1 CHAPTER 1 INTRODUCTION 1.1 Background Study According to the global energy statistical yearbook 2011 by Enerdata, the world’s energy consumption rises steadily and in the year 2011, it reaches the maximum value of 13,000 Mtoe (megaton of oil equivalent). Figure 1.1 shows the increasing trend of energy consumption in the world. According to the same data, 13,200 Mtoe of energy is produced each year and from that number, the main sources of energy are still oil and natural gases. Renewable energy only accounts for 20% of the energy source where hydropower contributes about 60 % of it. Figure 1.2 shows the percentage of renewable energy production in the world. Figure 1.1 World energy consumption 0 2000 4000 6000 8000 10000 12000 14000 1990 1991 1992 1993 1994 1995 1996 1997 1998 1999 2000 2001 2002 2003 2004 2005 2006 2007 2008 2009 2010 2011 Value (MToe) Year

Welcome message from author
This document is posted to help you gain knowledge. Please leave a comment to let me know what you think about it! Share it to your friends and learn new things together.
Transcript

1
CHAPTER 1
INTRODUCTION
1.1 Background Study
According to the global energy statistical yearbook 2011 by Enerdata, the
world’s energy consumption rises steadily and in the year 2011, it reaches the maximum
value of 13,000 Mtoe (megaton of oil equivalent). Figure 1.1 shows the increasing trend
of energy consumption in the world. According to the same data, 13,200 Mtoe of energy
is produced each year and from that number, the main sources of energy are still oil and
natural gases. Renewable energy only accounts for 20% of the energy source where
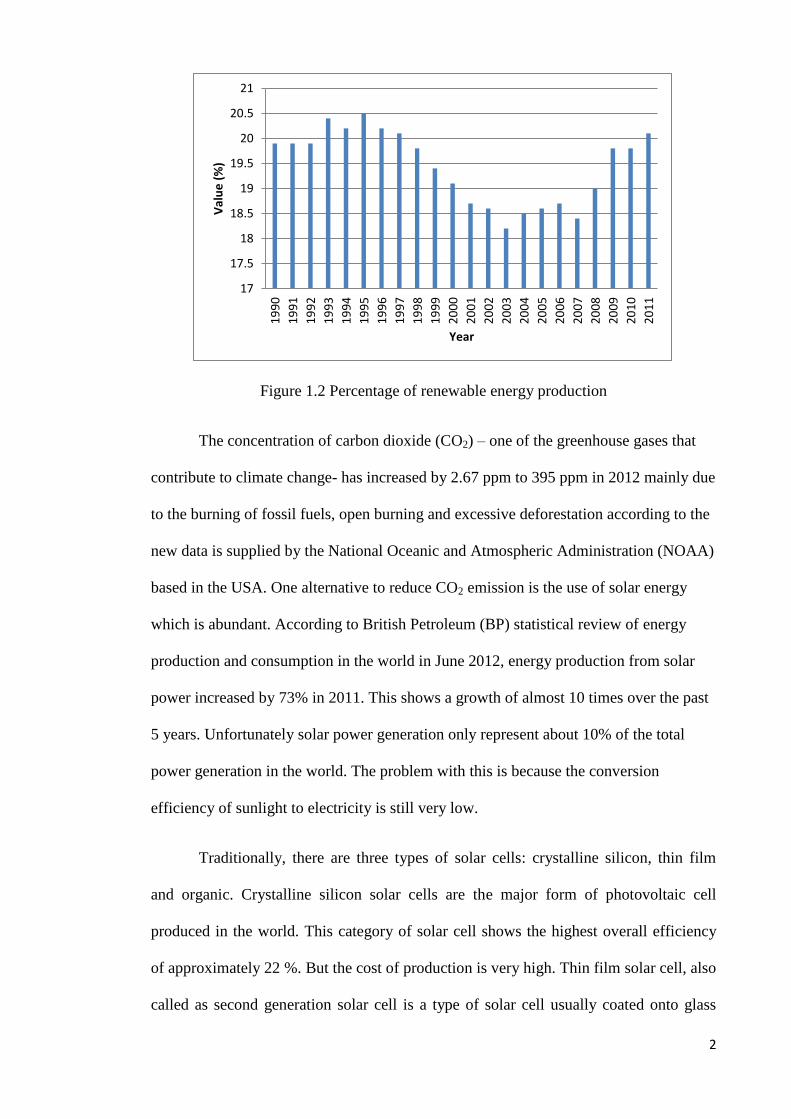
hydropower contributes about 60 % of it. Figure 1.2 shows the percentage of renewable
energy production in the world.
Figure 1.1 World energy consumption
0
2000
4000
6000
8000
10000
12000
14000
19
90
19
91
19
92
19
93
19
94
19
95
19
96
19
97
19
98
19
99
20
00
20
01
20
02
20
03
20
04
20
05
20
06
20
07
20
08
20
09
20
10
20
11
Val
ue
(M
Toe
)
Year
2
Figure 1.2 Percentage of renewable energy production
The concentration of carbon dioxide (CO2) – one of the greenhouse gases that
contribute to climate change- has increased by 2.67 ppm to 395 ppm in 2012 mainly due
to the burning of fossil fuels, open burning and excessive deforestation according to the
new data is supplied by the National Oceanic and Atmospheric Administration (NOAA)
based in the USA. One alternative to reduce CO2 emission is the use of solar energy
which is abundant. According to British Petroleum (BP) statistical review of energy
production and consumption in the world in June 2012, energy production from solar
power increased by 73% in 2011. This shows a growth of almost 10 times over the past
5 years. Unfortunately solar power generation only represent about 10% of the total
power generation in the world. The problem with this is because the conversion
efficiency of sunlight to electricity is still very low.
Traditionally, there are three types of solar cells: crystalline silicon, thin film
and organic. Crystalline silicon solar cells are the major form of photovoltaic cell
produced in the world. This category of solar cell shows the highest overall efficiency
of approximately 22 %. But the cost of production is very high. Thin film solar cell, also
called as second generation solar cell is a type of solar cell usually coated onto glass
17
17.5
18
18.5
19
19.5
20
20.5
21
19
90
19
91
19
92
19
93
19
94
19
95
19
96
19
97
19
98
19
99
20
00
20
01
20
02
20
03
20
04
20
05
20
06
20
07
20
08
20
09
20
10
20
11
Val
ue
(%
)
Year

3
panes. Advantages of this solar cell include the reduced weight of the solar cell
compared to crystalline silicon solar cells, less amount of material used and high
transparency. But the downside of this solar cell is that the efficiency is not as good as
first generation solar cell. The last type of photovoltaic cell is the organic solar cell
which has recently attracted a lot of attention. Organic solar cell uses organic and
polymeric materials which is conductive to convert sunlight to electron. Some of the
benefits are low cost of production, flexible and easy to process. Unfortunately, the
conversion efficiency is extremely low.
The highest ever reported efficiency for a solar cell is 37.8 % reported by
Spectrolab a subsidiary of Boeing. In the invention, the company employs a multi-
junction solar cell where different semiconductor materials were used. Another material
that is often used in solar cells and has high conversion efficiency is silicon. A black
silicon solar cell can achieve efficiency as high as 18.7 %. Even with this improvement,
it is still not enough to satisfy the world’s energy consumption. Thus, all around the
world people are still relying on oil and natural gas as source of energy. Solar energy
production is still less than 1% of the total world production of energy. There is need for
a big effort to improve the conversion efficiency of the photovoltaic cells and to bring
the cost down, which is very high compared to the fossil fuels.
As one of the largest oil-producing countries, most of the research works in
Malaysia are more focused on oil and gas. Thus, Malaysia is lagging behind in term of
research and development in renewable energy. It has been reported that, Malaysian
government has set a target that in 2001-2005, 5% out of the total energy production
must come from renewable energy. Unfortunately, only 1% is achieved (M. R. Islam,
2009). One of the main reasons for this is the lack of research works and technology in
green technology in Malaysia. Although Malaysia has a research institute, Solar Energy

4
Research Institute (SERI), dedicated in research on renewable energy, but most of their
research works are on inorganic materials particularly silicon, whereas other countries
already exploring the use of organic and polymer-based materials, as an alternative to
silicon. The reasons behind this are that silicon is expensive whereas polymers are
cheap and easily available. Also, the use of polymer in solar cells allow it to be applied
in many places as it is very thin, flexible and pose no health risks.
Organic and polymeric materials are touted to be one of the most promising
materials, where inorganic semiconductors have been replaced with conjugated organic
semiconductors. The organic materials have significant advantages compared to
inorganic materials, but big improvements need to be done. Recently, 12 % power
conversion efficiency has been achieved based according to Heliatek a company
developing organic solar films in Germany. The growth of the plastic solar cells results
from the developments in organic synthesis and device fabrication technologies. Figure
1.3 shows the highest efficiency achieved in each year according to the types of the
solar cells. As can be seen from the figure, research works for organic solar cells
significantly increased since early 2000s.
Figure 1.3 Solar cells efficiency according to the types
5
1.2 Problem statement
Until now, there have been many papers suggesting the use of various dopants
and plasticizers in polymer electrolyte in order to significantly increase the ionic
conductivity. However, the addition of some plasticizers makes the polymer electrolyte
mechanically unstable either the electrolyte becomes too viscous, or the presence of air
bubbles within the electrolyte or even lowering the ionic conductivity. There, however,
has been little investigation in the use of liquid crystal as a plasticizer despite the
interesting characteristics of it. There is a lack of experimental data in the effect of
liquid crystal on the ionic conductivity and the electrochemical property which makes it
difficult to make a comparison. An experiment where various parameters such as the
method of fabrication and varying the concentration of liquid crystal is proposed.
1.3 Objective
The main objective of this research is to
1) Fabricate polymer electrolyte consisting of nematic liquid crystal with different
methods and evaluate the performance
2) Optimize the ionic conductivity of the polymer electrolyte by varying liquid
crystal concentration
3) Determine the electrochemical property such as the electronic band gap
4) Understand the physics behind the mechanism of ion or electron transport within
the polymer electrolyte liquid crystal system

6
CHAPTER 2
BACKGROUND THEORY
In this chapter, an introduction to dye-sensitized solar cells (DSSCs) and liquid crystals
(LCs) which includes the mechanism and theory of both will be given.
2.1 Dye-sensitized solar cells (DSSCs)
Dye-sensitized solar cells (DSSCs) are a type of fourth generation solar cell,
which was first developed by Brian O’Regan and Michael Grätzel and the report on
their finding was published in Nature in 1991 (O'Regan & Graetzel, 1991). Although
the efficiency is still low compared to the existing Silicon-based solar cells which are
typically around 25 %, they are very promising in replacing the conventional Si solar
cells due to them having a relatively high light to energy conversion efficiency, simple
fabrication procedure, low environmental impact and low fabrication.
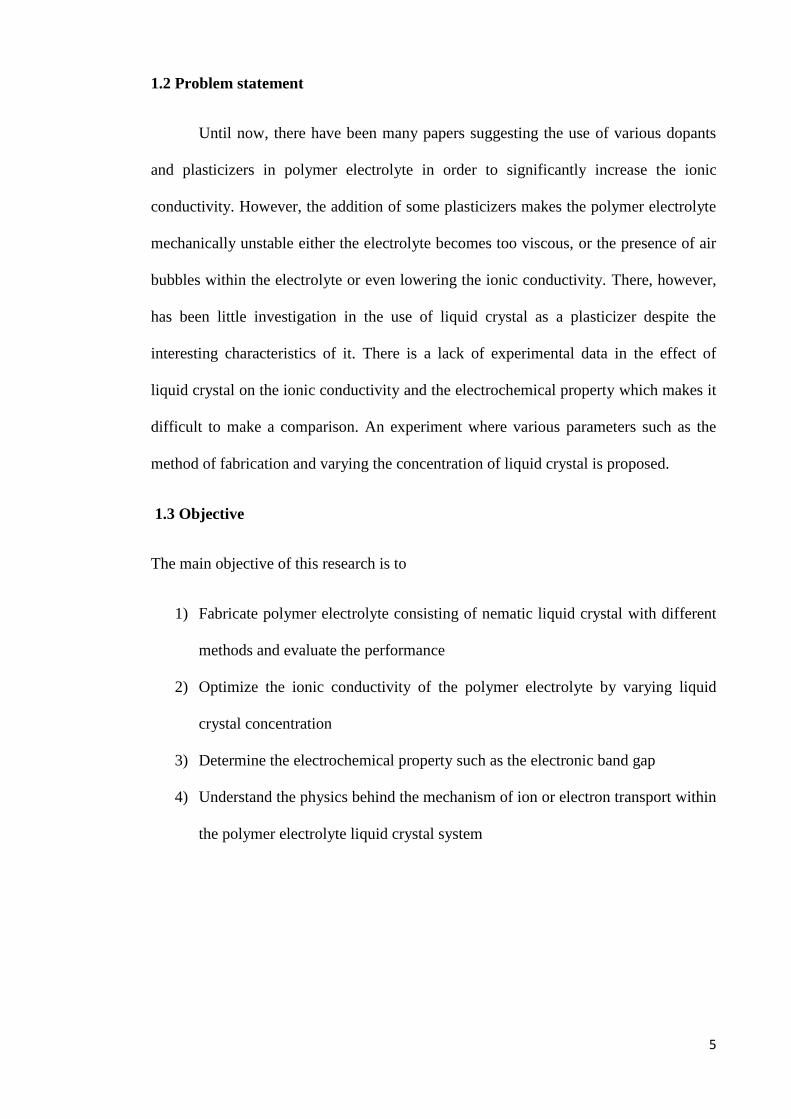
A typical working DSSC (Figure 2.1) consists of four parts, which are (1) a
transparent conducting oxide electrode, (2) a nanocrystalline TiO2 layer with charge
transfer dye on the nanoparticle surface, (3) a counter conducting electrode consisting of
Pt thin layer, and (4) an electrolyte system between the two electrodes usually
composed of the redox system (I3-/I
-). The electrolyte is one of the most important parts
in a solar cell and typically, a liquid electrolyte is used in a DSSC. Unfortunately, there
are some drawbacks of using liquid electrolytes such as leakage and evaporation of
solvent, sealing difficulties and corrosion of electrodes. Many research works have been
done to address these issues by exploring new types of electrolytes such as solid
electrolytes, ionic liquids, polymer electrolytes and so on.
7
Figure 2.1 Schematic diagram of a typical DSSC
2.2 Polymer electrolyte
A conventional DSSC uses liquid electrolyte which gives the highest
conductivity. Unfortunately, the use of liquid electrolyte has other disadvantages such
as leakage and evaporation of solvent, difficulty in sealing and corrosion of electrodes
(Nazeeruddin et al., 2005; Wang et al., 2005). To overcome this problem, an alternative
is through the use of polymer electrolyte. Polymer electrolytes are electrolytes that
consist of polymer/salt complex and have free ions which make them electrically
conductive. Polymer electrolytes are made from salt complex mixed together with a
polymer. The salt complex is responsible for making the polymer ionically conductive.
One of the earliest reports on the use of solid polymer electrolyte in DSSC
applications which shown high power conversion efficiency (PCE) was by Noguira et al.

8
(Nogueira, Alonso-Vante, & De Paoli, 1999) in 1999. They prepared a polymer
consisted of poly(epichlorohydrin-co-ethylene oxide) filled with sodium iodide (NaI)
and iodine (I2). The DSSC incorporating the polymer electrolyte showed a high ionic
conductivity of 1.5 x 10⁻⁵
S/cm and a PCE of 2.6% at 10 mW/cm2.
A composite can also be called a solid polymer electrolyte as has been shown by
Kim et al.(J. H. Kim et al., 2004), who prepared a composite from poly(ethylene oxide
dimethyl ether) (PEODME, Mw = 500 g/mol) and fumed silica. They found out the
composite polymer electrolyte showed a high conversion efficiency of 4.5 % at 100
mW/cm2. This is attributable to the excellent interaction between dye-attached TiO2
particles and the composite polymer electrolyte. This good interaction allows for
improved electrolyte diffusion into the nanopores and helps to increase the interfacial
contact between the electrolyte and the electrode.
2.2.1 Mechanism of Ionic Conduction
The mechanism of ionic conduction within a polymer electrolyte is attributable
to the intrachain and interchain hopping where the segmental motions of the polymer
chains allow the cations to move between one coordination site to another, either on one
chain or between adjacent neighboring chains. A high ionic conductivity is believed to
be facilitated by the interchain hopping. Figure 2.2a and b shows the motion of cation
aided by polymer’s segmental motion. Ion clusters can also contribute to the ionic
conduction through ion-ion interactions as shown in Figure 2.2c and d. But this type of
ionic conduction is limited by the concentration of ions within the polymer host.

9
Figure 2.2 Ionic conduction mechanism of a polymer electrolyte assisted by polymer
chains only and ionic cluster. a) ion hopping intrachain and b) interchain. c) ion pairs
dissociates d) ion pair dissociates and pairs with another unpaired ion
A high ionic conductivity can be achieved if the polymer host is ideally in the
amorphous phase or in other words, the glass transition temperature is low enough so
that at room temperature it is already in amorphous state. High crystallinity in a polymer
limits the performance of the polymer electrolyte (Manuel Stephan, 2006). As an
example, in polyethylene oxide (PEO) and many PEO/salt mixtures, at room
temperature the crystallinity is around 70-85%.
2.2.2 Factors Affecting Ionic Conductivity
One of the factors that affect the ionic conductivity of solid polymer electrolyte
is the size of the cation of the salt complex. Bhattacharya et al. (Bhattacharya, Lee,
Geng, Jung, & Park, 2009) found that the crystallinity decreases as the size of cations
increases which proves that the ionic conductivity is related to the mobility of the ions
and not due to the number of dissociated charge carriers. In the experiment, the group
used complex salts with different sizes and achieved a higher ionic conductivity for the
one with the largest cation size.

10
Another factor that can affect the ionic conductivity and thus the performance of
the DSSC is the concentration of salt complex such as sodium iodide (NaI). It has been
shown that the ionic conductivity of the polymer electrolyte increases proportionate to
the salt concentration and once it reaches a certain concentration, the conductivity value
decreases gradually (J. H. Kim, Kang, Kim, Won, & Kang, 2005). The increase in the
conductivity can be attributed to the additional number of charge in the electrolyte
whereas the decrease is due to the formation of ion pairs in the electrolyte (Gray, 1997;
J.R. MacCallum, 1987). According to Kim et al. in the same paper, the maximum ionic
conductivity obtained was 2.6 x 10⁶ S/cm at sodium iodide to poly(butyl acrylate)
(PBA) molar ratio of [Na]/[COO] = 0.1. The PCE of the DSSC employing the polymer
electrolyte at the same molar ratio was 1.66 % at a solar intensity of 10 mW/cm2.
The use of different types of polymers such as difference in chemical and/or
physical properties and also with various molecular weights will also affect the ionic
conductivity. Kim et al. (J. H. Kim et al., 2005) showed that there is a vast difference in
PCE between PBA (Mw = 99,000 g/mol) (η = 1.66 %) and PEO (Mw = 1,000,000 g/mol)
(η = 0.07 %). This vast difference in magnitude is due to (1) higher percentage of
crystallinity in PEO, (2) low diffusion of chains in high-molecular weight PEO and (3)
good adhesion of PBA with the electrodes.
Chen et al. (Chen, Liou, Lee, & Chen, 2010) reported that the ionic conductivity
increases with increasing immersion time of the polymer into the electrolyte. In their
report, polyvinylbutyral (PVB) immersed in γ-butyrolactone/N-methyl-2-
pyrrolidone/LiI/I2 for 10 minutes and 40 minutes have conductivities of 2.0 x 10⁻⁴
S/cm
and 10.0 x 10⁻⁴
S/cm respectively. However, this is true up to a certain time after which
the ionic conductivity will reach a maximum value.

11
Due to the solid polymer electrolyte having a low ionic conductivity compared
to liquid electrolyte, researchers have been trying to improve the ionic conductivity by
mixing the polymer electrolyte with other materials, changing the parameter, revising
the fabrication method and many more. Recently, people start experimenting with liquid
crystal as one of the materials for improving the conductivity of the polymer electrolyte.
2.3 Liquid Crystals (LCs)
Liquid crystal (LC) is a fourth state matter that combines both the properties of
solid and liquid and have orientational order and sometimes positional order (Peter J.
Collings, 1997). A liquid crystal molecule is consisted of a rigid part called the
‘mesogen’ and a flexible part. Figure 2.3 shows a typical structure of a liquid crystal
where the liquid crystal is divided into two parts: spacer and mesogen.
Figure 2.3 Example of a typical liquid crystal structure
LCs can be categorized into two categories: thermotropic and lyotropic.
Thermotropic LCs are LCs that change phases depending on the temperature whereas
lyotropic LCs phases transition depends on the solvent. In this thesis, the focus is on the
thermotropic LCs and the lyotropic LCs will not be discussed.
Thermotropic LCs can be divided into 3 phases namely smectic, nematic and
isotropic. The closest phase to crystal is the smectic phase where the liquid crystal is
very viscous and has both orientational and positional order. Increasing the temperature
will turn the phase to nematic. Once it becomes nematic, the liquid crystal no longer has

12
the positional order but only orientational order. Lastly, as the temperature is increased
further, the LC becomes isotropic which is more liquid like and does not possess
orientational and positional order. Figure 2.3 below shows the transition of
thermotropic liquid crystal from solid to isotropic with increasing temperature.
Figure 2.3 Phases of liquid crystal
2.3.1 Smectic Liquid Crystals
The smectic phase can be obtained after increasing the temperature of the liquid
crystal. The smectic phase is highly ordered when compared with the nematic phase due
to the phase having both positional and orientational order. The molecules within the
nematic phase form a layered structure and the molecules are allowed to move freely
within the layer and sometimes to different layers. The smectic phase can be viewed as
a 2 D element where the mesogen aligns orthogonally and can also be tilted along the
layer plane. The smectic phase can be furthered categorized into a few other types:
SmA, SmC, SmB, SmF and SmI. These different types of smectic phases are
characterized by different degrees of positional and orientational order.

13
2.3.2 Nematic Liquid Crystals
The nematic (N) liquid crystal is less ordered than the smectic phase liquid
crystal which makes it less viscous than smectic phase. The phase is identified by the
mesogen that aligns parallel along a director (n) as shown in Figure 2.6. The phase has
orientational order but not positional order as the molecules are distributed randomly
without any layers. The molecules are also able to rotate freely about their long axes.
These make the nematic liquid crystal behave more like liquid than smectic phase.
Although the viscosity is comparable to that of liquid, a nematic liquid crystal appears
cloudy. Under an optical polarizing microscope (OPM), nematic liquid crystal shows a
Schlieren texture where point defects and extinction brushes can be seen.
To better quantify the molecular orientation, the following equation was
proposed:
⟨ ⟩
where S is the order parameter and θ is the angle between the mesogen and the director
(n). For an ideal nematic liquid crystal, the order parameter must be 1 and as it becomes
isotropic, the order parameter becomes 0. Figure below shows (Figure 2.5) the
representation of the angle, θ. There are several ways to determine the order parameter:
deuterium nuclear magnetic resonance (NMR) and measurement of linear dichroism in
UV and IR absorptions.
Figure 2.5 Determination of the angle between the mesogen and the director axis
θ
n

14
2.3.4 Applications of Liquid Crystals
Liquid crystal has been used as a template for organic and inorganic materials
highly ordered nature. The first report on the use of LC as a template was reported by
Shirakawa et al.(Shirakawa et al., 1988), where the group succeeded in producing a film
with highly aligned fibrils. The liquid crystal was us as an ordered matrix solvent
assumes its alignment under applied magnetic field. This method has also been proven
to increase the carrier mobility and electrical conductivity of the template material
(Akagi et al., 1998; Kang, Jin, Chien, & Sprunt, 2004).
Amorphous material has a very low charge carrier mobility of about 10-3
cm2/Vs
or less limited its application for electronic devices. Whereas, for discotic (Bushby &
Lozman, 2002; Debije et al., 2004) and smectic (Masahiro Funahashi & Hanna, 2000;
M. Funahashi & Hanna, 2005) LCs alone have charge carrier mobility values of 0.4 to
0.1 cm2/Vs which is considerably higher than that of amorphous materials. The
discovery of conjugated LC and also smectic and discotic LCs at room temperature
further improved the charge carrier value up to 1 cm2/Vs. These breakthroughs allow for
the development of electronic devices with high charge carrier mobility with the
combination of amorphous material and liquid crystal.
The first reported work on the use of liquid crystal in solar cell was first reported
by Chandra et al. (Chandra, Srivastava, & Khare, 1986). The group found that the
addition of nematic n-(p-methoxy-benzylidene)p-butylanaline (MBBA) to chlorophyll
electrode enhanced the photovoltage, photocurrent and photoconductivity value. Other
groups have also experimented with liquid crystal as the main component in solar cell in
example polymer electrolyte (H. K. Kim, Lee, Jin, & Lee, 2009; Petritsch et al., 1999;
Schmidt-Mende et al., 2001).
15
CHAPTER 3
METHODOLOGY
3.1 Materials
Poly(vinyl alcohol) (PVA) (Mw=89,000-98,000) (Sigma Aldrich), 4’-pentyl-4-
biphenylcarbonitrile (5CB) (Sigma Aldrich), potassium iodide (KI) (Merck), tetra(n-
butyl)ammonium hexafluorophosphate (TBAHFP) (Sigma Aldrich), tetrahydrofuran
(Merck) and dimethyl sulfoxide (DMSO) (Merck) were used as received.
3.2 Film Fabrication
3.2.1 Casting method
4’-pentyl-4-biphenylcarbonitrile (5CB) was added drop wise to dimethyl
sulfoxide (DMSO) solution. The solution was stirred at room temperature for 1 hour.
Then potassium iodide (KI) was added to the solution at stirred for another 1 hour until
the salt fully dissolved. Lastly, poly(vinyl alcohol) (PVA) was added to the mixture and
stirred at 100ºC for 2 hours until the solution became transparent. The resulting viscous
solution is then casted in a glass petri dish and let dry at 50ºC for a few days until it
formed a film. The film is cut into 1 cm x 1cm for impedance spectroscopy (IS)
measurement.
3.2.2 Spin-coating Method
The spin-coating method is very similar to the casting method. Instead of casting
the film in a petri dish, in this method, the resultant mixture from previous method is
dropped on a glass substrate and placed in a spin coater. The thickness can be controlled
by controlling the rotation speed, viscosity and amount of the sample. Once the sample
was rotated, the glass substrate was placed on a hot plate at 50ºC for a few days to
remove the solvent. Once the sample is dried enough, it is then used for further

16
characterizations.
3.3 Characterization
3.3.1 Optical Polarizing Microscopy
The phase transition temperature of the polymer electrolyte liquid crystal film was
observed by using Olympus BX51-P polarising optical microscope attached to a
Linkam hot stage. The sample was spin coated on a glass slide and then put under the
microscope for observation. The sample was heated on the hot stage at 1ºC/min and
cooled at 1ºC/min from room temperature to 100 ºC.
3.3.2 Differential Scanning Calorimetry
To further confirm the transition temperature of the liquid crystal inside the
polymer electrolyte, differential scanning calorimetry (DSC) was used. DSC is a
thermal analysis where heat is applied to measure the transition temperature and
enthalpy changes of this temperature. The heat applied is constant throughout the
measurement where at certain temperature where the phase transition occurs; the sample
will require more or less heat to be at the same temperature as the reference. This will
depend on whether it is an endothermic or exothermic process. In this experiment, the
sample was placed in an aluminum sample pan and put inside the DSC together with a
blank sample pan as a reference. The experiment was done at a heating rate of 10
ºC/min from 0 ºC to 100 ºC under argon gas. The transition temperature can be
determined from the thermogram of the DSC.

17
Figure 3.1 Schematic representation of DSC equipment
Figure 3.2 A typical DSC curve showing the temperature for glass transition,
crystallization and melting
3.3.3 Conductivity measurement
The conductivity is measured firstly by the two electrode conductivity
measurement method where impedance spectroscopy was carried out on the thin film
using a HIOKI 3531-01 with the frequency range varied from 20 Hz to 1 MHz. The thin
film is sandwiched between two stainless steel electrodes. Figure 3.4 shows the set up
for impedance spectroscopy experiment. The two electrodes were attached to a
computer with crocodile clips for data acquisition. The conductivity, σ, of each thin film
is calculated using the following equation
σ = t/(RbA) (3.1)
heater heater
Temperature sensor
blank sample pan sample
18
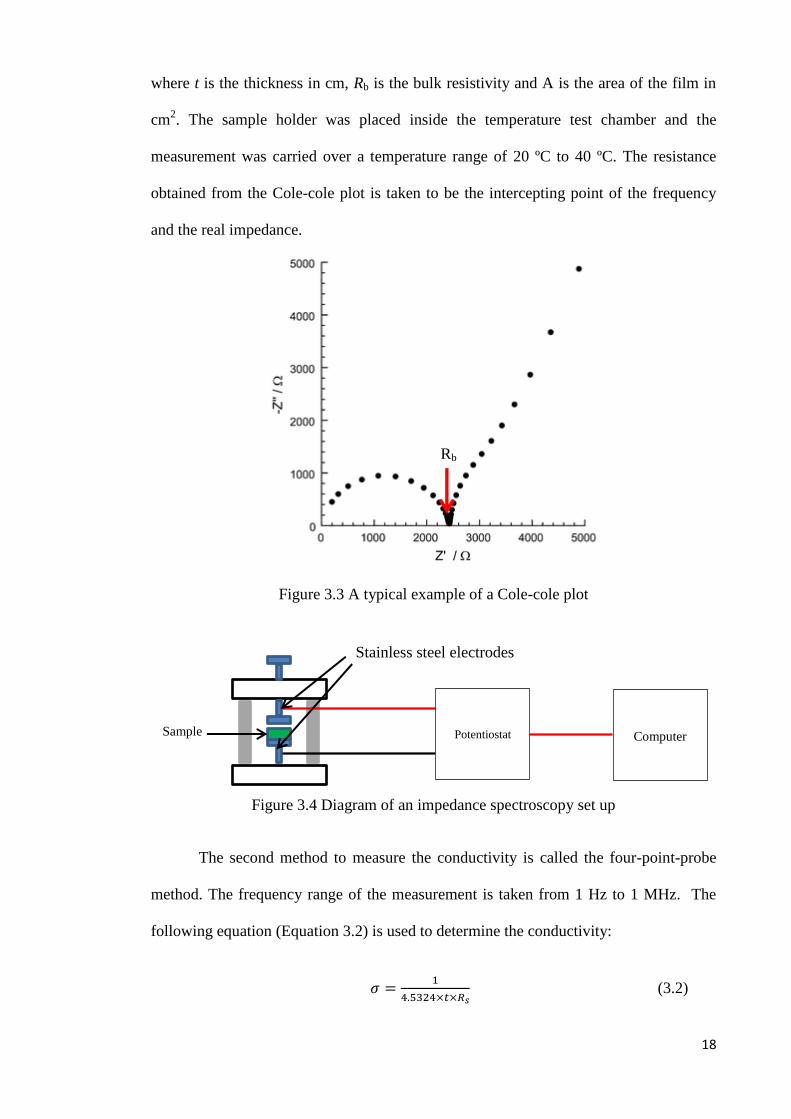
where t is the thickness in cm, Rb is the bulk resistivity and A is the area of the film in
cm2. The sample holder was placed inside the temperature test chamber and the
measurement was carried over a temperature range of 20 ºC to 40 ºC. The resistance
obtained from the Cole-cole plot is taken to be the intercepting point of the frequency
and the real impedance.
Figure 3.3 A typical example of a Cole-cole plot
Figure 3.4 Diagram of an impedance spectroscopy set up
The second method to measure the conductivity is called the four-point-probe
method. The frequency range of the measurement is taken from 1 Hz to 1 MHz. The
following equation (Equation 3.2) is used to determine the conductivity:
(3.2)
Rb
Potentiostat
Computer Sample
Stainless steel electrodes

19
where t is thickness in cm and Rs is the sheet resistivity in ohm (Ω). The resistance that
is obtained from this method is the resistance of both the bulk and surface resistances.
This shows that this method is more accurate than the previous method. From the
impedance measurement the sample behaves as a pure resistor at low frequency. This is
evident from the flat impedance response at low frequency as well as phase shift close
to 0 degree.
3.3.4 Cyclic Voltammetry (CV)
Cyclic voltammetry (CV) is an electrochemical technique to examine the redox
reactions of a solution where a certain voltage is applied in both forward and reverse
directions giving a certain current. The scanning rate is set to be constant at all time.
The resulting curve is given in Figure 3.2. The Ep and Ea correspond to LUMO and
HOMO respectively. And the band gap of the material is given by the difference
between Ep and Ea.
Figure 3.5 A typical cyclic voltammetry curve
The CV experiment is conducted in a three-electrode cell consisted of reference
electrode (Ag/AgCl), working electrode and counter electrode at a scan rate of 50 mV/s
(Gamry). Figure 3.5 below shows the set up for CV experiment where a Gamry

20
Potentiostat was used. The potentials were measured at room temperature with 0.1 M
tetra(n-butyl)ammonium hexafluorophosphate (TBAHFP) as the supporting electrolyte
in tetrahydrofuran (THF). The working electrode was prepared by spin coating the
sample onto an ITO glass substrate and let dry. The determination of ELUMO and EHOMO
can be done by using the following equation EHOMO = - [Ered+ 4.4] eV and ELUMO = -
[Eoxi+ 4.4] eV.
Figure 3.6 Experimental a) equipment and b) set up
CHAPTER 4
a) b)

21
RESULT AND DISCUSSION
Phase transition
The PVA-only thin film obtained is transparent, whereas the 5CB-embedded
PVA thin film is cloudy and turbid. From this, it can be confirmed that the liquid crystal
is embedded inside the polymer thin film. After soaking with KI solution, the membrane
became yellowish in color and the color became more apparent as the concentration of
KI is increased. Figure 4.1 shows the polymer membrane before and after soaking.
Figure 4.1 Thin film without (left) and with 15 wt% LC (right) before (i) and after (ii)
soaking with KI solution
The phase change temperature for the sample prepared by casting method could
not be determined due to the nature of the sample that is not transparent. The strong
coloration of the sample does not allow the light from the optical polarizing microscope
to pass through and thus no phase transition could be observed. In order to observe the
phase transition, the sample prepared by the spin coating method was used. The nematic
to isotropic temperature have been found to decrease when introduced into the polymer.
For pure 5CB, the nematic to isotropic temperature is around 34.5 ºC. But the inclusion
into polymer brought it down to 32~33 ºC. The figure (Figure 4.2) below shows the
image of the sample at 27 ºC and 40 ºC (inset picture). Within the polymer electrolyte,
the liquid crystal presents in the form of bubbles which is similar to polymer dispersed
ii)
i)

22
liquid crystal (PDLC). As the temperature is increased, the bubbles changed from
Schlieren structure to slightly transparent.
Figure 4.2 OPM images of samples at 27 ºC and 40 ºC of samples with a) 5 wt%, b) 10
wt% and c) 15 wt% of 5CB
Ionic conductivity measurement
a)
b)
c)
27 ºC 40 ºC
27 ºC 40 ºC
40 ºC 27 ºC
23
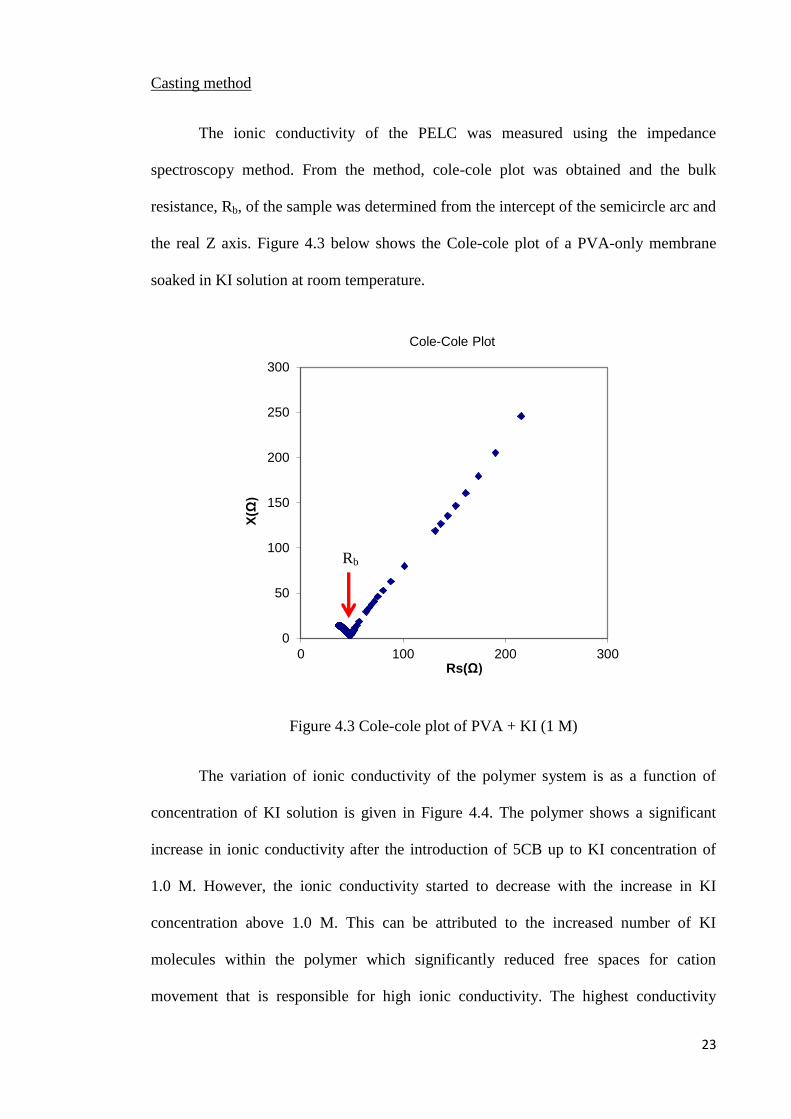
Casting method
The ionic conductivity of the PELC was measured using the impedance
spectroscopy method. From the method, cole-cole plot was obtained and the bulk
resistance, Rb, of the sample was determined from the intercept of the semicircle arc and
the real Z axis. Figure 4.3 below shows the Cole-cole plot of a PVA-only membrane
soaked in KI solution at room temperature.
Figure 4.3 Cole-cole plot of PVA + KI (1 M)
The variation of ionic conductivity of the polymer system is as a function of
concentration of KI solution is given in Figure 4.4. The polymer shows a significant
increase in ionic conductivity after the introduction of 5CB up to KI concentration of
1.0 M. However, the ionic conductivity started to decrease with the increase in KI
concentration above 1.0 M. This can be attributed to the increased number of KI
molecules within the polymer which significantly reduced free spaces for cation
movement that is responsible for high ionic conductivity. The highest conductivity
0
50
100
150
200
250
300
0 100 200 300
X(Ω
)
Rs(Ω)
Cole-Cole Plot
Rb

24
obtained is for sample with 10 wt % of 5CB at KI concentration of 1.0 M which shows
conductivity of 2.42 x 10⁻⁴
S/cm. For the same KI concentration, the PVA-only
membrane only showed a conductivity of 1.45 x 10⁻⁴
S/cm.
KI concentration (mol/L)
0.0 0.5 1.0 1.5 2.0 2.5
Conductivity (
S/c
m)
0.00000
0.00005
0.00010
0.00015
0.00020
0.00025
0.00030
PVA
PVA + LC (5 wt%)
PVA + LC (10 wt%)
PVA + LC (15 wt%)
Figure 4.4 Variations of ionic conductivity at different LC and KI concentration
Figure 4.5 shows the ionic conductivity for different polymer electrolyte liquid
crystal (PELC) system at different temperatures. The measurement was performed at
room temperature up to 40 ºC for PELC membrane at 2 M KI solution. It can be seen
from the curve that the ionic conductivity linearly increases with the increase with in
temperature. This agrees well with the Arrhenius conductivity equation:
(
)
where T is temperature in Kelvin, Ea is the activation energy and k is the boltzmann
constant. The PELC with 15 wt% 5CB reached the highest ionic conductivity of 4.23 ×
10-3
S/cm at 39ºC. This data also agrees well with the free volume model proposed by
Miyamoto et al. (Miyamoto & Shibayama, 1973). According to the model, as the

25
temperature increases, the vibration of the polymer also increases until when the energy
is high enough to push neighboring polymer chains which allows for the formation of
void. Subsequently, the ions will fill in these voids and will move to the next aided by
the segmental motion of the polymer chains. The increase in ionic conductivity can also
be attributed to the decrease in viscosity as you increase the temperature which lead to
the increase in flexibility of the polymer chains (Subba Reddy, Jin, Zhu, Mai, & Chen,
2006).
Figure 4.5 Variations of ionic conductivities at different temperatures
The above equation can also be used to determine the activation energy (Ea) by
plotting the log σ versus 1000/T curve. The Ea is the minimum energy required to start
the reaction, or in other words the energy required for defect deformation and migration
where the defect is K+ ions. A low Ea is ideal for generating a fast ionic hopping process.
Figure 4.6 shows the variations of log σ with 1000/T. As can be seen from the curves,
the increase in liquid crystal content lowers the activation energy. The polymer
electrolyte with 15 wt% 5CB showed an activation energy of 1.130 eV where it also
Temperature (K)
296 298 300 302 304 306 308 310 312 314
Con
du
ctivity (
S/c
m)
0
1x10⁻³
2x10⁻³
3x10⁻³
4x10⁻³
5x10⁻³
PVA + KI (2M)
PVA + KI (2M) + LC (10 wt%)
PVA + KI (2M) + LC (15 wt%)

26
correspond to the highest conductivity. This comparably low Ea indicates that the ion
migration is easier with the inclusion of liquid crystal into polymer electrolyte.
1000/T (K-1
)
3.18 3.20 3.22 3.24 3.26 3.28 3.30 3.32 3.34 3.36 3.38
log (
S/c
m)
-3.8
-3.6
-3.4
-3.2
-3.0
-2.8
-2.6
-2.4
-2.2
PVA + KI (2 M)
PVA + KI (2 M) + 5CB (10 wt%)
PVA + KI (2 M) + 5CB (15 wt%)
1.2442 1.1304x - y
2.6577 1.8434x - y
2.756 1.9142x - y
Figure 4.6 Plots of ionic conductivity versus 1000/T
Spin coating method
In this method, the conductivity of the sample was measured using the four point
probe method where a curve below can be used to determine the resistance. As can be
seen from the curve, at low frequency (~ 1 kHz), the sample behaves like a pure resistor.
Thus the resistance value for the sample is taken as the average of the resistance from 1
Hz to 1 kHz.
The values of conductivities are given in Table 4.1. From the table, it can be
seen that the conductivity reached highest conductivity of S/cm at liquid
crystal concentration of 5 wt%. Above the concentration, the conductivity began to
decrease. This can be attributed to the increase viscosity within the polymer electrolyte
which can impede the movement of ions.

27
Table 4.1 Conductivity result of spin coated sample
LC concentration (wt %) Ionic conductivity (S/cm)
0 3.06 x 10⁻⁴
5 7.82 x 10⁻⁴
10 2.93 x 10⁻⁴
15 1.22 x 10⁻⁴
20 7.33 x 10⁻⁵
*All samples contained PVA and KI (20 wt%)
Thermal analysis
DSC curve for a pure DSC is shown in the figure below (Figure 4.7). The glass
transition temperature, Tg, is around 85 ºC. With the introduction of liquid crystal into
the polymer electrolyte, the Tg decreases slightly to 78.88 ºC. The inclusion of the 5CB
also decreases the crystallinity of the polymer and thus higher percentage of amorphous
phase is present. This amorphous phase is important in allowing the ions to move freely
within the polymer which increases the ionic conductivity.
Figure 4.7 DSC thermogram of PVA+KI (20 wt%)+5CB (5 wt%)

28
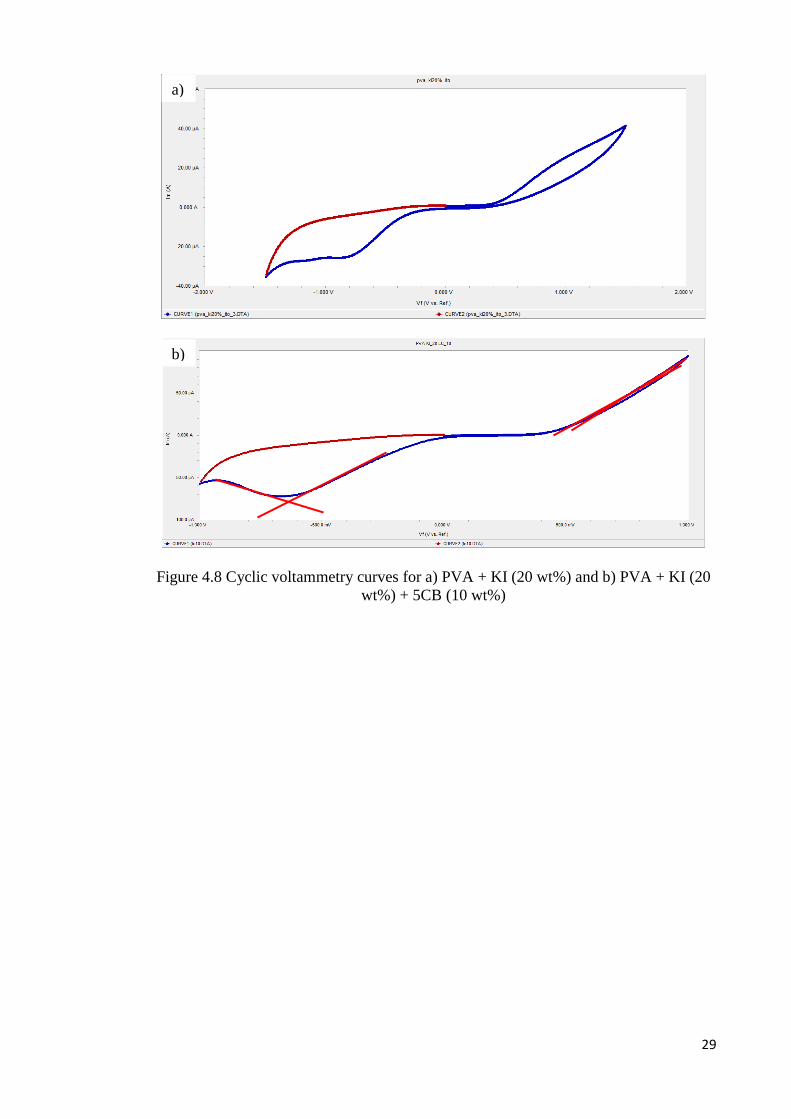
Electrochemical analysis
The HOMO, LUMO and band gap energy can be determined from the CV
curves using the following relations: EHOMO = - [Ered+ 4.4] eV and ELUMO = - [Eoxi+ 4.4]
eV. The band gap can be calculated from the difference between ELUMO and EHOMO.
Figure 4.8 shows the CV curves of the polymer electrolyte. Based on the cyclic
voltammetry results, PVA+KI(20 wt%) shows EHOMO = - 6.933 eV , ELUMO = - 5.275
eV and Eg = 1.657 eV. On the other hand, PVA+KI(20 wt%)+5CB (5 wt%) shows
EHOMO = - 6.588 eV, ELUMO = - 5.031 eV and Eg = 1.557 eV. A small amount of donor
materials introduced into the polymer electrolyte create energy levels in the band gap
near the conduction bad whereas a low level of acceptor materials will create band gap
near the valence bad edge. With increase in the amount of doping, the density of states
of these dopants increase and forms a continuum of states just like in the bands and
effectively the band gap decreases (H. C. Casey & Stern, 1976). The presence of cyano
group and alkyl group in 5CB also contributed to the narrowing of the band gap
(Roncali, 2007).
29
Figure 4.8 Cyclic voltammetry curves for a) PVA + KI (20 wt%) and b) PVA + KI (20
wt%) + 5CB (10 wt%)
a)
b)

30
CHAPTER 5
CONCLUSION
In summary, a series of polymer electrolyte incorporating liquid crystal was
fabricated. The inclusion of the liquid crystal showed an increase in the ionic
conductivity of the polymer electrolyte. The successful inclusion of the liquid crystal
within the polymer electrolyte was verified by using optical polarizing microscope
where the Schlieren structure of the liquid crystal embedded inside the polymer can be
observed. To investigate the effect of the host polymer on the phase transition
temperature of the liquid crystal, differential scanning calorimetry was used. The DSC
curve also showed the effect of liquid crystal addition to the glass transition temperature,
Tg, of the polymer host. The Tg can be related to the ionic conductivity where it is
inversely proportional to the ionic conductivity. To investigate the possibility of the
polymer electrolyte liquid crystal system to be used in solar cell applications, cyclic
voltammetry experiment was performed where the band gap was determined. It is found
out that the inclusion of the liquid crystal narrowed down the band gap. Overall, the
result of this research shows the polymer electrolyte liquid crystal system resulted in a
significant increase in conductivity and also the narrowing of the band gap which
opened up possible applications for this material in solar cells and other energy
conversion/storage devices.

31
CHAPTER 6
REFERENCES
Akagi, K., Piao, G., Kaneko, S., Sakamaki, K., Shirakawa, H., & Kyotani, M.
(1998). Helical Polyacetylene Synthesized with a Chiral Nematic Reaction
Field. Science, 282(5394), 1683-1686. doi: 10.1126/science.282.5394.1683
Bhattacharya, B., Lee, J. Y., Geng, J., Jung, H.-T., & Park, J.-K. (2009). Effect of
Cation Size on Solid Polymer Electrolyte Based Dye-Sensitized Solar Cells.
Langmuir, 25(5), 3276-3281. doi: 10.1021/la8029177
Bushby, R. J., & Lozman, O. R. (2002). Photoconducting liquid crystals. Current
Opinion in Solid State and Materials Science, 6(6), 569-578. doi:
http://dx.doi.org/10.1016/S1359-0286(03)00007-X
Chandra, S., Srivastava, B. B., & Khare, N. (1986). Liquid Crystal Assisted
Photoelectrochemical Solar Cell With Chlorophyll Photoelectrode.
Molecular Crystals and Liquid Crystals, 132(3-4), 265-274. doi:
10.1080/00268948608079547
Chen, K. F., Liou, C. H., Lee, C. H., & Chen, F. R. (2010, 20-25 June 2010).
Development of solid polymeric electrolyte for DSSC device. Paper presented
at the Photovoltaic Specialists Conference (PVSC), 2010 35th IEEE.
Debije, M. G., Piris, J., de Haas, M. P., Warman, J. M., Tomović, Ž., Simpson, C.
D., . . . Müllen, K. (2004). The Optical and Charge Transport Properties of
Discotic Materials with Large Aromatic Hydrocarbon Cores. Journal of the
American Chemical Society, 126(14), 4641-4645. doi: 10.1021/ja0395994
Funahashi, M., & Hanna, J.-i. (2000). High ambipolar carrier mobility in self-
organizing terthiophene derivative. Applied Physics Letters, 76(18), 2574-
2576.
Funahashi, M., & Hanna, J. I. (2005). High Carrier Mobility up to 0.1 cm2 V-1 s-1
at Ambient Temperatures in Thiophene-Based Smectic Liquid Crystals.
Advanced Materials, 17(5), 594-598. doi: 10.1002/adma.200401274
Gray, F. M. (1997). Polymer Electrolytes. The Royal Society of Chemistry.
H. C. Casey, J., & Stern, F. (1976). Concentration-dependent absorption and
spontaneous emission of heavily doped GaAs. Journal of Applied Physics,
47(2), 631-643.
J.R. MacCallum, C. A. V. (1987). Polymer Electrolyte Reviews. Elsevier.
Kang, S. W., Jin, S. H., Chien, L. C., & Sprunt, S. (2004). Spatial and
Orientational Templating of Semiconducting Polymers in a Cholesteric
Liquid Crystal. Advanced Functional Materials, 14(4), 329-334. doi:
10.1002/adfm.200305083
32
Kim, H. K., Lee, M. J., Jin, S. H., & Lee, G. D. (2009). Optimization of Liquid
Crystal Concentration in the Dye-Sensitized Solar Cell for High Efficiency.
Molecular Crystals and Liquid Crystals, 510(1), 323/[1457]-1328/[1462]. doi:
10.1080/15421400903070283
Kim, J. H., Kang, M.-S., Kim, Y. J., Won, J., & Kang, Y. S. (2005). Poly(butyl
acrylate)/NaI/I2 electrolytes for dye-sensitized nanocrystalline TiO2 solar
cells. Solid State Ionics, 176(5–6), 579-584. doi: 10.1016/j.ssi.2004.10.002
Kim, J. H., Kang, M.-S., Kim, Y. J., Won, J., Park, N.-G., & Kang, Y. S. (2004).
Dye-sensitized nanocrystalline solar cells based on composite polymer
electrolytes containing fumed silica nanoparticles. Chemical
Communications(14), 1662-1663.
M. R. Islam, R., Saidur, N. A. Rahim, K. H. Solangi. (2009). Renewable energy
research in Malaysia. Engineering e-Transaction, 4(2), 69 - 72.
Manuel Stephan, A. (2006). Review on gel polymer electrolytes for lithium
batteries. European Polymer Journal, 42(1), 21-42. doi:
http://dx.doi.org/10.1016/j.eurpolymj.2005.09.017
Miyamoto, T., & Shibayama, K. (1973). Free-volume model for ionic conductivity
in polymers. Journal of Applied Physics, 44(12), 5372-5376.
Nazeeruddin, M. K., De Angelis, F., Fantacci, S., Selloni, A., Viscardi, G., Liska,
P., . . . Grätzel, M. (2005). Combined Experimental and DFT-TDDFT
Computational Study of Photoelectrochemical Cell Ruthenium Sensitizers.
Journal of the American Chemical Society, 127(48), 16835-16847. doi:
10.1021/ja052467l
Nogueira, A. F., Alonso-Vante, N., & De Paoli, M.-A. (1999). Solid-state
photoelectrochemical device using poly(o-methoxy aniline) as sensitizer and
an ionic conductive elastomer as electrolyte. Synthetic Metals, 105(1), 23-27.
doi: http://dx.doi.org/10.1016/S0379-6779(99)00078-8
O'Regan, B., & Graetzel, M. (1991). A low-cost, high-efficiency solar cell based on
dye-sensitized colloidal titanium dioxide films. Nature, 353(6346), 737-740.
Peter J. Collings, M. H. (1997). Introduction to Liquid Crystals: Chemistry and
Physics.
Petritsch, K., Friend, R. H., Lux, A., Rozenberg, G., Moratti, S. C., & Holmes, A. B.
(1999). Liquid crystalline phthalocyanines in organic solar cells. Synthetic
Metals, 102(1–3), 1776-1777. doi: http://dx.doi.org/10.1016/S0379-
6779(98)01035-2
Roncali, J. (2007). Molecular Engineering of the Band Gap of π-Conjugated
Systems: Facing Technological Applications. Macromolecular Rapid
Communications, 28(17), 1761-1775. doi: 10.1002/marc.200700345
Schmidt-Mende, L., Fechtenkötter, A., Müllen, K., Moons, E., Friend, R. H., &
MacKenzie, J. D. (2001). Self-Organized Discotic Liquid Crystals for High-

33
Efficiency Organic Photovoltaics. Science, 293(5532), 1119-1122. doi:
10.1126/science.293.5532.1119
Shirakawa, H., Akagi, K., Katayama, S., Araya, K., Mukoh, A., & Narahara, T.
(1988). Synthesis, Characterization, and Properties of Aligned
Polyacetylene Films. Journal of Macromolecular Science: Part A - Chemistry,
25(5-7), 643-654. doi: 10.1080/00222338808053390
Subba Reddy, C. V., Jin, A. P., Zhu, Q. Y., Mai, L. Q., & Chen, W. (2006).
Preparation and characterization of (PVP + NaClO4) electrolytes for
battery applications. The European Physical Journal E, 19(4), 471-476. doi:
10.1140/epje/i2005-10076-8
Wang, H., Li, H., Xue, B., Wang, Z., Meng, Q., & Chen, L. (2005). Solid-State
Composite Electrolyte LiI/3-Hydroxypropionitrile/SiO2 for Dye-Sensitized
Solar Cells. Journal of the American Chemical Society, 127(17), 6394-6401.
doi: 10.1021/ja043268p
Related Documents