1 "Kenya aims to be a nation living in a clean, secure, and sustainable environment by 2030" -Kenya Vision 2030 (GoK 2007) A s a newly industrializing country, Kenya faces the challenge of improving its economic performance and the lives of its citizens without undermining the environment upon which so much of its national earnings and individual people’s livelihoods depend. This chapter introduces the theme of environmental change in Kenya through the lens of the country’s long-term national development plan known as Kenya Vision 2030. It looks at a select number of salient and emerging issues that need to be considered to achieve the Vision’s goals and targets, including how to protect the country’s water sources that feed hydropower, support wildlife and tourism destinations, irrigate both export and small holder farms, and nurture grazing areas. It also highlights the importance of planning for weather-related disasters to enable development goals to be achieved. Kenya’s Vision 2030 Kenya Vision 2030 is the country’s new development blueprint for the period 2008 to 2030. It aims to make Kenya a “middle income country providing high quality life for all its citizens by the year 2030”. The first phase of the Kenya Vision 2030 covers the period 2008 to 2012 during which a number of “flagship” projects will be implemented. Vision 2030 is based on three pillars: the economic pillar, the social pillar, and the political pillar. In one way or another, these pillars are all interrelated and the fibre that binds them together Chapter 1: Environment and Vision 2030 Sunrise Over Maasai Mara The 1 510 km 2 Maasai Mara Game Reserve is one of the greatest regions of migrating wildlife in the world. It is shared by Kenya and the United Republic of Tanzania. Every year, herds of wildebeest, zebras and other herbivores migrate between Maasai Mara and Serengeti National Park (Tanzania) during the Great Migration (July - October) Figure 1: Thematic overview of the Kenya Vision 2030 (Source: GoK 2007) Plans and implementation Vi- sion Strategy Economic To maintain a sustained economic growth of 10% p.a. over the next 25 years Social A just and cohesive society enjoying equitable social development in a clean and secure environment Political An issue-based, people-centered, result-oriented, and accountable democratic political system Overarching vision A globally competitive and prosperous nation with a high quality of life by 2030

Welcome message from author
This document is posted to help you gain knowledge. Please leave a comment to let me know what you think about it! Share it to your friends and learn new things together.
Transcript

1
"Kenya aims to be a nation living in a clean,
secure, and sustainable environment by 2030"
-Kenya Vision 2030(GoK 2007)
As a newly industrializing country, Kenya faces the challenge of improving its economic
performance and the lives of its citizens without undermining the environment upon which
so much of its national earnings and individual people’s livelihoods depend. This chapter
introduces the theme of environmental change in Kenya through the lens of the country’s long-term national
development plan known as Kenya Vision 2030. It looks at a select number of salient and emerging issues
that need to be considered to achieve the Vision’s goals and targets, including how to protect the country’s
water sources that feed hydropower, support wildlife and tourism destinations, irrigate both export and small
holder farms, and nurture grazing areas. It also highlights the importance of planning for weather-related
disasters to enable development goals to be achieved.
Kenya’s Vision 2030 Kenya Vision 2030 is the country’s new development blueprint for the period 2008 to 2030. It aims to make
Kenya a “middle income country providing high quality life for all its citizens by the year 2030”. The fi rst
phase of the Kenya Vision 2030 covers the period 2008 to 2012 during which a number of “fl agship” projects
will be implemented. Vision 2030 is based on three pillars: the economic pillar, the social pillar, and the
political pillar. In one way or another, these pillars are all interrelated and the fi bre that binds them together
Chapter 1: Environment and Vision 2030
Sunrise Over Maasai Mara
The 1 510 km2 Maasai Mara Game
Reserve is one of the greatest regions
of migrating wildlife in the world. It
is shared by Kenya and the United
Republic of Tanzania. Every year,
herds of wildebeest, zebras and
other herbivores migrate between
Maasai Mara and Serengeti National
Park (Tanzania) during the Great
Migration (July - October)Figure 1: Thematic overview of the Kenya Vision 2030 (Source: GoK 2007)
Plans and
implementation
Vi-sion
StrategyEconomic
To maintain a sustained
economic growth of 10% p.a. over the
next 25 years
Social
A just and cohesive
society enjoying
equitable social development in a
clean and secure environment
Political
An issue-based,
people-centered,
result-oriented, and accountable
democratic political system
Overarching vision
A globally competitive and
prosperous nation with a high quality of life by 2030
2
is the natural environment, with its inherent supply of renewable and non-
renewable goods and services.
Development objectives and the need to protect and maintain the
natural environment must go hand in hand. This is because environmental
sustainability, including the conservation of biodiversity, underpins human
well-being (UN 2005). Our natural environment not only provides us with
the basic goods needed for sustenance, such as water, food, and fi bre, but it
also purifi es the air and water, produces healthy soils, cycles nutrients, and
regulates the climate. These ecosystem services provided by the environment
0
10 000
20 000
30 000
40 000
50 000
60 000
70 000
80 000
90 000
1950 1960 1970 1980 1990 2000 2010 2020 2030 2040 2050
Urban
Rural
Total
Po
pu
lati
on
(th
ou
san
ds)
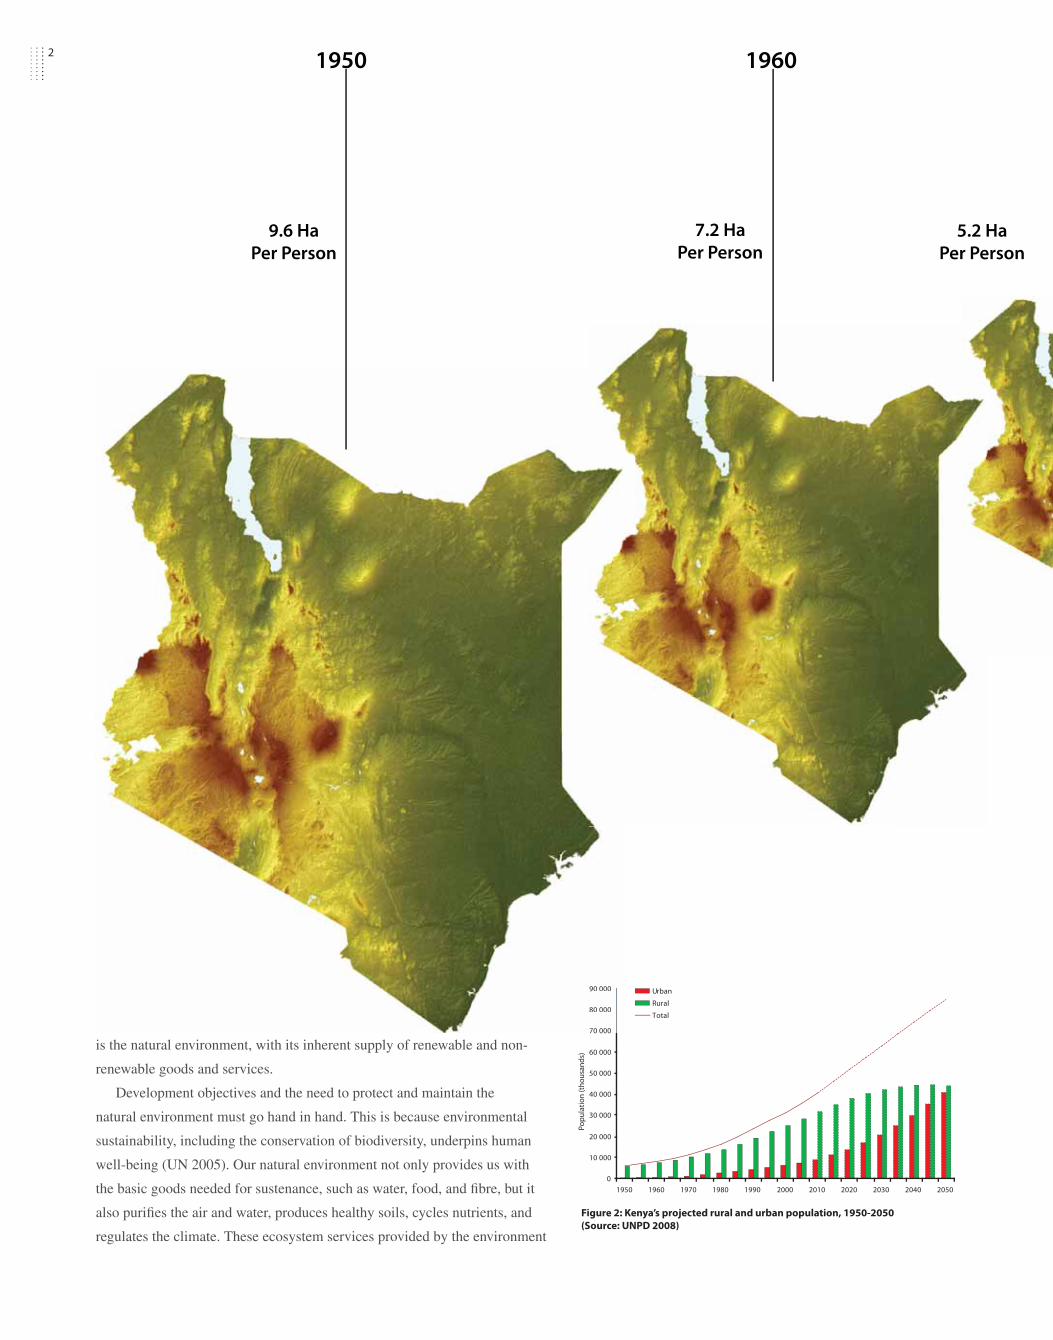
Figure 2: Kenya’s projected rural and urban population, 1950-2050
(Source: UNPD 2008)
70 000
80 000
90 000
1950 1960
9.6 HaPer Person
7.2 HaPer Person
5.2 HaPer Person

31970 1980 1990 2000 2005 2015 2050
3.6 HaPer Person
2.5 HaPer Person
1.9 HaPer Person
1.3 HaPer Person
1.7 HaPer Person 0.3 Ha
Per Person
are important for developing and maintaining human
health, creating national wealth, and reducing poverty
(UN 2005).
Population Challenges for Vision 2030
Currently, Kenya’s population is nearly 38 million, having grown
from just eight million in 1960. With a yearly growth rate of 2.8 per cent
it is projected to reach 51 million by 2025 (Thaxton 2007). Vision 2030
should plan for and ensure an equivalent economic growth to accommodate its
growing population. The proportion of Kenyans living in urban areas increased from
7.4 per cent in 1960 to 21.3 per cent in 2007. By 2030, it is projected that 33 per cent of
Kenyans will live in urban areas (UNPD 2008); to achieve Vision 2030, this fact must also
be considered. Increasing the number of people living in the same area adds pressure on land and
its resources. In a hypothetical situation in which land is shared equally among the population base,
as time passes and population increases, each individual’s share of land would decrease, as illustrated in
Figure 3.
Environmental Goals for 2012
The Government of Kenya understands and appreciates the important function that the environment plays
in underpinning development. It is cognizant that achieving Vision 2030 depends on maintaining the
natural systems that support agriculture, energy supplies, livelihood strategies, and tourism. Table 1 on the
following page illustrates how the environment cuts across Vision 2030’s pillars.
To support the social pillar, Kenya aims to provide its citizens with a clean, secure, and sustainable
environment by the year 2030. To achieve this, the nation has set goals such as increasing forest cover
from less than three per cent of its land base at present to four per cent by 2012 and to lessen by half all
environment related diseases by the same time (GoK 2007).
Among the strategies for achieving these goals are the following: promoting environmental conservation
to help achieve the Millennium Development Goals (MDGs); improving pollution and waste management
through the design and application of economic incentives; and commissioning public-private partnerships
(PPPs) for improved effi ciency in water and sanitation delivery. Kenya will enhance disaster preparedness
in all disaster-prone areas and improve the capacity for adaptation to the impacts of global climate change.
In addition, the country will harmonize environment-related laws for better environmental planning and
governance (GoK 2007).
Figure 3: Kenya’s shrinking land base
(Source: UNPD 2008)
The amount of land available to each person
in Kenya has decreased from 9.6 ha in 1950
to 1.7 ha in 2005. It is projected that available
land will further decline to 0.3 ha per person
by 2050
0
2
4
6
8
10
12
1950 1960 1970 1980 1990 2000 2005 2015 2050
Hect
ares
Per
Per
son
Ch
rist
ian
La
mb
rech
ts/U
NEP
Smoke rises from farmers clearing small patches of land
4
Kenya’s Forests and the Economic and Social PillarsForests cover only about three per cent of Kenya’s land area, yet they provide crucial direct and indirect
goods and services to its people and make a signifi cant contribution to the national economy. About 70
per cent of Kenya’s domestic energy comes from wood, for example, and out of the 20 million m3 of
fuelwood consumed annually, 95 per cent is collected from forests and rangelands (MENR 1994). In
addition to providing a variety of wood and non-timber products, Kenya’s forests provide the following
ecosystem services: they trap and store rain water; regulate river fl ows and prevent fl ooding; help recharge
ground-water tables; improve soil fertility; reduce soil erosion and sediment loads in river water; help
regulate local climate conditions; and act as carbon reservoirs and sinks.
Many forests serve as essential wildlife habitats, and are traditionally important for cultural ceremonies
and as sacred sites to local communities. It is estimated that 530 000 forest-adjacent households (which
amount to 2.9 million people living within fi ve kilometres from forests) derive direct benefi ts from
indigenous closed-canopy forests. This amounts to about eight per cent of Kenya’s population. Estimates
indicate that in some areas, the forestry sector contributes about 70 per cent of the cash income of forest
adjacent households (Wass 1995).
Forests play a critical role as water catchments. In addition to retaining and fi ltering water for
human uses, forests contribute to the availability of water for hydro power, which supplies Kenya
with close to 60 per cent of its electricity generation. Forests also help to reduce siltation in
hydroelectric empoundments.
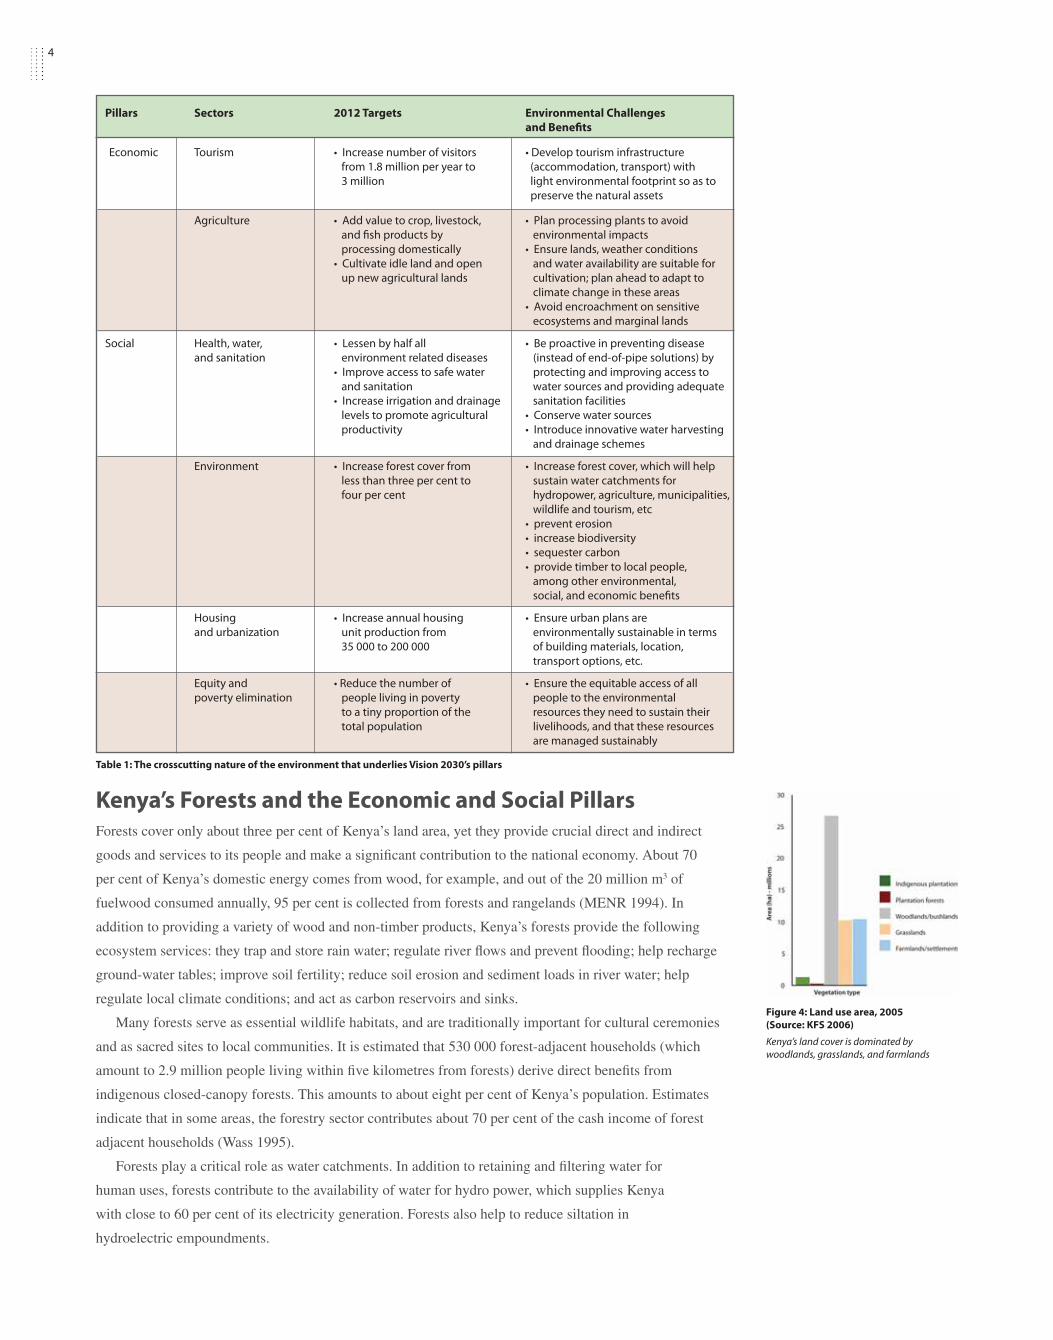
Figure 4: Land use area, 2005
(Source: KFS 2006)
Kenya’s land cover is dominated by
woodlands, grasslands, and farmlands
Table 1: The crosscutting nature of the environment that underlies Vision 2030’s pillars
Pillars Sectors 2012 Targets Environmental Challenges
and Benefi ts
Economic Tourism • Increase number of visitors • Develop tourism infrastructure
from 1.8 million per year to (accommodation, transport) with
3 million light environmental footprint so as to
preserve the natural assets
Agriculture • Add value to crop, livestock, • Plan processing plants to avoid
and fi sh products by environmental impacts
processing domestically • Ensure lands, weather conditions
• Cultivate idle land and open and water availability are suitable for
up new agricultural lands cultivation; plan ahead to adapt to
climate change in these areas
• Avoid encroachment on sensitive
ecosystems and marginal lands
Social Health, water, • Lessen by half all • Be proactive in preventing disease
and sanitation environment related diseases (instead of end-of-pipe solutions) by
• Improve access to safe water protecting and improving access to
and sanitation water sources and providing adequate
• Increase irrigation and drainage sanitation facilities
levels to promote agricultural • Conserve water sources
productivity • Introduce innovative water harvesting
and drainage schemes
Environment • Increase forest cover from • Increase forest cover, which will help
less than three per cent to sustain water catchments for
four per cent hydropower, agriculture, municipalities,
wildlife and tourism, etc
• prevent erosion
• increase biodiversity
• sequester carbon
• provide timber to local people,
among other environmental,
social, and economic benefi ts
Housing • Increase annual housing • Ensure urban plans are
and urbanization unit production from environmentally sustainable in terms
35 000 to 200 000 of building materials, location,
transport options, etc.
Equity and • Reduce the number of • Ensure the equitable access of all
poverty elimination people living in poverty people to the environmental
to a tiny proportion of the resources they need to sustain their
total population livelihoods, and that these resources
are managed sustainably

5
UNITED REPUBLICOF TANZANIA
ETHIOPIA
UGANDA
SUDAN
SOMALIA
Lake Victoria
Lake Turkana
I N D I A N
O C E A N
0 100 200
Kilometres
Town
Capital City
Major Town
500
1 000
1 500
2 000
!
! (
! \
! (
Lodwar
Mombasa
NAIROBI
Nakuru
Kisumu
! Garissa
Lake
Government
Protected Forest
Elevation
(Metres)
N
Figure 5: Forests are concentrated in Kenya’s moist highlands where human populations and agricultural production are also concentrated. In
the extensive semi-arid regions, forests are mainly found on isolated hills and in discontinuous narrow bands along riverbeds. Kenya has 258
forest reserves.
Protected Forests
WD
PA 2
00
7
5

6
Figure 6: The fi ve water towers of Kenya
Five Water Towers6
UNITED REPUBLICOF TANZANIA
ETHIOPIA
UGANDA
SUDAN
SOMALIA
Lake Victoria
Lake Turkana
I N D I A N
O C E A N
Elevation
(Metres)
0 100 200
Kilometres
Lake
“Water Towers”
River
Turk
wel
Ewaso Nyiro
Tana
Athi
Sondu
Yala Nzoia
Kerio
Mar
a
Ewas
o N
yiro
!
! ( !
! \
! (
Lodwar
Mombasa
NAIROBI
Nakuru
Kisumu
! Garissa
1 2
3
4 5
1. Mt. Elgon
2. Cherangani Hills
3. Mau Complex
4. Aberdare Range
5. Mt. Kenya
500
1 000
1 500
2 000
N
DR
SR
S a
nd
KF
WG
20
06

7
Five water towers: Kenya’s water catchments—a fl agship project for 2012
The fi ve “water towers” of Kenya — Mount Kenya, the Aberdare Range, the Mau Forest Complex, Mount
Elgon, and the Cherangani Hills — are montane forests and the fi ve largest forest blocks in the country. They
form the upper catchments of all the main rivers in Kenya (except the Tsavo River originating from Mt.
Kilimanjaro). The “water towers” are sources of water for irrigation, agriculture, industrial processes, as well
as to all installed hydro-power plants, which produce about 60 per cent of Kenya’s electricity output.
These montane forests are also surrounded by the most densely populated areas of Kenya, because
they provide enough water for intensive agriculture and urban settlements (DRSRS and KFWG 2006).
Their importance in the supply of timber and non-timber products to the communities living within their
surroundings cannot be over emphasized. As such these forests are important and support livelihoods for
all Kenyans in one way or another. At the same time, however, they are being lost or degraded by extensive
illegal, irregular, and ill-
planned settlements and illegal
forest resource extraction.
Such extensive and on-going
destruction of the country’s
natural assets and their
economic value is a matter of
national concern.
This section presents each
of the fi ve “water towers”
and describes their changing
physical conditions over time.
Assessing changes in these fi ve
regions is important not only
for ensuring the livelihoods of
millions of Kenyans, but also
for preserving their intrinsic
beauty and richness.
Ch
rist
ian
Lam
bre
chts
/UN
EP
Mau Complex
The Mau Complex, the largest
of the fi ve water towers, feeds
major water arteries that extend
as far as lakes Turkana, Natron,
and Victoria, and support critical
economic activities including
hydropower, tourism,
and agriculture.
Mount Kenya
Mount Kenya was designated
a UNESCO World Heritage
Site in 1997 for its remarkable
ecosystems and natural beauty.
Its forests are critical water
catchments for Kenya, delivering
an estimated 40 per cent of the
country’s water needs.
Aberdare Range
Located on the eastern edge of
the Rift Valley, the Aberdare Range
forests cover over 250 000 ha and
form part of the upper catchments
of the Tana River, and the Sasumua
and Ndakaini dams, which provide
most of Nairobi’s drinking water.
Mount Elgon
This 73 706 ha national park forms
the upper catchment area for the
Nzoia and Turkwel rivers, providing
water to Malakisi River that
crosses farming areas south of the
mountain before entering Uganda.
Cherangani Hills
The Cherangani Hills forest,
located on the western ridge of
the Great Rift Valley, covers an
area of some 120 000 ha and
forms the upper catchments
of the Nzoia, Kerio, and
Turkwel rivers.
N

8
The Mau Forest Complex
The Mau Forest Complex is Kenya’s largest closed canopy forest
ecosystem and the single most important water catchment in the
Rift Valley and western Kenya. The Mau Complex forms part of the
upper catchments of all but one of the main rivers on the west side
of the Rift Valley. These rivers act as arteries carrying the Mau’s
waters throughout western Kenya — from
Lake Turkana in the north to Lake Natron in
the south as well as to Kenya’s most populous
rural areas in the Lake Victoria basin.
The Mau Complex covering over
400 000 ha, is the largest of the fi ve “water
towers” of Kenya. Its montane forests are
an important part of water-fl ow regulation,
fl ood mitigation, water storage, groundwater
recharge, water purifi cation, micro-climate
regulation, and reduced soil erosion and
siltation. The forests also provide other major
environmental services, including nutrient
cycling and soil formation. In addition, their
role in storing carbon makes the Mau
Forest globally important for mitigating
climate change.
The Mau Complex supports key
economic sectors in Kenya including energy,
tourism, agriculture, and water supplies
for settlements. The catchment’s potential
hydropower generation capacity is approximately 535 megawatts,
which represents 57 per cent of Kenya’s current total electricity
generation. To date, projects that have already been developed,
are under construction, or are proposed within the Mau catchment
will generate only about 190 MW (GoK and UNEP 2008).
Ch
rist
ian
La
mb
rech
ts/U
NE
P
¯
!(
0 60 120Kilometres
!(
!(
!(
!(
!(
!(
!(!\
Figure 7: Critical water catchments, Mau Complex
Go
K a
nd
UN
EP
20
08
Tea estate

9
The Mau Complex is particularly important for two
of Kenya’s largest foreign currency earners: tea and
tourism. Kenya’s most important tea-growing areas
are located in the excellent growing conditions of the
highlands adjacent to the forests of the fi ve “water
towers.” In addition to approximately Kshs 12 billion
in foreign currency, the tea sector brings 50 000 jobs
and supports 645 000 dependants in western Kenya.
It is estimated that two-thirds of the tea produced in
western Kenya is grown in areas that benefi t from the
ecological functions of the Mau Complex, including the
maintenance of favourable micro-climatic conditions.
In recent years, the tourism industry has been one of
Kenya’s three largest foreign currency earners. Kenya’s
wildlife and natural areas are the key attraction for
most of those tourists. The rivers fl owing from the Mau
Complex are the lifeline for major tourism destination
areas including: Maasai Mara National Reserve and
Lake Nakuru National Park.
Mu
sicfi
en
d/F
lick
r.co
m
Figure 8: Kenya’s tea growing areas and the fi ve “water towers”
(Source: UNEP, taken from The Tea Map, The Tea Board of Kenya, 2003)
Woman picking tea leaves

10
The Mau Forest Complex: Degrading Forests
In spite of its national importance, many areas of the Mau Forest Complex have been deforested or degraded;
much of this damage taking place in the past few decades. Degazettement of forest reserves and continuous
widespread encroachment have led to the destruction of over 100 000 ha of forest since 2000, representing
roughly one-quarter of the Mau Complex’s area (yellow arrows). This series of satellite images documents 35
years of incremental destruction of forest area, punctuated by dramatic excisions.
Ch
rist
ian
La
mb
rech
ts/U
NE
P
11
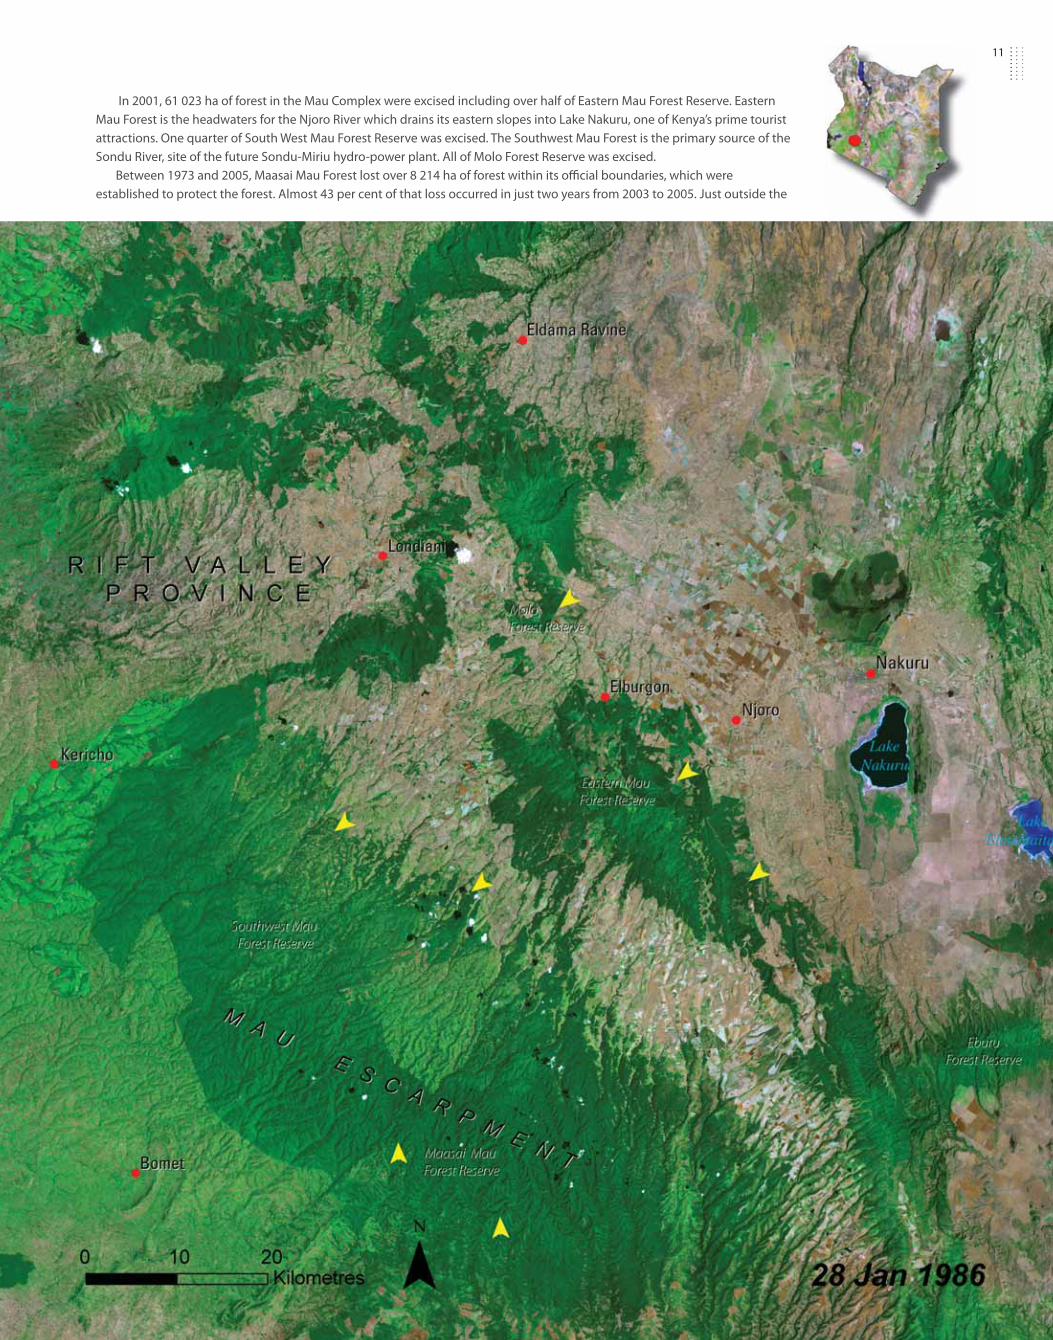
In 2001, 61 023 ha of forest in the Mau Complex were excised including over half of Eastern Mau Forest Reserve. Eastern
Mau Forest is the headwaters for the Njoro River which drains its eastern slopes into Lake Nakuru, one of Kenya’s prime tourist
attractions. One quarter of South West Mau Forest Reserve was excised. The Southwest Mau Forest is the primary source of the
Sondu River, site of the future Sondu-Miriu hydro-power plant. All of Molo Forest Reserve was excised.
Between 1973 and 2005, Maasai Mau Forest lost over 8 214 ha of forest within its offi cial boundaries, which were
established to protect the forest. Almost 43 per cent of that loss occurred in just two years from 2003 to 2005. Just outside the

12
gazetted boundaries of Maasai Mau Forest nearly 32 000 ha were lost during
the same time period. The eastern slopes of the Maasai Mau are a crucial
catchment for the Ewaso Nyiro River, as the western slopes are for the Mara
River. Forest loss in critical catchment areas for the Sondu, Mara, Molo, Naishi,
Makalia Nderit, and Njoro Rivers will result in ecological and hydrological
changes, which threaten the sustainable future of areas downstream.
In addition, people have encroached into some 43 700 ha in the Mau
Complex’s remaining protected forests. The desirability of many of these
areas for agriculture attracts a rapidly growing population and has led to
rapid conversion of large areas of forest to farmland. Extreme land cover
changes such as these can have serious consequences both within the forest
and downstream in the form of water shortages, health risks, desertifi cation,

13
habitat destruction, sedimentation, erosion and even alteration of the
micro-climate.
Loss of forest at this rate is unsustainable and threatens the security and
future development of Kenya. Realizing the goals of Vision 2030 will depend
in a very signifi cant way upon the sustainable management of Kenya’s
natural assets. Kenya’s fi ve “water towers” are key among those assets.
In the mid-1980s, Kenya’s Nyayo Tea Zones were created to form
a clear boundary and a buff er between the indigenous forest and
surrounding land uses. They have not been particularly successful
in meeting that aim and many hectares of indigenous forest were
cleared for their creation (Birdlife International 2008a, GEF 2008).
Ch
rist
ian
La
mb
rech
ts/U
NEP

14
Mount Kenya: Disappearing Glaciers
Mount Kenya lies directly on the equator, 180 km north of Nairobi. Its scenic snow-cap, rising above the
surrounding savanna, can be seen for hundreds of kilometres. It is an iconic symbol of Kenya known around
the world. In addition to its beauty, Mt. Kenya’s slopes are valuable for timber, farmland, and tourism and as a
critical water catchment for much of the country. From the forest belt growing between 3 000 and 4 000 m to the
Ch
rist
ian
La
mb
rech
ts/U
NE
P

15
glacial summit at 5 199 m, Mt. Kenya receives over 2 000 mm of precipitation annually. This water feeds the Ewaso Nyiro River and
the Tana—Kenya’s largest rivers. Mount Kenya’s contribution to the Tana provides roughly half the water needed for its crucial
hydropower facilities.
Its wide range of altitude and rainfall gives rise to eight ecological zones ranging from a cultivated zone below 1 800 m to
the Afro-alpine (areas above 3 800 m) and the Nival zone, found above most vegetation. Some of these zones can be seen in
distinctly diff erent shades of green in the satellite images.
16
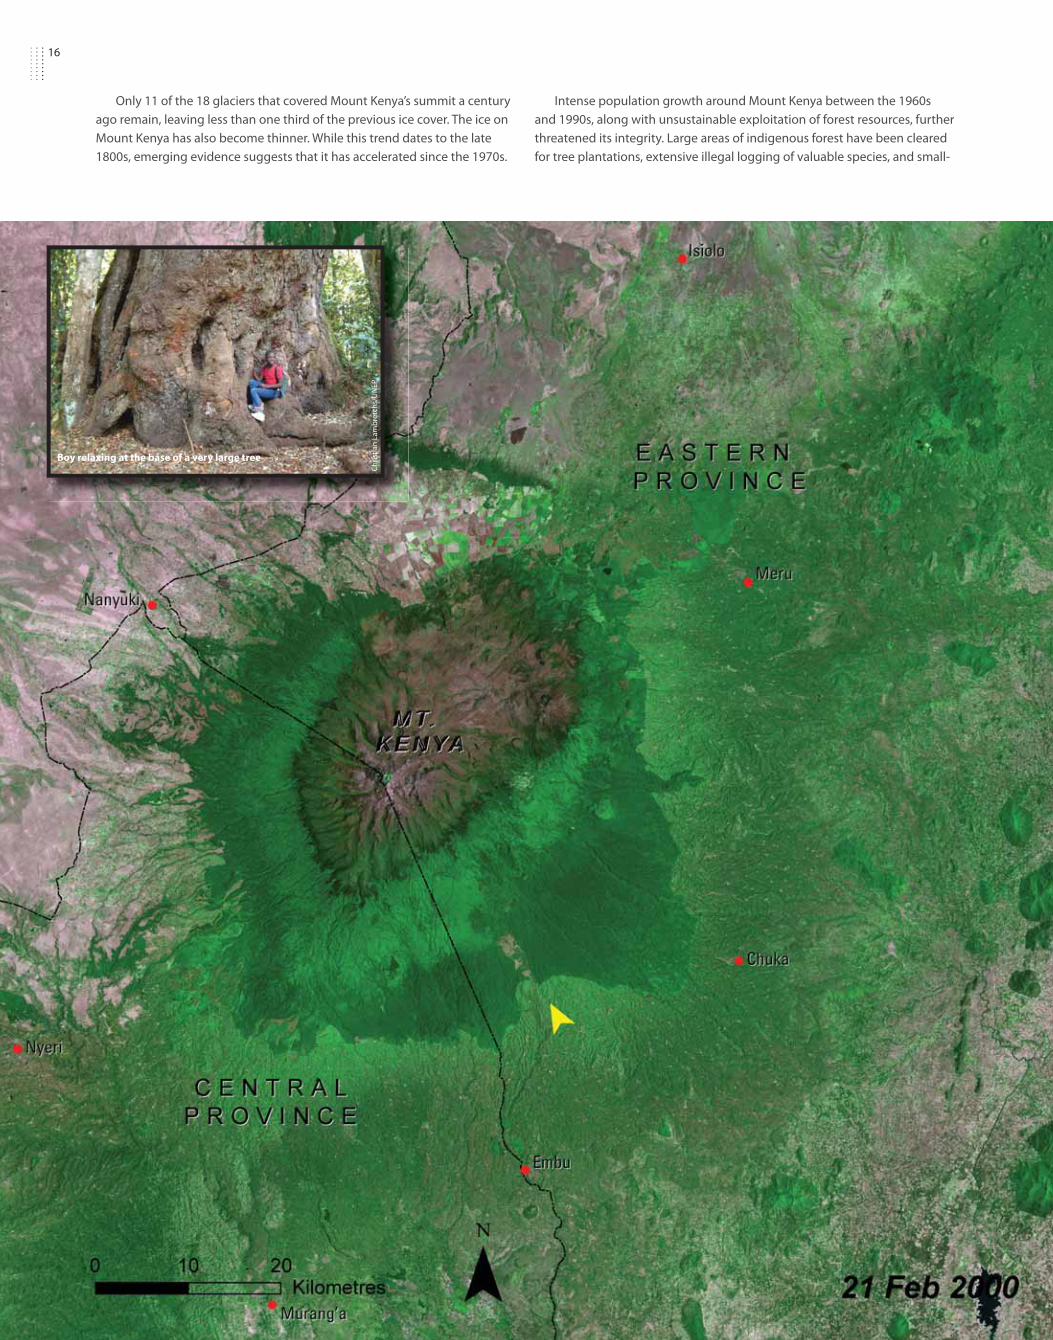
Only 11 of the 18 glaciers that covered Mount Kenya’s summit a century
ago remain, leaving less than one third of the previous ice cover. The ice on
Mount Kenya has also become thinner. While this trend dates to the late
1800s, emerging evidence suggests that it has accelerated since the 1970s.
Intense population growth around Mount Kenya between the 1960s
and 1990s, along with unsustainable exploitation of forest resources, further
threatened its integrity. Large areas of indigenous forest have been cleared
for tree plantations, extensive illegal logging of valuable species, and small-
Ch
rist
ian
La
mb
retc
hs/
UN
EP
Boy relaxing at the base of a very large tree
17
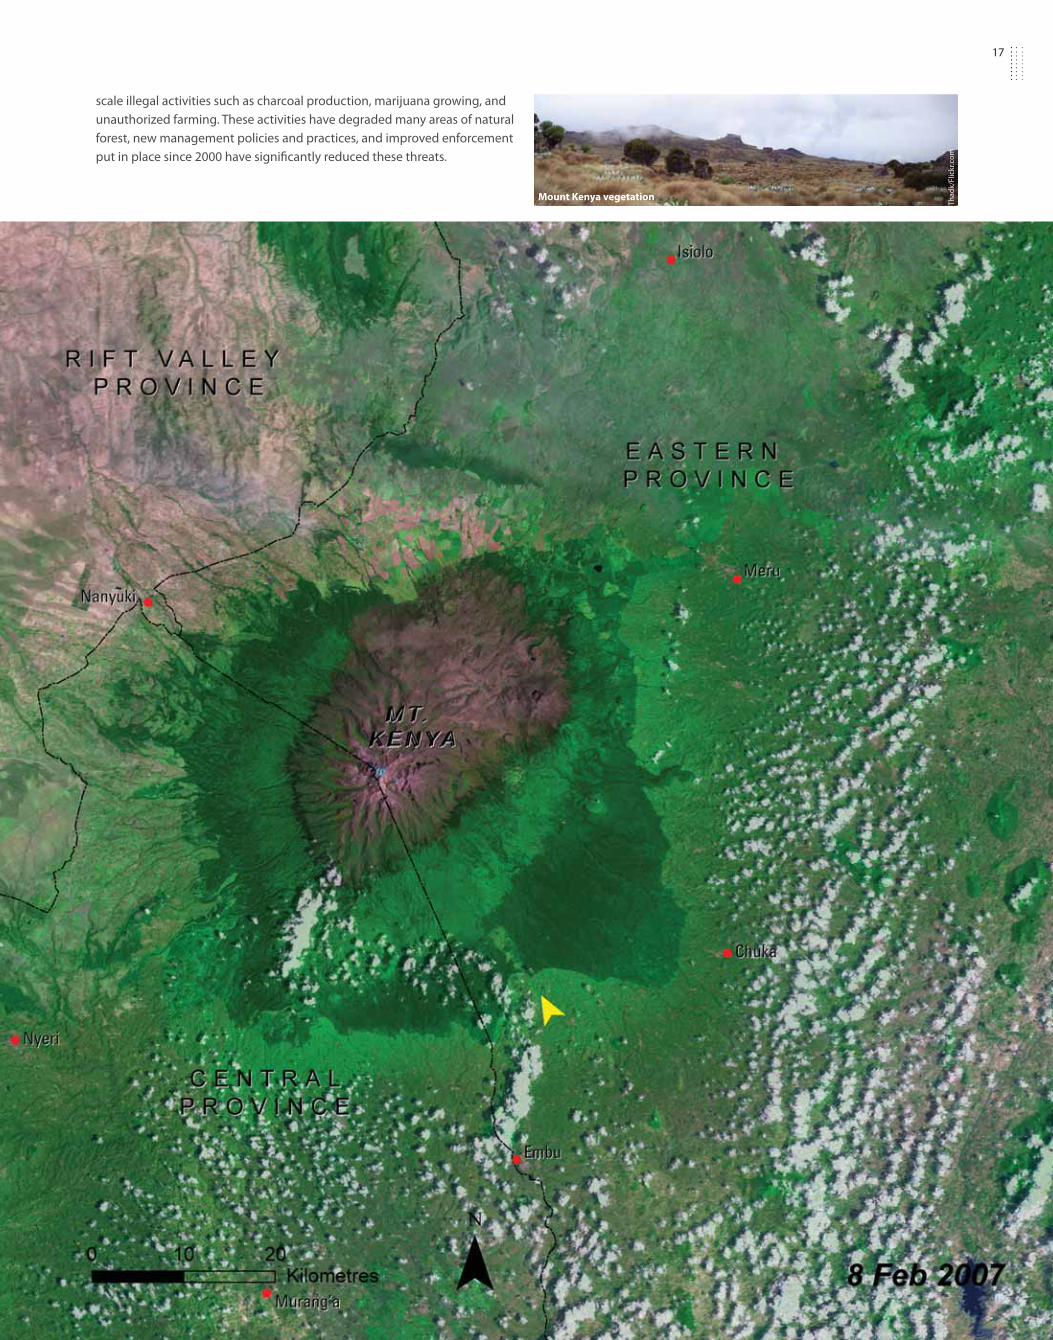
scale illegal activities such as charcoal production, marijuana growing, and
unauthorized farming. These activities have degraded many areas of natural
forest, new management policies and practices, and improved enforcement
put in place since 2000 have signifi cantly reduced these threats.
Th
ad
k/Fl
ick
r.co
m
Mount Kenya vegetation

18
The Aberdare Range: Forest Devastation
The Aberdare Range spans the equator west of Nairobi rising over 4 000 m at its highest peak, Oldonyo Lesatima.
Its western escarpments drop dramatically toward the Rift Valley. To the east it slopes gradually, carrying water
into the Tana River and to the Seven Forks hydropower plants where over half of Kenya’s electricity is generated.
On their way into the Tana, the Chania River fl ows into Sasumua Dam and the Thika River into Ndakaini Dam,
from which Nairobi’s more than three million people obtain most of their water. The Aberdares also form part of
the upper catchments of the Athi, Ewaso Nyiro, and Malewa Rivers.
Na
tio
n M
ed
ia G
rou
p
Ch
rist
ian
La
mb
rech
ts/U
NE
P
Ndakaini Dam

19
Reserves protect the forest belt of the Aberdare Range, including Aberdare, Kikuyu Escarpment, Kijabe Hill, Kipipiri, and
Nyamweru and 760 km2 of the forest falls under the protection of Aberdare National Park. The forests cover over 250 000 ha. The
Range is characterized by a high diversity of forest types due to the wide altitudinal range (1 800 to 3 600 metres) and climatic
diff erences between slopes.
The forests are being devastated by large-scale, uncontrolled, irregular, or illegal human activities, in particular charcoal
production, logging, encroachment and settlements, cultivation of marijuana and other crops, and livestock grazing. The assault
on these forests poses a grave threat to Kenya’s water security, biodiversity conservation, and economic development.
19

20
Mount Elgon: Legal Logging
Mt. Elgon lies north of Lake Victoria on the Kenya-Uganda border. Its Kenyan side is protected by Mt. Elgon National
Park, Chepkitale National Reserve, and Mt. Elgon Forest Reserve; the latter covers 73 706 ha. Mt. Elgon forms the
upper catchment area for two major rivers, the Nzoia and Turkwel. The forest contains globally threatened species,
including some endemic to the Afro-montane region and others endemic to Mt. Elgon alone, making the area a
priority for species conservation and a major attraction for tourists. A rapidly growing population of around two
Landscape surrounding Mt. Elgon Ch
rist
ian
La
mb
rech
ts/U
NE
P
Ch
rist
ian
La
mb
rech
ts/U
NE
P

21
million people in the area around the mountain puts very high pressure on this unique ecosystem. Authorized logging has
been practiced in Mt. Elgon since at least the 1930s. In the 1970s, land was excised from the Mt. Elgon Forest around Chebyuk
where 600 families were settled to make way for a national game reserve. While a 1986 Presidential Decree banned all logging in
Kenya’s natural forests, it excluded Mt. Elgon where legal logging continues. Agricultural encroachment and charcoal production
are degrading the forest in many areas as well. In many cases forest has been cleared for crops on slopes that are not suitable,
making them susceptible to erosion and landslides. Continued degradation and forest loss on Mt. Elgon threatens to undermine
the area’s crucial role as a water catchment for the surrounding region and will reduce the viability of the ecosystem itself.

22
The Cherangani Hills: Indigenous Forests
The Cherangani Hills, an ancient fault-block formation of non-volcanic origin, are a series of gently rolling hills
that form an undulating upland plateau on the western edge of Kenya’s Rift Valley. They lie between the Elgeyo
Escarpment to the east and Mt. Elgon to the west, rising to 3 365 m above sea level at Cheptoket Peak in the
north-central section. Located on the Cherangani escarpment, the hills are largely covered by a series of gazetted
indigenous Forest Reserves. River Nzoia has its source in these Hills. Over the last 20 years, local inhabitants have
encroached on the forest land converting it to farmlands.Ch
rist
ian
La
mb
rech
ts/U
NE
P
23
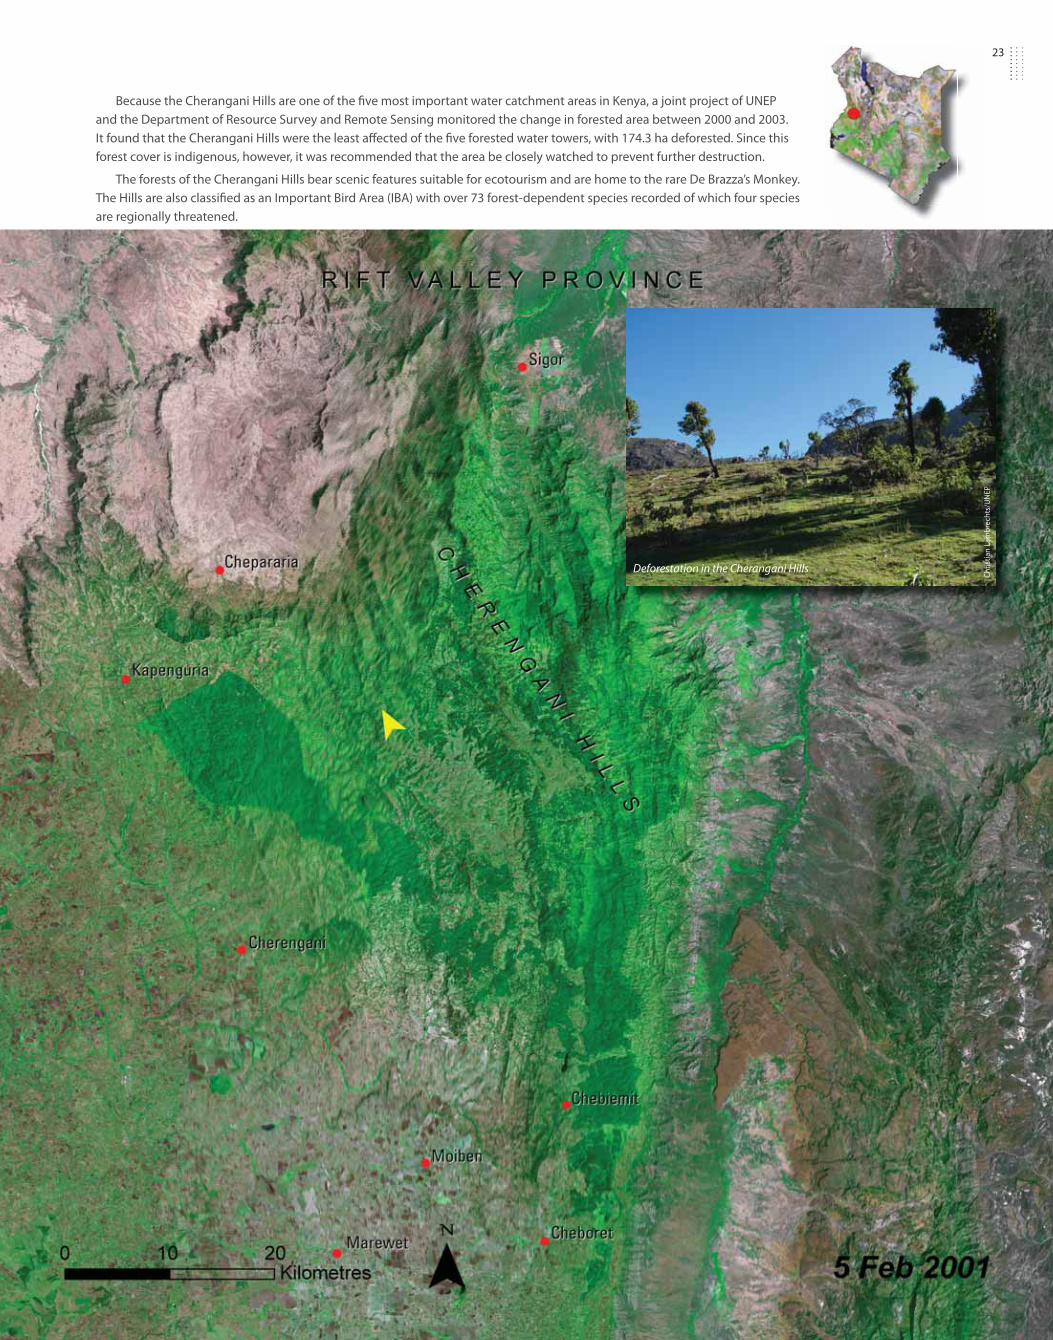
Because the Cherangani Hills are one of the fi ve most important water catchment areas in Kenya, a joint project of UNEP
and the Department of Resource Survey and Remote Sensing monitored the change in forested area between 2000 and 2003.
It found that the Cherangani Hills were the least aff ected of the fi ve forested water towers, with 174.3 ha deforested. Since this
forest cover is indigenous, however, it was recommended that the area be closely watched to prevent further destruction.
The forests of the Cherangani Hills bear scenic features suitable for ecotourism and are home to the rare De Brazza’s Monkey.
The Hills are also classifi ed as an Important Bird Area (IBA) with over 73 forest-dependent species recorded of which four species
are regionally threatened.
Deforestation in the Cherangani Hills
Ch
rist
ian
La
mb
rech
ts/U
NE
P

24
TourismSince 2002, the tourism industry has been one of Kenya’s three largest foreign exchange earners. In 2007,
consolidated earnings from tourism amounted to Ksh. 65.4 billion. Tourism is also a major source of
employment, providing at least 400 000 jobs in the formal sector and over 600 000 in the informal sector
(GoK and UNEP 2008). Tourism is targeted as the leading sector in achieving the goals of the Vision 2030.
The Vision’s economic pillar aims for the country to be among the top 10 long-haul tourist destinations
in the world, offering high-end, diverse, and distinctive visitor experiences that few competitors can offer.
Preserving the environment is essential if this goal is to be realized.
Kenya will need to improve the infrastructure in and around its tourist attraction sights, including
airports/airstrips and road networks, in order to achieve its goals of quadrupling tourism’s annual GDP
contribution to over Ksh. 80 billion, raise international visitors from 1.8 million in 2006 to three million in
2012, increase hotel beds from 40 000 to about 65 000, and provide high quality service. The challenge is to
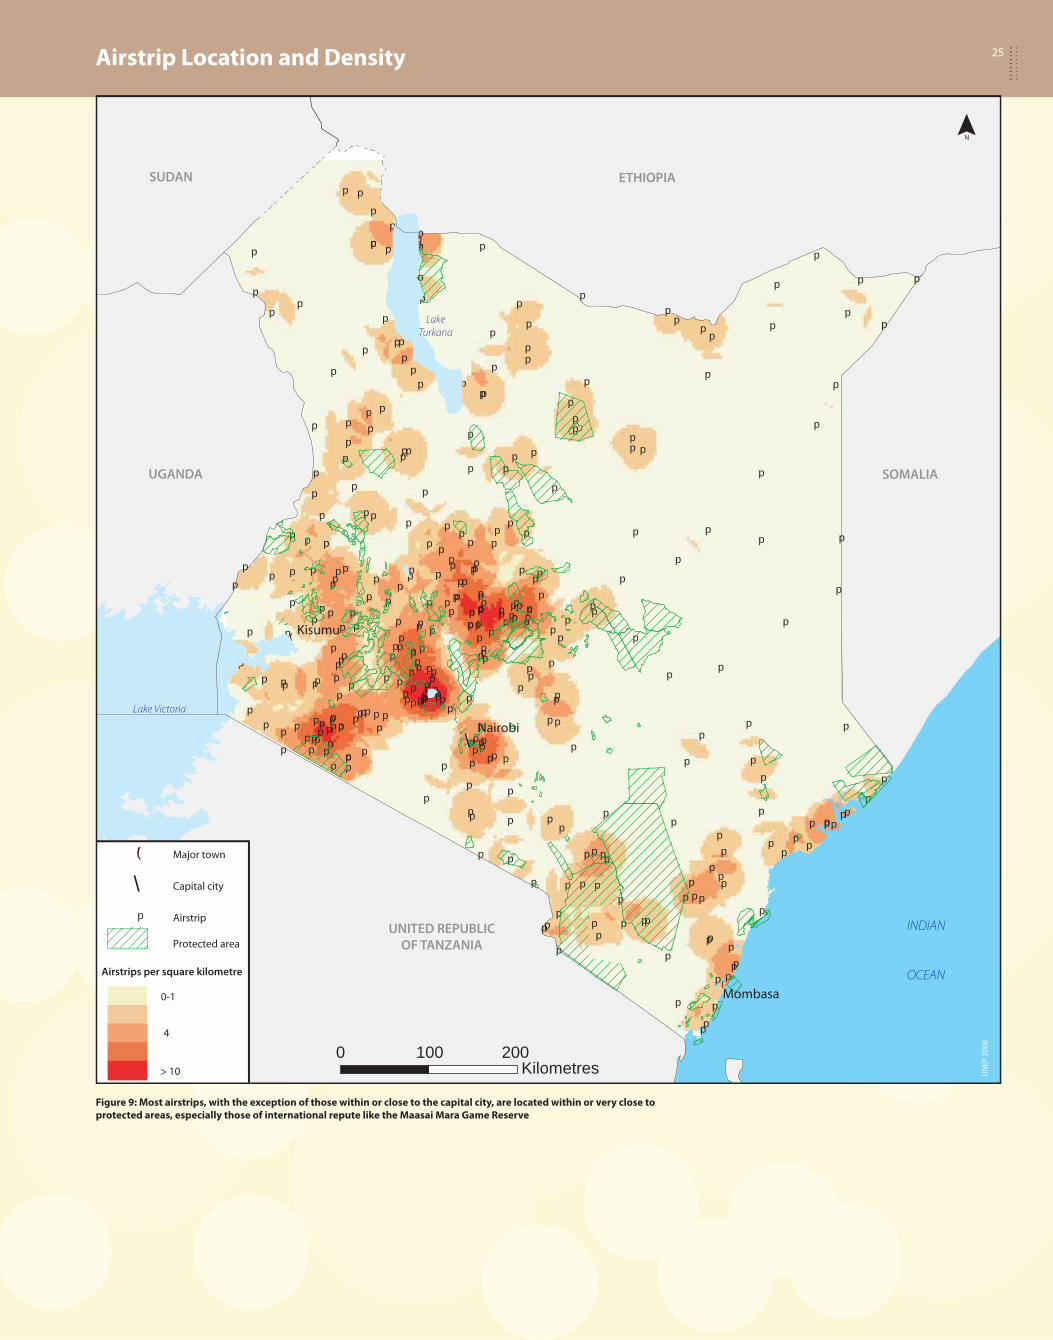
do this without destroying the very environment that visitors come to see. As can be seen in Figure 9, there
are already many airstrips within protected areas and some parks have high densities of these strips. Building
more of them in such sensitive areas will destroy wildlife habitat and endanger the animals that attract
tourists to Kenya.
Wildife conservation
Kenya’s game parks and spectacular wildlife attract nearly two million tourists each year (UN-Water 2006).
Wildlife conservation is thus a high priority. Formed in 1946, Nairobi National Park, just outside the city,
was the country’s fi rst protected area (Chapter 5). By 2008, 75 237.9 km2 of the nation’s land area had been
set aside as national parks and game reserves (WDPA 2007).
Ars
hia
Ch
an
de
r/S
GT
/UN
EP
24
Tourists on safari view a large herd of African elephants
25
p
p
p
p
p
p
p
pp
p
p
p
p
p
p
p
p
p
p
p
p
p
p
p
p
p
p
p
p
p
p
p
p
p
p
p
p
p
p
p
p
p
p
p
p
p
p
p
p
p
p
p
p
p
p
p
p
p
p
p
p
p
p
p
p
pp
p
p
p
p
p
p
p
p
p
p
p
p
p
p
p
p
p
p
p
p p
p
p
p
p
p
p
p
p
p
p
p
p
p
p p
pp
p
p
p
p
p
p
p
p
p
p
p
p
p
p
p
p
p
p
p
p
p
p
p
p
p
p
p
p
p
p
p
p
p
p
p
p
p
p
p
p
p
p
p
p
p
p
p
p
p
p
p
p
p
p
p
p
p
p
p
p
p
p
p
p
p
p
p
p
p
p
p
p
p p
pp
p
p
p
p
p
p
p
p
p
p
p
p
p
p
p
p
p
p
p
p
p
p
p
p
p
p
p
p
p
p
p
p
pp
p
p
p
p
p
p
p
pp
p
p
pp
p
p
p
p
p
p
pp
p
p
pp
p
p
ppp
p
p
p
p
p
p
pppp
p
p
p
p
p
p
pp
p
p
p
p
p
p
pp
p
p
p
p
p
p
p
p
p
p
p
p
p
p
p
p
p
p
p p
p
p
p
p
p
p
p
pp
p
p
p
p
p
p
p
pp
p
pp
p
p
p
p
p
p
p
p
p
p
p
p
p
p
p
p
p
p
p
pp
p
p
pp
p
p
p
p
p
p
p
p
p
p
pp
p
p
p
p
p
p
p
0 100 200Kilometres
!(
!(
!\
!(
!\
p
Airstrip Location and Density
Figure 9: Most airstrips, with the exception of those within or close to the capital city, are located within or very close to
protected areas, especially those of international repute like the Maasai Mara Game Reserve
UN
EP
20
08
25
N

26
The environment underpins economic vitality, including future tourism growth. For example, the
rivers fl owing from the Mau Complex are the lifeline for major tourism destinations including the Maasai
Mara Game Reserve and Lake Nakuru National Park (Figure 10). In 2007, revenues from entry fees alone
amounted to Ksh. 650 million and Ksh. 513 million for the Maasai Mara and Lake Nakuru respectively
(GoK and UNEP 2008). The annual indirect revenues from tourism in these two conservation areas are
estimated to be in excess of Ksh. 5 billion. The rivers are also the lifeline for a number of other conservation
areas where tourism potential is not yet fully developed, including Kakamega National Reserve, Kerio
Valley National Reserve, South Turkana National Reserve, Lake Baringo, and Lake Natron.
These conservation areas host a high diversity of fauna and fl ora. For example, three of
them — Kakamega, Baringo, and Natron — are classifi ed as Important Bird Areas, with Kakamega
and Baringo each hosting over 450 bird species, while Natron is the main breeding area for the Lesser
Flamingoes in the Rift Valley. Other Important Bird Areas (IBA) that depend on rivers fl owing from the
Mau Complex include: Koguta Swamp (Kenya–Sondu River); Kusa Swamp (Kenya–Nyando River);
Serengeti National Park (Tanzania–Mara River), Mara Bay, and Masirori Swamp (Tanzania–Mara River).
Ch
rist
ian
La
mb
rech
ts/U
NE
PLi
p K
ee
/Flic
kr.
com
26
Flamingos and other birds wade in the shallow water along the northwest shores of Lake Nakuru
Flamingoes in Lake Nakuru

27
Figure 10: Major tourism destinations
The rivers fl owing from the Mau Complex are the lifeline for major tourism destinations.
¯
!(
0 60 120Kilometres
!(
!(
!(
!(
!(
!(
!(!\
So
urc
e: U
NEP
20
08

28
The Aberdare National Park receives an average 50 000 visitors annually. The scenery is spectacular and
the high upland waterfalls are a special attraction. The north and southeast of the park are as yet undeveloped
but have unique attractions. Kenya Wildlife Service (KWS) has identifi ed sites in the south with potential
for forest walks and hiking routes to Kinangop peak. In the north, areas for fi shing, hiking, and horse riding
have been identifi ed. Thus, the tourism potential of the Aberdares remains largely untapped.
The rivers fl owing from the Marmanet forests provide water to fi ve major conservation areas: Lake
Baringo, Lake Bogoria National Reserve, Samburu National Reserve, Buffalo Springs National Reserve, and
Shaba National Reserve (Figure 11). In 2007, the entry fees alone in these fi ve conservation areas generated
revenues in the range of Ksh. 100 - 200 million (GoK and UNEP 2008).
Biodiversity attractions and threats
Kenya ranks second highest among African countries in bird and mammal species richness. It has an
estimated 6 506 higher plant species, 359 mammals, 1 079 birds (of which 344 are breeding birds), 61
reptiles, 63 amphibians, and 34 fi sh species (Survey of Kenya 2003, WRI 2003). In addition, there are an
estimated 21 575 insect species for a total of 29 673 species excluding molluscs and other invertebrates
(Survey of Kenya 2003).
Joh
an
ne
s A
kiw
um
i/U
NE
P
Ste
vie
Wit
he
rs/F
lick
r.co
m
Aft
ab
Uzz
am
an
/Flic
kr.c
om
Goliath heron, Lake Baringo
Located in the Rift Valley, Lake Baringo is a
critical habitat and refuge for a variety of
birds and fi sh species. Today, fi sh stocks in the
lake have decreased, and so have water levels
as a results of droughts and over-irrigation.

29
Threatened Species
The closed canopy forests are major habitats for a disproportionately large percentage of the country’s
wildlife and other biodiversity. Though forests cover about three per cent of Kenya’s area, they contain 50
per cent of the nation’s tree species, and it is estimated that they harbour 40 per cent of the larger mammals,
30 per cent of birds, and 35 per cent of the nation’s butterfl ies. The indigenous forests have both endemic
and threatened species (KFWG 2008).
About half of Kenya’s threatened mammals and birds are found in its forests (Survey of Kenya 2003).
According to the 2006 International Union for Conservation of Nature and Natural Resources (IUCN) report,
Kenya’s threatened species include 33 species of mammals, 28 breeding bird species, fi ve species of reptiles,
four of amphibians, 29 of fi sh, 16 molluscs species, 11 species of other invertebrates, and 103 plant species.
Figure 11: Marmanet forests are critical to major conservation areas
100 5Kilometres
¯
Joh
an
ne
s A
kiw
um
i/U
NE
P
Ch
rist
ian
La
mb
rech
ts/U
NE
P
Ch
rist
ian
La
mb
rech
ts/U
NE
P
Go
K a
nd
UN
EP
20
08

303030
Endangered
KenyaSpec ies Spec ies of
Luka
s V
erm
eer
/ Fl
ickr
.co
m
Tis
wa
ng
o/
Flic
kr.
com
Rya
n H
arv
ey /
Flic
kr.c
om
alu
ka.o
rg
bir
dfi
nd
ers.
co.u
k
Sokoke Scops Owl(Otus ireneae)
The Sokoke Scops owl’s population is
estimated at about 1 000 pairs over about
220 km2 of forest in the Arabuko-Sokoke
forest. Unsustainable (and often illegal)
deforestation for wood-carving and fi rewood
may substantially reduce the species
breeding success. Government owned forest
reserves suff er from pit-sawing of timber and
pole-cutting. The Sokoke Scops is listed as
Endangered under the IUCN.
Grevy’s Zebra (Equus grevyi)
Grevy’s zebras have suff ered one of the most substantial reductions of
range of any African mammal. A few decades ago, more than 15 000
Grevy’s zebra inhabited Africa. Today in Kenya alone, the population
estimates are between 1 838 and 2 319. The Grevy’s Zebra is listed as
Endangered under the IUCN. The greatest threats facing the species today
are habitat fragmentation and loss as more land is converted to agricultural
use. Overgrazing by livestock is leading to signifi cant environmental
degradation. Grevy’s zebra compete with the ever-increasing livestock
population and agricultural crops for water.
African Elephant(Loxodonta africana)
The African elephant is the largest land animal
on Earth. It is listed as Endangered under IUCN.
African elephants are threatened by poaching
and habitat loss. Their tusks have been used
in jewelry, piano keys, hanko (personalized
signature seal used in Japan), and other items.
Local people consume their meat and trade their
hides and other parts, which are highly prized
among big game hunters. From 1979 to 1989,
Kenya's elephant population declined from about
130 000 to less than 17 000. Management and
anti-poaching measures implemented through
the ivory ban in 1989 has helped to increase and
stabilize their population.
Gigasiphon(Gigasiphon macrosiphon)
The gigasiphon is listed as Endangered under the IUCN. Native
of the tropical forest, this plant is threatened by anthropogenic
activities. Threats originate from habitat destruction or
loss, deforestation — where land is cleared for agriculture,
development, and population resettlement — competition
from introduced species, pollution, global warming, and plant
hunting, collecting, and harvesting.
Black Rhino(Diceros bicornis)
The black rhinoceros population was
nearly wiped out by poachers in the
1970s and 80s. Today its population
stands at 540 in Kenya (AWF 2008).
Poaching activities for horn trade,
believed to have medicinal value, along
with habitat loss, have put the black
rhinoceros on the Critically Endangered
list of the IUCN.
313131131
Ra
ymo
nd
TM /
Flic
kr.c
om
Oliv
ier
Leja
de/
Flic
kr.c
om
Flic
kr. c
om
Flic
kr. c
om
Law
Kev
en /
Flir
ckr.
com
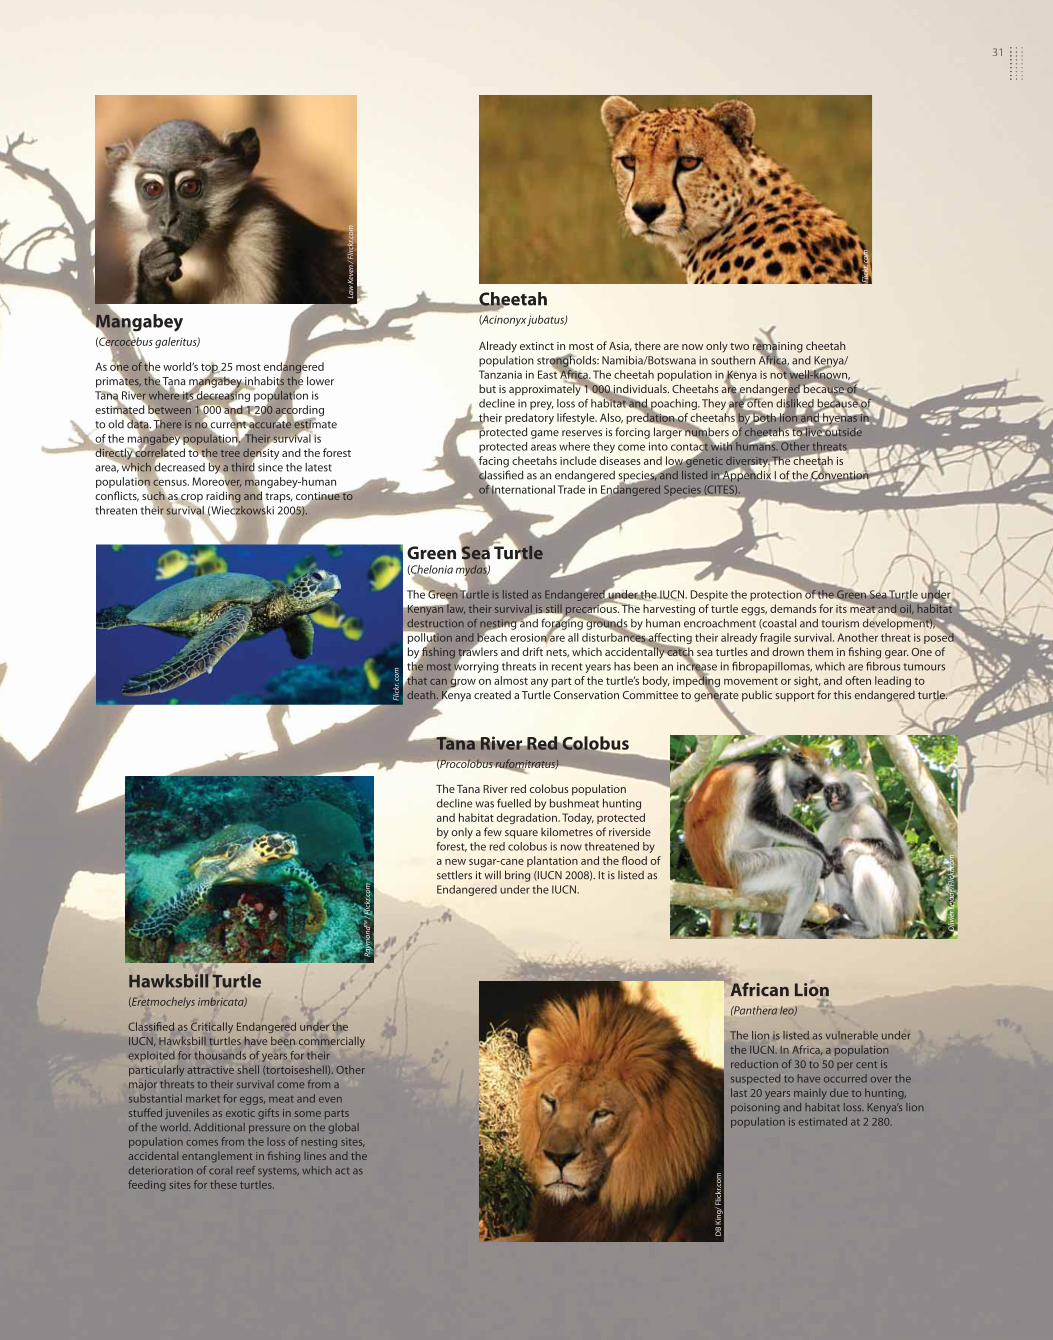
Mangabey(Cercocebus galeritus)
As one of the world’s top 25 most endangered
primates, the Tana mangabey inhabits the lower
Tana River where its decreasing population is
estimated between 1 000 and 1 200 according
to old data. There is no current accurate estimate
of the mangabey population. Their survival is
directly correlated to the tree density and the forest
area, which decreased by a third since the latest
population census. Moreover, mangabey-human
confl icts, such as crop raiding and traps, continue to
threaten their survival (Wieczkowski 2005).
Green Sea Turtle(Chelonia mydas)
The Green Turtle is listed as Endangered under the IUCN. Despite the protection of the Green Sea Turtle under
Kenyan law, their survival is still precarious. The harvesting of turtle eggs, demands for its meat and oil, habitat
destruction of nesting and foraging grounds by human encroachment (coastal and tourism development),
pollution and beach erosion are all disturbances aff ecting their already fragile survival. Another threat is posed
by fi shing trawlers and drift nets, which accidentally catch sea turtles and drown them in fi shing gear. One of
the most worrying threats in recent years has been an increase in fi bropapillomas, which are fi brous tumours
that can grow on almost any part of the turtle’s body, impeding movement or sight, and often leading to
death. Kenya created a Turtle Conservation Committee to generate public support for this endangered turtle.
Hawksbill Turtle(Eretmochelys imbricata)
Classifi ed as Critically Endangered under the
IUCN, Hawksbill turtles have been commercially
exploited for thousands of years for their
particularly attractive shell (tortoiseshell). Other
major threats to their survival come from a
substantial market for eggs, meat and even
stuff ed juveniles as exotic gifts in some parts
of the world. Additional pressure on the global
population comes from the loss of nesting sites,
accidental entanglement in fi shing lines and the
deterioration of coral reef systems, which act as
feeding sites for these turtles.
African Lion(Panthera leo)
The lion is listed as vulnerable under
the IUCN. In Africa, a population
reduction of 30 to 50 per cent is
suspected to have occurred over the
last 20 years mainly due to hunting,
poisoning and habitat loss. Kenya’s lion
population is estimated at 2 280.
Tana River Red Colobus(Procolobus rufomitratus)
The Tana River red colobus population
decline was fuelled by bushmeat hunting
and habitat degradation. Today, protected
by only a few square kilometres of riverside
forest, the red colobus is now threatened by
a new sugar-cane plantation and the fl ood of
settlers it will bring (IUCN 2008). It is listed as
Endangered under the IUCN.
Cheetah(Acinonyx jubatus)
Already extinct in most of Asia, there are now only two remaining cheetah
population strongholds: Namibia/Botswana in southern Africa, and Kenya/
Tanzania in East Africa. The cheetah population in Kenya is not well-known,
but is approximately 1 000 individuals. Cheetahs are endangered because of
decline in prey, loss of habitat and poaching. They are often disliked because of
their predatory lifestyle. Also, predation of cheetahs by both lion and hyenas in
protected game reserves is forcing larger numbers of cheetahs to live outside
protected areas where they come into contact with humans. Other threats
facing cheetahs include diseases and low genetic diversity. The cheetah is
classifi ed as an endangered species, and listed in Appendix I of the Convention
of International Trade in Endangered Species (CITES).
DB
Kin
g/
Flic
kr.
com
32
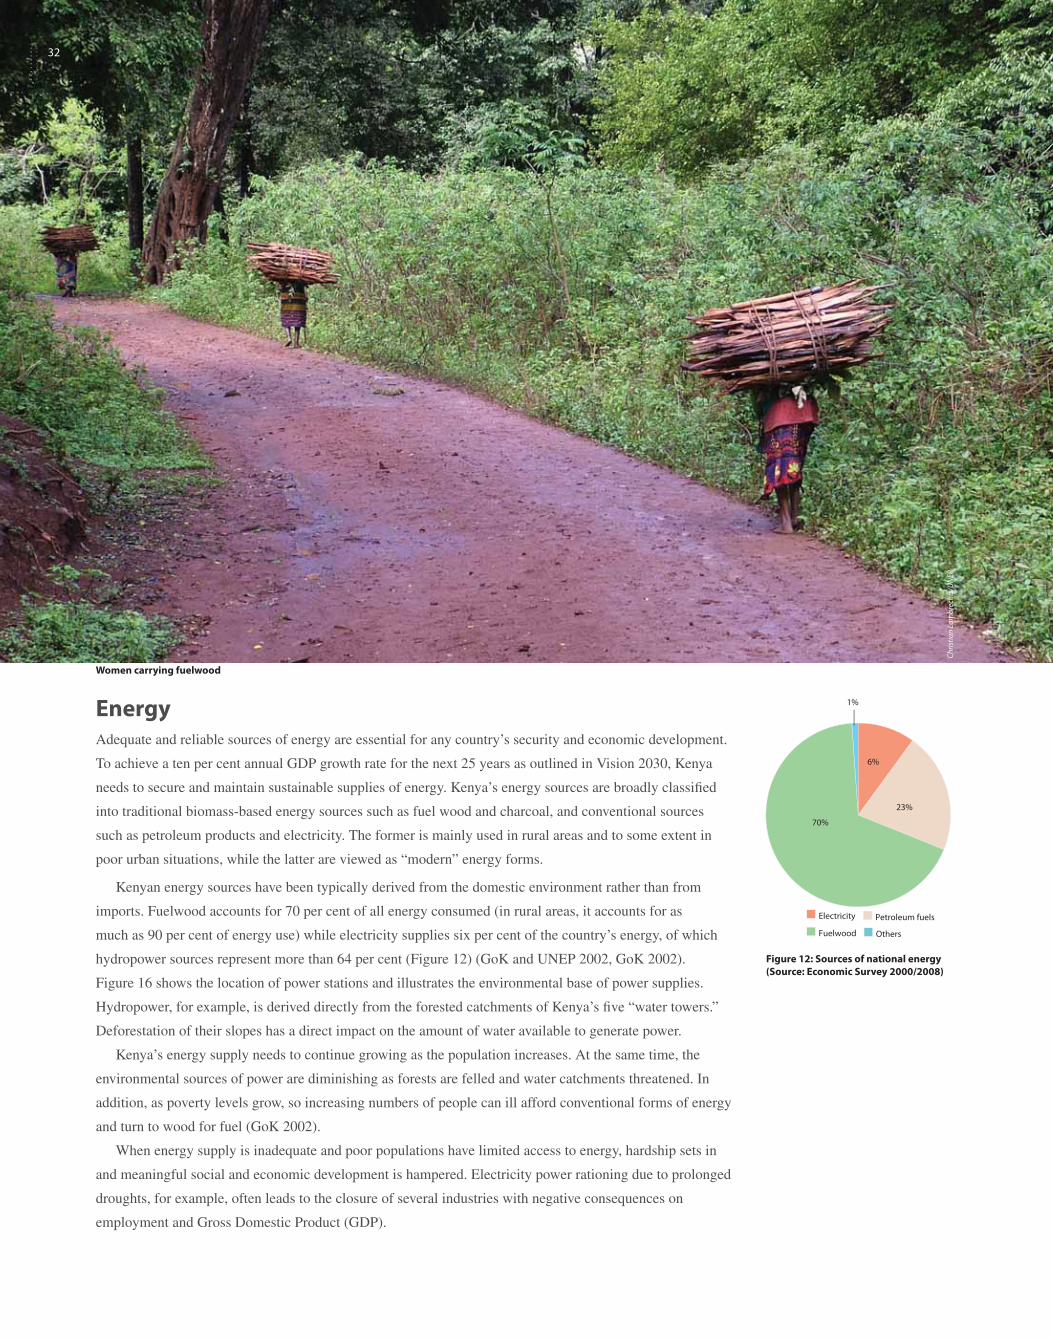
EnergyAdequate and reliable sources of energy are essential for any country’s security and economic development.
To achieve a ten per cent annual GDP growth rate for the next 25 years as outlined in Vision 2030, Kenya
needs to secure and maintain sustainable supplies of energy. Kenya’s energy sources are broadly classifi ed
into traditional biomass-based energy sources such as fuel wood and charcoal, and conventional sources
such as petroleum products and electricity. The former is mainly used in rural areas and to some extent in
poor urban situations, while the latter are viewed as “modern” energy forms.
Kenyan energy sources have been typically derived from the domestic environment rather than from
imports. Fuelwood accounts for 70 per cent of all energy consumed (in rural areas, it accounts for as
much as 90 per cent of energy use) while electricity supplies six per cent of the country’s energy, of which
hydropower sources represent more than 64 per cent (Figure 12) (GoK and UNEP 2002, GoK 2002).
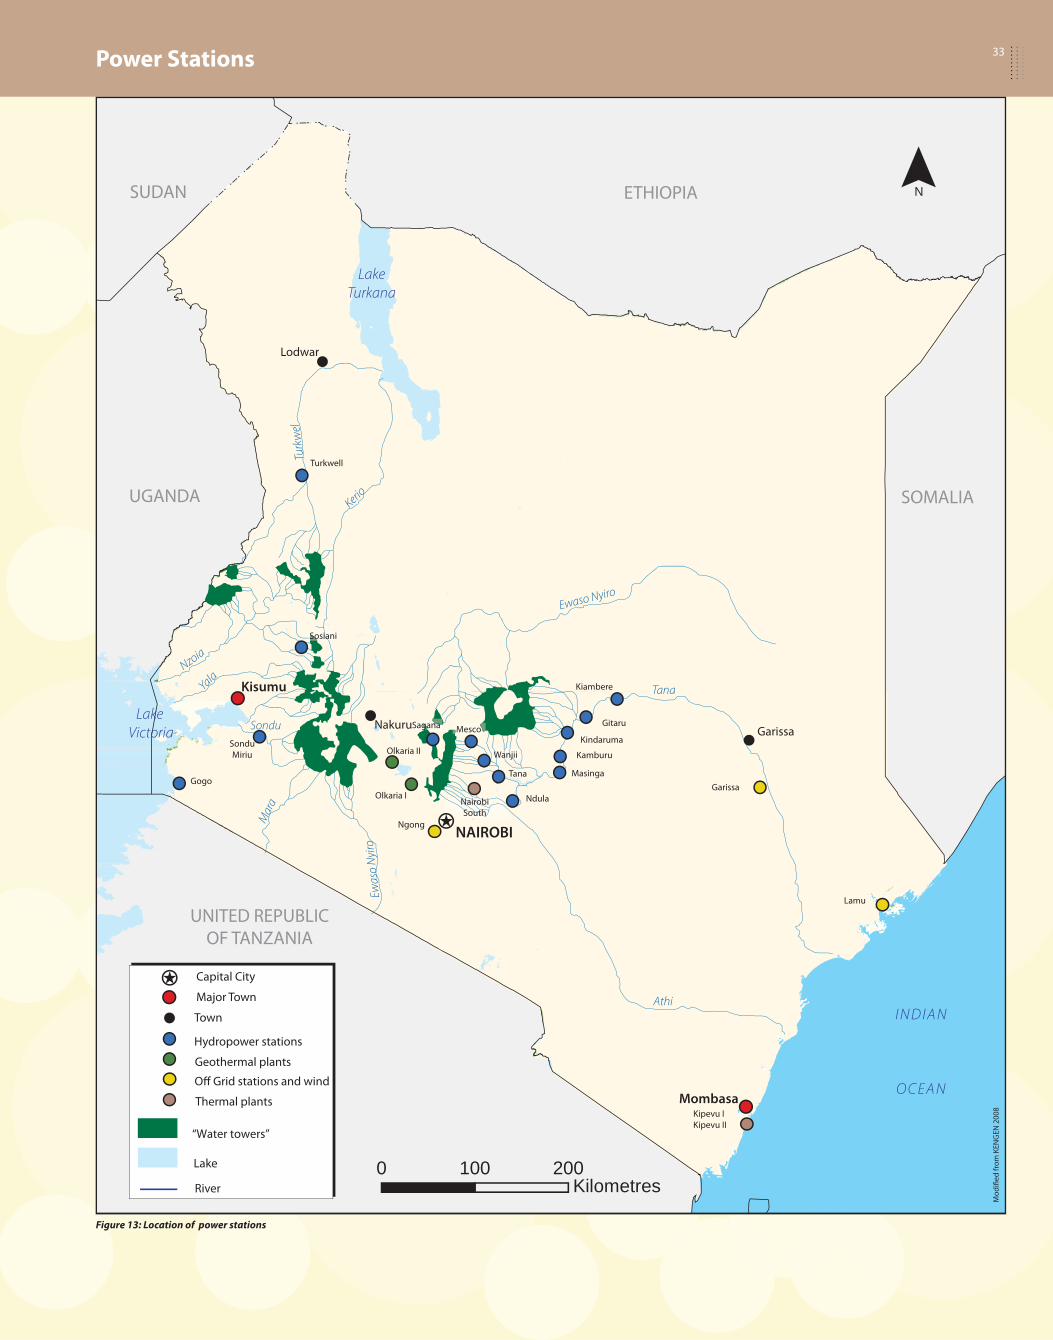
Figure 16 shows the location of power stations and illustrates the environmental base of power supplies.
Hydropower, for example, is derived directly from the forested catchments of Kenya’s fi ve “water towers.”
Deforestation of their slopes has a direct impact on the amount of water available to generate power.
Kenya’s energy supply needs to continue growing as the population increases. At the same time, the
environmental sources of power are diminishing as forests are felled and water catchments threatened. In
addition, as poverty levels grow, so increasing numbers of people can ill afford conventional forms of energy
and turn to wood for fuel (GoK 2002).
When energy supply is inadequate and poor populations have limited access to energy, hardship sets in
and meaningful social and economic development is hampered. Electricity power rationing due to prolonged
droughts, for example, often leads to the closure of several industries with negative consequences on
employment and Gross Domestic Product (GDP).
Electricity Petroleum fuels
Fuelwood Others
6%
70%
1%
23%
Figure 12: Sources of national energy
(Source: Economic Survey 2000/2008)
Ch
rist
ian
La
mb
rech
ts/U
NEP
32
Women carrying fuelwood
33
Figure 13: Location of power stations
Power Stations
KE
NG
EN
20
08
33
Lake
“Water towers”
0 100 200KilometresRiver
UNITED REPUBLIC
OF TANZANIA
ETHIOPIA
UGANDA
SUDAN
SOMALIA
Lake Victoria
LakeTurkana
I N D I A N
O C E A N
!
!
! ! !
! !
! ! !
! !
Kipevu I
Kipevu II
Turkwell
Sosiani
Sondu
Miriu
Gogo
Olkaria I
Olkaria II
Ngong
Nairobi
South
!
!
!
Lodwar
Mombasa
NAIROBI
Nakuru
Kisumu
! Garissa
Sagana Mesco
Wanjii
Tana
Ndula
Masinga
Kamburu
Kindaruma
Gitaru
Kiambere
Garissa
Lamu
Turk
wel
Ewaso Nyiro
Tana
Athi
Sondu
Yala Nzoia
Kerio
Mar
a
Ewas
o N
yiro
Hydropower stations
Geothermal plants
Thermal plants
Off Grid stations and wind
Town
Capital City
Major Town
N
Mo
difi
ed
fro
m K
EN
GE
N 2
00
8

34
Conventional Energy: Petroleum
Petroleum fuel is the most important
conventional energy source accounting
for 23 per cent of total national energy
consumption. Kenya imports all its
petroleum requirements either in the
form of crude oil or fi nished petroleum
products and they account for a signifi cant
proportion of national importation costs.
Most of the petroleum fuels are consumed
in the transport sector and in electricity production. Road tankers, rail, or oil pipelines transport petroleum
products from the port of Mombasa to other parts of the country. The oil pipeline network extends to the
cities and towns of Nairobi, Nakuru, Eldoret, and Kisumu. Plans are underway to extend the pipeline
to Uganda.
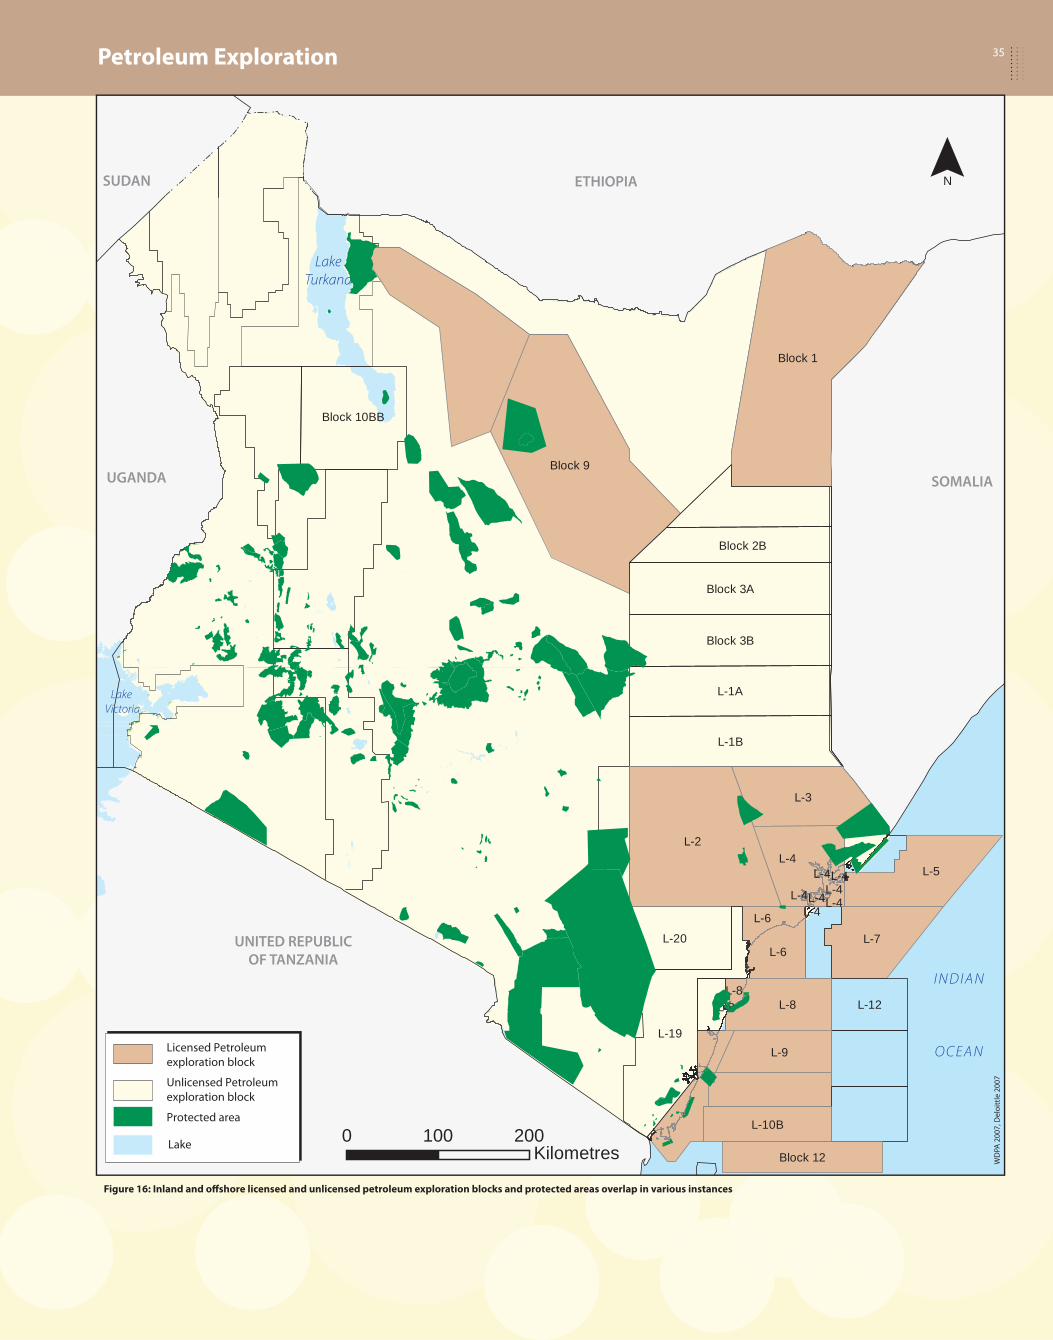
In recent years, Kenya has geared up petroleum exploration as a major step towards providing the energy
needed to attain Vision 2030. To this end, several inland and offshore blocks have been leased to petroleum
exploration companies (Figure 16). Adherence to high environmental standards during the exploration and
production process is essential, especially since some of these blocks overlap with existing protected areas.
It is important to note that demand for petroleum sometimes increases with drought events and that
petroleum consumption is a major source of the greenhouse gases that contribute to climate change. On the
other hand, traditional domestic energy sources such as fuelwood and hydropower could be managed on a
sustainable basis, while other renewable energy sources, such as solar, geothermal, wind, and biogas, could
be developed to increase their contribution to the nation’s energy needs.
Traditional Energy: Fuelwood
Fuelwood is the nation’s major source of energy,
especially for rural people who make up 80 per cent
of the total population. Although it constitutes
the most signifi cant energy source, the resource
base is rapidly shrinking as demand outstrips the
sources of local fi rewood and charcoal (Figure 15).
Furthermore, the use of ineffi cient methods of burning
is widespread, including traditional three-stone
fi replaces for fi rewood and earth-mound charcoal
kilns. Excessive reliance on fuelwood and the supply/
demand imbalance are the cause of much deforestation
and forest fragmentation, which in turn accelerates
land degradation and threatens water catchments (GoK 2008). In addition to hampering the achievement of
Vision 2030’s economic goals, the fuelwood crisis undermines progress towards the MDG goal of increasing
the land area covered by forest. Another impact of burning fuelwood and charcoal is respiratory illness
among women who are exposed to indoor smoke from kitchen fi res. There is, therefore, a great need for the
adoption of improved effi ciency and energy-saving stoves and kilns and for the nation to shift away from a
reliance on fuelwood, or excessive demand will increase pressures on already vulnerable forest resources.
30 000
25 000
20 000
15 000
10 000
5 000
1992 1995 2000 2005 2010 2015
Total Fuelwood Supply Fuelwood Demand Fuelwood Deficit
Met
ric
tonn
es
0
500
1 000
1 500
2 000
2 500
3 000
3 500
4 000
1995 1997 1999 2001 2003 2005 2007
Petr
oleu
m d
eman
d (0
00 t
onne
s)
Figure 14: National petroleum energy demand, 1995 – 2007
(Source: CBS 2001)
Figure 15: Fuelwood supply, demand, and defi cit
(Source: MENR 1994)W
orl
d B
an
k
Bundle of fuelwood
35Petroleum Exploration
WC
PA 2
00
7, D
elo
itte
20
07
Figure 16: Inland and off shore licensed and unlicensed petroleum exploration blocks and protected areas overlap in various instances
35
Lake
Unlicensed Petroleum
exploration block
Licensed Petroleum
exploration block
Protected area
0 100 200Kilometres
UNITED REPUBLICOF TANZANIA
ETHIOPIA
UGANDA
SUDAN
SOMALIA
Lake Victoria
I N D I A N
O C E A N
LakeTurkana
L- 2
Bl oc k 1
Bl oc k 9
L- 20
L- 19
L- 3
L- 5
L- 1B
L- 1A
L- 7
L- 8
L- 4
L- 9
Bl oc k 3A
Bl oc k 3B
Bl oc k 10 BB
L- 12
L- 6
L- 10B
Bl oc k 2B
Bl oc k 12
L- 6
L- 4
L- 8
L- 4
L- 4 L- 4 L- 4
L- 8
L- 4
L- 4
N
WD
PA 2
00
7, D
elo
ittl
e 2
00
7

36
Renewable Energy
Eighty-one per cent of the energy
used in Kenya is from renewable
sources, including solid biomass
(fuelwood) (REN21 2008).
Geothermal energy is by far the most
developed renewable energy form,
accounting for about 11 per cent of
all the electricity produced in the
country (GoK 2008). It is produced
at three sites in the Rift Valley and
a new plant is being built in Hell’s
Gate National Park to increase capacity. Kenya’s geothermal potential is very large and it has several
advantages — it is generated domestically so doesn’t rely on expensive oil imports and it doesn’t emit
greenhouse gases. Future development, however, must avoid damaging the environment for local people,
wildlife, and tourism.
Kenya’s electric power generation capacity in the year 2005 was 5.5 billion kWh (EIA 2008). In 2000,
hydropower accounted for about 57 per cent of the total. Petroleum based, geothermal, and wind account for
31 per cent, 11 per cent, and less than 0.1 per cent respectively (GoK 2008) (Figure 17).
The water used in hydropower generation comes from dams on major rivers fl owing from Kenya’s fi ve
water towers (page 6). Deforestation, land cover conversion, or any other activity that degrades these water
towers will in turn lead to a reduction in the amount of electricity generated hence directly affecting the
attainment of Vision 2030.
The exploitation of solar, wind, and biogas energy is still very low in spite of the country’s enormous
potential for these environmentally sound energy sources and the need for sustainable and affordable energy
sources to reduce reliance on fuelwood (GoK 2008). Solar energy is currently under-exploited although
it widely regarded as a plausible option to stimulate rural electrifi cation. To date, it is being exploited in
Kenya for lighting (photovoltaic), water pumping (mechanical), refrigeration, and water heating (solar
water heaters). The solar market is currently estimated to be worth over Ksh. 300 million per year. A solar
photovoltaic policy framework and strategy is being developed under the power sector
reorganization programme.
Wind energy also remains largely under-developed and under-exploited. A study in 2002 found there
is the potential for about 0.6 per cent of total energy to come from community wind energy (GoK 2002).
Wind energy applications, especially those related to mechanical functions, have a long history in Kenya.
In 1986, there were over 200 working windmills, of which about 100 were in Lamu and Mombasa districts.
Local expertise for building windmills, especially for water pumping, is still available in the private sector.
The Ministry of Energy created a national wind atlas for Kenya in 2003. It provides useful information to
facilitate both public and private sector investment in this important energy sub-sector.
Biogas technology for cooking and lighting gained momentum in the mid-1980s during the German-
funded Special Energy Project. Active promotion of biogas resulted in an estimated 1 000 biogas plants
being constructed and in use by 1995. Most of these plants are found in areas of high agricultural potential.
0
10
20
30
40
50
60
70
Hydro
(including
imports)
Geothermal Oil thermal
generation
IPPs
(thermal)
Gas turbine Wind Isolated
diesel plants
Source
Pe
rce
nta
ge
of
To
tal
Cap
acit
yFigure 17: Electricity power generation capacity from various sources, 2000
(Source: GoK 2008)
Am
bro
se O
rod
aIn
tern
ati
on
al R
ive
rs
Steam rises from a geothermal plant
Young man selling a solar panel

37
Environmental Disasters and Challenges to Vision 2030Kenya has always been plagued by natural, weather-
related disasters that cause diseases, deaths, and
suffering throughout the nation. Figure 18 illustrates
the prevalence of various types of hazards and the
proportion of Kenyans affected by each of them.
Especially prevalent are the twin weather-related
hazards of drought (Figure 19) and fl ooding (Figure
20). As the nation strives to achieve its development
goals, including targets under the MDGs and those
related to Vision 2030, it needs to effectively plan
and manage its environmental, as well as its economic and human resources, to avoid allowing recurring
natural phenomenon to turn into human and economic disasters.
Although these events are natural in
origin, the impacts of human-induced
climate change are predicted to exacerbate
them. It is already evident that the frequency
and occurrence of fl oods in many parts of
the country have increased signifi cantly
since the 1990s, for example. In addition,
environmental changes brought by
human activity, such as those highlighted
in this Atlas, including deforestation;
desertifi cation; coastal modifi cation, such as
the removal of mangroves; and agricultural
practices in fragile ecosystems, contribute to
an increase in the disastrous consequences
of what were once purely natural weather
hazards. Protecting and restoring these
environmental assets will help make Vision
2030's economic and social goals a reality.
Figure 18: Types of hazards in Kenya
(Source: Mutua 2005)
Key: a) Prevalence b) People aff ected c) People killed or
aff ected adversely (disasters)
Ch
rist
ian
La
mb
rech
ts/U
NEP
Millions of People Affected
0 1 2 3 4 5
1975
1977
1980
1984
1992
1995-1996
1999-2000
2004-2006
Yea
r o
f D
rou
gh
tFigure 19: Number of Kenyans (million) aff ected by drought,
1975-2006
(Source: KMD 2008)
Figure 20: Areas aff ected by fl oods
Many areas, especially in the northeast, along the coast, and in western Kenya,
are susceptible to fl oods and the country’s rangeland districts generally
experience fl ashfl oods during the rainy seasons.
0 100 200Kilometres
¯
!
!(
!
!\
!(
!
!(
!
\
ALR
MP
/Res
po
nse
Tea
m, F
EWS
NET
Ke
in U
SAID
20
07
37
Flash fl oods wash out a section of a road in Baringo District
38
DEP
HA
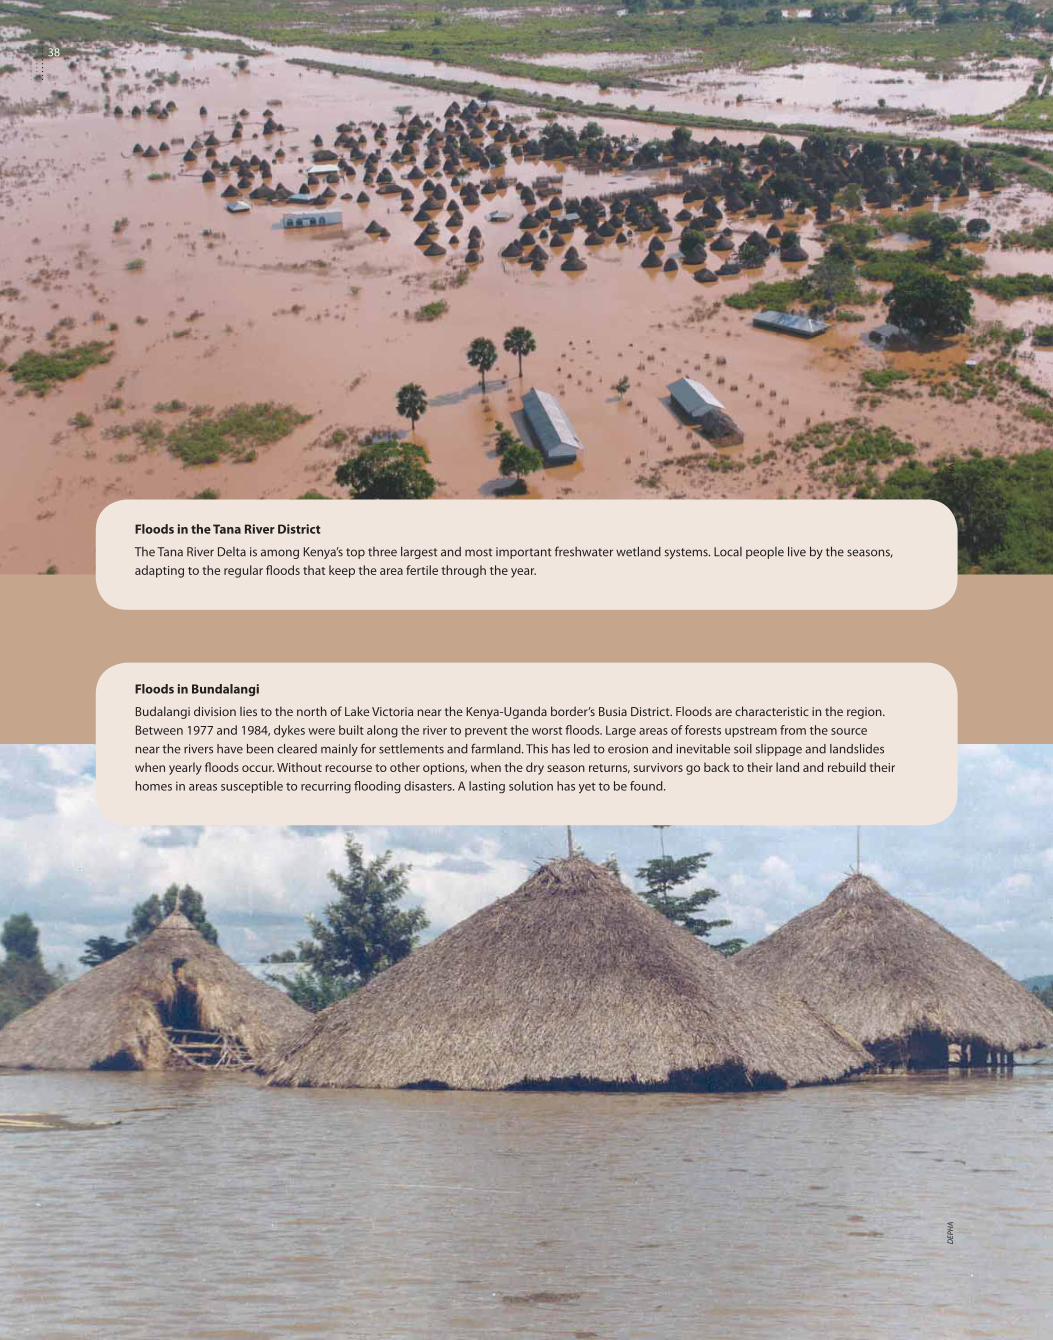
Floods in Bundalangi
Budalangi division lies to the north of Lake Victoria near the Kenya-Uganda border’s Busia District. Floods are characteristic in the region.
Between 1977 and 1984, dykes were built along the river to prevent the worst fl oods. Large areas of forests upstream from the source
near the rivers have been cleared mainly for settlements and farmland. This has led to erosion and inevitable soil slippage and landslides
when yearly fl oods occur. Without recourse to other options, when the dry season returns, survivors go back to their land and rebuild their
homes in areas susceptible to recurring fl ooding disasters. A lasting solution has yet to be found.
Floods in the Tana River District
The Tana River Delta is among Kenya’s top three largest and most important freshwater wetland systems. Local people live by the seasons,
adapting to the regular fl oods that keep the area fertile through the year.
38
DE
PH
A

39
References
Alden, A. (n.d.). “Birth of the Earth. The Earth's Formation in a Nutshell”. http://geology.about.com/od/nutshells/a/aa_earthbirth.htm (Accessed on 28 December 2008)
AWF (2008). “Saving the endangered Grevy’s zebra”. African Wildlife Foundation. http://www.awf.org/content/solution/detail/3377/ (Accessed on 5 December 2008)
Birdlife International (2008). Sokoke Scops-owl - BirdLife Species Factsheet.http://www.birdlife.org/datazone/species/index.html?action=SpcHTMDetails.asp&sid=2164&m=0 (Accessed on 5 December 2008)
BirdLife International (2008a) BirdLife’s online world Bird Database. Cambridge, UK: BirdLife International. http://www.birdlife.org (Accessed on 6 January 2009)
CliffsNotes.com (2008). “How is photosynthesis essential to life on earth?” http://www.cliffsnotes.com/WileyCDA/Section/id-305406,articleId-55702.html. (Accessed on 28 December 2008)
CBS (2001). “Counting our People for Development”. Population and Housing Census Vol.1, Central Bureau of Statistics, Nairobi.
Deloitte (2007). Energy, Infrastructure and Utilities, sub-Saharan Africa. www.deloitte.com/petroleumservices (Accessed on 5 December 2008)
DRSRS and KFWG (2006). “Changes in Forest Cover in Kenya’s Five Water Towers, 2003-2005”.
Department of Resource Surveys and Remote Sensing and Kenya Forests Working Group. Kenya Forestry Working Group.
EarthTrends (2003). “Biodiversity and Protected Areas – Kenya”. World Research Institute, Washington, DC. http://earthtrends.wri.org/pdf_library/country_profi les/bio_cou_404.pdf (Accessed on 23 October 2008)
EIA (2008). “Kenya Energy Profi le”. Energy Information Administration. http://tonto.eia.doe.gov/country/country_time_series.cfm?fi ps=KE#elec (Accessed on 28 November 2008)
IUCN (2006). Primate Specialist Group. International Union for the Conservation of Nature. http://www.primate-sg.org/rufomitratus.htm. (Accessed on 15 December 2008)
GEF (2008) Project Executive Summary, Enhanced Regulatory And Information Systems For Integrated Implementation Of MEAs. http://www.gefweb.org/uploadedfi les/03-05-08-MSP_CB-2_Kenya_.pdf (Accessed on 6 January 2009)
GoK (2008). Government of Kenya, Ministry of Energy. http://www.energy.go.ke/index.php?option=com_content&task=view&id=6&Itemid=5 (Accessed on 20 November 2008)
GoK (2007). “Kenya Vision 2030”. Government of Kenya. Nairobi. http://www.education.nairobi-unesco.org/PDFs/Kenya_VISION%202030-fi nal%20report-October%202007.pdf (Accessed on
4 December 2008)
GoK (2002). “Study on Kenya’s energy demand, supply and policy strategy for households, small scale industries and service establishments by Kamfor Company Limited”. Government of Kenya, Ministry of Energy, Nairobi
GoK and UNEP (2002). First National Communication of Kenya to the Conference of the Parties to the United Nations Framework Convention on Climate Change (UNFCCC)
GoK and UNEP (2008). “Mau Complex and Marmanet forests, environmental and economic contributions. Current state and trends”. Briefi ngs notes. United Nations Environment Programme.http://www.unep.org/pdf/Mau-Complex_20May08.pdf (Accessed 20 November 2008)
KENGEN (2008). Kenya Electricity Generating Company. http://www.kengen.co.ke/Map.aspx (Accessed on 8 January 2008).
KFWG (2008). “Forests in Kenya overview”. Kenya Forestry Working Group. http://www.kenyaforests.org/index.php?option=com_content&task=view&id=61&Itemid=74&limit=1&limitstart=2 (Accessed on 13 November 2008)
KFS (2006). Kenya Forestry Service. http://www.kfs.go.ke/ (Accessed on 4 December 2008)
Lean, J. and Rind, D. (1996). “The Sun and Climate”. http://www.gcrio.org/CONSEQUENCES/winter96/sunclimate.html (Accessed on 28 December 2008)
MENR (1994). “A 25-year Master Plan for forestry Sector Development in Kenya”. Kenya Forestry Master Plan (KFMP) Development programmes. Ministry of Environment and Natural Resources.Forest Department Headquarters, Nairobi.
Ol Pejeta Conservancy (2008). “Endangered Species”. http://www.olpejetaconservancy.org/wildlife_conservation/endangered_species (Accessed on 5 December 2008)
REN21 (2008). “Renewables 2007 Global Status Report”. REN21 Secretariat, Paris and Worldwatch Institute, Washington, DC. http://www.ren21.net/pdf/RE2007_Global_Status_Report.pdf (Accessed on 20 December 2008)
Survey of Kenya (2003). National Atlas of Kenya. Fifth Edition. Survey of Kenya, Nairobi
Thaxton, M. (2007). “Integrating population, health and environment in Kenya”. http://www.prb.org/pdf07/phe-kenya.pdf (Accessed on 5 December 2008)
UMD (2001). “Continuous Fields Tree Cover”. University of Maryland, Department of Geography. http://glcf.umiacs.umd.edu/data/treecover/ (Accessed on 25 November 2008)
UN (2005). “Environment and Human Well-being: A Practical Strategy”. UN Millenium Project. Report of the Task Force on Environmental Sustainability. Earthscan, London.
UNEP (2008). “Africa: Atlas of our Changing Environment”. Division of Early Warning and Assessment (DEWA), United Nations Environment Programme, Nairobi, Kenya
UNPD (2008). “World Population Prospects: The 2006 Revision” and “World Urbanization Prospects: The 2007 Revision Population”. Division of the Department of Economic and Social Affairs of the United Nations Secretariat. http://esa.un.org/unup. (Accessed on 18 November 2008)
UN-Water (2006). “Kenya National Water Development Report”. United Nations http://unesdoc.unesco.org/images/0014/001488/148866E.pdf (Accessed on 9 January 2008)
Wass, P. (1995). “Kenya’s Indigenous Forests: status, management and conservation”. IUCN Forest Conservation Programme, Gland and Cambridge.
Wieczkowski, J. (2005). Comprehensive Conservation Profi le of Tana, Mangabeys, International Journal of Primatology, 26 (3).
WDPA (2007). World Database on Protected Areas. World Commission of Protected Areas, UNEP and WCMC. http://www.unep-wcmc.org/wdpa/index.htm (Accessed 21 October 2008)
WRI (2007). Nature’s Benefi ts in Kenya, An Atlas of Ecosystems and Human Well-Being. World Resources Institute, Department of Resource Surveys and Remote Sensing, Ministry of Environment and Natural Resources, Kenya, Central Bureau of Statistics, Ministry of Planning and National Development, Kenya, and International Livestock Research Institute, Washington, DC and Nairobi
The Mau Forest Complex
Reconnaissance Flight (2008). “Mau Complex and Marmanet forests, Environmental and economic contributions, Current state and trends”. http://www.unep.org/pdf/Mau-Complex_20May08.pdf (Accessed on 20 November 2008)
Mount Kenya
FAO (2002). “Mount Kenya: Inappropriate Settlement of Highlands by Lowlanders”. In Highland – Lowland Interactive Systems – Jack D. Ives, Ottawa, Canada. Food and Agriculture Organization of the United Nations http://www.fao.org/forestry/webview/media?mediaId=12408&langId=1 (Accessed 18 October 2008)
KFWG (2004). “Changes in Forest Cover in Kenya’s Five “Water Towers” 2000-2003”. Kenya Forests Working Group. http://www.unep.org/dewa/assessments/EcoSystems/land/mountain/Tower/index.asp (Accessed on 18 October 2008)
KWS (1999). “Aerial Survey of the Destruction of Mt. Kenya, Imenti and Ngare Ndare Forest Reserves”. Kenya Wildlife Service Report. http://www.unep.org/expeditions/docs/Mt-Kenya-report_Aerial%20survey%201999.pdf (Accessed on 18 October 2008)
Mizuno, K. (2005). Glacial Fluctuation and Vegetation Succession on Tyndall Glacier, Mt. Kenya. Mountain Research and Development 25(1): 68-75
UNESCO (n.d.) “World Heritage List – Mount Kenya National Park/Natural Forest”. United Nations Educational, Scientifi c and Cultural Organization. http://whc.unesco.org/en/list/800 (Accessed on 25 November 2008)
Wielochowski, A. (1991). “Mount Kenya 1:50,000 Map & Guide”. Fourth Edition. EWP, UK. www.kilimanjaro.cc/mkgeolog.htm (Accessed on 18 October 2008)
The Aberdare Range
KFWG (2003). “Aerial Survey of the Destruction of the Aberdare Range Forests”. Report prepared jointly by UNEP, Kenya Wildlife Service, Rhino Ark, and Kenya Forests Working Group.
Mount Elgon
Boy, G. and Allan, I. (1988). Snowcaps on the equator. The fabled mountains of Kenya, Tanzania, Uganda and Zaire. Chapter 3: Cave-riddled Colossus: Mt. Elgon. The Bodely Head, London.
Hitimana, J., Kiyiapi, J.L. and Njunge, J.T. (2004). Forest structure characteristics in disturbed and undisturbed sites of Mt. Elgon Moist Lower Montane Forest, western Kenya. Forest Ecology and Management 194:269-291
Knapen, A., Kitutu, M.G., Poesen, J., Breugelmans, W., Deckers, J. And Muwanga, A. (2006). Landslides in a densely populated county at the footslopes of Mount Elgon (Uganda): Characteristics and causal factors. Geomorphology 73:149-165
Muhweezi, A.B., Sikoyo, G.M. and Chemonges, M. (2007). Introducing a Transboundary Ecosystem Management Approach in the Mount Elgon Region. Mountain Research and Development 27(3): 215-219
The Cherangani Hills
BirdLife International (2008) “BirdLife's online World Bird Database: the site for bird conservation” Version 2.1. BirdLife International. Cambridge, UK. http://www.birdlife.org (Accessed on 16 October 2008)
UNEP and DRSRS (2004). “Changes in forest cover in Kenya's fi ve "water towers" 2000 -2003". United Nations Environment Programme and Department of Resource Surveys and Remote Sensing. http://www.unep.org/dewa/assessments/EcoSystems/land/mountain/Tower/index.asp. (Accessed on October 15, 2008).
40
An
gel
a S
evin
/Flic
kr.c
om
Related Documents