VALUATION OF INTERNET-BASED BUSINESSES J Krüger 2013

Welcome message from author
This document is posted to help you gain knowledge. Please leave a comment to let me know what you think about it! Share it to your friends and learn new things together.
Transcript

VALUATION OF INTERNET-BASED BUSINESSES
J Krüger
2013
VALUATION OF INTERNET-BASED BUSINESSES
By
Janine Krüger
Submitted in fulfilment of the requirements for the degree of
DOCTOR OF PHILOSOPHY
to be awarded at the Nelson Mandela Metropolitan University
March 2013
Promoter: Prof FW Struwig

DECLARATION
i
DECLARATION
PhD CANDIDATE
I, Janine Krüger, student number 190017500, hereby declare that the thesis,
Valuation of Internet-based businesses, for Doctor of Philosophy, is my own
work and that it is has not previously been submitted for assessment or
completion of any postgraduate qualification to another university or for another
qualification.
Janine Krüger
PORT ELIZABETH
MARCH 2013

DECLARATION
ii
DECLARATION
LANGUAGE PRACTITIONER

ACKNOWLEDGEMENTS
iii
ACKNOWLEDGEMENTS I would like to thank the following people and institutions for their contribution to
making this study possible:
My Heavenly Father for giving me the talent, opportunity, strength, wisdom
and courage to complete the study which I thoroughly enjoyed.
My promoter and colleague, Prof Miemie Struwig, for her knowledge,
insights, support, encouragements and guidance.
Prof Eileen Mazibuko for supporting my application for sabbatical leave,
because without the leave I would not have been able to complete my thesis
on time.
My husband, Deon, for all his encouragement, continuous support and
insights throughout my study. Thank you for all the coffee he made for me to
keep me awake. I love you more each day!
My children, Duan and Anke, for having patience with your mommy while I
worked and your continuous support. I love you lots!
My mother, Lynne van Wyk, and mother-in-law, Hester Krüger, for their
continuous encouragement.
My colleague and friend, Dr Chantal Rootman, for helping me with the
module Financial Management and taking on a hectic term to allow me to be
on sabbatical leave.
The e-commerce experts, Dr Lynette Barnard and Albert Nelmapius and the
accounting experts, Deon Krüger and Heidi Janse van Rensburg for their
insights and time to ensure that the data I used were reliable and valid.
My colleague Tony Matchaba-Hove for taking my Investment Management
classes while I was on sabbatical leave.
My family, friends and colleagues for the assistance, encouragement and
support.
Helen Allen for language editing of the thesis.
McGregor BFA for allowing me to subscribe to the McGregor BFA
Fin24Expert package.
The funds received from Research Capacity Development for the finalisation
of my thesis.
TABLE OF CONTENTS
iv
TABLE OF CONTENTS
PAGE
DECLARATION i
ACKNOWLEDGEMENTS iii
TABLE OF CONTENTS iv
LIST OF FIGURE xvii
LIST OF TABLES xix
LIST OF ABBREVIATIONS xxv
EXECUTIVE SUMMARY xxvii
CHAPTER ONE
INTRODUCTION TO THE STUDY
1.1 INTRODUCTION AND BACKGROUND TO THE STUDY 1
1.2 LITERATURE OVERVIEW 10
1.2.1 Concept clarification 10
1.2.2 Previous research in the field of business valuation 15
1.3 PROBLEM STATEMENT 23
1.4 CONCEPTUAL FRAMEWORK OF THE RESEARCH
DESIGN 25
1.5 RESEARCH OBJECTIVES 27
1.5.1 Primary objective 27
1.5.2 Secondary objectives 27
1.5.3 Research questions 28
1.5.4 Research hypotheses 28
TABLE OF CONTENTS
v
PAGE
1.6 RESEARCH DESIGN AND METHODOLOGY 32
1.6.1 Secondary research 32
1.6.2 Primary research 34
1.7 SCOPE OF THE STUDY 39
1.8 CONTRIBUTION OF THE STUDY 39
1.9 STRUCTURE OF THE RESEARCH 39
CHAPTER TWO
INTERNET-BASED BUSINESSES
2.1 INTRODUCTION 42
2.2 NATURE OF INTERNET-BASED BUSINESSES 44
2.3 TYPES OF INTERNET-BASED BUSINESSES 46
2.3.1 Brick-and-click businesses 47
2.3.2 Click-only businesses 49
2.3.3 Internet search engines 51
2.3.4 Internet social networks 54
2.3.5 Other types of Internet-based businesses 59
2.4 HISTORY OF INTERNET-BASED BUSINESS 61
2.5 E-BUSINESS MODEL STAGES 64
2.6 IMPORTANCE OF INTERNET-BASED BUSINESSES 71
TABLE OF CONTENTS
vi
PAGE
2.7 INTERNET-BASED BUSINESS SUCCESSES
AND FAILURES 75
2.7.1 Business successes 75
2.7.2 Business failures 77
2.8 SUMMARY 82
CHAPTER THREE
VALUATION OF BUSINESSES
3.1 INTRODUCTION 83
3.2 NATURE OF BUSINESS VALUATION 85
3.2.1 Valuation concepts clarification 85
3.2.2 Purpose of business valuation 88
3.2.3 Valuation of businesses of different sizes 89
3.2.4 Valuation of real estate 90
3.3 HISTORY OF THE VARIOUS VALUATION APPROACHES 92
3.4 TRADITIONAL VALUATION APPROACHES 93
3.4.1 Dividend discount model 93
3.4.2 Zero growth model 96
3.4.3 Constant growth model 97
3.4.4 Non-constant growth model 100
3.4.5 Free cash flow valuation model 103
3.4.6 Price ratios 104
3.4.7 Economic and market value added performance
measurements 107
3.4.8 Real options 109
TABLE OF CONTENTS
vii
PAGE
3.5 VARIABLES OF THE VALUATION APPROACHES 112
3.5.1 Unknown variables 112
3.5.2 Variables and applicability of approaches 114
3.6 PREVIOUS RESEARCH ON BUSINESS VALUATION 117
3.6.1 Research on applicability of the valuation approaches 117
3.6.2 Summary of findings of previous research on valuation 125
3.7 VALUATION OF INTERNET-BASED BUSINESSES 130
3.7.1 Approaches to Internet-based business valuations 130
3.7.2 Intrinsic values of Internet-based businesses 133
3.7.3 Income generation of Internet-based businesses 134
3.7.4 Summary of approaches to valuation, intrinsic values,
and income generation of Internet-based businesses 137
3.8 SUMMARY 141
CHAPTER FOUR
RESEARCH DESIGN AND METHODOLOGY
4.1 INTRODUCTION 143
4.2 NATURE OF RESEARCH 145
4.3 RESEARCH CLASSIFICATIONS 147
4.3.1 Purpose of research 148
4.3.2 Process of research 149
4.3.3 Logic of research 152
4.3.4 Outcome of research 153
4.4 RESEARCH PARADIGMS 154
TABLE OF CONTENTS
viii
PAGE
4.5 DATA COLLECTION 156
4.5.1 Population and sample selection 156
4.5.2 Database construction for business valuations 157
4.6 DATA ANALYSIS 158
4.7 RELIABILITY, VALIDITY AND ETHICAL CONSIDERATIONS 159
4.8 SUMMARY 160
CHAPTER FIVE
OVERVIEW OF SELECTED BUSINESSES
5.1 INTRODUCTION 162
5.2 SHOPRITE HOLDINGS LIMITED 164
5.2.1 History of Shoprite Holdings Limited 164
5.2.2 Operational overview of Shoprite Holdings Limited
for the period 2004 to 2011 165
5.2.3 Number of stores and store locations of Shoprite
Holdings Limited 173
5.2.4 Financial overview of Shoprite Holdings Limited for the
period 2004 to 2011 175
5.2.5 Classification of Shoprite Holdings Limited according
to the e-business model 179
5.3 THE SPAR GROUP LTD 180
5.3.1 History of The SPAR Group Ltd 180
5.3.2 Operational overview of The SPAR Group Ltd for the
period 2004 to 2011 181
TABLE OF CONTENTS
ix
PAGE
5.3.3 Number of stores and store locations of The SPAR
Group Ltd 188
5.3.4 Financial overview of The SPAR Group Ltd for the
period 2004 to 2011 190
5.3.5 Classification of The SPAR Group Ltd according to
the e-business model 194
5.4 PICK N PAY STORES LTD 195
5.4.1 History of Pick n Pay Stores Ltd 195
5.4.2 Operational overview of Pick n Pay Stores Ltd for the
period 2004 to 2011 196
5.4.3 Store formats of Pick n Pay Stores Ltd 202
5.4.4 Financial overview of Pick n Pay Stores Ltd for the period
2004 to 2011 203
5.4.5 Classification of Pick n Pay Stores Ltd according
to the e-business model 207
5.5 NASPERS LTD 208
5.5.1 History of Naspers Ltd 208
5.5.2 Operational overview of Naspers Ltd for the period
2004 to 2011 211
5.5.3 Companies and brands forming part of Naspers Ltd 217
5.5.4 Financial overview of Naspers Ltd for the period 2004
to 2011 222
5.5.5 Classification of Naspers Ltd according to the e-business
model 224
5.6 OVERVIEW OF THE BUSINESS ENVIRONMENT 226
5.6.1 The 2004 economic year 226
5.6.2 The 2005 economic year 228
5.6.3 The 2006 economic year 229
5.6.4 The 2007 economic year 231
TABLE OF CONTENTS
x
PAGE
5.6.5 The 2008 economic year 232
5.6.6 The 2009 economic year 233
5.6.7 The 2010 economic year 235
5.6.8 The 2011 economic year 237
5.7 SUMMARY 238
CHAPTER SIX
OVERVIEW OF SELECTED BUSINESSES
6.1 INTRODUCTION 240
6.2 VALUATION APPROACH APPLIED FOR THE PURPOSE OF
VALUATING THE SELECTED BUSINESSES 242
6.3 REPORTING ON VALUATION OF SHOPRITE HOLDINGS
LIMITED (BRICK-AND-MORTAR BUSINESS WITH LIMITED
ONLINE PRESENCE) 244
6.3.1 Variables for valuations of Shoprite Holdings Limited
(brick-and-mortar business with limited online presence) 244
6.3.2 Valuations of Shoprite Holdings Limited (brick-and-mortar
business with limited online presence) 249
6.4 REPORTING ON VALUATION OF THE SPAR GROUP LTD
(BRICK-AND-CLICK BUSINESS WITH INTERACTIVE
ONLINE PRESENCE) 252
6.4.1 Variables for valuations of The SPAR Group Ltd
(brick-and-click business with interactive online presence) 252
6.4.2 Valuations of The SPAR Group Ltd (brick-and-click
business with interactive online presence) 257
TABLE OF CONTENTS
xi
PAGE
6.5 REPORTING ON VALUATION OF PICK N PAY STORES LTD
(BRICK-AND-CLICK BUSINESS IN THE E-COMMERCE
STAGE) 261
6.5.1 Variables for valuations of Pick n Pay Stores Ltd
(brick-and-click business in the e-commerce stage) 261
6.5.2 Valuations of Pick n Pay Stores Ltd (brick-and-click
business in the e-commerce stage) 265
6.6 REPORTING ON VALUATION OF NASPERS LTD
(ONLINE BUSINESS IN THE E-COMMERCE STAGE) 270
6.6.1 Variables for valuations of Naspers Ltd (online business
in the e-commerce stage) 270
6.6.2 Valuations of Naspers Ltd (online business in the
e-commerce stage) 274
6.7 ALTERNATIVE APPROACH TO VALUATION 278
6.8 SUMMARY 278
CHAPTER SEVEN
EMPIRICAL RESULTS OF VALUATION ANALYSIS
7.1 INTRODUCTION 280
7.2 DESCRIPTIVE STATISTICS OF SELECTED BUSINESSES 282
7.2.1 Single period valuations using the R157 government bond
as the risk-free rate 285
7.2.2 Multiple period valuations using the R157 government bond
as the risk-free rate 286
TABLE OF CONTENTS
xii
PAGE
7.2.3 Single period valuations using the R153 government bond
as the risk-free rate 286
7.2.4 Multiple period valuations using the R153 government bond
as the risk-free rate 287
7.2.5 Valuations as calculated by McGregor BFA Fin24Expert 288
7.2.6 Descriptive statistics of the share prices over the
eight-year period 289
7.2.7 Remarks regarding the results of the descriptive statistics 291
7.3 CORRELATION OF VALUATIONS OF SELECTED
BUSINESSES 292
7.3.1 Correlation of valuations using the R157 government bond
as the risk-free rate for a single period 292
7.3.2 Correlation of valuations using the R157 government bond
as the risk-free rate for multiple periods 294
7.3.3 Correlation of valuations using the R153 government bond
as the risk-free rate for a single period 295
7.3.4 Correlation of valuations using the R153 government bond
as the risk-free rate for multiple periods 297
7.3.5 Correlation of valuations calculated by McGregor BFA
Fin24Expert 299
7.3.6 Correlation of share prices of the selected businesses 300
7.3.7 Summary of statistically significant correlations 301
7.4 T-TEST RESULTS FOR INDIVIDUAL BUSINESSES 303
7.4.1 T-test results for Shoprite Holdings Limited
(brick-and-mortar business with limited online presence) 303
7.4.2 T-test results for The SPAR Group Ltd (brick-and-click
business with interactive online presence) 304
7.4.3 T-test results for Pick n Pay Stores Ltd (brick-and-click
business in the e-commerce stage) 305
TABLE OF CONTENTS
xiii
PAGE
7.4.4 T-test results for Naspers Ltd (online business in the
e-commerce stage) 306
7.5 DEPENDENT T-TEST RESULTS 307
7.5.1 T-test results when comparing Shoprite Holdings Limited
(brick-and-mortar business with limited online presence)
and The SPAR Group Ltd (brick-and-click business with
interactive online presence) 307
7.5.2 T-test results when comparing Shoprite Holdings Limited
(brick-and-mortar business with limited online presence)
and Pick n Pay Stores Ltd (brick-and-click business
in the e-commerce stage) 309
7.5.3 T-test results when comparing Shoprite Holdings Limited
(brick-and-mortar business with limited online presence)
and Naspers Ltd (online business in the e-commerce stage) 312
7.5.4 T-test results when comparing The SPAR Group Ltd
(brick-and-click business with interactive online presence)
and Pick n Pay Stores Ltd (brick-and-click business in
the e-commerce stage) 314
7.5.5 T-test results when comparing The SPAR Group Ltd
(brick-and-click business with interactive online presence)
and Naspers Ltd (online business in the e-commerce stage) 316
7.5.6 T-test results when comparing Pick n Pay Stores Ltd
(brick-and-click business in the e-commerce stage) and
Naspers Ltd (online business in the e-commerce stage) 318
7.5.7 T-test results when comparing the share prices of the
selected businesses 320
7.6 RESEARCH HYPOTHESES RESULTS SUMMARY 321
7.7 SUMMARY 324
TABLE OF CONTENTS
xiv
PAGE
CHAPTER EIGHT
SUMMARY, CONCLUSIONS AND RECOMMENDATIONS
8.1 INTRODUCTION 327
8.2 SUMMARY OF THE RESEARCH 329
8.2.1 Summary of Internet-based businesses – Chapter Two 331
8.2.2 Summary of valuation approaches – Chapter Three 332
8.2.3 Summary of research methodology – Chapter Four 333
8.2.4 Summary of the four selected businesses – Chapter Five 335
8.2.5 Summary of valuations of four selected businesses –
Chapter Six 336
8.2.6 Summary of statistically analysed valuation results –
Chapter Seven 338
8.3 FINDINGS AND RECOMMENDATIONS BASED ON
EMPIRICAL RESULTS 340
8.3.1 Findings and recommendations based on empirical study
of brick-and-mortar businesses with limited online
presence (Shoprite Holdings Limited) 340
8.3.2 Findings and recommendations based on empirical study
of brick-and-click businesses with interactive online
presence (The SPAR Group Ltd) 342
8.3.3 Findings and recommendations based on empirical study
of brick-and-click businesses in the e-commerce stage
(Pick n Pay Stores Ltd) 344
8.3.4 Findings and recommendations based on empirical study
of online businesses in the e-commerce stage (Naspers Ltd) 346
TABLE OF CONTENTS
xv
PAGE
8.3.5 Findings and recommendations based on empirical study
of comparing brick-and-mortar businesses with limited
online presence (Shoprite Holdings Limited) with brick-
and-click businesses with interactive online presence
(The SPAR Group Ltd) 346
8.3.6 Findings and recommendations based on empirical study
of comparing brick-and-mortar business with limited online
presence (Shoprite Holdings Limited) with brick-and-click
businesses in the e-commerce stage (Pick n Pay Stores Ltd) 347
8.3.7 Findings and recommendations based on empirical study
of comparing brick-and-mortar businesses with limited
online presence (Shoprite Holdings Limited) with online
businesses in the e-commerce stage (Naspers Ltd) 348
8.3.8 Findings and recommendations based on empirical study
of comparing brick-and-click businesses with interactive
online presence (The SPAR Group Ltd) with brick-and-click
businesses in the e-commerce stage (Pick n Pay Stores Ltd) 349
8.3.9 Findings and recommendations based on empirical study
of comparing brick-and-click businesses with interactive
online presence (The SPAR Group Ltd) with online
businesses in the e-commerce stage (Naspers Ltd) 350
8.3.10 Findings and recommendations based on empirical study
of comparing brick-and-click businesses in the e-commerce
stage (Pick n Pay Stores Ltd) with online businesses in
the e-commerce stage (Naspers Ltd) 351
8.3.11 Summary of relationships found 351
8.4 CONTRIBUTIONS OF THE STUDY TO THE FIELD OF
VALUATIONS 355
8.5 LIMITATIONS OF THE STUDY AND FUTURE RESEARCH
AREAS 359
TABLE OF CONTENTS
xvi
PAGE
8.6 CONCLUDING REMARKS 360
REFERENCES 362
ANNEXURE A:
OPERATING CASH FLOWS FOR SHOPRITE HOLDINGS
LIMITED 394
ANNEXURE B:
OPERATING CASH FLOWS FOR THE SPAR GROUP LTD 396
ANNEXURE C:
OPERATING CASH FLOWS FOR PICK N PAY STORES LTD 298
ANNEXURE D:
OPERATING CASH FLOWS FOR NASPERS LTD 400
ANNEXRURE E:
VALUATION USING THE GORDON MODEL 402
LIST OF FIGURES
xvii
LIST OF FIGURES
PAGE
FIGURE 1.1 CONCEPTUAL FRAMEWORK OF THE RESEARCH
PROCESS 26
FIGURE 1.2 BUSINESS VALUATIONS AT VARIOUS
E-BUSINESS MODEL STAGES 29
FIGURE 1.3 REVISED MODEL OF BUSINESS VALUATIONS
AT VARIOUS E-BUSINESS MODEL STAGES 30
FIGURE 2.1 CHAPTER TWO AS PART OF THE CONCEPTUAL
FRAMEWORK OF THE RESEARCH PROCESS 43
FIGURE 2.2 RELATIONSHIP BETWEEN E-BUSINESS,
E-COMMERCE AND M-COMMERCE 45
FIGURE 2.3 FUNCTIONS OF THE INTERNET 46
FIGURE 2.4 TYPES OF INTERNET-BASED BUSINESSES 47
FIGURE 2.5 TIMELINE BASED ON YEAR OF SEARCH
ENGINE CREATION 52
FIGURE 2.6 TIMELINE OF INTERNET SOCIAL NETWORK
CREATION 56
FIGURE 2.7 E-BUSINESS MODEL STAGES AS DESCRIBED
BY MCKAY AND MARSHALL 65
FIGURE 2.8 E-BUSINESS MODEL STAGES AS DESCRIBED
BY BOTHA 66
FIGURE 2.9 E-BUSINESS MODEL STAGES AS DESCRIBED
BY TURBAN 67
FIGURE 2.10 COMPARISON OF E-BUSINESS MODEL STAGES 68
FIGURE 2.11 PROPOSED E-BUSINESS MODEL STAGES 69
FIGURE 2.12 BUSINESS VALUE CREATION USING THE
INTERNET 73
FIGURE 2.13 BENEFIT OF E-BUSINESS WHEN
CONSIDERING DEMAND AND SUPPLY 74
LIST OF FIGURES
xviii
PAGE
FIGURE 3.1 CHAPTER THREE AS PART OF THE CONCEPTUAL
FRAMEWORK OF THE RESEARCH PROCESS 84
FIGURE 3.2 ILLUSTRATION OF THE NON-CONSTANT
GROWTH MODEL 102
FIGURE 3.3 FUTURE VALUE SCENARIOS 117
FIGURE 3.4 CRITICAL E-VALUE INDICATORS 124
FIGURE 4.1 CHAPTER FOUR AS PART OF THE CONCEPTUAL
FRAMEWORK OF THE RESEARCH PROCESS 144
FIGURE 5.1 CHAPTER FIVE AS PART OF THE CONCEPTUAL
FRAMEWORK OF THE RESEARCH PROCESS 163
FIGURE 5.2 HOMEPAGE OF SHOPRITE HOLDINGS LIMITED 179
FIGURE 5.3 HOMEPAGE OF THE SPAR GROUP LTD 194
FIGURE 5.4 HOMEPAGE OF PICK N PAY STORES LTD 207
FIGURE 5.5 COMPOSITION OF NASPERS LTD 210
FIGURE 5.6 HOMEPAGE OF NASPERS LTD – SCREEN
DUMP 1 225
FIGURE 5.7 HOMEPAGE OF NASPERS LTD – SCREEN
DUMP 2 225
FIGURE 6.1 CHAPTER SIX AS PART OF THE CONCEPTUAL
FRAMEWORK OF THE RESEARCH PROCESS 241
FIGURE 7.1 CHAPTER SEVEN AS PART OF THE CONCEPTUAL
FRAMEWORK OF THE RESEARCH PROCESS 281
FIGURE 8.1 CHAPTER EIGHT AS PART OF THE CONCEPTUAL
FRAMEWORK OF THE RESEARCH PROCESS 328
FIGURE 8.2 RELATIONSHIPS BETWEEN BUSINESS
VALUATIONS AT VARIOUS E-BUSINESS
MODEL STAGES 352
LIST OF TABLES
xix
LIST OF TABLES
PAGE
TABLE 1.1 SUMMARY OF CONCEPTS 14
TABLE 1.2 VALUATION OBSTACLES AND POSSIBLE
SOLUTIONS 16
TABLE 2.1 HISTORY OF THE INTERNET AND E-BUSINESS
ADOPTION 62
TABLE 3.1 SUMMARY OF VALUATION APPROACHES 115
TABLE 3.2 SUMMARY OF PREVIOUS RESEARCH FINDINGS 126
TABLE 3.3 SUMMARY OF APPROACHES USED TO VALUE
INTERNET-BASED BUSINESSES 137
TABLE 3.4 SUMMARY OF INTRINSIC VALUES AND MARKET
CAPITALISATION OF INTERNET-BASED
BUSINESSES 138
TABLE 3.5 SUMMARY OF INCOME GENERATION OF
INTERNET-BASED BUSINESSES 140
TABLE 4.1 GENERAL RESEARCH CATEGORIES 147
TABLE 4.2 RESEARCH CLASSIFICATION ADOPTED IN STUDY 148
TABLE 4.3 DIFFERENCES BETWEEN QUANTITATIVE AND
QUALITATIVE RESEARCH 150
TABLE 5.1 NUMBER OF BOARD DIRECTORS OF SHOPRITE
HOLDINGS LIMITED 172
TABLE 5.2 STORES PER COUNTRY FOR SHOPRITE
HOLDINGS LIMITED 173
TABLE 5.3 FINANCIAL DATA OF SHOPRITE HOLDINGS
LIMITED AS AT 30 JUNE ANNUALLY 176
LIST OF TABLES
xx
PAGE
TABLE 5.4 SHARE-RELATED DATA OF SHOPRITE
HOLDINGS LIMITED AS AT 30 JUNE ANNUALLY 177
TABLE 5.5 HIGHLIGHTS OF SHOPRITE HOLDINGS LIMITED 178
TABLE 5.6 NUMBER OF BOARD DIRECTORS OF THE SPAR
GROUP LTD 187
TABLE 5.7 NUMBER OF STORE FORMATS OF THE SPAR
GROUP LTD 188
TABLE 5.8 GEOGRAPHIC DISTRIBUTION OF SPAR, TOPS
AT SPAR AND BUILT IT STORES 189
TABLE 5.9 FINANCIAL DATA OF THE SPAR GROUP LTD AS
AT 30 SEPTEMBER ANNUALLY 190
TABLE 5.10 SHARE-RELATED DATA OF THE SPAR GROUP
LTD AS AT 30 SEPTEMBER ANNUALLY 191
TABLE 5.11 HIGHLIGHTS OF THE SPAR GROUP LTD 193
TABLE 5.12 NUMBER OF BOARD DIRECTORS OF PICK N PAY
STORES LTD 201
TABLE 5.13 STORE FORMATS OF PICK N PAY STORES LTD 202
TABLE 5.14 STORE CATEGORIES OF PICK N PAY STORES
LTD 203
TABLE 5.15 FINANCIAL DATA OF PICK N PAY STORES LTD
AS AT 28(29) FEBRUARY ANNUALLY 204
TABLE 5.16 SHARE-RELATED DATA OF PICK N PAY STORES
LTD AS AT 28(29) FEBRUARY ANNUALLY 205
TABLE 5.17 HIGHLIGHTS OF PICK N PAY STORES LTD 206
TABLE 5.18 NUMBER OF BOARD DIRECTORS OF NASPERS
LTD 216
TABLE 5.19 COMPANIES AND BRANDS OPERATING UNDER
THE NASPERS BANNER 217
TABLE 5.20 FINANCIAL DATA OF NASPERS LTD AS AT
31 MARCH ANNUALLY 222
TABLE 5.21 SHARE-RELATED DATA OF NASPERS LTD AS
AT 31 MARCH ANNUALLY 223
LIST OF TABLES
xxi
PAGE
TABLE 5.22 HIGHLIGHTS OF NASPERS LTD 224
TABLE 6.1 SUMMARY OF VARIABLES USED IN THE
VALUATION OF SHOPRITE HOLDINGS LIMITED
(BRICK-AND-MORTAR BUSINESS WITH
LIMITED ONLINE PRESENCE) 245
TABLE 6.2 SUMMARY OF VALUATIONS OF SHOPRITE
HOLDINGS LIMITED (BRICK-AND-MORTAR
BUSINESS WITH LIMITED ONLINE PRESENCE) 249
TABLE 6.3 GROWTH OF VALUATIONS AND SHARE PRICES
OF SHOPRITE HOLDINGS LIMITED (BRICK-AND-
MORTAR BUSINESS WITH LIMITED ONLINE
PRESENCE) 250
TABLE 6.4 SUMMARY OF VARIABLES USED IN THE
VALUATION OF THE SPAR GROUP LTD (BRICK-
AND-CLICK BUSINESS WITH INTERACTIVE
ONLINE PRESENCE) 253
TABLE 6.5 SUMMARY OF VALUATIONS OF THE SPAR
GROUP LTD (BRICK-AND-CLICK BUSINESS
WITH INTERACTIVE ONLINE PRESENCE) 257
TABLE 6.6 GROWTH OF VALUATIONS AND SHARE PRICES
OF THE SPAR GROUP LTD (BRICK-AND-CLICK
BUSINESS WITH INTERACTIVE ONLINE
PRESENCE) 258
TABLE 6.7 SUMMARY OF VARIABLES USED IN THE
VALUATION OF PICK N PAY STORES LTD
(BRICK-AND-CLICK BUSINESS IN THE
E-COMMERCE STAGE) 262
TABLE 6.8 SUMMARY OF VALUATIONS OF PICK N PAY
STORES LTD (BRICK-AND-CLICK BUSINESS IN
THE E-COMMERCE STAGE) 266
LIST OF TABLES
xxii
PAGE
TABLE 6.9 GROWTH OF VALUATIONS AND SHARE PRICES
OF PICK N PAY STORES LTD (BRICK-AND-
CLICK BUSINESS IN THE E-COMMERCE STAGE) 267
TABLE 6.10 SUMMARY OF VARIABLES USED IN THE
VALUATION OF NASPERS LTD (ONLINE BUSINESS
IN THE E-COMMERCE STAGE) 271
TABLE 6.11 SUMMARY OF VALUATIONS OF NASPERS LTD
(ONLINE BUSINESS IN THE E-COMMERCE STAGE) 275
TABLE 6.12 GROWTH OF VALUATIONS AND SHARE PRICES
OF NAPSERS LTD (ONLINE BUSINESS IN THE
E-COMMERCE STAGE) 276
TABLE 7.1 DESCRIPTIVE STATISTICS OF THE VARIOUS
BUSINESS VALUATIONS 283
TABLE 7.2 DESCRIPTIVE STATISTICS OF THE SHARE
PRICES 290
TABLE 7.3 CORRELATION OF VALUATIONS WITH
R157 GOVERNMENT BOND AS RISK-FREE RATE
FOR A SINGLE PERIOD 292
TABLE 7.4 CORRELATION OF VALUATIONS WITH
R157 GOVERNMENT BOND AS RISK-FREE RATE
FOR MULTIPLE PERIODS 294
TABLE 7.5 CORRELATION OF VALUATIONS WITH
R153 GOVERNMENT BOND AS RISK-FREE RATE
FOR A SINGLE PERIOD 296
TABLE 7.6 CORRELATION OF VALUATIONS WITH
R153 GOVERNMENT BOND AS RISK-FREE RATE
FOR MULTIPLE PERIODS 297
TABLE 7.7 CORRELATION OF VALUATIONS AS CALCULATED
BY MCGREGOR BFA FIN24EXPERT 299
TABLE 7.8 CORRELATION OF SHARE PRICES AS AT THE
END OF THE FINANCIAL YEAR 300
LIST OF TABLES
xxiii
PAGE
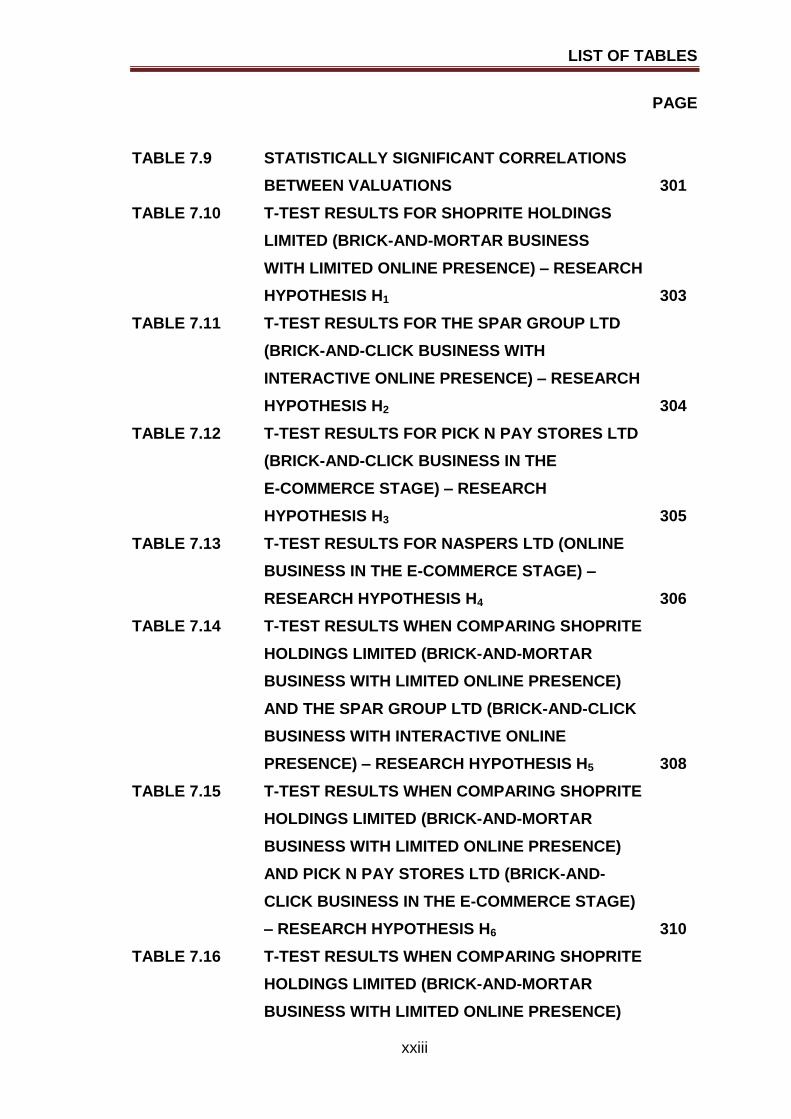
TABLE 7.9 STATISTICALLY SIGNIFICANT CORRELATIONS
BETWEEN VALUATIONS 301
TABLE 7.10 T-TEST RESULTS FOR SHOPRITE HOLDINGS
LIMITED (BRICK-AND-MORTAR BUSINESS
WITH LIMITED ONLINE PRESENCE) – RESEARCH
HYPOTHESIS H1 303
TABLE 7.11 T-TEST RESULTS FOR THE SPAR GROUP LTD
(BRICK-AND-CLICK BUSINESS WITH
INTERACTIVE ONLINE PRESENCE) – RESEARCH
HYPOTHESIS H2 304
TABLE 7.12 T-TEST RESULTS FOR PICK N PAY STORES LTD
(BRICK-AND-CLICK BUSINESS IN THE
E-COMMERCE STAGE) – RESEARCH
HYPOTHESIS H3 305
TABLE 7.13 T-TEST RESULTS FOR NASPERS LTD (ONLINE
BUSINESS IN THE E-COMMERCE STAGE) –
RESEARCH HYPOTHESIS H4 306
TABLE 7.14 T-TEST RESULTS WHEN COMPARING SHOPRITE
HOLDINGS LIMITED (BRICK-AND-MORTAR
BUSINESS WITH LIMITED ONLINE PRESENCE)
AND THE SPAR GROUP LTD (BRICK-AND-CLICK
BUSINESS WITH INTERACTIVE ONLINE
PRESENCE) – RESEARCH HYPOTHESIS H5 308
TABLE 7.15 T-TEST RESULTS WHEN COMPARING SHOPRITE
HOLDINGS LIMITED (BRICK-AND-MORTAR
BUSINESS WITH LIMITED ONLINE PRESENCE)
AND PICK N PAY STORES LTD (BRICK-AND-
CLICK BUSINESS IN THE E-COMMERCE STAGE)
– RESEARCH HYPOTHESIS H6 310
TABLE 7.16 T-TEST RESULTS WHEN COMPARING SHOPRITE
HOLDINGS LIMITED (BRICK-AND-MORTAR
BUSINESS WITH LIMITED ONLINE PRESENCE)
LIST OF TABLES
xxiv
PAGE
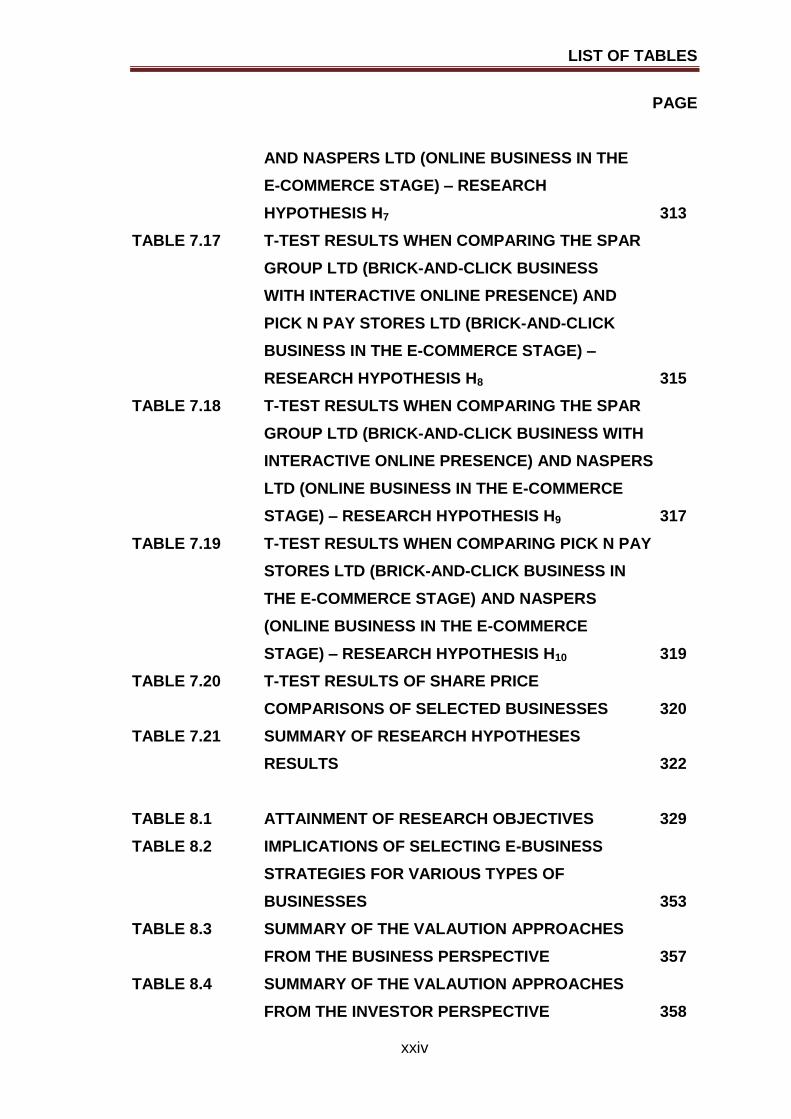
AND NASPERS LTD (ONLINE BUSINESS IN THE
E-COMMERCE STAGE) – RESEARCH
HYPOTHESIS H7 313
TABLE 7.17 T-TEST RESULTS WHEN COMPARING THE SPAR
GROUP LTD (BRICK-AND-CLICK BUSINESS
WITH INTERACTIVE ONLINE PRESENCE) AND
PICK N PAY STORES LTD (BRICK-AND-CLICK
BUSINESS IN THE E-COMMERCE STAGE) –
RESEARCH HYPOTHESIS H8 315
TABLE 7.18 T-TEST RESULTS WHEN COMPARING THE SPAR
GROUP LTD (BRICK-AND-CLICK BUSINESS WITH
INTERACTIVE ONLINE PRESENCE) AND NASPERS
LTD (ONLINE BUSINESS IN THE E-COMMERCE
STAGE) – RESEARCH HYPOTHESIS H9 317
TABLE 7.19 T-TEST RESULTS WHEN COMPARING PICK N PAY
STORES LTD (BRICK-AND-CLICK BUSINESS IN
THE E-COMMERCE STAGE) AND NASPERS
(ONLINE BUSINESS IN THE E-COMMERCE
STAGE) – RESEARCH HYPOTHESIS H10 319
TABLE 7.20 T-TEST RESULTS OF SHARE PRICE
COMPARISONS OF SELECTED BUSINESSES 320
TABLE 7.21 SUMMARY OF RESEARCH HYPOTHESES
RESULTS 322
TABLE 8.1 ATTAINMENT OF RESEARCH OBJECTIVES 329
TABLE 8.2 IMPLICATIONS OF SELECTING E-BUSINESS
STRATEGIES FOR VARIOUS TYPES OF
BUSINESSES 353
TABLE 8.3 SUMMARY OF THE VALAUTION APPROACHES
FROM THE BUSINESS PERSPECTIVE 357
TABLE 8.4 SUMMARY OF THE VALAUTION APPROACHES
FROM THE INVESTOR PERSPECTIVE 358
LIST OF ABBREVIATIONS
xxv
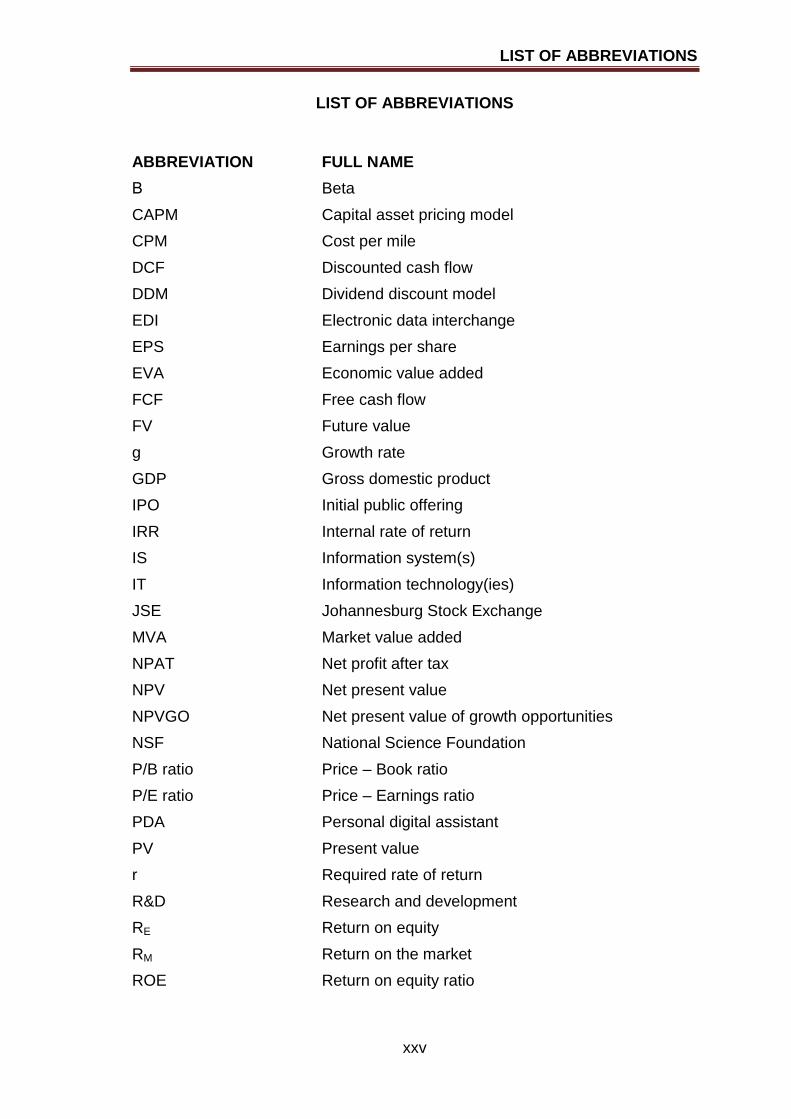
LIST OF ABBREVIATIONS
ABBREVIATION FULL NAME
Β Beta
CAPM Capital asset pricing model
CPM Cost per mile
DCF Discounted cash flow
DDM Dividend discount model
EDI Electronic data interchange
EPS Earnings per share
EVA Economic value added
FCF Free cash flow
FV Future value
g Growth rate
GDP Gross domestic product
IPO Initial public offering
IRR Internal rate of return
IS Information system(s)
IT Information technology(ies)
JSE Johannesburg Stock Exchange
MVA Market value added
NPAT Net profit after tax
NPV Net present value
NPVGO Net present value of growth opportunities
NSF National Science Foundation
P/B ratio Price – Book ratio
P/E ratio Price – Earnings ratio
PDA Personal digital assistant
PV Present value
r Required rate of return
R&D Research and development
RE Return on equity
RM Return on the market
ROE Return on equity ratio

LIST OF ABBREVIATIONS
xxvi
ABBREVIATION FULL NAME
S&P Standard and Poor 500
SMEs Small and medium enterprises
SMMEs Small, medium and micro enterprises
TCP/IP Transmission Control Protocol/Internet Protocol
USA United States of America
WACC Weighted average cost of capital
EXECUTIVE SUMMARY
xxvii
EXECUTIVE SUMMARY This study investigates the valuation of Internet-based businesses. In particular
the influence of the implementation of an e-business strategy on the value of a
business by focussing on its financial performance, will be determined. Although
the valuation of businesses in general has been researched extensively,
research on the valuation of Internet-based businesses produced contradictory
findings. No consensus could be reached regarding the most appropriate
valuation approach to be used. Some research findings indicated that the
discounted cash flow approach was the most appropriate while others stipulated
that a new valuation approach should be developed. Many authors state that
the move to include an e-business strategy is natural, and that businesses
cannot afford not to include some form of e-business strategy. Previous
research has also shown that by including an e-business strategy, it is possible
to improve efficiency of the business and ultimately increase profitability.
However, there was no emphasis on how the e-business strategy will influence
the business valuation.
In order to establish whether an e-business strategy will create value for a
business, an empirical investigation was undertaken. Based on the literature
review, the primary objective of the study was formulated to determine and
analyse the value of Internet-based businesses at the various stages of Internet
presence, with the purpose of establishing whether value creation by
implementing an e-business strategy took place. A positivistic research
paradigm was adopted in the study to test 10 statistical relationships. A
judgement sample of four businesses was drawn to be investigated. Based on
the importance of the food retail industry, the food and drug retail industry
(retailers and wholesalers subsector) as classified by the Johannesburg Stock
Exchange (JSE) was selected. The businesses selected were Shoprite
Holdings Limited, The SPAR Group Ltd, and Pick n Pay Stores Ltd. The well-
known click-only business, Kalahari.net, is a subsidiary of Naspers and
therefore Naspers Ltd (media industry, broadcasting and entertainment
subsector) was included in the study. Based on a proposed e-business model
as developed by the researcher, Shoprite was classified as a brick-and-mortar
EXECUTIVE SUMMARY
xxviii
business with limited online presence, SPAR as a brick-and-click business with
interactive online presence, PnP as a brick-and-click in the e-commerce stage,
and Naspers as an online business in the e-commerce stage. To ensure
reliability and validity of the data sources, method triangulation was used to
calculate the FCFs that were required for the various valuations. Five valuations
per year for each business from 2004 to 2011 were calculated.
For the study, ten research hypotheses were formulated. Four research
hypotheses focused on whether relationships exist between the changes in
valuations of businesses at various stages of the e-business model over an
eight-year period. Six research hypotheses were formulated to establish
whether relationships exist between the valuations of businesses at different e-
business model stages.
The empirical results revealed that positive relationships exist between at least
three of the five valuations of each business, except for Naspers (online
business in the e-commerce stage). None of the relationships tested for
Naspers (online business in the e-commerce stage) were statistically significant.
It was also found that relationships do exist between the valuations of Shoprite
(brick-and-mortar business with limited online presence) and SPAR (brick-and-
click business with interactive online presence), Shoprite (brick-and-mortar
business with limited online presence) and PnP (brick-and-click business in the
e-commerce stage), and SPAR (brick-and-click business with interactive online
presence) and PnP (brick-and-click business in the e-commerce stage). None
of the relationships investigated between the valuations of Shoprite (brick-and-
mortar business with limited online presence) and Naspers (online business in
the e-commerce stage), SPAR (brick-and-click business with interactive online
presence) and Naspers (online business in the e-commerce stage), and PnP
(brick-and-click business in the e-commerce stage) and Naspers (online
business in the e-commerce stage), existed. It was concluded that if a physical
business (“brick”) adds an e-business strategy, it is possible to create value for
the business over time, but only to a limited extent. Evidence also showed that
converting to an online business in the e-commerce stage will not necessarily
add value to the business.
EXECUTIVE SUMMARY
xxix
The research findings also showed that various valuation approaches should be
used depending on the purpose of the valuation and the recipients of the
valuation report. Based on the results, it was recommended that a new
valuation approach should be developed for the exclusive use of online
businesses valuation.
To conclude, it may not be viable for brick-and-mortar or brick-and-click
businesses to convert to online businesses in the e-commerce stage. Such
conversions may not increase the value of the business when using the
discounted cash flow approach in the valuation process. It might be viable for
brick-and-mortar businesses and brick-and-click businesses to move up one
stage in the e-business model, but such conversion decisions should be made
after careful analysis. To conclude, the implementation of an e-business
strategy only increase the value of some businesses and business managers
should be mindful of this.
KEY WORDS
valuations, valuation approaches, brick-and-mortar businesses, brick-and-click
businesses, online businesses, Internet-based businesses, e-business model,
e-business model stages
INTRODUCTION TO THE STUDY CHAPTER 1
CHAPTER ONE
INTRODUCTION TO THE STUDY
1.1 INTRODUCTION AND BACKGROUND TO THE STUDY
The strength of any country‟s economy is dependent on the success of the
businesses of that particular country. Small, medium and micro enterprises
(SMMEs) form a vital part of a country‟s economy because they can expand in
size and create more employment that will in the long run stimulate economic
activity. The importance of SMMEs can be seen in their contributions to the
country‟s Gross Domestic Product (GDP). A recent study found that SMMEs
contributed between 52% and 57% to South Africa‟s GDP. (Abor & Quartey
2010:223; Olawale & Garwe 2010:729; „Small business‟ 2009:3).
Many of these SMMEs fail within the first few years of their existence. According
to Bosch, Tait and Venter (2006:663), approximately 57% of small businesses
fail within the first operational year, and 70% to 80% of all new small businesses
cease to exist within the first five operational years. According to Olawale and
Garwe (2010:729-730), for a SMME to be regarded as an established business,
it has to operate successfully for at least 42 months (three-and-a-half years).
SMMEs in South Africa employ an estimated 61% of the South African work
force (Abor & Quartey 2010:223; „Small business‟ 2009:3). It is imperative that
these SMMEs grow and prosper to create economic stability (Olawale & Garwe
2010:729-730). Therefore these businesses should develop strategies to
increase the value of the business over the long term, that is, to maximise the
shareholders‟ or owners‟ wealth.
The majority of businesses whether an SMME or a large business, usually start
as brick-and-mortar businesses. To ensure future success, businesses need to
consider various strategies to improve their profitability (bottom lines). One of
the strategies that many of the businesses implement is the introduction of e-
business. Hall (2010a:22) emphasises that small businesses are growing at a
large rate thanks to the Internet. eBay Inc (hereafter referred to as eBay)
reports that the number of small businesses engaging in online trading in
INTRODUCTION TO THE STUDY CHAPTER 1
2
excess of £1 million will be doubled in 2011 (Hall 2010a). Polatoglu (2007:395)
states that small businesses globally are starting to realise the value of
implementing an e-business strategy. The areas in which the small businesses
benefit are marketing research, increased customer base by expanding their
geographical touch, more effective customer service and support, and greater
flexibility and speed when dealing with customers, suppliers and competitors.
Studies conducted by Chandra, Ravi and Bose (2008:4930), Pitta and Fowler
(2005a:283-284) and Mora-Monge, Azadegan and Gonzalez (2010:782)
emphasise that businesses should realise the importance of implementing an e-
business strategy in order to remain competitive in the business environment
and to create a competitive advantage, as this industry is growing at a rapid
rate.
According to McKay and Marshall (2004:7), the move to include an e-business
strategy is natural. Pavic, Koh, Simpson and Padmore (2007:320) warn that
businesses cannot afford not to include some form of e-business strategy. From
a business perspective, the importance of including an e-business strategy can
be summarised as follows (McKay & Marshall 2004:7):
The business environment implements various information technologies
and is therefore highly interconnected.
Businesses can provide better service to all their internal and external
stakeholders.
Substantial internal efficiencies can be achieved by providing timeous
and accurate information to the relevant stakeholders.
Substantial external efficiencies can be achieved by improving
communication with the stakeholders.
The main advantages businesses which have implemented an e-business
strategy are that their brand names (that is brand equity) are well known, and
that a strong customer base exists. (Kennedy & Coughlan 2006:518; Ko &
Roztocki 2009:6). According to Willmott (2010:534), brand equity as an
intangible asset of a business, is neglected when determining the market
capitalisation of a business and therefore the importance of branding is
INTRODUCTION TO THE STUDY CHAPTER 1
3
underestimated when focusing on shareholder value. For large businesses,
especially for those with a strong brand name, it is suggested that they can
increase their market reach by conducting business overseas. One example of
a large business that has implemented an e-business strategy successfully is
Dell. Dell is one of the top five “Most Admired” businesses, and has improved its
rankings in the Fortune 500 and the Fortune Global 500 (Turban, King, Viehland
& Lee 2006:2-3). In 2008, three of the top ten online businesses were Dell,
Hewlett Packard and Apple. The advantage that Dell had was the low-cost
Internet-based sales to consumers and businesses. Unfortunately Dell lost that
advantage to Apple, which has successfully integrated its online business with
highly productive brick-and-mortar stores (Jackson 2008:54).
However, SMEs can also implement e-business strategies that are part of the
so-called new economy. The new economy refers to new high-growth industries
using the latest technology (the Internet, digital technology and information, and
communications technology) to enable them to be major contributors to the
economic growth of a country (Combe 2006:2; Investopedia 2011). Levis
(2009:5) describes the new economy as a globally integrated, electronically
networked economy that is highly competitive According to Klopper, Berndt,
Chipp, Ismail, Roberts-Lombard, Subramani, Wakeman, Petzer, Hern,
Saunders and Myers-Smith (2006:388), the new economy is a result of
digitisation, where transactions, from purchasing to banking, are done
electronically. Li (2007:2) identifies two major changes in the business
environment of the new economy, namely the increase of intangible or
informational elements of products and/or services offered, and the increase in
the number of informational activities in relation to the number of physical
activities that need to be performed in a business. If one considers the
characteristics of a new economy, it is important to realise that the profit and
loss distribution of new economy businesses will not be in the form of a normal
distribution. The distribution can be bimodal or even multimodal (Zarzecki
2011:110-111).
Klopper et al. (2006:340, 388) agree with Shepard (1997) who identifies two
major trends that define the new economy, namely the globalisation of
INTRODUCTION TO THE STUDY CHAPTER 1
4
businesses and the rapid development in information technology. Robinson
(2000:1-3) concurs with Shepard (1997) with regard to the major trends and
also points out two key factors to individual success, namely education and
training. Other aspects of the new economy identified by Pavic et al. (2007:320)
and Robinson (2000:1-3) are increased business growth, major technological
advances, job creation, lowering of costs, and structural changes in businesses.
The benefits for SMMEs include the reaching of otherwise unreachable market
areas and competing for business with the larger businesses (Bosch et al.
2006:635; Parkin 2008:18; Turban et al. 2006:25-27). Many SMEs (small and
medium-size businesses) have realised the various opportunities e-business
can create, which include marketing at a fraction of the cost of traditional
marketing, lower overhead costs, and access to support networks that can
assist, manage and grow the SMEs (Hafeez, Keoy & Hanneman 2006:807;
Parkin 2008:33). Day and Bens (2005:160-162) concur with the previous
authors regarding the benefits, and stress the fact that these benefits are also
true for all businesses implementing e-business strategies to conduct
transactions with other businesses and not only with customers. Amit and Zott
(2001:494) contend that entrepreneurial start-ups and corporate ventures can
benefit extensively from implementing an e-business strategy.
Unfortunately there is little evidence that SMEs are in fact adopting e-business
strategies, especially in developing countries. The main e-business strategy
implemented by many SMEs is that of having an official website and using
electronic mail (e-mail). The main reason given for the lack of e-business
adoption is the lack of skills and technical knowledge (Polatoglu 2007:395-396).
A study by Pavic et al. (2007:320-321) finds that SMEs in the UK are adopting
the Internet, but that the SMEs are reluctant to implement e-business strategies.
The authors add that SMEs can create an online presence by using the Internet
for market research, advertising, and communication with customers and
potential customers. It is possible for SMEs to operate their online presence
using mobile technologies such as personal digital assistants (PDA); therefore
expensive technology is not required at the start-up. (Pavic et al. 2007:335). In
their research, Ramsey, Ibbotson, Bell and Gray (2003:261) have found that the
INTRODUCTION TO THE STUDY CHAPTER 1
5
majority of the SMEs studied used an e-business strategy as a stand-alone
activity, and that this strategy was not included in the overall business strategy.
The main finding was that 68% of the respondents used the Internet to provide
business details (excluding product and price information), 59% used the
Internet to communicate with customers, 20% used the Internet to convey
product and price information, and only 10% used the Internet for online orders.
No payments were allowed on any of the home pages (Ramsey et al.
2003:259). Taylor and Murphy (2004:288) found that SMEs need to consider
the implementation of e-business strategies because SMEs are an important
source for economic growth. Furthermore, it was stated that e-business
strategies should be used to take advantage of growth opportunities, to
generate profits and to create wealth for the relevant stakeholders. The barriers
to the implementation of e-business strategies, according to Marasini, Ions and
Ahmad (2008:637), were as follows:
cultural, for example, resistance to change;
financial, for example, high initial set-up costs;
technical, for example, security and privacy issues;
access, for example, lack of training opportunities and networking;
sharing of knowledge, for example, intellectual property; and
awareness, for example, lack of proven best practice or potential.
It is important to realise that SMEs can benefit from implementing more
aggressive e-business strategies. According to a study conducted by Interland
(Turban et al. 2006:609), 28% of small businesses surveyed expected at least a
75% increase in their annual sales. Polatoglu (2007:402-403) investigated the
implementation of an e-business strategy by the largest online bookstore,
Pandora, in Turkey. One of the main findings of the study was that Pandora was
highly successful in creating synergies between the online and physical stores
and providing more value and convenience to customers. Therefore the
traditional brick-and-mortar business changed to a brick-and-click business.
INTRODUCTION TO THE STUDY CHAPTER 1
6
One example of a brick-and-click business in South Africa is the Pick n Pay
Group, with 869 physical stores as well as online shopping available from the
home page of the Pick n Pay Group (Pick n Pay – Inspired by You 2011;
Profile‟s Stock Exchange Handbook October 2011 – January 2012 2011:272).
Formal retail businesses, such as the Pick n Pay Group, are important in the
business environment as these businesses will match the needs of the
businesses to those of the customers, to the benefit both parties involved.
These businesses sell products such as groceries, household products and
electrical products. (Klopper et al. 2006:264, 272).
According to Kurtz and Boone (2006:138), online sales of apparel, prescription
medicines, home appliances and home products, which are provided by most
retailers, will continue to grow. Chirnside, the CEO of the online and mobile
service provider PayU, confirms the belief that customers are becoming more
knowledgeable about online buying. He comments on the results of the
MasterCard Online Shopping Survey, indicating that 58% of Internet users
engage in online buying. PayU has had a growth of 78% year on year, and the
business has processed approximately 65% of the total value of e-commerce
transactions in South Africa. Chirnside also believes that if businesses want to
remain a going concern in the dynamic business environment, the Internet
domain should be part of the business strategy. (Trust fuels online shopping
growth 2012). According to Novitzkas, the chief executive of Kalahari.com, the
e-business strategy using mobile phones (mobi-sites) is growing at an
exceptionally fast rate. He further states that for a country to be regarded as
having reached a significant e-commerce milestone, online retail sales need to
contribute more than 1% of total retail sales. The online retail sales in South
Africa were at 0.4% of total retail sales in July 2011. (Moorad 2011). The
Internet economy was worth R59 billion in 2011 and contributed 2% towards
South Africa‟s GDP. It is estimated the contribution from the Internet economy
will grow by 0.1% per year and that it should reach 2.5% by 2016. (SAinfo
reporter 2012). Novitzkas also states that when thinking of online retail in South
Africa, one immediately associates such transactions with Kalahari.net.
Customers can shop from Kalahari.net, and this site is automatically redirected
to Kalahari.com. (kalahari.net now available via kalahari.com 2011). If one

INTRODUCTION TO THE STUDY CHAPTER 1
7
considers the growth and the expected growth of online shopping in the USA, it
is a definite opportunity that retailers need to seize.
Forrester Research Inc forecast that online spending in the USA will increase
from US$202 billion in 2011 to US$226 billion by 2016. Their results also
showed that online retail sales were expected to grow at 10.1% annually over
the five-year forecast (Rueter 2012). The results of research by Cicso Systems
showed that global online retailing would increase by 13.5% per annum over the
next three years. In South Africa, approximately 50% of online sales have
resulted from a combination between online searching and social media
content. Botes, the executive director of Business Partners, has also stated that
e-commerce can be a key driver for SME growth in terms of skills development
and job creation, and that South Africa has great potential to take advantage of
e-business strategies (E-tailers need to engage consumers 2012). The positive
online sales trend has taken place in various industries if one considers the
IMRG Capgemini e-Retail Sales Index. The index includes more than 100 e-
retailers, such as Furniture123, Home & Cook, Marks & Spencer, Serenata
Flowers, The Body Shop and Woolworths. The IMRG (Interactive Media in
Retail Group) is the e-retail industry association in the UK, and Capgemini is a
provider of consulting, technology and outsourcing services. The March year-
on-year results are as follows:
13% change for beers, wines and spirits;
15% change for clothing, footwear and accessories;
14% change for electrical products;
48% change for gifts;
22% change for health and beauty products/services; and
11% change for other retail categories. („As e-retail market rebounds‟
2012).
As is evident from the year-on-year results, online sales are not restricted to
certain industries. Therefore retailers need to be proactive to remain competitive
in the dynamic business environment, by implementing some form of e-
INTRODUCTION TO THE STUDY CHAPTER 1
8
business strategy. Krishnamurthy (2003:46) states that businesses should
carefully evaluate all the implications of becoming a brick-and-click business.
The author also maintains that the level of doing business online will vary from
simply having an online presence to trading of products and/or services using
the Internet. Studies conducted by Day and Bens (2005:160, 167) and Oliva,
Sterman and Giese (2003:112-113) agree with Krishnamurthy (2003:46) that it
is essential for all businesses to carefully assess the positive and negative
potentials of Internet opportunities. The results of the study indicated that only
those brick-and-click businesses that had succeeded as brick-and-mortar
businesses in terms of customer retention, growth and profitability, would
benefit from having an e-business strategy. Therefore an e-business strategy
should not be seen as a quick fix for growth and financial problems.
Many businesses go one step further and become an online business, such as
Kalahari.net, Amazon.com, search engines (such as Google and Yahoo!) and
the various social networks (for example Facebook and Twitter). An online
business implies that the business does not have physical business premises
where customers can go to buy products and/or services. Águila-Obra, Padilla-
Meléndez and Serarols-Tarrés (2007:187) and Yao (2004:54) point out that
changes in technology, especially the development of the Internet, have created
new opportunities for businesses to seize, to be highly innovative but to remain
viable (Skinner 2010:410). Amit and Zott (2001:493-494) agree with the
previous authors and add that an e-business strategy has the greatest potential
to create wealth.
Williams (2009a) states that online web surfing is so popular that many people
are turning to home-based businesses. Another reality is that social networking
is one of the fastest growing industries, and the growth rate, as evident in the
increase in the number of Internet users, is still escalating at a rapid pace.
Several mergers and acquisitions of online businesses took place in the last
decade. The business eBay acquired Skype Technologies in 2005 for US$2.6
billion, and other acquisitions include the purchase of DoubleClick and YouTube
by Google, Aquantive by Microsoft, and MySpace by News Corporation.
(Farzad, Elgin & Yang 2005). In 2007 the value of the more than 1 150
INTRODUCTION TO THE STUDY CHAPTER 1
9
transactions that were executed where one online business acquired another
online business amounted to approximately US$30 billion (Katz & Zangrilli
2007:1).
According to „Enthusiasm for Google‟ (2006), it is imperative that a method
should be found to value the shares of online businesses. Many authors
(Athanassakos 2007:12, Kemper 2010:44-46, McCutcheon 2008:79-80 and
PricewaterhouseCoopers as cited in Hall 2011a) argue that the traditional
valuation approaches are inadequate to value online businesses, but some
authors (Ashuri, Lu and Kashani 2011:17 and Riihimäki 2009:32) disagree, and
contend that the traditional valuation approaches can be used although some
adjustments need to be made. The question one can ask is whether an e-
business strategy will increase the value of brick-and-click businesses in the
same way as the values of online businesses increased in a relatively short
period. To summarise, will the valuation of brick-and-mortar businesses
increase if e-business strategies are implemented (thus transformed into brick-
and-click businesses) and will the value of brick-and-click businesses differ
when implementing e-business strategies with various levels of online activity?
Various valuation models (such as the dividend discount model, the Gordon
model and the residual income method) described in theory can be used to
determine fair market-related values for brick-and-mortar businesses. Brick-
and-click businesses do not pose a major problem, because the traditional
valuation methods can still be implemented, although some changes may be
necessary, especially in terms of determining the various income streams.
However, when considering online businesses such as the search engine
Google, certain obstacles (for example no dividend policy) are encountered
when trying to use the traditional valuation methods. Therefore the main aim of
this research is to determine whether the valuation of brick-and-click and online
businesses will differ during the various stages of their Internet presence, that
is, from having a presence on the Internet (customers can view only a catalogue
and business details) to trading (customers can order items and make the
necessary payments on the website).
INTRODUCTION TO THE STUDY CHAPTER 1
10
1.2 LITERATURE OVERVIEW
Firstly, the concepts used in this study will be clarified. The second section will
focus on previous research done in this field of study.
1.2.1 Concept clarification
A number of concepts will be used in the study, and because various definitions
can be found in literature, it is imperative to clarify each concept. The concepts
that will be clarified are electronic commerce (e-commerce), electronic business
(e-business), brick-and-mortar businesses, brick-and-click businesses and
Internet-based businesses.
(a) E-commerce versus e-business
It is important to understand the difference between e-commerce and e-
business, because while many authors use these two concepts
interchangeably, other authors differentiate between them. Kinder (2002:131),
Klopper et al. (2006:388) and Zarzecki (2011:106) do not make a distinction
between e-commerce and e-business. Kinder (2002:131) and Klopper et al.
(2006:388) define e-commerce as commercially purposive systems that can be
used to search, assessment and conduct dealings using various types of media,
while Zarzecki (2011:106) describes e-commerce as the application of
electronic exchanges of information, either processed or unprocessed, from one
entity to another. All these activities are supported by information and
communications technologies.
Botha, Bothma and Geldenhuys (2008:3) distinguish between e-commerce and
e-business. E-commerce is when customers use the Internet to locate products
and/or services as well as for the placement of an order and payment of the
order for products and/or services. E-business is a more inclusive concept and
includes e-commerce; electronic data interchange (EDI), competitor analysis
and Internet-based business process re-engineering. According to Schneider
(2007:5) and Papazoglou and Ribbers (2006:2), e-commerce refers to the
buying of products and/or services using the Internet and also includes activities
such as trading between two or more business. These authors refer to e-
commerce in its broadest context that also includes business activities involving
INTRODUCTION TO THE STUDY CHAPTER 1
11
Internet technologies (Internet, World Wide Web, wireless transmissions and
personal digital assistants).
Combe (2006:1) describes e-commerce as the buying and selling, and
marketing and servicing of products and services using computer networks,
while e-business is the use of the Internet, intranets and extranets to assist the
commercial processes. According to Turban et al. (2006:4), e-commerce is the
process that involves the buying, selling and/or exchanging of products,
services and/or information using computer networks such as the Internet. The
definition of e-business includes e-commerce, but it also extends to the
servicing of customers, collaborating with business partners as well as
performing transactions electronically within the business.
Jelassi and Enders (2005:4) also distinguish between e-commerce and e-
business. E-commerce involves the use of the Internet or any other
telecommunications network for the purpose of selling products and/or services
online, while the concept e-business is a broader concept that refers to the
execution of business activities within the business (micro environment) as well
as with businesses outside the business (market and macro environment) using
the Internet. McKay and Marshall (2004:4) conclude that e-commerce is the
commercial transactions that take place in the business using the Internet. E-
business, on the other hand, is described as the use of information and Internet
technology to achieve effectiveness as well as to create strategic opportunities
through the use of information technology to change current market and
industry structures. In the present study, the definition used for e-commerce will
be the buying and selling of products and/or services using the Internet. The
definition for e-business will be all the e-commerce activities as well as the
serving of customers and the collaboration with business partners. Internet-
based businesses refer to businesses only engaging in some form of Internet
activity. These activities include trading of products and/or services, sharing of
information using the Internet as a platform, and focusing on online-marketing
(for example banners on websites).
INTRODUCTION TO THE STUDY CHAPTER 1
12
(b) Brick-and-mortar businesses
Brick-and-mortar businesses refer to traditional businesses that are engaged in
various business activities from physical premises (Combe 2006:413; Lee,
Kang, Lee & Lee 2002:16; Parkin 2008:228). According to Botha et al.
(2008:280), brick-and-mortar businesses conduct business with their customers
in the physical world, from physical brick-and-mortar buildings. The explanation
given by Turban et al. (2006:5) with regard to this type of business is the off-line
business performance of a business by using physical selling agents to facilitate
the selling of products, while Klopper et al. (2006:390) define brick-and-mortar
businesses as solely offline businesses. McKay and Marshall (2004:10)
describe brick-and-mortar businesses as businesses that present the products
and/or services on offer to their customers using factories, warehouses, office
blocks, retail stores and a sales force. Kotzab and Madlberger (2001:441) refer
to brick-and-mortar businesses as stationary retailers that have physical assets
in stores and warehouses (distribution facilities). Brick-and-mortar businesses
can thus be described as businesses that sell products and/or services from
physical business premises. Brick-and-mortar businesses may have an Internet
presence, but the presence will only be there to provide general information
regarding the business and its operations, and is not used as an online
distribution channel of products and/or services.
(c) Brick-and-click businesses
A number of names can be found in the literature for this category of business,
and include click-and-mortar businesses, clicks-and-bricks as well as bricks-
and-clicks businesses. According to Parkin (2008:230), click-and-mortar
businesses describe businesses that are engaged in various business activities
from some physical premises as well as online. The „mortar‟ of click-and-mortar
refers to the business activities that take place at some physical location and
the „click‟ refers to online activities using the Internet. Another term used by
Parkin (2008:230) is clicks-and-bricks. Botha et al. (2008:280) explain brick-
and-click businesses as multichannel stores where the websites of the
businesses are extensions of the conventional distribution channels to engage
in online transactions.
INTRODUCTION TO THE STUDY CHAPTER 1
13
Combe (2006:413) and Klopper et al. (2006:390-391) describe click-and-mortar
businesses as businesses that offer a mix of online and offline commerce
possibilities. The emphasis of the click-and-mortar business definition provided
by Turban et al. (2006:5) is on the fact that the primary business is done in the
physical world, but some business is done electronically. McKay and Marshall
(2004:10) state that clicks-and-bricks businesses use their sales force to
interact directly with the customer either over the Internet or in person.
According to Krishnamurthy (2003:73), brick-and-clicks businesses have both
physical premises and an online presence. Dennis, Harris and Sandhu
(2002:287-288) describe brick-and-click businesses as multi-channelled
businesses combining online and off-line activities in a hybrid strategy, while
Lee et al. (2002:16) refer to click-and-mortar as traditional retailers with an
online distribution channel. For the purpose of the present study, the term
brick-and-click businesses will be used. Some form of monetary transactions
should take place online for a brick-and-mortar business to be regarded as a
brick-and-click business.
(d) Online businesses
As in the case of the brick-and-click businesses, numerous names can be found
in literature for online businesses. These names include dot-coms, pure
dotcom, Internet pure-play, Internet companies” and e-tailers as well as surf-
and-turf businesses. According to Combe (2006:414), dot-coms are businesses
that use the Internet for trading purposes. Virtual businesses, as defined by
Turban et al. (2006:5), conduct business purely online and no physical contact
takes place between the business and the customer. McKay and Marshall
(2004:10) and Krishnamurthy (2003:73) define the pure dotcom or Internet
pure-play businesses as businesses that present the products and/or services
on offer to their customers using the web page(s) of the business and therefore
no face-to-face interaction between the sales force and customers takes place.
Zarzecki (2011:106) describes an Internet company as a business whose basic
activity is based on using the Internet for creating income. Kotzab and
Madlberger (2001:443) refer to e-tailers as businesses with no physical stores
while marketing products to customers using the Internet. Lee et al. (2002:16)
INTRODUCTION TO THE STUDY CHAPTER 1
14
agree with Kotzab and Madlberger (2001:443) regarding the definition of e-
tailers, and add that e-tailers may have physical promotional outlets.
One of the advantages a brick-and-click business has over an Internet-based
business is the brand image of the physical store. Research done by Doong,
Wang and Foxall (2010) has found that brick-and-click businesses can more
easily attract consumers because of brand loyalty. For the purpose of the
present study, the researcher will use online businesses when referring to
businesses that use only the Internet for trading purposes.
(e) Internet-based businesses
In the previous sections (see 1.2.1(c) and 1.2.1(d)), brick-and-click and online
businesses were described and clarified. Klopper et al. (2006:266) define the
selling of products directly to the final consumer using the Internet as e-tailing,
which is an activity performed by both brick-and-click and online businesses.
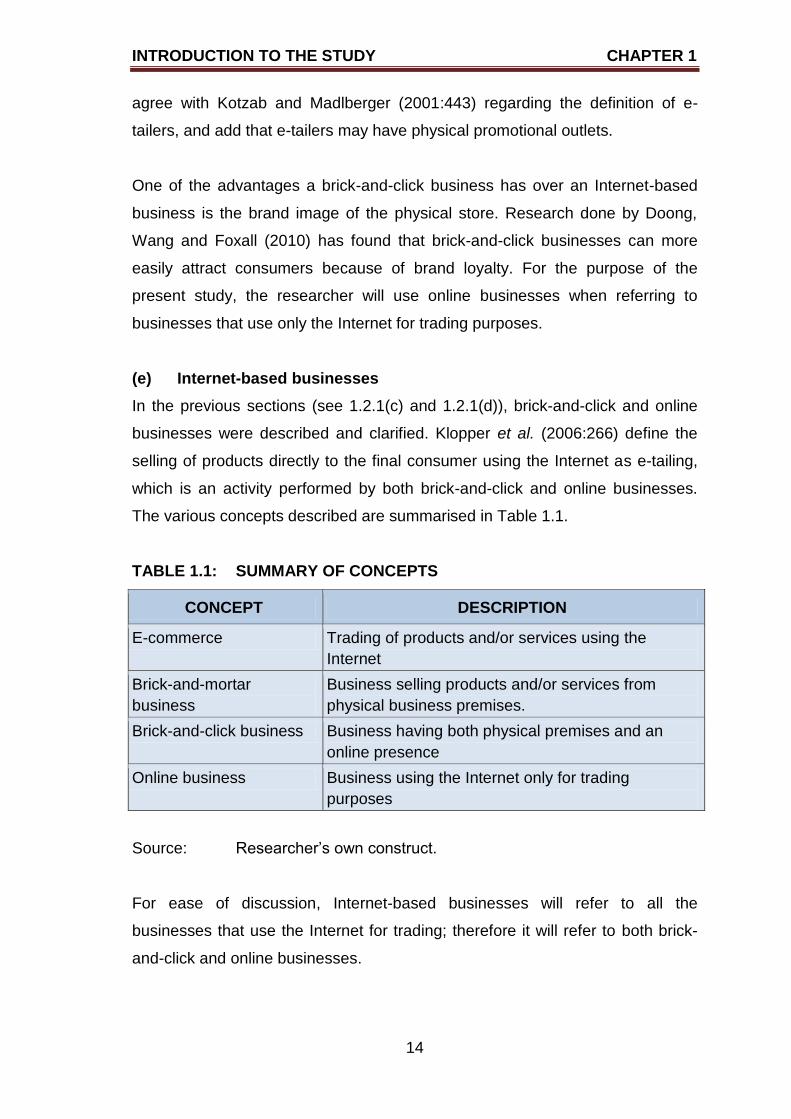
The various concepts described are summarised in Table 1.1.
TABLE 1.1: SUMMARY OF CONCEPTS
CONCEPT DESCRIPTION
E-commerce Trading of products and/or services using the
Internet
Brick-and-mortar
business
Business selling products and/or services from
physical business premises.
Brick-and-click business Business having both physical premises and an
online presence
Online business Business using the Internet only for trading
purposes
Source: Researcher‟s own construct.
For ease of discussion, Internet-based businesses will refer to all the
businesses that use the Internet for trading; therefore it will refer to both brick-
and-click and online businesses.
INTRODUCTION TO THE STUDY CHAPTER 1
15
1.2.2 Previous research in the field of business valuation
Numerous studies have been conducted with regard to the valuation of
businesses. In 2007, Spratt (2007) conducted a study to determine whether
South African online businesses trade at a premium over brick-and-mortar
businesses when a buyout or listing occurs. The major limitations found were
that no published research was available on the valuation of online business,
and that the majority of the online businesses were privately owned which
implies that the financial information for these businesses was not available.
This research focused on the asset pricing methodologies that included the
asset pricing schools of thought, the earnings and market-based valuation,
revenues valuation, equity and yield valuations, discounted cash flow valuation
and subscriber-based valuation. According to this research, traditional valuation
methods cannot be implemented to determine fair market-related values of
online businesses because online businesses have high operating costs and
very steep growth trends.
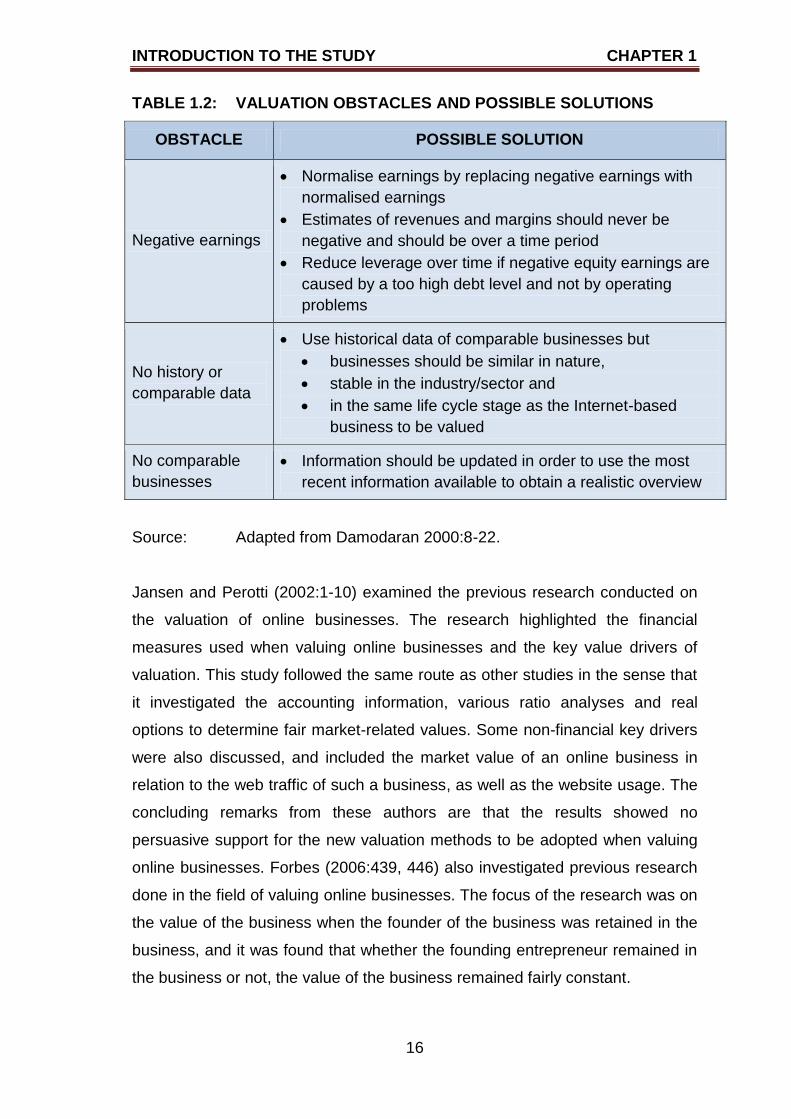
Damodaran (2000:8) investigated the traditional valuation model and found that
a number of obstacles made it rather difficult to implement these models when
businesses had negative earnings. Furthermore, the lack of comparable
businesses that were properly valued also created a big stumbling block in the
valuation process. A number of solutions to these problems were provided by
Damodaran (2000:10-16) and are summarised in Table 1.2.
INTRODUCTION TO THE STUDY CHAPTER 1
16
TABLE 1.2: VALUATION OBSTACLES AND POSSIBLE SOLUTIONS
OBSTACLE POSSIBLE SOLUTION
Negative earnings
Normalise earnings by replacing negative earnings with
normalised earnings
Estimates of revenues and margins should never be
negative and should be over a time period
Reduce leverage over time if negative equity earnings are
caused by a too high debt level and not by operating
problems
No history or
comparable data
Use historical data of comparable businesses but
businesses should be similar in nature,
stable in the industry/sector and
in the same life cycle stage as the Internet-based
business to be valued
No comparable
businesses
Information should be updated in order to use the most
recent information available to obtain a realistic overview
Source: Adapted from Damodaran 2000:8-22.
Jansen and Perotti (2002:1-10) examined the previous research conducted on
the valuation of online businesses. The research highlighted the financial
measures used when valuing online businesses and the key value drivers of
valuation. This study followed the same route as other studies in the sense that
it investigated the accounting information, various ratio analyses and real
options to determine fair market-related values. Some non-financial key drivers
were also discussed, and included the market value of an online business in
relation to the web traffic of such a business, as well as the website usage. The
concluding remarks from these authors are that the results showed no
persuasive support for the new valuation methods to be adopted when valuing
online businesses. Forbes (2006:439, 446) also investigated previous research
done in the field of valuing online businesses. The focus of the research was on
the value of the business when the founder of the business was retained in the
business, and it was found that whether the founding entrepreneur remained in
the business or not, the value of the business remained fairly constant.
INTRODUCTION TO THE STUDY CHAPTER 1
17
A study conducted by Mazurencu-Marinescu and Nijkamp (2008:72-79)
highlighted the need for an appropriate valuation model for Internet-based
businesses, with specific reference to online businesses and businesses in the
information and communication technology sector in emerging markets. The
major reason provided was that the traditional valuation methods found in
literature were rather complex, because many of the variables required for the
traditional methods were not available. The authors pointed out that many
Internet-based businesses had emerged since the year 2000, and suggested
that the value of these businesses lay in the attainment of new operational
excellence levels, customisation, customer and supplier integration and
productivity. The authors described the cost approach, the market approach
and the income approach as valuation methods, and with each of these
approaches an attempt was made to identify the various factors that would
influence them. Mazurencu-Marinescu and Nijkamp (2008:81, 88) mention that
one of the greatest challenges was to determine the required rate of return to be
used in the valuation process, because it is extremely difficult to estimate this
rate using the historical data of the business. These authors concur with
Damodaran (2000:8-22) that the main problems with the valuation of online
businesses revolve around uncertainty, the lack of relevant data, and the lack of
knowledge regarding the business and the environment in which it operates.
As stated previously, determination of the required rate of return, also known as
the discount rate, seems to be problematic because intangible assets are not
traded publicly, and therefore no required rate of return is available for this
asset class. This implies that one will not be able to determine the riskiness of
these assets. (Schauten, Stegink & De Graaff 2010:801). The study by
Schauten et al. (2010:809) also shows that the required rate of return on
intangible assets is higher than the weighted average cost of capital (WACC) of
the business, as well as higher than the levered or unlevered cost of equity for
the business as a holistic entity.
According to Uzma, Singh and Kumar (2010:369, 374-375) and Ali, El-
Haddadeh, Eldabi and Mansour (2010:18-20), most online businesses use the
discounted cash flow approach (DCF) to determine the value of their
INTRODUCTION TO THE STUDY CHAPTER 1
18
businesses. From this perspective, Uzma et al. (2010:366-374) have discussed
the expected cash flow, the project risk and intangible risks, the difficulty in
determining the riskiness (beta values) of intangibles assets using the capital
asset pricing model (CAPM), and the possibility that the riskiness of intangible
assets may change over time. Although there are numerous shortcomings,
Uzma et al. (2010:375) have found that the use of the DCF is the preferred
method, and that a fair value of this asset class can be shown on the balance
sheet. Steiger (2008) argues that the DCF valuation method is based on
numerous assumptions, and that if the underlying assumptions are not correct,
an incorrect valuation of businesses will result. Ali et al. (2010:31-32) state that
to overcome the shortcomings of the DCF, the DCF should be supplemented
with sensitivity analysis, scenario analysis and/or Monte Carlo simulations.
Although scenario analysis will solve one of the shortcomings of the sensitivity
analysis, the valuator will determine a range of outcomes (that is, a minimum
and maximum value) and not a precise market-related value. Mazurencu-
Marinescu and Nijkamp (2008:88) and Damodaran (2000) have identified
uncertainty as one of the major problems in the valuation process, but Ali et al.
(2010:31-32) suggest that Monte Carlo simulations should be used to minimise
uncertainty in the calculation.
Research carried out by Stubeji (2010:44) has also found that the internal value
of equity capital is not always reliable. A further finding is that the market value
of the businesses under investigation could be higher than the true value as a
result of an expected takeover. Stubeji (2010:44) therefore suggests that the
businesses investigated should be compared to foreign businesses, to ensure
more realistic market values.
Schwartz and Moon, as cited by Valkanov (2001:1-5), are of the opinion that the
basic foundation of an online business valuation model must take into account
the uncertainty of the forecasting of future cash flows. The growth rate is
another uncertainty that needs to be considered when conducting valuations.
Valkanov (2001:5) summarises the model developed by Schwartz and Moon as
follows:
INTRODUCTION TO THE STUDY CHAPTER 1
19
There are three sources of uncertainty, namely revenues, the growth of
the revenues and the variable cost.
The variances of all the processes decline to zero or to a fixed number
over time and the time period is specified.
Other unavoidable expenses such as taxes and depreciation are taken
into account.
If cash flows remain negative, the business is declared bankrupt.
The value of an online business, and therefore its share prices, can be
determined using risk neutral valuation.
The results of the study conducted by Schwartz and Moon (2000:62-75)
showed that it is possible for online businesses to yield extremely high
valuations; however, tor these high valuations to be true and fair, two
prerequisites need to exist. The first prerequisite is that the early growth rates
should be adequately high, and the second prerequisite is that there should be
enough volatility in the growth rate over a period of time (Wyler & Moon 2000).
From this summary one can also conclude that there are too many assumptions
and prerequisites to always ensure a fair market-related valuation.
Demers and Lev (2001:331-334) conducted research in order to develop a
model to explain the market values of online businesses during 1999 and 2000.
This model included financial and non-financial variables. The non-financial
variables included in the model were the reach of the business, the stickiness of
the business‟s website, and customer loyalty. The results provided evidence
that the reach of the business and the stickiness of the website do have an
influence on the share price of an online business, but that customer loyalty
(measured by web traffic) does not play a significant role. Another important
finding was that the changes in investors‟ perceptions of the future performance
of online businesses influenced the share prices of the businesses.
Although a study conducted by Huang and Van Mieghem (2009) focused on
offline ordering behaviour, they concur that web traffic can be used to forecast
customer behaviour. Furthermore, Huang and Van Mieghem (2009) agree with
INTRODUCTION TO THE STUDY CHAPTER 1
20
Demers and Lev (2001:356) that the stickiness of websites can provide a good
indication of customer behaviour even though new and existing customers may
portray different behaviour. A study by Keating, Lys and Magee (2003:191)
focused on the importance of financial measures as used in the residual income
model to non-financial measurements. The focus of the study was therefore to
include information in the valuation process that was not yet captured in the
accounting system that would otherwise have been left out.
Many studies focus on the measuring of the intangibles of a business. An article
by Watson (2010:132) considers the knowledge economy in which SMEs
operate. It is argued in the article that various types of intangibles are of utmost
importance to SMEs, and that some of these intangibles are more easily
identified and valued than others. Lev states, as cited in Watson (2010:133),
that intangibles should be regarded as one of the key drivers of economic
activity. If businesses do not report and value intangibles correctly,
underinvestment in such assets will occur. This implies that the value of these
businesses will not be correct because the market values will exceed the book
values. The end result is that the use of financial statements is of limited use
when businesses are valued. Damodaran (2006) also states that intangibles
such as brand names, patents, trademarks and copyrights, should be valued
and incorporated in the valuation process. This author also argues that the
various valuation models generally do not fully integrate the value of such
intangibles into the final value of a business. Léger (2010:420-421) concurs that
it is imperative that the valuation of intangible assets should be done, and that it
is becoming more important to be done correctly as businesses are becoming
more dependent on the use of the Internet (and Internet business partners) to
provide improved customer service. According to Kemper (2010:44-46), who
agrees with the previous authors, the traditional valuation methods do not take
into account flexibility or intangible assets.
Oliva et al. (2003:93-96) have examined the traditional valuation method known
as the Gordon model. This model assumes that the net income that the
investors will receive will grow at a constant rate of return. Unfortunately this
method is not applicable for high-growth businesses, as the major assumption
INTRODUCTION TO THE STUDY CHAPTER 1
21
of this model is that the required rate of return must be greater than the growth
rate; and as cited in Spratt (2007:34), online businesses have extremely high
growth rates. To overcome this problem of the required rate of return having to
be greater than the constant growth rate, the following model was developed by
Oliva et al. (2003:94):
V = MAX(Breakup value, EPV of profit x Pre IPO Discount)
where:
V is the greater of the salvage value (breakup value) or the present value
of the expected profits (EPV of profit)
Pre IPO discount is the reduction in the market value for privately held
businesses
All the assumptions used in the discussion for developing the equation by Oliva
et al. (2003:94-96) are based on estimates. The salvage value at some future
point in time, the expected present value of profit, the discount factor and the
initial public offering (IPO) discount are all forecasts or estimates, and therefore
all difficult to determine.
A study by Bartov, Mohanram and Seethamraju (2002:322, 345) has
considered the valuation process from an IPO perspective. The first important
finding of the study was visible differences, at prospective stage, between
valuations of Internet-based businesses and brick-and-mortar businesses. IPOs
of brick-and-mortar businesses are influenced by earnings, while negative cash
flows are significant for Internet-based businesses. The authors conclude that in
valuation, financial variables are more important for brick-and-mortar
businesses, while non-financial variables are more important for online
businesses. The second major finding was that at the end of the first trading
day, large differences were found between the initial business valuations and
IPO stage and the value as given by the relevant stock market.
McCutcheon (2008:79-80, 89-90) argues that it is of vital importance that the
intellectual assets of a business should be valued correctly. This author
INTRODUCTION TO THE STUDY CHAPTER 1
22
therefore proposes that EVVICATM (Estimated Value Via Intellectual Capital
Analysis) should be used by businesses to determine a likely rate of return on
the development of new products. This programme uses a probability
adjustment to conventional net present value (NPV) valuation. It should be
noted, though, that the use of such a programme is still in its infant stage.
Ko and Roztocki (2009:1-27) conducted a study by focusing on the financial
performance of brick-and-mortar, brick-and-click and online businesses.
Financial performance was measured by calculating five profitability ratios and
two cost ratios. The purpose of this study was two-fold. The first set of
hypotheses focused on whether brick-and-click businesses have higher
profitability and cost ratios than similar sized brick-and-mortar businesses in the
same industry. The second set of hypotheses focused on whether brick-and-
click businesses have higher profitability and cost ratios than similar sized
online businesses in the same industry. The results indicated that brick-and-
click business achieved the highest profitability ratios, that their cost structure
are comparable to that of brick-and-mortar businesses and that brick-and-click
businesses can achieve higher levels of efficiency than online businesses. The
difference between this study and the current study is that the current study is
focusing on the influence of e-business strategies on business valuation, and
not on the financial performance of the business.
A study by Hafeez et al. (2006:806-828) investigated the business performance
of businesses that implemented aggressive e-business strategies with those
that did not implement aggressive e-business strategies. The findings indicated
that overall business performance was enhanced by implementing successful e-
business strategies which were embedded in the overall business strategy. The
study further revealed that to enhance e-business implementation, it is
important that the business should include an Internet-enabled supply chain.
Ramsey et al. (2003:251) concur that it is imperative that the business
strategies and the information technology strategies should be aligned. With
regard to businesses not adopting an e-business strategy, greater attention
should be given to the supply chain strategy because it is the main contributor
to business performance (Hafeez et al. 2006:820-822).
INTRODUCTION TO THE STUDY CHAPTER 1
23
The research of Lin, Jang and Chen (2007:235) has indicated that e-service
initiatives have a positive influence on the valuation of a business, and that the
future benefits to be realised are greater than the future costs to be incurred.
When considering the timing of entering the market, it was found that the
pioneers and first movers into the industry obtained the greatest benefit from
implementing an e-business strategy. The early followers into the industry did
not obtain any competitive advantage, although the late entries into the industry
did manage to create a competitive edge. Therefore the authors recommended
that businesses considering implementing an e-business strategy should either
be one of the first entrants into the industry or wait and learn from the mistakes
of the other entrants into the industry. (Lin et al. 2007:236-237).
It is clear that there are various views regarding the valuation of online
businesses. All the research that has been done has focused on online
businesses with share capital. The question that still needs to be answered is
how to determine the value of an online business that does not issue shares or
pay any dividends. The fact that no definite answer could be found in existing
studies concerning the valuation of online businesses at the various stages of
Internet presence, indicates that this is an area that needs to be researched.
1.3 PROBLEM STATEMENT
All businesses, whether profit-oriented or not, will have a financial department
or section focusing on the finances of the business. The most important goal of
the person(s) responsible for the finances of the business is to create value for
the shareholders (or owners of the business if no shares are issued). Many
authors state that the primary goal of all financial managers is to maximise the
share price of the business (Els 2010:3; Gitman, Beaumont Smith, Hall, Lowies,
Marx, Strydom & Van der Merwe, 2010:14). Hillier, Ross, Westerfield, Jaffe and
Jordan (2010:9) phrase the primary goal of financial management slightly
differently by saying that it is important to maximise the market value of the
existing owners‟ equity. The way in which this can be achieved is firstly through
the buying of assets to create cash flow, and secondly through the issuing of
various financial instruments (such as shares and bonds) to raise additional
cash (provided the cash inflow exceeds the cash outflow) (Hillier et al. 2010:4).
INTRODUCTION TO THE STUDY CHAPTER 1
24
Therefore, whether the form of ownership is a sole proprietorship, close
corporation, partnership, private company or public company, the primary goal
of financial management will remain the same, namely to maximise the wealth
of the owners.
Determining the fair market value of a business that does not have share capital
(does not issue shares) is not a complex task. The balance sheet of the
business will provide an adequate view of the business‟s value to the owners;
this specific financial statement presents all the non-current assets, current
assets, intangible assets (such as goodwill and patents), owners‟ equity, non-
current liabilities and current liabilities of the business (Els 2010:34-41). The
value can only be regarded as fair if the intangible assets are valued correctly.
According to Hillier et al. (2010:13-15), the online business Google was worth
more than US$130 billion in 2010. Most online businesses such as Google,
Amazon.com and eBay do not pay dividends to the shareholders. The reason
the shareholders accept non-payment of dividends is their conviction that they
will receive dividends at some future date, or that they will be compensated in
another way, currently unknown to them. The shareholders also believe that the
business will be taken over by another business through a merger process, and
that the shareholders will be compensated in cash or with shares in the newly
merged business. (Hillier et al. 2010:136).
It is important to realise that online businesses such as the search engine
Google and social networks such as Facebook and Twitter, will have tangible
assets, such as property and equipment. What these businesses value most is
their intangible assets. These intangible assets include knowledge of
employees and the technology implemented in the business. According to
Rutterford, Upton and Kodwani (2006:374-375), these intangible assets will
have a profound influence on the true value of the business when combined
with the tangible assets (non-current and current assets). These authors further
argue that intangible assets on their own will not create value for the business,
but the value of intangible assets is embedded in the organisational context and
strategy of the business. Botha et al. (2008:12) agree that the value of a
INTRODUCTION TO THE STUDY CHAPTER 1
25
business does not lie in the tangible assets, but in the intangible assets, which
include the employees, the ideas, and the strategic aggregation of the key
information-driven assets (for example the Internet and the web presence).
Sander and Kõomägi (2007:6) support Botha et al. (2008:12-13) and identify
other factors, such as a high level of economic and technological uncertainty,
illiquidity of investments, the use of complex financial contracts and staged
financing as hurdles, when valuation of businesses is mainly based on
intangible assets.
If one considers the valuation methods found in literature, such as the dividend
discount model, the zero dividend growth model, the Gordon model, the
variable dividend growth model and the residual income model, one needs to
determine the future dividends. All the existing valuation methods make use of
current and/or future dividends to determine the current share price. Clearly, if a
business does not pay dividends, it poses some problems when attempting to
use these valuation methods. Furthermore, to implement these valuation
models, one needs a required rate of return. Determining the required rate of
return to be used in these valuations is a complex task. Therefore the problem
statement for the proposed study can be formulated as follows:
Does the value of Internet-based businesses differ during the various
stages of Internet presence?
1.4 CONCEPTUAL FRAMEWORK OF THE RESEARCH DESIGN
Figure 1.1 depicts the steps that will be followed in order to address the problem
statement identified above. The various steps of the conceptual framework
illustrated in Figure 1.1 will be discussed in the following sections.
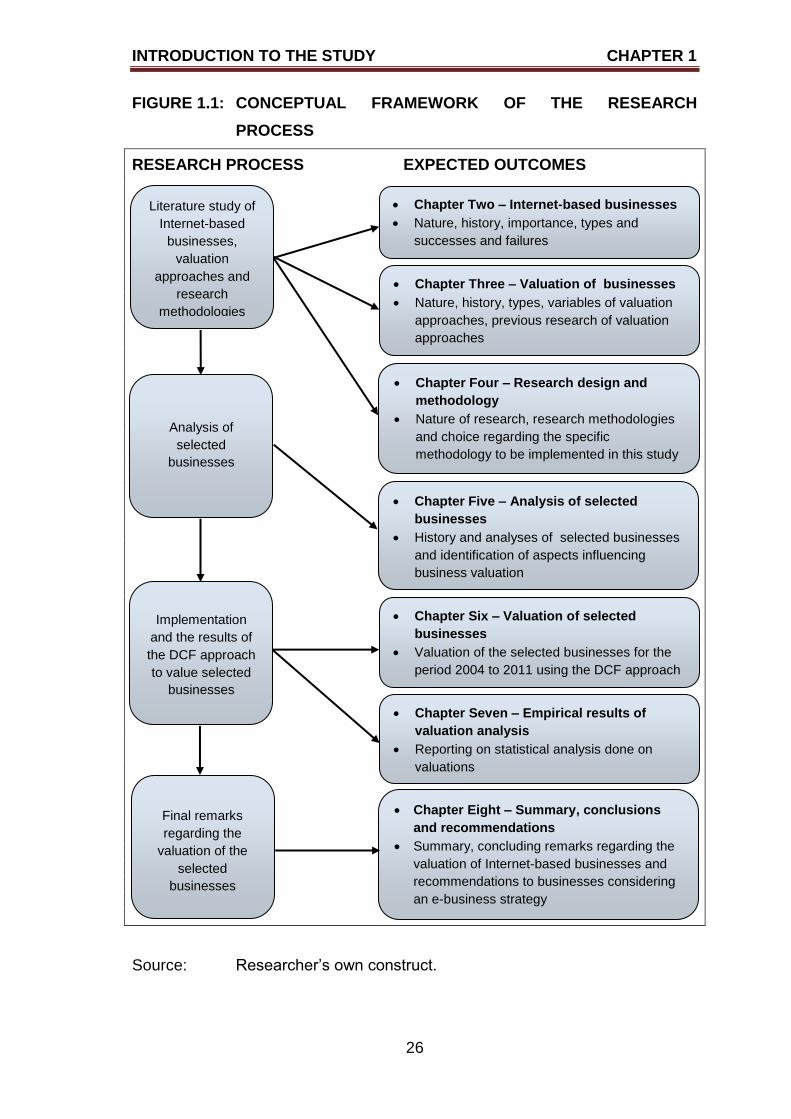
INTRODUCTION TO THE STUDY CHAPTER 1
26
FIGURE 1.1: CONCEPTUAL FRAMEWORK OF THE RESEARCH
PROCESS
RESEARCH PROCESS EXPECTED OUTCOMES
Source: Researcher‟s own construct.
Literature study of
Internet-based
businesses,
valuation
approaches and
research
methodologies
Chapter Three – Valuation of businesses
Nature, history, types, variables of valuation
approaches, previous research of valuation
approaches
Chapter Two – Internet-based businesses
Nature, history, importance, types and
successes and failures
Chapter Four – Research design and
methodology
Nature of research, research methodologies
and choice regarding the specific
methodology to be implemented in this study
Analysis of
selected
businesses
Chapter Five – Analysis of selected
businesses
History and analyses of selected businesses
and identification of aspects influencing
business valuation
Chapter Six – Valuation of selected
businesses
Valuation of the selected businesses for the
period 2004 to 2011 using the DCF approach
Implementation
and the results of
the DCF approach
to value selected
businesses
Chapter Eight – Summary, conclusions
and recommendations
Summary, concluding remarks regarding the
valuation of Internet-based businesses and
recommendations to businesses considering
an e-business strategy
Final remarks
regarding the
valuation of the
selected
businesses
Chapter Seven – Empirical results of
valuation analysis
Reporting on statistical analysis done on
valuations
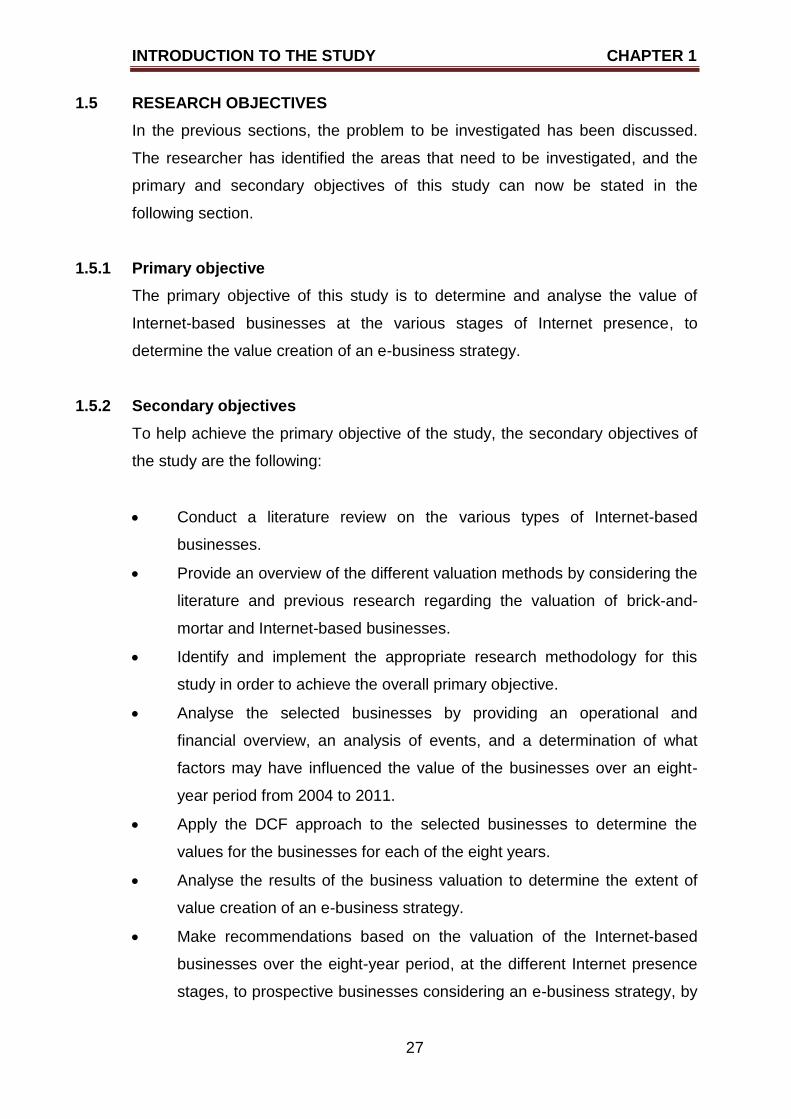
INTRODUCTION TO THE STUDY CHAPTER 1
27
1.5 RESEARCH OBJECTIVES
In the previous sections, the problem to be investigated has been discussed.
The researcher has identified the areas that need to be investigated, and the
primary and secondary objectives of this study can now be stated in the
following section.
1.5.1 Primary objective
The primary objective of this study is to determine and analyse the value of
Internet-based businesses at the various stages of Internet presence, to
determine the value creation of an e-business strategy.
1.5.2 Secondary objectives
To help achieve the primary objective of the study, the secondary objectives of
the study are the following:
Conduct a literature review on the various types of Internet-based
businesses.
Provide an overview of the different valuation methods by considering the
literature and previous research regarding the valuation of brick-and-
mortar and Internet-based businesses.
Identify and implement the appropriate research methodology for this
study in order to achieve the overall primary objective.
Analyse the selected businesses by providing an operational and
financial overview, an analysis of events, and a determination of what
factors may have influenced the value of the businesses over an eight-
year period from 2004 to 2011.
Apply the DCF approach to the selected businesses to determine the
values for the businesses for each of the eight years.
Analyse the results of the business valuation to determine the extent of
value creation of an e-business strategy.
Make recommendations based on the valuation of the Internet-based
businesses over the eight-year period, at the different Internet presence
stages, to prospective businesses considering an e-business strategy, by
INTRODUCTION TO THE STUDY CHAPTER 1
28
indicating prospective benefits.
1.5.3 Research questions
Based on the problem statement, primary and secondary objectives, the
following research questions are formulated:
What are the various types of Internet-based businesses in the business
environment?
Which valuation approaches should be used for brick-and-mortar and
Internet-based (brick-and-click and online) businesses?
What are the components of the various valuation approaches?
Which of the components of the various valuation approaches are difficult
to be determined?
What are the limitations of the various valuation approaches?
What information is necessary to perform a business valuation?
What factors will influence the value of a business?
Which valuation approach is the most used in the business environment?
What are the different e-business stages of an e-business model?
What is the influence on the business value when implementing an e-
business strategy?
How will the business value change when the business progresses to the
various e-business stages?
To what extent, if any, will the business value differ at the different stages
of e-business as presented in the e-business model?
How will the implementation of an e-business strategy influence the value
of the business over time?
1.5.4 Research hypotheses
In order to achieve the primary objective of the study, a number of research
hypotheses were formulated. The hypotheses were formulated to determine
whether the changes in the valuation of businesses using different e-business
strategies according to the e-business model stages (see Chapter Two) are
similar. As all public companies listed on the Johannesburg Stock Exchange
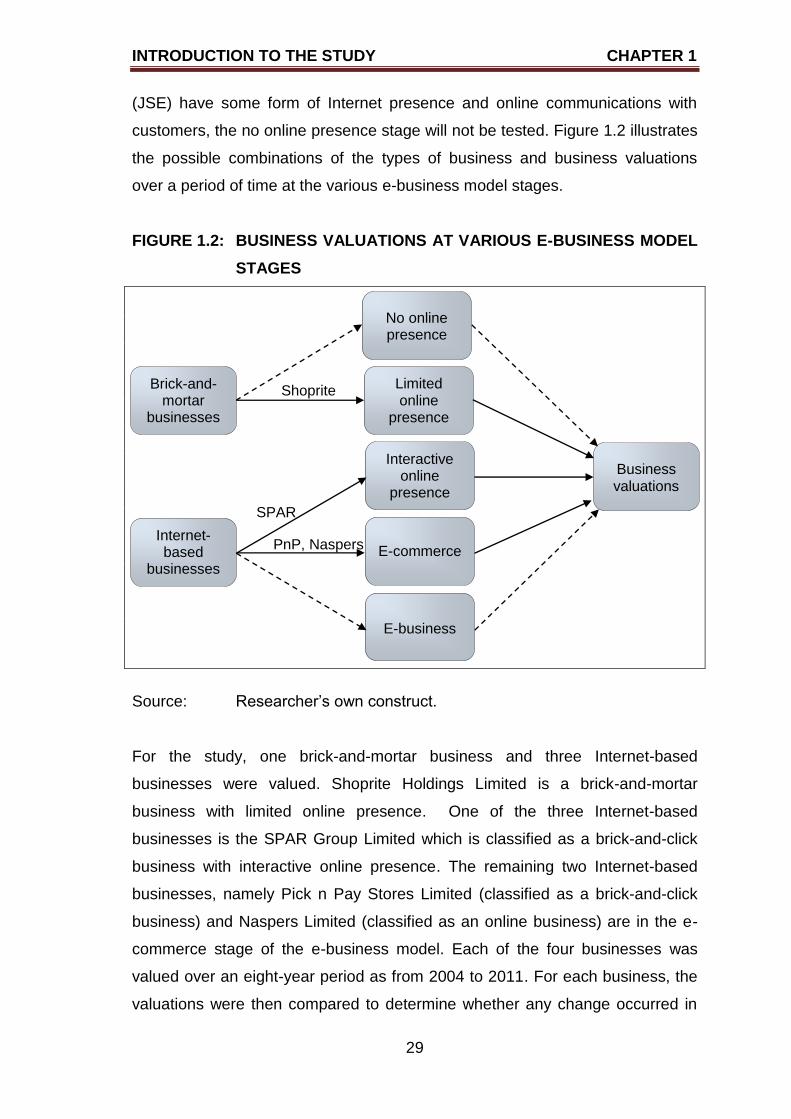
INTRODUCTION TO THE STUDY CHAPTER 1
29
(JSE) have some form of Internet presence and online communications with
customers, the no online presence stage will not be tested. Figure 1.2 illustrates
the possible combinations of the types of business and business valuations
over a period of time at the various e-business model stages.
FIGURE 1.2: BUSINESS VALUATIONS AT VARIOUS E-BUSINESS MODEL
STAGES
Source: Researcher‟s own construct.
For the study, one brick-and-mortar business and three Internet-based
businesses were valued. Shoprite Holdings Limited is a brick-and-mortar
business with limited online presence. One of the three Internet-based
businesses is the SPAR Group Limited which is classified as a brick-and-click
business with interactive online presence. The remaining two Internet-based
businesses, namely Pick n Pay Stores Limited (classified as a brick-and-click
business) and Naspers Limited (classified as an online business) are in the e-
commerce stage of the e-business model. Each of the four businesses was
valued over an eight-year period as from 2004 to 2011. For each business, the
valuations were then compared to determine whether any change occurred in
PnP, Naspers
SPAR
Shoprite
Internet-based
businesses
Business valuations
No online presence
Limited online
presence
Interactive online
presence
E-commerce
E-business
Brick-and-mortar
businesses
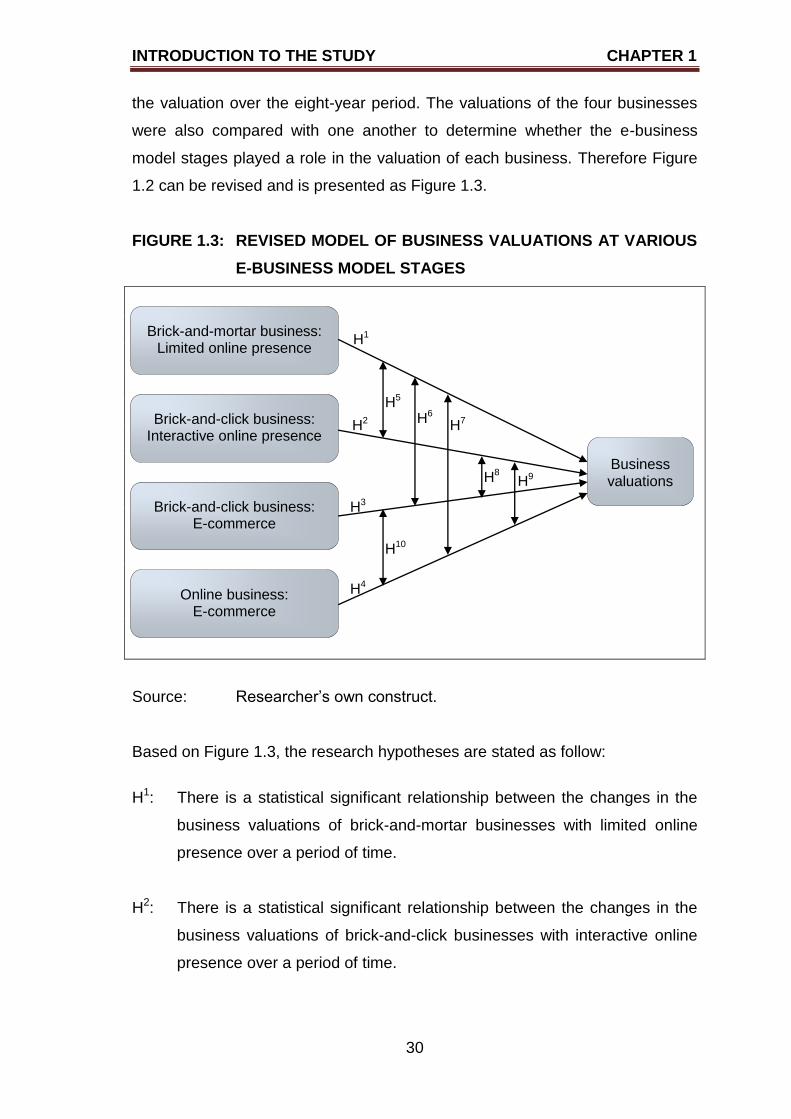
INTRODUCTION TO THE STUDY CHAPTER 1
30
the valuation over the eight-year period. The valuations of the four businesses
were also compared with one another to determine whether the e-business
model stages played a role in the valuation of each business. Therefore Figure
1.2 can be revised and is presented as Figure 1.3.
FIGURE 1.3: REVISED MODEL OF BUSINESS VALUATIONS AT VARIOUS
E-BUSINESS MODEL STAGES
Source: Researcher‟s own construct.
Based on Figure 1.3, the research hypotheses are stated as follow:
H1: There is a statistical significant relationship between the changes in the
business valuations of brick-and-mortar businesses with limited online
presence over a period of time.
H2: There is a statistical significant relationship between the changes in the
business valuations of brick-and-click businesses with interactive online
presence over a period of time.
H5 H6
H7
H8 H9
H10
H4
H3
H2
H1
Business valuations
Brick-and-mortar business: Limited online presence
Brick-and-click business: Interactive online presence
Brick-and-click business: E-commerce
Online business: E-commerce
INTRODUCTION TO THE STUDY CHAPTER 1
31
H3: There is a statistical significant relationship between the changes in the
business valuations of brick-and-click businesses in the e-commerce
stage over a period of time.
H4: There is a statistical significant relationship between the changes of the
business valuations of online businesses in the e-commerce stage over a
period of time.
H5: There is a statistical significant relationship between the changes of the
business valuations of brick-and-mortar businesses with limited online
presence and brick-and-click businesses with interactive online presence
over a period of time.
H6: There is a statistical significant relationship between the changes of the
business valuations of brick-and-mortar businesses with limited online
presence and brick-and-click businesses in the e-commerce stage over a
period of time.
H7: There is a statistical significant relationship between the changes of the
business valuations of brick-and-mortar businesses with limited online
presence and online businesses in the e-commerce stage over a period
of time.
H8: There is a statistical significant relationship between the changes of the
business valuations of brick-and-click businesses with interactive online
presence and brick-and-click businesses in the e-commerce stage over a
period of time.
H9: There is a statistical significant relationship between the changes of the
business valuations of brick-and-click businesses with interactive online
presence and online businesses in the e-commerce stage over a period
of time.
H10: There is a statistical significant relationship between the changes of the
INTRODUCTION TO THE STUDY CHAPTER 1
32
business valuations of brick-and-click businesses in the e-commerce
stage and online businesses in the e-commerce stage over a period of
time.
1.6 RESEARCH DESIGN AND METHODOLOGY
The specific research paradigm to be adopted in this study is one of the
secondary objectives to be completed to ensure the achievement of the ultimate
primary objective. In the study, a complete chapter will be devoted to discussing
the research methodologies available. This chapter will also include the choice
of research design and methodology, as well as the motivation for the specific
research design and methodology chosen. The following section outlines the
envisaged research design and methodology to be implemented.
1.6.1 Secondary research
The aim of secondary research is to collect appropriate and up-to-date
secondary data to be used in a study. According to Myers (2009:122) and
Zikmund (2003:136), secondary data is data that has been collected already for
a purpose other than the one to be studied. Cooper and Schindler (2008:104)
define secondary data as interpretations of primary data. Secondary data will be
collected by conducting an extensive literature review on Internet-based
businesses in terms of nature, types, history and importance as well as
business successes and failures. A comprehensive literature research on the
valuation of businesses will also be conducted. Aspects that will be covered
include the nature and history of the valuation approaches, the various
traditional valuation approaches, and the variables of the valuation approaches.
Previous research on valuation in general and online businesses valuation will
be included. The secondary sources that will be studied include books, journals,
newspapers and information from Internet websites. Secondary data will be
obtained from international and national data searches. The inter-library loan
facilities of the library of the Nelson Mandela Metropolitan University (NMMU)
will be used. The researcher will also conduct searches on EBSCO, Emerald,
ScienceDirect and Google Scholar. Other online databases available will also
be consulted. The library of the NMMU will be approached to assist in finding
INTRODUCTION TO THE STUDY CHAPTER 1
33
relevant and up-to-date publications on the various individual topics to be
investigated.
The secondary data gathered will be presented in two chapters. The first
literature chapter (Chapter Two) will address the issue of Internet-based
businesses. The nature, history and the importance of online businesses will be
discussed. The various Internet-based business categories, namely brick-and-
click and online businesses, will be described. Some Internet-based business
successes and failures will be highlighted. It is important to note that research
from a business perspective in e-business will be followed.
The second literature chapter (Chapter Three) will focus on the various
valuation approaches that can be used to determine the fair value of brick-and-
mortar businesses, brick-and-click businesses and online businesses. The
nature, history and various types of the valuation approaches will be addressed.
The different variables required to apply the valuation approaches will be
described. Previous research in the field of valuation will be discussed. The
chapter will conclude with previous research on the valuation of online
businesses. Aspects such as the approaches followed in the valuation process,
the intrinsic values and the income generation of online businesses will be
discussed.
Numerous studies from an accountancy perspective (such as Ali et al. 2010;
Bartov et al. 2002; Farooq, Ullah, Alam & Shah 2010; Holland 2009; Schauten
et al. 2010; Steiger 2008; Uzma et al. 2010) on the valuation of intangibles
exist. A few studies with regard to the valuation of online businesses exist
where businesses such as Google, Amazon.com and Facebook are valued.
These studies focused only on valuing these businesses using the DCF
approach, although there is no consensus on the applicability of the DCF
approach when valuing online businesses. Chapter Three (sections 3.5.2 and
3.6.1) will provide more detail regarding the issue of applicability of the various
valuation approaches when valuing online businesses. One important
distinction between the proposed study and the previous studies is that this
study will value one online business, two brick-and-click businesses and one
INTRODUCTION TO THE STUDY CHAPTER 1
34
brick-and-mortar (with Internet presence only) over an eight-year period (2004
to 2011). The purpose will be to establish whether the value of the business will
differ at various Internet presence stages. The choice of the four businesses will
be motivated and fully explained in Chapter Four.
1.6.2 Primary research
As this study is focusing on valuation of businesses, existing sources (such as
annual reports) will be used to source the required data. The collected data
from secondary sources will be analysed and reworked into a usable format for
the valuation process. Therefore the main purpose of this study is not to collect
new primary data.
This section will focus on the appropriate research paradigm to be adopted in
this study. The population, sample, sampling method, the measuring
instrument, data collection and data analysis to be implemented will also be
described. Chapter Four of the study will discuss the various research
paradigms, population, sample, sampling methods and measuring instrument to
be adopted in this study. The data collected will be used in the analyses and
valuation of the selected businesses which will be reported on in Chapters Five
(overview of selected businesses), Six (values based on the DCF approach
results) and Seven (report on statistical data analysis of valuations).
(a) Research paradigms
Two paradigms can be distinguished, namely the positivistic and the
phenomenological research paradigms. The positivistic paradigm is known as
quantitative, objectivist, scientific, experimentalist or traditional research, while
the phenomenological paradigm is known as qualitative, subjectivist, humanistic
or interpretive research (Collis & Hussey 2003:47; Cooper & Schindler
2008:164).
The positivistic paradigm emphasises the quantification of the data collected
and analysed. It is a deductive strategy where relationships between theory and
research are tested. The aim of the phenomenological paradigm, on the other
hand, is to emphasise content and to develop new theories instead of testing
INTRODUCTION TO THE STUDY CHAPTER 1
35
existing theories. Furthermore, if one considers the principal orientation of the
research to the role of theory in relation to research, the positivistic paradigm
uses deductive reasoning, and existing theory will be tested. The
phenomenological paradigm differs from the positivistic paradigm in the sense
that inductive reasoning is used, and a new theory will be generated rather than
deductive reasoning and theory testing. This paradigm creates theory, and
different categories are developed as a result of the analysis of the data
collected. (Bryman & Bell 2007:28, 157, 404; Creswell 2009:3-4).
Myers (2009:5) states that one of the benefits of qualitative research is that it
allows the researcher to comprehend the context in which decisions and
activities are undertaken. According to Cooper and Schindler (2008:162), the
purpose of quantitative research is to measure consumer behaviour,
knowledge, opinions or attitudes, while qualitative research focuses on how and
why things happen the way they do. For the purpose of this study, a positivistic
paradigm will be followed. A positivistic paradigm will be adopted because four
businesses (one brick-and-mortar and three Internet-based businesses)
providing consumer services (three in the food and drug retail industry and one
in the media industry) will be valued by reworking secondary quantitative data
into more easily understandable information. A more detailed discussion of the
research methodology will be provided in Chapter Four.
(b) Population, sample size and sample selection
Population or universe are described as all people or group of entities that may
be part of the research because of a number of similar characteristics (Quinlan
2011:143; Zikmund, Babin, Carr & Griffen 2010:387). With regard to the
population of the present study, the businesses that are public companies listed
on the JSE will form part of the population. The reason for the businesses to be
public companies is the accessibility to the businesses‟ annual reports. Private
companies and businesses with other forms of ownership do not make their
annual reports available to the public. The population is restricted to public
companies in South Africa, because the data required for the valuations, such
as the annual reports, are not available for foreign public companies and the
INTRODUCTION TO THE STUDY CHAPTER 1
36
financial statements available are not standardised in the same manner as the
South African financial statements.
A sample is a subset consisting of only a few people or group of entities
selected from the population (Quinlan 2011:143; Zikmund et al. 2010:387). The
researcher will analyse and value four businesses using secondary data; one
brick-and-mortar business with limited online presence and no online trading
taking place via the Internet (Shoprite Holdings Limited) and three Internet-
based businesses where some form of actual online trading is conducted via
the Internet (The Spar Group Ltd and Pick n Pay Stores Ltd as brick-and-click
businesses and Naspers Ltd as an online business). All four businesses to be
valued are in the consumer services sector. Three of the four businesses are in
the food and drug retail industry (retailers and wholesalers subsector), while the
fourth business is in the media industry (broadcasting and entertainment
subsector). The food and drug retail industry (retailer and wholesalers
subsector) comprises four businesses, three of which will be included in the
study. A detailed discussion and motivation of the businesses included in the
study will be given in Chapter Four.
Saunders, Lewis and Thornhill (2009:213) distinguish between probability and
nonprobability sampling. Probability sampling refers to the selection of a
representative group from the population, and each member of the population
has an equal opportunity to be included in the group selected. In contrast, in
nonprobability sampling, the researcher makes little attempt to obtain a
representative sample and the participants will not have an equal opportunity to
be included in the sample. Cooper and Schindler (2008:169-170) and Zikmund
et al. (2010:396) further identify three types of nonprobability sampling, namely
purposive sampling, snowball sampling and convenience sampling. In
purposive sampling, participants are selected for their unique characteristics
and experiences. Snowball sampling occurs when one participant refers the
researcher to other possible participants who have similar unique
characteristics and experiences. In convenience sampling, the researcher
selects readily available individuals as participants.
INTRODUCTION TO THE STUDY CHAPTER 1
37
A variety of businesses from various sectors and industries can be found on the
JSE. The retail consumer services, with specific reference to the food and drug
retail industry, were selected as they are of growing importance to all
consumers, as highlighted in the literature. Three of the four businesses from
the food and drug retail industry will be included in the study. The business not
included in the study is the holding company of one of the included businesses.
One media company, also in the consumer services sector, was selected
because the principal activities of the company were embedded in technology
and Internet-based activities. Therefore the media company was selected using
nonprobability sampling. For the purpose of this study, judgement (purposive)
sampling was used to select the companies to be valued as all the companies
in the sample were required to have some form of e-business strategy.
(d) Data collection
The collection of secondary data was explained in section 1.6.1. To collect the
secondary data, the relevant annual financial reports from 2004 to 2011 were
obtained from the four companies‟ websites. The McGregor BFA Fin24Expert
package was also used to extract the required data for the business valuations.
Data was also gathered from the South African Reserve Bank, the
Johannesburg Securities Exchange, and other sources of available public
information that might influence the market value of the businesses. The
collection of the secondary data took approximately one month. The researcher
collected all the secondary data.
The reliability and validity of quantitative research are very important. Reliability
is a measurement of the internal consistency of a measuring instrument.
Internal validity refers to the extent that a variable is truly responsible for any
variance in the dependent variable. External validity is the extent to which the
results can be generalised beyond the selected sample. (Zikmund et al.
2010:274, 277, 305). The reliability and validity of the secondary data collected
will be discussed below when addressing the issue of trustworthiness. The
usual reliability measurements could not be used to determine reliability
because no measuring instrument or interview guide was used. Therefore, to
ensure the reliability and the validity of the data captured in the database
INTRODUCTION TO THE STUDY CHAPTER 1
38
created by the researcher for the valuation process, experts in the field of
accounting were asked to verify the data collected as well as calculations, to
ensure correctness. All the valuations of all the businesses were calculated
using two methods as the two methods should yield the same result. This is
known as triangulation. Triangulation occurs when different data collection
methods are used within the same study to ensure that the data is indeed
reliable and valid. The data collection can be done over different times or from
different sources. (Gray 2009:36; Saunders et al. 2009:146). All the equations
used in the valuation process were included in the Microsoft Excel Spreadsheet.
The equations and all the calculations done by the researcher were checked by
two independent accountants, one being a chartered accountant working in
practice and one academic with a Masters-degree in accounting with specific
reference to valuations.
(e) Data analysis
The secondary quantitative data collected was transformed into usable data to
calculate the valuations of the businesses over an eight-year period. The
valuations of the businesses were calculated for each business and for all eight
years. For each business, the change (growth) in the business valuations over
the period investigated was determined. The valuations of the various
businesses were also compared with one another over the investigating period.
The Pearson‟s product moment correlation coefficient was calculated to assess
the strength of the relationship between the valuations of the four businesses.
As stated by Gray (2009:488) and Saunders et al. (2009:451, 460), the
Pearson‟s product moment correlation coefficient is used to assess the strength
of a relationship between numerical data. The t-test is used to determine
whether significant differences exist between two sets of data and this test can
also be used with sample size smaller than 30 (Oates 2006:261, Saunders et al.
2009:457). The one-sample t-tests were used to determine whether statistically
significant differences exist between the five valuations of each of the
businesses used in the investigation. The dependent t-tests were used to
establish whether there were significant differences between the valuations of
the businesses. According to Gray (2009:473), Saunders et al. (2009:457) and
Oates (2006:262), dependent t-tests are used to determine whether statistically
INTRODUCTION TO THE STUDY CHAPTER 1
39
significant differences exist between two sets of data by comparing the means
of the two groups using a measure of the spread of the scores. The dependent
t-tests were implemented as the valuations used in the analyses were
calculated using the same valuation approach. An analysis of the events as
recorded in the annual reports of the sample businesses was also provided as
these events might have influenced the valuation of the businesses. If such
events were found, these events would be linked to the valuations of that
particular year for the business in question.
1.7 SCOPE OF THE STUDY
The study will focus on the primary research objective, which is to determine
whether retail businesses focusing on e-business strategies have greater
opportunities to increase the value of the business. Therefore businesses are
categorised into brick-and-mortar, brick-and-click and online businesses.
Business types are also linked to the various e-business model stages.
1.8 CONTRIBUTION OF THE STUDY
Businesses can be categorised into brick-and-mortar, brick-and-click as well as
online businesses. Although the main aim of the study is to determine whether
the values of Internet-based businesses will increase after implementing an e-
business strategy, brick-and-mortar and Internet-based businesses (brick-and-
click and online businesses) will be included in the study since comparisons will
be made between the values of the selected businesses over time. The
research will thus aim to establish whether the benefit of implementing an e-
business strategy can be seen in the valuation of businesses to assist in future
strategic decision-making regarding the various e-business strategies.
1.9 STRUCTURE OF THE RESEARCH
The study will be divided into the following seven chapters. Chapter One will
indicate the scope of the study and methods used. Aspects to be included are:
problem identification; aim of the study; the importance of the study; a brief
overview of the research methodology; and the division of the content to follow
in the subsequent chapters.
INTRODUCTION TO THE STUDY CHAPTER 1
40
Chapter Two will address the topic of Internet-based businesses. The nature,
history and importance of Internet-based businesses will be discussed. Internet-
based businesses will be classified into brick-and-click and online businesses.
Online businesses include all the businesses that use only the Internet for all
transactions, namely, click-only businesses, Internet search engines, Internet
social networks and other businesses (such as auctions and blogs). A historical
overview of each type will be given. Several Internet-based businesses‟
success and failure stories will be given.
Chapter Three will focus on the nature of valuation where various valuation
concepts, the purpose of valuation, valuation of businesses of different sizes
and the valuation of real estate will be discussed. The history of valuation
approaches will also be touched on. Overviews of the different valuation
approaches available to determine the value of brick-and-mortar and brick-and-
click businesses will be given. The approaches to be discussed include the
dividend discount method; the zero growth model; the constant growth method;
the non-constant growth method; the free cash-flow valuation model; price
ratios; the economic value-added performance measurement (EVA) also known
as the residual income model; the market value-added (MVA) performance
measurement; and the real options approach. The variables of the valuation
approaches will also be identified. An overview of previous research in the field
of valuation will be provided. The chapter will conclude with a discussion on the
valuation of online businesses.
The method of the study will be discussed in Chapter Four. The research
design, the research methodology, data collection and data analysis chosen will
be discussed in detail.
Chapter Five will provide an analysis of the four selected businesses. An
operational and financial overview of each business will be provided, and the
events that may have influenced the market value of the businesses will be
discussed. The main events of each business will be tabulated. Each business
will also be categorised according to the e-business model stages, as proposed
in Chapter Two, based on the activities as found on the websites of the
INTRODUCTION TO THE STUDY CHAPTER 1
41
businesses.
The valuation of the four selected businesses will be reported in Chapter Six.
The assumptions as well as the estimates used in the valuation process will be
discussed and motivated. Five valuations for each business will reported on.
These valuations are the valuations using the R157 government bond as the
risk-free rate for single and multiple period valuations, valuations using the
R153 government bond as the risk-free rate for single and multiple period
valuations and the valuations as calculated by McGregor BFA Fin24Expert. The
share prices of the businesses will also be provided.
The purpose of Chapter Seven is to discuss the statistical analysis of the five
valuations and share prices. Basic descriptive statistics such as the mean,
median, minimum, maximum, range and standard deviation will be provided and
discussed. T-tests will be conducted to test the research hypotheses as
formulated in Chapter One. The one-sample t-test and the dependent t-test will
be implemented to test the research hypotheses.
Chapter Eight will conclude with a summary of the study and conclusions drawn
from the results of the valuation. Recommendations will be made regarding the
benefit of implementing an e-business strategy for all businesses in terms of
value creation. The contribution made by the study will be highlighted. The
limitations and future research areas will also be provided.
INTERNET-BASED BUSINESSES CHAPTER 2
42
CHAPTER TWO
INTERNET-BASED BUSINESSES
2.1 INTRODUCTION
In Chapter One the importance of business valuation was highlighted. It was
furthermore stated that various methods are available to be used by businesses
to determine fair market-related values for these businesses, in particular brick-
and-mortar and brick-and-click businesses. Some of the reasons found in
literature why brick-and-mortar businesses add online presence are in order to
remain competitive and to maintain or, to increase their market share. Many
businesses have an online presence only in providing the business details and
a product or service catalogue, whether through a conscious decision or
whether due to the nature of the business itself. Therefore it is important for
owners, shareholders and future investors to be able to determine the possible
future benefit of implementing such an e-business strategy, whether in terms of
business performance or business value.
The primary objective of this study is determine whether the valuation of
Internet-based businesses will differ at the various stages of online presence
since it is important for owners, shareholders and future investors to obtain fair
market-related values to assist the investment decision-making process. One of
the secondary objectives that were formulated to assist in achieving the primary
objective is to discuss the various types of Internet-based businesses. For the
purpose of the study, Internet-based businesses refer to all businesses that
have some e-business strategy, whether it is online presence only, or using the
Internet extensively for all trading. These businesses will include brick-and-click
and online businesses. Online businesses include all businesses with an e-
business strategy, specifying that all transactions will be done using the
Internet. Reference to online businesses includes businesses such as click-only
businesses, Internet search engines, Internet social networks, blogs and
auctions. Figure 2.1 is reproduced from Chapter One to illustrate the
applicability of this chapter regarding the conceptual framework of the research
process.
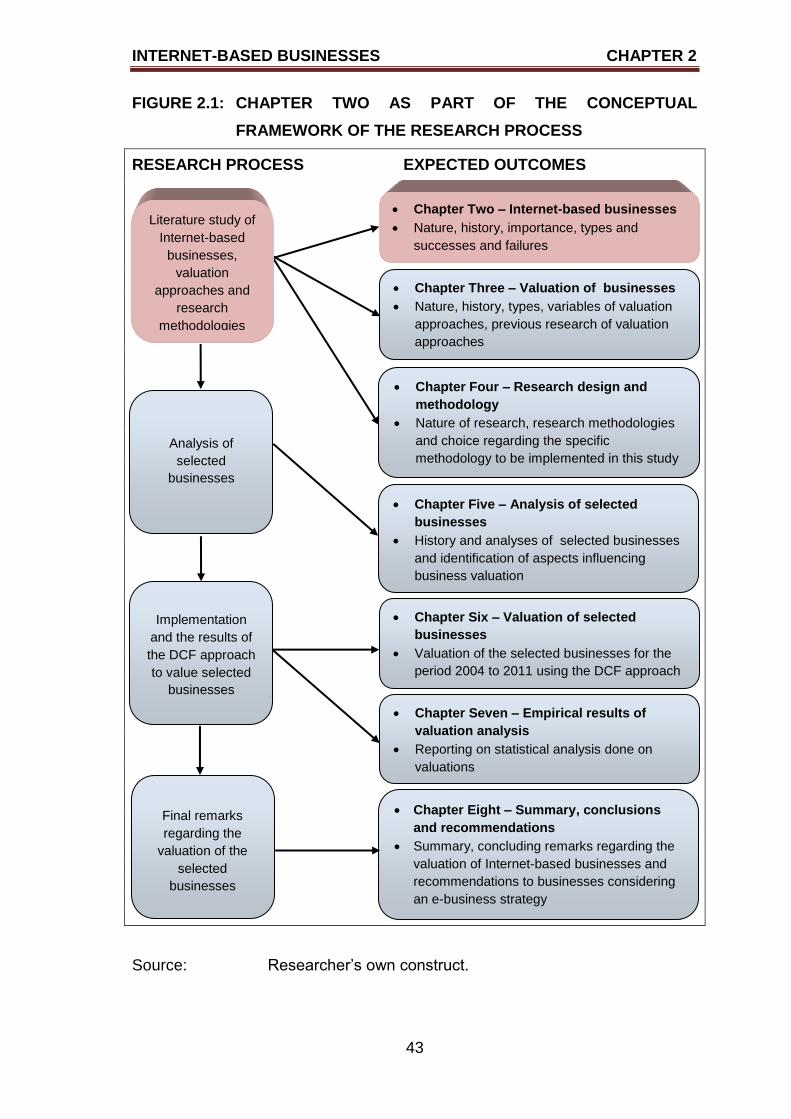
INTERNET-BASED BUSINESSES CHAPTER 2
43
FIGURE 2.1: CHAPTER TWO AS PART OF THE CONCEPTUAL
FRAMEWORK OF THE RESEARCH PROCESS
RESEARCH PROCESS EXPECTED OUTCOMES
Source: Researcher‟s own construct.
Literature study of
Internet-based
businesses,
valuation
approaches and
research
methodologies
Chapter Three – Valuation of businesses
Nature, history, types, variables of valuation
approaches, previous research of valuation
approaches
Chapter Two – Internet-based businesses
Nature, history, importance, types and
successes and failures
Chapter Four – Research design and
methodology
Nature of research, research methodologies
and choice regarding the specific
methodology to be implemented in this study
Analysis of
selected
businesses
Chapter Five – Analysis of selected
businesses
History and analyses of selected businesses
and identification of aspects influencing
business valuation
Chapter Six – Valuation of selected
businesses
Valuation of the selected businesses for the
period 2004 to 2011 using the DCF approach
Implementation
and the results of
the DCF approach
to value selected
businesses
Chapter Eight – Summary, conclusions
and recommendations
Summary, concluding remarks regarding the
valuation of Internet-based businesses and
recommendations to businesses considering
an e-business strategy
Final remarks
regarding the
valuation of the
selected
businesses
Chapter Seven – Empirical results of
valuation analysis
Reporting on statistical analysis done on
valuations
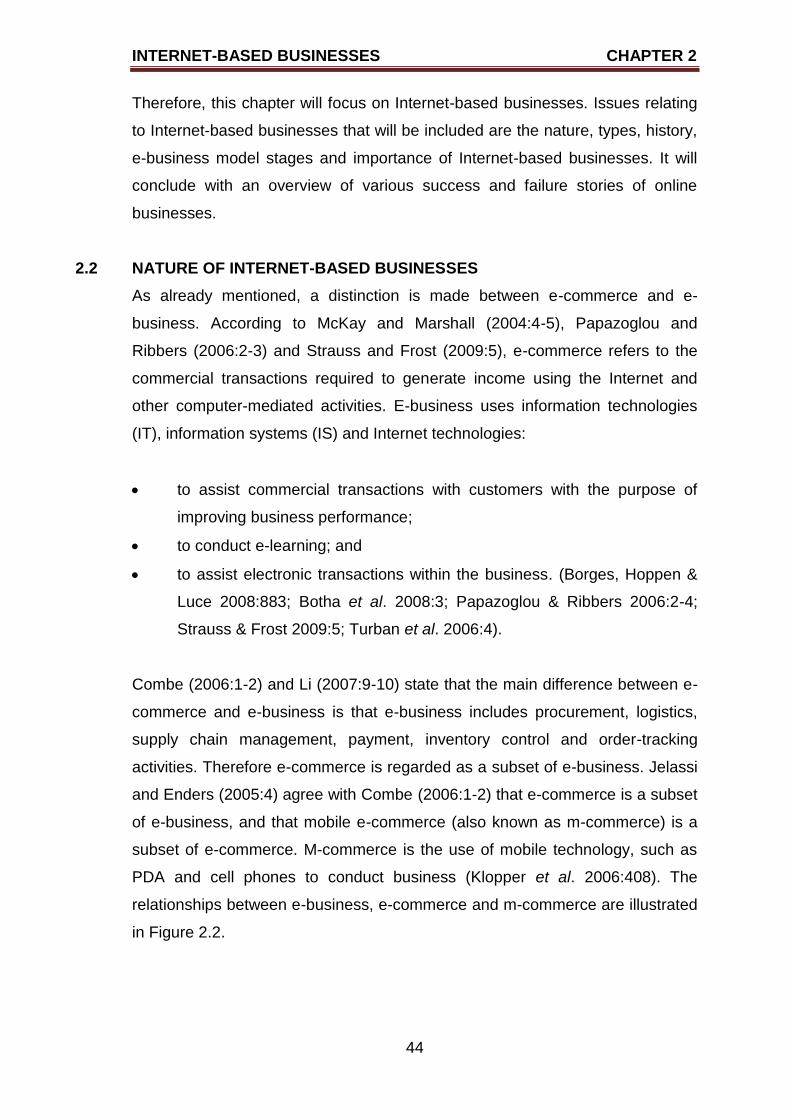
INTERNET-BASED BUSINESSES CHAPTER 2
44
Therefore, this chapter will focus on Internet-based businesses. Issues relating
to Internet-based businesses that will be included are the nature, types, history,
e-business model stages and importance of Internet-based businesses. It will
conclude with an overview of various success and failure stories of online
businesses.
2.2 NATURE OF INTERNET-BASED BUSINESSES
As already mentioned, a distinction is made between e-commerce and e-
business. According to McKay and Marshall (2004:4-5), Papazoglou and
Ribbers (2006:2-3) and Strauss and Frost (2009:5), e-commerce refers to the
commercial transactions required to generate income using the Internet and
other computer-mediated activities. E-business uses information technologies
(IT), information systems (IS) and Internet technologies:
to assist commercial transactions with customers with the purpose of
improving business performance;
to conduct e-learning; and
to assist electronic transactions within the business. (Borges, Hoppen &
Luce 2008:883; Botha et al. 2008:3; Papazoglou & Ribbers 2006:2-4;
Strauss & Frost 2009:5; Turban et al. 2006:4).
Combe (2006:1-2) and Li (2007:9-10) state that the main difference between e-
commerce and e-business is that e-business includes procurement, logistics,
supply chain management, payment, inventory control and order-tracking
activities. Therefore e-commerce is regarded as a subset of e-business. Jelassi
and Enders (2005:4) agree with Combe (2006:1-2) that e-commerce is a subset
of e-business, and that mobile e-commerce (also known as m-commerce) is a
subset of e-commerce. M-commerce is the use of mobile technology, such as
PDA and cell phones to conduct business (Klopper et al. 2006:408). The
relationships between e-business, e-commerce and m-commerce are illustrated
in Figure 2.2.
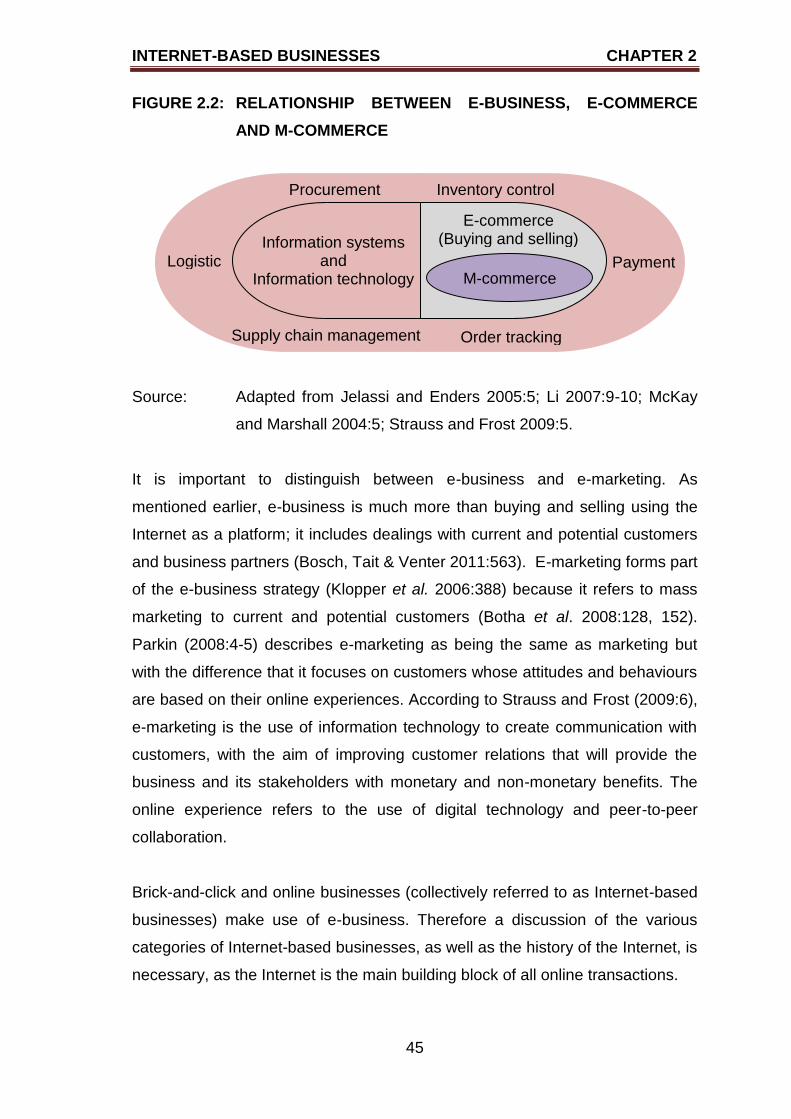
INTERNET-BASED BUSINESSES CHAPTER 2
45
FIGURE 2.2: RELATIONSHIP BETWEEN E-BUSINESS, E-COMMERCE
AND M-COMMERCE
Source: Adapted from Jelassi and Enders 2005:5; Li 2007:9-10; McKay
and Marshall 2004:5; Strauss and Frost 2009:5.
It is important to distinguish between e-business and e-marketing. As
mentioned earlier, e-business is much more than buying and selling using the
Internet as a platform; it includes dealings with current and potential customers
and business partners (Bosch, Tait & Venter 2011:563). E-marketing forms part
of the e-business strategy (Klopper et al. 2006:388) because it refers to mass
marketing to current and potential customers (Botha et al. 2008:128, 152).
Parkin (2008:4-5) describes e-marketing as being the same as marketing but
with the difference that it focuses on customers whose attitudes and behaviours
are based on their online experiences. According to Strauss and Frost (2009:6),
e-marketing is the use of information technology to create communication with
customers, with the aim of improving customer relations that will provide the
business and its stakeholders with monetary and non-monetary benefits. The
online experience refers to the use of digital technology and peer-to-peer
collaboration.
Brick-and-click and online businesses (collectively referred to as Internet-based
businesses) make use of e-business. Therefore a discussion of the various
categories of Internet-based businesses, as well as the history of the Internet, is
necessary, as the Internet is the main building block of all online transactions.
Information systems and
Information technology Logistics
Supply chain management managementchainmcProc
Payment
Procurement
Order tracking
Inventory control
M-commerce
E-commerce (Buying and selling)
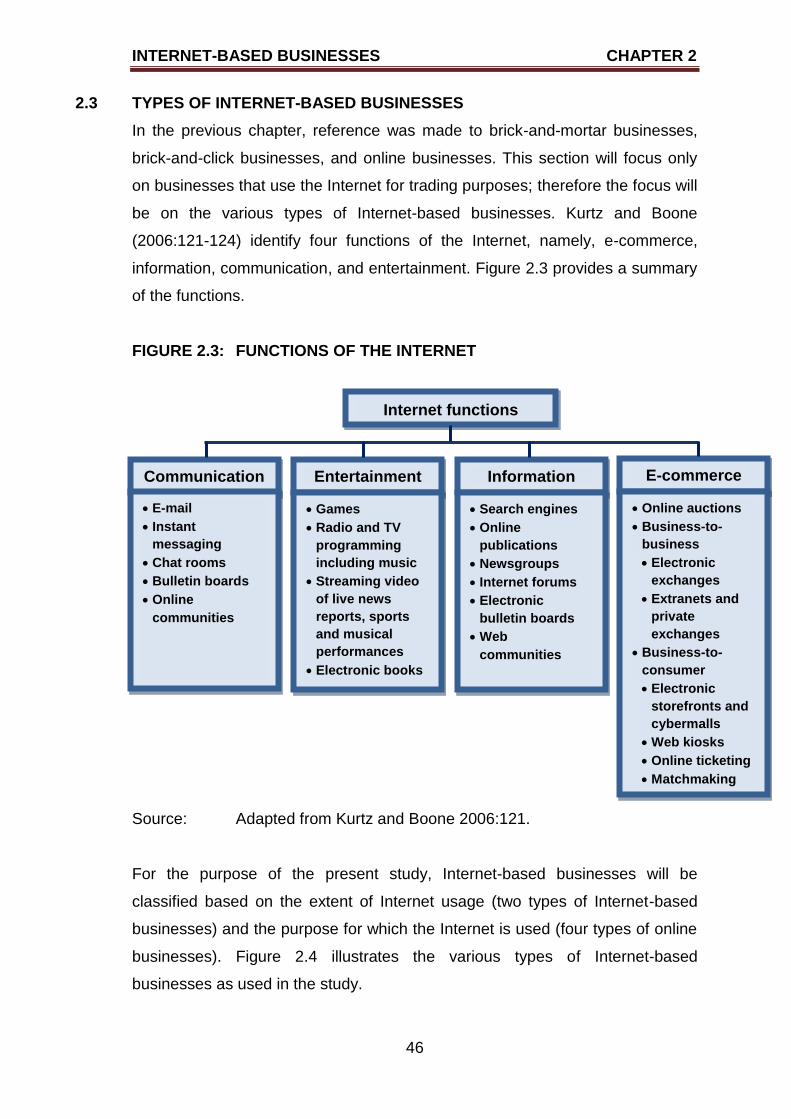
INTERNET-BASED BUSINESSES CHAPTER 2
46
2.3 TYPES OF INTERNET-BASED BUSINESSES
In the previous chapter, reference was made to brick-and-mortar businesses,
brick-and-click businesses, and online businesses. This section will focus only
on businesses that use the Internet for trading purposes; therefore the focus will
be on the various types of Internet-based businesses. Kurtz and Boone
(2006:121-124) identify four functions of the Internet, namely, e-commerce,
information, communication, and entertainment. Figure 2.3 provides a summary
of the functions.
FIGURE 2.3: FUNCTIONS OF THE INTERNET
Source: Adapted from Kurtz and Boone 2006:121.
For the purpose of the present study, Internet-based businesses will be
classified based on the extent of Internet usage (two types of Internet-based
businesses) and the purpose for which the Internet is used (four types of online
businesses). Figure 2.4 illustrates the various types of Internet-based
businesses as used in the study.
Internet functions
Communication Entertainment Information E-commerce
Instant
messaging
Chat rooms
Bulletin boards
Online
communities
Games
Radio and TV
programming
including music
Streaming video
of live news
reports, sports
and musical
performances
Electronic books
Search engines
Online
publications
Newsgroups
Internet forums
Electronic
bulletin boards
Web
communities
Online auctions
Business-to-
business
Electronic
exchanges
Extranets and
private
exchanges
Business-to-
consumer
Electronic
storefronts and
cybermalls
Web kiosks
Online ticketing
Matchmaking
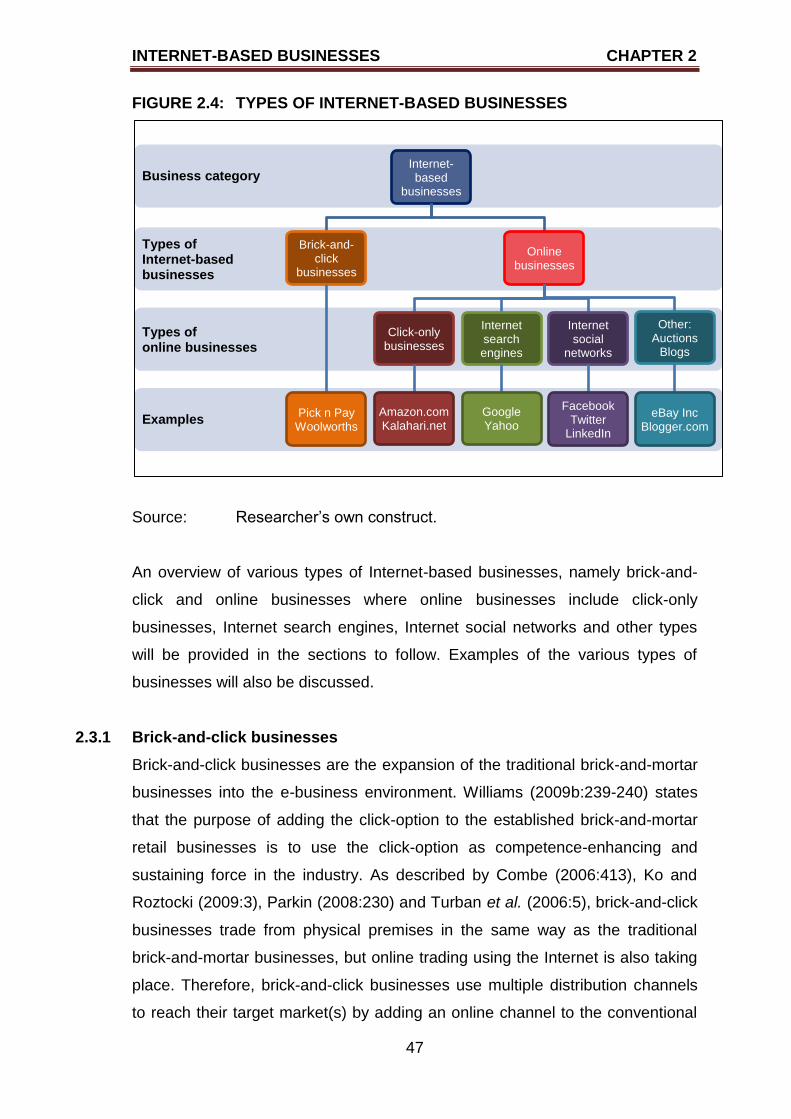
INTERNET-BASED BUSINESSES CHAPTER 2
47
Types of Internet-based businesses
Examples
Business category
Types of online businesses
Internet-based
businesses
Brick-and-click
businesses
Pick n Pay Woolworths
Online businesses
Click-only businesses
Amazon.com Kalahari.net
Internet search engines
Google Yahoo
Internet social
networks
Facebook Twitter
Other: Auctions
Blogs
eBay Inc Blogger.com
FIGURE 2.4: TYPES OF INTERNET-BASED BUSINESSES
Source: Researcher‟s own construct.
An overview of various types of Internet-based businesses, namely brick-and-
click and online businesses where online businesses include click-only
businesses, Internet search engines, Internet social networks and other types
will be provided in the sections to follow. Examples of the various types of
businesses will also be discussed.
2.3.1 Brick-and-click businesses
Brick-and-click businesses are the expansion of the traditional brick-and-mortar
businesses into the e-business environment. Williams (2009b:239-240) states
that the purpose of adding the click-option to the established brick-and-mortar
retail businesses is to use the click-option as competence-enhancing and
sustaining force in the industry. As described by Combe (2006:413), Ko and
Roztocki (2009:3), Parkin (2008:230) and Turban et al. (2006:5), brick-and-click
businesses trade from physical premises in the same way as the traditional
brick-and-mortar businesses, but online trading using the Internet is also taking
place. Therefore, brick-and-click businesses use multiple distribution channels
to reach their target market(s) by adding an online channel to the conventional
INTERNET-BASED BUSINESSES CHAPTER 2
48
distribution channels (Botha et al. 2008:280; Dennis et al. 2002:287-288). To be
regarded as a brick-and-click business, the click-option needs to be used to
perform some form of monetary transaction.
The respondents in a study by Wadsworth, Little, Wheat and Swartz (2006:27)
stated that brick-and-mortar retailers were more confusing than click-only
retailers, and click-only retailers were regarded as providing excellent value,
which was not the case with brick-and-mortar retailers. It was also found that
shopping comfort, sales assistance and store prestige were highly regarded by
customers, irrespective of whether the businesses were brick-and-mortar or
click-only. Therefore, brick-and-click retailers should take the best from both
types of business to maximise customer perceptions.
The importance of the inclusion of an e-business strategy on financial
performance is highlighted by research done by Ko and Roztocki (2009:1-27).
Rosencrance, as cited by Ko and Roztocki (2009:3), estimated that online sales
would grow by 14% per annum from 2008 until 2012, while the growth of sales
from physical premises would only increase by 2.6% per annum. Oliva et al.
(2003:83) state that many brick-and-mortar businesses use the „get big fast‟
strategy, which is the implementation of an e-business strategy to create brick-
and-click businesses. Unfortunately not all the brick-and-click businesses
implementing e-business strategies have been successful. A discussion of the
business successes and failures can be found in section 2.7.
The pricing strategy of brick-and-click businesses should also be carefully
evaluated. If the two distribution channels, that is the brick-and-mortar channel
and the online channel, are allowed to be in direct competition with one another,
different pricing strategies may be followed. However, if the online channel is
regarded as an extension of the brick-and-mortar channel, then the same
pricing strategy should be followed. It is also important to realise that customers
will use the distribution channel which will yield the greatest benefit to the
customer (Yan 2008:49-51). In the banking industry, banks provide incentives to
clients to make use of the online channel (for example online banking and the
use of automated teller machines) rather than conducting over-the-counter
INTERNET-BASED BUSINESSES CHAPTER 2
49
transactions inside the bank itself. The incentives used include the pricing
strategy of transactions (over-the-counter transactions are more expensive) and
the availability of the automated teller machines. (Allen, Clark & Houde 2009:2-
4).
One the Africa‟s largest and most successful brick-and-click retailers is the
Pick n Pay Group. In 2011, the Pick n Pay Group consisted of 500 corporate
stores and 379 franchise outlets. Using the ten-year compound annual growth
with the year 2002 as the base year, the turnover growth was 14.3% while the
trading profit growth was 14.9%. The headline earnings per share increased by
10.4%, and the net asset value per share for the group grew by 14.5%. (Pick n
Pay Integrated Annual Report 2011 2011:2-3, 7). Pick n Pay Group was a
traditional brick-and-mortar business, but in June 2001 the business launched
online shopping to their customers, and therefore the business transformed to a
brick-and-click business (Creating a new generation 2012). A more detailed
analysis of the Pick n Pay Group is provided in Chapter Five.
2.3.2 Click-only businesses
Click-only businesses refer to all online businesses where products and/or
services are trading using the Internet (Krishnamurthy 2003:73). Therefore
click-only businesses do not have physical premises where customers can buy
products and/or services. One well-known example of a click-only business is
Amazon.com.
Jeff Bezos founded Amazon.com in 1994. The purpose of this business was to
sell books online, although it was not the first online bookstore on the Internet.
Bezos decided on books and music because they are standardised products
customers will know. Amazon.com went public in May 1997. Unfortunately
Amazon.com made losses in the early years, and only in 2004 did the business
report a consistent trading profit. Investors and lenders provided the required
finance during the difficult years. The long-term debt of Amazon.com amounted
to US$1.5 billion in 1999. The major reasons for the early cumulative losses of
Amazon.com were a number of issues including overspending on marketing
and advertising, poor investments, business growth which was too rapid, and
INTERNET-BASED BUSINESSES CHAPTER 2
50
high technology costs. (Amazon.com, Inc. 2004; Combe 2006:294;
Krishnamurthy 2003:102, 122-123; Levis 2009:86-91).
The customer base of Amazon.com grew at a remarkable rate. As from
December 1997 to December 2001, the growth rate of new customers was
approximately 1 547%, as the number of new customers increased from 1.5
million to 24.7 million. The growth rate of repeat customers for the period 1998
to 2000 was nearly 22%, as the number of repeat customers increased from
64% to 78%. One of the reasons cited by Bezos for this tremendous growth was
that the customers using the Internet were exclusively early adopters who were
willing to participate in new opportunities. (Amazon.com, Inc. 2004;
Krishnamurthy 2003:104; Levis 2009:91).
Amazon.com‟s sales reached US$16 million in the first quarter of 1997,
although losses amounting to US$3 million were still made. The initial public
offering (IPO) brought in US$54 million in equity, and Amazon.com was then
valued at US$548 million. The business was also in a position to obtain credit to
the value of US$75 million for expansion purposes. The sales increased rapidly
after the IPO, and sales more than doubled to US$148 million at the end of
1997. One of the successful strategies Amazon.com used was to become
customer-centric by providing advice to customers, based on their previous
online purchases. (Levis 2009:95, 98-99). In December 2000, the share price
was US$19.88 (Stone 2000).
A well-known South African online business is Naspers Ltd. Naspers Ltd can be
regarded as an online business as it is a multinational media group with
principal operations in Internet platforms, pay-television services and the
provision of related technologies and print media. Naspers Ltd does not have a
physical store where customers can engage in some form of monetary
transactions. Naspers Ltd has business interests focusing on Internet
operations in China, India, Southern Asia, Russia, Eastern and Western
Europe, the Middle East, Latin America and Africa. The pay-television services
are offered in South Africa by MultiChoice South Africa (MCSA) and to sub-
Saharan Africa by MultiChoice Africa (MCA). Irdeto provides protection
INTERNET-BASED BUSINESSES CHAPTER 2
51
solutions to subscriber platform operators and other providers of digital content.
Naspers Ltd is also responsible, through Media 24, for the publication of
newspapers, magazines and books in Africa, and has print interests in Brazil
and China. (Naspers Fact Sheet 2012). Therefore Naspers Ltd is not only a
brick-and-mortar business, but has extensive operations in the click-
environment as well. The revenue of Naspers Ltd increased by 127.9% from
R19 790m in 2007 to R45 103m in 2011. The headline earnings per share
increased from 965c in 2007 to 1 612c in 2011, which is a 67.0% increase.
(Naspers Integrated Annual Report 2011 2011:5). An overview of Naspers Ltd
is given in Chapter Five.
2.3.3 Internet search engines
Internet search engines include all the online businesses whose primary
function is to find information on the web (Bellis 2011; Krishnamurthy
2003:163). A search engine is an automated mechanism that sorts and
identifies information on the web. The information is sorted according to key
words, where a key word refers to a single word or a short phrase. (Parkin
2008:147-148). Different users use search engines in different ways. One of the
ways people use search engines is to conduct economic transactions. Other
people use search engines to improve online accessibility to their business
websites (Jansen & Mullen 2008:115). Figure 2.5 provides a timeline based on
the year of creation of the different search engines as from 1990.
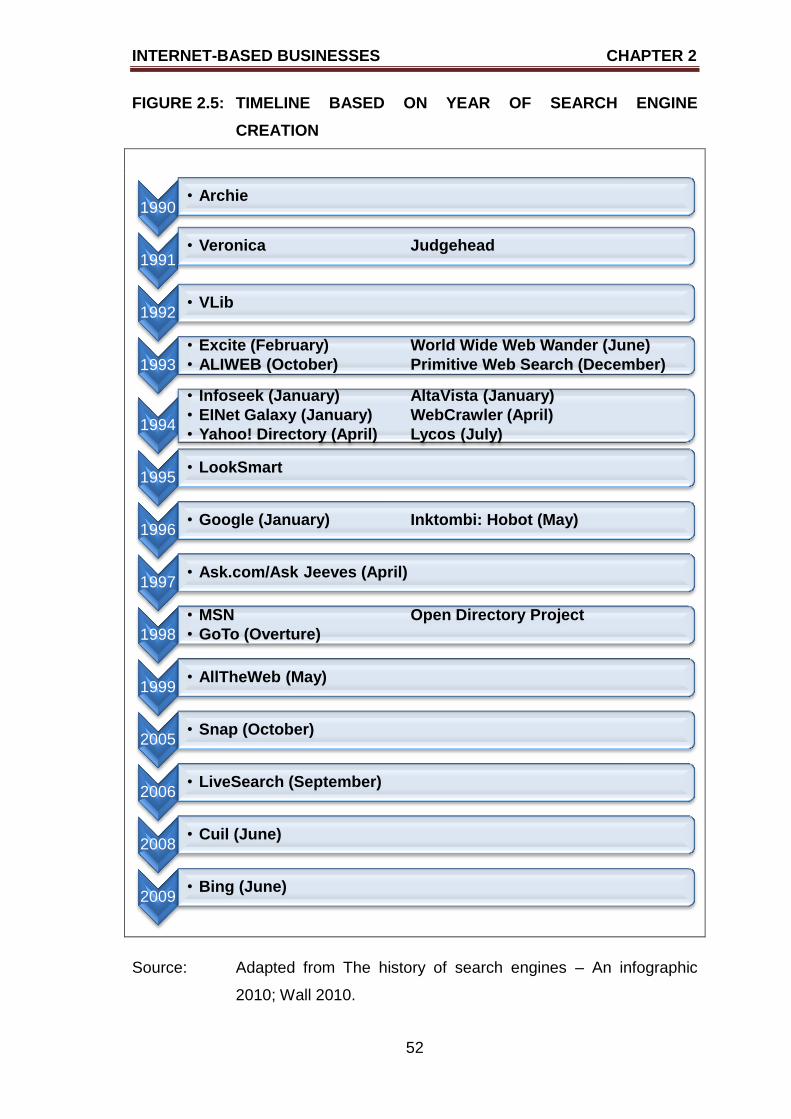
INTERNET-BASED BUSINESSES CHAPTER 2
52
FIGURE 2.5: TIMELINE BASED ON YEAR OF SEARCH ENGINE
CREATION
Source: Adapted from The history of search engines – An infographic
2010; Wall 2010.
1990 • Archie
1991 • Veronica Judgehead
1992 • VLib
1993
• Excite (February) World Wide Web Wander (June)
• ALIWEB (October) Primitive Web Search (December)
1994
• Infoseek (January) AltaVista (January)
• EINet Galaxy (January) WebCrawler (April)
• Yahoo! Directory (April) Lycos (July)
1995 • LookSmart
1996 • Google (January) Inktombi: Hobot (May)
1997 • Ask.com/Ask Jeeves (April)
1998
• MSN Open Directory Project
• GoTo (Overture)
1999 • AllTheWeb (May)
2005 • Snap (October)
2006 • LiveSearch (September)
2008 • Cuil (June)
2009 • Bing (June)
INTERNET-BASED BUSINESSES CHAPTER 2
53
Google is an example of a search engine; it was founded in 1998 by Sergey
Brin and Lawrence Page. Advertising.com was sold to AOL in June 2004, and
because of Advertising.com linkage with Google, the deal was made at US$435
million. (Bellis 2011; Farzad et al. 2005; Google, Inc. 2003; History of search
engines 2011). On 19 August 2004 Google had its first IPO of 22.5 million
shares at US$85 per share, and a price-earnings ratio of 118. The value of the
IPO was determined by using the IPO auction model instead of the Wall Street
book-building method. The original plan was to sell 28.3 million shares at a
price between US$108 and US$135 per share, but it was dropped to a share
price range from US$85 to US$95 after negative publicity in the Playboy
Magazine. The value of Google was US$23 billion. The shares were offered in a
Dutch auction. (Bodie, Kane & Marcus 2008:60; „Enthusiasm for Google‟ 2006;
Ritter 2007; Schneider 2011:3; Wall 2010). On 16 September 2004 a secondary
share offering to the value of US$4.2 billion was announced (Farzad et al.
2005). In January 2004, the search engine Yahoo! acquired AlltheWeb and
AltaVista (Google history 2011; History of search engines 2011).
On 11 January 2006, Google‟s share price was US$475, and it plummeted to
US$343 on 14 February 2006. The share price then increased, and on 24
October 2006 it escalated to US$473.31, which was an 11% increase over a
five-day period. Google was valued at US$145 billion. According to analysts, it
was estimated that the share price could reach US$520 at the end of 2006.
Septet Systems sold advertisements through Google, and the income
generated was divided between the two businesses. In 2006 is was reported
that Google controlled approximately 70% of all the search advertising online,
and between 8% and 12% of online payments were made using Google
Checkout, while 3% to 4% were using eBay‟s PayPal. (Holahan 2006).
YouTube was acquired by Google on 6 October 2006 for US$1.65 billion, and
DoubleClick on 13 April 2007 at a cost of US$3.1 billion (Shifrin 2006; Wall
2010).
In 2008, Google had a search-query share of 60% in the USA, followed by
Yahoo! with 23% and MSN Live with 10%. In the UK, the picture was very
different as Google had a search-query share of 90%. In China, Google was not
INTERNET-BASED BUSINESSES CHAPTER 2
54
so popular, as Baidu was dominating the search-query market (Parkin
2008:147-148). On 25 June 2009 all the major search engines crashed; the
reason for this crash was an overload of searches on that day (History of search
engines 2011).
During August 2010, Google acquired Like.com, which is an online shopping
site where customers can buy clothing accessories. Other transactions took
place when Google bought the social media website Slide for US$182 million
and Jambool (purchase price not known). (Hall 2010b:22-23). Google also
acquired BeatThatQuote.com for £37.7 million (Ashford 2011a).
With the entrance of the various social networks, Google devised a different
strategy to encourage the employees to increase income. The employees were
informed that 25% of their annual bonuses were at stake if the required
performance was not achieved. (Ingram 2011).
The largest search engine in Russia, Yandex, offered 52.17 million shares in its
IPO on NASDAQ on 20 May 2011. The share price range was from US$20 –
US$22, thus the offering was approximately US$1.1 billion. The market
capitalisation of Yandex would be US$6.7 billion. Yandex‟s revenue for the first
quarter of 2011 was US$137 million, which was 65% higher than for the same
period in 2010. (Geron 2011a).
2.3.4 Internet social networks
Internet social networks are the online social interaction amongst individuals
using information technology. People using these social networks communicate
with other people they know or do not know. Experiences and opinions
regarding a wide array of aspects are shared with other people. The greater the
trust amongst people, the more detailed will be the information shared. The
value of social networks is therefore embedded in the trust that individuals place
in the social network in terms of privacy and in the reputation of the social
network without face-to-face contact. (Adali, Escriva, Goldberg, Hayvanonych,
Magdon-Ismail, Szymanski, Wallace & Williams 2008:1; Bhuiyan, Jøsang & Xu
2010:207-211; Boyd & Ellison 2008:211; Clemons 2009:46; Wirtz, Schilke &
INTERNET-BASED BUSINESSES CHAPTER 2
55
Ulrich 2010:276). Social networks are defined by different authors (see Beer
2008:517-519; Boyd and Ellison 2008:211) in different ways.
Social networks can be used in the corporate environment to gauge customers‟
opinions that can be used to improve customer relationships (Ellison, Lampe &
Steinfield 2009:6-9; History of social networking websites 2011). According to
Gneiser, Heidemann, Klier, Landherr and Probst (2010:1) and Joinson (2008),
the use of online social networks has not only increased tremendously in the
public sphere, but also in the corporate environment. Furthermore, Wirtz et al.
(2010:281) state that social networks are not a “fun tool” any more, but have
changed into a medium that professionals can use to interact and establish new
contacts. Boyd and Ellison (2008:212) highlight the following social networking
developments:
Facebook was developed in 2004 for use at Harvard University. In 2005
the high school networks were launched and during the beginning of
2006 the corporate networks were implemented. Facebook was opened
to everyone during the latter half of 2006.
BlackPlanet was originally started in 1999 but relaunched in 2005.
CyWorld was launched in China in 2006 and in the US in 2006.
If businesses use social networks to conduct business, it is possible to increase
income generation, which will have a positive influence on the valuation of such
businesses (Goyal 2011). Various social networks exist, and include Six
Degrees, Frienster, MySpace, LinkedIn, Facebook, YouTube and Twitter.
Twitter is a free online social network enabling individuals to communicate with
other individuals. This communication is known as a tweet. (Adali et al. 2008:5).
Figure 2.6 provides a timeline of the various social networks based on their year
of creation.
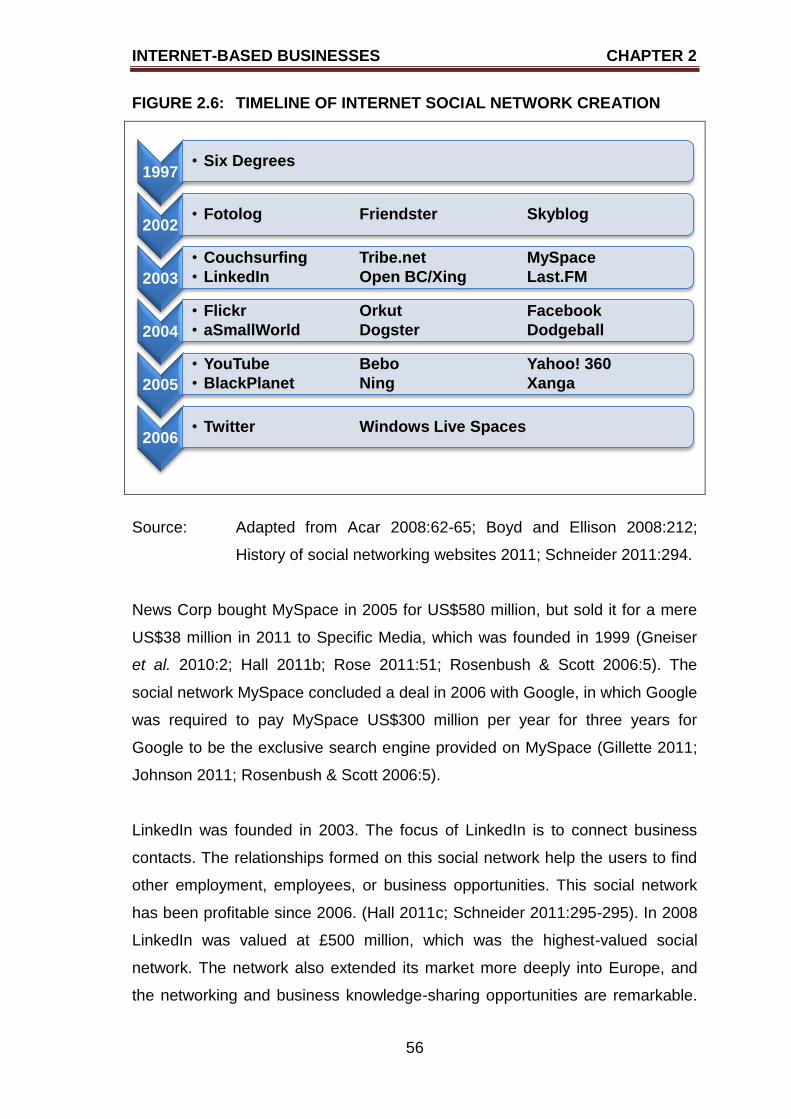
INTERNET-BASED BUSINESSES CHAPTER 2
56
FIGURE 2.6: TIMELINE OF INTERNET SOCIAL NETWORK CREATION
Source: Adapted from Acar 2008:62-65; Boyd and Ellison 2008:212;
History of social networking websites 2011; Schneider 2011:294.
News Corp bought MySpace in 2005 for US$580 million, but sold it for a mere
US$38 million in 2011 to Specific Media, which was founded in 1999 (Gneiser
et al. 2010:2; Hall 2011b; Rose 2011:51; Rosenbush & Scott 2006:5). The
social network MySpace concluded a deal in 2006 with Google, in which Google
was required to pay MySpace US$300 million per year for three years for
Google to be the exclusive search engine provided on MySpace (Gillette 2011;
Johnson 2011; Rosenbush & Scott 2006:5).
LinkedIn was founded in 2003. The focus of LinkedIn is to connect business
contacts. The relationships formed on this social network help the users to find
other employment, employees, or business opportunities. This social network
has been profitable since 2006. (Hall 2011c; Schneider 2011:295-295). In 2008
LinkedIn was valued at £500 million, which was the highest-valued social
network. The network also extended its market more deeply into Europe, and
the networking and business knowledge-sharing opportunities are remarkable.
1997 • Six Degrees
2002 • Fotolog Friendster Skyblog
2003
• Couchsurfing Tribe.net MySpace
• LinkedIn Open BC/Xing Last.FM
2004
• Flickr Orkut Facebook
• aSmallWorld Dogster Dodgeball
2005
• YouTube Bebo Yahoo! 360
• BlackPlanet Ning Xanga
2006 • Twitter Windows Live Spaces
INTERNET-BASED BUSINESSES CHAPTER 2
57
(Savvas 2008). LinkedIn raised US$353 million with the first IPO. LinkedIn
indicated that an IPO is planned to raise US$175 million after they acquire
CardMunch, a business specialising in supplies technology for scanning and
transcribing business cards (Ashford 2011b). The expected share prices were
between US$32 and US$35, but the market opened at US$83 (Savitz 2011). In
2008, LinkedIn was ranked 193rd in the world, based on the amount of traffic
attracted to the site. In LinkedIn‟s case, on average 500 million pages of view
per month were obtained. (Papacharissi 2009:200).
Renren, one of China‟s social networks, raised US$743 with their first IPO in
May 2011. The share price was between US$12 and US$14. The underwriters
of the IPOs estimated that the value of Renren was 67 times sales, while
Facebook was valued at 25 times sales. A noteworthy comment made by the
founder of IPOScoop.com was that high technology deals such as LinkedIn and
Renren IPOs could price the shares above market value. (Geron 2011a,
2011b). The share price of Renren increased by 29% during the first few
months of 2011 (Miller 2011).
Another concern raised by analysts in the technology industry is the
development of a second technology bubble, especially after LinkedIn was
valued at US$10 billion in May 2011 and the share price reached a level of
US$120 per share. The Financial Times Deutschland also questioned the
valuation of Facebook in 2008, then valued at US$15 billion. One of the main
reasons given for this concern was that revenue models for online businesses
are not clear-cut as in the case of brick-and-mortar or brick-and-click
businesses. (Gneiser, Heidemann, Klier & Weib 2009; Hall 2011d).
Facebook was created by Zuckerberg in 2004, but the Winklevoss twin brothers
claimed that their idea of Facebook was stolen by Zuckerberg. In 2004 the court
ruled that Zuckerberg was to pay the Winklevoss brothers a settlement of
US$65 million as US$20 million cash and shares in Facebook to the value of
US$45 million. During 2008 the two brothers filed a claim that the shares were
overvalued when the negotiations were originally concluded. In June 2011 all
INTERNET-BASED BUSINESSES CHAPTER 2
58
claims against Zuckerberg were dropped, and a release to all claims was
signed by the two brothers. (Ashford 2011c; Helft 2011).
Microsoft obtained a minority interest of 1.6% in Facebook at a cost of US$240
million. The market value of Facebook in 2007 was US$10 billion, and Microsoft
was seeking to obtain a 5% stake in Facebook at a cost of US$500 million. In
2008, serious questions were raised in terms of the valuation of Internet-based
businesses, especially when Facebook was valued at US$15 billion. Facebook
generated income to the value of US$280 million, but the business did not
break even. (Gneiser et al. 2010:2; Hempel 2009:2; Holahan, Hof & Ante
2007:4; McGirt 2007:129). From July 2009 to November 2009, the share price
of Facebook increased by 42%, with share capital estimated at around US$9.5
billion. In 2010, Facebook was valued at US$33.7 billion, and based on the
price private investors were willing to sell, one share was valued at US$76.
(Williams 2010).
In May 2011 it was announced that Facebook would acquire Snaptu, which is a
social networking site for non-smartphone users. The value of this transaction
was estimated to be between US$60 million and US$70 million. Prior to this
acquisition, Facebook also bought Beluga (messaging service company),
ReI8tion (advertising group) and Pursuit (recruiting network). (Hall 2011e).
Google launched a Google+ button, which is similar to the “like” button of
Facebook, and wanted to compete against Facebook in the social media
industry (Hall 2011f).
The value of Facebook in January 2011 was estimated to be US$50 billion and
that of the founder, Mark Zuckerberg, to be US$12 billion. The 2012 IPO is
expected to be more than twice as much as Google‟s IPO in 2004. (Rose
2011:51; Williams 2011). The IPO is rumoured to value Facebook at US$100
billion. Since Facebook will have more than 500 investors, the financial
accounts need to be made public after the 2012 IPO. (Hall 2011g).
INTERNET-BASED BUSINESSES CHAPTER 2
59
To conclude the discussion on social networks, the question is whether to invest
in social media businesses. According to Hall (2011h), there are seven aspects
that need to be considered before investing in social network businesses:
Investors drive up the share price.
Consider the timing of the IPO.
The law of a country may require the business to go public.
Evaluate the business model implemented.
Determine the value of the business to current investors.
Investigate opportunities that may appear when the business moves
through the business life cycle.
Compare the risks and returns of the IPO timing.
2.3.5 Other types of Internet-based businesses
Many Internet-based businesses organise and manage online auctions where
sellers can trade their products to the buyer with the highest bid offer. An online
auction is similar to a traditional auction with the one exception that the sellers
and the potential buyers are not physically present at a specific auction site.
Advantages of online auctions include the broadening of the online audience
(global sellers and buyers) and the ease with which a specific auction can be
found online, using search engines. Examples of online auctions are eBay,
Amazon.com Auctions, Yahoo! Auctions and Onlineauctions.com.
(Krishnamurthy 2003:89; Strauss & Frost 2009:251).
eBay was created by Pierre Omudyar to act as an intermediary to allow sellers
and buyers of products to interact with the purpose of trading. According to
Krishnamurthy (2003:136), eBay can be regarded as a massive classified
advertisement page where buyers can find products they would like to buy.
eBay is an auction house because buyers bid on available products, and the
highest bidder at the close of the bid period will win the bid. The main income
stream for eBay is a listing fee and a sliding percentage of the final selling price
(Schneider 2011:309). One advantage of eBay is that the seller of products will
INTERNET-BASED BUSINESSES CHAPTER 2
60
incur the shipping cost to the buyer. Various services are offered by eBay
(Krishnamurthy 2003:137-138):
Billpoint is an online bill payment service to ensure the seller receives
payment for products sold on eBay Auctions.
Half.com sells pre-owned products at fixed-prices.
eBay International trades in countries outside the USA to overcome legal
and financial barriers.
eBay Motors sells vehicles, motorcycles and auto parts. Other services
are also provided, such as financing, inspections, insurance, vehicle
shipping, and title and registration of vehicle to the new owner.
eBay Stores allows sellers to create customised shopping destinations,
and buyers can purchase products at a fixed price or at an auction.
eBay Professional Services provides information on professionals and
freelancers in various fields such as web design, accounting and
technical support.
eBay Local Trading assists trading within the USA in specific regions,
which leads to lower shipping costs associated with delivery of products.
eBay Premier is a speciality site focusing on collectors‟ items ranging
from fine arts and antiques to fine wines and rare collectibles.
eBay Live Auctions provides access for customers to leading auction
houses in the world.
Amazon.com introduced Amazon.com Auctions on 30 March 1999, to be in
direct competition with eBay. At the same time, Sharper Image started
auctioning new and existing merchandise (1 March), Cyberian Outpost started
trading online (16 March), eBay made a deal with American Online (AOL) (25
March) to the value of US$75 million to promote eBay auctions, and
PriceLine.com went public (30 March). (Krishnamurthy 2003:118).
A web log, better known as a blog, is a personal website of an individual. Parkin
(2008:121) and Strauss and Frost (2009:8) describe a blog as an electronic
public journal where an individual can publish information and other interested
INTERNET-BASED BUSINESSES CHAPTER 2
61
parties can then make comments on the blog regarding the information
provided on the blog. Schneider (2011:296) defines a blog as a website
containing commentary on current events or specific issues as provided by
various individuals.
A new addition to e-business is social apponomics. Although not much is written
about the new phenomenon, the purpose of social apponomics is to change
online traffic to customer lifecycle management. (Anderson, Harter, Hagen &
Plenge 2011).
2.4 HISTORY OF INTERNET-BASED BUSINESS
The majority of businesses start as brick-and-mortar businesses, meaning that
customers need to present themselves at the physical business premises for a
commercial transaction to take place. A further development was the creation of
brick-and-click businesses (Combe 2006:5, 54). According to Turban et al.
(2006:90), brick-and-click businesses use a website as a trading platform in
conjunction with the physical store. Therefore these businesses offer their
customers a choice of concluding a commercial transaction at the physical
business premises, or concluding a commercial transaction via the Internet on
the web site of the business.
Another type of Internet-based business which was addressed in section 2.3 is
that of online business. Although online businesses have physical business
premises, these premises are merely an administrative office of the business,
not a physical location where customers can interact with the business‟s sales
team. Therefore all interactions between the online business and the customer
are facilitated by using the Internet. (Botha et al. 2008:280; McKay & Marshall
2004:10; Turban et al. 2006:5).
Table 2.1 summarises the history of the Internet and the adoption of e-business
by businesses and individuals. The history of the Internet is important because
e-business would not be able to exist without the Internet.
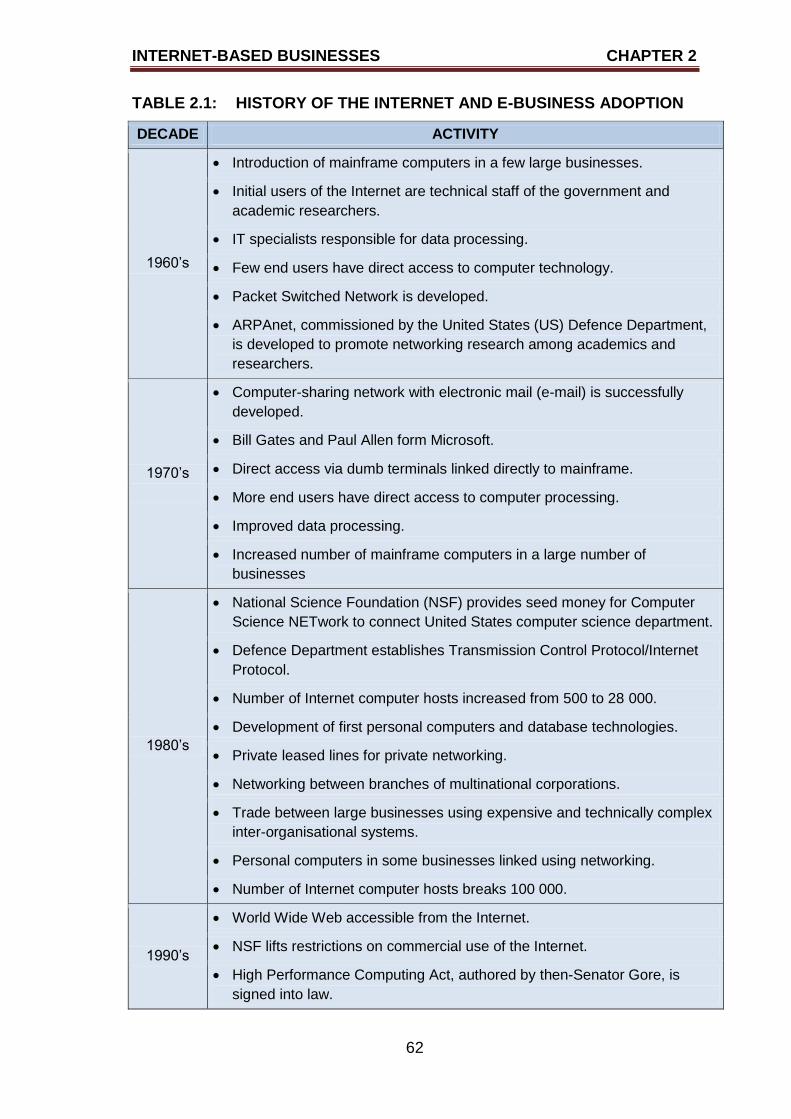
INTERNET-BASED BUSINESSES CHAPTER 2
62
TABLE 2.1: HISTORY OF THE INTERNET AND E-BUSINESS ADOPTION
DECADE ACTIVITY
1960‟s
Introduction of mainframe computers in a few large businesses.
Initial users of the Internet are technical staff of the government and
academic researchers.
IT specialists responsible for data processing.
Few end users have direct access to computer technology.
Packet Switched Network is developed.
ARPAnet, commissioned by the United States (US) Defence Department,
is developed to promote networking research among academics and
researchers.
1970‟s
Computer-sharing network with electronic mail (e-mail) is successfully
developed.
Bill Gates and Paul Allen form Microsoft.
Direct access via dumb terminals linked directly to mainframe.
More end users have direct access to computer processing.
Improved data processing.
Increased number of mainframe computers in a large number of
businesses
1980‟s
National Science Foundation (NSF) provides seed money for Computer
Science NETwork to connect United States computer science department.
Defence Department establishes Transmission Control Protocol/Internet
Protocol.
Number of Internet computer hosts increased from 500 to 28 000.
Development of first personal computers and database technologies.
Private leased lines for private networking.
Networking between branches of multinational corporations.
Trade between large businesses using expensive and technically complex
inter-organisational systems.
Personal computers in some businesses linked using networking.
Number of Internet computer hosts breaks 100 000.
1990‟s
World Wide Web accessible from the Internet.
NSF lifts restrictions on commercial use of the Internet.
High Performance Computing Act, authored by then-Senator Gore, is
signed into law.
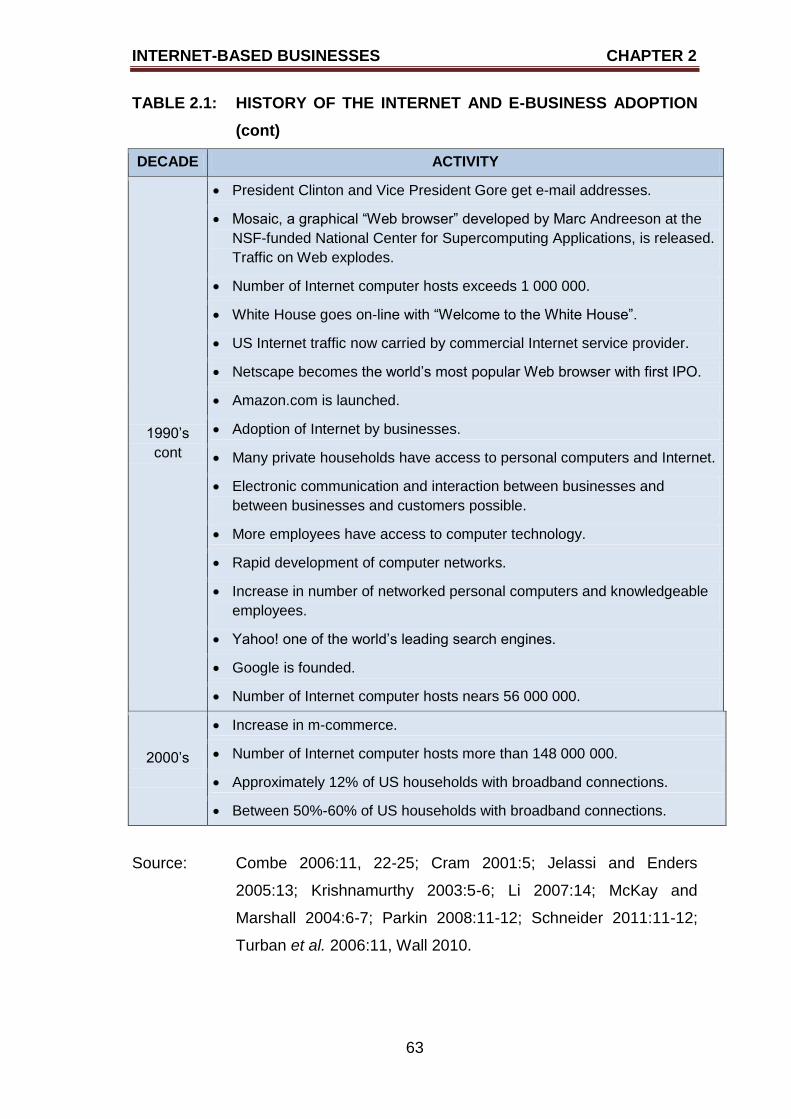
INTERNET-BASED BUSINESSES CHAPTER 2
63
TABLE 2.1: HISTORY OF THE INTERNET AND E-BUSINESS ADOPTION
(cont)
DECADE ACTIVITY
1990‟s
cont
President Clinton and Vice President Gore get e-mail addresses.
Mosaic, a graphical “Web browser” developed by Marc Andreeson at the
NSF-funded National Center for Supercomputing Applications, is released.
Traffic on Web explodes.
Number of Internet computer hosts exceeds 1 000 000.
White House goes on-line with “Welcome to the White House”.
US Internet traffic now carried by commercial Internet service provider.
Netscape becomes the world‟s most popular Web browser with first IPO.
Amazon.com is launched.
Adoption of Internet by businesses.
Many private households have access to personal computers and Internet.
Electronic communication and interaction between businesses and
between businesses and customers possible.
More employees have access to computer technology.
Rapid development of computer networks.
Increase in number of networked personal computers and knowledgeable
employees.
Yahoo! one of the world‟s leading search engines.
Google is founded.
Number of Internet computer hosts nears 56 000 000.
2000‟s
Increase in m-commerce.
Number of Internet computer hosts more than 148 000 000.
Approximately 12% of US households with broadband connections.
Between 50%-60% of US households with broadband connections.
Source: Combe 2006:11, 22-25; Cram 2001:5; Jelassi and Enders
2005:13; Krishnamurthy 2003:5-6; Li 2007:14; McKay and
Marshall 2004:6-7; Parkin 2008:11-12; Schneider 2011:11-12;
Turban et al. 2006:11, Wall 2010.
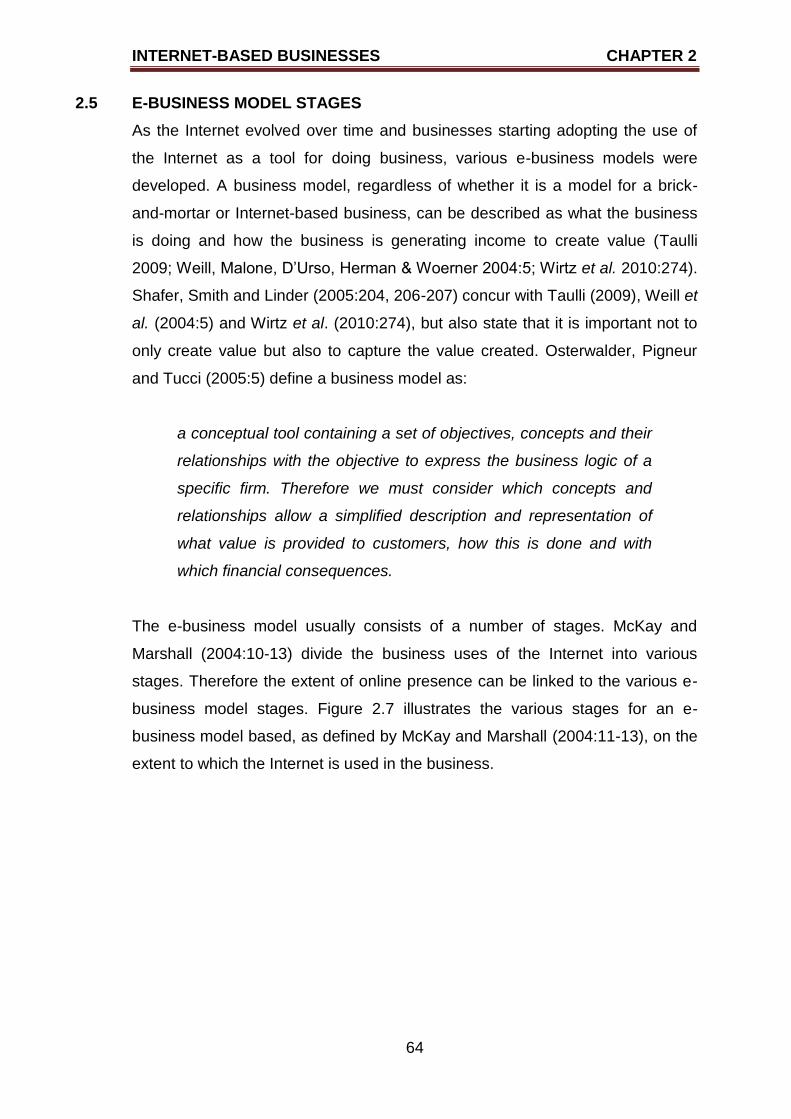
INTERNET-BASED BUSINESSES CHAPTER 2
64
2.5 E-BUSINESS MODEL STAGES
As the Internet evolved over time and businesses starting adopting the use of
the Internet as a tool for doing business, various e-business models were
developed. A business model, regardless of whether it is a model for a brick-
and-mortar or Internet-based business, can be described as what the business
is doing and how the business is generating income to create value (Taulli
2009; Weill, Malone, D‟Urso, Herman & Woerner 2004:5; Wirtz et al. 2010:274).
Shafer, Smith and Linder (2005:204, 206-207) concur with Taulli (2009), Weill et
al. (2004:5) and Wirtz et al. (2010:274), but also state that it is important not to
only create value but also to capture the value created. Osterwalder, Pigneur
and Tucci (2005:5) define a business model as:
a conceptual tool containing a set of objectives, concepts and their
relationships with the objective to express the business logic of a
specific firm. Therefore we must consider which concepts and
relationships allow a simplified description and representation of
what value is provided to customers, how this is done and with
which financial consequences.
The e-business model usually consists of a number of stages. McKay and
Marshall (2004:10-13) divide the business uses of the Internet into various
stages. Therefore the extent of online presence can be linked to the various e-
business model stages. Figure 2.7 illustrates the various stages for an e-
business model based, as defined by McKay and Marshall (2004:11-13), on the
extent to which the Internet is used in the business.
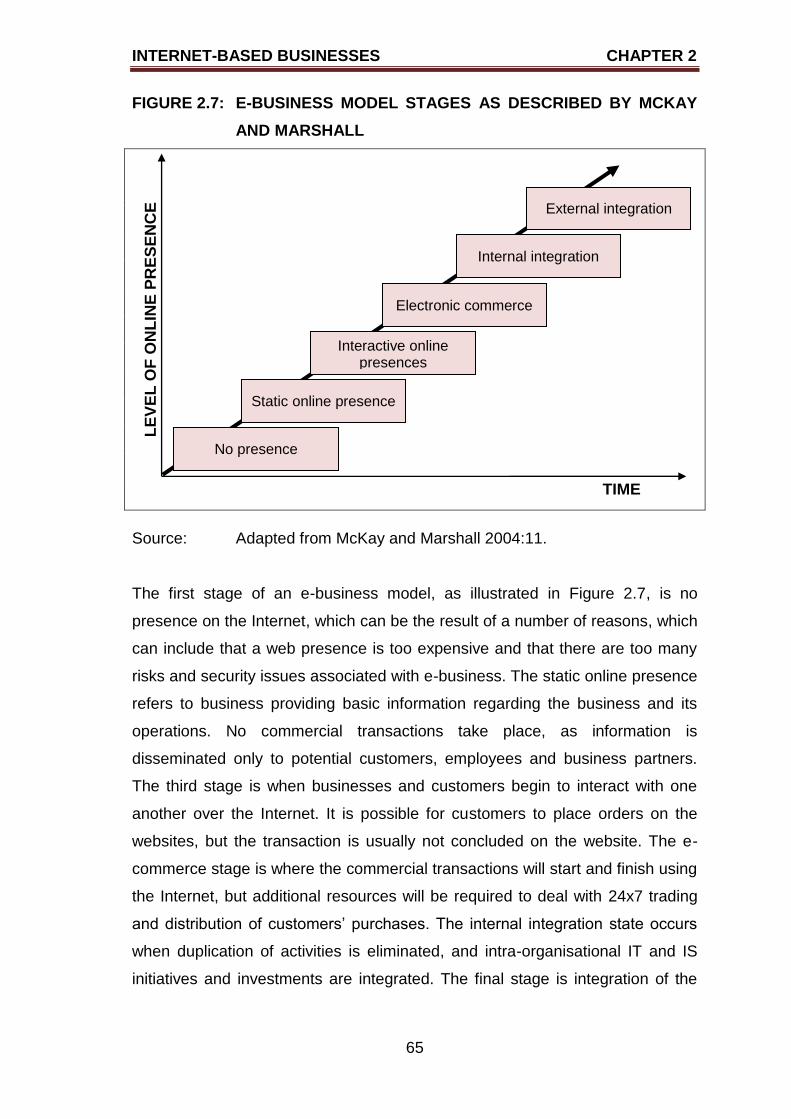
INTERNET-BASED BUSINESSES CHAPTER 2
65
FIGURE 2.7: E-BUSINESS MODEL STAGES AS DESCRIBED BY MCKAY
AND MARSHALL
Source: Adapted from McKay and Marshall 2004:11.
The first stage of an e-business model, as illustrated in Figure 2.7, is no
presence on the Internet, which can be the result of a number of reasons, which
can include that a web presence is too expensive and that there are too many
risks and security issues associated with e-business. The static online presence
refers to business providing basic information regarding the business and its
operations. No commercial transactions take place, as information is
disseminated only to potential customers, employees and business partners.
The third stage is when businesses and customers begin to interact with one
another over the Internet. It is possible for customers to place orders on the
websites, but the transaction is usually not concluded on the website. The e-
commerce stage is where the commercial transactions will start and finish using
the Internet, but additional resources will be required to deal with 24x7 trading
and distribution of customers‟ purchases. The internal integration state occurs
when duplication of activities is eliminated, and intra-organisational IT and IS
initiatives and investments are integrated. The final stage is integration of the
TIME
External integration
No presence
Static online presence
Interactive online presences
Electronic commerce
Internal integration
LE
VE
L O
F O
NL
INE
PR
ES
EN
CE
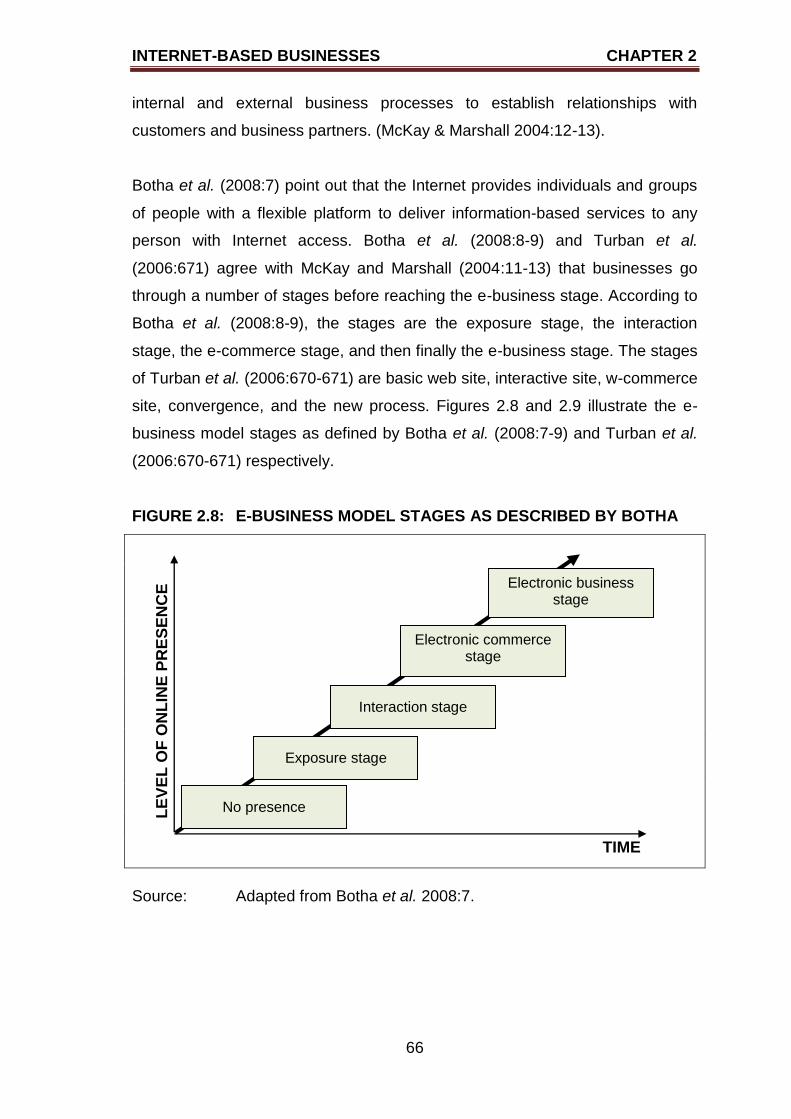
INTERNET-BASED BUSINESSES CHAPTER 2
66
internal and external business processes to establish relationships with
customers and business partners. (McKay & Marshall 2004:12-13).
Botha et al. (2008:7) point out that the Internet provides individuals and groups
of people with a flexible platform to deliver information-based services to any
person with Internet access. Botha et al. (2008:8-9) and Turban et al.
(2006:671) agree with McKay and Marshall (2004:11-13) that businesses go
through a number of stages before reaching the e-business stage. According to
Botha et al. (2008:8-9), the stages are the exposure stage, the interaction
stage, the e-commerce stage, and then finally the e-business stage. The stages
of Turban et al. (2006:670-671) are basic web site, interactive site, w-commerce
site, convergence, and the new process. Figures 2.8 and 2.9 illustrate the e-
business model stages as defined by Botha et al. (2008:7-9) and Turban et al.
(2006:670-671) respectively.
FIGURE 2.8: E-BUSINESS MODEL STAGES AS DESCRIBED BY BOTHA
Source: Adapted from Botha et al. 2008:7.
LE
VE
L O
F O
NL
INE
PR
ES
EN
CE
TIME
No presence
Exposure stage
Interaction stage
Electronic commerce stage
Electronic business stage
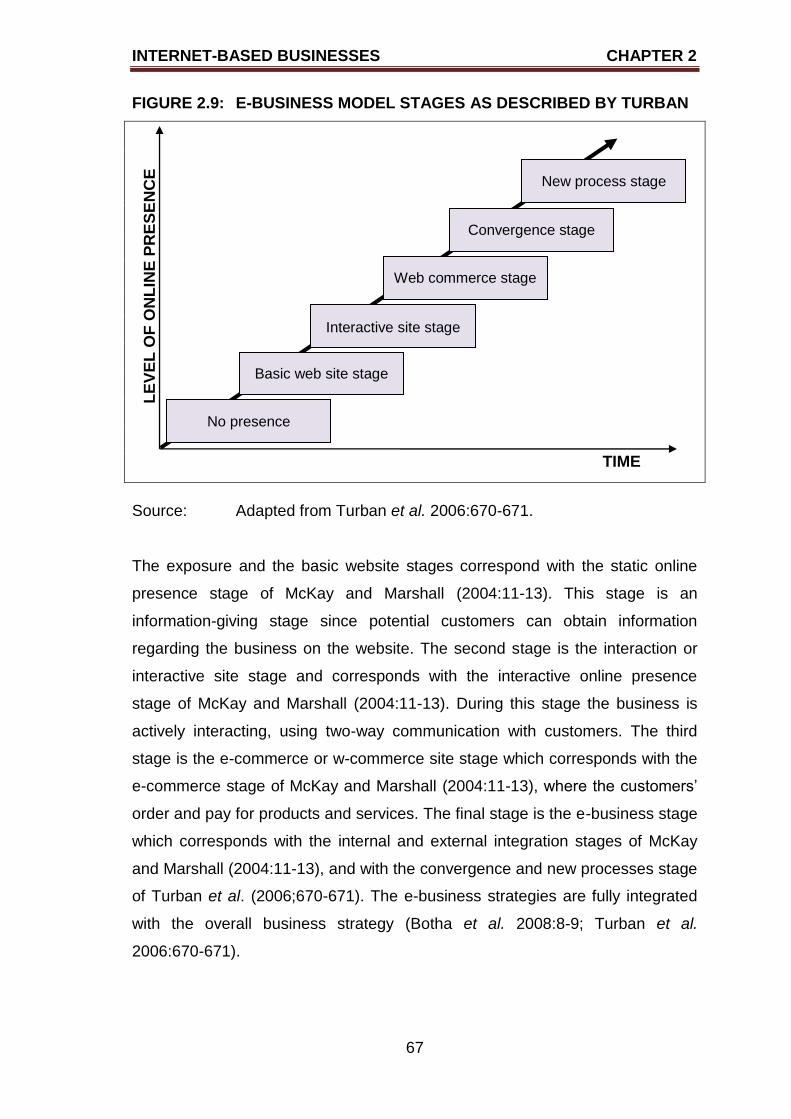
INTERNET-BASED BUSINESSES CHAPTER 2
67
FIGURE 2.9: E-BUSINESS MODEL STAGES AS DESCRIBED BY TURBAN
Source: Adapted from Turban et al. 2006:670-671.
The exposure and the basic website stages correspond with the static online
presence stage of McKay and Marshall (2004:11-13). This stage is an
information-giving stage since potential customers can obtain information
regarding the business on the website. The second stage is the interaction or
interactive site stage and corresponds with the interactive online presence
stage of McKay and Marshall (2004:11-13). During this stage the business is
actively interacting, using two-way communication with customers. The third
stage is the e-commerce or w-commerce site stage which corresponds with the
e-commerce stage of McKay and Marshall (2004:11-13), where the customers‟
order and pay for products and services. The final stage is the e-business stage
which corresponds with the internal and external integration stages of McKay
and Marshall (2004:11-13), and with the convergence and new processes stage
of Turban et al. (2006;670-671). The e-business strategies are fully integrated
with the overall business strategy (Botha et al. 2008:8-9; Turban et al.
2006:670-671).
LE
VE
L O
F O
NL
INE
PR
ES
EN
CE
TIME
New process stage
No presence
Basic web site stage
Interactive site stage
Web commerce stage
Convergence stage
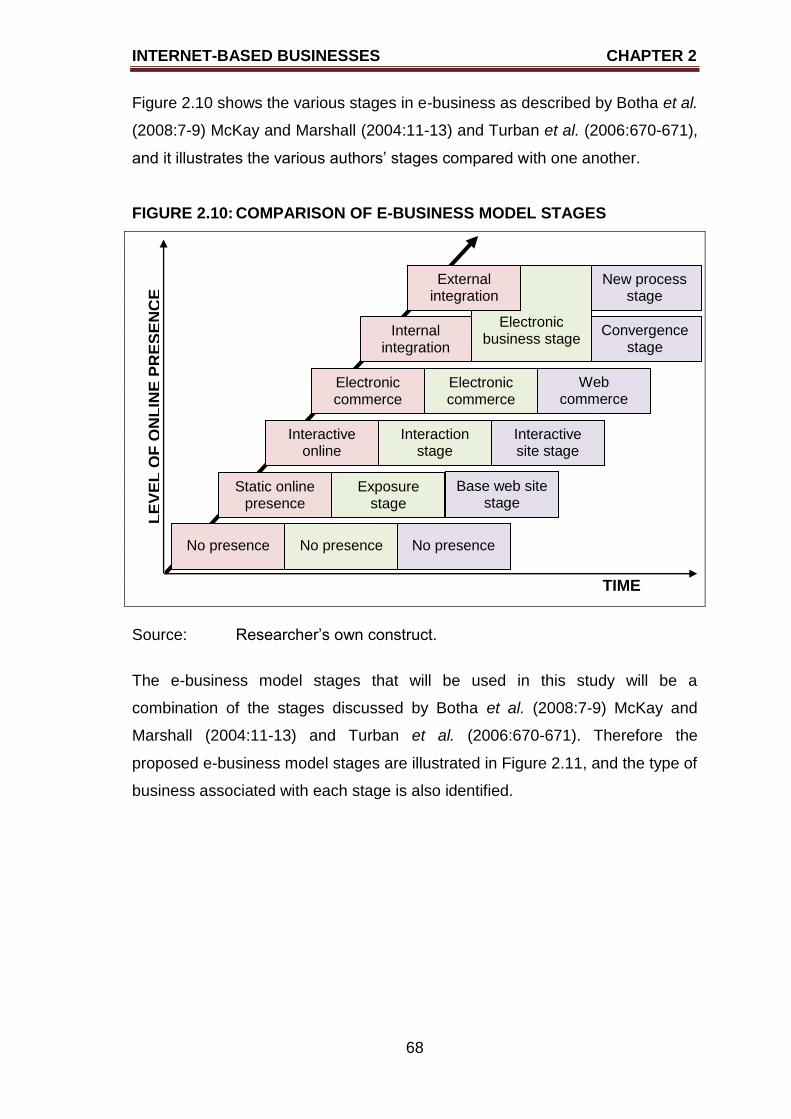
INTERNET-BASED BUSINESSES CHAPTER 2
68
Figure 2.10 shows the various stages in e-business as described by Botha et al.
(2008:7-9) McKay and Marshall (2004:11-13) and Turban et al. (2006:670-671),
and it illustrates the various authors‟ stages compared with one another.
FIGURE 2.10: COMPARISON OF E-BUSINESS MODEL STAGES
Source: Researcher‟s own construct.
The e-business model stages that will be used in this study will be a
combination of the stages discussed by Botha et al. (2008:7-9) McKay and
Marshall (2004:11-13) and Turban et al. (2006:670-671). Therefore the
proposed e-business model stages are illustrated in Figure 2.11, and the type of
business associated with each stage is also identified.
LE
VE
L O
F O
NL
INE
PR
ES
EN
CE
TIME
New process stage
No presence
Static online presence
Interactive online
presence
Electronic commerce
stage
Convergence stage
Exposure stage
Base web site stage
Electronic business stage
External integration
Interactive site stage
Interaction stage
Web commerce
stage
Electronic commerce
Internal integration
No presence
No presence
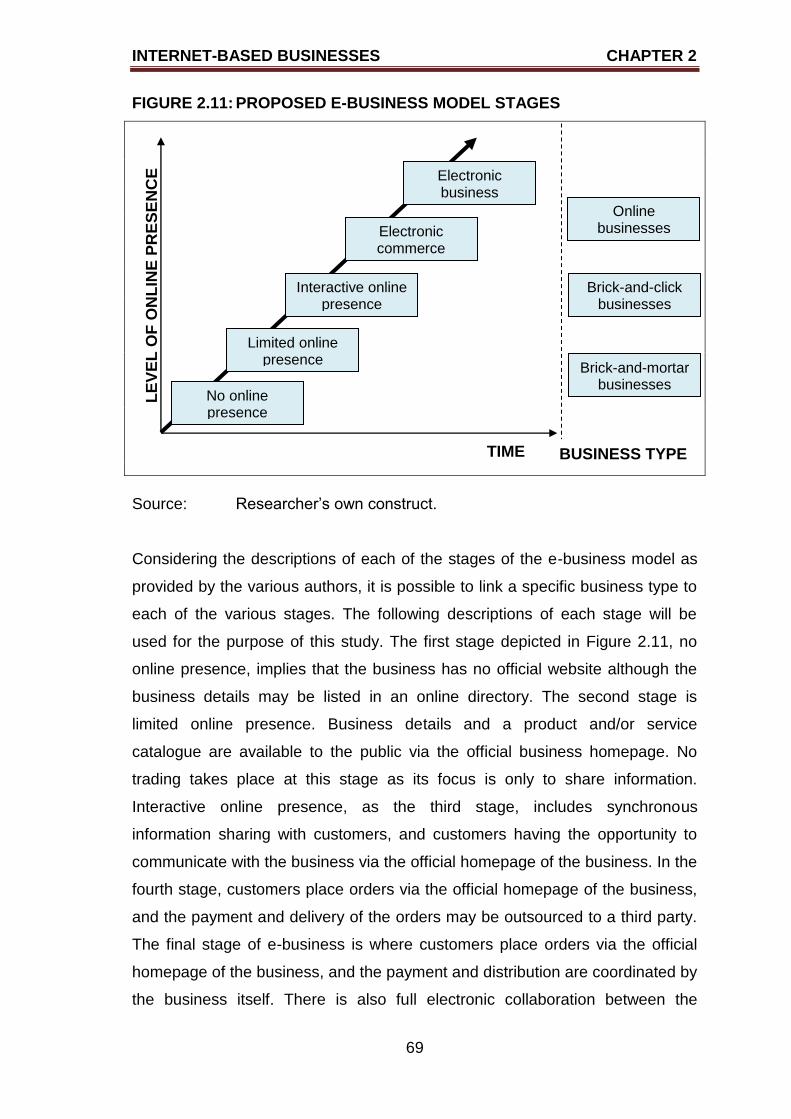
INTERNET-BASED BUSINESSES CHAPTER 2
69
FIGURE 2.11: PROPOSED E-BUSINESS MODEL STAGES
Source: Researcher‟s own construct.
Considering the descriptions of each of the stages of the e-business model as
provided by the various authors, it is possible to link a specific business type to
each of the various stages. The following descriptions of each stage will be
used for the purpose of this study. The first stage depicted in Figure 2.11, no
online presence, implies that the business has no official website although the
business details may be listed in an online directory. The second stage is
limited online presence. Business details and a product and/or service
catalogue are available to the public via the official business homepage. No
trading takes place at this stage as its focus is only to share information.
Interactive online presence, as the third stage, includes synchronous
information sharing with customers, and customers having the opportunity to
communicate with the business via the official homepage of the business. In the
fourth stage, customers place orders via the official homepage of the business,
and the payment and delivery of the orders may be outsourced to a third party.
The final stage of e-business is where customers place orders via the official
homepage of the business, and the payment and distribution are coordinated by
the business itself. There is also full electronic collaboration between the
LE
VE
L O
F O
NL
INE
PR
ES
EN
CE
TIME
No online presence
Limited online presence
Interactive online presence
Electronic commerce
Electronic business
Brick-and-mortar businesses
Online businesses
Brick-and-click businesses
BUSINESS TYPE
INTERNET-BASED BUSINESSES CHAPTER 2
70
customer and the business, and between the business itself and the business
partners.
It is important that each stage of the e-business model comprises certain
elements, regardless of the stage of e-business adoption. Teece (2010:43)
describes the combination of these elements as the organisational and financial
architecture of a business. The six elements that need to be incorporated into
each stage, with the focus to create customer value, attract payments and
transform payments to profits, are:
the selection of technologies and features that needs to be embedded in
the product and/or service;
the determination of the benefits the customer will receive when
consuming or using the product and/or service;
the identification of the market segments to be targeted;
the confirmation of the availability of the income streams; and
the designing of the mechanisms to capture the value created by each
target market. (Teece 2010:173).
Taulli (2009) concurs with Teece (2010) regarding the identified e-business
elements, but adds that it is important to ensure a differentiation strategy to
make the e-business unique and to ensure adequate and realistic pricing.
Zhu and Kraemer (2005:61) are of the opinion that there is scepticism regarding
the value of e-business and information technology, especially if one considers
the high initial costs that are incurred when implementing an e-business
strategy. These authors argue that it is imperative to determine whether e-
business strategies contribute to the value of businesses.
Lee et al. (2002:15-16) explain that the extraordinary growth rates of the share
prices and market capitalisation of online businesses resulted in astoundingly
high business valuations. Therefore the brick-and-mortar businesses
implemented e-business strategies and transformed into brick-and-click
INTERNET-BASED BUSINESSES CHAPTER 2
71
businesses, to see whether these businesses could capitalise on the high
growth rates experienced by the online businesses. The purpose of the Lee et
al. (2002:15-35) study was to determine whether brick-and-mortar, brick-and-
click and online businesses (e-tailers) experienced differences in revenue and
income over a three-year period (1999 – 2001) that was linked to four e-
business stages. The findings showed that online businesses in the late
exploration stage had positive revenue but negative income impacts on their
business value. In the break-even stage, online businesses had positive
revenue and insignificant income impacts on their business value, while in the
growth stage, both positive revenue and income impacts on the business value
occurred. Regarding the brick-and-mortar and brick-and-click businesses, it was
found that the driving factor of business value in 2000 was income, and in 2001
it was both revenue and income. It was also found that click-and-brick
businesses outperformed brick-and-mortar business in terms of revenue,
income, income/revenue, share prices, and market capitalisation. Furthermore,
the revenue effect in 2001 was significantly higher for brick-and-click
businesses than for brick-and-mortar businesses. (Lee et al. 2002:15-35).
According to Zhu and Kraemer (2005:62), most of the studies which focus on e-
business address the issue of whether an e-business strategy should be
adopted. Another issue identified by these authors is that there is a lack of
evidence showing the usage and impact of performance of a business that has
implemented an e-business strategy. It is also important to take note of the
different economic and regulatory environments in which the businesses
operate, because developed and developing countries may have different
regulations to adhere to (Zhu & Kraemer 2005:62). The present study will focus
on the gap identified by Zhu and Kraemer (2005:62) by quantifying businesses‟
valuations at different e-business model stages, in order to determine the value
creation benefit of e-business strategies.
2.6 IMPORTANCE OF INTERNET-BASED BUSINESSES
According to McKay and Marshall (2004:13) and Pitta and Fowler (2005a:290;
2005b:266), the benefits businesses, whether brick-and-click or online, can
achieve by using the Internet, include:
INTERNET-BASED BUSINESSES CHAPTER 2
72
increased income by selling directly to the customer over the Internet;
growth in market share by entering into new markets nationally and
globally;
increased customer retention when the Internet is used to add value to
the products and services sold; and
reduced costs by completing activities more efficiently when using
appropriate Internet technologies.
Bosch et al. (2011:565-566), Botha et al. (2008:5) and Papazoglou and Ribbers
(2006:1, 12-14) concur that the use of the Internet can lead to major cost
savings, increased business efficiency, better time management of businesses,
improved customer service and more extensive customer reach. Enhanced
customer service and therefore improved customer relations can be expected
as an end result, since one-on-one relationships with individual customers are
possible at a low cost to the business. Léger (2010:406) suggests that the
intangible assets, such as the relationships with suppliers, also influence the
value of a business. It is therefore important to value the use of the Internet in
the form of an e-business strategy.
Research by Schramm-Klein, Wagner, Steinmann and Morschett (2011:509)
emphasises that multichannel systems (traditional and online outlets) of
retailers have a positive impact on customer loyalty and trust, as well as on the
image of the retailer. If the multichannel retailing is fully integrated, then long-
term customer profitability is possible. The customers will also be more willing to
use all the channels (traditional and online outlets) for purchases because
loyalty and trust are established between the customer and the e-business
retailer. Jackson (2008:53) and Kennedy and Coughlan (2006:524, 526) concur
with Schramm-Klein et al. (2011:509) that both the customer and the e-business
retailer can benefit from multichannel retailing.
According to Zhu and Kraemer (2005:65), the unique characteristics of the
Internet create the opportunity for retail businesses to improve business
financial performance, which has a potential to increase businesses values.
These authors stress the fact that only those retail businesses that use e-
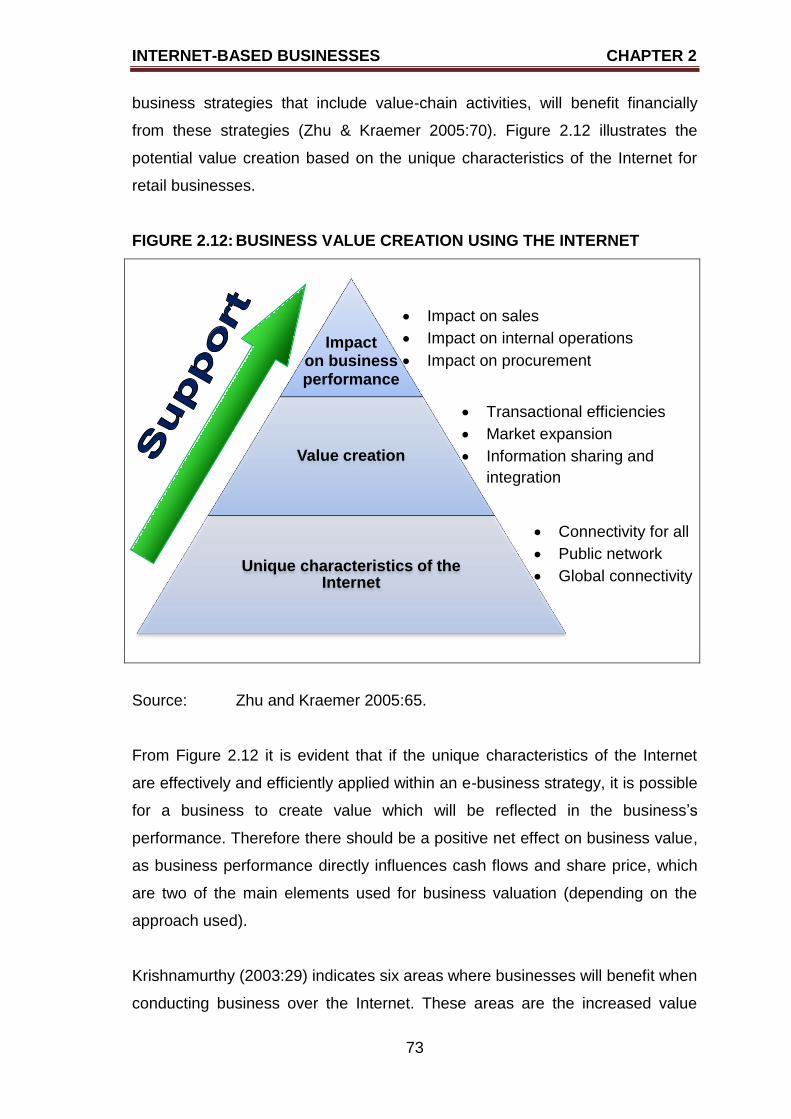
INTERNET-BASED BUSINESSES CHAPTER 2
73
business strategies that include value-chain activities, will benefit financially
from these strategies (Zhu & Kraemer 2005:70). Figure 2.12 illustrates the
potential value creation based on the unique characteristics of the Internet for
retail businesses.
FIGURE 2.12: BUSINESS VALUE CREATION USING THE INTERNET
Source: Zhu and Kraemer 2005:65.
From Figure 2.12 it is evident that if the unique characteristics of the Internet
are effectively and efficiently applied within an e-business strategy, it is possible
for a business to create value which will be reflected in the business‟s
performance. Therefore there should be a positive net effect on business value,
as business performance directly influences cash flows and share price, which
are two of the main elements used for business valuation (depending on the
approach used).
Krishnamurthy (2003:29) indicates six areas where businesses will benefit when
conducting business over the Internet. These areas are the increased value
Impact on business performance
Value creation
Unique characteristics of the Internet
Connectivity for all
Public network
Global connectivity
Impact on sales
Impact on internal operations
Impact on procurement
Transactional efficiencies
Market expansion
Information sharing and
integration
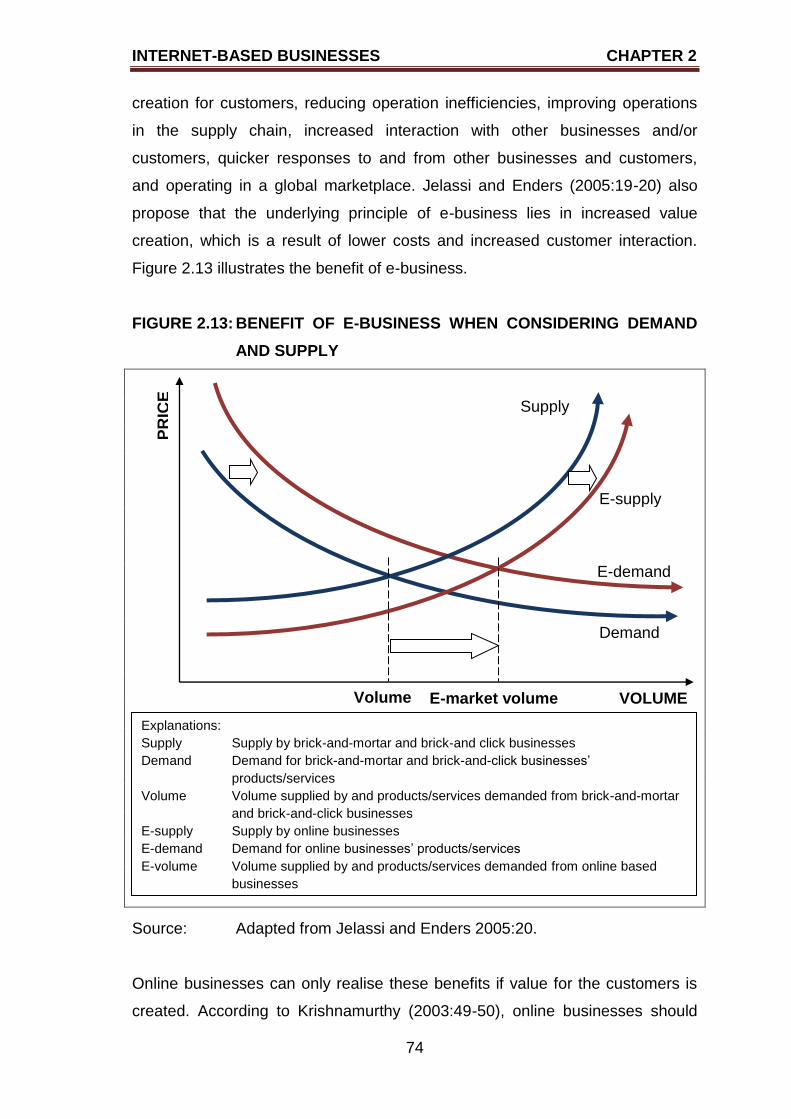
INTERNET-BASED BUSINESSES CHAPTER 2
74
creation for customers, reducing operation inefficiencies, improving operations
in the supply chain, increased interaction with other businesses and/or
customers, quicker responses to and from other businesses and customers,
and operating in a global marketplace. Jelassi and Enders (2005:19-20) also
propose that the underlying principle of e-business lies in increased value
creation, which is a result of lower costs and increased customer interaction.
Figure 2.13 illustrates the benefit of e-business.
FIGURE 2.13: BENEFIT OF E-BUSINESS WHEN CONSIDERING DEMAND
AND SUPPLY
Source: Adapted from Jelassi and Enders 2005:20.
Online businesses can only realise these benefits if value for the customers is
created. According to Krishnamurthy (2003:49-50), online businesses should
VOLUME
E-supply
PR
ICE
Volume E-market volume
Demand
E-demand
Supply
Explanations:
Supply Supply by brick-and-mortar and brick-and click businesses
Demand Demand for brick-and-mortar and brick-and-click businesses‟
products/services
Volume Volume supplied by and products/services demanded from brick-and-mortar
and brick-and-click businesses
E-supply Supply by online businesses
E-demand Demand for online businesses‟ products/services
E-volume Volume supplied by and products/services demanded from online based
businesses
INTERNET-BASED BUSINESSES CHAPTER 2
75
use the six C‟s to create value. The first C is Commerce, which will help the
Internet-based business to generate income. It is important that the traditional
marketing mix (product, price, promotion and place) should still be applied.
Communication, as the second C, is vital in developing a relationship between
the Internet-based business and the customer. Communication technologies
such as electronic mail (e-mail), discussion boards and instant messaging can
be implemented to enhance the customer relationship. Thirdly, Connectivity will
help the online business to reach potential and existing customers in locations
which are usually not accessible. Connectivity will also assist customers to
communicate with other customers and employees of the online business. The
online business should be aware of the value elements of the fourth C,
Community. These value elements include informal socialising, learning from
other customers and employees, the ability to work together within a business
and with other businesses, and having topical discussions in discussion forums.
The fifth C is Content, which can be used to provide information regarding the
business itself and products and/or services on offer. The last C, namely
Computing, is the provision to customers of computing tools such as package
tracking services and real-time updates on inventory regarding a particular
product.
According to Lin and Kulatilaka (2007:893-394), businesses needs to adapt to
the current technological developments to remain competitive. One important
aspect that the authors stress is that investment in the latest technology will
have an influence on the value of the business. Kamel and Hussein (2001:119)
emphasise that the use of technology is not only important for businesses, but
also for government, in order to improve customer interaction.
2.7 INTERNET-BASED BUSINESS SUCCESSES AND FAILURES
The following two sections provide a brief overview of a number of successful or
failed Internet-based businesses.
2.7.1 Business successes
A number of Internet-based businesses have been highly successful. These
businesses include eBay, Google, Yahoo!, Verisign, AOL, Checkpoint, Gap,
INTERNET-BASED BUSINESSES CHAPTER 2
76
Best Buy, Lands‟ End and Office Depot. (Jackson 2008:53; Kurtz & Boone
2006:469; Turban et al. 2006:11). Williams (2009b:228) states that the success
of the Internet-based businesses is generally not founded on offering lower
prices to beat the competition. Lower prices can be offered in a sustainable
manner because these businesses have the skills to adjust to the prevailing
market conditions effectively and efficiently.
The business Land‟s End allows customers to develop a virtual three-
dimensional personal model, given the customer‟s own hair colour, height and
shape. Customers can then dress the model in different styles, to see which
clothing styles are best suited to him/her Customers can also interact directly
with a customer-service representative while designing clothing for a better fit.
Based on these fittings, the site provides the customer with personalised
buyers‟ tips on how to dress. (Kotler & Armstrong 2001:29; Wirtz et al.
2010:285). Some of the reasons cited by Office Depot for their success are their
well-established brand name, low-cost buying, and an extensive distribution
network that enables customers to collect purchases at their convenience (Kurtz
& Boone 2006:469). A number of small Internet-based businesses have also
proved to be successful. Since 2007, the small Internet-based business
Online4baby doubled its turnover to £4m (Hall 2010a).
Many Internet-based businesses have the first-mover advantage, which meant
being the first business to enter a specific niche market and capitalising on that
entrance. Examples of these Internet-based businesses include:
eBay as the first Internet-based auction market;
Blogger.com as the first website to provide blog hosting services;
Yahoo! as the first Internet directory; and
Apple Computer as the first computer with a Windows desktop, mouse,
hard floppy disk, floppyless laptops and wireless technology (Turban et
al. 2006:592).
Some Internet-based businesses were late movers into the market, but
managed to outperform the first and early movers. Examples of these Internet-
INTERNET-BASED BUSINESSES CHAPTER 2
77
based businesses include Intel, AOL and Google (Turban et al. 2006:592).
Therefore, for Internet-based businesses to be successful, whether first or late
movers, implies that they created value for the customer. Value is created when
the performance of a specific product or service exceed the perceptions the
customer have of that product or service (Krishnamurthy 2003:47).
According to Whitman as cited in Krishnamurthy (2003:138), there are three
reasons why eBay is successful. The first reason is that eBay could not exist
without the Internet because no business in the vicinity of the customer can
provide the customer with the product required. Therefore a new consumer
business model was developed. The second reason provided was that the new
consumer business model was created to be profitable. The third reason is that
eBay was developed in such a way that the business could grow and still be
profitable. One growth strategy that eBay is implementing is that of m-
commerce. (Krishnamurthy 2003:149).
One of South Africa‟s most well-known Internet-based business successes is
that of Mark Shuttleworth. In 1995 he started his own Internet-based business,
Thawte, a business specialising in digital security certificates. In 1999 he sold
Thawte to Verisign for a staggering US$575 million (McLeod 2011; Parr 2010).
2.7.2 Business failures
Unfortunately not all Internet-based businesses have been profitable and have
therefore disappeared. A study conducted by Lee et al. (2002:20) over a three-
year period from 1999 to 2001 focusing on Internet-based businesses, found
that in the USA 15 of the 22 businesses used in the study ceased to exist by the
end of the study for various reasons. These vanished businesses included the
following:
CDNow was acquired by Bertelsmann.
Cybershop closed its operations in April 2000.
FatBrain.com was acquired by Barnesandnoble.com in November 2000.
Go2Net was acquired by InfoSpace in October 2000.
INTERNET-BASED BUSINESSES CHAPTER 2
78
i-Mall mergerd with Excite@home in July 1999.
OnSale merged with Egghead.com in November 1999 and Egghead.com
delisted from NASDAQ on 10 April 2001.
PCOrder.com merged with Trilogy Software in October 2000.
Preview Travel merged with Travelocity in March 2000.
VitamanShoppe.com delisted from NASDAQ.
eToys closed its operations in April 2001.
Peapod was acquired by Royal Ahold in April 2000. (Lee et al. 2002:20).
Other examples of unsuccessful Internet-based businesses include eToys,
Xpeditor, Boo.com Walt Disney, Hollywood Entertainment, Levi Strauss and
Pets.com (Levis 2009:103; Sandoval 2000; Turban et al. 2006:11). According to
Kamalabadi, Bayat, Ahmadi and Ebrahimi (2008:590) and Krishnamurthy
(2003:4-5), reasons for the closure of Internet-based businesses include lack of
customer loyalty, inefficient development of a customer base, underestimation
of human behaviour, and the underestimation of well-established business
alliances.
The online business, eToys, was founded in 1997 with the vision of becoming
the premier family-oriented site on the Internet. During 1998, the number of its
employees increased from 13 to 235. Unfortunately the business accumulated a
deficit of US$17.5 million, and had debt to the value of US$274 million. eToys
closed down during April 2000. (Mahoney & Weisman 2001; Metz 2001:163).
The rival business, Toys Я Us, also implemented an e-business strategy.
Although its initial e-business attempt was disastrous because of a lack of
knowledge regarding packing and shipping products to customers, the business
found a workable and successful solution by entering into a partnership with
Amazon. Amazon is responsible for the fulfilling of orders, while Toys Я Us uses
the relationship with its suppliers and its brand name to enhance the
relationship with its target market. (Bicknell 2000; Metz 2001:163).
Pets.com was the first dot.com business to close down. Amazon.com invested
US$60 million in this business, which they lost in the end. One of the major
INTERNET-BASED BUSINESSES CHAPTER 2
79
reasons for Pets.com‟s closure was that they required external funding to cover
their losses. (Levis 2009:103-104).
The search engine Excite started in February 1993. Excite was bought by
@Home in January 1999 for US$6.5 billion, and was renamed Excite@Home.
In October 2001 Excite@Home filed for bankruptcy and was bought by
InfoSpace from the bankruptcy court for US$10 million. (Wall 2010).
Boo.com launched its opening in November 1999. In January 2000 sales
targets were not reached. The strategy followed by Boo.com was to
retrench100 employees and to reduce product prices for to 40%. After the chief
executive officer left the business, attempts were made to sell Boo.com to other
retailers and to obtain more funding from shareholders. Because both these
strategies failed, Boo.com announced in May 2000 that the business would be
liquidated. Reasons that contributed to the failure of Boo.com included: too
many different currencies and languages to cope with; extensive use of man-
hours to deal with distribution issues and the various courier services; excessive
use of graphics, movies, audio and videos; ineffective advertising campaigns;
and poor management quality. (Krishnamurthy 2003:129).
Other Internet-based businesses, such as Citibank, Sony, Chemdex and
Netscape, lost the first mover advantage to other Internet-based businesses
that entered the market at a later stage. Citibank invented the automatic teller
machines (ATMs) but Cirrus developed the ATM protocols. Sony created the
Betamax videotape format but Matsushiata‟s VHS format took over the market.
Chemdex was the first digital exchange, but after declining growth the owners
closed the business after spending US50 million. Netscape, as the first Internet
browser company, dominated the market until Microsoft Internet Explorer
entered the Internet browser market. (Stone 2000; Turban et al. 2006:292).
According to Gillette (2011), the social network MySpace is no longer an
Internet-based business to be concerned about. MySpace was developed by
Chris de Wolfe and Tom Anderson and launched in August 2003. In December
2008, MySpace had 75.9 million unique visitors in the USA alone. The number
INTERNET-BASED BUSINESSES CHAPTER 2
80
of visitors dropped to 34.8 million in May 2011. The income stream for MySpace
was in the form of advertising, which declined drastically owing to the lower
number of visitors. News Corp bought MySpace and Intermix, the parent
company of MySpace, in 2005, for US$580 million. In February 2011, News
Corp wanted to sell Intermix for US$100 million, but could not find a buyer.
Since the inception of the business, 30% of the USA employees and 66% of the
employees at the international offices have been retrenched. Some of the
reasons offered for the fall of MySpace are the rapid change in technology, the
unpredictability of consumer behaviour, and the influence of peers on users of
social networks. (Gillette 2011). LinkedIn was valued at US$6.4 billion in June
2011 (Gillette 2011). Kurtz and Boone (2006:125) state that the main income
stream of MySpace was the selling of advertisements, but it was not successful.
To enhance the income stream, MySpace decided to charge customers for the
services rendered, which had initially been free, but only approximately 6 000
customers out of a 9-million customer base were prepared to pay for the
service.
Other Internet-based businesses mentioned by Kurtz and Boone (2006:125)
that failed are iHarvest.com, Furniture.com, Kozmo.com and SwapIt.com.
iHarvest.com did not provide a unique service for a fee, as both Netscape and
Internet Explorer provided customers with a browser plug-in at no cost.
Furniture.com sold furniture online, but the main problem was shipping large
and bulky furniture to customers. Many delivery and courier businesses did not
transport such products, and those that did were very costly. Some of the
reasons for failure included the free-of-charge shipping of products, shipping
products to customers but not billing the customers for the products, and lack of
tracking orders (Metz 2001:163). Kozmo.com rented movies by delivering the
movies to the customer‟s home. The costs outweighed the income stream, and
the business model was flawed in the sense that it could never be sustainable.
The SwapIt.com used the concept of trade-in of old compact disks (CDs) and
video games. The only income stream for this business was the shipping and
handling charges, which were also not sustainable (Kurtz & Boone 2006:125).
INTERNET-BASED BUSINESSES CHAPTER 2
81
One of the main reasons why the Internet-based businesses failed in the
inception stage was that the basic services were offered free to customers. A
typical case was MySPace. Once the Internet-based businesses realised that
the income levels were not sufficient to be sustainable, it was difficult to convert
the basic services from a free service to a service for subscribers only, where
the subscribers had to pay a fee to receive the service. (Krishnamurthy
2003:59). Oliva et al. (2003:85) cite low prices and large infrastructural
investments as possible reasons for failure, as the Internet-based businesses
were not able to provide enough capital through retained earnings for growth
and expansion, and therefore had to acquire external capital. Kennedy and
Coughlan (2006:526) recommend that businesses considering implementing an
e-business strategy, should evaluate the possibility of portal participation until
established in that specific market, as this will assist in rapid development and
will minimise the uncertainty and new-entrant risk.
The major reason for the failure of so many of the so-called dot.com businesses
after the 2000 dot.com crash, is that these businesses could not process the
customers‟ orders quickly enough, or provide prompt delivery of processed
orders. Another reason cited for failure is that many of the businesses‟ websites
were unable to handle the large number of orders placed, as the systems in
place were not reliable or proven workable. (Levis 2009:81). Borges et al.
(2008:883) concur, and furthermore state that the businesses that failed did not
take into account critical factors for strategic and operational success. Arend
(2006:372) agrees that a major issue contributing to failure and not addressed
by businesses was that of strategic management. Another reason provided by
Spaulding (2009:38-49) why Internet-based businesses failed was that no trust
relationship was built between the business and the customers. According to
Adali et al. (2008:1), there are many dimensions to trust that need to be
considered. Dhillon, Coss and Hackney (2001:163) believe that disruptive
technologies can also lead to business failures. Disruptive technologies are
defined as technologies used in businesses that result in bad product and
services performance. Other reasons for failure of some Internet-based
businesses were that these businesses underestimated the cost of customer
INTERNET-BASED BUSINESSES CHAPTER 2
82
acquisition and retention, since the click-through referral fees were extremely
high for start-up Internet-based businesses (Jackson 2008:54).
2.8 SUMMARY
The purpose of Chapter Two has been to achieve the secondary objective, as
stated in Chapter One, to give an overview of Internet-based businesses. The
first issue addressed in this chapter was the nature of Internet-based
businesses. A distinction was made between e-commerce, e-business, m-
commerce and e-marketing.
Internet-based businesses were classified into five main categories, each of
which was discussed. The discussion provided a historical overview of brick-
and-click businesses, click-only businesses, Internet search engines and social
networks, and other types of businesses (such as auctions and blogs) were
mentioned.
Another issue that was outlined was the history of Internet-based businesses. A
timeline of the Internet was provided, as e-business cannot exist without the
Internet. The various stages of an e-business model, according to various
authors, were provided. These stages were used to construct an e-business
model to illustrate the types of business that are associated with the different e-
business stages.
The importance of an e-business strategy for all businesses was stressed. The
chapter concluded with some Internet-based business successes or failures,
and the probable reasons for the failures were also given.
Chapter Three will focus on the various traditional valuation approaches that
can be used to value brick-and-mortar and brick-and-click businesses.
Variables that are needed for valuation purposes will be identified. Chapter
Three will give an overview of previous research in the field of valuation, and on
the valuation of Internet-based businesses.
VALUATION OF BUSINESSES CHAPTER 3
83
CHAPTER THREE
VALUATION OF BUSINESSES
3.1 INTRODUCTION
Chapter Two discussed Internet-based businesses. The focus was on the
nature of this type of business and how it differs from brick-and-mortar
businesses in terms of trading. The importance of the Internet-based
businesses in the business environment was also highlighted, and it was
concluded that it is important to correctly value Internet-based businesses. A
secondary objective of this study is a detailed discussion of the various
traditional approaches to business valuation. In literature, one finds that there
are various valuation approaches. For ease of reference, instead of using the
words methods and models, reference will be made to valuation approaches. In
the study, reference is made to shares, which refers to ordinary shares only.
In the financial literature, many business valuation approaches are discussed.
Various authors, such as Lundholm (2001), Plenborg (2002) and Uzma et al.
(2010) have carried out research to determine which approach is the most
appropriate in various situations. Previous research has shown that the
discounted cash flow (DCF) is the most preferred approach used by businesses
to conduct market valuations of large businesses, although it has many
shortcomings. According to Huang and Van Mieghem (2009), for Internet-based
businesses, it is important to keep track of the browsing and the conversion
ratio (that is from browsing to committing online) as this data gives an indication
of future sales.
In Chapter One a number of secondary objectives were identified to give effect
to the primary objective of the study. These objectives were incorporated into
the conceptual framework of the research process. Figure 3.1, which is
reproduced from Chapter One, illustrates where this specific chapter fits into the
research process.
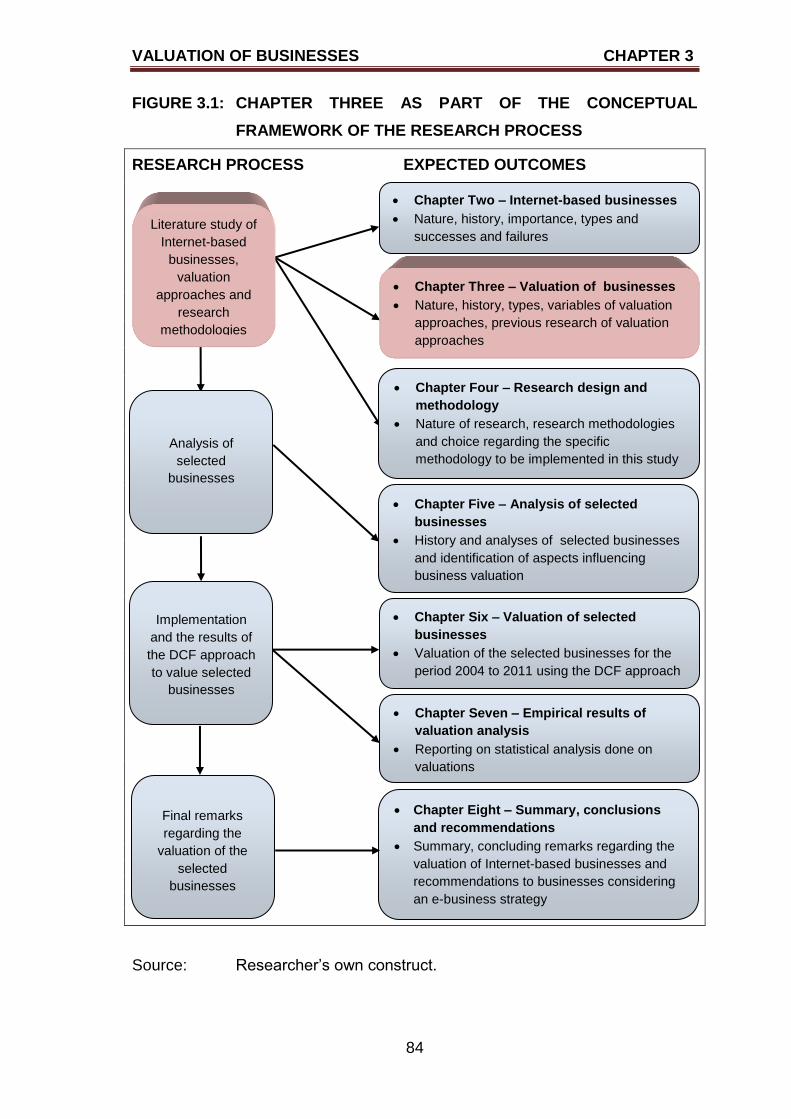
VALUATION OF BUSINESSES CHAPTER 3
84
FIGURE 3.1: CHAPTER THREE AS PART OF THE CONCEPTUAL
FRAMEWORK OF THE RESEARCH PROCESS
RESEARCH PROCESS EXPECTED OUTCOMES
Source: Researcher‟s own construct.
Literature study of
Internet-based
businesses,
valuation
approaches and
research
methodologies
Chapter Three – Valuation of businesses
Nature, history, types, variables of valuation
approaches, previous research of valuation
approaches
Chapter Two – Internet-based businesses
Nature, history, importance, types and
successes and failures
Chapter Four – Research design and
methodology
Nature of research, research methodologies
and choice regarding the specific
methodology to be implemented in this study
Analysis of
selected
businesses
Chapter Five – Analysis of selected
businesses
History and analyses of selected businesses
and identification of aspects influencing
business valuation
Chapter Six – Valuation of selected
businesses
Valuation of the selected businesses for the
period 2004 to 2011 using the DCF approach
Implementation
and the results of
the DCF approach
to value selected
businesses
Chapter Eight – Summary, conclusions
and recommendations
Summary, concluding remarks regarding the
valuation of Internet-based businesses and
recommendations to businesses considering
an e-business strategy
Final remarks
regarding the
valuation of the
selected
businesses
Chapter Seven – Empirical results of
valuation analysis
Reporting on statistical analysis done on
valuations
VALUATION OF BUSINESSES CHAPTER 3
85
This chapter will address the issue of valuation in terms of the nature of
valuation, and what the market-related value of a business is. The purpose of
valuation will be addressed. The valuation of businesses of different sizes and
the valuation of real estate will be discussed. A brief history of valuation
approaches will be provided, as well as the development of the various
valuation approaches. A discussion of the various approaches available to
business valuation will follow.
The valuation approaches to be included in the discussion are the dividend
discount model (DDM), the zero growth model, the constant growth model, the
non-constant growth model, the free cash flow valuation model, the price ratios
(price-earnings ratio, price-book ratio, book value per share and the liquidation
value per share), the economic and market value added performance
measurements, and real options. A summary that will highlight the unknown
variables and the variables necessary to each approach will follow. The
applicability of various valuation approaches will be included in the discussion.
The last section will include previous research on the topic of valuation.
3.2 NATURE OF BUSINESS VALUATION
To start the discussion on the nature of valuation, a brief overview of valuation
and its associated concepts will be followed by a discussion on the purposes of
valuation. Then the question whether small, medium and large businesses
should follow different valuation approaches when determining the market
values, will be addressed. The valuation of real estate has many similar
variables, such as the valuation approaches of shares. Therefore the
approaches that can be used when valuing real estate will be described.
3.2.1 Valuation concepts clarification
According to Els (2010:257) and Marx, De Swardt and Nortjé (2003:98), one
needs to differentiate between par value, market value, book value and
economic value, when referring to the value of a share. The par value, also
known as face value, of a share is the value of that share when it was issued in
the primary market for the first time (Els 2010:257; Marx et al. 2003:98).
VALUATION OF BUSINESSES CHAPTER 3
86
The market value of a share is determined by the law of economics, which is
demand and supply. Els (2010:257) and Marx et al. (2003:98) define market
value as the monetary value that buyers are willing to pay for a specific share
and sellers are willing to accept for that specific share. Marx et al. (2003:98)
furthermore state that two concepts that are related to market value are that of
market capitalisation and market value added. Market capitalisation is equal to
the number of shares times the market value per share, while market value
added is the monetary value by which the share price increases over a
specified period. Gitman et al. (2010:308) describe the market value of a share
as the equilibrium price as a result of the interactions of multiple buyers and
sellers. This equilibrium price has been reached after both buyers and sellers
have taken all the available information into account. French (2004:534) and
Pallister and Isaacs (2003:321-322; 332) define market value as the value of an
asset if it were sold on the open market at the current market price, where the
market price refers to the price of the asset in the open market. Furthermore it is
important to note that certain assets, such as shares, have two market prices,
namely a buying price and a selling price. The market price, known as the
middle price that is quoted in the press, is equal to the average of the buying
and selling prices. Grajkowska (2011:179-201) concurs with the above
descriptions of market value, but adds that the buyer and seller are under no
obligation to trade the asset, and that both the buyer and seller have equal
knowledge about the asset that may be traded.
According to Smith (2009:102), the market value for a property is important to
the investment process, as it determines the amount the investor will pay for the
property, and ultimately it will influence the maximisation of the investor‟s
wealth. If one considers the criteria as identified by Lind (1998:172), then the
following definitions of market value are correct:
No indication is given to the cautiousness and knowledge of buyers and
sellers.
No reference is made to willing buyers and willing sellers.
The price referred to is interpreted in terms of the realistic degree of
confidence in a price in a certain period.
VALUATION OF BUSINESSES CHAPTER 3
87
Els (2010:257) describes book value as the total assets minus liabilities,
preference share capital and intangible assets. The economic value (intrinsic
value) is the current price of a share, and is based on the future cash flows.
When applying the various valuation approaches to determine current prices of
shares, one is in fact calculating the economic or intrinsic value of the shares.
Marx et al. (2003:98-99) explain that there is a difference between the definition
of the book value of fixed assets and the book value of shares. The book value
of fixed assets is the initial cost of the fixed assets plus the installation costs
associated with the fixed assets minus the accumulated depreciation of the
fixed assets. The book value of shares is the per share amount that
shareholders will receive from the proceeds of selling all the assets of the
business at book value after all the liabilities have been paid.
The economic value, also known as the intrinsic value, is the total of all the
discounted future cash flows and the increase in the market value (Marx et al.
2003:99). Pallister and Isaacs (2003:182) concur that the economic value is the
difference between the present value of the all the future cash inflows and the
present value of all the future cash outflows.
A discussion by Singh and Saiyid (2008) draws attention to the implication of
the subprime crisis on valuation. Many pricing models have used historical data
as the trading volumes of shares declined. According to Singh and Saiyid
(2008), three valuation approaches, namely the mark-to-market approach, the
mark-to-matrix approach, and the mark-to-model approach, can be used when
valuing businesses. The mark-to-market approach is applicable to actively
traded securities, and is used when the quoted prices of shares are used in the
valuation process. The mark-to-matrix approach is used to value less actively
traded securities, and makes use of estimates of the credit spread of these
securities relative to the credit spread of the more actively traded securities. The
reason for the estimation of relationship between the two credit spreads is that
actively traded securities are more easily valued than less actively traded
securities. Examples of less actively traded securities are emerging market
securities, municipal bonds, and asset-backed securities. The third approach,
the mark-to-model approach, is the most appropriate approach to be used when
VALUATION OF BUSINESSES CHAPTER 3
88
valuing the least liquid securities. This approach values securities based on
numerical supposition. Examples of least liquid securities are real estate and
private equity investments.
3.2.2 Purpose of business valuation
It is important to realise that the price of a business is linked to the value of the
business, and that the price of a business is not the value of the business.
Therefore the value of the business will assist in the determining the price of the
business if traded. Turban et al. (2006:643) describe the purpose of valuation
as the determining of a fair market value for a business, where a fair market
value is the acceptable price to be paid by an informed buyer and to be
received by an informed seller. The market value of a public company can be
determined by the current price of the shares. It is also important to note that
the value of a business may be different for different buyers. According to
Turban et al. (2006:643), valuations are done when businesses want to merge
or when a business needs to determine an acceptable initial public offering
(IPO) price for the shares when listing on a stock exchange. Fernández
(2007a:2-3) and French (2004:535-536) identify a number of purposes for
business valuation, as it will assist in the following:
the buying and selling of the business by determination of the highest
price (from the buyer‟s perspective) and the lowest price (from the seller‟s
perspective) for the business to be bought or sold;
the decision to trade in the company‟s shares, by indicating whether
shares should be bought, sold or held;
the decision which companies‟ shares should be included in the portfolio
by identifying undervalued shares;
justifying the price of the shares offered to the general public;
comparing the value of shares to other securities when dealing with
inheritances and wills;
quantifying the value creation attributable to the executives when
considering compensation schemes;
identifying and stratifying the value drivers of a business or business unit;
VALUATION OF BUSINESSES CHAPTER 3
89
the strategic decisions on the future of the business in terms of whether
the business should be sold, milked, merged or grow;
the decision of whether the business should consider national and
international market development (intensify existing markets and enter
new markets) and product development (expand the product mix and
product lines);
obtaining debt from external sources; and
taxation, insurance and accounting purposes.
Léger (2010:408-409) states that it is important to place a fair value on a
business, but without the relevant financial and non-financial information it is
difficult to do so. The research of Léger (2010:409) considers the expected
return on sound investments in cases where e-business activities are included
and excluded, to determine whether there are differences in the expected
return. One concern that Pennisi and Scandizzo (2006:77) raise is that the
traditional cost-benefit approaches to valuation are seriously lacking, although
the valuation of businesses (regardless of type of business) is not embedded in
one economic theory. The authors add that there is no one valuation method
preferred by the various valuators.
3.2.3 Valuation of businesses of different sizes
McGuigan, Krelow and Moyer (2009:278) contend that closely-held businesses,
such as small businesses, may not be able to use the traditional valuation
approaches. Some reasons are that these small businesses do not issue
shares, or that the shares are not actively traded and therefore the value of the
shares does not reflect their actual market value. Furthermore, McGuigan et al.
(2009:278) believe that other factors should be considered when valuing a small
business, and include:
the nature and history of the business;
the general economic outlook of the economy, sector and industry in
which the business operates;
the earnings and dividend payment capacity of the business;
VALUATION OF BUSINESSES CHAPTER 3
90
the financial condition of the business as per financial statements;
the book value of the business; and
the type of shareholders (majority or minority interest and voting or non-
voting.
Another major question that needs to be addressed is the valuation of shares of
businesses that do not pay dividends. Lasher (2011:371) asserts that these
shares do have value, but the value is not based on the current dividend
stream. Many businesses prefer not to pay out dividends, and rather to reinvest
the earnings to fund growth in the business. The value of the shares is based
on the expectation that the shares will pay a dividend at some time in the future.
Therefore it is important to distinguish between valuation approaches applicable
to businesses of different sizes as measured by their equity capital.
According to Watson (2010:137), when SMEs engage in the valuation of
intangible assets for the purpose of inclusion in financial statements, the costs
associated with the valuation process should be taken into account. The costs
include the time and effort of the owner and/or manager, as well as the fees
payable to the professional valuators who are conducting the valuation process.
Parker (n.d.) states that the so-called asking price of an online business is not
the actual price that will be paid when it is bought. One factor that sellers of
online businesses include in the asking price is the effort put into the business.
In reality this effort by the sellers to create the online business will not form part
of the price the seller will receive when the selling contract is signed.
3.2.4 Valuation of real estate
When investing in real estate, it is important that an appropriate market value
for the real estate needs to be determined. According to Smith (2009:102-103),
the use of the correct real estate market value is critical when:
determining the correct price to pay when acquiring the real estate;
recording the value of the real estate in the financial statements;
VALUATION OF BUSINESSES CHAPTER 3
91
ensuring that the appropriate insurance for the real estate is taken;
determining the current return and future returns that the investor will
receive when investing in the real estate;
conducting a feasibility study to evaluate possible development(s) of the
current real estate; and
determining the maximum financing that financiers will be willing to
provide to acquire the real estate, or for alterations to the real estate.
Smith (2009:105) identifies four approaches to value real estate, namely the
income-capitalisation method, the discounted cash flow method, the
construction cost method, and the sales comparison method. The sales
comparison method is used when valuing residential real estate, while the other
three methods are used to value commercial real estate. The income-
capitalisation method aims at converting the payback period (the time taken to
recover the initial investment) of the investment into a required rate of return.
Smith (2009:106, 122, 128, 134, 139) indicates that the cost of capital will be
used, but this rate needs to be adjusted for expiry risk, tenancy risk, nodal
obsolescence and maintenance risk. Expiry risk is linked to the length of the
leases as stated in the lease agreements between the lessors and lessees. The
ability of the tenants (lessees) to pay the rental for the duration of the payback
period is referred to as tenancy risk. Nodal risk of a property is calculated by
comparing the actual lease rentals with the market rentals of the node in which
the real estate is located. Maintenance risk of real estate refers to the technical
condition of the real estate, and emphasis is placed on the investment required
to convert the real estate into the intended grade of the real estate to be valued.
The discounted cash flow method calculates the risk adjusted value of a real
estate‟s future cash inflows, implying that the net cash inflows for the real estate
over its lifetime will be determined. In forecasting the future cash inflows, factors
such as lease expiries, real estate market conditions and benchmarked
operating costs will be taken into account. To use this method, the correct future
cash inflows and discount rate are required. (Smith 2009:142).
VALUATION OF BUSINESSES CHAPTER 3
92
According to Smith (2009:147), the construction cost method can also be
applied to value real estate. This method is applicable when valuing a new
development, an existing development for insurance purposes, or the
expansion of an existing development. The main features of the method are to
determine the total land costs, total construction costs, total profession fees,
total holding costs and total finance costs.
Kooymans and Abbot (2006:200-203) have discussed the estimation of
replacement or reproduction costs, where the cost is dependent on technology
and on the legislation applicable to the building and the planning of the real
estate assets in question. This approach takes the depreciated replacement
cost into account, as well as the functional obsolescence of the specific
building. According to Roubi and Littlejohn (2004:175), valuation models used in
real asset valuation aim to determine whether relationships exist between
tangible and intangible property characteristics and property asset values.
3.3 HISTORY OF THE VARIOUS VALUATION APPROACHES
In 1959 Myron Gordon published the first article on how to value a share. The
model he presented in this article is known as the Gordon growth model.
Gordon (1959:99) states that the basic principle of the model is that when
investors invest in a share, they are in fact investing in the possibilities of such a
share:
to pay out dividends (dividend yields);
to increase in value (capital gains); or
to pay out dividends and to increase in value.
In this study (Gordon 1959:100-104), three main tasks are undertaken. The
three tasks are the explanation of the variation in share prices, testing of the
dividend hypothesis, and the testing of the earnings hypothesis. The dividend
hypothesis focuses on the dividend stream that the investor foresees receiving
in the future, and not only on the current value, while the earnings hypothesis
states that the investor buys the earnings per share when a share is purchased.
Gordon (1959:101) explains that the growth of dividends is based on retained
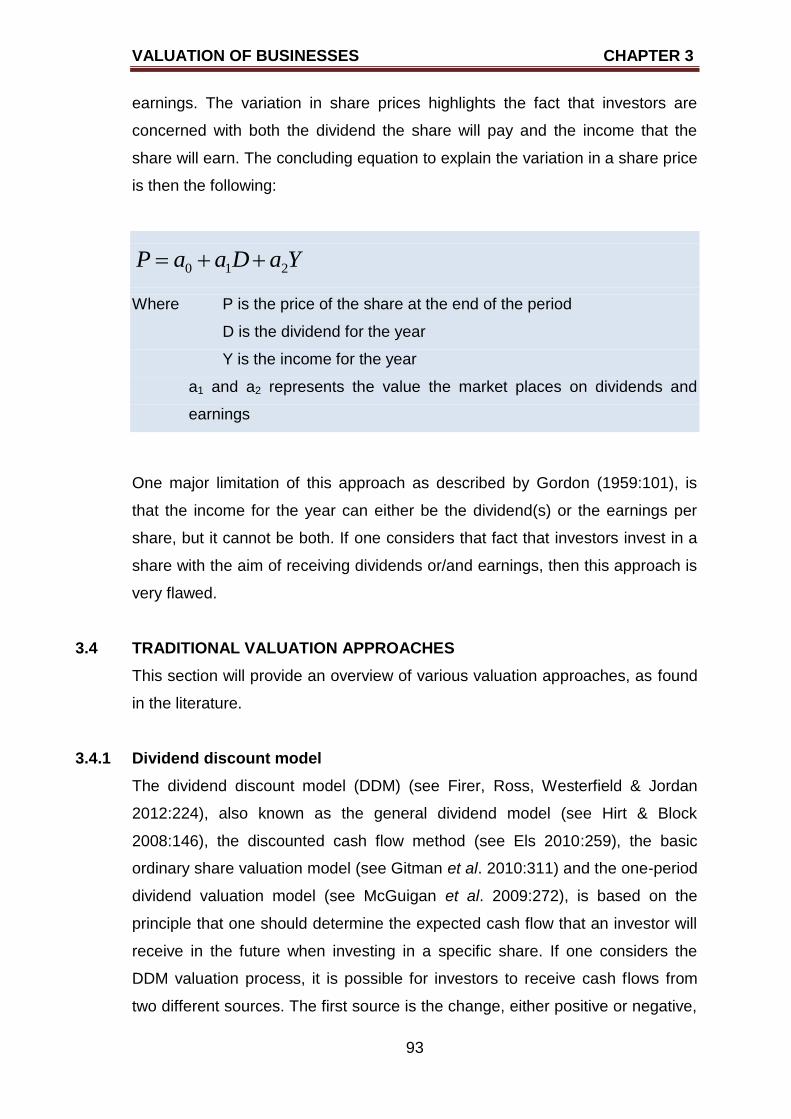
VALUATION OF BUSINESSES CHAPTER 3
93
earnings. The variation in share prices highlights the fact that investors are
concerned with both the dividend the share will pay and the income that the
share will earn. The concluding equation to explain the variation in a share price
is then the following:
YaDaaP 210
Where P is the price of the share at the end of the period
D is the dividend for the year
Y is the income for the year
a1 and a2 represents the value the market places on dividends and
earnings
One major limitation of this approach as described by Gordon (1959:101), is
that the income for the year can either be the dividend(s) or the earnings per
share, but it cannot be both. If one considers that fact that investors invest in a
share with the aim of receiving dividends or/and earnings, then this approach is
very flawed.
3.4 TRADITIONAL VALUATION APPROACHES
This section will provide an overview of various valuation approaches, as found
in the literature.
3.4.1 Dividend discount model
The dividend discount model (DDM) (see Firer, Ross, Westerfield & Jordan
2012:224), also known as the general dividend model (see Hirt & Block
2008:146), the discounted cash flow method (see Els 2010:259), the basic
ordinary share valuation model (see Gitman et al. 2010:311) and the one-period
dividend valuation model (see McGuigan et al. 2009:272), is based on the
principle that one should determine the expected cash flow that an investor will
receive in the future when investing in a specific share. If one considers the
DDM valuation process, it is possible for investors to receive cash flows from
two different sources. The first source is the change, either positive or negative,
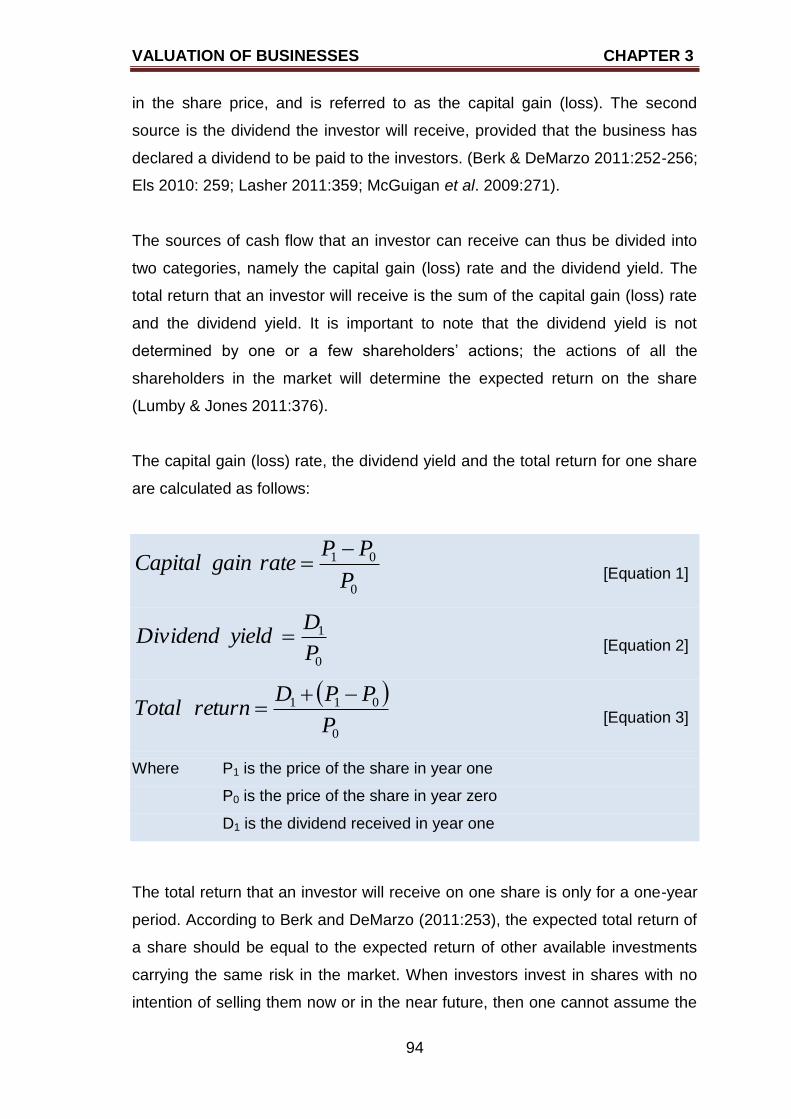
VALUATION OF BUSINESSES CHAPTER 3
94
in the share price, and is referred to as the capital gain (loss). The second
source is the dividend the investor will receive, provided that the business has
declared a dividend to be paid to the investors. (Berk & DeMarzo 2011:252-256;
Els 2010: 259; Lasher 2011:359; McGuigan et al. 2009:271).
The sources of cash flow that an investor can receive can thus be divided into
two categories, namely the capital gain (loss) rate and the dividend yield. The
total return that an investor will receive is the sum of the capital gain (loss) rate
and the dividend yield. It is important to note that the dividend yield is not
determined by one or a few shareholders‟ actions; the actions of all the
shareholders in the market will determine the expected return on the share
(Lumby & Jones 2011:376).
The capital gain (loss) rate, the dividend yield and the total return for one share
are calculated as follows:
[Equation 1]
0
1
P
DyieldDividend
[Equation 2]
0
011
P
PPDreturnTotal
[Equation 3]
Where P1 is the price of the share in year one
P0 is the price of the share in year zero
D1 is the dividend received in year one
The total return that an investor will receive on one share is only for a one-year
period. According to Berk and DeMarzo (2011:253), the expected total return of
a share should be equal to the expected return of other available investments
carrying the same risk in the market. When investors invest in shares with no
intention of selling them now or in the near future, then one cannot assume the
0
01
P
PPrategainCapital
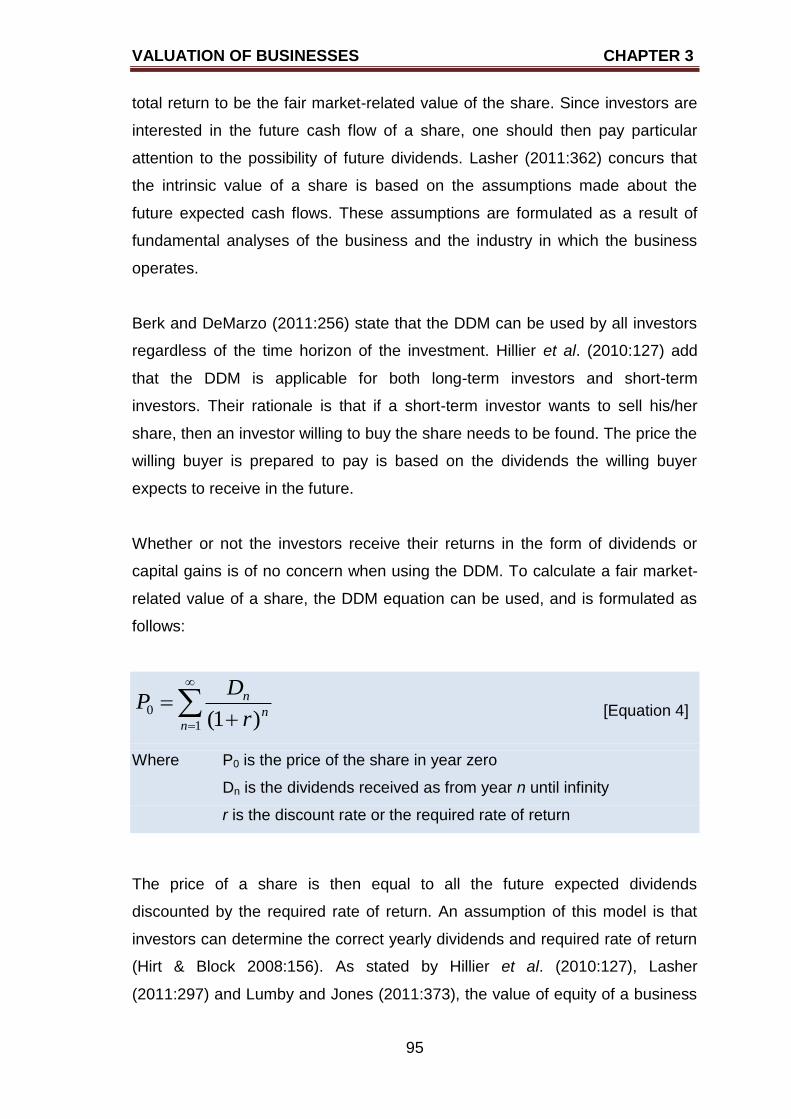
VALUATION OF BUSINESSES CHAPTER 3
95
total return to be the fair market-related value of the share. Since investors are
interested in the future cash flow of a share, one should then pay particular
attention to the possibility of future dividends. Lasher (2011:362) concurs that
the intrinsic value of a share is based on the assumptions made about the
future expected cash flows. These assumptions are formulated as a result of
fundamental analyses of the business and the industry in which the business
operates.
Berk and DeMarzo (2011:256) state that the DDM can be used by all investors
regardless of the time horizon of the investment. Hillier et al. (2010:127) add
that the DDM is applicable for both long-term investors and short-term
investors. Their rationale is that if a short-term investor wants to sell his/her
share, then an investor willing to buy the share needs to be found. The price the
willing buyer is prepared to pay is based on the dividends the willing buyer
expects to receive in the future.
Whether or not the investors receive their returns in the form of dividends or
capital gains is of no concern when using the DDM. To calculate a fair market-
related value of a share, the DDM equation can be used, and is formulated as
follows:
1
0)1(n
n
n
r
DP
[Equation 4]
Where P0 is the price of the share in year zero
Dn is the dividends received as from year n until infinity
r is the discount rate or the required rate of return
The price of a share is then equal to all the future expected dividends
discounted by the required rate of return. An assumption of this model is that
investors can determine the correct yearly dividends and required rate of return
(Hirt & Block 2008:156). As stated by Hillier et al. (2010:127), Lasher
(2011:297) and Lumby and Jones (2011:373), the value of equity of a business
VALUATION OF BUSINESSES CHAPTER 3
96
(which belongs to the investors since shares were issued to shareholders) is the
sum of the present values of all the expected future dividends. According to
Lumby and Jones (2011:377), it seems that the DDM ignores capital gains
(losses), but the approach in fact does include the reasons why capital gains
(losses) will occur.
As can be seen in Equation 4, one of the elements of the DDM is the required
rate of return. As cash flows are uncertain, one cannot use the risk-free rate of
return (rf) as the required rate of return. The higher the risk of not receiving the
cash flow and in this instance a dividend, the higher the return will be. A good
measure to use for the required rate of return is the cost of equity capital, which
should be similar to the expected return of other available investments with the
same risk profile as the share to be valued (Berk & DeMarzo 2011:252).
According to McGuigan et al. (2009:272), another issue that makes the valuing
of ordinary shares more complex than, for example the valuing of preference
shares, is that the dividends of ordinary shares are expected to grow.
Preference share dividends and bond coupons remain constant over time, as
both the dividends and the coupon payments are expressed as fixed
percentages of the par value of the shares or bonds.
If one considers Equation 4, then it is nearly impossible to determine the price
of a share if the time horizon is indefinite. To overcome this problem, investors
can use a number of different approaches, which will be discussed in the
sections to follow. The first three approaches are variations of the DDM, namely
the zero growth model, the constant growth model, and the non-constant growth
model. More discussions on other approaches will then follow.
3.4.2 Zero growth model
Using Equation 4 to determine the current price of a single share, one needs
the estimated dividends forever. If it is expected that there will be no growth in
the dividends forever, this implies that D0 = D1 = D2 = ... = D∞. Various authors
(see for example Els 2010:260; Gitman et al. 2010:312; Hillier et al. 2010:128;
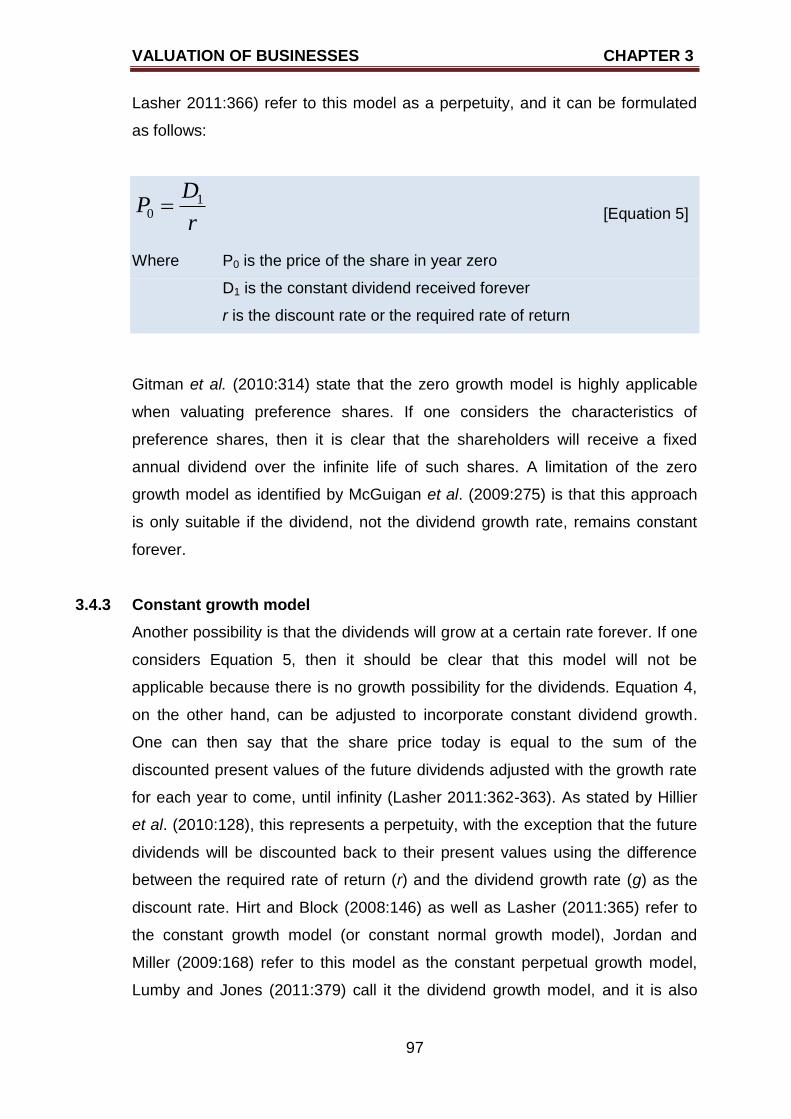
VALUATION OF BUSINESSES CHAPTER 3
97
Lasher 2011:366) refer to this model as a perpetuity, and it can be formulated
as follows:
r
DP 1
0 [Equation 5]
Where P0 is the price of the share in year zero
D1 is the constant dividend received forever
r is the discount rate or the required rate of return
Gitman et al. (2010:314) state that the zero growth model is highly applicable
when valuating preference shares. If one considers the characteristics of
preference shares, then it is clear that the shareholders will receive a fixed
annual dividend over the infinite life of such shares. A limitation of the zero
growth model as identified by McGuigan et al. (2009:275) is that this approach
is only suitable if the dividend, not the dividend growth rate, remains constant
forever.
3.4.3 Constant growth model
Another possibility is that the dividends will grow at a certain rate forever. If one
considers Equation 5, then it should be clear that this model will not be
applicable because there is no growth possibility for the dividends. Equation 4,
on the other hand, can be adjusted to incorporate constant dividend growth.
One can then say that the share price today is equal to the sum of the
discounted present values of the future dividends adjusted with the growth rate
for each year to come, until infinity (Lasher 2011:362-363). As stated by Hillier
et al. (2010:128), this represents a perpetuity, with the exception that the future
dividends will be discounted back to their present values using the difference
between the required rate of return (r) and the dividend growth rate (g) as the
discount rate. Hirt and Block (2008:146) as well as Lasher (2011:365) refer to
the constant growth model (or constant normal growth model), Jordan and
Miller (2009:168) refer to this model as the constant perpetual growth model,
Lumby and Jones (2011:379) call it the dividend growth model, and it is also
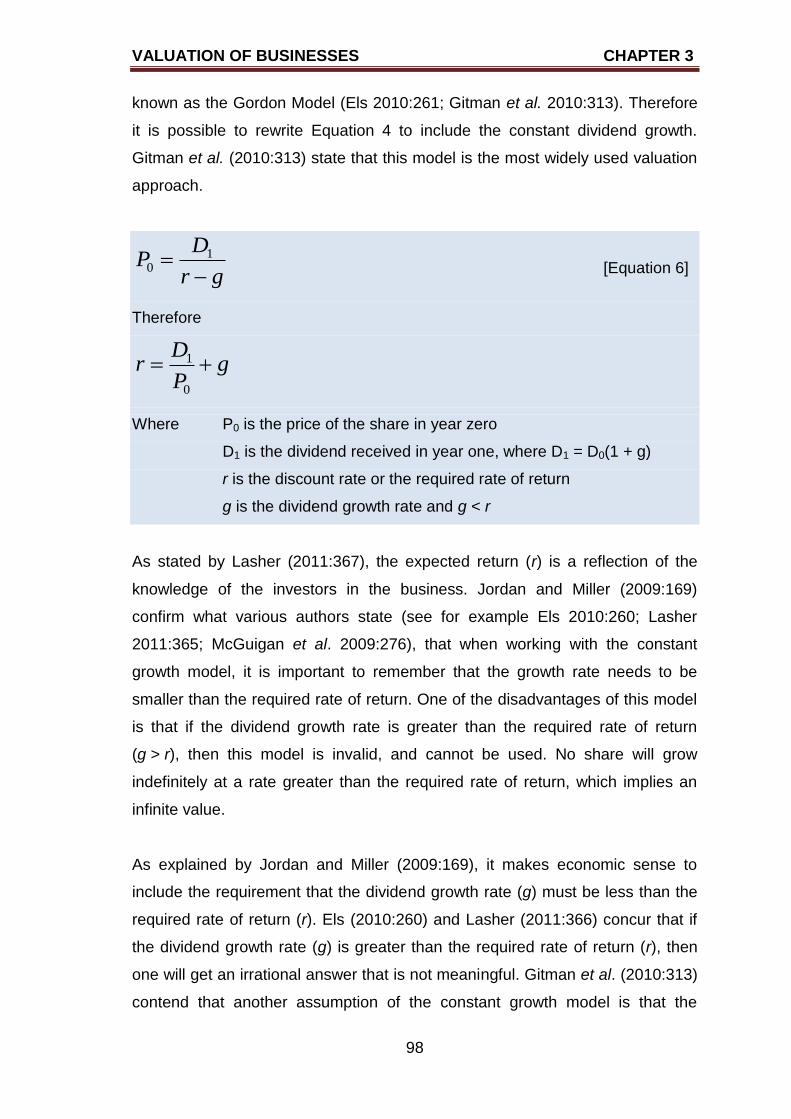
VALUATION OF BUSINESSES CHAPTER 3
98
known as the Gordon Model (Els 2010:261; Gitman et al. 2010:313). Therefore
it is possible to rewrite Equation 4 to include the constant dividend growth.
Gitman et al. (2010:313) state that this model is the most widely used valuation
approach.
gr
DP
1
0 [Equation 6]
Therefore
gP
Dr
0
1
Where P0 is the price of the share in year zero
D1 is the dividend received in year one, where D1 = D0(1 + g)
r is the discount rate or the required rate of return
g is the dividend growth rate and g < r
As stated by Lasher (2011:367), the expected return (r) is a reflection of the
knowledge of the investors in the business. Jordan and Miller (2009:169)
confirm what various authors state (see for example Els 2010:260; Lasher
2011:365; McGuigan et al. 2009:276), that when working with the constant
growth model, it is important to remember that the growth rate needs to be
smaller than the required rate of return. One of the disadvantages of this model
is that if the dividend growth rate is greater than the required rate of return
(g > r), then this model is invalid, and cannot be used. No share will grow
indefinitely at a rate greater than the required rate of return, which implies an
infinite value.
As explained by Jordan and Miller (2009:169), it makes economic sense to
include the requirement that the dividend growth rate (g) must be less than the
required rate of return (r). Els (2010:260) and Lasher (2011:366) concur that if
the dividend growth rate (g) is greater than the required rate of return (r), then
one will get an irrational answer that is not meaningful. Gitman et al. (2010:313)
contend that another assumption of the constant growth model is that the
VALUATION OF BUSINESSES CHAPTER 3
99
business‟s earnings and dividends will grow at the same rate. This implies that
the difference between the required rate of return (r) and the dividend growth
rate (g) will always be constant. It is important to note that the discount rate
applicable (in this case the difference between required rate of return and
dividend growth rate) will only remain constant if the business has a fixed
payout ratio, that is, a fixed percentage of earnings will be paid out to the
shareholders of the business.
One advantage of the constant growth model is that the expected price of a
share can be calculated for a future date, provided that the dividend, discount
rate and growth rate are known. Disadvantages of the constant growth model
include that it can only be used for large stable businesses, and that the
dividend in year one (that is D1 as per Equation 6) must be greater than zero.
Thus this approach is not appropriate for use on volatile shares. (Gitman et al.
2010:313).
Hillier et al. (2010:134) further suggest that when valuing businesses, one
should not only consider future growth in dividends, but also consider future
growth opportunities. Future growth opportunities are opportunities that
businesses have, to invest in profitable projects using retained earnings. These
authors indicate that when considering growth opportunities, the net present
value per share of the growth opportunity (NPVGO) should be determined. The
value of businesses with many growth opportunities should be higher than
businesses with no or only a few growth opportunities. When businesses pay
out all their earnings to shareholders (meaning that the earnings per share are
equal to dividends per share) then these businesses are known as cash cows.
Cash cows do not have growth opportunities that need to be funded. To value
cash cows, the zero growth model (see Equation 5) can be used. When
businesses have growth opportunities, then the future cash inflows need to be
included in the valuation process. Therefore Equation 5 can be adjusted to
include these future cash flows, and is shown below as Equation 7.
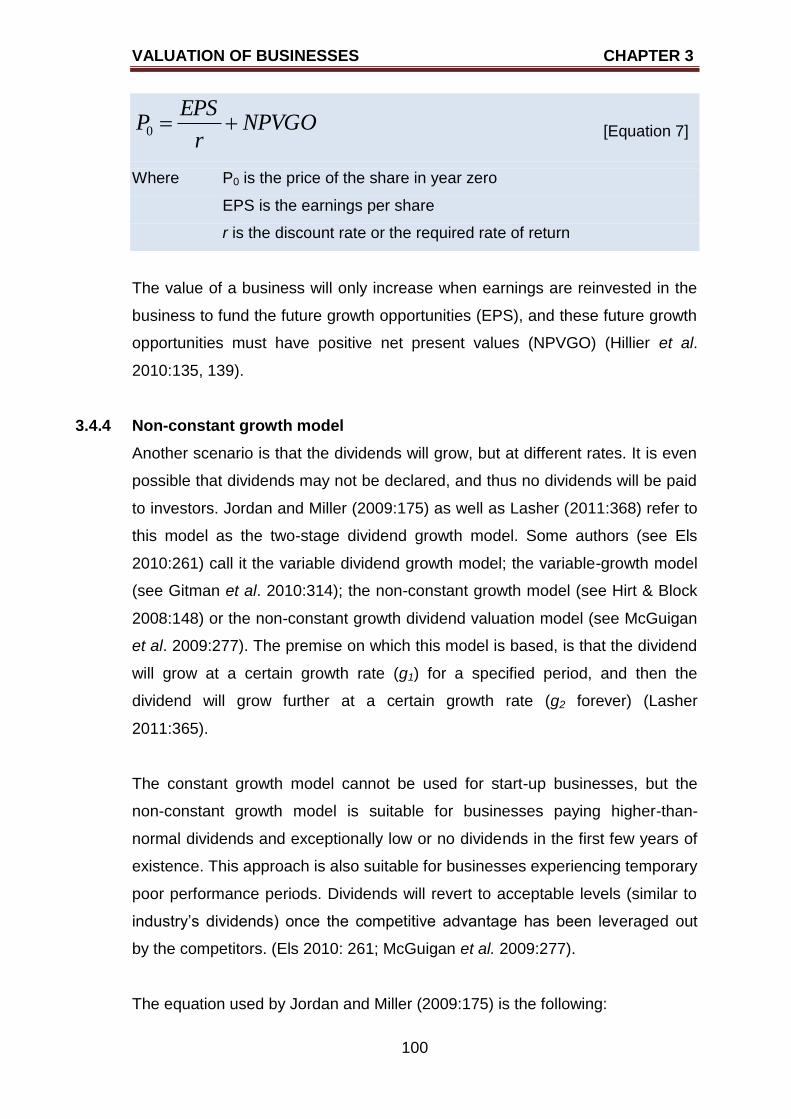
VALUATION OF BUSINESSES CHAPTER 3
100
NPVGOr
EPSP 0 [Equation 7]
Where P0 is the price of the share in year zero
EPS is the earnings per share
r is the discount rate or the required rate of return
The value of a business will only increase when earnings are reinvested in the
business to fund the future growth opportunities (EPS), and these future growth
opportunities must have positive net present values (NPVGO) (Hillier et al.
2010:135, 139).
3.4.4 Non-constant growth model
Another scenario is that the dividends will grow, but at different rates. It is even
possible that dividends may not be declared, and thus no dividends will be paid
to investors. Jordan and Miller (2009:175) as well as Lasher (2011:368) refer to
this model as the two-stage dividend growth model. Some authors (see Els
2010:261) call it the variable dividend growth model; the variable-growth model
(see Gitman et al. 2010:314); the non-constant growth model (see Hirt & Block
2008:148) or the non-constant growth dividend valuation model (see McGuigan
et al. 2009:277). The premise on which this model is based, is that the dividend
will grow at a certain growth rate (g1) for a specified period, and then the
dividend will grow further at a certain growth rate (g2 forever) (Lasher
2011:365).
The constant growth model cannot be used for start-up businesses, but the
non-constant growth model is suitable for businesses paying higher-than-
normal dividends and exceptionally low or no dividends in the first few years of
existence. This approach is also suitable for businesses experiencing temporary
poor performance periods. Dividends will revert to acceptable levels (similar to
industry‟s dividends) once the competitive advantage has been leveraged out
by the competitors. (Els 2010: 261; McGuigan et al. 2009:277).
The equation used by Jordan and Miller (2009:175) is the following:
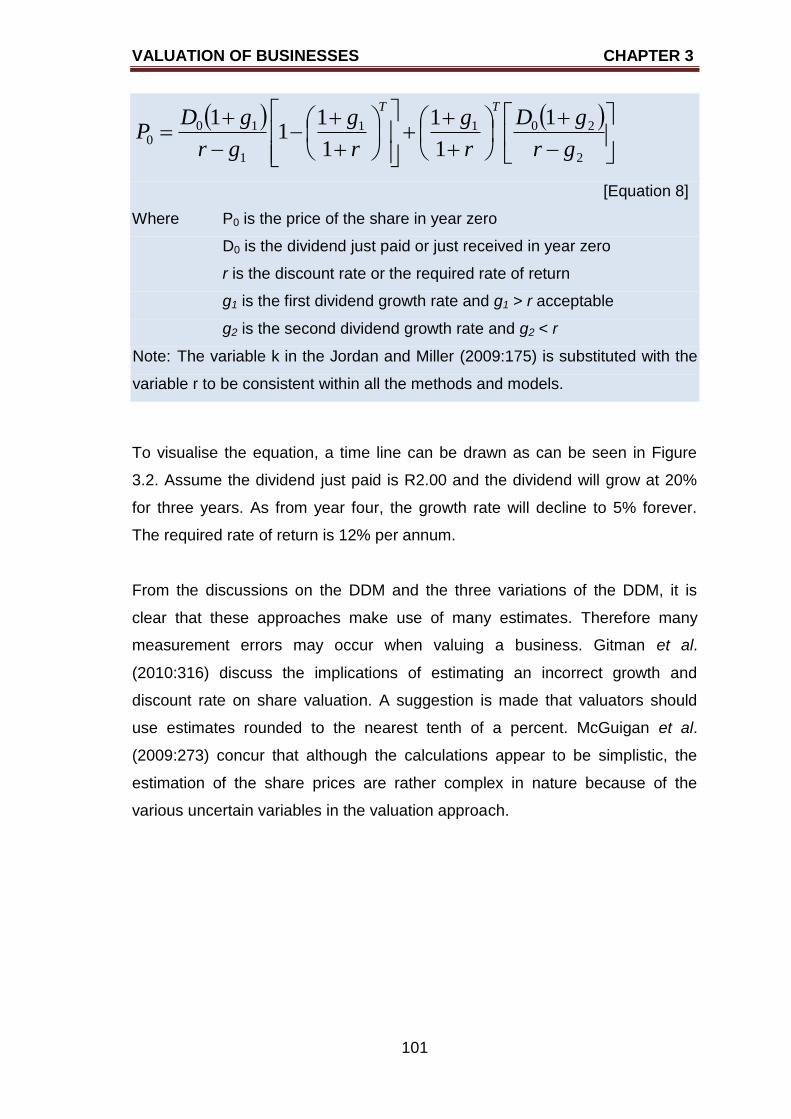
VALUATION OF BUSINESSES CHAPTER 3
101
2
2011
1
100
1
1
1
1
11
1
gr
gD
r
g
r
g
gr
gDP
TT
[Equation 8]
Where P0 is the price of the share in year zero
D0 is the dividend just paid or just received in year zero
r is the discount rate or the required rate of return
g1 is the first dividend growth rate and g1 > r acceptable
g2 is the second dividend growth rate and g2 < r
Note: The variable k in the Jordan and Miller (2009:175) is substituted with the
variable r to be consistent within all the methods and models.
To visualise the equation, a time line can be drawn as can be seen in Figure
3.2. Assume the dividend just paid is R2.00 and the dividend will grow at 20%
for three years. As from year four, the growth rate will decline to 5% forever.
The required rate of return is 12% per annum.
From the discussions on the DDM and the three variations of the DDM, it is
clear that these approaches make use of many estimates. Therefore many
measurement errors may occur when valuing a business. Gitman et al.
(2010:316) discuss the implications of estimating an incorrect growth and
discount rate on share valuation. A suggestion is made that valuators should
use estimates rounded to the nearest tenth of a percent. McGuigan et al.
(2009:273) concur that although the calculations appear to be simplistic, the
estimation of the share prices are rather complex in nature because of the
various uncertain variables in the valuation approach.
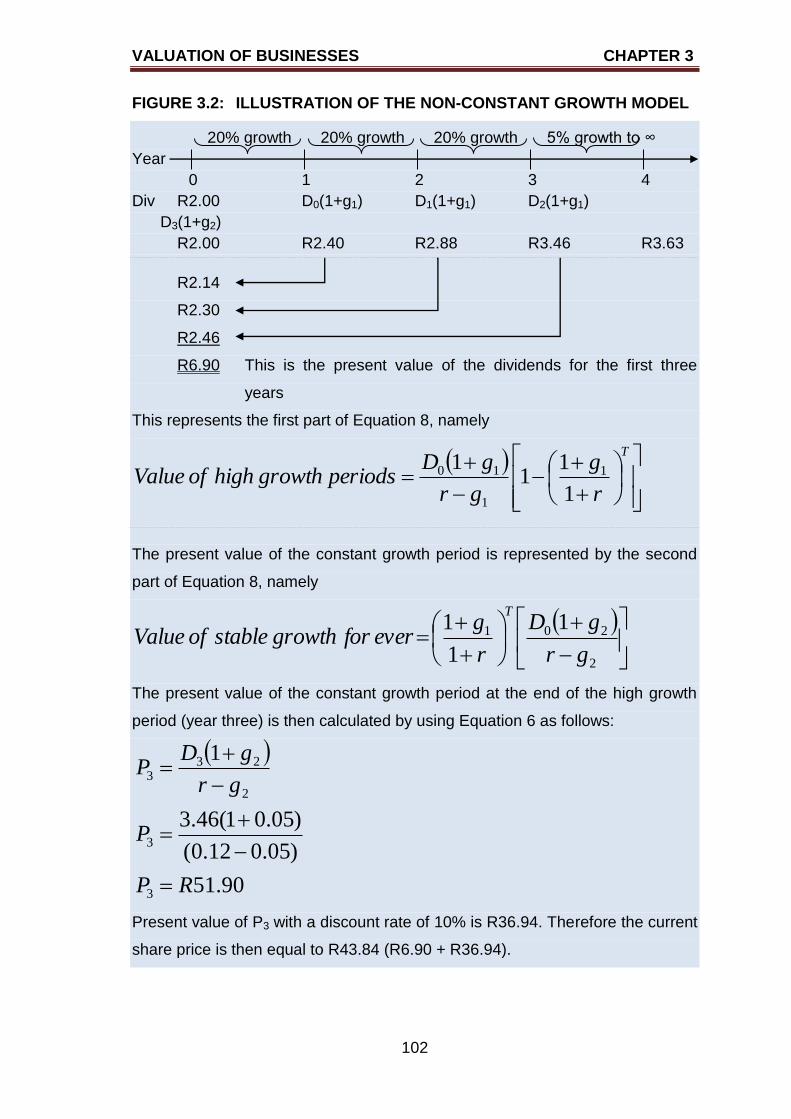
VALUATION OF BUSINESSES CHAPTER 3
102
FIGURE 3.2: ILLUSTRATION OF THE NON-CONSTANT GROWTH MODEL
20% growth 20% growth 20% growth 5% growth to ∞
Year
0 1 2 3 4
Div R2.00 D0(1+g1) D1(1+g1) D2(1+g1)
D3(1+g2)
R2.00 R2.40 R2.88 R3.46 R3.63
R2.14
R2.30
R2.46
R6.90 This is the present value of the dividends for the first three
years
This represents the first part of Equation 8, namely
T
r
g
gr
gDperiodsgrowthhighofValue
1
11
1 1
1
10
The present value of the constant growth period is represented by the second
part of Equation 8, namely
2
201 1
1
1
gr
gD
r
geverforgrowthstableofValue
T
The present value of the constant growth period at the end of the high growth
period (year three) is then calculated by using Equation 6 as follows:
90.51
)05.012.0(
)05.01(46.3
1
3
3
2
233
RP
P
gr
gDP
Present value of P3 with a discount rate of 10% is R36.94. Therefore the current
share price is then equal to R43.84 (R6.90 + R36.94).
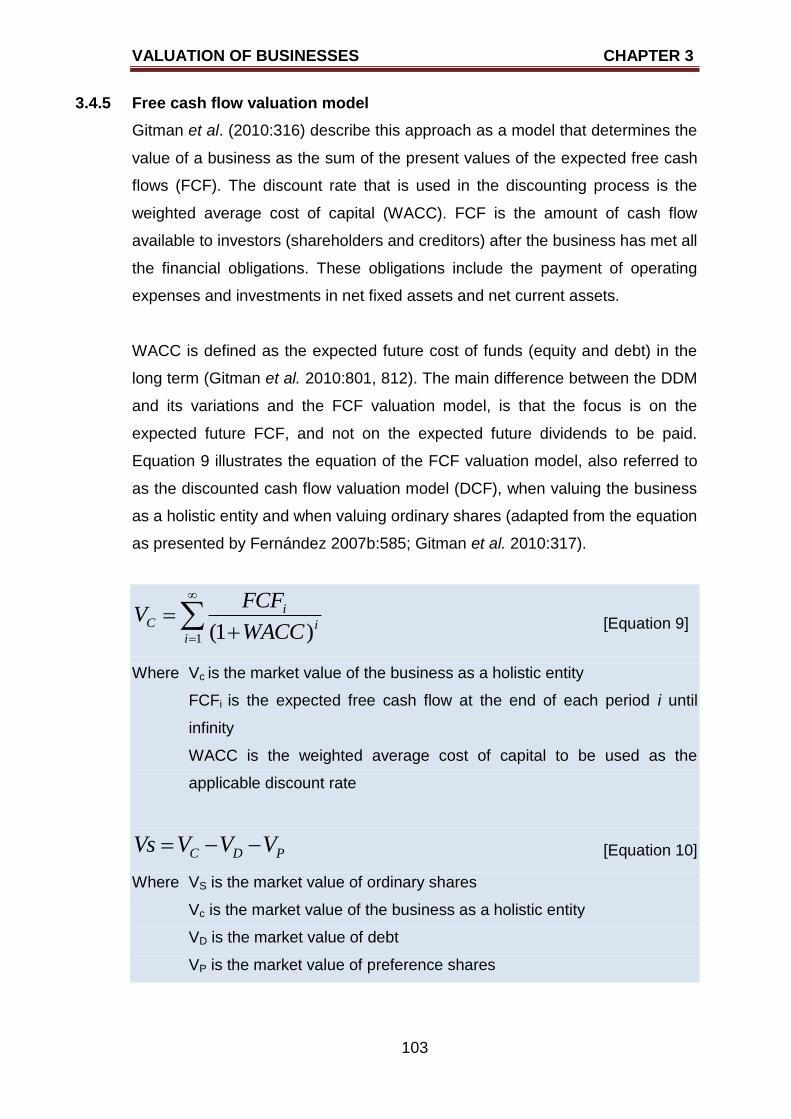
VALUATION OF BUSINESSES CHAPTER 3
103
3.4.5 Free cash flow valuation model
Gitman et al. (2010:316) describe this approach as a model that determines the
value of a business as the sum of the present values of the expected free cash
flows (FCF). The discount rate that is used in the discounting process is the
weighted average cost of capital (WACC). FCF is the amount of cash flow
available to investors (shareholders and creditors) after the business has met all
the financial obligations. These obligations include the payment of operating
expenses and investments in net fixed assets and net current assets.
WACC is defined as the expected future cost of funds (equity and debt) in the
long term (Gitman et al. 2010:801, 812). The main difference between the DDM
and its variations and the FCF valuation model, is that the focus is on the
expected future FCF, and not on the expected future dividends to be paid.
Equation 9 illustrates the equation of the FCF valuation model, also referred to
as the discounted cash flow valuation model (DCF), when valuing the business
as a holistic entity and when valuing ordinary shares (adapted from the equation
as presented by Fernández 2007b:585; Gitman et al. 2010:317).
1 )1(ii
iC
WACC
FCFV [Equation 9]
Where Vc is the market value of the business as a holistic entity
FCFi is the expected free cash flow at the end of each period i until
infinity
WACC is the weighted average cost of capital to be used as the
applicable discount rate
PDC VVVVs [Equation 10]
Where VS is the market value of ordinary shares
Vc is the market value of the business as a holistic entity
VD is the market value of debt
VP is the market value of preference shares
VALUATION OF BUSINESSES CHAPTER 3
104
The FCF valuation model is applicable in a number of situations, namely
where businesses pay no dividends and therefore no dividend history is
available;
when it is a new business (start-up); and
when it is only one business unit of a large business that needs to be
valued (Gitman et al. 2010:316).
3.4.6 Price ratios
A number of price ratios are frequently used, and include the price-earnings
(P/E) ratio, the price-book (P/B) ratio, the book value ratio, and the liquidation
ratio. Each of these ratios will now be discussed.
(a) Price-earnings ratio
According to Els (2010:264), the price-earnings (P/E) ratio is the most important
relative valuation technique because it shows the monetary value that investors
are willing to pay in relation to reported earnings per share. Gitman et al.
(2010:319) refer to this ratio as the price-earnings multiples, while McGuigan et
al. (2009:278) refer to the price-earnings multiples or to the capitalisation of
earnings.
In section 3.4.3, Equation 7 states that the current share price is equal to sum of
the discounted EPS and NPVGO. To calculate the P/E ratio, one needs to
divide this answer by the EPS.
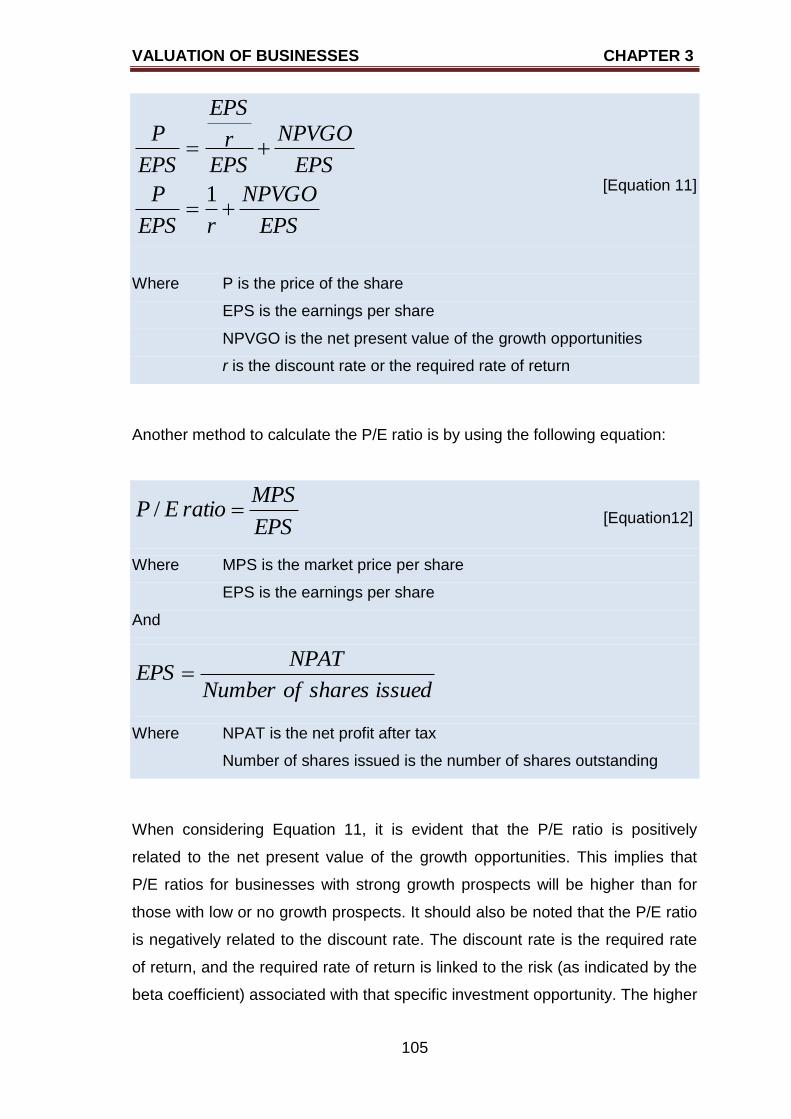
VALUATION OF BUSINESSES CHAPTER 3
105
EPS
NPVGO
rEPS
P
EPS
NPVGO
EPSr
EPS
EPS
P
1 [Equation 11]
Where P is the price of the share
EPS is the earnings per share
NPVGO is the net present value of the growth opportunities
r is the discount rate or the required rate of return
Another method to calculate the P/E ratio is by using the following equation:
EPS
MPSratioEP / [Equation12]
Where MPS is the market price per share
EPS is the earnings per share
And
issuedsharesofNumber
NPATEPS
Where NPAT is the net profit after tax
Number of shares issued is the number of shares outstanding
When considering Equation 11, it is evident that the P/E ratio is positively
related to the net present value of the growth opportunities. This implies that
P/E ratios for businesses with strong growth prospects will be higher than for
those with low or no growth prospects. It should also be noted that the P/E ratio
is negatively related to the discount rate. The discount rate is the required rate
of return, and the required rate of return is linked to the risk (as indicated by the
beta coefficient) associated with that specific investment opportunity. The higher
VALUATION OF BUSINESSES CHAPTER 3
106
the risk associated with the investment opportunity, the higher the required rate
of return for that opportunity, and the lower the P/E ratio. (Els 2010:264; Hillier
et al. 2010:140, 340).
Gitman et al. (2010:32) state that one of the advantages of calculating the P/E
ratio to determine the value of a business is that it is easy and quick to
calculate. It is also highly applicable when valuing privately owned businesses.
Privately owned or closely owned businesses do not have minority interests of
non-controlling investors, which publicly owned businesses do have, and
therefore the P/E ratio is adjusted by added a premium to it when valuing
privately owned or closely owned businesses. (Gitman et al. 2010:320;
McGuigan et al. 2009:278). Although it is quick and easy to calculate, Zarzecki
(2011:108) points out three limitations of the P/E ratio, namely that the P/E ratio
cannot be used when no profits are generated, the income is increasing too fast
and it ignores the unique characteristics of each specific business.
McGuigan et al. (2009:278) suggest that when valuing minority interest shares,
the value of the business as a holistic entity should be determined. A generally
accepted and practised principle is to discount the value of the minority interest
shares. The major limitation of minority interest shares is that the shareholders
do not have any control or very little control, and that the shareholders receive
small dividends, if any. Another issue with regard to minority interest shares is
the lack of marketability because there is no active market for these shares, and
the shareholders are usually the owners of these businesses.
An important statement made by Lasher (2011:372) is that stock markets have
a tendency to fix short-term industry P/E ratios. This implies that the P/E ratio is
fairly constant, and therefore changes in share prices rely on changes in the
latest earnings of the business.
(b) Price-book ratio
The price-book (P/B) ratio is another ratio used in share valuation. This ratio
provides an indication of the wealth creation possibility of the specific share. As
stated by McGuigan et al. (2009:274), shareholders‟ wealth maximisation is the
VALUATION OF BUSINESSES CHAPTER 3
107
most important primary financial goal, therefore the P/B ratio will be a suitable
ratio to indicate whether wealth maximisation has occurred. The higher the P/B
ratio, the more value management has created for the shareholders. (Els
2010:8, 265).
(c) Book value per share
The book value per share refers to the monetary amount that each ordinary
share will receive if all the assets of the business are sold for the book or
accounting value. Gitman et al. (2010:319) argue that this approach is flawed in
that it uses historical data from the financial statements, and that it disregards
the future potential earnings of the business. Therefore, book value per share
has no relationship with the true market-related value of the business.
(d) Liquidation value per share
The difference between book value per share and liquidation value per share is
that the liquidation value per share is based on the current value of the assets
of the business. Liquidation value per share is the monetary amount that each
outstanding ordinary share will receive after paying all liabilities from the
proceeds of selling all the assets of the business at the market-related value.
This ratio also ignores the future potential earnings of the business. (Gitman et
al. 2010:319).
3.4.7 Economic and market value added performance measurements
Economic value added performance measurement (EVA) is the net operating
profit after tax, after all capital costs have been deducted. Lasher (2011:102)
describes the rationale behind this approach as being consistent with the
primary financial goal of shareholders‟ wealth maximisation. One of the
disadvantages of EVA is that it only focuses on current earnings after tax, and
does not take the time value of money into account. Therefore the use of EVA
may lead to incorrect long-term decisions (Hillier et al. 2010:339-339).
Fernández (2007b:585) and Gitman et al. (2010:466) agree that EVA needs the
weighted cost of capital. The weighted cost of capital is dependent on the
required rate of return, which is one of the uncertain variables when engaging in
valuation (Els 2010:323). A positive EVA implies that the business performance
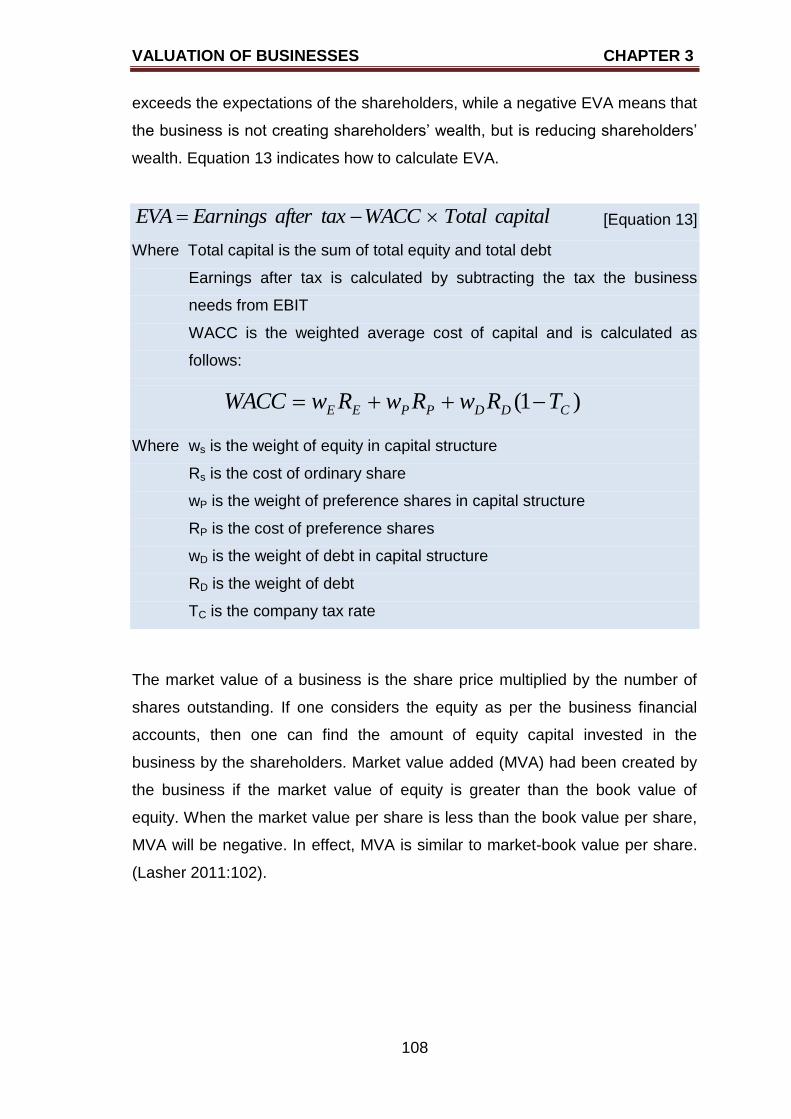
VALUATION OF BUSINESSES CHAPTER 3
108
exceeds the expectations of the shareholders, while a negative EVA means that
the business is not creating shareholders‟ wealth, but is reducing shareholders‟
wealth. Equation 13 indicates how to calculate EVA.
capitalTotalWACCtaxafterEarningsEVA [Equation 13]
Where Total capital is the sum of total equity and total debt
Earnings after tax is calculated by subtracting the tax the business
needs from EBIT
WACC is the weighted average cost of capital and is calculated as
follows:
)1( CDDPPEE TRwRwRwWACC
Where ws is the weight of equity in capital structure
Rs is the cost of ordinary share
wP is the weight of preference shares in capital structure
RP is the cost of preference shares
wD is the weight of debt in capital structure
RD is the weight of debt
TC is the company tax rate
The market value of a business is the share price multiplied by the number of
shares outstanding. If one considers the equity as per the business financial
accounts, then one can find the amount of equity capital invested in the
business by the shareholders. Market value added (MVA) had been created by
the business if the market value of equity is greater than the book value of
equity. When the market value per share is less than the book value per share,
MVA will be negative. In effect, MVA is similar to market-book value per share.
(Lasher 2011:102).

VALUATION OF BUSINESSES CHAPTER 3
109
3.4.8 Real options
Athanassakos (2007:8), Brigham and Daves (2010:489) and Ryan (2007:320)
define a real option as an option that is linked to the future cash flows that will
be obtained from a capital asset investment made by the business, which is
difficult to capture in the most popular investment appraisals such as net
present value (NPV), internal rate of return (IRR) and payback and discounted
payback periods. Real options refer to the trading of real assets instead of
financial assets such as shares (Firer et al. 2012:347). Therefore real options as
a valuation approach are appropriate to be used when valuing Internet and
biotechnology businesses, because share prices are highly volatile
(Cuthbertson & Notzsche 2008:309). Gitman and Zutter (2012:483) also refer to
real options as strategic options since the decision made usually involves large
capital budgeting projects.
A distinction is made between a simple option and a compound real option. A
simple option is where there is only one option for changing the expected route
of the project, while a compounded real option has a number of routes that can
be followed, and some of the routes are dependent on decisions regarding
previous routes chosen (Ryan 2007:325). Brigham and Daves (2010:209; 477-
479), Cuthbertson and Notzsche (2008:102), Firer et al. (2012:350-361) and
Gitman and Zutter (2012:483-484) concur with Ryan (2007:325-326) that there
are four generic real options, and the specific choice of real options is based on
the managerial discretion. The four general real options are as follows:
the delay option, where the commitment to the project or asset is
postponed until a later stage;
the expansion option, where the commitment towards the project or asset
provides opportunities for immediate or future expansion and growth;
the redeployment option, where the asset can be used in other projects;
and
the abandonment option, where the commitment to the project or asset is
withdrawn and the asset will be sold.
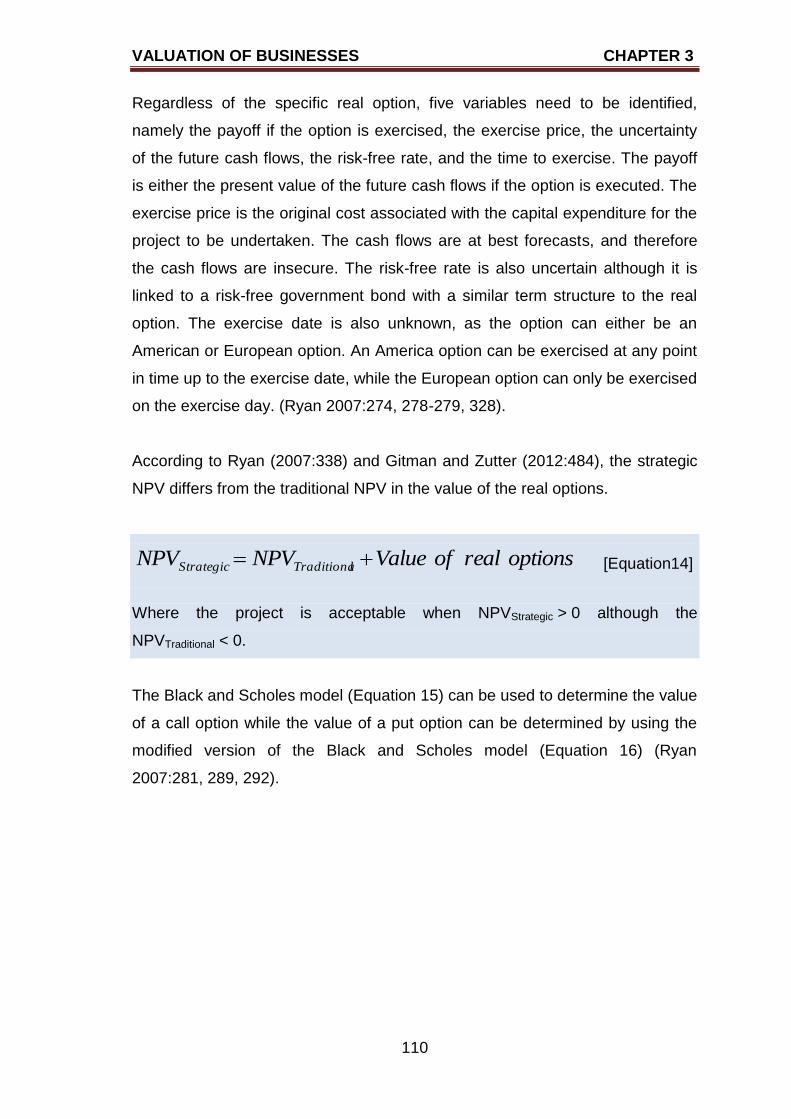
VALUATION OF BUSINESSES CHAPTER 3
110
Regardless of the specific real option, five variables need to be identified,
namely the payoff if the option is exercised, the exercise price, the uncertainty
of the future cash flows, the risk-free rate, and the time to exercise. The payoff
is either the present value of the future cash flows if the option is executed. The
exercise price is the original cost associated with the capital expenditure for the
project to be undertaken. The cash flows are at best forecasts, and therefore
the cash flows are insecure. The risk-free rate is also uncertain although it is
linked to a risk-free government bond with a similar term structure to the real
option. The exercise date is also unknown, as the option can either be an
American or European option. An America option can be exercised at any point
in time up to the exercise date, while the European option can only be exercised
on the exercise day. (Ryan 2007:274, 278-279, 328).
According to Ryan (2007:338) and Gitman and Zutter (2012:484), the strategic
NPV differs from the traditional NPV in the value of the real options.
optionsrealofValueNPVNPV lTraditionaStrategic [Equation14]
Where the project is acceptable when NPVStrategic > 0 although the
NPVTraditional < 0.
The Black and Scholes model (Equation 15) can be used to determine the value
of a call option while the value of a put option can be determined by using the
modified version of the Black and Scholes model (Equation 16) (Ryan
2007:281, 289, 292).
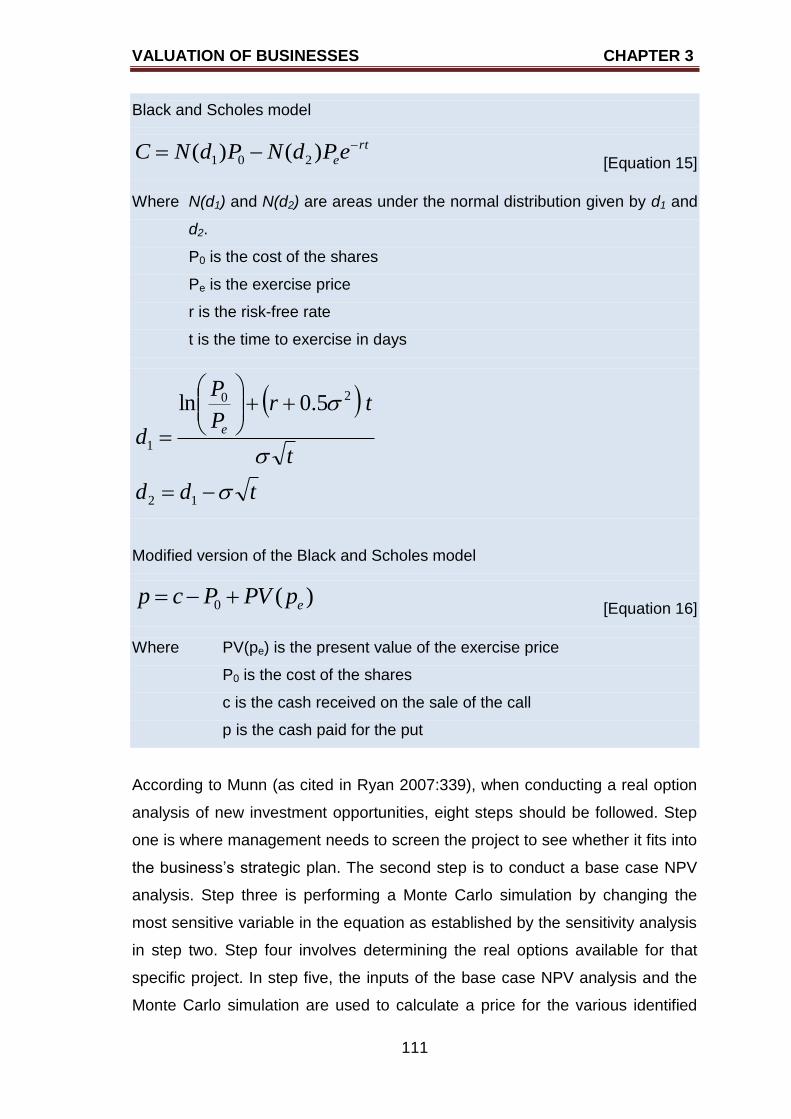
VALUATION OF BUSINESSES CHAPTER 3
111
Black and Scholes model
rt
eePdNPdNC )()( 201 [Equation 15]
Where N(d1) and N(d2) are areas under the normal distribution given by d1 and
d2.
P0 is the cost of the shares
Pe is the exercise price
r is the risk-free rate
t is the time to exercise in days
tdd
t
trP
P
de
12
20
1
5.0ln
Modified version of the Black and Scholes model
)(0 epPVPcp [Equation 16]
Where PV(pe) is the present value of the exercise price
P0 is the cost of the shares
c is the cash received on the sale of the call
p is the cash paid for the put
According to Munn (as cited in Ryan 2007:339), when conducting a real option
analysis of new investment opportunities, eight steps should be followed. Step
one is where management needs to screen the project to see whether it fits into
the business‟s strategic plan. The second step is to conduct a base case NPV
analysis. Step three is performing a Monte Carlo simulation by changing the
most sensitive variable in the equation as established by the sensitivity analysis
in step two. Step four involves determining the real options available for that
specific project. In step five, the inputs of the base case NPV analysis and the
Monte Carlo simulation are used to calculate a price for the various identified

VALUATION OF BUSINESSES CHAPTER 3
112
options. The sixth step focuses on portfolio and resource optimisation, where
management should assess the significance of the project when considering the
business range of investment opportunities. Reporting is step seven, where the
reasons for each recommendation are given in detail. The final step, step eight,
is to update the analysis. The analysis should be updated on a regular basis,
especially if new investment opportunities come to the fore. The only way to
minimise the effects of uncertainty is to update the analysis regularly.
3.5 VARIABLES OF THE VALUATION APPROACHES
Firstly the unknown variables required in the valuation process will be discussed
and possible solutions to determine these variables will be identified. Secondly,
the variables of the various approaches will be identified and clarification with
regard to the usefulness of each for the different types of businesses will be
provided.
3.5.1 Unknown variables
The approaches discussed make use of different variables, such as the
discount rate (required rate of return which is denoted by r) and the dividend
growth rate (denoted by g, g1 and g2 in the various equations). One needs to
know how to estimate these variables as valuation approaches are only as good
as the inputs used in the approaches. Marx et al. (2003:108) stress that it is
important to determine the dividends, growth rate and required rate of return, as
these variables will influence the value of the firm.
According to Els (2010:259), the discount rate and the growth rate can be
estimated using a fundamental analysis of macro, market and micro factors.
Lumby and Jones (2011:351) also refer to the fundamental analysis that can be
used to determine estimates of the future revenues of the business, the costs
associated with generating these revenues, and the possibilities of not
achieving the estimated revenues and incurring the estimated costs. Lasher
(2011:362, 370) concurs that valuation approaches make use of estimated
growth rates to forecast future dividends to determine share prices, but
comment that it is a rather complex task to correctly estimate these variables.
VALUATION OF BUSINESSES CHAPTER 3
113
Exact and precise values are not possible; just an approximation of the share
price can be determined.
Hillier et al. (2010:75, 131) describe the growth rate g to be the sustainable
growth rate of a business, which is the highest growth rate a business can grow
at without increasing financial leverage. Therefore, the sustainable growth rate
is the maximum rate at which a business can grow before additional external
finance (interest-bearing debt) is needed, while keeping the debt/equity ratio
constant. To calculate the growth rate, one needs the retention ratio and the
return on retained earnings. The retention ratio is that part of net profit after tax
(NPAT) that is not paid out to shareholders in the form of dividends, but is rather
reinvested in the business as retained earnings. According to Hillier et al.
(2010:131), the historical return on equity (ROE) can be used to determine the
return on retained earnings.
According to Lumby and Jones (2011:381), the estimation of the dividend
growth rate can be done in two ways. The one method is to use the historical
growth rates to determine the average growth rate of dividends, therefore
making the assumption that dividends will follow that same pattern as in the
past. In many cases, this average growth rate is adjusted to take into account
risks that are new to the industry or business. The second method to determine
the dividend growth rate, as stated by Lumby and Jones (2011:381), is to
calculate the product of the retained earnings of the business and the growing
levels of earnings. This method is based on the following four assumptions:
The business is an all-equity business, therefore there is no debt in the
business.
Only one source of additional investment capital in the form of retained
earnings is used.
The retention ratio, that is, the percentage of NPAT that is reinvested in
the business, remains constant over time.
A constant yearly return is earned on all the investments made, using the
retained earnings.
VALUATION OF BUSINESSES CHAPTER 3
114
Lumby and Jones (2011:389) conclude by saying that both the methods to
estimate the growth rate have serious flaws, and both will yield unsatisfactory
results. The authors suggest that the capital asset pricing model (CAPM) could
be used, but this model also has its own limitations. One critical element of the
CAPM is that the beta values (β) tend to move over time. Beta values are
calculated by using regression analysis, and the data used is again historical
data. This implies that beta values are based on past relationships between a
share‟s return (RE) and the return on the market portfolio (RM). Therefore the
different methods will yield different growth rates, and then the problem that
arises is to choose which one is correct. Lumby and Jones (2011:389) suggest
that the CAPM should be used as the expected growth rate.
3.5.2 Variables and applicability of approaches
Table 3.1 summarises the variables needed for each of the valuation
approaches discussed in section 3.4. The applicability of each approach
regarding the three categories of businesses, namely brick-and-mortar, brick-
and-click, and online, will be provided. The unknown variables that need to be
estimated and the shortcomings of the various approaches will also be
identified.
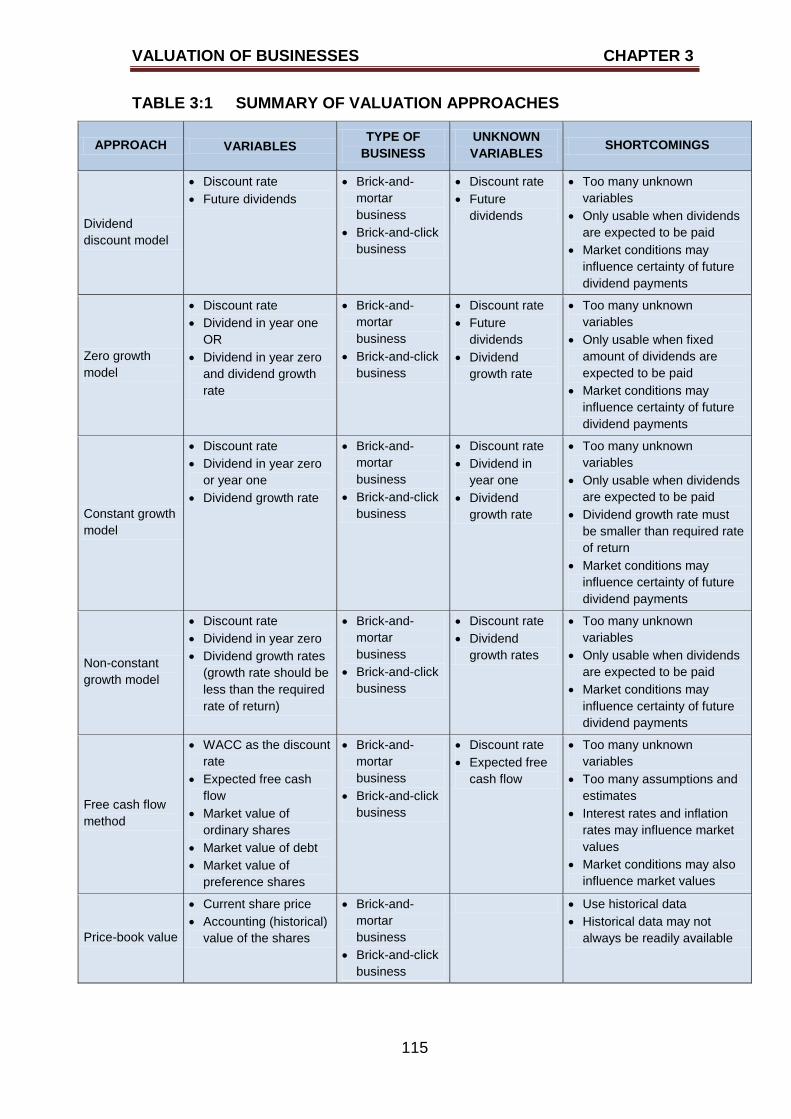
VALUATION OF BUSINESSES CHAPTER 3
115
TABLE 3:1 SUMMARY OF VALUATION APPROACHES
APPROACH VARIABLES TYPE OF
BUSINESS
UNKNOWN
VARIABLES SHORTCOMINGS
Dividend
discount model
Discount rate
Future dividends
Brick-and-
mortar
business
Brick-and-click
business
Discount rate
Future
dividends
Too many unknown
variables
Only usable when dividends
are expected to be paid
Market conditions may
influence certainty of future
dividend payments
Zero growth
model
Discount rate
Dividend in year one
OR
Dividend in year zero
and dividend growth
rate
Brick-and-
mortar
business
Brick-and-click
business
Discount rate
Future
dividends
Dividend
growth rate
Too many unknown
variables
Only usable when fixed
amount of dividends are
expected to be paid
Market conditions may
influence certainty of future
dividend payments
Constant growth
model
Discount rate
Dividend in year zero
or year one
Dividend growth rate
Brick-and-
mortar
business
Brick-and-click
business
Discount rate
Dividend in
year one
Dividend
growth rate
Too many unknown
variables
Only usable when dividends
are expected to be paid
Dividend growth rate must
be smaller than required rate
of return
Market conditions may
influence certainty of future
dividend payments
Non-constant
growth model
Discount rate
Dividend in year zero
Dividend growth rates
(growth rate should be
less than the required
rate of return)
Brick-and-
mortar
business
Brick-and-click
business
Discount rate
Dividend
growth rates
Too many unknown
variables
Only usable when dividends
are expected to be paid
Market conditions may
influence certainty of future
dividend payments
Free cash flow
method
WACC as the discount
rate
Expected free cash
flow
Market value of
ordinary shares
Market value of debt
Market value of
preference shares
Brick-and-
mortar
business
Brick-and-click
business
Discount rate
Expected free
cash flow
Too many unknown
variables
Too many assumptions and
estimates
Interest rates and inflation
rates may influence market
values
Market conditions may also
influence market values
Price-book value
Current share price
Accounting (historical)
value of the shares
Brick-and-
mortar
business
Brick-and-click
business
Use historical data
Historical data may not
always be readily available
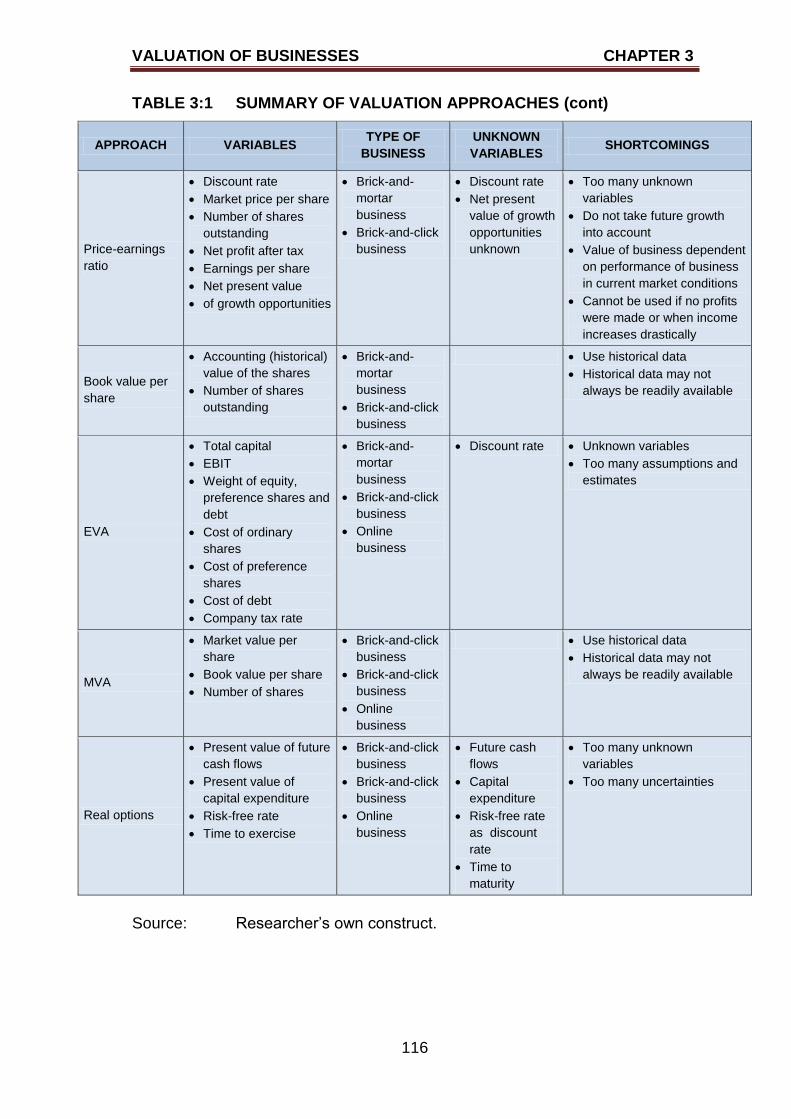
VALUATION OF BUSINESSES CHAPTER 3
116
TABLE 3:1 SUMMARY OF VALUATION APPROACHES (cont)
APPROACH VARIABLES TYPE OF
BUSINESS
UNKNOWN
VARIABLES SHORTCOMINGS
Price-earnings
ratio
Discount rate
Market price per share
Number of shares
outstanding
Net profit after tax
Earnings per share
Net present value
of growth opportunities
Brick-and-
mortar
business
Brick-and-click
business
Discount rate
Net present
value of growth
opportunities
unknown
Too many unknown
variables
Do not take future growth
into account
Value of business dependent
on performance of business
in current market conditions
Cannot be used if no profits
were made or when income
increases drastically
Book value per
share
Accounting (historical)
value of the shares
Number of shares
outstanding
Brick-and-
mortar
business
Brick-and-click
business
Use historical data
Historical data may not
always be readily available
EVA
Total capital
EBIT
Weight of equity,
preference shares and
debt
Cost of ordinary
shares
Cost of preference
shares
Cost of debt
Company tax rate
Brick-and-
mortar
business
Brick-and-click
business
Online
business
Discount rate Unknown variables
Too many assumptions and
estimates
MVA
Market value per
share
Book value per share
Number of shares
Brick-and-click
business
Brick-and-click
business
Online
business
Use historical data
Historical data may not
always be readily available
Real options
Present value of future
cash flows
Present value of
capital expenditure
Risk-free rate
Time to exercise
Brick-and-click
business
Brick-and-click
business
Online
business
Future cash
flows
Capital
expenditure
Risk-free rate
as discount
rate
Time to
maturity
Too many unknown
variables
Too many uncertainties
Source: Researcher‟s own construct.
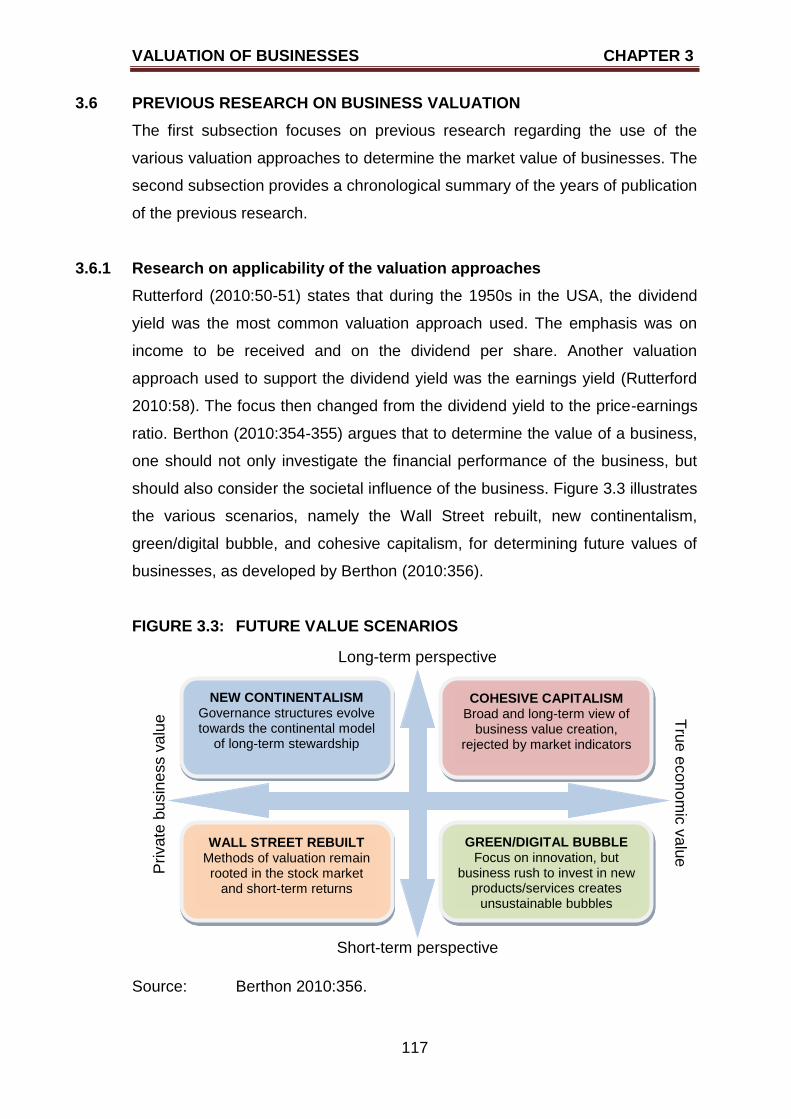
VALUATION OF BUSINESSES CHAPTER 3
117
3.6 PREVIOUS RESEARCH ON BUSINESS VALUATION
The first subsection focuses on previous research regarding the use of the
various valuation approaches to determine the market value of businesses. The
second subsection provides a chronological summary of the years of publication
of the previous research.
3.6.1 Research on applicability of the valuation approaches
Rutterford (2010:50-51) states that during the 1950s in the USA, the dividend
yield was the most common valuation approach used. The emphasis was on
income to be received and on the dividend per share. Another valuation
approach used to support the dividend yield was the earnings yield (Rutterford
2010:58). The focus then changed from the dividend yield to the price-earnings
ratio. Berthon (2010:354-355) argues that to determine the value of a business,
one should not only investigate the financial performance of the business, but
should also consider the societal influence of the business. Figure 3.3 illustrates
the various scenarios, namely the Wall Street rebuilt, new continentalism,
green/digital bubble, and cohesive capitalism, for determining future values of
businesses, as developed by Berthon (2010:356).
FIGURE 3.3: FUTURE VALUE SCENARIOS
Source: Berthon 2010:356.
NEW CONTINENTALISM Governance structures evolve towards the continental model
of long-term stewardship
COHESIVE CAPITALISM Broad and long-term view of
business value creation, rejected by market indicators
WALL STREET REBUILT Methods of valuation remain rooted in the stock market
and short-term returns
GREEN/DIGITAL BUBBLE Focus on innovation, but
business rush to invest in new products/services creates
unsustainable bubbles
Long-term perspective
Short-term perspective
Tru
e e
con
om
ic v
alu
e P
riva
te b
usin
ess v
alu
e
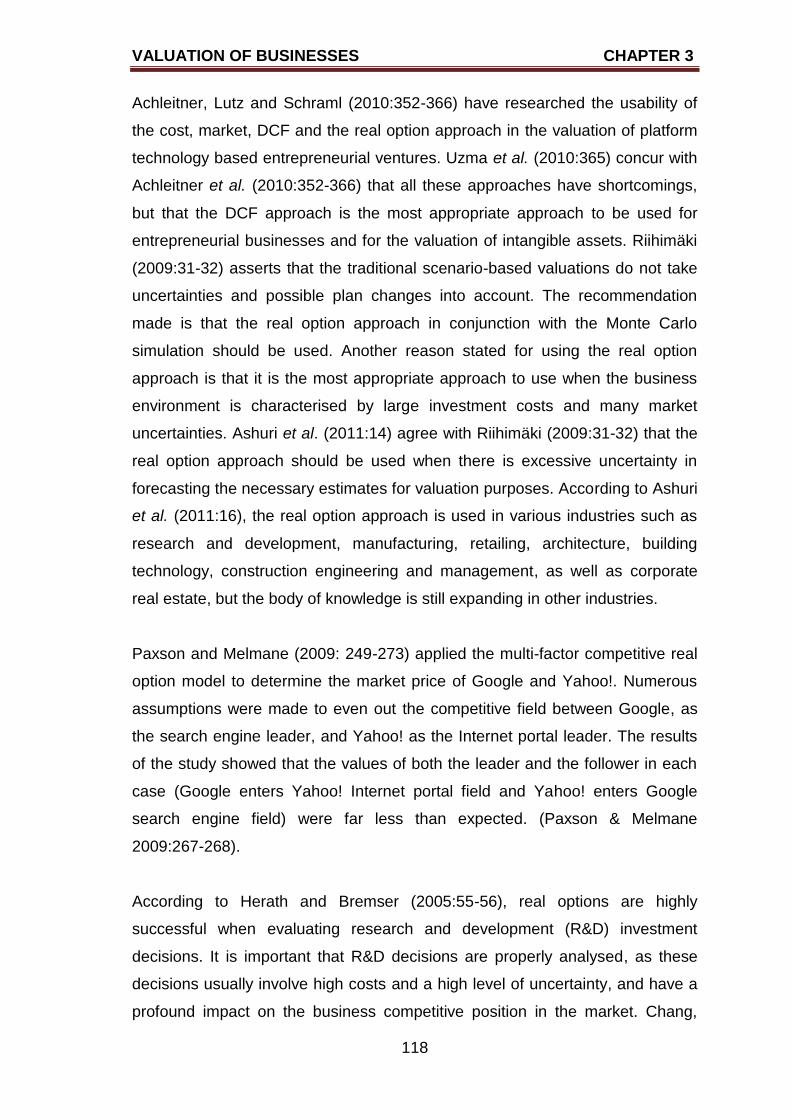
VALUATION OF BUSINESSES CHAPTER 3
118
Achleitner, Lutz and Schraml (2010:352-366) have researched the usability of
the cost, market, DCF and the real option approach in the valuation of platform
technology based entrepreneurial ventures. Uzma et al. (2010:365) concur with
Achleitner et al. (2010:352-366) that all these approaches have shortcomings,
but that the DCF approach is the most appropriate approach to be used for
entrepreneurial businesses and for the valuation of intangible assets. Riihimäki
(2009:31-32) asserts that the traditional scenario-based valuations do not take
uncertainties and possible plan changes into account. The recommendation
made is that the real option approach in conjunction with the Monte Carlo
simulation should be used. Another reason stated for using the real option
approach is that it is the most appropriate approach to use when the business
environment is characterised by large investment costs and many market
uncertainties. Ashuri et al. (2011:14) agree with Riihimäki (2009:31-32) that the
real option approach should be used when there is excessive uncertainty in
forecasting the necessary estimates for valuation purposes. According to Ashuri
et al. (2011:16), the real option approach is used in various industries such as
research and development, manufacturing, retailing, architecture, building
technology, construction engineering and management, as well as corporate
real estate, but the body of knowledge is still expanding in other industries.
Paxson and Melmane (2009: 249-273) applied the multi-factor competitive real
option model to determine the market price of Google and Yahoo!. Numerous
assumptions were made to even out the competitive field between Google, as
the search engine leader, and Yahoo! as the Internet portal leader. The results
of the study showed that the values of both the leader and the follower in each
case (Google enters Yahoo! Internet portal field and Yahoo! enters Google
search engine field) were far less than expected. (Paxson & Melmane
2009:267-268).
According to Herath and Bremser (2005:55-56), real options are highly
successful when evaluating research and development (R&D) investment
decisions. It is important that R&D decisions are properly analysed, as these
decisions usually involve high costs and a high level of uncertainty, and have a
profound impact on the business competitive position in the market. Chang,
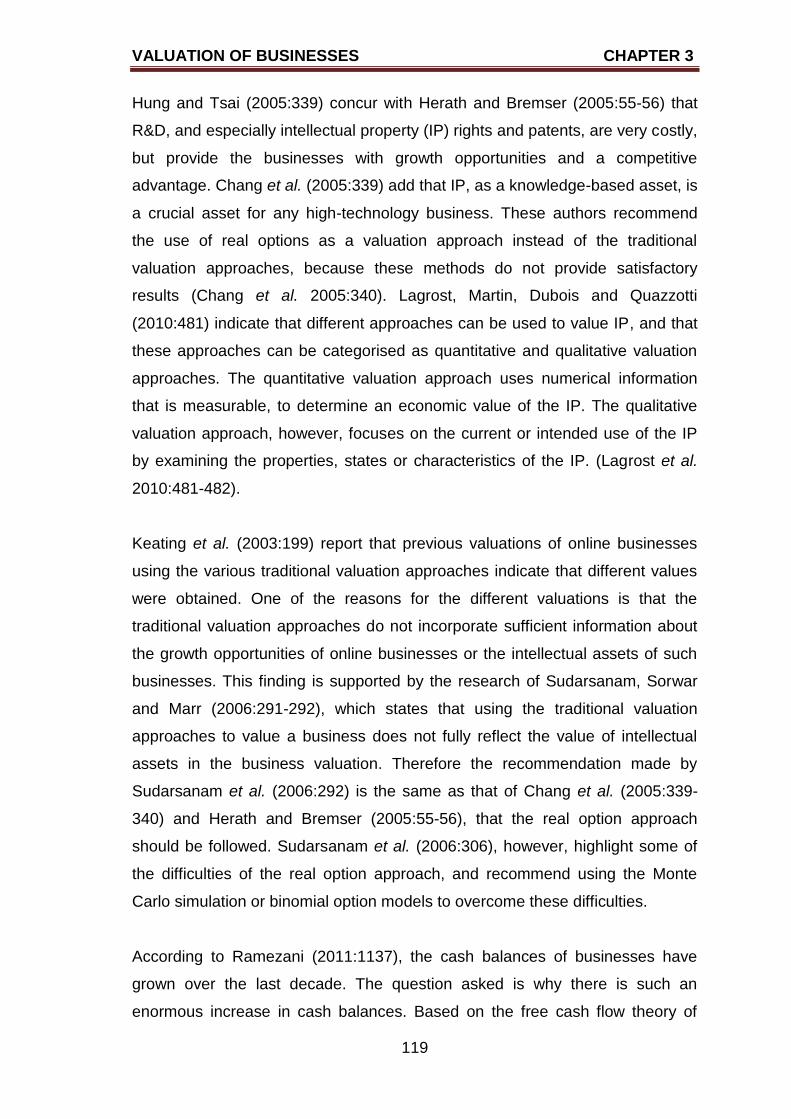
VALUATION OF BUSINESSES CHAPTER 3
119
Hung and Tsai (2005:339) concur with Herath and Bremser (2005:55-56) that
R&D, and especially intellectual property (IP) rights and patents, are very costly,
but provide the businesses with growth opportunities and a competitive
advantage. Chang et al. (2005:339) add that IP, as a knowledge-based asset, is
a crucial asset for any high-technology business. These authors recommend
the use of real options as a valuation approach instead of the traditional
valuation approaches, because these methods do not provide satisfactory
results (Chang et al. 2005:340). Lagrost, Martin, Dubois and Quazzotti
(2010:481) indicate that different approaches can be used to value IP, and that
these approaches can be categorised as quantitative and qualitative valuation
approaches. The quantitative valuation approach uses numerical information
that is measurable, to determine an economic value of the IP. The qualitative
valuation approach, however, focuses on the current or intended use of the IP
by examining the properties, states or characteristics of the IP. (Lagrost et al.
2010:481-482).
Keating et al. (2003:199) report that previous valuations of online businesses
using the various traditional valuation approaches indicate that different values
were obtained. One of the reasons for the different valuations is that the
traditional valuation approaches do not incorporate sufficient information about
the growth opportunities of online businesses or the intellectual assets of such
businesses. This finding is supported by the research of Sudarsanam, Sorwar
and Marr (2006:291-292), which states that using the traditional valuation
approaches to value a business does not fully reflect the value of intellectual
assets in the business valuation. Therefore the recommendation made by
Sudarsanam et al. (2006:292) is the same as that of Chang et al. (2005:339-
340) and Herath and Bremser (2005:55-56), that the real option approach
should be followed. Sudarsanam et al. (2006:306), however, highlight some of
the difficulties of the real option approach, and recommend using the Monte
Carlo simulation or binomial option models to overcome these difficulties.
According to Ramezani (2011:1137), the cash balances of businesses have
grown over the last decade. The question asked is why there is such an
enormous increase in cash balances. Based on the free cash flow theory of
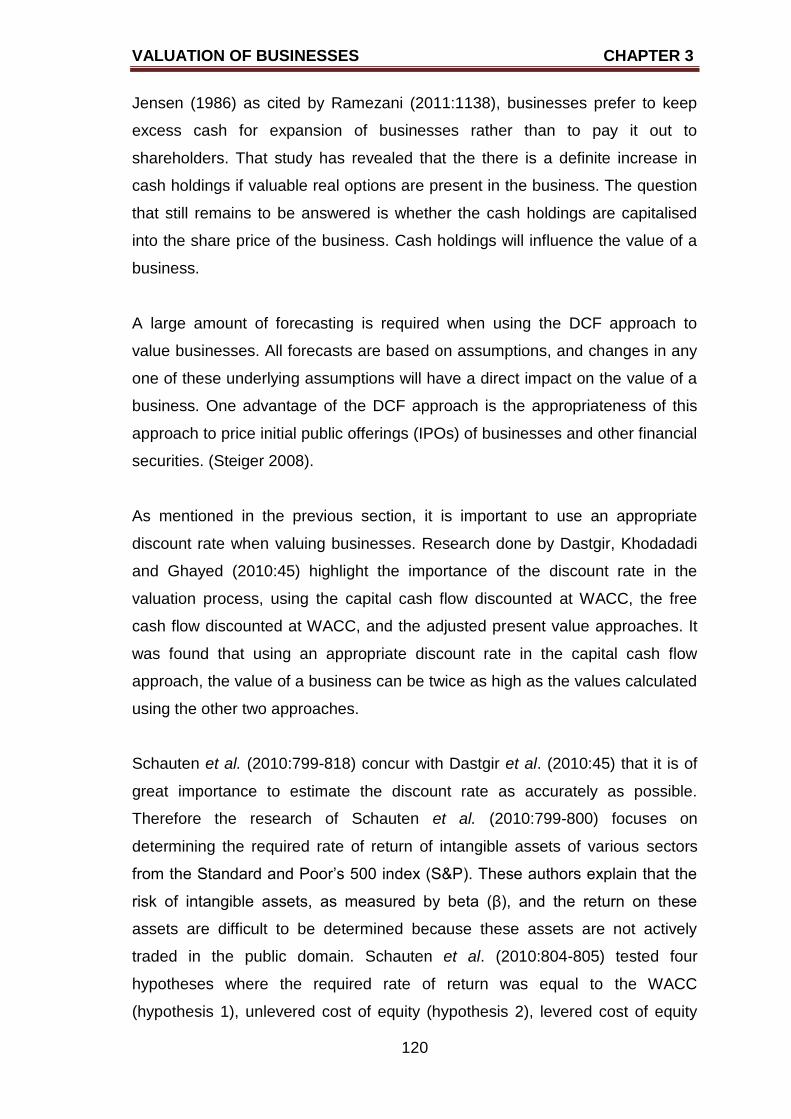
VALUATION OF BUSINESSES CHAPTER 3
120
Jensen (1986) as cited by Ramezani (2011:1138), businesses prefer to keep
excess cash for expansion of businesses rather than to pay it out to
shareholders. That study has revealed that the there is a definite increase in
cash holdings if valuable real options are present in the business. The question
that still remains to be answered is whether the cash holdings are capitalised
into the share price of the business. Cash holdings will influence the value of a
business.
A large amount of forecasting is required when using the DCF approach to
value businesses. All forecasts are based on assumptions, and changes in any
one of these underlying assumptions will have a direct impact on the value of a
business. One advantage of the DCF approach is the appropriateness of this
approach to price initial public offerings (IPOs) of businesses and other financial
securities. (Steiger 2008).
As mentioned in the previous section, it is important to use an appropriate
discount rate when valuing businesses. Research done by Dastgir, Khodadadi
and Ghayed (2010:45) highlight the importance of the discount rate in the
valuation process, using the capital cash flow discounted at WACC, the free
cash flow discounted at WACC, and the adjusted present value approaches. It
was found that using an appropriate discount rate in the capital cash flow
approach, the value of a business can be twice as high as the values calculated
using the other two approaches.
Schauten et al. (2010:799-818) concur with Dastgir et al. (2010:45) that it is of
great importance to estimate the discount rate as accurately as possible.
Therefore the research of Schauten et al. (2010:799-800) focuses on
determining the required rate of return of intangible assets of various sectors
from the Standard and Poor‟s 500 index (S&P). These authors explain that the
risk of intangible assets, as measured by beta (β), and the return on these
assets are difficult to be determined because these assets are not actively
traded in the public domain. Schauten et al. (2010:804-805) tested four
hypotheses where the required rate of return was equal to the WACC
(hypothesis 1), unlevered cost of equity (hypothesis 2), levered cost of equity
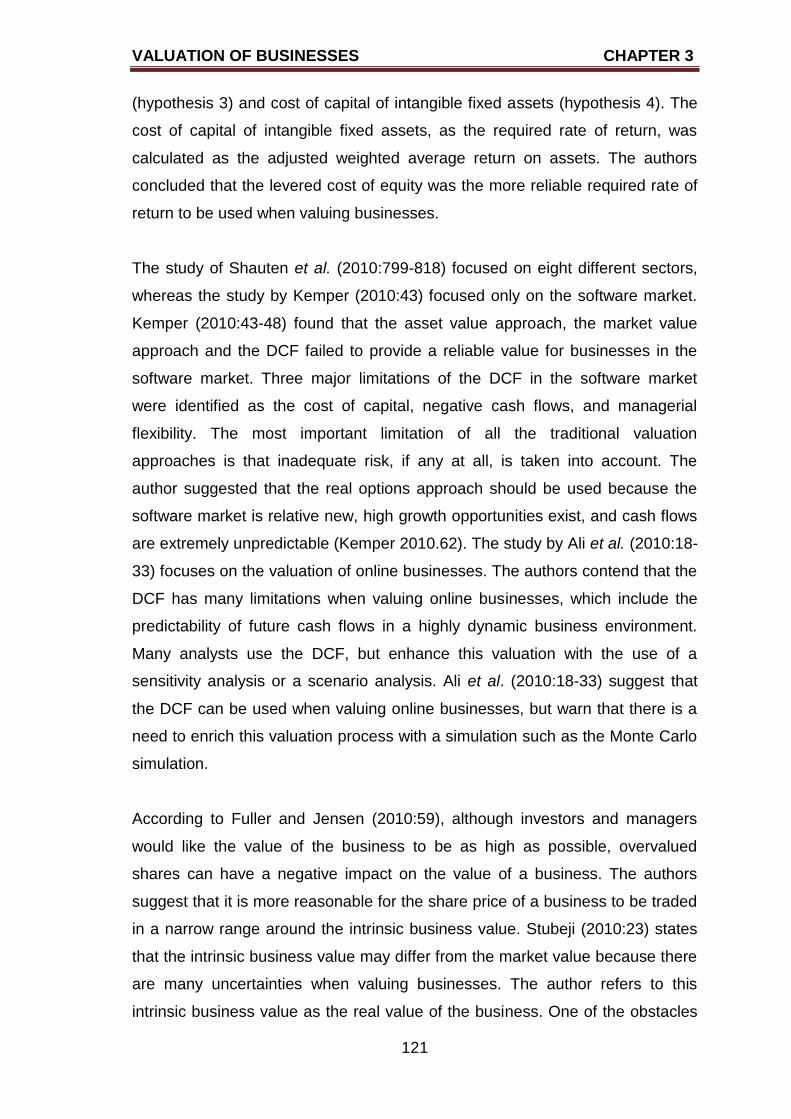
VALUATION OF BUSINESSES CHAPTER 3
121
(hypothesis 3) and cost of capital of intangible fixed assets (hypothesis 4). The
cost of capital of intangible fixed assets, as the required rate of return, was
calculated as the adjusted weighted average return on assets. The authors
concluded that the levered cost of equity was the more reliable required rate of
return to be used when valuing businesses.
The study of Shauten et al. (2010:799-818) focused on eight different sectors,
whereas the study by Kemper (2010:43) focused only on the software market.
Kemper (2010:43-48) found that the asset value approach, the market value
approach and the DCF failed to provide a reliable value for businesses in the
software market. Three major limitations of the DCF in the software market
were identified as the cost of capital, negative cash flows, and managerial
flexibility. The most important limitation of all the traditional valuation
approaches is that inadequate risk, if any at all, is taken into account. The
author suggested that the real options approach should be used because the
software market is relative new, high growth opportunities exist, and cash flows
are extremely unpredictable (Kemper 2010.62). The study by Ali et al. (2010:18-
33) focuses on the valuation of online businesses. The authors contend that the
DCF has many limitations when valuing online businesses, which include the
predictability of future cash flows in a highly dynamic business environment.
Many analysts use the DCF, but enhance this valuation with the use of a
sensitivity analysis or a scenario analysis. Ali et al. (2010:18-33) suggest that
the DCF can be used when valuing online businesses, but warn that there is a
need to enrich this valuation process with a simulation such as the Monte Carlo
simulation.
According to Fuller and Jensen (2010:59), although investors and managers
would like the value of the business to be as high as possible, overvalued
shares can have a negative impact on the value of a business. The authors
suggest that it is more reasonable for the share price of a business to be traded
in a narrow range around the intrinsic business value. Stubeji (2010:23) states
that the intrinsic business value may differ from the market value because there
are many uncertainties when valuing businesses. The author refers to this
intrinsic business value as the real value of the business. One of the obstacles
VALUATION OF BUSINESSES CHAPTER 3
122
when using the various valuation approaches where the input data is obtained
from the financial statements of the business, is that the financial statements
cannot justly reflect all the future growth and earnings potentials of the
business. The main reason is that the intangible assets of the business are not
always accurately recorded in terms of their value. The author adds that when
valuing a business, one should guard against bias data (as many input data
items are estimates), uncertain futures, and the ease of obtaining data for
valuing businesses. (Stubeji 2010:24).
Garay and González (2010) explain that value creation is also a result of
minimising the forecasting risk and the cost of capital, through the recognition
and assessment of investment opportunities. They argue that there is evidence
that good corporate governance is positively related to market value. Therefore
the better the corporate governance of a business, the higher the market value
of that business will be.
Many businesses do not pay dividends, but rather reinvest the NPAT in the
business. The question arises why businesses follow this route. If one considers
the fact that the value of a business‟s intellectual capital is equal to the value of
intellectual assets of that business, then investors are acknowledging the
potential of the intellectual capital. Investors will even go a step further to pay a
higher price per share than the book value per share, because of this future
potential. (Grajkowska 2011:179-201). This future potential of the business can
be regarded as the competitive advantage of the business. Therefore it will not
make sense if the business reports on the competitive advantage, as this
advantage will then be lost. Businesses will only report on these intangible
secrets when there is an absolute need for it. Valuators, financial analysts and
fund managers regard these intangible secrets as highly significant in the
valuation process (Holland 2009:154-155). Abdallah and Maghrabi (2009:116)
agree that the know-how of the business needs to be safeguarded because it
provides the business with a competitive advantage. They also suggest that
these intangible assets need to be valued differently from tangible assets. The
reason is that the intangible assets, especially in high-tech industries, are
unique assets providing a competitive advantage for the business. It is
VALUATION OF BUSINESSES CHAPTER 3
123
unreasonable to expect businesses to share these unique assets or intellectual
property with external valuators.
Farooq et al. (2010:141-142) are of the opinion that academics prefer to use the
DCF and EVA when valuing businesses, whereas valuators prefer to use the
less complex approaches such as the P/E and the price-to-book ratios. The
research also shows that balance sheets and book values of assets are
becoming more significant, while the importance of income statements is
becoming less. Another aspect of importance is that the cash flow based
approaches may provide erroneous intrinsic values of the business‟s assets
which were a result of the various uncertainties in the valuation process. A
study by Francis as cited by Farooq et al. (2010:145) compares the intrinsic
values of assets using three valuation approaches, namely the DDM, the free
cash flow approach, and EVA. This research found that EVA provided the more
reliable intrinsic values of the assets. According to Farooq et al. (2010:147), the
unique characteristics of the various industries are important when valuing
businesses, and it is possible for certain valuation approaches to provide more
reliable results in certain industries. Farooq et al. (2010:157) conclude that
much research in the field of valuation is required, and one specific domain of
research is the influence of corporate governance in the valuation of equity.
Fernández (2007a:28-29) points out various common errors when undertaking
a business valuation. The errors, to mention a few, and the list is not exhausted
by any means, include the following:
the use of the historical beta or the average of betas of the businesses in
the same industry;
the incorrect handling of seasonal working capital requirements;
the incorrect handling of cash equivalent shares;
assuming that a business has the same value for all buyers and sellers;
taking the price of a business as the value of the business; and
using a valuation from a valuator without having any input in the valuation
process.
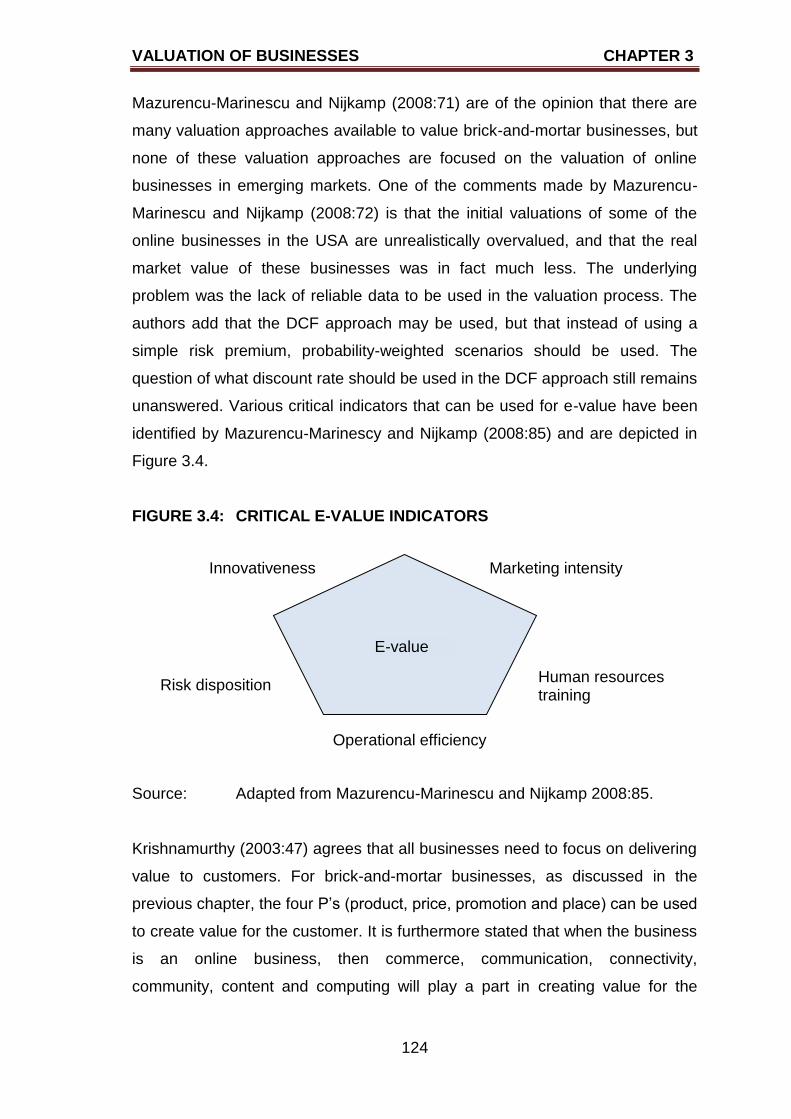
VALUATION OF BUSINESSES CHAPTER 3
124
Mazurencu-Marinescu and Nijkamp (2008:71) are of the opinion that there are
many valuation approaches available to value brick-and-mortar businesses, but
none of these valuation approaches are focused on the valuation of online
businesses in emerging markets. One of the comments made by Mazurencu-
Marinescu and Nijkamp (2008:72) is that the initial valuations of some of the
online businesses in the USA are unrealistically overvalued, and that the real
market value of these businesses was in fact much less. The underlying
problem was the lack of reliable data to be used in the valuation process. The
authors add that the DCF approach may be used, but that instead of using a
simple risk premium, probability-weighted scenarios should be used. The
question of what discount rate should be used in the DCF approach still remains
unanswered. Various critical indicators that can be used for e-value have been
identified by Mazurencu-Marinescy and Nijkamp (2008:85) and are depicted in
Figure 3.4.
FIGURE 3.4: CRITICAL E-VALUE INDICATORS
Source: Adapted from Mazurencu-Marinescu and Nijkamp 2008:85.
Krishnamurthy (2003:47) agrees that all businesses need to focus on delivering
value to customers. For brick-and-mortar businesses, as discussed in the
previous chapter, the four P‟s (product, price, promotion and place) can be used
to create value for the customer. It is furthermore stated that when the business
is an online business, then commerce, communication, connectivity,
community, content and computing will play a part in creating value for the
Innovativeness
Risk disposition
Marketing intensity
Human resources training
E-value
Operational efficiency
VALUATION OF BUSINESSES CHAPTER 3
125
customer. All these indicators, see Figure 3.4, have also been highlighted by
Mazurencu-Marinescu and Nijkamp (2008:85).
As mentioned previously, the information element of the new economy is highly
significant, and is especially true for online businesses. According to Li
(2007:37), the importance of the information element is evident in the market
capitalisation of businesses and in their physical assets As stated by
Athanassakos (2007:1-15), online businesses use the same valuation
standards and rules as brick-and-mortar and brick-and-click businesses, but it is
essential that the traditional valuation approaches are adapted to address the
unique characteristics of online business. Hering, Olbrich and Steinrucke
(2006:55-72) emphasise that in evaluating online businesses, the approach
used is not as important as the forecasts used. According to
PricewaterhouseCoopers, as stated by Hall (2011a), traditional valuation
approaches are inappropriate for the valuation of online businesses.
McCutcheon (2008:79) agrees that the DCF approach to valuing businesses
does not satisfactorily record the future value of e-businesses, and therefore the
market value of the business will not be accurately determined. All these
authors have identified a need for a new approach to valuing Internet-based
businesses and have therefore suggested that a new valuation approach is
required to overcome the various shortcomings.
3.6.2 Summary of findings of previous research on valuation
The findings of previous research on various valuation approaches as
discussed in section 3.6.1 are summarised in Table 3.2. The various authors
are listed, and the main findings of the research highlighted.
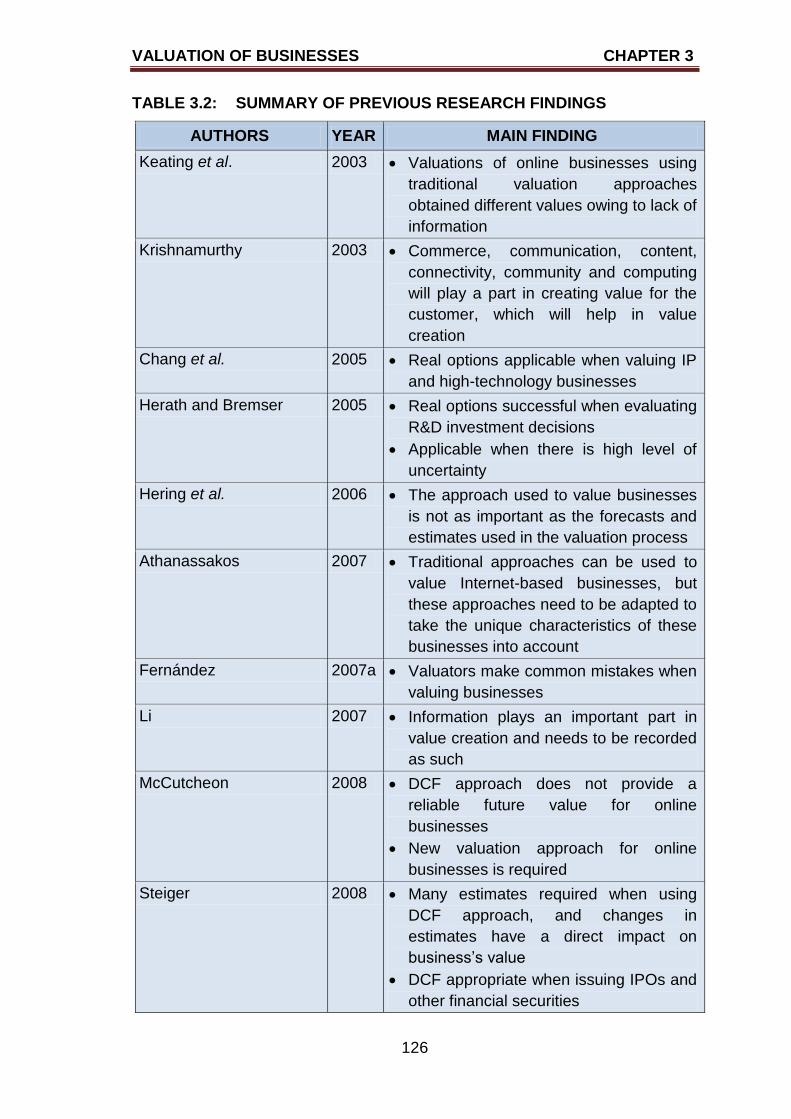
VALUATION OF BUSINESSES CHAPTER 3
126
TABLE 3.2: SUMMARY OF PREVIOUS RESEARCH FINDINGS
AUTHORS YEAR MAIN FINDING
Keating et al. 2003 Valuations of online businesses using
traditional valuation approaches
obtained different values owing to lack of
information
Krishnamurthy 2003 Commerce, communication, content,
connectivity, community and computing
will play a part in creating value for the
customer, which will help in value
creation
Chang et al. 2005 Real options applicable when valuing IP
and high-technology businesses
Herath and Bremser 2005 Real options successful when evaluating
R&D investment decisions
Applicable when there is high level of
uncertainty
Hering et al. 2006 The approach used to value businesses
is not as important as the forecasts and
estimates used in the valuation process
Athanassakos 2007 Traditional approaches can be used to
value Internet-based businesses, but
these approaches need to be adapted to
take the unique characteristics of these
businesses into account
Fernández 2007a Valuators make common mistakes when
valuing businesses
Li 2007 Information plays an important part in
value creation and needs to be recorded
as such
McCutcheon 2008 DCF approach does not provide a
reliable future value for online
businesses
New valuation approach for online
businesses is required
Steiger 2008 Many estimates required when using
DCF approach, and changes in
estimates have a direct impact on
business‟s value
DCF appropriate when issuing IPOs and
other financial securities
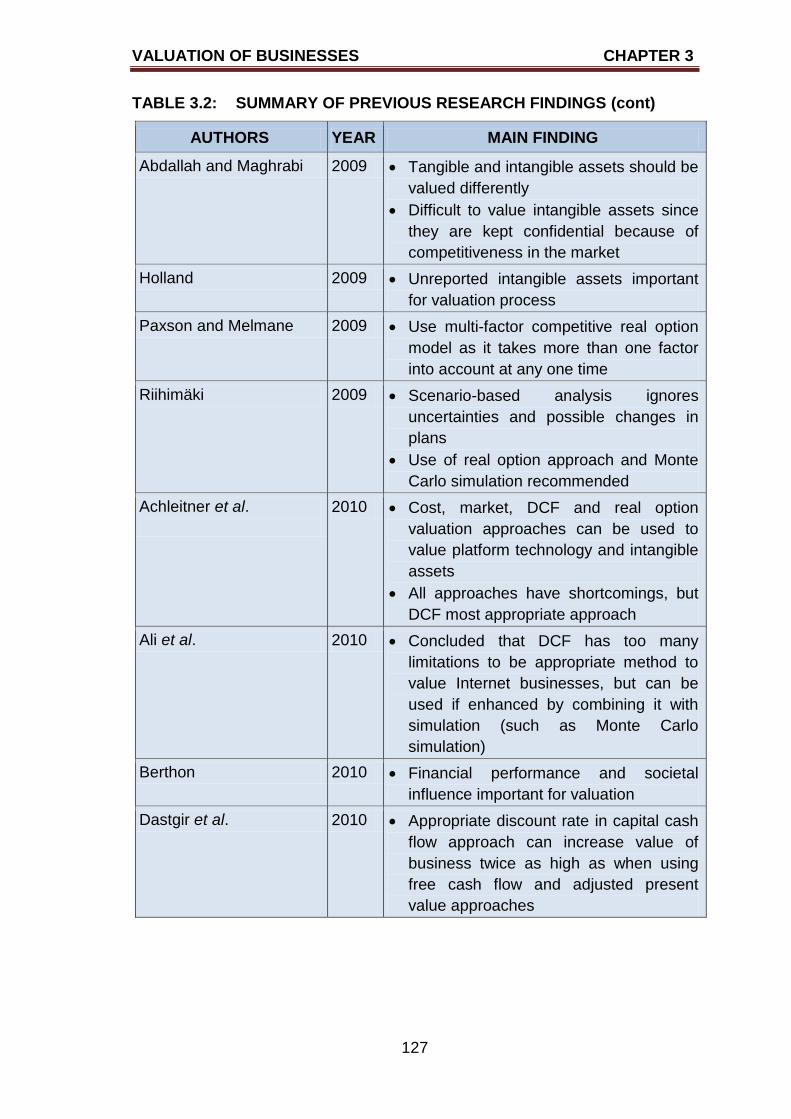
VALUATION OF BUSINESSES CHAPTER 3
127
TABLE 3.2: SUMMARY OF PREVIOUS RESEARCH FINDINGS (cont)
AUTHORS YEAR MAIN FINDING
Abdallah and Maghrabi 2009 Tangible and intangible assets should be
valued differently
Difficult to value intangible assets since
they are kept confidential because of
competitiveness in the market
Holland 2009 Unreported intangible assets important
for valuation process
Paxson and Melmane 2009 Use multi-factor competitive real option
model as it takes more than one factor
into account at any one time
Riihimäki 2009 Scenario-based analysis ignores
uncertainties and possible changes in
plans
Use of real option approach and Monte
Carlo simulation recommended
Achleitner et al.
2010 Cost, market, DCF and real option
valuation approaches can be used to
value platform technology and intangible
assets
All approaches have shortcomings, but
DCF most appropriate approach
Ali et al. 2010 Concluded that DCF has too many
limitations to be appropriate method to
value Internet businesses, but can be
used if enhanced by combining it with
simulation (such as Monte Carlo
simulation)
Berthon 2010 Financial performance and societal
influence important for valuation
Dastgir et al. 2010 Appropriate discount rate in capital cash
flow approach can increase value of
business twice as high as when using
free cash flow and adjusted present
value approaches
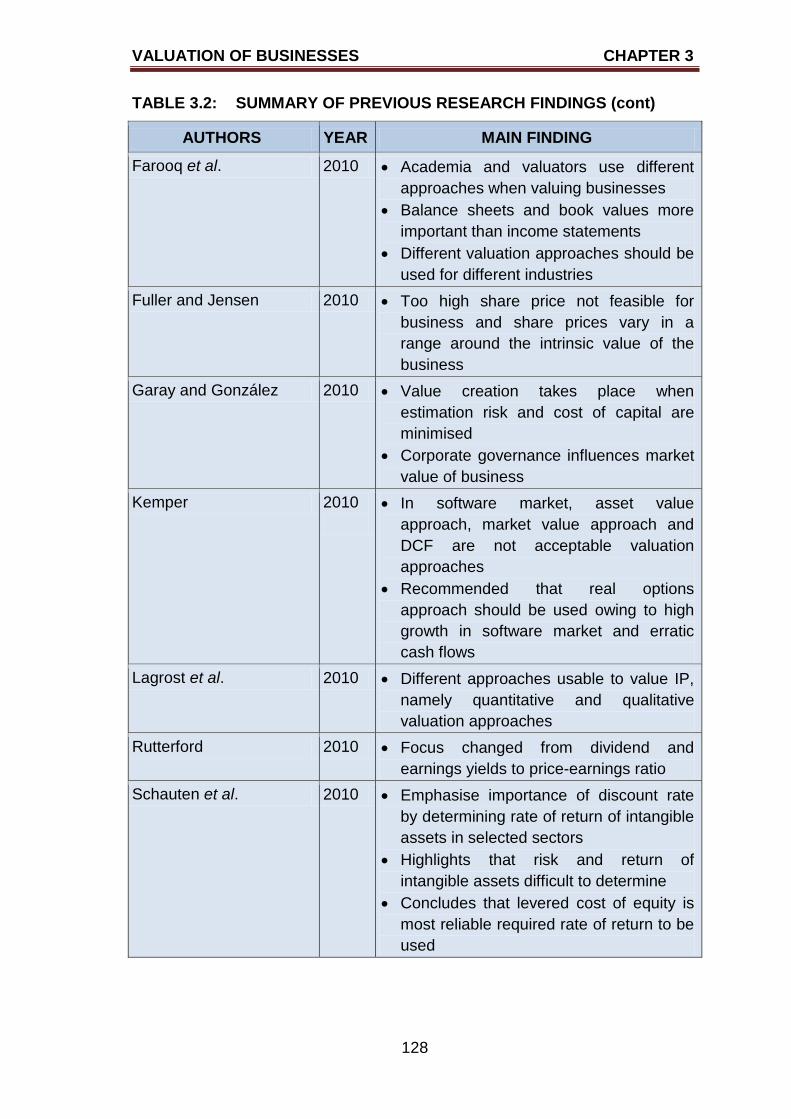
VALUATION OF BUSINESSES CHAPTER 3
128
TABLE 3.2: SUMMARY OF PREVIOUS RESEARCH FINDINGS (cont)
AUTHORS YEAR MAIN FINDING
Farooq et al. 2010 Academia and valuators use different
approaches when valuing businesses
Balance sheets and book values more
important than income statements
Different valuation approaches should be
used for different industries
Fuller and Jensen 2010 Too high share price not feasible for
business and share prices vary in a
range around the intrinsic value of the
business
Garay and González 2010 Value creation takes place when
estimation risk and cost of capital are
minimised
Corporate governance influences market
value of business
Kemper 2010
In software market, asset value
approach, market value approach and
DCF are not acceptable valuation
approaches
Recommended that real options
approach should be used owing to high
growth in software market and erratic
cash flows
Lagrost et al. 2010 Different approaches usable to value IP,
namely quantitative and qualitative
valuation approaches
Rutterford 2010 Focus changed from dividend and
earnings yields to price-earnings ratio
Schauten et al. 2010 Emphasise importance of discount rate
by determining rate of return of intangible
assets in selected sectors
Highlights that risk and return of
intangible assets difficult to determine
Concludes that levered cost of equity is
most reliable required rate of return to be
used
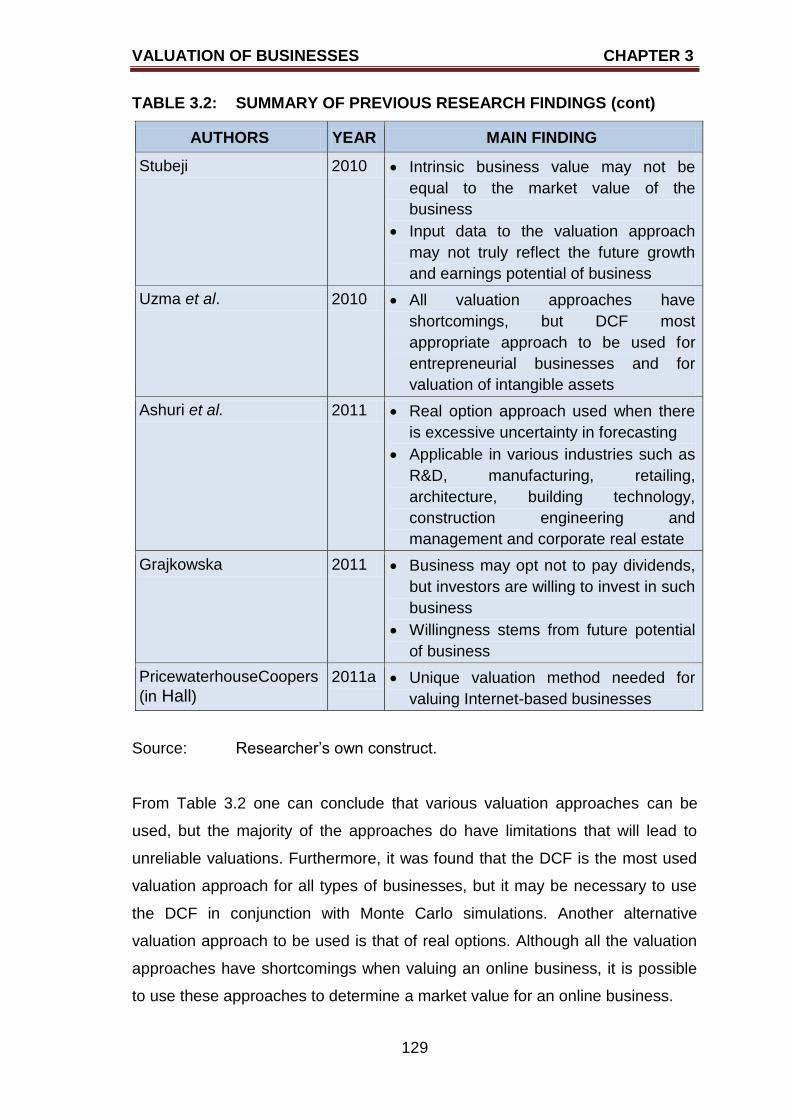
VALUATION OF BUSINESSES CHAPTER 3
129
TABLE 3.2: SUMMARY OF PREVIOUS RESEARCH FINDINGS (cont)
AUTHORS YEAR MAIN FINDING
Stubeji 2010 Intrinsic business value may not be
equal to the market value of the
business
Input data to the valuation approach
may not truly reflect the future growth
and earnings potential of business
Uzma et al. 2010 All valuation approaches have
shortcomings, but DCF most
appropriate approach to be used for
entrepreneurial businesses and for
valuation of intangible assets
Ashuri et al. 2011 Real option approach used when there
is excessive uncertainty in forecasting
Applicable in various industries such as
R&D, manufacturing, retailing,
architecture, building technology,
construction engineering and
management and corporate real estate
Grajkowska 2011 Business may opt not to pay dividends,
but investors are willing to invest in such
business
Willingness stems from future potential
of business
PricewaterhouseCoopers
(in Hall) 2011a Unique valuation method needed for
valuing Internet-based businesses
Source: Researcher‟s own construct.
From Table 3.2 one can conclude that various valuation approaches can be
used, but the majority of the approaches do have limitations that will lead to
unreliable valuations. Furthermore, it was found that the DCF is the most used
valuation approach for all types of businesses, but it may be necessary to use
the DCF in conjunction with Monte Carlo simulations. Another alternative
valuation approach to be used is that of real options. Although all the valuation
approaches have shortcomings when valuing an online business, it is possible
to use these approaches to determine a market value for an online business.
VALUATION OF BUSINESSES CHAPTER 3
130
3.7 VALUATION OF INTERNET-BASED BUSINESSES
The section to follow will focus on approaches that were used to value Internet-
based businesses, the intrinsic value of Internet-based businesses, and lastly
the income generation of this type of business.
3.7.1 Approaches to Internet-based business valuations
A study done by Ho, Liao and Kim (2011) investigated the use of both data
envelopment analysis (DEA) and multiple valuation approaches to value
Internet-based businesses. The four valuation approaches that were
recommended were tested based on the price-to-gross margin ratio of 52
Internet-based businesses. When the valuations were compared to the real
prices, it was found the suggested approaches provided a 70% accuracy rate.
Athanassakos (2007:1-15) determined that the traditional valuation approaches
as discussed in section 3.4 provided very low P/E ratios. The author
furthermore argued that high P/E ratios were founded in the lower risks
associated with Internet businesses‟ cash flows, provided that these businesses
were successful in the initial phases. Seol (2010:145-162) rejected the use of
the Monte Carlo simulation when valuing technologies, such as in the case of
Internet-based businesses. Parker (n.d.) stated that to establish the value of an
Internet-based business is one of the most difficult tasks a prospective buyer
needs to perform. The author identified five ways to conduct an Internet-based
business valuation, as follows:
An asset valuation is when the value of all the assets of a business is
determined and the total asset value is then the value of the business.
This valuation approach is not applicable to small businesses, regardless
of whether the business is a brick-and-mortar or Internet-based business.
A liquidation valuation involves determining the value of all the assets if
the business is forced to sell as quickly as possible.
Income capitalisation refers to the forecasting of the future income of the
business based on historical data and various assumptions. This
approach can be used to value large businesses.
The income multiplier is when the business is sold at a price “so many”
times more than earnings. The number of times that need to be used in
VALUATION OF BUSINESSES CHAPTER 3
131
the equation will be determined by the benefit the owner will receive. The
owner benefits are calculated using the monetary amount the owner will
be able to withdraw from the business based on the historical income
generation of the website.
The rule of thumb is when a business is valued based on the value of a
similar business. This approach is difficult to use because there are
seldom businesses that can be used as a benchmark.
Grajkowska (2011:179-201) also identifies three approaches to value
intellectual assets of a business. According to this study intellectual assets
include organisational resources, human resources and relational resources.
Organisational resources comprise intellectual property, explicit knowledge and
other intangibles. Customer and partner values form the basis for relational
resources. The three approaches identified by Grajkowska (2011:179-201) are
the cost approach, the market approach and the income approach. The cost
approach states that the value of intellectual assets is the sum of the amount
invested in the development of such assets and the expenses incurred in the
creation of such assets. Using the market approach to value intellectual assets
is to determine how much a buyer is willing to pay for these assets, and can be
based on historical transactions. The income approach determines the present
value of all future cash flows that the intellectual assets will bring into the
business. It is important to note that intellectual assets may lead to increased
cash flows generated by direct income from sales or licensing, cost savings
incurred, and additional income earned as a premium brand. Importantly, the
author discards the cost and market approaches because these approaches do
not take the future benefits of the intellectual assets into account.
According to Kim, Song and Koo (2008:203), strategic positioning of a business
has an influence on business performance. This research has shown that
businesses following different strategic positioning strategies together with
technology resources strongly affect business performance, which will be
reflected in the value of the business. Research by Nagam and Kautz (2008:62-
64) focused on the relationship between information technology and the
performance of the business. An event study method was followed. The findings
VALUATION OF BUSINESSES CHAPTER 3
132
showed that if information technology investments announcement are made,
then share prices will be influenced and therefore the market value of the
business will be affected.
An important aspect that needs to be addressed when valuing Internet-based
businesses is that these businesses are extremely rich in intellectual assets.
These assets provide the businesses with a competitive advantage and
therefore should be kept confidential. The question then is how to value the
business without destroying its competitive advantage (Johanson, Koga,
Almqvist & Skoog 2009:521). Allee (2008:5-8) agrees that intangible assets,
such as professional expertise (intellectual assets) need to be valued, but
should be transformed into a more measurable format, such as consulting
services, before being valued. The author adds that intangibles assets comprise
three dimensions, namely:
the negotiable forms of value of intangible assets;
how intangible assets are managed as deliverables; and
how tangible and intangible assets are transformed into other forms of
value and how inputs are used to increase the value of both asset
classes.
The literature research by O‟Brien and Tian (2008:6) found that there is a
negative correlation between market value and earnings. One reason posed for
the negative correlation is the use of different valuation approaches, although
the various approaches were not mentioned. A further finding was that when
investigating the net income in more detail, a positive correlation was found
between market value and both gross profit and research and development
expenditures.
Kettles and David (2008:2-8) studied the value of investments in social network
technologies. The research concluded that businesses should focus on the key
features of business platforms for social networking. Once these features were
in place, then businesses should be able to use social networking successfully
to create a competitive advantage.
VALUATION OF BUSINESSES CHAPTER 3
133
3.7.2 Intrinsic values of Internet-based businesses
Google acquired Applied Semantics Inc, an online advertisements upstart, in
2003 for US$102 million. On 17 November 2005 Google‟s share price exceeded
the US$400 per share mark, while the market capitalisation was equal to
US$120 billion. The price-earnings ratio was 70. Google was also in
negotiations with AOL, where AOL‟s value was estimated to be approximately
US$20 billion. (Farzad et al. 2005). On 11 January 2006 Google‟s share price
was US$475 per share, after which it plummeted to US$343 per share on 14
February 2006 and the market capitalisation declined to US$101 billion. Google
was not alarmed like other giant Internet-based businesses, namely,
Amazon.com, Yahoo! and eBay, which also showed a steep decline in share
prices. It was said that some economists suggested that the real value for one
Google share was as little as US$188 in the beginning of 2006. In February
2006 a Wall Street Internet analyst determined that the share price of Google
should be in excess of US$400, and using the DCF for the following ten years
(cash flows from 2006 to 2016), a fair market value for one Google share would
be US$413. When using other valuation approaches, the share price reached a
level of US$597. The analyst used an 11.5% discount rate when using the
various valuation approaches. („Enthusiasm for Google‟ 2006).
PricewaterhouseCoopers, as cited by Hall (2011a), stated that it was possible to
justify the high valuations of Internet-based businesses, and that extremely high
P/E ratios should not always been seen as a business being overvalued. The
true value of Internet-based businesses would only be seen in the long term.
The attraction and retaining of subscribers would be the justification for such
high P/E ratios (Hall 2011a).
eBay bought Skype Technologies for US$2.6 billion in September 2005 (Farzad
et al. 2005). In 2000, Yahoo! shares were trading at 89 times revenues, and in
2005 the market capitalisation was US$115 billion (Farzad et al. 2005; Nerney
2000). In 2008, AOL paid 42.5 times income to acquire Bebo, while Microsoft
paid 50 times income to acquire a stake in Facebook (Sadighi 2008:1).
VALUATION OF BUSINESSES CHAPTER 3
134
The market capitalisation of DoubleClick in 1999 was US$14 billion, but in April
2005 DoubleClick was acquired by a private equity firm for a little more than
US$1 billion (Farzad et al. 2005). The IPO value of Groupon, an online network
where people can trade products and/or services, is between US$15 billion and
US$20 billion (Miller 2011). In the beginning of 2011, Facebook was valued at
US$50 billion and in May 2011 the value increased to US$70 billion (Miller
2011). One of the major concerns regarding the valuation of such social media
is the income models used to forecast the future cash flows.
Amazon.com started trading on 6 July 1995, and in July 2010 it was regarded
as one of the largest online retailers in the world, selling a diverse range of
products and services (Webley 2010). On 27 July 2011, it was recorded that
Amazon.com‟s market capitalisation reached US$101.81 billion, and that the
shares were trading at an all-time high of US$227.20 per share. The major
competitors to Amazon.com are Hewlett Packard and eBay with market
capitalisations of US$76 billion and US$43 billion respectively. Over the last five
years, Amazon.com‟s value has increased by nine times, while Apple Inc has
increased by at least six times. (Rao 2011; Wilson 2011). Since June 1999
when Amazon.com acquired Alexa Internet, many acquisitions and partnerships
followed. Some of the acquisitions include Joyo.com Limited (September 2004),
Booksurge LLC (April 2005), Shopbop.com (February 2006), Audible (March
2008), AbeBooks (December 2008), Zappos.com (July 2009), BuyVIP.com
(October 2010) and LOVEFilm International Limited (January 2011). (History &
Timeline 2011; History of Amazon.com 2008). The latest acquisition by
Amazon.com as announced on 19 March 2012 will be that of Kiva Systems,
which will be bought for US$775 million in cash (Kucera 2012).
3.7.3 Income generation of Internet-based businesses
Krishnamurthy (2003:51-52) explains that Internet-based businesses generate
income from various streams, namely commerce, advertising, fees, sale of
consumer information, and credit. Commerce refers to the actual trading of
products and/or services. Advertising is also an important income stream,
because interested businesses buy advertising space on websites. Internet-
based businesses can generate income by asking individual customers and
VALUATION OF BUSINESSES CHAPTER 3
135
businesses to pay certain fees. Examples of such fees are subscriber fees,
brokerage fees and fees for using technology. eBay, for example, only collect a
small fee once a product has been auctioned. A database with consumer
behaviour information can also be sold to third parties to generate income.
Credit is when the Internet-based business receives payment from customers
immediately for products and/or services to be delivered, while the suppliers of
the Internet-based business are only paid at some future date. (Krishnamurthy
2003:136). A study by Swatman, Krueger and Van der Beek (2006:66-67)
identified five sources of income for online newspapers, namely:
online edition subscription fees;
pay per article or per view of individual items in the online edition;
selling of products related to the information offered in the print and
online editions;
selling of advertising space for print and online editions; and
selling exclusive banner or text advertising space in the online edition.
It is important to consider the income streams of Internet-based businesses
because these businesses have intangible and intellectual assets that can be
used to manage the marketing mix. Internet-based businesses also interact and
have linkages with one another, and these linkages may be converted into a
profitable income stream. It is also critical for the Internet-based businesses to
consider the cost of obtaining income. If the cost of attracting customers is very
high, then the business should consider whether it is feasible to continue with
that specific income stream as the cost may be outweigh the income that is
generated. (Krishnamurthy 2003:52).
One should also realise that income streams are merely estimates that are
based on assumptions. Krishnamurthy (2003:58-59) has identified four
guidelines for forecasting, namely:
use experts in the field of forecasting;
VALUATION OF BUSINESSES CHAPTER 3
136
scrutinise similar businesses and industries for similarities and
differences;
consider the cyclical nature of the various income streams and how they
will affect the business holistically; and
divide the main aim into smaller issues, and solve each issue individually.
As mentioned, estimates or forecasts are based on assumptions. Therefore
there are many pitfalls when estimating forecasts. Some of the pitfalls that
should be avoided include a too aggressive growth rate, a growth rate that
cannot be justified, the manageability of the growth rate, and the lack of
planning for all situations. (Krishnamurthy 2003:59).
Search engines generate income using various methods, such as paid
inclusion, pay per click, and pay per sale. Paid inclusion refers to a flat fee or
annual fee charged to be included in a search engine. The pay per click occurs
when advertisers on search engines pay a certain amount per click on their
advertisements. Pay per click advertisements are usually sold in auction style,
where the highest bidder will obtain the highest ranking (position number one)
on the list. Therefore the amount paid by the advertisers will depend on the
traffic to their advertisements from the search engine page. (Wall 2010). Pay
per sale occurs when the search engine receives commission on sales that took
place using the search engine as a marketing tool (Clemons 2009:47).
Spaulding (2009:38) identifies sales, subscriptions and advertisements as the
major sources of income for Internet-based businesses.
Fain and Pedersen (2006:12-13) describe the preferred listings as an income
generation method where businesses are charged to be placed in a research
result based on predetermined keywords. The cost per mile (CPM) involves the
cost the advertiser will pay to display an advertisement one thousand times on
the Website of the Internet-based business. Cost per click is when advertisers
are charged for each click customers make on their link, while cost per action
charge is only paid by the advertiser if a transaction takes place.
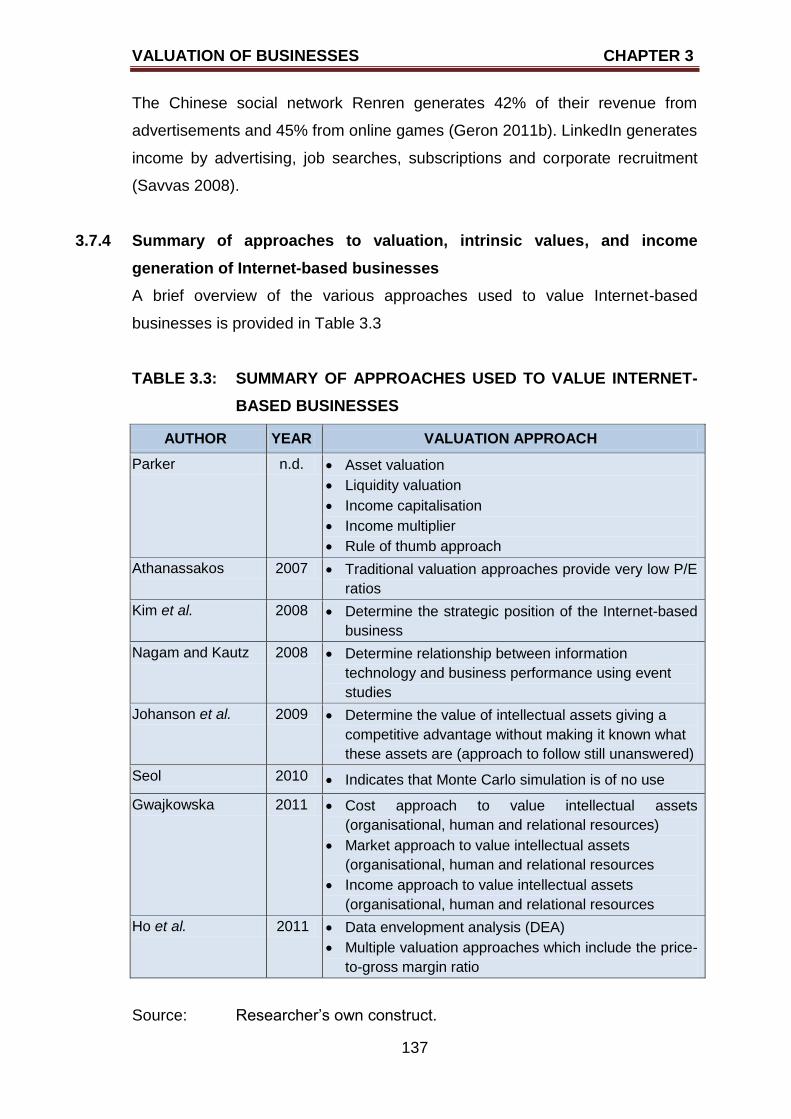
VALUATION OF BUSINESSES CHAPTER 3
137
The Chinese social network Renren generates 42% of their revenue from
advertisements and 45% from online games (Geron 2011b). LinkedIn generates
income by advertising, job searches, subscriptions and corporate recruitment
(Savvas 2008).
3.7.4 Summary of approaches to valuation, intrinsic values, and income
generation of Internet-based businesses
A brief overview of the various approaches used to value Internet-based
businesses is provided in Table 3.3
TABLE 3.3: SUMMARY OF APPROACHES USED TO VALUE INTERNET-
BASED BUSINESSES
AUTHOR YEAR VALUATION APPROACH
Parker n.d. Asset valuation
Liquidity valuation
Income capitalisation
Income multiplier
Rule of thumb approach
Athanassakos 2007 Traditional valuation approaches provide very low P/E
ratios
Kim et al. 2008 Determine the strategic position of the Internet-based
business
Nagam and Kautz 2008 Determine relationship between information
technology and business performance using event
studies
Johanson et al. 2009 Determine the value of intellectual assets giving a
competitive advantage without making it known what
these assets are (approach to follow still unanswered)
Seol 2010 Indicates that Monte Carlo simulation is of no use
Gwajkowska 2011 Cost approach to value intellectual assets
(organisational, human and relational resources)
Market approach to value intellectual assets
(organisational, human and relational resources
Income approach to value intellectual assets
(organisational, human and relational resources
Ho et al. 2011 Data envelopment analysis (DEA)
Multiple valuation approaches which include the price-
to-gross margin ratio
Source: Researcher‟s own construct.
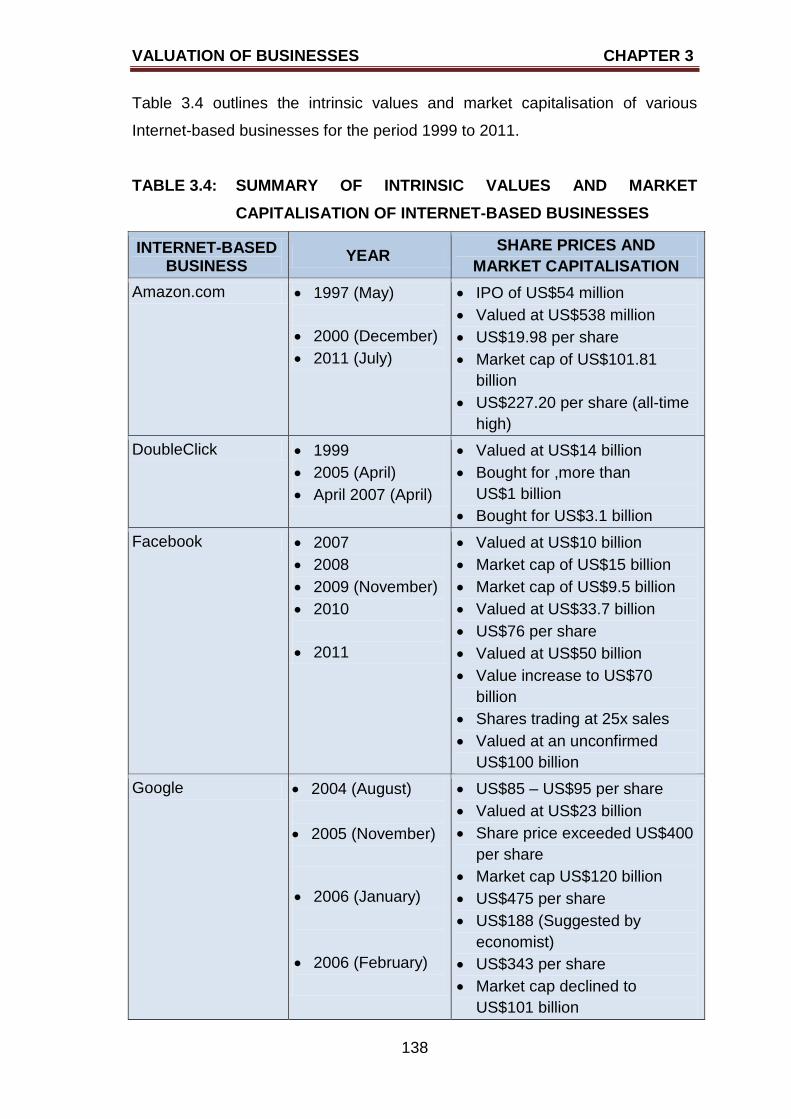
VALUATION OF BUSINESSES CHAPTER 3
138
Table 3.4 outlines the intrinsic values and market capitalisation of various
Internet-based businesses for the period 1999 to 2011.
TABLE 3.4: SUMMARY OF INTRINSIC VALUES AND MARKET
CAPITALISATION OF INTERNET-BASED BUSINESSES
INTERNET-BASED BUSINESS
YEAR SHARE PRICES AND
MARKET CAPITALISATION
Amazon.com 1997 (May)
2000 (December)
2011 (July)
IPO of US$54 million
Valued at US$538 million
US$19.98 per share
Market cap of US$101.81
billion
US$227.20 per share (all-time
high)
DoubleClick 1999
2005 (April)
April 2007 (April)
Valued at US$14 billion
Bought for ,more than
US$1 billion
Bought for US$3.1 billion
Facebook 2007
2008
2009 (November)
2010
2011
Valued at US$10 billion
Market cap of US$15 billion
Market cap of US$9.5 billion
Valued at US$33.7 billion
US$76 per share
Valued at US$50 billion
Value increase to US$70
billion
Shares trading at 25x sales
Valued at an unconfirmed
US$100 billion
Google 2004 (August)
2005 (November)
2006 (January)
2006 (February)
US$85 – US$95 per share
Valued at US$23 billion
Share price exceeded US$400
per share
Market cap US$120 billion
US$475 per share
US$188 (Suggested by
economist)
US$343 per share
Market cap declined to
US$101 billion
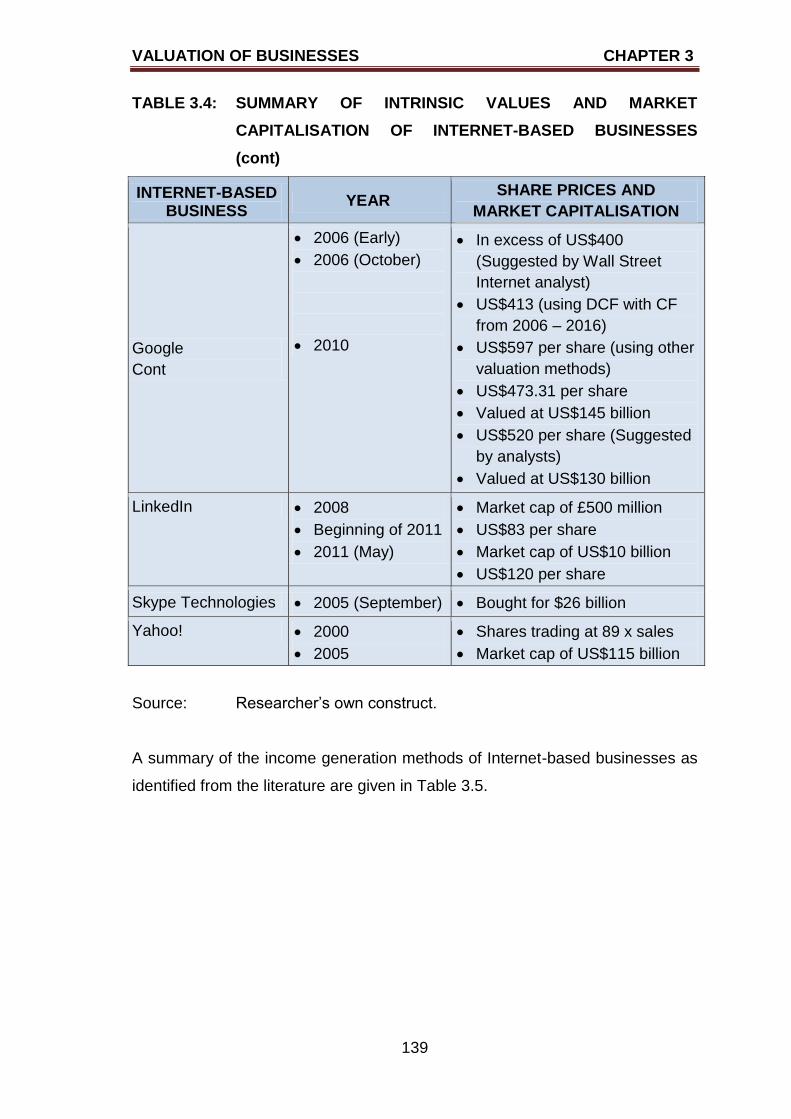
VALUATION OF BUSINESSES CHAPTER 3
139
TABLE 3.4: SUMMARY OF INTRINSIC VALUES AND MARKET
CAPITALISATION OF INTERNET-BASED BUSINESSES
(cont)
INTERNET-BASED BUSINESS
YEAR SHARE PRICES AND
MARKET CAPITALISATION
Cont
2006 (Early)
2006 (October)
2010
In excess of US$400
(Suggested by Wall Street
Internet analyst)
US$413 (using DCF with CF
from 2006 – 2016)
US$597 per share (using other
valuation methods)
US$473.31 per share
Valued at US$145 billion
US$520 per share (Suggested
by analysts)
Valued at US$130 billion
LinkedIn 2008
Beginning of 2011
2011 (May)
Market cap of £500 million
US$83 per share
Market cap of US$10 billion
US$120 per share
Skype Technologies 2005 (September) Bought for $26 billion
Yahoo! 2000
2005
Shares trading at 89 x sales
Market cap of US$115 billion
Source: Researcher‟s own construct.
A summary of the income generation methods of Internet-based businesses as
identified from the literature are given in Table 3.5.
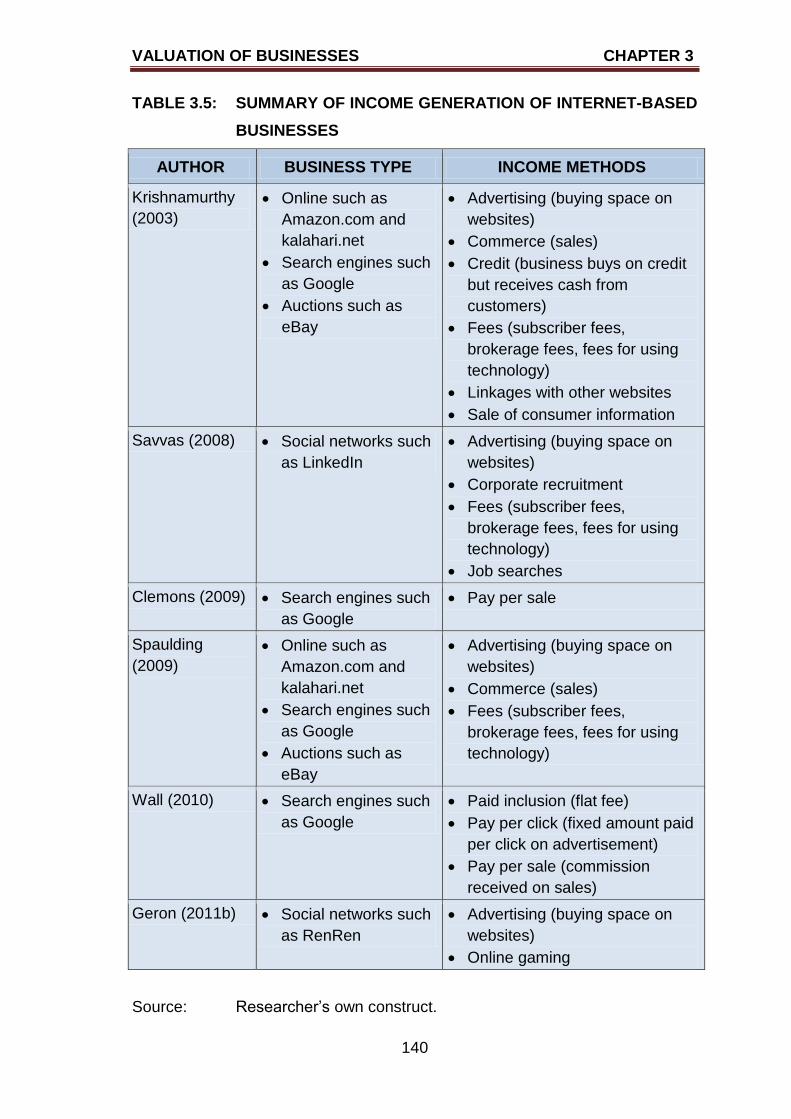
VALUATION OF BUSINESSES CHAPTER 3
140
TABLE 3.5: SUMMARY OF INCOME GENERATION OF INTERNET-BASED
BUSINESSES
AUTHOR BUSINESS TYPE INCOME METHODS
Krishnamurthy
(2003)
Online such as
Amazon.com and
kalahari.net
Search engines such
as Google
Auctions such as
eBay
Advertising (buying space on
websites)
Commerce (sales)
Credit (business buys on credit
but receives cash from
customers)
Fees (subscriber fees,
brokerage fees, fees for using
technology)
Linkages with other websites
Sale of consumer information
Savvas (2008) Social networks such
as LinkedIn
Advertising (buying space on
websites)
Corporate recruitment
Fees (subscriber fees,
brokerage fees, fees for using
technology)
Job searches
Clemons (2009) Search engines such
as Google
Pay per sale
Spaulding
(2009)
Online such as
Amazon.com and
kalahari.net
Search engines such
as Google
Auctions such as
eBay
Advertising (buying space on
websites)
Commerce (sales)
Fees (subscriber fees,
brokerage fees, fees for using
technology)
Wall (2010) Search engines such
as Google
Paid inclusion (flat fee)
Pay per click (fixed amount paid
per click on advertisement)
Pay per sale (commission
received on sales)
Geron (2011b) Social networks such
as RenRen
Advertising (buying space on
websites)
Online gaming
Source: Researcher‟s own construct.
VALUATION OF BUSINESSES CHAPTER 3
141
As is evident from the previous discussions, various valuation approaches can
be used to determine a complete valuation of a business. In Chapter Two it was
pointed out that Internet-based businesses can follow various e-business
strategies, which are based on the proposed e-business model stages. It was
furthermore shown that one of the benefits of implementing e-business
strategies is the enhancement of business performance, which will have an
influence on business valuation. Therefore it is important to quantify the benefit
of e-business strategies at various e-business model stages in business
valuation.
3.8 SUMMARY
The focus of Chapter Three has been on business valuation. Firstly, a brief
overview on the concepts of par-, market-, book- and economic values was
given. The purpose of valuation was described, and this section explained why
valuations of business are necessary. The valuation of businesses of different
sizes was also addressed, and it was found that the factors for valuation of
large businesses differ from those of small businesses. Some businesses might
also opt not to pay dividends, and the valuation of such businesses was also
briefly explained. The valuation of real estate was included in the discussion on
valuation because there are many similarities between real estate valuation and
business valuation where intangible assets form a major part of the valuation
process.
A brief section on the history of valuation was provided, and the return that
investors receive on their investments were analysed as the dividend yield, the
capital yield and total yield (both dividend and capital yields). The fourth
subsection was devoted to the various traditional valuation approaches found in
the literature. A discussion on the DDM, zero growth model, the constant growth
model, the non-constant growth model, the free cash flow valuation model,
price-earnings ratio, price-book ratio, book value per share, liquidation per
share, economic and market value added performance measurements and real
options followed. The relevant equations and/or explanations of each of these
valuation approaches were provided.
VALUATION OF BUSINESSES CHAPTER 3
142
The unknown variables of each of the valuation approaches were discussed
and the limitations of the various approaches were also highlighted. Possible
solutions to overcome the limitations were also provided. The variables, known
and unknown to the valuators, the applicability of the various valuation
approaches to the different type of businesses, and the shortcomings of each
approach were summarised in Table 3.1.
The previous research using the traditional valuation approaches as well as the
application of some of the valuation approaches in practice were discussed. It
was found that the most used valuation approach was the DCF approach.
These findings concluded that there is a need for a valuation approach for
Internet-based businesses.
An overview of the various approaches used to value Internet-based
businesses was provided. Various authors, for example Grajkowska (2011), Ho,
et al. (2011) and Seol (2010), have different opinions regarding the valuation of
Internet-based businesses. Although a number of approaches were identified
which might be used for valuation, many limitations and obstacles were also
identified that would prevent the determining of a fair market-related value for
Internet-based businesses. The chapter concluded with a summary of the
identified valuation approaches, the share price and market capitalisation of a
number of Internet-based businesses, and the possible income streams of
Internet-based businesses, as well as explaining the benefit of implementing e-
business strategies on business performance and ultimately business
valuations.
The focus of Chapter Four will be the research design and methodology
implemented in the present study. The various methodologies and methods will
be explained and choices motivated. The population, sample and sampling
method will be described. To conclude the chapter, the data collection and
analysis will also be addressed.
RESEARCH DESIGN AND METHODOLOGY CHAPTER 4
143
CHAPTER FOUR
RESEARCH DESIGN AND METHODOLOGY
4.1 INTRODUCTION
The focus of Chapter Three was on the various traditional valuation approaches
as found in financial literature. It was seen that the most used valuation
approach was the DCF approach where free cash flow was discounted. It was
furthermore pointed out that all the approaches have shortcomings, especially
when valuing a business that did not pay dividends or that had unconventional
growth rates. The different categories of Internet-based businesses were
discussed in Chapter Two. The purpose of Chapters Two and Three was to
achieve two of the secondary objectives as stated in Chapter One.
The problem statement, purpose and objectives of the study were described in
Chapter One. To give effect to the third secondary objective, it is important to
identify and discuss the various research paradigms, research methodologies,
data collection and data analysis methods, from which the most appropriate
methodology will be chosen for the study. The place of the chapter in the
research design is illustrated in Figure 4.1, which is reproduced from Chapter
One.
Therefore this chapter will identify and describe in detail the processes followed
during the research. The nature of research and the various research
classifications will be described. The different research paradigms will be
discussed, and the specific paradigm chosen will be motivated. The data
collection, including the population, sample size and sample selection, will be
addressed. The last aspect to be covered in this chapter is the data analysis
that will be implemented in the study.
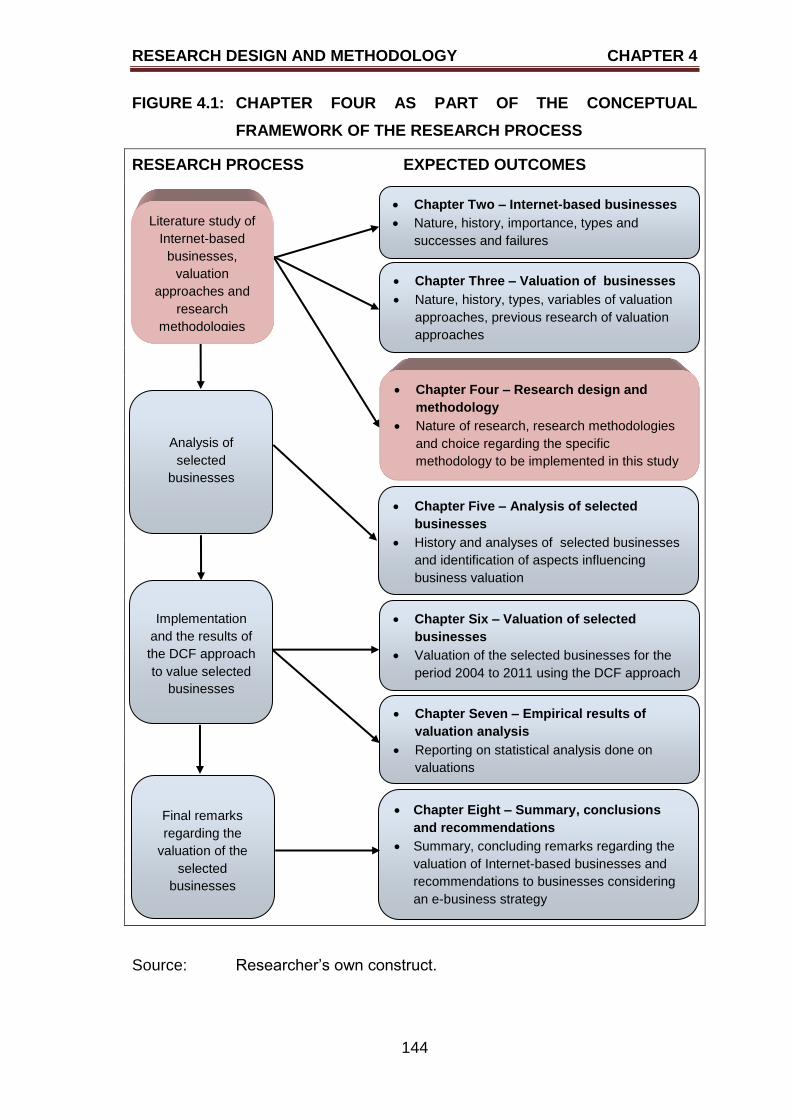
RESEARCH DESIGN AND METHODOLOGY CHAPTER 4
144
FIGURE 4.1: CHAPTER FOUR AS PART OF THE CONCEPTUAL
FRAMEWORK OF THE RESEARCH PROCESS
RESEARCH PROCESS EXPECTED OUTCOMES
Source: Researcher‟s own construct.
Literature study of
Internet-based
businesses,
valuation
approaches and
research
methodologies
Chapter Three – Valuation of businesses
Nature, history, types, variables of valuation
approaches, previous research of valuation
approaches
Chapter Two – Internet-based businesses
Nature, history, importance, types and
successes and failures
Chapter Four – Research design and
methodology
Nature of research, research methodologies
and choice regarding the specific
methodology to be implemented in this study
Analysis of
selected
businesses
Chapter Five – Analysis of selected
businesses
History and analyses of selected businesses
and identification of aspects influencing
business valuation
Chapter Six – Valuation of selected
businesses
Valuation of the selected businesses for the
period 2004 to 2011 using the DCF approach
Implementation
and the results of
the DCF approach
to value selected
businesses
Chapter Eight – Summary, conclusions
and recommendations
Summary, concluding remarks regarding the
valuation of Internet-based businesses and
recommendations to businesses considering
an e-business strategy
Final remarks
regarding the
valuation of the
selected
businesses
Chapter Seven – Empirical results of
valuation analysis
Reporting on statistical analysis done on
valuations
RESEARCH DESIGN AND METHODOLOGY CHAPTER 4
145
4.2 NATURE OF RESEARCH
Research is the implementation of appropriate steps to produce original
knowledge that will satisfy the users of the research. The implementation of the
research steps needs to be performed rigorously, implying that it should be
done in a systematic manner and that the results of the research are answering
the research questions (Oates 2006:7, 10). Saunders et al. (2009:5) and
Zikmund et al. (2010:5) describe research as knowledge creation to overcome
uncertainty in areas such as the business, the market, or the economy. The
authors further explain that business research is a scientific means to find the
truth regarding business phenomena. Welman, Kruger and Mitchell (2010:2)
concur with the previous authors, stating that research is a process and that the
aim of this process is to obtain scientific knowledge by implementing different
methods and procedures. Collis and Hussey (2003:1) summarise research as a
process that enquires and investigates in a systematic and methodical manner
with the ultimate aim to increase knowledge.
According to Oates (2006:11-13), research consists of six elements, or the six
Ps, namely purpose, products, process, participants, paradigm and
presentation. Purpose refers to the reason why the research is conducted, and
includes the research questions and primary and secondary objectives (Oates
2006:11). The purpose, or primary objective, of this study is to determine and
analyse the value of Internet-based businesses at the various stages of Internet
presence, to determine the value creation of an e-business strategy. A number
of secondary objectives, research questions and research hypotheses are also
presented in Chapter One (section 1.5) to give effect to the primary objective of
the study.
The product(s) of research are the ultimate outcome of the research, and may
include the contribution the study makes to the field of study, creation of new
models or products, conference papers and journal articles (Oates 2006:11-12).
The products of the study are encapsulated in the recommendations of the
study and will revolve around the primary objective of the study. Therefore the
intended product of the present study is to establish whether the benefits of
implementing the various e-business strategies can increase the value of a
RESEARCH DESIGN AND METHODOLOGY CHAPTER 4
146
business. The answer to this statement will assist owners and managers of
businesses in making a decision about the extent of an e-business strategy to
be implemented. The product(s) of the study will be reported in the final chapter,
Chapter Eight.
The process refers to the activities that will be performed, in sequence, in order
to reach the purpose of the study, which is the achievement of the primary
objective of the study (Oates 2006:12). The process in the format of sequential
steps that the study is following, is depicted in Figure 4.1 and is explained in
Chapter One (sections 1.4 – 1.6). Chapters Two to Eight represent in detail the
process of the study.
The participants of a study are the individuals who will complete a questionnaire
or with whom an interview will be conducted. Therefore the participants will be
the sample drawn from the population identified for the study (Oates 2006:12).
The participants of the study are drawn from a population. The population of the
study is listed public companies, and the sample is all the listed public
companies in consumer services, retail sector, as classified by the JSE. More
detail regarding the population, sample and sampling size will be provided later
in the chapter.
The paradigm is the pattern of thinking which will be followed during the
research (Oates 2006:13). The pattern of thinking can follow a positivistic
paradigm or a phenomenological paradigm, or even a combination of the two
paradigms. The study will use a positivistic paradigm.
Presentation of the academic-oriented research can be in the form of a thesis,
dissertation, conference paper or journal article (Oates 2006:13). The
presentation of the results of the study will first be in the format of a final
document, the thesis. The results will also be published in journal articles and
presented at conference.
The six elements of research as described by Oates (2006) are nothing more
than the research design of a study. Research design is a step-by-step master
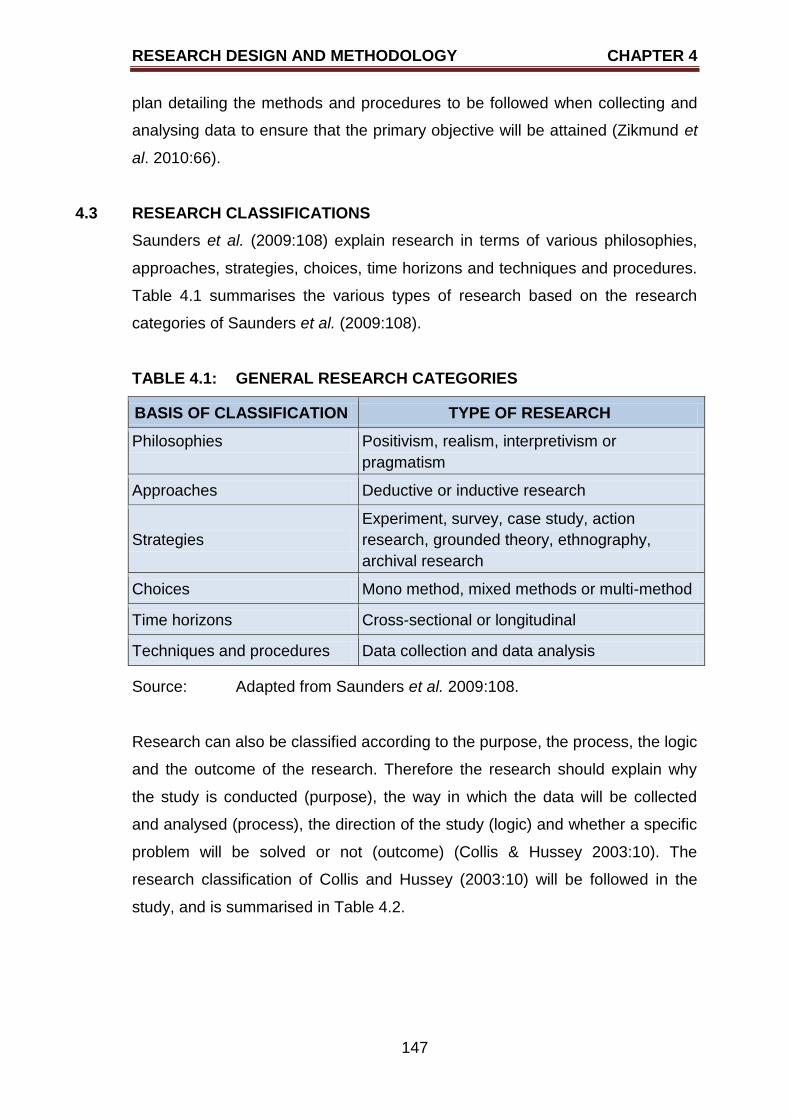
RESEARCH DESIGN AND METHODOLOGY CHAPTER 4
147
plan detailing the methods and procedures to be followed when collecting and
analysing data to ensure that the primary objective will be attained (Zikmund et
al. 2010:66).
4.3 RESEARCH CLASSIFICATIONS
Saunders et al. (2009:108) explain research in terms of various philosophies,
approaches, strategies, choices, time horizons and techniques and procedures.
Table 4.1 summarises the various types of research based on the research
categories of Saunders et al. (2009:108).
TABLE 4.1: GENERAL RESEARCH CATEGORIES
BASIS OF CLASSIFICATION TYPE OF RESEARCH
Philosophies Positivism, realism, interpretivism or
pragmatism
Approaches Deductive or inductive research
Strategies
Experiment, survey, case study, action
research, grounded theory, ethnography,
archival research
Choices Mono method, mixed methods or multi-method
Time horizons Cross-sectional or longitudinal
Techniques and procedures Data collection and data analysis
Source: Adapted from Saunders et al. 2009:108.
Research can also be classified according to the purpose, the process, the logic
and the outcome of the research. Therefore the research should explain why
the study is conducted (purpose), the way in which the data will be collected
and analysed (process), the direction of the study (logic) and whether a specific
problem will be solved or not (outcome) (Collis & Hussey 2003:10). The
research classification of Collis and Hussey (2003:10) will be followed in the
study, and is summarised in Table 4.2.
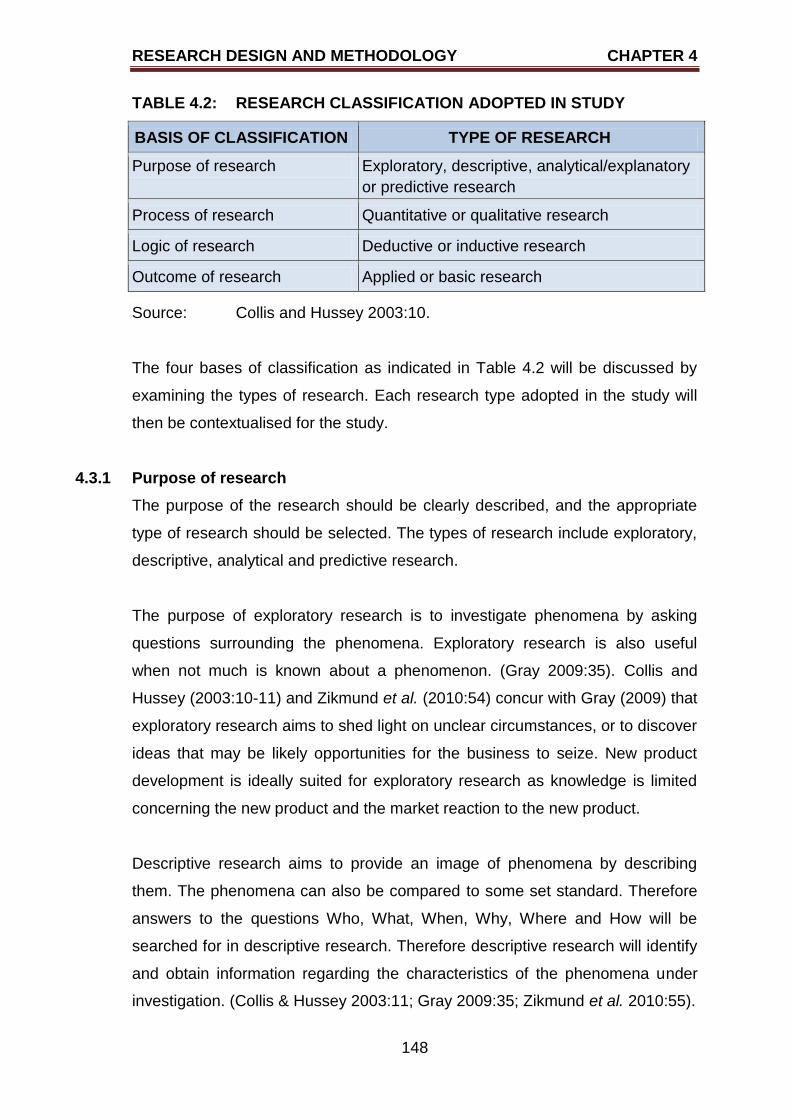
RESEARCH DESIGN AND METHODOLOGY CHAPTER 4
148
TABLE 4.2: RESEARCH CLASSIFICATION ADOPTED IN STUDY
BASIS OF CLASSIFICATION TYPE OF RESEARCH
Purpose of research Exploratory, descriptive, analytical/explanatory
or predictive research
Process of research Quantitative or qualitative research
Logic of research Deductive or inductive research
Outcome of research Applied or basic research
Source: Collis and Hussey 2003:10.
The four bases of classification as indicated in Table 4.2 will be discussed by
examining the types of research. Each research type adopted in the study will
then be contextualised for the study.
4.3.1 Purpose of research
The purpose of the research should be clearly described, and the appropriate
type of research should be selected. The types of research include exploratory,
descriptive, analytical and predictive research.
The purpose of exploratory research is to investigate phenomena by asking
questions surrounding the phenomena. Exploratory research is also useful
when not much is known about a phenomenon. (Gray 2009:35). Collis and
Hussey (2003:10-11) and Zikmund et al. (2010:54) concur with Gray (2009) that
exploratory research aims to shed light on unclear circumstances, or to discover
ideas that may be likely opportunities for the business to seize. New product
development is ideally suited for exploratory research as knowledge is limited
concerning the new product and the market reaction to the new product.
Descriptive research aims to provide an image of phenomena by describing
them. The phenomena can also be compared to some set standard. Therefore
answers to the questions Who, What, When, Why, Where and How will be
searched for in descriptive research. Therefore descriptive research will identify
and obtain information regarding the characteristics of the phenomena under
investigation. (Collis & Hussey 2003:11; Gray 2009:35; Zikmund et al. 2010:55).
RESEARCH DESIGN AND METHODOLOGY CHAPTER 4
149
Analytical research, also referred to as explanatory research, is describing the
phenomena on a continuous basis. The phenomena are not only described, but
are also analysed by discovering and measuring causal relationships between
the variables of the phenomena. (Collis & Hussey 2003:11).
The starting point of predictive research is analytical research. Predictive
research is forecasting the possibility that the same or similar phenomena will
occur at some future point in time. This forecasting can only be done once the
variables of the phenomena are identified and explained. Therefore the main
difference between analytical and predictive research is that predictive research
is forward-looking, while analytical research focuses on describing and
explaining why a phenomenon occurred. (Collis & Hussey 2003:12).
Based on the discussion of the various purposes of research, the most
appropriate type of research for the present study is predictive research. The
objective of the study is to determine whether e-business strategies at various
e-business model stages will increase the value of the business. Based on
these results, a forecast on e-business strategy value creation will be made.
4.3.2 Process of research
There are two types of research that are classified according to the processes
that are followed during the research, namely quantitative and qualitative
research.
Quantitative research is a positivist approach that focuses on research that can
be observed and measured objectively. Therefore quantitative research studies
human behaviour that is observable. (Welman et al. 2010:6-7). Zikmund et al.
(2010:134) agree with Welman et al. (2010:6-7) by explaining that quantitative
research achieves research objectives using empirical assessments. Collis and
Hussey (2003:13) explain that quantitative research focuses on measuring
phenomena quantitatively. These empirical assessments are numerical in
nature, and can therefore be measured and analysed by applying statistical
tests.
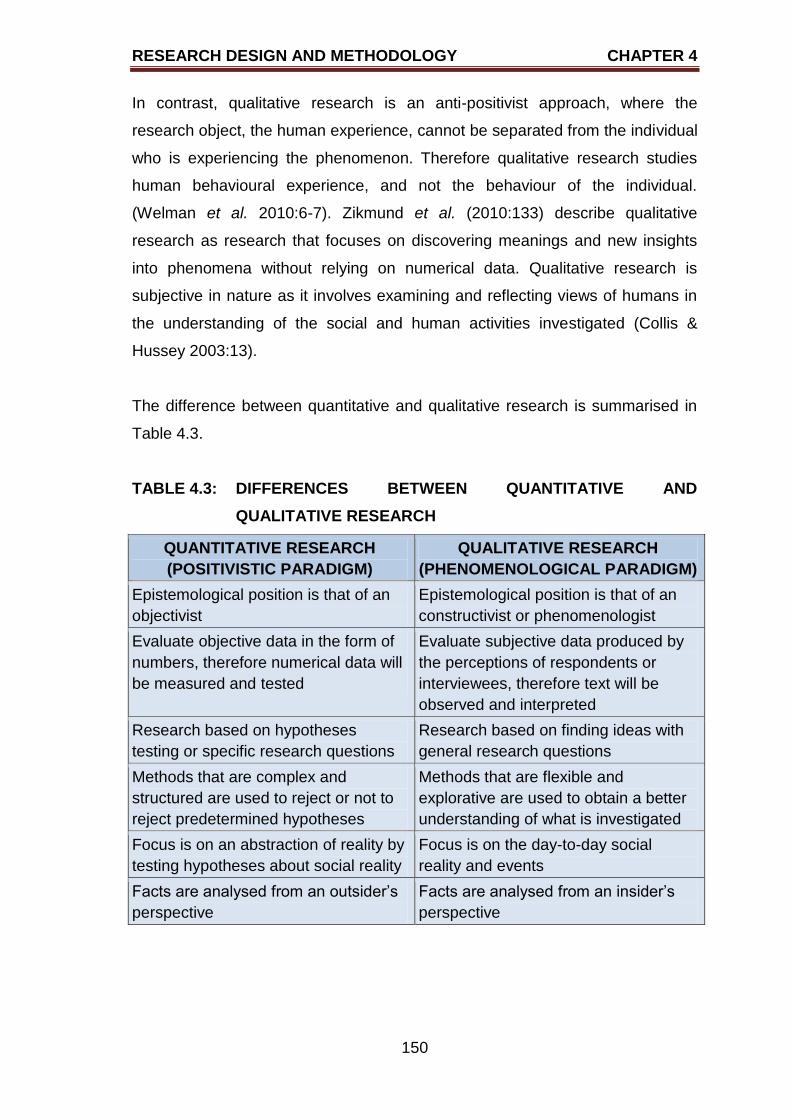
RESEARCH DESIGN AND METHODOLOGY CHAPTER 4
150
In contrast, qualitative research is an anti-positivist approach, where the
research object, the human experience, cannot be separated from the individual
who is experiencing the phenomenon. Therefore qualitative research studies
human behavioural experience, and not the behaviour of the individual.
(Welman et al. 2010:6-7). Zikmund et al. (2010:133) describe qualitative
research as research that focuses on discovering meanings and new insights
into phenomena without relying on numerical data. Qualitative research is
subjective in nature as it involves examining and reflecting views of humans in
the understanding of the social and human activities investigated (Collis &
Hussey 2003:13).
The difference between quantitative and qualitative research is summarised in
Table 4.3.
TABLE 4.3: DIFFERENCES BETWEEN QUANTITATIVE AND
QUALITATIVE RESEARCH
QUANTITATIVE RESEARCH
(POSITIVISTIC PARADIGM)
QUALITATIVE RESEARCH
(PHENOMENOLOGICAL PARADIGM)
Epistemological position is that of an
objectivist
Epistemological position is that of an
constructivist or phenomenologist
Evaluate objective data in the form of
numbers, therefore numerical data will
be measured and tested
Evaluate subjective data produced by
the perceptions of respondents or
interviewees, therefore text will be
observed and interpreted
Research based on hypotheses
testing or specific research questions
Research based on finding ideas with
general research questions
Methods that are complex and
structured are used to reject or not to
reject predetermined hypotheses
Methods that are flexible and
explorative are used to obtain a better
understanding of what is investigated
Focus is on an abstraction of reality by
testing hypotheses about social reality
Focus is on the day-to-day social
reality and events
Facts are analysed from an outsider‟s
perspective
Facts are analysed from an insider‟s
perspective
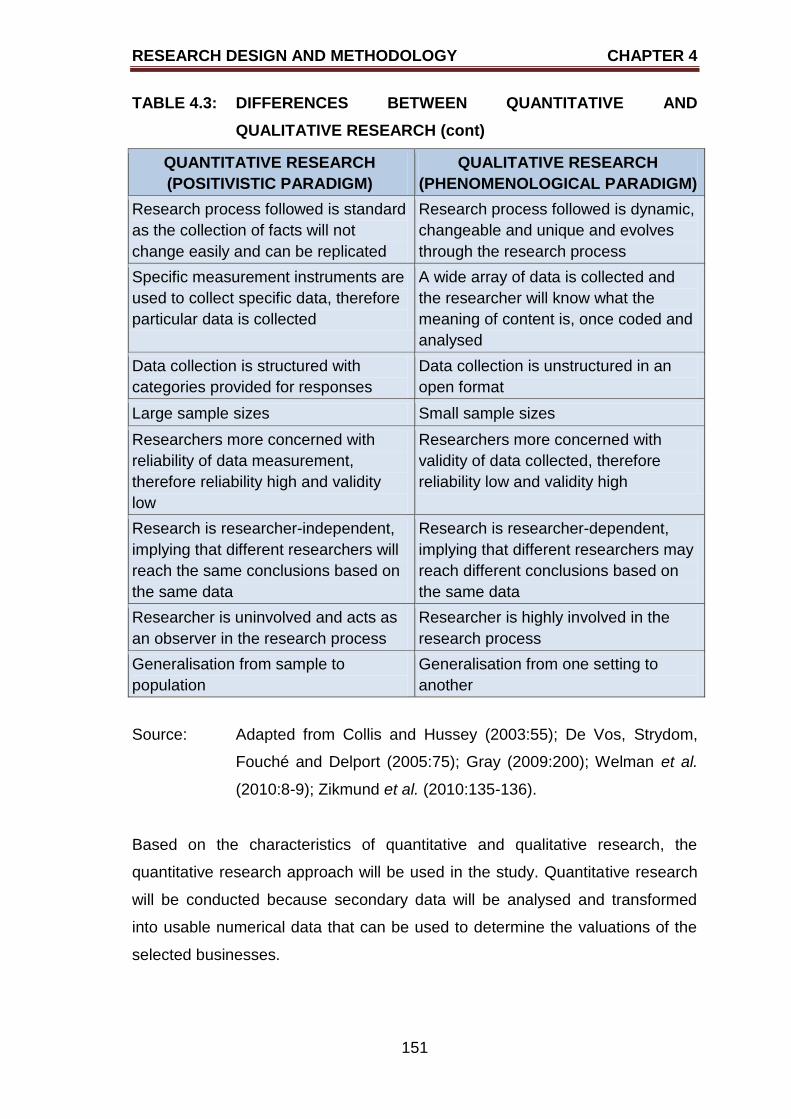
RESEARCH DESIGN AND METHODOLOGY CHAPTER 4
151
TABLE 4.3: DIFFERENCES BETWEEN QUANTITATIVE AND
QUALITATIVE RESEARCH (cont)
QUANTITATIVE RESEARCH
(POSITIVISTIC PARADIGM)
QUALITATIVE RESEARCH
(PHENOMENOLOGICAL PARADIGM)
Research process followed is standard
as the collection of facts will not
change easily and can be replicated
Research process followed is dynamic,
changeable and unique and evolves
through the research process
Specific measurement instruments are
used to collect specific data, therefore
particular data is collected
A wide array of data is collected and
the researcher will know what the
meaning of content is, once coded and
analysed
Data collection is structured with
categories provided for responses
Data collection is unstructured in an
open format
Large sample sizes Small sample sizes
Researchers more concerned with
reliability of data measurement,
therefore reliability high and validity
low
Researchers more concerned with
validity of data collected, therefore
reliability low and validity high
Research is researcher-independent,
implying that different researchers will
reach the same conclusions based on
the same data
Research is researcher-dependent,
implying that different researchers may
reach different conclusions based on
the same data
Researcher is uninvolved and acts as
an observer in the research process
Researcher is highly involved in the
research process
Generalisation from sample to
population
Generalisation from one setting to
another
Source: Adapted from Collis and Hussey (2003:55); De Vos, Strydom,
Fouché and Delport (2005:75); Gray (2009:200); Welman et al.
(2010:8-9); Zikmund et al. (2010:135-136).
Based on the characteristics of quantitative and qualitative research, the
quantitative research approach will be used in the study. Quantitative research
will be conducted because secondary data will be analysed and transformed
into usable numerical data that can be used to determine the valuations of the
selected businesses.
RESEARCH DESIGN AND METHODOLOGY CHAPTER 4
152
4.3.3 Logic of research
When conducting research a deductive or inductive research approach can be
followed; however, these approaches are not mutually exclusive (Gray
2009:15). Deductive research aims at testing existing theories and ideas found
in the secondary data reviewed by empirical observation. The theories and the
ideas are used to develop a research-specific theoretical or conceptual
framework which is tested using various statistical methods. Therefore the
general patterns found in the empirical observation will assist in making
recommendations regarding the particular. (Collis & Hussey 2003:15; Gray
2009:14; Saunders et al. 2009:61). In contrast, inductive research aims at
developing theories based on the data explored. The purpose is not to develop
a framework to test in the research (Saunders et al. 2009:61). As stated by
Gray (2009:14-15), the purpose of inductive research is to collect data which
will be coded and analysed to determine if any patterns occur in the data that
suggest relationships amongst the variables identified. From these findings, it is
possible for the researcher to generate generalisations, relationships and
theories (Collis & Hussey 2003:15). The main difference between deductive and
inductive research is the logic that is used when doing the research; therefore
this classification is based on the logic of the research.
According to Robson as cited in Saunders et al. (2009:124-125), deductive
research involves five sequential stages, namely:
formulating propositions from theory (known as hypotheses) to be tested
about possible relationships between two or more variables;
expressing how the hypotheses will be measured;
testing the formulated hypotheses using the methods identified;
analysing the results of the hypotheses testing; and
modifying the theory in line with the findings.
Deductive research has several characteristics that are important to ensure
quality research. Firstly, causal relationships between variables should be
found. The second characteristic is that a structured methodology should be
RESEARCH DESIGN AND METHODOLOGY CHAPTER 4
153
followed to ensure reliability. Thirdly, the concepts (variables) used to formulate
the hypotheses should be measurable quantitatively. Fourthly, reductionism is
important, implying that to understand the problem holistically, it is important to
understand all the individual elements of the problem. The fifth characteristic is
generalisation, meaning that the results should be true for not only the sample
selected for the research, but for the population as well. (Saunders et al.
2009:125).
Inductive research emphasises a close understanding of the research context,
and is less concerned with generalisation. This type of research focuses on
collection of qualitative data, and the researcher is part of the research process.
One of the issues with inductive research is that the researcher may encounter
no useful data patterns and therefore the research can be of no value.
(Saunders et al. 2009:127).
Deductive research will be used in the study, as a number of hypotheses will be
tested. The aim of the study is not develop new theories, but rather to enhance
existing knowledge regarding the value creation of e-business strategies for
businesses.
4.3.4 Outcome of research
Research can also be classified according to applied and basic research, which
is based on the outcome of the research. Applied research refers to research
undertaken to improve the understanding of a particular business or
management problem, which will result in finding a solution by creating new
knowledge, although limited to the problem. The solution found will add value to
the businesses for the managers. (Gray 2009:3; Saunders et al. 2009:9). As
stated by Collis and Hussey (2003:13) and Zikmund et al. (2010:6), applied
research is searching for a solution for a specific existing problem with which a
specific business is struggling.
Basic research is an alternative to applied research and is known as
fundamental or pure research. The outcome of basic research is to expand
knowledge of processes of business and management, to develop universal
RESEARCH DESIGN AND METHODOLOGY CHAPTER 4
154
principles regarding the processes investigated, and to add value for the society
in general. (Collis & Hussey 2003:13; Gray 2009:3; Saunders et al. 2009:9).
Collis and Hussey (2003:15) and Zikmund et al. (2010:7) explain that basic
research is not focused on solving a specific problem, but rather aims to expand
the knowledge in the field that is studied for the general good.
Therefore the main differences between applied and basic can be summarised
as follows:
Applied research focuses on finding a solution for a specific issue or
problem at hand, whereas the focus of basic research is to expand
knowledge in general.
Both types of research create knowledge. Applied research creates new
knowledge which is related to the specific problem, while basic research
expands current knowledge with new knowledge of business processes.
The value of the findings of applied research is practical, relevant, and
applicable to the situation where the problem being investigated is
occurring, while the value of the findings of basic research is significant
and applicable to society in general.
Therefore the findings of basic research are useful to a wider audience, while
the findings of applied research are more limited in their usage. If one considers
the characteristics of both basic and applied research, the present study can be
classified as applied research, because the findings will only be useful for
businesses which are evaluating the opportunities to implement e-business
strategies or to expand their e-business strategies.
4.4 RESEARCH PARADIGMS
There are two research paradigms that can be adopted in research, namely the
positivistic and the phenomenological research paradigms. The positivistic
paradigm refers to quantitative, objectivist, scientific, experimentalist or
traditional research. The phenomenological paradigm refers to qualitative,
subjectivist, humanistic or interpretive research. (Collis & Hussey 2003:47;
Cooper & Schindler 2008:164). As stated by Collis and Hussey (2003:55-56),
RESEARCH DESIGN AND METHODOLOGY CHAPTER 4
155
the data produced by a positivistic paradigm can be qualitative, and the data
produced by the phenomenological paradigm can be quantitative. Therefore
reference will be made to the positivistic and phenomenological paradigms
instead of quantitative and qualitative research.
The emphasis of the positivistic paradigm is on the quantification of the data
collected and analysed. Once the data is quantified, explanations of the data
can be provided, and the predictions of the phenomena investigated can be
made. Therefore the positivistic paradigm follows deductive reasoning to
determine whether relationships between theory and research exist. (Bryman &
Bell 2007:28, 157, 404; Collis & Hussey 2003:13, 52-54; Creswell 2009:3-4).
The positivistic paradigm focuses on the measuring of consumer behaviour,
knowledge, opinions or attitudes (Cooper & Schindler 2008:162).
In contrast, the emphasis of the phenomenological paradigm is on the content.
Therefore new theories are developed, instead of testing existing theories. This
paradigm uses inductive reasoning, and not deductive reasoning, to develop a
new theory. Therefore the phenomenological paradigm discovers new
knowledge, which is used to create new theories. (Bryman & Bell 2007:28, 157,
404; Collis & Hussey 2003:13, 52-54; Creswell 2009:3-4). A benefit of the
phenomenological paradigm is that the researcher can comprehend the context
in which decisions and activities are undertaken (Myers 2009:5).
Based on the above discussion and the discussion in section 4.3.2, for the
purpose of this study, a positivistic paradigm will be followed. A positivistic
paradigm (quantitative research) will be adopted, because business valuations
for four businesses (one brick-and-mortar and three Internet-based businesses)
providing consumer services (three in the retail industry and one in media
industry) will be carried out by transforming secondary quantitative and
qualitative data into more easily understandable information. Firstly, the
transformed data will be captured in Microsoft Excel (data collection) and the
various business valuations will be done. Secondly, the business valuations will
be used in t-tests (both one-sample and dependent) to test the hypotheses, as
stipulated in Chapter One section 1.5.4.
RESEARCH DESIGN AND METHODOLOGY CHAPTER 4
156
4.5 DATA COLLECTION
The section to follow will describe the data collection, which will include the
population, sample selection, and sampling method.
4.5.1 Population and sample selection
Population or universe is defined as any specifically distinct set of people or a
collection of items or entities which is under investigation, having the same or
similar characteristics (Collis & Hussey 2003:56; Quinlan 2011:143; Zikmund et
al. 2010:387). The public companies listed on the JSE will be included in the
study‟s population. As mentioned in Chapter One, the reason for only public
companies to be included in the study is that the annual reports of private
companies and other forms of ownership are not publicly available. Therefore,
to obtain the sampling frame of all the listed South African public companies,
the JSE website will be visited, as well as the Profile‟s Stock Exchange
Handbook, which provides a list and details of all the listed companies on the
JSE.
As it is not feasible to include all the public companies, the researcher selected
a few public companies to be investigated in the study. Such a selected group
of entities is known as a sample. Collis and Hussey (2003:56), Quinlan
(2011:143) and Zikmund et al. (2010:387) describe a sample as a subset of the
population. The sample of the study will consist of four businesses. Three
businesses will be from the consumer services sector specialising in the food
and drug retail industry (retailers and wholesalers subsector) as classified by
the JSE, while one business will be from the consumer services sector
specialising in media industry (broadcasting and entertainment subsector) as
classified by the JSE. The businesses are one brick-and-mortar business with
limited online presence (Shoprite Holdings Limited), and three Internet-based
businesses where actual online trading is conducted via the Internet (The SPAR
Group Ltd and Pick n Pay Stores Ltd as brick-and-mortar businesses and
Naspers Ltd as an online business). According to the JSE classification, there
are four businesses in the food and drug retail industry (retailers and
wholesalers subsector). Only three of the four businesses will be included in the
study as Pick n Pay Holdings Limited is established with the main purpose to be
RESEARCH DESIGN AND METHODOLOGY CHAPTER 4
157
the holding company of Pick n Pay Stores Limited. The holding company does
not have any employees. (Profile‟s Stock Exchange Handbook June 2012 –
September 2012 2012:363).
Probability and non-probability sampling methods can be used to select the
sample. Probability sampling is when all the respondents have an equal chance
of being selected. In contrast, non-probability sampling is when the respondents
do not have an equal chance of the being selected to participate in the study.
With regard to the three of the four businesses selected from the food and drug
retail industry (retailers and wholesalers subsector), non-probability sampling
was used as the specific industry was chosen by the researcher based on the
e-business strategies implemented by the three companies selected. Regarding
the selection of the one business in the media industry (broadcasting and
entertainment subsector), non-probability sampling was also used. To be more
specific, judgement or purposive sampling was used to select all four
companies, which refers to the selection of a respondent based on the personal
judgement of the researcher regarding the characteristics of the respondent
selected (Oates 2006:98; Zikmund 2010:396). The business selected was
chosen since one of the subsidiaries of the business is a well-known South
African click-only business, and the basic operations of the business are based
on electronic platforms (Naspers Fact Sheet 2012).
4.5.2 Database construction for business valuations
Secondary data from the annual financial statements will be analysed, and
transformed into usable data. A database will be constructed with the weighted
average cost of capital and the components of the free cash flows for the years
2004 to 2011. The required data and annual financial statements will be
obtained from the McGregor BFA Fin24Expert and from the official websites of
the selected businesses. The data of the annual financial statements available
from McGregor BFA Fin24Expert will be used to ensure that all the statements
are in the same format. The annual financial statements obtained from the
individual websites will be analysed to determine which events may have had
an influence on the performances of the businesses and ultimately on the
business valuation. Data will also be gathered from the South African Reserve
RESEARCH DESIGN AND METHODOLOGY CHAPTER 4
158
Bank, the JSE, and other available public sources of information that may
influence the market value of the business. The collection of the secondary data
will take approximately one month. The researcher will collect all the secondary
data. The discounted free cash flow method, as described in the financial
literature (see Chapter Three), will be used to do the valuations of the four
selected businesses.
4.6 DATA ANALYSIS
Once the database is completed, the valuations of the four businesses will be
done for each year as from 2004 to 2011. Although valuations are usually
forward-looking, the aim of the study is to determine the influence of online
activity on the business valuation. Therefore historical data will be used for the
valuation process. The growth rate of the business valuations will also be
compared to see whether there was consistency, and possible events will be
identified that may have influenced the various valuations. The correlation
among the valuations was also determined by calculating the Pearson‟s product
moment correlation coefficient assessing the strength of the relationship
between the valuations of the four businesses. As stated by Gray (2009:579)
and Saunders et al. (2009:451, 460), the Pearson‟s product moment correlation
coefficient is used to assess the strength of a relationship between two
variables. The purpose of t-tests is to determine whether statistically significant
differences exist between two sets of data. Different types of t-tests are found in
literature, namely the one-sample t-test, the dependent t-test and the
independent groups t-test. (Gray 2009:470). Dependent t-tests will be used to
compare the valuations calculated using the DCF approach and the valuations
calculated by McGregor BFA Fin24Expert with each another. The valuations for
each business over the eight-year period will be compared, that is a trend
analysis will be done. The valuations of the four businesses will also be
compared with one another. The purpose of these comparisons is to establish
whether significant differences exist between the valuations of the business.
Gray (2009:472-473), Saunders et al. (2009:456) and Oates (2006:262)
describe the purpose of dependent t-tests to determine whether statistically
significant differences exist between two sets of data. The means of the two
groups using a measure of the spread of the scores are used to determine
RESEARCH DESIGN AND METHODOLOGY CHAPTER 4
159
statistically significance. The one-sample t-test will be used to compare the five
valuations of each business with each other.
4.7 RELIABILITY, VALIDITY AND ETHICAL CONSIDERATIONS
The reliability and validity of quantitative research is very important. Reliability is
a measurement of the internal consistency of the measuring instrument. Internal
validity refers to the extent that a variable is truly responsible for any variance in
the dependent variable. External validity is the extent to which the results can
be generalised beyond the selected sample. (Zikmund et al. 2010:274, 277,
305).
The reliability of the discounted free cash flow method need not be confirmed as
it is an existing and established mathematical equation with the components of
the equation being consistent. The discounted free cash flow method can be
regarded as having construct validity because it is measuring what it is
supposed to measure; in this case, the valuation of a business. Therefore the
valuation method has face validity, content validity, criterion validity, convergent
validity, and discriminant validity. (Zikmund et al. 2010:308).
Only the actual values of the mathematical equation will change, and therefore
the reliability and validity of the inputs for the discounted free cash flow method
need to be confirmed. As no primary data will be collected, the usual reliability
measures, namely the Cronbach alpha coefficients, split-halves method or
internal consistency method, cannot be used. To ensure that the data used for
the valuation process as captured in the database is correct, a person other
than the researcher and an expert in accounting will be asked to verify the
correctness of the data. All the valuations will be calculated using two different
methods as both methods should yield the same result. The same source of
data, namely the cash flow statement will be used, but the inputs of the two
methods are different. The first method will focus on the cash from assets (also
known as the free cash flow) and the second will focus on the cash flow to
lenders and the cash flow to shareholders. This is known as triangulation where
different sources of data (different items from the cash flow statements) are
used to obtain the same results. Gray (2009:36) explains that triangulation
RESEARCH DESIGN AND METHODOLOGY CHAPTER 4
160
takes place firstly when data is collected over different times, or secondly when
data is collected from different sources. Saunders et al. (2009:146) state that
the purpose of triangulation is to ensure that the data collected is indeed reliable
and valid. According to Oates (2006:37), various types of triangulation exist,
namely method triangulation, strategy triangulation, time triangulation, space
triangulation, investigator triangulation and theoretical triangulation. As two
methods of calculating FCF were used, method triangulation is applicable.
Method triangulation is when one study uses two or more methods of data
collection (Oates 2006:37). The calculations of the valuations will also be
confirmed by experts, to ensure reliability of the valuations. One expert is a
chartered accountant employed in practice while the second expert is an
academic with research experience in business valuations.
The four businesses to be valued are classified according to the e-business
model stages, as discussed in Chapter Two. The researcher visited the various
websites of the selected sample businesses to determine if, and what, products
and services are sold over the Internet. The extent of the e-business strategy of
each business will indicate the e-business model stage of the business. To
ensure that the classification was done correctly, two experts in the field of e-
commerce will be consulted to verify the appropriateness of the classifications.
Ethical considerations are also of great concern for all researchers. As all the
data used will be secondary in nature and freely available in the public domain,
no ethical clearance needs to be obtained. The researcher subscribed to
McGregor BFA Fin24Expert, from which certain financial data was extracted, to
be used in the valuation of the selected businesses.
4.8 SUMMARY
The chapter described the nature of research as solving a problem by following
several steps in sequence. The purpose of research is thus to create
knowledge, either to expand the current knowledge level concerning a specific
phenomenon, or to create new theories regarding general phenomena. It is
important that the purpose and the product (outcome) of the research are
clearly identified, the processes to achieve the product are explained, the
RESEARCH DESIGN AND METHODOLOGY CHAPTER 4
161
participants and the paradigm of the research are selected, and the
presentation of the results is decided on.
The various research classifications were identified and discussed. Each of the
categories was contextualised for the study. The study could be classified as
predictive, quantitative, deductive and applied research. A distinction was made
between positivistic and phenomenological paradigms. The difference between
the two paradigms lies in the outcome of each. The purpose of a positivistic
paradigm is to test for relationships between variables whereas the purpose of a
phenomenological paradigm is to create new knowledge. As the study was
quantitative in nature and relationships would be tested, a positivistic paradigm
would be followed.
Four businesses were selected for the study, and the valuations for each of the
four businesses for eight years from 2004 to 2011 were calculated. The data
used was collected from the annual reports of the four selected businesses. The
reliability and validity of the data were confirmed. The data was analysed using
t-tests (one-sample and dependent) to determine whether there were
relationships between the valuations of the individual businesses and between
brick-and-mortar, brick-and-click and online businesses. This was done to
establish whether the various e-business strategies add value to the
businesses.
Chapter Five will provide an overview of the sample. The history and
operational overview of the four businesses will be described, and the financial
performance of the businesses will be discussed. Attention will also be given to
the dividends paid, and the share prices of the selected businesses.
OVERVIEW OF SELECTED BUSINESSES CHAPTER 5
162
CHAPTER FIVE
OVERVIEW OF SELECTED BUSINESSES
5.1 INTRODUCTION
In Chapter Four this study was classified as predictive, deductive, quantitative
and applied research. The research paradigm of the study was also described.
The population and the sample for the study were identified, and the
appropriate sampling method was discussed.
When investing in a business, whether investing in shares of the business or
buying a business, investors will have to analyse the business in question. It is
essential for investors to consider the events that have occurred in the business
and the business environment in which it operates, as these events may have
an influence on the business valuation. It is thus important to provide a
description and overview of the selected sample. Therefore Chapter Five will
provide an overview of the history, operational issues and financial information
for each of the four businesses selected. For each business, a history of the
business, an operational and financial overview of the business, and its
Internet-based business classification according to the e-business model, will
be discussed. To illustrate the purpose of Chapter Five, Figure 5.1 is
reproduced from Chapter One.
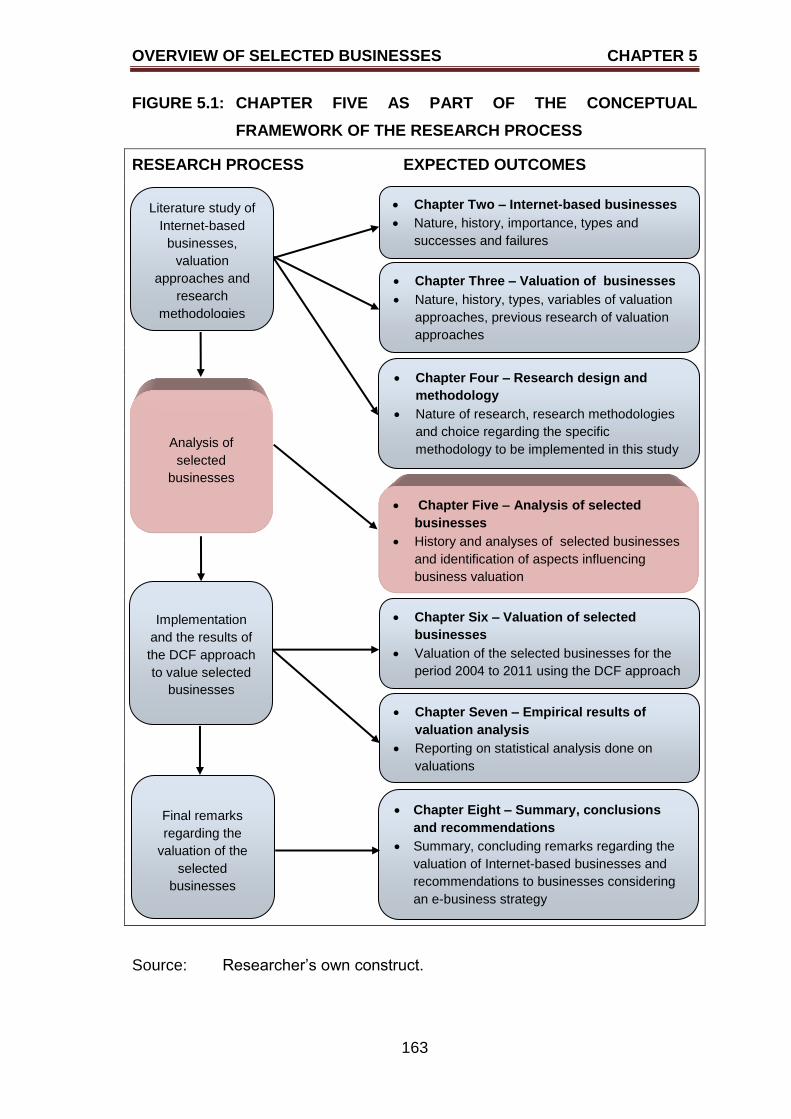
OVERVIEW OF SELECTED BUSINESSES CHAPTER 5
163
FIGURE 5.1: CHAPTER FIVE AS PART OF THE CONCEPTUAL
FRAMEWORK OF THE RESEARCH PROCESS
RESEARCH PROCESS EXPECTED OUTCOMES
Source: Researcher‟s own construct.
Literature study of
Internet-based
businesses,
valuation
approaches and
research
methodologies
Chapter Three – Valuation of businesses
Nature, history, types, variables of valuation
approaches, previous research of valuation
approaches
Chapter Two – Internet-based businesses
Nature, history, importance, types and
successes and failures
Chapter Four – Research design and
methodology
Nature of research, research methodologies
and choice regarding the specific
methodology to be implemented in this study
Analysis of
selected
businesses
Chapter Five – Analysis of selected
businesses
History and analyses of selected businesses
and identification of aspects influencing
business valuation
Chapter Six – Valuation of selected
businesses
Valuation of the selected businesses for the
period 2004 to 2011 using the DCF approach
Implementation
and the results of
the DCF approach
to value selected
businesses
Chapter Eight – Summary, conclusions
and recommendations
Summary, concluding remarks regarding the
valuation of Internet-based businesses and
recommendations to businesses considering
an e-business strategy
Final remarks
regarding the
valuation of the
selected
businesses
Chapter Seven – Empirical results of
valuation analysis
Reporting on statistical analysis done on
valuations
OVERVIEW OF SELECTED BUSINESSES CHAPTER 5
164
5.2 SHOPRITE HOLDINGS LIMITED
A brief historical overview of Shoprite Holdings Limited (hereafter referred to as
“the Group”) will be provided. This will be followed by an operational overview,
change in the number of stores and store locations of the Group, and a financial
overview of the Group. The classification of the Group according to the Internet-
based business classification as discussion in Chapter Two will be provided.
5.2.1 History of Shoprite Holdings Limited
Shoprite was launched in 1979 by acquiring eight Cape-based supermarkets at
a cost of R1 million. During 1983, the first Shoprite branch outside the Western
Cape was opened in Hartswater in the Northern Cape. The number of Shoprite
stores grew, and by the end of 1983 the store count stood at 21, with the store
opened in Worcester being the 21st. The turnover increased by nearly 600%
from the day Shoprite was launched four years earlier. In 1984, Shoprite bought
six food stores from Ackermans. The first store launched in the Free State was
opened in Bloemfontein during 1986, bringing number of stores owned to 33
national wide. Shoprite also listed on the JSE in 1986 in the consumer services
industry, retail super-sector, food and drug sector, and more specifically in the
food sub-sector. In 1988 the store extended its reach into the former Transvaal
province by opening two stores, the first store situated in Polokwane
(Pietersburg). Grand Bazaars with its 27 stores was acquired in 1990 and the
store count of Shoprite increased to 72. During 1991 Shoprite bought all 169
Checkers stores, and now owns 241 stores, employing 22 600 employees. In
1995, Shoprite started trading in Zambia. Sentra, a central buying organisation
for 550 owner-manager supermarket members, was bought. The Woman of the
Year Award was launched in 1996 to celebrate National Women‟s Day. The
year 1997 was also characterised by acquisitions. OK Bazaars, comprising 157
super and hyper-sized stores as well as 146 furniture stores, was added to
Shoprite‟s acquisitions. The Money Markets concept was introduced in 1998 at
Shoprite. The Chief Executive, Whitey Basson, received the Cape Business
Man of the Year Award. (Shoprite Holdings Limited Annual Report 2004
2004:4).
OVERVIEW OF SELECTED BUSINESSES CHAPTER 5
165
The Group extended its trading outside South Africa to Zimbabwe and Uganda
in 2000, to Egypt and Malawi in 2001, and to Madagascar, Mauritius and
Tanzania in 2002. The Group entered the North African market in 2001 through
its store in Egypt. During 2002 the Group listed on the Namibian Stock
Exchange, and in 2003 on the Lusaka Stock Exchange. Other 2003 events
included the opening of stores in Ghana and Angola, and the launching of
Usave format stores. In 2010, the Group extended its reach into Africa,
especially West Africa, and had more than 140 stores in 15 countries outside
South Africa. Wal-Mart entered the South African food retail market in 2011,
representing a major foreign direct investment in South Africa. Shoprite and
Checkers, individually and combined as a group, were identified by the 2003
Markinor-Sunday Times Top Brands Survey as the most trusted supermarket in
South Africa. (Shoprite Holdings Limited Annual Report 2004 2004:4; Shoprite
Holdings Ltd Integrated Annual Report 2011 2011:11).
5.2.2 Operational overview of Shoprite Holdings Limited for the period 2004 to
2011
Shoprite was acquired from the Rogut family in 1979, and since then it has
grown into a multifaceted business. In 2004 the Group was employing 63 000
employees in 16 countries. The 2004 financial year was characterised by lower
inflation, decrease in interest rates and cheaper imports, which created a
favourable market for durable and semi-durable products. The year also saw
job losses owing to the competitiveness of imported products. Turnover for the
year increased by 7.3%, while the market share increased by 5.3%. The South
African Rand strengthened against the US dollar and caused imports from other
countries to be cheaper, but exports to African countries to be more expensive.
There was also a nationwide strike in November 2003 after the implementation
of the Sectoral Determination Act which had a negative effect on sales. The
revenue generated by the furniture stores increased by 26.0%. The year-on-
year sales in South Africa were in 2004 the following: 4.2% increase for
Shoprite, 8.0% increase for Checkers and Checkers Hyper, and 26.0% increase
for House & Home and OK Furniture. The sales growth for Shoprite and
Shoprite Hyper outside South Africa was 20.7%. A number of OK stores lost
their franchise status as they did not meet the OK standards. Supplier
OVERVIEW OF SELECTED BUSINESSES CHAPTER 5
166
participation in using the Shoprite E-Commerce Exchange for orders, claims
and information on a daily basis, increased to a level where 85% of total orders
by volume and value were processed through the exchange. The dispute
between Shoprite and South African Breweries regarding the purchase of OK
Bazaars was not resolved. (Shoprite Holdings Limited Annual Report 2004
2004:8-20, 36).
The 2005 financial year comprised 53 weeks instead of the normal 52 weeks.
The turnover of the Group for the financial year increased by 11.9%, while the
operating profit increased by 27.8%. The individual brands of the Group also
performed well, with Shoprite increasing turnover by 13.2% and Checkers
increasing their turnover by 9.5%. Unfortunately the turnover growth of the
operations outside South Africa was not as promising, as it was 20.2% for 2005
compared to the 26.2% for 2004. The main reason cited for the weaker
performance was that the Rand had strengthened against the other currencies,
and therefore the affordability of the South African merchandise was reduced.
New technology that integrated the Group‟s national and international stores
was implemented during 2005. Replenishment is carried out exclusively by the
computer system, which compares the new order with previous year‟s order to
eliminate possible over- or under-ordering. During 2005, Checkers was
repositioning itself in the market by targeting higher-income consumers, while
Shoprite was still targeting the lower-income consumers. The Mumbai franchise
store was also performing very well, given the environment in which it operates.
The OK Franchise returned to profitability during 2005, and has 248 members in
South Africa and neighbouring countries. The furniture division also performed
well during 2005, increasing revenue by 16.5%, and 23 pharmacies inside
existing supermarkets were opened. The Group spent R155 million on new
stores, and R63 million on information technology. (Shoprite Holdings Limited
Annual Report 2005 2005:10-13).
In 2006, Shoprite as a price leader was better positioned than its competitors to
profit from the high growth that took place in this market. The results of the 2006
Sunday Times/Markinor Top Brands Survey found that Shoprite was the
number-one food retail brand in South Africa. Turnover of the supermarkets
OVERVIEW OF SELECTED BUSINESSES CHAPTER 5
167
increased by 12.8%, while the market share increased by a mere 0.13%. The
international stores improved their performance in rand terms by 20.4%. The
Usave brand had a 29.3% growth in turnover from 2005 to 2006. The total
number of customers served increased by 10.1%. The first store in West Africa
was opened in Lagos, Nigeria, but the store in Egypt was closed owing to the
restrictive retailing environment. Properties were sold during 2006, and a capital
gains tax to the value of R27 million was paid to SARS. The Group purchased
land and buildings to the value of R288 million, spent R516 million on
refurbishments, R336 million on new stores, and R185 million on information
technology. A total of 40 new members of the OK Franchise were signed up,
while 35 contracts were terminated. (Shoprite Holdings Limited Annual Report
2006 2006:12-17, 25).
The financial year 2007 was characterised by low interest rates which
encouraged the spending of available funds by consumers. During the first
quarter of the year the Group also experienced industrial action. The Group
encountered trading limitations with the movement of merchandise between
countries, such as different sets of duties and regulations as well as restrictions
on trade. The turnover for the Group in South Africa increased by 16.2%, while
the turnover for the international stores increased by 28.4%. Usave sales
growth was 35.2% while OK Franchise showed a growth of 14.2% in turnover.
Cash sales achieved extremely high levels while lenders provided credit
facilities before the introduction of the National Credit Act (NCA). Shoprite was
selected as Grocery and Convenience Store category winner in the annual Top
Brands survey conducted by Markinor and the Sunday Times. Land and
buildings were purchased to the value of R308 million, refurbishments
amounted to R463 million, R239 million was spent on new stores, and R159
million was used for information technology. The Group also obtained the
approval of the shareholders to repurchase shares from Shoprite Checkers
(Pty) Ltd and Shoprite Holdings Ltd Share Incentive Trust. The Group was
operating for a period of three months under a cautionary notice after Brait
Private Equity made a proposal which involved the restructuring of the
company, which may have led to a delisting of the Group from the stock
exchange. The dispute with South African Breweries regarding the acquisition
OVERVIEW OF SELECTED BUSINESSES CHAPTER 5
168
of OK Bazaars (1929) Ltd was not resolved. (Shoprite Holdings Limited Annual
Report 2007 2007:11-18, 50-51).
A global food shortage, higher inflation and higher fuel prices were some of the
external factors the Group had to face during 2008. Despite the negative
influence of these factors, the Group increased sales by 22.3%, and the
international stores managed to grow sales by 12.4%. One of the main
advantages of Shoprite is that it is the cheapest supermarket brand in South
Africa. A total of 27 new stores opened during 2008. The Money Markets,
targeting mainly the consumers with no bank accounts, helped to maintain and
to expand Shoprite‟s customer base. Shoprite increased turnover by 25.0%,
Checkers‟ turnover growth rate was 15.6%, the OK Franchise turnover growth
rate was 17.7%, and the furniture division increased turnover by 5.6%. The low
increase in turnover of the furniture division was linked to the implementation of
the NCA. The repositioning of Checkers was completed during 2008. An
amount of R1.441 billion was spent on property, plant, equipment and intangible
assets during 2008, which included investments in new land and buildings
(R401.3 million), refurbishments (R458.1 million), new stores (R220 million),
information technology (R212.9 million) and normal replacements (R148.7
million). (Shoprite Holdings Limited Annual Report 2008 2008:10-15).
The 2009 financial year was a difficult year for the Group as a result of the
global credit crisis. The year was also characterised by many job losses in the
business environment. Checkers showed the highest growth during the 2009
financial year. The turnover growth of the supermarkets of the Group was
22.8%, while the non-South African supermarkets grew by 39.9%. Computicket
Travel was launched by Checkers. The turnover of Checkers grew by 23.1%
and was the fastest growing supermarket chain in South Africa. The OK
Franchise showed a turnover growth of 26.5%, and a total of 13 new members
were added to the franchise. The turnover of the furniture division also
increased by 13.9% and 28 stores were opened. The Group opened a total of
57 new stores during 2009. A total of R1.820 billion was spent on property,
plant, equipment and intangible assets. An amount of R347.2 million was spent
on land and buildings, refurbishments amounted to R606 million, new stores
OVERVIEW OF SELECTED BUSINESSES CHAPTER 5
169
were erected at a cost of R334 million, R242.4 million was spent on information
technology, and an amount of R290.4 million was used for normal
replacements. (Shoprite Holdings Limited Annual Report 2009 2009:8-15).
Food inflation declined from 15.8% in 2009 to approximately 2.2% during 2010.
The staple products were also 30% cheaper in 2010 than in 2009. The Group‟s
turnover increased by 13.6% over the last 53 weeks for the 2010 financial year
(the reporting for 2009 was done for a period of 52 weeks) while the
international stores increased their turnover by 18.0%. During the 2010 financial
year, 7 000 job opportunities were created by the Group. Various distribution
centres were expanded, including those in Centurion, Gauteng, Cape Town and
Durban. A total of R870 million was spent on new stores outside South Africa.
OK Franchise reported a turnover growth of 8.9%. The liquor store, Enjoy, was
also launched during 2010. MediRite, the pharmacies located inside the
Group‟s supermarkets and hypermarkets, increased by 23% and the revenue
reported grew by 60%. MediRite acquired Transfarm Pharmaceutical
Wholesalers during 2010. An amount of R870 million was used to purchase
land and buildings, R417 million was used for refurbishments, new stores at a
cost of R355 million were erected, and R279 million was spent on information
technology. A net total of 11 Shoprite stores opened during 2010, a net total of
39 Usave stores were opened, and 35 LiquorShops were opened. Checkers
increased their turnover by 19.9%. The strongest growth of 17.3% was reported
by OK Furniture and OK Power Express and 15.9% by House & Home, while
the overall price deflation in the furniture segments was 5.5%. The Group had a
34.4% market share in June 2010 and an overall 32.6% market share for the
year. Shoprite received the Most-loved retail brand in the country award in the
annual Top Brands survey conducted by Markinor and the Sunday Times.
(Shoprite Holdings Ltd Annual Report 2010 2010:10-22, 35).
The disposable income, especially of the low-income consumers, came under
pressure as household debt increased and the cost of essential services
increased drastically over the last few years as from 2007 owing to the
worldwide recession. The turnover of the Group for 2011 increased by 7.3%
when compared to the 2010 growth rate over a 53-week period (9.7% growth if
OVERVIEW OF SELECTED BUSINESSES CHAPTER 5
170
compared to a 52-week period). The Group‟s turnover increased by 7.26%, OK
Franchise increased turnover by 7.8%, and the furniture division increased
turnover by 1.9%. Investments in property, plant, equipment and intangible
assets amounted to R3.005 billion. An amount of R937 million was used to
acquire land and buildings, R361 million was used for refurbishments, the cost
of new stores was R610 million, and R374 million was spent on information
technology, while R723 million was used for normal replacements. With the
repositioning of Checkers completed, 53% of their consumers were seen to
come from the higher-income consumer segment. Shoprite was again selected
as Grocery and Convenience Store category winner in the annual Top Brands
survey conducted by Markinor and the Sunday Times. (Shoprite Holdings
Limited Integrated Report 2011 2011:14-21).
As a corporate citizen, Shoprite employed over the period 2004 to 2011
between 61 500 and 69 000 people, the majority of whom were from the
historically disadvantaged groups. Shoprite also provided management and
staff training with specific programmes to enhance the various skills. A large
number of articled clerks were employed at Shoprite over the eight-year period
to complete their articles at Shoprite. Shoprite was approved by the South
African Institute for Chartered Accountants (SAICA) as a training organisation
for Training Outside Public Practice (TOPP) up to chartered accountant (CA)
level. The learnerships programmes were launched and involved opportunities
in retail management and other related occupations at various NQF-levels.
Succession planning was done by identifying a pool of managers to be
developed as possible successors. Educational assistance in terms of grants for
school fees for lower-income staff was provided, and interest-free educational
loans and bursaries for studies were made available. A support programme for
HIV+/Aids employees was launched, providing access to Aids counselling
specialists. Product safety programmes were implemented in both stores and
distribution centres, to ensure that all products were free of forbidden residues.
Shoprite also supported local producers when buying supplies. Other initiatives
undertaken by Shoprite included worm-farming/vermiculture, energy
management, packaging, and waste management (Shoprite Holdings Limited

OVERVIEW OF SELECTED BUSINESSES CHAPTER 5
171
Annual Report 2004 – 2009; Shoprite Holdings Ltd Annual Report 2010;
Shoprite Holdings Ltd Integrated Report 2011).
Over the period 2004 to 2011, Shoprite was involved in numerous corporate
projects, and some of the projects are still running during 2012. The projects
included the following:
consumer education programmes focusing on a diverse range of topics
from hygiene, health issues, finances to crime;
Shoprite Checkers/SABC2 Woman of the Year Awards recognising
women of distinction;
the Shoprite Checkers/USSASA Under-13 Netball Challenge sponsorship
programme to develop talented young girls;
the association with Aged in Action and the South African Police Services
focusing on fitness, activity, celebration and vulnerability of the elderly;
a sponsorship programme to develop talented young girls and self-
defence workshops for young girls in the Western Cape, with the aim to
nationalise the workshop;
the Toy for Toy Campaign in association with the SA Red Cross Society
to collect toys to be distributed at Christmas to needy children;
the Shoprite Soup Truck Initiative, distributing soup and bread to needy
children and the elderly;
the Shoprite Community Network where listeners nominated worthy
causes or development projects to be supported by the initiative;
the RSG/KKNK Book Collection to collect books for libraries throughout
South Africa to promote literacy in South Africa;
Shoprite Checkers Strokes of Genius project to help young local artists to
gain recognition for their work, and to encourage an art culture among the
youth;
Cuppa for Cansa in association with the Cancer Association of South
Africa to raise cancer awareness of funds for the worthy cause;
Age in Action‟s Pretty Things for Little Things where the elderly produced
clothing or toys for needy children;
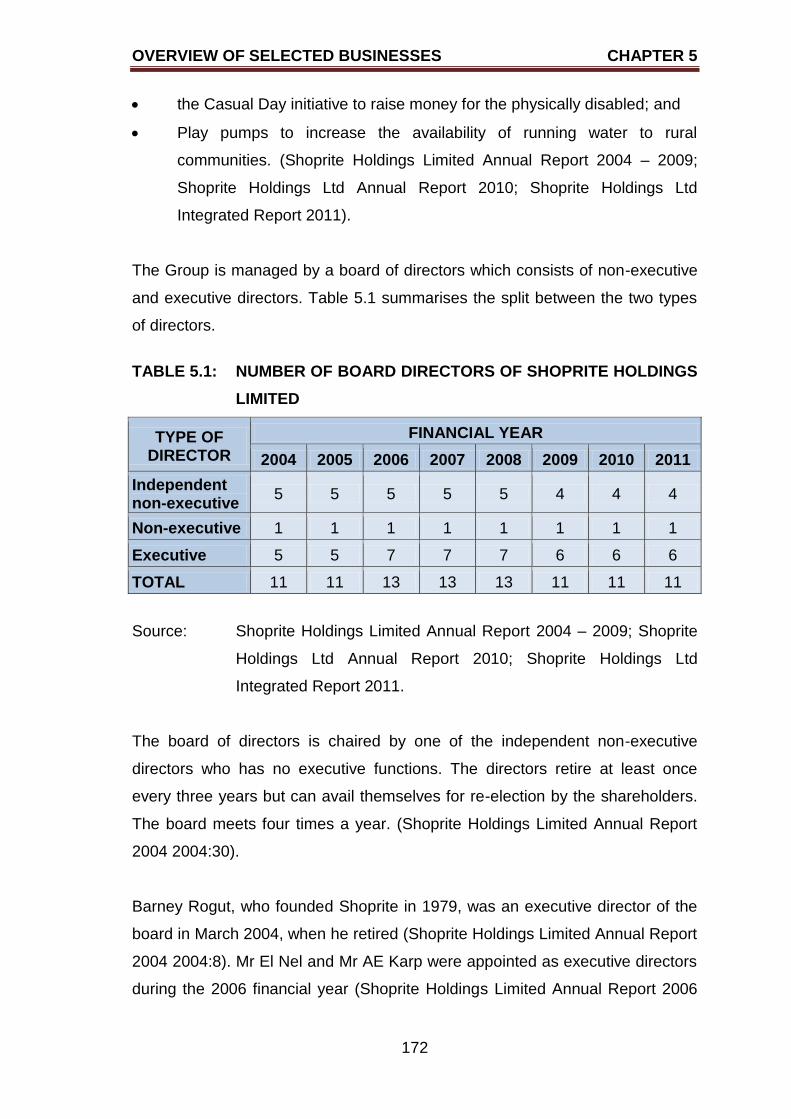
OVERVIEW OF SELECTED BUSINESSES CHAPTER 5
172
the Casual Day initiative to raise money for the physically disabled; and
Play pumps to increase the availability of running water to rural
communities. (Shoprite Holdings Limited Annual Report 2004 – 2009;
Shoprite Holdings Ltd Annual Report 2010; Shoprite Holdings Ltd
Integrated Report 2011).
The Group is managed by a board of directors which consists of non-executive
and executive directors. Table 5.1 summarises the split between the two types
of directors.
TABLE 5.1: NUMBER OF BOARD DIRECTORS OF SHOPRITE HOLDINGS
LIMITED
TYPE OF DIRECTOR
FINANCIAL YEAR
2004 2005 2006 2007 2008 2009 2010 2011
Independent non-executive
5 5 5 5 5 4 4 4
Non-executive 1 1 1 1 1 1 1 1
Executive 5 5 7 7 7 6 6 6
TOTAL 11 11 13 13 13 11 11 11
Source: Shoprite Holdings Limited Annual Report 2004 – 2009; Shoprite
Holdings Ltd Annual Report 2010; Shoprite Holdings Ltd
Integrated Report 2011.
The board of directors is chaired by one of the independent non-executive
directors who has no executive functions. The directors retire at least once
every three years but can avail themselves for re-election by the shareholders.
The board meets four times a year. (Shoprite Holdings Limited Annual Report
2004 2004:30).
Barney Rogut, who founded Shoprite in 1979, was an executive director of the
board in March 2004, when he retired (Shoprite Holdings Limited Annual Report
2004 2004:8). Mr El Nel and Mr AE Karp were appointed as executive directors
during the 2006 financial year (Shoprite Holdings Limited Annual Report 2006
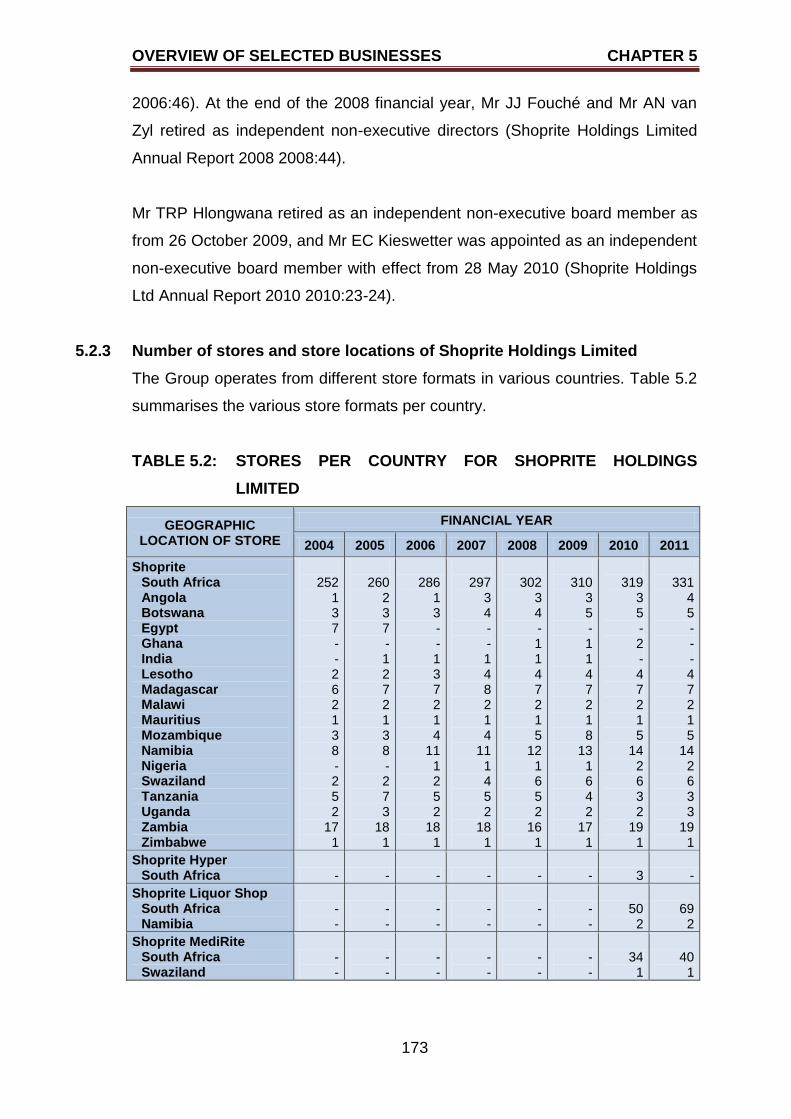
OVERVIEW OF SELECTED BUSINESSES CHAPTER 5
173
2006:46). At the end of the 2008 financial year, Mr JJ Fouché and Mr AN van
Zyl retired as independent non-executive directors (Shoprite Holdings Limited
Annual Report 2008 2008:44).
Mr TRP Hlongwana retired as an independent non-executive board member as
from 26 October 2009, and Mr EC Kieswetter was appointed as an independent
non-executive board member with effect from 28 May 2010 (Shoprite Holdings
Ltd Annual Report 2010 2010:23-24).
5.2.3 Number of stores and store locations of Shoprite Holdings Limited
The Group operates from different store formats in various countries. Table 5.2
summarises the various store formats per country.
TABLE 5.2: STORES PER COUNTRY FOR SHOPRITE HOLDINGS
LIMITED
GEOGRAPHIC LOCATION OF STORE
FINANCIAL YEAR
2004 2005 2006 2007 2008 2009 2010 2011
Shoprite South Africa Angola Botswana Egypt Ghana India Lesotho Madagascar Malawi Mauritius Mozambique Namibia Nigeria Swaziland Tanzania Uganda Zambia Zimbabwe
252
1 3 7 - - 2 6 2 1 3 8 - 2 5 2
17 1
260
2 3 7 - 1 2 7 2 1 3 8 - 2 7 3
18 1
286 1 3 - - 1 3 7 2 1 4
11 1 2 5 2
18 1
297
3 4 - - 1 4 8 2 1 4
11 1 4 5 2
18 1
302
3 4 - 1 1 4 7 2 1 5
12 1 6 5 2
16 1
310
3 5 - 1 1 4 7 2 1 8
13 1 6 4 2
17 1
319
3 5 - 2 - 4 7 2 1 5
14 2 6 3 2
19 1
331
4 5 - - - 4 7 2 1 5
14 2 6 3 3
19 1
Shoprite Hyper South Africa - - - - - - 3 -
Shoprite Liquor Shop South Africa Namibia
- -
- -
- -
- -
- -
- -
50 2
69 2
Shoprite MediRite South Africa Swaziland
- -
- -
- -
- -
- -
- -
34 1
40 1
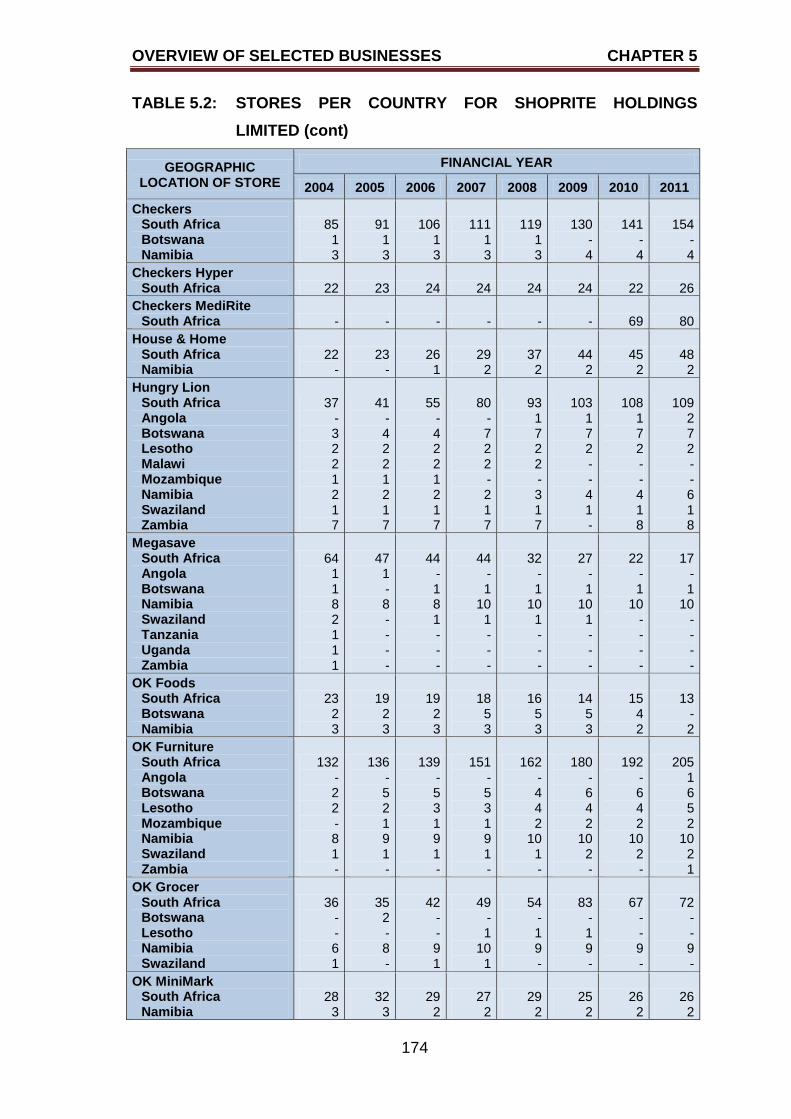
OVERVIEW OF SELECTED BUSINESSES CHAPTER 5
174
TABLE 5.2: STORES PER COUNTRY FOR SHOPRITE HOLDINGS
LIMITED (cont)
GEOGRAPHIC LOCATION OF STORE
FINANCIAL YEAR
2004 2005 2006 2007 2008 2009 2010 2011
Checkers South Africa Botswana Namibia
85 1 3
91 1 3
106 1 3
111 1 3
119 1 3
130 - 4
141 - 4
154 - 4
Checkers Hyper South Africa 22 23 24 24 24 24 22 26
Checkers MediRite South Africa - - - - - - 69 80
House & Home South Africa Namibia
22 -
23 -
26 1
29 2
37 2
44 2
45 2
48 2
Hungry Lion South Africa Angola Botswana Lesotho Malawi Mozambique Namibia Swaziland Zambia
37 - 3 2 2 1 2 1 7
41 - 4 2 2 1 2 1 7
55 - 4 2 2 1 2 1 7
80 - 7 2 2 - 2 1 7
93 1 7 2 2 - 3 1 7
103 1 7 2 - - 4 1 -
108 1 7 2 - - 4 1 8
109 2 7 2 - - 6 1 8
Megasave South Africa Angola Botswana Namibia Swaziland Tanzania Uganda Zambia
64 1 1 8 2 1 1 1
47 1 - 8 - - - -
44 - 1 8 1 - - -
44 - 1
10 1 - - -
32 - 1
10 1 - - -
27 - 1
10 1 - - -
22 - 1
10 - - - -
17 - 1
10 - - - -
OK Foods South Africa Botswana Namibia
23 2 3
19 2 3
19 2 3
18 5 3
16 5 3
14 5 3
15 4 2
13 - 2
OK Furniture South Africa Angola Botswana Lesotho Mozambique Namibia Swaziland Zambia
132 - 2 2 - 8 1 -
136 - 5 2 1 9 1 -
139 - 5 3 1 9 1 -
151 - 5 3 1 9 1 -
162 - 4 4 2
10 1 -
180 - 6 4 2
10 2 -
192 - 6 4 2
10 2 -
205 1 6 5 2
10 2 1
OK Grocer South Africa Botswana Lesotho Namibia Swaziland
36 - - 6 1
35 2 - 8 -
42 - - 9 1
49 - 1
10 1
54 - 1 9 -
83 - 1 9 -
67 - - 9 -
72 - - 9 -
OK MiniMark South Africa Namibia
28 3
32 3
29 2
27 2
29 2
25 2
26 2
26 2
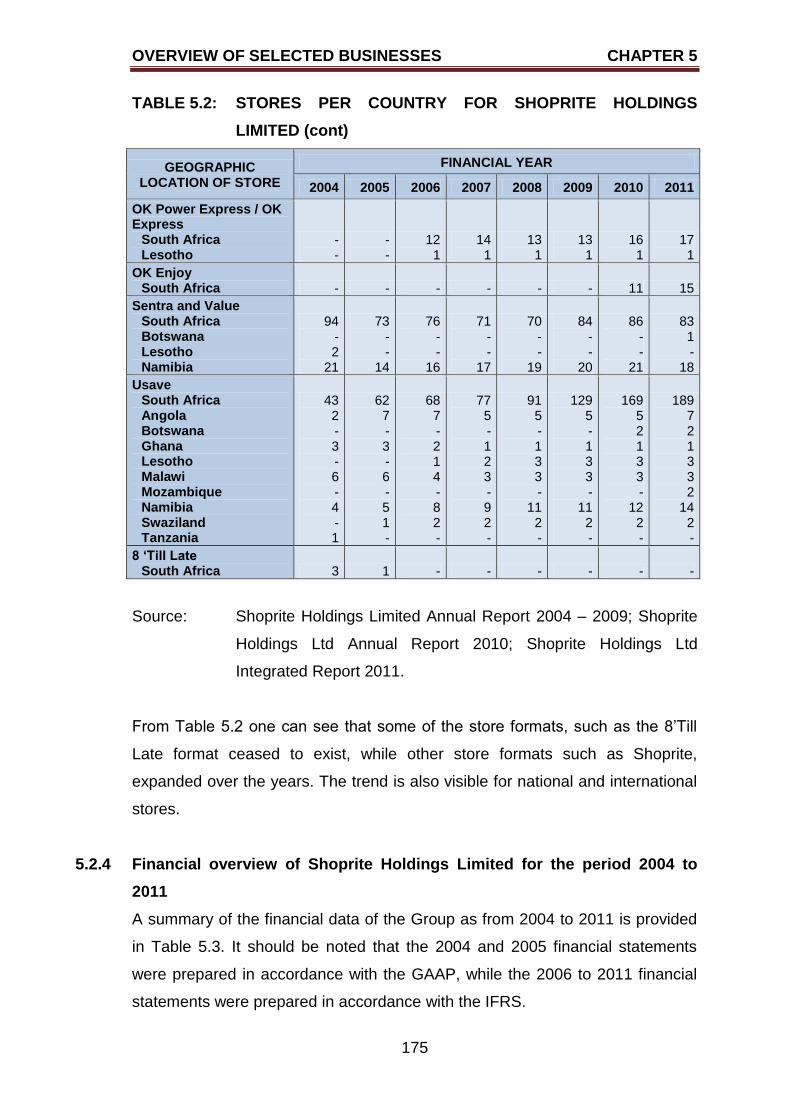
OVERVIEW OF SELECTED BUSINESSES CHAPTER 5
175
TABLE 5.2: STORES PER COUNTRY FOR SHOPRITE HOLDINGS
LIMITED (cont)
GEOGRAPHIC LOCATION OF STORE
FINANCIAL YEAR
2004 2005 2006 2007 2008 2009 2010 2011
OK Power Express / OK Express
South Africa Lesotho
- -
- -
12 1
14 1
13 1
13 1
16 1
17 1
OK Enjoy South Africa - - - - - - 11 15
Sentra and Value South Africa Botswana Lesotho Namibia
94 - 2
21
73 - -
14
76 - -
16
71 - -
17
70 - -
19
84 - -
20
86 - -
21
83 1 -
18
Usave South Africa Angola Botswana Ghana Lesotho Malawi Mozambique Namibia Swaziland Tanzania
43 2 - 3 - 6 - 4 - 1
62 7 - 3 - 6 - 5 1 -
68 7 - 2 1 4 - 8 2 -
77 5 - 1 2 3 - 9 2 -
91 5 - 1 3 3 -
11 2 -
129 5 - 1 3 3 -
11 2 -
169 5 2 1 3 3 -
12 2 -
189 7 2 1 3 3 2
14 2 -
8 ‘Till Late South Africa 3 1 - - - - - -
Source: Shoprite Holdings Limited Annual Report 2004 – 2009; Shoprite
Holdings Ltd Annual Report 2010; Shoprite Holdings Ltd
Integrated Report 2011.
From Table 5.2 one can see that some of the store formats, such as the 8‟Till
Late format ceased to exist, while other store formats such as Shoprite,
expanded over the years. The trend is also visible for national and international
stores.
5.2.4 Financial overview of Shoprite Holdings Limited for the period 2004 to
2011
A summary of the financial data of the Group as from 2004 to 2011 is provided
in Table 5.3. It should be noted that the 2004 and 2005 financial statements
were prepared in accordance with the GAAP, while the 2006 to 2011 financial
statements were prepared in accordance with the IFRS.
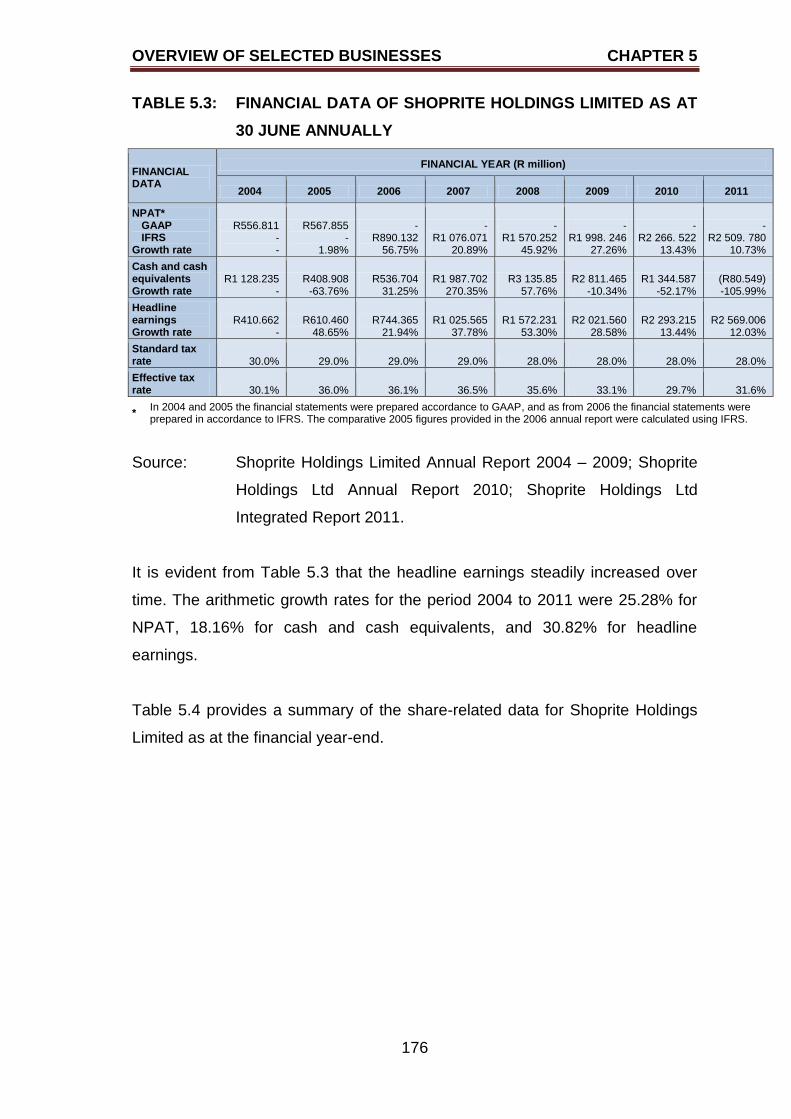
OVERVIEW OF SELECTED BUSINESSES CHAPTER 5
176
TABLE 5.3: FINANCIAL DATA OF SHOPRITE HOLDINGS LIMITED AS AT
30 JUNE ANNUALLY
FINANCIAL DATA
FINANCIAL YEAR (R million)
2004 2005 2006 2007 2008 2009 2010 2011
NPAT* GAAP IFRS
Growth rate
R556.811 - -
R567.855 -
1.98%
- R890.132
56.75%
- R1 076.071
20.89%
- R1 570.252
45.92%
- R1 998. 246
27.26%
- R2 266. 522
13.43%
- R2 509. 780
10.73%
Cash and cash equivalents Growth rate
R1 128.235 -
R408.908 -63.76%
R536.704 31.25%
R1 987.702 270.35%
R3 135.85 57.76%
R2 811.465 -10.34%
R1 344.587 -52.17%
(R80.549) -105.99%
Headline earnings Growth rate
R410.662 -
R610.460 48.65%
R744.365 21.94%
R1 025.565 37.78%
R1 572.231 53.30%
R2 021.560 28.58%
R2 293.215 13.44%
R2 569.006 12.03%
Standard tax rate 30.0% 29.0% 29.0% 29.0% 28.0% 28.0% 28.0% 28.0%
Effective tax rate 30.1% 36.0% 36.1% 36.5% 35.6% 33.1% 29.7% 31.6%
* In 2004 and 2005 the financial statements were prepared accordance to GAAP, and as from 2006 the financial statements were prepared in accordance to IFRS. The comparative 2005 figures provided in the 2006 annual report were calculated using IFRS.
Source: Shoprite Holdings Limited Annual Report 2004 – 2009; Shoprite
Holdings Ltd Annual Report 2010; Shoprite Holdings Ltd
Integrated Report 2011.
It is evident from Table 5.3 that the headline earnings steadily increased over
time. The arithmetic growth rates for the period 2004 to 2011 were 25.28% for
NPAT, 18.16% for cash and cash equivalents, and 30.82% for headline
earnings.
Table 5.4 provides a summary of the share-related data for Shoprite Holdings
Limited as at the financial year-end.
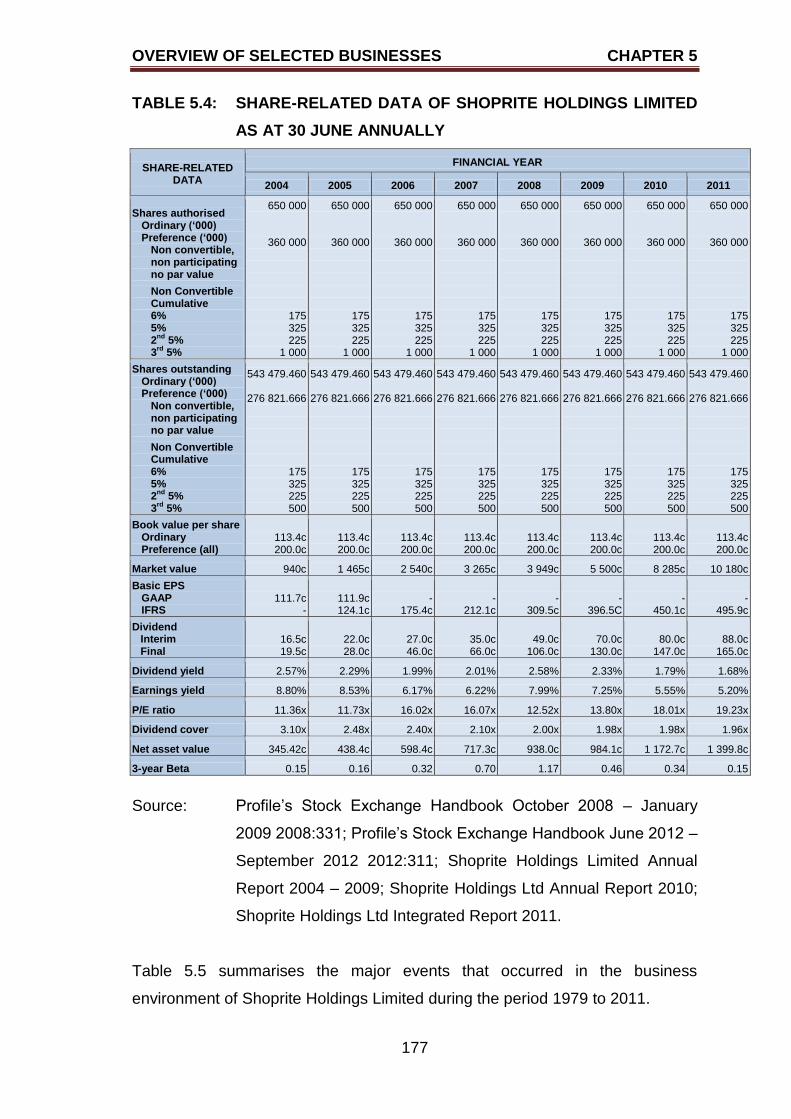
OVERVIEW OF SELECTED BUSINESSES CHAPTER 5
177
TABLE 5.4: SHARE-RELATED DATA OF SHOPRITE HOLDINGS LIMITED
AS AT 30 JUNE ANNUALLY
SHARE-RELATED DATA
FINANCIAL YEAR
2004 2005 2006 2007 2008 2009 2010 2011
Shares authorised Ordinary (‘000) Preference (‘000)
Non convertible, non participating no par value
Non Convertible Cumulative 6% 5% 2
nd 5%
3rd
5%
650 000
360 000
175 325 225
1 000
650 000
360 000
175 325 225
1 000
650 000
360 000
175 325 225
1 000
650 000
360 000
175 325 225
1 000
650 000
360 000
175 325 225
1 000
650 000
360 000
175 325 225
1 000
650 000
360 000
175 325 225
1 000
650 000
360 000
175 325 225
1 000
Shares outstanding Ordinary (‘000) Preference (‘000)
Non convertible, non participating no par value
Non Convertible Cumulative 6% 5% 2
nd 5%
3rd
5%
543 479.460
276 821.666
175 325 225 500
543 479.460
276 821.666
175 325 225 500
543 479.460
276 821.666
175 325 225 500
543 479.460
276 821.666
175 325 225 500
543 479.460
276 821.666
175 325 225 500
543 479.460
276 821.666
175 325 225 500
543 479.460
276 821.666
175 325 225 500
543 479.460
276 821.666
175 325 225 500
Book value per share Ordinary Preference (all)
113.4c 200.0c
113.4c 200.0c
113.4c 200.0c
113.4c 200.0c
113.4c 200.0c
113.4c 200.0c
113.4c 200.0c
113.4c 200.0c
Market value 940c 1 465c 2 540c 3 265c 3 949c 5 500c 8 285c 10 180c
Basic EPS GAAP IFRS
111.7c -
111.9c 124.1c
- 175.4c
- 212.1c
- 309.5c
- 396.5C
- 450.1c
- 495.9c
Dividend Interim Final
16.5c 19.5c
22.0c 28.0c
27.0c 46.0c
35.0c 66.0c
49.0c 106.0c
70.0c 130.0c
80.0c 147.0c
88.0c 165.0c
Dividend yield 2.57% 2.29% 1.99% 2.01% 2.58% 2.33% 1.79% 1.68%
Earnings yield 8.80% 8.53% 6.17% 6.22% 7.99% 7.25% 5.55% 5.20%
P/E ratio 11.36x 11.73x 16.02x 16.07x 12.52x 13.80x 18.01x 19.23x
Dividend cover 3.10x 2.48x 2.40x 2.10x 2.00x 1.98x 1.98x 1.96x
Net asset value 345.42c 438.4c 598.4c 717.3c 938.0c 984.1c 1 172.7c 1 399.8c
3-year Beta 0.15 0.16 0.32 0.70 1.17 0.46 0.34 0.15
Source: Profile‟s Stock Exchange Handbook October 2008 – January
2009 2008:331; Profile‟s Stock Exchange Handbook June 2012 –
September 2012 2012:311; Shoprite Holdings Limited Annual
Report 2004 – 2009; Shoprite Holdings Ltd Annual Report 2010;
Shoprite Holdings Ltd Integrated Report 2011.
Table 5.5 summarises the major events that occurred in the business
environment of Shoprite Holdings Limited during the period 1979 to 2011.
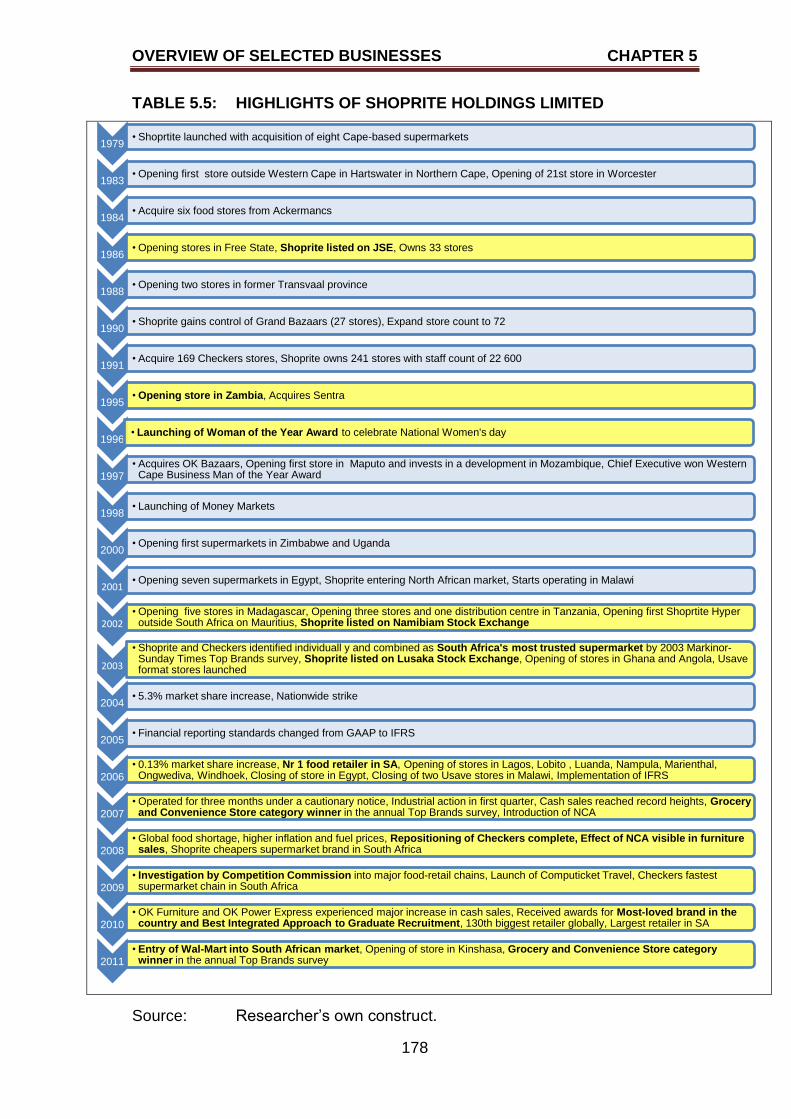
OVERVIEW OF SELECTED BUSINESSES CHAPTER 5
178
TABLE 5.5: HIGHLIGHTS OF SHOPRITE HOLDINGS LIMITED
Source: Researcher‟s own construct.
1979 • Shoprtite launched with acquisition of eight Cape-based supermarkets
1983 • Opening first store outside Western Cape in Hartswater in Northern Cape, Opening of 21st store in Worcester
1984 • Acquire six food stores from Ackermancs
1986 • Opening stores in Free State, Shoprite listed on JSE, Owns 33 stores
1988 • Opening two stores in former Transvaal province
1990 • Shoprite gains control of Grand Bazaars (27 stores), Expand store count to 72
1991 • Acquire 169 Checkers stores, Shoprite owns 241 stores with staff count of 22 600
1995 • Opening store in Zambia, Acquires Sentra
1996 • Launching of Woman of the Year Award to celebrate National Women's day
1997 • Acquires OK Bazaars, Opening first store in Maputo and invests in a development in Mozambique, Chief Executive won Western
Cape Business Man of the Year Award
1998 • Launching of Money Markets
2000 • Opening first supermarkets in Zimbabwe and Uganda
2001 • Opening seven supermarkets in Egypt, Shoprite entering North African market, Starts operating in Malawi
2002 • Opening five stores in Madagascar, Opening three stores and one distribution centre in Tanzania, Opening first Shoprtite Hyper
outside South Africa on Mauritius, Shoprite listed on Namibiam Stock Exchange
2003
• Shoprite and Checkers identified individuall y and combined as South Africa's most trusted supermarket by 2003 Markinor-Sunday Times Top Brands survey, Shoprite listed on Lusaka Stock Exchange, Opening of stores in Ghana and Angola, Usave format stores launched
2004 • 5.3% market share increase, Nationwide strike
2005 • Financial reporting standards changed from GAAP to IFRS
2006 • 0.13% market share increase, Nr 1 food retailer in SA, Opening of stores in Lagos, Lobito , Luanda, Nampula, Marienthal,
Ongwediva, Windhoek, Closing of store in Egypt, Closing of two Usave stores in Malawi, Implementation of IFRS
2007 • Operated for three months under a cautionary notice, Industrial action in first quarter, Cash sales reached record heights, Grocery
and Convenience Store category winner in the annual Top Brands survey, Introduction of NCA
2008 • Global food shortage, higher inflation and fuel prices, Repositioning of Checkers complete, Effect of NCA visible in furniture
sales, Shoprite cheapers supermarket brand in South Africa
2009 • Investigation by Competition Commission into major food-retail chains, Launch of Computicket Travel, Checkers fastest
supermarket chain in South Africa
2010 • OK Furniture and OK Power Express experienced major increase in cash sales, Received awards for Most-loved brand in the
country and Best Integrated Approach to Graduate Recruitment, 130th biggest retailer globally, Largest retailer in SA
2011 • Entry of Wal-Mart into South African market, Opening of store in Kinshasa, Grocery and Convenience Store category
winner in the annual Top Brands survey
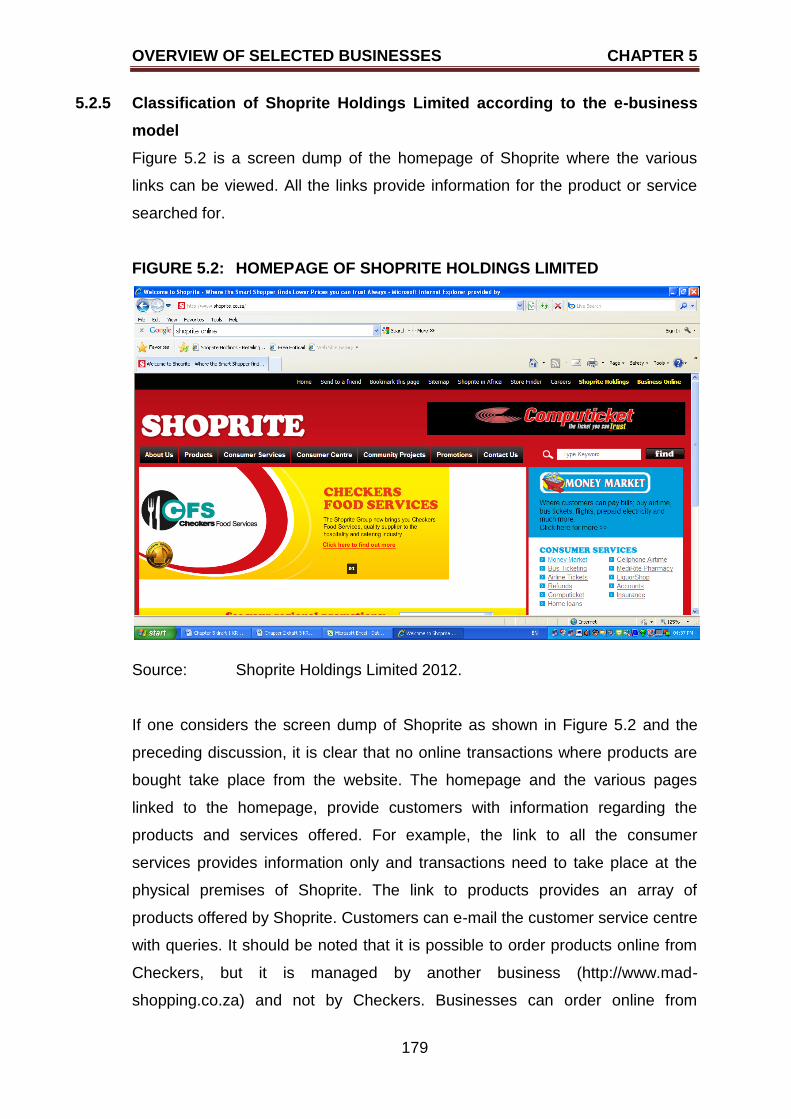
OVERVIEW OF SELECTED BUSINESSES CHAPTER 5
179
5.2.5 Classification of Shoprite Holdings Limited according to the e-business
model
Figure 5.2 is a screen dump of the homepage of Shoprite where the various
links can be viewed. All the links provide information for the product or service
searched for.
FIGURE 5.2: HOMEPAGE OF SHOPRITE HOLDINGS LIMITED
Source: Shoprite Holdings Limited 2012.
If one considers the screen dump of Shoprite as shown in Figure 5.2 and the
preceding discussion, it is clear that no online transactions where products are
bought take place from the website. The homepage and the various pages
linked to the homepage, provide customers with information regarding the
products and services offered. For example, the link to all the consumer
services provides information only and transactions need to take place at the
physical premises of Shoprite. The link to products provides an array of
products offered by Shoprite. Customers can e-mail the customer service centre
with queries. It should be noted that it is possible to order products online from
Checkers, but it is managed by another business (http://www.mad-
shopping.co.za) and not by Checkers. Businesses can order online from
OVERVIEW OF SELECTED BUSINESSES CHAPTER 5
180
Checkers via the Checkers Food Services (CFS) link, but final consumers
cannot use this facility. Based on the discussion in Chapter Two regarding the
e-business model stages, the Group can therefore be classified as a brick-and-
mortar business in the limited online presence stage from a business-to-
consumer perspective.
5.3 THE SPAR GROUP LTD
The following paragraphs will provide a brief history of The SPAR Group Ltd
(hereafter referred to as SPAR) and an overview of the operations over an
eight-year period. A summary of the store formats and distribution centres will
be given and will be followed by an overview of the financial performance for the
period 2004 to 2011. To conclude the discussion of SPAR, the highlights of
SPAR will be summarised.
5.3.1 History of The SPAR Group Ltd
SPAR originated in the Netherlands and was established by Adriaan van Well in
1932 as DESPAR. The establishing of DESPAR was in line with what was
happening in the USA, where independent wholesalers and retailers were
uniting to enter voluntary trading. The business philosophy of DESPAR was “all
will benefit from united co-operation” and the business name is an acronym for
the Dutch version of the business philosophy (“Door Eendrachtig Samenwerken
Profiteren Allen Regelmatig”). In 1963, eight wholesalers formed SPAR, which
provided services to approximately 500 small retailers. SPAR operates under a
licence agreement with SPAR International in Amsterdam. Over time, SPAR
reorganised itself into two types of members, namely, SPAR retailers and SPAR
distribution centres. All SPAR retailers and SPAR distribution centres are
members of the SPAR Guild of Southern Africa, which is a non-profit company.
All members pay subscriptions to this non-profit company, and the subscriptions
collected are then used for advertising and promoting SPAR. The operations of
SPAR are divided into six geographic areas, each with its own distribution
centre. (The SPAR Group Limited Annual Report 2005 2005:11; The SPAR
Group Limited 2011 Integrated Annual Report 2011:5).
OVERVIEW OF SELECTED BUSINESSES CHAPTER 5
181
The overall efficiency of SPAR is controlled by following the 12 Ladders, which
is a comparative measure of world-class performance across 12 indices and
Work Structuring processes. Succession planning is also of great importance.
Possible future leaders are identified on an ongoing basis, and the progress of
high-potential employees is closely monitored. SPAR is also committed to
corporate social investments, by funding identified AIDS projects, Business
Against Crime, and local projects and charities involved in health and hunger
alleviation and the promotion of education. (The SPAR Group Limited Annual
Report 2006 2006:30-33). SPAR is also exposed to various financial risks,
namely credit risk, interest risk, liquidity risk and foreign exchange risk (The
SPAR Group Limited Annual Report 2005 2005:57).
5.3.2 Operational overview of The SPAR Group Ltd for the period 2004 to 2011
For the retail market in general, the 2004 financial year was a remarkable year
which was characterised by good growth, favourable exchange rates and
lowered interest rates. The stiff competition in food market consists of a few
major chains, large trade centres and a number of small convenience stores.
The major competitors of SPAR extended their businesses by franchising.
SPAR members were encouraged to acquire liquor stores to expand the reach
of SPAR in the liquor market. The building materials market was also regarded
as a booming market because interest rates were reduced, and therefore
customers had more disposable income for upgrading and expanding their
homes. Other expansions, extensions and upgrading that took place during
2004 were at the North Rand Distribution Centre (major extensions and re-
organisation), the Nelspruit Distribution Centre (new warehouse racking and
equipment, improved information and operating technology which was planned
to be completed by 2006) and the Western Cape Distribution Centre
(warehouse planned to be completed by 2006 at a cost of R190 million). Plans
were also approved in 2004 to expand the KwaZulu Natal Distribution Centre at
a cost of R20 million by 2006. (The SPAR Group Limited Annual Report 2004
2004:11-13).
The 2004 financial year for SPAR was also characterised by three major issues,
namely, the remarkable drop in food inflation, the acquisition of Nelspruit
OVERVIEW OF SELECTED BUSINESSES CHAPTER 5
182
Wholesalers (Pty) Ltd and the unbundling of SPAR from Tiger Brands Ltd and
the subsequent listing of SPAR on the JSE. The 2004 food inflation was
averaging between 2% and 3% while the real growth for SPAR was
approximately 8% for the year. The cash purchase of Nelspruit Wholesalers
(Pty) Ltd on 1 November 2003 at a cost of R263 million negatively influenced
the 2004 NPAT. The trading margin of 3.3% was also below the 2003 trading
margin of 3.7% owing to the acquisition and the expansion of the North Rand
Distribution Centre. Tiger Brands Ltd had a minority stake in SPAR from 1978,
and in 1988 SPAR became a wholly-owned subsidiary of Tiger Brands Ltd. On
13 May 2004 Tiger Brands Ltd announced its unbundling from SPAR. After the
unbundling of SPAR from their holding company, Tiger Brands Ltd, SPAR
became a listed company on the JSE on 18 October 2004. (The SPAR Group
Limited Annual Report 2004 2004:11-12, 30; Tiger Brands Annual Report 2005
2005:8). During the 2004 financial year, SPAR disposed of a retail division, and
the net proceeds on the disposal amounted to R17 092 000. Four SPAR-owned
retail stores which formed the retail division were Gateway, Westwille, Knowles
and Richdens. Other retail stores, namely The Greymont and Dowerglen retail
stores and Twoline Trading 9 (Pty) Limited were also sold during 2004. The
Greymont and Dowerglen retail stores traded as Fixtrade 538 (Pty) Limited. A
net cash flow equal to R993 000 resulted from the disposal of these retail
stores. (The SPAR Group Limited Annual Report 2004 2004:38-39; The SPAR
Group Limited Annual Report 2005 2005:49-50).
During 2005, the lower interest, tax and inflation rates had a positive influence
on consumer spending. There was also a slow growth in the food retail market.
The liquor market was growing at an extraordinary rate although the market is
highly competitive. The building materials market was also booming because of
the lower interest, tax and inflation rates (The SPAR Group Limited Annual
Report 2005 2005:3).
The growth of the 2006 financial year for SPAR was 16.7% although the market
only grew by 14.7%. During the year, a total of 122 existing SPAR stores were
engaged in the ongoing upgrading process, as the focus remained on improving
customer service and meeting customer demands. The SPAR house brand
OVERVIEW OF SELECTED BUSINESSES CHAPTER 5
183
experienced an unprecedented growth in excess of 21%. Although there was a
growth in the number of liquor stores, the opening of some liquor stores was
delayed as there was a legislative backlog in various provinces regarding the
issuing of liquor licences. The growth of the liquor market was approximately
12%, and the turnover growth of Built-it was 61%. During the year the
warehouse management systems were improved, which resulted in improved
productivity while adhering to best operating practices. New techniques such as
the scanning of inbound stock and voice-activated stock picking were
implemented with great success at certain distribution centres. The transport
fleet of SPAR was also upgraded and expanded. The fleet consisted of 190
trucks and more than 250 semi-trailers. A new distribution centre in Philippi was
underway at a cost of R300 million, and SPAR expected to sell the Montague
Gardens facility for R60 million. The capital expenditure for the 2006 financial
year on facilities amounted to R190 million. During the 2006 financial year, the
SPAR Group Limited Employee Share incentive Trust bought back 2.7 million
shares at a cost of R99.8 million. (The SPAR Group Limited Annual Report
2006 2006:7-13).
Despite a highly competitive environment, the growth rate of the liquor and
building materials stores was at 48.2% and 37.3% respectively for the 2007
financial year. Many expansion and replacement projects at a cost of R314.66
million were undertaken during 2007, to ensure that the growth could be
sustained. Shares were repurchased at cost of R92.1 million. The 2007 financial
year had a record high of more than R2.4 billion in sales. The Good Living
range of products was launched in 2007. (The SPAR Group Limited 2007
Annual Report 2007:2-3, 5).
The SPAR branded products excelled by realising a 44% year-on-year sales
growth from 2007 to 2008. The turnover of SPAR increased by 23.2% although
there was a sharp upward trend in the inflation. The liquor market also
prospered in 2008 and there was moderate growth in the building materials
market. During 2008, R365.3 million was spent on expansion projects, while
R60.8 million was used for replacement projects. A new distribution centre in
the Western Cape was built at a cost of R270 million, and the construction of
OVERVIEW OF SELECTED BUSINESSES CHAPTER 5
184
another facility in KwaZulu Natal commenced at an estimated cost of R190
million. The SPAR Group Limited Employee Share Trust purchased 163 200
shares at a cost of R8.1 million. (The SPAR Group Limited 2008 Annual Report
2008:5-7, 34).
The 2009 financial year was a very difficult and highly competitive year in terms
of sales and profitability for SPAR. Turnover for the year increased by19.5%
from the 2008 results. A number of expansion projects were undertaken during
2009. The KwaZulu Natal perishable facility and the South Rand facility were
completed during 2009 at a cost of R145 million and R104 million respectively.
Montague Gardens was sold for R93 million. A total of 240 products (new and
repackaged products) were introduced to the market. The SPAR Group Limited
Employee Share Trust purchased 719 800 shares at a cost of R34.9 million.
(The SPAR Group Limited 2009 Annual Report 2009:3-10, 38).
The 2010 financial year was characterised by slow economic recovery, low
inflation and a highly competitive retail environment. Food inflation for 2010 was
only 1% owing to the deflation of basic commodities. Despite these
circumstances, SPAR increased food retail turnover by 8.6%, liquor turnover by
25.4%, and building materials by 19%. The capital expenditure for 2010 was
R206 million. In 2009, TOPS at SPAR won the Best bottle store – Your choice
award 2009, the Favourite liquor retailer – Readers Choice 2009, the Retail
liquor category – Sunday Times Top Achievement Award 2009 and the Best
liquor chain – AVUSA Retail 2009. The Competition Commission was
investigating all the major South African supermarket chains for possible
contraventions. SPAR implemented a number of strategies to reduce their
carbon footprint. Examples of strategies implemented included oil recycling,
waste recycling, fine metal recycling, electricity savings, fleet service used-oil
disposal system, and collection of used cooking oil and fats for conversion into
biodiesel. The SPAR Group Limited Employee Share Trust purchased
2 629 088 shares at a cost of R188.1 million. (The SPAR Group Limited 2010
Annual Report 2010:5, 9, 11, 31, 42).
OVERVIEW OF SELECTED BUSINESSES CHAPTER 5
185
During the 2011 financial year, the food retail turnover increased by 7.9%, the
liquor market turnover by 19.9% and the building materials market turnover
increased by 18.2%. One of the major issues that SPAR faced was the high
diesel prices which resulted in a 19.9% increase in delivery costs. A total of 12
stores closed down during 2011. The two reasons for their closure were
financial problems or these stores did not meet the group standards. The capital
expenditure for 2011 amounted to R160 million which included a new R39
million perishable facility extension in the Eastern Cape. During 2011, 800
employees from the KwaZulu Natal Distribution Centre embarked on a five-
week industrial action. The SPAR Group Limited Employee Share Trust
purchased 1.05 million shares in SPAR for R97.8 million. Five retail stores were
acquired during 2011 mainly to obtain key retail sites. (The SPAR Group
Limited 2011 Integrated Annual Report 2011:10-12, 44).
SPAR focused on creating opportunities for historically disadvantaged people
and to equip them with skills for more responsible positions. A number of skills
development programmes were offered, which included various National
Certificates and National Diplomas at NQF levels two, three, four and five.
Various non-certificated SETA-approved programmes and learnerships at retail
were also offered. Bursaries were also available for tertiary education to SPAR
employees‟ children. As a corporate citizen, SPAR set specific budgets which
were allocated to two main causes and one discretionary cause. The two main
causes were Business Against Crime and projects supporting AIDS orphans.
SPAR was also involved in the Miles for Smiles campaign where runners were
sponsored to raise funds for children in need of surgery to correct cleft palate
abnormalities. Succession planning was also addressed by identifying
employees with high potential to take over the future leadership of SPAR. SPAR
sponsored and hosted the TUNZA African Children‟s Conference held in 2009.
Several environmental issues, such as improving recycling, reducing fuel and
energy usage, more efficient waste management, and reducing the impact of
packaging of products on the environment, were also addressed. SPAR was
involved in and remained involved in the following:
OVERVIEW OF SELECTED BUSINESSES CHAPTER 5
186
Ikamv‟elihle Rehabilitation Centre, which provides home community-
based care, soup kitchens, material support programmes, educational
awareness programmes and group support to the community;
the Arebaokeng Child Daycare Centre, which is daycare and a hospice
facility; and
the Junior Achievement South Africa (JASA) which is focusing on
providing opportunities for entrepreneurs in disadvantages communities;
supporting the Gozololo Daycare Centre and the JL Zwane and Ubunta
House;
the Kids Haven Orphanage aiming at rehabilitating children living and
working on the streets; and
the World Changes Academy offering life skills courses for high school
students, the unemployed and juvenile delinquents. (The SPAR Group
Limited Annual Report 2004 – 2006; The SPAR Group Limited 2007 –
2010 Annual Report; The SPAR Group Limited 2011 Integrated Annual
Report).
The board of directors is responsible for compliance with sound corporate
governance standards and ensuring that business decisions are made to the
best interest of the company. The board members are classified as executive,
non-executive, or independent non-executive members. Table 5.6 summarises
the split between the two types of directors.
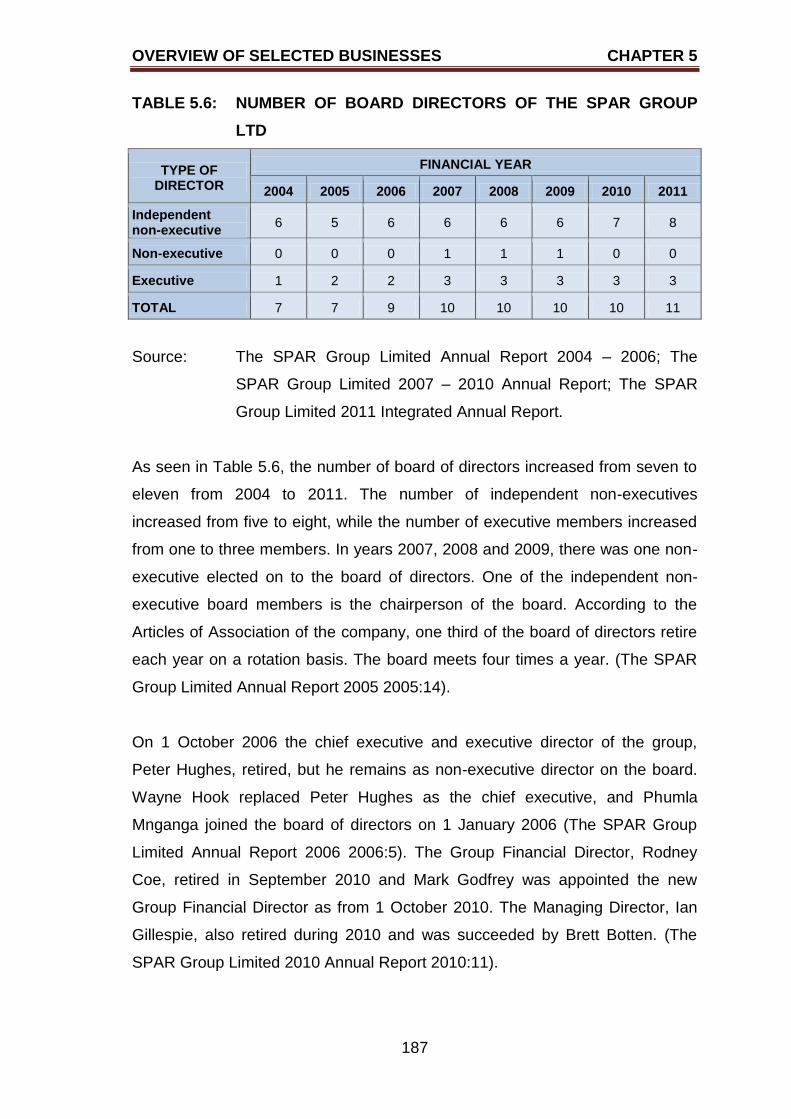
OVERVIEW OF SELECTED BUSINESSES CHAPTER 5
187
TABLE 5.6: NUMBER OF BOARD DIRECTORS OF THE SPAR GROUP
LTD
TYPE OF DIRECTOR
FINANCIAL YEAR
2004 2005 2006 2007 2008 2009 2010 2011
Independent non-executive
6 5 6 6 6 6 7 8
Non-executive 0 0 0 1 1 1 0 0
Executive 1 2 2 3 3 3 3 3
TOTAL 7 7 9 10 10 10 10 11
Source: The SPAR Group Limited Annual Report 2004 – 2006; The
SPAR Group Limited 2007 – 2010 Annual Report; The SPAR
Group Limited 2011 Integrated Annual Report.
As seen in Table 5.6, the number of board of directors increased from seven to
eleven from 2004 to 2011. The number of independent non-executives
increased from five to eight, while the number of executive members increased
from one to three members. In years 2007, 2008 and 2009, there was one non-
executive elected on to the board of directors. One of the independent non-
executive board members is the chairperson of the board. According to the
Articles of Association of the company, one third of the board of directors retire
each year on a rotation basis. The board meets four times a year. (The SPAR
Group Limited Annual Report 2005 2005:14).
On 1 October 2006 the chief executive and executive director of the group,
Peter Hughes, retired, but he remains as non-executive director on the board.
Wayne Hook replaced Peter Hughes as the chief executive, and Phumla
Mnganga joined the board of directors on 1 January 2006 (The SPAR Group
Limited Annual Report 2006 2006:5). The Group Financial Director, Rodney
Coe, retired in September 2010 and Mark Godfrey was appointed the new
Group Financial Director as from 1 October 2010. The Managing Director, Ian
Gillespie, also retired during 2010 and was succeeded by Brett Botten. (The
SPAR Group Limited 2010 Annual Report 2010:11).
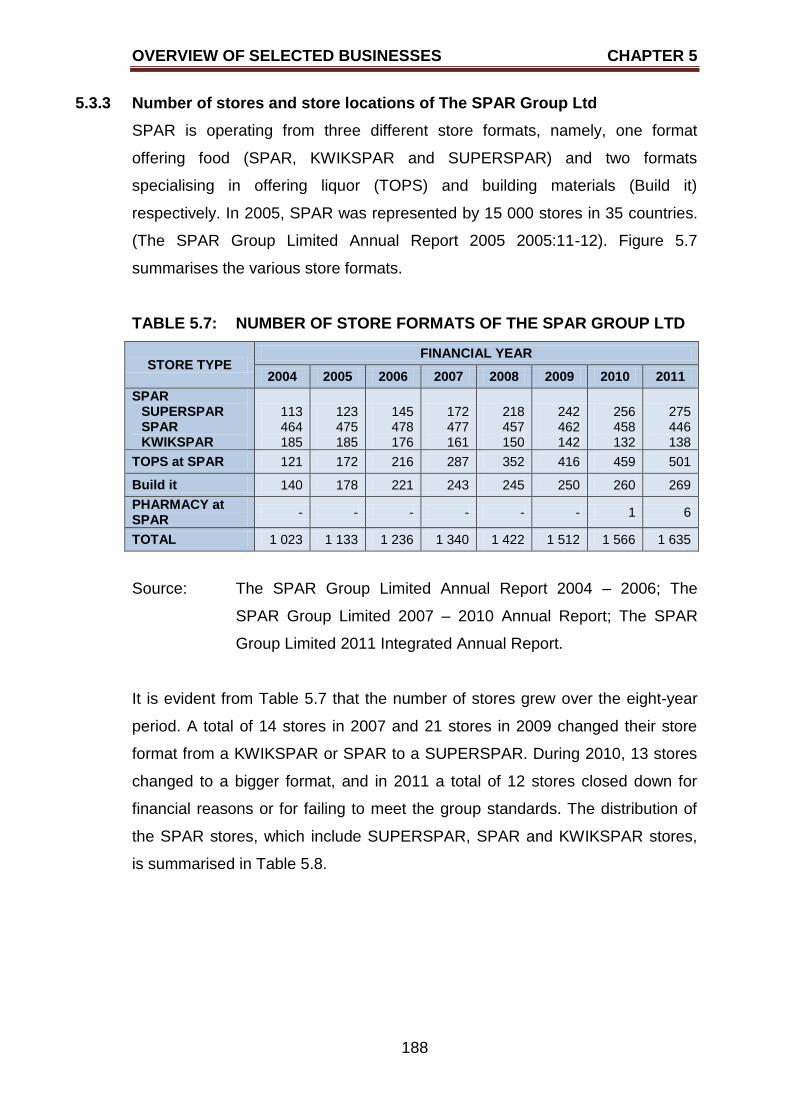
OVERVIEW OF SELECTED BUSINESSES CHAPTER 5
188
5.3.3 Number of stores and store locations of The SPAR Group Ltd
SPAR is operating from three different store formats, namely, one format
offering food (SPAR, KWIKSPAR and SUPERSPAR) and two formats
specialising in offering liquor (TOPS) and building materials (Build it)
respectively. In 2005, SPAR was represented by 15 000 stores in 35 countries.
(The SPAR Group Limited Annual Report 2005 2005:11-12). Figure 5.7
summarises the various store formats.
TABLE 5.7: NUMBER OF STORE FORMATS OF THE SPAR GROUP LTD
STORE TYPE FINANCIAL YEAR
2004 2005 2006 2007 2008 2009 2010 2011
SPAR SUPERSPAR SPAR KWIKSPAR
113 464 185
123 475 185
145 478 176
172 477 161
218 457 150
242 462 142
256 458 132
275 446 138
TOPS at SPAR 121 172 216 287 352 416 459 501
Build it 140 178 221 243 245 250 260 269
PHARMACY at SPAR
- - - - - - 1 6
TOTAL 1 023 1 133 1 236 1 340 1 422 1 512 1 566 1 635
Source: The SPAR Group Limited Annual Report 2004 – 2006; The
SPAR Group Limited 2007 – 2010 Annual Report; The SPAR
Group Limited 2011 Integrated Annual Report.
It is evident from Table 5.7 that the number of stores grew over the eight-year
period. A total of 14 stores in 2007 and 21 stores in 2009 changed their store
format from a KWIKSPAR or SPAR to a SUPERSPAR. During 2010, 13 stores
changed to a bigger format, and in 2011 a total of 12 stores closed down for
financial reasons or for failing to meet the group standards. The distribution of
the SPAR stores, which include SUPERSPAR, SPAR and KWIKSPAR stores,
is summarised in Table 5.8.
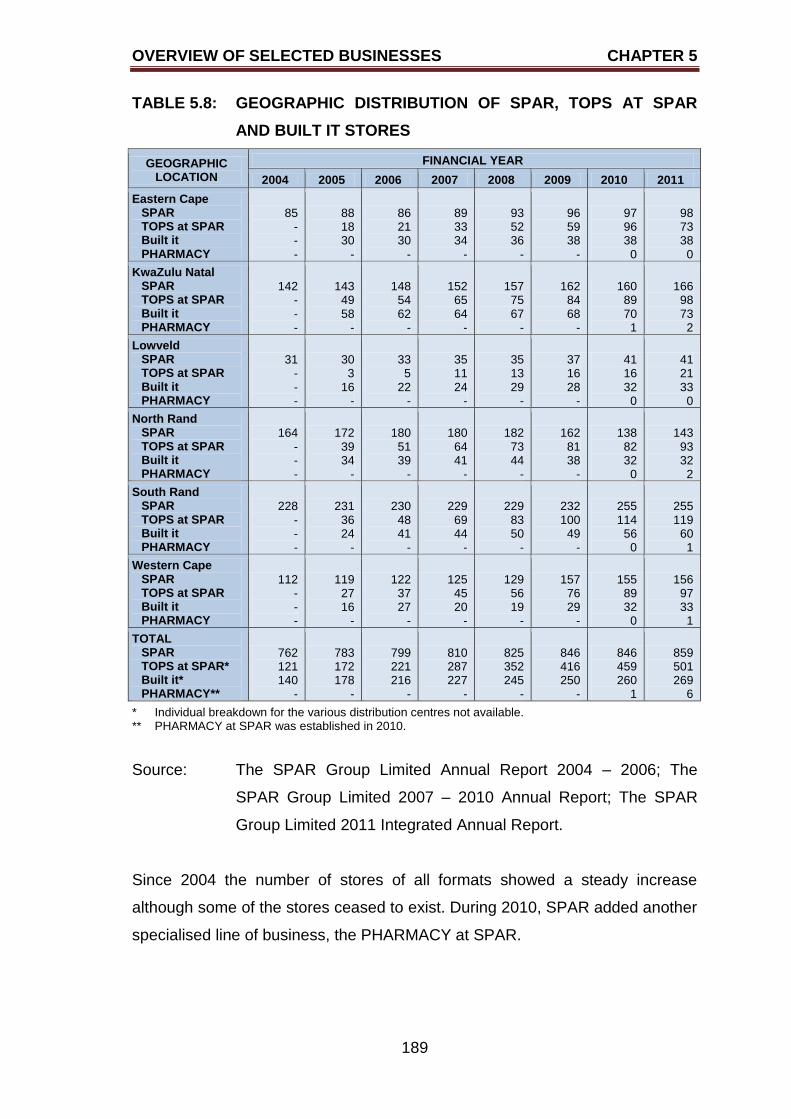
OVERVIEW OF SELECTED BUSINESSES CHAPTER 5
189
TABLE 5.8: GEOGRAPHIC DISTRIBUTION OF SPAR, TOPS AT SPAR
AND BUILT IT STORES
GEOGRAPHIC LOCATION
FINANCIAL YEAR
2004 2005 2006 2007 2008 2009 2010 2011
Eastern Cape SPAR TOPS at SPAR Built it PHARMACY
85 - - -
88 18 30
-
86 21 30
-
89 33 34
-
93 52 36
-
96 59 38
-
97 96 38 0
98 73 38 0
KwaZulu Natal SPAR TOPS at SPAR Built it PHARMACY
142 - - -
143 49 58
-
148 54 62
-
152 65 64
-
157 75 67
-
162 84 68
-
160 89 70 1
166 98 73 2
Lowveld SPAR TOPS at SPAR Built it PHARMACY
31 - - -
30 3
16 -
33 5
22 -
35 11 24
-
35 13 29
-
37 16 28
-
41 16 32 0
41 21 33 0
North Rand SPAR TOPS at SPAR Built it PHARMACY
164 - - -
172 39 34
-
180 51 39
-
180 64 41
-
182 73 44
-
162 81 38
-
138 82 32 0
143 93 32 2
South Rand SPAR TOPS at SPAR Built it PHARMACY
228 - - -
231 36 24
-
230 48 41
-
229 69 44
-
229 83 50
-
232 100
49 -
255 114
56 0
255 119
60 1
Western Cape SPAR TOPS at SPAR Built it PHARMACY
112 - - -
119 27 16
-
122 37 27
-
125 45 20
-
129 56 19
-
157 76 29
-
155 89 32 0
156 97 33 1
TOTAL SPAR TOPS at SPAR* Built it* PHARMACY**
762 121 140
-
783 172 178
-
799 221 216
-
810 287 227
-
825 352 245
-
846 416 250
-
846 459 260
1
859 501 269
6
* **
Individual breakdown for the various distribution centres not available. PHARMACY at SPAR was established in 2010.
Source: The SPAR Group Limited Annual Report 2004 – 2006; The
SPAR Group Limited 2007 – 2010 Annual Report; The SPAR
Group Limited 2011 Integrated Annual Report.
Since 2004 the number of stores of all formats showed a steady increase
although some of the stores ceased to exist. During 2010, SPAR added another
specialised line of business, the PHARMACY at SPAR.
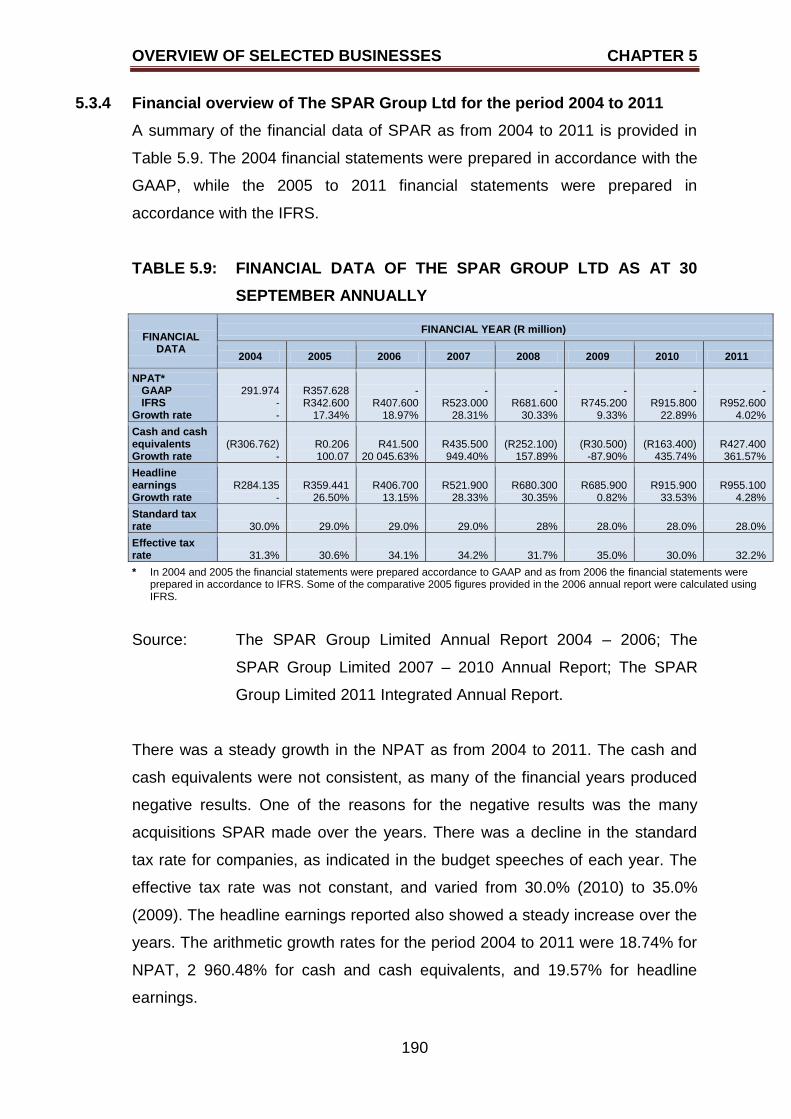
OVERVIEW OF SELECTED BUSINESSES CHAPTER 5
190
5.3.4 Financial overview of The SPAR Group Ltd for the period 2004 to 2011
A summary of the financial data of SPAR as from 2004 to 2011 is provided in
Table 5.9. The 2004 financial statements were prepared in accordance with the
GAAP, while the 2005 to 2011 financial statements were prepared in
accordance with the IFRS.
TABLE 5.9: FINANCIAL DATA OF THE SPAR GROUP LTD AS AT 30
SEPTEMBER ANNUALLY
FINANCIAL DATA
FINANCIAL YEAR (R million)
2004 2005 2006 2007 2008 2009 2010 2011
NPAT* GAAP IFRS
Growth rate
291.974 - -
R357.628 R342.600
17.34%
- R407.600
18.97%
- R523.000
28.31%
- R681.600
30.33%
- R745.200
9.33%
- R915.800
22.89%
- R952.600
4.02%
Cash and cash equivalents Growth rate
(R306.762) -
R0.206 100.07
R41.500 20 045.63%
R435.500 949.40%
(R252.100) 157.89%
(R30.500) -87.90%
(R163.400) 435.74%
R427.400 361.57%
Headline earnings Growth rate
R284.135 -
R359.441 26.50%
R406.700 13.15%
R521.900 28.33%
R680.300 30.35%
R685.900 0.82%
R915.900 33.53%
R955.100 4.28%
Standard tax rate 30.0% 29.0% 29.0% 29.0% 28% 28.0% 28.0% 28.0%
Effective tax rate 31.3% 30.6% 34.1% 34.2% 31.7% 35.0% 30.0% 32.2%
* In 2004 and 2005 the financial statements were prepared accordance to GAAP and as from 2006 the financial statements were prepared in accordance to IFRS. Some of the comparative 2005 figures provided in the 2006 annual report were calculated using IFRS.
Source: The SPAR Group Limited Annual Report 2004 – 2006; The
SPAR Group Limited 2007 – 2010 Annual Report; The SPAR
Group Limited 2011 Integrated Annual Report.
There was a steady growth in the NPAT as from 2004 to 2011. The cash and
cash equivalents were not consistent, as many of the financial years produced
negative results. One of the reasons for the negative results was the many
acquisitions SPAR made over the years. There was a decline in the standard
tax rate for companies, as indicated in the budget speeches of each year. The
effective tax rate was not constant, and varied from 30.0% (2010) to 35.0%
(2009). The headline earnings reported also showed a steady increase over the
years. The arithmetic growth rates for the period 2004 to 2011 were 18.74% for
NPAT, 2 960.48% for cash and cash equivalents, and 19.57% for headline
earnings.
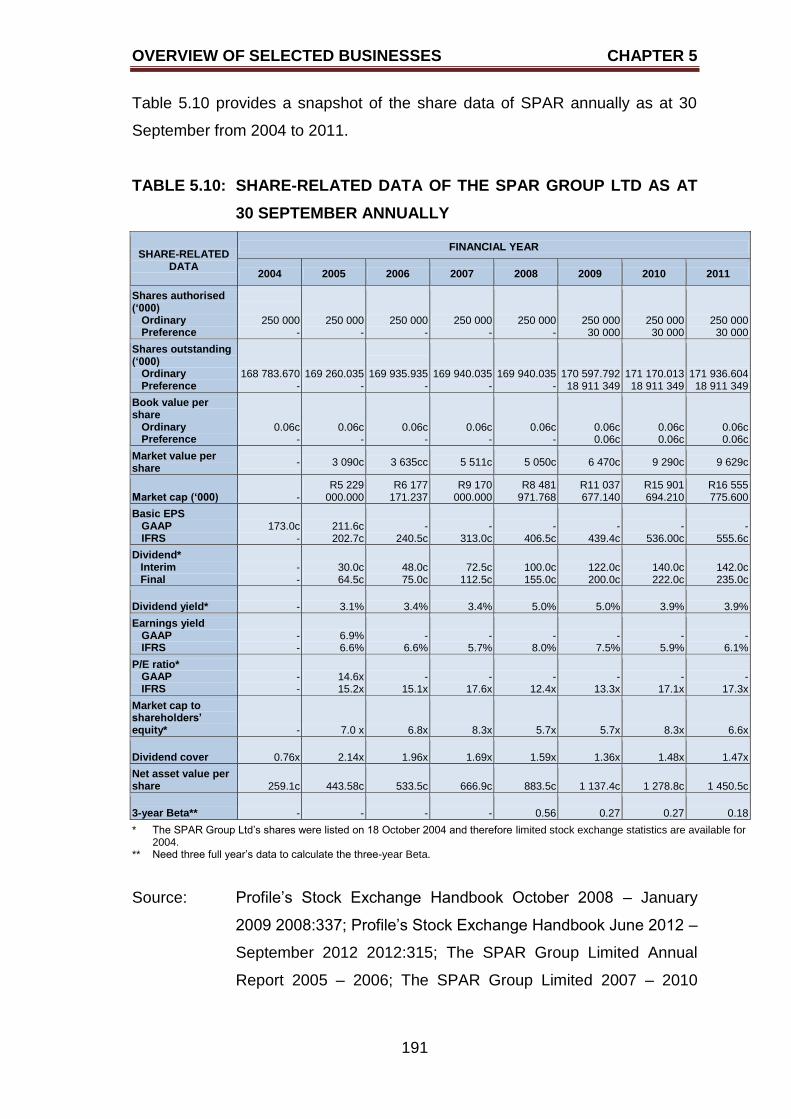
OVERVIEW OF SELECTED BUSINESSES CHAPTER 5
191
Table 5.10 provides a snapshot of the share data of SPAR annually as at 30
September from 2004 to 2011.
TABLE 5.10: SHARE-RELATED DATA OF THE SPAR GROUP LTD AS AT
30 SEPTEMBER ANNUALLY
SHARE-RELATED DATA
FINANCIAL YEAR
2004 2005 2006 2007 2008 2009 2010 2011
Shares authorised (‘000)
Ordinary Preference
250 000 -
250 000 -
250 000 -
250 000 -
250 000 -
250 000 30 000
250 000 30 000
250 000 30 000
Shares outstanding (‘000)
Ordinary Preference
168 783.670 -
169 260.035 -
169 935.935 -
169 940.035 -
169 940.035 -
170 597.792 18 911 349
171 170.013 18 911 349
171 936.604 18 911 349
Book value per share
Ordinary Preference
0.06c -
0.06c -
0.06c -
0.06c -
0.06c -
0.06c 0.06c
0.06c 0.06c
0.06c 0.06c
Market value per share
- 3 090c 3 635cc 5 511c 5 050c 6 470c 9 290c 9 629c
Market cap (‘000) - R5 229
000.000 R6 177
171.237 R9 170
000.000 R8 481
971.768 R11 037 677.140
R15 901 694.210
R16 555 775.600
Basic EPS GAAP IFRS
173.0c -
211.6c 202.7c
- 240.5c
- 313.0c
- 406.5c
- 439.4c
- 536.00c
- 555.6c
Dividend* Interim Final
- -
30.0c 64.5c
48.0c 75.0c
72.5c
112.5c 100.0c 155.0c
122.0c 200.0c
140.0c 222.0c
142.0c 235.0c
Dividend yield* - 3.1% 3.4% 3.4% 5.0% 5.0% 3.9% 3.9%
Earnings yield GAAP IFRS
- -
6.9% 6.6%
- 6.6%
- 5.7%
- 8.0%
- 7.5%
- 5.9%
- 6.1%
P/E ratio* GAAP IFRS
- -
14.6x 15.2x
- 15.1x
- 17.6x
- 12.4x
- 13.3x
- 17.1x
- 17.3x
Market cap to shareholders’ equity* - 7.0 x 6.8x 8.3x 5.7x 5.7x 8.3x 6.6x
Dividend cover 0.76x 2.14x 1.96x 1.69x 1.59x 1.36x 1.48x 1.47x
Net asset value per share 259.1c 443.58c 533.5c 666.9c 883.5c 1 137.4c 1 278.8c 1 450.5c
3-year Beta** - - - - 0.56 0.27 0.27 0.18
* **
The SPAR Group Ltd‟s shares were listed on 18 October 2004 and therefore limited stock exchange statistics are available for 2004. Need three full year‟s data to calculate the three-year Beta.
Source: Profile‟s Stock Exchange Handbook October 2008 – January
2009 2008:337; Profile‟s Stock Exchange Handbook June 2012 –
September 2012 2012:315; The SPAR Group Limited Annual
Report 2005 – 2006; The SPAR Group Limited 2007 – 2010
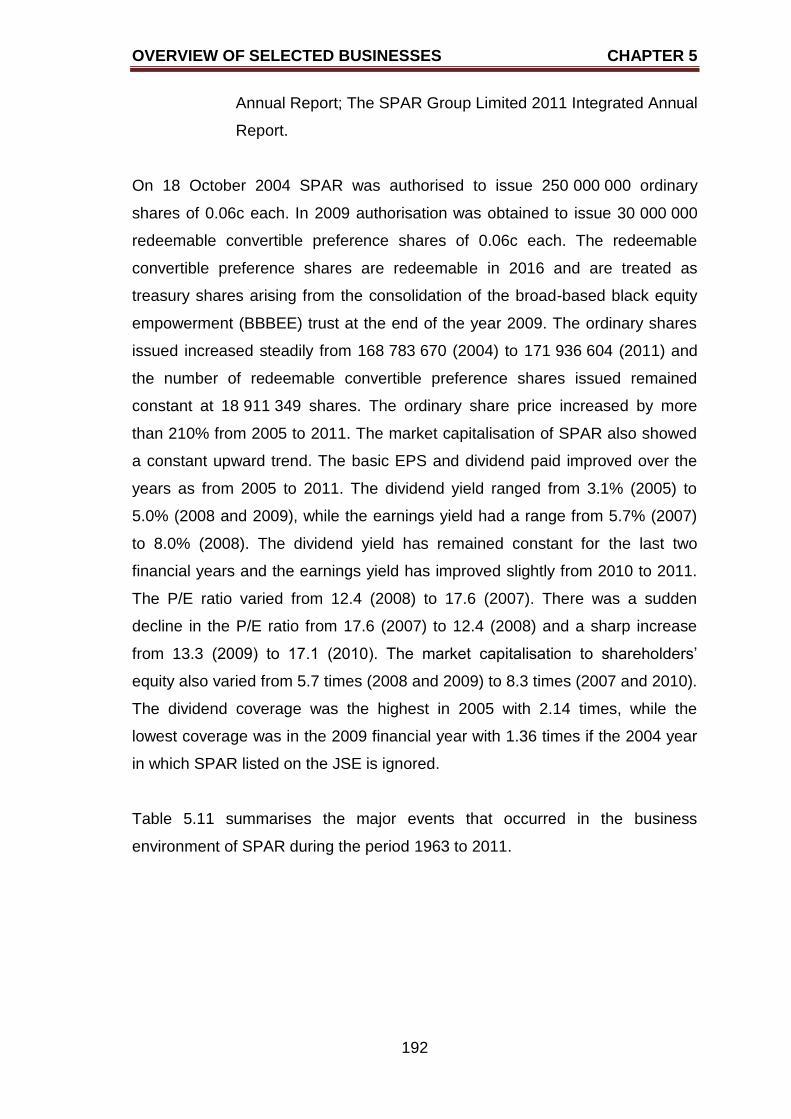
OVERVIEW OF SELECTED BUSINESSES CHAPTER 5
192
Annual Report; The SPAR Group Limited 2011 Integrated Annual
Report.
On 18 October 2004 SPAR was authorised to issue 250 000 000 ordinary
shares of 0.06c each. In 2009 authorisation was obtained to issue 30 000 000
redeemable convertible preference shares of 0.06c each. The redeemable
convertible preference shares are redeemable in 2016 and are treated as
treasury shares arising from the consolidation of the broad-based black equity
empowerment (BBBEE) trust at the end of the year 2009. The ordinary shares
issued increased steadily from 168 783 670 (2004) to 171 936 604 (2011) and
the number of redeemable convertible preference shares issued remained
constant at 18 911 349 shares. The ordinary share price increased by more
than 210% from 2005 to 2011. The market capitalisation of SPAR also showed
a constant upward trend. The basic EPS and dividend paid improved over the
years as from 2005 to 2011. The dividend yield ranged from 3.1% (2005) to
5.0% (2008 and 2009), while the earnings yield had a range from 5.7% (2007)
to 8.0% (2008). The dividend yield has remained constant for the last two
financial years and the earnings yield has improved slightly from 2010 to 2011.
The P/E ratio varied from 12.4 (2008) to 17.6 (2007). There was a sudden
decline in the P/E ratio from 17.6 (2007) to 12.4 (2008) and a sharp increase
from 13.3 (2009) to 17.1 (2010). The market capitalisation to shareholders‟
equity also varied from 5.7 times (2008 and 2009) to 8.3 times (2007 and 2010).
The dividend coverage was the highest in 2005 with 2.14 times, while the
lowest coverage was in the 2009 financial year with 1.36 times if the 2004 year
in which SPAR listed on the JSE is ignored.
Table 5.11 summarises the major events that occurred in the business
environment of SPAR during the period 1963 to 2011.
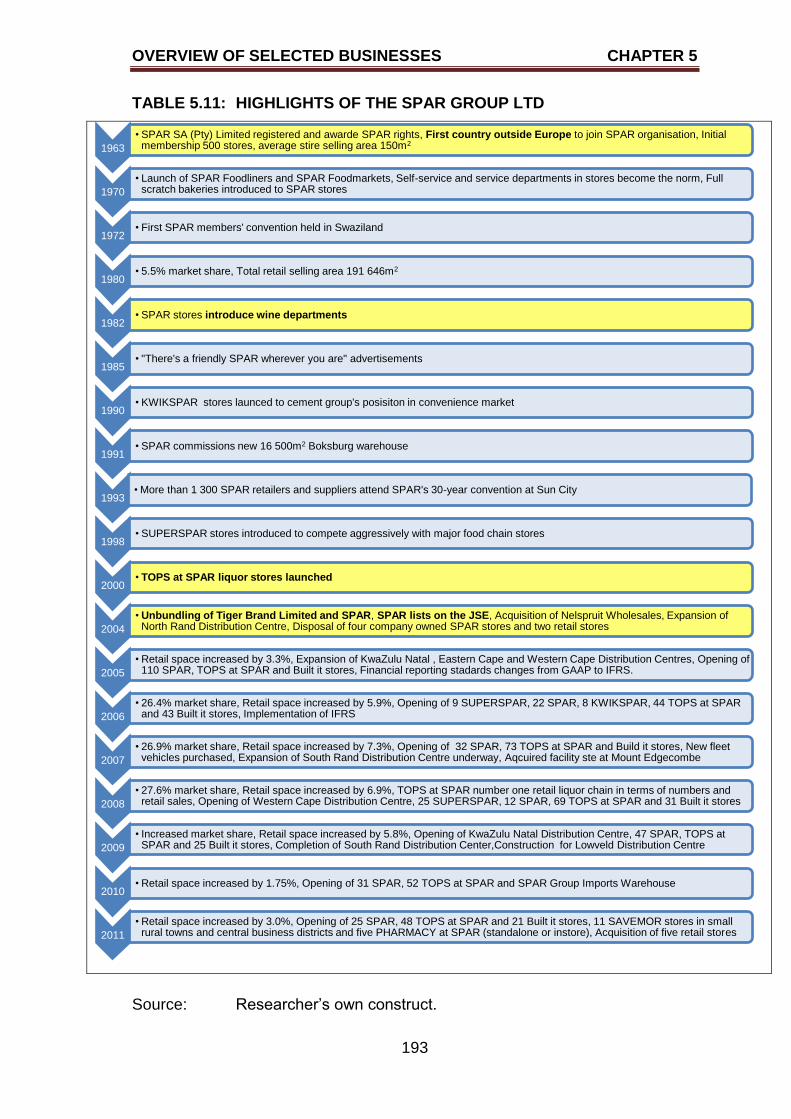
OVERVIEW OF SELECTED BUSINESSES CHAPTER 5
193
TABLE 5.11: HIGHLIGHTS OF THE SPAR GROUP LTD
Source: Researcher‟s own construct.
1963
• SPAR SA (Pty) Limited registered and awarde SPAR rights, First country outside Europe to join SPAR organisation, Initial membership 500 stores, average stire selling area 150m2
1970
• Launch of SPAR Foodliners and SPAR Foodmarkets, Self-service and service departments in stores become the norm, Full scratch bakeries introduced to SPAR stores
1972 • First SPAR members' convention held in Swaziland
1980 • 5.5% market share, Total retail selling area 191 646m2
1982 • SPAR stores introduce wine departments
1985 • "There's a friendly SPAR wherever you are" advertisements
1990 • KWIKSPAR stores launced to cement group's posisiton in convenience market
1991 • SPAR commissions new 16 500m2 Boksburg warehouse
1993 • More than 1 300 SPAR retailers and suppliers attend SPAR's 30-year convention at Sun City
1998 • SUPERSPAR stores introduced to compete aggressively with major food chain stores
2000 • TOPS at SPAR liquor stores launched
2004
• Unbundling of Tiger Brand Limited and SPAR, SPAR lists on the JSE, Acquisition of Nelspruit Wholesales, Expansion of North Rand Distribution Centre, Disposal of four company owned SPAR stores and two retail stores
2005
• Retail space increased by 3.3%, Expansion of KwaZulu Natal , Eastern Cape and Western Cape Distribution Centres, Opening of 110 SPAR, TOPS at SPAR and Built it stores, Financial reporting stadards changes from GAAP to IFRS.
2006
• 26.4% market share, Retail space increased by 5.9%, Opening of 9 SUPERSPAR, 22 SPAR, 8 KWIKSPAR, 44 TOPS at SPAR and 43 Built it stores, Implementation of IFRS
2007
• 26.9% market share, Retail space increased by 7.3%, Opening of 32 SPAR, 73 TOPS at SPAR and Build it stores, New fleet vehicles purchased, Expansion of South Rand Distribution Centre underway, Aqcuired facility ste at Mount Edgecombe
2008
• 27.6% market share, Retail space increased by 6.9%, TOPS at SPAR number one retail liquor chain in terms of numbers and retail sales, Opening of Western Cape Distribution Centre, 25 SUPERSPAR, 12 SPAR, 69 TOPS at SPAR and 31 Built it stores
2009
• Increased market share, Retail space increased by 5.8%, Opening of KwaZulu Natal Distribution Centre, 47 SPAR, TOPS at SPAR and 25 Built it stores, Completion of South Rand Distribution Center,Construction for Lowveld Distribution Centre
2010 • Retail space increased by 1.75%, Opening of 31 SPAR, 52 TOPS at SPAR and SPAR Group Imports Warehouse
2011
• Retail space increased by 3.0%, Opening of 25 SPAR, 48 TOPS at SPAR and 21 Built it stores, 11 SAVEMOR stores in small rural towns and central business districts and five PHARMACY at SPAR (standalone or instore), Acquisition of five retail stores
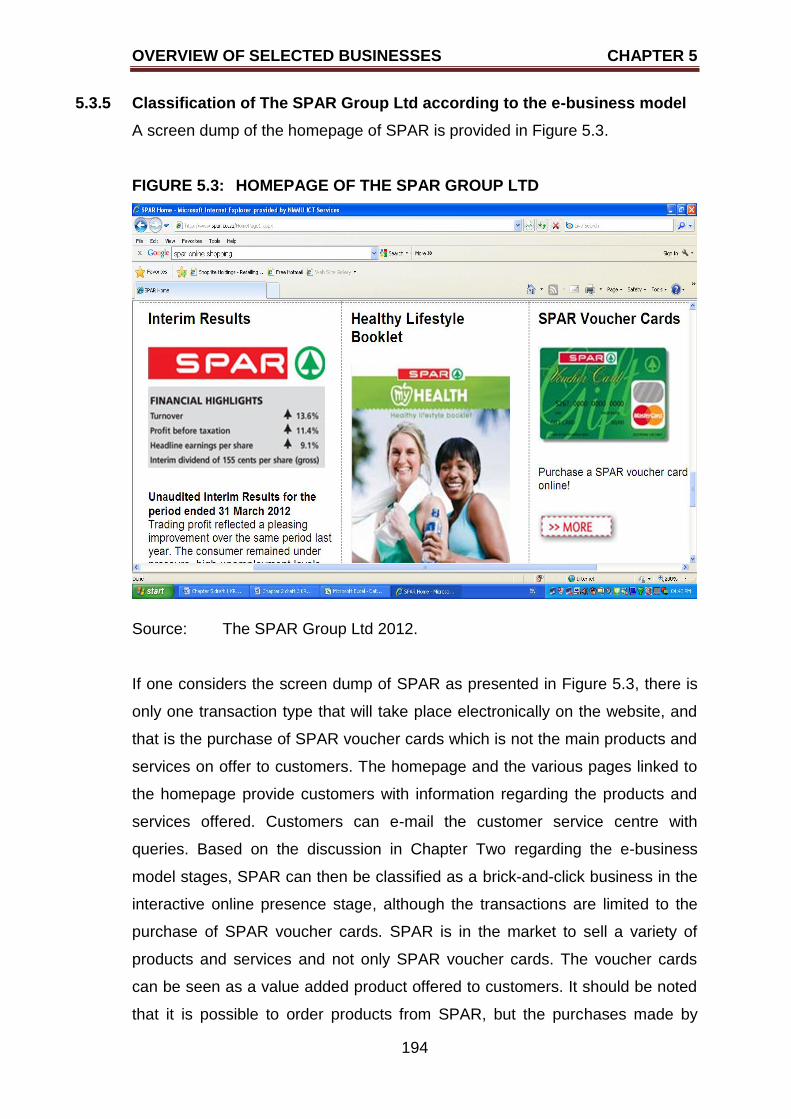
OVERVIEW OF SELECTED BUSINESSES CHAPTER 5
194
5.3.5 Classification of The SPAR Group Ltd according to the e-business model
A screen dump of the homepage of SPAR is provided in Figure 5.3.
FIGURE 5.3: HOMEPAGE OF THE SPAR GROUP LTD
Source: The SPAR Group Ltd 2012.
If one considers the screen dump of SPAR as presented in Figure 5.3, there is
only one transaction type that will take place electronically on the website, and
that is the purchase of SPAR voucher cards which is not the main products and
services on offer to customers. The homepage and the various pages linked to
the homepage provide customers with information regarding the products and
services offered. Customers can e-mail the customer service centre with
queries. Based on the discussion in Chapter Two regarding the e-business
model stages, SPAR can then be classified as a brick-and-click business in the
interactive online presence stage, although the transactions are limited to the
purchase of SPAR voucher cards. SPAR is in the market to sell a variety of
products and services and not only SPAR voucher cards. The voucher cards
can be seen as a value added product offered to customers. It should be noted
that it is possible to order products from SPAR, but the purchases made by
OVERVIEW OF SELECTED BUSINESSES CHAPTER 5
195
customers are managed by another business (http://www.mad-shopping.co.za)
and not SPAR.
5.4 PICK N PAY STORES LTD
The following paragraphs will provide a brief history of Pick n Pay Stores Ltd
(hereafter referred to as PnP) and an overview of the operations over an eight-
year period. A summary of the store formats will be given, and will be followed
by an overview of the financial performance for the period 2004 to 2011. To
conclude this discussion, the highlights of PnP will be summarised.
5.4.1 History of Pick n Pay Stores Ltd
The PnP empire began in 1967 when Mr Ackerman acquired four small stores
in Cape Town at a cost of R620 000. PnP listed on the JSE in 1968 and the
share increased from R1.00 per share to R6.50 per share. The turnover of PnP
for the first year of trading reached R5 million. PnP expanded its reach to Port
Elizabeth in 1969 and in the same year, PnP was reported to be on the
Business Times Top 100 Companies. During 1970, PnP reached the Financial
Mail Top 100 Companies. The 1971 financial year was characterised by PnP‟s
campaign to cut prices in an attempt to reduce the cost of living. In 1973, PnP
reached the 18th position on the Business Times Top 100 Companies. Mr
Ackerman requested the government to shut down price-fixing cartels. The first
PnP hypermarket was opened in Boksburg in 1975, and at the same time Mr
Ackerman took on oil companies in order to reduce fuel prices. The no name
brand was established in 1976. During 1977, PnP signed a Non-Racial
Manifesto, and donated R25 million to the Urban Foundation for Black Housing.
The highlight of the year 1978 was PnP becoming the first South African
company to secure 99-year lease rights for black employees. The first PnP
superstores opened during 1979. (History (n.d.):103).
PnP shares were issued to all races at the Mitchell‟s Plain PnP store in 1980.
Mr Raymond Ackerman received the Times Businessman of the Year Award in
1984. PnP‟s turnover was in excess of R2 billion in 1986, and in 1987 PnP
became the official sponsor of the Comrades Marathon. PnP celebrated its 21st
OVERVIEW OF SELECTED BUSINESSES CHAPTER 5
196
birthday in 1988, while the 100th store was opened in Highgate and a turnover
of R3 billion was achieved. (History (n.d.):103-104).
During 1990, both Foodhall and Green ranges were launched. PnP became the
official sponsor of the Cape Argus Cycle Tour in 1991, and in 1992, on its 25th
birthday, became the national sponsor of the Olympic team in Barcelona. PnP
was also named the most admired company in South Africa by the Financial
Mail. The Family Stores brand was born in 1993, and in 1994 the Choice brand
saw the light. PnP also became the official sponsor of the ultimate bid to bring
the Rugby World Cup to South Africa in 1994, and in 1995 was named the
Rugby World Cup broadcast sponsor. PnP was the sponsor for the Olympic
team in Atlanta and a supporter of the 2004 Olympic bid. The 1997 financial
year was a good year for PnP as turnover reached the R56 million milestone. In
1998 Mr Ackerman received the Professional Management Review Award for
The Most Admired Personality in Western Cape while PnP received the Golden
Arrow Award for Best Corporate Citizen and Best JSE Company in the Western
Cape. Another award given to Mr Ackerman in 1999 was the Vivid People‟s
Choice Award. (History (n.d.):104-105)
In 2001 Mr Ackerman received the Business Times Lifetime Achievement
Award. PnP also sponsored Calypso Beach Cricket. Online shopping was
introduced by PnP. In 2003 PnP was voted as South Africa‟s most trusted
company. The PnP Schools Club was launched in 2005. On the environmental
field, PnP received the Kudu Award for environmental projects. PnP was named
the sponsor of the 2011 Rugby World Cup bid. In 2007, PnP changed its logo
and brandline (Inspired by you) and was voted the company with the “Best
Reputation” by The Reputation Institute. Another accolade for PnP was that of
being named the Coolest Grocery Store by South Africa‟s youth. (History
(n.d.):105)
5.4.2 Operational overview of Pick n Pay Stores Ltd for the period 2004 to 2011
The CEO of PnP, Mr Sean Summers, regarded the 2004 financial year as the
most demanding year in the 37 years of operation. The growth in turnover for
the 2004 financial year was 11.8%. Franklins, situated in Australia, had a
OVERVIEW OF SELECTED BUSINESSES CHAPTER 5
197
turnover growth of 4% (in Australian dollars) while the Southern African
operations produced 15.9%. Property and equipment to the value of R508.6
million was acquired, including a total of eight new Corporate stores and 15
Family stores. The Score stores were going through restructuring. Boardmans
was sold on 1 April 2004 after obtaining the Competition Tribunal approval.
(Pick n Pay Annual Report 2004 2004: 10-11; „Reviewed Group Results‟ 2004).
The low-inflation business environment of 2005 resulted in an 8.9% increase in
turnover, as selling prices were lower. During the financial year, Boardmans
was sold for R24 million, property was disposed of for R1.4 million, and fixed
assets were sold for a loss of R3.8 million. PnP invested R525.6 million in
property and new stores, and 12.4 million shares were repurchased for R267.3
million. A total of 14 corporate supermarkets, 12 franchise stores, 2 stand-alone
clothing stores and 13 liquor stores were opened during 2005. PnP supported
South Africa‟s bid to host the Soccer World Cup in 2010, and became a bid
sponsor for the 2011 Rugby World Cup. (Pick n Pay Annual Report 2005
2005:14-15, 18, 21).
The 2006 financial year was characterised by low inflation (approximately 3.5%)
and PnP was also hindered by industrial action. PnP implemented SAP retail,
Finance and HR operating systems as an enterprise-wide computer software
system. Growth in PnP‟s turnover was 10.0%. Eight new corporate
supermarkets, 12 Family Franchise stores and 11 clothing stores were opened.
Boxer stores increased by three stores in 2006. PnP and Netcare 911 jointly
raised funds to assist the victims of the Tsunami disaster. The long-term ratings
of A+ and short-term rating of F1 for PnP, as affirmed by Fitch, provided a clear
indication that the outlook for PnP remained stable, and reflects PnP‟s leading
position in the South African retail market. (Pick n Pay Annual Report 2006
2006:8, 19-20, 23, 50).
The growth of PnP‟s turnover for the 2007 financial year was 12.3%. The CEO,
Mr Summers, retired after 33 years‟ service to PnP, having been the CEO for 11
of these years. A number of stores were opened during 2007, namely, 10
corporate stores, two corporate stores converted to Family franchise format, 11
OVERVIEW OF SELECTED BUSINESSES CHAPTER 5
198
Family franchise format stores, and two Hypermarkets. PnP considered joining
Fruit & Veg City, but decided against the acquisition. During 2007, PnP became
the first retail company to participate in the Carbon Disclosure Project, and PnP
also supported the Organic Freedom Project. A total of 10 corporate stores, 11
Family Franchise format stores and two Hypermarkets were opened during
2007. Two corporate stores converted to Family Franchise format stores. Nine
new Boxer stores and three Boxer Build hardware stores opened their doors for
the first time during 2007. TM‟s trading environment was extremely difficult.
Franklin‟s store count had a net increase of two; three new stores were opened
and five stores were closed, while two stores relocated to new locations. (Pick n
Pay Annual Report 2007 2007:7-8, 16, 20).
The 2008 financial year was characterised by the conversion of the Score
stores to Family Franchise format stores. Other investments included the
implementation of SAP, the development of the distribution capacity, and the
relaunching of the PnP brand. During 2008, there were steep hikes in the
interest rates and petrol prices which led to increased food prices. PnP
managed to grow turnover by 15.2% while Franklin growth was 16.4% despite
the disposal of two stores. Seven new corporate stores were opened during
2008 while six corporate stores converted to Family Franchise stores. Twenty
new Family Franchise stores were opened and two Score stores were
converted to Family Franchise stores. Two Hypermarkets were also opened,
one in Edenvale and one in Soweto. A total of 18 new liquor stores and seven
clothing stores also opened their doors during 2008 for the first time. Both the
Score and Boxer stores performed well during 2008, and five new Boxer stores
were opened. The Managing Director of Boxer, Mr Hugh Bland, retired on 1
March 2008, and Mr Eugene Stoop took over the reigns from him. The TM
stores traded in conditions of economic and social instability, and faced difficulty
with the procurement of inventory. (Pick n Pay Annual Report 2008 2008:6, 14-
16).
For the 2009 financial year, the turnover of PnP increased by 17.3% from 2008,
and for the same period Franklin‟s increased by 17.3%. The year was also
characterised by higher inflation and ultimately higher food prices. A total of 38
OVERVIEW OF SELECTED BUSINESSES CHAPTER 5
199
Score stores were converted to Family Franchise format stores or Boxer stores,
while 18 Score stores closed down or were sold. Six new Boxer stores were
opened over and the above the nine Score stores that were converted to Boxer
stores. During 2009, 11 Franklin stores were fully refurbished, and the Franklin
loyalty card was named the best loyalty card, based on ease of use and
customer benefits. (Pick n Pay Annual Report 2009 2009:1, 10-21).
The turnover of PnP increased by 9.8% to R54 734.5 million for the 2010
financial year. Mr Gareth Ackerman was appointed as the new chairman of the
board of directors after the retirement of Mr Raymond Ackerman. The business
environment was slowly recovering from the recession which the global
economy was experiencing. Lower interest rates and lower levels of inflation did
not encourage consumer spending. During 2010, five new PnP corporate
supermarkets, 20 Boxer stores and 38 Franchise stores were opened. The first
store in Zambia was opened in mid-2010, franchise partnerships with
Mozambique were signed, and sites for expansion into Mauritius were
identified. The PnP private label and Fresh food sales increased by 15% and
17% respectively. The Competition Commission‟s investigation was still
underway and not yet finalised. (Pick n Pay Annual Report 2010 2010:6-7, 14-
17).
The turnover of the PnP group increased by 5.9% to R51.9 billion for the 2011
financial year, although the year was characterised by depressed consumer
spending, rising costs and problematic industrial relations. South Africa‟s first
major grocery chain loyalty programme, The Smart Shopper loyalty card, was
launched during 2011. In July 2010, Metcash Trading Limited (Metcash)
submitted a proposal to acquire Franklins for AUD215 million (Australian dollar),
but the Australian Competition and Consumer Commission (ACCC) ruled
against the proposal. The two parties concerned indicated that they intended to
continue with the sale and the ACCC commenced with legal proceedings in the
Federal Court of Australia in December 2010. On 11 August 2011, Metcash was
given the approval by the court to purchase Franklins. PnP was the overall
winner at the Mail & Guardian Greening the Future Awards in the category
“Companies and organisations with innovative environmental strategies that
OVERVIEW OF SELECTED BUSINESSES CHAPTER 5
200
improve business performance”. Mr Jonathan Ackerman was appointed as
Customer Director. Mr Alex Mathole and Ms Lorato Phalatse were appointed as
independent non-executive board members, Ms Connie Nkosi retired as a
board member, and Mr Dennis Cope retired as a board member and Chief
Financial Officer (CFO). Mr Cope was replaced by Mr Bakar Jakoet as board
member and as CFO. The 2011 financial year was a busy year considering the
number of new stores that opened, namely, four corporate supermarkets, 13
Franchise format stores, 33 liquor stores, 11 clothing stores and six Boxer
format stores. A second store was opened in Zambia. PnP increased the
shareholding in TM to 49%. New local master franchise agreements were
signed with Mozambique and Mauritius (Pick n Pay Integrated Annual Report
2011 2011:9-13, 18-19).
PnP aimed at reducing energy consumption and waste consistently. PnP was
involved in several social engagements as a corporate citizen, and many
engagements are still continuing, such as:
expanding the “Green” merchandise range;
exchanging vouchers for Compact Fluorescent Lamp light bulbs as part
of the power pledge campaign;
assisting and empowering emerging entrepreneurs by working closely
with the Ackerman Pick n Pay Foundation;
being a SASSI (The South African Sustainable Seafood Initiative) Retail
Participant and a founding sponsor and supporter of SASSI
partnering with Landmark Foundation on a predator management
programme;
training and mentoring emerging farmers;
reducing energy and water usage, waste and the business‟s carbon
footprint;
installing a wind turbine at the Port Elizabeth regional offices;
providing organic products by joining forces with OrganiMark and Bio
Swiss Industries;
converting waste oil to biodiesel for use in the commercial fleet of PnP;
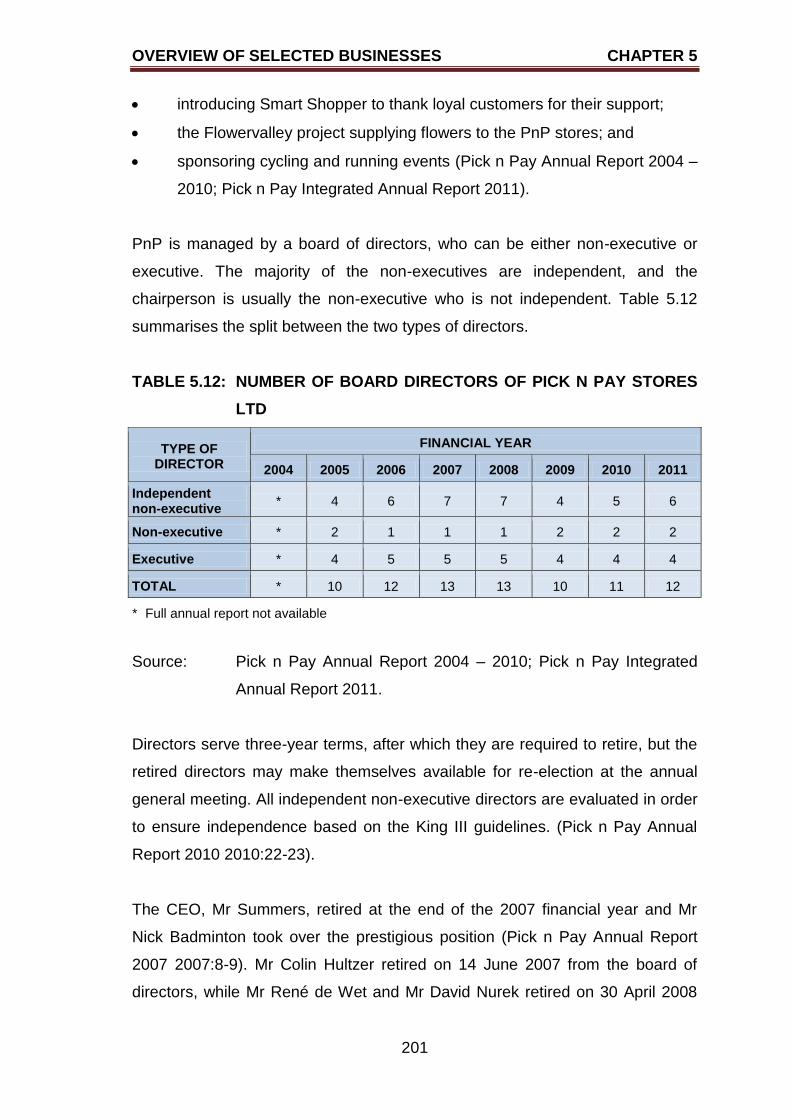
OVERVIEW OF SELECTED BUSINESSES CHAPTER 5
201
introducing Smart Shopper to thank loyal customers for their support;
the Flowervalley project supplying flowers to the PnP stores; and
sponsoring cycling and running events (Pick n Pay Annual Report 2004 –
2010; Pick n Pay Integrated Annual Report 2011).
PnP is managed by a board of directors, who can be either non-executive or
executive. The majority of the non-executives are independent, and the
chairperson is usually the non-executive who is not independent. Table 5.12
summarises the split between the two types of directors.
TABLE 5.12: NUMBER OF BOARD DIRECTORS OF PICK N PAY STORES
LTD
TYPE OF DIRECTOR
FINANCIAL YEAR
2004 2005 2006 2007 2008 2009 2010 2011
Independent non-executive
* 4 6 7 7 4 5 6
Non-executive * 2 1 1 1 2 2 2
Executive * 4 5 5 5 4 4 4
TOTAL * 10 12 13 13 10 11 12
* Full annual report not available
Source: Pick n Pay Annual Report 2004 – 2010; Pick n Pay Integrated
Annual Report 2011.
Directors serve three-year terms, after which they are required to retire, but the
retired directors may make themselves available for re-election at the annual
general meeting. All independent non-executive directors are evaluated in order
to ensure independence based on the King III guidelines. (Pick n Pay Annual
Report 2010 2010:22-23).
The CEO, Mr Summers, retired at the end of the 2007 financial year and Mr
Nick Badminton took over the prestigious position (Pick n Pay Annual Report
2007 2007:8-9). Mr Colin Hultzer retired on 14 June 2007 from the board of
directors, while Mr René de Wet and Mr David Nurek retired on 30 April 2008
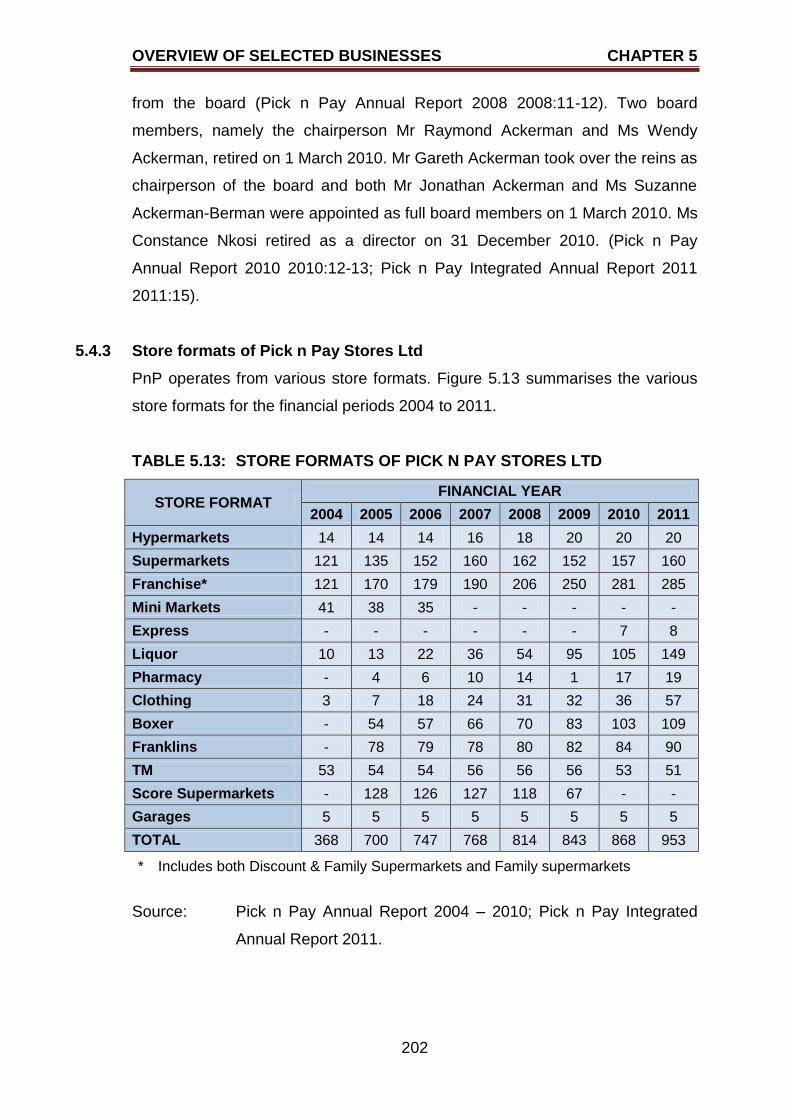
OVERVIEW OF SELECTED BUSINESSES CHAPTER 5
202
from the board (Pick n Pay Annual Report 2008 2008:11-12). Two board
members, namely the chairperson Mr Raymond Ackerman and Ms Wendy
Ackerman, retired on 1 March 2010. Mr Gareth Ackerman took over the reins as
chairperson of the board and both Mr Jonathan Ackerman and Ms Suzanne
Ackerman-Berman were appointed as full board members on 1 March 2010. Ms
Constance Nkosi retired as a director on 31 December 2010. (Pick n Pay
Annual Report 2010 2010:12-13; Pick n Pay Integrated Annual Report 2011
2011:15).
5.4.3 Store formats of Pick n Pay Stores Ltd
PnP operates from various store formats. Figure 5.13 summarises the various
store formats for the financial periods 2004 to 2011.
TABLE 5.13: STORE FORMATS OF PICK N PAY STORES LTD
STORE FORMAT FINANCIAL YEAR
2004 2005 2006 2007 2008 2009 2010 2011
Hypermarkets 14 14 14 16 18 20 20 20
Supermarkets 121 135 152 160 162 152 157 160
Franchise* 121 170 179 190 206 250 281 285
Mini Markets 41 38 35 - - - - -
Express - - - - - - 7 8
Liquor 10 13 22 36 54 95 105 149
Pharmacy - 4 6 10 14 1 17 19
Clothing 3 7 18 24 31 32 36 57
Boxer - 54 57 66 70 83 103 109
Franklins - 78 79 78 80 82 84 90
TM 53 54 54 56 56 56 53 51
Score Supermarkets - 128 126 127 118 67 - -
Garages 5 5 5 5 5 5 5 5
TOTAL 368 700 747 768 814 843 868 953
* Includes both Discount & Family Supermarkets and Family supermarkets
Source: Pick n Pay Annual Report 2004 – 2010; Pick n Pay Integrated
Annual Report 2011.
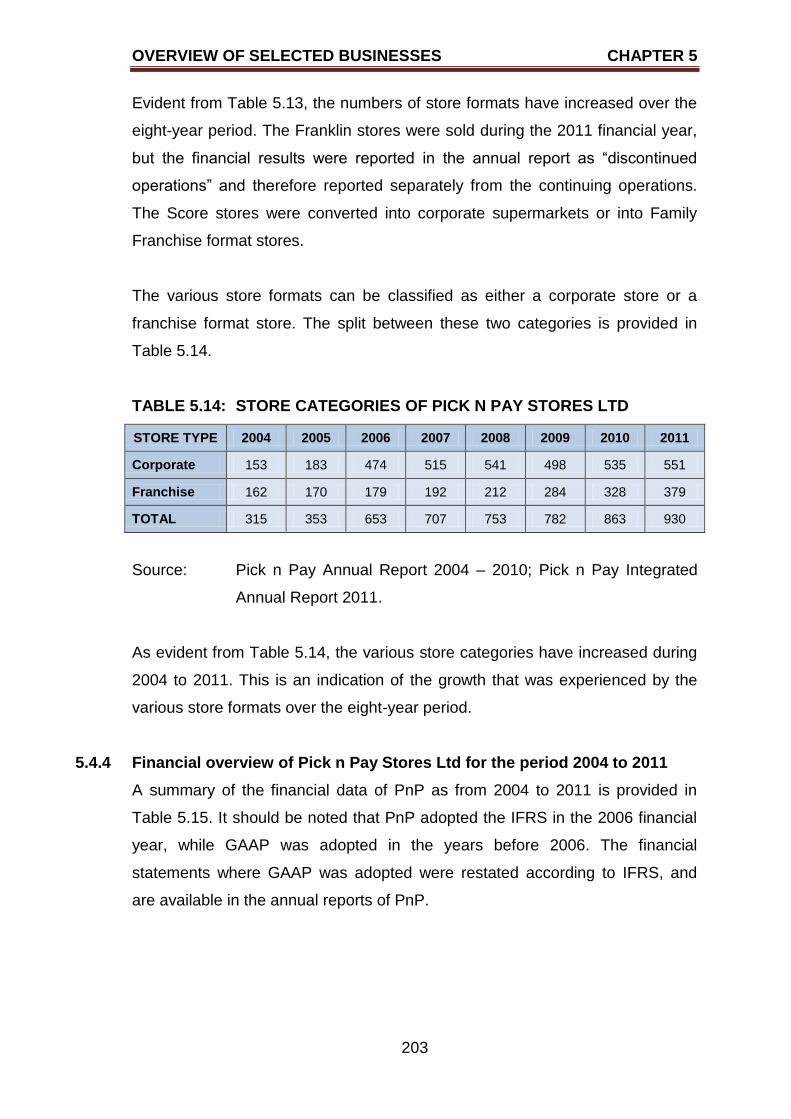
OVERVIEW OF SELECTED BUSINESSES CHAPTER 5
203
Evident from Table 5.13, the numbers of store formats have increased over the
eight-year period. The Franklin stores were sold during the 2011 financial year,
but the financial results were reported in the annual report as “discontinued
operations” and therefore reported separately from the continuing operations.
The Score stores were converted into corporate supermarkets or into Family
Franchise format stores.
The various store formats can be classified as either a corporate store or a
franchise format store. The split between these two categories is provided in
Table 5.14.
TABLE 5.14: STORE CATEGORIES OF PICK N PAY STORES LTD
STORE TYPE 2004 2005 2006 2007 2008 2009 2010 2011
Corporate 153 183 474 515 541 498 535 551
Franchise 162 170 179 192 212 284 328 379
TOTAL 315 353 653 707 753 782 863 930
Source: Pick n Pay Annual Report 2004 – 2010; Pick n Pay Integrated
Annual Report 2011.
As evident from Table 5.14, the various store categories have increased during
2004 to 2011. This is an indication of the growth that was experienced by the
various store formats over the eight-year period.
5.4.4 Financial overview of Pick n Pay Stores Ltd for the period 2004 to 2011
A summary of the financial data of PnP as from 2004 to 2011 is provided in
Table 5.15. It should be noted that PnP adopted the IFRS in the 2006 financial
year, while GAAP was adopted in the years before 2006. The financial
statements where GAAP was adopted were restated according to IFRS, and
are available in the annual reports of PnP.
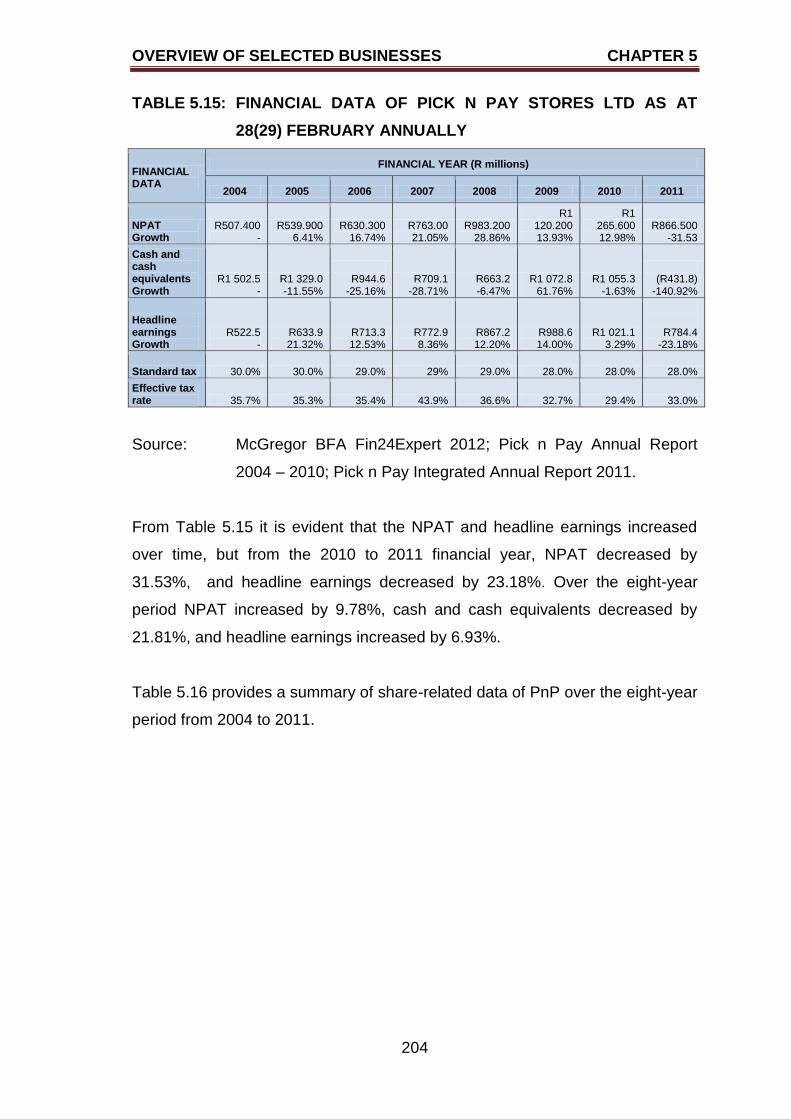
OVERVIEW OF SELECTED BUSINESSES CHAPTER 5
204
TABLE 5.15: FINANCIAL DATA OF PICK N PAY STORES LTD AS AT
28(29) FEBRUARY ANNUALLY
FINANCIAL DATA
FINANCIAL YEAR (R millions)
2004 2005 2006 2007 2008 2009 2010 2011
NPAT Growth
R507.400 -
R539.900 6.41%
R630.300 16.74%
R763.00 21.05%
R983.200 28.86%
R1 120.200 13.93%
R1 265.600 12.98%
R866.500 -31.53
Cash and cash equivalents Growth
R1 502.5 -
R1 329.0 -11.55%
R944.6
-25.16% R709.1
-28.71% R663.2 -6.47%
R1 072.8 61.76%
R1 055.3 -1.63%
(R431.8)
-140.92%
Headline earnings Growth
R522.5 -
R633.9 21.32%
R713.3 12.53%
R772.9 8.36%
R867.2 12.20%
R988.6 14.00%
R1 021.1 3.29%
R784.4 -23.18%
Standard tax 30.0% 30.0% 29.0% 29% 29.0% 28.0% 28.0% 28.0%
Effective tax rate 35.7% 35.3% 35.4% 43.9% 36.6% 32.7% 29.4% 33.0%
Source: McGregor BFA Fin24Expert 2012; Pick n Pay Annual Report
2004 – 2010; Pick n Pay Integrated Annual Report 2011.
From Table 5.15 it is evident that the NPAT and headline earnings increased
over time, but from the 2010 to 2011 financial year, NPAT decreased by
31.53%, and headline earnings decreased by 23.18%. Over the eight-year
period NPAT increased by 9.78%, cash and cash equivalents decreased by
21.81%, and headline earnings increased by 6.93%.
Table 5.16 provides a summary of share-related data of PnP over the eight-year
period from 2004 to 2011.
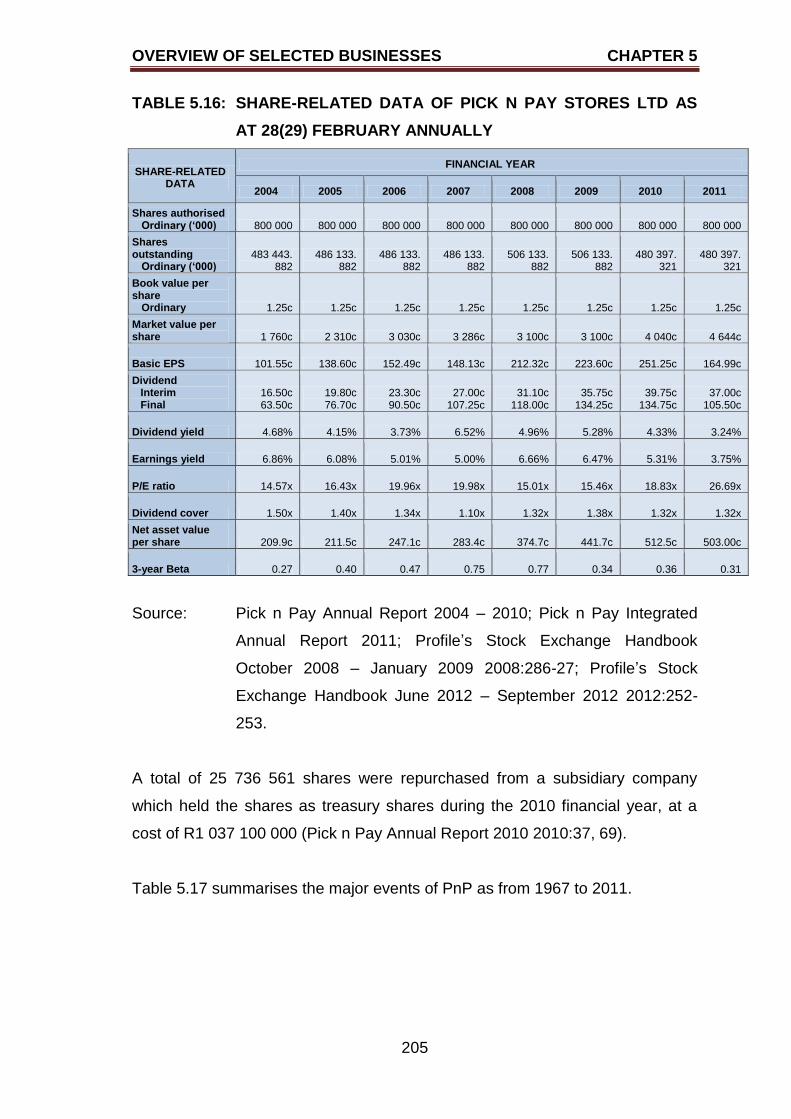
OVERVIEW OF SELECTED BUSINESSES CHAPTER 5
205
TABLE 5.16: SHARE-RELATED DATA OF PICK N PAY STORES LTD AS
AT 28(29) FEBRUARY ANNUALLY
SHARE-RELATED DATA
FINANCIAL YEAR
2004 2005 2006 2007 2008 2009 2010 2011
Shares authorised Ordinary (‘000) 800 000 800 000 800 000 800 000 800 000 800 000 800 000 800 000
Shares outstanding
Ordinary (‘000) 483 443.
882 486 133.
882 486 133.
882 486 133.
882 506 133.
882 506 133.
882 480 397.
321 480 397.
321
Book value per share
Ordinary 1.25c 1.25c 1.25c 1.25c 1.25c 1.25c 1.25c 1.25c
Market value per share 1 760c 2 310c 3 030c 3 286c 3 100c 3 100c 4 040c 4 644c
Basic EPS 101.55c 138.60c 152.49c 148.13c 212.32c 223.60c 251.25c 164.99c
Dividend Interim Final
16.50c 63.50c
19.80c 76.70c
23.30c 90.50c
27.00c 107.25c
31.10c 118.00c
35.75c 134.25c
39.75c 134.75c
37.00c 105.50c
Dividend yield 4.68% 4.15% 3.73% 6.52% 4.96% 5.28% 4.33% 3.24%
Earnings yield 6.86% 6.08% 5.01% 5.00% 6.66% 6.47% 5.31% 3.75%
P/E ratio 14.57x 16.43x 19.96x 19.98x 15.01x 15.46x 18.83x 26.69x
Dividend cover 1.50x 1.40x 1.34x 1.10x 1.32x 1.38x 1.32x 1.32x
Net asset value per share 209.9c 211.5c 247.1c 283.4c 374.7c 441.7c 512.5c 503.00c
3-year Beta 0.27 0.40 0.47 0.75 0.77 0.34 0.36 0.31
Source: Pick n Pay Annual Report 2004 – 2010; Pick n Pay Integrated
Annual Report 2011; Profile‟s Stock Exchange Handbook
October 2008 – January 2009 2008:286-27; Profile‟s Stock
Exchange Handbook June 2012 – September 2012 2012:252-
253.
A total of 25 736 561 shares were repurchased from a subsidiary company
which held the shares as treasury shares during the 2010 financial year, at a
cost of R1 037 100 000 (Pick n Pay Annual Report 2010 2010:37, 69).
Table 5.17 summarises the major events of PnP as from 1967 to 2011.
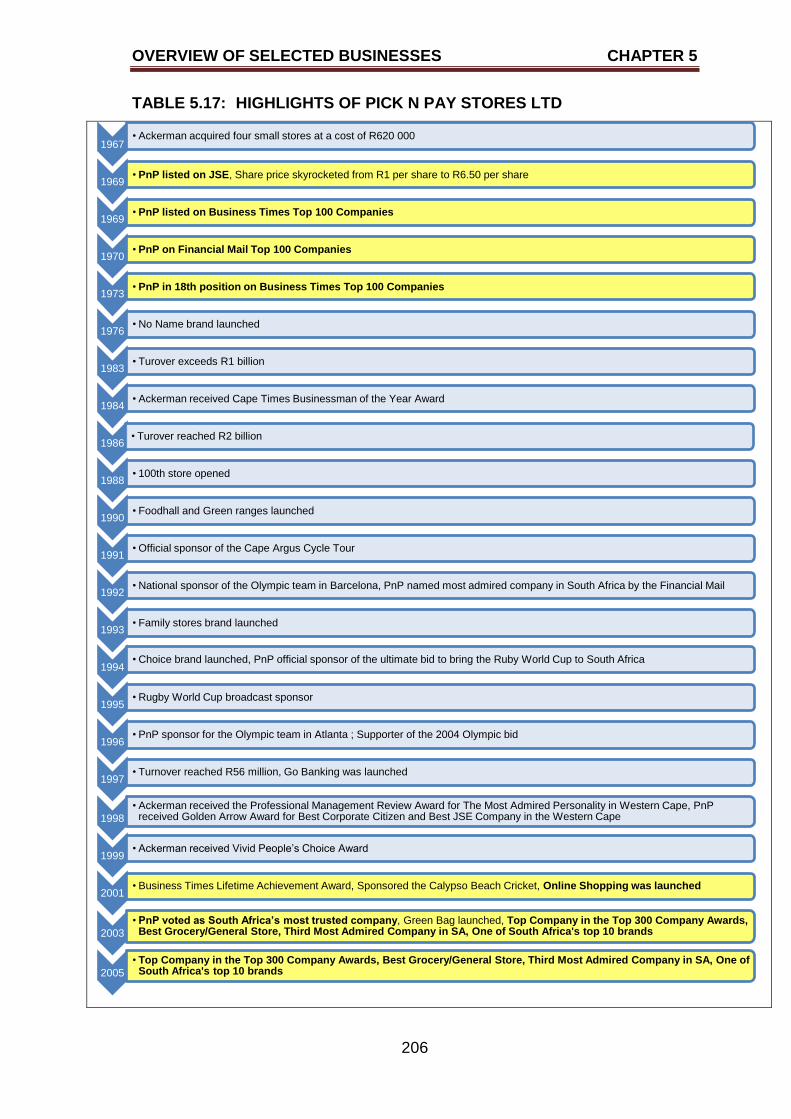
OVERVIEW OF SELECTED BUSINESSES CHAPTER 5
206
TABLE 5.17: HIGHLIGHTS OF PICK N PAY STORES LTD
1967 • Ackerman acquired four small stores at a cost of R620 000
1969 • PnP listed on JSE, Share price skyrocketed from R1 per share to R6.50 per share
1969 • PnP listed on Business Times Top 100 Companies
1970 • PnP on Financial Mail Top 100 Companies
1973 • PnP in 18th position on Business Times Top 100 Companies
1976 • No Name brand launched
1983 • Turover exceeds R1 billion
1984 • Ackerman received Cape Times Businessman of the Year Award
1986 • Turover reached R2 billion
1988 • 100th store opened
1990 • Foodhall and Green ranges launched
1991 • Official sponsor of the Cape Argus Cycle Tour
1992 • National sponsor of the Olympic team in Barcelona, PnP named most admired company in South Africa by the Financial Mail
1993 • Family stores brand launched
1994 • Choice brand launched, PnP official sponsor of the ultimate bid to bring the Ruby World Cup to South Africa
1995 • Rugby World Cup broadcast sponsor
1996 • PnP sponsor for the Olympic team in Atlanta ; Supporter of the 2004 Olympic bid
1997 • Turnover reached R56 million, Go Banking was launched
1998
• Ackerman received the Professional Management Review Award for The Most Admired Personality in Western Cape, PnP received Golden Arrow Award for Best Corporate Citizen and Best JSE Company in the Western Cape
1999 • Ackerman received Vivid People‟s Choice Award
2001 • Business Times Lifetime Achievement Award, Sponsored the Calypso Beach Cricket, Online Shopping was launched
2003
• PnP voted as South Africa’s most trusted company, Green Bag launched, Top Company in the Top 300 Company Awards, Best Grocery/General Store, Third Most Admired Company in SA, One of South Africa's top 10 brands
2005
• Top Company in the Top 300 Company Awards, Best Grocery/General Store, Third Most Admired Company in SA, One of South Africa's top 10 brands
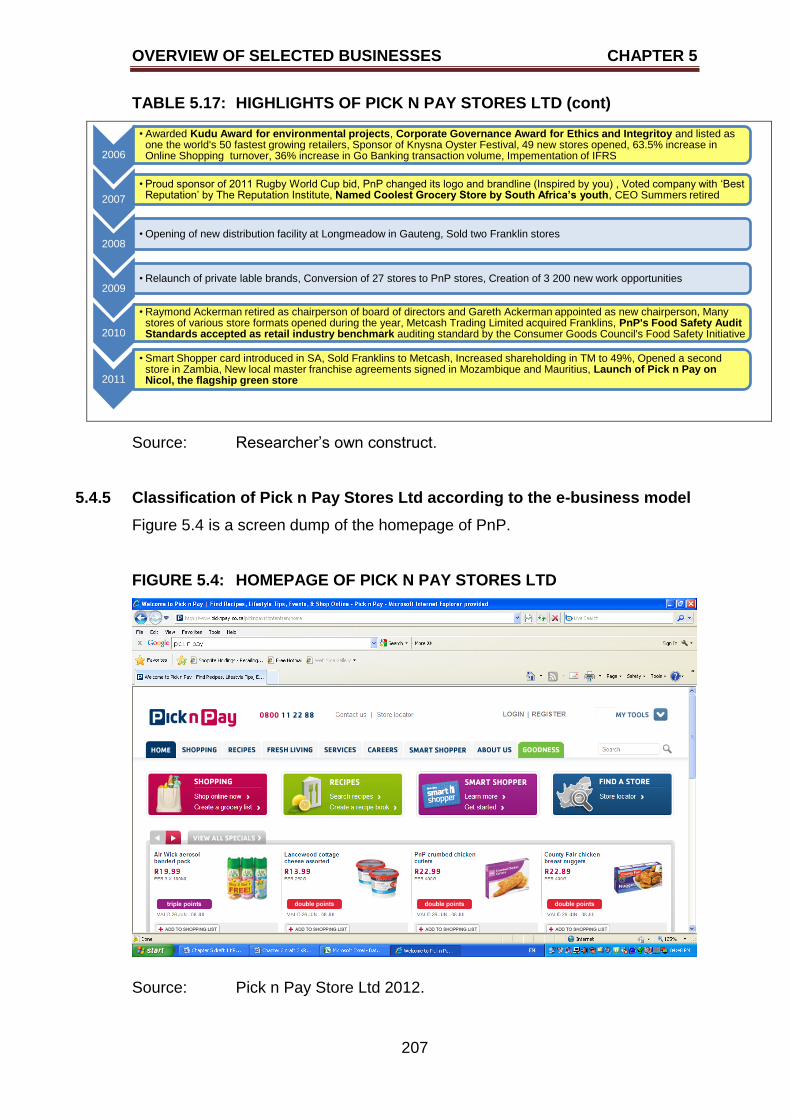
OVERVIEW OF SELECTED BUSINESSES CHAPTER 5
207
TABLE 5.17: HIGHLIGHTS OF PICK N PAY STORES LTD (cont)
Source: Researcher‟s own construct.
5.4.5 Classification of Pick n Pay Stores Ltd according to the e-business model
Figure 5.4 is a screen dump of the homepage of PnP.
FIGURE 5.4: HOMEPAGE OF PICK N PAY STORES LTD
Source: Pick n Pay Store Ltd 2012.
2006
• Awarded Kudu Award for environmental projects, Corporate Governance Award for Ethics and Integritoy and listed as one the world's 50 fastest growing retailers, Sponsor of Knysna Oyster Festival, 49 new stores opened, 63.5% increase in Online Shopping turnover, 36% increase in Go Banking transaction volume, Impementation of IFRS
2007
• Proud sponsor of 2011 Rugby World Cup bid, PnP changed its logo and brandline (Inspired by you) , Voted company with „Best Reputation‟ by The Reputation Institute, Named Coolest Grocery Store by South Africa’s youth, CEO Summers retired
2008 • Opening of new distribution facility at Longmeadow in Gauteng, Sold two Franklin stores
2009 • Relaunch of private lable brands, Conversion of 27 stores to PnP stores, Creation of 3 200 new work opportunities
2010
• Raymond Ackerman retired as chairperson of board of directors and Gareth Ackerman appointed as new chairperson, Many stores of various store formats opened during the year, Metcash Trading Limited acquired Franklins, PnP's Food Safety Audit Standards accepted as retail industry benchmark auditing standard by the Consumer Goods Council's Food Safety Initiative
2011
• Smart Shopper card introduced in SA, Sold Franklins to Metcash, Increased shareholding in TM to 49%, Opened a second store in Zambia, New local master franchise agreements signed in Mozambique and Mauritius, Launch of Pick n Pay on Nicol, the flagship green store
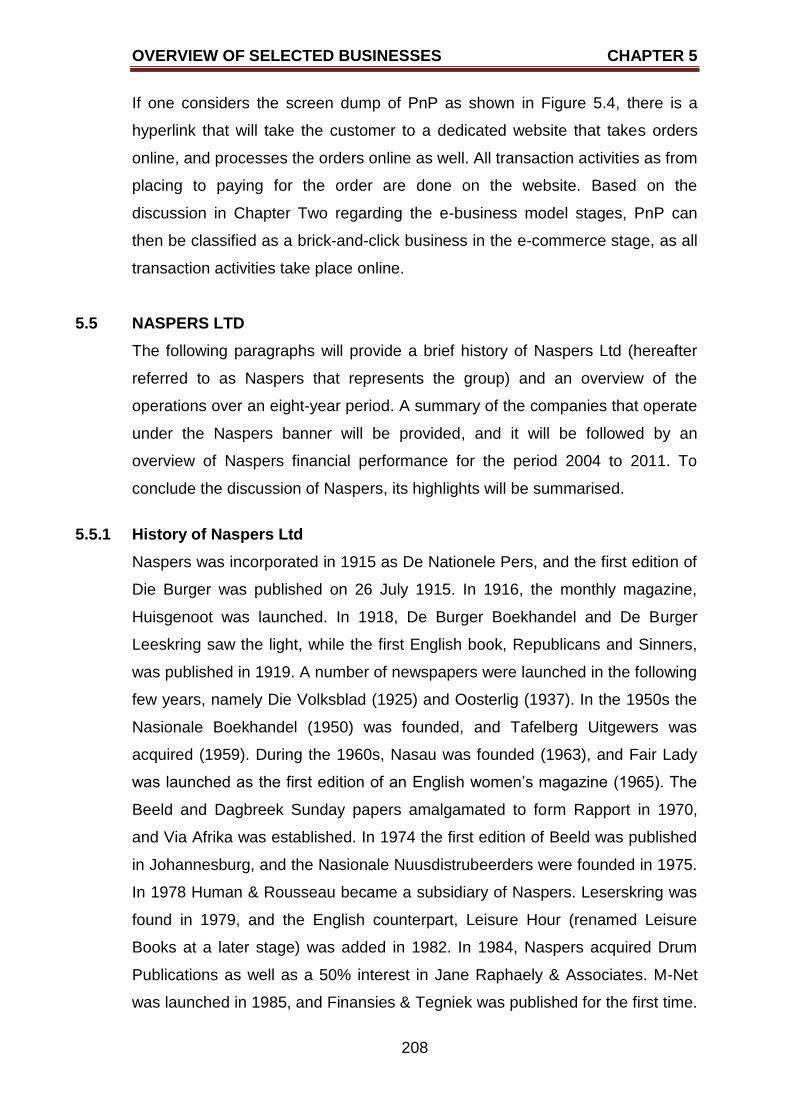
OVERVIEW OF SELECTED BUSINESSES CHAPTER 5
208
If one considers the screen dump of PnP as shown in Figure 5.4, there is a
hyperlink that will take the customer to a dedicated website that takes orders
online, and processes the orders online as well. All transaction activities as from
placing to paying for the order are done on the website. Based on the
discussion in Chapter Two regarding the e-business model stages, PnP can
then be classified as a brick-and-click business in the e-commerce stage, as all
transaction activities take place online.
5.5 NASPERS LTD
The following paragraphs will provide a brief history of Naspers Ltd (hereafter
referred to as Naspers that represents the group) and an overview of the
operations over an eight-year period. A summary of the companies that operate
under the Naspers banner will be provided, and it will be followed by an
overview of Naspers financial performance for the period 2004 to 2011. To
conclude the discussion of Naspers, its highlights will be summarised.
5.5.1 History of Naspers Ltd
Naspers was incorporated in 1915 as De Nationele Pers, and the first edition of
Die Burger was published on 26 July 1915. In 1916, the monthly magazine,
Huisgenoot was launched. In 1918, De Burger Boekhandel and De Burger
Leeskring saw the light, while the first English book, Republicans and Sinners,
was published in 1919. A number of newspapers were launched in the following
few years, namely Die Volksblad (1925) and Oosterlig (1937). In the 1950s the
Nasionale Boekhandel (1950) was founded, and Tafelberg Uitgewers was
acquired (1959). During the 1960s, Nasau was founded (1963), and Fair Lady
was launched as the first edition of an English women‟s magazine (1965). The
Beeld and Dagbreek Sunday papers amalgamated to form Rapport in 1970,
and Via Afrika was established. In 1974 the first edition of Beeld was published
in Johannesburg, and the Nasionale Nuusdistrubeerders were founded in 1975.
In 1978 Human & Rousseau became a subsidiary of Naspers. Leserskring was
found in 1979, and the English counterpart, Leisure Hour (renamed Leisure
Books at a later stage) was added in 1982. In 1984, Naspers acquired Drum
Publications as well as a 50% interest in Jane Raphaely & Associates. M-Net
was launched in 1985, and Finansies & Tegniek was published for the first time.
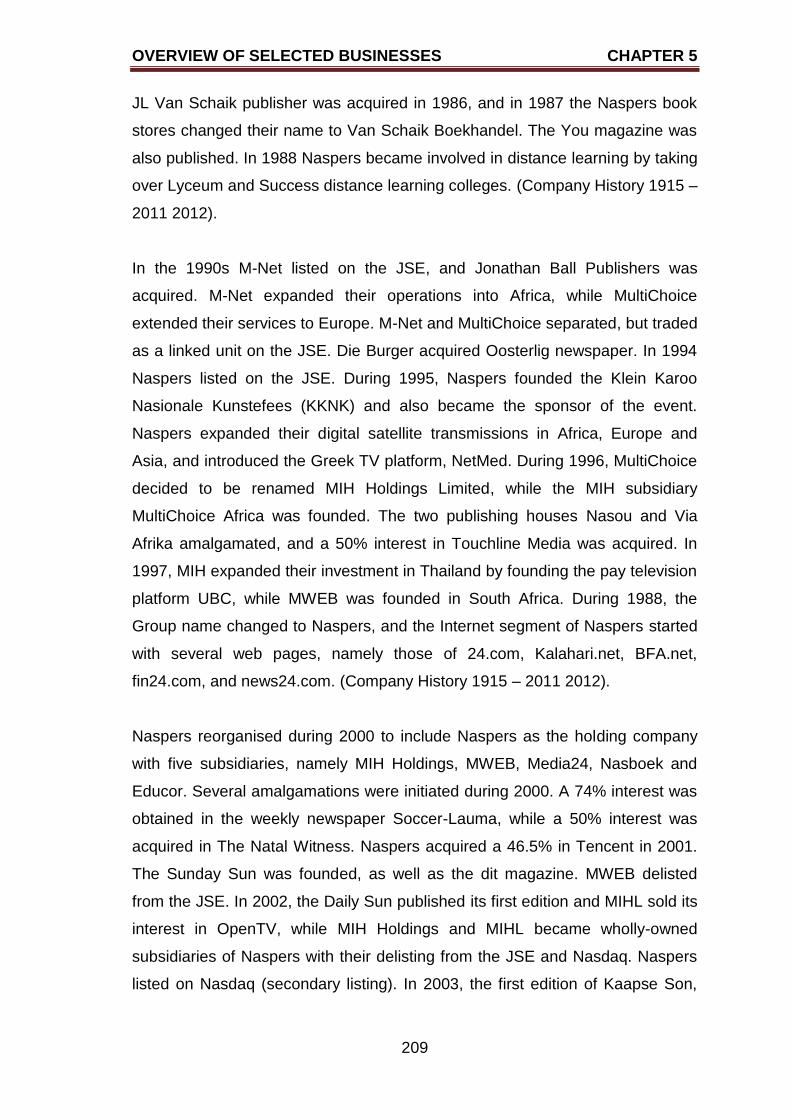
OVERVIEW OF SELECTED BUSINESSES CHAPTER 5
209
JL Van Schaik publisher was acquired in 1986, and in 1987 the Naspers book
stores changed their name to Van Schaik Boekhandel. The You magazine was
also published. In 1988 Naspers became involved in distance learning by taking
over Lyceum and Success distance learning colleges. (Company History 1915 –
2011 2012).
In the 1990s M-Net listed on the JSE, and Jonathan Ball Publishers was
acquired. M-Net expanded their operations into Africa, while MultiChoice
extended their services to Europe. M-Net and MultiChoice separated, but traded
as a linked unit on the JSE. Die Burger acquired Oosterlig newspaper. In 1994
Naspers listed on the JSE. During 1995, Naspers founded the Klein Karoo
Nasionale Kunstefees (KKNK) and also became the sponsor of the event.
Naspers expanded their digital satellite transmissions in Africa, Europe and
Asia, and introduced the Greek TV platform, NetMed. During 1996, MultiChoice
decided to be renamed MIH Holdings Limited, while the MIH subsidiary
MultiChoice Africa was founded. The two publishing houses Nasou and Via
Afrika amalgamated, and a 50% interest in Touchline Media was acquired. In
1997, MIH expanded their investment in Thailand by founding the pay television
platform UBC, while MWEB was founded in South Africa. During 1988, the
Group name changed to Naspers, and the Internet segment of Naspers started
with several web pages, namely those of 24.com, Kalahari.net, BFA.net,
fin24.com, and news24.com. (Company History 1915 – 2011 2012).
Naspers reorganised during 2000 to include Naspers as the holding company
with five subsidiaries, namely MIH Holdings, MWEB, Media24, Nasboek and
Educor. Several amalgamations were initiated during 2000. A 74% interest was
obtained in the weekly newspaper Soccer-Lauma, while a 50% interest was
acquired in The Natal Witness. Naspers acquired a 46.5% in Tencent in 2001.
The Sunday Sun was founded, as well as the dit magazine. MWEB delisted
from the JSE. In 2002, the Daily Sun published its first edition and MIHL sold its
interest in OpenTV, while MIH Holdings and MIHL became wholly-owned
subsidiaries of Naspers with their delisting from the JSE and Nasdaq. Naspers
listed on Nasdaq (secondary listing). In 2003, the first edition of Kaapse Son,
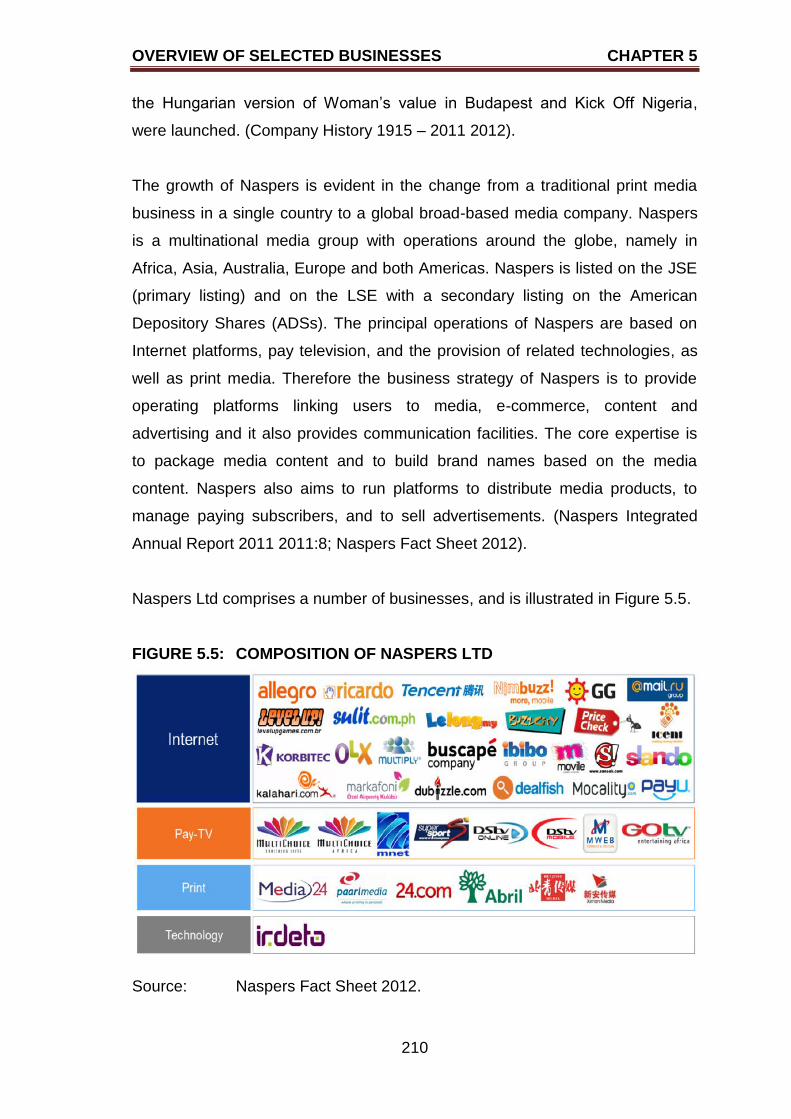
OVERVIEW OF SELECTED BUSINESSES CHAPTER 5
210
the Hungarian version of Woman‟s value in Budapest and Kick Off Nigeria,
were launched. (Company History 1915 – 2011 2012).
The growth of Naspers is evident in the change from a traditional print media
business in a single country to a global broad-based media company. Naspers
is a multinational media group with operations around the globe, namely in
Africa, Asia, Australia, Europe and both Americas. Naspers is listed on the JSE
(primary listing) and on the LSE with a secondary listing on the American
Depository Shares (ADSs). The principal operations of Naspers are based on
Internet platforms, pay television, and the provision of related technologies, as
well as print media. Therefore the business strategy of Naspers is to provide
operating platforms linking users to media, e-commerce, content and
advertising and it also provides communication facilities. The core expertise is
to package media content and to build brand names based on the media
content. Naspers also aims to run platforms to distribute media products, to
manage paying subscribers, and to sell advertisements. (Naspers Integrated
Annual Report 2011 2011:8; Naspers Fact Sheet 2012).
Naspers Ltd comprises a number of businesses, and is illustrated in Figure 5.5.
FIGURE 5.5: COMPOSITION OF NASPERS LTD
Source: Naspers Fact Sheet 2012.
OVERVIEW OF SELECTED BUSINESSES CHAPTER 5
211
5.5.2 Operational overview of Naspers Ltd for the period 2004 to 2011
The revenue for the 2004 financial year grew by 5%. During the 2004 financial
year, there were 2.1 million pay-television subscribers, with 71% of the
subscribers subscribing to digital services. Pay-television revenues grew by 1%,
and the two subscriber management platforms of MultiChoice and M-Web were
merged. The operations in the sub-Saharan Africa and Mediterranean regions
experienced exceptionally high levels of growth. Challenges experienced by
Naspers in the Thailand operation are cable and copyright piracy. With regard
to technology, Naspers experienced stiff competition in the encryption
technology market. Naspers developed a business that provides security, billing
and customer care service for broadcast and online media. The Internet
business Tencent‟s QQ services experienced growth, and a popular QQ game
portal with multiplayer online games and instant messaging services, was also
introduced. In South Africa, the growth of M-Web has stalled owing to the
monopoly Telkom has in the market. The print media (newspapers and
magazines) operated in a mature market, and revenues increased by 14%. The
various newspapers, namely, the Daily Sun, Sunday Sun and Son experienced
high growth. Several niche magazines, namely Bicycling SA, Seventeen and
Wegbreek, were launched. The book publishing business increased revenues
by 18%. (Naspers Annual Report 2004 2004).
In the 2005 financial year the revenues of Naspers increased by 9%. The major
challenge faced by Naspers during that financial year was the strengthening of
the rand against most of the major currencies. The Naspers group comprised
two segments, namely the electronic media and print media segments.
MultiChoice provided television and subscriber management services to South
Africa (1.14 million subscribers of whom 78% subscribed to digital services) and
more than 50 other sub-Saharan African countries, as well as the Indian Ocean
islands. The television services included 59 video channels, six data channels
and 40 audio channels. During 2005 the MultiChoice and MWEB subscriber
management platforms were merged. A new satellite, SESAT, was assisting in
the expansion of the French and Portuguese bouquets, and nine Portuguese
channels were introduced in Angola. A total of eleven new channels were
introduced on the French bouquet, focusing on the Democratic Republic of
OVERVIEW OF SELECTED BUSINESSES CHAPTER 5
212
Congo. The largest subscriber base in sub-Saharan Africa is Nigeria.
Competition from three service providers was faced during 2005. SuperSport
introduced three short channels and six extra channels to broadcast overflow
sport. (Naspers Annual Report 2005 2005).
The revenues increased by 16% for the 2006 financial year. The major drivers
for this increase were the net growth in pay television subscribers, resulting in
an increase of 22% in advertising revenues. The revenues generated by the
pay television increased by 15% during the year, the Internet segment revenues
grew by 29%, and the revenues generated by print media increased by 18%.
MultiChoice launched the personal video recorder (PVR). During 2006, a 30%
equity stake was obtained in leading Brazilian media company, Abril, for a cash
consideration of US$422 million. (Naspers Annual Report 2006 2006).
The South African subscriber base grew to just below 1.4 million subscribers in
the 2007 financial year, 88% of which receive digital signals. MultiChoice
bouquet consisted of 76 video channels, eight interactive channels and 68
audio channels. M-Net produced 15 channels for the DStv platform. SuperSport
broadcast the 2006 soccer world cup and the 2007 cricket world cup. A new
Portuguese sports channel was introduced. Media24 expanded to publish six
daily newspapers, three Sunday newspapers, two weekly newspapers and 43
community newspapers. During the 2007 financial year, the newspaper division
underwent reorganisation to improve customer service. The division was
subdivided into publishing and print as a division, and distribution as a separate
division. The journalists received various awards, such as the Mondi Shanduka
Newspaper Awards, Sanlam Community Press Awards. Media24 published
more than 60 magazines and was regarded as the leading magazine publisher
in Africa. The NND24 and On the Dot distributions were also consolidated
during 2007. In July 2007, the 24.com portal was launched, and the portal has
experienced high growth since its establishment. During 2007, the restructuring
of Damelin was started, while Midrand Graduate Institute and the Graduate
Institute of Management and Technology were disposed of. (Naspers Annual
Report 2007 2007).
OVERVIEW OF SELECTED BUSINESSES CHAPTER 5
213
The growth in revenue for the 2008 financial year was 19%, with the Internet
segment reporting a 42% growth rate, followed by the pay television growth rate
of 22%. Naspers acquired 100% of Tradus plc issued share capital at a cost of
R491 million for net assets, R461 million for intangible assets, and a balance for
goodwill. In October 2007 Media24 accepted an offer to sell Educor, and in
November 2007 Naspers acquired a 40% interest in M-Net/SuperSport. In
December 2007 two further acquisitions were concluded, namely Gadu-Gadu
and Cloakware. (Naspers Annual Report 2008 2008).
The 2009 financial year was a prosperous year for the Naspers group, with a
revenue growth rate of 30%. The drivers that led to the high growth rate were
the growth of existing operations of 19% and new acquisitions which contributed
11% to the growth rate. As a result of improved gross subscriber growth, pay
television growth rate increased by 29%. The pay television businesses in
Greece and Cyprus were disposed of at a profit of R2.97 billion. Naspers
acquired a 100% interest in Vatera.hu at a cost of R183 million, a 37% interest
in Xin‟an Media at a cost of R315 million, and an additional 10.3% interest in
mail.ru for R1.03 billion. Other disposals included the agreement for the sale of
MWEB‟s sub-Saharan Africa business, excluding South Africa. Naspers
announced that a public tender of R156 million was submitted to acquire up to
100% of Bankier.pl, a Warsaw-listed financial portal. (Naspers Annual Report
2009 2009).
The revenue growth for Naspers for the 2010 financial year was a low 5%
because of the pressure on print media and the strengthening of the rand
against the major currencies. The Internet segments reported an increase in
revenues of 24% while the pay television segment increased turnover by 12%.
The revenues for both the print and technology segments declined for the 2010
financial year. Acquisitions during 2010 included the purchase of a 94.8%
interest in BuscaPé, a Brazilian e-commerce group, for approximately R2.7
billion. A 51% stake was obtained in Korbitec (Proprietary) Limited, which is an
electronic platform for attorneys, banks and other property value chain
members, for R158 million. Naspers acquired the remaining share in Bankier.pl
for R178 million. (Naspers Annual Report 2010 2010).
OVERVIEW OF SELECTED BUSINESSES CHAPTER 5
214
Revenues for the 2011 financial year for Naspers increased by 18% as a result
of a well-diversified portfolio. Growth was experienced in the Internet and pay
television segments, while the media businesses were slowly recovering from
the 2010 performance. A 28.7% interest was obtained in the Digital Sky
Technologies in Russia. A R365 million cash purchase ensured that Naspers
obtained a 100% interest in Level Up! International Holdings. Another
acquisition was that of DineroMail, where Naspers bought a 77.7% share for
R206 million. A number of awards were received by the group companies. ibibo
received the Star Youth Icon Award at Global Youth Marketing Awards 2011.
Media24 Newspapers received the National Press Club Editor of the year
Award 2010. At Pica 2011 Awards, Sarie received Editor of the Year Award and
Consumer Magazine of the Year Award, while Woolworths Taste received
Client of the Year Award. Paarl Media was the first Africa member to be
admitted to the international WAN/IFRA Quality Club, and was acknowledged
by Mondi and Sappi for printing work. NB Publishers received the Hertzog prize
for fiction, and the University of Johannesburg début prize for creative writing,
the Alba Bouwer prize for children‟s literature and the Commonwealth Writers
Prize for best book Africa region. SuperSport‟s Let‟s Play was named South
Africa‟s best social responsibility in sport initiative at Virgin Active sport industry
awards. MultiChoice also received numerous accolades. At The Orange Index
Awards MultiChoice came first in the telecommunication sector, and fourth
overall among companies providing customer services. Four Loerie Awards for
creative media advertising, 12 Africa Promax Awards for creative on-air
marketing and four international Promax Awards for international on-air creative
marketing were received. MultiChoice also obtained the first position in the
FinWeek radio campaign of the year, and the 21 Generation X Top Teas Award.
In the top ten most-loved South African television advertisements, MultiChoice
received the first and joint second positions. (Naspers Integrated Annual Report
2011 2011).
As a corporate citizen, Naspers developed comprehensive programmes for their
South African operations dealing with HIV/Aids information and awareness
campaigns, voluntary free testing, free counselling and comprehensive medical
treatment programmes. Naspers also focused their attention on the waste

OVERVIEW OF SELECTED BUSINESSES CHAPTER 5
215
management of hazardous materials at the various printing facilities. Free eye-
testing was provided for their employees. Professional and independent
psychosocial support was also made available to the employees. (Naspers
Annual Report 2004 – 2010; Naspers Integrated Annual Report 2011 2011).
Other corporate and social engagements Naspers were involved in since 2004
to 2011 included the following:
KTV Market Days focusing on encouraging entrepreneurship;
SuperSport‟s Let‟s Play initiative aiming at encouraging children to take
part in sport activities;
the Carte Blanche Making a Difference campaign where funds were
raised that were donated to state hospitals and identified charity
organisations;
the MultiChoice Orphaned and Vulnerable Children programmes assisting
care centres by providing new and refurbished buildings and homes and
training care personnel;
SuperSport Executive Management Programme aiming at improving the
skills and knowledge of sport managers and sport administrators;
the Vuka Awards and Film Talent Incubator for aspirant
filmmakers/producers making television commercials and films;
Volunteers24 were involved in projects to revamp and upgrade shelters
for the homeless youth in Cape Town, Earth Hour and Rachel‟s Angels
mentorship programmes;
the Media24 Lapdesk Challenge where lap desks were donated to
learners in historically disadvantaged communities;
the MultiChoice Information Communication Technology (ICT) in Schools
initiative by donating equipment to develop multimedia centres;
the Paarl Media Bursary Trust providing bursaries to needy students from
previously disadvantages communities in the Paarl community;
the DStv Education bouquet comprising eight education channels which
were free of charge to MultiChoice Resource Centres in more than 800
schools in 24 countries;
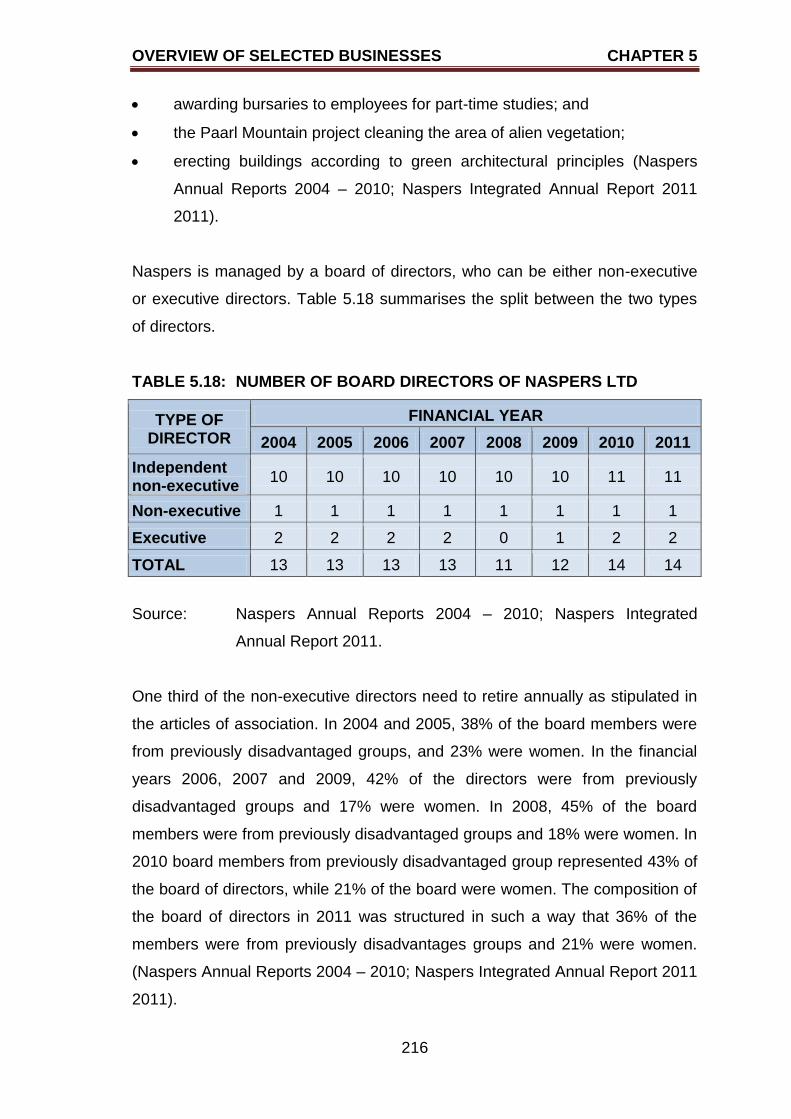
OVERVIEW OF SELECTED BUSINESSES CHAPTER 5
216
awarding bursaries to employees for part-time studies; and
the Paarl Mountain project cleaning the area of alien vegetation;
erecting buildings according to green architectural principles (Naspers
Annual Reports 2004 – 2010; Naspers Integrated Annual Report 2011
2011).
Naspers is managed by a board of directors, who can be either non-executive
or executive directors. Table 5.18 summarises the split between the two types
of directors.
TABLE 5.18: NUMBER OF BOARD DIRECTORS OF NASPERS LTD
TYPE OF DIRECTOR
FINANCIAL YEAR
2004 2005 2006 2007 2008 2009 2010 2011
Independent non-executive
10 10 10 10 10 10 11 11
Non-executive 1 1 1 1 1 1 1 1
Executive 2 2 2 2 0 1 2 2
TOTAL 13 13 13 13 11 12 14 14
Source: Naspers Annual Reports 2004 – 2010; Naspers Integrated
Annual Report 2011.
One third of the non-executive directors need to retire annually as stipulated in
the articles of association. In 2004 and 2005, 38% of the board members were
from previously disadvantaged groups, and 23% were women. In the financial
years 2006, 2007 and 2009, 42% of the directors were from previously
disadvantaged groups and 17% were women. In 2008, 45% of the board
members were from previously disadvantaged groups and 18% were women. In
2010 board members from previously disadvantaged group represented 43% of
the board of directors, while 21% of the board were women. The composition of
the board of directors in 2011 was structured in such a way that 36% of the
members were from previously disadvantages groups and 21% were women.
(Naspers Annual Reports 2004 – 2010; Naspers Integrated Annual Report 2011
2011).
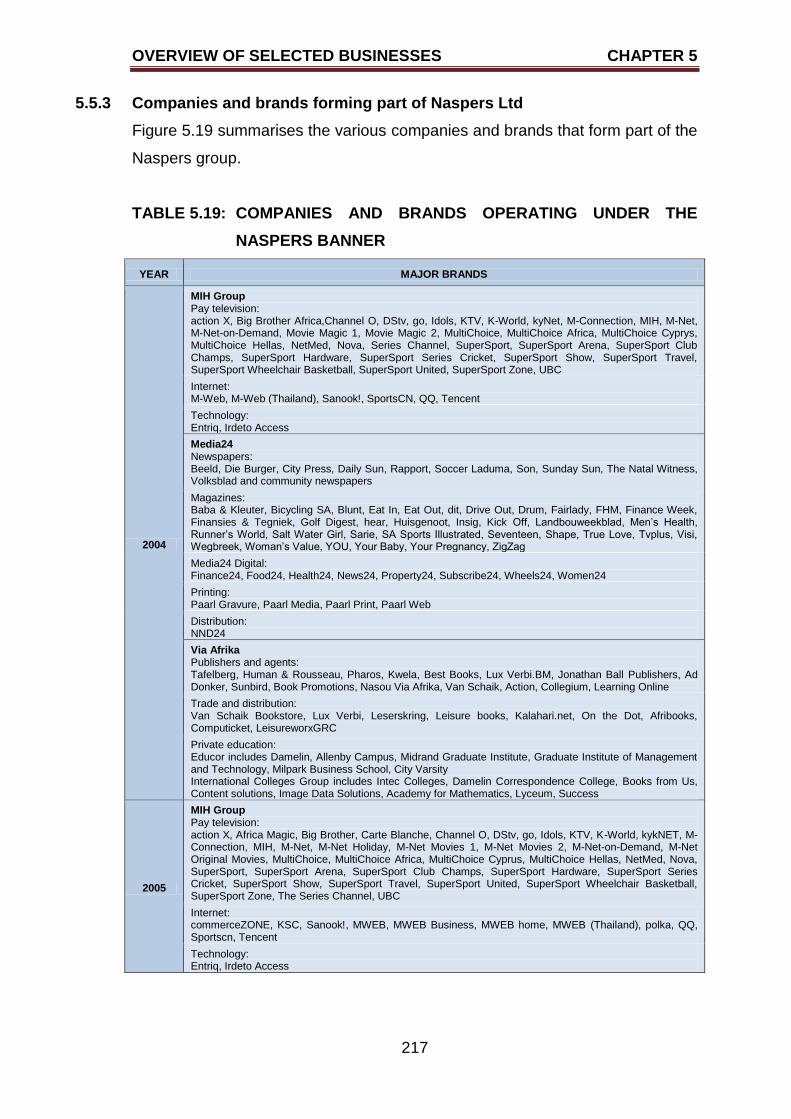
OVERVIEW OF SELECTED BUSINESSES CHAPTER 5
217
5.5.3 Companies and brands forming part of Naspers Ltd
Figure 5.19 summarises the various companies and brands that form part of the
Naspers group.
TABLE 5.19: COMPANIES AND BRANDS OPERATING UNDER THE
NASPERS BANNER
YEAR MAJOR BRANDS
2004
MIH Group Pay television: action X, Big Brother Africa,Channel O, DStv, go, Idols, KTV, K-World, kyNet, M-Connection, MIH, M-Net, M-Net-on-Demand, Movie Magic 1, Movie Magic 2, MultiChoice, MultiChoice Africa, MultiChoice Cyprys, MultiChoice Hellas, NetMed, Nova, Series Channel, SuperSport, SuperSport Arena, SuperSport Club Champs, SuperSport Hardware, SuperSport Series Cricket, SuperSport Show, SuperSport Travel, SuperSport Wheelchair Basketball, SuperSport United, SuperSport Zone, UBC
Internet: M-Web, M-Web (Thailand), Sanook!, SportsCN, QQ, Tencent
Technology: Entriq, Irdeto Access
Media24 Newspapers: Beeld, Die Burger, City Press, Daily Sun, Rapport, Soccer Laduma, Son, Sunday Sun, The Natal Witness, Volksblad and community newspapers
Magazines: Baba & Kleuter, Bicycling SA, Blunt, Eat In, Eat Out, dit, Drive Out, Drum, Fairlady, FHM, Finance Week, Finansies & Tegniek, Golf Digest, hear, Huisgenoot, Insig, Kick Off, Landbouweekblad, Men‟s Health, Runner‟s World, Salt Water Girl, Sarie, SA Sports Illustrated, Seventeen, Shape, True Love, Tvplus, Visi, Wegbreek, Woman‟s Value, YOU, Your Baby, Your Pregnancy, ZigZag
Media24 Digital: Finance24, Food24, Health24, News24, Property24, Subscribe24, Wheels24, Women24
Printing: Paarl Gravure, Paarl Media, Paarl Print, Paarl Web
Distribution: NND24
Via Afrika Publishers and agents: Tafelberg, Human & Rousseau, Pharos, Kwela, Best Books, Lux Verbi.BM, Jonathan Ball Publishers, Ad Donker, Sunbird, Book Promotions, Nasou Via Afrika, Van Schaik, Action, Collegium, Learning Online
Trade and distribution: Van Schaik Bookstore, Lux Verbi, Leserskring, Leisure books, Kalahari.net, On the Dot, Afribooks, Computicket, LeisureworxGRC
Private education: Educor includes Damelin, Allenby Campus, Midrand Graduate Institute, Graduate Institute of Management and Technology, Milpark Business School, City Varsity International Colleges Group includes Intec Colleges, Damelin Correspondence College, Books from Us, Content solutions, Image Data Solutions, Academy for Mathematics, Lyceum, Success
2005
MIH Group Pay television: action X, Africa Magic, Big Brother, Carte Blanche, Channel O, DStv, go, Idols, KTV, K-World, kykNET, M-Connection, MIH, M-Net, M-Net Holiday, M-Net Movies 1, M-Net Movies 2, M-Net-on-Demand, M-Net Original Movies, MultiChoice, MultiChoice Africa, MultiChoice Cyprus, MultiChoice Hellas, NetMed, Nova, SuperSport, SuperSport Arena, SuperSport Club Champs, SuperSport Hardware, SuperSport Series Cricket, SuperSport Show, SuperSport Travel, SuperSport United, SuperSport Wheelchair Basketball, SuperSport Zone, The Series Channel, UBC
Internet: commerceZONE, KSC, Sanook!, MWEB, MWEB Business, MWEB home, MWEB (Thailand), polka, QQ, Sportscn, Tencent
Technology: Entriq, Irdeto Access
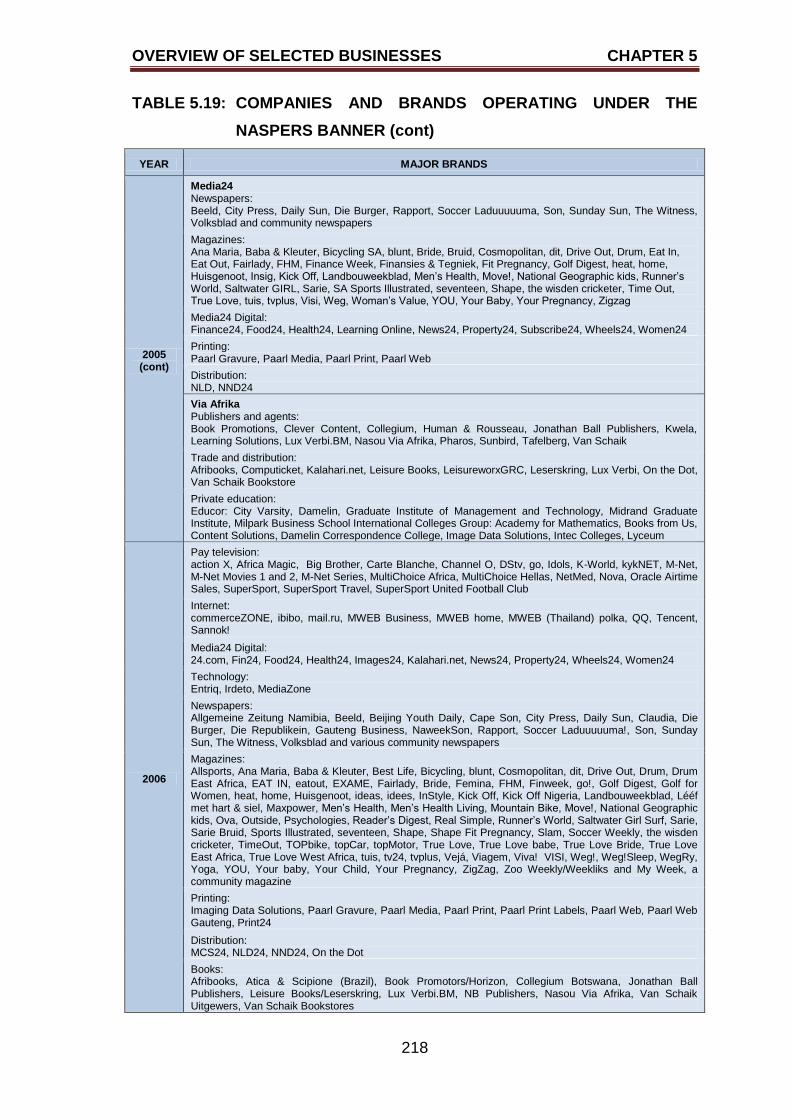
OVERVIEW OF SELECTED BUSINESSES CHAPTER 5
218
TABLE 5.19: COMPANIES AND BRANDS OPERATING UNDER THE
NASPERS BANNER (cont)
YEAR MAJOR BRANDS
2005 (cont)
Media24 Newspapers: Beeld, City Press, Daily Sun, Die Burger, Rapport, Soccer Laduuuuuma, Son, Sunday Sun, The Witness, Volksblad and community newspapers
Magazines: Ana Maria, Baba & Kleuter, Bicycling SA, blunt, Bride, Bruid, Cosmopolitan, dit, Drive Out, Drum, Eat In, Eat Out, Fairlady, FHM, Finance Week, Finansies & Tegniek, Fit Pregnancy, Golf Digest, heat, home, Huisgenoot, Insig, Kick Off, Landbouweekblad, Men‟s Health, Move!, National Geographic kids, Runner‟s World, Saltwater GIRL, Sarie, SA Sports Illustrated, seventeen, Shape, the wisden cricketer, Time Out, True Love, tuis, tvplus, Visi, Weg, Woman‟s Value, YOU, Your Baby, Your Pregnancy, Zigzag
Media24 Digital: Finance24, Food24, Health24, Learning Online, News24, Property24, Subscribe24, Wheels24, Women24
Printing: Paarl Gravure, Paarl Media, Paarl Print, Paarl Web
Distribution: NLD, NND24
Via Afrika Publishers and agents: Book Promotions, Clever Content, Collegium, Human & Rousseau, Jonathan Ball Publishers, Kwela, Learning Solutions, Lux Verbi.BM, Nasou Via Afrika, Pharos, Sunbird, Tafelberg, Van Schaik
Trade and distribution: Afribooks, Computicket, Kalahari.net, Leisure Books, LeisureworxGRC, Leserskring, Lux Verbi, On the Dot, Van Schaik Bookstore
Private education: Educor: City Varsity, Damelin, Graduate Institute of Management and Technology, Midrand Graduate Institute, Milpark Business School International Colleges Group: Academy for Mathematics, Books from Us, Content Solutions, Damelin Correspondence College, Image Data Solutions, Intec Colleges, Lyceum
2006
Pay television: action X, Africa Magic, Big Brother, Carte Blanche, Channel O, DStv, go, Idols, K-World, kykNET, M-Net, M-Net Movies 1 and 2, M-Net Series, MultiChoice Africa, MultiChoice Hellas, NetMed, Nova, Oracle Airtime Sales, SuperSport, SuperSport Travel, SuperSport United Football Club
Internet: commerceZONE, ibibo, mail.ru, MWEB Business, MWEB home, MWEB (Thailand) polka, QQ, Tencent, Sannok!
Media24 Digital: 24.com, Fin24, Food24, Health24, Images24, Kalahari.net, News24, Property24, Wheels24, Women24
Technology: Entriq, Irdeto, MediaZone
Newspapers: Allgemeine Zeitung Namibia, Beeld, Beijing Youth Daily, Cape Son, City Press, Daily Sun, Claudia, Die Burger, Die Republikein, Gauteng Business, NaweekSon, Rapport, Soccer Laduuuuuma!, Son, Sunday Sun, The Witness, Volksblad and various community newspapers
Magazines: Allsports, Ana Maria, Baba & Kleuter, Best Life, Bicycling, blunt, Cosmopolitan, dit, Drive Out, Drum, Drum East Africa, EAT IN, eatout, EXAME, Fairlady, Bride, Femina, FHM, Finweek, go!, Golf Digest, Golf for Women, heat, home, Huisgenoot, ideas, idees, InStyle, Kick Off, Kick Off Nigeria, Landbouweekblad, Lééf met hart & siel, Maxpower, Men‟s Health, Men‟s Health Living, Mountain Bike, Move!, National Geographic kids, Ova, Outside, Psychologies, Reader‟s Digest, Real Simple, Runner‟s World, Saltwater Girl Surf, Sarie, Sarie Bruid, Sports Illustrated, seventeen, Shape, Shape Fit Pregnancy, Slam, Soccer Weekly, the wisden cricketer, TimeOut, TOPbike, topCar, topMotor, True Love, True Love babe, True Love Bride, True Love East Africa, True Love West Africa, tuis, tv24, tvplus, Vejá, Viagem, Viva! VISI, Weg!, Weg!Sleep, WegRy, Yoga, YOU, Your baby, Your Child, Your Pregnancy, ZigZag, Zoo Weekly/Weekliks and My Week, a community magazine
Printing: Imaging Data Solutions, Paarl Gravure, Paarl Media, Paarl Print, Paarl Print Labels, Paarl Web, Paarl Web Gauteng, Print24
Distribution: MCS24, NLD24, NND24, On the Dot
Books: Afribooks, Atica & Scipione (Brazil), Book Promotors/Horizon, Collegium Botswana, Jonathan Ball Publishers, Leisure Books/Leserskring, Lux Verbi.BM, NB Publishers, Nasou Via Afrika, Van Schaik Uitgewers, Van Schaik Bookstores
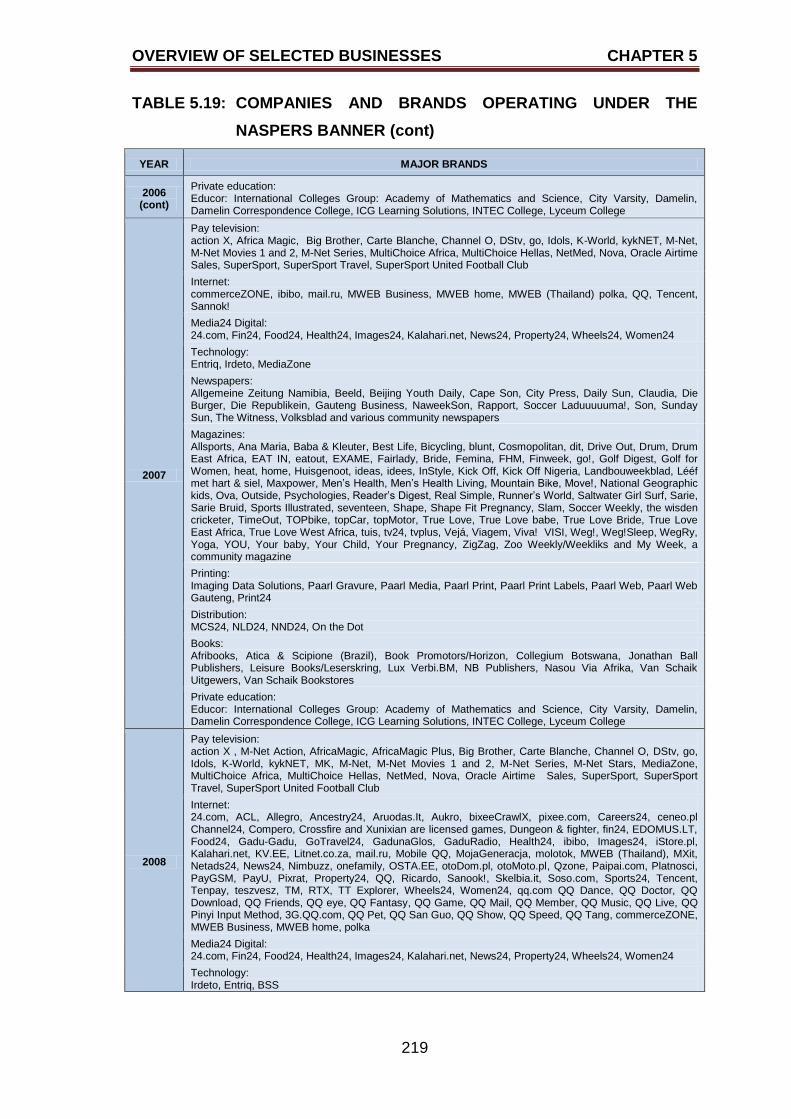
OVERVIEW OF SELECTED BUSINESSES CHAPTER 5
219
TABLE 5.19: COMPANIES AND BRANDS OPERATING UNDER THE
NASPERS BANNER (cont)
YEAR MAJOR BRANDS
2006 (cont)
Private education: Educor: International Colleges Group: Academy of Mathematics and Science, City Varsity, Damelin, Damelin Correspondence College, ICG Learning Solutions, INTEC College, Lyceum College
2007
Pay television: action X, Africa Magic, Big Brother, Carte Blanche, Channel O, DStv, go, Idols, K-World, kykNET, M-Net, M-Net Movies 1 and 2, M-Net Series, MultiChoice Africa, MultiChoice Hellas, NetMed, Nova, Oracle Airtime Sales, SuperSport, SuperSport Travel, SuperSport United Football Club
Internet: commerceZONE, ibibo, mail.ru, MWEB Business, MWEB home, MWEB (Thailand) polka, QQ, Tencent, Sannok!
Media24 Digital: 24.com, Fin24, Food24, Health24, Images24, Kalahari.net, News24, Property24, Wheels24, Women24
Technology: Entriq, Irdeto, MediaZone
Newspapers: Allgemeine Zeitung Namibia, Beeld, Beijing Youth Daily, Cape Son, City Press, Daily Sun, Claudia, Die Burger, Die Republikein, Gauteng Business, NaweekSon, Rapport, Soccer Laduuuuuma!, Son, Sunday Sun, The Witness, Volksblad and various community newspapers
Magazines: Allsports, Ana Maria, Baba & Kleuter, Best Life, Bicycling, blunt, Cosmopolitan, dit, Drive Out, Drum, Drum East Africa, EAT IN, eatout, EXAME, Fairlady, Bride, Femina, FHM, Finweek, go!, Golf Digest, Golf for Women, heat, home, Huisgenoot, ideas, idees, InStyle, Kick Off, Kick Off Nigeria, Landbouweekblad, Lééf met hart & siel, Maxpower, Men‟s Health, Men‟s Health Living, Mountain Bike, Move!, National Geographic kids, Ova, Outside, Psychologies, Reader‟s Digest, Real Simple, Runner‟s World, Saltwater Girl Surf, Sarie, Sarie Bruid, Sports Illustrated, seventeen, Shape, Shape Fit Pregnancy, Slam, Soccer Weekly, the wisden cricketer, TimeOut, TOPbike, topCar, topMotor, True Love, True Love babe, True Love Bride, True Love East Africa, True Love West Africa, tuis, tv24, tvplus, Vejá, Viagem, Viva! VISI, Weg!, Weg!Sleep, WegRy, Yoga, YOU, Your baby, Your Child, Your Pregnancy, ZigZag, Zoo Weekly/Weekliks and My Week, a community magazine
Printing: Imaging Data Solutions, Paarl Gravure, Paarl Media, Paarl Print, Paarl Print Labels, Paarl Web, Paarl Web Gauteng, Print24
Distribution: MCS24, NLD24, NND24, On the Dot
Books: Afribooks, Atica & Scipione (Brazil), Book Promotors/Horizon, Collegium Botswana, Jonathan Ball Publishers, Leisure Books/Leserskring, Lux Verbi.BM, NB Publishers, Nasou Via Afrika, Van Schaik Uitgewers, Van Schaik Bookstores
Private education: Educor: International Colleges Group: Academy of Mathematics and Science, City Varsity, Damelin, Damelin Correspondence College, ICG Learning Solutions, INTEC College, Lyceum College
2008
Pay television: action X , M-Net Action, AfricaMagic, AfricaMagic Plus, Big Brother, Carte Blanche, Channel O, DStv, go, Idols, K-World, kykNET, MK, M-Net, M-Net Movies 1 and 2, M-Net Series, M-Net Stars, MediaZone, MultiChoice Africa, MultiChoice Hellas, NetMed, Nova, Oracle Airtime Sales, SuperSport, SuperSport Travel, SuperSport United Football Club
Internet: 24.com, ACL, Allegro, Ancestry24, Aruodas.It, Aukro, bixeeCrawlX, pixee.com, Careers24, ceneo.pl Channel24, Compero, Crossfire and Xunixian are licensed games, Dungeon & fighter, fin24, EDOMUS.LT, Food24, Gadu-Gadu, GoTravel24, GadunaGlos, GaduRadio, Health24, ibibo, Images24, iStore.pl, Kalahari.net, KV.EE, Litnet.co.za, mail.ru, Mobile QQ, MojaGeneracja, molotok, MWEB (Thailand), MXit, Netads24, News24, Nimbuzz, onefamily, OSTA.EE, otoDom.pl, otoMoto.pl, Qzone, Paipai.com, Platnosci, PayGSM, PayU, Pixrat, Property24, QQ, Ricardo, Sanook!, Skelbia.it, Soso.com, Sports24, Tencent, Tenpay, teszvesz, TM, RTX, TT Explorer, Wheels24, Women24, qq.com QQ Dance, QQ Doctor, QQ Download, QQ Friends, QQ eye, QQ Fantasy, QQ Game, QQ Mail, QQ Member, QQ Music, QQ Live, QQ Pinyi Input Method, 3G.QQ.com, QQ Pet, QQ San Guo, QQ Show, QQ Speed, QQ Tang, commerceZONE, MWEB Business, MWEB home, polka
Media24 Digital: 24.com, Fin24, Food24, Health24, Images24, Kalahari.net, News24, Property24, Wheels24, Women24
Technology: Irdeto, Entriq, BSS
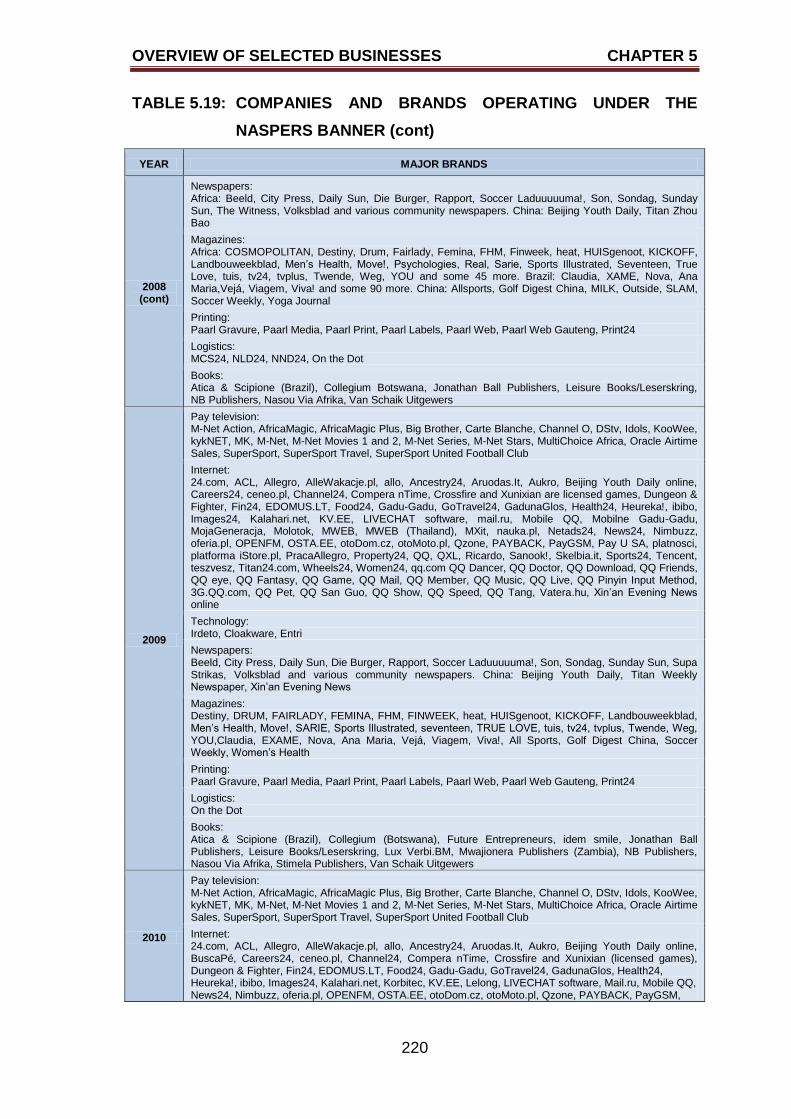
OVERVIEW OF SELECTED BUSINESSES CHAPTER 5
220
TABLE 5.19: COMPANIES AND BRANDS OPERATING UNDER THE
NASPERS BANNER (cont)
YEAR MAJOR BRANDS
2008 (cont)
Newspapers: Africa: Beeld, City Press, Daily Sun, Die Burger, Rapport, Soccer Laduuuuuma!, Son, Sondag, Sunday Sun, The Witness, Volksblad and various community newspapers. China: Beijing Youth Daily, Titan Zhou Bao
Magazines: Africa: COSMOPOLITAN, Destiny, Drum, Fairlady, Femina, FHM, Finweek, heat, HUISgenoot, KICKOFF, Landbouweekblad, Men‟s Health, Move!, Psychologies, Real, Sarie, Sports Illustrated, Seventeen, True Love, tuis, tv24, tvplus, Twende, Weg, YOU and some 45 more. Brazil: Claudia, XAME, Nova, Ana Maria,Vejá, Viagem, Viva! and some 90 more. China: Allsports, Golf Digest China, MILK, Outside, SLAM, Soccer Weekly, Yoga Journal
Printing: Paarl Gravure, Paarl Media, Paarl Print, Paarl Labels, Paarl Web, Paarl Web Gauteng, Print24
Logistics: MCS24, NLD24, NND24, On the Dot
Books: Atica & Scipione (Brazil), Collegium Botswana, Jonathan Ball Publishers, Leisure Books/Leserskring, NB Publishers, Nasou Via Afrika, Van Schaik Uitgewers
2009
Pay television: M-Net Action, AfricaMagic, AfricaMagic Plus, Big Brother, Carte Blanche, Channel O, DStv, Idols, KooWee, kykNET, MK, M-Net, M-Net Movies 1 and 2, M-Net Series, M-Net Stars, MultiChoice Africa, Oracle Airtime Sales, SuperSport, SuperSport Travel, SuperSport United Football Club
Internet: 24.com, ACL, Allegro, AlleWakacje.pl, allo, Ancestry24, Aruodas.It, Aukro, Beijing Youth Daily online, Careers24, ceneo.pl, Channel24, Compera nTime, Crossfire and Xunixian are licensed games, Dungeon & Fighter, Fin24, EDOMUS.LT, Food24, Gadu-Gadu, GoTravel24, GadunaGlos, Health24, Heureka!, ibibo, Images24, Kalahari.net, KV.EE, LIVECHAT software, mail.ru, Mobile QQ, Mobilne Gadu-Gadu, MojaGeneracja, Molotok, MWEB, MWEB (Thailand), MXit, nauka.pl, Netads24, News24, Nimbuzz, oferia.pl, OPENFM, OSTA.EE, otoDom.cz, otoMoto.pl, Qzone, PAYBACK, PayGSM, Pay U SA, platnosci, platforma iStore.pl, PracaAllegro, Property24, QQ, QXL, Ricardo, Sanook!, Skelbia.it, Sports24, Tencent, teszvesz, Titan24.com, Wheels24, Women24, qq.com QQ Dancer, QQ Doctor, QQ Download, QQ Friends, QQ eye, QQ Fantasy, QQ Game, QQ Mail, QQ Member, QQ Music, QQ Live, QQ Pinyin Input Method, 3G.QQ.com, QQ Pet, QQ San Guo, QQ Show, QQ Speed, QQ Tang, Vatera.hu, Xin‟an Evening News online
Technology: Irdeto, Cloakware, Entri
Newspapers: Beeld, City Press, Daily Sun, Die Burger, Rapport, Soccer Laduuuuuma!, Son, Sondag, Sunday Sun, Supa Strikas, Volksblad and various community newspapers. China: Beijing Youth Daily, Titan Weekly Newspaper, Xin‟an Evening News
Magazines: Destiny, DRUM, FAIRLADY, FEMINA, FHM, FINWEEK, heat, HUISgenoot, KICKOFF, Landbouweekblad, Men‟s Health, Move!, SARIE, Sports Illustrated, seventeen, TRUE LOVE, tuis, tv24, tvplus, Twende, Weg, YOU,Claudia, EXAME, Nova, Ana Maria, Vejá, Viagem, Viva!, All Sports, Golf Digest China, Soccer Weekly, Women‟s Health
Printing: Paarl Gravure, Paarl Media, Paarl Print, Paarl Labels, Paarl Web, Paarl Web Gauteng, Print24
Logistics: On the Dot
Books: Atica & Scipione (Brazil), Collegium (Botswana), Future Entrepreneurs, idem smile, Jonathan Ball Publishers, Leisure Books/Leserskring, Lux Verbi.BM, Mwajionera Publishers (Zambia), NB Publishers, Nasou Via Afrika, Stimela Publishers, Van Schaik Uitgewers
2010
Pay television: M-Net Action, AfricaMagic, AfricaMagic Plus, Big Brother, Carte Blanche, Channel O, DStv, Idols, KooWee, kykNET, MK, M-Net, M-Net Movies 1 and 2, M-Net Series, M-Net Stars, MultiChoice Africa, Oracle Airtime Sales, SuperSport, SuperSport Travel, SuperSport United Football Club
Internet: 24.com, ACL, Allegro, AlleWakacje.pl, allo, Ancestry24, Aruodas.It, Aukro, Beijing Youth Daily online, BuscaPé, Careers24, ceneo.pl, Channel24, Compera nTime, Crossfire and Xunixian (licensed games), Dungeon & Fighter, Fin24, EDOMUS.LT, Food24, Gadu-Gadu, GoTravel24, GadunaGlos, Health24, Heureka!, ibibo, Images24, Kalahari.net, Korbitec, KV.EE, Lelong, LIVECHAT software, Mail.ru, Mobile QQ, News24, Nimbuzz, oferia.pl, OPENFM, OSTA.EE, otoDom.cz, otoMoto.pl, Qzone, PAYBACK, PayGSM,
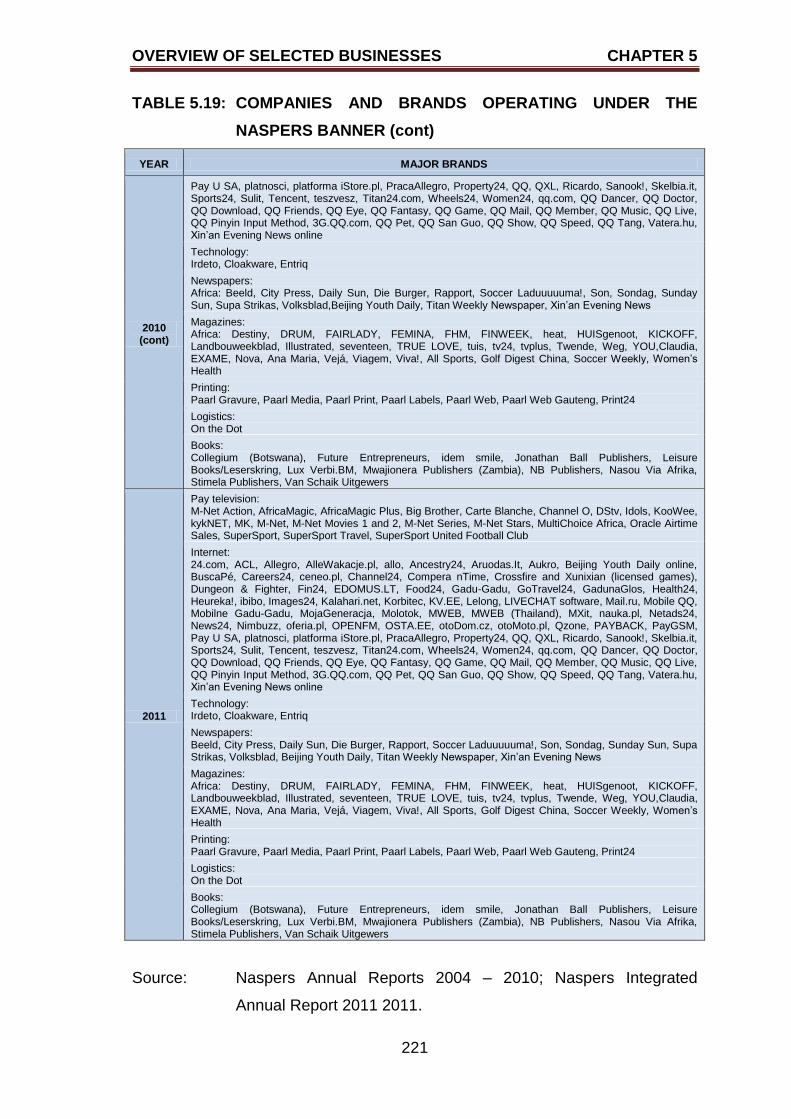
OVERVIEW OF SELECTED BUSINESSES CHAPTER 5
221
TABLE 5.19: COMPANIES AND BRANDS OPERATING UNDER THE
NASPERS BANNER (cont)
YEAR MAJOR BRANDS
2010 (cont)
Pay U SA, platnosci, platforma iStore.pl, PracaAllegro, Property24, QQ, QXL, Ricardo, Sanook!, Skelbia.it, Sports24, Sulit, Tencent, teszvesz, Titan24.com, Wheels24, Women24, qq.com, QQ Dancer, QQ Doctor, QQ Download, QQ Friends, QQ Eye, QQ Fantasy, QQ Game, QQ Mail, QQ Member, QQ Music, QQ Live, QQ Pinyin Input Method, 3G.QQ.com, QQ Pet, QQ San Guo, QQ Show, QQ Speed, QQ Tang, Vatera.hu, Xin‟an Evening News online
Technology: Irdeto, Cloakware, Entriq
Newspapers: Africa: Beeld, City Press, Daily Sun, Die Burger, Rapport, Soccer Laduuuuuma!, Son, Sondag, Sunday Sun, Supa Strikas, Volksblad,Beijing Youth Daily, Titan Weekly Newspaper, Xin‟an Evening News
Magazines: Africa: Destiny, DRUM, FAIRLADY, FEMINA, FHM, FINWEEK, heat, HUISgenoot, KICKOFF, Landbouweekblad, Illustrated, seventeen, TRUE LOVE, tuis, tv24, tvplus, Twende, Weg, YOU,Claudia, EXAME, Nova, Ana Maria, Vejá, Viagem, Viva!, All Sports, Golf Digest China, Soccer Weekly, Women‟s Health
Printing: Paarl Gravure, Paarl Media, Paarl Print, Paarl Labels, Paarl Web, Paarl Web Gauteng, Print24
Logistics: On the Dot
Books: Collegium (Botswana), Future Entrepreneurs, idem smile, Jonathan Ball Publishers, Leisure Books/Leserskring, Lux Verbi.BM, Mwajionera Publishers (Zambia), NB Publishers, Nasou Via Afrika, Stimela Publishers, Van Schaik Uitgewers
2011
Pay television: M-Net Action, AfricaMagic, AfricaMagic Plus, Big Brother, Carte Blanche, Channel O, DStv, Idols, KooWee, kykNET, MK, M-Net, M-Net Movies 1 and 2, M-Net Series, M-Net Stars, MultiChoice Africa, Oracle Airtime Sales, SuperSport, SuperSport Travel, SuperSport United Football Club
Internet: 24.com, ACL, Allegro, AlleWakacje.pl, allo, Ancestry24, Aruodas.It, Aukro, Beijing Youth Daily online, BuscaPé, Careers24, ceneo.pl, Channel24, Compera nTime, Crossfire and Xunixian (licensed games), Dungeon & Fighter, Fin24, EDOMUS.LT, Food24, Gadu-Gadu, GoTravel24, GadunaGlos, Health24, Heureka!, ibibo, Images24, Kalahari.net, Korbitec, KV.EE, Lelong, LIVECHAT software, Mail.ru, Mobile QQ, Mobilne Gadu-Gadu, MojaGeneracja, Molotok, MWEB, MWEB (Thailand), MXit, nauka.pl, Netads24, News24, Nimbuzz, oferia.pl, OPENFM, OSTA.EE, otoDom.cz, otoMoto.pl, Qzone, PAYBACK, PayGSM, Pay U SA, platnosci, platforma iStore.pl, PracaAllegro, Property24, QQ, QXL, Ricardo, Sanook!, Skelbia.it, Sports24, Sulit, Tencent, teszvesz, Titan24.com, Wheels24, Women24, qq.com, QQ Dancer, QQ Doctor, QQ Download, QQ Friends, QQ Eye, QQ Fantasy, QQ Game, QQ Mail, QQ Member, QQ Music, QQ Live, QQ Pinyin Input Method, 3G.QQ.com, QQ Pet, QQ San Guo, QQ Show, QQ Speed, QQ Tang, Vatera.hu, Xin‟an Evening News online
Technology: Irdeto, Cloakware, Entriq
Newspapers: Beeld, City Press, Daily Sun, Die Burger, Rapport, Soccer Laduuuuuma!, Son, Sondag, Sunday Sun, Supa Strikas, Volksblad, Beijing Youth Daily, Titan Weekly Newspaper, Xin‟an Evening News
Magazines: Africa: Destiny, DRUM, FAIRLADY, FEMINA, FHM, FINWEEK, heat, HUISgenoot, KICKOFF, Landbouweekblad, Illustrated, seventeen, TRUE LOVE, tuis, tv24, tvplus, Twende, Weg, YOU,Claudia, EXAME, Nova, Ana Maria, Vejá, Viagem, Viva!, All Sports, Golf Digest China, Soccer Weekly, Women‟s Health
Printing: Paarl Gravure, Paarl Media, Paarl Print, Paarl Labels, Paarl Web, Paarl Web Gauteng, Print24
Logistics: On the Dot
Books: Collegium (Botswana), Future Entrepreneurs, idem smile, Jonathan Ball Publishers, Leisure Books/Leserskring, Lux Verbi.BM, Mwajionera Publishers (Zambia), NB Publishers, Nasou Via Afrika, Stimela Publishers, Van Schaik Uitgewers
Source: Naspers Annual Reports 2004 – 2010; Naspers Integrated
Annual Report 2011 2011.
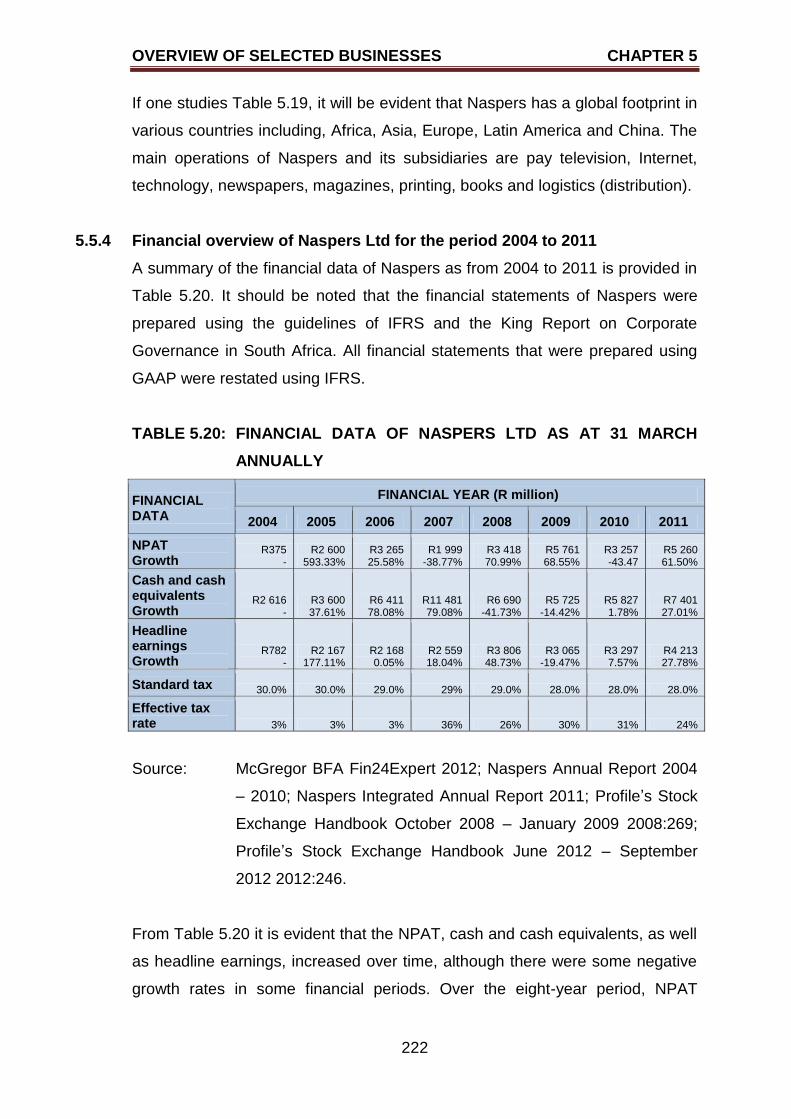
OVERVIEW OF SELECTED BUSINESSES CHAPTER 5
222
If one studies Table 5.19, it will be evident that Naspers has a global footprint in
various countries including, Africa, Asia, Europe, Latin America and China. The
main operations of Naspers and its subsidiaries are pay television, Internet,
technology, newspapers, magazines, printing, books and logistics (distribution).
5.5.4 Financial overview of Naspers Ltd for the period 2004 to 2011
A summary of the financial data of Naspers as from 2004 to 2011 is provided in
Table 5.20. It should be noted that the financial statements of Naspers were
prepared using the guidelines of IFRS and the King Report on Corporate
Governance in South Africa. All financial statements that were prepared using
GAAP were restated using IFRS.
TABLE 5.20: FINANCIAL DATA OF NASPERS LTD AS AT 31 MARCH
ANNUALLY
FINANCIAL DATA
FINANCIAL YEAR (R million)
2004 2005 2006 2007 2008 2009 2010 2011
NPAT Growth
R375 -
R2 600 593.33%
R3 265 25.58%
R1 999 -38.77%
R3 418 70.99%
R5 761 68.55%
R3 257 -43.47
R5 260 61.50%
Cash and cash equivalents Growth
R2 616 -
R3 600 37.61%
R6 411 78.08%
R11 481 79.08%
R6 690 -41.73%
R5 725 -14.42%
R5 827 1.78%
R7 401 27.01%
Headline earnings Growth
R782 -
R2 167 177.11%
R2 168 0.05%
R2 559 18.04%
R3 806 48.73%
R3 065 -19.47%
R3 297 7.57%
R4 213 27.78%
Standard tax 30.0% 30.0% 29.0% 29% 29.0% 28.0% 28.0% 28.0%
Effective tax rate 3% 3% 3% 36% 26% 30% 31% 24%
Source: McGregor BFA Fin24Expert 2012; Naspers Annual Report 2004
– 2010; Naspers Integrated Annual Report 2011; Profile‟s Stock
Exchange Handbook October 2008 – January 2009 2008:269;
Profile‟s Stock Exchange Handbook June 2012 – September
2012 2012:246.
From Table 5.20 it is evident that the NPAT, cash and cash equivalents, as well
as headline earnings, increased over time, although there were some negative
growth rates in some financial periods. Over the eight-year period, NPAT
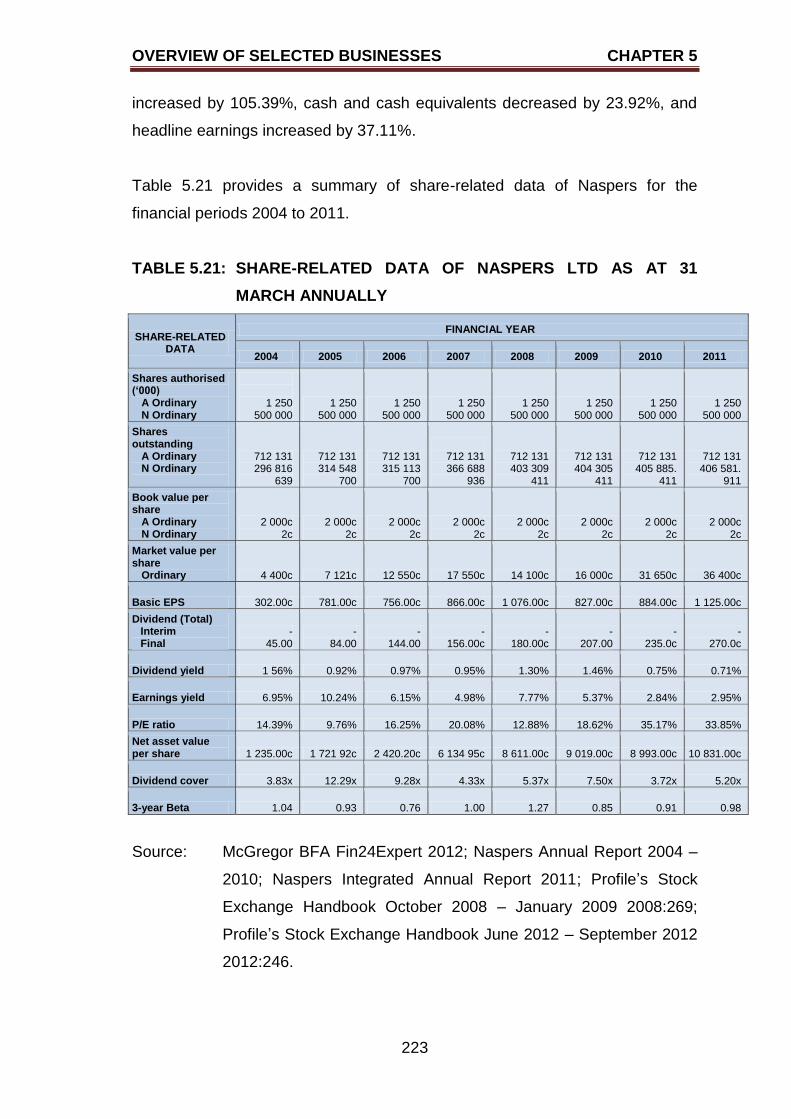
OVERVIEW OF SELECTED BUSINESSES CHAPTER 5
223
increased by 105.39%, cash and cash equivalents decreased by 23.92%, and
headline earnings increased by 37.11%.
Table 5.21 provides a summary of share-related data of Naspers for the
financial periods 2004 to 2011.
TABLE 5.21: SHARE-RELATED DATA OF NASPERS LTD AS AT 31
MARCH ANNUALLY
SHARE-RELATED DATA
FINANCIAL YEAR
2004 2005 2006 2007 2008 2009 2010 2011
Shares authorised (‘000)
A Ordinary N Ordinary
1 250 500 000
1 250 500 000
1 250 500 000
1 250 500 000
1 250 500 000
1 250 500 000
1 250 500 000
1 250 500 000
Shares outstanding
A Ordinary N Ordinary
712 131 296 816
639
712 131 314 548
700
712 131 315 113
700
712 131 366 688
936
712 131 403 309
411
712 131 404 305
411
712 131 405 885.
411
712 131 406 581.
911
Book value per share
A Ordinary N Ordinary
2 000c 2c
2 000c 2c
2 000c 2c
2 000c 2c
2 000c 2c
2 000c 2c
2 000c 2c
2 000c 2c
Market value per share
Ordinary 4 400c 7 121c 12 550c 17 550c 14 100c 16 000c 31 650c 36 400c
Basic EPS 302.00c 781.00c 756.00c 866.00c 1 076.00c 827.00c 884.00c 1 125.00c
Dividend (Total) Interim Final
- 45.00
- 84.00
- 144.00
- 156.00c
- 180.00c
- 207.00
- 235.0c
- 270.0c
Dividend yield 1 56% 0.92% 0.97% 0.95% 1.30% 1.46% 0.75% 0.71%
Earnings yield 6.95% 10.24% 6.15% 4.98% 7.77% 5.37% 2.84% 2.95%
P/E ratio 14.39% 9.76% 16.25% 20.08% 12.88% 18.62% 35.17% 33.85%
Net asset value per share 1 235.00c 1 721 92c 2 420.20c 6 134 95c 8 611.00c 9 019.00c 8 993.00c 10 831.00c
Dividend cover 3.83x 12.29x 9.28x 4.33x 5.37x 7.50x 3.72x 5.20x
3-year Beta 1.04 0.93 0.76 1.00 1.27 0.85 0.91 0.98
Source: McGregor BFA Fin24Expert 2012; Naspers Annual Report 2004 –
2010; Naspers Integrated Annual Report 2011; Profile‟s Stock
Exchange Handbook October 2008 – January 2009 2008:269;
Profile‟s Stock Exchange Handbook June 2012 – September 2012
2012:246.
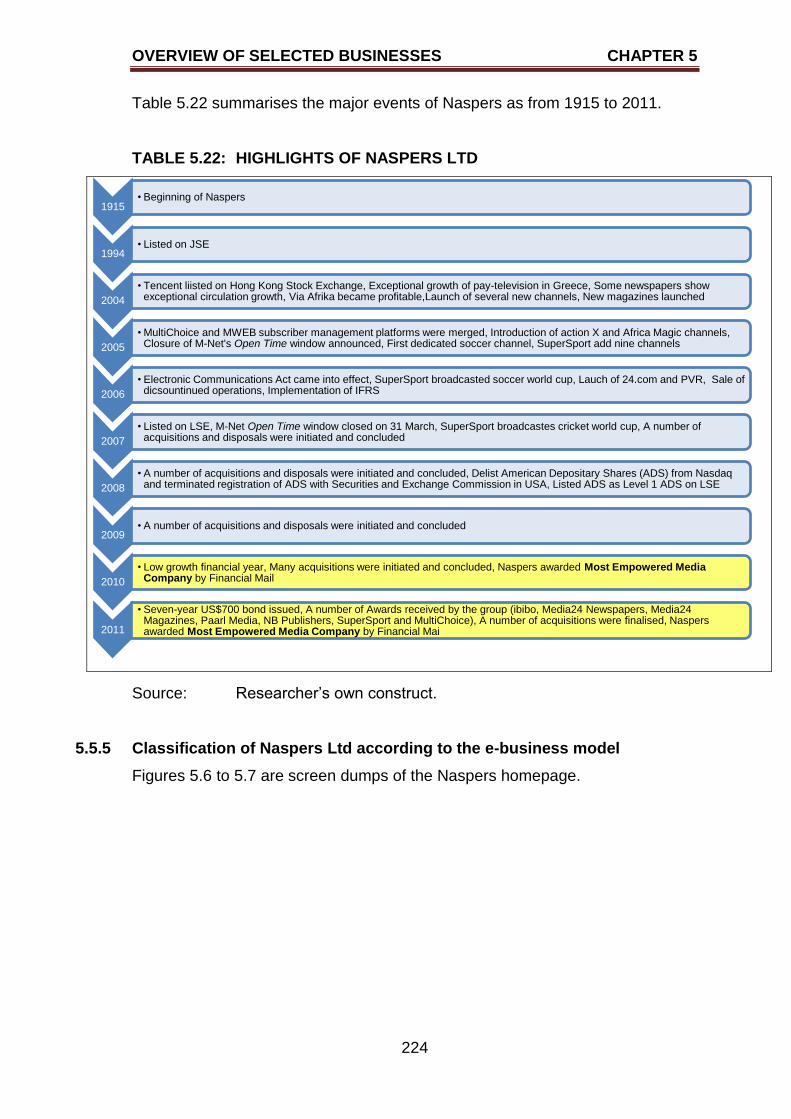
OVERVIEW OF SELECTED BUSINESSES CHAPTER 5
224
Table 5.22 summarises the major events of Naspers as from 1915 to 2011.
TABLE 5.22: HIGHLIGHTS OF NASPERS LTD
Source: Researcher‟s own construct.
5.5.5 Classification of Naspers Ltd according to the e-business model
Figures 5.6 to 5.7 are screen dumps of the Naspers homepage.
1915 • Beginning of Naspers
1994 • Listed on JSE
2004
• Tencent liisted on Hong Kong Stock Exchange, Exceptional growth of pay-television in Greece, Some newspapers show exceptional circulation growth, Via Afrika became profitable,Launch of several new channels, New magazines launched
2005
• MultiChoice and MWEB subscriber management platforms were merged, Introduction of action X and Africa Magic channels, Closure of M-Net's Open Time window announced, First dedicated soccer channel, SuperSport add nine channels
2006
• Electronic Communications Act came into effect, SuperSport broadcasted soccer world cup, Lauch of 24.com and PVR, Sale of dicsountinued operations, Implementation of IFRS
2007
• Listed on LSE, M-Net Open Time window closed on 31 March, SuperSport broadcastes cricket world cup, A number of acquisitions and disposals were initiated and concluded
2008
• A number of acquisitions and disposals were initiated and concluded, Delist American Depositary Shares (ADS) from Nasdaq and terminated registration of ADS with Securities and Exchange Commission in USA, Listed ADS as Level 1 ADS on LSE
2009 • A number of acquisitions and disposals were initiated and concluded
2010
• Low growth financial year, Many acquisitions were initiated and concluded, Naspers awarded Most Empowered Media Company by Financial Mail
2011
• Seven-year US$700 bond issued, A number of Awards received by the group (ibibo, Media24 Newspapers, Media24 Magazines, Paarl Media, NB Publishers, SuperSport and MultiChoice), A number of acquisitions were finalised, Naspers awarded Most Empowered Media Company by Financial Mai
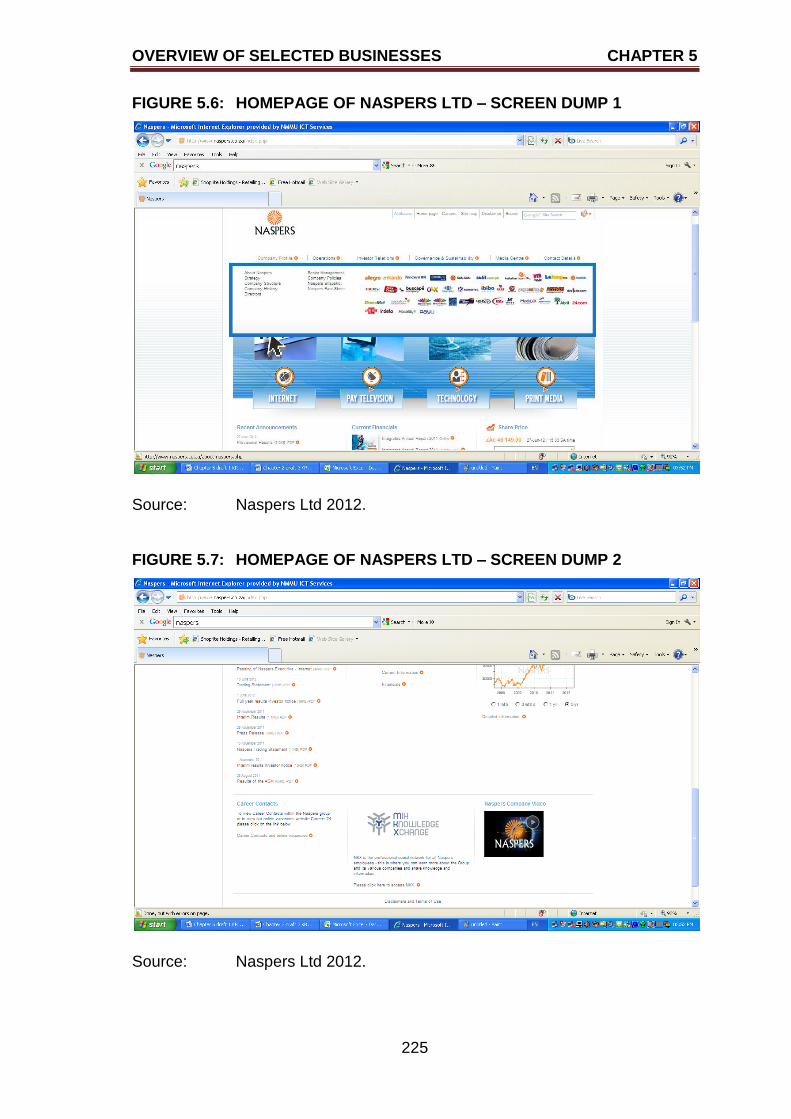
OVERVIEW OF SELECTED BUSINESSES CHAPTER 5
225
FIGURE 5.6: HOMEPAGE OF NASPERS LTD – SCREEN DUMP 1
Source: Naspers Ltd 2012.
FIGURE 5.7: HOMEPAGE OF NASPERS LTD – SCREEN DUMP 2
Source: Naspers Ltd 2012.
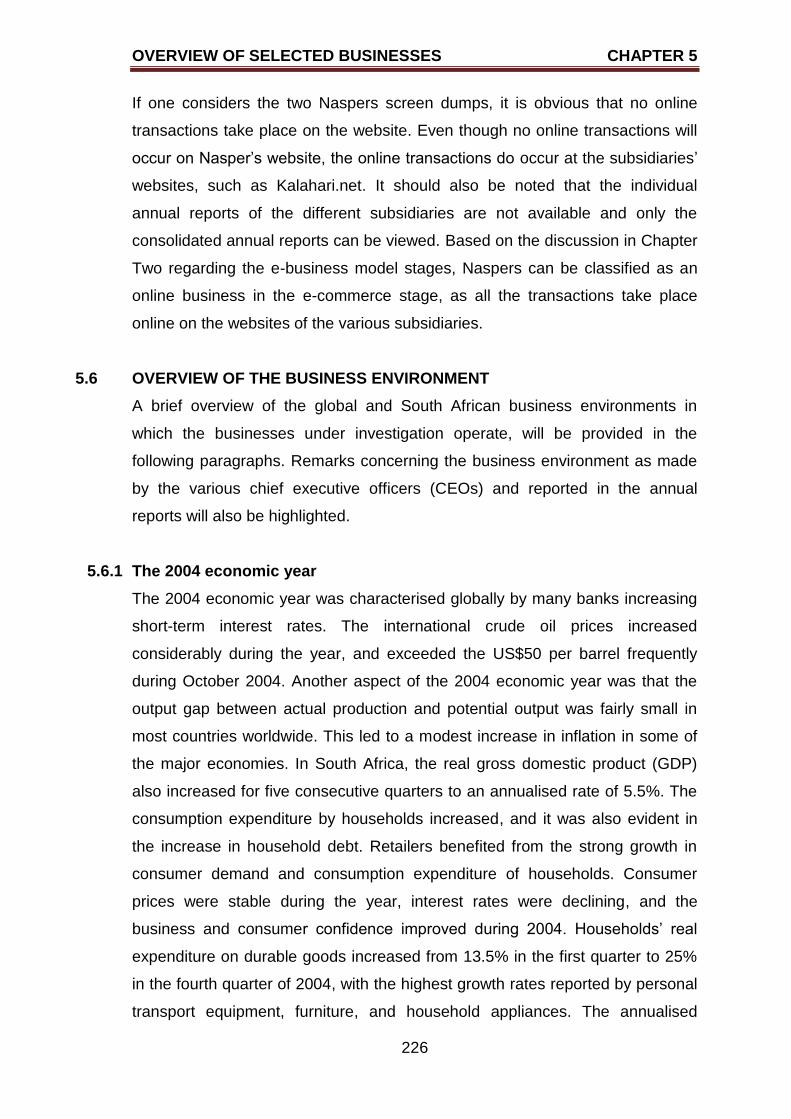
OVERVIEW OF SELECTED BUSINESSES CHAPTER 5
226
If one considers the two Naspers screen dumps, it is obvious that no online
transactions take place on the website. Even though no online transactions will
occur on Nasper‟s website, the online transactions do occur at the subsidiaries‟
websites, such as Kalahari.net. It should also be noted that the individual
annual reports of the different subsidiaries are not available and only the
consolidated annual reports can be viewed. Based on the discussion in Chapter
Two regarding the e-business model stages, Naspers can be classified as an
online business in the e-commerce stage, as all the transactions take place
online on the websites of the various subsidiaries.
5.6 OVERVIEW OF THE BUSINESS ENVIRONMENT
A brief overview of the global and South African business environments in
which the businesses under investigation operate, will be provided in the
following paragraphs. Remarks concerning the business environment as made
by the various chief executive officers (CEOs) and reported in the annual
reports will also be highlighted.
5.6.1 The 2004 economic year
The 2004 economic year was characterised globally by many banks increasing
short-term interest rates. The international crude oil prices increased
considerably during the year, and exceeded the US$50 per barrel frequently
during October 2004. Another aspect of the 2004 economic year was that the
output gap between actual production and potential output was fairly small in
most countries worldwide. This led to a modest increase in inflation in some of
the major economies. In South Africa, the real gross domestic product (GDP)
also increased for five consecutive quarters to an annualised rate of 5.5%. The
consumption expenditure by households increased, and it was also evident in
the increase in household debt. Retailers benefited from the strong growth in
consumer demand and consumption expenditure of households. Consumer
prices were stable during the year, interest rates were declining, and the
business and consumer confidence improved during 2004. Households‟ real
expenditure on durable goods increased from 13.5% in the first quarter to 25%
in the fourth quarter of 2004, with the highest growth rates reported by personal
transport equipment, furniture, and household appliances. The annualised
OVERVIEW OF SELECTED BUSINESSES CHAPTER 5
227
growth rate was then calculated to be 16%. The growth of semi-durable goods
increased at an annualised rate of 13% in the third quarter of 2004, with the
highest growth rates reported for clothing, footwear, household textiles and
furnishings. The non-durable goods and services remained during the year in
the 4% to 4.5% range. Employment in the trade, catering and accommodation
sector increased by 8.5%, while employment in the total private and total public
sectors increased by 5.3% and 4.1% respectively. Owing to the steep increase
in petrol and diesel prices, consumers curbed their expenditure on non-durable
goods, with only services showing a strong positive growth during the fourth
quarter of 2004. The international crude oil prices increased by approximately
123%, which resulted in higher domestic petrol and diesel prices; the domestic
fuel prices increased by 32.5%. The repurchase rate was reduced by 50 basis
points from 8.0% to 7.5% in August 2004, and it remained unchanged for the
remainder of the year. The ultimate result of these higher prices was that the
year-on-year Total CPIX inflation increased to 4.2% in October 2004. (Quarterly
Bulletin – March, June, September, December 2004 2004 – 2005).
Shoprite reported that the business environment had had a negative effect on
food retailing in the primary markets. Lower inflation, cheaper imported
commodities and reduced interest rates resulted in more spending on durable
and semi-durable goods, and not on food (Shoprite Holdings Limited Annual
Report 2004 2004:8). Spar reported that the retail sector as a whole had
experienced strong growth as a result of favourable exchange rates and
lowered interest rates. It was furthermore reported that the food market had not
experienced the same growth, because the food market, in general, does not
move with the shifts in the economy. The extremely low levels of inflation and
deflation for certain food categories also negatively influenced the food market
(The SPAR Group Limited Annual Report 2005 2005:11). PnP experienced
great difficulty during the 2004 financial year, but thanks to the support of their
customers, suppliers and the broader South African community, PnP was able
to recover. During the year inflation also decreased, and there was a deflation
on basic food items sold in the Score and Boxer stores. Despite the challenges,
PnP performed remarkably well. (Pick n Pay Annual Report 2004 2004:10).
Naspers performed well during the 2004 financial year which presented
OVERVIEW OF SELECTED BUSINESSES CHAPTER 5
228
favourable trading conditions. The international operations of Naspers excelled
in their performance. Growth was experienced in sub-Saharan Africa which
resulted in a satisfactory financial performance by Naspers (Naspers Annual
Report 2004 2004).
5.6.2 The 2005 economic year
The global economy experienced strong economic growth during the first three
quarters of 2005, with a real growth nearing 4.5%. The international price of
crude oil also declined drastically although the refining capacity along the cost
of the Gulf of Mexico was disrupted because of hurricanes. The South African
economy continued to expand for 24 consecutive quarters until the third quarter
of 2005. The real GDP reported an annualised growth of 5.5% in the second
quarter, but it declined to 4% in the third quarter. Reasons suggested for this
decline were the lower gold and diamond production output, the slower growth
in the manufacturing sector, and the decline in electricity production. The
annualised growth rate of the trade section was 7% in the second quarter and
6.5% in the third quarter of 2005. This is evident when considering the real final
consumption expenditure by households, which slowed to an annualised growth
rate of 6% in the third quarter. This decline was a result of a lower demand for
durable goods during this period. Consumer spending on durable goods
reported a third-quarter growth rate of 8%, with furniture, household appliances,
medical equipment, and recreational and entertainment goods showing the
highest growth. The annualised growth rate in real final consumption
expenditure by households on durable goods was 17%. The growth rate of
semi-durable goods also improved rapidly from an annualised growth rate of
13.5% in the second quarter of 2005 to 19.5% in the third quarter. The major
growth areas were vehicle tyres, parts and accessories, clothing, footwear,
household textiles, furnishings and glassware. The growth of non-durable goods
was sustained from 2004. The first three quarters of 2005 were characterised
by industrial action regarding wage disputes. Employment in the trade, catering
and accommodation sector increased by 7.8%, compared to the 0.7% increase
for the private sector in total and a 3.0% increase for the total public sector.
During 2005, the repurchase rate was reduced only once by 50 basis points in
April from 7.5% to 7.0%, and remained unchanged for the remainder of the
OVERVIEW OF SELECTED BUSINESSES CHAPTER 5
229
year. The prices of international crude oil and derivative products increased
during 2005, and the result of these higher prices was an increase in inflation.
Inflation, as measured by the CPIX, in August 2005 was 4.8%, and it declined to
4.4% in October 2005, which is in the 3% to 6% inflation target range.
(Quarterly Bulletin – March, June, September, December 2005 2005 – 2006).
Shoprite reported that there was an increase in disposable income in the lower-
income group as interest rates decreased further. Another positive aspect was
the creation of jobs, resulting in more consumers having disposable income to
spend, and consumers moving into higher lifestyle levels. Consumers also
spent more on high-margin food items and non-food products (Shoprite
Holdings Limited Annual Report 2005 2005:10). SPAR retail sales exceeded
those of the market, and SPAR also increased its market share during the 2005
financial year. The direct competition increased the number of stores nationally,
and SPAR counteracted by engaging in more extensive advertising (The SPAR
Group Limited Annual Report 2005 2005:11). PnP reported an increase in their
operating margin in a low-inflation environment (Pick n Pay Annual Report 2005
2005:14). The newspapers, magazines and printing divisions of Naspers
experienced exceptionally high growth levels in advertising. As an end result,
Naspers maintained its profitability and reported strong cash flows. (Naspers
results presentation for the financial year ended 31 March 2005 2005).
5.6.3 The 2006 economic year
The global economy indicated a slower growth in the third quarter of 2006 than
in the previous quarter. Global inflation was kept under control by the decline in
the international crude oil prices and the implementation of tighter monetary
policies. The growth rate of the South African real GDP was around 5.0%.
Factors influencing the slower growth of the real GDP included higher domestic
price levels. The growth of the secondary and tertiary sectors in South Africa
was also fairly slack because of the pressures experienced by the food
manufactures and agricultural producers. The retail sectors‟ real output also
slowed down during 2006. Consumer spending on new vehicle sales dropped
drastically, while the catering and accommodation subsectors were improving
rapidly. The real gross domestic expenditure for the first three quarters of 2006
OVERVIEW OF SELECTED BUSINESSES CHAPTER 5
230
was 7.0% higher than the corresponding 2005 quarters. Consumer spending
was curbed by a decline in consumer confidence, higher interest rates and
higher consumer prices. This is evident when considering the real final
consumption expenditure by households for durable, semi-durable and non-
durable goods, as well as for services. Expenditure by households on furniture
and household appliances increased, while expenditure on vehicles and other
personal transport equipment decreased. The wholesale and retail trade
industry reported an 18.03% increase in employment compared with the 5.6%
increase in employment for all formal sectors within the public sector. The
repurchase rate increased four times during 2006. In June 2006 the repurchase
rate increased from 7.0% to 7.5%, in August 2006 the rate increased to 8.0%
and in October 2006 the rate further increased to 8.5%. The final increase for
the year ended the repurchase rate at 9.0% after another 50 basis point
increase in December 2006. The international crude oil prices decreased
towards the end of 2006 from the high record prices of August 2006. The
targeted twelve-month rate of CPIX remained under the 6% upper boundary of
the target range for the 38th successive month, indicating that inflation would
remain under control. (Quarterly Bulletin – March, June, September, December
2006 2006 – 2007).
The durable and non-food sectors reported increased spending as consumer
confidence remained high. Numbers of middle-class earners were growing, and
disposable income also increased during 2006. This posed a challenge for
Shoprite to continuously serve this group of consumers by providing improved
product choices and an extended range of customer services (Shoprite
Holdings Limited Annual Report 2006 2006:12). SPAR experienced strong
competition during the 2006 financial year. The trading gross margin declined
slightly owing to a change from agency to direct sales delivery and a change in
the sales mix (The SPAR Group Limited Annual Report 2006 2006:5). In the low
inflation environment in which PNP operated during 2006, business was faced
with industrial action in the middle of the year. Despite the challenges of 2006,
PnP maintained to be a confident market player with a strong performance.
(Pick n Pay Annual Report 2006 2006:19). The macro economic conditions
were seen as favourable. The number of subscribers to Pay TV grew rapidly. A
OVERVIEW OF SELECTED BUSINESSES CHAPTER 5
231
large number of acquisitions were made during the year and a few business
and business units were disposed of during the year. (Naspers results
presentation for the financial year ended 31 March 2006 2006).
5.6.4 The 2007 economic year
The US market experienced great difficulty because of the sub-prime mortgage
crisis. The global economy was also severely affected by this crisis as there
was great uncertainty in the financial markets that led to higher risk premiums.
The US Federal Reserve lowered both the discount rate and the federal funds
rate to curb the negative effect of the crisis on the financial markets and on the
global economy. The real economic growth rate for South Africa for 2006 was
5.4%. The main contributors to the strong growth rate were the finance, real-
estate and business services sectors. Trade and construction also showed
healthy growth. The manufacturing sector experienced some setbacks due to
industrial action in the motor industry. The mining industry recovered owing to
more favourable international diamond and platinum prices, while the
agriculture industry had some difficulties as field crop production declined. The
agriculture industry faced severe drought conditions that hampered planting and
harvesting of grain. The commerce sector reported a lower growth in 2007 than
in 2006. Regarding the real final consumption expenditure by households, there
was also a downward trend. One reason posed for this decline was the higher
interest payments and moderate growth in property income, resulting in less
disposable income. The growth in durable goods consumption was irregular
with two of the four quarters reporting increases of 9.4% and 7.6% respectively
and two reporting decreases of 12.6% and 0.7% respectively. The employment
in the trade, catering and accommodation sectors increased by 5.7%, while the
employment of the total private sector increased by 3.6% and the total public
sector decreased by 1.0%. The repurchase rate increased from 9.0% to 11.0%
during 2007 after four consecutive increases of 50 basis points. Fuel prices also
increased owing to higher international crude oil prices. (Quarterly Bulletin –
March, June, September, December 2007 2007 – 2008).
Shoprite reported for the 2007 financial year high consumer spending on
durable and semi-durable goods, mainly on credit. The reason for buying on
OVERVIEW OF SELECTED BUSINESSES CHAPTER 5
232
credit was the lowered interest rates and the increase in disposable income of
the black middle class. (Shoprite Holdings Limited Annual Report 2007
2007:12). SPAR was faced with stiff competition during 2005 and the actual
gross margins declined by 0.2%. The decline was a result of change in the
sales mix. (The SPAR Group Limited 2007 Annual Report 2007:2). During
2008, PnP performed exceptionally well although the inflation of certain staple
food items increased rapidly to exceed the rate of inflation. PnP retailed bread
at below cost on a regular basis, and persisted in keeping basic food items at
low prices. (Pick n Pay Annual Report 2007 2007:10). The 2007 economic year
was characterised by favourable macroeconomic conditions in Naspers key
markets in which it operated. Major investments were made by Naspers during
the year. (Naspers Annual Results 2007 2007:8).
5.6.5 The 2008 economic year
The 2008 economic year was characterised by widespread losses with many
liquidity and solvency problems in the financial sectors word-wide. Some central
banks lowered their policy interest rates. Another measure taken to alleviate the
uncertainty in the financial markets and the economy, was the injection of
liquidity into money markets. The third quarter of 2008 reported the lowest
growth per quarter in ten years for South Africa. The main contributor to the
lower growth was the disruptions in the mining industry. The mining industry
experienced weaker international demand, declining commodity prices and
interruptions for maintenance, safety procedures and industrial action.
Manufacturing also declined in the third quarter of 2008, while the agriculture
sector flourished and reported a high positive growth. The real disposal income
of households was limited as the domestic economic environment was very
tight. The demand for all durable goods declined and the demand for semi-
durable goods decreased because of high food and fuel prices. Clothing and
footwear increased, while expenditure on household textiles, furnishings,
glassware, and vehicles and vehicle accessories were restricted. The
expenditure on non-durable goods was also limited by the high prices of these
goods, and expenditure declined at an annualised rate of 2.2% in the third
quarter. Employment in the trade, catering and accommodation sector
decreased by 0.1%, while the employment of the total private sector increased
OVERVIEW OF SELECTED BUSINESSES CHAPTER 5
233
by 1.4% and the total public sector decreased by 4.4%. The repurchase rate
reached 12.0% after six consecutive increases of 50 basis points after June
2007. The repurchase rate decreased by 50 basis points to end the year on
11.5%. International crude oil declined from US$146 per barrel to approximately
US$50. The year-on-year CPIX inflation reached an unprecedented high of
13.6% in August 2008 after which it declined to 12.4% in October 2008. In
October 2008 the Minister of Finance announced that the CPI would be used as
both the headline measure and the inflation target measures as of 25 February
2009. (Quarterly Bulletin – March, June, September, December 2008 2008 –
2009).
In 2008, Shoprite made staple foods more affordable for lower income earners
as increases in basic food products and higher transport costs were negatively
affecting this consumer group. Due to the particular attempt to reduce the costs
of staple foods, many consumers switched to the various brands offered by
Shoprite. (Shoprite Holdings Limited Annual Report 2008 2008:10-11). During
the second half of 2008, inflation increased sharply which resulted in lower
sales volumes. SPAR increased their national market share. Growth in the
number of stores opened was also experienced. (The SPAR Group Limited
2008 Annual Report 2008:6). During 2008 PnP performed exceptionally well
again. Problems identified by PnP were a growing global food crisis and the
regular protests against rising prices of basic food items. Possible reasons cited
for these problems included the growing China and India economies, the
conversion to bio fuels, the drastic increases in commodity prices, the halting of
exporting food by some countries, and the lifting of import duties on basic food
items. (Pick n Pay Annual Report 2008 2008:7). Naspers experienced major
growth in the Internet and pay television sectors during 2008. The print media
was under pressure and not performing very well. (Naspers Annual Report 2008
2008:8-12).
5.6.6 The 2009 economic year
Signs of recovery in the global economy became visible during the fourth
quarter of 2009. Higher international trade volumes were reported and the
recovery of the oil-exporting and other commodity-producing countries resulted
OVERVIEW OF SELECTED BUSINESSES CHAPTER 5
234
in higher international commodity prices. Many countries started to change their
policy settings back to normal by increasing interest rates, while other countries
remained operating under the tighter controls. The South African economy
showed positive signs after three consecutive quarters of contractions. The
agricultural industry experienced some difficulty and therefore produced smaller
crops. The mining industry faced lower output levels because of industrial action
and the temporary shaft closures following accidents. The export volumes from
South Africa showed an upward trend and the international prices of precious
metal such as gold and platinum also increased. Foreign investment in South
Africa increased as investor sentiment started to turn upward. The real
consumptions of expenditure of households contracted during most of 2009 as
the recessionary conditions and uncertainty continued. The expenditure on
durable goods increased slightly by 0.5% in the third quarter, while it decreased
in the first two quarters of 2009. The year-on-year rate was -14.4%, which
indicated the low confidence level of consumers and the impact of the recession
on the economy. Semi-durable goods declined at an annualised rate of 7.2% in
the third quarter of 2009. Spending on all non-durable goods declined during
the third quarter of 2009. The number of jobs lost in the first six months of 2009
in the trade, catering and accommodation sector was 42 500 compared to
219 000 in the total private sector. The total public sector created 13 400 jobs
during the same period. The repurchase rate decreased by five consecutive 100
basis points to decline from 12.5% to 7.5%. The last decrease in 2009 was 50
basis points which ended the repurchase rate on 7.0%. The international prices
of imported commodities, including crude oil, petroleum, coal and furniture,
declined at a rate of 10.2% in October 2009. The CPI indicated a decline in
inflation by reporting a 5.9% which was the first time in 30 months within the
target inflation bracket. (Quarterly Bulletin – March, June, September,
December 2009 2009 – 2010).
South Africa was faced with its first recession in 17 years. Shoprite managed to
keep costs under control to provide basic food products at affordable prices to
lower income earners. Owing to the recession, crime levels also escalated and
therefore Shoprite had an increase in security costs (Shoprite Holdings Limited
Annual Report 2009 2009:10). SPAR reported that the 2009 financial year was
OVERVIEW OF SELECTED BUSINESSES CHAPTER 5
235
a difficult year with very strong competition in the trading environment. Despite
the difficulties faced, SPAR managed to produce strong growth in both sales
and profitability. The first six months were characterised by food inflation of
16%, while the second six months reported food inflation of 9%. SPAR recorded
group turnovers of 24.5% and 14.9% respectively for the two periods. (The
SPAR Group Limited 2009 Annual Report 2009:3). The world market was in
turmoil and the economic conditions became tighter. Although the gross
margins for PnP dropped during 2009, the business continued to perform well
under difficult economic conditions. Food prices kept on rising and the fuel and
commodity prices declined during the year. (Pick n Pay Annual Report 2009
2009:10). Although the financial year showed a global economic downturn,
Naspers as a group reported satisfactory results for the 2009 financial year.
Naspers reported a growth of 30% in revenues. Customer spending came
under pressure and customers spent more time at home. The result was that
the pay television subscriber base and the Internet segment based grew during
2009. (Naspers Annual Report 2009 2009:8).
5.6.7 The 2010 economic year
Economies globally were still recovering from the crisis well into the 2010
economic year. The emerging-market economies showed stronger growth than
the developed economies. The result of the stronger growth was that the
developed economies followed very tight fiscal controls. The euro area, Japan,
UK and US implemented very low interest rates. In the third quarter of 2010, the
South African economy decelerated slightly. This slower growth was due to
industrial action in the automotive and related industries, resulting in lower
outputs. The tertiary sector also faced industrial action. The mining industry
recovered in the third quarter of 2010 after dealing with a lengthy industrial
action and routine maintenance work on smelters that reduced the output
capacity of the industry. The agricultural sector reported improved outputs. The
trade sector showed a slower growth in the third quarter (annualised rate of
3.3%) than in the second quarter (annualised rate of 6.0%) of 2010. The major
contributor to the slower growth was the decline in vehicle sales owing to the
lack of stock resulting from industrial action. However, the catering and
accommodation industry reported strong growth as foreign visitors visited South
OVERVIEW OF SELECTED BUSINESSES CHAPTER 5
236
Africa after the FIFA World CupTM tournament ended. The real final
consumption expenditure by households increased to an annualised rate of
5.9% in the third quarter of 2010. Households spent less on durable goods as
the annualised rate decreased from 50.8% to 13.7%. The spending on semi-
durable goods declined at an annualised rate of 5.9% in the third quarter. The
non-durable goods spending increased by 2.0% although households spent
less on fuel and power as the prices of these commodities increased drastically.
Employment in the trade, catering and accommodation sector decreased by
2.2%, while employment of the total private sector also decreased by 2.3% and
the total public sector increased by 1.7%. The repurchase rate declined by 50
basis points from 7.0% to 6.5% in March 2010. Another two further 50 basis
point reductions were announced in September 2010 and November 2010,
bringing the repurchase rate down to 6.0% and 5.5% respectively. The
repurchase rate of 5.5% was the lowest since October 1980. (Quarterly Bulletin
– March, June, September, December 2010 2010 – 2011).
Shoprite reported that the 2010 financial year was a challenging economic year
for South Africa as the effect of the global economic crisis was strongly felt by
the consumers. Because of the low inflation market, retailers had to sell more
products to achieve similar results to the previous years. The disposable
income of consumers was also under pressure, and therefore competition
became fierce to convince consumers to use specific brands. (Shoprite
Holdings Ltd Annual Report 2010 2010:10). The 2010 financial year showed a
slow recovery from the global recession with low inflation and a highly
competitive environment. Despite the challenges, SPAR reported satisfactory
financial performance. Food inflation was 1% and was influenced by deflation
on basic commodities. (The SPAR Group Limited 2010 Annual Report 2010:5).
The second half of the 2010 financial year was characterised by a drastic
decline in consumer inflation, and the impact of the global recession was felt by
PnP. The interest rate cuts that were announced assisted the local economy to
limit the impact of the recession in the South African market. (Pick n Pay Annual
Report 2010 2010:6-7). Naspers faced economic challenges during the 2010
financial year and the strong rand against foreign currencies also negatively
impacted on reported results when converting amounts to rand values. The
OVERVIEW OF SELECTED BUSINESSES CHAPTER 5
237
emerging market in which Naspers operated survived the global economic
recession fairly well compared to the survival of businesses operating in the
developed economies. The 2010 results were satisfactory. During 2020,
Naspers restructured and forced retrenchments were implemented. (Naspers
Annual Report 2010 2010:16, 52, 79).
5.6.8 The 2011 economic year
The recovery of the economies continued into the 2011 economic year. The
euro area debt crisis also negatively affected the overall growth and confidence
in the global financial markets. Growth in the developing economies was
remarkable. Although tensions in the Middle East and North Africa had a
negative impact on the price of gold, the sub-Saharan Africa economies were
not exposed extensively to the problems the tensions caused. The South
African economy continued to expand well into 2010 although production in the
third quarter was hampered by industrial action in the mining and manufacturing
sectors. The results of the industrial action were work stoppages, logistical
problems and delays in plant maintenance. The electricity tariffs also increased
drastically mid-year. The trade sector experienced high growth, especially the
retail and motor trade industries. The high growth in the motor trade industry
was a result of the car rental industry upgrading and expanding their fleet. The
real final consumption expenditure by households decreased from quarter 1 to
quarter 2 from an annualised rate of 6.4% to 3.3% and then increased to an
annualised rate of 3.7% for quarter 3. Spending on durable goods by
households increased from an annualised rate of 14.1% to 17.8%, while
spending on semi-durable and non-durable goods declined drastically. Semi-
durable spending declined from an annualised rate of 12.6% in quarter 1 to
6.0% in quarter 3, while non-durable goods spending decreased from an
annualised rate of 5.4% in quarter 1 to 0.7% in quarter 3. The employment in
the trade, catering and accommodation sectors increased by 5 200 jobs, while
the employment of the total private sector increased with 48 800 jobs and the
total public sector increased with 50 300. The repurchase rate remained
unchanged at 5.5% as from November 2010. During the third quarter of 2011,
petroleum prices reached record high prices. (Quarterly Bulletin – March, June,
September, December 2011 2011 – 2012).
OVERVIEW OF SELECTED BUSINESSES CHAPTER 5
238
The disposable income of the lower income earners came under pressure as
household debt increased and essential services became more expensive.
Shoprite reported that some smaller local suppliers were struggling to survive
owing to higher input costs. Therefore Shoprite had to develop contingency
plans to source alternative suppliers if the local suppliers ceased to exist.
(Shoprite Holdings Ltd Integrated Report 2011 2011:12). Consumer spending
was under pressure and low food inflation made the 2011 financial year a
challenging one. The retail market was also a very competitive market and
despite the obstacles SPAR faced, managed to produce satisfactory annual
results. (The SPAR Group Limited 2011 Integrated Annual Report 2011:11). In
the Pick n Pay Integrated Annual Report 2011 (2011) it was stated that the
financial year 2011 was the toughest trading year in history. As a result of the
tough financial conditions, the financial results were disappointing when
compared to previous years. One of the factors hindering good performance
was the slow recovery of the economy from the global recession. Another factor
influencing the financial performance of PnP was that the retail environment
became more competitive. (Pick n Pay Integrated Annual Report 2011 2011:4,
9). Naspers performed well during the year. The emerging markets performed
better than the developed markets during the global economic downturn.
(Naspers Integrated Annual Report 2012 2012).
5.7 SUMMARY
The four Internet-based businesses that will be valued in Chapter Six were
analysed by considering their history, operational and financial overviews. The
chapter concluded with an overview of the economic conditions in South Africa
and how the four businesses were affected by the economic conditions.
Shoprite was established in 1979 to operate in the food segment, and over the
years, became a dominant player in the food retail segment. Shoprite was listed
on the JSE in 1936 using the code SHP. Spar originated in 1932 as DE SPAR
and was later renamed SPAR. SPAR is a dominant player in the food retail
segment. Spar was listed on the JSE in 2004 using the code SPP. PnP was
established by Mr Raymond Ackerman in 1968 and became a dominant player
in the food retail segment. PnP was listed on the JSE in 1968 using the code
OVERVIEW OF SELECTED BUSINESSES CHAPTER 5
239
PIK. Naspers came into existence in 1915 and grew over the years to be a
major business in the media segment. Naspers is listed on the JSE in 1994
using the code PNP.
The main conclusion regarding the economic environment was that as from
2008, the global economy went into a recession. As from 2009 the global
economy started to recover and the South African market was not desperately
affected by the global crisis.
The focus of Chapter Six will be on the valuations of the one brick-and-mortar
business with limited online presence, and the three Internet-based businesses
(two brick-and-mortar and one online) discussed. The valuations will be done
for each year as from 2004 to 2011. The aim of the valuations is to determine
whether there is a trend in the valuations of businesses at different e-business
model stages, and in doing so, to quantify the effect of e-business strategies on
the value of a business.
VALUATION OF SELECTED BUSINESSES CHAPTER 6
240
CHAPTER SIX
VALUATION OF SELECTED BUSINESSES
6.1 INTRODUCTION
Chapter Five presented an overview of the four businesses that were selected
to be valued. The overviews included an operational and financial overview over
an eight-year period, that is, from the 2004 financial year up to and including the
2011 financial year. The Internet-based business classification as used in the
study and the specific e-business model stage of each business were identified
and supported by appropriate evidence. The motivation for selecting these four
businesses was provided in Chapter Four.
The purpose of Chapter Six is to achieve one of the secondary objectives
identified in Chapter One which will assist in the attainment of the primary
objective of the study. Figure 6.1 is reproduced from Chapter One, and
illustrates the importance of this chapter in the research process.
This chapter will firstly highlight the chosen valuation approach to be used for
the valuation purpose. This will be followed by a discussion of the valuations of
Shoprite Holdings Limited, The SPAR Group Ltd, Pick n Pay Stores Ltd and
Naspers Ltd. The discussion will address the variables used in the valuation
and the valuations calculated using the FCF (DCF) approach with different risk-
free rates for single and multiple periods. The purpose of the single period
calculation is to determine what the valuation of the business will be if it existed
for that specific year only. The valuations for each financial year as from 2004 to
2011 will be presented for each business, and where possible, be linked to the
economic and business environment. A comparison of the valuations will be
done by businesses and by year. The purpose of comparisons will be to
determine whether the selected businesses managed to create tangible links
between the implemented e-business strategies and value creation.
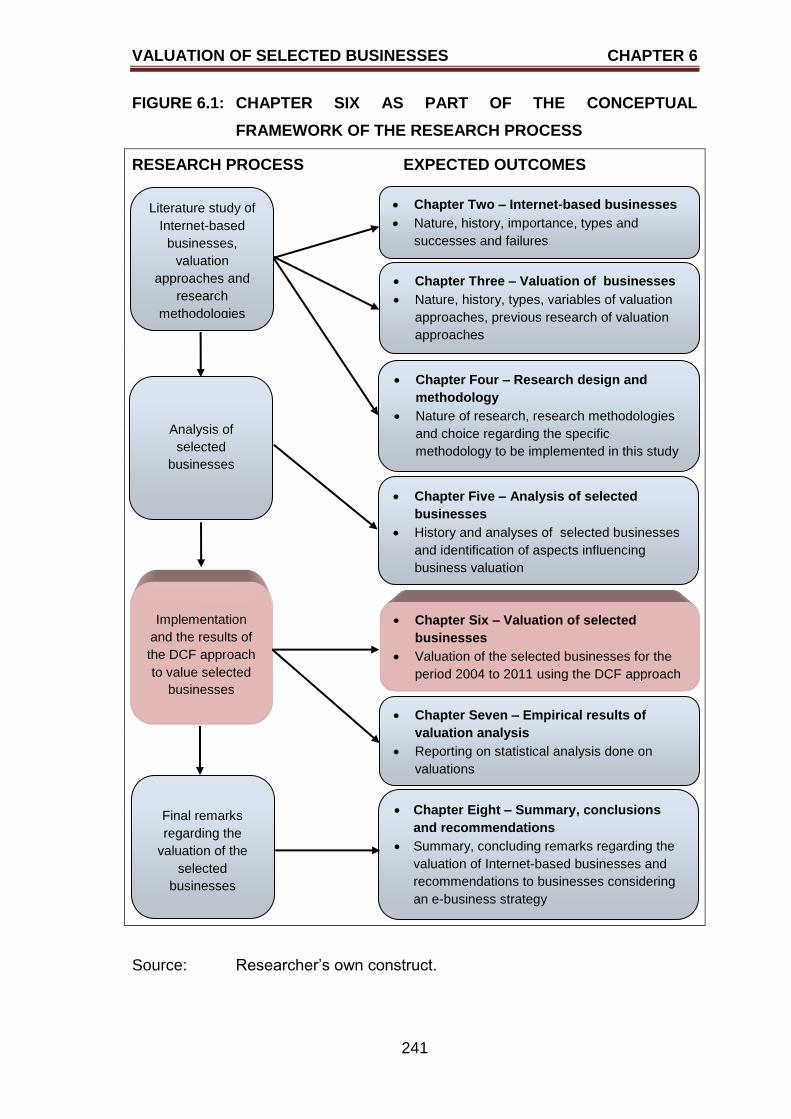
VALUATION OF SELECTED BUSINESSES CHAPTER 6
241
FIGURE 6.1: CHAPTER SIX AS PART OF THE CONCEPTUAL
FRAMEWORK OF THE RESEARCH PROCESS
RESEARCH PROCESS EXPECTED OUTCOMES
Source: Researcher‟s own construct.
Literature study of
Internet-based
businesses,
valuation
approaches and
research
methodologies
Chapter Three – Valuation of businesses
Nature, history, types, variables of valuation
approaches, previous research of valuation
approaches
Chapter Two – Internet-based businesses
Nature, history, importance, types and
successes and failures
Chapter Four – Research design and
methodology
Nature of research, research methodologies
and choice regarding the specific
methodology to be implemented in this study
Analysis of
selected
businesses
Chapter Five – Analysis of selected
businesses
History and analyses of selected businesses
and identification of aspects influencing
business valuation
Chapter Six – Valuation of selected
businesses
Valuation of the selected businesses for the
period 2004 to 2011 using the DCF approach
Implementation
and the results of
the DCF approach
to value selected
businesses
Chapter Eight – Summary, conclusions
and recommendations
Summary, concluding remarks regarding the
valuation of Internet-based businesses and
recommendations to businesses considering
an e-business strategy
Final remarks
regarding the
valuation of the
selected
businesses
Chapter Seven – Empirical results of
valuation analysis
Reporting on statistical analysis done on
valuations
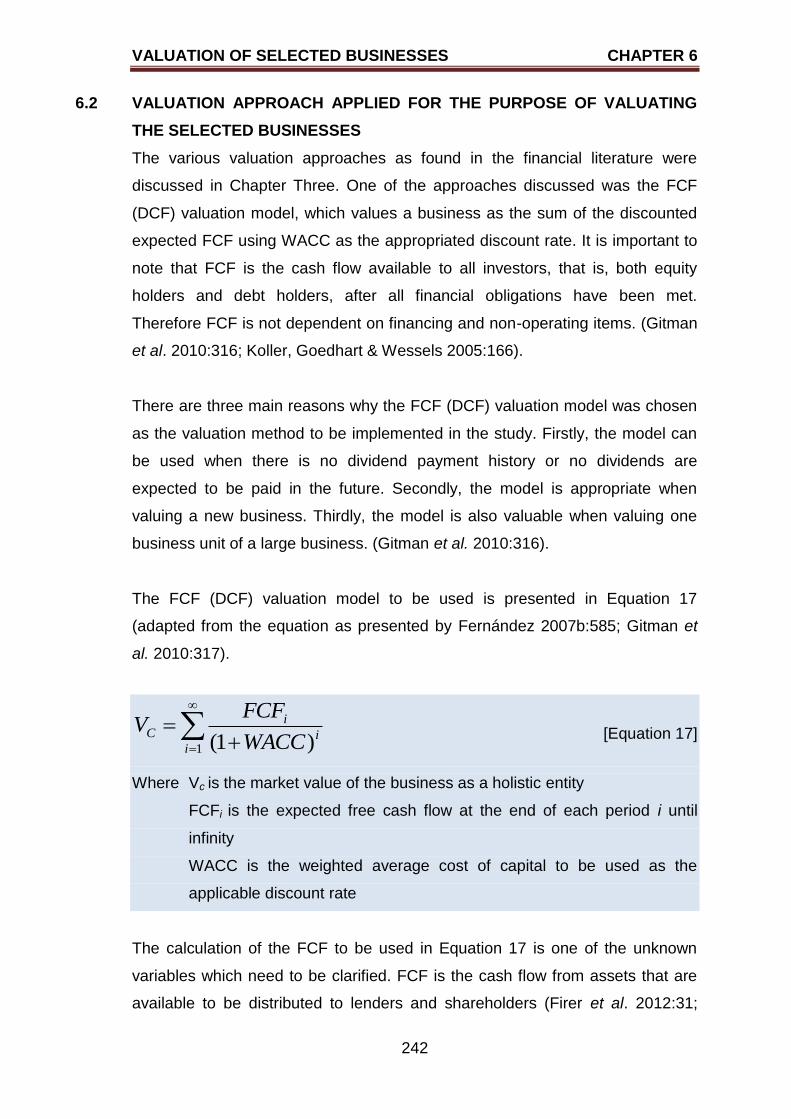
VALUATION OF SELECTED BUSINESSES CHAPTER 6
242
6.2 VALUATION APPROACH APPLIED FOR THE PURPOSE OF VALUATING
THE SELECTED BUSINESSES
The various valuation approaches as found in the financial literature were
discussed in Chapter Three. One of the approaches discussed was the FCF
(DCF) valuation model, which values a business as the sum of the discounted
expected FCF using WACC as the appropriated discount rate. It is important to
note that FCF is the cash flow available to all investors, that is, both equity
holders and debt holders, after all financial obligations have been met.
Therefore FCF is not dependent on financing and non-operating items. (Gitman
et al. 2010:316; Koller, Goedhart & Wessels 2005:166).
There are three main reasons why the FCF (DCF) valuation model was chosen
as the valuation method to be implemented in the study. Firstly, the model can
be used when there is no dividend payment history or no dividends are
expected to be paid in the future. Secondly, the model is appropriate when
valuing a new business. Thirdly, the model is also valuable when valuing one
business unit of a large business. (Gitman et al. 2010:316).
The FCF (DCF) valuation model to be used is presented in Equation 17
(adapted from the equation as presented by Fernández 2007b:585; Gitman et
al. 2010:317).
1 )1(ii
iC
WACC
FCFV [Equation 17]
Where Vc is the market value of the business as a holistic entity
FCFi is the expected free cash flow at the end of each period i until
infinity
WACC is the weighted average cost of capital to be used as the
applicable discount rate
The calculation of the FCF to be used in Equation 17 is one of the unknown
variables which need to be clarified. FCF is the cash flow from assets that are
available to be distributed to lenders and shareholders (Firer et al. 2012:31;
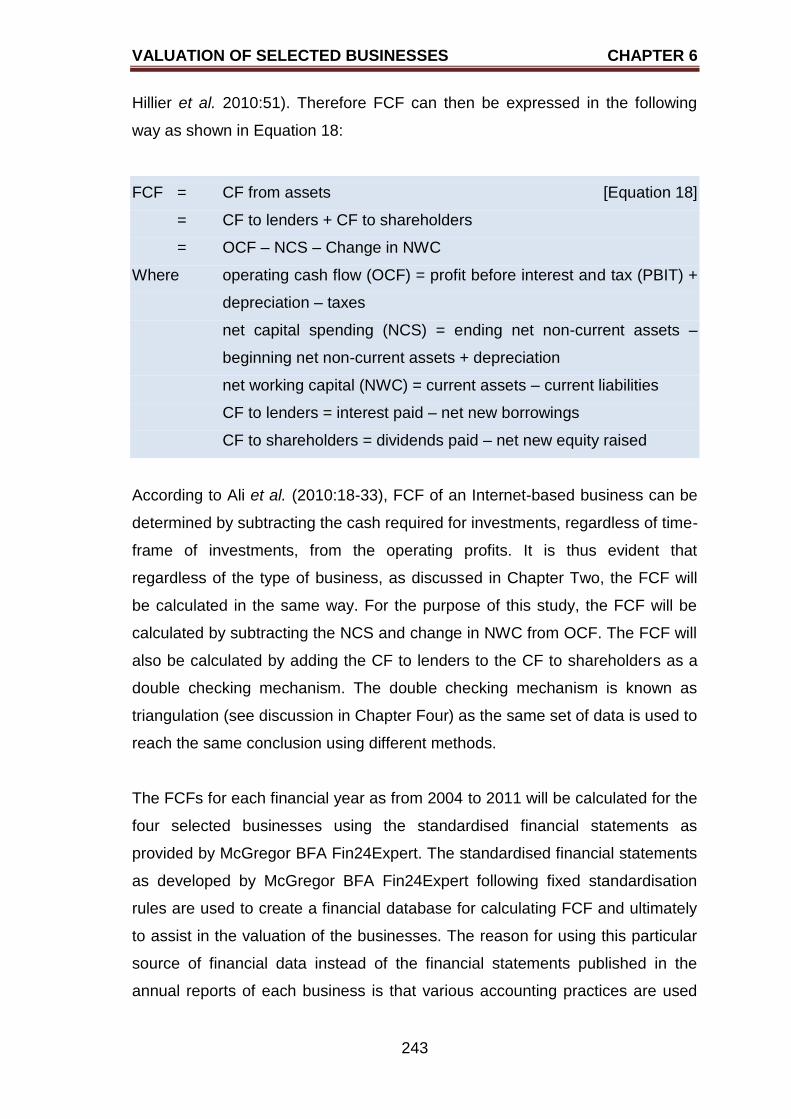
VALUATION OF SELECTED BUSINESSES CHAPTER 6
243
Hillier et al. 2010:51). Therefore FCF can then be expressed in the following
way as shown in Equation 18:
FCF = CF from assets [Equation 18]
= CF to lenders + CF to shareholders
= OCF – NCS – Change in NWC
Where operating cash flow (OCF) = profit before interest and tax (PBIT) +
depreciation – taxes
net capital spending (NCS) = ending net non-current assets –
beginning net non-current assets + depreciation
net working capital (NWC) = current assets – current liabilities
CF to lenders = interest paid – net new borrowings
CF to shareholders = dividends paid – net new equity raised
According to Ali et al. (2010:18-33), FCF of an Internet-based business can be
determined by subtracting the cash required for investments, regardless of time-
frame of investments, from the operating profits. It is thus evident that
regardless of the type of business, as discussed in Chapter Two, the FCF will
be calculated in the same way. For the purpose of this study, the FCF will be
calculated by subtracting the NCS and change in NWC from OCF. The FCF will
also be calculated by adding the CF to lenders to the CF to shareholders as a
double checking mechanism. The double checking mechanism is known as
triangulation (see discussion in Chapter Four) as the same set of data is used to
reach the same conclusion using different methods.
The FCFs for each financial year as from 2004 to 2011 will be calculated for the
four selected businesses using the standardised financial statements as
provided by McGregor BFA Fin24Expert. The standardised financial statements
as developed by McGregor BFA Fin24Expert following fixed standardisation
rules are used to create a financial database for calculating FCF and ultimately
to assist in the valuation of the businesses. The reason for using this particular
source of financial data instead of the financial statements published in the
annual reports of each business is that various accounting practices are used
VALUATION OF SELECTED BUSINESSES CHAPTER 6
244
and therefore one cannot compare the results with one another (Brummer
2010). The WACC that will be used for each calculation is calculated by
McGregor BFA Fin24Expert, and all calculations are based on the standardised
financial statements as developed by McGregor BFA Fin24Expert.
The cost of equity is calculated using CAPM with the R157 and R153
government bonds as the risk-free rate. A risk premium of 6% (range is 5% to
7% for South Africa) is used in the calculations, as suggested by Brummer
(2010). The main findings of a study conducted by Nel (2011:5339) were that
the R157 government bond was the most used bond to represent the South
African risk-free rate, and the R153 was used when the R157 was not available.
It was furthermore found that McGregor BFA was one of the top three financial
data suppliers to be used as a source of financial data. The first step in
calculating WACC is to allocate weights to equity and debt according to the
optimum financing structuring. These weights are then multiplied with the
market value of the equity and debt respectively and the multiplications are then
summed. (Nel 2011:5336). A summary of the calculations of the FCF for each
of the four selected businesses can be found in Annexures A to D.
6.3 REPORTING ON VALUATION OF SHOPRITE HOLDINGS LIMITED (BRICK-
AND-MORTAR BUSINESS WITH LIMITED ONLINE PRESENCE)
A discussion of the variables that formed part of the valuations will be
presented. The discussion will be followed by the presentation of the valuations
as calculated using the DCF approach. Shoprite was classified as a brick-and-
mortar business with limited online presence, as discussed in section 5.2.5.
6.3.1 Variables for valuations of Shoprite Holdings Limited (brick-and-mortar
business with limited online presence)
Table 6.1 summarises the variables used to calculate the value of Shoprite for
each year as from 2004 to 2011. The calculation of the FCFs as presented in
Table 6.1 is shown in Annexure A. All the other variables shown in Table 6.1
were obtained from the McGregor BFA Fin24Expert.
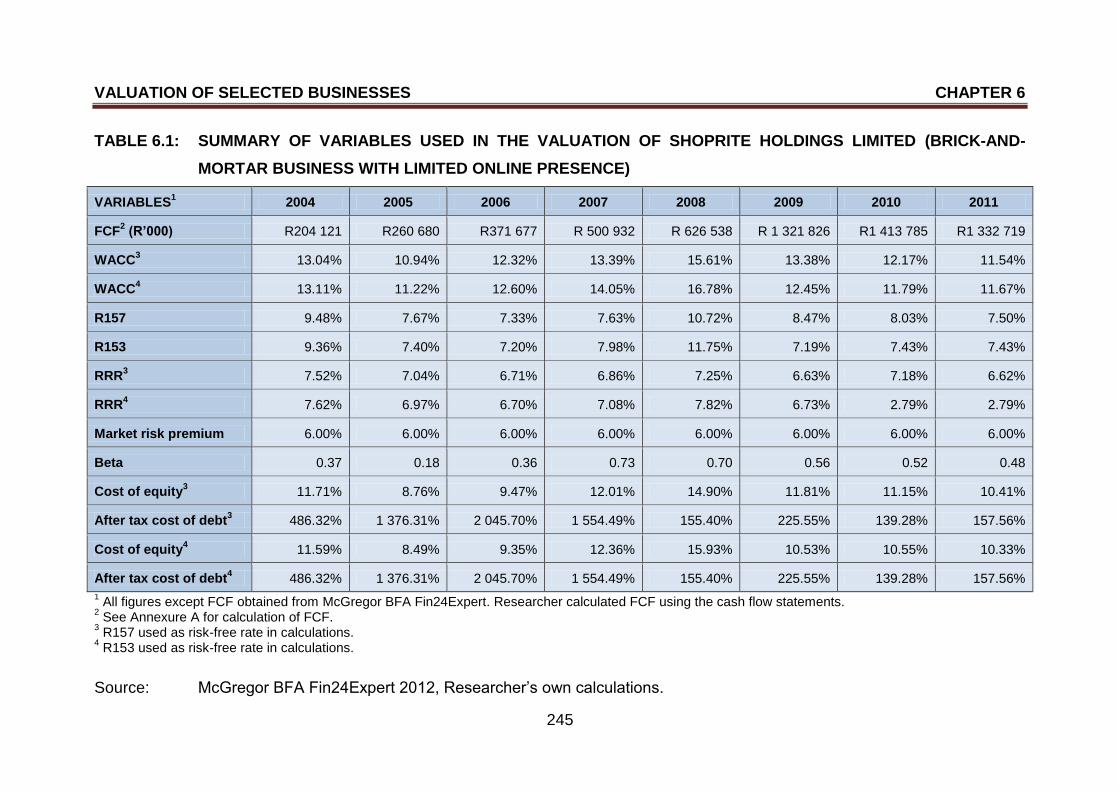
VALUATION OF SELECTED BUSINESSES CHAPTER 6
245
TABLE 6.1: SUMMARY OF VARIABLES USED IN THE VALUATION OF SHOPRITE HOLDINGS LIMITED (BRICK-AND-
MORTAR BUSINESS WITH LIMITED ONLINE PRESENCE)
VARIABLES1 2004 2005 2006 2007 2008 2009 2010 2011
FCF2 (R’000) R204 121 R260 680 R371 677 R 500 932 R 626 538 R 1 321 826 R1 413 785 R1 332 719
WACC3 13.04% 10.94% 12.32% 13.39% 15.61% 13.38% 12.17% 11.54%
WACC4 13.11% 11.22% 12.60% 14.05% 16.78% 12.45% 11.79% 11.67%
R157 9.48% 7.67% 7.33% 7.63% 10.72% 8.47% 8.03% 7.50%
R153 9.36% 7.40% 7.20% 7.98% 11.75% 7.19% 7.43% 7.43%
RRR3 7.52% 7.04% 6.71% 6.86% 7.25% 6.63% 7.18% 6.62%
RRR4 7.62% 6.97% 6.70% 7.08% 7.82% 6.73% 2.79% 2.79%
Market risk premium 6.00% 6.00% 6.00% 6.00% 6.00% 6.00% 6.00% 6.00%
Beta 0.37 0.18 0.36 0.73 0.70 0.56 0.52 0.48
Cost of equity3 11.71% 8.76% 9.47% 12.01% 14.90% 11.81% 11.15% 10.41%
After tax cost of debt3 486.32% 1 376.31% 2 045.70% 1 554.49% 155.40% 225.55% 139.28% 157.56%
Cost of equity4 11.59% 8.49% 9.35% 12.36% 15.93% 10.53% 10.55% 10.33%
After tax cost of debt4 486.32% 1 376.31% 2 045.70% 1 554.49% 155.40% 225.55% 139.28% 157.56%
1 All figures except FCF obtained from McGregor BFA Fin24Expert. Researcher calculated FCF using the cash flow statements.
2 See Annexure A for calculation of FCF.
3 R157 used as risk-free rate in calculations.
4 R153 used as risk-free rate in calculations.
Source: McGregor BFA Fin24Expert 2012, Researcher‟s own calculations.
VALUATION OF SELECTED BUSINESSES CHAPTER 6
246
A discussion of the results as presented in Table 6.1 is provided in the next
paragraphs. The FCF for Shoprite increased from R204 121 000 to
R1 332 719 000 over the eight-year period as from 2004 to 2011, which
represents a 552.91% increase in FCF. As from 2010 to 2011, the FCF
decreased by 5.73%. For the remainder of the period, that is, 2004 to 2010, the
FCF increased each year (27.71%, 42.58%, 34.78%, 25.07%, 110.97% and
6.96%). The arithmetic average growth rate of the FCF for the period 2004 to
2011 was 34.62%. The highest FCF was recorded for the 2010 financial year
(R1 413 785 000) while the lowest was recorded for the 2004 financial year
(R204 121 000). The growth of the FCF from 2008 to 2009 was the highest
(110.97%) which could be a result of the recovery of the economy from the
world recession. Other possible reasons could be the completion of the
repositioning of Checkers in the market place as Checkers moved into a higher-
income target market and Shoprite was voted as the cheapest supermarket
brand in South Africa.
The WACC using the R157 government bond as the risk-free rate ranged from
13.04% in 2004 to 11.54% in 2011. The average WACC for the eight-year
period was 12.80%. The lowest WACC of 10.94% was reported in 2005 while
the highest WACC of 15.61% was reported in 2008. The WACC using the R153
government bond as the risk-free rate ranged from 13.11% in 2004 to 11.67% in
2011. The average WACC for the eight-year period was 12.96%. The lowest
WACC of 11.22% was reported in 2005 while the highest WACC of 16.78% was
reported in 2008. One possible reason for the highest WACC reported in 2008
was that the world economy was in a recession and therefore the cost of capital
in general was exceptionally high (14.90% when using the R157 as the risk-free
rate or 15.93% when using the R153 as the risk-free rate). The WACC reported
in 2007 was the second highest over the eight-year period. A possible
explanation could be the cautionary note under which Shoprite Holdings Limited
operated for three months during 2007, the industrial action which characterised
the first quarter of 2007 and the introduction of the NCA.
The rate of return of the R157 government bond ranged from 9.48% in 2004 to
7.77% in 2011 with the lowest return of 7.33% in 2006 and the highest return of
VALUATION OF SELECTED BUSINESSES CHAPTER 6
247
10.72% in 2008. The average rate of return for the period 2004 to 2011 was
8.35%. The rate of return of the R153 government bond ranged from 9.36% in
2004 to 7.43% in 2011. The average rate of return for the eight-year period was
8.22%. The lowest rate of return of 7.19% was reported in 2009 while the
highest return of 11.75% was reported in 2008. Once again, the world recession
can be regarded as the main contributor to the higher returns during 2008.
The required rate of return ranged from 7.52% in 2004 to 6.62% in 2011 when
using the R157 government bond as the risk-free rate of return. The average
required rate of return was 6.98%. The highest required rate of return was
recorded in 2004 (7.52%) while the lowest was recorded in 2011 (6.62%). The
required rate of return ranged from 7.62% in 2004 to 2.79% in 2011 when using
the R153 government bond as the risk-free rate of return. The average required
rate of return was 6.06%. The highest required rate of return was recorded in
2008 (7.82%) while the lowest required rates of return were recorded in 2010
and 2011 (both were 2.79%). The global financial environment was in extreme
turmoil in 2008 and therefore the higher required rate of return during the 2008
financial year.
If one considers the volatility of Shoprite as measured by beta (β), Shoprite was
not as volatile as the market as it was less than one (β < 1). Beta is the
measurement to determine the sensitivity of a security to the movements in the
market portfolio (Hillier et al. 2010:280). The lowest beta of 0.18 was recorded
in 2005 while the highest beta of 0.73 was recorded in 2007. The higher beta
values of 0.73, 0.70 and 0.56 were recorded during the world recession and the
recovery period thereafter. During the world economic recovery it can be noted
that the beta was declining to lower levels as it declined from 0.73 in 2007 to
0.70, 0.56, 0.52 and 0.48 for the years 2008, 2009, 2010 and 2011 respectively.
Therefore an investment in Shoprite became less sensitive to the movements in
the market as from 2007, although it has not yet reached the low betas as
recorded in 2004 (0.37), 2005 (0.18) and 2006 (0.36). The early signs of the
world recession could have led to the higher than normal beta recorded for
2007 of 0.73. Other factors that might have influenced the betas include the
global food shortages and higher inflation and fuel prices during 2008, and the
VALUATION OF SELECTED BUSINESSES CHAPTER 6
248
investigation into the major food-retail chains by the Competition Commission
during 2009. Factors that might have assisted in stabilising the betas as from
2008 include the completion of the repositioning of Checkers, the naming of
Shoprite as the cheapest brand in South Africa, and winning several awards
over the last few years.
The cost of equity ranged from 11.71% in 2004 to 10.41% in 2011 when using
the R157 government bond as the risk-free rate of return. The cost of equity
was therefore cheaper in 2011 than in 2004. The lowest cost of equity was
recorded in 2005 (8.76%) and the highest cost of equity was recorded in 2008
(14.90%). The average cost of equity for the 2004 to 2011 period was 11.28%.
The cost of equity ranged from 11.59% in 2004 to 10.33% in 2011 when using
the R153 government bond as the risk-free rate of return. The cost of equity
was therefore cheaper in 2011 than in 2004. The lowest cost of equity was
recorded in 2005 (8.49%) and the highest cost of equity was recorded in 2008
(15.93%). The average cost of equity for the 2004 to 2011 period was 11.14%.
During the 2007 and 2008 financial years equity was very expensive, with the
2008 financial year being the most expensive year to obtain equity, regardless
of which one of the two risk-free rates was used. The high cost of equity could
have resulted from the world recession and the turmoil in the financial
environment. Other explanations could include the industrial actions during the
first quarter of 2007, the introduction of the NCA, and the cautionary notice
under which Shoprite Holdings Limited operated for three months during 2007.
The after-tax cost of debt ranged from 486.32% in 2004 to 157.56% in 2011. As
the risk-free rate has no effect on the cost of debt, the after-tax cost of debt
when using the R157 and R153 government bonds as risk-free rates does not
differ. The after-tax cost of debt of Shoprite for the period 2004 to 2011 was
very high, with exceptionally high after-tax cost of debt recorded in 2005
(1 376.31%), 2006 (2 045.70%) and 2007 (1 554.49%). The lowest cost of debt
was recorded in 2010 (139.28%). The average after-tax cost of debt for the
2004 to 2011 period was 767.58%. The applicable South African tax rate was
30% for the 2004 and 2005 financial years, 29% for the 2006, 2007 and 2008
financial years and 28% for the 2009, 2010 and 2011 financial years.
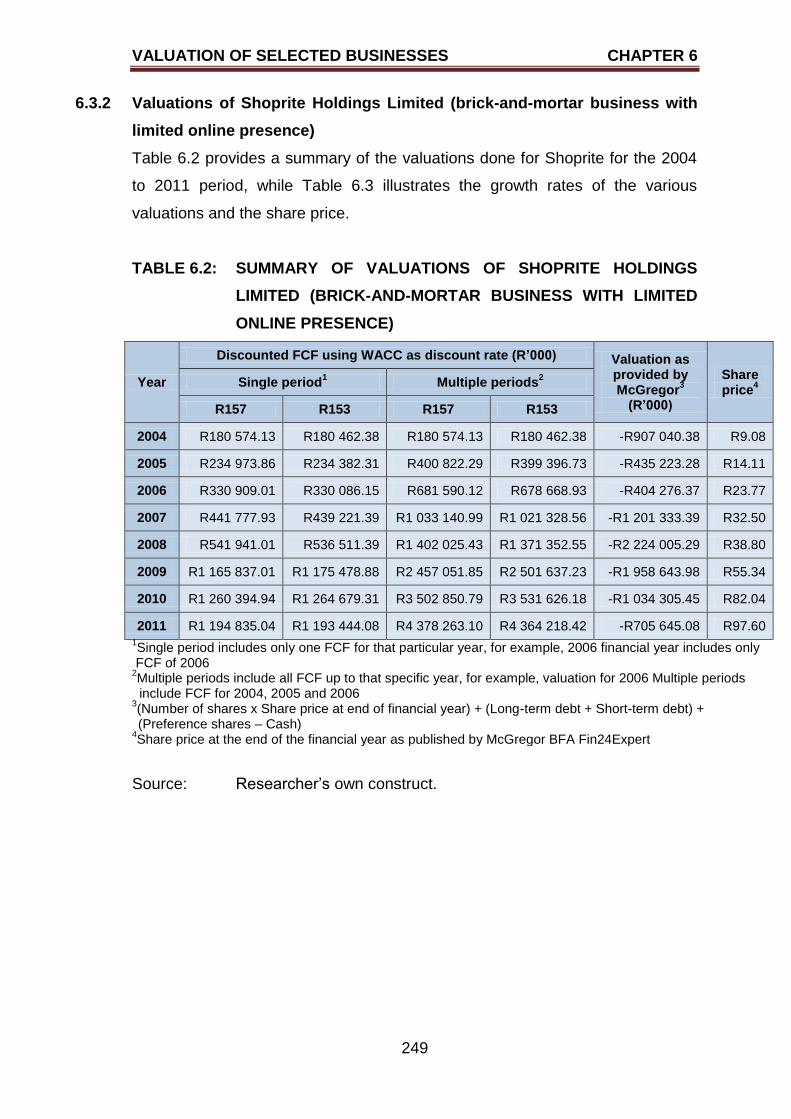
VALUATION OF SELECTED BUSINESSES CHAPTER 6
249
6.3.2 Valuations of Shoprite Holdings Limited (brick-and-mortar business with
limited online presence)
Table 6.2 provides a summary of the valuations done for Shoprite for the 2004
to 2011 period, while Table 6.3 illustrates the growth rates of the various
valuations and the share price.
TABLE 6.2: SUMMARY OF VALUATIONS OF SHOPRITE HOLDINGS
LIMITED (BRICK-AND-MORTAR BUSINESS WITH LIMITED
ONLINE PRESENCE)
Year
Discounted FCF using WACC as discount rate (R’000) Valuation as provided by McGregor
3
(R’000)
Share price
4
Single period1 Multiple periods
2
R157 R153 R157 R153
2004 R180 574.13 R180 462.38 R180 574.13 R180 462.38 -R907 040.38 R9.08
2005 R234 973.86 R234 382.31 R400 822.29 R399 396.73 -R435 223.28 R14.11
2006 R330 909.01 R330 086.15 R681 590.12 R678 668.93 -R404 276.37 R23.77
2007 R441 777.93 R439 221.39 R1 033 140.99 R1 021 328.56 -R1 201 333.39 R32.50
2008 R541 941.01 R536 511.39 R1 402 025.43 R1 371 352.55 -R2 224 005.29 R38.80
2009 R1 165 837.01 R1 175 478.88 R2 457 051.85 R2 501 637.23 -R1 958 643.98 R55.34
2010 R1 260 394.94 R1 264 679.31 R3 502 850.79 R3 531 626.18 -R1 034 305.45 R82.04
2011 R1 194 835.04 R1 193 444.08 R4 378 263.10 R4 364 218.42 -R705 645.08 R97.60 1Single period includes only one FCF for that particular year, for example, 2006 financial year includes only
FCF of 2006 2Multiple periods include all FCF up to that specific year, for example, valuation for 2006 Multiple periods
include FCF for 2004, 2005 and 2006 3(Number of shares x Share price at end of financial year) + (Long-term debt + Short-term debt) +
(Preference shares – Cash)
4Share price at the end of the financial year as published by McGregor BFA Fin24Expert
Source: Researcher‟s own construct.
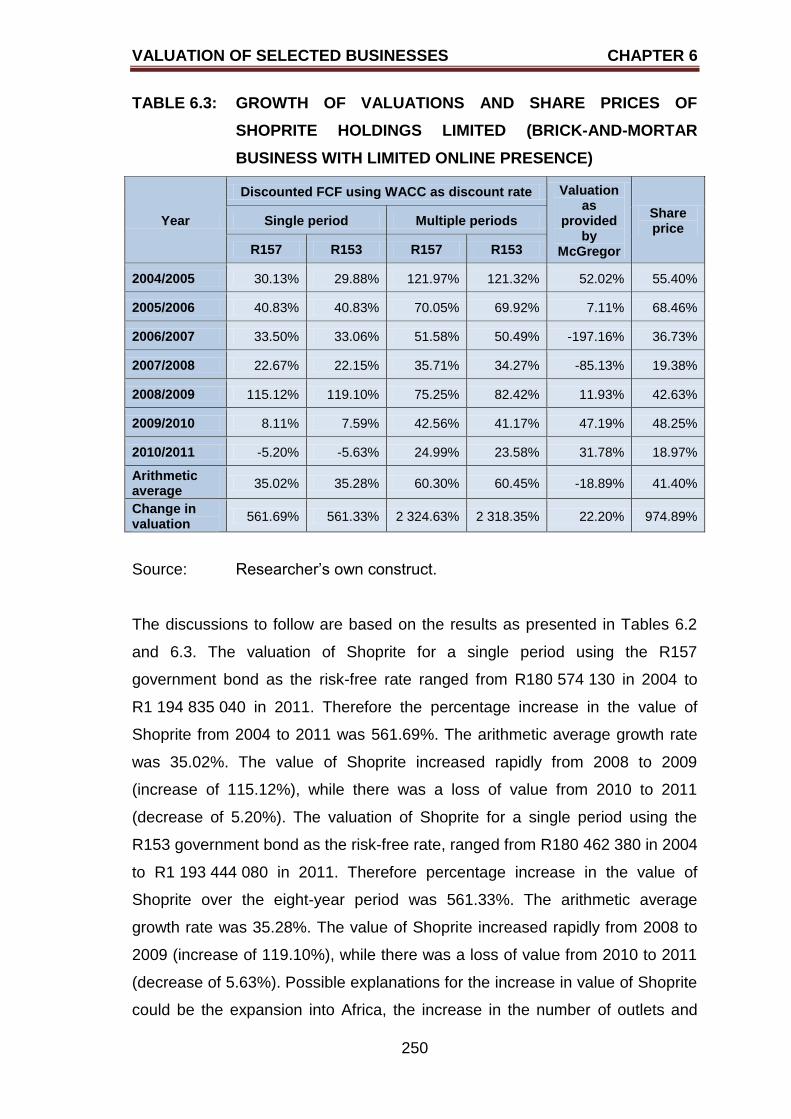
VALUATION OF SELECTED BUSINESSES CHAPTER 6
250
TABLE 6.3: GROWTH OF VALUATIONS AND SHARE PRICES OF
SHOPRITE HOLDINGS LIMITED (BRICK-AND-MORTAR
BUSINESS WITH LIMITED ONLINE PRESENCE)
Year
Discounted FCF using WACC as discount rate Valuation as
provided by
McGregor
Share price
Single period Multiple periods
R157 R153 R157 R153
2004/2005 30.13% 29.88% 121.97% 121.32% 52.02% 55.40%
2005/2006 40.83% 40.83% 70.05% 69.92% 7.11% 68.46%
2006/2007 33.50% 33.06% 51.58% 50.49% -197.16% 36.73%
2007/2008 22.67% 22.15% 35.71% 34.27% -85.13% 19.38%
2008/2009 115.12% 119.10% 75.25% 82.42% 11.93% 42.63%
2009/2010 8.11% 7.59% 42.56% 41.17% 47.19% 48.25%
2010/2011 -5.20% -5.63% 24.99% 23.58% 31.78% 18.97%
Arithmetic average
35.02% 35.28% 60.30% 60.45% -18.89% 41.40%
Change in valuation
561.69% 561.33% 2 324.63% 2 318.35% 22.20% 974.89%
Source: Researcher‟s own construct.
The discussions to follow are based on the results as presented in Tables 6.2
and 6.3. The valuation of Shoprite for a single period using the R157
government bond as the risk-free rate ranged from R180 574 130 in 2004 to
R1 194 835 040 in 2011. Therefore the percentage increase in the value of
Shoprite from 2004 to 2011 was 561.69%. The arithmetic average growth rate
was 35.02%. The value of Shoprite increased rapidly from 2008 to 2009
(increase of 115.12%), while there was a loss of value from 2010 to 2011
(decrease of 5.20%). The valuation of Shoprite for a single period using the
R153 government bond as the risk-free rate, ranged from R180 462 380 in 2004
to R1 193 444 080 in 2011. Therefore percentage increase in the value of
Shoprite over the eight-year period was 561.33%. The arithmetic average
growth rate was 35.28%. The value of Shoprite increased rapidly from 2008 to
2009 (increase of 119.10%), while there was a loss of value from 2010 to 2011
(decrease of 5.63%). Possible explanations for the increase in value of Shoprite
could be the expansion into Africa, the increase in the number of outlets and
VALUATION OF SELECTED BUSINESSES CHAPTER 6
251
additional services within South Africa, the repositioning of Checkers, the
naming of Shoprite as the cheapest supermarket in South Africa, and the
various major awards won by Shoprite Holdings Limited. The decrease in the
value of Shoprite from 2010 to 2011 could be explained by the introduction of
Wal-Mart into the South African market.
The valuation of Shoprite for multiple periods using the R157 government bond
as the risk-free rate ranged from R180 574 130 in 2004 to R4 378 263 100 in
2011. This represents a 2 324.63% increase in value for Shoprite. The
arithmetic average growth rate for the eight-year period was 60.30%. The value
of Shoprite showed steep increases of 121.97% and 75.25% for the 2004/2005
and 2008/2009 financial years respectively. The valuation of Shoprite for
multiple periods using the R153 government bond as the risk-free rate ranged
from R180 462 380 in 2004 to R4 364 218 420 in 2011. This represents a
2 318.35% increase in value for Shoprite while the arithmetic average growth
rate was 60.45% for the same eight-year period. The value of Shoprite showed
steep increases of 121.32% and 82.42% for the 2004/2005 and 2008/2009
financial years respectively. The steep increase from 2008 to 2009 in Shoprite‟s
value can be a result of the increase in the number of stores that opened during
this period and the completion of the repositioning of Checkers within the
market. Shoprite was also named the cheapest supermarket brand in South
Africa during 2008. Another possible reason can be the announcement of
Shoprite as the Top Brands survey‟s Grocery and Convenience Store category
winner, although the same or similar growth did not occur during 2010/2011
when Shoprite was voted the Most-loved brand in the country. The slow growth
of 2009/2010 could be a result of the investigation by the Competition
Commission into the major food-retail chains.
McGregor BFA Fin24Expert completed a valuation of Shoprite and the findings
resulted in negative figures. The values as obtained from the McGregor BFA
Fin24Expert ranged from -R907 040 380 in 2004 to -R705 645 080 in 2011. The
highest negative figure (R2 224 005 290) was reported for the financial year
2008. The value of Shoprite showed an increase of 22.20% over the eight-year
period, although the arithmetic average growth rate for the period 2004 to 2011
VALUATION OF SELECTED BUSINESSES CHAPTER 6
252
of 18.89% was negative. The highest percentage decrease in value occurred
from 2006 to 2007 (decrease of 197.16%) and from 2007 to 2008 (decrease of
85.13%). The other years, that is for the 2004/2005, 2005/2006, 2008/2009,
2009/2010 and 2010/2011 financial years, showed positive percentage
increases in value ranging from 7.11% (2005/2006) to 52.02% (2004/2005). The
share price of Shoprite at the end of the financial year increased from R9.08 in
2004 to R97.60 in 2011. Therefore the percentage increase in the share prices
was 974.89%. If one considers the growth rate for the share price of the eight-
year period, the arithmetic average growth rate was 41.40% with the steepest
increase of 68.46% for the 2005/2006 financial year and the lowest increase of
18.97% for the 2010/2011 financial year. It should be noted that the DCF
approach was not used to value Shoprite. The valuation approach used by
McGregor BFA Fin24Expert placed emphasis on the number of shares
outstanding, the share price at the end of the financial year, the short-term and
long-term debt (interest bearing and non-interest bearing), preference shares
outstanding and cash. Therefore the approach used by McGregor BFA
Fin24Expert did not focus on the business‟s ability to generate cash flow, which
is the focus of the DCF approach.
6.4 REPORTING ON VALUATION OF THE SPAR GROUP LTD (BRICK-AND-
CLICK BUSINESS WITH INTERACTIVE ONLINE PRESENCE)
A discussion of the variables that formed part of the valuations will be
presented. The discussion will be followed by the presentation of the valuations
as calculated using the DCF approach. SPAR was classified as a brick-and-
click business with interactive online presence, as described in section 5.3.5.
6.4.1 Variables for valuations of The SPAR Group Ltd (brick-and-click business
with interactive online presence)
Table 6.4 summarises the variables used to calculate the value of SPAR for
each year as from 2004 to 2011. The calculation of the FCFs as presented in
Table 6.4 is shown in Annexure B. All the other variables shown in Table 6.4
were obtained from the McGregor BFA Fin24Expert.
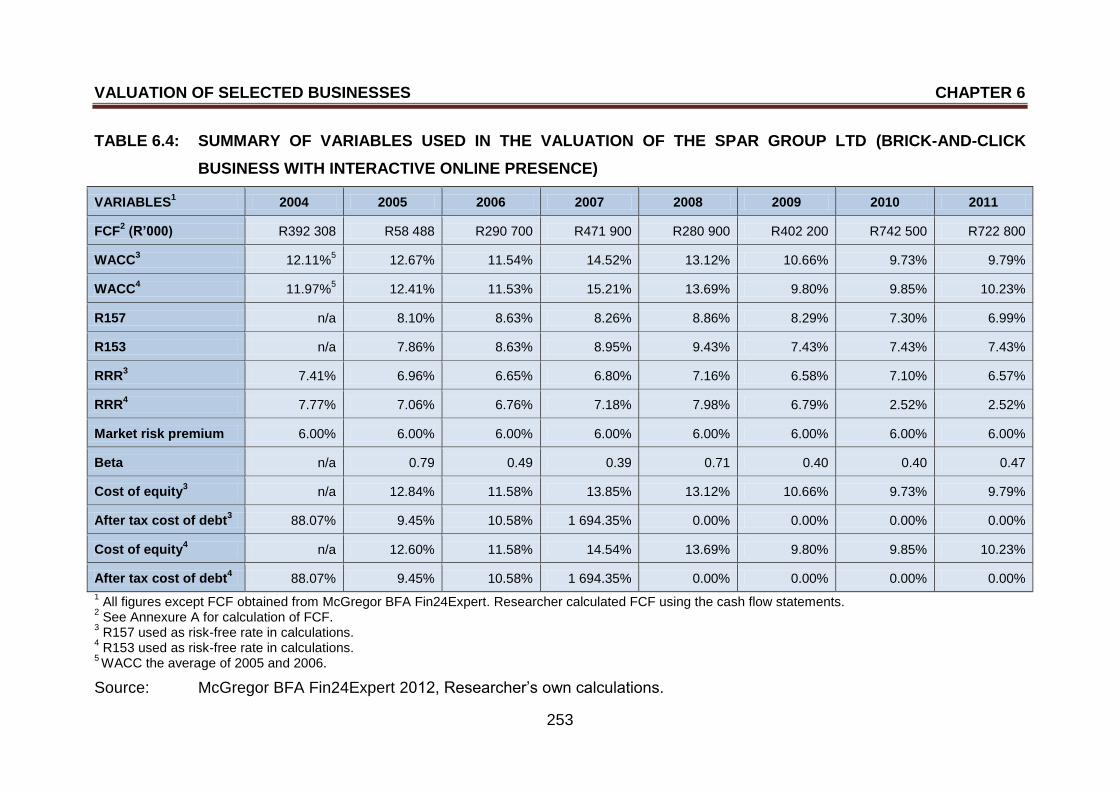
VALUATION OF SELECTED BUSINESSES CHAPTER 6
253
TABLE 6.4: SUMMARY OF VARIABLES USED IN THE VALUATION OF THE SPAR GROUP LTD (BRICK-AND-CLICK
BUSINESS WITH INTERACTIVE ONLINE PRESENCE)
VARIABLES1 2004 2005 2006 2007 2008 2009 2010 2011
FCF2 (R’000) R392 308 R58 488 R290 700 R471 900 R280 900 R402 200 R742 500 R722 800
WACC3 12.11%
5 12.67% 11.54% 14.52% 13.12% 10.66% 9.73% 9.79%
WACC4 11.97%
5 12.41% 11.53% 15.21% 13.69% 9.80% 9.85% 10.23%
R157 n/a 8.10% 8.63% 8.26% 8.86% 8.29% 7.30% 6.99%
R153 n/a 7.86% 8.63% 8.95% 9.43% 7.43% 7.43% 7.43%
RRR3 7.41% 6.96% 6.65% 6.80% 7.16% 6.58% 7.10% 6.57%
RRR4 7.77% 7.06% 6.76% 7.18% 7.98% 6.79% 2.52% 2.52%
Market risk premium 6.00% 6.00% 6.00% 6.00% 6.00% 6.00% 6.00% 6.00%
Beta n/a 0.79 0.49 0.39 0.71 0.40 0.40 0.47
Cost of equity3 n/a 12.84% 11.58% 13.85% 13.12% 10.66% 9.73% 9.79%
After tax cost of debt3 88.07% 9.45% 10.58% 1 694.35% 0.00% 0.00% 0.00% 0.00%
Cost of equity4 n/a 12.60% 11.58% 14.54% 13.69% 9.80% 9.85% 10.23%
After tax cost of debt4 88.07% 9.45% 10.58% 1 694.35% 0.00% 0.00% 0.00% 0.00%
1 All figures except FCF obtained from McGregor BFA Fin24Expert. Researcher calculated FCF using the cash flow statements.
2 See Annexure A for calculation of FCF.
3 R157 used as risk-free rate in calculations.
4 R153 used as risk-free rate in calculations.
5 WACC the average of 2005 and 2006.
Source: McGregor BFA Fin24Expert 2012, Researcher‟s own calculations.
VALUATION OF SELECTED BUSINESSES CHAPTER 6
254
It should be noted that SPAR listed on the JSE during October 2004 after the
unbundling from Tiger Brands Limited, therefore the 2004 figures and
percentages are not a true reflection of SPAR‟s performance for that specific
year. The discussion of the variables to follow will thus be either as from 2005
or 2004, depending on the applicability and availability of the information. A
discussion of the results as presented in Table 6.4 is provided in the paragraphs
to follow.
The FCF for SPAR increased from R392 308 000 to R722 800 000 over the
eight-year period as from 2004 to 2011, which represents an 84.24% increase
in FCF. For the financial years 2004/2005 and 2007/2008, the FCF decreased
by 85.09% and 40.47% respectively. There was a slight decline of 2.65% in the
FCF from 2010 to 2011. The FCF increased drastically from 2005 to 2006 by
397.03%, especially after the decline from 2004 to 2005. For the financial years
2006/2007, 2008/2009 and 2009/2010, the FCF increased by 62.33%, 43.18%
and 84.61% respectively. The arithmetic average growth rate of the FCF for the
period 2004 to 2011 was 65.56%. The highest FCF was recorded for the 2010
financial year (R742 500 000) while the lowest was recorded for the 2005
financial year (R58 488 000). It should be noted that SPAR listed on the JSE
during October 2004 after the unbundling from Tiger Brands. Therefore the first
full year for SPAR as a listed company on the JSE would be the 2005 financial
year and thus could be the reason for the low FCF for the 2005 financial year.
During the 2005 financial year, a total of 110 outlets were opened, which could
have decreased the FCF of SPAR. The greatest percentage decline in FCF was
for the 2008 financial year, which could be a result of the economic recession
and the financial instability of the world economy.
The WACC using the R157 government bond as the risk-free rate ranged from
12.11% in 2004 to 9.79% in 2011. The average WACC for the seven-year
period was 11.72%. The lowest WACC of 9.73% was reported in 2010 while the
highest WACC of 14.52% was reported in 2007. The WACC using the R153
government bond as the risk-free rate ranged from 11.97% in 2004 to 10.23% in
2011. The average WACC for the seven-year period was 12.82%. The lowest
WACC of 9.80% was reported in 2009 while the highest WACC of 15.21% was
VALUATION OF SELECTED BUSINESSES CHAPTER 6
255
reported in 2007. One possible reason for the highest WACCs reported for the
2007 and 2008 financial years was that of the turmoil in the financial world and
the start of the world economic recession. Therefore the cost of capital in
general was extraordinarily high, with WACC as 14.52% (13.12% in 2008) when
using the R157 as the risk-free rate in 2007 and 15.21% (13.69% in 2008) when
using the R153 as the risk-free rate in 2007.
The rate of return of the R157 government bond ranged from 8.10% in 2005 to
6.99% in 2011 with the lowest return of 6.99% in 2011 and the highest return of
8.86% in 2008. The average rate of return for the period 2005 to 2011 was
8.06%. The rate of return of the R153 government bond ranged from 7.86% in
2005 to 7.43% in 2011. The average rate of return for the seven-year period
was 8.17%. The lowest rate of return of 7.43% was reported for three
consecutive years, namely for the 2009, 2010 and 2011 financial years, while
the highest return of 9.43% was reported in 2008. The main contributor to the
higher returns during 2008 on the government bonds was the result of the world
recession.
The required rate of return ranged from 7.41% in 2004 to 6.57% in 2011 when
using the R157 government bond as the risk-free rate of return. The average
required rate of return for the eight-year period was 6.90% (6.83% for the period
2005 to 2011). The highest required rate of return of 7.41% was recorded in
2004 (7.16% in 2008 if the 2004 financial year is ignored) while the lowest
required rate of return of 6.57% was recorded in 2011. The required rate of
return ranged from 7.77% in 2004 to 2.52% in 2011 when using the R153
government bond as the risk-free rate of return. The average required rate of
return was 6.07% (5.83% if the 2004 financial year is ignored). The highest
required rate of return was recorded in 2008 (7.98%) while the lowest required
rates of return were recorded in 2010 and 2011 (both were 2.52%). The higher
required rate of return during the 2008 financial year could be a result of the
financial instability in the global financial environment.
If one considers the volatility of SPAR as measured by beta (β), SPAR was not
as volatile as the market as it was less than one (β < 1). Beta is the
VALUATION OF SELECTED BUSINESSES CHAPTER 6
256
measurement to determine the sensitivity of a security to the movements in the
market portfolio (Hillier et al. 2010:280). Beta ranged from 0.79 in 2005 to 0.47
in 2011. The lowest beta of 0.39 was recorded in 2006 while the highest beta of
0.79 was recorded in 2005 which was the first full year SPAR was listed on the
JSE. The second highest beta, 0.71, was recorded in 2008 and could be due to
the world recession.
The cost of equity ranged from 12.841% in 2005 to 9.79% in 2011 when using
the R157 government bond as the risk-free rate of return. The cost of equity
was therefore cheaper in 2011 than in 2005. The lowest cost of equity was
recorded in 2010 (9.73%) and the highest cost of equity was recorded in 2007
(13.85%). The average cost of equity for the 2005 to 2011 period was 11.65%.
The cost of equity ranged from 12.60% in 2005 to 10.23% in 2011 when using
the R153 government bond as the risk-free rate of return. The cost of equity
was therefore cheaper in 2011 than in 2005. The lowest cost of equity was
recorded in 2010 (9.85%) and the highest cost of equity was recorded in 2007
(14.54%). The average cost of equity for the 2004 to 2011 period was 11.76%.
During the 2007 and 2008 financial years equity was very expensive with the
2007 financial year being the most expensive year for SPAR to obtain equity,
regardless of which one of the two risk-free rates were used. The cause of the
high cost of equity could have been the world recession and the instability in the
world financial environment.
The after-tax cost of debt ranged from 9.45% in 2005 to 0.00% in 2011. The
weighting given to the cost of equity was 100% for the 2008 to 2011 financial
years as per McGregor BFA Fin24Expert, therefore no debt formed part of the
optimal capital structure for these four years. As the risk-free rate has no effect
on the cost of debt, the after-tax cost of debt when using the R157 and R153
government bonds as risk-free rates do not differ. The after-tax cost of debt of
SPAR for 2007 was exceptionally high (1 694.35%). A possible reason for the
high cost of debt was that SPAR expanded rapidly during 2007 in terms of new
outlets (SPAR, TOPS at SPAR and Built it stores), new fleet purchases,
expansion of distribution centres and increased market share. The lowest cost
of debt was recorded in 2005 (9.45%). The average after-tax cost of debt for the
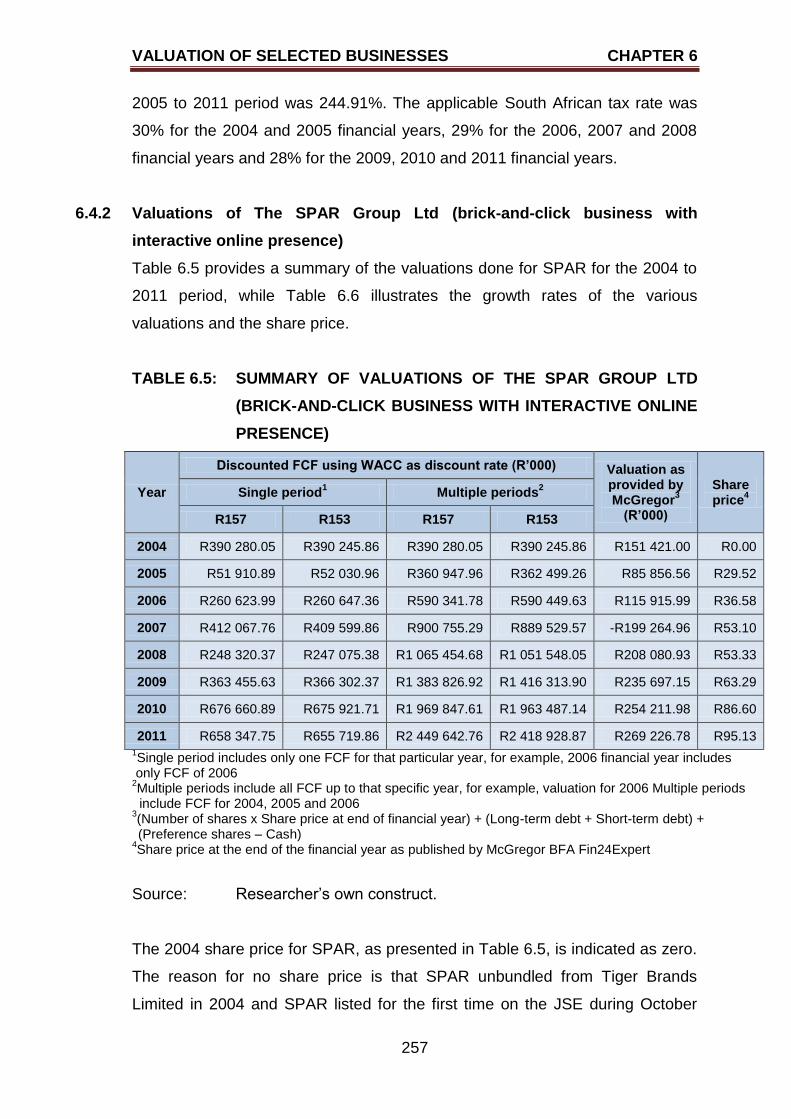
VALUATION OF SELECTED BUSINESSES CHAPTER 6
257
2005 to 2011 period was 244.91%. The applicable South African tax rate was
30% for the 2004 and 2005 financial years, 29% for the 2006, 2007 and 2008
financial years and 28% for the 2009, 2010 and 2011 financial years.
6.4.2 Valuations of The SPAR Group Ltd (brick-and-click business with
interactive online presence)
Table 6.5 provides a summary of the valuations done for SPAR for the 2004 to
2011 period, while Table 6.6 illustrates the growth rates of the various
valuations and the share price.
TABLE 6.5: SUMMARY OF VALUATIONS OF THE SPAR GROUP LTD
(BRICK-AND-CLICK BUSINESS WITH INTERACTIVE ONLINE
PRESENCE)
Year
Discounted FCF using WACC as discount rate (R’000) Valuation as provided by McGregor
3
(R’000)
Share price
4
Single period1 Multiple periods
2
R157 R153 R157 R153
2004 R390 280.05 R390 245.86 R390 280.05 R390 245.86 R151 421.00 R0.00
2005 R51 910.89 R52 030.96 R360 947.96 R362 499.26 R85 856.56 R29.52
2006 R260 623.99 R260 647.36 R590 341.78 R590 449.63 R115 915.99 R36.58
2007 R412 067.76 R409 599.86 R900 755.29 R889 529.57 -R199 264.96 R53.10
2008 R248 320.37 R247 075.38 R1 065 454.68 R1 051 548.05 R208 080.93 R53.33
2009 R363 455.63 R366 302.37 R1 383 826.92 R1 416 313.90 R235 697.15 R63.29
2010 R676 660.89 R675 921.71 R1 969 847.61 R1 963 487.14 R254 211.98 R86.60
2011 R658 347.75 R655 719.86 R2 449 642.76 R2 418 928.87 R269 226.78 R95.13 1Single period includes only one FCF for that particular year, for example, 2006 financial year includes
only FCF of 2006 2Multiple periods include all FCF up to that specific year, for example, valuation for 2006 Multiple periods
include FCF for 2004, 2005 and 2006 3(Number of shares x Share price at end of financial year) + (Long-term debt + Short-term debt) +
(Preference shares – Cash)
4Share price at the end of the financial year as published by McGregor BFA Fin24Expert
Source: Researcher‟s own construct.
The 2004 share price for SPAR, as presented in Table 6.5, is indicated as zero.
The reason for no share price is that SPAR unbundled from Tiger Brands
Limited in 2004 and SPAR listed for the first time on the JSE during October
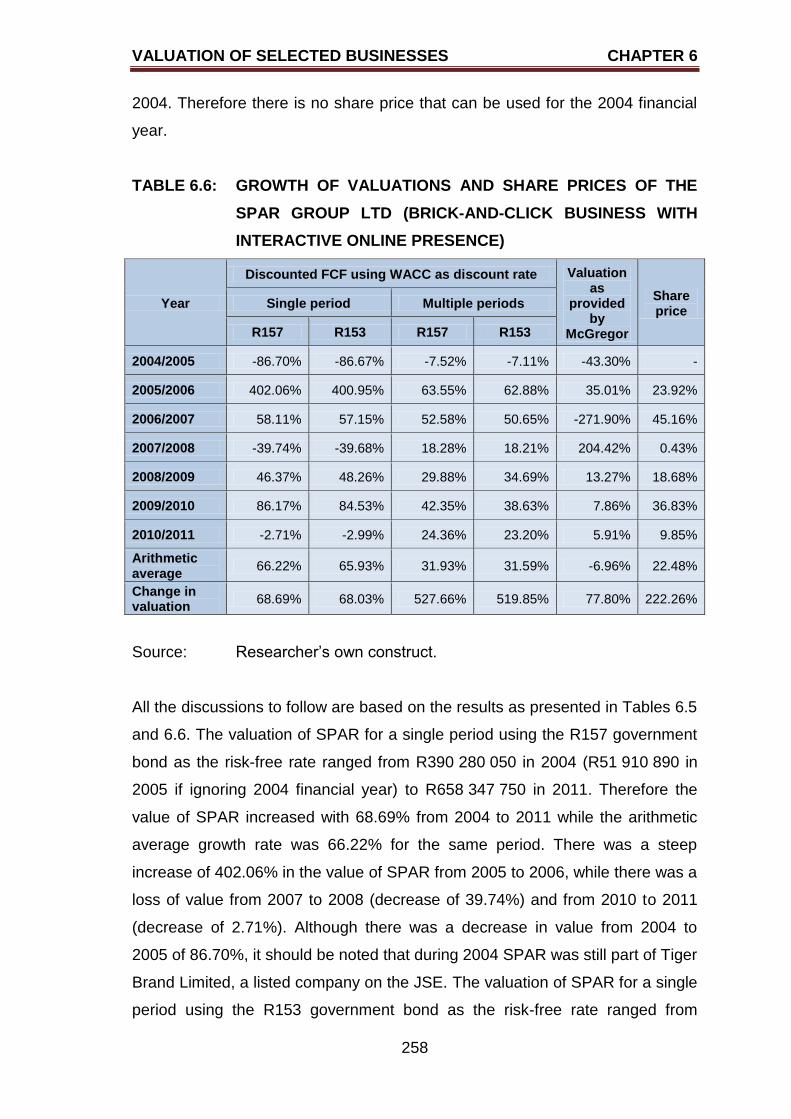
VALUATION OF SELECTED BUSINESSES CHAPTER 6
258
2004. Therefore there is no share price that can be used for the 2004 financial
year.
TABLE 6.6: GROWTH OF VALUATIONS AND SHARE PRICES OF THE
SPAR GROUP LTD (BRICK-AND-CLICK BUSINESS WITH
INTERACTIVE ONLINE PRESENCE)
Year
Discounted FCF using WACC as discount rate Valuation as
provided by
McGregor
Share price
Single period Multiple periods
R157 R153 R157 R153
2004/2005 -86.70% -86.67% -7.52% -7.11% -43.30% -
2005/2006 402.06% 400.95% 63.55% 62.88% 35.01% 23.92%
2006/2007 58.11% 57.15% 52.58% 50.65% -271.90% 45.16%
2007/2008 -39.74% -39.68% 18.28% 18.21% 204.42% 0.43%
2008/2009 46.37% 48.26% 29.88% 34.69% 13.27% 18.68%
2009/2010 86.17% 84.53% 42.35% 38.63% 7.86% 36.83%
2010/2011 -2.71% -2.99% 24.36% 23.20% 5.91% 9.85%
Arithmetic average
66.22% 65.93% 31.93% 31.59% -6.96% 22.48%
Change in valuation
68.69% 68.03% 527.66% 519.85% 77.80% 222.26%
Source: Researcher‟s own construct.
All the discussions to follow are based on the results as presented in Tables 6.5
and 6.6. The valuation of SPAR for a single period using the R157 government
bond as the risk-free rate ranged from R390 280 050 in 2004 (R51 910 890 in
2005 if ignoring 2004 financial year) to R658 347 750 in 2011. Therefore the
value of SPAR increased with 68.69% from 2004 to 2011 while the arithmetic
average growth rate was 66.22% for the same period. There was a steep
increase of 402.06% in the value of SPAR from 2005 to 2006, while there was a
loss of value from 2007 to 2008 (decrease of 39.74%) and from 2010 to 2011
(decrease of 2.71%). Although there was a decrease in value from 2004 to
2005 of 86.70%, it should be noted that during 2004 SPAR was still part of Tiger
Brand Limited, a listed company on the JSE. The valuation of SPAR for a single
period using the R153 government bond as the risk-free rate ranged from
VALUATION OF SELECTED BUSINESSES CHAPTER 6
259
R390 245 860 in 2004 (R52 030 960 in 2005 if ignoring 2004) to R655 719 860
in 2011. Therefore the value of SPAR increased with 68.03% over the eight-
year period. The arithmetic average growth rate for the same period was
65.93%. The value of SPAR increased rapidly from 2005 to 2006 (increase of
400.95%), while there was a loss of value from 2007 to 2008 (decrease of
39.68%) and from 2010 to 2011 (slight decrease of 2.99%). Possible
explanations for the increase in value of SPAR could be the increase in the
number of outlets throughout South Africa, the improvement of the various
distribution centres and the use of the new fleet vehicles. The decreases in the
value of SPAR could be a result of the world recession and the global food
shortages during 2008 and the decline in 2011 could be the effect of
competition (Wal-Mart) entering the retail market.
The valuation of SPAR for multiple periods using the R157 government bond as
the risk-free rate ranged from R390 280 050 in 2004 to R2 449 642 760 in 2011.
This represents a 527.66% increase in value for SPAR. The arithmetic average
growth rate for the eight-year period was 31.93%. The highest percentage
increase in the value of SPAR was from 2005 to 2006 (63.55%) and the lowest
percentage increase was from 2007 to 2008 (18.28%). The valuation of SPAR
for multiple periods using the R153 government bond as the risk-free rate
ranged from R390 245 860 in 2004 to R2 418 928 870 in 2011. This represents
a 519.85% increase in value for SPAR while the arithmetic average growth rate
was 31.59% for the same eight-year period. As in the case of the valuation with
the R157 government bond as the risk-free rate, the highest percentage
increase in value occurred from 2005 to 2006 (62.88%) and the lowest
percentage increase in value occurred from 2007 to 2008 (18.21%). The decline
in the value of SPAR from 2004 to 2005 was ignored as SPAR was still part of
Tiger Brand Limited for the majority of the 2004 financial year. Possible reasons
for the increase in value of SPAR could be the increase in the number of outlets
catering for various income groups country-wide in South Africa. Some of the
existing SPAR (SPAR, TOPS at SPAR and Built it) outlets also increased their
retail space over the eight-year period. SPAR also increased the market share
on a continuous basis. A number of distribution centres were streamlined to be
more efficient.
VALUATION OF SELECTED BUSINESSES CHAPTER 6
260
McGregor BFA Fin24Expert completed a valuation of SPAR and one of the
valuations resulted in a negative figure. The values as obtained from the
McGregor BFA Fin24Expert ranged from R151 421 000 in 2004 to
R269 226 780 in 2011. The value of SPAR showed an increase of 77.80% over
the eight-year period, although the arithmetic average growth rate for the period
2004 to 2011 of 6.96% was negative. The highest percentage decrease in value
occurred from 2006 to 2007 (decrease of 271.90%) and from 2004 to 2005
(decrease of 43.30%). The highest percentage increase in value occurred from
2007 to 2008 when the value increased by 204.42%. The value of SPAR was
growing from 2008 to 2011 at a diminishing rate (204.42% in 2008, 13.27% in
2009, 7.86% in 2010 and 5.91% in 2011). The share price of SPAR at the end
of the financial year increased from R29.52 in 2005 to R95.13 in 2011 which is
a 222.26% increase. If one considers the growth rate for the share price of the
seven-year period (2005 to 2011), the arithmetic average growth rate was
22.48% with the steepest increase of 45.16% for the 2006/2007 financial year
and the lowest increase of 0.43% for the 2007/2008 financial year. It should be
noted that the DCF approach was not used to value SPAR. The valuation
approach used by McGregor BFA Fin24Expert placed emphasis on the number
of shares outstanding, the share price at the end of the financial year, the short-
term and long-term debt (interest bearing and non-interest bearing), preference
shares outstanding and cash. Therefore the approach used by McGregor BFA
Fin24Expert did not focus on the business‟s ability to generate cash flow, which
is the focus of the DCF approach.
VALUATION OF SELECTED BUSINESSES CHAPTER 6
261
6.5 REPORTING ON VALUATION OF PICK N PAY STORES LTD (BRICK-AND-
CLICK BUSINESS IN THE E-COMMERCE STAGE)
A discussion of the variables that formed part of the valuations will be
presented. The discussion will be followed by the presentation of the valuations
as calculated using the DCF approach. According to section 5.4.5, PnP is
classified as a brick-and-click business in the e-commerce stage.
6.5.1 Variables for valuations of Pick n Pay Stores Ltd (brick-and-click business
in the e-commerce stage)
Table 6.7 summarises the variables used to calculate the value of PnP for each
year as from 2004 to 2011. The calculation of the FCFs as presented in Table
6.7 is shown in Annexure C. All the other variables shown in Table 6.7 were
obtained from the McGregor BFA Fin24Expert.
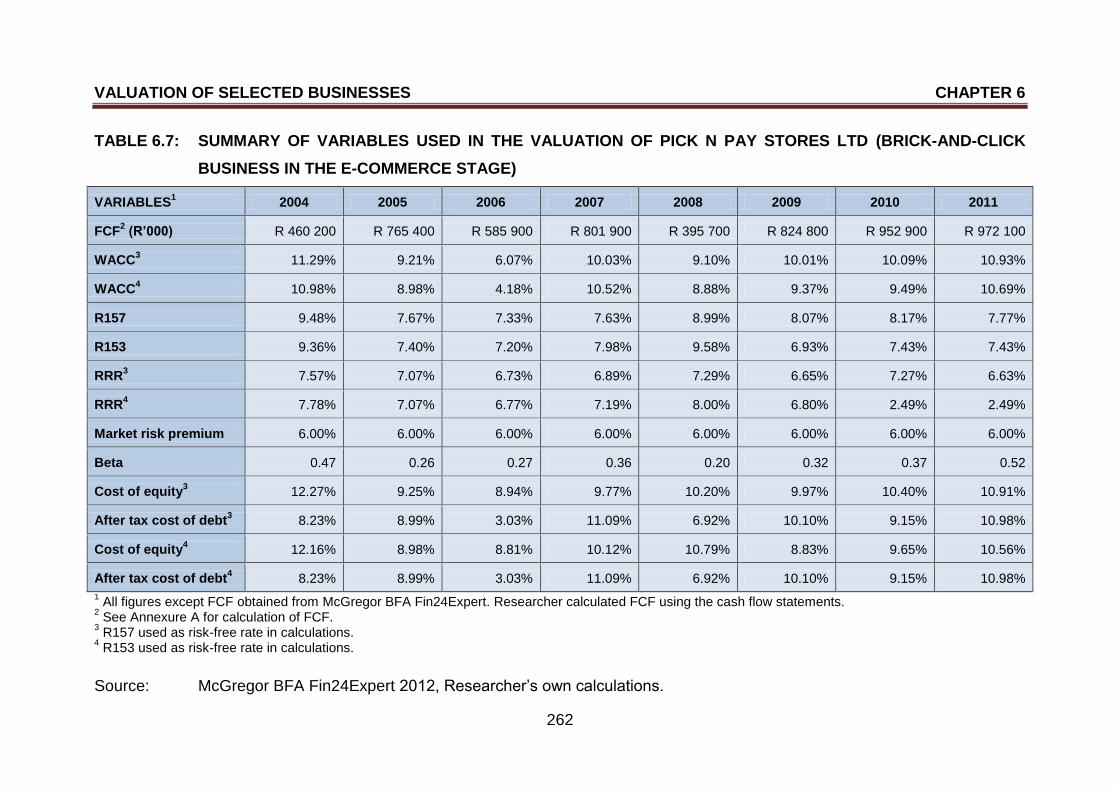
VALUATION OF SELECTED BUSINESSES CHAPTER 6
262
TABLE 6.7: SUMMARY OF VARIABLES USED IN THE VALUATION OF PICK N PAY STORES LTD (BRICK-AND-CLICK
BUSINESS IN THE E-COMMERCE STAGE)
VARIABLES1 2004 2005 2006 2007 2008 2009 2010 2011
FCF2 (R’000) R 460 200 R 765 400 R 585 900 R 801 900 R 395 700 R 824 800 R 952 900 R 972 100
WACC3 11.29% 9.21% 6.07% 10.03% 9.10% 10.01% 10.09% 10.93%
WACC4 10.98% 8.98% 4.18% 10.52% 8.88% 9.37% 9.49% 10.69%
R157 9.48% 7.67% 7.33% 7.63% 8.99% 8.07% 8.17% 7.77%
R153 9.36% 7.40% 7.20% 7.98% 9.58% 6.93% 7.43% 7.43%
RRR3 7.57% 7.07% 6.73% 6.89% 7.29% 6.65% 7.27% 6.63%
RRR4 7.78% 7.07% 6.77% 7.19% 8.00% 6.80% 2.49% 2.49%
Market risk premium 6.00% 6.00% 6.00% 6.00% 6.00% 6.00% 6.00% 6.00%
Beta 0.47 0.26 0.27 0.36 0.20 0.32 0.37 0.52
Cost of equity3 12.27% 9.25% 8.94% 9.77% 10.20% 9.97% 10.40% 10.91%
After tax cost of debt3 8.23% 8.99% 3.03% 11.09% 6.92% 10.10% 9.15% 10.98%
Cost of equity4 12.16% 8.98% 8.81% 10.12% 10.79% 8.83% 9.65% 10.56%
After tax cost of debt4 8.23% 8.99% 3.03% 11.09% 6.92% 10.10% 9.15% 10.98%
1 All figures except FCF obtained from McGregor BFA Fin24Expert. Researcher calculated FCF using the cash flow statements.
2 See Annexure A for calculation of FCF.
3 R157 used as risk-free rate in calculations.
4 R153 used as risk-free rate in calculations.
Source: McGregor BFA Fin24Expert 2012, Researcher‟s own calculations.
VALUATION OF SELECTED BUSINESSES CHAPTER 6
263
A discussion of the results as presented in Table 6.7 is given in the following
paragraphs. Table 6.7 showed that the FCF for PnP increased by 111.23%, that
is as from R460 200 000 in 2004 to R972 100 000 in 2011. There was a decline
in the FCF from 2005 to 2006 (decrease of 23.45%) and from 2007 to 2008
(decrease of 50.65%). For the other financial years positive FCF growth were
reported ranging from 2.01% to 108.44%. The arithmetic average growth rate of
the FCF for the period 2004 to 2011 is 22.15%. The highest FCF was recorded
for the 2011 financial year (R972 100 000) while the lowest was recorded for
the 2008 financial year (R395 700 000). The lowest FCF growth was reported
for the 2007/2008 financial year (decrease of 50.65%) which could be a result of
the start of the world financial crisis. The growth of the FCF from 2008 to 2009
was the highest (108.44%) which could be a result of the recovery of the
economy from the world recession. The disposal of the Franklin stores did not
have an impact on the FCF of PnP.
The WACC using the R157 government bond as the risk-free rate ranged from
11.29% in 2004 to 10.93% in 2011. The average WACC for the eight-year
period was 9.59%. The lowest WACC of 6.07% was reported in 2006 while the
highest WACC of 11.29% was reported in 2004. The WACC using the R153
government bond as the risk-free rate ranged from 10.98% in 2004 to 10.69% in
2011. The average WACC for the eight-year period was 9.14%. The lowest
WACC of 4.18% was reported in 2006 while the highest WACC of 10.98% was
reported in 2004.
The rate of return of the R157 government bond ranged from 9.48% in 2004 to
7.77% in 2011 with the lowest return of 7.33% in 2006 and the highest return of
9.48% in 2004. The average rate of return for the period 2004 to 2011 was
8.14%. The rate of return of the R153 government bond ranged from 9.36% in
2004 to 7.43% in 2011. The average rate of return for the eight-year period was
7.91%. The lowest rate of return of 6.93% was reported in 2009 while the
highest return of 9.58% was reported in 2008. Once again, the world recession
can be regarded as the main contributor to the higher returns during 2008.
VALUATION OF SELECTED BUSINESSES CHAPTER 6
264
The required rate of return ranged from 7.57% in 2004 to 6.63% in 2011 when
using the R157 government bond as the risk-free rate of return. The average
required rate of return was 7.01%. The highest required rate of return was
recorded in 2004 (7.57%) while the lowest was recorded in 2011(6.63%). The
required rate of return ranged from 7.78% in 2004 to 2.49% in 2011 and 2010
when using the R153 government bond as the risk-free rate of return. The
average required rate of return was 6.07%. The highest required rate of return
was recorded in 2008 (8.00%) while the lowest required rates of return were
recorded in 2010 and 2011 (both were 2.49%). The instability of the global
financial environment led to higher required rate of return during the 2008
financial year. A recovery of the economic environment is visible if one
considers the lower required rate of returns after the 2008 financial year.
If one considers the volatility of PnP as measured by beta (β), PnP was not as
volatile as the market, as it is less than one (β < 1). Beta is the measurement to
determine the sensitivity of a security to the movements in the market portfolio
(Hillier et al. 2010:280). The lowest beta of 0.20 was recorded in 2008 while the
highest beta of 0.52 was recorded in 2011. A possible reason for the low beta in
2008 could be the need for groceries regardless of the state of the economy.
The higher beta of 2011 could be a result of the retirement of Mr Raymond
Ackerman as chairperson of the board of directors during 2010, implying that a
trusted form of stability in the company was no more part of the company.
Another possible reason could be that more emphasis was placed on PnP‟s
Food Safety Audit Standards in the retail market, as these standards were
accepted as the retail industry benchmark. Other factors that might have
resulted in low betas include being named as one of South Africa‟s top 10
brands, awarding of Best Grocery/General Store, the awarding of the Corporate
Governance Award for Ethics and Integrity, awarding of the Kudu Award for
environmental projects and being named as the Coolest Grocery Store by
South Africa‟s youth. All these awards created a sense of stability and therefore
PnP was regarded as being not as volatile as the market in general.
The cost of equity ranged from 12.27% in 2004 to 10.91% in 2011 when using
the R157 government bond as the risk-free rate of return. The cost of equity
VALUATION OF SELECTED BUSINESSES CHAPTER 6
265
was therefore cheaper in 2011 than in 2004. The lowest cost of equity was
recorded in 2006 (8.94%) and the highest cost of equity was recorded in 2004
(12.27%). The average cost of equity for the 2004 to 2011 period was 10.21%.
The cost of equity ranged from 12.16% in 2004 to 10.56% in 2011 when using
the R153 government bond as the risk-free rate of return. The cost of equity
was therefore cheaper in 2011 than in 2004. The lowest cost of equity was
recorded in 2006 (8.81%) and the highest cost of equity was recorded in 2004
(12.16%). The average cost of equity for the 2004 to 2011 period was 9.99%.
The after-tax cost of debt ranged from 8.23% in 2004 to 10.98% in 2011. As the
risk-free rate has no effect on the cost of debt, the after-tax cost of debt when
using the R157 and R153 government bonds as risk-free rates do not differ.
The after-tax cost of debt of PnP was cheaper than the cost of equity in 2004
(8.23% versus 12.27% and 12.16%), 2006 (3.03% versus 8.94% and 8.81%),
2008 (6.92% versus 10.20% and 10.79%) and 2010 (9.15% versus 10.40% and
9.65%). The years 2007 and 2009 were the only years where the after-tax cost
of debt (11.09% in 2007 and 10.10% in 2009) was more expensive than the
cost of equity (9.77% and 10.12% in 2007 and 9.97% and 8.83% in 2009). The
lowest cost of debt was recorded in 2008 (6.92%) although there was a world
financial crisis. The average after-tax cost of debt for the 2004 to 2011 period
was 8.56%. The applicable South African tax rate was 30% for the 2004 and
2005 financial years, 29% for the 2006, 2007 and 2008 financial years and 28%
for the 2009, 2010 and 2011 financial years.
6.5.2 Valuations of Pick n Pay Stores Ltd (brick-and-click business in the e-
commerce stage)
Table 6.8 provides a summary of the valuations done for PNP for the 2004 to
2011 period, while Table 6.9 illustrates the growth rates of the various
valuations and the share price.
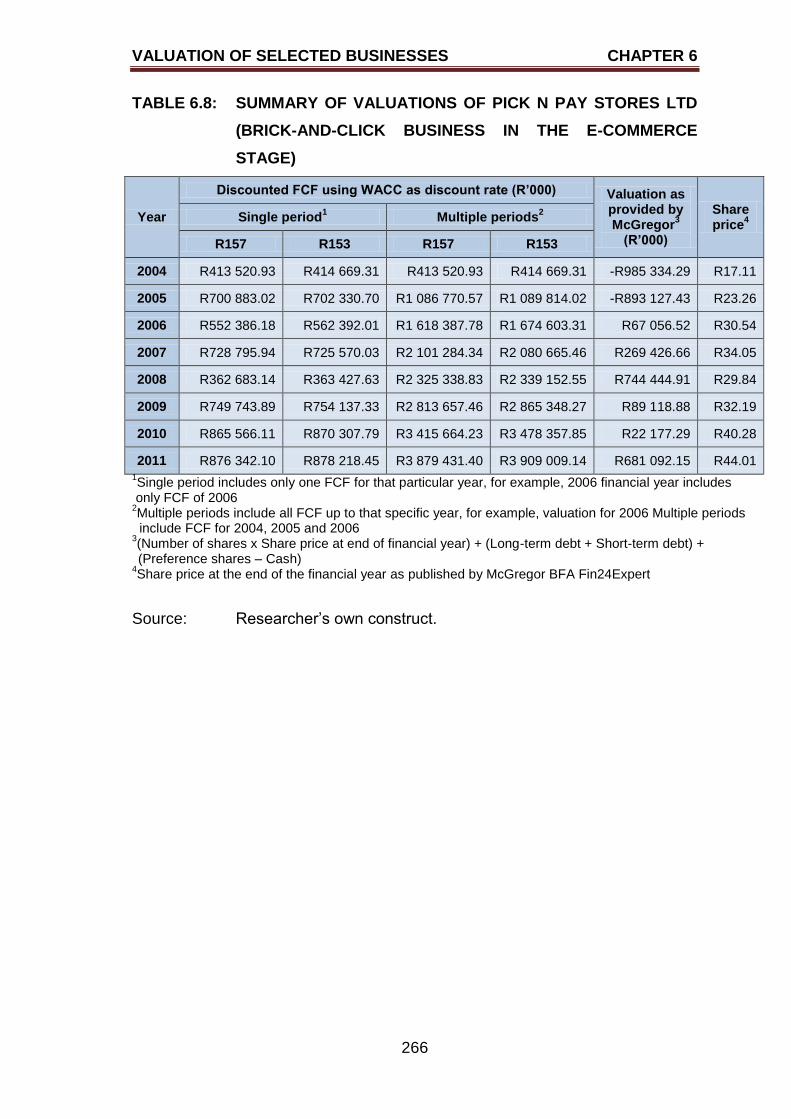
VALUATION OF SELECTED BUSINESSES CHAPTER 6
266
TABLE 6.8: SUMMARY OF VALUATIONS OF PICK N PAY STORES LTD
(BRICK-AND-CLICK BUSINESS IN THE E-COMMERCE
STAGE)
Year
Discounted FCF using WACC as discount rate (R’000) Valuation as provided by McGregor
3
(R’000)
Share price
4
Single period1 Multiple periods
2
R157 R153 R157 R153
2004 R413 520.93 R414 669.31 R413 520.93 R414 669.31 -R985 334.29 R17.11
2005 R700 883.02 R702 330.70 R1 086 770.57 R1 089 814.02 -R893 127.43 R23.26
2006 R552 386.18 R562 392.01 R1 618 387.78 R1 674 603.31 R67 056.52 R30.54
2007 R728 795.94 R725 570.03 R2 101 284.34 R2 080 665.46 R269 426.66 R34.05
2008 R362 683.14 R363 427.63 R2 325 338.83 R2 339 152.55 R744 444.91 R29.84
2009 R749 743.89 R754 137.33 R2 813 657.46 R2 865 348.27 R89 118.88 R32.19
2010 R865 566.11 R870 307.79 R3 415 664.23 R3 478 357.85 R22 177.29 R40.28
2011 R876 342.10 R878 218.45 R3 879 431.40 R3 909 009.14 R681 092.15 R44.01 1Single period includes only one FCF for that particular year, for example, 2006 financial year includes
only FCF of 2006 2Multiple periods include all FCF up to that specific year, for example, valuation for 2006 Multiple periods
include FCF for 2004, 2005 and 2006 3(Number of shares x Share price at end of financial year) + (Long-term debt + Short-term debt) +
(Preference shares – Cash)
4Share price at the end of the financial year as published by McGregor BFA Fin24Expert
Source: Researcher‟s own construct.
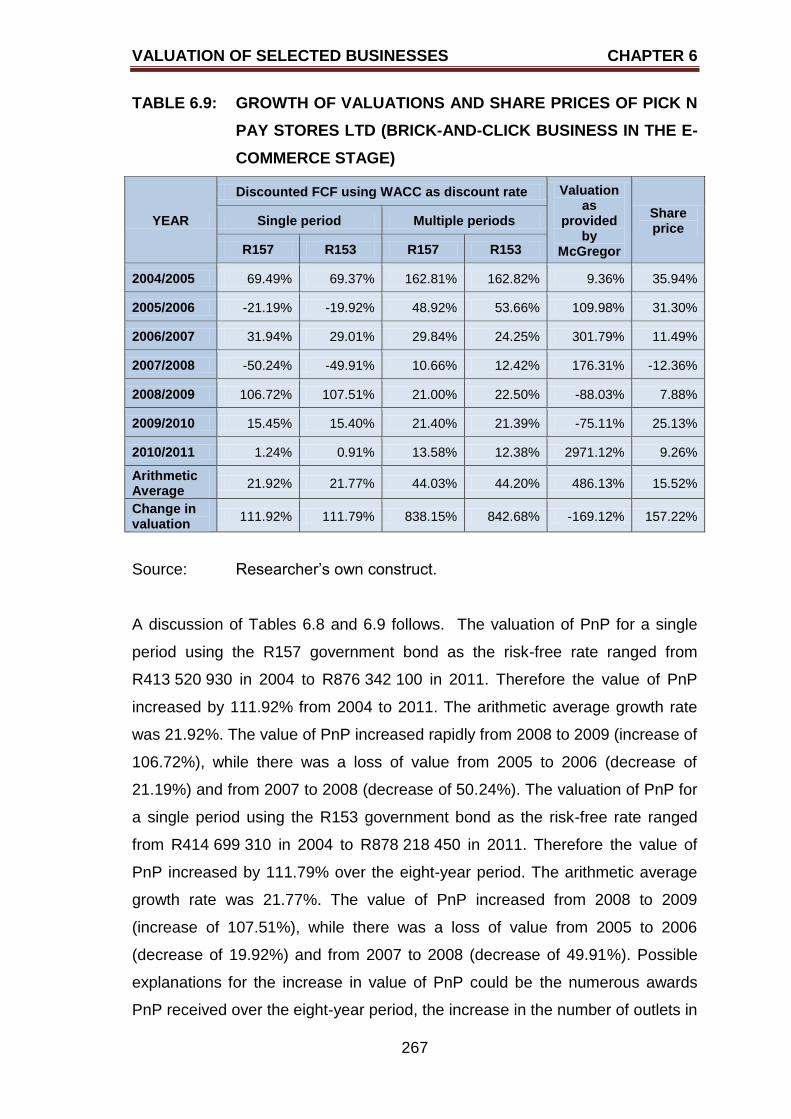
VALUATION OF SELECTED BUSINESSES CHAPTER 6
267
TABLE 6.9: GROWTH OF VALUATIONS AND SHARE PRICES OF PICK N
PAY STORES LTD (BRICK-AND-CLICK BUSINESS IN THE E-
COMMERCE STAGE)
YEAR
Discounted FCF using WACC as discount rate Valuation as
provided by
McGregor
Share price
Single period Multiple periods
R157 R153 R157 R153
2004/2005 69.49% 69.37% 162.81% 162.82% 9.36% 35.94%
2005/2006 -21.19% -19.92% 48.92% 53.66% 109.98% 31.30%
2006/2007 31.94% 29.01% 29.84% 24.25% 301.79% 11.49%
2007/2008 -50.24% -49.91% 10.66% 12.42% 176.31% -12.36%
2008/2009 106.72% 107.51% 21.00% 22.50% -88.03% 7.88%
2009/2010 15.45% 15.40% 21.40% 21.39% -75.11% 25.13%
2010/2011 1.24% 0.91% 13.58% 12.38% 2971.12% 9.26%
Arithmetic Average
21.92% 21.77% 44.03% 44.20% 486.13% 15.52%
Change in valuation
111.92% 111.79% 838.15% 842.68% -169.12% 157.22%
Source: Researcher‟s own construct.
A discussion of Tables 6.8 and 6.9 follows. The valuation of PnP for a single
period using the R157 government bond as the risk-free rate ranged from
R413 520 930 in 2004 to R876 342 100 in 2011. Therefore the value of PnP
increased by 111.92% from 2004 to 2011. The arithmetic average growth rate
was 21.92%. The value of PnP increased rapidly from 2008 to 2009 (increase of
106.72%), while there was a loss of value from 2005 to 2006 (decrease of
21.19%) and from 2007 to 2008 (decrease of 50.24%). The valuation of PnP for
a single period using the R153 government bond as the risk-free rate ranged
from R414 699 310 in 2004 to R878 218 450 in 2011. Therefore the value of
PnP increased by 111.79% over the eight-year period. The arithmetic average
growth rate was 21.77%. The value of PnP increased from 2008 to 2009
(increase of 107.51%), while there was a loss of value from 2005 to 2006
(decrease of 19.92%) and from 2007 to 2008 (decrease of 49.91%). Possible
explanations for the increase in value of PnP could be the numerous awards
PnP received over the eight-year period, the increase in the number of outlets in
VALUATION OF SELECTED BUSINESSES CHAPTER 6
268
South Africa and in Africa, the launching of private label brands and the creation
of new employment opportunities. The announcement of PnP as one of the
proud sponsors of the 2011 Rugby World Cup and the new logo and brandline
could have resulted in exceptionally high valuations for 2007. The low growth
rate of 2011 could be ascribed to the entry of Wal-Mart into the South African
market. The retiring of the CEO during 2007 could have had an impact on the
2008 growth rate.
The valuation of PnP for multiple periods using the R157 government bond as
the risk-free rate ranged from R413 520 930 in 2004 to R3 879 431 400 in 2011.
This represents an 838.15% increase in value for PnP. The arithmetic average
growth rate for the eight-year period was 44.03%. The value of PnP showed
steep increases from 2004 to 2005 of 162.81% and from 2005 to 2006 of
48.92%. For the other periods, the growth rate slowed down to below 30.00%
per annum. The valuation of PnP for multiple periods using the R153
government bond as the risk-free rate ranged from R414 669 310 in 2004 to
R3 909 009 140 in 2011. This represents an 842.68% increase in value for PnP
while the arithmetic average growth rate was 44.20% for the same eight-year
period. The value of PnP showed steep increases of 162.82% and 53.66% for
the 2004/2005 and 2005/2006 financial years respectively. The steep increases
could be a result of green initiatives (such as the launching of the Green Bag)
undertaken by PnP and the various award received by PnP. The awards
included the Top Company in the Top 300, Best Grocery/General Store and
Third Most Admired Company in South Africa. PnP was also named as one of
South Africa‟s top 10 brands.
Two of the valuations of PnP as calculated by McGregor BFA Fin24Expert
resulted in negative figures (2004 with negative R985 334 290 and 2005 with
negative R893 127 430). The values as calculated by McGregor BFA
Fin24Expert ranged from negative R985 334 290 in 2004 to R681 092 150 in
2011. The value of PnP increased by 169.12% over the eight-year period, from
a negative value to a positive value. The arithmetic average growth rate for the
period 2004 to 2011 was 486.13%. The highest percentage increase in value of
2 971.12% occurred from 2010 to 2011. Extraordinarily high growth rates were
VALUATION OF SELECTED BUSINESSES CHAPTER 6
269
also reported for 2006 to 2007 (increase of 301.79%), 2007 to 2008 (increase of
176.31%) and 2005 to 2006 (107.51%). Two consecutive years reported a
decrease in value, namely from 2008 to 2009 (decrease of 88.03%) and from
2009 to 2010 (decrease of 75.11%). The share price of PnP at the end of the
financial year increased from R17.11 in 2004 to R44.01 in 2011 which
represents an increase of 157.22%. If one considers the growth rate for the
share price of the eight-year period, the arithmetic average growth rate was
15.52%, with the steepest increase of 35.94% for the 2004/2005 financial year
and the lowest increase (which is actually a decrease) of -12.36% for the
2007/2008 financial year. During 2007 it was announced that PnP was one of
the proud sponsors of the 2011 Rugby World Cup. Therefore the increase in the
share price during 2007 could have resulted from this announcement. The new
logo and brandline of PnP that was introduced during 2007 could also have
resulted in an increase in the share price. The retiring of the CEO could have
been a possible reason for the decrease in the share price in 2008. It should be
noted that the DCF approach was not used to value PnP. The valuation
approach used by McGregor BFA Fin24Expert placed emphasis on the number
of shares outstanding, the share price at the end of the financial year, the short-
term and long-term debt (interest bearing and non-interest bearing), preference
shares outstanding and cash. Therefore the approach used by McGregor BFA
Fin24Expert did not focus on the business‟s ability to generate cash flow which
is the focus of the DCF approach.
VALUATION OF SELECTED BUSINESSES CHAPTER 6
270
6.6 REPORTING ON VALUATION OF NASPERS LTD (ONLINE BUSINESS IN
THE E-COMMERCE STAGE)
A discussion of the variables that formed part of the valuations will be
presented. The discussion will be followed by the presentation of the valuations
as calculated using the DCF approach. According to the discussion in section
5.5.5, Naspers is an online business in the e-commerce stage.
6.6.1 Variables for valuations of Naspers Ltd (online business in the e-
commerce stage)
Table 6.10 summarises the variables used to calculate the value of Naspers for
each year as from 2004 to 2011. The calculation of the FCFs as presented in
Table 6.10 is shown in Annexure D. All the other variables shown in Table 6.10
were obtained from the McGregor BFA Fin24Expert.
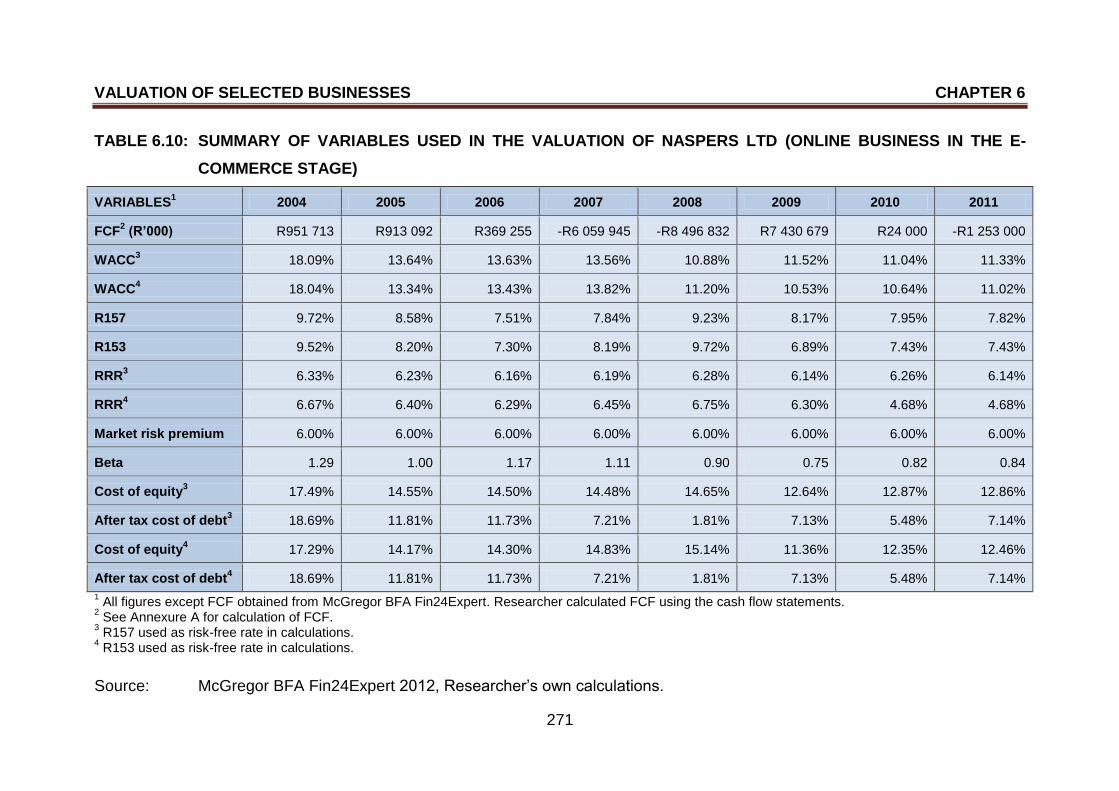
VALUATION OF SELECTED BUSINESSES CHAPTER 6
271
TABLE 6.10: SUMMARY OF VARIABLES USED IN THE VALUATION OF NASPERS LTD (ONLINE BUSINESS IN THE E-
COMMERCE STAGE)
VARIABLES1 2004 2005 2006 2007 2008 2009 2010 2011
FCF2 (R’000) R951 713 R913 092 R369 255 -R6 059 945 -R8 496 832 R7 430 679 R24 000 -R1 253 000
WACC3 18.09% 13.64% 13.63% 13.56% 10.88% 11.52% 11.04% 11.33%
WACC4 18.04% 13.34% 13.43% 13.82% 11.20% 10.53% 10.64% 11.02%
R157 9.72% 8.58% 7.51% 7.84% 9.23% 8.17% 7.95% 7.82%
R153 9.52% 8.20% 7.30% 8.19% 9.72% 6.89% 7.43% 7.43%
RRR3 6.33% 6.23% 6.16% 6.19% 6.28% 6.14% 6.26% 6.14%
RRR4 6.67% 6.40% 6.29% 6.45% 6.75% 6.30% 4.68% 4.68%
Market risk premium 6.00% 6.00% 6.00% 6.00% 6.00% 6.00% 6.00% 6.00%
Beta 1.29 1.00 1.17 1.11 0.90 0.75 0.82 0.84
Cost of equity3 17.49% 14.55% 14.50% 14.48% 14.65% 12.64% 12.87% 12.86%
After tax cost of debt3 18.69% 11.81% 11.73% 7.21% 1.81% 7.13% 5.48% 7.14%
Cost of equity4 17.29% 14.17% 14.30% 14.83% 15.14% 11.36% 12.35% 12.46%
After tax cost of debt4 18.69% 11.81% 11.73% 7.21% 1.81% 7.13% 5.48% 7.14%
1 All figures except FCF obtained from McGregor BFA Fin24Expert. Researcher calculated FCF using the cash flow statements.
2 See Annexure A for calculation of FCF.
3 R157 used as risk-free rate in calculations.
4 R153 used as risk-free rate in calculations.
Source: McGregor BFA Fin24Expert 2012, Researcher‟s own calculations.
VALUATION OF SELECTED BUSINESSES CHAPTER 6
272
A discussion of the results as presented in Table 6.10 follows. The FCF for
Naspers decreased from R951 713 000 to -R1 253 000 000 from 2004 to 2011.
Therefore the FCF decreased by 231.66% and the arithmetic average growth
rate of the FCF was -1 011.16%. As from 2004 to 2010, the only positive growth
took place from 2008 to 2009 when the FCF grew by 187.45%. For all the other
years, the growth rate of the FCF decreased ranging from negative 4.06%
(2004) to negative 5 320.83% (2011). The highest positive FCF was recorded
for the 2009 financial year (R7 430 679 000) while the lowest positive FCF was
recorded for the 2010 financial year (R24 000 000). The highest negative FCF
of R8 496 832 000 was reported for the 2008 financial year and the lowest
negative FCF of R1 253 000 000 was reported in 2011.
The WACC using the R157 government bond as the risk-free rate ranged from
18.09% in 2004 to 11.33% in 2011. The average WACC for the eight-year
period was 12.96%. The lowest WACC of 10.88% was reported in 2008 while
the highest WACC of 18.09% was reported in 2004. The WACC using the R153
government bond as the risk-free rate ranged from 18.04% in 2004 to 11.02% in
2011. The average WACC for the eight-year period was 12.75%. The lowest
WACC of 10.53% was reported in 2009 while the highest WACC of 18.04% was
reported in 2004.
The rate of return of the R157 government bond ranged from 9.72% in 2004 to
7.82% in 2011 with the lowest return of 7.51% in 2006 and the highest return of
9.72% in 2004. The average rate of return for the period 2004 to 2011 was
8.35%. The rate of return of the R153 government bond ranged from 9.52% in
2004 to 7.43% in 2011. The average rate of return for the eight-year period was
8.08%. The lowest rate of return of 6.89% was reported in 2009 while the
highest return of 9.72% was reported in 2008. The world‟s financial instability
can be regarded as the main contributor to the higher returns during 2008.
The required rate of return ranged from 6.33% in 2004 to 6.14% in 2011 when
using the R157 government bond as the risk-free rate of return. The average
required rate of return was 6.22%. The highest required rate of return of 6.33%
was recorded in 2004 while the lowest of 6.14% was recorded in both 2009 and
VALUATION OF SELECTED BUSINESSES CHAPTER 6
273
2011. The required rate of return ranged from 6.67% in 2004 to 4.68% in 2011
when using the R153 government bond as the risk-free rate of return with the
average required rate of return of 6.03%. The highest required rate of return
was recorded in 2008 (6.75%) while the lowest required rates of return were
recorded in 2010 and 2011 (both were 4.68%). The global financial environment
was in extreme turmoil in 2008 and therefore a higher required rate of return
during the 2008 financial year was recorded.
If one considers the volatility of Naspers as measured by beta (β), Naspers‟
volatility for the eight-year period ranged from not as volatile as the market
(β < 1), to as volatile as the market (β = 1) to as more volatile than the market
(β > 1). Beta is the measurement to determine the sensitivity of a security to the
movements in the market portfolio (Hillier et al. 2010:280). The lowest beta of
0.75 was recorded in 2009 while the highest beta of 1.29 was recorded in 2004.
The beta value of Naspers was greater than or equal to one from 2004 to 2007
and since 2008 it has been below 0.9. The financial instability that occurred
during and after 2008 did not have an impact on the volatility of Naspers. One of
the reasons that could be offered as an explanation is that the majority of the
products and services offered by Naspers are for the more wealthy consumers
and the wealthy consumers might not have been affected by the world
recession as much as less wealthy consumers. Another possibility is the listing
of Naspers on the London Stock Exchange (LSE) during 2007 which could have
been seen as a sign of stability and future growth opportunities. The higher beta
of 2006 could have been a result of the implementation of the Electronic
Communications Act.
The cost of equity ranged from 17.49% in 2004 to 12.86% in 2011 when using
the R157 government bond as the risk-free rate of return. The cost of equity
decreased drastically from 2004 to 2011. The lowest cost of equity was
recorded in 2009 (12.64%) and the highest cost of equity was recorded in 2004
(17.49%). The average cost of equity for the 2004 to 2011 period was 14.25%.
The cost of equity ranged from 17.29% in 2004 to 12.46% in 2011 when using
the R153 government bond as the risk-free rate of return. The cost of equity
was therefore cheaper in 2011 than in 2004. The lowest cost of equity was
VALUATION OF SELECTED BUSINESSES CHAPTER 6
274
recorded in 2009 (11.36%) and the highest cost of equity was recorded in 2004
(17.29%). The average cost of equity for the 2004 to 2011 period was 13.99%.
During the 2007 and 2008 financial years equity was very expensive with the
2008 financial year being the most expensive year to obtain equity (ignoring the
2004 year), regardless of which one of the two risk-free rates were used. The
high cost of equity could have resulted from the world recession and the turmoil
in the financial environment. It should also be noted that Naspers delisted the
American Depositary Shares (ADS) from Nasdaq in 2008 and terminated their
registration of ADS with the Securities and Exchange Commission in the USE.
Furthermore, Naspers listed on the LSE during 2007.
The after-tax cost of debt ranged from 18.69% in 2004 to 7.14% in 2011.
Therefore debt was cheaper in 2011 than what it was in 2004. As the risk-free
rate has no effect on the cost of debt, the after-tax cost of debt when using the
R157 and R153 government bonds as risk-free rates does not differ. The after-
tax cost of debt of Naspers for the period 2004 to 2011 was with the exception
of the year 2004, cheaper than the cost of equity. Therefore it was cheaper for
Naspers to finance investments with debt than with equity. The lowest cost of
debt was recorded in 2008 (1.81%). The average after-tax cost of debt for the
2004 to 2011 period was 8.87%. The applicable South African tax rate was 30%
for the 2004 and 2005 financial years, 29% for the 2006, 2007 and 2008
financial years and 28% for the 2009, 2010 and 2011 financial years.
6.6.2 Valuations of Naspers Ltd (online business in the e-commerce stage)
Table 6.11 provides a summary of the valuations done for Naspers for the 2004
to 2011 period, while Table 6.12 illustrates the growth rates of the various
valuations and the share price.
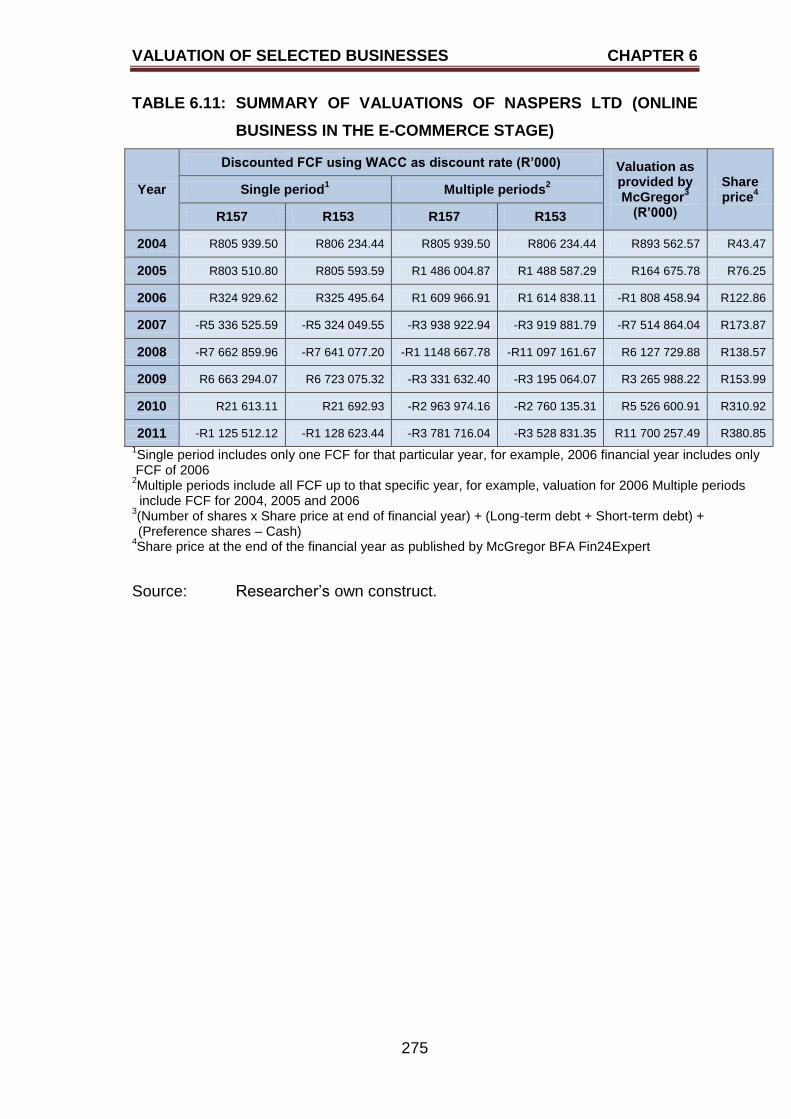
VALUATION OF SELECTED BUSINESSES CHAPTER 6
275
TABLE 6.11: SUMMARY OF VALUATIONS OF NASPERS LTD (ONLINE
BUSINESS IN THE E-COMMERCE STAGE)
Year
Discounted FCF using WACC as discount rate (R’000) Valuation as provided by McGregor
3
(R’000)
Share price
4
Single period1 Multiple periods
2
R157 R153 R157 R153
2004 R805 939.50 R806 234.44 R805 939.50 R806 234.44 R893 562.57 R43.47
2005 R803 510.80 R805 593.59 R1 486 004.87 R1 488 587.29 R164 675.78 R76.25
2006 R324 929.62 R325 495.64 R1 609 966.91 R1 614 838.11 -R1 808 458.94 R122.86
2007 -R5 336 525.59 -R5 324 049.55 -R3 938 922.94 -R3 919 881.79 -R7 514 864.04 R173.87
2008 -R7 662 859.96 -R7 641 077.20 -R1 1148 667.78 -R11 097 161.67 R6 127 729.88 R138.57
2009 R6 663 294.07 R6 723 075.32 -R3 331 632.40 -R3 195 064.07 R3 265 988.22 R153.99
2010 R21 613.11 R21 692.93 -R2 963 974.16 -R2 760 135.31 R5 526 600.91 R310.92
2011 -R1 125 512.12 -R1 128 623.44 -R3 781 716.04 -R3 528 831.35 R11 700 257.49 R380.85
1Single period includes only one FCF for that particular year, for example, 2006 financial year includes only
FCF of 2006 2Multiple periods include all FCF up to that specific year, for example, valuation for 2006 Multiple periods
include FCF for 2004, 2005 and 2006 3(Number of shares x Share price at end of financial year) + (Long-term debt + Short-term debt) +
(Preference shares – Cash)
4Share price at the end of the financial year as published by McGregor BFA Fin24Expert
Source: Researcher‟s own construct.
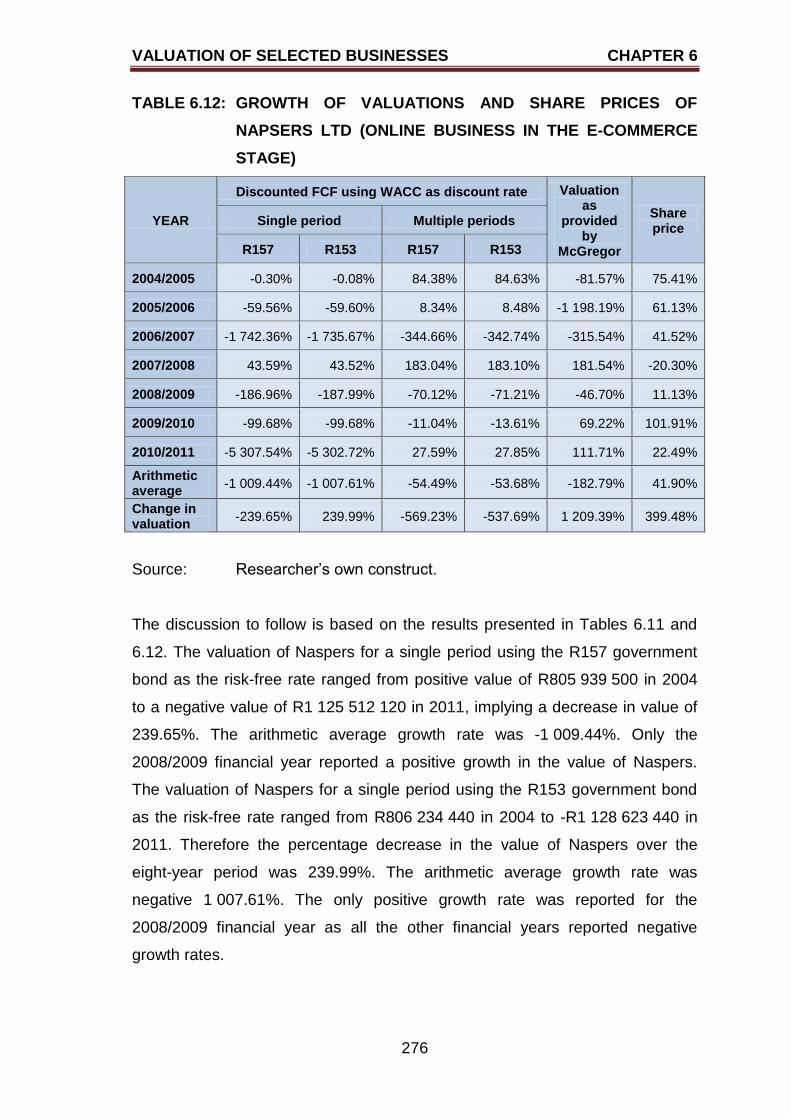
VALUATION OF SELECTED BUSINESSES CHAPTER 6
276
TABLE 6.12: GROWTH OF VALUATIONS AND SHARE PRICES OF
NAPSERS LTD (ONLINE BUSINESS IN THE E-COMMERCE
STAGE)
YEAR
Discounted FCF using WACC as discount rate Valuation as
provided by
McGregor
Share price
Single period Multiple periods
R157 R153 R157 R153
2004/2005 -0.30% -0.08% 84.38% 84.63% -81.57% 75.41%
2005/2006 -59.56% -59.60% 8.34% 8.48% -1 198.19% 61.13%
2006/2007 -1 742.36% -1 735.67% -344.66% -342.74% -315.54% 41.52%
2007/2008 43.59% 43.52% 183.04% 183.10% 181.54% -20.30%
2008/2009 -186.96% -187.99% -70.12% -71.21% -46.70% 11.13%
2009/2010 -99.68% -99.68% -11.04% -13.61% 69.22% 101.91%
2010/2011 -5 307.54% -5 302.72% 27.59% 27.85% 111.71% 22.49%
Arithmetic average
-1 009.44% -1 007.61% -54.49% -53.68% -182.79% 41.90%
Change in valuation
-239.65% 239.99% -569.23% -537.69% 1 209.39% 399.48%
Source: Researcher‟s own construct.
The discussion to follow is based on the results presented in Tables 6.11 and
6.12. The valuation of Naspers for a single period using the R157 government
bond as the risk-free rate ranged from positive value of R805 939 500 in 2004
to a negative value of R1 125 512 120 in 2011, implying a decrease in value of
239.65%. The arithmetic average growth rate was -1 009.44%. Only the
2008/2009 financial year reported a positive growth in the value of Naspers.
The valuation of Naspers for a single period using the R153 government bond
as the risk-free rate ranged from R806 234 440 in 2004 to -R1 128 623 440 in
2011. Therefore the percentage decrease in the value of Naspers over the
eight-year period was 239.99%. The arithmetic average growth rate was
negative 1 007.61%. The only positive growth rate was reported for the
2008/2009 financial year as all the other financial years reported negative
growth rates.
VALUATION OF SELECTED BUSINESSES CHAPTER 6
277
The valuation of Naspers for multiple periods using the R157 government bond
as the risk-free rate ranged from R805 939 500 in 2004 to negative
R3 781 716 040 in 2011. This represents a decline in value of 569.23% for
Naspers. The arithmetic average growth rate for the eight-year period was
negative 54.49%. The value of Naspers showed steep decreases of 344.66%
and 183.04% for the 2006/2007 and 2007/2008 financial years respectively.
These decreases could have been the early signs of the world recession. The
valuation of Naspers for multiple periods using the R153 government bond as
the risk-free rate ranged from R806 234 440 in 2004 to negative
R3 528 831 350 420 in 2011. This represents a 537.69% decrease in value for
Naspers while the arithmetic average growth rate was -53.68% for the same
eight-year period. The value of Naspers showed steep decreases of 342.74%
and 183.10% for the 2006/2007 and 2007/2008 financial years respectively.
The steep decreases from 2006 to 2007 and from 2007 to 2008 in Naspers‟
value could be a result of the implementation of the Electronic Communication
Act and the delisting from Nasdaq.
McGregor BFA Fin24Expert completed a valuation of Naspers and two of the
valuations resulted in negative valuations. The values as obtained from the
McGregor BFA Fin24Expert ranged from R893 562 570 in 2004 to
R11 700 257 490 in 2011. The highest positive value of R11 700 257 490 was
reported for the 2011 financial year, while the smallest positive value of
R893 562 570 was reported for the 2004 financial year. The value of Naspers
increased by 1 209.39% from 2004 to 2011 although the arithmetic average
growth rate for the same period of 182.79% was negative. The highest
percentage decrease in value occurred from 2005 to 2006 (decrease of
1 198.19%) and from 2006/2007 (decrease of 315.54%). The highest
percentage increase in value for Naspers was reported in 2008 (181.54%) and
in 2011 (111.71%). The share price of Naspers at the end of the financial year
increased from R43.47 in 2004 to R380.85 in 2011, which is a 776.12%
increase. If one considers the growth rate for the share price of the eight-year
period, the arithmetic average growth rate was 41.90% with the steepest
increase of 101.91% for the 2009/2010 financial year and the lowest increase of
11.13% for the 2009/2010 financial year. The percentage decrease in the share
VALUATION OF SELECTED BUSINESSES CHAPTER 6
278
price from 2007 to 2008 was 20.30%. It should be noted that the DCF approach
was not used to value Naspers. The valuation approach used by McGregor BFA
Fin24Expert placed emphasis on the number of shares outstanding, the share
price at the end of the financial year, the short-term and long-term debt (interest
bearing and non-interest bearing), preference shares outstanding and cash.
Therefore the approach used by McGregor BFA Fin24Expert did not focus on
the business‟s ability to generate cash flow which is the focus of the DCF
approach.
6.7 ALTERNATIVE APPROACH TO VALUATION
It should be noted that the principles of the Gordon model as discussed in
Chapter Three could also be applied in the study. The FCF as calculated and
presented in Annexures A to D are used. The WACCs as presented in Tables
6.1, 6.4, 6.7 and 6.10 for the respective businesses are used in the calculations.
This valuation approach aims to grow the FCF with WACC for each period as
from the basis year. The basis year for this study is 2004. Therefore the 2004
FCF will grow for one period, 2005 FCF will grow for two periods, the 2006 FCF
will grow for three periods, and so forth. The average of the “future” FCF will
then be discounted to the basis year (2004). The discount rate used is the
difference between the WACC and the risk-free rate of return. Annexure E
provides a summary of the valuations using this alternative model.
6.8 SUMMARY
The main aim of this chapter was to use the DCF approach to value each of the
four selected businesses. The variables required by the DCF approach were
identified and explained. In order to facilitate the testing of the research
hypotheses still to be done, the various valuations of the four selected
businesses, namely Shoprite, SPAR, PnP and Naspers, had to be calculated
using the DCF approach. Therefore the first section of the chapter motivated
why the DCF approach was used. The calculation of the FCF was also
explained and the different ways to calculation were also described. Both the
methods explained were used to calculate the FCF as a double checking
mechanism for reliability of FCF as an input into the DCF approach. WACC was
also identified as the discount rate to be used in the DCF approach. The
VALUATION OF SELECTED BUSINESSES CHAPTER 6
279
valuations were calculated with the R157 and R153 government bonds as risk-
free rates.
The valuations of each of the four selected businesses, that is for Shoprite,
SPAR, PnP and Naspers, were discussed. For each of the businesses, the
variables used in the valuation process were identified and explained. Once the
variables were identified, the valuations for each business for each year as from
2004 to 2011 were calculated. For Shoprite, the highest FCF was
R1 413 785 000 (2010) while the lowest FCF was R204 121 000 (2004). The
percentage change in the valuation of Shoprite from 2004 to 2011 using the
R157 government bond as risk-free rate was 561.69% (single period valuations)
and 2 324.63% (multiple period valuations). For SPAR, the highest FCF was
R742 500 000 (2010) while the lowest FCF was R58 488 000 (2005). The
percentage change in the valuation of SPAR from 2004 to 2011 using the R157
government bond as risk-free rate, was 68.69% (single period valuations) and
527.66% (multiple period valuations). For PnP, the highest FCF was
R972 100 000 (2011) while the lowest FCF was R395 700 000 (2008). The
percentage change in the valuation of PnP from 2004 to 2011 using the R157
government bond as risk-free rate, was 111.92% (single period valuations) and
838.15% (multiple period valuations). For Naspers, the highest FCF was
R7 430 679 000 (2009) while the lowest FCF was negative R8 496 831 000
(2008). The percentage change in the valuation of Naspers from 2004 to 2011
using the R157 government bond as risk-free rate, was negative 239.65%
(single period valuations) and negative 569.23% (multiple period valuations),
implying that the valuations decreased. It should be noted that if the valuation
yielded a negative value, then the net asset value (NAV) of the business should
be used as an appropriate value for decision-making. An alternative model for
valuation was also provided.
Chapter Seven will present the results from the research hypotheses testing
using the valuations as discussed in Chapter Six. The basic descriptive
statistics, Pearson product moment correlation coefficients and t-test results will
be discussed.
EMPIRICAL RESULTS OF VALUATION ANALYSIS CHAPTER 7
280
CHAPTER SEVEN
EMPIRICAL RESULTS OF VALUATION ANALYSIS
7.1 INTRODUCTION
Chapter Six identified and discussed the variables required by the DCF
approach. The valuations for the four businesses for the period 2004 to 2011
were calculated. The valuations presented in Chapter Six will be used in
Chapter Seven in the statistical analysis necessary to test the research
hypotheses formulated in Chapter One. Therefore Chapter Seven will assist in
the achievement of one of the secondary objectives identified in Chapter One,
which will assist in the attainment of the primary objective of the study. The
purpose and importance of Chapter Seven in the research process can be seen
in Figure 7.1, which is reproduced from Chapter One.
In Chapter Six, the various valuations from 2004 to 2011 were compared for
each individual business (trend analysis) and the valuations of the businesses
were also compared with each other. The comparisons done in Chapter Six will
further be supported by the descriptive statistics (mean, median, minimum,
maximum, range and standard deviation) to be presented in Chapter Seven.
The Pearson‟s Product Moment Correlation Coefficient (hereafter referred to as
correlation) will be calculated to assess the strength of the relationships
between any two business valuations. The results of the t-test for the individual
businesses and results of the t-test when comparing the businesses with each
other will also be provided and discussed.
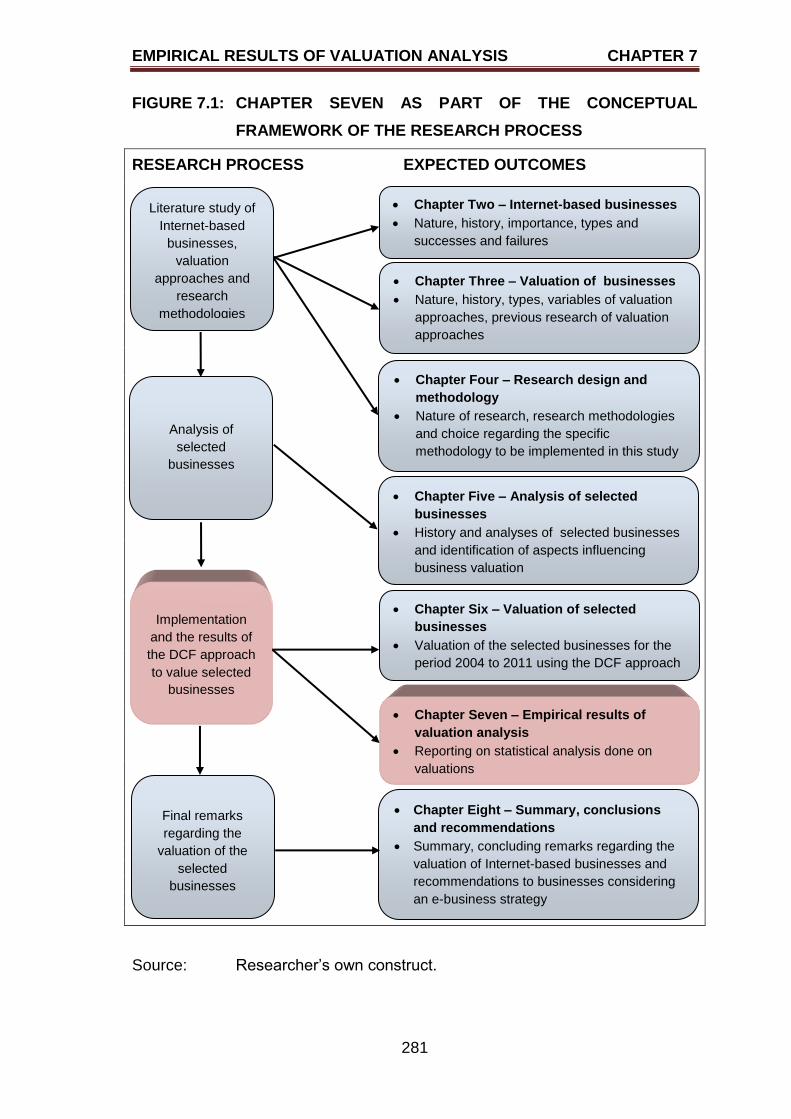
EMPIRICAL RESULTS OF VALUATION ANALYSIS CHAPTER 7
281
FIGURE 7.1: CHAPTER SEVEN AS PART OF THE CONCEPTUAL
FRAMEWORK OF THE RESEARCH PROCESS
RESEARCH PROCESS EXPECTED OUTCOMES
Source: Researcher‟s own construct.
Literature study of
Internet-based
businesses,
valuation
approaches and
research
methodologies
Chapter Three – Valuation of businesses
Nature, history, types, variables of valuation
approaches, previous research of valuation
approaches
Chapter Two – Internet-based businesses
Nature, history, importance, types and
successes and failures
Chapter Four – Research design and
methodology
Nature of research, research methodologies
and choice regarding the specific
methodology to be implemented in this study
Analysis of
selected
businesses
Chapter Five – Analysis of selected
businesses
History and analyses of selected businesses
and identification of aspects influencing
business valuation
Chapter Six – Valuation of selected
businesses
Valuation of the selected businesses for the
period 2004 to 2011 using the DCF approach
Implementation
and the results of
the DCF approach
to value selected
businesses
Chapter Eight – Summary, conclusions
and recommendations
Summary, concluding remarks regarding the
valuation of Internet-based businesses and
recommendations to businesses considering
an e-business strategy
Final remarks
regarding the
valuation of the
selected
businesses
Chapter Seven – Empirical results of
valuation analysis
Reporting on statistical analysis done on
valuations
EMPIRICAL RESULTS OF VALUATION ANALYSIS CHAPTER 7
282
7.2 DESCRIPTIVE STATISTICS OF SELECTED BUSINESSES
The descriptive statistics that will be provided are the mean, median, minimum,
maximum, range and standard deviation. Before discussing the descriptive
statistics for the data set, the various statistics will be defined.
The mean of a data set is a measure of central tendency for interval or ratio
data. The mean (also known as average) can be calculated by adding all the
observations under study and dividing the sum total by the total number of
observations. (Gray 2009:578; Saunders et al. 2009:444; Zikmund 2003:404).
The median is a measure of central tendency, but it differs from the mean in
that 50% of the observations are above the median and 50% of the
observations are below the median. In other words, the median is the middle
value when all the observations are placed in ranked order (Gray 2009:578;
Saunders et al. 2009:444). The range of the data set is the difference between
the largest (highest or maximum) and the smallest (lowest or minimum)
observation or value within the data set. The standard deviation is a measure of
the spread of the data about the mean (average) of the data set. (Gray
2009:580-581; Saunders et al. 2009:447).
Table 7.1 provides a summary of the descriptive statistics of the valuations for
the four selected businesses over an eight-year period as from 2004 to 2011.
The mean, median, minimum, maximum, range and standard deviation of each
valuation method for the four selected businesses are presented in Table 7.1.
All valuations are given to the nearest Rand. The same descriptive statistics will
also be provided for the share prices of the four selected businesses and will
also be discussed in the following sections.
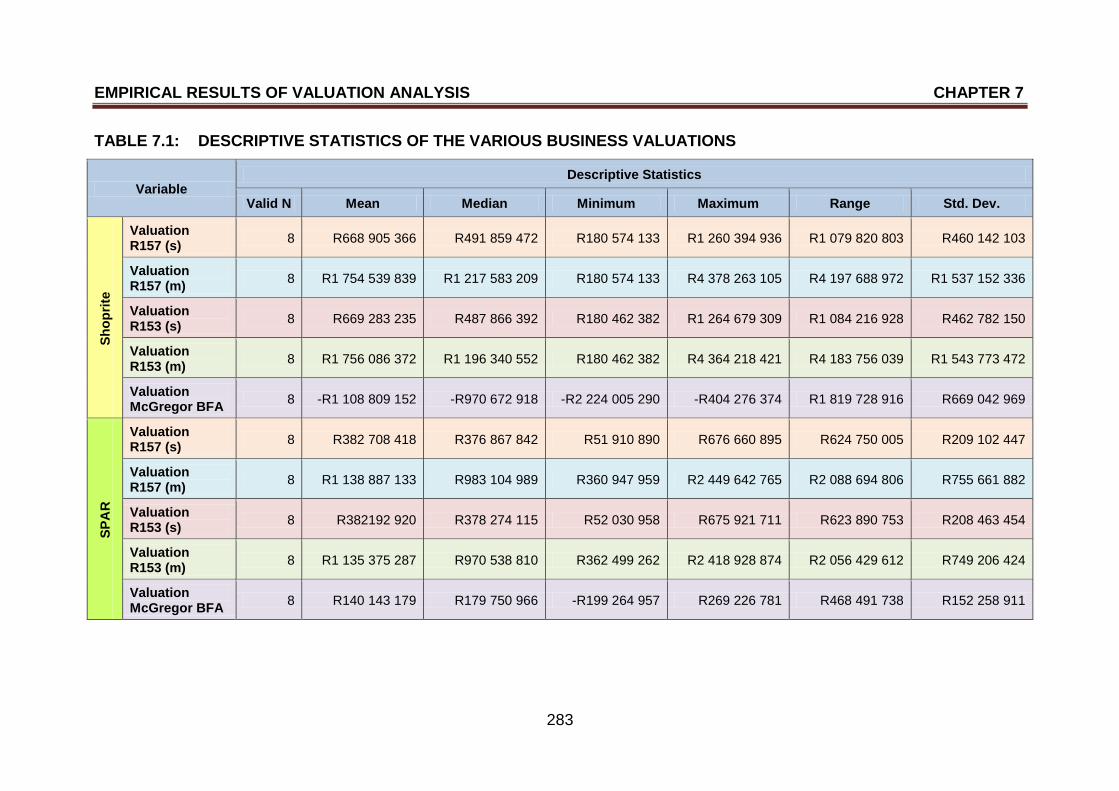
EMPIRICAL RESULTS OF VALUATION ANALYSIS CHAPTER 7
283
TABLE 7.1: DESCRIPTIVE STATISTICS OF THE VARIOUS BUSINESS VALUATIONS
Variable Descriptive Statistics
Valid N Mean Median Minimum Maximum Range Std. Dev.
Sh
op
rite
Valuation R157 (s)
8 R668 905 366 R491 859 472 R180 574 133 R1 260 394 936 R1 079 820 803 R460 142 103
Valuation R157 (m)
8 R1 754 539 839 R1 217 583 209 R180 574 133 R4 378 263 105 R4 197 688 972 R1 537 152 336
Valuation R153 (s)
8 R669 283 235 R487 866 392 R180 462 382 R1 264 679 309 R1 084 216 928 R462 782 150
Valuation R153 (m)
8 R1 756 086 372 R1 196 340 552 R180 462 382 R4 364 218 421 R4 183 756 039 R1 543 773 472
Valuation McGregor BFA
8 -R1 108 809 152 -R970 672 918 -R2 224 005 290 -R404 276 374 R1 819 728 916 R669 042 969
SP
AR
Valuation R157 (s)
8 R382 708 418 R376 867 842 R51 910 890 R676 660 895 R624 750 005 R209 102 447
Valuation R157 (m)
8 R1 138 887 133 R983 104 989 R360 947 959 R2 449 642 765 R2 088 694 806 R755 661 882
Valuation R153 (s)
8 R382192 920 R378 274 115 R52 030 958 R675 921 711 R623 890 753 R208 463 454
Valuation R153 (m)
8 R1 135 375 287 R970 538 810 R362 499 262 R2 418 928 874 R2 056 429 612 R749 206 424
Valuation McGregor BFA
8 R140 143 179 R179 750 966 -R199 264 957 R269 226 781 R468 491 738 R152 258 911
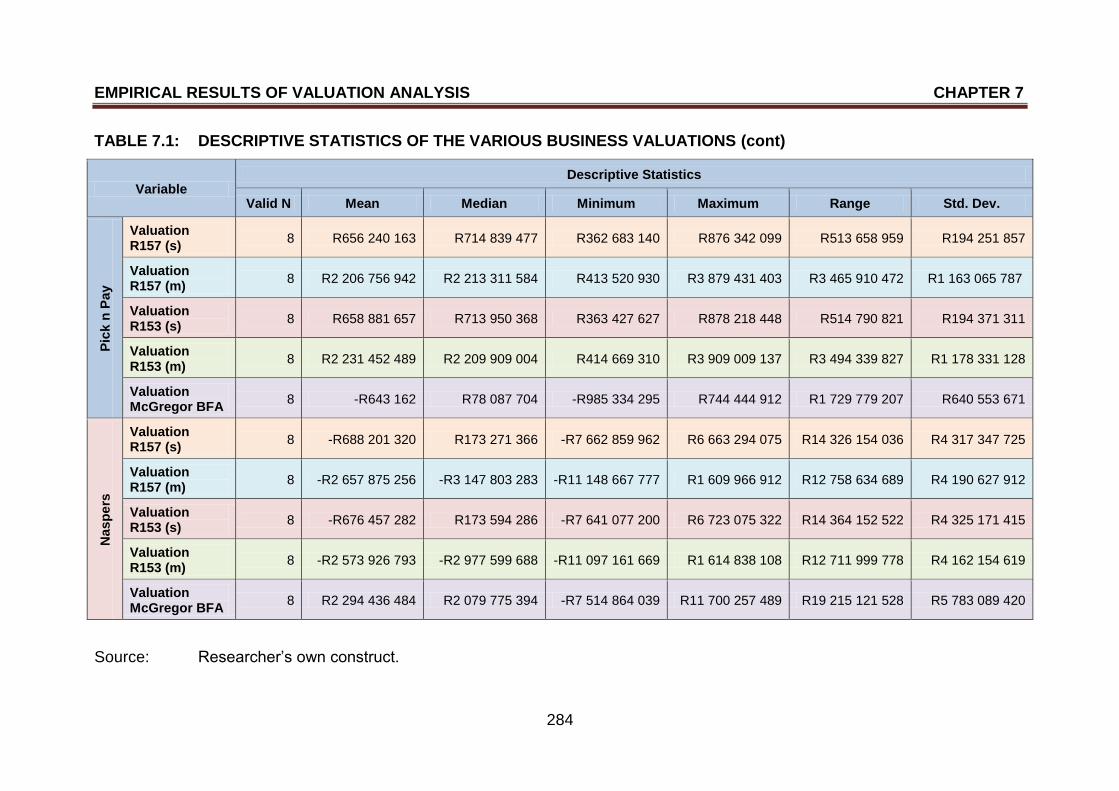
EMPIRICAL RESULTS OF VALUATION ANALYSIS CHAPTER 7
284
TABLE 7.1: DESCRIPTIVE STATISTICS OF THE VARIOUS BUSINESS VALUATIONS (cont)
Variable Descriptive Statistics
Valid N Mean Median Minimum Maximum Range Std. Dev.
Pic
k n
Pay
Valuation R157 (s)
8 R656 240 163 R714 839 477 R362 683 140 R876 342 099 R513 658 959 R194 251 857
Valuation R157 (m)
8 R2 206 756 942 R2 213 311 584 R413 520 930 R3 879 431 403 R3 465 910 472 R1 163 065 787
Valuation R153 (s)
8 R658 881 657 R713 950 368 R363 427 627 R878 218 448 R514 790 821 R194 371 311
Valuation R153 (m)
8 R2 231 452 489 R2 209 909 004 R414 669 310 R3 909 009 137 R3 494 339 827 R1 178 331 128
Valuation McGregor BFA
8 -R643 162 R78 087 704 -R985 334 295 R744 444 912 R1 729 779 207 R640 553 671
Nasp
ers
Valuation R157 (s)
8 -R688 201 320 R173 271 366 -R7 662 859 962 R6 663 294 075 R14 326 154 036 R4 317 347 725
Valuation R157 (m)
8 -R2 657 875 256 -R3 147 803 283 -R11 148 667 777 R1 609 966 912 R12 758 634 689 R4 190 627 912
Valuation R153 (s)
8 -R676 457 282 R173 594 286 -R7 641 077 200 R6 723 075 322 R14 364 152 522 R4 325 171 415
Valuation R153 (m)
8 -R2 573 926 793 -R2 977 599 688 -R11 097 161 669 R1 614 838 108 R12 711 999 778 R4 162 154 619
Valuation McGregor BFA
8 R2 294 436 484 R2 079 775 394 -R7 514 864 039 R11 700 257 489 R19 215 121 528 R5 783 089 420
Source: Researcher‟s own construct.
EMPIRICAL RESULTS OF VALUATION ANALYSIS CHAPTER 7
285
A discussion of the basic descriptive statistics as presented in Table 7.1 will be
presented in the sections to follow.
7.2.1 Single period valuations using the R157 government bond as the risk-free
rate
The results highlighted in light orange as presented Table 7.1 will be reported
on for each of the four businesses. The year-on-year valuations used to
calculate the basic descriptive statistics are for the period 2004 to 2011 and the
R157 government bond was used as the risk-free rate.
The average (mean) value for Shoprite was R668 905 366 and the median
value of Shoprite was R491 859 472. The lowest (minimum) value was
R180 574 133 and the highest (maximum) value was R1 260 394 936.
Therefore the range of the values for Shoprite was R1 079 820 803. The
standard deviation was R460 142 103.
The average (mean) value for SPAR was R382 708 418 and the median value
of SPAR was R376 867 842. The lowest (minimum) value was R51 910 890
and the highest (maximum) value was R67 6660 895. Therefore the range of
the values for Shoprite was R624 750 005. The standard deviation was
R209 102 447.
The average (mean) value for PnP was R656 240 163 and the median value of
PnP was R714 839 477. The lowest (minimum) value was R362 683 140 and
the highest (maximum) value was R876 342 099. Therefore the range of the
values for Shoprite was R513 658 959. The standard deviation was
R194 251 857.
The average (mean) value for Naspers was a negative value of R688 201 320
and the median value of Naspers was R173 271 366. The lowest (minimum)
value was a negative value of R7 662 859 962 and the highest (maximum)
value was R6 663 294 075. Therefore the range of the values for Shoprite was
R14 326 154 036. The standard deviation was R4 317 347 725.
EMPIRICAL RESULTS OF VALUATION ANALYSIS CHAPTER 7
286
7.2.2 Multiple period valuations using the R157 government bond as the risk-
free rate
The results highlighted in light blue as presented Table 7.1 will be reported on
for each of the four businesses. The compounding year valuations used to
calculate the basic descriptive statistics are for the period 2004 to 2011 and the
R157 government bond was used as the risk-free rate.
The average (mean) value for Shoprite was R1 754 539 839 and the median
value was R1 217 583 209. The lowest (minimum) value was R180 574 133
and the highest (maximum) value was R4 378 263 105. Therefore the value
range for Shoprite was R4 197 688 972. The standard deviation was
R1 537 152 336.
The average (mean) value for SPAR was R1 138 887 133 and the median
value was R983 104 989. The lowest (minimum) value was R360 947 959 and
the highest (maximum) value was R2 449 642 765. Therefore the value range
for Shoprite was R2 088 694 806. The standard deviation was R755 661 882.
The average (mean) value for PnP was R2 206 756 942 and the median value
was R2 213 311 584. The lowest (minimum) value was R413 520 930 and the
highest (maximum) value was R3 879 431 403. Therefore the value range for
Shoprite was R3 465 910 472. The standard deviation was R1 163 065 787.
The average (mean) value for Naspers was a negative value of R2 657 875 256
and the median value was a negative value of R3 147 803 283. The lowest
(minimum) value was a negative value of R11 148 667 777 and the highest
(maximum) value was R1 609 966 912. Therefore the value range for Shoprite
was R12 758 634 689. The standard deviation was R4 190 627 912.
7.2.3 Single period valuations using the R153 government bond as the risk-free
rate
The results highlighted in light pink as presented Table 7.1 will be reported on
for each of the four businesses. The year-on-year valuations used to calculate
EMPIRICAL RESULTS OF VALUATION ANALYSIS CHAPTER 7
287
the basic descriptive statistics are for the period 2004 to 2011 and the R153
government bond was used as the risk-free rate.
The average (mean) value for Shoprite was R669 283 235 and the median
value was R487 866 392. The lowest (minimum) value was R180 462 382 and
the highest (maximum) value was R1 264 679 309. Therefore the value range
for Shoprite was R1 084 216 928. The standard deviation was R462 782 150.
The average (mean) value for SPAR was R382 192 920 and the median value
was R378 274 115. The lowest (minimum) value was R52 030 958 and the
highest (maximum) value was R9 675 921 711. Therefore the value range for
SPAR was R623 890 753. The standard deviation was R208 463 454.
The average (mean) value for PnP was R658 881 657 and the median value
was R3713 950 368. The lowest (minimum) value was R363 427 627 and the
highest (maximum) value was R878 218 448. Therefore the value range for
Shoprite was R514 790 821. The standard deviation was R194 371 311.
The average (mean) value for Naspers was a negative value of R676 457 282
and the median value was a positive value of R173 594 286. The lowest
(minimum) value was a negative value of R7 641 077 200 and the highest
(maximum) value was a positive value of R6 723 075 322. Therefore the value
range for Shoprite was R14 364 152 522. The standard deviation was
R4 325 171 415.
7.2.4 Multiple period valuations using the R153 government bond as the risk-
free rate
The results highlighted in light green as presented Table 7.1 will be reported on
for each of the four businesses. The compounding year valuations used to
calculate the basic descriptive statistics are for the period 2004 to 2011 and the
R153 government bond was used as the risk-free rate.
The average (mean) value for Shoprite was R1 756 086 372 and the median
value was R1 196 340 552. The lowest (minimum) value was R180 462 382
EMPIRICAL RESULTS OF VALUATION ANALYSIS CHAPTER 7
288
and the highest (maximum) value was R4 364 218 421. Therefore the value
range for Shoprite was R4 183 756 039. The standard deviation was
R1 543 773 472.
The average (mean) value for SPAR was R1 135 375 287 and the median
value was R970 538 810. The lowest (minimum) value was R362 499 262 and
the highest (maximum) value was R2 418 928 874. Therefore the value range
for Shoprite was R2 056 429 612. The standard deviation was R749 206 424.
The average (mean) value for PnP was R2 231 452 489 and the median value
was R2 209 909 004. The lowest (minimum) value was R414 669 310 and the
highest (maximum) value was R3 909 009 137. Therefore the value range for
Shoprite was R3 494 339 827. The standard deviation was R1 178 331 128.
The average (mean) value for Naspers was a negative figure of R2 573 926 793
and the median value was a negative figure of R2 977 599 688. The lowest
(minimum) value was a negative figure of R11 097 161 669 and the highest
(maximum) value was a positive figure of R1 614 838 108. Therefore the value
range for Shoprite was R12 711 999 778. The standard deviation was
R4 162 154 619.
7.2.5 Valuations as calculated by McGregor BFA Fin24Expert
The results highlighted in light purple as presented Table 7.1 will be reported on
for each of the four businesses. The valuations used to calculate the basic
descriptive statistics are for the period 2004 to 2011 and were calculated by
McGregor BFA Fin24Expert.
The average (mean) value for Shoprite for the eight-year period was a negative
value of R1 108 809 152 and the median value was also a negative value of
R970 672 918. The lowest (minimum) value was a negative value of
R2 224 005 290 and the highest (maximum) value was also a negative value of
R404 276 374. Therefore the value range for Shoprite was R1 819 728 916.
The standard deviation was R669 042 969.
EMPIRICAL RESULTS OF VALUATION ANALYSIS CHAPTER 7
289
The average (mean) value for SPAR for the eight-year period was
R140 143 179 and the median value was R179 750 966. The lowest (minimum)
value was a negative value of R199 264 957 and the highest (maximum) value
was a positive value of R269 226 781. Therefore the value range for Shoprite
was R468 491 738. The standard deviation was R152 258 911.
The average (mean) value for PnP for the eight-year period was a negative
figure of R643 612 and the median value was a positive figure of R78 087 704.
The lowest (minimum) value was a negative figure of R985 334 295 and the
highest (maximum) value was a positive figure of R744 444 912. Therefore the
value range for Shoprite was R1 729 779 207. The standard deviation was
R640 553 671.
The average (mean) value for Naspers for the eight-year period was
R2 294 436 484 and the median value was R2 070 775 394. The lowest
(minimum) value was a negative figure of R7 514 864 039 and the highest
(maximum) value was a positive figure of R11 700 257 489. Therefore the value
range for Shoprite was R12 215 121 528. The standard deviation was
R5 782 089 420.
7.2.6 Descriptive statistics of the share prices over the eight-year period
Table 7.2 summarises the descriptive statistics of the share prices over the
eight-year period of the four selected businesses.
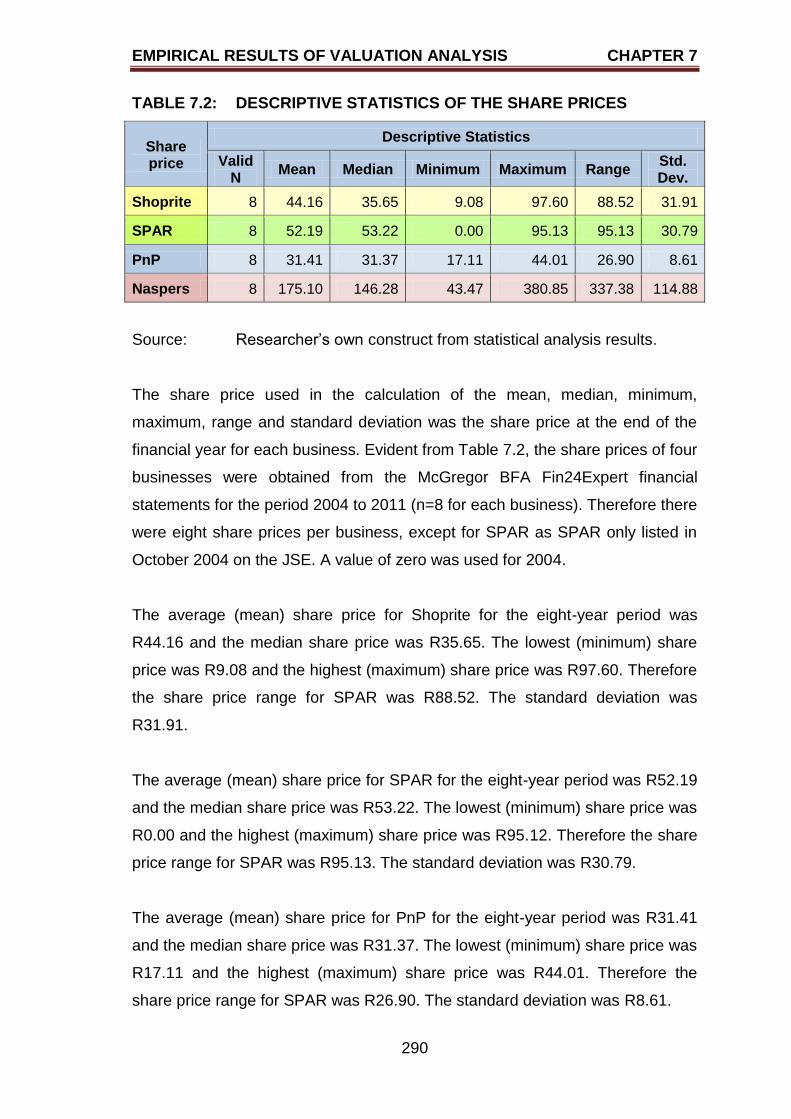
EMPIRICAL RESULTS OF VALUATION ANALYSIS CHAPTER 7
290
TABLE 7.2: DESCRIPTIVE STATISTICS OF THE SHARE PRICES
Share price
Descriptive Statistics
Valid N
Mean Median Minimum Maximum Range Std. Dev.
Shoprite 8 44.16 35.65 9.08 97.60 88.52 31.91
SPAR 8 52.19 53.22 0.00 95.13 95.13 30.79
PnP 8 31.41 31.37 17.11 44.01 26.90 8.61
Naspers 8 175.10 146.28 43.47 380.85 337.38 114.88
Source: Researcher‟s own construct from statistical analysis results.
The share price used in the calculation of the mean, median, minimum,
maximum, range and standard deviation was the share price at the end of the
financial year for each business. Evident from Table 7.2, the share prices of four
businesses were obtained from the McGregor BFA Fin24Expert financial
statements for the period 2004 to 2011 (n=8 for each business). Therefore there
were eight share prices per business, except for SPAR as SPAR only listed in
October 2004 on the JSE. A value of zero was used for 2004.
The average (mean) share price for Shoprite for the eight-year period was
R44.16 and the median share price was R35.65. The lowest (minimum) share
price was R9.08 and the highest (maximum) share price was R97.60. Therefore
the share price range for SPAR was R88.52. The standard deviation was
R31.91.
The average (mean) share price for SPAR for the eight-year period was R52.19
and the median share price was R53.22. The lowest (minimum) share price was
R0.00 and the highest (maximum) share price was R95.12. Therefore the share
price range for SPAR was R95.13. The standard deviation was R30.79.
The average (mean) share price for PnP for the eight-year period was R31.41
and the median share price was R31.37. The lowest (minimum) share price was
R17.11 and the highest (maximum) share price was R44.01. Therefore the
share price range for SPAR was R26.90. The standard deviation was R8.61.
EMPIRICAL RESULTS OF VALUATION ANALYSIS CHAPTER 7
291
The average (mean) share price for Naspers for the eight-year period was
R175.10 and the median share price was R146.28. The lowest (minimum)
share price was R43.47 and the highest (maximum) share price was R380.85.
Therefore the share price range for Naspers was R337.38. The standard
deviation was R114.88.
In conclusion it is evident that all the businesses experienced extraordinary
growth in the share prices with the exception of PnP (increased with only
R26.90 over the eight-year period). The share price of Naspers showed the
highest change in share price of R337.88 over the eight-year period. The
dispersion of the values of all the businesses is relatively small, with all the
standard deviations being smaller than the mean values, with PnP having the
smallest dispersion.
7.2.7 Remarks regarding the results of the descriptive statistics
Although the values of the standard deviations are large, the standard
deviations are relatively small in comparison to the mean values. There are a
few exceptions, with all the standard deviations of Naspers being greater than
50% as the standard deviations are larger than the mean values. The standard
deviations of Naspers, regardless of the valuation approach used, are also
greater than the mean values, that is, the standard deviations are greater than
50%.
It is clear from the valuations as presented in Table 7.1 that the values
calculated by McGregor BFA Fin24Expert differ vastly from the values
calculated using the DCF approach. An explanation for the differences is that
the valuations done by McGregor BFA Fin24Expert are based on share price
and not on the free cash flow of the business as is the case with the DCF
approach.
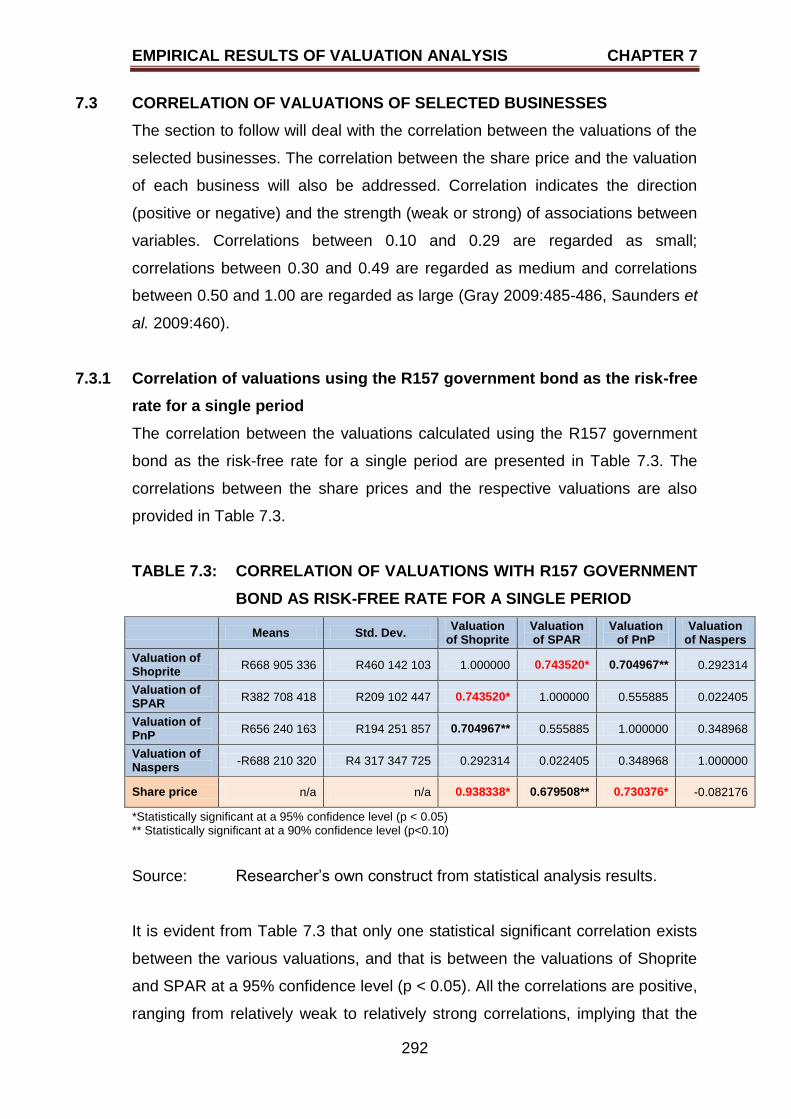
EMPIRICAL RESULTS OF VALUATION ANALYSIS CHAPTER 7
292
7.3 CORRELATION OF VALUATIONS OF SELECTED BUSINESSES
The section to follow will deal with the correlation between the valuations of the
selected businesses. The correlation between the share price and the valuation
of each business will also be addressed. Correlation indicates the direction
(positive or negative) and the strength (weak or strong) of associations between
variables. Correlations between 0.10 and 0.29 are regarded as small;
correlations between 0.30 and 0.49 are regarded as medium and correlations
between 0.50 and 1.00 are regarded as large (Gray 2009:485-486, Saunders et
al. 2009:460).
7.3.1 Correlation of valuations using the R157 government bond as the risk-free
rate for a single period
The correlation between the valuations calculated using the R157 government
bond as the risk-free rate for a single period are presented in Table 7.3. The
correlations between the share prices and the respective valuations are also
provided in Table 7.3.
TABLE 7.3: CORRELATION OF VALUATIONS WITH R157 GOVERNMENT
BOND AS RISK-FREE RATE FOR A SINGLE PERIOD
Means Std. Dev. Valuation
of Shoprite Valuation of SPAR
Valuation of PnP
Valuation of Naspers
Valuation of Shoprite
R668 905 336 R460 142 103 1.000000 0.743520* 0.704967** 0.292314
Valuation of SPAR
R382 708 418 R209 102 447 0.743520* 1.000000 0.555885 0.022405
Valuation of PnP
R656 240 163 R194 251 857 0.704967** 0.555885 1.000000 0.348968
Valuation of Naspers
-R688 210 320 R4 317 347 725 0.292314 0.022405 0.348968 1.000000
Share price n/a n/a 0.938338* 0.679508** 0.730376* -0.082176
*Statistically significant at a 95% confidence level (p < 0.05) ** Statistically significant at a 90% confidence level (p<0.10)
Source: Researcher‟s own construct from statistical analysis results.
It is evident from Table 7.3 that only one statistical significant correlation exists
between the various valuations, and that is between the valuations of Shoprite
and SPAR at a 95% confidence level (p < 0.05). All the correlations are positive,
ranging from relatively weak to relatively strong correlations, implying that the
EMPIRICAL RESULTS OF VALUATION ANALYSIS CHAPTER 7
293
movement in the valuations are both either upward or downward. There is a
relatively strong correlation between the valuations of Shoprite and PnP
(0.704967) that are statistically significant at a 90% confidence level (p < 0.10).
The relatively strong correlation between the valuations of SPAR and PnP
(0.555885) is not statistically significant (p > 0.10). Relatively weak correlations
exist between the valuations of Shoprite and Naspers (0.292314), the
valuations of SPAR and Naspers (0.022405) and the valuations of PnP and
Naspers (0.348968), but none of the three are statistically significant (p < 0.10).
Based on the results in Table 7.3, the following conclusions can be made. If one
considers the correlations between the share prices of each business and the
specific valuation under discussion, it is evident that three of the correlations
showed a positive correlation while one indicated a negative correlation. A
strong correlation exists between the share price of Shoprite and the valuation
of Shoprite (0.938338). Relatively strong correlations exist between the share
price of SPAR and the valuation of SPAR (0.679508) and between the share
price of PnP and the valuation of PnP (0.730376). The strong correlation
between the share price of Shoprite and the valuation of Shoprite and the
relatively strong correlation between the share price of PnP and the valuation of
PnP are both statistically significant (p < 0.05), while the relatively strong
correlation between the share price of SPAR and the valuation of SPAR is
statistically significant at a 90% confidence level (p < 0.10). A weak negative
correlation (-0.082176) exists between the share price of Naspers and the
valuation of Naspers, but it is not statistically significant. Based on these
relatively strong positive correlations, the movement in the share price of
Shoprite, SPAR and PnP can be used as a guideline to assess the movement
in the value of the business, implying that if the share price increases, the value
of the business should increase. As the correlation between the share price and
the valuation of Naspers is not statistically significant, it is not possible to draw
the same conclusion as for the statistically significant correlations.
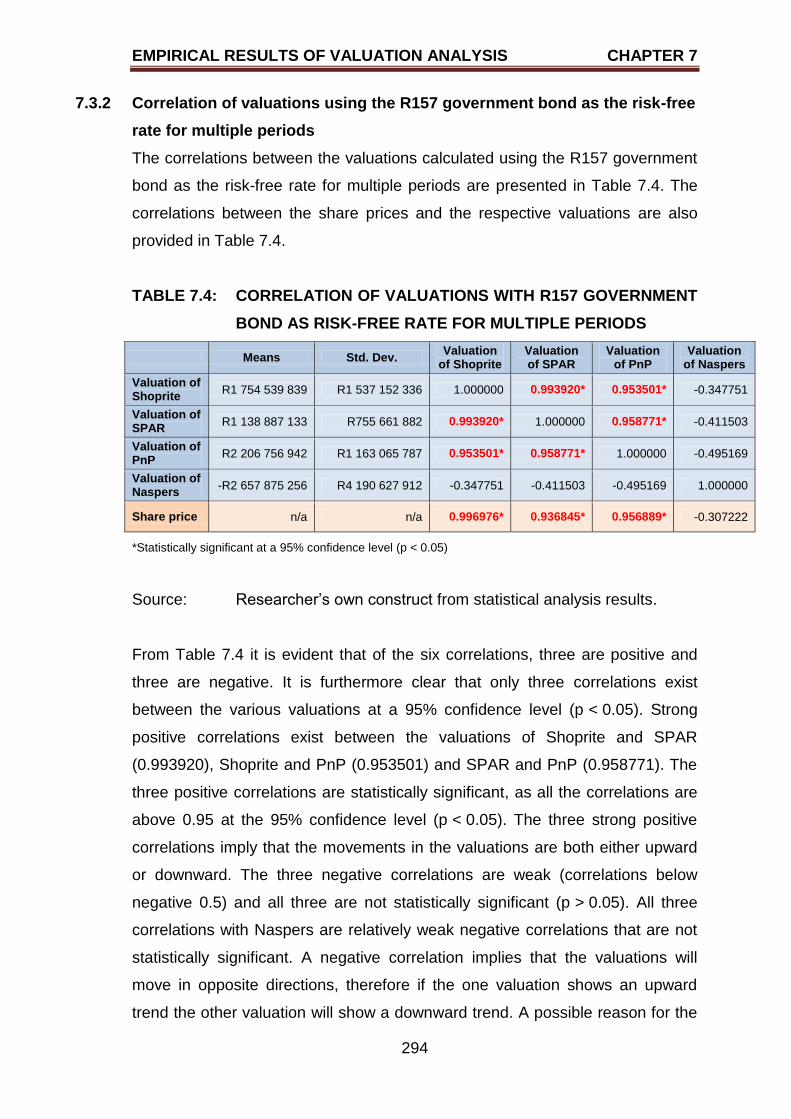
EMPIRICAL RESULTS OF VALUATION ANALYSIS CHAPTER 7
294
7.3.2 Correlation of valuations using the R157 government bond as the risk-free
rate for multiple periods
The correlations between the valuations calculated using the R157 government
bond as the risk-free rate for multiple periods are presented in Table 7.4. The
correlations between the share prices and the respective valuations are also
provided in Table 7.4.
TABLE 7.4: CORRELATION OF VALUATIONS WITH R157 GOVERNMENT
BOND AS RISK-FREE RATE FOR MULTIPLE PERIODS
Means Std. Dev. Valuation
of Shoprite Valuation of SPAR
Valuation of PnP
Valuation of Naspers
Valuation of Shoprite
R1 754 539 839 R1 537 152 336 1.000000 0.993920* 0.953501* -0.347751
Valuation of SPAR
R1 138 887 133 R755 661 882 0.993920* 1.000000 0.958771* -0.411503
Valuation of PnP
R2 206 756 942 R1 163 065 787 0.953501* 0.958771* 1.000000 -0.495169
Valuation of Naspers
-R2 657 875 256 R4 190 627 912 -0.347751 -0.411503 -0.495169 1.000000
Share price n/a n/a 0.996976* 0.936845* 0.956889* -0.307222
*Statistically significant at a 95% confidence level (p < 0.05)
Source: Researcher‟s own construct from statistical analysis results.
From Table 7.4 it is evident that of the six correlations, three are positive and
three are negative. It is furthermore clear that only three correlations exist
between the various valuations at a 95% confidence level (p < 0.05). Strong
positive correlations exist between the valuations of Shoprite and SPAR
(0.993920), Shoprite and PnP (0.953501) and SPAR and PnP (0.958771). The
three positive correlations are statistically significant, as all the correlations are
above 0.95 at the 95% confidence level (p < 0.05). The three strong positive
correlations imply that the movements in the valuations are both either upward
or downward. The three negative correlations are weak (correlations below
negative 0.5) and all three are not statistically significant (p > 0.05). All three
correlations with Naspers are relatively weak negative correlations that are not
statistically significant. A negative correlation implies that the valuations will
move in opposite directions, therefore if the one valuation shows an upward
trend the other valuation will show a downward trend. A possible reason for the
EMPIRICAL RESULTS OF VALUATION ANALYSIS CHAPTER 7
295
negative correlations could be that Naspers is in a different sector from
Shoprite, SPAR and PnP. Another possibility could be because Naspers is an
online business while Shoprite, SPAR and PnP are brick-and-mortar and brick-
and-click businesses. It should also be noted that Naspers is a multinational
company in various industries and therefore there are many external factors
within and outside South Africa that may have an influence on the value of the
business. The three retailers in the food and drug industry (Shoprite, SPAR and
PnP) are operating in the same business environment which is different from
the business environment of Naspers, although some similarities may exist.
Three (Shoprite, SPAR and PnP) of the four businesses show a positive
correlation between the share price and the valuation of that specific business,
while one (Naspers) shows a weak negative correlation. The three positive
correlations are statistically significant (p < 0.05) while the weak negative
correlation is not statistically significant (p > 0.05). Strong positive correlations
exist between the share price and the valuation of Shoprite (0.996976), SPAR
(0.936845) and PnP (0.956889). A weak negative correlation exists between
the share price and the valuation of Naspers (-0.307222). Based on these
strong positive correlations (all above 0.90), the change in the share price of
Shoprite, SPAR and PnP can be used as a guideline to indicate the direction of
the movement in the value of the business, implying that if the share price
increases, the value of the business should increase. No conclusion can be
drawn with regard to Naspers as the correlation is not statistically significant.
7.3.3 Correlation of valuations using the R153 government bond as the risk-free
rate for a single period
The correlations between the valuations calculated using the R153 government
bond as the risk-free rate for a single period are presented in Table 7.5. The
correlations between the share prices and the respective valuations are also
provided in Table 7.5.
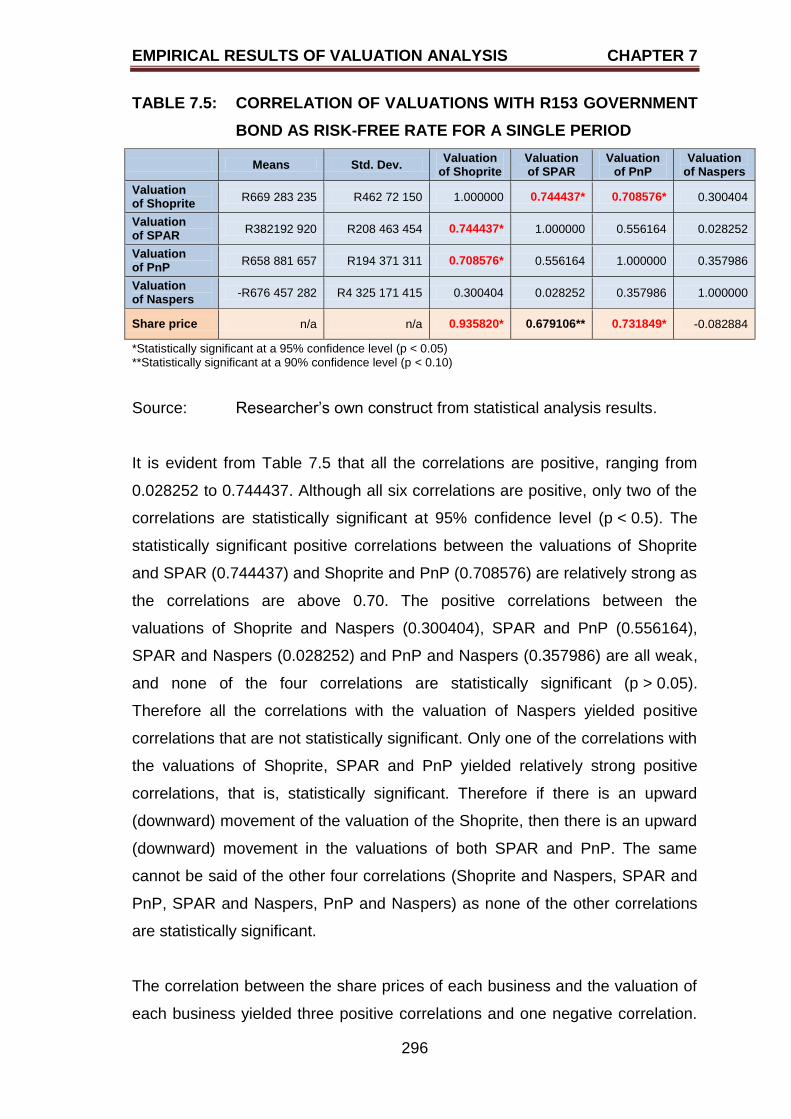
EMPIRICAL RESULTS OF VALUATION ANALYSIS CHAPTER 7
296
TABLE 7.5: CORRELATION OF VALUATIONS WITH R153 GOVERNMENT
BOND AS RISK-FREE RATE FOR A SINGLE PERIOD
Means Std. Dev. Valuation
of Shoprite Valuation of SPAR
Valuation of PnP
Valuation of Naspers
Valuation of Shoprite
R669 283 235 R462 72 150 1.000000 0.744437* 0.708576* 0.300404
Valuation of SPAR
R382192 920 R208 463 454 0.744437* 1.000000 0.556164 0.028252
Valuation of PnP
R658 881 657 R194 371 311 0.708576* 0.556164 1.000000 0.357986
Valuation of Naspers
-R676 457 282 R4 325 171 415 0.300404 0.028252 0.357986 1.000000
Share price n/a n/a 0.935820* 0.679106** 0.731849* -0.082884
*Statistically significant at a 95% confidence level (p < 0.05) **Statistically significant at a 90% confidence level (p < 0.10)
Source: Researcher‟s own construct from statistical analysis results.
It is evident from Table 7.5 that all the correlations are positive, ranging from
0.028252 to 0.744437. Although all six correlations are positive, only two of the
correlations are statistically significant at 95% confidence level (p < 0.5). The
statistically significant positive correlations between the valuations of Shoprite
and SPAR (0.744437) and Shoprite and PnP (0.708576) are relatively strong as
the correlations are above 0.70. The positive correlations between the
valuations of Shoprite and Naspers (0.300404), SPAR and PnP (0.556164),
SPAR and Naspers (0.028252) and PnP and Naspers (0.357986) are all weak,
and none of the four correlations are statistically significant (p > 0.05).
Therefore all the correlations with the valuation of Naspers yielded positive
correlations that are not statistically significant. Only one of the correlations with
the valuations of Shoprite, SPAR and PnP yielded relatively strong positive
correlations, that is, statistically significant. Therefore if there is an upward
(downward) movement of the valuation of the Shoprite, then there is an upward
(downward) movement in the valuations of both SPAR and PnP. The same
cannot be said of the other four correlations (Shoprite and Naspers, SPAR and
PnP, SPAR and Naspers, PnP and Naspers) as none of the other correlations
are statistically significant.
The correlation between the share prices of each business and the valuation of
each business yielded three positive correlations and one negative correlation.
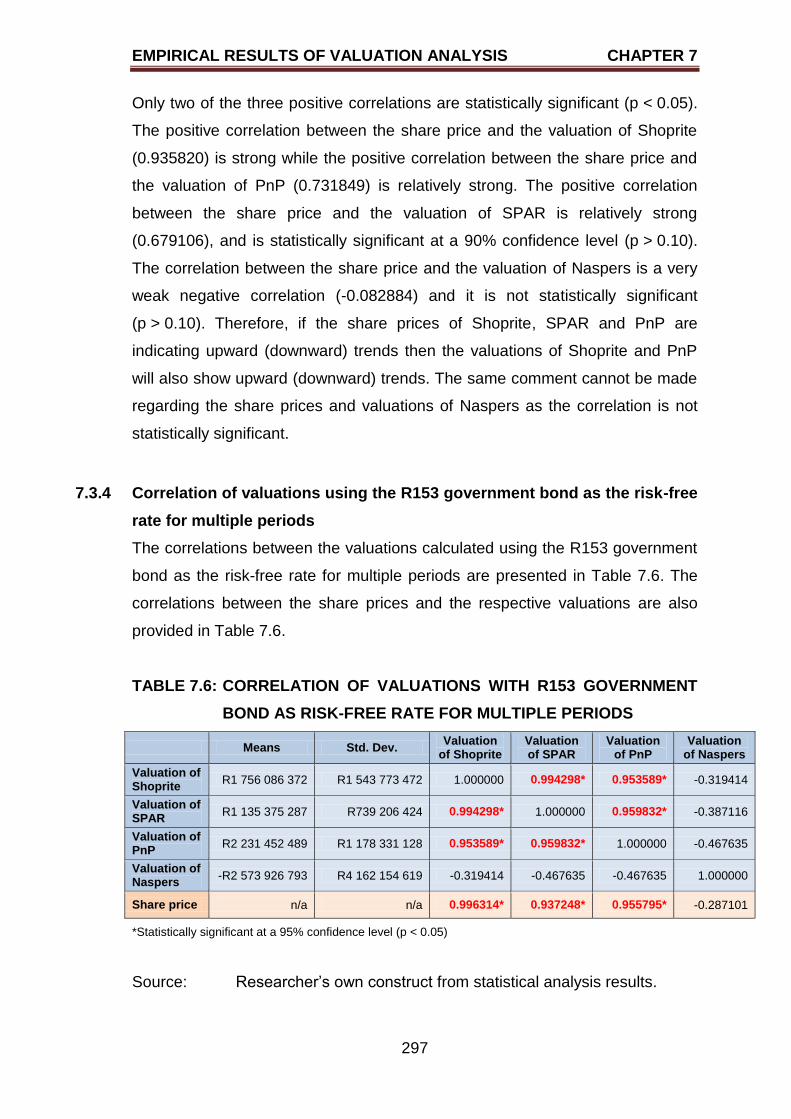
EMPIRICAL RESULTS OF VALUATION ANALYSIS CHAPTER 7
297
Only two of the three positive correlations are statistically significant (p < 0.05).
The positive correlation between the share price and the valuation of Shoprite
(0.935820) is strong while the positive correlation between the share price and
the valuation of PnP (0.731849) is relatively strong. The positive correlation
between the share price and the valuation of SPAR is relatively strong
(0.679106), and is statistically significant at a 90% confidence level (p > 0.10).
The correlation between the share price and the valuation of Naspers is a very
weak negative correlation (-0.082884) and it is not statistically significant
(p > 0.10). Therefore, if the share prices of Shoprite, SPAR and PnP are
indicating upward (downward) trends then the valuations of Shoprite and PnP
will also show upward (downward) trends. The same comment cannot be made
regarding the share prices and valuations of Naspers as the correlation is not
statistically significant.
7.3.4 Correlation of valuations using the R153 government bond as the risk-free
rate for multiple periods
The correlations between the valuations calculated using the R153 government
bond as the risk-free rate for multiple periods are presented in Table 7.6. The
correlations between the share prices and the respective valuations are also
provided in Table 7.6.
TABLE 7.6: CORRELATION OF VALUATIONS WITH R153 GOVERNMENT
BOND AS RISK-FREE RATE FOR MULTIPLE PERIODS
Means Std. Dev. Valuation
of Shoprite Valuation of SPAR
Valuation of PnP
Valuation of Naspers
Valuation of Shoprite
R1 756 086 372 R1 543 773 472 1.000000 0.994298* 0.953589* -0.319414
Valuation of SPAR
R1 135 375 287 R739 206 424 0.994298* 1.000000 0.959832* -0.387116
Valuation of PnP
R2 231 452 489 R1 178 331 128 0.953589* 0.959832* 1.000000 -0.467635
Valuation of Naspers
-R2 573 926 793 R4 162 154 619 -0.319414 -0.467635 -0.467635 1.000000
Share price n/a n/a 0.996314* 0.937248* 0.955795* -0.287101
*Statistically significant at a 95% confidence level (p < 0.05)
Source: Researcher‟s own construct from statistical analysis results.
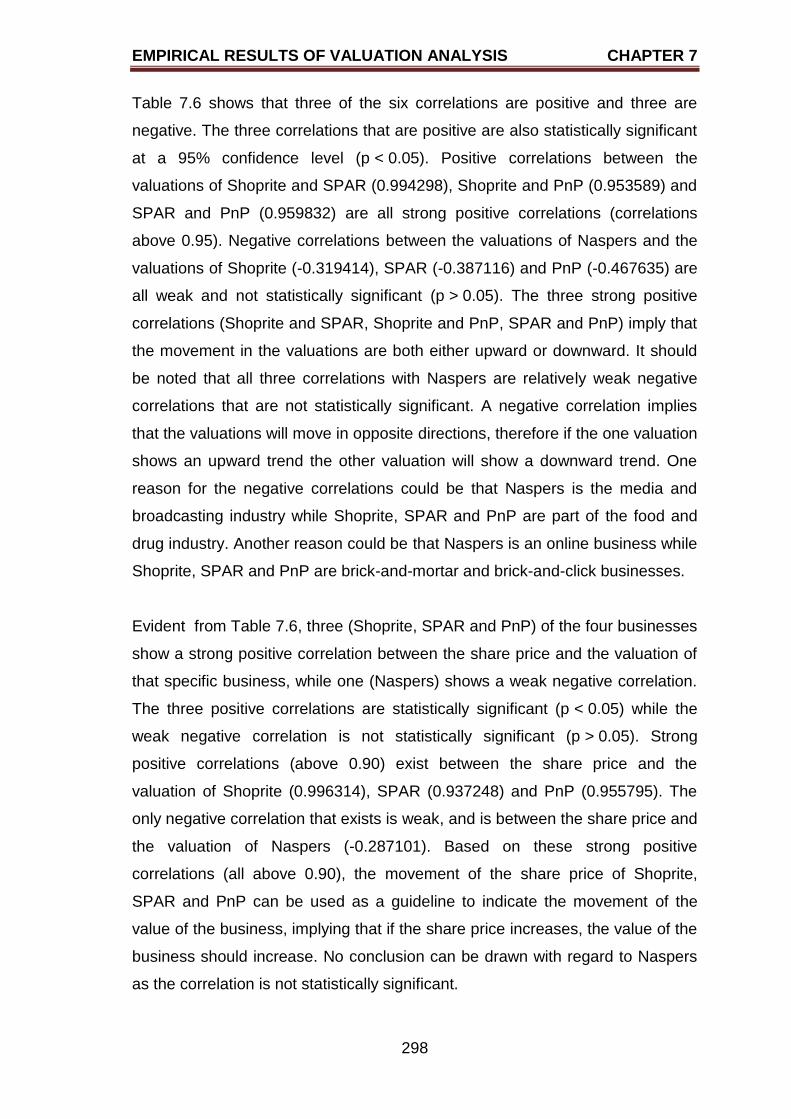
EMPIRICAL RESULTS OF VALUATION ANALYSIS CHAPTER 7
298
Table 7.6 shows that three of the six correlations are positive and three are
negative. The three correlations that are positive are also statistically significant
at a 95% confidence level (p < 0.05). Positive correlations between the
valuations of Shoprite and SPAR (0.994298), Shoprite and PnP (0.953589) and
SPAR and PnP (0.959832) are all strong positive correlations (correlations
above 0.95). Negative correlations between the valuations of Naspers and the
valuations of Shoprite (-0.319414), SPAR (-0.387116) and PnP (-0.467635) are
all weak and not statistically significant (p > 0.05). The three strong positive
correlations (Shoprite and SPAR, Shoprite and PnP, SPAR and PnP) imply that
the movement in the valuations are both either upward or downward. It should
be noted that all three correlations with Naspers are relatively weak negative
correlations that are not statistically significant. A negative correlation implies
that the valuations will move in opposite directions, therefore if the one valuation
shows an upward trend the other valuation will show a downward trend. One
reason for the negative correlations could be that Naspers is the media and
broadcasting industry while Shoprite, SPAR and PnP are part of the food and
drug industry. Another reason could be that Naspers is an online business while
Shoprite, SPAR and PnP are brick-and-mortar and brick-and-click businesses.
Evident from Table 7.6, three (Shoprite, SPAR and PnP) of the four businesses
show a strong positive correlation between the share price and the valuation of
that specific business, while one (Naspers) shows a weak negative correlation.
The three positive correlations are statistically significant (p < 0.05) while the
weak negative correlation is not statistically significant (p > 0.05). Strong
positive correlations (above 0.90) exist between the share price and the
valuation of Shoprite (0.996314), SPAR (0.937248) and PnP (0.955795). The
only negative correlation that exists is weak, and is between the share price and
the valuation of Naspers (-0.287101). Based on these strong positive
correlations (all above 0.90), the movement of the share price of Shoprite,
SPAR and PnP can be used as a guideline to indicate the movement of the
value of the business, implying that if the share price increases, the value of the
business should increase. No conclusion can be drawn with regard to Naspers
as the correlation is not statistically significant.
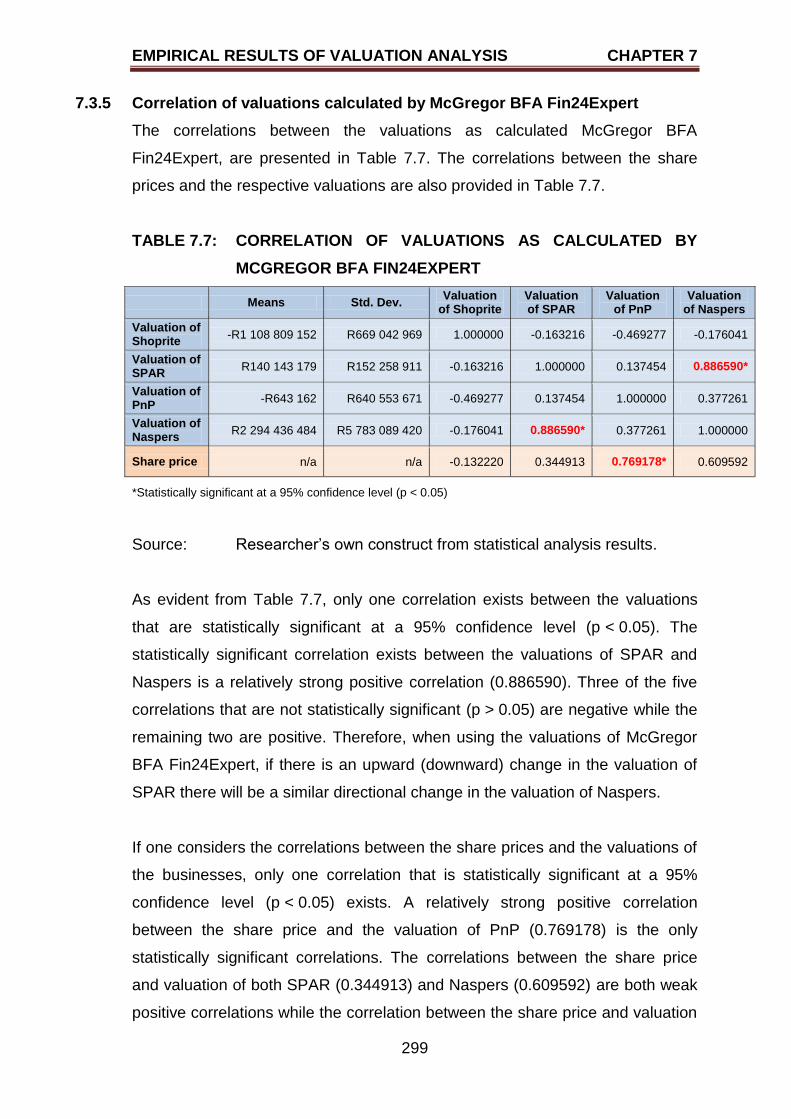
EMPIRICAL RESULTS OF VALUATION ANALYSIS CHAPTER 7
299
7.3.5 Correlation of valuations calculated by McGregor BFA Fin24Expert
The correlations between the valuations as calculated McGregor BFA
Fin24Expert, are presented in Table 7.7. The correlations between the share
prices and the respective valuations are also provided in Table 7.7.
TABLE 7.7: CORRELATION OF VALUATIONS AS CALCULATED BY
MCGREGOR BFA FIN24EXPERT
Means Std. Dev. Valuation
of Shoprite Valuation of SPAR
Valuation of PnP
Valuation of Naspers
Valuation of Shoprite
-R1 108 809 152 R669 042 969 1.000000 -0.163216 -0.469277 -0.176041
Valuation of SPAR
R140 143 179 R152 258 911 -0.163216 1.000000 0.137454 0.886590*
Valuation of PnP
-R643 162 R640 553 671 -0.469277 0.137454 1.000000 0.377261
Valuation of Naspers
R2 294 436 484 R5 783 089 420 -0.176041 0.886590* 0.377261 1.000000
Share price n/a n/a -0.132220 0.344913 0.769178* 0.609592
*Statistically significant at a 95% confidence level (p < 0.05)
Source: Researcher‟s own construct from statistical analysis results.
As evident from Table 7.7, only one correlation exists between the valuations
that are statistically significant at a 95% confidence level (p < 0.05). The
statistically significant correlation exists between the valuations of SPAR and
Naspers is a relatively strong positive correlation (0.886590). Three of the five
correlations that are not statistically significant (p > 0.05) are negative while the
remaining two are positive. Therefore, when using the valuations of McGregor
BFA Fin24Expert, if there is an upward (downward) change in the valuation of
SPAR there will be a similar directional change in the valuation of Naspers.
If one considers the correlations between the share prices and the valuations of
the businesses, only one correlation that is statistically significant at a 95%
confidence level (p < 0.05) exists. A relatively strong positive correlation
between the share price and the valuation of PnP (0.769178) is the only
statistically significant correlations. The correlations between the share price
and valuation of both SPAR (0.344913) and Naspers (0.609592) are both weak
positive correlations while the correlation between the share price and valuation
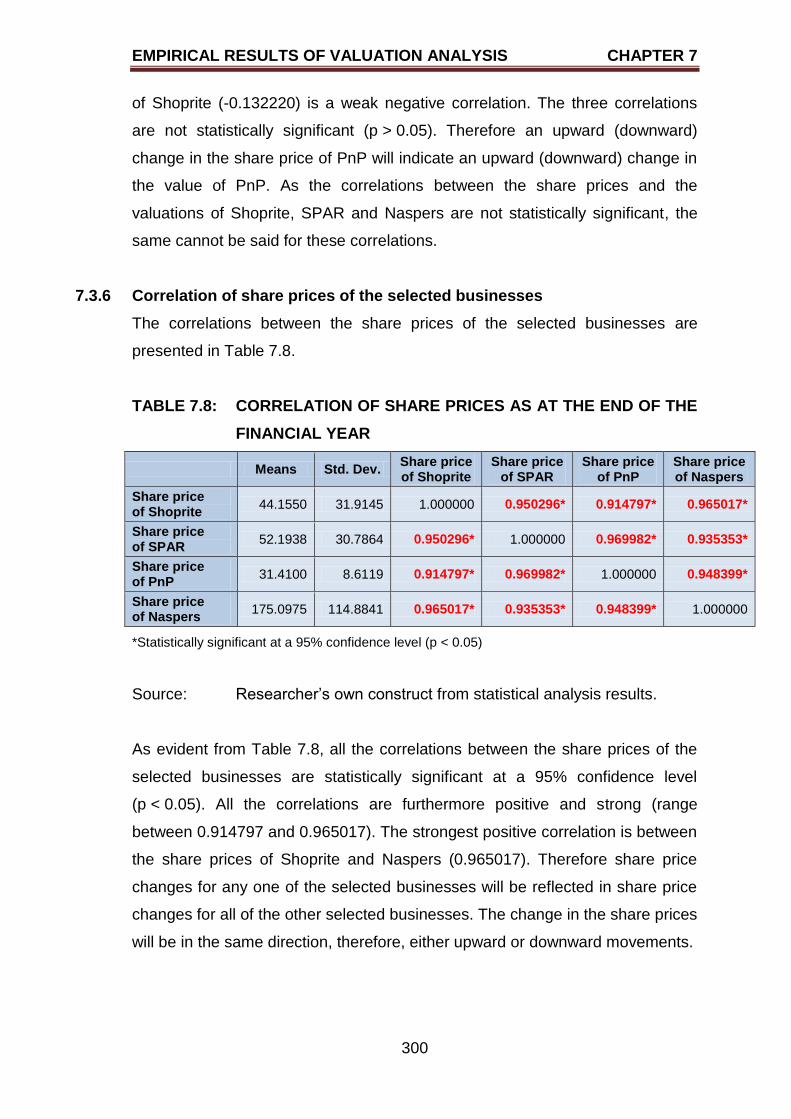
EMPIRICAL RESULTS OF VALUATION ANALYSIS CHAPTER 7
300
of Shoprite (-0.132220) is a weak negative correlation. The three correlations
are not statistically significant (p > 0.05). Therefore an upward (downward)
change in the share price of PnP will indicate an upward (downward) change in
the value of PnP. As the correlations between the share prices and the
valuations of Shoprite, SPAR and Naspers are not statistically significant, the
same cannot be said for these correlations.
7.3.6 Correlation of share prices of the selected businesses
The correlations between the share prices of the selected businesses are
presented in Table 7.8.
TABLE 7.8: CORRELATION OF SHARE PRICES AS AT THE END OF THE
FINANCIAL YEAR
Means Std. Dev. Share price of Shoprite
Share price of SPAR
Share price of PnP
Share price of Naspers
Share price of Shoprite
44.1550 31.9145 1.000000 0.950296* 0.914797* 0.965017*
Share price of SPAR
52.1938 30.7864 0.950296* 1.000000 0.969982* 0.935353*
Share price of PnP
31.4100 8.6119 0.914797* 0.969982* 1.000000 0.948399*
Share price of Naspers
175.0975 114.8841 0.965017* 0.935353* 0.948399* 1.000000
*Statistically significant at a 95% confidence level (p < 0.05)
Source: Researcher‟s own construct from statistical analysis results.
As evident from Table 7.8, all the correlations between the share prices of the
selected businesses are statistically significant at a 95% confidence level
(p < 0.05). All the correlations are furthermore positive and strong (range
between 0.914797 and 0.965017). The strongest positive correlation is between
the share prices of Shoprite and Naspers (0.965017). Therefore share price
changes for any one of the selected businesses will be reflected in share price
changes for all of the other selected businesses. The change in the share prices
will be in the same direction, therefore, either upward or downward movements.
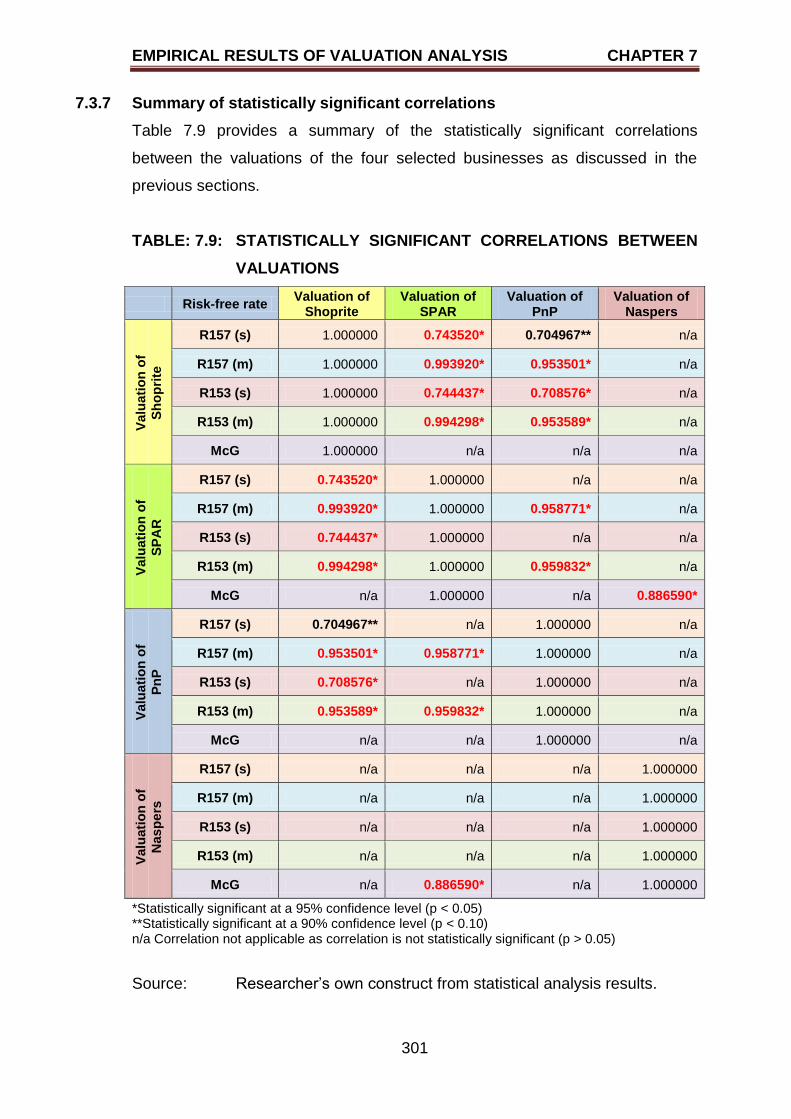
EMPIRICAL RESULTS OF VALUATION ANALYSIS CHAPTER 7
301
7.3.7 Summary of statistically significant correlations
Table 7.9 provides a summary of the statistically significant correlations
between the valuations of the four selected businesses as discussed in the
previous sections.
TABLE: 7.9: STATISTICALLY SIGNIFICANT CORRELATIONS BETWEEN
VALUATIONS
Risk-free rate Valuation of
Shoprite Valuation of
SPAR Valuation of
PnP Valuation of
Naspers
Valu
ati
on
of
Sh
op
rite
R157 (s) 1.000000 0.743520* 0.704967** n/a
R157 (m) 1.000000 0.993920* 0.953501* n/a
R153 (s) 1.000000 0.744437* 0.708576* n/a
R153 (m) 1.000000 0.994298* 0.953589* n/a
McG 1.000000 n/a n/a n/a
Valu
ati
on
of
SP
AR
R157 (s) 0.743520* 1.000000 n/a n/a
R157 (m) 0.993920* 1.000000 0.958771* n/a
R153 (s) 0.744437* 1.000000 n/a n/a
R153 (m) 0.994298* 1.000000 0.959832* n/a
McG n/a 1.000000 n/a 0.886590*
Valu
ati
on
of
Pn
P
R157 (s) 0.704967** n/a 1.000000 n/a
R157 (m) 0.953501* 0.958771* 1.000000 n/a
R153 (s) 0.708576* n/a 1.000000 n/a
R153 (m) 0.953589* 0.959832* 1.000000 n/a
McG n/a n/a 1.000000 n/a
Valu
ati
on
of
Nasp
ers
R157 (s) n/a n/a n/a 1.000000
R157 (m) n/a n/a n/a 1.000000
R153 (s) n/a n/a n/a 1.000000
R153 (m) n/a n/a n/a 1.000000
McG n/a 0.886590* n/a 1.000000
*Statistically significant at a 95% confidence level (p < 0.05) **Statistically significant at a 90% confidence level (p < 0.10) n/a Correlation not applicable as correlation is not statistically significant (p > 0.05)
Source: Researcher‟s own construct from statistical analysis results.
EMPIRICAL RESULTS OF VALUATION ANALYSIS CHAPTER 7
302
From Table 7.9 it is evident that there are only 11 statistically significant
correlations. All the correlations are positive but with varying strengths. When
using the DCF approach with the R157 government bond as the risk-free rate
for a single period valuation, there are two correlations. A relatively strong
positive correlation is between the valuations of Shoprite and SPAR (0.743520)
at a 95% confidence level. The second relatively strong positive correlation at a
90% confidence level exists between the valuations of Shoprite and PnP
(0.704967). When using the DCF approach with the R157 government bond as
the risk-free rate for a multiple period valuation, three correlations exist, namely
between the valuations of Shoprite and SPAR (0.993920), Shoprite and PnP
(0.953501) and SPAR and PnP (0.958771). All three correlations are strong
positive correlations with the correlation between the valuations of Shoprite and
SPAR being the stronger of the two correlations.
When the R153 government bond is used as the risk-free rate in the DCF
approach for a single period valuation, two relatively strong correlations are
found. The relatively strong correlations exist between the valuations of
Shoprite and SPAR (0.744437) and Shoprite and PnP (0.708576) with the
correlation between the valuations of Shoprite and SPAR being the stronger
correlation. When using the DCF approach with the R153 government bond as
the risk-free rate for a multiple period valuation, three correlations exist, namely
between the valuations of Shoprite and SPAR (0.994298), Shoprite and PnP
(0.953589) and SPAR and PnP (0.959832). All three the correlations between
the valuations are found to be strong positive correlations with the correlation
between the valuations of Shoprite and SPAR the strongest.
The correlations between the valuations as calculated by McGregor BFA
Fin24Expert yielded only one correlation between the valuations of SPAR and
Naspers (0.886590). The correlation is positive and strong. None of the
statistically significant correlations are negative. Therefore the correlations that
are statistically significant imply that when the valuation of one business
changes, the valuation of the other business will also change in the same
direction (both valuations will increase or decrease). The majority of the
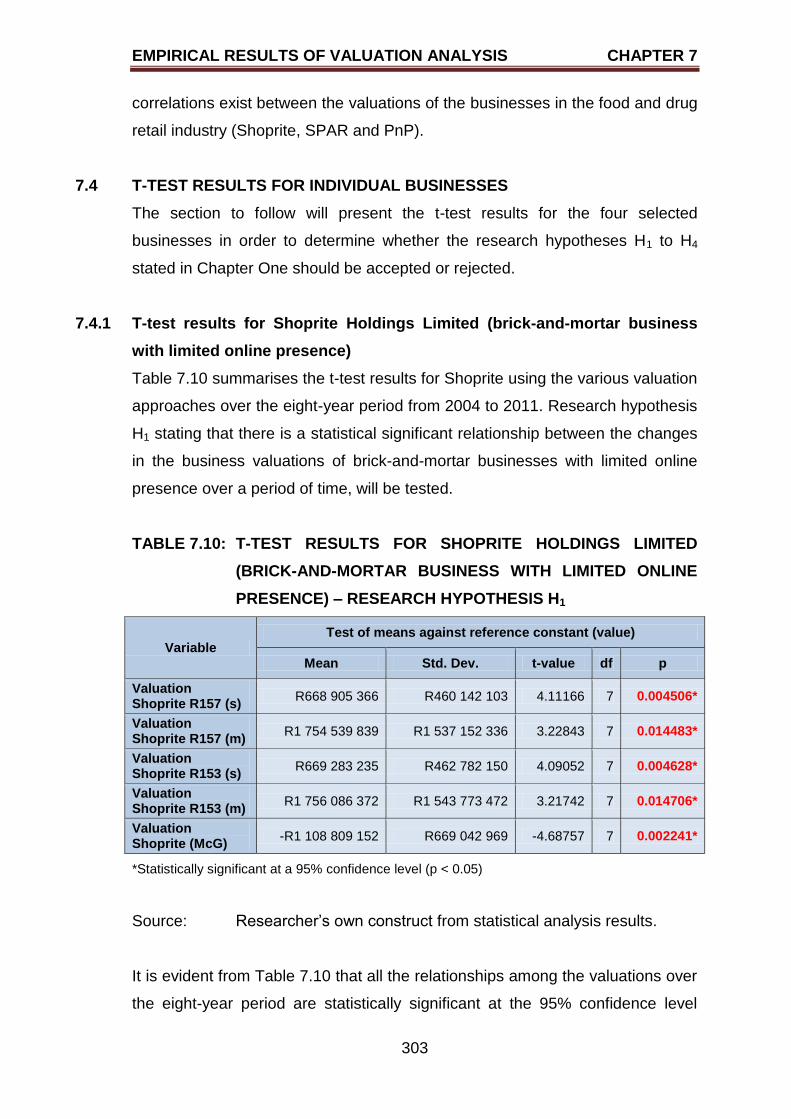
EMPIRICAL RESULTS OF VALUATION ANALYSIS CHAPTER 7
303
correlations exist between the valuations of the businesses in the food and drug
retail industry (Shoprite, SPAR and PnP).
7.4 T-TEST RESULTS FOR INDIVIDUAL BUSINESSES
The section to follow will present the t-test results for the four selected
businesses in order to determine whether the research hypotheses H1 to H4
stated in Chapter One should be accepted or rejected.
7.4.1 T-test results for Shoprite Holdings Limited (brick-and-mortar business
with limited online presence)
Table 7.10 summarises the t-test results for Shoprite using the various valuation
approaches over the eight-year period from 2004 to 2011. Research hypothesis
H1 stating that there is a statistical significant relationship between the changes
in the business valuations of brick-and-mortar businesses with limited online
presence over a period of time, will be tested.
TABLE 7.10: T-TEST RESULTS FOR SHOPRITE HOLDINGS LIMITED
(BRICK-AND-MORTAR BUSINESS WITH LIMITED ONLINE
PRESENCE) – RESEARCH HYPOTHESIS H1
Variable Test of means against reference constant (value)
Mean Std. Dev. t-value df p
Valuation Shoprite R157 (s)
R668 905 366 R460 142 103 4.11166 7 0.004506*
Valuation Shoprite R157 (m)
R1 754 539 839 R1 537 152 336 3.22843 7 0.014483*
Valuation Shoprite R153 (s)
R669 283 235 R462 782 150 4.09052 7 0.004628*
Valuation Shoprite R153 (m)
R1 756 086 372 R1 543 773 472 3.21742 7 0.014706*
Valuation Shoprite (McG)
-R1 108 809 152 R669 042 969 -4.68757 7 0.002241*
*Statistically significant at a 95% confidence level (p < 0.05)
Source: Researcher‟s own construct from statistical analysis results.
It is evident from Table 7.10 that all the relationships among the valuations over
the eight-year period are statistically significant at the 95% confidence level
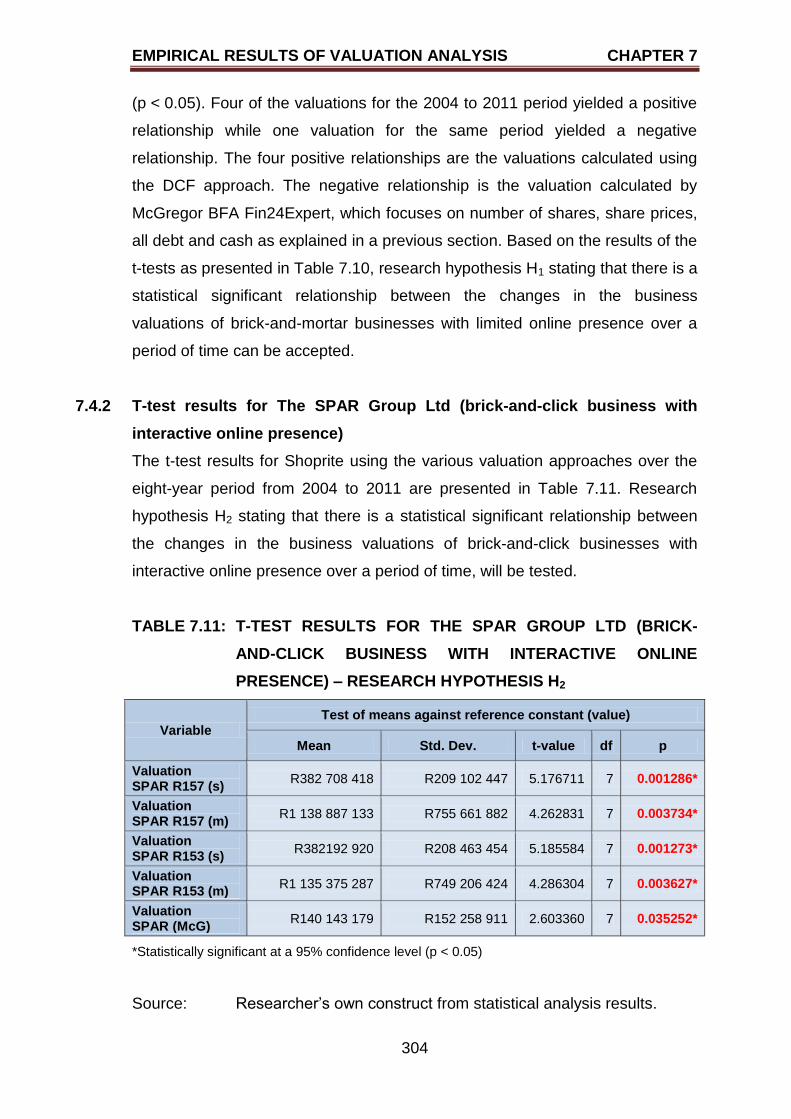
EMPIRICAL RESULTS OF VALUATION ANALYSIS CHAPTER 7
304
(p < 0.05). Four of the valuations for the 2004 to 2011 period yielded a positive
relationship while one valuation for the same period yielded a negative
relationship. The four positive relationships are the valuations calculated using
the DCF approach. The negative relationship is the valuation calculated by
McGregor BFA Fin24Expert, which focuses on number of shares, share prices,
all debt and cash as explained in a previous section. Based on the results of the
t-tests as presented in Table 7.10, research hypothesis H1 stating that there is a
statistical significant relationship between the changes in the business
valuations of brick-and-mortar businesses with limited online presence over a
period of time can be accepted.
7.4.2 T-test results for The SPAR Group Ltd (brick-and-click business with
interactive online presence)
The t-test results for Shoprite using the various valuation approaches over the
eight-year period from 2004 to 2011 are presented in Table 7.11. Research
hypothesis H2 stating that there is a statistical significant relationship between
the changes in the business valuations of brick-and-click businesses with
interactive online presence over a period of time, will be tested.
TABLE 7.11: T-TEST RESULTS FOR THE SPAR GROUP LTD (BRICK-
AND-CLICK BUSINESS WITH INTERACTIVE ONLINE
PRESENCE) – RESEARCH HYPOTHESIS H2
Variable Test of means against reference constant (value)
Mean Std. Dev. t-value df p
Valuation SPAR R157 (s)
R382 708 418 R209 102 447 5.176711 7 0.001286*
Valuation SPAR R157 (m)
R1 138 887 133 R755 661 882 4.262831 7 0.003734*
Valuation SPAR R153 (s)
R382192 920 R208 463 454 5.185584 7 0.001273*
Valuation SPAR R153 (m)
R1 135 375 287 R749 206 424 4.286304 7 0.003627*
Valuation SPAR (McG)
R140 143 179 R152 258 911 2.603360 7 0.035252*
*Statistically significant at a 95% confidence level (p < 0.05)
Source: Researcher‟s own construct from statistical analysis results.
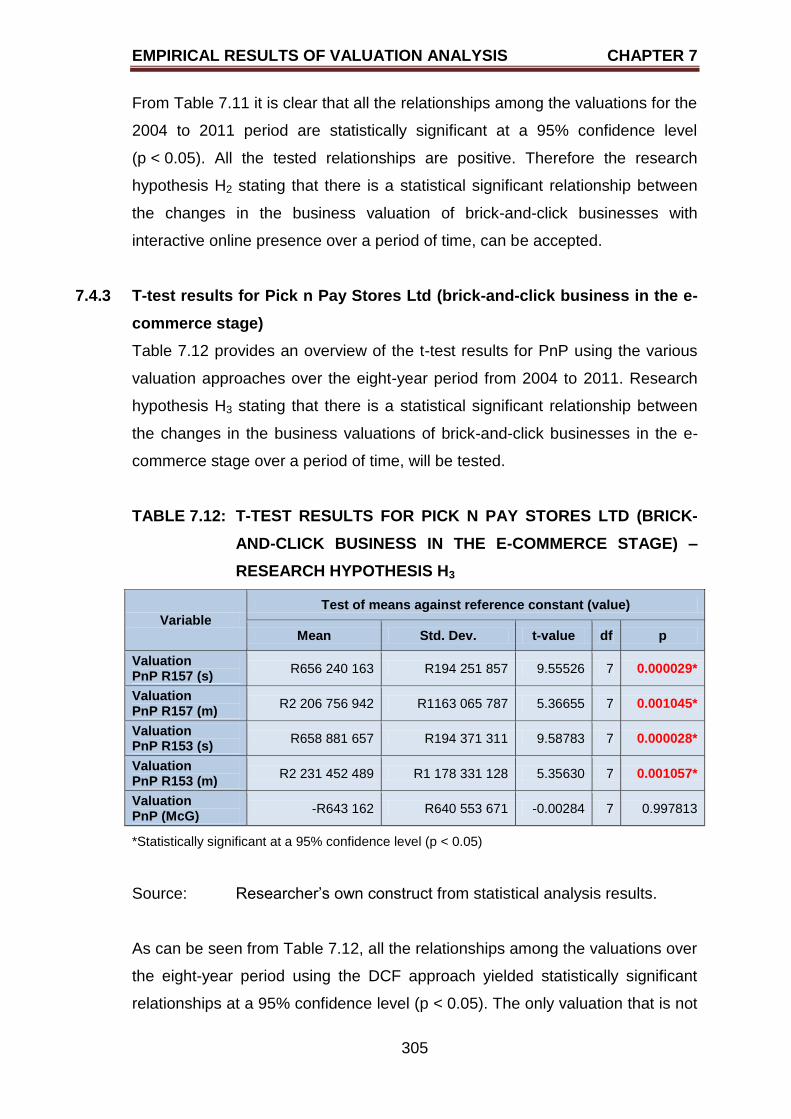
EMPIRICAL RESULTS OF VALUATION ANALYSIS CHAPTER 7
305
From Table 7.11 it is clear that all the relationships among the valuations for the
2004 to 2011 period are statistically significant at a 95% confidence level
(p < 0.05). All the tested relationships are positive. Therefore the research
hypothesis H2 stating that there is a statistical significant relationship between
the changes in the business valuation of brick-and-click businesses with
interactive online presence over a period of time, can be accepted.
7.4.3 T-test results for Pick n Pay Stores Ltd (brick-and-click business in the e-
commerce stage)
Table 7.12 provides an overview of the t-test results for PnP using the various
valuation approaches over the eight-year period from 2004 to 2011. Research
hypothesis H3 stating that there is a statistical significant relationship between
the changes in the business valuations of brick-and-click businesses in the e-
commerce stage over a period of time, will be tested.
TABLE 7.12: T-TEST RESULTS FOR PICK N PAY STORES LTD (BRICK-
AND-CLICK BUSINESS IN THE E-COMMERCE STAGE) –
RESEARCH HYPOTHESIS H3
Variable Test of means against reference constant (value)
Mean Std. Dev. t-value df p
Valuation PnP R157 (s)
R656 240 163 R194 251 857 9.55526 7 0.000029*
Valuation PnP R157 (m)
R2 206 756 942 R1163 065 787 5.36655 7 0.001045*
Valuation PnP R153 (s)
R658 881 657 R194 371 311 9.58783 7 0.000028*
Valuation PnP R153 (m)
R2 231 452 489 R1 178 331 128 5.35630 7 0.001057*
Valuation PnP (McG)
-R643 162 R640 553 671 -0.00284 7 0.997813
*Statistically significant at a 95% confidence level (p < 0.05)
Source: Researcher‟s own construct from statistical analysis results.
As can be seen from Table 7.12, all the relationships among the valuations over
the eight-year period using the DCF approach yielded statistically significant
relationships at a 95% confidence level (p < 0.05). The only valuation that is not
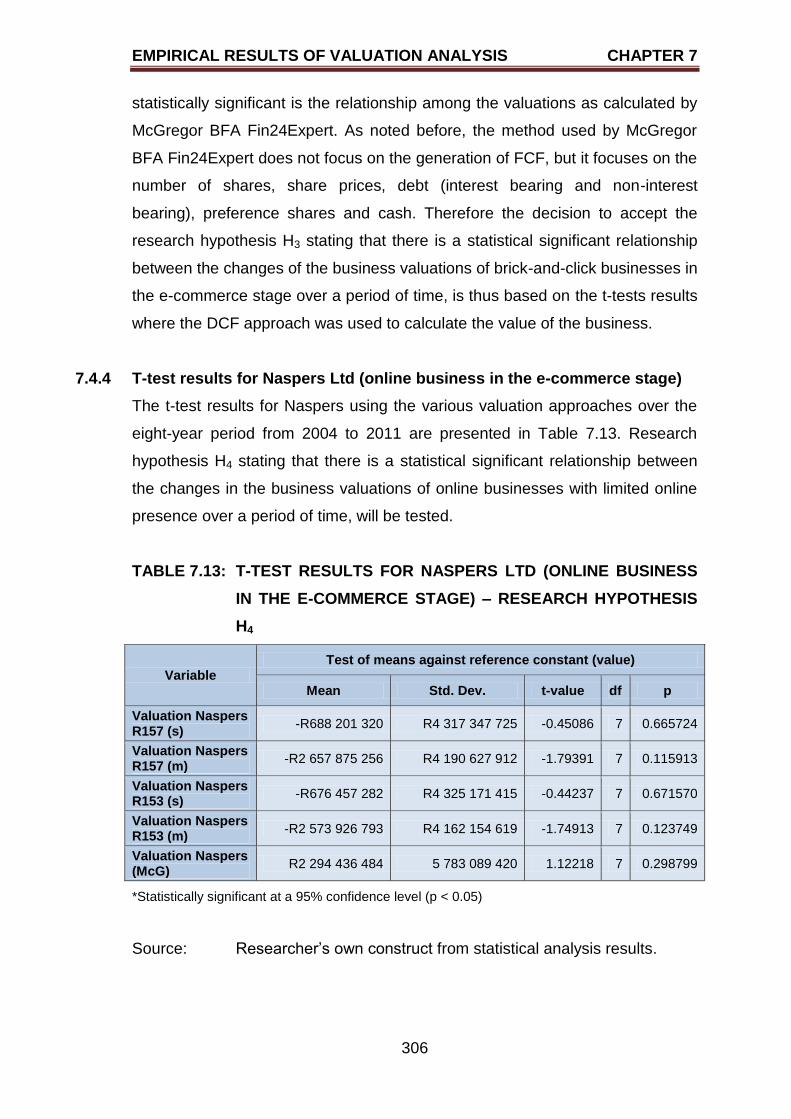
EMPIRICAL RESULTS OF VALUATION ANALYSIS CHAPTER 7
306
statistically significant is the relationship among the valuations as calculated by
McGregor BFA Fin24Expert. As noted before, the method used by McGregor
BFA Fin24Expert does not focus on the generation of FCF, but it focuses on the
number of shares, share prices, debt (interest bearing and non-interest
bearing), preference shares and cash. Therefore the decision to accept the
research hypothesis H3 stating that there is a statistical significant relationship
between the changes of the business valuations of brick-and-click businesses in
the e-commerce stage over a period of time, is thus based on the t-tests results
where the DCF approach was used to calculate the value of the business.
7.4.4 T-test results for Naspers Ltd (online business in the e-commerce stage)
The t-test results for Naspers using the various valuation approaches over the
eight-year period from 2004 to 2011 are presented in Table 7.13. Research
hypothesis H4 stating that there is a statistical significant relationship between
the changes in the business valuations of online businesses with limited online
presence over a period of time, will be tested.
TABLE 7.13: T-TEST RESULTS FOR NASPERS LTD (ONLINE BUSINESS
IN THE E-COMMERCE STAGE) – RESEARCH HYPOTHESIS
H4
Variable Test of means against reference constant (value)
Mean Std. Dev. t-value df p
Valuation Naspers R157 (s)
-R688 201 320 R4 317 347 725 -0.45086 7 0.665724
Valuation Naspers R157 (m)
-R2 657 875 256 R4 190 627 912 -1.79391 7 0.115913
Valuation Naspers R153 (s)
-R676 457 282 R4 325 171 415 -0.44237 7 0.671570
Valuation Naspers R153 (m)
-R2 573 926 793 R4 162 154 619 -1.74913 7 0.123749
Valuation Naspers (McG)
R2 294 436 484 5 783 089 420 1.12218 7 0.298799
*Statistically significant at a 95% confidence level (p < 0.05)
Source: Researcher‟s own construct from statistical analysis results.
EMPIRICAL RESULTS OF VALUATION ANALYSIS CHAPTER 7
307
From Table 7.13 it is evident that none of the relationships among the
valuations are statistically significant at a 95% confidence level (p > 0.05).
Three of the four relationships indicate a negative relationship (the DCF
approached were used to calculate the values) while the valuation calculated by
McGregor is the BFA Fin24Expert only positive relationship, although none of
the four are statistically significant. Based on the results as presented in Table
7.13, the research hypothesis H4 stating that there is a statistical significant
relationship between the changes of the business valuations of online
businesses in the e-commerce stage over a period of time, is rejected.
7.5 DEPENDENT T-TEST RESULTS
The section will present the t-test results for comparing the valuations over the
eight-year period from 2004 to 2011 of the selected businesses with one
another. The results presented will assist in the accepting of rejecting of the
research hypotheses H5 to H10 as formulated in Chapter One.
7.5.1 T-test results when comparing Shoprite Holdings Limited (brick-and-
mortar business with limited online presence) and The SPAR Group Ltd
(brick-and-click business with interactive online presence)
Table 7.14 summarises the t-test results when comparing the various valuations
of Shoprite and SPAR over the eight-year period from 2004 to 2011. Research
hypothesis H5 stating that there is a statistical significant relationship between
the changes in the business valuations of brick-and-click businesses with
limited online presence and brick-and-click businesses with interactive online
presence over a period of time, will be tested.
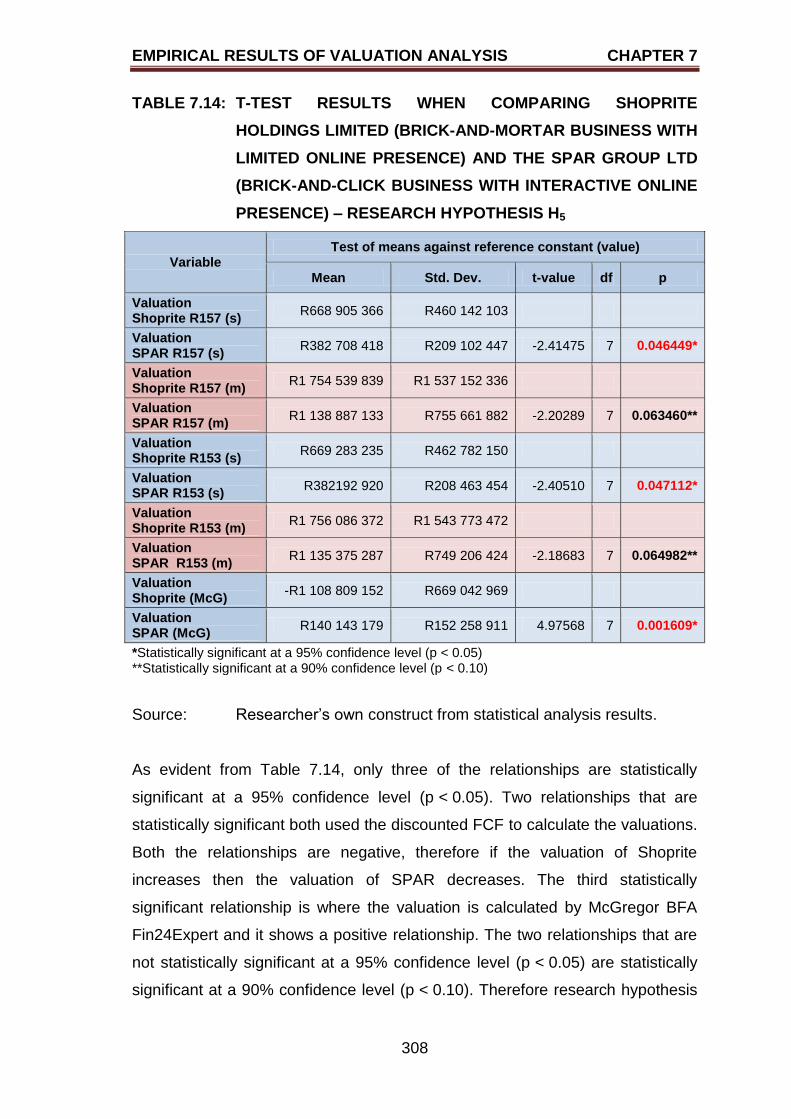
EMPIRICAL RESULTS OF VALUATION ANALYSIS CHAPTER 7
308
TABLE 7.14: T-TEST RESULTS WHEN COMPARING SHOPRITE
HOLDINGS LIMITED (BRICK-AND-MORTAR BUSINESS WITH
LIMITED ONLINE PRESENCE) AND THE SPAR GROUP LTD
(BRICK-AND-CLICK BUSINESS WITH INTERACTIVE ONLINE
PRESENCE) – RESEARCH HYPOTHESIS H5
Variable Test of means against reference constant (value)
Mean Std. Dev. t-value df p
Valuation Shoprite R157 (s)
R668 905 366 R460 142 103
Valuation SPAR R157 (s)
R382 708 418 R209 102 447 -2.41475 7 0.046449*
Valuation Shoprite R157 (m)
R1 754 539 839 R1 537 152 336
Valuation SPAR R157 (m)
R1 138 887 133 R755 661 882 -2.20289 7 0.063460**
Valuation Shoprite R153 (s)
R669 283 235 R462 782 150
Valuation SPAR R153 (s)
R382192 920 R208 463 454 -2.40510 7 0.047112*
Valuation Shoprite R153 (m)
R1 756 086 372 R1 543 773 472
Valuation SPAR R153 (m)
R1 135 375 287 R749 206 424 -2.18683 7 0.064982**
Valuation Shoprite (McG)
-R1 108 809 152 R669 042 969
Valuation SPAR (McG)
R140 143 179 R152 258 911 4.97568 7 0.001609*
*Statistically significant at a 95% confidence level (p < 0.05) **Statistically significant at a 90% confidence level (p < 0.10)
Source: Researcher‟s own construct from statistical analysis results.
As evident from Table 7.14, only three of the relationships are statistically
significant at a 95% confidence level (p < 0.05). Two relationships that are
statistically significant both used the discounted FCF to calculate the valuations.
Both the relationships are negative, therefore if the valuation of Shoprite
increases then the valuation of SPAR decreases. The third statistically
significant relationship is where the valuation is calculated by McGregor BFA
Fin24Expert and it shows a positive relationship. The two relationships that are
not statistically significant at a 95% confidence level (p < 0.05) are statistically
significant at a 90% confidence level (p < 0.10). Therefore research hypothesis
EMPIRICAL RESULTS OF VALUATION ANALYSIS CHAPTER 7
309
H5 stating that there is a statistical significant relationship between the changes
of the business valuations of brick-and-mortar businesses with limited online
presence and brick-and-click businesses with interactive online presence over a
period of time, can be accepted at a 90% confidence level (p < 0.10).
7.5.2 T-test results when comparing Shoprite Holdings Limited (brick-and-
mortar business with limited online presence) and Pick n Pay Stores Ltd
(brick-and-click business in the e-commerce stage)
A summary of the t-test results when comparing the various valuations of
Shoprite and PnP over the eight-year period from 2004 to 2011 is presented in
Table 7.15. Research hypothesis H6 stating that there is a statistical significant
relationship between the changes in the business valuations of brick-and-mortar
businesses with limited online presence and brick-and-click businesses in the e-
commerce stage over a period of time, will be tested.
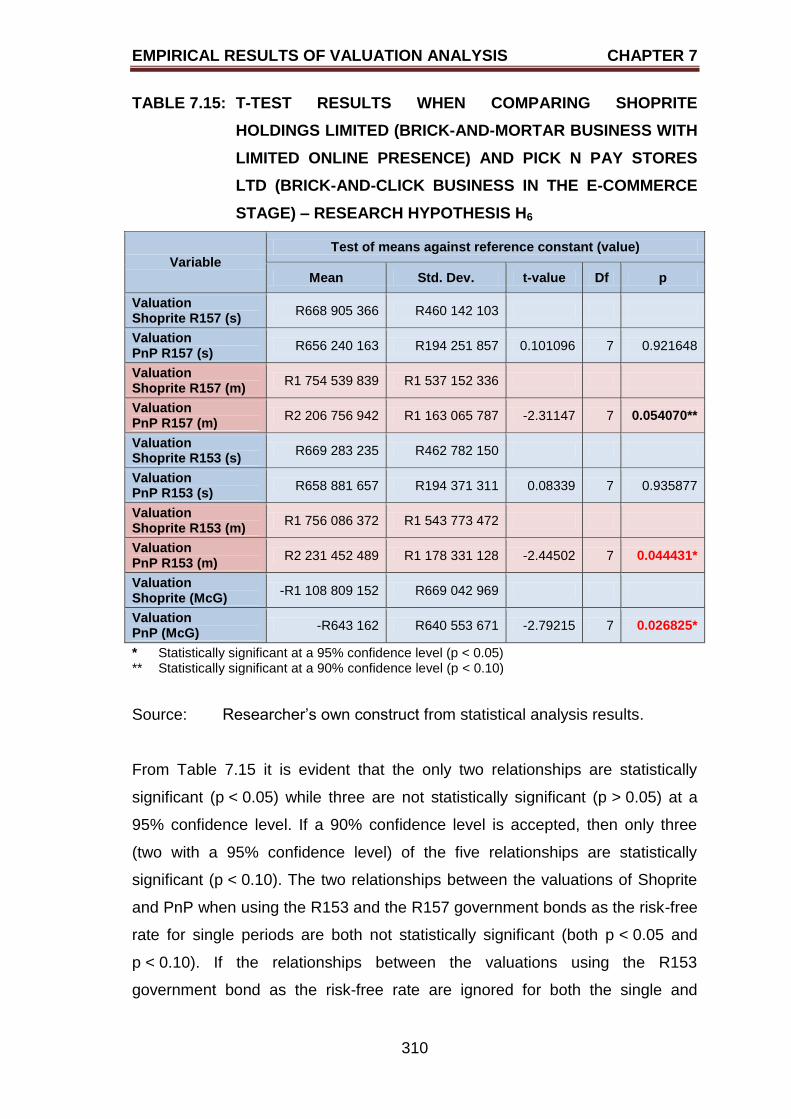
EMPIRICAL RESULTS OF VALUATION ANALYSIS CHAPTER 7
310
TABLE 7.15: T-TEST RESULTS WHEN COMPARING SHOPRITE
HOLDINGS LIMITED (BRICK-AND-MORTAR BUSINESS WITH
LIMITED ONLINE PRESENCE) AND PICK N PAY STORES
LTD (BRICK-AND-CLICK BUSINESS IN THE E-COMMERCE
STAGE) – RESEARCH HYPOTHESIS H6
Variable Test of means against reference constant (value)
Mean Std. Dev. t-value Df p
Valuation Shoprite R157 (s)
R668 905 366 R460 142 103
Valuation PnP R157 (s)
R656 240 163 R194 251 857 0.101096 7 0.921648
Valuation Shoprite R157 (m)
R1 754 539 839 R1 537 152 336
Valuation PnP R157 (m)
R2 206 756 942 R1 163 065 787 -2.31147 7 0.054070**
Valuation Shoprite R153 (s)
R669 283 235 R462 782 150
Valuation PnP R153 (s)
R658 881 657 R194 371 311 0.08339 7 0.935877
Valuation Shoprite R153 (m)
R1 756 086 372 R1 543 773 472
Valuation PnP R153 (m)
R2 231 452 489 R1 178 331 128 -2.44502 7 0.044431*
Valuation Shoprite (McG)
-R1 108 809 152 R669 042 969
Valuation PnP (McG)
-R643 162 R640 553 671 -2.79215 7 0.026825*
* **
Statistically significant at a 95% confidence level (p < 0.05) Statistically significant at a 90% confidence level (p < 0.10)
Source: Researcher‟s own construct from statistical analysis results.
From Table 7.15 it is evident that the only two relationships are statistically
significant (p < 0.05) while three are not statistically significant (p > 0.05) at a
95% confidence level. If a 90% confidence level is accepted, then only three
(two with a 95% confidence level) of the five relationships are statistically
significant (p < 0.10). The two relationships between the valuations of Shoprite
and PnP when using the R153 and the R157 government bonds as the risk-free
rate for single periods are both not statistically significant (both p < 0.05 and
p < 0.10). If the relationships between the valuations using the R153
government bond as the risk-free rate are ignored for both the single and
EMPIRICAL RESULTS OF VALUATION ANALYSIS CHAPTER 7
311
multiple period valuations, both the relationships between the valuations using
the R157 government bond as the risk-free rate for both the single and multiple
period valuations are not statistically significant at a 95% confidence level.
However, if a 90% confidence level is accepted, then the relationship between
the valuations of Shoprite and PnP using the R157 government bond as the
risk-free rate for multiple periods is statistically significant (p < 0.10). The
relationship is a negative relationship, implying that if the valuation of Shoprite is
changing, the valuation of PnP is changing in the opposite direction.
The reason for placing more importance on the relationships with the valuations
using the R157 government bond is that the R153 government bond has a final
(last one of three maturity dates) maturity date of 31 August 2011 while the
R157 government bond has three maturity dates, namely on 15 September
2014, 15 September 2015 and 15 September 2016 (Schedule of domestic
government bonds as at 28 February 2009). Previous research, as discussed in
section 6.2, found that the R157 government bond was used as the preferred
risk-free rate and that the R153 government was used when then R157
government bond was not available.
Both the statistically significant relationships have negative relationships. This
implies that if the valuation using the R153 government bond as the risk-free
rate for multiple periods of Shoprite is changing, then the valuation of PnP will
move in the opposite direction. The same applies for the valuations of Shoprite
and PnP when considering the valuations as calculated by McGregor BFA
Fin24Expert. The two relationships for single period valuations of Shoprite and
PnP (R153 and R157 government bonds as risk-free rates) both have positive
relationships, although not statistically significant. The relationship between the
valuations of Shoprite and PnP using the R157 government bond as the risk-
free rate for multiple periods has a negative relationship and is not statistically
significant at a 95% confidence level (p < 0.05) but at a 90% confidence level
(p < 0.10).
Based on the varying results as discussed, research hypothesis H6 stating that
there is a statistical significant relationship between the changes of business
EMPIRICAL RESULTS OF VALUATION ANALYSIS CHAPTER 7
312
valuations of brick-and-mortar businesses with limited online presence and
brick-and-click businesses in the e-commerce stage over a period of time, is
accepted at a 90% confidence level (p < 0.10). The reason for accepting H6 is
because only three of the five valuations using the DCF approach yielded
statistically significant relationships at a 95% (p < 0.05) and 90% (p < 0.10)
confidence level respectively (p = 0.026825, p = 0.044431 and p = 0.054070).
7.5.3 T-test results when comparing Shoprite Holdings Limited (brick-and-
mortar business with limited online presence) and Naspers Ltd (online
business in the e-commerce stage)
Table 7.16 summarises the t-test results when comparing the various valuations
of Shoprite and Naspers over the eight-year period from 2004 to 2011.
Research hypothesis H7 stating that there is a statistical significant relationship
between the changes in the business valuations of brick-and-mortar businesses
with limited online presence and online businesses in the e-commerce stage
over a period of time, will be tested.
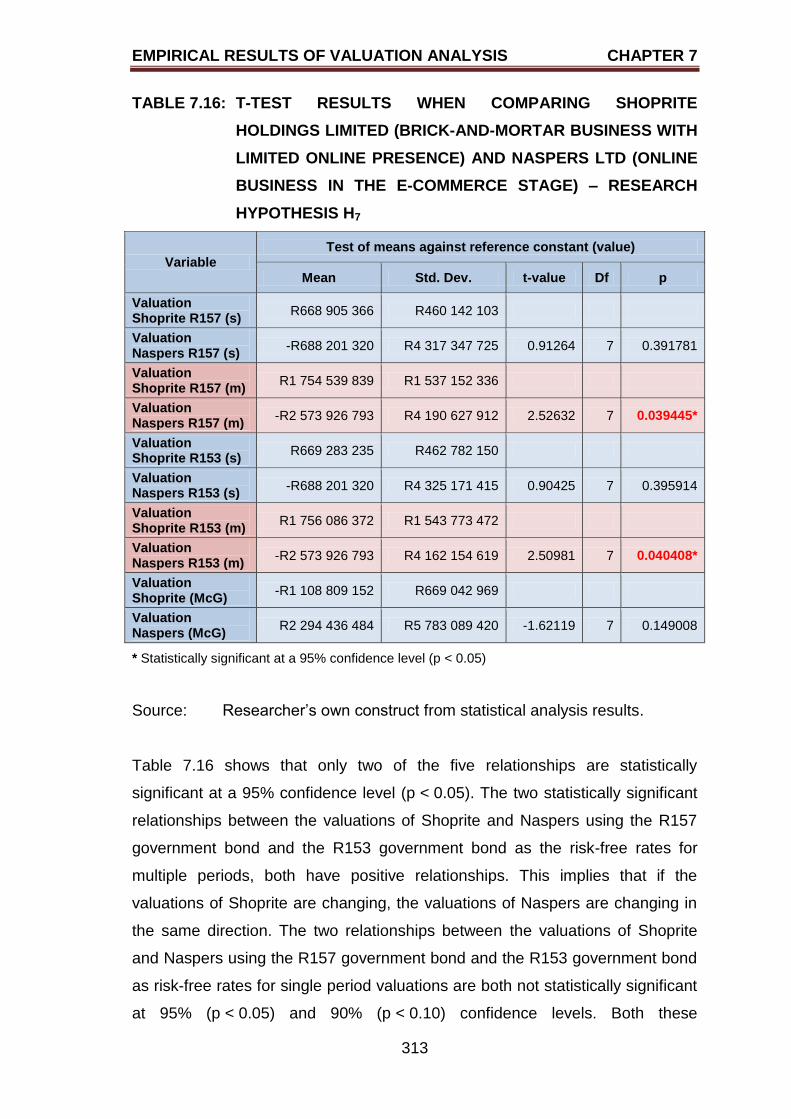
EMPIRICAL RESULTS OF VALUATION ANALYSIS CHAPTER 7
313
TABLE 7.16: T-TEST RESULTS WHEN COMPARING SHOPRITE
HOLDINGS LIMITED (BRICK-AND-MORTAR BUSINESS WITH
LIMITED ONLINE PRESENCE) AND NASPERS LTD (ONLINE
BUSINESS IN THE E-COMMERCE STAGE) – RESEARCH
HYPOTHESIS H7
Variable Test of means against reference constant (value)
Mean Std. Dev. t-value Df p
Valuation Shoprite R157 (s)
R668 905 366 R460 142 103
Valuation Naspers R157 (s)
-R688 201 320 R4 317 347 725 0.91264 7 0.391781
Valuation Shoprite R157 (m)
R1 754 539 839 R1 537 152 336
Valuation Naspers R157 (m)
-R2 573 926 793 R4 190 627 912 2.52632 7 0.039445*
Valuation Shoprite R153 (s)
R669 283 235 R462 782 150
Valuation Naspers R153 (s)
-R688 201 320 R4 325 171 415 0.90425 7 0.395914
Valuation Shoprite R153 (m)
R1 756 086 372 R1 543 773 472
Valuation Naspers R153 (m)
-R2 573 926 793 R4 162 154 619 2.50981 7 0.040408*
Valuation Shoprite (McG)
-R1 108 809 152 R669 042 969
Valuation Naspers (McG)
R2 294 436 484 R5 783 089 420 -1.62119 7 0.149008
* Statistically significant at a 95% confidence level (p < 0.05)
Source: Researcher‟s own construct from statistical analysis results.
Table 7.16 shows that only two of the five relationships are statistically
significant at a 95% confidence level (p < 0.05). The two statistically significant
relationships between the valuations of Shoprite and Naspers using the R157
government bond and the R153 government bond as the risk-free rates for
multiple periods, both have positive relationships. This implies that if the
valuations of Shoprite are changing, the valuations of Naspers are changing in
the same direction. The two relationships between the valuations of Shoprite
and Naspers using the R157 government bond and the R153 government bond
as risk-free rates for single period valuations are both not statistically significant
at 95% (p < 0.05) and 90% (p < 0.10) confidence levels. Both these
EMPIRICAL RESULTS OF VALUATION ANALYSIS CHAPTER 7
314
relationships are positive while the relationship between the valuations of
Shoprite and Naspers as calculated by McGregor BFA Fin24Expert has a
negative relationship and is not statistically significant.
Based on the results as discussed, research hypothesis H7 stating that there is
a statistical significant relationship between the changes of the business
valuations of brick-and-mortar businesses with limited online presence and
online businesses in the e-commerce stage over a period of time, is rejected as
only two out of four relationships are statistically significant. The hypothesis is
thus rejected at a 95% confidence level (p < 0.05).
7.5.4 T-test results when comparing The SPAR Group Ltd (brick-and-click
business with interactive online presence) and Pick n Pay Stores Ltd
(brick-and-click business in the e-commerce stage)
The t-test results when comparing the various valuations of SPAR and PnP
over the eight-year period from 2004 to 2011 are summarised in Table 7.17.
Research hypothesis H8 stating that there is a statistical significant relationship
between the changes in the business valuations of brick-and-click businesses
with interactive online presence and brick-and-click businesses in the e-
commerce stage over a period of time, will be tested.
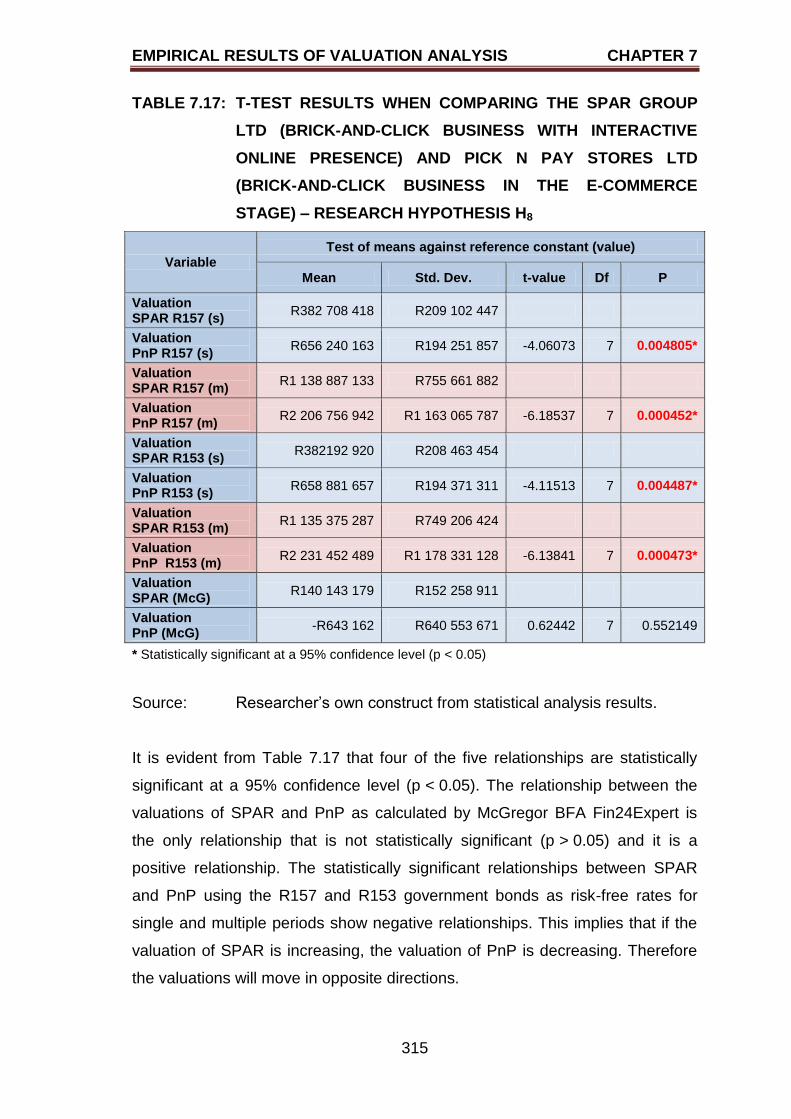
EMPIRICAL RESULTS OF VALUATION ANALYSIS CHAPTER 7
315
TABLE 7.17: T-TEST RESULTS WHEN COMPARING THE SPAR GROUP
LTD (BRICK-AND-CLICK BUSINESS WITH INTERACTIVE
ONLINE PRESENCE) AND PICK N PAY STORES LTD
(BRICK-AND-CLICK BUSINESS IN THE E-COMMERCE
STAGE) – RESEARCH HYPOTHESIS H8
Variable Test of means against reference constant (value)
Mean Std. Dev. t-value Df P
Valuation SPAR R157 (s)
R382 708 418 R209 102 447
Valuation PnP R157 (s)
R656 240 163 R194 251 857 -4.06073 7 0.004805*
Valuation SPAR R157 (m)
R1 138 887 133 R755 661 882
Valuation PnP R157 (m)
R2 206 756 942 R1 163 065 787 -6.18537 7 0.000452*
Valuation SPAR R153 (s)
R382192 920 R208 463 454
Valuation PnP R153 (s)
R658 881 657 R194 371 311 -4.11513 7 0.004487*
Valuation SPAR R153 (m)
R1 135 375 287 R749 206 424
Valuation PnP R153 (m)
R2 231 452 489 R1 178 331 128 -6.13841 7 0.000473*
Valuation SPAR (McG)
R140 143 179 R152 258 911
Valuation PnP (McG)
-R643 162 R640 553 671 0.62442 7 0.552149
* Statistically significant at a 95% confidence level (p < 0.05)
Source: Researcher‟s own construct from statistical analysis results.
It is evident from Table 7.17 that four of the five relationships are statistically
significant at a 95% confidence level (p < 0.05). The relationship between the
valuations of SPAR and PnP as calculated by McGregor BFA Fin24Expert is
the only relationship that is not statistically significant (p > 0.05) and it is a
positive relationship. The statistically significant relationships between SPAR
and PnP using the R157 and R153 government bonds as risk-free rates for
single and multiple periods show negative relationships. This implies that if the
valuation of SPAR is increasing, the valuation of PnP is decreasing. Therefore
the valuations will move in opposite directions.
EMPIRICAL RESULTS OF VALUATION ANALYSIS CHAPTER 7
316
The results discussed showed that the four relationships using the R157 and
R153 government bonds as risk-free rates for single and multiple period
valuations are statistically significant. Therefore research hypothesis H8 stating
that there is a statistical significant relationship between the changes of the
business valuations of brick-and-click businesses with interactive online
presence and brick-and-click businesses in the e-commerce stage over a period
of time, is accepted at a 95% confidence level (p < 0.05).
7.5.5 T-test results when comparing The SPAR Group Ltd (brick-and-click
business with interactive online presence) and Naspers Ltd (online
business in the e-commerce stage)
Table 7.18 summarises the t-test results when comparing the various valuations
of Shoprite and Naspers over the eight-year period from 2004 to 2011.
Research hypothesis H9 stating that there is a statistical significant relationship
between the changes in the business valuations of brick-and-click businesses
with interactive online presence and online businesses in the e-commerce stage
over a period of time, will be tested.
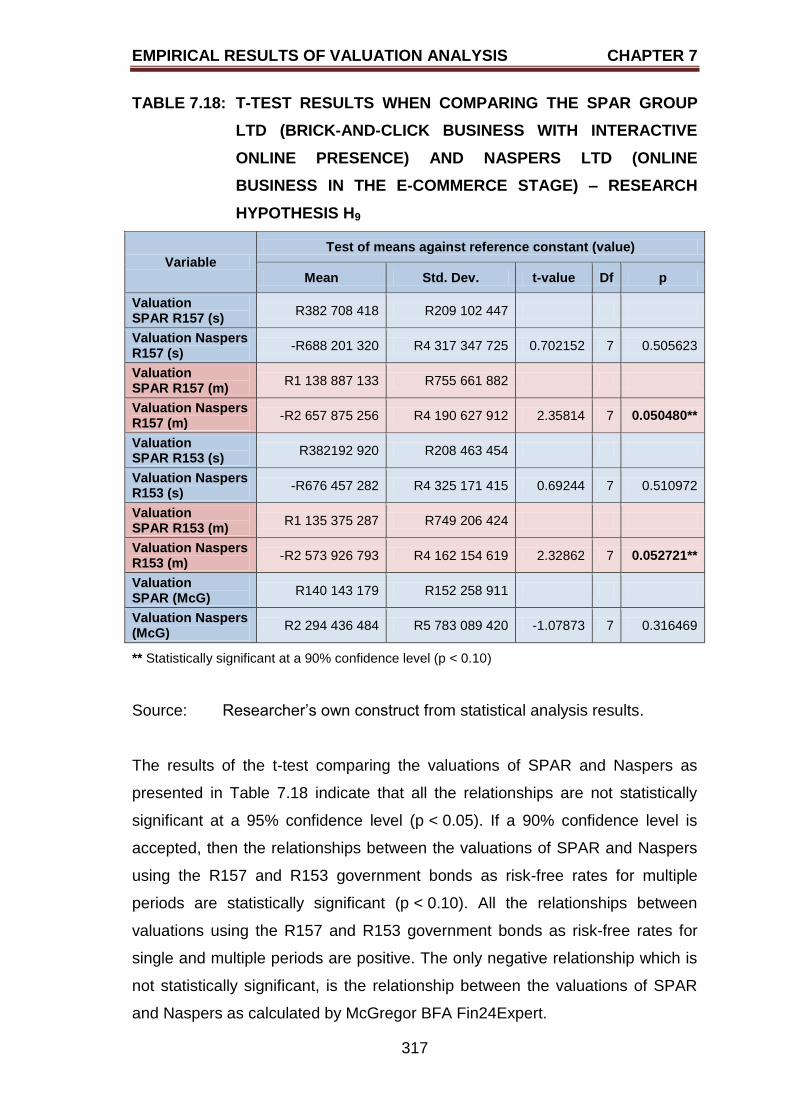
EMPIRICAL RESULTS OF VALUATION ANALYSIS CHAPTER 7
317
TABLE 7.18: T-TEST RESULTS WHEN COMPARING THE SPAR GROUP
LTD (BRICK-AND-CLICK BUSINESS WITH INTERACTIVE
ONLINE PRESENCE) AND NASPERS LTD (ONLINE
BUSINESS IN THE E-COMMERCE STAGE) – RESEARCH
HYPOTHESIS H9
Variable Test of means against reference constant (value)
Mean Std. Dev. t-value Df p
Valuation SPAR R157 (s)
R382 708 418 R209 102 447
Valuation Naspers R157 (s)
-R688 201 320 R4 317 347 725 0.702152 7 0.505623
Valuation SPAR R157 (m)
R1 138 887 133 R755 661 882
Valuation Naspers R157 (m)
-R2 657 875 256 R4 190 627 912 2.35814 7 0.050480**
Valuation SPAR R153 (s)
R382192 920 R208 463 454
Valuation Naspers R153 (s)
-R676 457 282 R4 325 171 415 0.69244 7 0.510972
Valuation SPAR R153 (m)
R1 135 375 287 R749 206 424
Valuation Naspers R153 (m)
-R2 573 926 793 R4 162 154 619 2.32862 7 0.052721**
Valuation SPAR (McG)
R140 143 179 R152 258 911
Valuation Naspers (McG)
R2 294 436 484 R5 783 089 420 -1.07873 7 0.316469
** Statistically significant at a 90% confidence level (p < 0.10)
Source: Researcher‟s own construct from statistical analysis results.
The results of the t-test comparing the valuations of SPAR and Naspers as
presented in Table 7.18 indicate that all the relationships are not statistically
significant at a 95% confidence level (p < 0.05). If a 90% confidence level is
accepted, then the relationships between the valuations of SPAR and Naspers
using the R157 and R153 government bonds as risk-free rates for multiple
periods are statistically significant (p < 0.10). All the relationships between
valuations using the R157 and R153 government bonds as risk-free rates for
single and multiple periods are positive. The only negative relationship which is
not statistically significant, is the relationship between the valuations of SPAR
and Naspers as calculated by McGregor BFA Fin24Expert.
EMPIRICAL RESULTS OF VALUATION ANALYSIS CHAPTER 7
318
Therefore research hypothesis H9 stating that there is a statistical significant
relationship between the changes of the business valuations of brick-and-click
businesses with interactive online presence and online businesses in the e-
commerce stage over a period of time, is rejected at a 90% confidence level
(p < 0.10). Only two of the five relationships were found to be statistically
significant at a 90% confidence level (p < 0.10).
7.5.6 T-test results when comparing Pick n Pay Stores Ltd (brick-and-click
business in the e-commerce stage) and Naspers Ltd (online business in
the e-commerce stage)
Table 7.19 summarises the t-test results when comparing the various valuations
of PnP and Naspers over the eight-year period from 2004 to 2011. Research
hypothesis H10 stating that there is a statistical significant relationship between
the changes in the business valuations of brick-and-click businesses in the e-
commerce stage and online businesses in the e-commerce stage over a period
of time, will be tested.
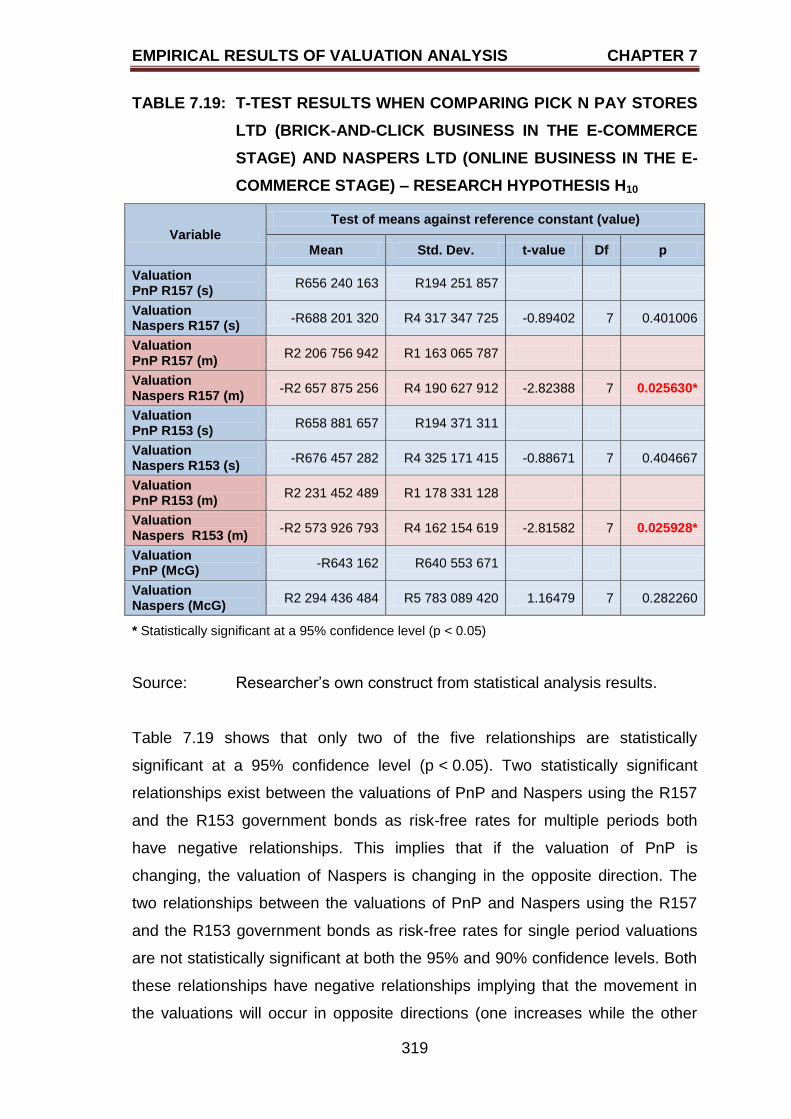
EMPIRICAL RESULTS OF VALUATION ANALYSIS CHAPTER 7
319
TABLE 7.19: T-TEST RESULTS WHEN COMPARING PICK N PAY STORES
LTD (BRICK-AND-CLICK BUSINESS IN THE E-COMMERCE
STAGE) AND NASPERS LTD (ONLINE BUSINESS IN THE E-
COMMERCE STAGE) – RESEARCH HYPOTHESIS H10
Variable Test of means against reference constant (value)
Mean Std. Dev. t-value Df p
Valuation PnP R157 (s)
R656 240 163 R194 251 857
Valuation Naspers R157 (s)
-R688 201 320 R4 317 347 725 -0.89402 7 0.401006
Valuation PnP R157 (m)
R2 206 756 942 R1 163 065 787
Valuation Naspers R157 (m)
-R2 657 875 256 R4 190 627 912 -2.82388 7 0.025630*
Valuation PnP R153 (s)
R658 881 657 R194 371 311
Valuation Naspers R153 (s)
-R676 457 282 R4 325 171 415 -0.88671 7 0.404667
Valuation PnP R153 (m)
R2 231 452 489 R1 178 331 128
Valuation Naspers R153 (m)
-R2 573 926 793 R4 162 154 619 -2.81582 7 0.025928*
Valuation PnP (McG)
-R643 162 R640 553 671
Valuation Naspers (McG)
R2 294 436 484 R5 783 089 420 1.16479 7 0.282260
* Statistically significant at a 95% confidence level (p < 0.05)
Source: Researcher‟s own construct from statistical analysis results.
Table 7.19 shows that only two of the five relationships are statistically
significant at a 95% confidence level (p < 0.05). Two statistically significant
relationships exist between the valuations of PnP and Naspers using the R157
and the R153 government bonds as risk-free rates for multiple periods both
have negative relationships. This implies that if the valuation of PnP is
changing, the valuation of Naspers is changing in the opposite direction. The
two relationships between the valuations of PnP and Naspers using the R157
and the R153 government bonds as risk-free rates for single period valuations
are not statistically significant at both the 95% and 90% confidence levels. Both
these relationships have negative relationships implying that the movement in
the valuations will occur in opposite directions (one increases while the other
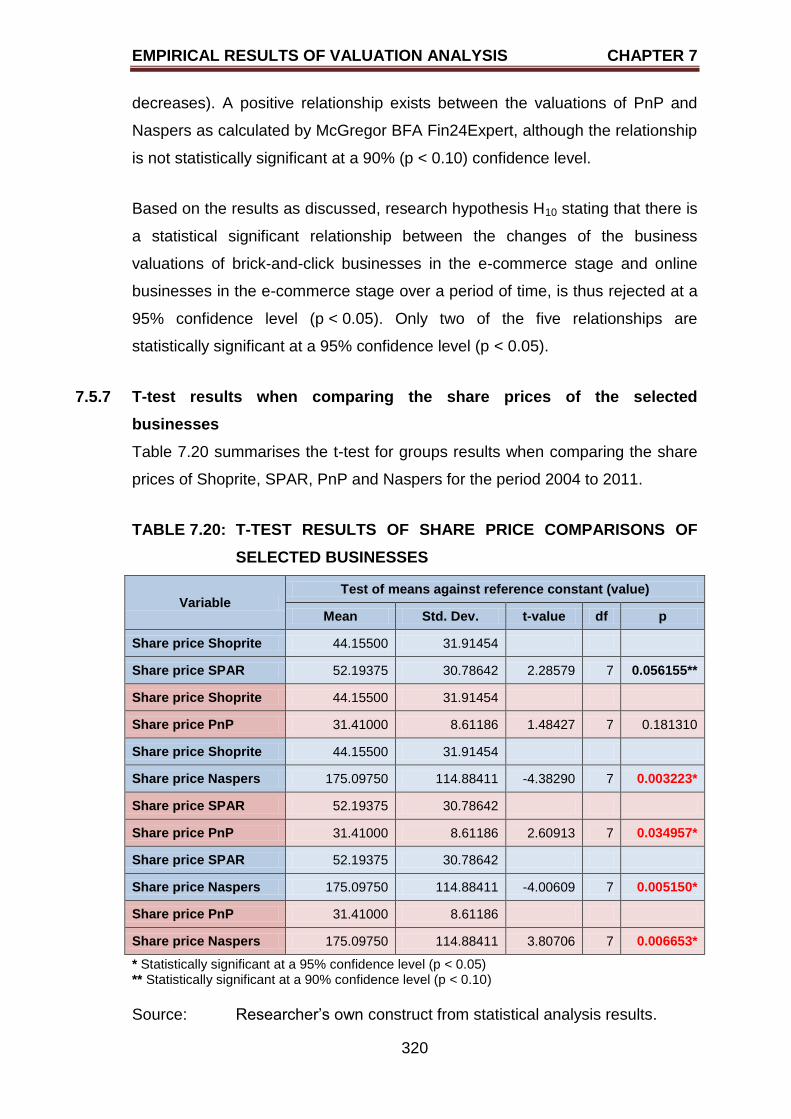
EMPIRICAL RESULTS OF VALUATION ANALYSIS CHAPTER 7
320
decreases). A positive relationship exists between the valuations of PnP and
Naspers as calculated by McGregor BFA Fin24Expert, although the relationship
is not statistically significant at a 90% (p < 0.10) confidence level.
Based on the results as discussed, research hypothesis H10 stating that there is
a statistical significant relationship between the changes of the business
valuations of brick-and-click businesses in the e-commerce stage and online
businesses in the e-commerce stage over a period of time, is thus rejected at a
95% confidence level (p < 0.05). Only two of the five relationships are
statistically significant at a 95% confidence level (p < 0.05).
7.5.7 T-test results when comparing the share prices of the selected
businesses
Table 7.20 summarises the t-test for groups results when comparing the share
prices of Shoprite, SPAR, PnP and Naspers for the period 2004 to 2011.
TABLE 7.20: T-TEST RESULTS OF SHARE PRICE COMPARISONS OF
SELECTED BUSINESSES
Variable Test of means against reference constant (value)
Mean Std. Dev. t-value df p
Share price Shoprite 44.15500 31.91454
Share price SPAR 52.19375 30.78642 2.28579 7 0.056155**
Share price Shoprite 44.15500 31.91454
Share price PnP 31.41000 8.61186 1.48427 7 0.181310
Share price Shoprite 44.15500 31.91454
Share price Naspers 175.09750 114.88411 -4.38290 7 0.003223*
Share price SPAR 52.19375 30.78642
Share price PnP 31.41000 8.61186 2.60913 7 0.034957*
Share price SPAR 52.19375 30.78642
Share price Naspers 175.09750 114.88411 -4.00609 7 0.005150*
Share price PnP 31.41000 8.61186
Share price Naspers 175.09750 114.88411 3.80706 7 0.006653*
* Statistically significant at a 95% confidence level (p < 0.05) ** Statistically significant at a 90% confidence level (p < 0.10)
Source: Researcher‟s own construct from statistical analysis results.
EMPIRICAL RESULTS OF VALUATION ANALYSIS CHAPTER 7
321
When comparing the share prices of Shoprite, SPAR, PnP and Naspers, only
four of the six relationships are statistically significant (p < 0.05) as shown in
Table 7.20. There are positive statistically significant relationships between the
share prices of SPAR and PnP, and between the share prices of PnP and
Naspers. Negative statistically significant relationships exist between the share
prices of Shoprite and Naspers and between the share prices of SPAR and
Naspers.
If a 90% confidence level (p < 0.10) is accepted, then a positive relationship
exists between the share prices of Shoprite and SPAR. A positive relationship
exist between the share price of Shoprite and PnP, but the relationship is not
statistically significant at 95% (p < 0.05) or 90% (p < 0.10) confidence levels.
7.6 RESEARCH HYPOTHESES RESULTS SUMMARY
Table 7.21 summarises the results of the research hypotheses based on the
relationships between:
the single period valuations using the R157 government bond as the risk-
free rate (first p-value for each hypothesis in Table 7.21);
the multiple period valuations using the R157 government bond as the
risk-free rate (second p-value for each hypothesis in Table 7.21);
the single period valuations using the R153 government bond as the risk-
free rate (third p-value for each hypothesis in Table 7.21);
the multiple period valuations using the R153 government bond as the
risk-free rate (fourth p-value for each hypothesis in Table 7.21); and
the valuations as calculated by McGregor BFA Fin24Expert (fifth p-value
for each hypothesis in Table 7.21).
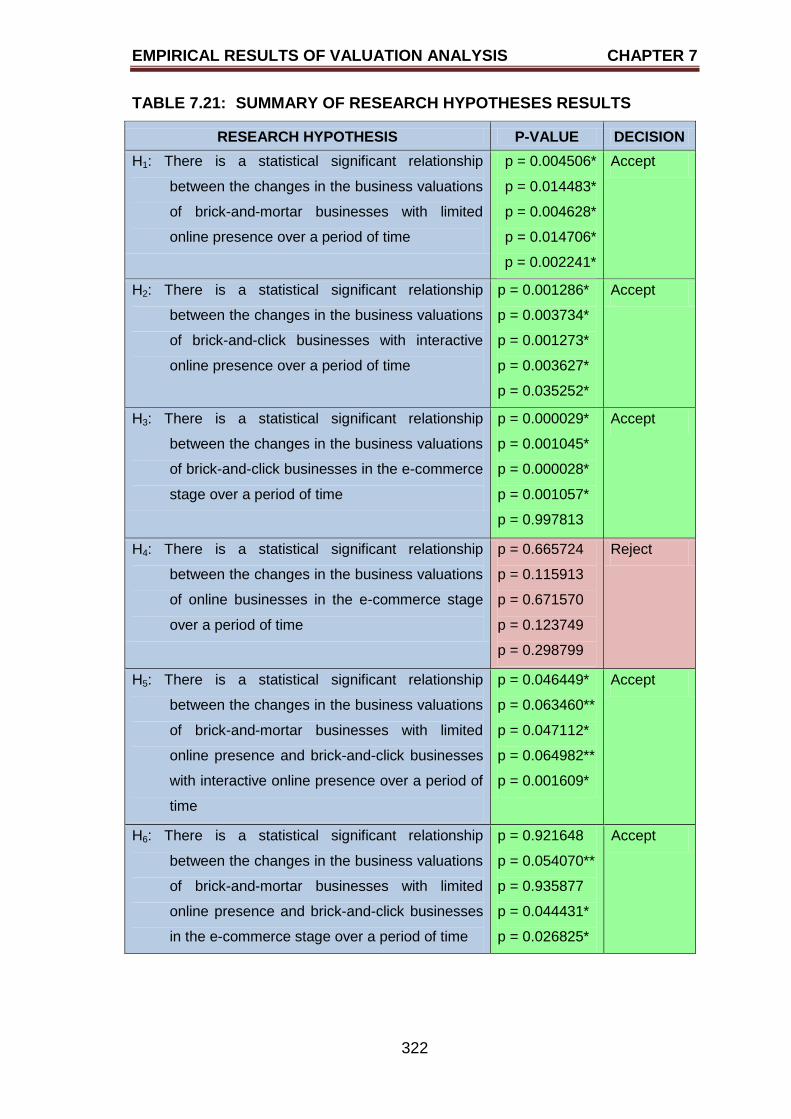
EMPIRICAL RESULTS OF VALUATION ANALYSIS CHAPTER 7
322
TABLE 7.21: SUMMARY OF RESEARCH HYPOTHESES RESULTS
RESEARCH HYPOTHESIS P-VALUE DECISION
H1: There is a statistical significant relationship
between the changes in the business valuations
of brick-and-mortar businesses with limited
online presence over a period of time
p = 0.004506*
p = 0.014483*
p = 0.004628*
p = 0.014706*
p = 0.002241*
Accept
H2: There is a statistical significant relationship
between the changes in the business valuations
of brick-and-click businesses with interactive
online presence over a period of time
p = 0.001286*
p = 0.003734*
p = 0.001273*
p = 0.003627*
p = 0.035252*
Accept
H3: There is a statistical significant relationship
between the changes in the business valuations
of brick-and-click businesses in the e-commerce
stage over a period of time
p = 0.000029*
p = 0.001045*
p = 0.000028*
p = 0.001057*
p = 0.997813
Accept
H4: There is a statistical significant relationship
between the changes in the business valuations
of online businesses in the e-commerce stage
over a period of time
p = 0.665724
p = 0.115913
p = 0.671570
p = 0.123749
p = 0.298799
Reject
H5: There is a statistical significant relationship
between the changes in the business valuations
of brick-and-mortar businesses with limited
online presence and brick-and-click businesses
with interactive online presence over a period of
time
p = 0.046449*
p = 0.063460**
p = 0.047112*
p = 0.064982**
p = 0.001609*
Accept
H6: There is a statistical significant relationship
between the changes in the business valuations
of brick-and-mortar businesses with limited
online presence and brick-and-click businesses
in the e-commerce stage over a period of time
p = 0.921648
p = 0.054070**
p = 0.935877
p = 0.044431*
p = 0.026825*
Accept
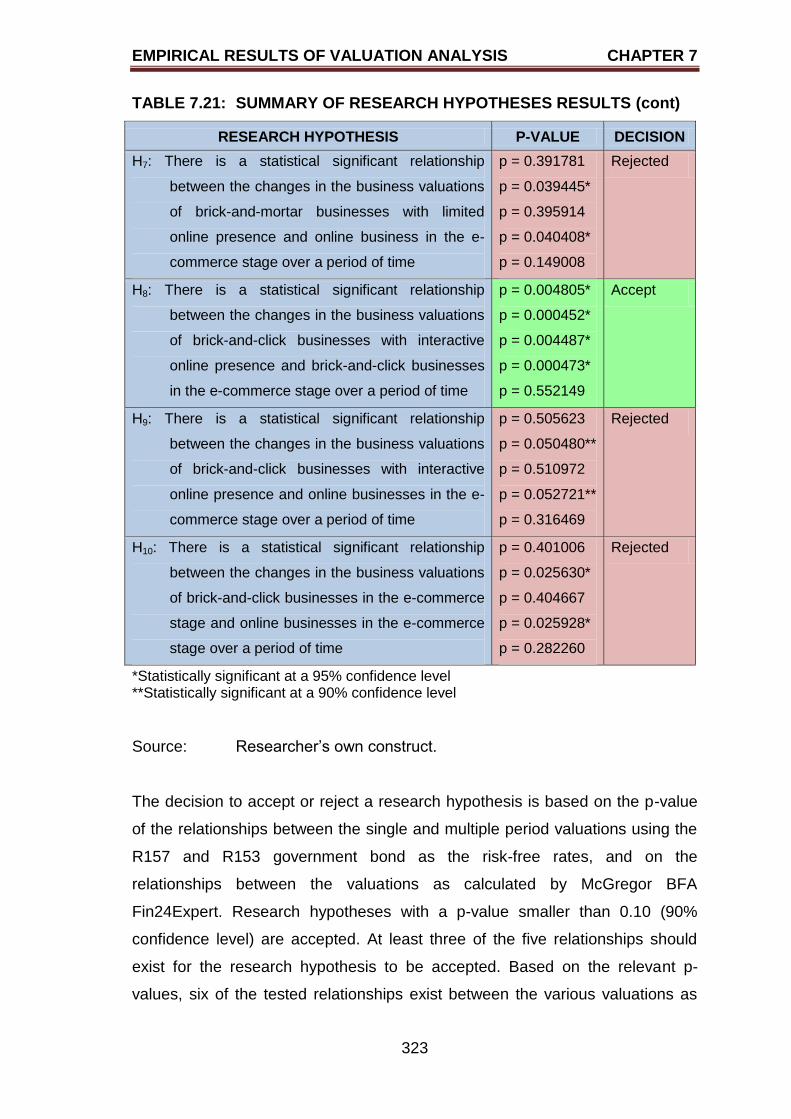
EMPIRICAL RESULTS OF VALUATION ANALYSIS CHAPTER 7
323
TABLE 7.21: SUMMARY OF RESEARCH HYPOTHESES RESULTS (cont)
RESEARCH HYPOTHESIS P-VALUE DECISION
H7: There is a statistical significant relationship
between the changes in the business valuations
of brick-and-mortar businesses with limited
online presence and online business in the e-
commerce stage over a period of time
p = 0.391781
p = 0.039445*
p = 0.395914
p = 0.040408*
p = 0.149008
Rejected
H8: There is a statistical significant relationship
between the changes in the business valuations
of brick-and-click businesses with interactive
online presence and brick-and-click businesses
in the e-commerce stage over a period of time
p = 0.004805*
p = 0.000452*
p = 0.004487*
p = 0.000473*
p = 0.552149
Accept
H9: There is a statistical significant relationship
between the changes in the business valuations
of brick-and-click businesses with interactive
online presence and online businesses in the e-
commerce stage over a period of time
p = 0.505623
p = 0.050480**
p = 0.510972
p = 0.052721**
p = 0.316469
Rejected
H10: There is a statistical significant relationship
between the changes in the business valuations
of brick-and-click businesses in the e-commerce
stage and online businesses in the e-commerce
stage over a period of time
p = 0.401006
p = 0.025630*
p = 0.404667
p = 0.025928*
p = 0.282260
Rejected
*Statistically significant at a 95% confidence level **Statistically significant at a 90% confidence level
Source: Researcher‟s own construct.
The decision to accept or reject a research hypothesis is based on the p-value
of the relationships between the single and multiple period valuations using the
R157 and R153 government bond as the risk-free rates, and on the
relationships between the valuations as calculated by McGregor BFA
Fin24Expert. Research hypotheses with a p-value smaller than 0.10 (90%
confidence level) are accepted. At least three of the five relationships should
exist for the research hypothesis to be accepted. Based on the relevant p-
values, six of the tested relationships exist between the various valuations as
EMPIRICAL RESULTS OF VALUATION ANALYSIS CHAPTER 7
324
summarised in Table 7.21. For H1, H2 and H5 all the tested relationships are
statistically significant. No statistically significant relationships exist between the
valuations as calculated by McGregor BFA Fin24Expert for H3 and H8, although
statistically significant relationships exist between the valuations based on the
DCF approach. For H6, only three statistically significant relationships exist
between the valuations using the R153 government bond as the risk-free rate
for single and multiple period valuations and the valuations as calculated by
McGregor BFA Fin24Expert. There are only two statistically significant
relationships between the valuations using the R153 government bond as the
risk-free rate for single and multiple period valuations for H7, H9 and H10. The
valuations using the R157 government bond as the risk-free rate for single and
multiple period valuations and the valuations as calculated by McGregor BFA
Fin24Expert yields no statistically significant relationships for H7, H9 and H10.
None of the relationships tested for H4 yields statistically significant
relationships at a 95% (p < 0.05) or 90% (p < 0.10) confidence levels. To
summarise, six of the research hypotheses are accepted while four research
hypotheses are rejected.
It is clear from Table 7.21 that the four research hypotheses that are rejected
are concerned with online businesses in the e-commerce stage. Based on the
one-sample t-test results, it is evident that online businesses in the e-commerce
stage do not create value over time. When analysing the dependent t-test
results, one can see that there is no relationships between online businesses in
the e-commerce stage and any other business, regardless of the type of
business and the e-business model stage the business is in. Therefore one can
conclude that it may not be beneficial for brick-and-mortar and brick-and-click
businesses to convert to online businesses because the valuation of the
business will not increase and therefore shareholders‟ wealth will not be
created. The decision to convert should be based on a comprehensive viability
analysis.
7.7 SUMMARY
The main aim of the chapter was to test whether the research hypotheses
stated in Chapter One should be accepted or rejected. In order to test the
EMPIRICAL RESULTS OF VALUATION ANALYSIS CHAPTER 7
325
hypotheses, the various valuations of the four selected businesses, namely
Shoprite, SPAR, PnP and Naspers, had to be calculated using the DCF
approach. The calculated valuations were presented and discussed in Chapter
Six.
The descriptive statistics of the valuations for the four selected businesses were
discussed. When using the DCF approach, the lowest single period valuation
for Shoprite was R180 462 382 and the highest was R1 264 679 309, both
using the R153 government bond as the risk-free rate. The lowest multiple
period valuation for Shoprite was R180 462 382 (R153 government bond as the
risk-free rate) and the highest was R4 378 263 105 (R157 government bond as
the risk-free rate) when using the DCF approach. When using the DCF
approach, the lowest single period valuation for SPAR was R51 910 890 and
the highest was R676 660 895, both using the R157 government bond as the
risk-free rate. The lowest multiple period valuation for SPAR was R360 947 959
and the highest was R2 449 642 765 when using the DCF approach with the
R157 government bond as the risk-free rate. When using the DCF approach,
the lowest single period valuation for PnP was R362 683 140 (R157
government bond as the risk-free rate) and the highest was R878 218 448
(R153 government bond as the risk-free rate). The lowest multiple period
valuation for PnP was R413 520 930 (R157 government bond as the risk-free
rate) and the highest was R3 909 009 137 (R153 government bond as the risk-
free rate) when using the DCF approach. When using the DCF approach, the
lowest single period valuation for Naspers was a negative value of
R7 662 859 962 (R157 government as the risk-free rate) and the highest was
R6 723 075 322 (R153 government bond as the risk-free rate). The lowest
multiple period valuation for Naspers was -R11 148 667 777 (R157 government
bond as the risk-free rate) and the highest was R1 614 838 108 (R153
government bond as the risk-free rate) when using the DCF approach. It was
found that the standard deviations were relatively small when compared to the
mean values of the valuations. Naspers was the only exception as the standard
deviations exceeded the mean values of the valuations.
EMPIRICAL RESULTS OF VALUATION ANALYSIS CHAPTER 7
326
The results indicated that there were only 10 statistically significant correlations.
All the correlations were positive but the strength of the correlations varied.
When using the DCF approach with the R157 government bond as the risk-free
rate for a single period valuation, a relatively strong positive correlation was
found between Shoprite and SPAR. When using the DCF approach with the
R157 government bond as the risk-free rate for a multiple period valuation,
strong positive correlations existed between the valuations of Shoprite and
SPAR, the valuations of Shoprite and PnP, and the valuations of SPAR and
PnP. When the R153 government bond was used as the risk-free rate in the
DCF approach for a single period valuation, relatively strong correlations were
found between the valuations of Shoprite and SPAR and the valuations of
Shoprite and PnP. When using the DCF approach with the R153 government
bond as the risk-free rate for a multiple period valuation, strong positive
correlations existed between the valuations of Shoprite and SPAR, the
valuations of Shoprite and PnP and the valuations of SPAR and PnP. The
correlations between the valuations as calculated by McGregor BFA
Fin24Expert yielded only one strong positive correlation between the valuations
of SPAR and Naspers.
Ten research hypotheses were formulated and presented in Chapter One. Six
of the ten research hypotheses were accepted based on the t-test results where
the relationships were statistically significant. Four of the 10 research
hypotheses were rejected and all four of the research hypotheses involved the
online business in the e-commerce stage.
The chapter to follow will provide an overview of the study, and conclusions
based on the results. Recommendations will be made to valuators and investors
concerning businesses operating in the various stages of the e-business model.
The contribution of the study will be highlighted. The limitations and future
research areas will be identified.
SUMMARY, CONCLUSIONS AND RECOMMENDATIONS CHAPTER 8
327
CHAPTER EIGHT
SUMMARY, CONCLUSIONS AND RECOMMENDATIONS
8.1 INTRODUCTION
Chapters Two and Three provided the theoretical background to the study while
Chapter Four described the research methodology that was followed in the
study. The fifth chapter provided a detailed overview of the businesses that had
been selected to be valued using the DCF approach. Chapter Six presented the
five different valuations, while Chapter Seven provided the basic descriptive
statistics and research hypotheses testing results.
The final secondary objective, as stated in Chapter One, that was needed to
attain the primary objective of the study, was to provide a holistic overview of
the study. Chapter Eight will therefore summarise the study by addressing the
problem statement, research objectives, research design and methodology
employed in the study. A synopsis of the literature overview and the four
selected businesses will be provided. The main purpose of Chapter Eight is to
make recommendations to businesses considering implementing e-business
strategies. The recommendations can also be used by valuators and investors
of businesses in various stages of the e-business model. The results as
presented in Chapters Six and Seven will be used as supportive evidence to the
conclusions and recommendations made. The unique contribution of this study
will also be highlighted and discussed. The limitations of the study and possible
future research areas will be given. To conclude the chapter and the study,
some final remarks will be made regarding the study. Figure 8.1 is reproduced
to illustrate the place of Chapter Eight within the research process.
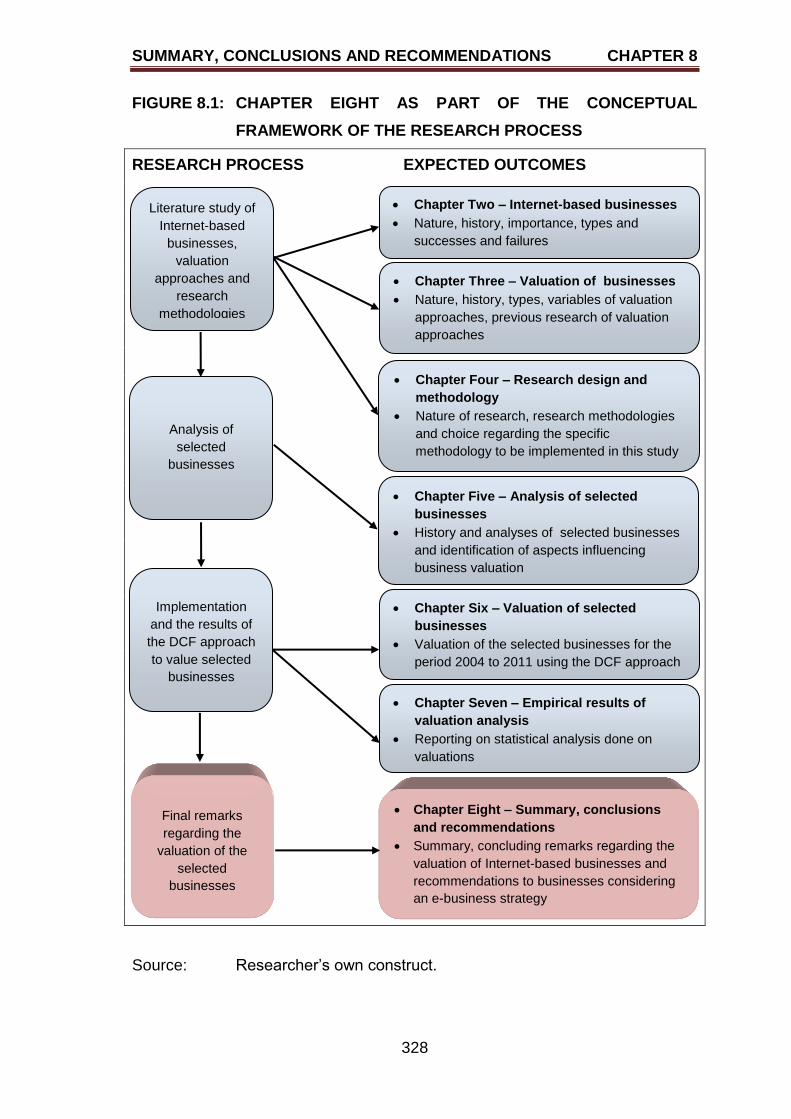
SUMMARY, CONCLUSIONS AND RECOMMENDATIONS CHAPTER 8
328
FIGURE 8.1: CHAPTER EIGHT AS PART OF THE CONCEPTUAL
FRAMEWORK OF THE RESEARCH PROCESS
RESEARCH PROCESS EXPECTED OUTCOMES
Source: Researcher‟s own construct.
Literature study of
Internet-based
businesses,
valuation
approaches and
research
methodologies
Chapter Three – Valuation of businesses
Nature, history, types, variables of valuation
approaches, previous research of valuation
approaches
Chapter Two – Internet-based businesses
Nature, history, importance, types and
successes and failures
Chapter Four – Research design and
methodology
Nature of research, research methodologies
and choice regarding the specific
methodology to be implemented in this study
Analysis of
selected
businesses
Chapter Five – Analysis of selected
businesses
History and analyses of selected businesses
and identification of aspects influencing
business valuation
Chapter Six – Valuation of selected
businesses
Valuation of the selected businesses for the
period 2004 to 2011 using the DCF approach
Implementation
and the results of
the DCF approach
to value selected
businesses
Chapter Eight – Summary, conclusions
and recommendations
Summary, concluding remarks regarding the
valuation of Internet-based businesses and
recommendations to businesses considering
an e-business strategy
Final remarks
regarding the
valuation of the
selected
businesses
Chapter Seven – Empirical results of
valuation analysis
Reporting on statistical analysis done on
valuations
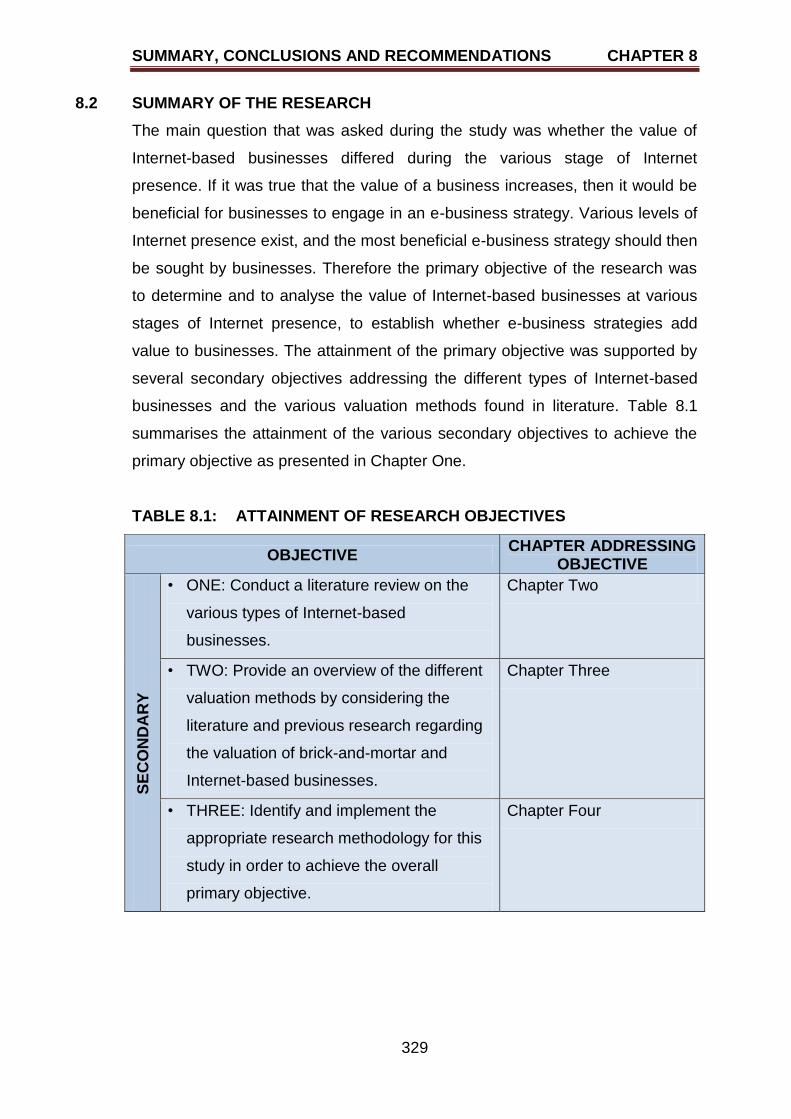
SUMMARY, CONCLUSIONS AND RECOMMENDATIONS CHAPTER 8
329
8.2 SUMMARY OF THE RESEARCH
The main question that was asked during the study was whether the value of
Internet-based businesses differed during the various stage of Internet
presence. If it was true that the value of a business increases, then it would be
beneficial for businesses to engage in an e-business strategy. Various levels of
Internet presence exist, and the most beneficial e-business strategy should then
be sought by businesses. Therefore the primary objective of the research was
to determine and to analyse the value of Internet-based businesses at various
stages of Internet presence, to establish whether e-business strategies add
value to businesses. The attainment of the primary objective was supported by
several secondary objectives addressing the different types of Internet-based
businesses and the various valuation methods found in literature. Table 8.1
summarises the attainment of the various secondary objectives to achieve the
primary objective as presented in Chapter One.
TABLE 8.1: ATTAINMENT OF RESEARCH OBJECTIVES
OBJECTIVE CHAPTER ADDRESSING
OBJECTIVE
SE
CO
ND
AR
Y
• ONE: Conduct a literature review on the
various types of Internet-based
businesses.
Chapter Two
• TWO: Provide an overview of the different
valuation methods by considering the
literature and previous research regarding
the valuation of brick-and-mortar and
Internet-based businesses.
Chapter Three
• THREE: Identify and implement the
appropriate research methodology for this
study in order to achieve the overall
primary objective.
Chapter Four
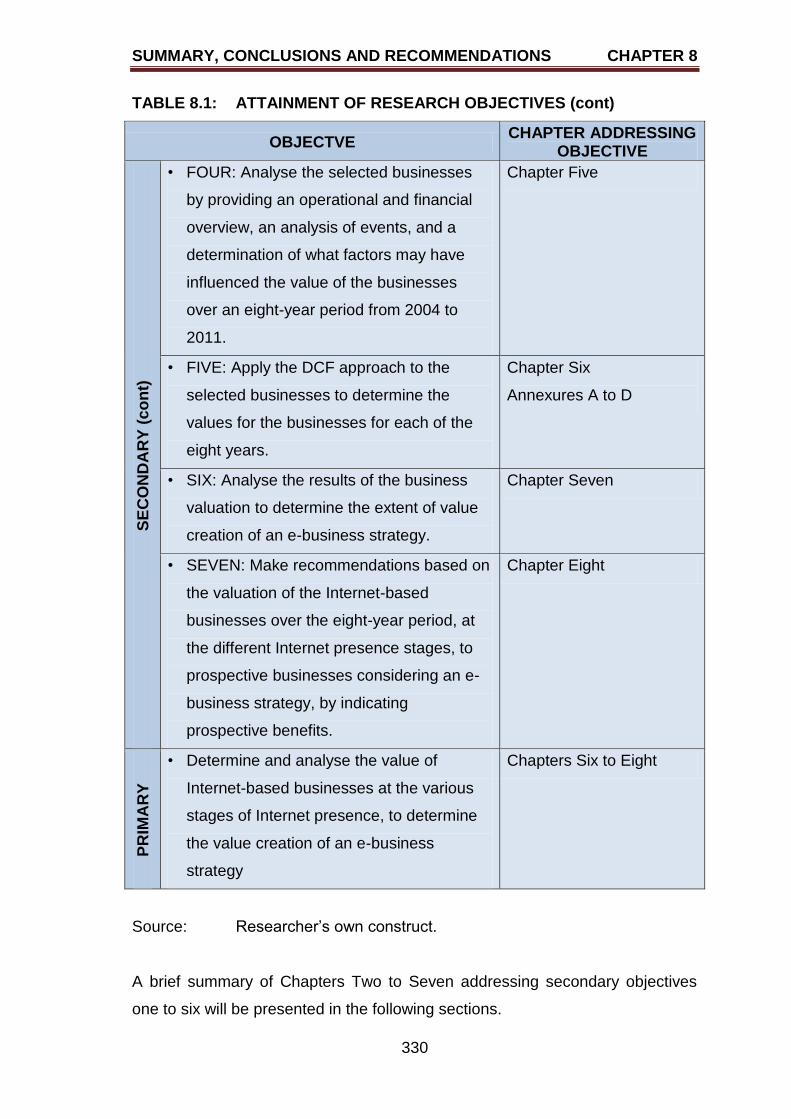
SUMMARY, CONCLUSIONS AND RECOMMENDATIONS CHAPTER 8
330
TABLE 8.1: ATTAINMENT OF RESEARCH OBJECTIVES (cont)
OBJECTVE CHAPTER ADDRESSING
OBJECTIVE S
EC
ON
DA
RY
(co
nt)
• FOUR: Analyse the selected businesses
by providing an operational and financial
overview, an analysis of events, and a
determination of what factors may have
influenced the value of the businesses
over an eight-year period from 2004 to
2011.
Chapter Five
• FIVE: Apply the DCF approach to the
selected businesses to determine the
values for the businesses for each of the
eight years.
Chapter Six
Annexures A to D
• SIX: Analyse the results of the business
valuation to determine the extent of value
creation of an e-business strategy.
Chapter Seven
• SEVEN: Make recommendations based on
the valuation of the Internet-based
businesses over the eight-year period, at
the different Internet presence stages, to
prospective businesses considering an e-
business strategy, by indicating
prospective benefits.
Chapter Eight
PR
IMA
RY
• Determine and analyse the value of
Internet-based businesses at the various
stages of Internet presence, to determine
the value creation of an e-business
strategy
Chapters Six to Eight
Source: Researcher‟s own construct.
A brief summary of Chapters Two to Seven addressing secondary objectives
one to six will be presented in the following sections.
SUMMARY, CONCLUSIONS AND RECOMMENDATIONS CHAPTER 8
331
8.2.1 Summary of Internet-based businesses – Chapter Two
The first secondary objective was to provide a literature overview of the different
types of Internet-based businesses. In the discussion of the nature of Internet-
based businesses, it was important to distinguish between e-commerce, e-
business, m-commerce and e-marketing. E-commerce referred to the trading of
products and services to generate income using the Internet and other
computer-mediated activities, while e-business used all the e-commerce
activities as well as the serving of customers and collaboration with business
partners. M-commerce was described as the use of mobile technology, such as
PDA and cell phones, to conduct business, while e-marketing was referred to as
the use of information technology to create communication with customers, with
the aim of improving customer relations that would provide the business and its
stakeholders with monetary and non-monetary benefits.
As the Internet is the corner-stone of Internet-based businesses, the four
functions of the Internet were highlighted, namely communication,
entertainment, information and e-commerce. Based on the functions, Internet-
based businesses were divided into two main groups: brick-and-click
businesses and online businesses. The online businesses were furthermore
subdivided into click-only, Internet search engines, Internet social networks and
other types of online businesses not listed. Each of the Internet-based
businesses was discussed and the timelines of each were provided. Examples
were identified to support the discussions. The history of the Internet from the
1960s to the 2000s was outlined.
As the emphasis of the study was on the valuation of businesses at various
stages of the e-business model, a discussion on the different e-business
models was provided. Based on the discussion, the researcher proposed an e-
business model to be used for the study. The stages were: no online presence,
limited online presence, interactive online presence, e-commerce and e-
business. Clarifications of the different stages were given.
The importance of the study was emphasised by a discussion of the importance
of Internet-based businesses. The value of these businesses in the market

SUMMARY, CONCLUSIONS AND RECOMMENDATIONS CHAPTER 8
332
environment was provided. Chapter Two, which addressed the first secondary
objective, concluded with examples of Internet-based business successes and
failures.
8.2.2 Summary of valuation approaches – Chapter Three
Various valuation approaches can be found in literature, and a discussion of
these approaches for brick-and-mortar and Internet-based businesses was
formulated as the second secondary objective. The purpose of valuation was
describe as the determining of a fair market value for a business, where a fair
market value is the acceptable price to be paid by an informed buyer and to be
received by an informed seller. To understand the development of the traditional
valuation approaches, a brief history of valuation was given. A number of
valuation approaches were discussed, namely the DDM, the zero growth model,
the constant growth model, the non-constant growth model, the FCF valuation
model, the price ratios (P/E ratio, P/B ratio, book value per share and liquidation
value per share ratios), EVA, MVA and real options. It was also found that some
businesses opt not to pay dividends, thus not all the valuation approaches could
be used.
The variables used in each of the valuation approaches were identified and
categorised either as a known or an unknown variable. The different valuation
approaches were also linked to the different types of businesses, namely, brick-
and-mortar, brick-and-click and online businesses. The shortcomings of each of
the valuation approaches were identified. It was found that the majority of the
valuation approaches had many unknown variables. Another major limitation of
the majority of the valuation approaches was the use of future dividends as one
of the unknown variables. This was especially true for businesses not paying
dividends, and therefore using valuation approaches with dividends as a
variable will yield incorrect valuations.
Previous research on the applicability of the valuation approaches indicated that
the DCF (also referred to as the discounted FCF approach) was the most used
approach to be used when valuing businesses. If one considered the four future
value scenarios, as depicted in Figure 3.3, the use of the DCF tended to focus
SUMMARY, CONCLUSIONS AND RECOMMENDATIONS CHAPTER 8
333
on the long-term perspective, providing a true economic value of the business.
The scenario was known as cohesive capitalism, and gave a broad and long-
term view of business value creation. An increase in the value of the business
as calculated using the DCF would then indicate value creation, which would
assist in the primary objective of financial managers of shareholders‟ wealth
creation.
It was then found that businesses implementing some form of e-business
strategy should consider the critical e-value indicators. The e-value indicators
included were innovativeness, marketing intensity, human resources training,
operational efficiency and risk disposition. These indicators should be used
effectively, especially in businesses not paying dividends, to encourage
investments in these businesses.
When valuing Internet-based businesses, it was found that the valuation of the
intangible assets of these businesses was critical to the valuation process. This
was also more important when valuing online businesses because online
businesses were described as being rich in intellectual assets, and were the
corner stone of the businesses‟ operations.
The chapter concluded with a summary of the intrinsic values over time for
Amazon.com, DoubleClick, Facebook, Google, LinkedIn, Skype Technologies
and Yahoo!. The income generation of Internet-based businesses included
selling products and services online, buying space on websites for advertising,
subscriber fees, brokerage fees, fees for using technology, job searches,
commerce, paid inclusions, pay per click, pay per sale and online gaming.
8.2.3 Summary of research methodology – Chapter Four
The aim of the third secondary objective was to identify the most appropriate
research methodology for the study. The nature of the research was solving a
problem by following several steps in sequence. The purpose of the study was
to solve a problem which was to determine and analyse the value of Internet-
based businesses at the various stages of Internet presence, in order to
establish whether the e-business strategy implemented created value for the
SUMMARY, CONCLUSIONS AND RECOMMENDATIONS CHAPTER 8
334
Internet-based business. The product of research was the ultimate outcome of
the research, which was the primary objective of the study. As stated in Chapter
One, the intended product of the study was to determine whether an e-business
strategy added value to an Internet-based business in terms of its valuation.
Based on the intended product, appropriate recommendations would be made,
which was the purpose of Chapter Eight. The research process that was
followed was depicted for the first time in Figure 1.1. The research process
included literature overviews of relevant topics (Internet-based businesses and
valuation approaches) and the use of the research methodology identified to
collect and analyse data to make appropriate recommendations. A positivistic
paradigm was followed and the presentation of the research would be in the
format of a thesis, journal articles and conference presentations.
To summarise the research classification, the type of research for the study was
predictive research because the primary objective was to determine whether an
e-business strategy would create value for a business. The research process
followed was quantitative because secondary data for four selected businesses
was analysed and transformed into usable numerical data. The logic of
research was deductive as 10 research hypotheses were formulated in Chapter
One and tested in Chapter Seven. The study was applied research because the
findings would only be usable for businesses considering e-business strategies
(regardless of the stage in the e-business model as described in Chapter Two).
The research was also usable by valuators and possible investors because the
findings would give an indication whether e-business strategies added value to
the business and therefore it would suggest future growth opportunities.
The population for the study was public companies listed on the JSE. The
sampling frame was the South African public companies, and the sample used
was all the businesses listed on the JSE in the food and drug industry (retailers
and wholesalers subsector). Four businesses were listed in the food and drug
sector and three of the four were used. The fourth business, which was not
included, was Pick n Pay Holdings Limited, an investment holding company with
a controlling interest in Pick n Pay Stores Ltd. Judgement sampling was was
used to select Shoprite Holdings Limited, The SPAR Group Ltd and Pick n Pay
SUMMARY, CONCLUSIONS AND RECOMMENDATIONS CHAPTER 8
335
Stores Ltd. Naspers Ltd, a business in the Media sector (broadcasting and
entertainment subsector) was also included. The main purpose of including
Naspers Ltd in the study was because it is includes the well-known click-only
business, Kalahari.net. Judgement sampling was used to select Naspers Ltd.
Secondary data from the annual financial statements of the four businesses
was obtained from the individual official websites of the four businesses. This
data was used to provide an operational and financial overview of the
businesses. The financial statements as obtained from McGregor BFA
Fin24Expert were used to compile a database for the calculations of the FCF
and ultimately for the valuation processes of the four businesses. The reason
for using the McGregor BFA financial statements was that all the financial
statements were standardised using the same parameters.
The valuations for each business were calculated for the period 2004 to 2011.
The reliability and validity of the data and the calculations were confirmed by
two independent experts in the field of accounting. The reliability and validity of
the e-business model and the classification of the four selected businesses
according to the proposed e-business model were confirmed by two
independent experts in the field of e-commerce. The data was analysed using
basic descriptive statistics, correlations and t-tests. The t-tests (both one-
sample and dependent) were used to test the research hypotheses as
formulated in Chapter One.
8.2.4 Summary of the four selected businesses – Chapter Five
The purpose of the fourth secondary objective was to conduct an analysis of the
four businesses by providing an operational and financial overview of each
business to identify events and factors that could have influenced the values of
the businesses. Therefore a brief historic overview of Shoprite, SPAR, PnP and
Naspers was provided. The operational overview for each business per year
from 2004 to 2011 was outlined. Operational highlights included awards
received, growth of stores, stores opened in new geographical locations,
acquiring of new stores, disposal of existing stores and capital spending. Other
issues addressed were the number and composition of the board of directors,
SUMMARY, CONCLUSIONS AND RECOMMENDATIONS CHAPTER 8
336
number of stores owned, store formats and store locations. The financial
overview included the NPAT, cash and cash equivalents, headline earnings,
standard and effective tax rates, number of shares authorised and outstanding,
book value per share, basic EPS, dividends paid, dividend and earnings yields,
P/E ratio, dividend cover, net asset value per share and 3-year betas.
The standard tax rates in South Africa for the four businesses from 2004 to
2011 decreased from 30% to 28%. It was also important to note that during the
2004 to 2005 period, the businesses changed from using GAAP to IFRS. The
highlights of each business were summarised by year. The discussion of each
business was concluded by classifying each business according to the e-
business model as proposed in Chapter Two. Shoprite was classified as a brick-
and-mortar business with limited online presence, SPAR as a brick-and-click
with interactive online presence, PnP as a brick-and-click in the e-commerce
stage and Naspers as an online business in the e-commerce stage.
The chapter concluded with a discussion on the business environment in which
the businesses operated. The performance of each business per year was
linked to the underlying economic climate. Possible causes for the operational
and/or financial performances of each business were highlighted per economic
year as from 2004 to 2011 to give effect to the specific secondary objective.
8.2.5 Summary of valuations of four selected businesses – Chapter Six
The fifth secondary objective was to value the four selected businesses for each
year from 2004 to 2011. The valuation approach used in the valuation process
was the DCF valuation model, also referred to as the discounted FCF valuation
model. According to previous research, as discussed in Chapters Three and
Six, the DCF valuation model was the preferred valuation approach to be used.
The variables necessary for the DCF valuation model were identified, and were
recorded in the financial database created by the researcher. FCFs were
calculated from 2004 to 2011 for each business based on the cash flow
statements obtained from McGregor BFA Fin24Expert. The R153 and R157
government bonds were used as risk-free rates in the valuations. Previous
research showing that the R157 government bond was the preferred risk-free
SUMMARY, CONCLUSIONS AND RECOMMENDATIONS CHAPTER 8
337
rate was presented. The market risk premium used by McGregor BFA ranged
between 5% and 7%. Previous research was presented showing that a 6%
market risk premium was acceptable for the South African market. The
recorded betas and WACC were also obtained from McGregor BFA
Fin24Expert. WACC was used as the discount rate in the valuations. The cost
of equity, after tax cost of debt, and the weight of equity and debt were provided
by McGregor BFA Fin24Expert. The weightings used in the calculation of
WACC by McGregor BFA Fin24Expert were assumed by the researcher to be
the target capital structure.
The valuations for Shoprite as a brick-and-mortar business with limited online
presence ranged from R180 574 million to R1 194 835 million when using the
R157 government bond as the risk-free rate for a single period valuation, while
it ranged from R180 462 million to R1 193 444 million when using the R153
government bond as the risk-free rate for a single period valuation. The multiple
period valuation using the R157 government bond as the risk-free rate ranged
from R180 574 million to R4 478 263 million and from R180 462 million to
R4 364 218 when using the R153 government bond as the risk-free rate.
The valuations for SPAR as a brick-and-click business with interactive online
presence ranged from R390 280 million to R658 348 million when using the
R157 government bond as the risk-free rate for a single period valuation while it
ranged from R390 246 million to R655 720 million when using the R153
government bond as the risk-free rate for a single period valuation. The multiple
period valuation using the R157 government bond as the risk-free rate ranged
from R390 280 million to R2 449 643 million and from R390 246 million to
R2 418 929 when using the R153 government bond as the risk-free rate.
The valuations for PnP as a brick-and-click business in the e-commerce stage
ranged from R413 521 million to R876 342 million when using the R157
government bond as the risk-free rate for a single period valuation while it
ranged from R414 669 million to R878 218 million when using the R153
government bond as the risk-free rate for a single period valuation. The multiple
period valuation using the R157 government bond as the risk-free rate ranged
SUMMARY, CONCLUSIONS AND RECOMMENDATIONS CHAPTER 8
338
from R413 521 million to R3 879 431 million and from R414 669 million to
R3 909 009 when using the R153 government bond as the risk-free rate.
The valuations for Naspers as an online business in the e-commerce stage
ranged from a positive value of R805 940 million to a negative value of
R1 125 512 million when using the R157 government bond as the risk-free rate
for a single period valuation while it ranged from a positive value of R806 234
million to a negative value of R1 128 623 million when using the R153
government bond as the risk-free rate for a single period valuation. The multiple
period valuation using the R157 government bond as the risk-free rate ranged
from a positive value of R805 940 million to a negative value of R3 781 716
million and from positive value of R806 234 million to a negative value of
R3 518 831 when using the R153 government bond as the risk-free rate.
8.2.6 Summary of statistically analysed valuation results – Chapter Seven
The aim of the sixth secondary objective was to report on the basic descriptive
statistics, the correlation and the research hypotheses testing. The descriptive
statistics (mean, median, minimum, maximum, range and standard deviation)
were reported and interpreted for each of the four businesses over the eight-
year period for each of the five valuations. If was found that the standard
deviations were relative small when compared with the mean values (standard
deviations less than 50%). The only exception was the standard deviation of
Naspers where the standard deviations were greater than 50%, regardless of
the valuation approach used. As mentioned previously, the valuations
calculated by McGregor BFA Fin24Expert were vastly different from the
valuations calculated by the researcher. The explanation for the differences was
that the researcher used the DCF valuation model where dividends and shares
outstanding were ignored, while the method used by McGregor BFA
Fin24Expert focused mainly on shares outstanding, share price, dividends paid
and received and cash. Therefore the valuation approach preferred by the
researcher focused on cash generation rather than on market value (number of
shares outstanding multiplied by share price).
SUMMARY, CONCLUSIONS AND RECOMMENDATIONS CHAPTER 8
339
The correlation results revealed that there were relatively strong positive
correlations between the valuations of Shoprite and SPAR for four of the
valuations calculated. The exception was that no correlation was found between
the valuations of Shoprite and SPAR as calculated by McGregor BFA
Fin24Expert. Three relatively strong positive correlations were found between
the valuations of Shoprite and PnP. The two exceptions where no correlations
were found were the correlation between the valuations of Shoprite and PnP
using the R157 government bond as the risk-free rate for single periods and the
correlation between the valuations of Shoprite and PnP as calculated by
McGregor BFA Fin24Expert. None of the five correlations between Shoprite and
Naspers were found to be statistically significant. Two strong positive
correlations between the valuations of SPAR and PnP were found between the
valuations calculated using the R157 government bond as the risk-free rate for
multiple periods and the R153 government bond as the risk-free rate for single
periods. No correlations were found between the valuations using the R157 and
the R153 government bonds as the risk-free rates for single periods and the
valuations as calculated by McGregor BFA Fin24Expert. The only relative
strong positive correlation between the valuations of SPAR and Naspers were
found for the valuations calculated by McGregor BFA Fin24Expert. None of the
correlations between the valuations using the R157 and R153 government
bonds as risk-free rates for single and multiple periods were statistically
significant. None of the five correlations between PnP and Naspers were found
to be statistically significant.
The results of the t-tests were used to accept or reject the research hypotheses
formulated in Chapter One. It was found that there were relationships between
the valuations of Shoprite, SPAR and PnP over the 2004 to 2011 period.
Therefore research hypotheses H1 to H3 were accepted. No relationships were
found between the five valuations of Naspers from 2004 to 2011 and therefore
research hypothesis H4 was rejected. Based on this finding, it can be stated that
online businesses in the e-commerce stage may not not add value to the
business over time. The brick-and-mortar and brick-and-click businesses were
found to increase the value of the business over time.
SUMMARY, CONCLUSIONS AND RECOMMENDATIONS CHAPTER 8
340
The dependent t-tests revealed that there were relationships between the
valuations of Shoprite and SPAR (H5), Shoprite and PnP (H6) and SPAR and
PnP (H8). Therefore the research hypotheses H5, H6 and H8 were accepted.
The dependent t-tests revealed that there were no relationships between the
valuations of Shoprite and Naspers (H7), SPAR and Naspers (H9) and PnP and
Naspers (H10). The three research hypotheses were rejected as no relationships
were found to exist between the valuations of the various businesses. It is thus
clear that there is no evidence that online businesses in the e-commerce stage
will add value to the business over time. Evidence, however to exist that brick-
and-click businesses in the interactive online presence stage and the e-
commerce stage will increase the valuation of the business over time.
8.3 FINDINGS AND RECOMMENDATIONS BASED ON EMPIRICAL RESULTS
The findings and recommendations based on the empirical results discussed in
Chapter Seven will be divided into a number of sections based on the type of
business in a specific e-business model stages.
8.3.1 Findings and recommendations based on the empirical results of brick-
and-mortar businesses with limited online presence (Shoprite Holdings
Limited)
The analysis where the five valuations of Shoprite as a brick-and-mortar
business with limited online presence were compared, indicated that four of the
relationships were statistically significant and positive. The only negative
relationship that was statistically significant was the relationship among the
valuations as calculated by McGregor BFA Fin24Expert. The positive
relationships implied that if the value of Shoprite using the R157 government
bond as the risk-free rate increases (decreases), then all the other valuations
(except the valuation as calculated by McGregor BFA Fin24Expert) will also
increase (decrease). The valuation as calculated by McGregor BFA
Fin24Expert will decrease (increase) when the valuation using either of the both
government bonds as risk-free rates for single or multiple periods increases
(decrease). A possible explanation is that the valuation approached used by
McGregor BFA Fin24Expert is based on share prices, number of shares
outstanding, dividends paid and received and cash while the DCF approach
SUMMARY, CONCLUSIONS AND RECOMMENDATIONS CHAPTER 8
341
focuses on cash generation. The valuation means of the valuations using the
R157 and R153 government bonds as risk-free rates for single period
valuations were three times higher than the valuation as calculated by
McGregor BFA Fin24Expert.
The standard deviations of the valuations of brick-and-mortar businesses with
limited online presence showed that the spread of the valuations was relatively
small when analysing the valuations using the DCF approach. The standard
deviation of the valuations calculated by McGregor BFA Fin24Expert, however,
showed that the spread of the valuations was large as the standard deviation
was greater than the mean valuation. Based on the five standard deviations, as
presented in Table 7.10, it was evident that the valuations as calculated by
McGregor BFA Fin24Expert were wider spread than the valuations calculated
using the DCF approach. Based on these findings, it is thus recommended that
brick-and-mortar businesses with limited online presence should rather use the
DCF approach to calculate valuations instead of focusing on valuation
approaches using share prices and number of shares outstanding, as the
spread of the valuations is not that widely dispersed.
The recommendation to businesses is that when valuing the brick-and-mortar
business with limited online presence, whether it is for obtaining capital,
possible acquisitions or disposals of properties, it is imperative to use the most
appropriate valuation approach. If the purpose of the valuation is to obtain
external capital, then one should consider valuation approaches that focus on
cash generation as cash generation will provide an indication of the payment of
dividends, repayment of capital and the payment of interest charged. One
should keep in mind that FCF refers to cash that is not required for operational
purposes and can be distributed to shareholders and lenders at the discretion of
management. Therefore the use of the DCF approach is advised.
If the purpose of the valuation is to make a decision regarding buying, selling or
holding the business‟s shares, then a valuation based on market value
(emphasis on share prices, number of shares and total debt) will be more
appropriate. If the business is deeply in debt, it is possible for the valuation to
SUMMARY, CONCLUSIONS AND RECOMMENDATIONS CHAPTER 8
342
be negative. Investors should investigate the reason for the business using debt
as the debt may be nearly paid off or the debt was obtained to invest in future
growth opportunities. Therefore the McGregor BFA Fin24Expert valuation will
be of greater value to the brick-and-mortar businesses with limited online
presence.
The shareholders of a business may be concerned with both types of
valuations, that is, the valuations based on cash generation and the valuations
based on market values. The reason is that cash generation will give the
shareholders an indication of possible future cash disbursements, either in the
form of dividends or reinvestments into the business for the future growth
opportunities while the valuations based on market values (emphasis on share
prices and number of shares) will provide an indication of what the investors are
willing to pay for a brick-and-mortar business with limited online presence.
Based on the empirical results presented in Chapters Six and Seven, Shoprite
as a brick-and-click business with limited online presence created value for the
business over the eight-year period. The valuations of Shoprite increased by
approximately 35% for single period valuations and 60% for multiple period
valuations while the share prices increased by 974.89% over the same period.
In the future, Shoprite may consider having interactive online presence
(therefore converting to a brick-and-click business) in order for their customers
to perform limited transactions using the Internet. Such an e-business strategy
may assist Shoprite to expand their target market reach and thus enlarge their
customer-base.
8.3.2 Findings and recommendations based on the empirical results of brick-
and-click businesses with interactive online presence (The SPAR Group
Ltd)
When comparing the five valuations of SPAR as a brick-and-click business with
interactive online presence, the findings revealed that all the relationships were
statistically significant and positive. This implies that if any one of the valuations
increases (decreases), all the other valuations will also increase (decrease).
SUMMARY, CONCLUSIONS AND RECOMMENDATIONS CHAPTER 8
343
The findings, as discussed in Chapter Seven, indicate that the valuations of
brick-and-click business with interactive online presence will increase over time.
The standard deviations of the valuations of brick-and-click businesses with
interactive online presence show that the spread of the valuations are relatively
small when analysing the valuations using the DCF approach. The standard
deviation of the valuations calculated by McGregor BFA Fin24Expert, however,
shows that the spread of the valuations are large as the standard deviation is
greater than the mean valuation. Based on the five standard deviations, as
presented in Table 7.11, it is evident that the valuations as calculated by
McGregor BFA Fin24Expert are more widely dispersed than the valuations
calculated using the DCF approach. It is thus recommended that brick-and-click
businesses with interactive online presence should rather use the DCF
approach to calculate valuations instead of focusing on valuation approaches
using share prices and number of shares outstanding.
The recommendation for valuing brick-and-click businesses with interactive
online presence, regardless of the purpose of the valuation, is that it is essential
to use the most appropriate valuation approach. Valuations of businesses serve
several purposes. If the purpose is to acquire capital from external sources,
then the valuation approach used should focus on cash generation. The cash
generation will serve as a motivation to the future investors regarding the ability
of the brick-and-click business to generate additional cash over and above what
is needed for the operational needs. The cash generated can be distributed to
shareholders in the form of dividends, debt capital can be repaid and the
payment of interest charges on debt capital will not be problematic. The DCF
approach is therefore advised to be used.
If the purpose of the valuation is to make a decision regarding buying, selling or
holding the business‟s shares, then a valuation based on market value
(emphasis on share prices and number of shares) will be recommended. The
reason for this recommendation is that the share price is an indication of the
attitudes of investors towards the business. The greater the demand for the
shares, the higher the share price, the higher the valuation of the business.
SUMMARY, CONCLUSIONS AND RECOMMENDATIONS CHAPTER 8
344
Therefore the McGregor BFA Fin24Expert valuation will be of greater value to
the brick-and-click business with interactive online presence.
The cash generation ability of a business and the market value of the
business‟s share are important to shareholders. Cash generation over and
above what is needed for operational needs is an important indicator for
shareholders of the business‟s ability to generate cash for possible distribution
to shareholders in the form of dividends. The additional cash generated could
also be used for feasible and sustainable future growth opportunities which
could lead to greater cash generation. The market value of the shares will give
the shareholders, and future investors, an indication of the current investors‟
sentiment regarding the business. The higher the share price the greater the
sentiment and the better the outlook of the brick-and-click business with
interactive online presence as perceived by the investors. Therefore both
valuation approaches might be preferred by future investors.
Based on the findings presented in Chapter Seven, if SPAR as a brick-and-click
business with interactive online presence remains in the e-business model
stage, it should be possible for SPAR to create value for the business over time.
It is recommended that SPAR should consider expanding their online presence
in the future depending on the actions taken by SPAR‟s direct and indirect
competition to remain a dominant player in the food and drug retail industry.
8.3.3 Findings and recommendations based on the empirical results of brick-
and-click businesses in the e-commerce stage (Pick n Pay Stores Ltd)
The findings of the comparison of the five valuations of PnP as a brick-and-click
business in the e-commerce stage revealed that four of the five relationships
were statistically significant and positive. The four statistically significant
relationships are among the valuations calculated using the DCF valuation
approach. This implies that if any one of the DCF valuations increases
(decreases), all the other DCF valuations will also increase (decrease). The
negative relationships among the valuations calculated by McGregor BFA
Fin24Expert were not statistically significant. Therefore brick-and-click
SUMMARY, CONCLUSIONS AND RECOMMENDATIONS CHAPTER 8
345
businesses in the e-commerce stage will create value for the business over
time.
The standard deviations of the valuations of brick-and-click businesses in the e-
commerce stage show that the spread of the valuations is relatively large when
analysing the valuations using the DCF approach because the standard
deviations are slightly higher than the mean valuations. The standard deviation
of the valuations calculated by McGregor BFA Fin24Expert shows that the
spread of the valuations are large as the standard deviation is greater than the
mean valuation because the standard deviation is approximately 122 times
larger than the mean valuations. Based on the five standard deviations, as
presented in Table 7.12, it is evident that the valuations as calculated by
McGregor BFA Fin24Expert are much more widely dispersed than the
valuations calculated using the DCF approach. It is thus recommended that
brick-and-click businesses in the e-commerce stage should rather use the DCF
approach to calculate valuations instead of focusing on valuation approaches
using share prices and number of shares outstanding. Another reason for using
the DCF approach instead of the valuations approach used by McGregor BFA
Fin24Expert is that the findings indicate that there is no relationship between
the valuations using McGregor BFA Fin24Expert valuation approach.
The recommendation for valuing brick-and-click businesses in the e-commerce
stage, regardless of the purpose of the valuation, is that the DCF approach
should be used. The findings indicated that there is no relationship between the
valuations focusing on share prices, number of shares and total debt, but there
are relationships among the valuations when using the DCF approach.
The findings presented in Chapter Seven indicated that if PnP as a brick-and-
click business in the e-commerce stage remains in the e-business model stage
and not move to the e-business stage, it is possible for PnP to create value for
the business over time. It is recommended that PnP should consider moving
from the e-commerce stage to the e-business stage of the e-business model as
it will assist in reducing operational costs, increasing efficiency and
effectiveness of operations.
SUMMARY, CONCLUSIONS AND RECOMMENDATIONS CHAPTER 8
346
8.3.4 Findings and recommendations based on the empirical results of online
businesses in the e-commerce stage (Naspers Ltd)
In the analysis of the five valuations of Naspers as an online business in the e-
commerce stage, the findings revealed that all the relationships were not
statistically significant (see Figure 7.13). The four valuations calculated using
DCF approach yielded negative relationships while the valuations as per
McGregor BFA Fin24Expert yielded a positive relationship. Therefore no
relationships exist between the changes in the valuations and thus it is not
possible to state that an online business in the e-commerce stage will create
value for the business over time.
As all the relationships were not statistically significant, the question should be
asked whether using the DCF method of valuation was the most appropriate
method to use. The recommendation is rather that a new valuation approach
should be developed that can be used exclusively for online businesses.
It is furthermore recommended that brick-and-click businesses should remain
as brick-and-click businesses, regardless of the e-business model stage the
businesses are in because the findings indicated that brick-and-click businesses
do create value over time. The findings for online businesses in the e-
commerce stage, however, indicated that it is not possible to state whether
value is created or not.
8.3.5 Findings and recommendations based on the empirical results of
comparing brick-and-mortar businesses with limited online presence
(Shoprite Holdings Limited) with brick-and-click businesses with
interactive online presence (The SPAR Group Ltd)
When comparing the five valuations of Shoprite as a brick-and-mortar business
with limited online presence with the five valuations of SPAR as a brick-and-
click business with interactive online presence, the findings revealed that four of
the five relationships were statistically significant and negative while one was
statistically significant and positive. The results were presented in Table 7.14.
This implies that if the valuation of Shoprite increases (decreases), the valuation
of SPAR decreases (increases). Therefore there is a negative relationship
SUMMARY, CONCLUSIONS AND RECOMMENDATIONS CHAPTER 8
347
between the valuations of brick-and-mortar businesses with limited online
presence and the valuations of brick-and-click businesses with interactive online
presence.
The recommendation is that if the valuation of the brick-and-mortar business is
consistently low or decreasing, it is worthwhile to consider expanding the
business‟s reach online. The brick-and-mortar business should firstly analyse
why the value of the business is consistently low or decreasing. One of the
reasons could be that the financial performance of the business is lacking. If the
financial performance is lacking owing to a restricted market (relatively low
market share compared to competitors within the industry), then online
expansion might be a good investment. If poor financial performance is a result
of inefficiencies with external stakeholders, then the brick-and-mortar business
should consider implementing a B2B commerce strategy after discussing such
strategies with the relevant internal and external parties. The use of an e-
business strategy by implementing one of the e-business model stages is a
great means of entering into markets, but careful planning should precede such
implementation.
The valuation of the business may also yield a low value as a result of
inconsistent accounting practices, which should be rectified as soon as possible
according to the IFRS and noted in the annual reports. The financial
performance of the business plays an important role in the valuation process
because the FCFs are calculated from the cash flow statements and indirectly it
influences the share price of the business.
8.3.6 Findings and recommendations based on empirical results of comparing
brick-and-mortar business with limited online presence (Shoprite
Holdings Limited) with brick-and-click businesses in the e-commerce
stage (Pick n Pay Stores Ltd)
The comparison of the five valuations of Shoprite as a brick-and-mortar
business with limited online presence with the five valuations of PnP as a brick-
and-click business in the e-commerce stage, the findings revealed that three of
the five relationships were statistically significant and negative. The two
SUMMARY, CONCLUSIONS AND RECOMMENDATIONS CHAPTER 8
348
relationships that were not statistically significant were positive. See Table 7.15
for results. This implies that if the valuation of Shoprite increases (decreases),
the valuation of PnP decreases (increases). Therefore there is a negative
relationship between the valuations of brick-and-mortar businesses with limited
online presence and the valuations of brick-and-click businesses in the e-
commerce stage.
It is recommended that if the valuations of brick-and-mortar businesses with
limited online presence are consistently low or consistently decreasing, then a
detailed analysis of the financial performance of the business should be
undertaken. If it is found that the low valuations are a result of low market share,
then an attempt should be made to increase the market share. One option for
the brick-and-mortar business with limited online presence is to move to the
next e-business model state, namely to convert to a brick-and-click business
with interactive online business (or even in the e-commerce stage). If the low or
decreasing business value is as a result of poor financial performance, an in-
depth study should be done of the financial performance. The financial
performance of any type of business will influence the FCFs of the business
which is a crucial variable of the DCF approach. Again, a word of caution is
extended that the implementation of an e-business strategy using one of the e-
business model stages should be preceded by careful planning and analysis.
8.3.7 Findings and recommendations based on empirical results of comparing
brick-and-mortar businesses with limited online presence (Shoprite
Holdings Limited) with online businesses in the e-commerce stage
(Naspers Ltd)
The five valuations of Shoprite as a brick-and-mortar business with limited
online presence were compared with the five valuations of Naspers as an online
business in the e-commerce stage. The findings, as presented in Table 7.16,
indicated that only two of the five relationships were statistically significant and
positive. Three relationships were not statistically significant, two positive and
one negative. This implies that there is no relationship between valuations of
brick-and-mortar businesses with limited online presence and the valuations of
online businesses in the e-commerce stage.
SUMMARY, CONCLUSIONS AND RECOMMENDATIONS CHAPTER 8
349
The recommendation to brick-and-mortar businesses with limited online
presence is not to convert to online businesses in the e-commerce stage as no
evidence can be found that value would be created for the existing brick-and-
mortar business as an online business.
8.3.8 Findings and recommendations based on empirical results of comparing
brick-and-click businesses with interactive online presence (The SPAR
Group Ltd) with brick-and-click businesses in the e-commerce stage (Pick
n Pay Stores Ltd)
The comparative analysis of the five valuations of SPAR as a brick-and-click
business with interactive online presence and the five valuations of PnP as a
brick-and-click business in the e-commerce stage revealed that four of the five
relationships were statistically significant. All four relationships were negative.
Only one relationship was positive but not statistically significant. See Table
7.17. This implies that if the valuation of SPAR increases (decreases), the
valuation of PnP decrease (increase). Therefore there is a negative relationship
between the valuations of brick-and-click businesses with interactive online
presence and the valuations of brick-and-click businesses in the e-commerce
stage.
It is recommended that when the valuations of brick-and-click businesses with
interactive online presence are consistently low or consistently decreasing, then
a detailed analysis of the financial performance of the business should be
undertaken. If it is found that the low valuations are a result of low market share,
then an attempt should be made to increase the market share. One option for
the brick-and-click business with interactive online presence is to move to the
next e-business model state, namely to convert to a brick-and-click business in
the e-commerce stage (or even into the e-business stage). If the low or
decreasing business value is as a result of poor financial performance, an in-
depth study should be done of the financial performance. The financial
performance of any type of business will influence the FCFs of the business
which is a crucial variable of the DCF approach. The implementation of an e-
business strategy using one of the e-business model stages should be
preceded by careful planning and analysis.
SUMMARY, CONCLUSIONS AND RECOMMENDATIONS CHAPTER 8
350
Another recommendation is that the brick-and-click business with interactive
online presence should make sure that their website with all the hyperlinks and
additional webpages are reliable. A decline in the value of the business could
be a result of a poorly designed website. If it is found that the website of the
brick-and-click business with interactive online presence is the main problem,
the website should be redesigned with a more effective navigation system. If the
valuation of the business is still below what is expected, alternative actions
should be considered. One action could be to expand the customer base by
converting to a brick-and-click business in the e-commerce stage. This should
however only be considered once all problems with the website has been
corrected and proper planning and development was done for the e-commerce
stage.
8.3.9 Findings and recommendations based on empirical results of comparing
brick-and-click businesses with interactive online presence (The SPAR
Group Ltd) with online businesses in the e-commerce stage (Naspers Ltd)
The five valuations of SPAR as a brick-and-click business with interactive online
presence were compared with the five valuations of Naspers as an online
business in the e-commerce stage. The findings presented in Table 7.18
revealed that only two of the five relationships were statistically significant and
positive. Three relationships were not statistically significant, two positive and
one negative. Therefore no relationships exist between the valuations of brick-
and-click businesses with interactive online presence and the valuations of
online businesses in the e-commerce stage.
The recommendation to brick-and-click businesses with interactive online
presence should not to convert to online businesses in the e-commerce stage.
No evidence was found in the results that value would be added to the original
brick-and-click business with interactive online presence if the business
changed to online business in the e-commerce stage.
SUMMARY, CONCLUSIONS AND RECOMMENDATIONS CHAPTER 8
351
8.3.10 Findings and recommendations based on empirical results of comparing
brick-and-click businesses in the e-commerce stage (Pick n Pay Stores
Ltd) with online businesses in the e-commerce stage (Naspers Ltd)
The comparing of the five valuations of PnP as a brick-and-click business in the
e-commerce stage with the five valuations of Naspers as an online business in
the e-commerce stage revealed that only two of the five relationships were
statistically significant and negative. Two of the three relationships that were
found not to be statistically significant were positive and one negative. This
implies that there is no relationship between the valuations of brick-and-click
businesses in the e-commerce stage and the valuations of online businesses in
the e-commerce stage. The findings were presented in Table 7.19.
Therefore the recommendation to brick-and-click businesses in the e-commerce
stage is not to change to online businesses in the e-commerce stage. The
findings provided no evidence that value would be added to the valuation of
business-and-click businesses if such a move was made.
8.3.11 Summary of relationships found
In Chapter One a revised model of business valuations at various e-business
model stages were presented. Figure 8.2 graphically illustrates the relationships
that were tested in the study. The relationships that were found to be
statistically significant are illustrated by means of solid lines. The relationships
found not to be statistically significant are illustrated by means of dashed lines.
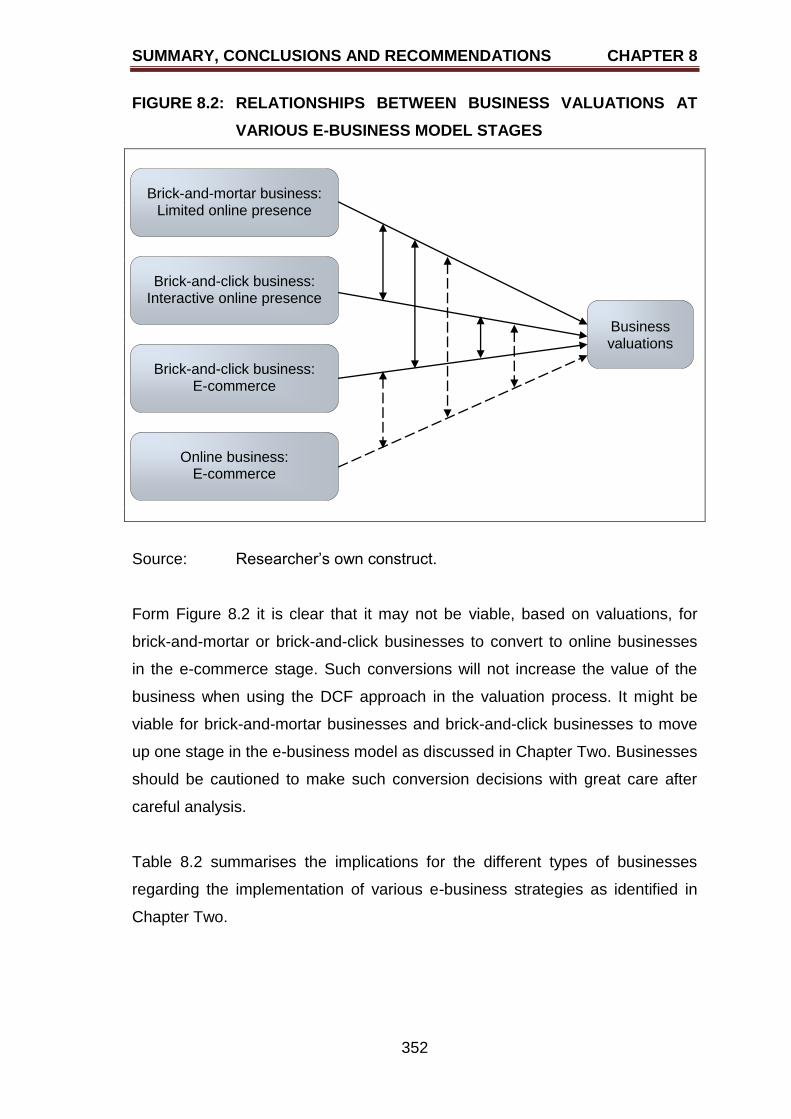
SUMMARY, CONCLUSIONS AND RECOMMENDATIONS CHAPTER 8
352
FIGURE 8.2: RELATIONSHIPS BETWEEN BUSINESS VALUATIONS AT
VARIOUS E-BUSINESS MODEL STAGES
Source: Researcher‟s own construct.
Form Figure 8.2 it is clear that it may not be viable, based on valuations, for
brick-and-mortar or brick-and-click businesses to convert to online businesses
in the e-commerce stage. Such conversions will not increase the value of the
business when using the DCF approach in the valuation process. It might be
viable for brick-and-mortar businesses and brick-and-click businesses to move
up one stage in the e-business model as discussed in Chapter Two. Businesses
should be cautioned to make such conversion decisions with great care after
careful analysis.
Table 8.2 summarises the implications for the different types of businesses
regarding the implementation of various e-business strategies as identified in
Chapter Two.
Business valuations
Brick-and-mortar business: Limited online presence
Brick-and-click business: Interactive online presence
Brick-and-click business: E-commerce
Online business: E-commerce
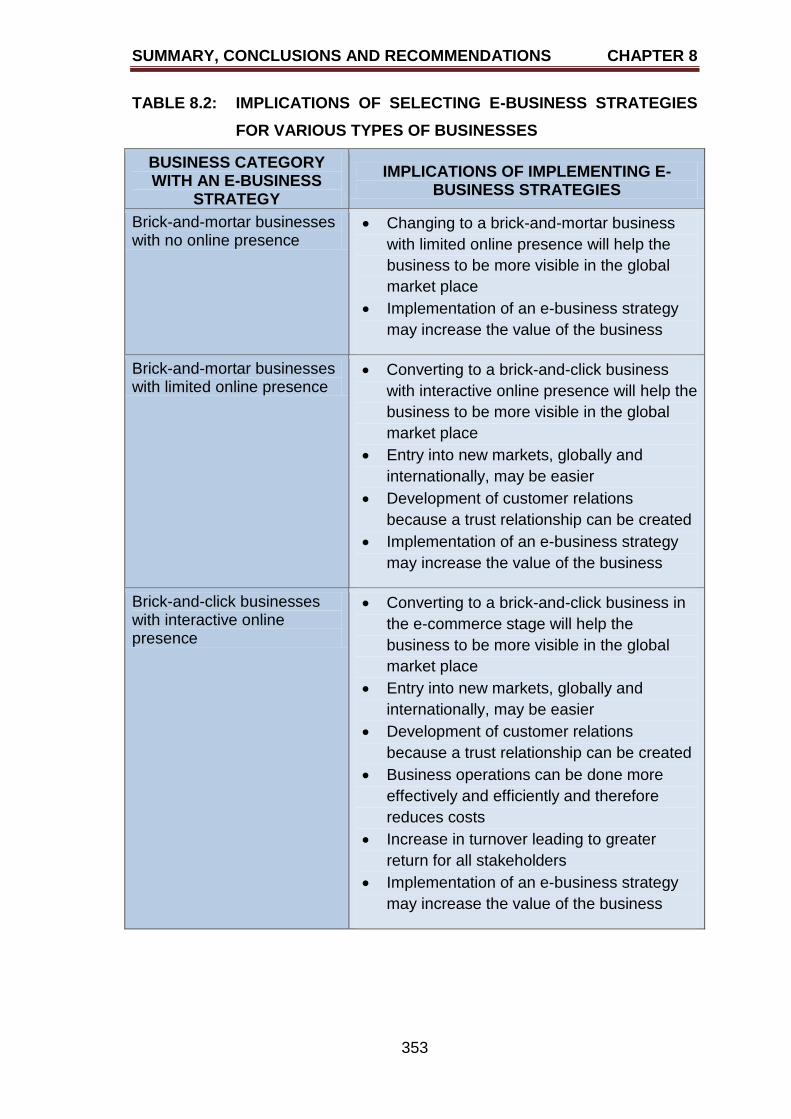
SUMMARY, CONCLUSIONS AND RECOMMENDATIONS CHAPTER 8
353
TABLE 8.2: IMPLICATIONS OF SELECTING E-BUSINESS STRATEGIES
FOR VARIOUS TYPES OF BUSINESSES
BUSINESS CATEGORY WITH AN E-BUSINESS
STRATEGY
IMPLICATIONS OF IMPLEMENTING E-BUSINESS STRATEGIES
Brick-and-mortar businesses with no online presence
Changing to a brick-and-mortar business
with limited online presence will help the
business to be more visible in the global
market place
Implementation of an e-business strategy
may increase the value of the business
Brick-and-mortar businesses with limited online presence
Converting to a brick-and-click business
with interactive online presence will help the
business to be more visible in the global
market place
Entry into new markets, globally and
internationally, may be easier
Development of customer relations
because a trust relationship can be created
Implementation of an e-business strategy
may increase the value of the business
Brick-and-click businesses with interactive online presence
Converting to a brick-and-click business in
the e-commerce stage will help the
business to be more visible in the global
market place
Entry into new markets, globally and
internationally, may be easier
Development of customer relations
because a trust relationship can be created
Business operations can be done more
effectively and efficiently and therefore
reduces costs
Increase in turnover leading to greater
return for all stakeholders
Implementation of an e-business strategy
may increase the value of the business
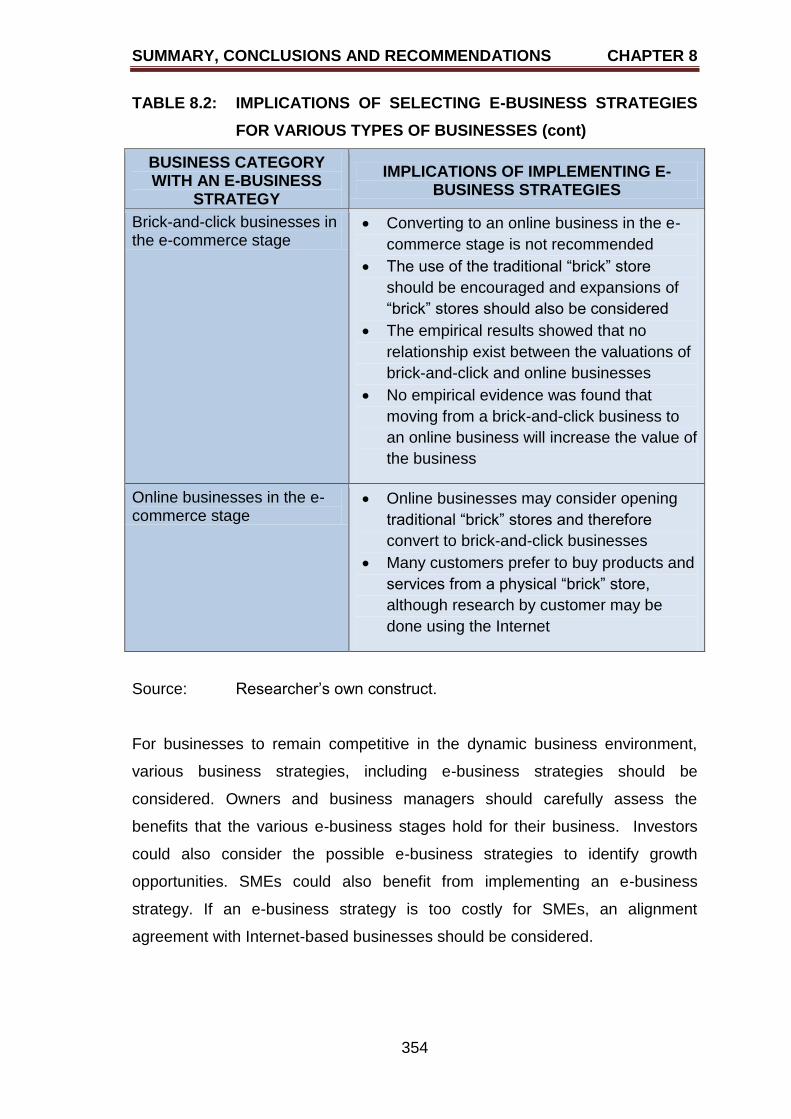
SUMMARY, CONCLUSIONS AND RECOMMENDATIONS CHAPTER 8
354
TABLE 8.2: IMPLICATIONS OF SELECTING E-BUSINESS STRATEGIES
FOR VARIOUS TYPES OF BUSINESSES (cont)
BUSINESS CATEGORY WITH AN E-BUSINESS
STRATEGY
IMPLICATIONS OF IMPLEMENTING E-BUSINESS STRATEGIES
Brick-and-click businesses in the e-commerce stage
Converting to an online business in the e-
commerce stage is not recommended
The use of the traditional “brick” store
should be encouraged and expansions of
“brick” stores should also be considered
The empirical results showed that no
relationship exist between the valuations of
brick-and-click and online businesses
No empirical evidence was found that
moving from a brick-and-click business to
an online business will increase the value of
the business
Online businesses in the e-commerce stage
Online businesses may consider opening
traditional “brick” stores and therefore
convert to brick-and-click businesses
Many customers prefer to buy products and
services from a physical “brick” store,
although research by customer may be
done using the Internet
Source: Researcher‟s own construct.
For businesses to remain competitive in the dynamic business environment,
various business strategies, including e-business strategies should be
considered. Owners and business managers should carefully assess the
benefits that the various e-business stages hold for their business. Investors
could also consider the possible e-business strategies to identify growth
opportunities. SMEs could also benefit from implementing an e-business
strategy. If an e-business strategy is too costly for SMEs, an alignment
agreement with Internet-based businesses should be considered.
SUMMARY, CONCLUSIONS AND RECOMMENDATIONS CHAPTER 8
355
8.4 CONTRIBUTIONS OF THE STUDY TO THE FIELD OF VALUATIONS
A number of contributions are evident when considering the purpose of the
research. The contributions range from the literature overview, to the research
methodology to the research findings.
Firstly, a unique research design was adopted in the study. Although a
positivistic research methodology was adopted, the traditional reliability and
validity measurements normally associated with a positivistic research
methodology could not be used. The researcher had to develop other methods
to ensure reliability and validity of the data used. Method triangulation was used
as a double checking mechanism to ensure the calculated FCFs were
calculated correctly. The FCFs were calculated using both methods as provided
by the literature. The collected data, equations used and workings were
captured on a database. Therefore the database could be used for other similar
studies to yield similar results. A further measure undertaken by the researcher
to ensure reliability and validity was the consultation of experts. Two experts in
the field of accounting and two experts in the field of e-commerce were
consulted to ensure reliability and validity of data, workings and classifications.
The second contribution made by the research was the classification of the
various types of businesses as brick-and-mortar and Internet-based (brick-and-
click and online) businesses. Online businesses were categorised as click-only
businesses, Internet search engines, Internet social networks and other
businesses which include blogs and auctions.
The third contribution was the proposing of an e-business model based on a
number of existing e-business models. Each of the e-business model stages
where furthermore linked to one or more types of businesses. The proposed e-
business model stages were:
no online presence (brick-and-mortar businesses);
limited online presence (brick-and-mortar businesses);
interactive online presence (brick-and-click businesses);
e-commerce (brick-and-click businesses and online businesses); and
SUMMARY, CONCLUSIONS AND RECOMMENDATIONS CHAPTER 8
356
e-business (brick-and-click businesses and online businesses).
The fourth contribution of the research is in terms of the literature overview. A
detailed summary of the different valuation approaches was provided. For each
of the valuation approaches, the type of business where the valuation approach
can be used was identified. The unknown variables and the shortcomings of
each valuation approach were also tabulated.
The research made a fifth contribution when it provided an overview of the
previous research in the field of valuations. Based on this section of the
research, the researcher concluded that the DCF approach would be the most
appropriate valuation approach to be used in the study.
The sixth contribution of the research is based on the results. It was found that
the movement from being a brick-and-mortar business with limited online
presence to being a brick-and-click business in the e-commerce stage does
increase the value of the business. It also makes no sense for a brick-and-click
business to dispose of the “brick” part of the business for a conversion into an
online business (for example click-only). No evidence was found to support the
feasibility of such a decision in terms of value creation.
Based on the various purposes of valuations and the research findings, specific
valuation approaches should be used. Tables 8.3 and 8.4 summarise the
applicability of the various valuation approaches from the business and investor
perspective as the seventh contribution of the study.
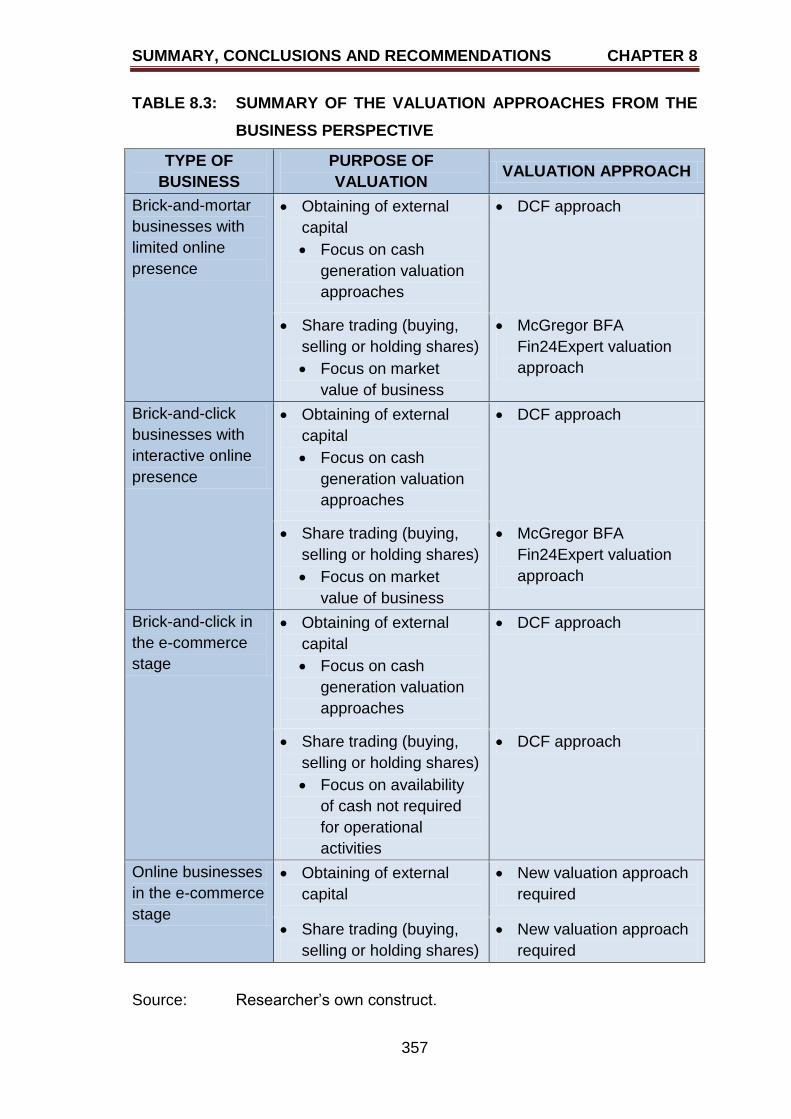
SUMMARY, CONCLUSIONS AND RECOMMENDATIONS CHAPTER 8
357
TABLE 8.3: SUMMARY OF THE VALUATION APPROACHES FROM THE
BUSINESS PERSPECTIVE
TYPE OF
BUSINESS
PURPOSE OF
VALUATION VALUATION APPROACH
Brick-and-mortar
businesses with
limited online
presence
Obtaining of external
capital
Focus on cash
generation valuation
approaches
DCF approach
Share trading (buying,
selling or holding shares)
Focus on market
value of business
McGregor BFA
Fin24Expert valuation
approach
Brick-and-click
businesses with
interactive online
presence
Obtaining of external
capital
Focus on cash
generation valuation
approaches
DCF approach
Share trading (buying,
selling or holding shares)
Focus on market
value of business
McGregor BFA
Fin24Expert valuation
approach
Brick-and-click in
the e-commerce
stage
Obtaining of external
capital
Focus on cash
generation valuation
approaches
DCF approach
Share trading (buying,
selling or holding shares)
Focus on availability
of cash not required
for operational
activities
DCF approach
Online businesses
in the e-commerce
stage
Obtaining of external
capital
New valuation approach
required
Share trading (buying,
selling or holding shares)
New valuation approach
required
Source: Researcher‟s own construct.
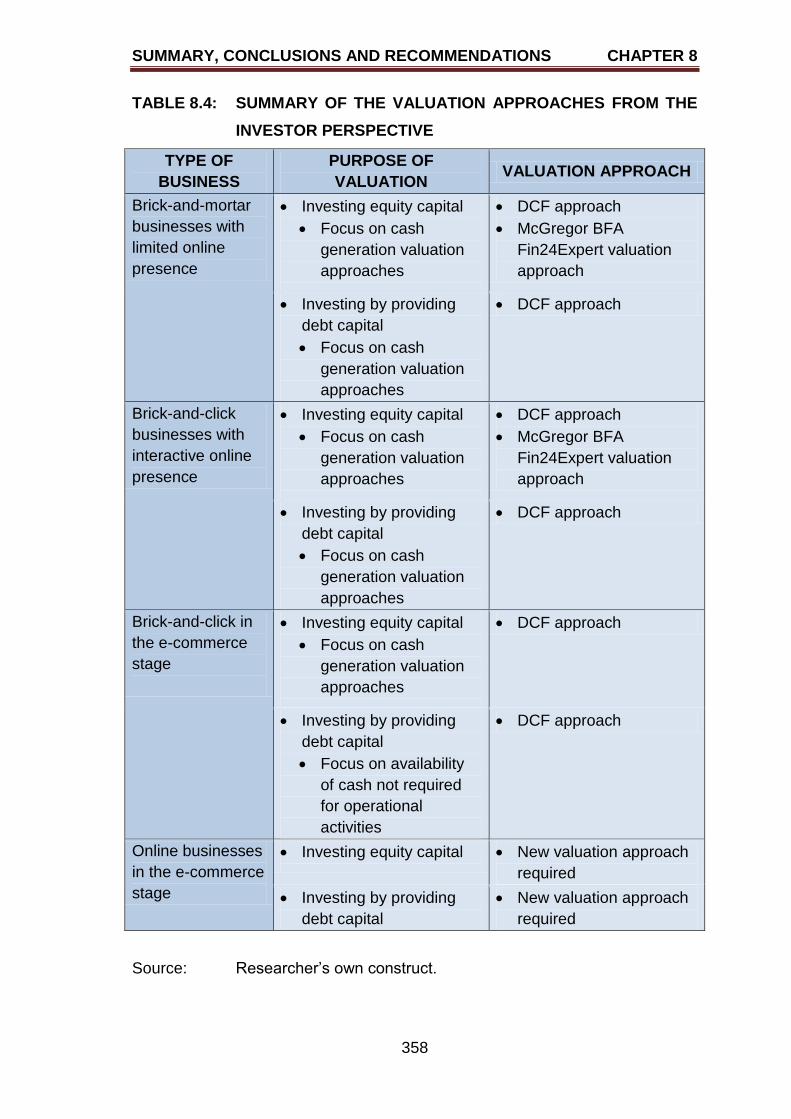
SUMMARY, CONCLUSIONS AND RECOMMENDATIONS CHAPTER 8
358
TABLE 8.4: SUMMARY OF THE VALUATION APPROACHES FROM THE
INVESTOR PERSPECTIVE
TYPE OF
BUSINESS
PURPOSE OF
VALUATION VALUATION APPROACH
Brick-and-mortar
businesses with
limited online
presence
Investing equity capital
Focus on cash
generation valuation
approaches
DCF approach
McGregor BFA
Fin24Expert valuation
approach
Investing by providing
debt capital
Focus on cash
generation valuation
approaches
DCF approach
Brick-and-click
businesses with
interactive online
presence
Investing equity capital
Focus on cash
generation valuation
approaches
DCF approach
McGregor BFA
Fin24Expert valuation
approach
Investing by providing
debt capital
Focus on cash
generation valuation
approaches
DCF approach
Brick-and-click in
the e-commerce
stage
Investing equity capital
Focus on cash
generation valuation
approaches
DCF approach
Investing by providing
debt capital
Focus on availability
of cash not required
for operational
activities
DCF approach
Online businesses
in the e-commerce
stage
Investing equity capital
New valuation approach
required
Investing by providing
debt capital
New valuation approach
required
Source: Researcher‟s own construct.
SUMMARY, CONCLUSIONS AND RECOMMENDATIONS CHAPTER 8
359
8.5 LIMITATIONS OF THE STUDY AND FUTURE RESEARCH AREAS
There were a number of limitations to the study which can also indicate future
research areas. Firstly a comparative valuation analysis could only be done if
standardised financial statements were available. It is for this reason that the
McGregor BFA Fin24Expert package was used to source the relevant financial
data because all the financial statements were standardised in the same
manner. The limitation with regard the use of McGregor BFA Fin24Expert was
that only South African businesses were available for analysis.
Secondly, the number of online businesses within South Africa that are listed on
the JSE is limited. Therefore the researcher used Naspers in this study as many
of the subsidiaries of Naspers are brick-and-click or online businesses.
Kalahari.net, a subsidiary of Naspers, is a well-known online business in South
Africa. Another limitation that may have influenced the valuations is that
Naspers is operating in more global business environments than Shoprite,
SPAR and PnP. Therefore Shoprite, SPAR and PnP were exposed to the
economic climate of Africa (major areas covered by the three businesses),
whereas Naspers was exposed to economic climates such as Africa, Europe,
Asia and the Americas.
Thirdly, the number of brick-and-click in the e-commerce stage and online
businesses in South Africa is very limited and the annual reports of international
online businesses are not available as these businesses are not public
companies at the time the study was conducted. If it is in the future possible to
obtain the annual reports with standardised financial statements of the various
types of online businesses as discussed in Chapter Two, a comparative study
of the valuations using various valuation approaches should be feasible.
Fourthly, the sample was relatively small. The study could be repeated with a
larger sample size. Similar research could be conducted with businesses from
other sectors as classified by the JSE, provided that the businesses included in
the study are representative of the types of businesses (brick-and-mortar, brick-
and-click and online) and in the various e-business model stages.
SUMMARY, CONCLUSIONS AND RECOMMENDATIONS CHAPTER 8
360
Fifthly, another limitation of the study is that three of the four businesses
analysed were from the food and drug sector while one is in the broadcasting
and entertainment sector. Ideally the businesses should have been from the
same sector, but owing to the limited choice of online businesses, it was not
possible to create a sample from the same sector that would be falling into the
various e-business model stages.
Sixthly, the valuations were based on historical FCF although valuations are
usually forward looking. The aim of the study was to establish whether there are
any relationships among the various valuations of the selected businesses.
Therefore the valuation based on historical FCF will suffice as the valuations
were linked to a specific e-business model stage. It is also recommended that
single period valuations should not be used as it does not present a true
valuation of the business over time. It is however possible to repeat the study
with forecasted future FCF. A future research area is to quantify the benefit of
using an e-business strategy.
Lastly, the classification of the various businesses investigated according to the
e-business model is based on what was found on the official website available
to the general public. Therefore the researcher could not establish to what
extent the four businesses use business-to-business commerce (B2B
commerce). However, the researcher‟s main focus was to determine what level
of online interaction takes place between the four businesses and their
customers and potential customers. The focus was thus more on business-to-
customer commerce (B2C commerce) and customer-to-business commerce
(C2B commerce).
8.6 CONCLUDING REMARKS
All businesses, regardless of whether they are brick-and-mortar or Internet-
based businesses, are cautioned to carefully analyse the operational aspects of
the business before deciding to move to the next e-business model stage. A
further cautionary note should be made in terms of analysing competition.
Although direct and/or indirect competition may appear not to be engaged at
some stage of e-business model, B2B commerce strategies may be
SUMMARY, CONCLUSIONS AND RECOMMENDATIONS CHAPTER 8
361
implemented to increase efficiency of the businesses. Therefore the
implementation of an e-business strategy using one of the e-business model
stages, should not be adopted blindly but should be made with great
consideration. If it is too costly for SMEs in particular to implement the e-
business model, one option is to enter into an agreement with brick-and-click or
online businesses providing online services to the SMEs.
In Chapter One, the problem statement for the study was formulated as:
Does the value of Internet-based businesses differ during the various
stages of Internet presence?
To answer the problem statement, the primary objective of this study was to
determine and analyse the value of Internet-based businesses at the various
stages of Internet presence, to determine the value creation of an e-business
strategy.
Therefore the answer to the question asked in the problem statement is yes, but
only to a limited extent. Value is created when moving from a brick-and-mortar
with limited online presence to brick-and-click businesses with interactive online
presence, and from brick-and-click businesses with interactive online presence
to brick-and-click businesses in the e-commerce stage. It is not feasible to
convert from a brick-and-mortar business or brick-and-click business to an
online business, as no evidence could be found that value would be created for
the new business. It was also found that the existing valuation approaches as
described in the literature, are not as applicable to online businesses as one
would expect. Therefore a new valuation approach for online businesses should
be developed. The alternative approach to valuation, as discussed in Section
6.7 may be one such approach to be used.
To conclude, an e-business strategy is not the answer to all problems. The
reasons for considering an e-business strategy should be valid and feasible.
Great care should be taken when deciding on implementing an e-business
strategy using one of the e-business model stages. If the implementation is not
properly planned and executed, it may be a costly exercise.
REFERENCES
362
REFERENCES
Abor, J. & Quartey, P. 2010. Issues in SME development in Ghana and South
Africa. International Research Journal of Finance and Economics,
(39):218-228.
Abdallah, W.M. & Maghrabi, A.S. 2009. Do multinational companies have
effective transfer pricing systems of intangible assets and e-commerce?
International Journal of Commerce and Management, 19(2):115-126.
Acar, A. 2008. Antecedents and consequences of online social networking
behaviour: The case of Facebook. Journal of Website Promotion, 2(1):62-
83.
Achleitner, A-K., Lutz, E. & Schraml, S. 2010. Quantitative valuation of platform
technology based entrepreneurial ventures. International Journal of
Entrepreneurial Venturing, 1(4):352-366.
Adali, S., Escriva, R., Goldberg, M.K., Hayvanonych, M., Magdon-Ismail, M.,
Szymanski, B.K., Wallace, W.A. & Williams, G.T. 2008. Measuring
behavioural trust in social networks. Center for Dynamic Data Analysis for
Homeland Security.
Águila-Obra, Del, A.R., Padilla-Meléndez, A. & Serarols-Tarrés, C. 2007. Value
creation and new intermediaries on Internet. An exploratory analysis of
the online new industry and the web content aggregators. International
Journal of Information Management, 27:187-199.
Ali, M., El-Haddadeh, R., Eldabi, T. & Mansour, E. 2010. Simulation discounted
cash flow valuation for Internet companies. International Journal of
Business Information Systems, 6(1):18-33.
Allee, V. 2008. Value network analysis and value conversion of tangible and
REFERENCES
363
intangible assets. Journal of Intellectual Capital, 9(1):5-24.
Allen, J., Clark, R. & Houde, J-F. 2009. Market structure and the diffusion of e-
commerce: Evidence from the retail banking industry. [Online]. Available:
http://www.ssc.wisc.edu/~houdejf/ebanking_06_2009.pdf (Accessed 7
May 2012).
Amazon.com, Inc. 2004. [Online]. Available: http://www.fundinguniverse.com
/company-histories/Amazoncom-Inc-Company-History.html (Accessed 28
June 2011).
Amit, R. & Zott, C. 2001. Value creation in e-business. Strategic Management
Journal, 22:493-520.
Anderson, A., Harter, G., Hagen, H. & Plenge, S. 2011. Booz CIO briefing: How
social media and apps are transforming e-commerce.
ComputerWeekly.com, 23 May. [Online]. Available: http://www.computer
weekly.com/Articles/2011/05/23/246753/Booz-CIO-Briefing-How-social-
media-and-apps-are-transforming-e-commerce.htm (Accessed 4 July
2011).
Arend, R.J. 2006. Bursting bubbles. Journal of Management Inquiry, 15:372-
382.
„As e-retail market rebounds‟, mobile sales record extraordinary growth. (n.a.)
2012. IMRG. [Online]. Available: http://www.imrg.org/ImrgWebsite/User/
Pages/PressReleases.aspx?pageID=85&parentPageID=0&itemID=7327
&pageTemplate=7&isHomePage=false&isDetailData=true&specificPage
Type=5 (Accessed 21 May 2012).
Ashford, W. 2011a. Google buys price comparison website for £37.7m.
ComputerWeekly.com, 8 March. [Online]. Available: http://www.computer
weekly.com/Articles/2011/03/08/245760/Google-buys-price-comarison-
webiste-for-16337.7m.htm (Accessed 18 July 2011).
REFERENCES
364
Ashford, W. 2011b. LinkedIn reveals plans for IPO. ComputerWeekly.com,
28 January. [Online]. Available: http://www.computerweekly.com/Articles/
2011/01/28/245118/LinkedIn-reveals-plans-for-an-IPO.htm (Accessed 18
July 2011).
Ashford, W. 2011c. Winklevoss twins call off battle against Facebook.
ComputerWeekly.com, 23 June. [Online]. Available: http://www.computer
weekly.com/Articles/2011/06/23/247086/Winklevoss-twins-call-off-battle-
against-Facebook.htm (Accessed 18 July 2011).
Ashuri, B., Lu, J. & Kashani, H. 2011. A real option framework to evaluate
investments in toll road projects delivered under the two-phase
development strategy. Built Environment Project and Asset Management,
1(1):14-31.
Athanassakos, G. 2007. Valuing Internet ventures. Journal of Business
Valuation and Economic Loss Analysis, 2(1), Article 2:1-15.
Bartov, E., Mohanram, P. & Seethamraju, C. 2002. Valuation of Internet stocks
– An IPO perspective. Journal of Accounting Research, 40(2):321-346.
Beer, D. 2008. Social network(ing) sites ... revisiting the story so far: A response
to danah boyd & Nicole Ellison. Journal of Computer-Mediated
Communication, 13:516-529.
Bellis, M. 2011. Who invested Google? [Online]. Available:
http://inventors.about.com/od/gstartinventions/a/google.htm?p=1
(Accessed 22 June 2011).
Berk, J. & DeMarzo, P. 2011. Corporate finance. Global edition. Boston,
Massachusetts: Pearson.
Berthon, B. 2010. Responding to the crisis: Redefining corporate value.
Corporate governance, 10(4):354-359.
REFERENCES
365
Bhuiyan, T., Jøsang, A. & Xu, Y. 2010. Trust and reputation management in
Web-based social networks. Web Intelligence Agents, 207-232.
Bodie, Z., Kane, A. & Marcus, A.J. 2008. Essentials of investments. 7th edition.
New York, New York: McGraw-Hill.
Borges, M., Hoppen, N. & Luce, F.B. 2008. Information technology impact on
market orientation in e-business. Journal of Business Research,
September, 62(9):883-890.
Bosch, J., Tait, M. & Venter, E. (Eds) 2006. Business management: An
entrepreneurial perspective. Port Elizabeth, South Africa: Lectern.
Bosch, J., Tait, M. & Venter, E. (Eds) 2011. Business management: An
entrepreneurial perspective. 2nd edition. Port Elizabeth, South Africa:
Lectern.
Botha, J., Bothma, C. & Geldenhuys, P. 2008. Managing e-commerce in
business. 2nd edition. Cape Town, South Africa: Juta.
Boyd, D.M. & Ellison, N.B. 2008. Social network sites: Definition, history, and
scholarship. Journal of Computer-Mediated Communication, 13:210-230.
Bicknell, D. 2000. E-business spend hits Toys R Us. ComputerWeekly.com,
17 August. [Online]. Available: http://www.computerweekly.com/news/
2240040787/E-business-spend-hits-Toys-R-Us (Accessed 14 May 2012).
Brigham, E.F. & Daves, P.R. 2010. Intermediate financial management. 10th
edition. Mason, Ohio: South-Western, Cengage Learning.
Brummer, L. 2010. Calculating the ratios. [Online]. Available:
http://www.fin24.com/Special-Reports/Top-200/Measuring-Performance/
Calculating-the-ratios-20100601-2 (Accessed 2 May 2012).
REFERENCES
366
Bryman, A. & Bell, E. 2007. Business research methods. 2nd edition. Oxford,
England: Oxford.
Chandra, D.K., Ravi, V. & Bose, I. 2008. Failure prediction of dotcom
companies using hybrid intelligent techniques. Expert systems with
applications, Part 1, April, 36, 3(1):4 830-4 837.
Chang, J-R., Hung, M-W. & Tsai, F-S. 2005. Valuation of intellectual property: A
real option approach. Journal of Intellectual Capital, 6(3):339-356.
Clemons, E.K. 2009. The complex problem of monetizing virtual electronic
social networks. Decision Support systems, 48:46-56.
Collis, J. & Hussey, R. 2003. Business research: A practical guide for
undergraduate and postgraduate students. 2nd edition. Basingstoke,
Hampshire, England: Palgrave Macmillan.
Combe, C. 2006. Introduction to e-business: Management and strategy. Oxford,
England: Butterworth-Heinemann.
Company History 1915 – 2011. (n.a.). 2012. [Online]. Available:
http://www.naspers.co.za/company-history_1915-2009.php (Accessed 1
July 2012).
Cooper, D.R. & Schindler, P.S. 2008. Business research methods. 10th edition.
London, England: McGraw-Hill.
Cram, C.M. 2001. E-commerce concepts: Illustrated introductory. Boston:
Thompson Learning.
Creating a new generation. (n.a.). 2012. [Online]. Available:
http://www.picknpay.co.za/picknpay/content/en/search-results?oid=1285
2&sn=Detail&pid=699 (Accessed 7 May 2012).
REFERENCES
367
Creswell, J.W. 2009. Research design: Qualitative, quantitative, and mixed
method approaches. 3rd edition. Thousand Oaks, California: SAGE.
Cuthbertson, K. & Notzsche, D. 2008. Investments. 2nd edition. Chichester,
West Sussex, England: Wiley.
Damodaran, A. 2000. The dark side of valuation: Firms with no earnings, no
history and no comparables. Can Amazon.com be valued? [Online].
Available: http://pages.stern.nyu.edu/~adamodar/pdfiles/papers/High
Grow.pdf (Accessed 29 November 2010).
Damodaran, A. 2006. Dealing with intangibles: Valuing brand names, flexibility
and patents. [Online]. Available: http://www.drbaranes.com/Corporate
ValuationArticles/4ValuingBrandNamesFlexibility.pdf (Accessed 29
November 2010).
Dastgir, M., Khodadadi, V. & Ghayed, M. 2010. Cash flow valuation using
capital cash flow method comparing it with free cash flow method and
adjusted present value method in companies listed on Tehran Stock
Exchange. Business Intelligence Journal, July, 2(2):45-58.
Day, G.S. & Bens, K.J. 2005. Capitalizing on the internet opportunity. Journal of
Business & Industrial Marketing, 20(4):160-168.
De Vos, A.S., Strydom, H., Fouché, C.B. & Delport, C.S.L. 2005. Research at
grass roots: For the social sciences and human service professions. 3rd
edition. Pretoria, South Africa: Van Schaik.
Demers, E. & Lev, B. 2001. A rude awakening: Internet shakeout in 2000.
Review of Accounting Studies, 6:331-359.
Dennis, C., Harris, L. & Sandhu, B. 2002. From bricks to clicks: Understanding
the e-consumer. Qualitative Market Research: An International Journal,
5(4):281-290.
REFERENCES
368
Dhillon, G., Coss, D. & Hackney, R. 2001. Interpreting the role of disruptive
technologies in e-business. Logistics Information Management,
14(1/2):163-170.
Doong, H-S., Wang, H-C. & Foxall, G.R. 2010. An investigation of consumers‟
webstore shopping: A view of click-and-mortar company. International
Journal of Information Management, 23 July.
Ellison, N.B., Lampe, C. & Steinfield, C. 2009. Social network sites and society:
Current and future possibilities. Interactions, January-February, 6-9.
Els, G. (Eds) 2010. Corporate Finance: A South African perspective. Cape
Town, South Africa: Oxford.
„Enthusiasm for Google‟ drains away as doubts set in. (n.a.). 2006. The
Economist, 16 February. [Online]. Available: http://www.economist.com
/node/5530712/ print (Accessed 12 July 2011).
E-tailers need to engage consumers. (n.a.). 2012. Bizcommunity, 16 May.
[Online]. Available: http://bizcommunity.com/Print.aspx?1=196&c=394&ct
=1&ci=75262 (Accessed 17 May 2012).
Fain, D.C. & Pedersen, J.O. 2006. Sponsored search: A brief history. Bulletin of
the American Society for Information Science and Technology,
December/January, 12-13.
Farooq, S.U., Ullah, S., Alam, W. & Shah, A.A. 2010. The performance of equity
valuation models for high and low intangible companies – A case of
United States. European Journal of Economics, Finance and
Administrative Sciences, 21:141-160.
Farzad, R., Elgin, B. & Yang, C. 2005. Googling for gold. Bloomberg
BusinessWeek, 5 December. [Online]. Available: http://www.business
week.com/magazine/content/0549/b3962001.htm?chan=gl (Accessed 12
REFERENCES
369
July 2011).
Fernández, P. 2007a. Company valuation methods. The most common errors in
valuations. Working paper no 449. IESE Business School, University of
Navarra:1-30.
Fernández, P. 2007b. Valuing companies by cash flow discounting: Ten
methods and nine theories. Managerial Finance, 33(11):853-876.
Firer, C., Ross, S.A., Westerfield, R.W. & Jordan, B.D. 2012. Fundamentals of
corporate finance. 5th South African edition. London, England: McGraw-
Hill.
Forbes, W. 2006. The boys in the bubble: Internet entrepreneurs and stock
market value. Omega 34, 439-447.
French, N. 2004. The valuation of specialised property: A review of valuation
methods. Journal of Property Investment & Finance, 22(6):533-541.
Fuller, J. & Jensen, M.C. 2010. Just say no to Wall Street: Putting a stop to the
earnings game. Journal of Applied Corporate Finance, 22(1):59-63.
Garay, U. & González, M. 2010. Internet-based corporate disclosure and
market value: Evidence from Latin American. [Online]. Available:
http://docs.google.com/viewer?a=v&q=cache:D6yHWi1CAzsJ:administra
cion.uniandes.edu.co/content/download/13220/131160/version/1/file/GAL
ERAS%2B28%2Bpara%2Bweb.pdf+Internet-based+corporate+disclosur
e+and+market+value,+Gara-y&hl=en&gl=za&pid=bl&srcid=ADGEESh9X
hBl9tStIqEdfZkorNMrmPyep9sNWHGO0L1indu8-bLX3LdHPiImirvDmfW
olYkCNMIRV-AneKMBDY5EytaUy23FwfxyxKMoVqPCppRf-Tp1qJAeeZ3
esz5cPARKiaOe-&sig=AHIEtbSKNvmih35D0Iw2HKySQ470qMcscg
(Accessed 25 January 2011).
Geron, T. 2011a. IPO Watch: Drafting off LinkedIn, Yandex looks to price $1.1B
REFERENCES
370
IPO Monday. [Online]. Available: http://blogs.forbes.com/tomiogeron
/2011/05/20/ipo-watch-drafting-off-linkedin-yandex-looks-to-price-1-1-ip1-
monday/ (Accessed 22 May 2011).
Geron, T. 2011b. „Facebook of China‟ Renren‟s IPO prices Wednesday after
delay. [Online]. Available: http://blogs.forbes.com/tomiogeron/2011/05 /04
/facebook-of-china-renrens-ipo-pricing-delayed-unit-wednesday-reuters/
(Accessed 22 May 2011).
Gillette, F. 2011. The rise and inglorious fall of MySpace. Bloomberg
BusinessWeek, 22 June. [Online]. Available: http://www.businessWeek.
com/print/magazine/content/1127/b4235053917570.htm (Accessed 12
July 2011).
Gitman, L.J., Beaumont Smith, M., Hall, J., Lowies, B., Marx, J., Strydom, B. &
Van der Merwe, A. 2010. Principles of managerial finance: Global and
Southern African perspective. Cape Town, South Africa: Pearson
Prentice Hall.
Gitman, L.J. & Zutter, C.J. 2012. Principles of managerial finance. 13th edition.
Essex, England: Pearson.
Gneiser, M., Heidemann, J., Klier, M., Landherr, A. & Probst, F. 2010. Valuation
of online social networks taking into account users‟ interconnectedness.
Information Systems and e-Business Management, 8(4):1-24.
Gneiser, M., Heidemann, J., Klier, M. & Weib, C. 2009. Valuation of online
social networks – An economic model and its application using the case
of Xing.com. ECIS 2009 Proceedings, Paper 89.
Gordon, M.J. 1959. Dividends, earnings, and stock prices. The Review of
Economics and Statistics, May, 41(1):99-105.
Google history. (n.a.). 2011. [Online]. Available: http://www.google.com/about
REFERENCES
371
/corporate/company/history.html (Accessed 22 June 2011).
Google, Inc. (n.a.). 2003. [Online]. Available: http://www.fundinguniverse.com
/company-histories/Google-Inc-Company-History.html (Accessed 28 June
2011).
Goyal, S. 2012. Social networks on the Web. [Online]. Available:
http://www.econ.cam.ac.uk/faculty/goyal/wp11/socialnetworksweb8.pdf
(Accessed 12 July 2011).
Grajkowska, A. 2011. Valuing intellectual capital of innovative start-ups. Journal
of Intellectual Capital, 12(2):179-201.
Gray, D.E. 2009. Doing research in the real world. 2nd edition. Los Angeles,
California: SAGE.
Hafeez, K., Keoy, K.J. & Hanneman, R. 2006. E-business capabilities model:
Validation and comparison between adopted and non-adopted of e-
business companies in UK. Journal of Manufacturing Technology
Management, 17(6):806-828.
Hall, K. 2010a. Google buys Like.com. ComputerWeekly.com, 23 August, 22.
[Online]. Available: http://www.computerweekly.com/Articles/2010/08/23/
242476/Google-buys-Like.com.htm (Accessed 18 July 2011).
Hall, K. 2010b. More small businesses set to become online millionaires.
Computer Weekly, 9 July, 22-23. [Online]. Available:
http://web.ebscohost.com/ehost/detail?vid=4&hid=17&sid=e8df2987-109
c-49adaf68df972ea6434a%40sessi onmgr12&bdata=JnNpdGU9ZWhvc3
QtbGl2ZQ%3d%3d#db=bth&AN=54313627 (Accessed 18 July 2011).
Hall, K. 2011a. PwC: Valuing social media companies. ComputerWeekly.com,
24 May. [Online]. Available: http://www.computerweekly.com/Articles/
2011/05/24/246762/PwC-Valuing-social-media-companies.htm
REFERENCES
372
(Accessed 18 July 2011).
Hall, K. 2011b. News Corp offloads MySpace to Justin Timberlake-backed
company Specific Media. ComputerWeekly.com, 30 June. [Online].
Available: http://www.computerweekly.com/Articles/2011/06/30/247145/
News-Corp-offloads-Myspace-to-Justin-Timerlake-backed-company-spe
cific-Media.htm (Accessed 18 July 2011).
Hall, K. 2011c. LinkedIn could beat Facebook to an IPO. ComputerWeekly.com,
7 January. [Online]. Available: http://www.computerweekly.com/Articles/
2011/01/07/244786/LinkedIn-could-beat-Facebook-to-an-IPO.htm
(Accessed 18 July 2011).
Hall, K. 2011d. LinkedIn‟s $10bn stock valuation raises fears of second
technology bubble. ComputerWeekly.com, 20 May January. [Online].
Available: http://www.computerweekly.com/Articles/2011/05/20/246735/
LinkedIns-10bn-stock-valuation-raises-fears-of-second-technology-bubb
le.htm (Accessed 18 July 2011).
Hall, K. 2011e. Facebook expands mobile user reach with Snaptu acquisition.
ComputerWeekly.com, 21 March. [Online]. Available: http://www.compu
terweekly.com/Articles/2011/03/21/245988/Facebook-expands-mobile-
user-reach-with-Snaptu-acquisition.htm.htm (Accessed 18 July 2011).
Hall, K. 2011f. Google throws down challenge to Facebook with trials for social
media site Google+. ComputerWeekly.com, 29 June. [Online]. Available:
http://www.computerweekly.com/Articles/2011/06/29/247130/Goolge-thro
ws-down-challenge-to-Facebook-with-trials-for-social-media-site.htm
(Accessed 18 July 2011).
Hall, K. 2011g. Facebook IPO rumoured to value company at $100bn.
ComputerWeekly.com, 14 June. [Online]. Available: http://www.computer
weekly.com/Articles/2011/06/14/246961/Facebook-IPO-rumoured-to-valu
e-company-at-100bn.htm (Accessed 4 July 2011).
REFERENCES
373
Hall, K. 2011h. Social media IPOs: Eight investment issues of social network
companies. ComputerWeekly.com, 12 January. [Online]. Available:
http://www.computerweekly.com/Articles/2011/01/12/244846/Social-med
ia-IPOs-Eight-investment-issues-of-social-network.htm (Accessed 18 July
2011).
Helft, M. 2011. Twins suing Facebook for a better deal. Deccan Herald.
[Online]. Available: http://www.deccanherald.com/content/130306/twins-
%3Cb%3Esuing%3C/b%3E-facebook-better-deal.htm (Accessed 18 June
2011).
Hempel, J. 2009. How Facebook is taking over our lives. CNNMoney.com, 17
February, 1-7. [Online]. Available: http://cnnmoney.printthis.clickability.
com/ (Accessed 3 October 2009).
Herath, H.S.B. & Bremser, W.G. 2005. Real-option valuation of research and
development investments: Implications for performance measurement.
Managerial Auditing Journal, 20(1):55-72.
Hering, T., Olbrich, M. & Steinrucke, M. 2006. Valuation of start-up internet
companies. International Journal of Technology Management, 33(4):406-
419.
Hillier, D., Ross, S., Westerfield, R., Jaffe, J. & Jordan, B. 2010. Corporate
finance. European edition. London, England: McGraw-Hill.
Hirt, G.A. & Block, S.B. 2008. Fundamentals of investment management. 9th
edition. New York, New York: McGraw-Hill Irwin.
History. (n.d.) Pick n Pay. [Online]. Available: http://www.picknpay.co.za/
picknpay/action/ media/download File?media_fileid=2284 (Accessed 10
April 2012).
REFERENCES
374
History & Timeline. (n.a.). 2011. Amazon.com. [Online]. Available:
http://phx.corporate-ir.net/phoenix.zhtml?c=176060&p=irol-corporate
Timeline (Accessed 17 May 2012).
History of Amazon.com. (n.a.). 2008. [Online]. Available:
http://www.xtimeline.com /timeline/History-of-amazon-com (Accessed on
17 May 2012).
History of search engines. (n.a.). 2011. [Online]. Available:
http://www.google.co.za (Accessed 22 June 2011).
History of social networking websites. (n.a.). 2011. 19 February. [Online].
Available: http://www.ontoseaarch.org/history-of-socia-networking-web
sites.htm (Accessed 22 June 2011).
Ho, C-TB., Liao, C-K. & Kim, H-T. 2011. Valuing Internet companies: A DEA-
based multiple valuation approach. Journal of Operational Research
Society. [Online]. Available: http://www.palgrave-journals.com/jors/jour
nal/vaop/ncurrent/abs/jors2010191 (Accessed 6 July 2011).
Holahan, C. 2006. How Google‟s garden grows. BusinessWeek, 25 October.
[Online]. Available: http://www.businessweek.com/print/technology/con
tent/oct2006/ tc20061024_318265.htm (Accessed 12 July 2011).
Holahan, C., Hof, R. & Ante, S.E. 2007. Facebook: The $10 billion social
network? BusinessWeek, 25 September. [Online]. Available:
http://www.businessweek.com/technology/content/sep2007/tc20070924_
995913.htm (21 June 2011).
Holland, J. 2009. Looking behind the veil – Invisible corporate intangibles,
stories, structure and the contextual information content of disclosure.
Qualitative Research in Financial markets, 1(3):152-187.
REFERENCES
375
Huang, T. & Van Mieghem, J.A. 2009. Are web visitors really saying
something? An empirical study of predicting offline orders and lead times
using online click data. [Online]. Available: http://www26.kellogg.
northwestern.edu/thu625/papers/empirical.pdf (Accessed 25 January
2011).
Ingram, M. 2011. Dear Google: You can‟t threaten people into being social.
Bloomberg BusinessWeek, 10 April. [Online]. Available:
http://www.businessweek.com/print/technology/content/apr2011/tc2011
048_527972.htm2 (Accessed 12 July 2011).
Investopedia. (n.a.). 2011. [Online]. Available: http://www.investopedia.com/
terms/n/neweconomy.asp (Accessed 1 February 2011).
Jackson, S.E. 2008. Net shareholder value. Journal of Business Strategy,
29(6):53-55.
Jansen, B.J. & Mullen, T. 2008. Sponsored search: An overview of the
concepts, history, and technology. International Journal of Electronic
Business, 6(2):114-131.
Jansen, P. & Perotti, E. 2002. Valuation of Internet companies: A survey of the
evidence. Advances in Financial Economics, 7:1-17.
Jelassi, T. & Enders, A. 2005. Strategies for e-business: Creating value through
electronic and mobile commerce. Harlow, England: Financial
Times/Prentice Hall.
Johanson, U., Koga, C., Almqvist, R. & Skoog, M. 2009. Breaking taboos:
Implementing intellectual assets-based management guidelines. Journal
of Intellectual Capital, 10(4):520-538.
Johnson, B. 2011. Was it Goolge that killed MySpace? 8 April. [Online].
Available: http://gigaom.com/2011/04/08/was-it-google-who-killed-my
REFERENCES
376
space/ (Accessed 12 July 2011).
Joinson, A.N. 2008. „Looking at‟, „Looking up‟ or Keeping up with‟ people?
Motives and uses of Facebook. CHI 2008 Proceedings. [Online].
Available: http://dl.acm.org/citation.cfm?id=1357213 (Accessed 22 June
2011).
Jordan, B.D. & Miller, T.W. 2009. Fundamentals of investments: Valuation and
management. 5th edition. London, England: McGraw-Hill.
kalahari.net now available via kalahari.com. (n.a.). 2011. 15 July. [Online].
Available: http://www.it-online.co.za/2011/07/15/kalahari-net-now-avail
able-via-kalahari-com/ (Accessed 19 October 2012).
Kamalabadi, I.N., Bayat, A., Ahmadi, P. & Ebrahimi, A. 2008.
Identifying and prioritization of challenges and barriers of e-commerce
implementation in Iran. World Applied Sciences Journal, 5(5):590-597.
Kamel, S. & Hussein, M. 2001. The development of e-commerce: The emerging
virtual context within Egypt. Logistics Information Management,
14(1/2):119-126.
Katz, R.L. & Zangrilli, P. 2007. Are Internet companies overvalued (again)?
Strategy & Business – Leading ideas, 1-3.
Keating, E.K., Lys, T.Z. & Magee, R.P. 2003. Internet downturn: Finding
valuation factors in Spring 2000. Journal of Accounting and Economics,
34:189-236.
Kemper, A. 2010. Reconsideration of valuation in software markets.
Contributions to Management Science, 2:43-63.
Kennedy, A. & Coughlan, J. 2006. Online shopping portals: An option for
traditional retailers? International Journal of Retail & Distribution
REFERENCES
377
Management, 34(7):516-528.
Kettles, D. & David, J.S. 2008. The business value of social network
technologies: A framework for identification opportunities for business
value and en emerging research program. Proceedings of the
Fourteenth American Conference on Information Systems.
Kim, Y.J., Song, J. & Koo, C. 2008. Exploring the effect of strategic positioning
on firm performance in the e-business context. International Journal of
Information Management, June, 28(3):203-214.
Kinder, T. 2002. Emerging e-commerce business models: An analysis of case
studies from West Lothian, Scotland. European Journal of Innovation
Management, 5(3):130-151.
Klopper, H.B., Berndt, A., Chipp, K., Ismail, Z., Roberts-Lombard, M.,
Subramani, D., Wakeman, M., Petzer, D., Hern, L., Saunders, S. &
Myers-Smith, P. 2006. Marketing: Fresh perspectives. Cape Town, South
Africa: Pearson.
Ko, M. & Roztocki, N. 2009. Investigating the impact of firm strategy – click-and-
brick, brick-and-mortar, and pure-click – on financial performance.
Working paper series, College of Business Knowledge for a New
World:1-27. [Online]. Available: http://business.utsa.edu/wps/files/IS/
0092IS-299-2009.pdf (Accessed 1 February 2011).
Koller, T., Goedhart, M. & Wessels, D. 2005. Valuation: Measuring and
managing the valuation of companies. Hoboken, New Jersey: Wiley.
Kooymans, R. & Abbot, J. 2006. Developing an effective service life asset
management and valuation model. Journal of Corporate Real Estate,
8(4):198-212.
Kotler, P. & Armstrong, G. 2001. Principles of marketing. 9th edition. Upper
REFERENCES
378
Saddle River, New Jersey: Prentice-Hall.
Kotzab, M. & Madlberger, M. 2001. European retailing in e-transition? An
empirical evaluation of web-based retailing – indications from Austria.
International Journal of Physical Distribution & Logistics Management,
31(6):440-462.
Krishnamurthy, S. 2003. E-commerce management: Text and cases. Mason,
Ohio: Thomson/South-Western.
Kurtz, D.L. & Boone, L.E. 2006. Principles of marketing. 12th edition. Mason,
Ohio: Thomson/South-Western.
Lagrost, C., Martin, D., Dubois, C. & Quazzotti, S. 2010. Intellectual property
valuation: How to approach the selection of an appropriate valuation
method. Journal of Intellectual Capital, 11(4):481-503.
Lasher, W.R. 2011. Financial management: A practical approach. 6th edition.
Mason, Ohio: South-Western, Cencage Learning.
Lee, J.K., Kang, H., Lee, H.K. & Lee, H.S. 2002. Evolutionary stages of e-tailers
and retailers: Firm value determinants model. Journal of Global
Information Management, July – September, 10(3):15-35.
Léger, P-M. 2010. Interorganizational IT investments and the value upstream
relational capital. Journal of Intellectual Capital, 11(3):406-428.
Levis, K. 2009. Winners & Losers: Creators and casualties of the age of the
Internet. London, England: Atlantic.
Li, F. 2007. What is e-business? How the Internet transforms organizations.
Malden, Massachusetts: Blackwell Publishing.
Lin, J-S.C., Jang, W-Y. & Chen, K-J. 2007. Assessing the market valuation of e-
REFERENCES
379
service initiatives. International Journal of Service Industry Management,
18(3):224-245.
Lin, L. & Kulatilaka, N. 2007. Strategic options and firm value. Managerial
Finance, 33(11):893-903.
Lind, H. 1998. The definition of market value: Criteria for judging proposed
definitions and an analysis of three controversial components. Journal of
Property Valuation & Investment, 16(2):159-174.
Lumby, S. & Jones, C. 2011. Corporate finance: Theory and practice. 8th
edition. London, England: South-Western, Cencage Learning.
Lundholm, R. 2001. Reconciling value estimates form the discounted cash flow
model and residual income model. Contemporary Accounting Research,
18(2):311-335.
Mahoney, M. & Weisman, J. 2001. The Last Days of eToys. E-Commerce
Times, 3 July. [Online]. Available: http://www.ecommercetimes.com/
story/7978.html (Accessed 14 May 2012).
Marasini, R., Ions, K. & Ahmad, M. 2008. Assessment of e-business adoption in
SMEs: A study of manufacturing industry in the UK North East region.
Journal of Manufacturing Technology, 19(5):627-644.
Marx, J., De Swardt, C. & Nortjé, A. 2003. Financial management in Southern
Africa. Cape Town, South Africa: Prentice Hall.
Mazurencu-Marinescu, M. & Nijkamp, P. 2008. Assessing the value of e-
businesses in emerging markets: Spotlight on Romania. International
Journal of Foresight and Innovation Policy, 4(1/2):71-89.
McCutcheon, G.A. 2008. EVVICATM, a valuation model for intellectual asset-rich
businesses. Measuring Business Excellence, 12(2):79-96.
REFERENCES
380
McGirt, E. 2007. Wunderkind of the Year (Again). Inc, December, 29(12):129.
[Online]. Available: http://www.inc.com/magazine/20071201/wunderkind-
of-the-year-again.html (Accessed 12 July 2011).
McGregor BFA. 2012. [Online]. Available: http://www.mcgregorbfa.com/
(Accessed 15 June 2011).
McGuigan, J.R., Kretlow, W.J. & Moyer, R.C. 2009. Contemporary corporate
finance. 11th edition. Mason, Ohio: South-Western, Cengage Learning.
McKay, J. & Marshall, P. 2004. Strategic management of e-business. Milton,
Queensland: Wiley.
McLeod, D. 2011. Mark Shuttleworth scores big in Fundamo deal. [Online].
Available: http://www.techncentral.co.za/mark-shuttleworth-scores-big-in-
the-fundamo-deal/23707/ (Accessed 28 June 2011).
Metz, C. 2001. E-tailing. PC Magazine, 3 July, 20(13):163.
Miller, J. 2011. LinkedIn‟s debut at $45/share sets stage for other social media
IPOs. 19 May. [Online]. Available: http://www.industryleadersmagazine.
com/linkedin%E2%80%99s-debut-at-45share-sets-stage-for-other-social-
media-ipos/ (Accessed 22 May 2011).
Moorad, Z. 2011. E-tailers in South Africa to see growth in mobile commerce.
Mail & Guardian Online, 20 July. [Online]. Available: http://www.mg.co.za/
article/2011-07-20-etailers-in-sa-to-see-growth-mobile-commerce/
(Accessed 17 May 2012).
Mora-Monge, C.A., Azadegan, A. & Gonzalez, M.E. 2010. Assessing the impact
of web-based electronic commerce use on the organizational benefits of
a firm: An empirical study. Benchmarking: An International Journal,
17(6):773-790.
REFERENCES
381
Myers, M.D. 2009. Qualitative research in business and management. Los
Angeles, California: SAGE.
Nagam, F. & Kautz, K. 2008. The market value impact of IT investment
announcements – An event study. Journal of Information Technology
Theory and Applications, 9(3):61-79.
Naspers Fact Sheet. 2012. March. [Online]. Available: http://www.naspers.com/
cmsAdmin/uploads/fact-sheet_march-2012_001.pdf (Accessed 20 April
2012).
Naspers Annual Report 2004 – 2010. 2004 – 2010. [Online]. Available:
http://www.naspers.com/financials-2012.php (Accessed 20 April 2012).
Naspers Integrated Annual Report 2011. 2011. [Online]. Available:
http://www.naspers.com/financials-2012.php (Accessed 20 April 2012).
Naspers Ltd. 2012. [Online]. Available: http://www.naspers.co.za/index.php
(Accessed 27 June 2012).
Naspers Results Presentation for the financial year ended 31 March 2005.
2005. [Online]. Available: http://www.naspers.com/downloads/
provinsional_results/2005/2005provppt.pdf (Accessed 20 April 2012).
Naspers Results Presentation for the financial year ended 31 March 2006.
2006. [Online]. Available: http://www.naspers.com/downloads/
provinsional_results/2006/results2006provisional.pdf (Accessed 20 April
2012).
Nel, W.S. 2011. The application of the Capital Asset Pricing Model (CAPM): A
South African perspective. African Journal of Business Management,
4 July, 5(13):5 336-5 347.
Nerney, C. 2000. Internet Capital Group: Down but still overvalued. [Online].
REFERENCES
382
Available: http://wwww.internetnews.com/bus-news/print.php/360441
(Accessed 6 June 2009).
Oates, B.J. 2006. Researching information systems and computing. London,
England: SAGE.
O‟Brien, P.C. & Tian, Y. 2008. Financial analysts‟ role in the 1996-2000 Internet
bubble. November. [Online]. Available: http://arts.uwaterloo.ca/~pobrien/
myfiles/Internet%20 draft% 2020050510.pdf (Accessed 22 June 2011).
Olawale, F. & Garwe, D. 2010. Obstacles to the growth of new SMMEs in South
Africa: A principal component analysis approach. African Journal of
Business Management, 4(5):729-738.
Oliva, R., Sterman, J.D. & Giese, M. 2003. Limits to growth in the new
economy: Exploring the „get big fast‟ strategy in e-commerce. System
Dynamics Review, 19(2), Summer, 83-117.
Pallister, J. & Isaacs, A. (Eds) 2003. A Dictionary of Business. Oxford, England:
Oxford.
Papacharissi, Z. 2009. The virtual geographics of social networks: A
comparative analysis of Facebook, LinkedIn and ASmallWorld. New
Media & Society, 11(1&2):199-220.
Papazoglou, M.P. & Ribbers, P.M.A. 2006. E-business: Organizational and
technical foundations. Chichester, West Sussex, England: Wiley.
Parker, R. (n.d). How to value an Internet business. [Online]. Available:
http://diomointernet.com/how-to-value-an-internet-business.html
(Accessed 22 May 2011).
Parkin, G. 2008. Doing business digitally: Eight steps to online success. Cape
Town, South Africa: Zebra Press.
REFERENCES
383
Parr, M. 2010. Successful South Africans – Mark Shuttleworth. Business News,
21 December. [Online]. Available: http://businessnews.za.msn.com/
gallery.aspx?cp-documentid=155620203 (Accessed 28 June 2011).
Pavic, S., Koh, S.C.L., Simpson, M. & Padmore, J. 2007. Could e-business
create a competitive advantage in UK SMEs? Benchmarking: An
International Journal, 14(3):320-351.
Paxson, D.A. & Melmane, A. 2009. Multi-factor competitive internet strategy
evaluation: Search expansions, portal synergies. Journal of Modelling in
Management, 4(3):249-273.
Pennisi, G. & Scandizzo, P.L. 2006. Economic evaluations in an age of
uncertainty. Evaluation, 12(1):77-94.
Pick n Pay – Inspired by You. 2011. [Online]. Available:
http://www.picknpay.co.za/picknpay/content/en/about-us-introduction
(Accessed 24 January 2011).
Pick n Pay Annual Report 2004 – 2010. 2004 – 2010. [Online]. Available:
http://www.picknpay-ir.co.za/annual-reports.php (Accessed 4 May 2012).
Pick n Pay Integrated Annual Report 2011.2011. [Online]. Available:
http://www.picknpay-ir.co.za/annual-reports.php (Accessed 4 May 2012).
Pick n Pay Stores Ltd. 2012. [Online]. Available: http://www.picknpay.co.za/
picknpay/content/en/home (Accessed 27 June 2012).
Pitta, D.A. & Fowler, D. 2005a. Online consumer communities and their value to
new product developers. Journal of Product & Brand Management,
14(5):283-291.
Pitta, D.A. & Fowler, D. 2005b. Internet community forums: An untapped
resource for consumer marketers. Journal of Consumer Marketing,
REFERENCES
384
22(5):265-274.
Plenborg, T. 2002. Firm valuation: Comparing the residual income and
discounting cash flow approaches. Scandinavian Journal of
Management, 18:303-318.
Polatoglu, V.N. 2007. Strategies that work – the case of an e-retailer in an
emerging market. International Journal of Emerging Markets, 2(4):395-
405.
Profile‟s Stock Exchange Handbook October 2008 – January 2009. 2008.
Johannesburg, South Africa: Profile Media.
Profile‟s Stock Exchange Handbook October 2011 – January 2012. 2011.
Johannesburg, South Africa: Profile Media.
Profile‟s Stock Exchange Handbook June 2012 – September 2012. 2012.
Johannesburg, South Africa: Profile Media.
Quarterly Bulletin – March 2004 – 2011. 2004 – 2012. [Online]. Available:
http://www.resbank.co.za/Publications/QuarterlyBulletins/Pages/Quarterly
-Bulletin.aspx (Accessed 20 June 2012).
Quarterly Bulletin – June 2004 – 2011. 2004 - 2012. [Online]. Available:
http://www.resbank.co.za/Publications/QuarterlyBulletins/Pages/Quarterly
-Bulletin.aspx (Accessed 20 June 2012).
Quarterly Bulletin – September 2004 – 2011. 2004 – 2012. [Online]. Available:
http://www.resbank.co.za/Publications/QuarterlyBulletins/Pages/Quarterly
-Bulletin.aspx (Accessed 20 June 2012).
Quarterly Bulletin – December 2004 – 2011. 2004 – 2012. [Online]. Available:
http://www.resbank.co.za/Publications/QuarterlyBulletins/Pages/Quarterly
-Bulletin.aspx (Accessed 20 June 2012).
REFERENCES
385
Quinlan, C. 2011. Business research methods. Hampshire, England: South-
Western, Cengage Learning.
Ramezani, C.A. 2011. Financial constraints, real options and corporate cash
holdings. Managerial Finance, 37(12):1137-1160.
Ramsey, E., Ibbotson, P., Bell, J. & Gray, B. 2003. E-opportunities of service
sector SMEs: An Irish cross-border study. Journal of Small Business and
Enterprise Development, 10(3):250-264.
Rao, L. 2011. Amazon‟s market cap passes $100 billion. TechCrunch. [Online].
Available: http://techcrunch.com/2011/07/27/amazons-market-cap-pas
ses-100-billion/ (Accessed 23 May 2012).
Riihimäki, V. 2009. Analyzing the WiMAX investment costs and NPV
distributions for real option valuation. info, 11(3):31-44.
Ritter, J. 2007. How Google mispriced itself. Bloomberg BusinessWeek, 16
August. [Online]. Available: http://www.businessweek.com/print/technolo
gy/content/aug2007/tc20070816_425764.htm (Accessed 12 July 2011).
Robinson, J.P. 2000. What is the new economy? The workplace – A fact sheet,
1(4) September:1-3.
Rose, C. 2011. Internet valuations and economic sustainability. Journal of
Business and Economic Research, May, 9(5):49-52.
Rosenbush, S. & Scott, M. 2006. Will Viacom remain a wallflower?
BusinessWeek, 14 August. [Online]. Available: http://www.businessweek.
com/technology/content/aug2006/tc20060811_396993.htm (21 June
2011).
Roubi, S. & Littlejohn, D. 2004. What makes hotel values in the UK? A hedonic
valuation model. International Journal of Contemporary Hospitality
REFERENCES
386
Management, 16(3):175-181.
Rueter, T. 2012. E-retail spending to increase 62% by 2016. Internet Retailer,
27 February. [Online]. Available: http://www.internetretailer.com/2012/02/
27/e-retail-spending-increase-45-2016 (Accessed 17 May 2012).
Rutterford, J. 2010. Gross or net? The role of taxation in the history of equity
valuation. Accounting History, 15(1):41-64.
Rutterford, J., Upton, M. & Kodwani, D. (Eds) 2006. Financial strategy. 2nd
edition. Chichester, West Sussex, England: Wiley.
Ryan, B. 2007. Corporate finance and valuations. London, England: Thomson.
Sadighi, L. 2008. Bebo deal suggests Facebook friends pricey. Red Herring, 13
March, 1.
SAinfo reporter. 2012. Internet economy 2% of SA GDP. [Online]. Available:
http://www.southafrica.info/business/trends/newbusiness/internet-29051
2.htm (Accessed 12 November 2012).
Sander, P. & Kõomägi, M. 2007. Valuation of private companies by Estonian
private equity and venture capitalists. Baltic Journal of Management,
2(1):6-19.
Sandoval, G. 2000. Is Toys “R” Us headed for e-commerce sidelines? CNET
News, 18 August. [Online]. Available: http://news.cnet.com/2100-1017-
244654.html (Accessed 14 May 2012).
Saunders, M., Lewis, P. & Thornhill, A. 2009. Research methods for business
students. 5th edition. Harlow, England: Financial Times/Prentice-Hall.
Savitz, E. 2011. LinkedIn‟s stunning public debut heightens fears of bubble 2.0.
[Online]. Available: http://www.blogs.forbes.com/ericsavitz/2011/05/19/
REFERENCES
387
linkedins-stunning-public-debut-heightends-fears-of-bubble-2.0.htm
(Accessed 22 May 2011).
Savvas, A. 2008. £500m valuation put on professional social networking site
LinkedIn. ComputerWeekly.com, 18 June. [Online]. Available:
http://www.computerweekly.com/Articles/2008/06/19/231106/163500m-
valuation-put-on-professional-social-networking-site.htm (Accessed 18
July 2011).
Schauten, M., Stegink, R. & De Graaff, G. 2010. The discount rate for
discounted cash flow valuations of intangible assets. Managerial Finance,
36(9):799-811.
Schneider, G. 2007. Electronic commerce. 7th annual edition. Boston,
Massachusetts: Course Technology, Cengage Learning.
Schneider, G. 2011. E-business. 9th edition. Boston, Massachusetts: Course
Technology, Cengage Learning.
Schramm-Klein, H., Wagner, G., Steinmann, S. & Morschett, D. 2011. Cross-
channel integration – Is it valued by customers? The International Review
of Retail, Distribution and Consumer Research, 21(5):501-511.
Schwartz, E.S. & Moon, M. 2000. Rational pricing of Internet companies.
Financial Analysts Journal, 56(3):62-75.
Seol, S-S. 2010. Some professional issues on the valuation of technology.
International Journal of Technology Marketing, 5(2):145-162.
Shafer, S.M., Smith, H.J. & Linder, J.C. 2005. The power of business models.
Business Horizons, 48:199-207.
Shepard, S.B. 1997. The new economy: What it really means. Business Week,
17 November. [Online]. Available: http://www.businessweek.com/1997
REFERENCES
388
/46/b3553084.htm (Accessed 2 February 2011).
Shifrin, T. 2006. Google buys YouTube. ComputerWeekly.com, 10 October.
[Online]. Available: http://www.computerweekly.com/Articles/2006/10/10/
219044/Google-buys-YouTube.htm (Accessed 18 July 2011).
Shoprite Holdings Limited. 2012. [Online]. Available:
http://www.shopriteholdings.co.za/ (Accessed 27 June May 2012).
Shoprite Holdings Limited Annual Report 2004 – 2009. 2004 – 2009. [Online].
Available: http://www.shopriteholdings.co.za/pages/1019812640/investor-
relations/financials/Financial-Archives.asp (Accessed 4 May 2012).
Shoprite Holdings Ltd Annual Report 2010. 2010. [Online]. Available:
http://www.shopriteholdings.co.za/pages/1019812640/investor-relations/
financials/Financial-Archives.asp (Accessed 4 May 2012).
Shoprite Holdings Ltd Integrated Annual Report 2011. 2011. [Online]. Available:
http://www.shopriteholdings.co.za/pages/1019812640/investor-relations
/financials/Financial-Archives.asp (Accessed 4 May 2012).
Singh, M. & Saiyid, M. 2008. Credit market turmoil makes valuation key.
International Monetary Fund. [Online]. Available: http://www.imf.org/
external/pubs/ft/survey/so/2008/res0115a.htm (Accessed 2 February
2011).
Skinner, C. 2010. Innovation in the internet age. Business Strategy Series,
11(6):407-411.
„Small business‟ development in South Africa. (n.a.). sbp. 2009. August.
[Online]. Available: http://www.sbp.org.za/uploads/media/SBP_ALERT_
smme_development_in_SA.pdf (Accessed 27 January 2011).
Smith, J. 2009. A guide to commercial property in South Africa. Rosebank,
REFERENCES
389
South Africa: Smith.
Spratt, J. 2007. Analysis of why high growth Internet companies in South Africa
trade at a premium over “traditional” companies upon buyout or listing.
Unpublished MBA research project. Gordon Institute of Business
Science, University of Pretoria.
Spaulding, T.J. 2009. How can virtual communities create value for business?
Electronic Commerce Research and Applications, January-February,
9(1):38-49.
Steiger, F. 2008. The validity of company valuation using discounted cash flow
methods. Seminar paper, Fall. [Online]. Available: http://ideas.repec.org
/p/arx/papers/1003.4881.html (Accessed 25 January 2011).
Stone, A. 2000. Crawling from the Dot.com wreckage. Business Week, 19
December. [Online]. Available: http://www.businessweek.com/print/
bwdaily/dnflash/dec2000/nf20001219_800.htm (Accessed 6 November
2009).
Strauss, J. & Frost, R. 2009. E-marketing. 5th edition. Upper Saddle River, New
Jersey: Pearson.
Stubeji, I. 2010. Valuation of Slovene publicly traded companies with a valuation
model based on expected earnings and growth opportunities. Managing
Global Transitions, 8(1):23-47.
Sudarsanam, S., Sorwar, G. & Marr, B. 2006. Real options and the impact of
intellectual capital on corporate value. Journal of Intellectual Capital,
7(3):291-308.
Swatman, P.M.C., Krueger, C. & Van der Beek, K. 2006. The changing digital
content landscape: An evaluation of e-business model development in
European online news and music. Internet Research, 16(1):53-80.
REFERENCES
390
Taulli, T. 2009. Three steps to a sound business model. Small Business
Financings, 27 February. [Online]. Available: http:www.businessweek.
com/ print/smalbiz/content/feb2009/sb20090226_798877.htm (Accessed
23 April 2012).
Taylor, M. & Murphy, A. 2004. SMEs and e-business. Journal of Small Business
and Enterprise Development, 11(3):280-289.
Teece, D.J. 2010. Business models, business strategy and innovation. Long
Range Planning, 43:172-194.
The history of search engines – An infographic. 2010. [Online]. Available:
http://www.wordstream.com/articles/internet-search-engines-history
(Accessed 22 June 2011).
The SPAR Group Ltd. 2012. [Online]. Available: http://www.spar.co.za/
HomePage1.aspx (Accessed 27 June 2012).
The SPAR Group Limited Annual Report 2004. 2004. [Online]. Available:
http://ipaper.ipapercms.dk/AfricanShareHolder/za/SPP/2004/ (Accessed
7 May 2012).
The SPAR Group Limited Annual Report 2005. 2005. [Online]. Available:
http://www.sharedata.co.za/Data/002201/pdfs/SPAR_ar_05.pdf
(Accessed 7 May 2012).
The SPAR Group Limited Annual Reports 2006. 2006. [Online]. Available:
http://www.spar.co.za/InvestorRelations56.aspx (Accessed 7 May 2012).
The SPAR Group Limited 2007 – 2010 Annual Report. 2007 – 2010. [Online].
Available: http://www.spar.co.za/InvestorRelations56.aspx (Accessed 7
May 2012).
REFERENCES
391
The SPAR Group Limited 2011 Integrated Annual Report. 2011. [Online].
Available: http://www.spar.co.za/InvestorRelations56.aspx (Accessed 7
May 2012).
Trust fuels online shopping growth. 2012. Bizcommunity, 20 April. [Online].
Available: http://bizcommunity.com/Print.aspx?!1=196&c=394&ct=1&ci=
74076 (Accessed 17 May 2012).
Turban, E., King, D. Viehland, D. & Lee, J. 2006. Electronic commerce: A
managerial perspective 2006. Upper Saddle River, New Jersey: Pearson
Prentice Hall.
Uzma, S.H., Singh, J.P. & Kumar, N. 2010. Discounted cash flow and its
implications on intangible valuation. Global Business Review, 11(3):365-
377.
Valkanov, R. 2001. Rational valuation of an Internet company: The case of
Amazon.com. Los Angeles, California: UCLA.
Wadsworth, F., Little, E., Wheat, J. & Swartz, B. 2006. An investigation of
selected dimensions of retail store image: Brick and mortar versus online.
Journal of Business and Economics research, August, 4(8):19-30.
Wall, A. 2010. History of search engines: From 1945 to Google today. [Online].
Available: http://www.searchenginehistory.com (Accessed 22 June 2011).
Watson, R. 2010. Small and medium size enterprises and the knowledge
economy: Assessing the relevance of intangible asset valuation, reporting
and management initiatives. Journal of Financial Regulation and
Compliance, 18(2):131-143.
Webley, K. 2010. Online shopping. Time, 16 July. [Online]. Available:
http://www.time.com/time/printout/0,8816,2004089,00.html (22 May
2012).
REFERENCES
392
Weill, P., Malone, T.W., D‟Urso, V., Herman, G. & Woerner, S. 2004. Do some
business models perform better than others? A study of the 1 000 largest
US firms, Working paper no 226. Sloan School of Management,
Massachusetts Institute of Technology.
Welman, C., Kruger, F. & Mitchell, B. 2010. Research methodology. 3rd edition.
Cape Town, South Africa: Oxford.
Williams, B. 2009a. Growth of information technology. [Online]. Available:
http://EzineArticles.com/?expert=Brenda_Williams (Accessed 6
November 2010).
Williams, D.E. 2009b. The evolution of e-tailing. The International Review of
Retail, Distribution and Consumer Research, 19(3):219-249.
Williams, J. 2010. Facebook valued at £22bn as investors anticipate IPO.
ComputerWeekly.com, 25 August. [Online]. Available: http://www.com
puterweekly.com/Articles/2010/08/25/242515/Facebook-valued-at-16322
bn-as-investors-anticipate.htm (Accessed 18 July 2011).
Williams, J. 2011. Facebook IPO expected early 2012. ComputerWeekly.com, 7
January. [Online]. Available: http://www.computerweekly.com/Articles/
2011/01/07/244785/Facebook-IPO-expected-early-2012.htm (Accessed
18 July 2011).
Willmott, H. 2010. Creating „value‟ beyond the point of production: Branding,
financialization and market capitalization. Organization, 15(5):517-542.
Wilson, D. 2011. Amazon.com mirrors Apple‟s market-value surge: Chart of the
day. Bloomberg, 28 July. [Online]. Available: http://www.bloomberg.com
/news/print/2011-07-28/amazon-com-mirrors-apple-s-market-value-surge
-chart-of-the-day.html (Accessed 23 May 2012).
Wirtz, B.W., Schilke, O. & Ulrich, S. 2010. Strategic developments of business
REFERENCES
393
models. Long Range Planning, April – June, 43(2-3):272-290.
Wyler, R. & Moon, M. 2000. AIMR‟S Financial Analyst Journal publishes model
for rational pricing of Internet companies. Press release, 10 July. [Online].
Available: http://www.cfainstitute.org/aboutus/press/release/00releases
/00inetco.html (Accessed 6 November 2010).
Yan, R. 2008. Pricing strategy for companies with mixed online and traditional
retailing distribution markets. Journal of Product & Brand Management,
17(1):48-56.
Yao, J.T. 2004. E-commerce adoption of insurance companies in New Zealand.
Journal of Electronic Commerce Research, 5(1):54-61.
Zarzecki, D. 2011. Valuing Internet companies: Selected issues. Folia
Oeconomica Stetinensia, 106-120.
Zhu, K. & Kraemer, K.L. 2005. Post-adoption variations in usage and value of e-
business by organizations: Cross-country evidence from the retail
industry. Information Systems Research, March, 16(1):61-84.
Zikmund, W.G. 2003. Business research methods. 7th edition. Mason, Ohio:
Thomson/South-Western.
Zikmund, W.G., Babin, B.J., Carr, J.C. & Griffen, M. 2010. Business research
methods. 8th edition. Mason, Ohio: South-Western, Cencage Learning.

ANNEXURE A
394
ANNEXURE A
OPERATING CASH FLOWS FOR SHOPRITE HOLDINGS LIMITED
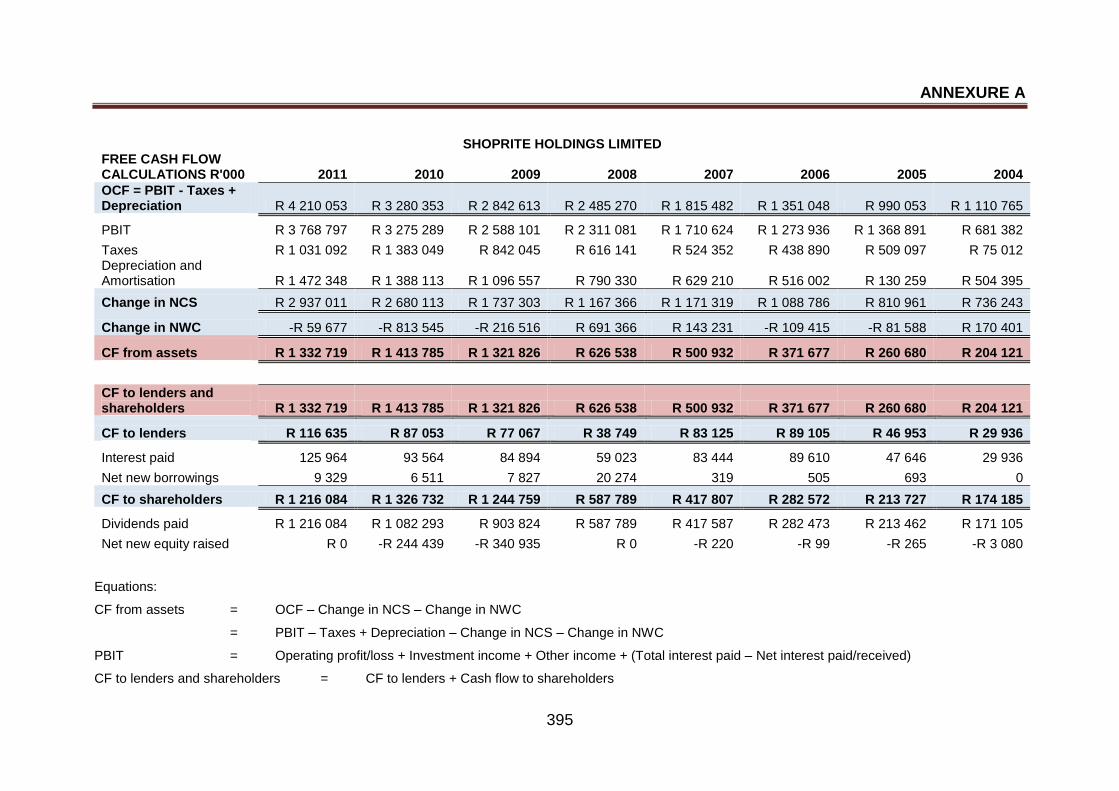
ANNEXURE A
395
SHOPRITE HOLDINGS LIMITED FREE CASH FLOW CALCULATIONS R'000 2011 2010 2009 2008 2007 2006 2005 2004
OCF = PBIT - Taxes + Depreciation R 4 210 053 R 3 280 353 R 2 842 613 R 2 485 270 R 1 815 482 R 1 351 048 R 990 053 R 1 110 765
PBIT R 3 768 797 R 3 275 289 R 2 588 101 R 2 311 081 R 1 710 624 R 1 273 936 R 1 368 891 R 681 382
Taxes R 1 031 092 R 1 383 049 R 842 045 R 616 141 R 524 352 R 438 890 R 509 097 R 75 012 Depreciation and Amortisation R 1 472 348 R 1 388 113 R 1 096 557 R 790 330 R 629 210 R 516 002 R 130 259 R 504 395
Change in NCS R 2 937 011 R 2 680 113 R 1 737 303 R 1 167 366 R 1 171 319 R 1 088 786 R 810 961 R 736 243
Change in NWC -R 59 677 -R 813 545 -R 216 516 R 691 366 R 143 231 -R 109 415 -R 81 588 R 170 401
CF from assets R 1 332 719 R 1 413 785 R 1 321 826 R 626 538 R 500 932 R 371 677 R 260 680 R 204 121
CF to lenders and shareholders R 1 332 719 R 1 413 785 R 1 321 826 R 626 538 R 500 932 R 371 677 R 260 680 R 204 121
CF to lenders R 116 635 R 87 053 R 77 067 R 38 749 R 83 125 R 89 105 R 46 953 R 29 936
Interest paid 125 964 93 564 84 894 59 023 83 444 89 610 47 646 29 936
Net new borrowings 9 329 6 511 7 827 20 274 319 505 693 0
CF to shareholders R 1 216 084 R 1 326 732 R 1 244 759 R 587 789 R 417 807 R 282 572 R 213 727 R 174 185
Dividends paid R 1 216 084 R 1 082 293 R 903 824 R 587 789 R 417 587 R 282 473 R 213 462 R 171 105
Net new equity raised R 0 -R 244 439 -R 340 935 R 0 -R 220 -R 99 -R 265 -R 3 080
Equations:
CF from assets = OCF – Change in NCS – Change in NWC
= PBIT – Taxes + Depreciation – Change in NCS – Change in NWC
PBIT = Operating profit/loss + Investment income + Other income + (Total interest paid – Net interest paid/received)
CF to lenders and shareholders = CF to lenders + Cash flow to shareholders

ANNEXURE B
396
ANNEXURE B
OPERATING CASH FLOWS FOR THE SPAR GROUP LTD
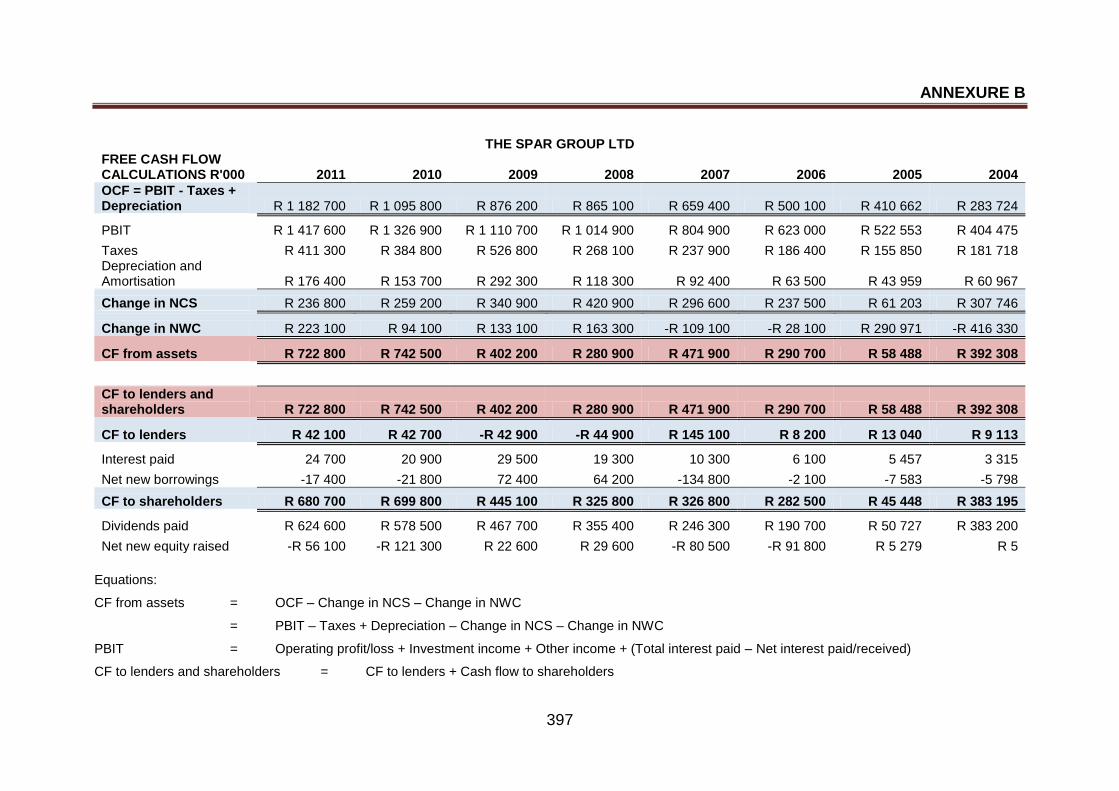
ANNEXURE B
397
THE SPAR GROUP LTD FREE CASH FLOW CALCULATIONS R'000 2011 2010 2009 2008 2007 2006 2005 2004
OCF = PBIT - Taxes + Depreciation R 1 182 700 R 1 095 800 R 876 200 R 865 100 R 659 400 R 500 100 R 410 662 R 283 724
PBIT R 1 417 600 R 1 326 900 R 1 110 700 R 1 014 900 R 804 900 R 623 000 R 522 553 R 404 475
Taxes R 411 300 R 384 800 R 526 800 R 268 100 R 237 900 R 186 400 R 155 850 R 181 718 Depreciation and Amortisation R 176 400 R 153 700 R 292 300 R 118 300 R 92 400 R 63 500 R 43 959 R 60 967
Change in NCS R 236 800 R 259 200 R 340 900 R 420 900 R 296 600 R 237 500 R 61 203 R 307 746
Change in NWC R 223 100 R 94 100 R 133 100 R 163 300 -R 109 100 -R 28 100 R 290 971 -R 416 330
CF from assets R 722 800 R 742 500 R 402 200 R 280 900 R 471 900 R 290 700 R 58 488 R 392 308
CF to lenders and shareholders R 722 800 R 742 500 R 402 200 R 280 900 R 471 900 R 290 700 R 58 488 R 392 308
CF to lenders R 42 100 R 42 700 -R 42 900 -R 44 900 R 145 100 R 8 200 R 13 040 R 9 113
Interest paid 24 700 20 900 29 500 19 300 10 300 6 100 5 457 3 315
Net new borrowings -17 400 -21 800 72 400 64 200 -134 800 -2 100 -7 583 -5 798
CF to shareholders R 680 700 R 699 800 R 445 100 R 325 800 R 326 800 R 282 500 R 45 448 R 383 195
Dividends paid R 624 600 R 578 500 R 467 700 R 355 400 R 246 300 R 190 700 R 50 727 R 383 200
Net new equity raised -R 56 100 -R 121 300 R 22 600 R 29 600 -R 80 500 -R 91 800 R 5 279 R 5
Equations:
CF from assets = OCF – Change in NCS – Change in NWC
= PBIT – Taxes + Depreciation – Change in NCS – Change in NWC
PBIT = Operating profit/loss + Investment income + Other income + (Total interest paid – Net interest paid/received)
CF to lenders and shareholders = CF to lenders + Cash flow to shareholders

ANNEXURE C
398
ANNEXURE C
OPERATING CASH FLOWS FOR PICK N PICK STORES LTD
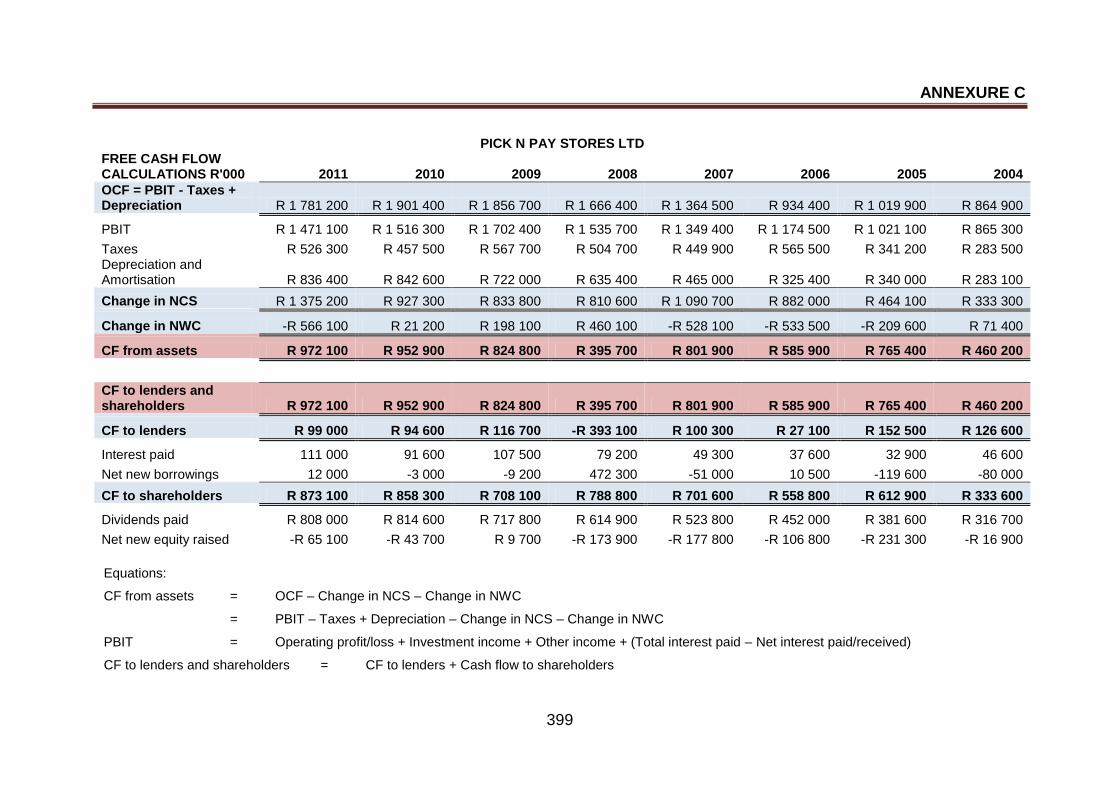
ANNEXURE C
399
PICK N PAY STORES LTD FREE CASH FLOW CALCULATIONS R'000 2011 2010 2009 2008 2007 2006 2005 2004
OCF = PBIT - Taxes + Depreciation R 1 781 200 R 1 901 400 R 1 856 700 R 1 666 400 R 1 364 500 R 934 400 R 1 019 900 R 864 900
PBIT R 1 471 100 R 1 516 300 R 1 702 400 R 1 535 700 R 1 349 400 R 1 174 500 R 1 021 100 R 865 300
Taxes R 526 300 R 457 500 R 567 700 R 504 700 R 449 900 R 565 500 R 341 200 R 283 500 Depreciation and Amortisation R 836 400 R 842 600 R 722 000 R 635 400 R 465 000 R 325 400 R 340 000 R 283 100
Change in NCS R 1 375 200 R 927 300 R 833 800 R 810 600 R 1 090 700 R 882 000 R 464 100 R 333 300
Change in NWC -R 566 100 R 21 200 R 198 100 R 460 100 -R 528 100 -R 533 500 -R 209 600 R 71 400
CF from assets R 972 100 R 952 900 R 824 800 R 395 700 R 801 900 R 585 900 R 765 400 R 460 200
CF to lenders and shareholders R 972 100 R 952 900 R 824 800 R 395 700 R 801 900 R 585 900 R 765 400 R 460 200
CF to lenders R 99 000 R 94 600 R 116 700 -R 393 100 R 100 300 R 27 100 R 152 500 R 126 600
Interest paid 111 000 91 600 107 500 79 200 49 300 37 600 32 900 46 600
Net new borrowings 12 000 -3 000 -9 200 472 300 -51 000 10 500 -119 600 -80 000
CF to shareholders R 873 100 R 858 300 R 708 100 R 788 800 R 701 600 R 558 800 R 612 900 R 333 600
Dividends paid R 808 000 R 814 600 R 717 800 R 614 900 R 523 800 R 452 000 R 381 600 R 316 700
Net new equity raised -R 65 100 -R 43 700 R 9 700 -R 173 900 -R 177 800 -R 106 800 -R 231 300 -R 16 900
Equations:
CF from assets = OCF – Change in NCS – Change in NWC
= PBIT – Taxes + Depreciation – Change in NCS – Change in NWC
PBIT = Operating profit/loss + Investment income + Other income + (Total interest paid – Net interest paid/received)
CF to lenders and shareholders = CF to lenders + Cash flow to shareholders

ANNEXURE D
400
ANNEXURE D
OPERATING CASH FLOWS FOR NASPERS LTD
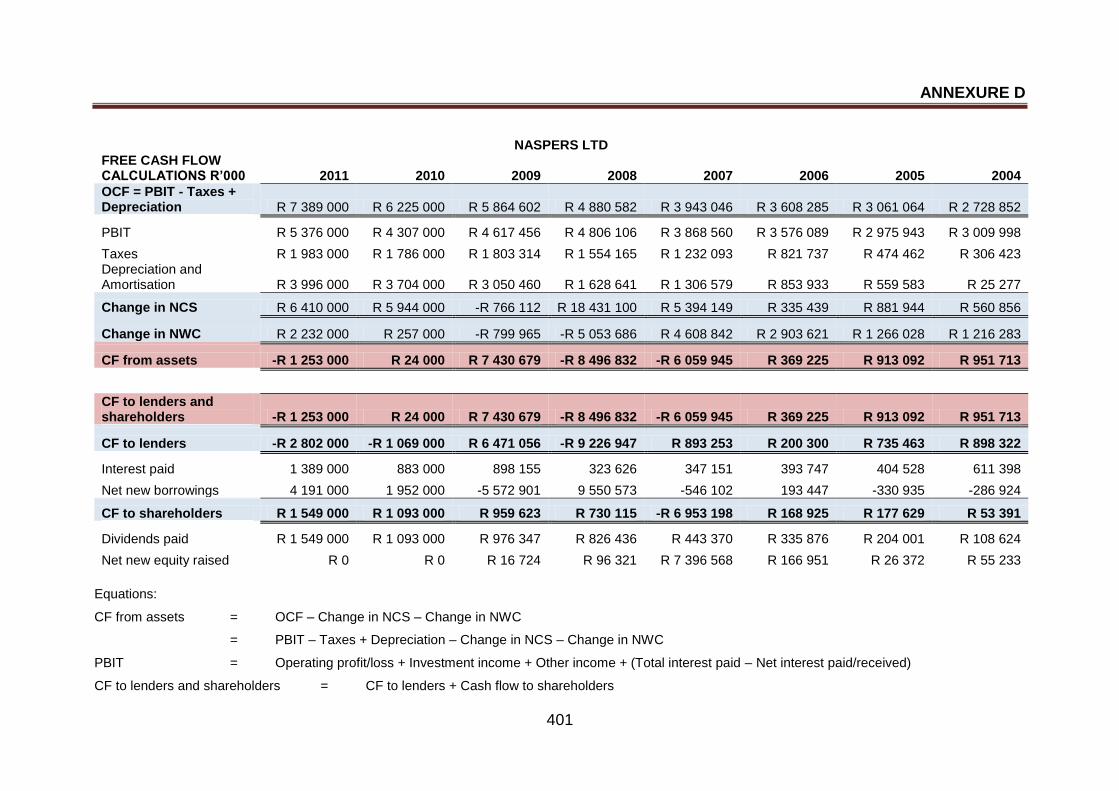
ANNEXURE D
401
NASPERS LTD FREE CASH FLOW CALCULATIONS R’000 2011 2010 2009 2008 2007 2006 2005 2004
OCF = PBIT - Taxes + Depreciation R 7 389 000 R 6 225 000 R 5 864 602 R 4 880 582 R 3 943 046 R 3 608 285 R 3 061 064 R 2 728 852
PBIT R 5 376 000 R 4 307 000 R 4 617 456 R 4 806 106 R 3 868 560 R 3 576 089 R 2 975 943 R 3 009 998
Taxes R 1 983 000 R 1 786 000 R 1 803 314 R 1 554 165 R 1 232 093 R 821 737 R 474 462 R 306 423 Depreciation and Amortisation R 3 996 000 R 3 704 000 R 3 050 460 R 1 628 641 R 1 306 579 R 853 933 R 559 583 R 25 277
Change in NCS R 6 410 000 R 5 944 000 -R 766 112 R 18 431 100 R 5 394 149 R 335 439 R 881 944 R 560 856
Change in NWC R 2 232 000 R 257 000 -R 799 965 -R 5 053 686 R 4 608 842 R 2 903 621 R 1 266 028 R 1 216 283
CF from assets -R 1 253 000 R 24 000 R 7 430 679 -R 8 496 832 -R 6 059 945 R 369 225 R 913 092 R 951 713
CF to lenders and shareholders -R 1 253 000 R 24 000 R 7 430 679 -R 8 496 832 -R 6 059 945 R 369 225 R 913 092 R 951 713
CF to lenders -R 2 802 000 -R 1 069 000 R 6 471 056 -R 9 226 947 R 893 253 R 200 300 R 735 463 R 898 322
Interest paid 1 389 000 883 000 898 155 323 626 347 151 393 747 404 528 611 398
Net new borrowings 4 191 000 1 952 000 -5 572 901 9 550 573 -546 102 193 447 -330 935 -286 924
CF to shareholders R 1 549 000 R 1 093 000 R 959 623 R 730 115 -R 6 953 198 R 168 925 R 177 629 R 53 391
Dividends paid R 1 549 000 R 1 093 000 R 976 347 R 826 436 R 443 370 R 335 876 R 204 001 R 108 624
Net new equity raised R 0 R 0 R 16 724 R 96 321 R 7 396 568 R 166 951 R 26 372 R 55 233
Equations:
CF from assets = OCF – Change in NCS – Change in NWC
= PBIT – Taxes + Depreciation – Change in NCS – Change in NWC
PBIT = Operating profit/loss + Investment income + Other income + (Total interest paid – Net interest paid/received)
CF to lenders and shareholders = CF to lenders + Cash flow to shareholders

ANNEXURE E
402
ANNEXURE E
VALUATION USING THE GORDON MODEL
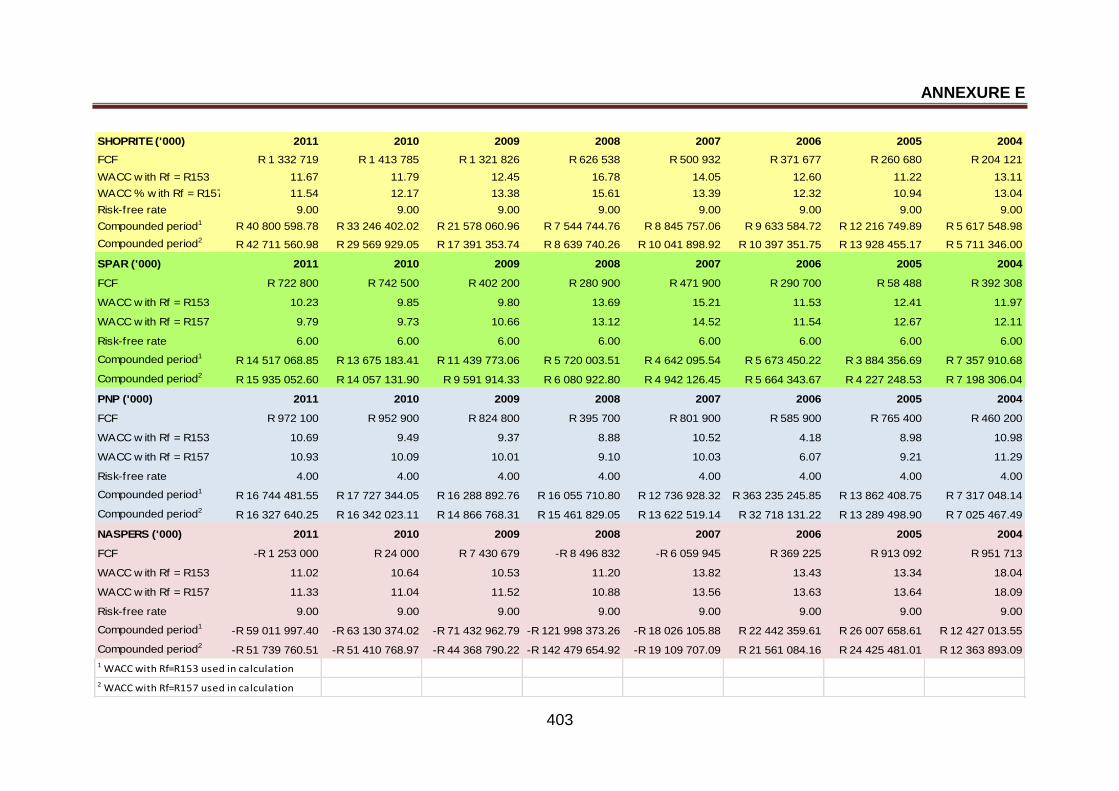
ANNEXURE E
403
SHOPRITE ('000) 2011 2010 2009 2008 2007 2006 2005 2004
FCF R 1 332 719 R 1 413 785 R 1 321 826 R 626 538 R 500 932 R 371 677 R 260 680 R 204 121
WACC w ith Rf = R153 11.67 11.79 12.45 16.78 14.05 12.60 11.22 13.11
WACC % w ith Rf = R157 11.54 12.17 13.38 15.61 13.39 12.32 10.94 13.04
Risk-free rate 9.00 9.00 9.00 9.00 9.00 9.00 9.00 9.00
Compounded period1 R 40 800 598.78 R 33 246 402.02 R 21 578 060.96 R 7 544 744.76 R 8 845 757.06 R 9 633 584.72 R 12 216 749.89 R 5 617 548.98
Compounded period2R 42 711 560.98 R 29 569 929.05 R 17 391 353.74 R 8 639 740.26 R 10 041 898.92 R 10 397 351.75 R 13 928 455.17 R 5 711 346.00
SPAR ('000) 2011 2010 2009 2008 2007 2006 2005 2004
FCF R 722 800 R 742 500 R 402 200 R 280 900 R 471 900 R 290 700 R 58 488 R 392 308
WACC w ith Rf = R153 10.23 9.85 9.80 13.69 15.21 11.53 12.41 11.97
WACC w ith Rf = R157 9.79 9.73 10.66 13.12 14.52 11.54 12.67 12.11
Risk-free rate 6.00 6.00 6.00 6.00 6.00 6.00 6.00 6.00
Compounded period1R 14 517 068.85 R 13 675 183.41 R 11 439 773.06 R 5 720 003.51 R 4 642 095.54 R 5 673 450.22 R 3 884 356.69 R 7 357 910.68
Compounded period2R 15 935 052.60 R 14 057 131.90 R 9 591 914.33 R 6 080 922.80 R 4 942 126.45 R 5 664 343.67 R 4 227 248.53 R 7 198 306.04
PNP ('000) 2011 2010 2009 2008 2007 2006 2005 2004
FCF R 972 100 R 952 900 R 824 800 R 395 700 R 801 900 R 585 900 R 765 400 R 460 200
WACC w ith Rf = R153 10.69 9.49 9.37 8.88 10.52 4.18 8.98 10.98
WACC w ith Rf = R157 10.93 10.09 10.01 9.10 10.03 6.07 9.21 11.29
Risk-free rate 4.00 4.00 4.00 4.00 4.00 4.00 4.00 4.00
Compounded period1R 16 744 481.55 R 17 727 344.05 R 16 288 892.76 R 16 055 710.80 R 12 736 928.32 R 363 235 245.85 R 13 862 408.75 R 7 317 048.14
Compounded period2R 16 327 640.25 R 16 342 023.11 R 14 866 768.31 R 15 461 829.05 R 13 622 519.14 R 32 718 131.22 R 13 289 498.90 R 7 025 467.49
NASPERS ('000) 2011 2010 2009 2008 2007 2006 2005 2004
FCF -R 1 253 000 R 24 000 R 7 430 679 -R 8 496 832 -R 6 059 945 R 369 225 R 913 092 R 951 713
WACC w ith Rf = R153 11.02 10.64 10.53 11.20 13.82 13.43 13.34 18.04
WACC w ith Rf = R157 11.33 11.04 11.52 10.88 13.56 13.63 13.64 18.09
Risk-free rate 9.00 9.00 9.00 9.00 9.00 9.00 9.00 9.00
Compounded period1-R 59 011 997.40 -R 63 130 374.02 -R 71 432 962.79 -R 121 998 373.26 -R 18 026 105.88 R 22 442 359.61 R 26 007 658.61 R 12 427 013.55
Compounded period2-R 51 739 760.51 -R 51 410 768.97 -R 44 368 790.22 -R 142 479 654.92 -R 19 109 707.09 R 21 561 084.16 R 24 425 481.01 R 12 363 893.09
1 WACC with Rf=R153 used in calculation
2 WACC with Rf=R157 used in calculation
Related Documents