Chapter McGraw-Hill/Irwin Copyright © 2008 by The McGraw-Hill Companies, Inc. All rights reserved. 1 A Brief History of Risk and Return

Welcome message from author
This document is posted to help you gain knowledge. Please leave a comment to let me know what you think about it! Share it to your friends and learn new things together.
Transcript

Chapter
McGraw-Hill/Irwin Copyright © 2008 by The McGraw-Hill Companies, Inc. All rights reserved.
1 A Brief History of
Risk and Return

1-2
Example I: Who Wants To Be A Millionaire?
• You can retire with One Million Dollars (or more).
• How? Suppose:– You invest $300 per month.
– Your investments earn 9% per year.
– You decide to take advantage of deferring taxes on your investments.
• It will take you about 36.25 years. Hmm. Too long.

1-3
Example II: Who Wants To Be A Millionaire?
• Instead, suppose:– You invest $500 per month.– Your investments earn 12% per year– you decide to take advantage of deferring taxes on your investments
• It will take you 25.5 years.
• Realistic?• $250 is about the size of a new car payment, and perhaps your employer will
kick in $250 per month• Over the last 80 years, the S&P 500 Index return was about 12%
Try this calculator: cgi.money.cnn.com/tools/millionaire/millionaire.html
1-4
A Brief History of Risk and Return
• Our goal in this chapter is to see what financial market history can tell us about risk and return.
• There are two key observations:– First, there is a substantial reward, on average, for bearing risk.– Second, greater risks accompany greater returns.

1-5
Dollar Returns
• Total dollar return is the return on an investment measured in dollars, accounting for all interim cash flows and capital gains or losses.
• Example:
Loss) (or Gain Capital
Income Dividend Stock a on Return Dollar Total

1-6
Percent Returns
• Total percent return is the return on an investment measured as a percentage of the original investment.
• The total percent return is the return for each dollar invested.
• Example, you buy a share of stock:
)Investment Beginning (i.e., Price Stock Beginning
Stock a on Return Dollar Total Return Percent
or
Price Stock Beginning
Loss) (or Gain Capital Income Dividend Stock a on Return Percent
1-7
Example: Calculating Total Dollar and Total Percent Returns
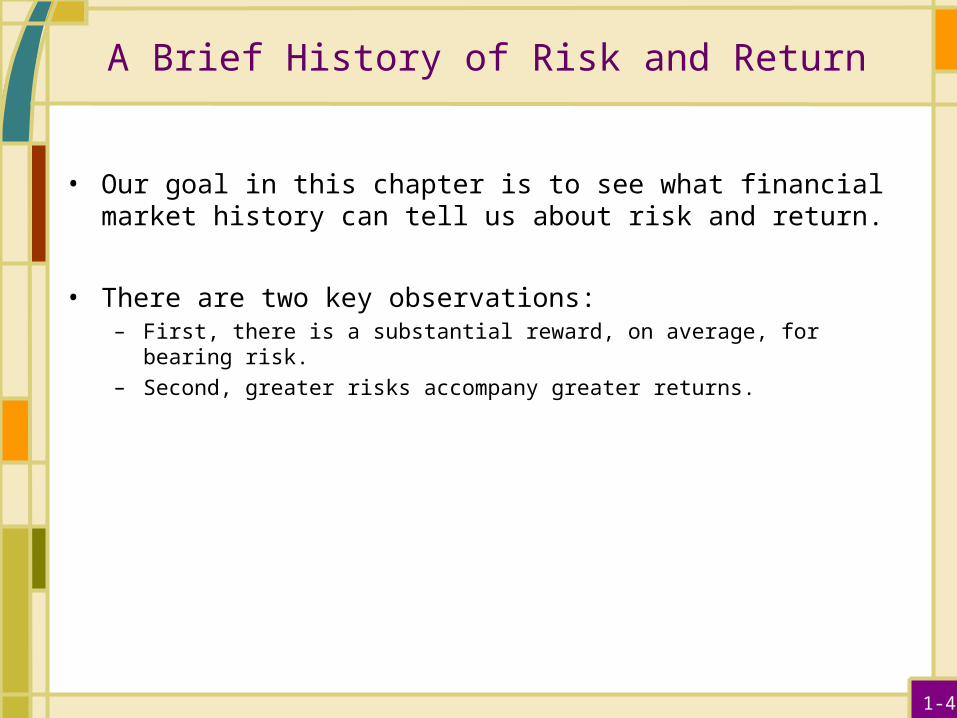
• Suppose you invested $1,000 in a stock with a share price of $25.
• After one year, the stock price per share is $35.
• Also, for each share, you received a $2 dividend.
• What was your total dollar return?– $1,000 / $25 = 40 shares
– Capital gain: 40 shares times $10 = $400
– Dividends: 40 shares times $2 = $80
– Total Dollar Return is $400 + $80 = $480
• What was your total percent return?– Dividend yield = $2 / $25 = 8%
– Capital gain yield = ($35 – $25) / $25 = 40%
– Total percentage return = 8% + 40% = 48%
Note that $480 divided by $1000 is 48%.
1-8
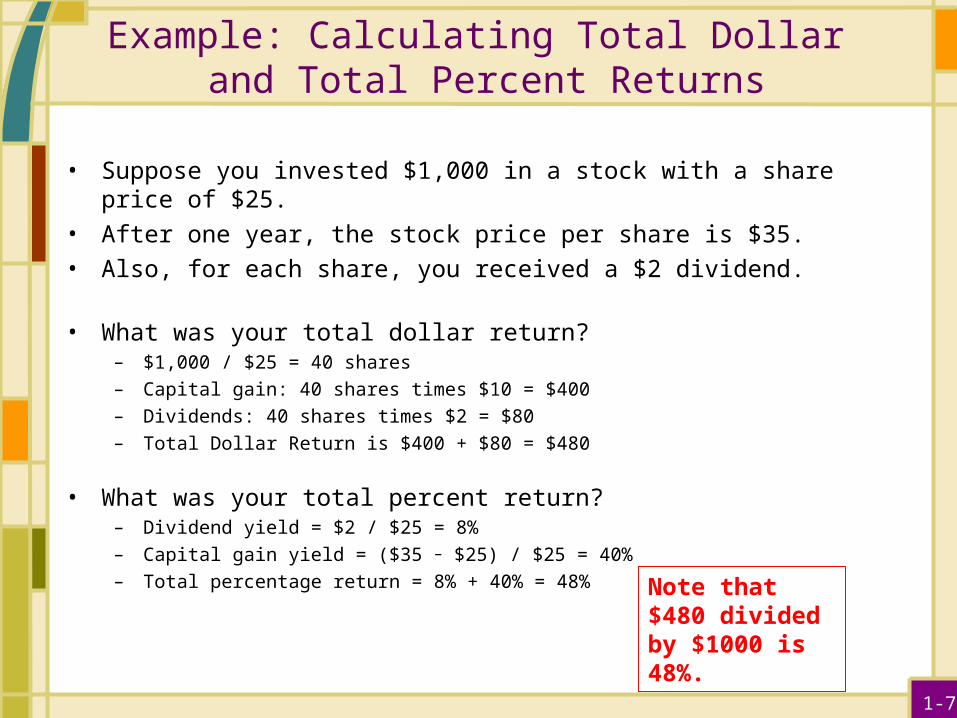
A $1 Investment in Different Typesof Portfolios, 1926—2005.

1-9
Financial Market History

1-10
The Historical Record:Total Returns on Large-Company Stocks.

1-11
The Historical Record: Total Returns on Small-Company Stocks.
1-12
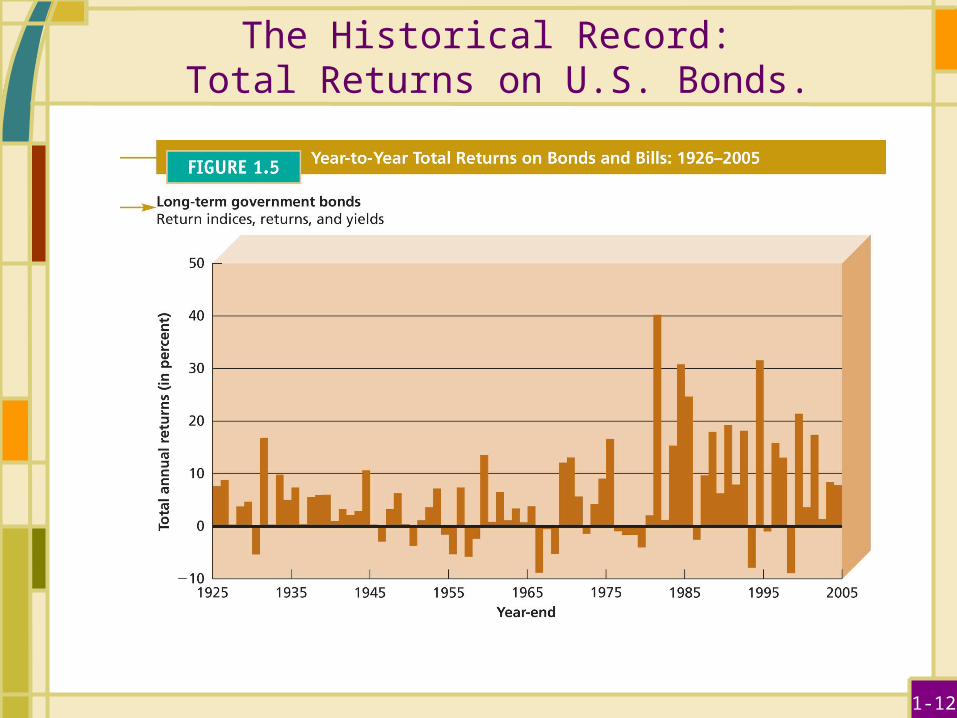
The Historical Record: Total Returns on U.S. Bonds.

1-13
The Historical Record: Total Returns on T-bills.
1-14
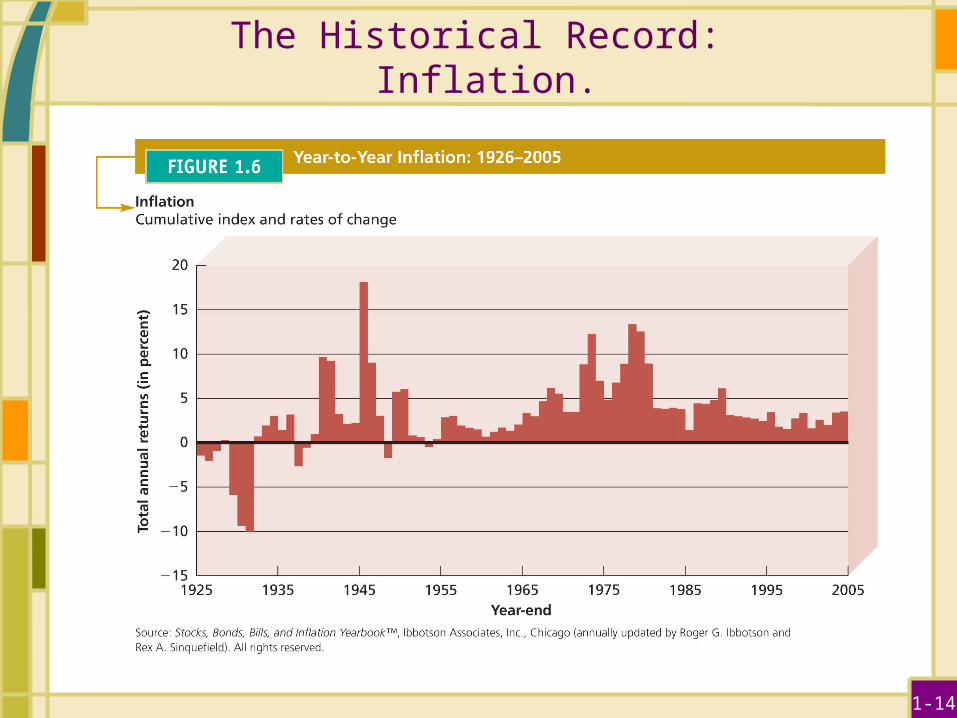
The Historical Record: Inflation.

1-15
Historical Average Returns
• A useful number to help us summarize historical financial data is the simple, or arithmetic average.
• Using the data in Table 1.1, if you add up the returns for large-company stocks from 1926 through 2005, you get about 984 percent.
• Because there are 80 returns, the average return is about 12.3%. How do you use this number?
• If you are making a guess about the size of the return for a year selected at random, your best guess is 12.3%.
• The formula for the historical average return is:
n
returnyearly Return AverageHistorical
n
1i

1-16
Average Annual Returns for Five Portfolios

1-17
Average Returns: The First Lesson
• Risk-free rate: The rate of return on a riskless, i.e., certain investment.
• Risk premium: The extra return on a risky asset over the risk-free rate; i.e., the reward for bearing risk.
• The First Lesson: There is a reward, on average, for bearing risk.
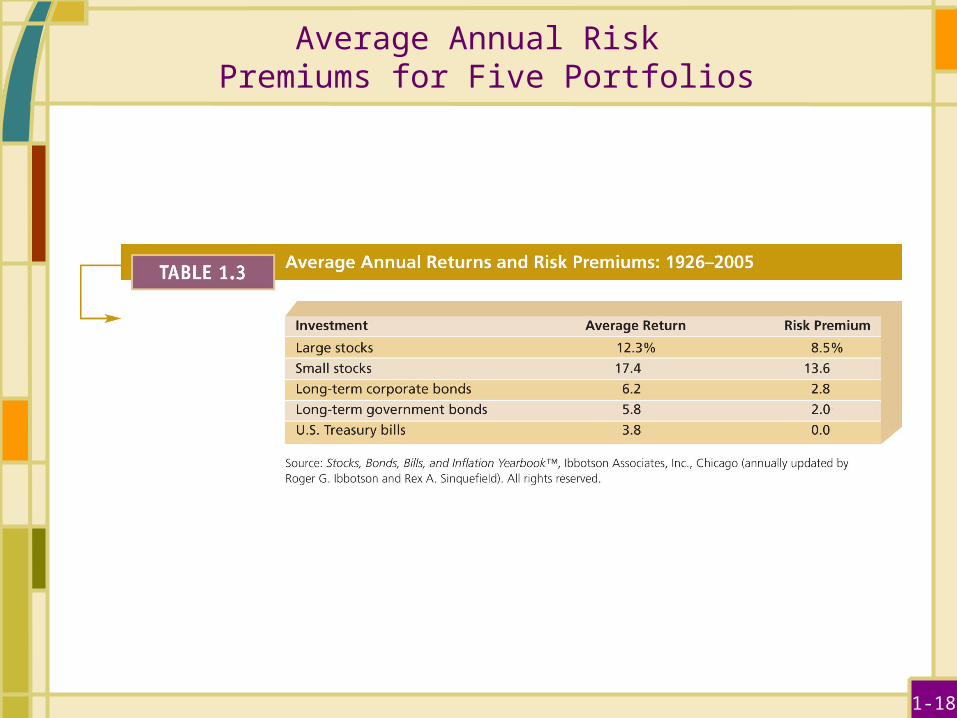
• By looking at Table 1.3, we can see the risk premium earned by large-company stocks was 8.5%!
1-18
Average Annual Risk Premiums for Five Portfolios
1-19
Why Does a Risk Premium Exist?
• Modern investment theory centers on this question.
• Therefore, we will examine this question many times in the chapters ahead.
• However, we can examine part of this question by looking at the dispersion, or spread, of historical returns.
• We use two statistical concepts to study this dispersion, or variability: variance and standard deviation.
• The Second Lesson: The greater the potential reward, the greater the risk.

1-20
Return Variability: The Statistical Tools
• The formula for return variance is ("n" is the number of returns):
• Sometimes, it is useful to use the standard deviation, which is related to variance like this:
1N
RR σ VAR(R)
N
1i
2
i2
VAR(R) σ SD(R)

1-21
Return Variability Review and Concepts
• Variance is a common measure of return dispersion. Sometimes, return dispersion is also call variability.
• Standard deviation is the square root of the variance.– Sometimes the square root is called volatility. – Standard Deviation is handy because it is in the same "units" as the average.
• Normal distribution: A symmetric, bell-shaped frequency distribution that can be described with only an average and a standard deviation.
• Does a normal distribution describe asset returns?

1-22
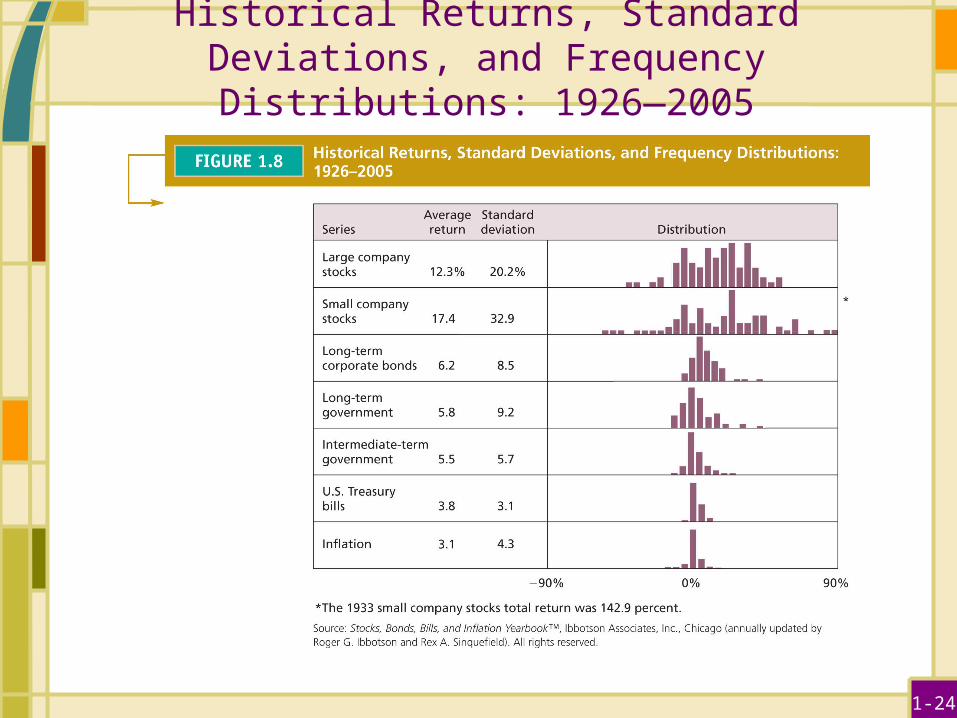
Frequency Distribution of Returns on Common Stocks, 1926—2005

1-23
Example: Calculating Historical Variance and Standard Deviation
• Let’s use data from Table 1.1 for large-company stocks.
• The spreadsheet below shows us how to calculate the average, the variance, and the standard deviation (the long way…).
(1) (2) (3) (4) (5)Average Difference: Squared:
Year Return Return: (2) - (3) (4) x (4)1926 13.75 12.12 1.63 2.661927 35.70 12.12 23.58 556.021928 45.08 12.12 32.96 1086.361929 -8.80 12.12 -20.92 437.651930 -25.13 12.12 -37.25 1387.56
Sum: 60.60 Sum: 3470.24
Average: 12.12 Variance: 867.56
29.45Standard Deviation:
1-24
Historical Returns, Standard Deviations, and Frequency Distributions: 1926—2005

1-25
The Normal Distribution and Large Company Stock Returns

1-26
Returns on Some “Non-Normal” Days
Top 12 One-Day Percentage Declines in the
Dow Jones Industrial Average
Source: Dow Jones
December 12, 1914 -24.4% August 12, 1932 -8.4%
October 19, 1987 -22.6 March 14, 1907 -8.3
October 28, 1929 -12.8 October 26, 1987 -8.0
October 29, 1929 -11.7 July 21, 1933 -7.8
November 6, 1929 -9.9 October 18, 1937 -7.7
December 18, 1899 -8.7 February 1, 1917 -7.2

1-27
Arithmetic Averages versusGeometric Averages
• The arithmetic average return answers the question: “What was your return in an average year over a particular period?”
• The geometric average return answers the question: “What was your average compound return per year over a particular period?”
• When should you use the arithmetic average and when should you use the geometric average?
• First, we need to learn how to calculate a geometric average.
1-28
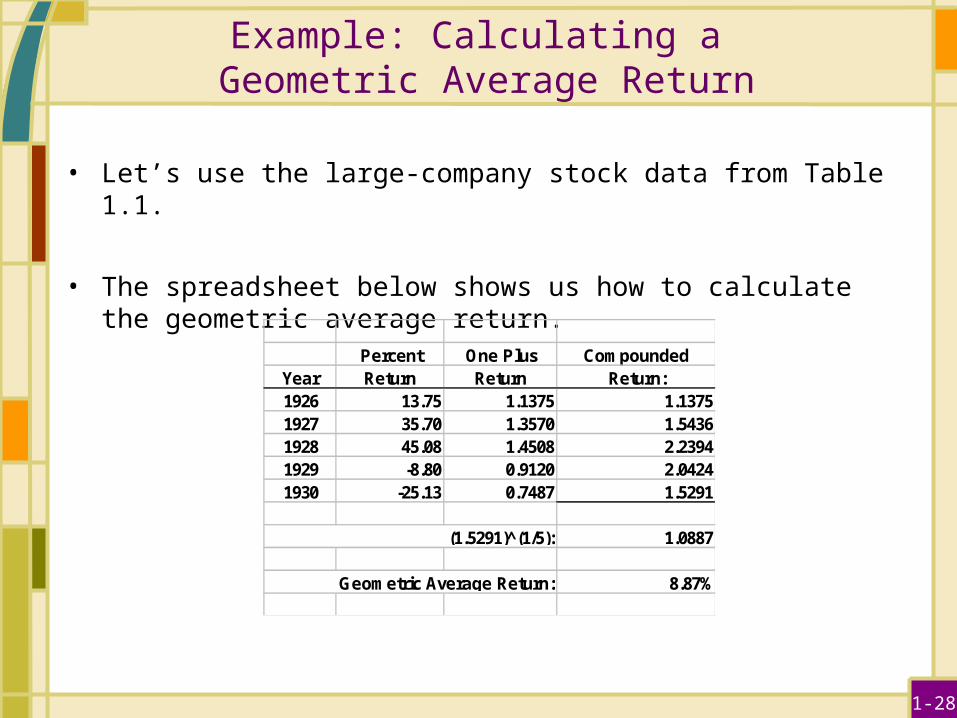
Example: Calculating a Geometric Average Return
• Let’s use the large-company stock data from Table 1.1.
• The spreadsheet below shows us how to calculate the geometric average return.
Percent One Plus CompoundedYear Return Return Return:1926 13.75 1.1375 1.13751927 35.70 1.3570 1.54361928 45.08 1.4508 2.23941929 -8.80 0.9120 2.04241930 -25.13 0.7487 1.5291
1.0887
8.87%
(1.5291)^(1/5):
Geometric Average Return:

1-29
Arithmetic Averages versusGeometric Averages
• The arithmetic average tells you what you earned in a typical year.
• The geometric average tells you what you actually earned per year on average, compounded annually.
• When we talk about average returns, we generally are talking about arithmetic average returns.
• For the purpose of forecasting future returns:– The arithmetic average is probably "too high" for long forecasts.– The geometric average is probably "too low" for short forecasts.
1-30
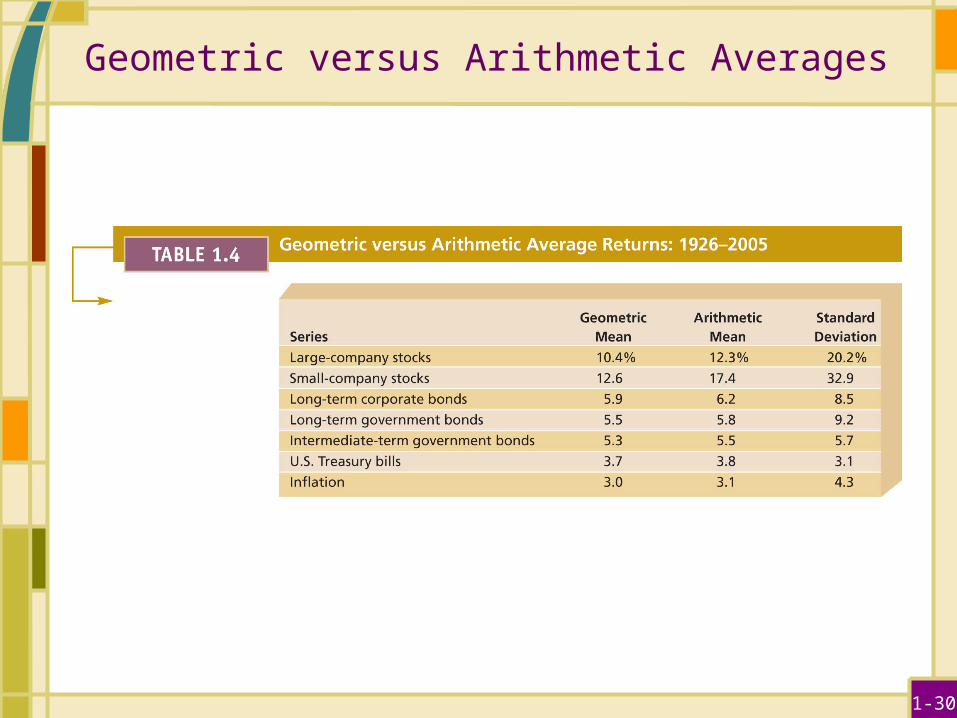
Geometric versus Arithmetic Averages
1-31
Risk and Return
• The risk-free rate represents compensation for just waiting.
• Therefore, this is often called the time value of money.
• First Lesson: If we are willing to bear risk, then we can expect to earn a risk premium, at least on average.
• Second Lesson: Further, the more risk we are willing to bear, the greater the expected risk premium.

1-32
Historical Risk and Return Trade-Off
1-33
A Look Ahead
• This text focuses exclusively on financial assets: stocks, bonds, options, and futures.
• You will learn how to value different assets and make informed, intelligent decisions about the associated risks.
• You will also learn about different trading mechanisms, and the way that different markets function.

1-34
Useful Internet Sites
• cgi.money.cnn.com/tools/millionaire/millionaire.html (millionaire link)
• finance.yahoo.com (reference for a terrific financial web site)
• www.globalfindata.com (reference for historical financial market data—not free)
• www.robertniles.com/stats (reference for easy to read statistics review)
1-35
Chapter Review, I.
• Returns– Dollar Returns– Percentage Returns
• The Historical Record– A First Look– A Longer Range Look– A Closer Look
• Average Returns: The First Lesson– Calculating Average Returns– Average Returns: The Historical Record– Risk Premiums
1-36
Chapter Review, II.
• Return Variability: The Second Lesson– Frequency Distributions and Variability
– The Historical Variance and Standard Deviation
– The Historical Record
– Normal Distribution
– The Second Lesson
• Arithmetic Returns versus Geometric Returns
• The Risk-Return Trade-Off
Related Documents