360 Government Bond Market Development in Asia 9 Malaysia Chok Kwee Bee and Teng Chean Choy Executive Summary Malaysias bond market is the second largest of the Asian develop- ing countries (ADCs) in this study, after the Republic of Koreas. However, in international terms, it is small, representing only about 55 percent of gross domestic product (GDP), and thus far having mainly expanded on account of privatization by the Government of major infrastructure projects. This is poor compared with 90 percent GDP in many developed countries. The reason is that the funding requirements of the economy and the Malaysian corporate sector have generally been met by the banking sector, as in other developing countries whose nancial sectors have matured faster than the nonnancial sectors. The Asian nancial crisis and its repercussions in 1997/98 showed only too well the vulnerabilities of a system with large funding mis- matches, where long-term requirements have been met by short-term borrowings. This points to the need to develop an e¹cient bond market to reduce heavy re ent in 1986 (caused by massive development fund- ing). The external debt position continued to rise in 1999, but the pace of increase moderated considerably. Originally, Malaysian Government Securities (MGS) were issued to meet the investment needs of the Employees Provident und (EP), but were extended in subsequent years to fund budget decits, in part re- ecting increasing public development expenditure. Satisfying these two needs drove public debt continuously upwards, with outstanding MGS rising to RM67.01 billion in 1998 and RM78.33 billion in 1999. Trad- ing volume in MGS averaged RM4.9 billion per month in 1999, which is not very large compared with recent transactions in the Malaysian equities market. The corporate bond market, on the other hand, which involves the issuance of private debt securities (PDS) by the Malaysian corporate sector, really made its debut with the establishment of the National Mortgage Corporation, Cagamas Berhad in December 1986. Cagamas

Welcome message from author
This document is posted to help you gain knowledge. Please leave a comment to let me know what you think about it! Share it to your friends and learn new things together.
Transcript

8/8/2019 Chap09_MAL
http://slidepdf.com/reader/full/chap09mal 1/70
360 Government Bond Market Development in Asia
9
MalaysiaChok Kwee Bee and Teng Chean Choy
Executive Summary
Malaysias bond market is the second largest of the Asian develop-
ing countries (ADCs) in this study, after the Republic of Koreas. However,
in international terms, it is small, representing only about 55 percent of
gross domestic product (GDP), and thus far having mainly expanded on
account of privatization by the Government of major infrastructure projects.
This is poor compared with 90 percent GDP in many developed countries.
The reason is that the funding requirements of the economy and
the Malaysian corporate sector have generally been met by the bankingsector, as in other developing countries whose nancial sectors have
matured faster than the nonnancial sectors.
The Asian nancial crisis and its repercussions in 1997/98 showed
only too well the vulnerabilities of a system with large funding mis-
matches, where long-term requirements have been met by short-term
borrowings. This points to the need to develop an e¹cient bond market
to reduce heavy re ent in 1986 (caused by massive development fund-
ing). The external debt position continued to rise in 1999, but the pace
of increase moderated considerably.Originally, Malaysian Government Securities (MGS) were issued to
meet the investment needs of the Employees Provident und (EP), but
were extended in subsequent years to fund budget decits, in part re-
ecting increasing public development expenditure. Satisfying these two
needs drove public debt continuously upwards, with outstanding MGS
rising to RM67.01 billion in 1998 and RM78.33 billion in 1999. Trad-
ing volume in MGS averaged RM4.9 billion per month in 1999, which
is not very large compared with recent transactions in the Malaysian
equities market.The corporate bond market, on the other hand, which involves the
issuance of private debt securities (PDS) by the Malaysian corporate
sector, really made its debut with the establishment of the National
Mortgage Corporation, Cagamas Berhad in December 1986. Cagamas

8/8/2019 Chap09_MAL
http://slidepdf.com/reader/full/chap09mal 2/70
Malaysia 361
was incorporated with the primary aim of developing a secondary mort-
gage market to assist banking institutions in need of liquidity or fundingto nd renancing for their mortgage loans. Before the establishment of
Cagamas, there were a few corporate bond issues, but they were small
and infrequent.
However, given the increase in corporate credit risks in current
market conditions, with investors wary of corporate defaults, trading
volumes for the MGS have been high, with the trading of listed corpo-
rate bonds considerably reduced. There has also been a sharp fall in the
issuance of PDS by the Malaysian corporate sector, exacerbated by re-
duced investment spending and uncertain investor interest.Increasingly, development of the corporate bond market is recog-
nized as the way forward for both business and investors. This market
will play an important role in the next phase of Malaysias development
in the next millennium, pointing to a need to develop a bond market
that is e¹cient and has depth and breath.
Essentially, a developed bond market will o¬er companies an al-
ternative source of nancing, providing exibility for long-term projects
to be funded by long-term funds. It will also create an opportunity for
Malaysian corporations to manage their capital structure more optimally.rom the investors viewpoint, bond issuance will be an alternative
form of investment, assist with diversication of opportunities, and help
to mobilize savings towards a more e¹cient allocation of resources.
Hopefully, it will also lead to the development of a secondary market
that allows bondholders to trade and make bond instruments marketable
and liquid, similar to equity stocks.
The secondary market for bonds in Malaysia is not as well devel-
oped as the primary market. Not many issues are traded, and information
on daily volume and prices is not readily available as compared, forexample, with equity trading. The lack of information is mainly attribut-
able to the fact that the secondary trading of Malaysian bonds is essentially
undertaken over-the-counter (OTC) and not in an organized exchange,
although a few corporate bonds are traded on the Kuala Lumpur Stock
Exchange (KLSE).
Until recently, inactivity in the secondary market has been due to
limited and irregular supply, with most issues being taken up by a cap-
tive market. This may be resolved, however, with the recent increase in
government bond issues over corporate debt securitiesunderstandablein view of the Governments e¬orts to spur economic recovery, and be-
cause the corporate sector in the aftermath of the Asian nancial crisis
has had problems in meeting its debt obligations, or is in the midst of
restructuring. There has also been an appetite for government securities

8/8/2019 Chap09_MAL
http://slidepdf.com/reader/full/chap09mal 3/70
362 Government Bond Market Development in Asia
because institutional investors, wary of corporate credit risks, nd them
preferabledespite their lower yieldsin light of the certainty that therecan be no default in government securities.
The increase in the supply of government bonds may result in a
more reective yield curve, and it is important that they take on the role
of benchmarker. Benchmark securities should have a regular and pre-
dictable issuance schedule with a whole spectrum of maturities, should
be actively traded, very liquid, and responsive to market conditions.
While not risk-free, the risk should be stable, predictable and easily
assessable. Having a reliable benchmark, the corporate bond market would
be able to come out with an array of its own issues, with risk premiabased on how they rank against the government securities, and eventu-
ally ourish.
The investor base in the Malaysian bond market is mainly com-
prised of banks and asset and pension funds, as certain institutional
investors are required by statute to invest a portion of their total funds
in government securities (designated as liquid assets). or example, provi-
dent and pension funds are required to invest a minimum of 50 percent
of their total investible funds in such securities. The largest of these is
the EP.This requirement has many advantages for the economy. It allows
xed-rate cheap fund-raising for the countrys development needs, and
allows the Government to exibly structure the maturity prole of its
debts to match the tenor of its nancing needs. It also gives the Central
BankBank Negara Malaysia (BNM)an e¬ective tool to manage the
level of market liquidity, thereby inuencing and setting the level of
interest rates.
It provides a safety net in case of unexpected demands for liquid-
ity, giving depositors some protection for their monies, increases condencein the banking institutions, and o¬ers a reasonable return on invest-
ments over the average ination rate.
However, it also results in a captive market for bonds, creating
articial demand that distorts yields. These bonds are inevitably locked
up and held until maturity, especially by the pension funds, further in-
hibiting the development of a secondary market. In the absence of an
e¬ective hedging instrument, this passive portfolio management may
also lead to a higher risk prole of the mandatory holders of the bonds.
The current dominance of the nancial institutions and large pen-sion funds ignores the needs of retail investors in search of secure
long-term investmentseven though the minimum denomination for
government bonds is set at RM1,000.00.

8/8/2019 Chap09_MAL
http://slidepdf.com/reader/full/chap09mal 4/70
Malaysia 363
Areas for .urther Development
In terms of further development of the primary market, problem
areas to be addressed mainly relate to market demand, such as irregularity
of bond o¬erings, unattractive coupons, and relatively large denomina-
tions for retail investments for government bonds. or corporate issues,
there is the additional problem of delays and complex and costly proce-
dures to be met before o¬erings are made. Unless these issues are
adequately addressed, the potential growth of the market as an increas-
ing and important channel for raising capital funds by corporations will
not be maximized.With regard to scal policy and management, government securi-
ties issuances should not be at the beck and call of scal surpluses or
decits, as this creates volatility.
If government securities are to serve as benchmark securities in the
development of a mature bond market, then a regular program of issu-
ances with a whole range of maturities should be scheduled to allow a
true yield curve to develop.
Distortionary features in the tax structure, in BNM regulations, and
in the market itself should be resolved. There should be a review of theexisting legal and regulatory framework, and the apparent dichotomy in
the development of the government and corporate bond market should
be gradually closed. The formal standards of practice and convention
that have been drawn up for MGS, and the setting up of modern and
e¹cient settlement and tendering systems, are steps in the right direction.
I .iscal Policy and Management
The scal policy of the Malaysian Government is broadly designedto promote the e¹cient allocation of resources, the distribution of in-
come and wealth, and economic stabilization.
The Government provides public goods and services, such as edu-
cation and health care. It distributes income and wealth between di¬erent
income groups, regions, and states by means of taxation, transfer pay-
ments, and subsidies. It aims to maintain high employment, price stability
and an acceptable rate of economic growth, while reducing economic
instability.
Levels of government participation in the economy have changedover time, however. In the early years of development, it was very limited,
but this changed signicantly in 1970 with the introduction of the New
Economic Policy (NEP). This aimed for ethnically equitable poverty re-
duction and economic progression through the restructuring of Malaysian

8/8/2019 Chap09_MAL
http://slidepdf.com/reader/full/chap09mal 5/70
364 Government Bond Market Development in Asia
society. iscal spending for development purposes, such as infrastructure
and health, began to increase rapidly.During this period, as part of its distribution objective, the Gov-
ernment started to intervene directly in the productive sectors of the
economy, mainly through the establishment of large state commercial
enterprises.
Total government expenditure during the NEP period constituted
close to 50 percent of GNP at its height in 1981. This represented a
large government presence in Malaysias economic activitymuch larger
than in many neighboring countries.
By 1982, as a result of the Governments unprecedented expan-sionary policy, the broad public sector scal decit and external current
account shortfall had climbed to 19 percent and 14 percent of GNP,
respectively. At the government level, the shortfall was also large at
17.5 percent. The decit was nanced through domestic and external
borrowings, so that by the mid-1980s the external debt/GNP ratio of the
broad public sector had reached a record high of 137 percent. The fur-
ther softening of commodity prices in the mid-1980s and rising global
interest rates, however, forced deep cutbacks in public programs, which
ultimately contributed to the recession of 1985/86. Table 1 shows gov-ernment sector nance from 1990 to 1999, as well as the o¹cial projection
for 2000.
TABLE 1
.ederal Government .inance
(RM billion; percent of GNP)
Current Revenue Current Expenditure Current Surplus/Decit
Year Amount Percent Amount Percent Amount Percent(RM billion) of GNP (RM billion) of GNP (RM billion) of GNP
1990 29.5 25.9 25.0 21.9 4.5 3.91991 34.1 26.5 28.3 22.1 5.8 4.51992 39.3 27.5 32.1 22.5 7.2 5.01993 41.7 25.4 32.2 19.7 9.5 5.81994 49.4 26.6 35.1 18.8 14.4 7.71995 51.0 24.0 36.6 17.2 14.4 6.81996 58.3 24.1 43.9 18.1 14.4 6.01997 65.7 24.6 44.7 16.7 21.1 7.91998 56.7 21.1 44.6 16.6 12.1 4.51999a 56.7 20.2 48.9 17.4 7.8 2.82000b 59.9 20.2 52.4 17.7 7.5 2.6
a estimate; b forecast.Source: Ministry of inance.

8/8/2019 Chap09_MAL
http://slidepdf.com/reader/full/chap09mal 6/70
Malaysia 365
This forced the adoption of various anticyclical measures. The
Government also decided to promote greater private sector involvementin economic growth, while emphasizing its own role as a catalyst for
development through the provision of scal direction and incentives.
This policy prevailed through the 1990s.
The NEP was replaced in 1990 by the National Development Policy
(NDP) (19912000). While the NEP had formally set targets to remove
poverty and ethnic di¬erences in access to jobs and wealth, the NDP
aimed to bring about balanced development less dependent on rigid
quotas.
Continued pruning of public expenditure greatly improved the s-cal position. In the six years following the 1985/86 recession, the
Government enjoyed falling scal decits from 11.2 percent in 1986 to
only 0.9 percent in 1992. The broad public sector also charted a spec-
tacular improvement, with overall decit falling from 10.1 percent to 2.7
percent during the same period. In the following years, and up to 1997,
the overall nancial position of the Government posted ve consecutive
years of surpluses ranging between 0.2 percent and 2.5 percent of GNP.
The scal position prior to 1997 brought about declining indebt-
edness, narrower external current account decits, a stable exchange rate,and negligible ination, which together enhanced business condence.
With the inow of private long-term capital, foreign direct investments
(DI) increased sharply, resulting in real GDP growth exceeding 9 per-
cent per year from 1988 to 1997.
During the Asian nancial crisis, the Government once again adopted
countercyclical measures to revitalize the domestic economy and sup-
port the private sector. These measures, together with selective capital
controls, helped the economy to make a quick turnaround, with real
GDP expected to record a growth of more than 5 percent in 1999, com-pared with negative 7.5 percent in 1998.
Nonetheless, revenue declined substantially as the result of the
expansionary scal package designed to revive domestic spending. The
Governments overall account registered a decit of 1.9 percent of GNP
in 1998, which widened in 1999, although it was still less than 5 per-
cent of GNP.
Malaysias past experience thus underlines the importance of main-
taining macroeconomic stability by avoiding large scal decits.

8/8/2019 Chap09_MAL
http://slidepdf.com/reader/full/chap09mal 7/70
366 Government Bond Market Development in Asia
A Government Revenue
Broadly, government revenue comprises: (i) tax revenue; (ii) nontax
revenue, and (iii) nonrevenue receipts. Tax revenue consists of direct
and indirect tax revenue, and accounts for more than 75 percent of total
revenue. Direct tax revenue includes revenue from personal and corpo-
rate income tax, petroleum income tax, stamp duty, and real property
gains tax, while indirect tax revenue consists of revenue from export
and import duties, and sales tax on certain goods and services.
Nontax revenue consists of receipts from licenses, registration fees
and permits, service fees, proceeds from sales of goods, rentals, interest
and returns on investments locally and from foreign countries, nes and
forfeitures and contributions, and compensations from foreign govern-
ments and international agencies. Nonrevenue receipts, which include
refunds of expenditure, receipts from government agencies and revenue
from the federal territories represent a minor fraction of total revenue.
Table 2 shows the revenue trend of the federal Government since 1990.
.IGURE 1
Real GDP Growth, 19902000
15.0
10.0
5.0
0.0
–5.0
–10.0
1990 1991 1992 1993 1994 1995 1996 1997 1998 1999a 2000b
Year
G r o w t h R a t e
a estimate; b forecast.Source: Bank Negara Malaysia.

8/8/2019 Chap09_MAL
http://slidepdf.com/reader/full/chap09mal 8/70
Malaysia 367
TABLE 2
.ederal Government Revenue, 19902000
(RM billion and percent share)
YearTotal Direct Taxes Indirect Taxes Non-Tax Revenue
Revenue Amount % Amount % Amount %
1990 29.5 10.4 35.2 10.8 36.7 8.3 28.01991 34.1 13.3 38.9 12.6 36.9 8.2 24.11992 39.3 15.4 39.2 13.4 34.1 10.5 26.71993 41.7 17.1 40.9 14.8 35.6 9.8 23.51994 49.4 20.2 40.8 17.3 35.0 12.0 24.2
1995 51.0 22.7 44.5 19.0 37.2 9.3 18.21996 58.3 25.9 44.4 21.4 36.8 11.0 18.91997 65.7 30.4 46.3 23.2 35.3 12.1 18.41998 56.7 30.0 52.9 15.3 27.0 11.4 20.11999a 56.7 26.9 47.5 17.5 30.8 12.3 21.72000b 59.9 29.1 48.6 18.5 30.9 12.3 20.6
a estimate; b forecast.Source: Ministry of inance.
B Government Expenditure
ederal government expenditure is divided between current or op-
erating expenditure and development expenditure. The former generally
accounts for between two thirds and three quarters of the Governments
total expenditure. The major components of current expenditure are gov-
ernment employees salaries, expenditure on goods and services, servicing
of the public sectors domestic and external debt, and transfer payments.
(Appendix A.5)
The Government provides public goods and services such as de-fense, law and order, and roads, in line with public demand and population
growth. Large and increasing allocations are made for infrastructure de-
velopment, education, and health care.
The role of Government in the social sectors has been guided by
the impact of public expenditure on outcomes. Among such expendi-
ture, health and education have been of central importance. Public
expenditure has the greatest impact in improving health and education
areas that are clearly characterized by market failure. Together, these
accounted for about 25 percent of government expenditure in the 1990s,the largest single category in the national budget. The huge progress
made in education and health conditions has indirectly enhanced the
nations human resources and manpower development.
Goods that enjoy increasing returns to scale, which give rise to

8/8/2019 Chap09_MAL
http://slidepdf.com/reader/full/chap09mal 9/70

8/8/2019 Chap09_MAL
http://slidepdf.com/reader/full/chap09mal 10/70
Malaysia 369
of personnel has been further reduced. Between 1983 and 1998, a total
of 105,825 government employees were transferred to the private sector.Rising demand for infrastructure was also addressed through the
privatization of national utility companies and projects.
D .inancing of .iscal Decits
The nancing of government activity until the early 1980s came
primarily from noninationary sources, particularly in the form of cap-
tive savings in the EP. As a result of countercyclical measures taken in
the early 1980s, however, there was increasing reliance on foreign -nancing to fund development expenditure, which was increasing rapidly
while domestic revenue growth was sluggish following the liberalization
of taxes and the dampening impact of income and commodity prices
caused by world recession.
Consequently, government external debt rose signicantly from
RM8.3 billion in 1981 to RM28.3 billion in 1986. Overall, the nations
external debt also increased sharply, rising to RM42.5 billion by the
end of 1985 from RM10 billion in 1980. At the same time, the debt
service ratio soared to close to 16 percent in 1985 from just 4 percent in1980. Such a situation, with the marked increase in development expen-
diture, was clearly unsustainable.
To deal with its rising debt problems, the Government embarked
on a multiyear structural adjustment program to ensure orderly growth
of the nations external debt, and to provide room for the private sector
to thrive. In 1983, it also introduced the rst in a series of budgets to
reduce overall public sector decit to sustainable levels as a proportion
to GNP.
The scal adjustment package included measures to consolidatethe nancial position of the NPEs and improve revenue collection,
while privatization of major public sector enterprises was actively pur-
sued. The Governments nancial position improved markedlyto the
extent that it could a¬ord to prepay some of its external borrowings,
improving the nations debt prole. With continued restraint on new
borrowings, the Governments external debt fell from a high of RM28.3
billion in 1986 to RM10.5 billion in 1996.
The domestic borrowing position also improved in the 1990s, re-
ected by the average increase of 2.9 percent per annum in outstandingdebt from 1989 to 1996. The Governments domestic borrowing program
prior to 1997 was mainly designed to accommodate market demand for
MGS and to provide a benchmark yield curve to support the develop-
ment of a domestic bond market.

8/8/2019 Chap09_MAL
http://slidepdf.com/reader/full/chap09mal 11/70
370 Government Bond Market Development in Asia
The shift in government policy in the mid-1980s led to the capital
market emerging as the countrys prominent nancing intermediary, il-lustrated by the unprecedented volume of papers issued by the private
sector amidst a diminishing supply of government papers. Net funds
raised by the Government declined progressively over the years, from
RM20.1 billion, or 77 percent of total funds raised, between 1981 and
1985 to RM7.6 billion, or 10.8 percent, between 1991 and 1996.
TABLE 3
.ederal Government Domestic Debt, 19902000
(RM billion and percent share to total)
Total Government InvestmentYear Domestic Treasury Bills Securities Issues Other
Debt Amount % Amount % Amount % Amount %
1990 70.0 4.3 6.2 62.1 88.7 0.9 1.3 2.7 3.81991 73.7 4.3 5.9 65.3 88.6 0.9 1.2 3.2 4.31992 76.1 4.3 5.7 66.6 87.6 1.0 1.3 4.1 5.41993 76.5 4.3 5.6 66.0 86.3 2.0 2.6 4.2 5.51994 78.3 4.3 5.5 65.0 83.0 4.8 6.1 4.2 5.3
1995 78.0 4.3 5.5 64.7 82.9 5.1 6.5 3.9 5.11996 79.2 4.3 5.5 66.9 84.5 4.2 5.2 3.8 4.81997 77.0 4.3 5.6 66.3 86.1 2.8 3.6 3.6 4.71998 88.2 4.3 4.9 75.0 85.1 2.0 2.3 6.9 7.81999a 94.3 4.3 4.6 82.3 87.4 2.0 2.1 5.6 5.9
a MO estimate.Source: Ministry of inance.
In contrast, the private sector mobilized RM63.1 billion, or close
to 90 percent of total net funds raised from the capital market between1991 and 1995, up from RM6 billion, or 23 percent of total funds raised
from 1981 to 1985.
In the equities market alone, privatized projects accounted for more
than one-half of total funds raised through the initial public o¬erings
(IPO) from 1990 to 1996. The presence of privatized companies in the
PDS market was also signicant, with total funds raised amounting to
RM12 billion or 28 percent of total bond issues in the 1993 to 1996
period.
The fund issuance pattern in the capital market, however, changeddramatically following the 1998 recession, largely due to investor con-
cerns over the nancial health of corporations, the weak sentiment in
the stock and bond markets, and uncertainties over the impact of the
global nancial market turmoil.

8/8/2019 Chap09_MAL
http://slidepdf.com/reader/full/chap09mal 12/70
Malaysia 371
The public sector was responsible for 55 percent, or RM9.8 bil-
lion, of net new funds raised in the capital market (a redemption of
RM1.4 billion in the previous year), compared with 45 percent or RM8
billion by the private sector (RM35 billion in 1997), reecting the lead
role played by the Government in reviving economic activities.
The Government was forced to adopt an expansionary scal policy
stance, nancing its expenditure decit from domestic sources and, to
some extent, external sources.Spending greatly outpaced revenue growth, and as a result the
Governments total domestic debt increased by 14.6 percent from a year
earlier to RM88.2 billion at the end of 1998. The rise in external debt
was even bigger, rising by 42.5 percent in 1997/98 to RM14.9 billion,
as the ringgit depreciated sharply against the major world currencies.
The total debt of the Government (domestic and external) as a
percent of GNP rose to 38.3 percent in 1998 from 33.7 percent in 1997.
Nonetheless, the ratio was still signicantly low compared with the peak
of 110.5 percent in 1986. This rising external debt position continuedin 1999, but the pace of increase moderated considerably.
40
35
30
25
20
15
10
5
0
–5
–10
1990 1991 1992 1993 1994 1995 1996 1997 1998 1999
R M B
i l l i o n
Year
Public Private
.IGURE 2
Public and Private Sector .unds Raised in the Capital Market(RM billion)
Source: Bank Negara Malaysia.

8/8/2019 Chap09_MAL
http://slidepdf.com/reader/full/chap09mal 13/70
372 Government Bond Market Development in Asia
II Monetary Policy and Management
Malaysias monetary policy is dened and implemented by BNM,
the Central Bank, which is one of the ve statutory bodies below the
Ministry of inance (MO). BNMs principal macroeconomic objective
is to promote a sustainable rate of output growth, consistent with do-
mestic price and exchange rate stability.
A Historical Overview
Malaysias monetary policy has varied with the move from NEP toNDP. Policies in the early 1980s were selectively restrictive, allowing
for a gradual increase in interest rates and discouraging the extension of
credit by the banking system for nonproductive and speculative activities.
rom 1983 to 1986, BNMs monetary policy became expansionary,
as conditions in the money market were extremely tight. BNM was,
especially in 1986, confronted with the conicting objectives of main-
taining stability in the exchange rate and reducing interest rates in the
money market. Monetary policy, however, turned neutral in 1987/88 as
liquidity conditions in the system improved signicantly amidst pricestability.
The period from 1989 to 1996 was characterized by prolonged
economic growth, averaging 9.5 percent per annum. Simultaneously, money
supply expanded strongly to double digit rates, well above the average
rate of economic growth. This increase was a major factor in creating
high economic growth, near full employment, and the emergence of ex-
cess demand, which began to impose a tremendous pressure on the
economy in terms of prices, labor, infrastructure, balance of payments,
and speculative activity. The Malaysian economy was clearly showingsigns of overheating.
With high demand for credit, and substantial inows of capital
into the stock and other markets, monetary policy had to strike a bal-
ance between the need to reduce excess demand while avoiding any
sudden impact on the general economic situation which would disturb
the business climate and condence.
BNM gave priority to sustaining high economic growth. Monetary
policy remained easy, and bank credit and money supply continued to
expand, while selective measures were taken to control the strong inowof short-term foreign capital.
While speculative funds began to unwind and ow out of the country
in 1994, price and other pressures brought about by excess aggregate
demand continued to prevail.

8/8/2019 Chap09_MAL
http://slidepdf.com/reader/full/chap09mal 14/70
Malaysia 373
B Postcrisis Policy
The conduct of monetary policy from 1997 to 1999, on the other
hand, underwent two distinct and opposing phases. Until 1998, the Ma-
laysian economy went into a recession induced by sudden capital ight
and a highly volatile and weak ringgit, caused by currency speculation.
Malaysia was caught by the contagion e¬ect, which had spread from
Thailand.
Monetary policy was gradually tightened, causing interest rates to
rise steeply while bank credit was drastically curtailed. Huge cutbacks
in scal spending were also enforced. The e¬ects of public policy ap-peared unsuccessful in pulling the economy out of recession, however.
The authorities therefore decided to reverse this policy response in the
second half of 1998, and imposed selective exchange controls and a
xed exchange rate for the Malaysian ringgit.
To reduce interest rates, additional liquidity was injected into the
banking system via reductions in banks liquidity ratio and reserve re-
quirements and open market operations (OMO). At the same time, various
reforms were instituted in the nancial sector, including the recapitaliza-
tion of the banking sector, through the establishment of the Danamodalbond. Nonperforming loans (NPLs) were restructured through the estab-
lishment of Danaharta Nasional Berhad and Pengurusan Danaharta Berhad,
to purchase the bad debts of banks. It was also proposed to merge bank-
ing institutions into a smaller number of bigger groups.
The Governments policy reversal, designed to contain speculation
on the ringgit and minimize the e¬ect of short-term capital ows on the
nancial markets and economy, also led to controls on the withdrawal of
the ringgit from external accounts. This now requires approval, except
for the purchase of ringgit assets. The export and import of the ringgitby travelers, together with payments to nonresidents, is also restricted,
although this does not apply to trade and direct investment purposes.
Although severely criticized outside, Malaysias so-called deance
of economic/nancial orthodoxy seemed to stabilize the local markets,
and liquidity conditions have eased considerably since September 1998.
With liquidity in excess supply, interest rates fell rapidly, in line
with the objective of an easier monetary policy. The three-month inter-
bank rate, which had stood at a high of 11.3 percent in July 1998,
dropped to a low of 3.1 percent from the second half of 1999. This inturn led to a downward movement of the base lending rate (BLR). Com-
pared with its highest level of 12.3 percent in June 1998, the BLR of
commercial banks has now fallen to 6.8 percent.

8/8/2019 Chap09_MAL
http://slidepdf.com/reader/full/chap09mal 15/70
.IGURE 3
Interest Rate and Exchange Rate Movements
13.00
12.00
11.00
10.00
9.00
8.00
7.00
6.00’80 ’81 ’82 ’83 ’84 ’85 ’86 ’87 ’88 ’89 ’90 ’91 ’92 ’93 ’94 ’95 ’96
Base Lending Rate
RM/US$
Base Lending Rate (%)

8/8/2019 Chap09_MAL
http://slidepdf.com/reader/full/chap09mal 16/70
Malaysia 375
O¬shore deposits returned. There was some inow of foreign bor-
rowings and a large external trade surplus. The average growth for thewhole of 1999 was predicted to be at least 5 percent.
Meanwhile, ination eased, largely due to the collapse of aggregate
demand, which had built up during the previous 10 years of high growth.
While this had some negative e¬ects on output and employment, it
reduced pressure on prices. In 1999, ination averaged just 2.8 percent,
as against 5.3 percent in 1998.
On the exchange rate front, the Government is expected to retain
the prevailing exchange rate of RM3.80 to US$1 until the economy has
fully recovered and the external payments balance remain in a funda-mentally strong position for some length of time.
C .uture Prospects
Malaysias external position showed a strong positive balance in
1999. The trade surplus registered a new record of RM72.8 billion, more
than o¬setting the traditional services account decit, and pushing the
current account surplus to an estimated RM55 billion or 20 percent of
GNP, compared with RM36.8 billion or 13.7 percent of GNP in 1998.The external reserves were therefore sustained at more than US$30 billion
by the end of 1999, and su¹cient to nance more than six months of
retained imports, compared with US$26.2 billion at the beginning of the
year.
Prospects in the medium term are relatively encouraging. The
economy charted growth of 4.1 percent and 8.1 percent in the second
and third quarters of 1999, respectively, after ve consecutive quarters
of contraction. The improvement began in the rst quarter, when real
GDP contracted by only 1.3 percent compared with more than 10 percentin the second half of 1998.
Although exports were the principal engine of growth, consumer
and investor spending recorded a turnaround, which helped to end the
recession. Consumer and investor condence improved gradually with
the return of stability in the local nancial markets.
The further improvement in macroeconomic fundamentals and the
accelerating momentum in domestic spending were expected to see real
GDP growth rising to up to 7 percent in 2000, accompanied by moder-
ate ination of about 3 percent.Meanwhile, the current account of the balance of payments was
expected to remain in surplus for the third successive year, although at a
lower level of RM32 billion, or 10.8 percent of GNP, following rising
imports of intermediate and capital goods during economic recovery.

8/8/2019 Chap09_MAL
http://slidepdf.com/reader/full/chap09mal 17/70
376 Government Bond Market Development in Asia
Along with bigger DI inows, particularly to the manufacturing sector,
and some o¹cial borrowings, this would make the external reserves po-sition of BNM comfortable. With the economy still in the recovery phase,
interest rates were expected to be kept at the present low levels in the
current year.
On the exchange rate front, the Government is expected to retain
the prevailing exchange rate of RM3.8 to US$1 until the economy has
fully recovered and the external payments balance remains in a funda-
mentally strong position for some length of time.
D Monetary Policy Tools
The principal objective of BNMs monetary policy is to promote a
sustainable rate of output growth, consistent with domestic price and
exchange rate stability. BNM ensures that growth in bank credit and
money supply is adequate to fuel real growth without causing ination-
ary pressures. To regulate money supply and bank credit, BNM employs
qualitative and quantitative monetary policy instruments, depending on
prevailing circumstances.
The Central Banks own securities, Bank Negara bills (BNBs), areissued as a monetary tool for OMO purposes, i.e. to control excess li-
quidity in the system and meet nancial institutions liquidity reserve
requirements. Currently, however, there are no more BNBs in the nan-
cial system, as BNM relies more on direct money borrowing to mop up
surplus liquidity.
E Impact of Monetary Policy on the Bond Market
Changes in monetary policy have a major impact on the bondmarket, as any increase in market interest rates (tightening of monetary
policy) leads to a decline in the value of bonds and other xed-income
securities. Conversely, if market interest rates decline, the value of these
securities will rise.
Lack of information unfortunately prevents any quantitative evalu-
ation of the impact of monetary policy on the Malaysian bond market
during the study period. The impact can be illustrated to some extent,
however, by two turbulent periods when interest rates moved drastically;
the rst from 1983 to 1985, when the base lending rate rose to a high of 11.25 percent, and the second in 1998, when rates were brought down
from above 12 percent to the present levels of 6.8 percent. On the rst
occasion, bondholders (banks, merchant banks, and discount houses) were
hit hard by substantial capital losses, while the 1998 event beneted

8/8/2019 Chap09_MAL
http://slidepdf.com/reader/full/chap09mal 18/70
Malaysia 377
TABLE 4
Monetary Policy Instruments
Instruments Advantages Disadvantages
Direct Borrowing/Lending
Open Market Operations(OMO) (discount windowfacility)
Reserve Requirement
Centralization of Depositsof ederal Governmentand Employees Providentund with Bank NegaraMalaysia
Selective Credit andAdministrative Measures
Banks unable to transactin secondary market inmanaging their liquidity.
Dependent on the supplyof government papers.
Ine¬ective if liquidity isunevenly distributedamong banks. A high
requirement imposes coston bank intermediationand could lead to awidening of spreadsbetween lending anddeposit rates.Not convenient forshort-term liquiditymanagement, as frequentchanges disrupt portfoliomanagement.
Not convenient for preciseliquidity management aswithdrawal decisions aremade independently tomeet respective nancingneeds.
If implemented over aprotracted period, maya¬ect e¹cient allocation of resources.
Useful in circumstanceswhere OMO areconstrained by the lack of papers. Can enhanceannouncement e¬ect of policy rate throughregular tender process.lexible in terms of
maturity, amount, ratetiming, depending onliquidity condition.
lexible in varyingmaturity, amount, rate,timing, depending onliquidity condition.
More useful in one-o¬ sterilization of excessliquidity. Act as bu¬er to
reduce volatility in theshort-term interest ratecaused by externalshocks.
Ensure consistency inoperations of theGovernment and the EPwith monetary policystance. Reduce liquidity atsource.
Direct impact on lendingactivities of banks. Willnot a¬ect overall liquidityand interest rates.
Source: The Central Bank and the Malaysian inancial SystemBank Negara Malaysia.

8/8/2019 Chap09_MAL
http://slidepdf.com/reader/full/chap09mal 19/70
378 Government Bond Market Development in Asia
many nancial institutions, many of whose treasuries reported substan-
tial prots, realized and unrealized, from their bond holdings.A potentially important impact of monetary policy is in the rela-
tionship between the stock and bond markets. Higher interest rates
(exceeding 10 percent, for example) can be bad for stock prices because
bonds and other xed-income investments become more attractive, lur-
ing money out of stocks and into bonds. On the other hand, lower interest
rates, such as those currently prevailing, should be favorable for stock
prices because stocks become relatively more attractive than bonds or
savings deposits. See igure 4 below.
11.00 1400
1200
1000
800
600
400
200
10 .00
9.00
8.00
7.00
6.00
5.00
4.00
3.00
2.00’91 ’92 ’93 ’94 ’95 ’96 ’97 ’98 ’99
3-M Interbank
KLCI
3-Month Interbank Rate (%) KL Composite Index
III Overview of the Bond Market
The Malaysian bond market is the second largest among the crisis
economies after the Republic of Koreas, but is small in comparison with
developed countries. As of 30 September 1999, the market comprised
total outstanding domestic debt of US$21.7 billion. The maturity distri-bution was 50.4 percent ve to 10 years, 26.6 percent one to ve years,
23 percent 10 to 30 years, and the remainder less than one year.
The bond market comprises both government bonds and PDS. Debt
issues by government agencies dominate the market (42.6 percent), followed
.IGURE 4
Interest Rate and Stock Prices

8/8/2019 Chap09_MAL
http://slidepdf.com/reader/full/chap09mal 20/70
Malaysia 379
by Treasury bonds (38.9 percent), and Treasury-bills (5.4 percent). Cor-
porate issues account for only 14.1 percent.There is a primary (new issue) as well as a secondary market for
both government bonds and PDS. Until 1990, the primary market was
dominated by government issues, which were o¬ered primarily to insti-
tutional investors, notably the EP and insurance companies, to full
their investment needs. Government issues, needless to say, were also
made to nance budget decits and the escalating development expen-
diture undertaken to promote economic development.
Historically, MGS were issued to meet the investment needs of the
EP, but were later extended to fund budget decits, in part reectingincreasing public development expenditure. Satisfying these two needs
drove public debt continuously upwards, with outstanding MGS rising to
RM67.01 billion in 1998 and RM78.33 billion in 1999, which is not very
large compared with recent transactions on the Malaysian equities market.
In many developed countries, bond issuance represents more than
90 percent of the countrys GDP. Issuance in Malaysia is small by com-
parison, representing only about 55 percent of GDP, but the volume of
growth has been phenomenal, with both the Government and Malaysian
businesses turning to the market to raise their funding requirements.
TABLE 5
Outstanding Public and Private Debt Securities
(RM billion)
Government Bonds Private Bonds
Year MGS GICs MSB Subtotal Debt Cagamas Subtotal Totaland KBs Securities
1991 65.3 1.0 0.0 66.3 5.3 3.9 9.2 75.41992 66.6 4.0 1.4 69.0 7.2 4.3 11.5 80.51993 66.0 2.0 1.2 69.2 10.0 5.0 15.0 84.21994 65.0 4.8 1.2 70.9 15.1 8.9 24.1 95.01995 64.7 5.1 1.1 70.9 22.7 9.3 32.0 102.91996 66.9 4.2 1.1 72.2 33.5 13.2 46.8 118.91997 66.3 2.8 1.9 70.9 46.6 16.8 63.4 134.31998 75.0 2.0 18.5 95.5 46.8 15.1 61.9 157.3
Source: Bank Negara Malaysia.
The majority of growth occurred because of privatization by theGovernment of major infrastructure projects, however, with the funding
requirements of the economy and Malaysian corporate sector having
largely been addressed by the banking sector.

8/8/2019 Chap09_MAL
http://slidepdf.com/reader/full/chap09mal 21/70
380 Government Bond Market Development in Asia
The Asian nancial crisis showed only too well the vulnerabilities
of a system that has large funding mismatches, and where long-termrequirements have been met by short-term borrowings. This points to the
need to develop an e¹cient bond market, which could o¬er companies
an alternative source of nancing, thus providing exibility for long-
term projects to be funded at a xed rate. This would also pave the way
for the creation/development of new nancial instruments that would
help companies to manage their portfolios better. rom the investors
standpoint, too, bonds are an alternative instrument to lodge their sav-
ings. rom the national viewpoint, a bond market would help to mobilize
savings, improve the breadth of the market to include more than justequities, and reduce heavy reliance on bank borrowing, thus allowing
for more sustainable economic growth.
A Secondary Market
The secondary market for bonds in Malaysia is not as well-devel-
oped as the primary market. Not many issues are traded, and information
on daily volume and prices is not readily available as compared, for
example, with equity trading. This is mainly due to the fact that thesecondary trading of Malaysian bonds is essentially undertaken OTC
and not in an organized exchange, although a few corporate bonds are
traded on the KLSE.
Trading volume in MGS averaged RM4.9 billion per month in
1999, which is not very large compared with recent transactions in the
Malaysian equities market. Table 6 shows the volume of transaction in
the interbank money market.
TABLE 6Volume of Transaction in the Interbank Money Market
(RM billion)
Inter Money Market Instrument
Year Total bank Sub-MGS
Khazanah CagamasMTBs
BN CagamasNIDs BAsDeposits
total Bonds Bonds Bills Notes
1994 912.4 805.1 107.3 10.9 0.0 8.6 3.6 5.7 0.0 37.6 41.01995 885.0 742.7 142.4 3.8 0.0 16.2 3.8 12.4 0.0 43.4 62.91996 1,155.8 973.5 182.3 25.4 0.0 2.5 2.8 14.1 1.7 54.8 81.0
1997 1,860.6 1,673.6 187.0 12.4 0.0 3.7 4.3 12.4 12.6 56.4 85.21998 1,824.0 1,650.7 173.3 27.3 1.4 2.4 6.7 0.0 13.1 43.1 79.31999 1,386.2 1,189.3 196.9 54.3 5.1 9.5 8.9 0.0 23.9 27.2 67.9
Source: Bank Negara Malaysia.

8/8/2019 Chap09_MAL
http://slidepdf.com/reader/full/chap09mal 22/70
Malaysia 381
In terms of composition, the MGS accounted for more than half
(approximately 54.2 percent) of the total volume of bonds traded in1998, while Cagamas (the National Mortgage Corporation) bonds and
notes, and Khazanah bonds (fully government-guaranteed bonds issued
for the purpose of establishing a benchmark for the corporate market)
accounted for 30.1 percent and 9.9 percent, respectively.
actors limiting the take-o¬ of the secondary market include the
distortions caused by dealers in MGS not being required to market their
stocks, thus contributing to illiquidity (when they decide to hold on to
loss-making positions instead of selling them). Additional problems are
limited and irregular supply of issues, and the phenomenon of the cap-tive market, which is a deterrent to the emergence of a true yield curve,
currently remains skewed to the lower side.
These problems may be resolved, however, since there has been a
recent increase in government bond issues, which now exceed corporate
debt securities. This is the result of the Governments e¬orts to spur
economic recovery activities, and because the corporate sector has expe-
rienced problems in meeting debt obligations in the aftermath of the
Asian crisis, or is in the midst of restructuring. Institutional investors,
wary of corporate credit risks, also have an appetite for governmentsecurities as these carry no risk of default.
To truly promote the market, however, it is crucial that the Govern-
ment securities take on the role of benchmarker for the market. A regular,
predictable issuance schedule is needed for a whole spectrum of maturi-
ties. The securities should be actively traded, very liquid, and responsive
to market conditions, and carry a risk that is stable, predictable, and
easily assessable. With the purpose of assisting in the assessment of the
prevailing interest rate structure, the securities should demonstrate the
true underlying interest rate (based on market expectations of futureinterest rate movements and ination risk premia). Having a reliable
benchmark, the corporate bond market would be able to come out with
an array of its own issues, risk premia based on how they rank against
government securities, and eventually ourish.
B Corporate .unding Behavior and the Corporate Market
Private borrowers were heavily reliant on bank nance until 1993,
with external nancing (bank borrowing and bond issues), representingmore than 70 percent of funds raised by Malaysian corporations. The
remainder was sourced by issuing shares in the capital market.
The corporate bond market, which involves the issuance of PDS by
the Malaysian corporate sector, really made its debut with the establishment

8/8/2019 Chap09_MAL
http://slidepdf.com/reader/full/chap09mal 23/70
382 Government Bond Market Development in Asia
of the National Mortgage Corporation, Cagamas Berhad, in December
1986. Cagamas was incorporated with the primary aim of developing a
secondary mortgage market to assist banking institutions in need of li-
quidity or funding to nd renancing for their mortgage loans. With
corporate expansion reducing sharply, demand for funds came more from
the issuance of bonds and shares. With many issues providing attractive
yields and default guarantees, the bond market attracted increased insti-
tutional demand, including foreign demand, giving a strong impetus tothe growth of the PDS market in the 1990s.
Bond nancing may also be preferred over equity nancing for
fast-growing rms, as bonds enable owners to retain control over invest-
ment decisions. Problems include the lack of transparency and information,
which hinders retail demand for bonds. In addition, the relatively small
issue size tends to raise transaction costs, which discourages secondary
market trading. Secondary market turnover is also low due to the large
number of bonds held to maturity by large nonbank investors such as
the EP and the Social Security Organization (SOCSO).However, given the increase in corporate credit risks in current
market conditions, with investors wary of corporate defaults, trading
volumes for the MGS have been high, with the trading of listed corpo-
rate bonds being considerably reduced. There has also been a sharp fall
60
50
40
30
20
10
0
–101989 1990 1991 1992 1993 1994 1995 1996 1997 1998 1989
Year
R M B
i l l i o n
Bank Borrowings Equity Bonds
.IGURE 5
Capital Structure of Malaysian Corporations(RM billion)
Note: igures for equity and bonds are new issues, and gures for bank borrowingrepresent net changes.Source: Bank Negara Malaysia.

8/8/2019 Chap09_MAL
http://slidepdf.com/reader/full/chap09mal 24/70
Malaysia 383
in the issuance of PDS by the Malaysian corporate sector, exacerbated
by reduced investment spending and uncertain investor interest.
C .uture Development of the Bond Market
Increasingly, development of the corporate bond market is recog-
nized as the way forward for both business and investors. This market
will play an important role in the next phase of Malaysias develop-
ment. There is a need to develop a bond market that is e¹cient and has
depth and breadth.
Essentially, a developed bond market will o¬er companies an al-ternative source of nancing, providing exibility for long-term projects
to be funded by long-term funds, and create an opportunity for Malay-
sian corporations to manage their capital structure more optimally.
rom the investors viewpoint, bond issuance will be an alternative
form of investment, assist with diversication of opportunities, and help
to mobilize savings towards a more e¹cient allocation of resources.
Hopefully, it will also lead to the development of a secondary market
that allows bondholders to trade and make bond instruments marketable
and liquid, similar to equity stocks.Recent measures taken by the authorities to develop the bond market
appear to have focused on the primary market, especially for corporate
issuers, with lesser priority given to secondary trading. Areas to be ad-
dressed mainly relate to market demand, such as irregularity of bond
o¬erings, unattractive coupons, and relatively large denominations for
retail investments for government bonds. or corporate issues, there is
the additional problem of delays, and complex and costly procedures to
be met before o¬erings are made. Unless these issues are adequately
addressed, the potential growth of the market as an increasing and im-portant channel for raising capital funds by corporations will not be
maximized.
D Types of Securities
1 Government Market
Malaysian Government Securities (MGS) The social security and in-
surance institutions hold more than half the total outstanding MGS. Bankinginstitutions are the second major player, while a small percentage is
shared between public enterprises, nonbank nancial institutions, and
foreign investors.
MGS are medium- to long-term xed-rate securities issued by the

8/8/2019 Chap09_MAL
http://slidepdf.com/reader/full/chap09mal 25/70
384 Government Bond Market Development in Asia
Government for the nancing of public sector development. They are
issued in Malaysian ringgit and carry a minimum denomination of RM1,000.
Prior to 1989, bonds were issued at par with a predetermined coupon
on a subscription basis to selected institutional investors. This meant
very little secondary trading, as the bulk of the issue was locked up
until maturity, despite being held in excess of the minimum statutory
requirements of these investors.
In recognition of the need for an active secondary market for gov-
ernment securities, the issues were opened to competitive tender, with
the coupon determined as the weighted average of the successful tenderyields. This system only extended to issues of maturity up to 10 years.
Issues with maturity exceeding 10 years are issued at par with market-
determined coupon rates to selected institutional investors such as the
EP, the SOCSO and National Savings Bank (NSB).
The tenors for bond issues are 3, 5, 7, 10, 15, and 20 years. The
frequency and size of issues may vary depending on the Governments
funding requirements and the need to replace maturing issues for the
benet of investors. Hence, the frequency has ranged from one issue in
1993 to six issues in 1998, which included two closed issues to the EPtotaling RM6 billion. This brought the total MGS issuance for 1998 to
RM14.95 billion, in line with the funding requirements of the Govern-
ment in response to the nancial crisis (RM10 billion in 1999).
Malaysian Treasury Bills (MTBs) These are sold by BNM on behalf
of the Treasury and are used for OMO. The standard tenors of issuance
are 3, 6, and 12 months, and do not extend beyond one year. They are
sold on a simple discount basis and issued with a regular schedule;
three- and six-month MTB issues are alternated with 12 month MTBs ona weekly basis. Each issue size ranges from RM80 million to RM100
million, and they are generally sold to replace maturities of the same
tenor to fund the Governments working capital, hence the schedule.
Total MTB issuance is approximately RM4.3 billion. They are also is-
sued in ringgit, with a minimum denomination of RM1,000.
Bank Negara Bills (BNBs) BNBs were rst issued in ebruary 1993
for the purpose of OMO, to control excess liquidity in the system and to
meet the liquidity reserve requirements of nancial institutions. The originaltenors are the same as MTBs but are in larger amounts, ranging from
RM500 million to RM1 billion. There are currently no more BNBs in
the system.

8/8/2019 Chap09_MAL
http://slidepdf.com/reader/full/chap09mal 26/70
Malaysia 385
Government Investment Certicates (GICs) The development of the
Islamic money and bond market in the mid-1980s was accompanied bythe establishment of the Government Investment Act 1983, which em-
powers the Government to issue negotiable instruments based on Islamic
principles, known as GICs. Issuances of GICs are much smaller than
MGS and MTBs. The bulk is held by Bank Islam Malaysia Berhad, a
fully dedicated Islamic banking institution established in 1983 with the
commencement of Islamic banking in Malaysia.
2 Corporate and Semigovernment Market
PDS Domestic Malaysian corporations issue corporate bonds. The original
amount issued ranges from RM10 million to RM1.5 billion. However,
most bonds are issued in amounts less than RM1 billion. Most corporate
bonds are redeemable, with warrants attached, and carry either a xed or
oating rate coupon.
Cagamas . Cagamas is presently the largest single issuer of PDS in the
country and ranks only after the Government in terms of total volume of
debt securities issued. It started o¬ issuing only one type of PDS, namelyxed rate bonds. Today, debt papers issued include oating rate bonds,
short-term discount notes, and Islamic bonds.
Khazanah Bonds Khazanah Nasional Berhad is wholly owned by the
Minister of inance Inc., and incorporated under the Companies Act
1965. Khazanah has been selected to issue from time to time various
series of Khazanah zero-coupon benchmark bonds based on the Islamic
Murabahah concept.
The bonds are fully guaranteed by the Government, so their priceis widely used as a guide to price corporate bonds to reect their respec-
tive risks. In essence, the bond issues by Khazanah are primarily aimed
at setting a benchmark yield curve for the corporate bond market.
The tenors of the bonds alternate between 3, 5, 7 and 10 years and
follow a quarterly issuance schedule on 18 March, 18 June, 18 Septem-
ber and 18 December. Khazanah bonds are fully underwritten by the
principal dealers and tendered through the ully Automated System for
Trading (AST).
Khazanah makes four issues a year, at intervals of three months.The rst issue was made in September 1997. However, in 1998, six new
bond issues were raised by Khazanah, amounting to RM14.95 billion, of
which two, totaling RM6.0 billion, were privately placed with EP. In
1999, there were four issues totaling RM4.13 billion.
8/8/2019 Chap09_MAL
http://slidepdf.com/reader/full/chap09mal 27/70
386 Government Bond Market Development in Asia
Khazanah has the right to retain up to 50 percent of the amount of
oversubscription and reduce the issue amount by no less than 10 per-cent of the o¬er amount. The bonds qualify as Class 1 Liqueable Assets
under the New Liquidity ramework (NL) for nancial institutions and
Low Risk Assets for insurance companies. They carry a zero risk weight
for capital requirement purposes and are tradable among institutions listed
under Section 47B(1) of the Companies Act 1965. They are exempt from
rating on account of the government guarantee. The proceeds from the
issues will be invested in a portfolio of PDS, money market instruments,
equities, and other investments approved by Khazanah. By 11 January
2000 there was approximately RM8.78 billion in bond outstanding.
Danamodal Bonds In August 1998, Danamodal Nasional Berhad was
set up to undertake the task of recapitalization of nancial institutions
and to serve as a catalyst for restructuring the banking sector. Danamodal
is 100 percent owned by BNM, which accords it an implicit government
guarantee. To fund the recapitalization program, Danamodal issued a
RM11 billion nominal amount of ve-year zero coupon redeemable un-
secured bonds. These were subsequently allocated to all 57 banking
institutions in the Malaysian banking sector in proportion to the fundseach institution received from the two percentage points reduction in
statutory reserve requirement (SRR) to 4 percent, introduced on 16 Sep-
tember 1998. This raised approximately RM7.7 billion in proceeds on
21 October 1998, when the bonds were issued at the then prevailing
ve-year MGS yield.
These bonds were accorded Liquid Asset and Class 1 Liqueable
Asset (under the NL) status for nancial institutions and Low Risk
Asset status for insurance companies. The bonds are assigned a zero risk
weight for capital requirement purposes and are available for discount-ing with BNM as lender of last resort. In addition, these bonds are tradable
among institutions listed under Section 47B(1) of the Companies Act
1965 and exempted from the 25 percent Single Customer Limit under
Section 61 of the Banking and inancial Institutions Act 1989. The
bonds are not rated.
Danamodal has the right to extend the maturity date of the bonds
upon maturity for a further period of between one and ve years. The
repricing will be at 50 basis points above the benchmark ve-year MGS
yield at the time.
Danaharta Bonds In June 1998 Pengurusan Danaharta Nasional Berhad
was set up to act as the National Asset Management Company to acquire
NPLs from the banking sector and to maximize their recovery value.

8/8/2019 Chap09_MAL
http://slidepdf.com/reader/full/chap09mal 28/70
Malaysia 387
Danaharta is a public company incorporated under the Companies Act
1965, and fully owned by the Minister of inance Inc.Danaharta bonds are issued as consideration for the NPLs it pur-
chases from any nancial institution. The bond program is constituted
by an issuance framework of up to RM15 billion nominal amount of
ve-year government-guaranteed zero coupon redeemable bonds. The price
of each new issue is pegged against the ve-year rate of the most re-
cently issued MGS. As at 11 January 2000, there was approximately
RM10.3 billion nominal amount in bond outstanding.
These bonds were accorded Liquid Asset and Class 1 Liqueable
Asset (under the NL) status for nancial institutions and Low Risk Asset status for insurance companies. Being government-guaranteed, the
bonds carry a zero risk weight for capital requirement purposes and are
available for discounting with BNM as lender of last resort. The bonds
are tradable among institutions listed under Section 47B(1) of the Com-
panies Act 1965 and exempt from rating. Danaharta has the option of
extending the maturity of the bonds for an additional period of one,
three, or ve years at the benchmark MGS yields at the point of extension.
E Investor Base
1 Institutional Investors
The investor base in the Malaysian bond market is mainly com-
prised of banks and asset and pension funds.
Certain institutional investors are required by statute to invest a
portion of their total funds in government securities (designated as liquid
assets) to support the Governments development nancing needs. or
example, provident and pension funds are required to invest a minimumof 50 percent of their total investible funds in such securities. The largest
of these is the EP which was rst established under the Employee Provident
unds Ordinance 1951 and reenacted under the EP Act 1991.
Besides pension funds, insurance companies, by virtue of the In-
surance Act 1963, must invest at least 25 percent of their total insurance
funds in a category of assets known as low-risk assets. This was tradi-
tionally made up of government securities, but with the reduction in
government expenditure, and thus issuances, this has been expanded to
cover Cagamas debt securities and government-guaranteed bonds. None-theless, the demand generated by this requirement has largely consumed
the bulk of the supply of securities, such as MGS, eligible for this purpose.
The requirement has many advantages for the economy, rstly
providing an avenue by which to raise funds at xed rates cheaply for

8/8/2019 Chap09_MAL
http://slidepdf.com/reader/full/chap09mal 29/70
388 Government Bond Market Development in Asia
the countrys development nancing needs. The required funds can also
be speedily raised as the bonds, being fully underwritten by a panel of appointed PDs, can be brought to the market within a short time.
The present framework also allows the Government exibility in
structuring the maturity prole of its debts, allowing it to match the
tenor of its nancing needs, especially for long-term infrastructure de-
velopment projects.
The issuance of government bonds through the BNM provides the
bank with an e¬ective tool in its implementation of monetary policies,
allowing it to manage the level of market liquidity, thereby inuencing
and setting the level of interest rates.It also provides a safety net in case of unexpected demands for
liquidity, giving depositors some protection of their monies, and in-
creases condence in the banking institutions. In the event of a run on
liquidity, the bonds can be easily disposed of in the open market, due to
their high marketability and liquidity, or by way of access to the BNM,
as lender of last resort, to be sold or pledged as collateral for liquidity
support.
The availability of a wide-term structure of government bonds also
provides attractive credit risk-free investment opportunities for investors,such as pension and insurance fund managers, particularly given the
glaring lack of long-term interest rate products in the Malaysian market.
Yields on such bonds also o¬er a reasonable return over the average
ination rate.
Providing a stable subscription base, and thereby ensuring a de-
gree of liquidity for these bonds in the interbank market, serves to provide
a market-determined yield on sovereign bonds, which are credit-risk free.
This acts as a benchmark for the pricing of other debt issues, as traders
and investors need only focus on quantifying the credit risk premia onthose issues.
Disadvantages The mandatory requirement to hold government bonds
has resulted in a captive market for the bonds, creating articial demand
that distorts yields. Yields may therefore not be truly reective of the
level of interest rates and market returns. This further discourages inde-
pendent assessment of other available investment opportunities.
These bonds are inevitably locked up and held until maturity, es-
pecially by the pension funds. This has inadvertently promoted passiveportfolio management, and discourages analysis of returns and trading
due to the need to obtain equivalent replacement investments if any are
disposed. This further leads to the lack of development of a secondary
market. In the absence of an e¬ective hedging instrument, e.g. government

8/8/2019 Chap09_MAL
http://slidepdf.com/reader/full/chap09mal 30/70
Malaysia 389
bond futures contracts, this passive portfolio management may also lead
to a higher risk prole of the mandatory holders of the bonds.urthermore, if the balance of supply and demand is not carefully
maintained, this may cause false or adverse movements in yields, irre-
spective of fundamental macroeconomic conditions. As a benchmark,
this may widen or narrow the spread on corporate debt, despite there
being no change in the underlying credit prole.
2 Retail Investors
The current framework has created the dominance of the govern-ment bond market by the nancial institutions and large pension funds,
and each issue seems to cater only for the wholesale market, thus ignor-
ing the needs of retail investors in search of secure long-term
investmentseven though the minimum denomination for government
bonds is set at RM1,000.00.
IV Infrastructure of the Bond Market
A Primary Dealer System
The backbone of the MGS market is the system of primary dealers
(PDs), rst introduced in 1988. These are appointed by BNM to bid at
primary auctions of designated benchmark securities, namely MGS, MTBs,
Cagamas securities, Khazanah bonds, and BNM bills. They also play an
important role in the secondary market. They are obliged not only to
quote two-way prices for these benchmark securities but also to bid on
behalf of third parties at primary auctions. or each third party, each PD
is required to bid a minimum of 10 percent and a maximum of 30 per-cent of the original issue size. urthermore, a PD can only accept a
maximum tender bid from each third party of 30 percent of the original
issue size.
The benchmark securities, which PDs are obliged to make markets
for, are currently determined as the four most recent issues of MGS, the
three most recent issues of Khazanah and Cagamas bonds, and the 3-, 6-,
and 12-month MTBs. The 3-, 6-, and 12-month BNM bills are also des-
ignated benchmarks, but there have not been any outstanding issues
since 1997 due to the developing liquidity crises in the country. The 14PDs appointed for 1999 comprise seven commercial banks, four merchant
banks, and three discount houses. PD status is reviewed yearly and is
based on an institutions participation in the government securities market.
Apart from the PDs, the Malaysian debt market recognizes approved

8/8/2019 Chap09_MAL
http://slidepdf.com/reader/full/chap09mal 31/70
390 Government Bond Market Development in Asia
dealers, which are also market makers in all securities traded within the
Scriptless Securities Trading System (SSTS). Unlike PDs, however, ap-proved dealers are not obliged to provide two-way quotes at all times.
B Issuance Methods and Procedures
The responsibility for issuing government bonds lies with BNM,
one of the ve statutory bodies under the Ministry of inance (MO). As
the Central Bank, BNM is vested with comprehensive legal powers to
regulate and supervise the nancial system of the country, as well as to
promote monetary stability and a sound nancial infrastructure.T-bills are issued through competitive biweekly auctions, while
MGS are issued through competitive auctions on an irregular basis. Only
PDs that are discount houses are eligible to tender for T-bills and MGS.
However, PDs that are not discount houses may tender for MGS with
maturity up to 10 years. MGS with maturity longer than 10 years are
allocated to advance subscribers. Auctions for T-bills are announced one
week beforehand and held a day before they are issued. Auction time
and date for MGS are only known upon announcement of new issues.
BNM, acting on behalf of the Government, announces the terms of the issue and interested parties submit bids for the entire issue. Com-
petitive bids must be submitted on a yield basis.
BNM, however, has the discretion to upsize or downsize the origi-
nal issue amount by 25 percent. BNM announces its intention to issue
the bonds at least seven days in advance of the issue date through both
AST and a leading daily national newspaper. The announcement also
appears on news services like Reuters and Bloomberg for dissemination
to professional investors. The information conveyed in this announce-
ment covers the basic details, such as issue amount, tenor, issue, andmaturity dates.
All new government bonds are issued scriptless, i.e. in the form of
book entries, located in an automated book-entry system operated by
BNM. Book entry securities are easier to trade than physical securities.
Corporate bonds are usually lead-managed and underwritten, while
Danaharta bonds are o¬ered direct to nancial institutions in exchange
for NPLs. The date and timing of the auction for Cagamas notes and
bonds are only known upon announcement of new issues. Like govern-
ment securities, Cagamas securities are auctioned through the SSTS systemand the Inter-Bank unds Transfer System (ITS). Khazanah bonds are
o¬ered through tenders to PDs, who bid competitively on a price basis.
Auctions for these bonds are submitted through AST, and in accordance
with the rules on AST for SSTS securities.

8/8/2019 Chap09_MAL
http://slidepdf.com/reader/full/chap09mal 32/70

8/8/2019 Chap09_MAL
http://slidepdf.com/reader/full/chap09mal 33/70
392 Government Bond Market Development in Asia
average, and highest successful rates. The average rate becomes the cou-
pon rate for the issue along the lines of a Dutch auction. Settlementtakes place on the next working day. Standard settlement for WI trades
take place one day after the issue date. Once this process is complete,
secondary trading can commence.
D Secondary Market Trading System
The OTC market is operated by security dealers (including primary
dealers given specic approval and obligations by BNM), who are linked
by telephone and electronic information systems. This trading system isno di¬erent from the OTC market in the US. As can be expected in a
dealer market, the dealers are market-makers, providing quotes (bid and
ask prices) to buyers, and standing ready to buy and sell at the quoted
prices. Some of the dealers are major commercial banks, merchant banks,
broking houses, and discount houses.
The market is not large, and trading volume , even on a yearly
basis ranged from only RM3.8 billion in 1995 to RM53 billion from
January to November 1999. The market is fairly liquid (although bid
and ask spread can sometimes be large) but not deep, with trades averagingabout RM100 million to RM200 million daily. The market is centered
in Kuala Lumpur and the principal participants are the dealers and brokers.
Dealers, as the market makers for MGS, must take a position in
securities, always carrying an inventory of MGS. Some transactions are
completed through brokers who, unlike dealers, never take a position in
securities. There are eight MGS brokers operating in Kuala Lumpur at
present. As in other markets, brokers merely bring together buyers and
sellers, and provide anonymity to trade. Since 1997, the trading system
has been aided by BIDS.
E Exchange Trading
Kuala Lumpur Stock Exchange (KLSE) was formed in 1973 and has
had fully computerized trading from 1992. Equity securities are traded
on the exchange, as well as warrants and bonds. As of 31 May 1999, the
exchange quotes 12 corporate bonds.
Malaysia Exchange of Securities Dealing and Automated Quotation(MESDAQ) commenced operations on 30 April 1999. It is expected to
function similarly to NASDAQ in the US, creating an equity market to
fund the development of technology-based, high-growth companies. This
exchange imposes less stringent admission criteria than the KLSE.

8/8/2019 Chap09_MAL
http://slidepdf.com/reader/full/chap09mal 34/70
Malaysia 393
Kuala Lumpur Options and .inancial .utures Exchange (KLO..E) was
formed on 15 December 1995. It provides a range of futures and optionsproducts (derivatives), which are available to both domestic and foreign
players in the Malaysian capital market as part of their risk management
activities. Membership and trading practices are governed by the ex-
change itself. Contracts traded on the exchange are cleared by the
Malaysian Derivatives Clearing House Berhad (MDCH).
Commodity and Monetary Exchange of Malaysia (COMMEX Malaysia)
previously the Kuala Lumpur Commodity Exchange, commenced opera-
tions in July 1980. It provides a market for trading in futures contract.The exchange exercises an open outcry trading method. The prices trans-
acted are captured on a real time basis and disseminated to users via
wire services and information agencies, such as Reuters.
. Interbank Market
BNM has authorized selected exempt dealers to participate in the
broad Malaysian securities market, mainly in nonequity related xed-
rate instruments. This market is an interbank market, whose participantsare those exempt dealers who deal on live prices broadcast by money
market and foreign exchange brokers. Exempt dealers are dened as those
who can undertake third party trades on behalf of customers.
G Other .eatures of Bond Market Infrastructure
1 Benchmark Yield Curve
Government securities typically perform an important role in acountrys capital market. They provide the basis for which the yield
curve (or the term structure of interest rates) is constructed. Yield curves
are often constituted from observations of prices and yields in the govern-
ment securities market. Several reasons account for this tendency. irst,
government securities are free of default risk, and second, this market
tends to give fewer problems of illiquidity and infrequent trading.
A government securities market yield curve clearly also functions
as a benchmark for pricing bonds and setting yields in other debt markets,
for example for corporate bonds.igure 6 shows the transition of interest rate levels of MGS, using
the 2- and 10-year maturities as a sample. As shown, the levels experi-
enced sudden hikes from October 1997, before gradually coming down
to present levels. igure 4, meanwhile, shows the prevailing MGS yield
curve, which is positive with a attening end at 13 years and above.

8/8/2019 Chap09_MAL
http://slidepdf.com/reader/full/chap09mal 35/70
394 Government Bond Market Development in Asia
D e c . ’ 9 4
D e c . ’ 9 5
F e b . ’ 9 5
A p r . ’ 9 5
J u n . ’ 9 5
A u g . ’ 9 5
O c t . ’ 9 5
F e b . ’ 9 6
A p r . ’ 9 6
J u n . ’ 9 6
A u g . ’ 9 6
O c t . ’ 9 6
D e c . ’ 9 6
F e b . ’ 9 7
A p r . ’ 9 7
J u n . ’ 9 7
A u g . ’ 9 7
O c t . ’ 9 7
D e c . ’ 9 7
F e b . ’ 9 8
A p r . ’ 9 8
J u n . ’ 9 8
A u g . ’ 9 8
O c t . ’ 9 8
D e c . ’ 9 9
F e b . ’ 9 9
A p r . ’ 9 9
J u n . ’ 9 9
A u g . ’ 9 9
O c t . ’ 9 9
D e c . ’ 9 9
9.50
9.00
8.50
8.00
7.50
7.00
6.50
6.00
5.50
5.00
P e r c
e n t
2-Year10-Year
8.00
7.50
7.00
6.50
6.00
5.50
5.00
4.50
4.00
3.50
3.001 2 3 4 5 6 7 8 9 10 11 12 13 14 15 16 17 18 19 20
Tenor Years
P e r c e n t
.IGURE 6
Two-Year and Ten-Year MGS Yield(December 1994 to December 1999)
.IGURE 7
MGS Yield Curve (November 1999)

8/8/2019 Chap09_MAL
http://slidepdf.com/reader/full/chap09mal 36/70
Malaysia 395
In Malaysia, government securities have not proven to be a good
benchmark because of the lack of a regular issuance program. The issu-ance of MGS declined in the past as the government budget moved into
surplus. This led to a disproportionate distribution of maturities com-
pounded by the fact that issues above 10 years are issued via closed
subscription.
urthermore, insurance companies and pension funds are legally
required to invest in these securities. As their funds grow, their require-
ment to purchase government securities increases, and unless the rate of
new issuances keeps pace, this leads to a greater proportion of these
securities being locked up and not traded. Such articial demand dis-torts yields, and discourages independent assessment of other available
investment opportunities.
The absence of an institutionalized securities borrowing and lend-
ing program makes it di¹cult to short sell securities when the interest
rate outlook demands it. This prevents dual-directional trading, creates a
strong buy-side bias for these securities, and also prevents price discov-
ery, as bondholders are forced to hold on to their bonds which are
underwater. This is compounded by the lack of a credible hedging mecha-
nism for bonds.In recognition of the reduced issuance of MGS and their weak-
nesses as a proxy for benchmark securities, the Government decided to
create a benchmark bond program with the issuance of Khazanah bench-
mark bonds in September 1997. Khazanah Nasional Berhad is a privately
incorporated investment holding company of the Government. The bonds
are Islamic, which means they appeal to a wider investor base. They are
also government-guaranteed, and so qualify as risk free. They are zero
coupon to eliminate reinvestment risk and follow a quarterly issuance
schedule covering the entire maturity spectrum of 3, 5, 7, and 10 years.Issue sizes range from RM1 billion to RM2 billion. Like the govern-
ment securities, Khazanah bonds are issued by way of competitive tender
through principal dealers.
Due to their being risk-free, the price of Khazanah bonds is widely
used as a guide to price corporate bonds to reect their respective risks.
In essence, the bond issues by Khazanah are primarily aimed at setting a
benchmark yield curve for the corporate bond market.
To investors and issuers, such benchmarks are an indispensable
guide as indicators of interest rate levels and total returns. In other words,they help to price credit risk which will, in turn, provide for more reec-
tive corporate bond pricing. Consequently, the existence of such a
benchmark will inevitably increase the liquidity of the corporate bond
market.

8/8/2019 Chap09_MAL
http://slidepdf.com/reader/full/chap09mal 37/70
396 Government Bond Market Development in Asia
It can be said that the mandate given to Khazanah reects the
Governments serious e¬orts to establish such a yield curve in the mar-ket. However, after two years of implementation the program has proved
to be unsatisfactory, mainly due to small issue size and general investor
preference for MGS.
2 Tax Treatment
Tax incentives may distort the purchasing and selling decisions of
investors. In this regard, there are tax incentives which allow interest
income from MGS held by corporate investors to be subjected to themarginal corporate tax rate but exempted from individual income tax.
However, nonresident MGS holders are subject to a 15 percent withhold-
ing tax, which dramatically reduces the yield on the bond for a given
price paid. This may make the already low coupon-bearing MGS much
less attractive compared with other quasi-sovereign issues like Khazanah
bonds, which are zero coupons.
3 Credit Rating
The need for a rating agency is a paramount requirement for the
development of the corporate bond market. A rating agency provides a
professional opinion on the credit standing of issuers and the credit risk
of particular issues, based on a set of factors that include the issuers
business fundamentals and credit enhancements, if any. The agency pro-
vides an opinion on the ability and willingness of the issuer to make
full and timely repayments of its nancial obligations.
Presently, there are two credit rating agencies in Malaysia. The
rst is Rating Agency Malaysia Berhad (RAM), established in November1993 and the second is Malaysian Rating Corporation Berhad (MRCB),
set up in September 1996. In May 1992, BNM made it mandatory for all
domestic bonds to be rated, a very important step for the development
of the primary corporate bond market.
4 .inancial Guarantee Insurer
Recently, the Government also proposed the establishment of a
nancial guarantee insurer (GI) for the bond market, in an attempt tocreate an active market with a large pool of issuers, investors, traders,
and nancial intermediaries, and thus contribute to the size and liquid-
ity of the market. The GI will help to provide the issuer of PDS with an
alternative guarantee facility and to enhance its proposed debt issues

8/8/2019 Chap09_MAL
http://slidepdf.com/reader/full/chap09mal 38/70
Malaysia 397
stand-alone rating. Acting as an insurer for the bond issues and a pro-
vider of a form of credit guarantee mechanism, the GI will diversifysome of the credit risk away from the banking system.
5 Transparency of Information
This is critical for the overall growth of the bond market, and an
active secondary market is also highly dependent on the availability of
information to all market participants. To address the information de-
ciency, the BIDS was launched in October 1997. BIDS provides a
comprehensive database on the government and PDS market, and stock and facility information on all ringgit-denominated nonequity linked
debt securities, as well as their last traded prices and volumes.
6 Clearing and Settlement
As with the new issue market, trading in MGS is also scriptless
and electronically driven through the introduction of a computerized
scriptless securities trading system known as the System Pemindahan
Elektronik untuk Dana dan Sekuriti (SPEEDS). Under SPEEDS, trading,registration, and settlement of MGS are automated. The system is com-
prised of ITS and SSTS. The ITS, launched in 1989, enables the
automatic transfer of interbank funds to be made at the end of each
business day.
The SSTS was introduced in December 1990 to accommodate the
electronic settlement of deals between counterparties and the registra-
tion of securities in both the banks and customers accounts. The securities
covered by the SSTS are MGS, MTBs, BNBs, and GICs.
In view of the increasing number of PDS issues, e¬orts were alsodirected towards the development of trading principles and a clearing
and settlement system for them. This led to the introduction of SPEEDS
in January 1990, which made conrmation of trades and settlement of
cash and securities transfers fully automated. In January 1996, the sys-
tem was further upgraded to serve as the central depository and paying
agent for all unlisted bonds.
In enhancing the e¹ciency of the primary market auction of gov-
ernment securities and eliminating potential disputes, the tendering process
of government bonds involving MGS, MTBs, and BNM bills also be-came automated with the implementation of the AST in 1996. This
system was subsequently upgraded in 1997 to include commercial pa-
pers and medium-term notes.
The transparency of information in the bond market is critical to

8/8/2019 Chap09_MAL
http://slidepdf.com/reader/full/chap09mal 39/70
398 Government Bond Market Development in Asia
its overall growth, and an active secondary market is highly dependent
on the availability of information to all market participants. To addressthe information deciency, the BIDS was launched in October 1997. In
July 1999, Real Time Electronic Transfer of unds and Securities (RENTAS)
was introduced to replace SPEEDS, with the purpose of providing a
more e¹cient mechanism for clearing and settlement of debt securities,
with the bonds issued on a scriptless basis.
Settlement of funds and securities occurs on a transaction-by-trans-
action or gross basis, without netting debits against credits as was the
case under SPEEDS. Thus, payments occur on a real-time basis, resulting
in nality of payments (enabling immediate use of funds by the recipi-ents) and the reduction of principal risk associated with the asynchronous
delivery versus payment settlement for securities transactions. RENTAS
provides a link to BIDS.
As government securities are scriptless, they must be lodged with a
custodian known as an authorized depository institution (ADI). An ADI
maintains two securities accounts with BNM within the RENTAS sys-
temits own securities account and an aggregate customer account for
securities held on behalf of its clients. An ADI is entrusted to record the
holdings and transactions of its customers and to issue to them periodicstatements listing their holdings of scriptless securities. ADIs have the
responsibility of collecting interest payments and redemption monies on
their customers behalf. All interbank participants are qualied to act as
ADIs.
7 Market Conventions
or all government securities, the conventions are settlement T+1
and for corporate bonds T+7. or all bonds value date is same as settle-ment and day count basis actual/365.
V Regulatory Structure
Debt issues by private limited companies are regulated by the BNM,
while issues by public and listed companies are regulated by the Secu-
rities Commission (SC). In the case of a public issue and listing purpose,
the Registrar of Companies and the KLSE oversee the prospectus, trust
deed, and circular. However, the National Bond Market Committee hasappointed the SC to be the single regulatory body for the supervision
and regulation of the corporate bond market in the future.
The government securities market is governed by a framework of
legal provisions, policies, and administrative guidelines issued by the

8/8/2019 Chap09_MAL
http://slidepdf.com/reader/full/chap09mal 40/70
Malaysia 399
authoritiesprincipally the Government, BNM and, to a lesser extent,
the SC. The relevant pieces of legislation are the Loan (Local) Ordi-nance 1959, the Treasury Bills (Local) Act 1946, and the Government
Investment Act 1983, along with their various amendments.
These pieces of legislation govern the issuance of MGS, MTBs,
and GICs, respectively. They were amended in 1989 to provide for the
issue and transfer of these securities in a scriptless form, in line with the
adoption of the SPEEDS system. They also outline the roles and respon-
sibilities of the various market participants, such as BNM, ADIs, and
customers, in addition to laying out punishments for violations of its
provisions.A large portion of the demand for government securities emanates
from the need for nancial institutions supervised by BNM to maintain
a certain portion of their eligible liabilities base in the form of liquid
assets. Presently, the ratio for commercial banks is 15 percent and 12.5
percent for merchant banks and nance companies. Instruments that qualify
as liquid assets for this purpose are MGS, MTBs, Cagamas debt securi-
ties, and BNBs, among others.
However, in 1999, BNM undertook the staged implementation of
the NL which requires institutions to monitor their liquidity require-ments in the form of the actual maturity distribution of their assets and
liabilities, instead of a static portion of their liabilities invested in liq-
uid assets. This has the impact of altering the demand-supply prole for
government securities, as institutions have the choice of maintaining
their liquidity in the form of cash or securities. urthermore, the securi-
ties eligible for this purpose have been expanded to include PDS and
government-guaranteed bonds.
Certain institutional investors are also required by statute to invest
a portion of their total funds in government securities. or example,provident and pension funds are required to invest a minimum of 50
percent of their total investible funds in such securities. The largest of
these is the EP which was rst established under the Employee Provi-
dent unds Ordinance 1951 and reenacted under the EP Act 1991.
Besides pension funds, insurance companies, by virtue of the In-
surance Act 1963, must invest at least 25 percent of their total insurance
funds in a category of assets known as low-risk assets. This was tradi-
tionally made up of government securities, but with the reduction in
issuances, this has been expanded to cover Cagamas debt securities andgovernment-guaranteed bonds.

8/8/2019 Chap09_MAL
http://slidepdf.com/reader/full/chap09mal 41/70
400 Government Bond Market Development in Asia
Code of Conduct
BNM sets the parameters of the government securities market and
seeks to dictate the functioning of the market via various guidelines and
policies aimed at directing the conduct of dealers and brokers. In addi-
tion, is also sets standards in matters such as trading times, trading amounts,
and settlement procedures, with which to enhance the operational e¹-
ciency of the market.
Over the years, various codes of market practice had been intro-
duced by the Government to further enhance the supervisory framework
for the corporate bond market, such as the Code of Conduct and MarketPractices for Scriptless Trading in the Malaysian Securities Market is-
sued in 1990.
These guidelines were subsequently revised and relaunched in July
1999 as the Code of Conduct and Market Practices for the Bond Mar-
ket. The revised guidelines coincided with the launching of the RENTAS,
a new clearing and settlement system which was recently introduced to
replace the previous computerized scriptless securities trading system
known as SPEEDS. RENTAS provides a link to BIDS. The code e¬ec-
tively covers the issuing procedures for primary issues, interest calculation,secondary trading principles, and the procedures for compensation of
delayed or failed settlements.
BNM also issued The Malaysian Code of Conduct for Principals
and Brokers in the Wholesale Money and oreign Exchange Markets in
1994, to set out the principles and standards to be observed by the
employees of money-broking companies and licensed nancial institu-
tions when dealing in the Malaysian money and foreign exchange wholesale
markets. This code focuses on maintaining high standards of profession-
alism, protecting the credibility of oral contracts, and avoiding mis-understandings and errors due to the reliance on verbal instructions and
agreements.
VI Major Policy Issues and Recommendations
Despite the advances of recent years, still some problems must be
addressed before the ideals of a freely functioning government bond
market can be realized in Malaysia. Major problem areas include:
Tax Disincentive Tax incentives may distort the purchase and selling
decisions of investors. In this regard, there are tax incentives which allow
interest income from MGS held by corporate investors to be subjected to
the marginal corporate tax rate but exempted from individual income

8/8/2019 Chap09_MAL
http://slidepdf.com/reader/full/chap09mal 42/70
Malaysia 401
tax. However, nonresident MGS holders are subject to a 15 percent with-
holding tax, which dramatically reduces the yield on the bond for agiven price paid. This may make the already low coupon-bearing MGS
much less attractive compared with other quasi-sovereign issues like
Khazanah bonds, which are zero coupons.
Interest Rate Incentives/Controls There is little incentive in the way
of interest rates, as the interest rate on MGS of 10 years and below is
determined by competitive bidding. Coupon rates tend to be low so
that, as a source of income, government bonds are unattractive, espe-
cially to retail customers.Where coupon rates are higher than the current yield, the bond
price will be at a premium. This may put o¬ some investors, as the
amortization of the premium will be registered as a loss in their nan-
cial statements. Hence, the preference will be for discount or low-premium
bonds with lower coupon rates.
urthermore, due to the various statutory and liquidity reserve re-
quirements of nancial institutions, it has been too costly for banks to
hold bonds, including MGS. They may su¬er a negative carrying cost,
as their cost of funds, including the cost of complying with these re-quirements, exceeds the yield on the MGS.
Compulsory Subscriptions As highlighted earlier, there are institutional
investors in Malaysia who are required by statute to invest a certain
portion of their investible funds in MGS. Hence, when the maturities of
these issues are not correspondingly replaced with new issues, or when
the requirements of these investors grow drastically due to phenomenal
growth in their assets, this causes demand to drive yields down in an
environment of supply scarcity. This problem becomes particularly pro-nounced when the supply of new MGS issues is neither regular nor
sizeable.
Market Distortions Other distortions exist where dealers in MGS are
not required to market their stocks and may therefore hold on to loss-
making positions instead of selling them in the secondary market. This
contributes to an illiquid secondary market for MGS, especially when
the yield curve has shifted up from a previous level.
The MGS market is primarily a wholesale market with little oppor-tunity for individual and other nonprofessional investors to invest. The
entire infrastructure of the market is suited to wholesale dealers in re-
spect of the size of the denominations, settlement system via interbank
funds transfer, standard dealing amounts of these bonds, and volatility

8/8/2019 Chap09_MAL
http://slidepdf.com/reader/full/chap09mal 43/70
402 Government Bond Market Development in Asia
in their prices. Lack of price volatility is a particular hindrance to a
wider bondholding market and to a more active secondary market.The cumulative e¬ects of these problems is a government bond
market that is often illiquid, and whose trading volume is not continu-
ous and large. This leads to unnecessary volatility in MGS yields and
prices in other markets, whose participants may take the lead from the
MGS market. Where there is no trading, there may be times when prices
do not exist at all, which denies the market the benet of price discov-
ery. This may cause a distortion in the shape of the MGS yield curve,
hindering buying and selling decisions.
The e¬ectiveness of the appointed PDs in the government bondmarket may not be up to expectations. Due in large part to inherent
problems, certain PDs may not fully full their role in making markets
and quoting two-way prices for MGS. A related problem is the uncertain
position of the discount houses, an important segment of the secondary
market, whose future is being reviewed by BNM. There is a proposal to
phase out discount house activity.
The e¬ect of these problems on the corporate bond market is simi-
lar and sometimes even worse. Corporate bond holdings are largely
institutional and secondary trading is limited. The market is neither deepnor liquid.
A Recommendations
Policy recommendations that may enhance the development and
e¹ciency of the government bond market are discussed below, and cover
the needs of both the primary and secondary markets.
.iscal Policy and Management Government bonds are usually issuedto nance budget decits. However, in the event that government bud-
gets are in surplus, it is essential for benchmarking purposes that the
government continues to issue bonds. Issuance should take place on a
regular and predictable schedule, and the size of the issue should be
fairly sizable to prevent any single investor cornering or dominating the
issue.
Interest Rate Policy The issuance of bonds should never be based on
an arbitrarily determined rate, as setting the wrong rate may risk alteringthe yield curve, resulting in the wrong signals being sent to the market
and a misallocation of resources. While the issuance of MGS should
continue to be market-determined, e¬orts should be made to ensure that
any single bidder does not dominate and thus manipulate the rate of the

8/8/2019 Chap09_MAL
http://slidepdf.com/reader/full/chap09mal 44/70
Malaysia 403
issue. This may be achieved by setting single bidder limits per issue.
Alternatively, each issue could cater to a competitive and noncom-petitive mode, where the portion of the issue, subject to the former mode,
would be tendered openly by the designated subscribers. The balance of
the issue could then be subscribed on a noncompetitive basis, with sub-
scribers allocated based on the average price determined by the com-
petitively tendered portion.
In setting the interest rate for bonds, attention should be paid to
interest rate levels as an incentive to a wider market for the government
bonds.
Identication of Instruments for Benchmarking Purposes The Khazanah
Benchmark Bond Program was introduced to compensate for the reduced
issuance of MGS in recent years. After two years of implementation,
however, the program has proved to be unsatisfactory, mainly due to
small issue size and general investor preference for MGS.
It seems advisable to reestablish the MGS purely to full the func-
tion of benchmark bonds instead of introducing a proxy. Investors will
otherwise have to assess the individual credit status of the issuer so
long as it is not a direct government obligation. Even if the proxy issueis enhanced by a government guarantee, some investors would need to
assess the legal aspects of the guarantee.
Legal and Regulatory .ramework The prevailing legal and regulatory
framework appears to be a limiting factor in the development of the
government bond market. E¬orts should be applied to reduce the demand
for MGS solely on account of statutory requirements. This has been
done to a certain extent for insurance companies, which have recently
been permitted to purchase Cagamas debt securities and government-guaranteed bonds, in addition to MGS for their statutory compliance.
The NL is in the process of being implemented for banks. This
obliges them to manage their liquidity more in terms of their asset-
liability mismatch, and is in contrast to the previous policy of requiring
banks to invest in selected government and quasi-government bonds of
an amount proportionate to their eligible liability base. This has, to
some extent, diverted the demand away from MGS.
Similarly, it has recently been decided that the sole task of regu-
lating the corporate bond market be transferred from BNM to the SC.While corporate bond issues will be under the jurisdiction of the SC, it
is anticipated that government bonds will continue to be under the ju-
risdiction of BNM.

8/8/2019 Chap09_MAL
http://slidepdf.com/reader/full/chap09mal 45/70
404 Government Bond Market Development in Asia
Market Demand for Government Bonds Market demand is growing
in line with the Malaysian economys recovery. The issue is one of furthering the growth of the market, and the various recommendations
made earlier in respect of regular and adequate supplies and attractive
interest rates are designed to achieve this purpose.
Modernization of Market Infrastructure and Dealing Systems The
government bond market in Malaysia would be greatly enhanced by the
introduction of mechanisms to allow hedging and short-selling. Any in-
vestment in the cash market should be complemented by the availability
of a dedicated hedging instrument. An exchange-traded MGS futurescontract could help to preserve the portfolio of MGS maintained by
investors, as well as to alter the duration characteristics of the portfolio
where desired. Such a contract would aid price determination and serve
as an additional signaling mechanism for the cash market. Trading ac-
tivity on that contract would greatly promote liquidity in the cash market,
as traders would simultaneously lubricate both markets through arbi-
trage activities.
A formal MGS borrowing and lending program would facilitate the
dual-directional trading of MGS, as players could then structurally shortthe stock instead of merely staying sidelined in a bear market. This
would help to remove the strong buy-side bias currently evident in the
MGS market.
Policy to Develop Government and Corporate Bond Markets in a
Balanced Manner At present, the government bond market is far bet-
ter developed and evolved than the corporate bond market. ormal
standards of practice and conventions have long been drawn up for the
MGS market and are closely adhered to. urthermore, the MGS markethas a modern and e¹cient settlement system through RENTAS and the
tendering process through AST.
The same cannot be said of the corporate bond market, although
similar infrastructure is currently being implemented. The corporate bond
market recently witnessed the issuance of dedicated guidelines and pro-
cedures by the Bond Traders Institute for primary and secondary corporate
bonds. Corporate bonds issued since October 1996 are scriptless and
settled through SPEEDS, the precursor to RENTAS. Those issues of cor-
porate bonds being priced through open market tender are no longerdone manually, but through AST.
The Malaysian authorities plan to issue a corporate bond market
blueprint early in 2000, which is expected to herald new initiatives and
methods to further develop the market.

8/8/2019 Chap09_MAL
http://slidepdf.com/reader/full/chap09mal 46/70
TABLE A1
.ederal Government .inance
1990 1991 1992 1993 1994 1995 1996
RM Billion
Current BudgetRevenue 29.5 34.1 39.3 41.7 49.4 51.0 58.3Current Expenditure 25.0 28.3 32.1 32.2 35.1 36.6 43.9
Current Surplus/Decit 45 58 72 95 144 144 144Overall BudgetGross Development Expenditure 10.7 9.6 9.7 10.1 11.3 14.1 14.6Less: Repayment 2.8 1.2 1.3 1.0 1.3 1.5 2.0Net Development Expenditure 7.9 8.4 8.4 9.1 10.0 12.5 12.6Overall Surplus/Decit -34 -26 -12 04 44 19 18Sources of .inanceNet Domestic Borrowings 3.8 3.2 1.5 0.4 1.8 0.0 1.3Net External Borrowings -0.8 0.1 -3.2 -3.1 -4.8 -1.6 -2.2Accumulation/Uses of Assets -0.4 0.6 -2.9 -2.4 1.4 0.2 0.9

8/8/2019 Chap09_MAL
http://slidepdf.com/reader/full/chap09mal 47/70

8/8/2019 Chap09_MAL
http://slidepdf.com/reader/full/chap09mal 48/70
TABLE A2
Consolidated Public Sector nance
1990 1991 1992 1993 1994 1995 1996
RM Billion
General GovernmentRevenue 37.8 42.7 49.3 52.6 61.1 62.3 70.9Current Expenditure 29.6 32.8 37.8 37.7 40.5 41.4 50.5Current Surplus/Decit 8.2 9.9 11.5 15.0 20.6 20.9 20.4NPEs Surplus/Decit 5.8 11.2 13.5 13.6 14.8 16.0 20.3Public Sector Surplus/Decit 140 210 250 286 354 369 408Development Expenditure 14.6 21.2 28.9 32.3 28.8 29.8 30.8General Government 101 110 127 128 126 162 153 N.PEs 45 103 161 195 162 136 155Overall Surplus/Decit -06 -02 -39 -37 66 71 100Sources of .inanceNet Domestic Borrowings -2.6 -0.9 -3.0 1.0 0.4 5.6 -10.3Net External Borrowings -3.2 -1.1 -6.9 -2.7 7.1 12.6 -0.3

8/8/2019 Chap09_MAL
http://slidepdf.com/reader/full/chap09mal 49/70
Percent of GNP
General GovernmentRevenue 33.1 33.3 34.5 32.1 32.9 29.4 29.3Current Expenditure 26.0 25.6 26.5 23.0 21.8 19.5 20.9Current Surplus/Decit 7.2 7.7 8.0 9.1 11.1 9.8 8.5NPEs Surplus/Decit 5.1 8.7 9.5 8.3 8.0 7.5 8.4Public Sector Surplus/Decit 122 164 175 174 190 174 169Development Expenditure 12.8 16.5 20.2 19.7 15.5 14.1 12.7General Government 8.8 8.5 8.9 7.8 6.7 7.6 6.3NPEs 4.0 8.0 11.3 11.9 8.7 6.4 6.4Overall Surplus/Decit -0.5 -0.2 -2.7 -2.3 3.6 3.3 4.1
Annual Percent Change
General Government Revenue 15.1 12.9 15.4 6.8 16.2 1.9 13.9Expenditure 11.7 22.3 23.4 5.0 -1.0 2.7 14.2
Current - General Govt 98 108 152 -03 77 21 219 Development - General Govt 277 87 162 10 -23 288 -53 Development - N.PEs -37 1279 571 205 -168 -158 138
Average RM/US$ 2.7044 2.7498 2.5472 2.5708 2.6205 2.5042 2.5119
E = MO Estimates; = MO orecast.Source: Economic Reports of the Ministry of inance, Malaysia.
TABLE A2
continued
1990 1991 1992 1993 1994 1995 1996
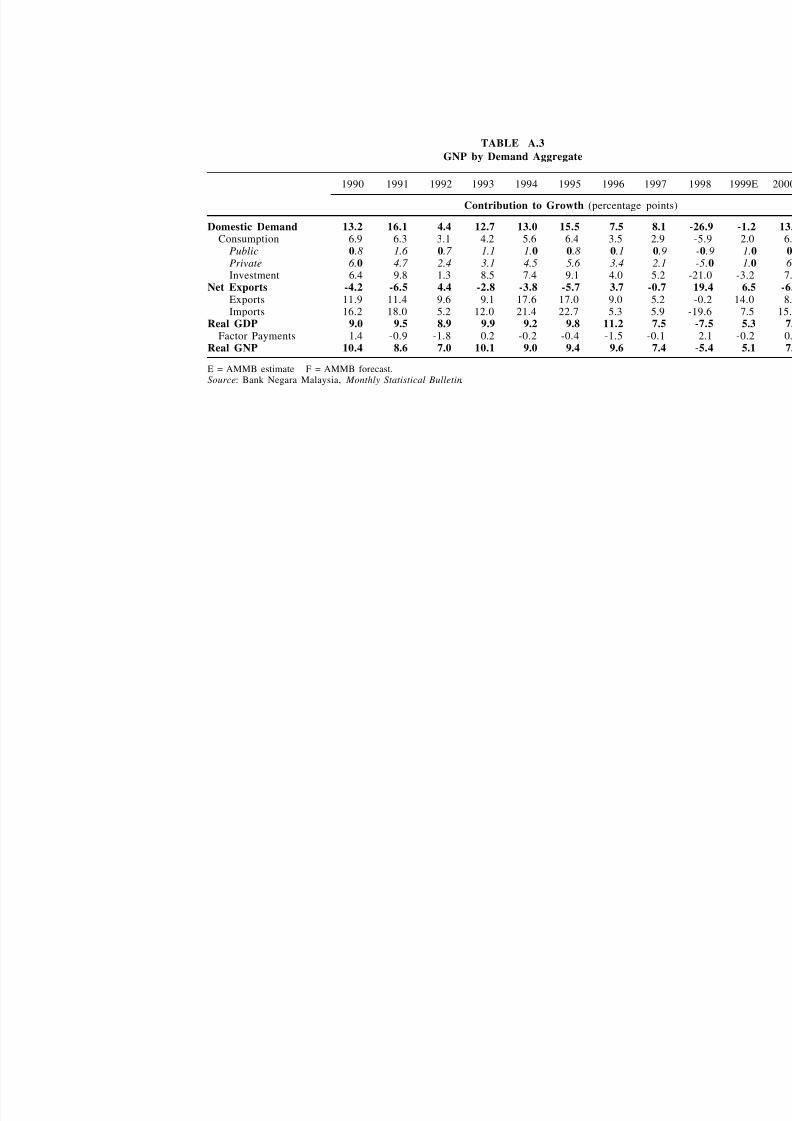
8/8/2019 Chap09_MAL
http://slidepdf.com/reader/full/chap09mal 50/70
TABLE A3
GNP by Demand Aggregate
1990 1991 1992 1993 1994 1995 1996 199
Contribution to Growth (percentage poi
Domestic Demand 132 161 44 127 130 155 75 8Consumption 6.9 6.3 3.1 4.2 5.6 6.4 3.5 2.
Public 08 16 07 11 10 08 01 0
Private 60 47 24 31 45 56 34 2Investment 6.4 9.8 1.3 8.5 7.4 9.1 4.0 5.
Net Exports -42 -65 44 -28 -38 -57 37 -0Exports 11.9 11.4 9.6 9.1 17.6 17.0 9.0 5.Imports 16.2 18.0 5.2 12.0 21.4 22.7 5.3 5.
Real GDP 90 95 89 99 92 98 112 7actor Payments 1.4 -0.9 -1.8 0.2 -0.2 -0.4 -1.5 -0.
Real GNP 104 86 70 101 90 94 96 7
E = AMMB estimate = AMMB forecast.Source: Bank Negara Malaysia, Monthly Statistical Bulletin.

8/8/2019 Chap09_MAL
http://slidepdf.com/reader/full/chap09mal 51/70
TABLE A4
.ederal Government Revenue
1990 1991 1992 1993 1994 1995 1996 1
RM Billion
Total Revenue 295 341 393 417 494 510 583Direct Taxes 104 133 154 171 202 227 259
Corporate 45 54 75 86 106 117 142 Petroleum 26 41 34 29 22 22 22 Personal 25 30 34 42 46 62 62 Others 08 09 10 14 28 26 33
Indirect Taxes 108 126 134 148 173 190 214 Export Duties 20 20 17 15 12 09 10 Import Duties 34 41 44 46 56 56 61 Excise Duties 23 28 31 37 43 53 58 Sales and Service Tax 24 28 31 35 41 49 55 Others 07 08 12 16 21 23 30
Nontax Revenue 8.3 8.2 10.5 9.8 12.0 9.3 11.0
Annual Percent Change
Total Revenue 168 153 153 62 186 30 144
Direct Taxes 335 274 162 108 181 126 139 Indirect Taxes 221 160 63 109 168 95 129 Nontax Revenue -37 -07 274 -66 221 -224 186

8/8/2019 Chap09_MAL
http://slidepdf.com/reader/full/chap09mal 52/70
Percent Share
Total Revenue 1000 1000 1000 1000 1000 1000 1000 1 Direct Taxes 352 389 392 409 408 445 444 Indirect Taxes 367 369 341 356 350 372 368 Nontax Revenue 280 241 267 235 242 182 189
Percent of GNP
Total Revenue 259 265 275 254 266 240 241 Direct Taxes 91 103 108 104 108 107 107 Indirect Taxes 95 98 94 90 93 89 89 Nontax Revenue 73 64 73 60 64 44 46
Average RM/US$ 2.7044 2.7498 2.5472 2.5708 2.6205 2.5042 2.5119 2.8
E = MO Estimates; = MO orecast.Source: Economic Reports of the Ministry of inance, Malaysia.

8/8/2019 Chap09_MAL
http://slidepdf.com/reader/full/chap09mal 53/70
TABLE A5
.ederal Government Current and Development Expenditure
1990 1991 1992 1993 1994 1995 1996 1
RM Billion
Total 357 379 418 423 463 506 585Defense and Security 4.9 6.3 7.0 7.4 7.9 8.9 9.1Economic Services 90 72 80 78 89 93 120
Agriculture and Rural Dev 23 23 24 24 25 25 26 Commerce and Industry 33 14 12 12 13 18 27 Transport 24 26 35 34 37 41 56 Public Utilities 08 07 08 06 08 07 07 Other 01 01 01 01 06 02 03
Social Services 99 104 123 126 148 157 188 Education 66 71 81 85 101 106 125 Medical Services 18 20 24 24 25 28 35 Postal and Broadcasting 02 02 02 02 03 03 03 Housing 00 01 01 02 04 04 05 Social and Community 05 05 08 05 06 07 09 Other 08 05 07 08 10 09 11
Other Expenditure 119 140 145 146 147 168 186
Transfer Payments 13 19 12 09 09 11 26 Public Debt Charges 68 70 73 72 68 65 68 Pension 12 18 22 23 27 28 35 General Administration 26 32 39 41 42 64 57

8/8/2019 Chap09_MAL
http://slidepdf.com/reader/full/chap09mal 54/70
Annual Percent Change
Total Expenditure 164 60 103 14 94 92 155 Defense and Security 111 290 110 60 64 132 19 Economic Services 409 -203 117 -28 151 40 287 Social Services 197 52 176 28 177 56 201 Other Expenditure 2.6 17.2 3.9 0.3 0.9 14.0 11.2
Percent Share
Total Expenditure 1000 1000 1000 1000 1000 1000 1000 1 Defense and Security 136 166 167 174 170 176 155 Economic Services 252 189 192 184 193 184 205 Social Services 278 275 294 298 320 309 322
Other Expenditure 33.4 36.9 34.8 34.4 31.7 33.1 31.9
Percent of GNP
Total Expenditure 313 295 293 258 249 239 242 Defense and Security 43 49 49 45 42 42 37 Economic Services 79 56 56 47 48 44 50 Social Services 87 81 86 77 80 74 78 Other Administration 105 109 102 89 79 79 77
Average RM/US$ 2.7044 2.7498 2.5472 2.5708 2.6205 2.5042 2.5119 2.8
E = MO Estimates; = MO orecast.Source: Economic Reports of the Ministry of inance, Malaysia.

8/8/2019 Chap09_MAL
http://slidepdf.com/reader/full/chap09mal 55/70
TABLE A6
.ederal Government Domestic and External Debt
1990 1991 1992 1993 1994 1995 19
RM Billion
Total Debt 947 991 970 959 931 914 8Domestic Debt 700 737 761 765 783 780 7
Treasury Bills 4.3 4.3 4.3 4.3 4.3 4.3 Investment Issues 0.9 0.9 1.0 2.0 4.8 5.1Government Securities 62.1 65.3 66.6 66.0 65.0 63.7 6
23 years 0.0 0.0 0.0 0.0 0.0 0.045 years 2.3 2.8 1.9 3.5 2.1 2.1610 years 11.1 11.6 13.9 13.3 12.3 11.5 11115 years 12.2 13.2 13.9 12.6 14.0 13.6 1 Above15 years 36.6 37.6 36.9 36.5 36.5 36.5 3
Other Loans 2.7 3.2 4.1 4.2 4.2 4.9External Debt 247 254 209 194 148 133 1
Market Loans 16.2 16.7 12.8 11.6 7.3 6.2Project Loans 8.5 8.7 8.1 7.8 7.6 7.1
Annual Percent Change
Total Debt 53 46 -21 -11 -29 -18 - Domestic Debt 64 52 33 06 23 -03 External Debt 22 28 -177 -75 -235 -100

8/8/2019 Chap09_MAL
http://slidepdf.com/reader/full/chap09mal 56/70
Percent Share
Total Debt 1000 1000 1000 1000 1000 1000 10 Domestic Debt 739 743 784 798 841 854 External Debt 261 257 216 202 159 146
Percent of GNP
Total Debt 831 772 680 585 500 431 3 Domestic Debt 614 574 533 467 421 368 External Debt 217 198 147 118 80 63
Average RM/US$ 2.7044 2.7498 2.5472 2.5708 2.6205 2.5042 2.51
E = MO Estimates; = MO orecast.Source: Economic Reports of the Ministry of inance, Malaysia.

8/8/2019 Chap09_MAL
http://slidepdf.com/reader/full/chap09mal 57/70
TABLE A7
.ederal Government Domestic Debt - by Holders
1990 1991 1992 1993 1994 1995 19
RM Billion
Total Domestic Debt 700 737 761 765 783 780 7Treasury Bills 43 43 43 43 43 43
BNM 00 01 00 00 00 00 Banking Institutions 37 33 15 14 26 26 Others 06 09 28 29 18 17
Investment Issues 0.9 0.9 1.0 2.0 4.8 5.1
Government Securities 621 653 666 660 650 647 6Public Sector 57 58 52 53 49 48 EP. 361 383 396 393 403 392 Insurance Companies 14 19 29 38 40 51 Central Bank 22 13 03 04 01 01 Banking Institutions 112 124 127 113 83 86 National Savings Bank 16 16 19 21 21 21 Others 38 40 40 40 53 48
Other Domestic Borrowings 2.7 3.2 4.1 4.2 4.2 3.9
Annual Percent Change
Total Domestic Debt 64 52 33 06 23 -03Treasury Bills 00 00 00 00 00 00 Government Securities 67 51 21 -09 -16 -04 Other Domestic Borrowings 193 192 299 19 -06 -53 -

8/8/2019 Chap09_MAL
http://slidepdf.com/reader/full/chap09mal 58/70
Percent Share
Total Domestic Debt 1000 1000 1000 1000 1000 1000 10Treasury Bills 62 59 57 56 55 55 Investment Issues 13 12 13 26 61 65 Government Securities 887 886 876 863 830 829 8Other Domestic Borrowings 38 43 54 55 53 51
Percent of GNP
Total Domestic Debt 614 574 533 467 421 368 3Treasury Bills 38 34 30 26 23 20 Investment Issues 08 07 07 12 26 24 Government Securities 545 509 467 403 349 305 2Other Domestic Borrowings 23 25 29 26 22 19
Average RM/US$ 2.7044 2.7498 2.5472 2.5708 2.6205 2.5042 2.51
E = MO Estimates; = MO orecast.Source: Economic Reports of the Ministry of inance, Malaysia.

8/8/2019 Chap09_MAL
http://slidepdf.com/reader/full/chap09mal 59/70
TABLE A8
.unds Raised in the Capital Market
Public Sector Private Sector TotalYear New Redemption Net unds Public
Issue Issue Shares Bonds Total Raised Sector
RM Billion
1980 3.27 0.96 2.31 0.14 0.02 0.16 2.47 936 1981 4.67 0.89 3.77 0.90 0.00 0.90 4.67 807 1982 6.57 1.02 5.55 0.63 0.05 0.68 6.23 891 1983 4.30 0.30 4.00 1.26 0.14 1.40 5.40 741 1984 4.08 0.93 3.16 1.97 0.39 2.36 5.52 572 1985 4.98 1.39 3.59 0.64 0.00 0.64 4.24 848
1986 5.62 0.90 4.72 0.19 0.00 0.19 4.91 962 1987 8.67 0.98 7.69 1.38 0.40 1.78 9.47 812 1988 8.98 1.45 7.53 0.93 1.93 2.86 10.40 725 1989 3.91 1.45 2.46 2.51 1.85 4.36 6.82 361 1990 5.44 1.63 3.82 8.65 2.13 10.78 14.59 261 1991 3.80 0.64 3.16 4.39 1.87 6.26 9.42 335 1992 4.30 2.77 1.53 9.18 3.32 12.51 14.04 109 1993 3.75 2.57 1.18 3.43 3.64 7.07 8.25 143 1994 5.50 3.72 1.78 8.46 9.03 17.49 19.27 92 1995 2.75 2.79 -0.04 11.44 8.34 19.78 19.74 -02 1996 6.00 4.67 1.33 15.92 14.53 30.46 31.79 42 1997 3.79 5.20 -1.41 18.36 16.60 34.96 33.55 -42 1998 17.68 7.88 9.80 1.79 6.18 7.96 17.77 552 1999 14.98 8.68 6.30 5.94 5.19 11.14 17.43 361
Source: Bank Negara Malaysia, Monthly Statistical Bulletin.

8/8/2019 Chap09_MAL
http://slidepdf.com/reader/full/chap09mal 60/70
TABLE A9
Malaysias External Debt
1990 1991 1992 1993 1994 1995 1996
RM Billion
Total External Debt 459 510 560 692 734 850 978Medium and Long Term 415 438 428 519 591 688 727
Public Sector 365 371 323 364 349 407 397 .ederal Government 247 254 209 194 148 133 105 N.PEs 118 117 114 170 201 274 292
Private Sector 4.9 6.7 10.5 15.5 24.2 28.1 33.0
Short-Term Debt 44 72 132 173 142 162 252Debt-Service Ratio (%) 8.3 7.0 6.9 7.1 5.5 6.6 6.9
of which .ed Govt 36 28 30 27 14 14 11
Annual Percent Change
Total External Debt 11 110 98 236 61 158 151Medium and Long Term -14 56 -23 212 140 163 56
Public Sector -24 15 -128 125 -39 166 -25 .ederal Government 22 28 -177 -75 -235 -100 -215 N.PEs -110 -14 -22 491 184 361 67
Private Sector 7.2 36.0 55.7 48.0 56.2 16.0 17.4Short-Term Debt 321 624 835 316 -178 138 552

8/8/2019 Chap09_MAL
http://slidepdf.com/reader/full/chap09mal 61/70
Percent Share
Total External Debt 1000 1000 1000 1000 1000 1000 1000Medium and Long Term 904 859 765 750 806 809 743
Public Sector 796 727 578 526 476 479 406 .ederal Government 539 499 374 280 202 157 107 N.PEs 257 229 204 246 274 322 299
Private Sector 10.8 13.2 18.7 22.4 33.0 33.0 33.7Short-Term Debt 96 141 235 250 194 191 257
Percent of GNP
Total External Debt 403 397 392 422 394 401 404Medium and Long Term 364 341 300 316 318 324 300
Public Sector 321 289 227 222 188 192 164 .ederal Government 217 198 147 118 80 63 43 N.PEs 104 91 80 104 108 129 121
Private Sector 4.3 5.2 7.3 9.5 13.0 13.2 13.6Short-Term Debt 39 56 92 106 77 76 104
Average RM/US$ 2.7044 2.7498 2.5472 2.5708 2.6205 2.5042 2.5119 2
E = MO Estimates; = MO orecast.Source: Economic Reports of the Ministry of inance, Malaysia.
TABLE A9
continued
1990 1991 1992 1993 1994 1995 1996

8/8/2019 Chap09_MAL
http://slidepdf.com/reader/full/chap09mal 62/70
Malaysia 421
TABLE A10
Malaysian Key Economic Indicators
1994 1995 1996 1997 1998 1999E 2000 2001
1987 GDP (% Change) 9.2 9.8 10.0 7.5 -7.5 5.3 7.0 6.5Agriculture -1.9 -2.5 4.5 0.4 -4.5 4.4 3.8 4.1Mining 6.0 22.9 2.9 2.9 1.8 -3.5 -0.5 0.5Manufacturing 11.4 11.4 18.2 10.4 -13.7 13.6 10.5 11.4Construction 15.1 21.1 16.2 10.6 -23.0 -5.8 6.1 5.7Services 10.1 10.2 8.9 9.9 -0.8 2.4 6.0 5.6
1987 GNP (% Change) 9.0 9.4 9.6 7.4 -5.4 5.1 7.2 6.9Consumption 9.1 10.5 5.6 4.9 -10.2 3.5 11.8 13.6
Private 94 117 69 43 -108 23 143 167 Public 79 60 08 76 -78 85 28 20
Investment 17.8 20.3 5.8 11.2 -42.9 -2.8 25.1 17.6Aggregate Domestic 12.6 14.6 5.7 7.7 -25.2 -1.5 16.9 19.7
DemandExports 21.9 19.0 9.2 5.4 -0.2 13.8 7.7 5.2Imports 25.6 23.7 4.9 5.7 -19.4 8.5 16.6 16.4
Per capita IncomeRinggit 9,251 10,251 11,429 12,314 12,134 12,125 12,803 13,927(% change) 10.4 10.8 11.5 7.7 -1.5 -0.1 5.6 8.8US dollar 3,617 4,094 4,550 4,381 3,094 3,191 3,658 4,220(% change) 16.6 13.2 11.1 -3.7 -29.4 3.1 14.6 15.4
Saving-Invest Ratio(% of GNP)Gross Investment 43.3 45.8 43.5 45.3 28.2 25.2 34.6 38.1Gross Savings 35.3 35.6 38.9 39.4 41.9 44.0 42.0 40.8Resource Balance -7.9 -10.2 -4.6 -5.9 13.7 18.8 7.4 2.7
Current Account of BOP(RMB)Merchandise Balance 4.5 0.1 10.1 10.3 69.0 87.6 71.2 43.2Services Balance -17.0 -19.2 -18.4 -22.7 -22.3 -24.9 -30.7 -27.8Net Transfers -2.2 -2.5 -2.9 -3.3 -9.9 -7.7 -8.4 -5.2Current Account Bal. -14.8 -21.6 -11.2 -15.8 36.7 55.0 32.0 10.2Percent of GNP -79 -102 -46 -59 137 200 108 31
Trade BalanceBalance (RMB) -2.0 -9.4 -0.3 0.4 58.4 72.8 52.9 28.3 Exports-fob (% yoy) 270 202 65 124 298 120 173 57 Imports-cif (% yoy) 328 246 15 120 33 91 299 142
CPI (%) 3.7 3.4 3.5 2.7 5.3 2.8 3.0 3.0PPI (%) 4.9 5.5 2.3 2.6 12.0 5.0 3.0 4.0Unemployment (%) 2.9 2.8 2.6 2.6 3.2 3.5 2.8 2.5Base Lending Rate (%) 6.55 7.70 9.00 10.25 8.05 6.80 6.00 6.00Interbank Three-Month (%) 5.41 6.74 7.31 9.10 6.40 3.05 4.00 4.70End-Period RM/US$ 2.56 2.54 2.53 3.88 3.80 3.80 3.50 3.00
E = AMMB estimate = AMMB forecast.
Source: Bank Negara Malaysia, Monthly Statistical Bulletin.

8/8/2019 Chap09_MAL
http://slidepdf.com/reader/full/chap09mal 63/70
TABLE A11
Monetary and Banking Statistics
Year M1 M2 M3 LoansRM Bil. % YOY RM Bil. % YOY RM Bil. % YOY RM Bil. % YOY
1980 9 . 8 15.0 28.0 29.0 32.7 28.4 25.7 35.61981 11.0 12.8 32.8 17.1 38.1 16.4 31.7 23.11982 12.5 13.3 37.9 15.6 44.4 16.6 37.3 17.81983 13.4 7 .7 42.3 11.5 51.7 16.6 47.0 25.81984 13.4 -0 .6 47.7 12.9 59.8 15.6 56.9 21.11985 13.6 1 .7 50.4 5 .6 65.6 9 . 8 65.1 14.41986 14.0 2 .8 56.1 11.3 71.4 8 . 8 69.0 6 . 11987 15.8 13.0 59.8 6 .6 74.9 4 . 9 69.4 0 . 51988 17.8 13.1 64.1 7 .2 81.0 8 . 1 76.3 10.0
1989 21.2 19.1 74.4 16.1 97.7 20.6 92.5 21.31990 24.2 14.1 83.9 12.8 115.4 18.2 114.0 23.21991 26.9 11.0 96.1 14.5 133.1 15.3 138.8 21.71992 30.4 13.0 114.5 19.1 159.2 19.6 152.5 9 . 91993 41.8 37.5 139.8 22.1 196.6 23.5 170.8 12.01994 46.5 11.2 160.4 14.7 222.3 13.1 195.8 14.71995 51.9 11.7 198.9 24.0 271.9 22.3 251.9 28.61996 60.6 16.7 238.2 19.8 329.7 21.2 333.0 32.21997 63.4 4 .6 292.2 22.7 390.8 18.5 421.0 26.51998 54.1 -14.6 296.5 1 .5 401.5 2 . 7 414.7 -1.51999 72.3 33.6 330.9 6 . 7 434.7 8 . 3 393.9 -4.5
M1 = coin and currency notes + demand deposits.M2 = M1 + quasi-money.Quasi-money = (savings deposits + xed deposits + NIDs issued + repos) of the private sector at commercial banks.M3 = M2 + broad quasi-money.Broad quasi-money = (savings deposits + xed deposits + NIDs issued + repos) of the private sector at nance companies, Mercha# = Loans and deposits of the banking system comprising commercial banks, nance companies, and merchant banks.Source: Bank Negara Malaysia, Monthly Statistical Bulletin.

8/8/2019 Chap09_MAL
http://slidepdf.com/reader/full/chap09mal 64/70
Malaysia 423
TABLE A12
Outstanding Public and Private Debt Securities
Government Bonds Private Sector Total
Year MSB & Sub- Debt Sub- Bonds
MGS GICs KBs total Securities Cagamas total Raised
RM Billion
1991 65.3 1.0 0.0 66.3 5.3 3.9 9.2 75.41992 66.6 1.0 1.4 69.0 7.2 4.3 11.5 80.51993 66.0 2.0 1.2 69.2 10.0 5.0 15.0 84.2
1994 65.0 4.8 1.2 70.9 15.1 8.9 24.1 95.01995 64.7 5.1 1.1 70.9 22.7 9.3 32.0 102.91996 66.9 4.2 1.1 72.2 33.5 13.2 46.8 118.91997 66.3 2.8 1.9 70.9 46.6 16.8 63.4 134.31998 75.0 2.0 18.5 95.5 46.8 15.1 61.9 157.3
Percent Share
1991 86.5 1.3 0.0 87.8 7.0 5.1 12.2 100.01992 82.8 1.2 1.7 85.8 8.9 5.3 14.2 100.01993 78.4 2.4 1.4 82.2 11.9 6.0 17.8 100.0
1994 68.4 5.1 1.2 74.7 15.9 9.4 25.3 100.01995 62.9 4.9 1.1 68.9 22.1 9.0 31.1 100.01996 56.3 3.5 0.9 60.7 28.2 11.1 39.3 100.01997 49.3 2.0 1.4 52.8 34.7 12.5 47.2 100.01998 47.7 1.3 11.7 60.7 29.7 9.6 39.3 100.0
Percent Change
1992 2.1 0.0 - 4.2 35.2 10.3 24.8 6.71993 -0.9 100.0 -16.2 0.2 39.1 17.6 31.1 4.61994 -1.6 140.0 0.0 2.5 51.3 78.0 60.2 12.81995 -0.4 5.2 -3.9 -0.1 50.0 4.3 33.1 8.31996 3.4 -17.8 -3.4 1.8 47.7 42.0 46.1 15.51997 -1.0 -33.7 75.6 -1.7 39.0 26.7 35.5 12.91998 13.2 -27.3 862.2 34.6 0.4 -10.1 -2.4 17.2
Percent of GDP
1991 48.3 0.7 0.0 49.0 3.9 2.9 6.8 55.81992 44.2 0.7 0.9 45.8 4.8 2.8 7.6 53.41993 38.3 1.2 0.7 40.2 5.8 2.9 8.7 48.91994 33.2 2.5 0.6 36.3 7.7 4.6 12.3 48.61995 29.1 2.3 0.5 31.9 10.2 4.2 14.4 46.3
1996 26.4 1.6 0.4 28.4 13.2 5.2 18.4 46.91997 23.5 1.0 0.7 25.2 16.5 5.9 22.5 47.61998 26.4 0.7 6.5 33.6 16.5 5.3 21.7 55.3
Source: Annual Reports of Bank Negara Malaysia.

8/8/2019 Chap09_MAL
http://slidepdf.com/reader/full/chap09mal 65/70
TABLE A13
Volume of Transactions in Interbank Money Market
Money Market Instrument
Year TOTAL Inter-bank Sub- MGS Khazanah Cagamas MTBs BNDeposits total MGS Bond Bonds Bills
Total in RM Billions
1994 912.4 805.1 107.3 10.9 0.0 8.6 3.6 5.71995 885.0 742.7 142.4 3.8 0.0 16.2 3.8 12.41996 1,155.8 973.5 182.3 25.4 0.0 2.5 2.8 14.11997 1,860.6 1,673.6 187.0 12.4 0.0 3.7 4.3 12.41998 1,824.0 1,650.7 173.3 27.3 1.4 2.4 6.7 0.01999 1,386.2 1,189.3 196.9 54.3 5.1 9.5 8.9 0.0
Monthly Average in RM Billions
1994 76.0 67.1 8.9 0.9 0.0 0.7 0.3 0.51995 73.8 61.9 11.9 0.3 0.0 1.3 0.3 1.01996 96.3 81.1 15.2 2.1 0.0 0.2 0.2 1.21997 155.1 139.5 15.6 1.0 0.0 0.3 0.4 1.01998 152.0 137.6 14.4 2.3 0.1 0.2 0.6 0.01999 115.5 99.1 16.4 4.5 0.4 0.8 0.7 0.0
Percent Share
1994 100.0 88.2 11.8 1.2 0.0 0.9 0.4 0.61995 100.0 83.9 16.1 0.4 0.0 1.8 0.4 1.41996 100.0 84.2 15.8 2.2 0.0 0.2 0.2 1.21997 100.0 90.0 10.0 0.7 0.0 0.2 0.2 0.71998 100.0 90.5 9.5 1.5 0.1 0.1 0.4 0.01999 100.0 85.8 14.2 3.9 0.4 0.7 0.6 0.0
Source: Bank Negara Malaysia, Monthly Statistical Bulletin.

8/8/2019 Chap09_MAL
http://slidepdf.com/reader/full/chap09mal 66/70
Malaysia 425
TABLE A14
Capital Structure of Malaysian Corporations
Bank Borrowings Equity BondsYear (Net Change) (New Issues) (New Issues) Total
RM Billion
1989 10.8 2.5 1.9 15.21990 12.5 8.6 2.1 23.31991 11.5 4.4 1.9 17.71992 4.5 9.2 3.3 17.0
1993 6.9 3.4 3.6 14.01994 9.6 8.5 9.0 27.11995 36.6 11.4 8.3 56.31996 48.4 15.9 14.5 78.91997 53.4 18.4 16.6 88.41998 -6.2 1.8 6.2 1.81999 11.2 5.9 5.2 22.3
Percent Share
1989 71.3 16.5 12.2 100.01990 53.8 37.1 9.1 100.01991 64.6 24.8 10.6 100.01992 26.4 54.1 19.6 100.01993 49.5 24.5 26.0 100.01994 35.4 31.2 33.4 100.01995 64.9 20.3 14.8 100.01996 61.4 20.2 18.4 100.01997 60.5 20.8 18.8 100.01998 -341.4 99.1 342.3 100.01999 50.1 26.6 23.3 100.0
Percent Change
1990 16.1 244.9 14.9 53.71991 -8.7 -49.2 -12.0 -24.01992 -60.9 109.1 77.5 -4.21993 55.0 -62.6 9.5 -17.51994 38.0 146.4 148.2 93.21995 281.8 35.2 -7.7 108.11996 32.4 39.2 74.3 40.01997 10.4 15.3 14.1 12.11998 -111.5 -90.3 -62.8 -98.01999 -281.8 232.4 -15.9 1,138.1
Note: Bank borrowings = loans of the banking system which exclude credit for residentialproperties, consumption and others.Source: Bank Negara Malaysia.

8/8/2019 Chap09_MAL
http://slidepdf.com/reader/full/chap09mal 67/70
TABLE A15
Outstanding MGS Issues (31 July 1999)
MGSLoan Year Coupon Maturity Amount Coupon Payment Period to Run MNo. Raised (%p.a) Date (RM Mil) Year Months
1 1984 8.000 15 Sep 99 100 15 Mar 15 Sep 0 1.53 1979 7.750 30 Sep 99 426 31 Mar 30 Sep 0 2.03 1981 8.300 15 Oct 99 500 15 Apr 15 Oct 0 2.53 1992 7.450 30 Nov 99 1,300 31 May 30 Nov 0 4.03 1986 7.800 1 Dec 99 200 01 Jun 01 Dec 0 4.11 1980 8.000 31 Mar 00 600 31 Mar 30 Sep 0 8.12 1980 8.000 15 Jul 00 750 15 Jan 15 Jul 0 11.5
2 1989 6.750 31 Jul 00 1,000 31 Jan 31 Jul 0 0.14 1987 6.285 15 Sep 00 1,200 15 Mar 15 Sep 1 1.63 1980 8.500 15 Dec 00 600 15 Jun 15 Dec 1 4.63 1990 8.375 28 Dec 00 1,136 28 Jun 28 Dec 1 5.01 1981 8.500 31 Jan 01 1,000 31 Jan 31 Jul 1 6.11 1986 8.000 15 Mar 01 300 15 Mar 15 Sep 1 7.51 1998 8.112 16 Apr 01 2,000 16 Apr 16 Oct 1 8.62 1981 8.500 15 May 01 1,300 15 May 15 Nov 1 9.51 1996 6.480 18 Jun 01 2,000 18 Jun 18 Dec 1 10.73 1981 8.500 15 Oct 01 500 15 Apr 15 Oct 2 2.61 1982 8.500 15 eb 02 1,200 15 eb 15 Aug 2 6.6
1 1999 5.624 30 Mar 02 2,000 30 Sep 30 Mar 2 8.02 1982 8.500 31 Mar 02 2,200 31 Mar 30 Sep 2 8.11 1991 8.350 30 Apr 02 500 30 Apr 31 Oct 2 9.02 1995 6.720 18 Sep 02 1,000 18 Mar 18 Sep 3 1.72 1997 8.157 18 Nov 02 2,000 18 May 18 Nov 3 3.71 1983 8.500 1 Mar 03 1,100 01 Mar 01 Sep 3 7.1

8/8/2019 Chap09_MAL
http://slidepdf.com/reader/full/chap09mal 68/70
1 1990 6.750 15 Mar 03 700 15 Mar 15 Sep 3 7.52 1992 8.275 30 Jun 03 1,500 30 Jun 31 Dec 3 11.02 1983 8.500 1 Jul 03 1,200 01 Jan 01 Jul 3 11.12 1998 9.030 15 Jul 03 2,500 15 Jan 15 Jul 3 11.53 1982 8.600 30 Sep 03 1,100 31 Mar 30 Sep 4 2.1
2 1996 6.586 30 Sep 03 2,000 30 Mar 30 Sep 4 2.11 1989 6.750 15 Mar 04 500 15 Mar 15 Sep 4 7.62 1999 5.337 15 Mar 04 2,000 15 Jun 15 Dec 4 10.62 1984 8.500 15 Jun 04 1,200 15 Jun 15 Dec 4 10.62 1991 8.350 30 Jul 04 700 30 Jan 30 Jul 5 0.11 1984 8.500 15 Sep 04 1,300 15 Mar 15 Sep 5 1.63 1983 8.600 31 Oct 04 1,000 30 Apr 31 Oct 5 3.11 1994 5.000 15 Apr 05 2,500 15 Apr 15 Oct 5 8.63 1998 7.424 30 Sep 05 2,450 31 Mar 30 Sep 6 2.12 1990 8.500 2 Oct 05 1,500 02 Apr 02 Oct 6 2.23 1984 8.600 15 Dec 05 1,800 15 Jun 15 Dec 6 4.6
3 1985 8.500 15 Dec 05 1,550 15 Jun 15 Dec 6 4.61 1989 6.850 15 Mar 06 500 15 Mar 15 Sep 6 7.61 1985 8.600 15 Apr 06 1,300 15 Apr 15 Oct 6 8.62 1985 8.600 1 Sep 06 1,200 01 Mar 01 Sep 7 1.23 1996 6.812 29 Nov 06 2,000 29 May 29 Nov 7 4.13 1986 8.500 1 Dec 06 850 01 Jun 01 Dec 7 4.11 1986 8.600 15 Mar 07 1,300 15 Mar 15 Sep 7 7.61 1989 6.900 15 Mar 07 500 15 Mar 15 Sep 7 7.62 1986 8.600 15 Jul 07 1,200 15 Jan 15 Jul 7 11.61 1997 7.284 15 Oct 07 1,000 15 Apr 15 Oct 8 2.63 1986 8.600 1 Dec 07 850 01 Jun 01 Dec 8 4.11 1987 7.600 15 Mar 08 650 15 Mar 15 Sep 8 7.62 1988 6.450 1 Jul 08 1,000 01 Jan 01 Jul 8 11.1

8/8/2019 Chap09_MAL
http://slidepdf.com/reader/full/chap09mal 69/70
3 1988 6.450 30 Nov 08 2,600 31 May 30 Nov 9 4.16 1998 7.005 15 Dec 08 2,000 15 Dec 15 Jun 9 4.61 1989 7.000 15 Mar 09 500 15 Mar 15 Sep 9 7.63 1991 8.500 30 Nov 12 1,000 31 May 30 Nov 13 4.24 1998 8.000 30 Oct 13 3,000 30 Apr 30 Oct 14 3.05 1998 8.000 30 Oct 18 3,000 30 Apr 30 Oct 19 3.0
Total 74,862
Source: Rating Agency Malaysia Berhad.
TABLE A15
continued
MGSLoan Year Coupon Maturity Amount Coupon Payment Period to Run MNo. Raised (%p.a) Date (RM Mil) Year Months

8/8/2019 Chap09_MAL
http://slidepdf.com/reader/full/chap09mal 70/70
Malaysia 429
TABLE A16
List of Principal Dealers (1 January 2000)
Commercial BanksMalayan Banking BerhadBumiputera-Commerce Bank BerhadPublic Bank BerhadStandard Chartered Bank BerhadCitibank BerhadOCBC BerhadRHB Bank BerhadHong Leong Bank Berhad
Merchant BanksArab-Malaysian Merchant Bank BerhadCommerce International Merchant Bankers Berhad
Discount HousesKA Discount BerhadAmanah-Short deposits Malaysia Berhad