Chapter 06: Working Capital and the Financing Decision Chapter 6 Working Capital and the Financing Decision Discussion Questions 6-1. Explain how rapidly expanding sales can drain the cash resources of a firm. Rapidly expanding sales will require a buildup in assets to support the growth. In particular, more and more of the increase in current assets will be permanent in nature. A non-liquidating aggregate stock of current assets will be necessary to allow for floor displays, multiple items for selection, and other purposes. All of these “asset” investments can drain the cash resources of the firm. 6-2. Discuss the relative volatility of short- and long- term interest rates. Figure 6-10 shows the long-run view of short- and long-term interest rates. Normally, short-term rates are much more volatile than long-term rates. 6-3. What is the significance to working capital management of matching sales and production? If sales and production can be matched, the level of inventory and the amount of current assets needed can be kept to a minimum; therefore, lower financing costs will be incurred. Matching sales and production has the advantage of maintaining smaller amounts of current assets than level production, and therefore less financing costs are incurred. However, if sales are seasonal or cyclical, workers will be laid off in a declining sales climate and machinery (fixed assets) will be idle. Here lies the tradeoff between level and seasonal production: Full utilization of 6-1

Welcome message from author
This document is posted to help you gain knowledge. Please leave a comment to let me know what you think about it! Share it to your friends and learn new things together.
Transcript

Chapter 06: Working Capital and the Financing Decision
Chapter 6Working Capital and the Financing Decision
Discussion Questions
6-1. Explain how rapidly expanding sales can drain the cash resources of a firm.
Rapidly expanding sales will require a buildup in assets to support the growth. In particular, more and more of the increase in current assets will be permanent in nature. A non-liquidating aggregate stock of current assets will be necessary to allow for floor displays, multiple items for selection, and other purposes. All of these “asset” investments can drain the cash resources of the firm.
6-2. Discuss the relative volatility of short- and long-term interest rates.
Figure 6-10 shows the long-run view of short- and long-term interest rates. Normally, short-term rates are much more volatile than long-term rates.
6-3. What is the significance to working capital management of matching sales and production?
If sales and production can be matched, the level of inventory and the amount of current assets needed can be kept to a minimum; therefore, lower financing costs will be incurred. Matching sales and production has the advantage of maintaining smaller amounts of current assets than level production, and therefore less financing costs are incurred. However, if sales are seasonal or cyclical, workers will be laid off in a declining sales climate and machinery (fixed assets) will be idle. Here lies the tradeoff between level and seasonal production: Full utilization of fixed assets with skilled workers and more financing of current assets versus unused capacity, training and retraining workers, with lower financing for current assets.
6-4. How is a cash budget used to help manage current assets?
A cash budget helps minimize current assets by providing a forecast of inflows and outflows of cash. It also encourages the development of a schedule as to when inventory is produced and maintained for sales (production schedule), and accounts receivables are collected. The cash budget allows us to forecast the level of each current asset and the timing of the buildup and reduction of each.
6-1

Chapter 06: Working Capital and the Financing Decision
6-5. “The most appropriate financing pattern would be one in which asset buildup and length of financing terms is perfectly matched.” Discuss the difficulty involved in achieving this financing pattern.
Only a financial manager with unusual insight and timing could design a plan in which asset buildup and the length of financing terms are perfectly matched. One would need to know exactly what current assets are temporary and which ones are permanent. Furthermore, one is never quite sure how much or short-term or long-term financing is available at all times. Even if this were known, it would be difficult to change the financing mix on a continual basis.
6-6. By using long-term financing to finance part of temporary current assts, a firm may have less risk but lower returns than a firm with a normal financing plan. Explain the significance of this statement.
By establishing a long-term financing arrangement for temporary current assets, a firm is assured of having necessary funding in good times as well as bad, thus we say there is low risk. However, long-term financing is generally more expensive than short-term financing and profits may be lower than those which could be achieved with a synchronized or normal financing arrangement for temporary current assets.
6-7. A firm that uses short-term financing methods for a portion of permanent current assets is assuming more risk but expects higher returns than a firm with a normal financing plan. Explain.
By financing a portion of permanent current assets on a short-term basis, we run the risk of inadequate financing in tight money periods. However, since short-term financing is less expensive than long-term funds, a firm tends to increase its profitability over the long run (assuming it survives). In answer to the preceding question, we stressed less risk and less return; here the emphasis is on risk and high return.
6-8. What does the term structure of interest rates indicate?
The term structure of interest rates shows the relative level of short-term and long-term interest rates at a point in time on U.S. treasury securities. It is often referred to as a yield curve.
6-2

Chapter 06: Working Capital and the Financing Decision
6-9. What are three theories for describing the shape of the term structure of interest rates (the yield curve)? Briefly describe each theory.
Liquidity premium theory, the market segmentation theory, and the expectations theory.
The liquidity premium theory indicates that long-term rates should be higher than short-term rates. This premium of long-term rates over short-term rates exists because short-term securities have greater liquidity, and therefore higher rates have to be offered to potential long-term bond buyer to entice them to hold these less liquid and more price sensitive securities.
The market segmentation theory states that Treasury securities are divided into market segments by the various financial institutions investing in the market. The changing needs, desires, and strategies of these investors tend to strongly influence the nature and relationship of short- and long-term rates.
The expectations hypothesis maintains that the yields on long-term securities are a function of short-term rates. The result of the hypothesis is that when long-term rates are much higher than short-term rates, the market is saying that is expects short-term rates to rise. Conversely, when long-term rates are lower than short-term rates, the market is expecting short-term rates to fall.
6-10. Since the mid-1960s, corporate liquidity has been declining. What reasons can you give for this trend?
The decrease is liquidity can be traced in part to more efficient inventory management such as just-in-time inventory and point of sales terminals that provide better inventory control. The decline in working capital can also be attributed to electronic cash flow transfer systems, and the ability to sell accounts receivables through securitization of assets (this is more fully explained in the next chapter). It might also be that management is simply willing to take more liquidity risk as interest rates declined.
6-3

Chapter 06: Working Capital and the Financing Decision
Chapter 6
Problems
1. Expected value (LO6) Austin Electronics expects sales next year to be $900,000 if the economy is strong, $650,000 if the economy is steady, and $375,000 if the economy is weak. The firm believes there is a 15 percent probability the economy will be strong, a 60 percent probability of a steady economy, and a 25 percent probability of a weak economy.
What is the expected level of sales for next year?
6-1. Solution:
Austin Electronics
State of Economy Sales Probability
Expected Outcome
Strong $900,000 .15 $135,000
Steady 650,000 .60 390,000
Weak 375,000 .25 93,750
Expected level of sales = $618,750
2. Expected value (LO6) Sharpe Knife Company expects sales next year to be $1,500,000 if the economy is strong, $800,000 if the economy is steady, and $500,000 if the economy is weak. Mr. Sharpe believes there is a 20 percent probability the economy will be strong, a 50 percent probability of a steady economy, and a 30 percent probability of a weak economy. What is the expected level of sales for the next year?
6-2. Solution:
6-4

Chapter 06: Working Capital and the Financing Decision
Sharpe Knife Company
State of Economy Sales Probability
Expected Outcome
Strong $1,500,000 .20 $300,000
Steady 800,000 .50 400,000
Weak 500,000 .30 150,000
Expected level of sales = $850,000
3. External financing (LO1) Axle Supply Co., expects sales next year to be $300,000. Inventory and accounts receivable will increase by $60,000 to accommodate this sales level. The company has a steady profit margin of 10 percent with a 30 percent dividend payout. How much external financing will the firm have to seek? Assume there is no increase in liabilities other than that which will occur with the external financing.
6-3. Solution:
Axle Supply Co.
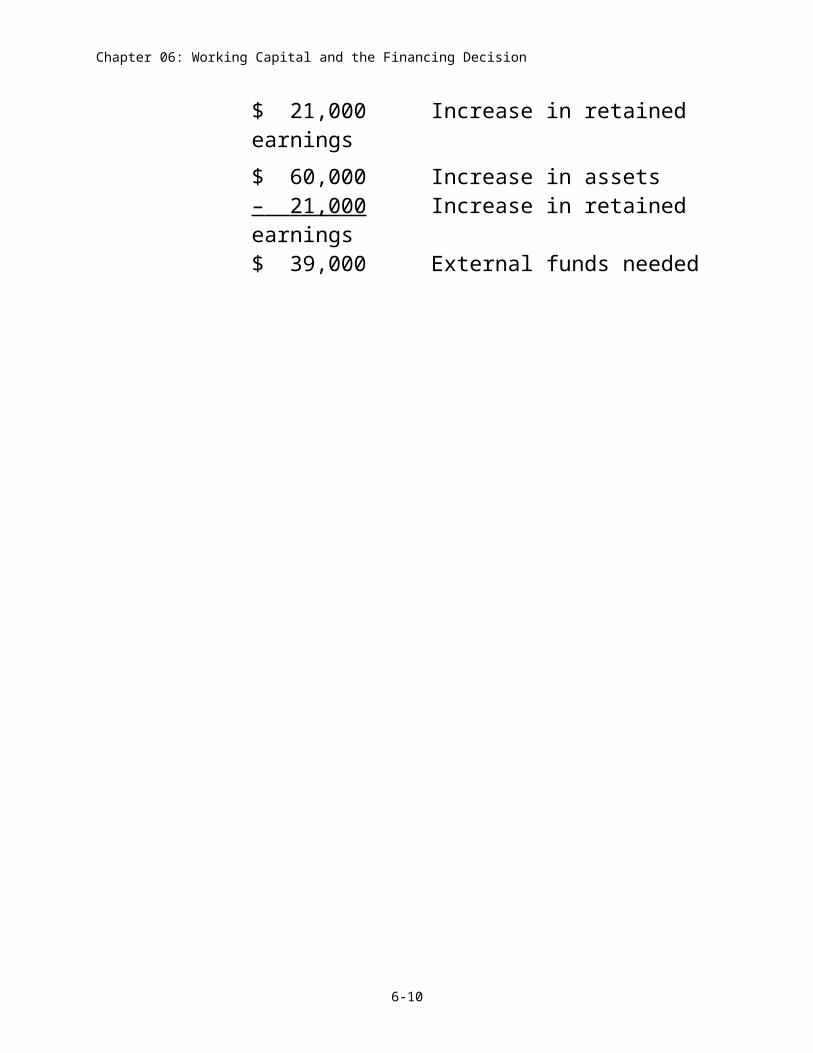
$300,000 Sales .10 Profit margin 30,000 Net income– 9,000 Dividends (30%)$ 21,000 Increase in retained earnings
$ 60,000 Increase in assets– 21,000 Increase in retained earnings$ 39,000 External funds needed
6-5

Chapter 06: Working Capital and the Financing Decision
4. External financing (LO1) Antivirus, Inc., expects its sales next year to be $2,000,000. Inventory and accounts receivable will increase $430,000 to accommodate this sales level. The company has a steady profit margin of 12 percent with a 25 percent dividend payout. How much external financing will the firm have to seek? Assume there is no increase in liabilities other than that which will occur with the external financing.
6-4. Solution:
Antivirus, Inc.
$2,000,000 Sales .12 Profit Margin 240,000 Net income – 60,000 Dividends (25%)$ 180,000 Increase in retained earnings
$ 430,000 Increase in assets – 180,000 Increase in retained earnings $250,000 External funds needed
5. Level versus seasonal production (LO1) Antonio Banderos & Scarves makes headwear that is very popular in the fall-winter season. Units sold are anticipated as:
October..................................................... 1,000November................................................. 2,000December................................................. 4,000January..................................................... 3,000
10,000 units
If seasonal production is used, it is assumed that inventory will directly match sales for each month and there will be no inventory buildup.
However, Antonio decides to go with level production to avoid being out of merchandise. He will produce the 10,000 items over four months at a level of 2,500 per month.
a. What is the ending inventory at the end of each month? Compare the units sales to the units produced and keep a running total.
b. If the inventory costs $5 per unit and will be financed at the bank at a cost of 12 percent, what is the monthly financing cost and the total for the four months? (Use 1 percent or the monthly rate).
6-5. Solution:
6-6

Chapter 06: Working Capital and the Financing Decision
Antonio Banderos and Scarves
a. Units Sold
Units Produced
Change in inventory
Ending Inventory
October 1,000 2,500 +1,500 1,500November 2,000 2,500 + 500 2,000December 4,000 2,500 –1,500 500January 3,000 2,500 – 500 0
b.
Ending Inventory
Total CostPer Unit
($5 per unit)
Inventory Financing Cost
at (1% per month)
October 1,500 7,500 75November 2,000 10,000 100December 500 2,500 25January 0 0 0
Total Financing Cost = $200
6. Level versus seasonal production (LO1) Bambino Sporting Goods makes baseball gloves that are very popular in the spring and early summer season. Units sold are anticipated as follows:
March....................................................... 3,000April......................................................... 7,000May.......................................................... 11,000June.......................................................... 9,000 30,000
If seasonal production is used, it is assumed that inventory will directly match sales for each month and there will be no inventory buildup.
The production manager thinks the above assumption is too optimistic and decides to go with level production to avoid being out of merchandise. He will produce the 30,000 units over 4 months at a level of 7,500 per month.
6-7

Chapter 06: Working Capital and the Financing Decision
a. What is the ending inventory at the end of each month? Compare the unit sales to the units produced and keep a running total.
b. If the inventory costs $20 per unit and will be financed at the bank at a cost of 6 percent, what is the monthly financing cost and the total for the four months? (Use .5% as the monthly rate.)
6-6. Solution:
Bambino Sporting Goods
a. Units Sold
Units Produced
Change in Inventory
Ending Inventory
March 3,000 7,500 +4,500 4,500April 7,000 7,500 + 500 5,000May 11,000 7,500 –3,500 1,500June 9,000 7,500 –1,500 0
6-6. (Continued)
b.
Ending Inventory
Total Cost ($20 per unit)
Inventory Financing Cost
at (.5% per month)
March 4,500 90,000 $ 450April 5,000 100,000 500May 1,500 30,000 150June 0 0 0
Total Financing Cost = $1,100
6-8

Chapter 06: Working Capital and the Financing Decision
7. Short-term versus longer-term borrowing (LO3) Boatler Used Cadillac Co. requires $800,000 in financing over the next two years. The firm can borrow the funds for two years at 9 percent interest per year. Mr. Boatler decides to do forecasting and predicts that if he utilizes short-term financing instead, he will pay 6.75 percent interest in the first year and 10.55 percent interest in the second year. Determine the total two-year interest cost under each plan. Which plan is less costly?
6-7. Solution:
Boatler Used Cadillac Co.
Cost of Two Year Fixed Cost Financing
$800,000 borrowed @ 9% per annum × 2 years = $144,000 interest cost
Cost of Two Year Variable Short-term Financing
1st year $800,000 × 6.75% per annum = $54,000 interest cost2nd year $800,000 × 10.55% per annum = $84,400 interest cost
138,400 total interest cost
The short-term plan is less costly.
8. Short-term versus longer-term borrowing (LO3) Biochemical Corp. requires $500,000 in financing over the next three years. The firm can borrow the funds for three years at 10.60 percent interest per year. The CEO decides to do a forecast and predicts that if she utilizes short-term financing instead, she will pay 7.25 percent interest in the first year, 11.90 percent interest in the second year, and 8.15 percent interest in the third year. Determine the total interest cost under each plan. Which plan is less costly?
6-8. Solution:
Biochemical Corp.
Cost of Three Year Fixed Cost Financing
$500,000 borrowed × 10.60% per annum × 3 years = $159,000
6-9
Chapter 06: Working Capital and the Financing Decision
Cost of Three Year Variable Short-term Financing
1st year $500,000 × 7.25% Per annum = $ 36,250 Interest cost2nd year $500,000 × 11.90% Per annum = 59,500 Interest cost3rd year $500,000 × 8.15% Per annum = 40,750 Interest cost
$136,500 3-year total
The short-term plan is less costly.9. Short-term versus longer-term borrowing (LO3) Stern Educational TV, Inc., has
decided to buy a new computer system with an expected life of three years at a cost of $200,000. The company can borrow $200,000 for three years at 12 percent annual interest or for one year at 10 percent annual interest.
a. How much would the firm save in interest over the three-year life of the computer system if the one-year loan is utilized, and the loan is rolled over (reborrowed) each year at the same 10 percent rate? Compare this to the 12 percent three-year loan.
b. What if interest rates on the 10 percent loan go up to 15 percent in the second year and 18 percent in the third year? What would be the total interest cost compared to the 12 percent, three-year loan?
6-9. Solution:
Stern Educational TV, Inc.
a. If Rates Are Constant
$200,000 borrowed × 12% per annum × 3 years = $72,000 interest cost (long-term)
$200,000 borrowed × 10% per annum × 3 years = $60,000 interest cost (short-term)
$72,000 – $60,000 = $12,000 interest savings borrowing short-term
6-10

Chapter 06: Working Capital and the Financing Decision
b. If Short-term Rates Change
1st year $200,000 × .10 = $20,0002nd year $200,000 × .15 = $30,0003rd year $200,000 × .18 = $36,000
Total = $86,000
$86,000 – $72,000 = $14,000 extra interest costs borrowing short-term one year at a time.
10. Optimal policy mix (LO5) Assume that Hogan Surgical Instruments Co. has $2,000,000 in assets. If it goes with a low-liquidity plan for the assets, it can earn a return of 18 percent, but with a high liquidity plan, the return will be 14 percent. If the firm goes with a short-term financing plan, the financing costs on the $2,000,000 will be 10 percent, and with a long-term financing plan, the financing costs on the $2,000,000 will be 12 percent. (Review Table 6-11 for parts a, b, and c of this problem.)
a. Compute the anticipated return after financing costs with the most aggressive asset-financing mix.
b. Compute the anticipated return after financing costs with the most conservative asset-financing mix.
c. Compute the anticipated return after financing costs with the two moderate approaches to the asset-financing mix.
d. Would you necessarily accept the plan with the highest return after financing costs? Briefly explain.
6-10. Solution:
Hogan Surgical Instruments Company
a. Most aggressive
Low liquidity $2,000,000 × 18% = $360,000Short-term financing 2,000,000 × 10% = –200,000Anticipated return $160,000
6-11

Chapter 06: Working Capital and the Financing Decision
b. Most conservative
High liquidity $2,000,000 × 14% = $280,000Long-term financing 2,000,000 × 12% = –240,000Anticipated return $ 40,000
c. Moderate approach
Low liquidity $2,000,000 × 18% = $360,000Long-term financing 2,000,000 × 12% = –240,000
$120,000
OR
High liquidity $2,000,000 × 14% = $280,000Short-term financing 2,000,000 × 10% = –200,000
$ 80,0006-10. (Continued)
d. You may not necessarily select the plan with the highest return. You must also consider the risk inherent in the plan. Of course, some firms are better able to take risks than others. The ultimate concern must be for maximizing the overall valuation of the firm through a judicious consideration of risk-return options.
11. Optimal policy mix (LO5) Assume that Atlas Sporting Goods, Inc., has $800,000 in assets. If it goes with a low-liquidity plan for the assets, it can earn a return of 15 percent, but with a high-liquidity plan the return will be 12 percent. If the firm goes with a short-term financing plan, the financing costs on the $800,000 will be 8 percent, and with a long-term financing plan, the financing costs on the $800,000 will be 10 percent. (Review Table 6-11 for parts a, b, and c of this problem.)
a. Compute the anticipated return after financing costs with the most aggressive asset-financing mix.
b. Compute the anticipated return after financing costs with the most conservative asset-financing mix.
c. Compute the anticipated return after financing costs with the two moderate approaches to the asset-financing mix.
6-12

Chapter 06: Working Capital and the Financing Decision
d. If the firm used the most aggressive asset-financing mix described in part a and had the anticipated return you computed for part a, what would earnings per share be if the tax rate on the anticipated return was 30 percent and there were 20,000 shares outstanding?
e. Now assume the most conservative asset-financing mix described in part b will be utilized. The tax rate will be 30 percent. Also assume there will only be 5,000 shares outstanding. What will earnings per share be? Would it be higher or lower than the earnings per share computed for the most aggressive plan computed in part d?
6-11. Solution:
Atlas Sporting Goods, Inc.
a. Most aggressive
Low liquidity $800,000 × 15% = $120,000Short-term financing 800,000 × 8% = –64,000Anticipated return $ 56,000
b. Most conservative
High liquidity $800,000 × 12% = $ 96,000Long-term financing 800,000 × 10% = –80,000Anticipated return $ 16,000
6-11. (Continued)
c. Moderate approach
Low liquidity $800,000 × 15% = $120,000Long-term financing 800,000 × 10% = –80,000Anticipated return $ 40,000
OR
High liquidity $800,000 × 12% = $ 96,000Short-term financing 800,000 × 8% = –64,000Anticipated return $ 32,000
6-13

Chapter 06: Working Capital and the Financing Decision
d. Anticipated return $ 56,000– taxes (30%) 16,800Earnings after taxes 39,200Shares 20,000Earnings per share $1.96
e. Anticipated return $ 16,000–taxes (30%) 4,800Earnings after taxes 11,200Shares 5,000Earnings per share $2.24
It is higher ($2.24 vs. $1.96)
12. Matching asset mix and financing plans (LO3) Winfrey Diet Food Corp. has $4,500,000 in assets.
Temporary current assets......................... $1,000,000Permanent current assets.......................... 1,500,000Fixed assets.............................................. 2,000,000
Total assets......................................... $4,500,000
Short-term rates are 8 percent. Long-term rates are 13 percent. Earnings before interest and taxes are $960,000. The tax rate is 40 percent.
If long-term financing is perfectly matched (synchronized) with long-term asset needs, and the same is true of short-term financing, what will earnings after taxes be? For an example of perfectly matched plans, see Figure 6-5 on page 168.
6-12. Solution:
6-14

Chapter 06: Working Capital and the Financing Decision
Winfrey Diet Food Corporation
Long-term financing equals:
Permanent current assets $1,500,000Fixed assets 2,000,000
$3,500,000
Short-term financing equals:
Temporary current assets $1,000,000
Long-term interest expense = 13% × $3,500,000 = $ 455,000Short-term interest expense = 8% × 1,000,000 = 80,000Total interest expense $ 535,000
Earnings before interest and taxes $ 960,000Less Interest expense 535,000
Earnings before taxes $ 425,000Taxes (40%) 170,000
Earnings after taxes $ 255,000
13. Impact of term structure of interest rates on financing plans (LO4) In Problem 12, assume the term structure of interest rates becomes inverted, with short-term rates going to 12 percent and long-term rates 4 percentage points lower than short-term rates.
If all other factors in the problem remain unchanged, what will earnings after taxes be?
6-13. Solution:
6-15

Chapter 06: Working Capital and the Financing Decision
Winfrey Diet Food Corporation (Continued)
Long-term interest expense = 8% × $3,500,000 = $280,000Short-term interest expense = 12% × 1,000,000 = 120,000Total interest expense $400,000
Earnings before interest and taxes $960,000Interest expense 400,000
Earnings before taxes $560,000Taxes (40%) 224,000
Earnings after taxes $336,000
14. Conservative versus aggressive financing (LO5) Collins Systems, Inc., is trying to develop an asset-financing plan. The firm has $300,000 in temporary current assets and $200,000 in permanent current assets. Collins also has $400,000 in fixed assets.
a. Construct two alternative financing plans for the firm. One of the plans should be conservative, with 80 percent of assets financed by long-term sources and the rest financed by short-term sources. The other plan should be aggressive, with only 30 percent of assets financed by long-term sources and the remaining assets financed by short-term sources. The current interest rate is 15 percent on long-term funds and 10 percent on short-term financing. Compute the annual interest payments under each plan.
b. Given that Collins’s earnings before interest and taxes are $180,000, calculate earnings after taxes for each of your alternatives. Assume a tax rate of 40 percent.
6-14. Solution:
Collins System Inc.
a. Temporary current assets $300,000Permanent current assets 200,000Fixed assets 400,000Total assets $900,000
Conservative
% of Interest InterestAmount Total Rate Expense
6-16

Chapter 06: Working Capital and the Financing Decision
$900,000 × .80 = $720,000 ×.15 = $108,000 Long-term
6-17

Chapter 06: Working Capital and the Financing Decision
$900,000 × .20 = $180,000 ×.10 = 18,000 Short-term
Total interest charge $126,000
Aggressive
% of Interest InterestAmount Total Rate Expense$900,000 × .30 = $270,000 × .15 = $ 40,500 Long-term$900,000 × .70 = $630,000 × .10 = 63,000 Short-term
Total interest charge $103,500
6-14. (Continued)
b. Conservative AggressiveEBIT $180,000 $180,000–Int 126,000 103,500EBT 54,000 76,500Tax 40% 21,600 30,600EAT $ 32,400 $ 45,900
15. Alternative financing plans (LO5) Lear, Inc., has $800,000 in current assets, $350,000 of which are considered permanent current assets. In addition, the firm has $600,000 invested in fixed assets.
a. Lear wishes to finance all fixed assets and half of its permanent current assets with long-term financing costing 10 percent. The balance will be financed with short-term financing, which currently costs 5 percent. Lear’s earnings before interest and taxes are $200,000. Determine Lear’s earnings after taxes under this financing plan. The tax rate is 30 percent.
b. As an alternative, Lear might wish to finance all fixed assets and permanent current assets plus half of its temporary current assets with long-term financing and the balance with short-term financing. The same interest rates apply as in part a. Earnings before interest and taxes will be $200,000. What will be Lear’s earnings after taxes? The tax rate is 30 percent.
6-18

Chapter 06: Working Capital and the Financing Decision
c. What are some of the risks and cost considerations associated with each of these alternative financing strategies?
6-19

Chapter 06: Working Capital and the Financing Decision
6-15. Solution:
Lear, Inc.
a.
Current assets – permanent current assets = temporary current assets
$800,000 – $350,000 = $450,000
Long-term interest expense = 10% [$600,000 + ½ ($350,000)]= 10% ($775,000)= $77,500
Short-term interest expense = 5% [$450,000 + ½($350,000)]= 5% × ($625,000)= $31,250
Total interest expense = $77,500 + $31,250= $108,750
Earnings before interest and taxes $200,000 Interest expense 108,750Earnings before taxes $ 91,250 Taxes (30%) 27,375Earnings after taxes $ 63,875
6-15. (Continued)
b. Alternative financing plan
Long-term interest expense = 10% [$600,000 + $350,000+ ½ ($450,000)]
= 10% ($1,175,000)= $117,500
Short-term interest expense = 5% [½ ($450,000)]
6-20

Chapter 06: Working Capital and the Financing Decision
= 5% (225,000)
6-21

Chapter 06: Working Capital and the Financing Decision
= $11,250
Total interest expense =$117,500 + $11,250=$128,750
Earnings before interest and taxes $200,000Interest 128,750Earnings before taxes $ 71,250Taxes (30%) 21,375Earnings after taxes $ 49,875
c. The alternative financing plan which calls for more financing by high-cost debt is more expensive and reduces aftertax income by $14,000. However, we must not automatically reject this plan because of its higher cost since it has less risk. The alternative provides the firm with long-term capital which at times will be in excess of its needs and invested in marketable securities. It will not be forced to pay higher short-term rates on a large portion of its debt when short-term rates rise and will not be faced with the possibility of no short-term financing for a portion of its permanent current assets when it is time to renew the short-term loan.
16. Expectations hypothesis and interest rates (LO4) Using the expectations hypothesis theory for the term structure of interest rates, determine the expected return for securities with maturities of two, three, and four years based on the following data. Do an analysis similar to that in the right-hand portion of Table 6-6.
1-year T-bill at beginning of year 1……. 5%1-year T-bill at beginning of year 2……. 6%1-year T-bill at beginning of year 3……. 8%1-year T-bill at beginning of year 4……10%
6-16. Solution:
6-22

Chapter 06: Working Capital and the Financing Decision
2 year security (5% + 6%)/2 = 5.5%3 year security (5% + 6% + 8%)/3 = 6.33%4 year security (5% + 6% + 8% + 10%)/4 = 7.25%
17. Expectations hypothesis and interest rates (LO4) Using the expectations hypothesis theory for the term structure of interest rates, determine the expected return for securities with maturities of two, three, and four years based on the following data. Do an analysis similar to that in the right-hand portion of Table 6-6.
1-year T-bill at beginning of year 1…… 3%1-year T-bill at beginning of year 2…… 6%1-year T-bill at beginning of year 3…… 5%1-year T-bill at beginning of year 4…… 8%
6-17. Solution:
2 year security (3% + 6%)/2 = 4.50%3 year security (3% + 6% + 5%)/3 = 4.67%4 year security (3% + 6% + 5% + 8%)/4 = 5.50%
18. Interest costs under alternative plans (LO3) Carmen’s Beauty Salon has estimated monthly financing requirements for the next six months as follows:
January................. $8,000 April.................. $8,000February............... 2,000 May................... 9,000March................... 3,000 June................... 4,000
Short-term financing will be utilized for the next six months. Projected annual interest rates are:
January................. 8.0% April.................. 15.0%February............... 9.0% May................... 12.0%March................... 12.0% June................... 12.0%
a. Compute total dollar interest payments for the six months. To convert an annual rate to a monthly rate, divide by 12. Then multiply this value times the monthly balance. To get your answer sum up the monthly interest payments.
6-23

Chapter 06: Working Capital and the Financing Decision
b. If long-term financing at 12 percent had been utilized throughout the six months, would the total-dollar interest payments be larger or smaller? Compute the interest owed over the six months and compare your answer to that in part a.
6-18. Solution:
Carmen’s Beauty Salon
a. Short-term financing
Month RateOn Monthly
Basis AmountActual Interest
January 8% .67% $8,000 $ 53.60February 9% .75% $2,000 $ 15.00March 12% 1.00% $3,000 $ 30.00April 12% 1.25% $8,000 $100.00May 12% 1.00% $9,000 $ 90.00June 12% 1.00% $4,000 $ 40.00
$328.60
6-18. (Continued)
b. Long-term financing
Month RateOn Monthly
Basis AmountActual Interest
January 12% 1% $8,000 $ 80.00February 12% 1% $2,000 $ 20.00March 12% 1% $3,000 $ 30.00April 15% 1% $8,000 $ 80.00
6-24

Chapter 06: Working Capital and the Financing Decision
May 12% 1% $9,000 $ 90.00June 12% 1% $4,000 $ 40.00
$340.00
Total dollar interest payments would be larger under the long-term financing plan as described in part b.
19. Break-even point in interest rates (LO3) In Problem 18, what long-term interest rate would represent a break-even point between using short-term financing as described in part a and long-term financing? Hint: Divide the interest payments in 18a by the amount of total funds provided for the six months and multiply by 12.
6-19. Solution:
Carmen’s Beauty Salon (Continued)
Divide the total interest payments in part (a) of $328.60 by the total amount of funds extended $34,000 ($8,000 + 2,000 + 3,000 + 8,000 + 9,000 + 4,000) and multiply by 12.
20. Cash receipts schedule (LO1) Eastern Auto Parts, Inc. has 20 percent of its sales paid for in cash and 80 percent on credit. All credit accounts are collected in the following month.
Assume the following sales:
January $60,000
February 50,000
March 95,000
April 40,000
Sales in December of the prior year were $70,000.
Prepare a cash receipts schedule for January through April.
6-25

Chapter 06: Working Capital and the Financing Decision
6-20. Solution:
Eastern Auto Parts
Jan Feb Mar Apr
Sales $60,000 $50,000 $95,000 $40,00020% Cash Sales 12,000 10,000 19,000 8,00080% Prior month’s sales* 56,000 48,000 40,000 76,000Total cash receipts $68,000 $58,000 $59,000 $84,000
*based on December sales of $70,000
21. Level production and related financing effects (LO3) Bombs Away Video Games Corporation has forecasted the following monthly sales:
January.............. $95,000 July.............. $ 40,000February............ 88,000 August......... 40,000March................ 20,000 September. . . 50,000April.................. 20,000 October........ 80,000May................... 15,000 November.... 100,000June................... 30,000 December.... 118,000
Total annual sales = $696,000
Bombs Away Video Games sells the popular Strafe and Capture video game. Its sells for $5 per unit and costs $2 per unit to produce. A level production policy is followed. Each month’s production is equal to annual sales (in units) divided by 12.
Of each month’s sales, 30 percent are for cash and 70 percent are on account. All accounts receivable are collected in the month after the sale is made.
a. Construct a monthly production and inventory schedule in units. Beginning inventory in January is 20,000 units. (Note: To do part a, you should work in terms of units of production and units of sales.)
b. Prepare a monthly schedule of cash receipts. Sales in the December before the planning year are $100,000. Work part b using dollars.
c. Determine a cash payments schedule for January through December. The production costs of $2 per unit are paid for in the month in which they occur. Other cash payments, besides those for production costs, are $40,000 per month.
6-26

Chapter 06: Working Capital and the Financing Decision
d. Prepare a monthly cash budget for January through December using the cash receipts schedule from part b and the cash payments schedule from part c. The beginning cash balance is $5,000, which is also the minimum desired.
6-21. Solution:
Bombs Away Video Games Corporation
a. Production and inventory schedule in units
Beginning Inventory + Production1 – Sales2 =
Ending Inventory
Jan. 20,000 + 11,600 – 19,000 = 12,600
Feb. 12,600 + 11,600 – 17,600 = 6,600
Mar. 6,600 + 11,600 – 4,000 = 14,200
Apr. 14,200 + 11,600 – 4,000 = 21,800May 21,800 + 11,600 – 3,000 = 30,400June 30,400 + 11,600 – 6,000 = 36,000July 36,000 + 11,600 – 8,000 = 39,600Aug. 39,600 + 11,600 – 8,000 = 43,200Sept. 43,200 + 11,600 – 10,000 = 44,800Oct. 44,800 + 11,600 – 16,000 = 40,400Nov. 40,400 + 11,600 – 20,000 = 32,000Dec. 32,000 + 11,600 – 23,600 = 20,000
1 Total annual sales = $696,000 $696,000/$5 per unit = 139,200 units 139,200 units/12 months = 11,600 per month2 Monthly dollar sales/$5 price = unit sales
6-27

Chapter 06: Working Capital and the Financing Decision
6-21. (Continued)
b.Bombs Away Video Games Corporation
Cash Receipts Schedule
Jan. Feb. Mar. Apr. May June
Sales (in dollars) $95,000 $88,000 $20,000 $20,000 $15,000 $30,00030% Cash sales 28,500 26,400 6,000 6,000 4,500 9,00070% Prior month’s sales 70,000 * 66,500 61,600 14,000 14,000 10,500 Total cash receipts $98,500 $92,900 $67,600 $20,000 $18,500 $19,500
*based on December sales of $100,000
July Aug. Sept. Oct. Nov. Dec.Sales (in dollars) $40,000 $40,000 $50,000 $80,000 $100,000 $118,00030% Cash sales 12,000 12,000 15,000 24,000 30,000 35,40070% Prior month’s sales 21,000 28,000 28,000 35,000 56,000 70,000 Total cash receipts $33,000 $40,000 $43,000 $59,000 $ 86,000 $105,400
6-28

Chapter 06: Working Capital and the Financing Decision
6-21. (Continued)
c.Bombs Away Video Games Corporation
Cash Payments Schedule
Constant production
Jan. Feb. Mar. Apr. May June
11,600 units × $2 $23,200 $23,200 $23,200 $23,200 $23,200 $23,200Other cash payments 40,000 40,000 40,000 40,000 40,000 40,000 Total cash payments $63,200 $63,200 $63,200 $63,200 $63,200 $63,200
July Aug. Sept. Oct. Nov. Dec.
11,600 units × $2 $23,200 $23,200 $23,200 $23,200 $23,200 $23,200Other cash payments 40,000 40,000 40,000 40,000 40,000 40,000 Total cash payments $63,200 $63,200 $63,200 $63,200 $63,200 $63,200
6-29

Chapter 06: Working Capital and the Financing Decision
6-21. (Continued)
d.Bombs Away Video Games Corporation
Cash Budget
Jan. Feb. Mar. Apr. May June
Net cash flow $35,300 $29,700 $ 4,400 ($43,200) ($44,700) ($43,700)Beginning cash 5,000 40,300 70,000 74,400 31,200 5,000Cumulative cash balance 40,300 70,000 74,400 31,200 (13,500) (38,700)Monthly loan or (repayment) -0- -0- -0- -0- 18,500 43,700Cumulative loan -0- -0- -0- -0- 18,500 62,200Ending cash balance 40,300 70,000 74,400 31,200 5,000 5,000
July Aug. Sept. Oct. Nov. Dec.
Net cash flow ($30,200) ($23,200) ($20,200) ($4,200) $22,800 $42,200Beginning cash 5,000 5,000 5,000 5,000 5,000 5,000Cumulative cash balance (25,200) (18,200) (15,200) 800 27,800 47,200Monthly loan or (repayment) 30,200 23,200 20,200 4,200 (22,800) (42,200)Cumulative loan 92,400 115,600 135,800 140,000 117,200 75,000Ending cash balance 5,000 5,000 5,000 5,000 5,000 5,000
6-30

Chapter 06: Working Capital and the Financing Decision
22. Level production and related financing effects (LO3) Esquire Products, Inc., expects the following monthly sales:
January.............. $24,000 May............. $4,000 September......... $25,000
February............ 15,000 June............. 2,000 October.............. 30,000
March................ 8,000 July.............. 18,000 November.......... 38,000
April.................. 10,000 August......... 22,000 December.......... 20,000
Total sales = $216,000
Cash sales are 40 percent in a given month, with the remainder going into accounts receivable. All receivables are collected in the month following the sale. Esquire sells all of its goods for $2 each and produces them for $1 each. Esquire uses level production, and average monthly production is equal to annual production divided by 12.
a. Generate a monthly production and inventory schedule in units. Beginning inventory in January is 8,000 units. (Note: To do part a, you should work in terms of units of production and units of sales.)
b. Determine a cash receipts schedule for January through December. Assume that dollar sales in the prior December were $20,000. Work part b using dollars.
c. Determine a cash payments schedule for January through December. The production costs ($1 per unit produced) are paid for in the month in which they occur. Other cash payments (besides those for production costs) are $7,000 per month.
d. Construct a cash budget for January through December using the cash receipts schedule from part b and the cash payments schedule from part c. The beginning cash balance is $3,000, which is also the minimum desired.
e. Determine total current assets for each month. Include cash, accounts receivable, and inventory. Accounts receivable equal sales minus 40 percent of sales for a given month. Inventory is equal to ending inventory (part a) times the cost of $1 per unit.
6-31

Chapter 06: Working Capital and the Financing Decision
6-22. Solution:
Esquire Products, Inc.
a. Production and inventory schedule in units
Beginning Inventory + Production1 – Sales2 =
Ending Inventory
Jan. 8,000 + 9,000 – 12,000 = 5,000Feb. 5,000 + 9,000 – 7,500 = 6,500Mar. 6,500 + 9,000 – 4,000 = 11,500Apr. 11,500 + 9,000 – 5,000 = 15,500May 15,500 + 9,000 – 2,000 = 22,500June 22,500 + 9,000 – 1,000 = 30,500July 30,500 + 9,000 – 9,000 = 30,500Aug. 30,500 + 9,000 – 11,000 = 28,500Sept. 28,500 + 9,000 – 12,500 = 25,000Oct. 25,000 + 9,000 – 15,000 = 19,000Nov. 19,000 + 9,000 – 19,000 = 9,000Dec. 9,000 + 9,000 – 10,000 = 8,000
1 $216,000 sales/$2 price = 108,000 units 108,000 units/12 months = 9,000 units per month2 Monthly dollar sales/$2 = number of units
6-32

Chapter 06: Working Capital and the Financing Decision
6-22. (Continued)
b.
Esquire Products, Inc.
Cash Receipts Schedule (take dollar values from problem statement)
Jan. Feb. Mar. Apr. May June
Sales (in dollars) $24,000 $15,000 $ 8,000 $10,000 $4,000 $2,00040% Cash sales 9,600 6,000 3,200 4,000 1,600 80060% Prior month’s sales 12,000* 14,400 9,000 4,800 6,000 2,400 Total receipts $21,600 $20,400 $12,200 $ 8,800 $7,600 $3,200
*based on December sales of $20,000
July Aug. Sept. Oct. Nov. Dec.
Sales (in dollars) $18,000 $22,000 $25,000 $30,000 $38,000 $20,00040% Cash sales 7,200 8,800 10,000 12,000 15,200 8,00060% Prior month’s sales 1,200 10,800 13,200 15,000 18,000 22,800 Total receipts $ 8,400 $19,600 $23,200 $27,000 $33,200 $30,800
6-33

Chapter 06: Working Capital and the Financing Decision
6-22. (Continued)
c.
Esquire Products, Inc.
Cash Payments Schedule
Constant production
Jan. Feb. Mar. Apr. May June
9,000 units × $1 $ 9,000 $ 9,000 $ 9,000 $ 9,000 $ 9,000 $ 9,000Other cash payments 7,000 7,000 7,000 7,000 7,000 7,000 Total payments $16,000 $16,000 $16,000 $16,000 $16,000 $16,000
July Aug. Sept. Oct. Nov. Dec.
9,000 units × $1 $ 9,000 $ 9,000 $ 9,000 $ 9,000 $ 9,000 $ 9,000Other cash payments 7,000 7,000 7,000 7,000 7,000 7,000 Total cash payments $16,000 $16,000 $16,000 $16,000 $16,000 $16,000
6-34

Chapter 06: Working Capital and the Financing Decision
6-22. (Continued)
d.
Esquire Products, Inc.
Cash Budget
Jan. Feb. Mar. Apr. May June
Cash flow $5,600 $ 4,400 ($3,800) ($ 7,200) ($ 8,400) ($12,800)Beginning cash 3,000 8,600 13,000 9,200 3,000 3,000Cumulative cash balance 8,600 13,000 9,200 2,000 (5,400) (9,800)Monthly loan or (repayment) -0- -0- -0- 1,000 8,400 12,800Cumulative loan -0- -0- -0- 1,000 9,400 22,200Ending cash balance $8,600 $13,000 $9,200 $3,000 $3,000 $ 3,000
July Aug. Sept. Oct. Nov. Dec.
Cash flow ($ 7,600) ($3,600) $ 7,200 $ 11,000 $17,200 $ 14,800Beginning cash 3,000 3,000 3,000 3,000 3,000 12,200Cumulative cash balance (4,600) 6,600 10,200 14,000 20,200 27,000Monthly loan or (repayment) 7,600 (3,600) (7,200) (11,000) (8,000) -0-Cumulative loan 29,800 26,200 19,000 8,000 -0- -0-Ending cash balance $ 3,000 $ 3,000 $ 3,000 $ 3,000 $12,200 $27,000
6-35

Chapter 06: Working Capital and the Financing Decision
6-22. (Continued)
e.
Esquire Products, Inc.Assets
CashAccounts
Receivable InventoryTotal
Current
Jan. $ 8,600 $14,400 $5,000 $28,000Feb. 13,000 9,000 6,500 28,500Mar. 9,200 4,800 11,500 25,500Apr. 3,000 6,000 15,500 24,500May 3,000 2,400 22,500 27,900June 3,000 1,200 30,500 34,700July 3,000 10,800 30,500 44,300Aug. 3,000 13,200 28,500 44,700Sept. 3,000 15,000 25,000 43,000Oct. 3,000 18,000 19,000 40,000Nov. 12,200 22,800 9,000 44,000Dec. 27,000 12,000 8,000 47,000
The instructor may wish to point out how current assets are at relatively high levels and illiquid during June through October. In November and particularly December, the asset levels remain high, but they become increasingly more liquid as inventory diminishes relative to cash.
6-36
Related Documents
![Chap006 [호환 모드] - khu.ac.kr](https://static.cupdf.com/doc/110x72/61987503bfda273fcc3d5f82/chap006-khuackr.jpg)