1.1 General Backg The financial crisis tha to the sub-prime lendi estate has led to the Liquidity Crisis in fina confidence of the inve thus the economic gro reason that the GDP o However with the v measures being taken institutions, the world and hence in domestic the world economy wi growth rate of our nei were 5.6 and 8.7 in 200 1 CHAPTER - ONE INTRODUCTION ground at arose post 2007 (first major crisis after Wo ing in US and subsequent non-recovery of t e economic slowdown of almost all deve ancial sector as well as bearish trend in stoc estors low, resulting in the decrease in aggre owth of the world economies was hampered of the world expanded only by 3.2% in 2008 various measures like capital injection an n by central banks, government and inte economy has slowly been recovering by incr c and external demand. Hence it has been esti ill grow by 3.9% as per the estimate of IMF ighbourhood countries the economic growth 09. It is estimated that the same will be 7.7% Table 1.1 World Economic Growth Rate orld War II era) due those credit in real eloped economies. ck market made the egate demand (AD) d. That is the only and 0.8% in 2009. nd other monetary ernational financial rease of confidence imated that in 2010 F. If we look at the of India and China % and 10% in 2010.

Welcome message from author
This document is posted to help you gain knowledge. Please leave a comment to let me know what you think about it! Share it to your friends and learn new things together.
Transcript
1
CHAPTER - ONE
INTRODUCTION
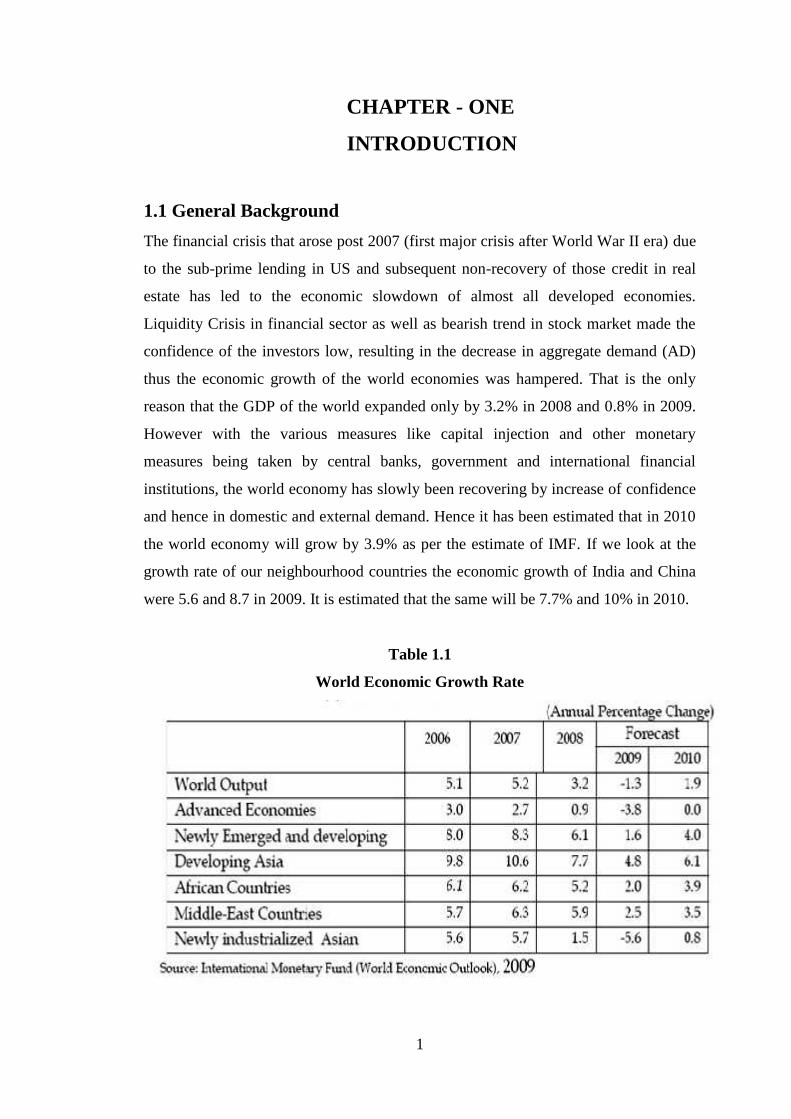
1.1 General Background
The financial crisis that arose post 2007 (first major crisis after World War II era) due
to the sub-prime lending in US and subsequent non-recovery of those credit in real
estate has led to the economic slowdown of almost all developed economies.
Liquidity Crisis in financial sector as well as bearish trend in stock market made the
confidence of the investors low, resulting in the decrease in aggregate demand (AD)
thus the economic growth of the world economies was hampered. That is the only
reason that the GDP of the world expanded only by 3.2% in 2008 and 0.8% in 2009.
However with the various measures like capital injection and other monetary
measures being taken by central banks, government and international financial
institutions, the world economy has slowly been recovering by increase of confidence
and hence in domestic and external demand. Hence it has been estimated that in 2010
the world economy will grow by 3.9% as per the estimate of IMF. If we look at the
growth rate of our neighbourhood countries the economic growth of India and China
were 5.6 and 8.7 in 2009. It is estimated that the same will be 7.7% and 10% in 2010.
Table 1.1
World Economic Growth Rate
1
CHAPTER - ONE
INTRODUCTION
1.1 General Background
The financial crisis that arose post 2007 (first major crisis after World War II era) due
to the sub-prime lending in US and subsequent non-recovery of those credit in real
estate has led to the economic slowdown of almost all developed economies.
Liquidity Crisis in financial sector as well as bearish trend in stock market made the
confidence of the investors low, resulting in the decrease in aggregate demand (AD)
thus the economic growth of the world economies was hampered. That is the only
reason that the GDP of the world expanded only by 3.2% in 2008 and 0.8% in 2009.
However with the various measures like capital injection and other monetary
measures being taken by central banks, government and international financial
institutions, the world economy has slowly been recovering by increase of confidence
and hence in domestic and external demand. Hence it has been estimated that in 2010
the world economy will grow by 3.9% as per the estimate of IMF. If we look at the
growth rate of our neighbourhood countries the economic growth of India and China
were 5.6 and 8.7 in 2009. It is estimated that the same will be 7.7% and 10% in 2010.
Table 1.1
World Economic Growth Rate
2
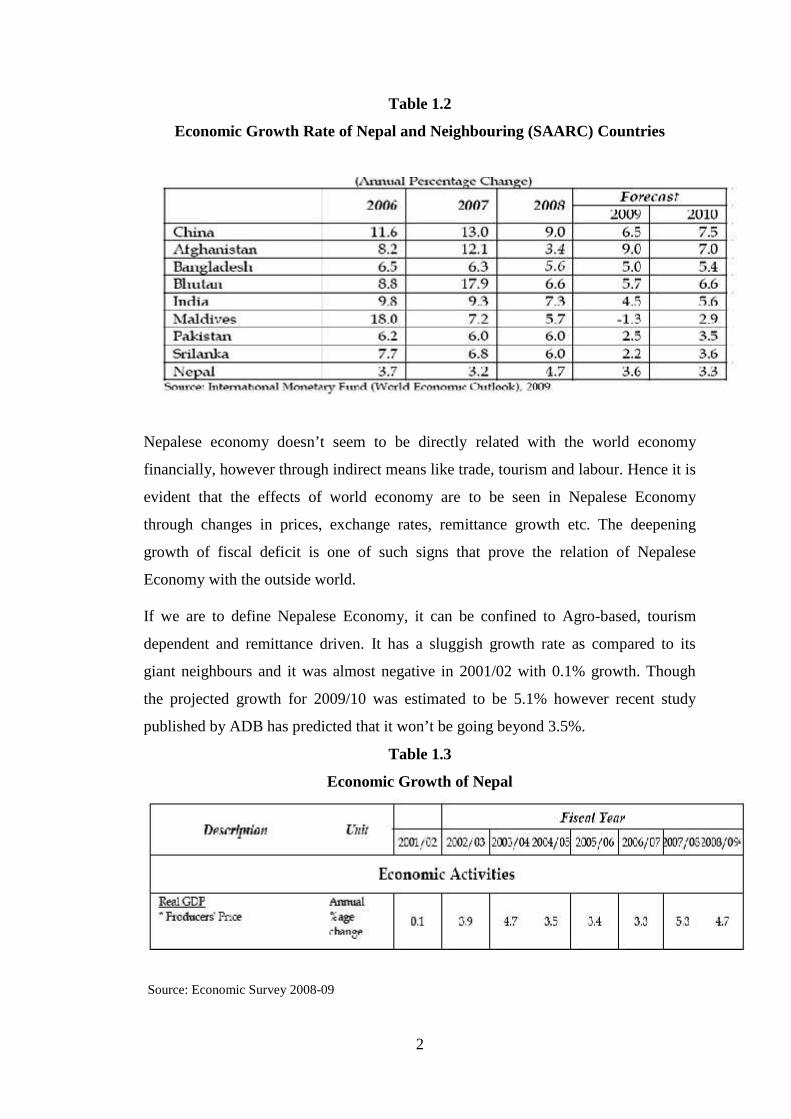
Table 1.2
Economic Growth Rate of Nepal and Neighbouring (SAARC) Countries
Nepalese economy doesn’t seem to be directly related with the world economy
financially, however through indirect means like trade, tourism and labour. Hence it is
evident that the effects of world economy are to be seen in Nepalese Economy
through changes in prices, exchange rates, remittance growth etc. The deepening
growth of fiscal deficit is one of such signs that prove the relation of Nepalese
Economy with the outside world.
If we are to define Nepalese Economy, it can be confined to Agro-based, tourism
dependent and remittance driven. It has a sluggish growth rate as compared to its
giant neighbours and it was almost negative in 2001/02 with 0.1% growth. Though
the projected growth for 2009/10 was estimated to be 5.1% however recent study
published by ADB has predicted that it won’t be going beyond 3.5%.
Table 1.3
Economic Growth of Nepal
Source: Economic Survey 2008-09
2
Table 1.2
Economic Growth Rate of Nepal and Neighbouring (SAARC) Countries
Nepalese economy doesn’t seem to be directly related with the world economy
financially, however through indirect means like trade, tourism and labour. Hence it is
evident that the effects of world economy are to be seen in Nepalese Economy
through changes in prices, exchange rates, remittance growth etc. The deepening
growth of fiscal deficit is one of such signs that prove the relation of Nepalese
Economy with the outside world.
If we are to define Nepalese Economy, it can be confined to Agro-based, tourism
dependent and remittance driven. It has a sluggish growth rate as compared to its
giant neighbours and it was almost negative in 2001/02 with 0.1% growth. Though
the projected growth for 2009/10 was estimated to be 5.1% however recent study
published by ADB has predicted that it won’t be going beyond 3.5%.
Table 1.3
Economic Growth of Nepal
Source: Economic Survey 2008-09
3
We went through a decade long conflict due to Maoists movements, faced winning
corruption, made good plans without implementation and there were all other sorts of
default by the government. There have been security issues in the industries, labour
management conflict has been in peak over years and there is little infrastructure
development in recent years. Long hour load shedding due to power shortages has
been long hampering the economic production as the major power source of Nepal is
Hydro Power (about 91%) which fails to produce enough energy during dry seasons.
In spite of all these economic problems, the only sector that has been earning a
continuous profit and performing well in all adversaries is the Banking Sector in
Nepalese Economy. Banking has a major contribution to the Nepalese Economy as it
has been the major player that is channelling the various sources of funds to the
investors and entrepreneurs.
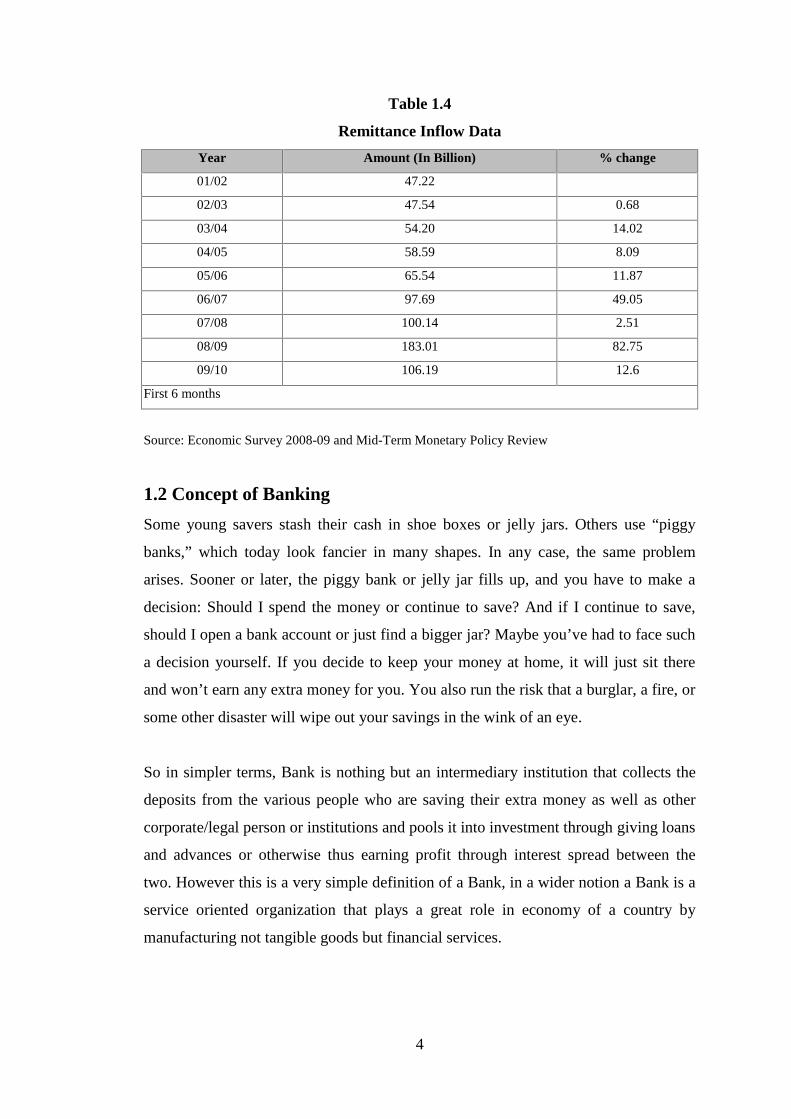
According to the recent study around 47% of the total population is currently virtually
unemployed with large and long dependence in unproductive agricultural economy.
Hence the only option remaining with the people is to go outside the country for
cheap labour work and send back some remittance to help support the family. The
labour export thus in lack of growth of other industries is the only sole saver from
Nepal going into bankrupt country by sending massive amount of remittance. The
development of banking sector also goes to the outstanding growth in remittance
income to the country which ultimately increased the deposit funds to the banks. The
growth of remittance in the past years including the establishment of the new
banks/financial institutions and expansion of branches of existing banks/financial
institutions led to the growth of deposits. The table below depicts the growth and
volume of contribution of remittance to the Nepalese Economy.
4
Table 1.4
Remittance Inflow Data
Year Amount (In Billion) % change
01/02 47.22
02/03 47.54 0.68
03/04 54.20 14.02
04/05 58.59 8.09
05/06 65.54 11.87
06/07 97.69 49.05
07/08 100.14 2.51
08/09 183.01 82.75
09/10 106.19 12.6
First 6 months
Source: Economic Survey 2008-09 and Mid-Term Monetary Policy Review
1.2 Concept of Banking
Some young savers stash their cash in shoe boxes or jelly jars. Others use “piggy
banks,” which today look fancier in many shapes. In any case, the same problem
arises. Sooner or later, the piggy bank or jelly jar fills up, and you have to make a
decision: Should I spend the money or continue to save? And if I continue to save,
should I open a bank account or just find a bigger jar? Maybe you’ve had to face such
a decision yourself. If you decide to keep your money at home, it will just sit there
and won’t earn any extra money for you. You also run the risk that a burglar, a fire, or
some other disaster will wipe out your savings in the wink of an eye.
So in simpler terms, Bank is nothing but an intermediary institution that collects the
deposits from the various people who are saving their extra money as well as other
corporate/legal person or institutions and pools it into investment through giving loans
and advances or otherwise thus earning profit through interest spread between the
two. However this is a very simple definition of a Bank, in a wider notion a Bank is a
service oriented organization that plays a great role in economy of a country by
manufacturing not tangible goods but financial services.
5
Modern Banks not only accept deposits, make lending, issue and accept cheques, but
they are involved in lot more complex businesses like electronic fund transfers,
investment banking, forex transactions, merchant banking, insurance, treasury,
financial advisory, credit rating, lease financing, export credit, consumer financing,
managing retirement plans and lot more.
A Bank is different from any other organization because it deals in the most liquid
asset, i.e. Money and thus it is operating in a critical environment. It is involved in
creation of money through issue of near money negotiable instruments and giving
loans and advances which in turn become the deposit in itself again. If some depositor
comes and asks back his money a bank cannot say that you take a cup of tea today,
we’ll give it to you tomorrow.
Origin
The name bank is said to be derived from the Italian word banco "desk/bench", used
during the Renaissance by Florentines bankers, who used to make their transactions
above a desk covered by a green tablecloth. However, there are traces of banking
activity even in ancient times.
In fact, the word traces its origins back to the Ancient Roman Empire, where
moneylenders would set up their stalls in the middle of enclosed courtyards
called macella on a long bench called a bancu, from which the words banco
and bank are derived. As a moneychanger, the merchant at the bancu did not so much
invest money as merely convert the foreign currency into the only legal tender in
Rome- that of the Imperial Mint.
There are few other words like “Back” in Germany and “Banke” in French that are
also believed to be the origin of the word Bank. No matter whether the world Bank
has been derived from any one of the above words, but all these words have the same
meaning of joint stock company that collect deposits and provides loan to the public.
The first bank Casa de san Giorgio in Genoa was established in 1148 A.D. Bank of
Vanice was established in 1147 A.D. In 1401 Bank of Barcelona was established in
Barcelona. Modern Bank started to take rapid speed from 7th century. In 1609, the
Bank of Amsterdam was established. Likewise in 1610 A.D. Bank of Humburg was
6
established in Germany. The first central bank was established in 1844 A.D. as “The
Bank of England”.
In context of Nepal the first bank is Nepal Bank Limited established in 1994 and the
central Bank of Nepal, Nepal Rastra Bank (NRB) was established in 2013 only.
Definitions
To further clarify the concept of Bank, here are few standard definitions:
According to Shorter Oxford English Dictionary “A bank is an establishment for the
custody of money its essential duty is to pay their draft on it, its profit arises from its
use of the money left unemployed by them.”
According to G.S. Crowther “A bank is an institution which collects money from
those who have in spare or who are saving it out of their income and lends this out to
those who require it.”
All the various definitions of scholars point out the definition of the bank as a
financial or business institution, which plays a role of financial intermediary in the
economy of a country.
1.3 Development of Banking Sector in Nepal
The banking sector in Nepal has developed to its current state in a gradual process.
From it’s evolution that can be traced back to the establishment of “kausi toshi khana”
as banking agency during the time of Prithivi Narayan Shah and “Tejarath Adda” to it
current expansion of above 260 Financial Institutions, it has come a long way.
History of Banking in Nepal
The History of Banking in Nepal can be summarized in 5 distinct phases:
Ist Phase of Nepalese Banking
The first phase of Banking in Nepal can be traced to very primitive stage when a
merchant named Shankhadhar had started the “New Year” Nepal Sambat after freeing
all the people of Kathmandu from the debt. This record proves the existence of money
7
lending function at that time as well. King Jayasthiti Malla had given the
responsibility to a caste of society called “Tankadhari” while he had given the name
of the castes as per their profession, for the purpose of transaction of money in the
society.
Government had established “Tejarath Adda” for the purpose of giving loan to
government officials and the people against gold and silver during 1933 B.S. though it
didn’t accepted the deposit. The establishment of this institution marked the beginning
of organized financial institution in Nepal.
2nd Phase of Nepalese Banking
The replacement of “Tejarath Adda” by Nepal Bank Limited as the first commercial
bank on 30th Kartik 1994 B.S. marked the second phase of Banking Development.
Nepal Bank limited was established with an authorized capital of Rs. 10 million.
Sadar Muluki Khana of His Majesty’s Government brought into circulation of 5, 10
and 100 Rs. Notes. At first Nepal Bank Limited was given the role of central bank
with modern banking facilities. However with time, it was necessary to establish
separate central bank.
Nepal Rastra Bank was established in 2013 Baisakh 14th in Nepal under NRB Act
2012 which has been replaced now by NRB Act 2058 due to change in scenario now
and then. The central bank of Nepal issued notes on 7th Falgun 2016 B.S. for the first
time. The then objectives was to replace Indian currency prevalent in that time by
Nepalese Note circulation, to stop dual monetary system, to apply monetarism in all
part of Nepal, to provided issuance of note, to bring Nepalese currency in use, to
manage the monetary system well, to encourage national industry by mobilizing the
capital for development and to develop the banking system in Nepal. Its objective has
been changed to maintenance of positive balance of payment and maintaining
exchange rates as well as regulation, supervision and inspection of Banks and
Financial Institution by NRB Act 2058.
Following the established of NBL and NRB, Rastriya Banijya Bank was established
in 2022 under Banijya Bank Act 2021 according to the recommendation of NRB.
8
RBB went into problem along with NBL due to high Non Performing Assets and has
been slowly recovering with the restructuring program of NRB.
Agriculture Development Bank was established on 7th Magh 2024 to play a positive
role in the agricultural development and financing the agricultural finance needs. This
was the first institution in agricultural financing.
3rd Phase of Nepalese Banking
There was gap of around 2 decades after that for further establishment of other Banks.
It was only in 2040 that the Joint Venture Bank Nepal Arab Bank Limited (NABIL)
was established under the Commercial Bank Act 2031 and Companies Act 2021.
Further to that two other joint venture banks Nepal Investment Bank Limited (the
Nepal Indosuez Bank) and Standard Chartered Bank Limited (then Grindlays Bank
Limited) was established in 2042 and 2043.
Many other joint venture banks were established after that like Himalayan Bank
Limited (JV of Habib Bank of Pakistan), Nepal SBI Bank Limited (JV of SBI India),
Nepal Bangladesh Bank Limited (JV of International Finance Investment and
Commerce, Bangladesh), Everest Bank Limited (JV of Punjab National Bank, India),
Bank of Kathmandu (JV of Syan Bank of Thailand), Nepal Credit and Commerce
(former bank of Ceylon, JV of Srilankan and Nepalese investors). So third phase of
Nepalese Banking Development saw the foreign investment in Nepal grow in
Banking sector. Along with it grew the other local banks like Lumbini Bank Limited,
Machhapuchhre Bank Limited as regional based banks and Laxmi Bank Limited,
Siddhartha Bank, Kumari Bank etc in Kathmandu.
4th Phase of Nepalese Banking
With deregulation and liberalization of Banking Sector thus giving the interest
fixation capability to the Banks themselves determined by the demand supply
chemistry as well as concept of regional banking and development banking, it marked
encouraging progress and the massive expansion of various types of banks and thus
the 4th Phase of Nepalese Banking. With the promulgation of NRB Act 2058
(Amendment 2063) and Bank and Financial Institutions Act 2063 that categorized the
banks into various categories as per the capital requirement and forms of transactions
9
possible to be done by them, many financial institutions sprouted, at national as well
as regional level. The range of financial inclusiveness has widened, environment for
capital mobilization eased, and opportunities in the banking sector extended with the
expansion of the financial sector. In order to check the sprouting financial institutions,
NRB had to revise its licensing policy and increase the capital requirement for various
categories of Banks and Financial Institutions.
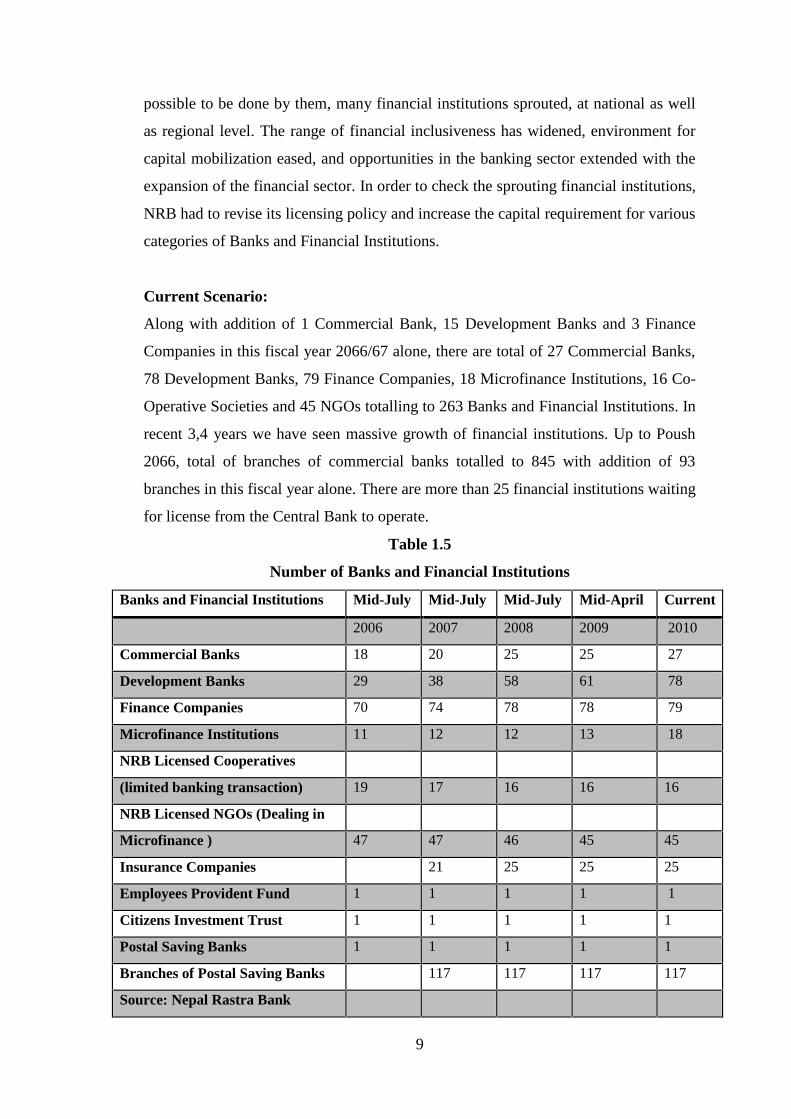
Current Scenario:
Along with addition of 1 Commercial Bank, 15 Development Banks and 3 Finance
Companies in this fiscal year 2066/67 alone, there are total of 27 Commercial Banks,
78 Development Banks, 79 Finance Companies, 18 Microfinance Institutions, 16 Co-
Operative Societies and 45 NGOs totalling to 263 Banks and Financial Institutions. In
recent 3,4 years we have seen massive growth of financial institutions. Up to Poush
2066, total of branches of commercial banks totalled to 845 with addition of 93
branches in this fiscal year alone. There are more than 25 financial institutions waiting
for license from the Central Bank to operate.
Table 1.5
Number of Banks and Financial Institutions
Banks and Financial Institutions Mid-July Mid-July Mid-July Mid-April Current
2006 2007 2008 2009 2010
Commercial Banks 18 20 25 25 27
Development Banks 29 38 58 61 78
Finance Companies 70 74 78 78 79
Microfinance Institutions 11 12 12 13 18
NRB Licensed Cooperatives
(limited banking transaction) 19 17 16 16 16
NRB Licensed NGOs (Dealing in
Microfinance ) 47 47 46 45 45
Insurance Companies 21 25 25 25
Employees Provident Fund 1 1 1 1 1
Citizens Investment Trust 1 1 1 1 1
Postal Saving Banks 1 1 1 1 1
Branches of Postal Saving Banks 117 117 117 117
Source: Nepal Rastra Bank
10
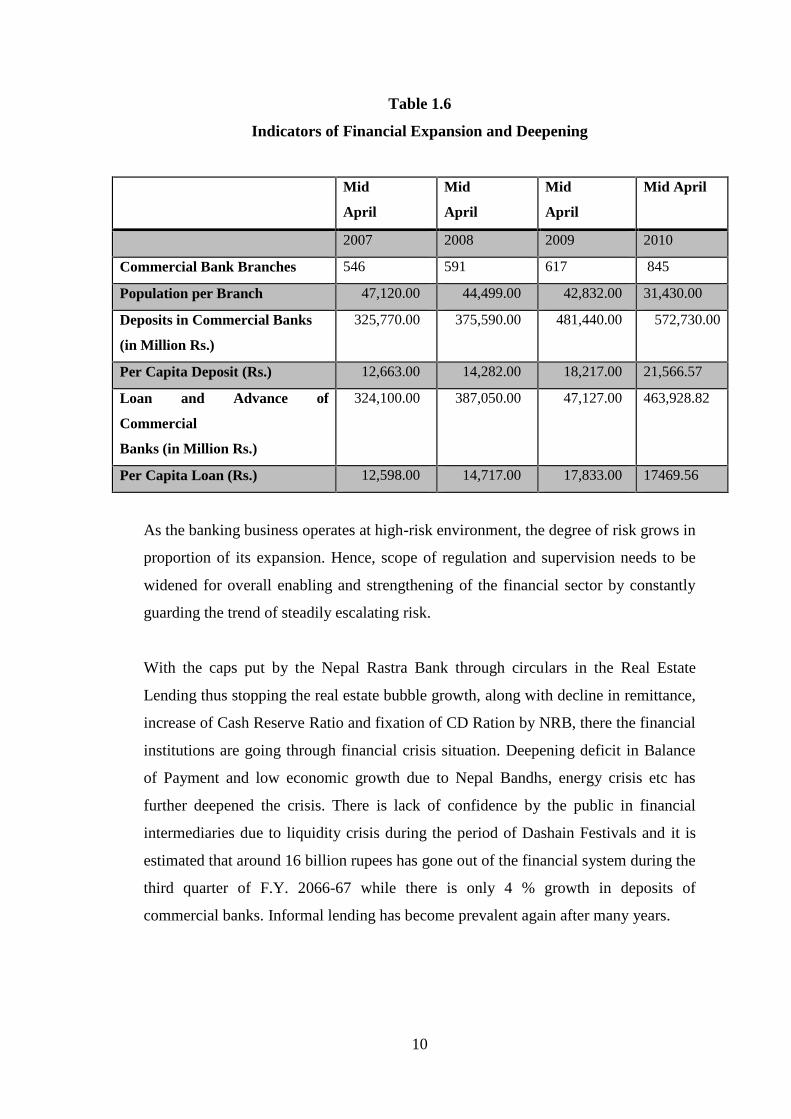
Table 1.6
Indicators of Financial Expansion and Deepening
Mid
April
Mid
April
Mid
April
Mid April
2007 2008 2009 2010
Commercial Bank Branches 546 591 617 845
Population per Branch 47,120.00 44,499.00 42,832.00 31,430.00
Deposits in Commercial Banks
(in Million Rs.)
325,770.00 375,590.00 481,440.00 572,730.00
Per Capita Deposit (Rs.) 12,663.00 14,282.00 18,217.00 21,566.57
Loan and Advance of
Commercial
Banks (in Million Rs.)
324,100.00 387,050.00 47,127.00 463,928.82
Per Capita Loan (Rs.) 12,598.00 14,717.00 17,833.00 17469.56
As the banking business operates at high-risk environment, the degree of risk grows in
proportion of its expansion. Hence, scope of regulation and supervision needs to be
widened for overall enabling and strengthening of the financial sector by constantly
guarding the trend of steadily escalating risk.
With the caps put by the Nepal Rastra Bank through circulars in the Real Estate
Lending thus stopping the real estate bubble growth, along with decline in remittance,
increase of Cash Reserve Ratio and fixation of CD Ration by NRB, there the financial
institutions are going through financial crisis situation. Deepening deficit in Balance
of Payment and low economic growth due to Nepal Bandhs, energy crisis etc has
further deepened the crisis. There is lack of confidence by the public in financial
intermediaries due to liquidity crisis during the period of Dashain Festivals and it is
estimated that around 16 billion rupees has gone out of the financial system during the
third quarter of F.Y. 2066-67 while there is only 4 % growth in deposits of
commercial banks. Informal lending has become prevalent again after many years.
11
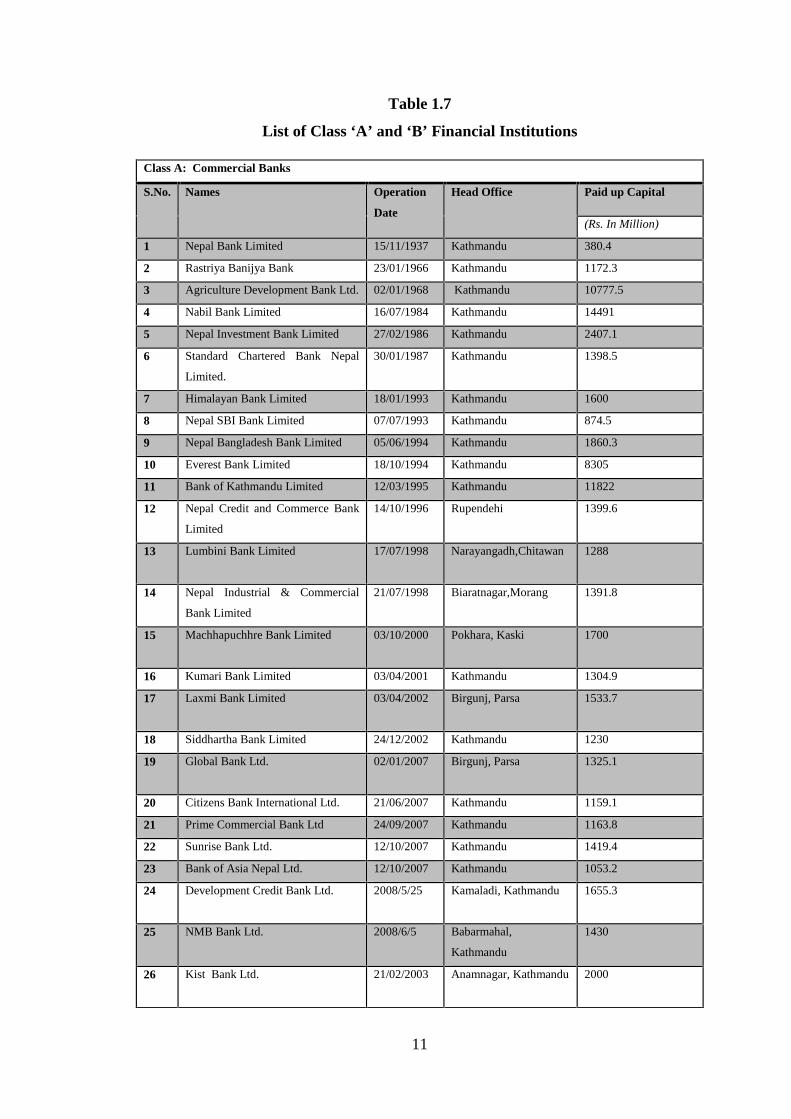
Table 1.7
List of Class ‘A’ and ‘B’ Financial Institutions
Class A: Commercial Banks
S.No. Names Operation
Date
Head Office Paid up Capital
(Rs. In Million)
1 Nepal Bank Limited 15/11/1937 Kathmandu 380.4
2 Rastriya Banijya Bank 23/01/1966 Kathmandu 1172.3
3 Agriculture Development Bank Ltd. 02/01/1968 Kathmandu 10777.5
4 Nabil Bank Limited 16/07/1984 Kathmandu 14491
5 Nepal Investment Bank Limited 27/02/1986 Kathmandu 2407.1
6 Standard Chartered Bank Nepal
Limited.
30/01/1987 Kathmandu 1398.5
7 Himalayan Bank Limited 18/01/1993 Kathmandu 1600
8 Nepal SBI Bank Limited 07/07/1993 Kathmandu 874.5
9 Nepal Bangladesh Bank Limited 05/06/1994 Kathmandu 1860.3
10 Everest Bank Limited 18/10/1994 Kathmandu 8305
11 Bank of Kathmandu Limited 12/03/1995 Kathmandu 11822
12 Nepal Credit and Commerce Bank
Limited
14/10/1996 Rupendehi 1399.6
13 Lumbini Bank Limited 17/07/1998 Narayangadh,Chitawan 1288
14 Nepal Industrial & Commercial
Bank Limited
21/07/1998 Biaratnagar,Morang 1391.8
15 Machhapuchhre Bank Limited 03/10/2000 Pokhara, Kaski 1700
16 Kumari Bank Limited 03/04/2001 Kathmandu 1304.9
17 Laxmi Bank Limited 03/04/2002 Birgunj, Parsa 1533.7
18 Siddhartha Bank Limited 24/12/2002 Kathmandu 1230
19 Global Bank Ltd. 02/01/2007 Birgunj, Parsa 1325.1
20 Citizens Bank International Ltd. 21/06/2007 Kathmandu 1159.1
21 Prime Commercial Bank Ltd 24/09/2007 Kathmandu 1163.8
22 Sunrise Bank Ltd. 12/10/2007 Kathmandu 1419.4
23 Bank of Asia Nepal Ltd. 12/10/2007 Kathmandu 1053.2
24 Development Credit Bank Ltd. 2008/5/25 Kamaladi, Kathmandu 1655.3
25 NMB Bank Ltd. 2008/6/5 Babarmahal,
Kathmandu
1430
26 Kist Bank Ltd. 21/02/2003 Anamnagar, Kathmandu 2000
12
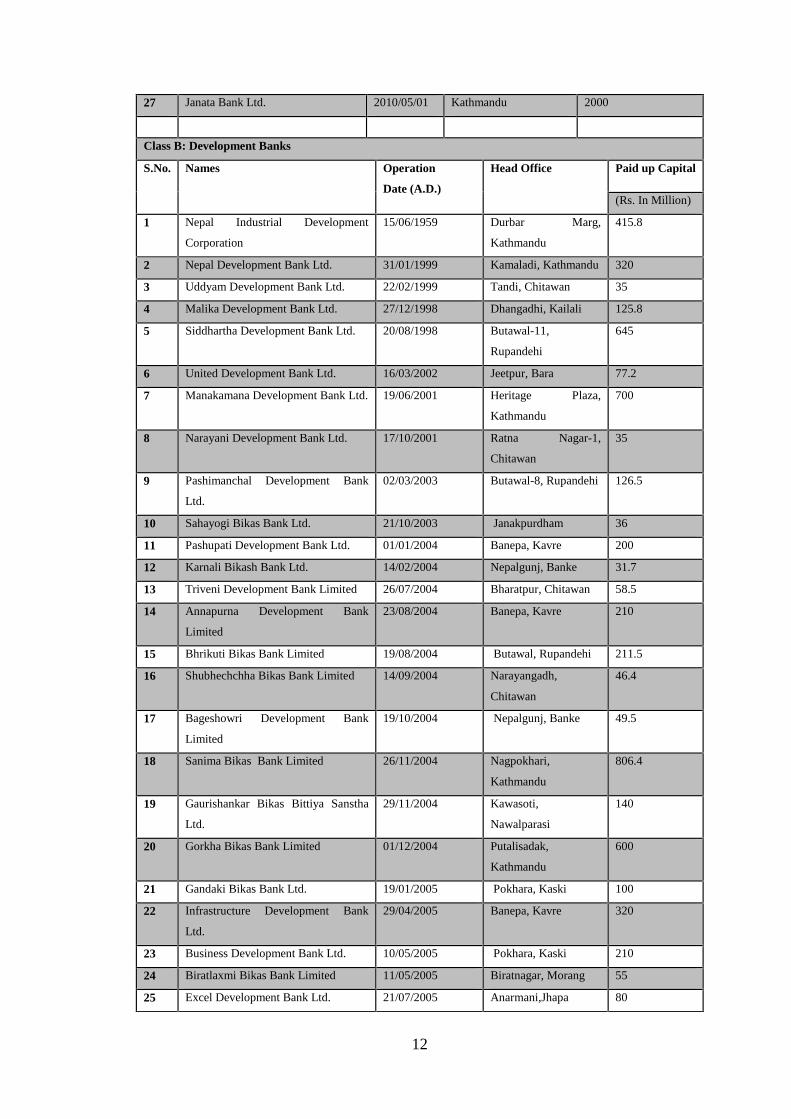
27 Janata Bank Ltd. 2010/05/01 Kathmandu 2000
Class B: Development Banks
S.No. Names Operation
Date (A.D.)
Head Office Paid up Capital
(Rs. In Million)
1 Nepal Industrial Development
Corporation
15/06/1959 Durbar Marg,
Kathmandu
415.8
2 Nepal Development Bank Ltd. 31/01/1999 Kamaladi, Kathmandu 320
3 Uddyam Development Bank Ltd. 22/02/1999 Tandi, Chitawan 35
4 Malika Development Bank Ltd. 27/12/1998 Dhangadhi, Kailali 125.8
5 Siddhartha Development Bank Ltd. 20/08/1998 Butawal-11,
Rupandehi
645
6 United Development Bank Ltd. 16/03/2002 Jeetpur, Bara 77.2
7 Manakamana Development Bank Ltd. 19/06/2001 Heritage Plaza,
Kathmandu
700
8 Narayani Development Bank Ltd. 17/10/2001 Ratna Nagar-1,
Chitawan
35
9 Pashimanchal Development Bank
Ltd.
02/03/2003 Butawal-8, Rupandehi 126.5
10 Sahayogi Bikas Bank Ltd. 21/10/2003 Janakpurdham 36
11 Pashupati Development Bank Ltd. 01/01/2004 Banepa, Kavre 200
12 Karnali Bikash Bank Ltd. 14/02/2004 Nepalgunj, Banke 31.7
13 Triveni Development Bank Limited 26/07/2004 Bharatpur, Chitawan 58.5
14 Annapurna Development Bank
Limited
23/08/2004 Banepa, Kavre 210
15 Bhrikuti Bikas Bank Limited 19/08/2004 Butawal, Rupandehi 211.5
16 Shubhechchha Bikas Bank Limited 14/09/2004 Narayangadh,
Chitawan
46.4
17 Bageshowri Development Bank
Limited
19/10/2004 Nepalgunj, Banke 49.5
18 Sanima Bikas Bank Limited 26/11/2004 Nagpokhari,
Kathmandu
806.4
19 Gaurishankar Bikas Bittiya Sanstha
Ltd.
29/11/2004 Kawasoti,
Nawalparasi
140
20 Gorkha Bikas Bank Limited 01/12/2004 Putalisadak,
Kathmandu
600
21 Gandaki Bikas Bank Ltd. 19/01/2005 Pokhara, Kaski 100
22 Infrastructure Development Bank
Ltd.
29/04/2005 Banepa, Kavre 320
23 Business Development Bank Ltd. 10/05/2005 Pokhara, Kaski 210
24 Biratlaxmi Bikas Bank Limited 11/05/2005 Biratnagar, Morang 55
25 Excel Development Bank Ltd. 21/07/2005 Anarmani,Jhapa 80
13
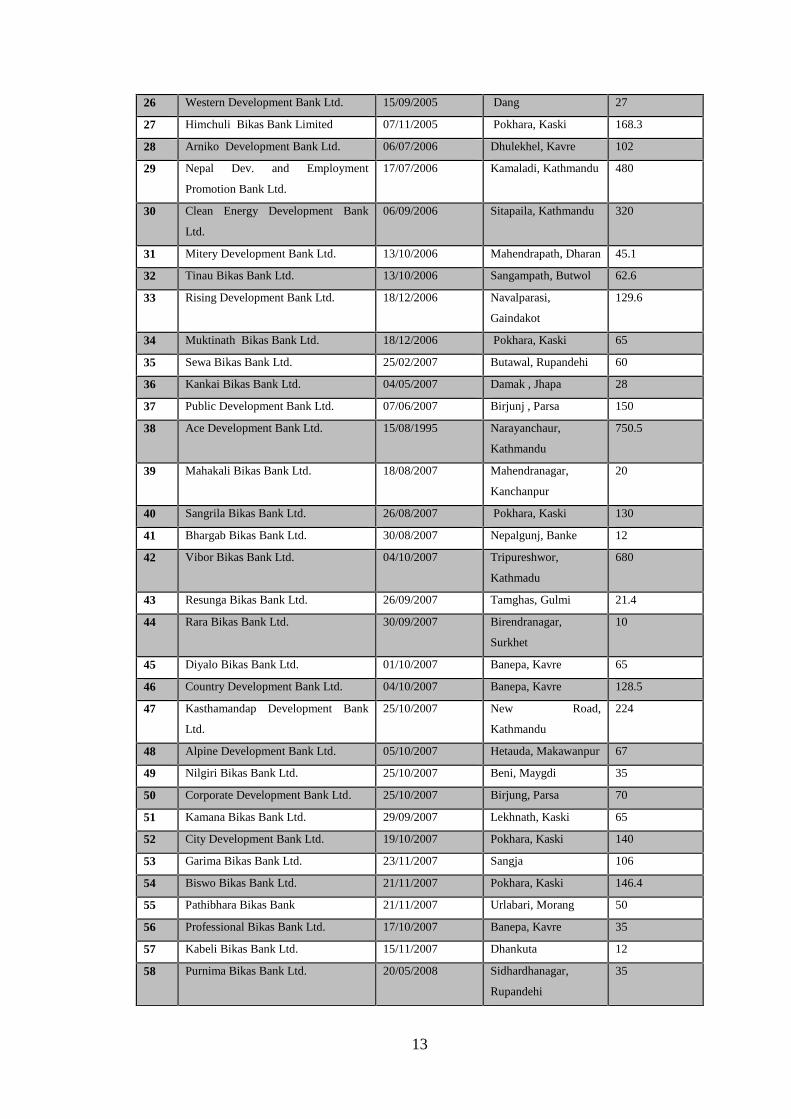
26 Western Development Bank Ltd. 15/09/2005 Dang 27
27 Himchuli Bikas Bank Limited 07/11/2005 Pokhara, Kaski 168.3
28 Arniko Development Bank Ltd. 06/07/2006 Dhulekhel, Kavre 102
29 Nepal Dev. and Employment
Promotion Bank Ltd.
17/07/2006 Kamaladi, Kathmandu 480
30 Clean Energy Development Bank
Ltd.
06/09/2006 Sitapaila, Kathmandu 320
31 Mitery Development Bank Ltd. 13/10/2006 Mahendrapath, Dharan 45.1
32 Tinau Bikas Bank Ltd. 13/10/2006 Sangampath, Butwol 62.6
33 Rising Development Bank Ltd. 18/12/2006 Navalparasi,
Gaindakot
129.6
34 Muktinath Bikas Bank Ltd. 18/12/2006 Pokhara, Kaski 65
35 Sewa Bikas Bank Ltd. 25/02/2007 Butawal, Rupandehi 60
36 Kankai Bikas Bank Ltd. 04/05/2007 Damak , Jhapa 28
37 Public Development Bank Ltd. 07/06/2007 Birjunj , Parsa 150
38 Ace Development Bank Ltd. 15/08/1995 Narayanchaur,
Kathmandu
750.5
39 Mahakali Bikas Bank Ltd. 18/08/2007 Mahendranagar,
Kanchanpur
20
40 Sangrila Bikas Bank Ltd. 26/08/2007 Pokhara, Kaski 130
41 Bhargab Bikas Bank Ltd. 30/08/2007 Nepalgunj, Banke 12
42 Vibor Bikas Bank Ltd. 04/10/2007 Tripureshwor,
Kathmadu
680
43 Resunga Bikas Bank Ltd. 26/09/2007 Tamghas, Gulmi 21.4
44 Rara Bikas Bank Ltd. 30/09/2007 Birendranagar,
Surkhet
10
45 Diyalo Bikas Bank Ltd. 01/10/2007 Banepa, Kavre 65
46 Country Development Bank Ltd. 04/10/2007 Banepa, Kavre 128.5
47 Kasthamandap Development Bank
Ltd.
25/10/2007 New Road,
Kathmandu
224
48 Alpine Development Bank Ltd. 05/10/2007 Hetauda, Makawanpur 67
49 Nilgiri Bikas Bank Ltd. 25/10/2007 Beni, Maygdi 35
50 Corporate Development Bank Ltd. 25/10/2007 Birjung, Parsa 70
51 Kamana Bikas Bank Ltd. 29/09/2007 Lekhnath, Kaski 65
52 City Development Bank Ltd. 19/10/2007 Pokhara, Kaski 140
53 Garima Bikas Bank Ltd. 23/11/2007 Sangja 106
54 Biswo Bikas Bank Ltd. 21/11/2007 Pokhara, Kaski 146.4
55 Pathibhara Bikas Bank 21/11/2007 Urlabari, Morang 50
56 Professional Bikas Bank Ltd. 17/10/2007 Banepa, Kavre 35
57 Kabeli Bikas Bank Ltd. 15/11/2007 Dhankuta 12
58 Purnima Bikas Bank Ltd. 20/05/2008 Sidhardhanagar,
Rupandehi
35
14
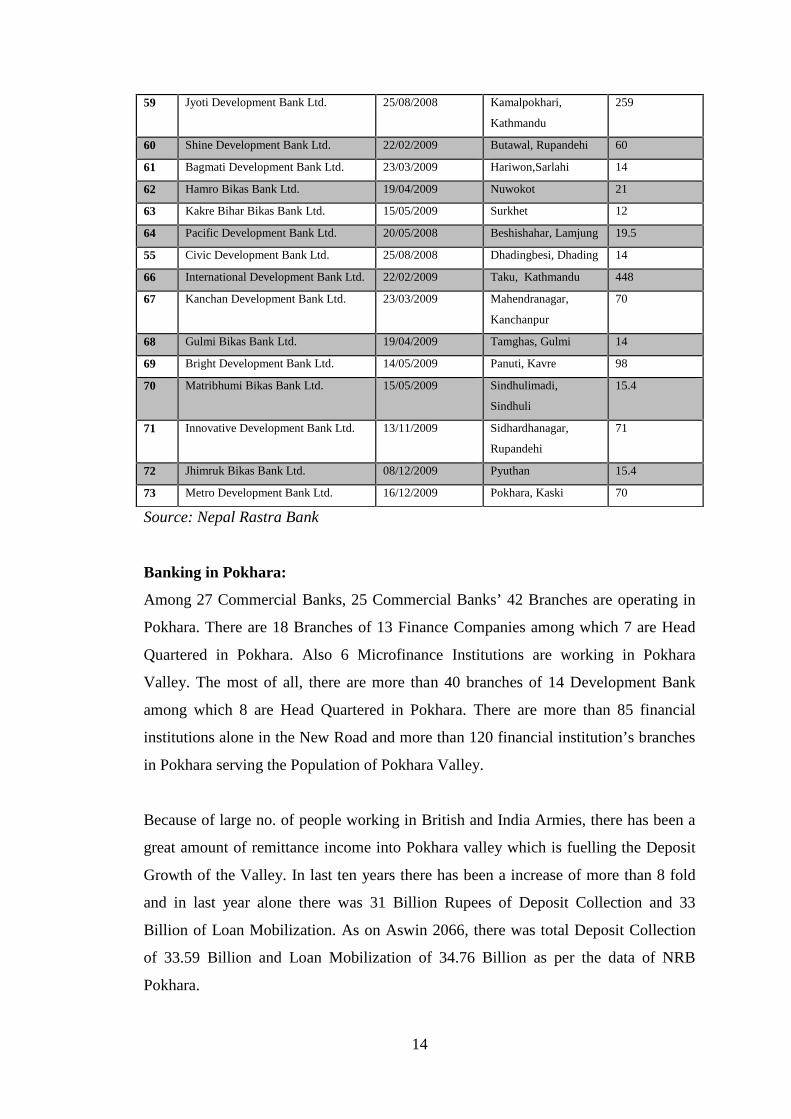
Source: Nepal Rastra Bank
Banking in Pokhara:
Among 27 Commercial Banks, 25 Commercial Banks’ 42 Branches are operating in
Pokhara. There are 18 Branches of 13 Finance Companies among which 7 are Head
Quartered in Pokhara. Also 6 Microfinance Institutions are working in Pokhara
Valley. The most of all, there are more than 40 branches of 14 Development Bank
among which 8 are Head Quartered in Pokhara. There are more than 85 financial
institutions alone in the New Road and more than 120 financial institution’s branches
in Pokhara serving the Population of Pokhara Valley.
Because of large no. of people working in British and India Armies, there has been a
great amount of remittance income into Pokhara valley which is fuelling the Deposit
Growth of the Valley. In last ten years there has been a increase of more than 8 fold
and in last year alone there was 31 Billion Rupees of Deposit Collection and 33
Billion of Loan Mobilization. As on Aswin 2066, there was total Deposit Collection
of 33.59 Billion and Loan Mobilization of 34.76 Billion as per the data of NRB
Pokhara.
59 Jyoti Development Bank Ltd. 25/08/2008 Kamalpokhari,
Kathmandu
259
60 Shine Development Bank Ltd. 22/02/2009 Butawal, Rupandehi 60
61 Bagmati Development Bank Ltd. 23/03/2009 Hariwon,Sarlahi 14
62 Hamro Bikas Bank Ltd. 19/04/2009 Nuwokot 21
63 Kakre Bihar Bikas Bank Ltd. 15/05/2009 Surkhet 12
64 Pacific Development Bank Ltd. 20/05/2008 Beshishahar, Lamjung 19.5
55 Civic Development Bank Ltd. 25/08/2008 Dhadingbesi, Dhading 14
66 International Development Bank Ltd. 22/02/2009 Taku, Kathmandu 448
67 Kanchan Development Bank Ltd. 23/03/2009 Mahendranagar,
Kanchanpur
70
68 Gulmi Bikas Bank Ltd. 19/04/2009 Tamghas, Gulmi 14
69 Bright Development Bank Ltd. 14/05/2009 Panuti, Kavre 98
70 Matribhumi Bikas Bank Ltd. 15/05/2009 Sindhulimadi,
Sindhuli
15.4
71 Innovative Development Bank Ltd. 13/11/2009 Sidhardhanagar,
Rupandehi
71
72 Jhimruk Bikas Bank Ltd. 08/12/2009 Pyuthan 15.4
73 Metro Development Bank Ltd. 16/12/2009 Pokhara, Kaski 70
15
1.4 About Shangri-la Development Bank Ltd.
Shangrila Development Bank Limited is the development bank headquartered in
Kaski, Pokhara which came into operation from 9th Bhadra 2064 with the theme
slogan of Bank for Every Body. Shangrila is more a dream project rather than just
another bank in the wall of all the existing banks which has been promoted by
Chartered Accountants, Engineers, Academicians, renowned Social Workers and
local Business Men. Within a short span of time, it has been able to show positive
impact in its regional economy. Established as the 39th Development Bank, it has
come into forefront in many terms like Deposit Mobilization, No. of Customers and
Return on Equity.
Outreach
Shangrila Development Bank has the second largest outreach in terms of branches
within the Development Banks after Gurkha Development Bank. It has altogether 12
branches within and outside of Pokhara Valley.
Figure 1.1:
Approved Districts of Shangri-la Development Bank Limited
Branches Within Pokhara
New Road, Pokhara (Head Office)
Bhadrakali Branch, Pokhara (First All Women Branch)
Naya Buspark Branch, Pokhara (Second All Women Branch)
Rambazar Branch, Pokhara
Birauta Branch, Pokhara
Zero KM Branch, Pokhara
16
Ranipauwa Branch, Pokhara
Branches Outside Pokhara
Butwal Regional Branch, Traffic Chowk, Butwal
Dulegauda Branch, Tanahun
Hetauda Branch, Seema Chowk, Hetauda
Narayangadh Branch, Lions Chowk, Narayangadh
Baglung Branch, Dhaulagiri Chowk, Baglung
In terms of its performance, the Bank has been able to be a leading deposit
mobilising financial institution with more that 1.43 Billion Deposit in its short span
of operation and it has been entrusted by more than 21,000 customers of various
castes, gender, age groups, and sectors and has really become the Bank for
Everybody.
Recent Annual General Meeting of Shangri-la Development Bank Limited has
decided to increase the current capital of Rs. 7.98 Crores to 32 Crores within the
fiscal year 2066-67 and become a national level bank by increasing it to 64 Crores
through right issue of 32 crores in fiscal year 2067-68. It has been running in the long
term goal achievement by development of 7 year strategic plan and has set forth
benchmarks for it which till now has been successfully achieved.
1.5 Products and Services of Shangri-La Development Bank Ltd.
SHANGRI-LA PREPAID
As the name suggests, Shangri-la Prepaid basically is a fixed deposit account where
upon the customer is entitled to receive the interest amount as prepayment either in
cash or as another fixed deposit receipt immediately.
SHANGRI-LA LAKH YOJANA
Shangri-la Lakh Yojana is a deposit product of SDBL where upon if the customer
deposits 65,000 which will grow to Rs. 100,000 at the end of 5 year. The annual
interest rate will be 11.34% on your deposited amount.
SHANGRI-LA BAL BHABISYA
17
Targeted for the secured future of your children, it’s the deposit product that will help
you save for future expenses of your children. Various facilities and attractive
features are available in this account.
SHANGRI-LA SUVA LAXMI
Considering the need of empowering women with their stable savings, Shangri-la
Shuva Laxmi Bachat is a customized product with various additional features.
SHANGRI-LA SPECIAL SAVING A/C
Shangri-la Special Saving A/C is a saving the account with special features like
additional interest rates of up to 7% and personalized services which has been
preferred by most of our customers.
SHANGRI-LA GURKHA BACHAT
Shangri-la Gurkha Bachat is a saving deposit product of SDBL basically in honor of
the Brave Gurkha’s who have kept the name of Nepal high with their bravery. It’s
main feature is the insurance of the lives of account holders.
SHANGRI-LA JESTHA NAGARIK
Shangri-la Jestha Nagarik is a deposit product of SDBL basically for the people
above the age of 50 Years. Its main feature is the monthly posting of interest so that
the senior people can withdraw the amount accruing in their account when they need
the most.
365 Days Banking
We understand that banking is a basic service that shouldn't be stopped. So being in
par with other financial institutions, we are providing all year round services from
our Head Office.
Shangrila SMS Banking
Bank has currently started SMS Banking through which the customers can make their
Balance Inquiry, Statement Request, Cheque Book Request, Banking Hours Inquiry,
and get customized E-Alerts.
ABBS
18
Keeping in mind of all customer needs, we've introduced Any Branch Banking
System with an objective to provide our customer with the most convenient service
possible. Now, they can withdraw or deposit cash, receive information about the
balance in their A/C or obtain a statement of accounts from any of our branch.
PROMPT SERVICES
We have seen that the best of the banks have got their customers wait long queues.
No more long hours or queues, work gets over in just a few minutes is what we claim
and working towards streamlining services. We are continuously looking towards
giving best attention to our clients and trying to keep without being unattended.
FINANCIAL ADVISORY
Good financial planning may make or break a business. We believe that our success
is measured upon the successes of our clients. Our team consists of experts who can
provide assistance to clients in need of consultancy for financial planning. Providing
timely pointers on the proper source of financing, terms and conditions, structure of
debt and equity, and even recommending sound financial tips are the strengths of
Shangri-La Development Bank. Our evaluation teams help the client in making
sound financial decisions. We takes pride in assisting clients requiring any type of
financial advisory services.
LOAN ADVISORY
Shangri-La Development Bank facilitates a wide range of fund requirement with
various credit schemes. However we feel that the financial health of our client is of
the utmost importance. A slight mismatch in funds and timing of credit can affect our
client. Our credit/loan team is able to provide sound advice to clients on how to
manage their funds. Based on a strong project evaluation foundation, our team is able
to advise the client on a favourable loan schedule. We believe in working with our
clients and working on a loan scheme that is in the best interest of the client.
LOAN FACILITIES
Various load products are available tailored to the need of the customers ranging
from personal loans to the corporate loans which will fulfil all of your needs. Our
interest rates and repayment structures are best suited to the customers' returns and
convenience. Few Loan products of SDBL are Education Loan, Gold Silver Loan,
19
Hire Purchase Loan, Housing Loan, Working Capital Loan, Share Loan, Easy
Revolving Loan etc.
1.6 Statement of Problem
As mentioned in details earlier there has been massive growth in the financial
institution after the economic liberalization policy of 1990. Recently there is still
more trend of opening maximum no. of branches by all the financial institutions
resulting in massive expansion. In such scenario where to remain competitive in the
market on one side high deposit rate and low lending rate are inevitable and on other
side there is obvious mounting increase in operating costs.
The financial results of the financial institutions are the most transparent as it is
continuously monitored by the central bank as well as it has to be regularly published
to the public. In such situation the banks to keep their competitive position intact and
retain customers have to continuously perform better in terms of profit. More over
the bank management has the responsibility towards the investors and promoters to
make a maximum return to their investment through bonus or cash dividend so that
the current market price remains high. In that view as well profit is always important.
Success is said not to be a matter of chance and profit obviously doesn’t happen but it
should be planned and managed. Cost Volume Profit Analysis or Break Even
Analysis is one of the major tools of Profit Planning and Control (PPC) which helps
to analyse the cost structure, define its nature, find the return pattern and determine
the single point where the bank can obtain the no-profit no-loss state. With this
determination of break-even point, the bank can set targets for sales, cost reduction,
product pricing so that the required amount of profit can be obtained.
This study would be focusing thus on the important analysis of Break Even and
various factors affecting it and in meantime it will try to answer the following
question:
1. What is the current trend of usage of CVP analysis in profit planning, organizing,
decision making and controlling function in banking sector as a whole and in
Shangri-la Development Bank in particular?
20
2. What are the different costs of banking industry?
3. What difficulties would be faced in application of CVP analysis in banking
industry?
4. How would CVP analysis be applied to the banking operations so that there can
be effective usage of it in profit planning thus improving competitiveness and
performance?
5. What is the current state of various cost and return as well as volume of business
thus analyzing whether it is optimal or is there chances of improvement.
1.7 Objective of the Study
Setting of objective of the study is important to give proper direction to the study and
reach a fruitful conclusion. CVP Analysis or Break Even Analysis has the sole
objective of studying the cost structure and categorizing it into various categories
according to it nature like variable, semi-variable and fixed costs and then analysing
the yield or return pattern thus knowing the relationship between them and finding a
common meeting point. This helps to plan and manage the profit for the organization.
The objectives of study paper can be further enumerated in following points:
To study the relationship between various types of costs, sales volume as well as
return and profit by means of applicable tools of analysis.
To differentiate appropriately the costs into fixed and variable to make the
analysis.
To find the income level where the bank is in no profit no loss position
To know the trend of other factors like contribution margin, margin of safety etc.
To identify the various factors affecting profitability and thus finding the inter
relationship between these factors
To help improve the margin of safety.
To provide relevant suggestions based on the study to enlighten on hidden
aspects of CVP and help increase the competitive state by Shangri-la
Development Bank Ltd.
To find out the profitability studies of various ventures of Bank like extension
counter, branches or ATMs or a New Products.
21
1.8 Significance of the Study
The signification of cost and management accounting in banking sector is widely
accepted principle. The concept of cost of a product is important for its several
decisions needed to be taken from time to time. Banking industry being a service
industry, the product of this industry is the services made available to its customers.
We can find a whole lot of work done in the field of manufacturing concerns. In spite
of the similar cost concept between manufacturing and banking concerns, their
application differs in various angles. The cost of funds for a bank is the same as the
cost of sales in an industrial undertaking. But there is an important distinction
between the costs of banking operation and production processes. Manufacturing cost
per unit generally tend to fall as production increases on account of getting economies
of scale in the resources. The cost of sales in a bank i.e. its cost of funds is not directly
related to the amount of loans which it provides, not necessarily to the rate it changes
on industrial loans and over draft facilities. Cost volume profit analysis provides a
sweeping financial overview of the planning process. It examines the behaviours of
total revenues and total costs as changes occur in the output levels, selling price,
variable cost and fixed costs. C.V. P. Analysis can be used to find out how various
variables being considered by a decision maker affect operating profit.
1.9 Limitations of the Study
Flawless study is never possible as always there are assumptions and limitation to
make any study possible. Following limitations are observed in this study:
Due to recent inception the study would be based only on last two and half years
data.
Cost segregation into fixed and variable is never always perfectly made as many
costs by nature are neither totally fixed nor totally variable.
Due to limited time a comprehensive study of all the factors was never possible
along with application of many tools and techniques.
CVP analysis is based on the assumption of linear relationship between the
variable costs and sales whereas in real terms there is never a perfectly linear
relationship existing.
22
The quality of study depends upon the data provided by the bank and its
management.
1.10 Organization of the Study
This study has been organized as follows;
Chapter one deals with introduction. It covers introduction of background of the
study, statement of problems, objectives of the study, limitations of the study and
organization of the study.
Chapter two comprises the review of literature. It is divided into two parts. The first
part of the review deals mainly with the theoretical and historical information related
to development banks in Nepal. The next part covers the review of related literature
from books, journals, seminar papers and publications relating to Development banks.
Chapter three deals with research methodology that consists of research design,
source of data, population and sample, statistical tools and method of analysis.
Chapter four includes data presentation and analysis.
Chapter five is concerned of the summary, conclusion and recommendations of the
study.
23
CHAPTER - TWO
REVIEW OF LITERATURE
2.1 Conceptual Framework
An organization is established to achieve some goals. It has its own objectives. To
achieve the goals of organization, its objectives should be clear mention. “In this
competitive globalize business age an organization whether it is public or private,
profit is essential. Profit is not chance, it is result of successful management. The
management of an enterprise requires continuing performances of certain managerial
responsibilities collectively are called the function of management. Planning,
organizing, staffing, and human resource management, Leading and interpersonal
influence and controlling are major functions of management. Planning is process of
developing enterprises objectives and selecting future course of action to accomplish
them. It reduces uncertainty and provides effective direction to the employee by
determining the course of action in advance. Controlling means evaluating the firm’s
activities against the plan and deciding what should be done if the plan is not being
followed” (Lynch and William, 1995:18). In business organization there may involve
various parties like, competitors, employees and trade union, Government community
representative, Investment analysis, suppliers, lender/Bankers, Managers, Owners,
and Customers etc. These all parties require various types of information for decision
making. Actual position of the enterprises can be found from financial statement. It
shows the clear picture of enterprises profit and loss position, financial position etc.
These are not sufficient to measure the firm’s performance and plan. There are
various tools and technique that can be effectively applied to measure and analyze the
financial performance. Cost Volume Profit Analysis (CVPA) in one the major and
popular tools to analyze the relevant data for management decision. It is one of the
important portion of profit planning and control and budgeting.
2.1.1 Profit
Every organization is established to make profit. Success of any organization is
primarily measured by profit because it is acid test of individual firm’s operation.
That organization is thought to be a successful, which can generate profit. The
24
existence of all the resources employed in the enterprise is possible only when there is
profit. Profit doesn’t just happen but it is managed. If a firm cannot make profit, it
cannot generate capital for future. Profit is the excess or residual income left after cost
of production or the payment of the contractual reward to other for production. But
the term profit is controversial and interpreted as thus:
• An economist says that profit is the reward for entrepreneurship for risk taking.
• A labor leader might say that it is a measure of how efficiently labor produced and
that it provides a base for negotiating a wage increase.
• An investor will view it as a gauge of the return on his money
• Through the accountants measuring stick, profit is a tangible expression of the
goals it has set for the firm.
• A yardstick for judging the competence and efficiency of the management.
(Maheshwari, 2000:171).
• A mean of maintaining the health, growth and continuity of the company. (Lynch,
1993: 100)
For the dynamic manufacturing industries, the most telling concept of profits, they are
the gains in national income that are generated by the managerial drive for distinction
through creative innovation.” (Myres, 1994:250).
“Thus, economic theories of profit may be put in three broad groups. The first look
open profit is the reward for bearing risk and uncertainty, the second view of profit as
the consequences of fraction and imperfection in the competitive adjustment of
economy to dynamic changes; the third see profit as the reward for successful
innovation. “(Dean, 1992:3)
2.2 Profit planning
Profit planning is the central theme of management planning, without proper
planning, profit will not just happen. So every activity needs to be systematically
planned for profit generation. Profit plan covers all the major aspects of business
activities toward the achievement of business objective, which is profit, various
functional budgets are the basic tools for proper planning of profit control over them.
A profit plan is a financial and narrative expression of the expected result from
25
planning decision. It is called profit plan because it explicitly set the goals in terms of
time for each major segment of entity. Glenn A. Welsch has used the descriptive term
comprehensive profit planning and control. Other terms used in the same context are
business budgeting, managerial budgeting and budgeting. The profit planning model
includes the following activities:
• The development and application of broad and long range objectives of the enterprise.
• The specification of the tactical short range project plan with assign responsibility.
• The development of strategic long-range profit plan in broad terms.
• The specification of enterprises goals.
• The development of follow up process.
• Establishment of a system of periodic performance reports detailed by assigned
responsibility.
Profit planning is one of the most important management tool used to plan business
operation budget or profit plans are financial plans prepared as a guide to and control
of future operation. (Gupta, 1992: 521)
Profit planning is one of the most important approaches that have been developing to
facilitate effective performance of the management process. The most relevant aspect
of profit planning concept:
I) Profit planning requires major planning decisions by management.
II) Profit planning recognizes many of the critical behavioral implications throughout
the organization. (Glenn A. Welsch, 1992:31).
Profit planning is a detail plan of action during a period of one year or less. Profit
planning helps a firm’s financial manager to regulate flow of undoes which is his
primary concern. (Pandey, 1997:223).
Profit plan is a short-term financial plan. It is an action plan to guide managers in
achieving the objective of a firm. A profit plan is a comprehensive and coordinated
plan of resource of an enterprise for some specific period in future. So, profit planning
is a part of an overall planning process and is an area in which, the financial function
plays a major role. (Myers, 1995: 250).

26
Profit plan is a detail expression of the expected result from the planning decision.
Profit planning is an important approach develops to facilitate for effective
performance of management process like planning, organizing, staffing and
controlling. So, it is carried out to fulfill the responsibility of forward thinking and
future operation of the organization.
2.3 Concept of Cost-Volume-Profit Analysis:
Cost volume profit analysis is the process of examining the relationships among
revenues cost and profits for a relevant range of an activity within a particulars time
frame. It is one of the most important and powerful tools that manager have at their
command in short term planning. It helps managers understand inter relationship
between cost volume and profit in an organization by focusing on interaction between
the following given elements.
• Price of product
• Volume or level of activity
• Per unit variables costs
• Mix product sold
“CVP analysis can be extended to cover the effects on profits of changes in selling
price/service fees, cost, income tax rate, product mix etc. It estimate total cost, total
revenue and profit at various sales volume. It provides only an overview of the effects
on revenue and costs of all kinds of short run financial changes. It is related to profit,
sales volume and cost” (Munakarmi, 2003:401).
“Cost volume profit analysis examines the behavior of total revenues total cost and
operation income as changes occur in the output level, the selling price, the variables
cost per unit and or fixed cost of a product” (Homgren Datar and Foster,2003:15).
“Cost volume profit analysis is a systematic method of examining the relationship
between changes in activity (i.e. output) and changes in total sales revenue, expenses
and net profit. As a model of their relationship CVP analysis simplifies the real world
conditions that a firm will face like most models which are abstractions from reality,
27
CVP analysis is subject to number of underlying assumptions and limitations.
Nevertheless it is powerful tool for decision making in certain situations” (Drury,
2000:112).
“Most of the business fails after a few years sometimes months of starting because
they tend to do anything for volume without thinking how it’s going to affect the
bottom line. CVPA is a management accounting tool to show the relationship between
the elements of profit planning. Profit planning is a function of the selling price of
product demand, variable costs. Fixed cost taxes etc. The whole picture of profit
planning is associated with coat volume profit interrelationships” (Bajracharya, Ojha,
Goet and Sharma, 2004:225).
The key motive of business enterprises is to make and maximize profit. Profit does
not happen by chance. It is to be managed. Cost volume profit analysis is
supplementary tool of planning for profit. CVP is immensely helpful for developing
alternative strategies in sales planning and cost estimation. Cost volume profit
analysis is an accounting technique showing the relationship between variables. It is
equally applicable for nonprofit making organization to allocate scare economic
resources most effectively among the completing alternative. Allocation of scare
resource among the various demanding sectors is the most important part of national
planning.
A popular technique to study CVP relationship is break even analysis (BEP). Break
even analysis is concerned with the study of revenues and cost in relation to sales at
which the firm’s revenues and total cost will be exactly equal or the net income will
zero. It is no profit no loss sales. This point is cornerstone of profit planning, Cost
volume profit analysis (CVPA) is popular analysis tool of management. It is very
useful in profit planning and control, management decision cost control, budgeting
etc.
28
2.4 Importance of CVP Analysis
“Planning controlling and decision making are the essential management functions
CVPA helps the manager to plan for profit to control cost and make decision”.” It
helps (Munakarmi, 2003:401-402):
• To determine the breakeven point in terms of unit or sales value.
• To ascertain the margin of safety.
• To estimate profits or losses at various level of output.
• To assess the likely effect of management decisions such as an increase or decrease
in selling price adoption of new method of production to reduce direct labor cost and
increase output.
• To help management to find the most profitable combination of costs and
volume.
• To determine the optimum selling price.
• To determine the sales volume at which the profit goal of the firm will be
achieved.
• To determine the maximum sales volume to avoid losses.
• To determine most profitable and least profitable product.
• To determine most profitable and least profitable product.
• To determine new breakeven point for changes on fixed or variable cost.
Generally CVP analysis provides information regarding “(Munakarmi,
2003:402).
• Minimum level of sales to avoid losses.
• Sales level to earn target profit.
• Effects of changes in prices, costs and volume of profits.
• New breakeven point for changes.
• Effects of changes in sales mix in profit.
• Impact of expansion plan on CVP relationship.
• Products those are most profitable and least profitable.
• Whether to continue or discontinue the sales of product or operation of plan.
• Effect on operating profit with the increase in fixed cost.
• Whether to close or not the firm for a short term.”
29
2.5 Application of Cost Volume Profit Analysis
“Cost volume profit analysis is applied specially for break even analysis and profit
planning. Profit planning is fundamental aspect of overall management function.
Profit planning can be done only when the management has the information about the
fixed and variable cost of product and selling price of the product. The most important
factors that affect the planning for profit are costs fixed and variable costs and volume
of sales. CVP analysis can be applied in the following respects”(Dangol,2004:120).
• It helps in fixation of selling price.
• It is helpful in cost control.
• It also assists the management in understanding the behaviors of cost and helps in
budgeting control.
• It helps in determining the level of output where all the costs can be met.
• It assists the management in profit planning.
• It also assists the management in performance evaluation for the purpose of
management control.
• It helps very much in making managerial decisions such as make or buy a part,
drop or continue a department or product line, accept or reject a special order,
selection of profitable product mix etc.
2.6 Contribution Margin Analysis
Contribution Margin is the excess of sales revenue over variable costs, so contribution
margin means how much is left from sales revenue after covering variable expenses
that are contributed toward profit for the period. Contribution margin is used to first
cover the fixed expenses and then whatever remains, after the fixed expenses are
covered, goes toward profit. If the contribution margin is not sufficient to cover the
fixed expenses then a loss occurs for the period. Basically contribution margin
indicates why operating income changes as the volume of sales changes. It can be
expressed as:
Contribution Margin = sales – variable cost or
Contribution Margin = Fixed cost + profit
Contribution Margin Per unit (CMPU) = Selling price – Variable cost per unit
30
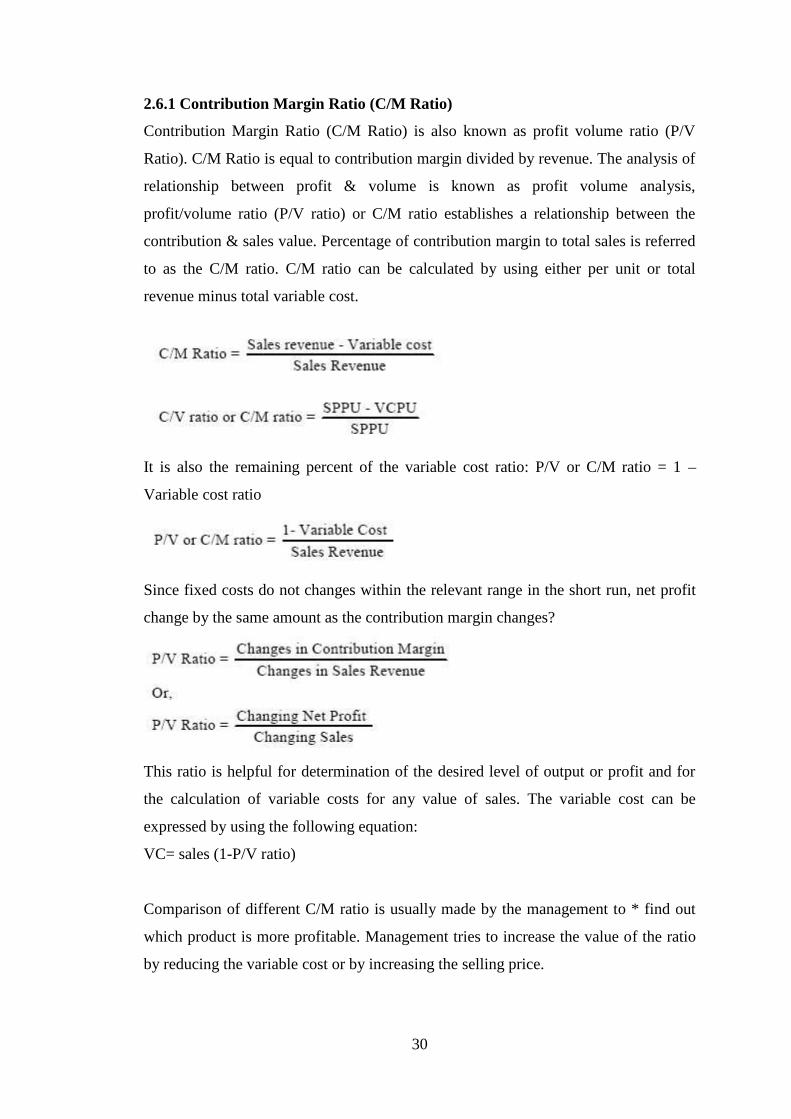
2.6.1 Contribution Margin Ratio (C/M Ratio)
Contribution Margin Ratio (C/M Ratio) is also known as profit volume ratio (P/V
Ratio). C/M Ratio is equal to contribution margin divided by revenue. The analysis of
relationship between profit & volume is known as profit volume analysis,
profit/volume ratio (P/V ratio) or C/M ratio establishes a relationship between the
contribution & sales value. Percentage of contribution margin to total sales is referred
to as the C/M ratio. C/M ratio can be calculated by using either per unit or total
revenue minus total variable cost.
It is also the remaining percent of the variable cost ratio: P/V or C/M ratio = 1 –
Variable cost ratio
Since fixed costs do not changes within the relevant range in the short run, net profit
change by the same amount as the contribution margin changes?
This ratio is helpful for determination of the desired level of output or profit and for
the calculation of variable costs for any value of sales. The variable cost can be
expressed by using the following equation:
VC= sales (1-P/V ratio)
Comparison of different C/M ratio is usually made by the management to * find out
which product is more profitable. Management tries to increase the value of the ratio
by reducing the variable cost or by increasing the selling price.
31
The variables usually used in cost volume profit analysis are:
a) Sales value: The sale value is actually includes the quality of total sales multiply
by selling price pre unit or sales rupees. Total sales revenue refers to income of the
company.
b) Variable cost: Variable cost is that cost which is directly affected by change in the
activity level. Direct material, direct labor cost and variable overhead etc, are variable
cost. Per unit variable cost always remains constant. If the output increases variable
cost also increases and if it decreases variable cost also decreases, Changes of variable
cost effects P/V ratio, BEP and Net income.
c) Fixed cost: Fixed cost remains constant in total amount even if the level of output
changes Depreciation, rent, interests etc. are fixed costs. It is also called capacity cost.
Per unit fixed cost changes but total fixed cost remains constant.
d) Mixed cost: Mixed cost contains both variable and fixed cost. Repair and
maintenance electricity charge, telephone, supervision etc. are examples of Mixed
Costs. These costs can’t be categorized as purely fixed or variable. Mixed cost is
known as semi variable cost, semi variable costs should be separated to find total
variable and fixed cost.
e) Jumping Cost: Some costs remain fixed over a wide range of activity but jump to
a different amount for activity level outside that range. Such costs are called jumping
costs or step fixed cost or moving fixed cost or ladder fixed costs.
2.7 Break Even Analysis
“Break even analysis, more precisely the breakeven point tells the quantity sales sold
at which total sales revenues equal total costs. Breakeven point is that quantity of
sales sold at which the operation income is zero. Cost volume profit analysis is
sometimes referred to simply as a break even analysis. This may be misleading
because break even analysis is just one aspect of the entire CVP concept. It is always
taken as an important aspect of profit planning as it gives the planner many insights
32
into the data with which he or she is working. Profit planning of each firm begins
from break even analysis. Profit begins from the breakeven point. It is survival point
where all firms must at least remain to sustain or continue the business. Business firm
running under BEP can be justified only under the following circumstance”
(Bajracharya, Ojha, Goet and Sharma, 2004:23)
2.7.1 Approaches to Break-Even Analysis
The breakeven point can be identified through different approaches. Mainly the
breakeven point and other required cost volume profit relationships can be explained
through contribution margin approaches or graphic approach or equation/formula
approach. A contribution margins statement is a variable costing income statement
where philosophy is that all fixed costs are period cost which should be deducted from
the contribution margin of the same period. Most often, the equations approach can be
used to identify break even sales instead of the graph or the income statement.
a) Contribution Margin Approach
The contribution margin approach to CVP analysis allows the preparation of proforma
statement from the available information. BEP and other required CVP relationships
can be explained through a contribution margin statement. A contribution margin
statement is the variable costing income statement whose philosophy is that all fixed
costs are period costs that should be deducted from the contribution margin of the
same period. Only the variable costs vary proportionately with the level of output or
sales.
b) Formula Approach
“The most popular practiced approach to the breakeven point and cost volume profit
analysis is the formula also known as the equation. The formula approach used an
algebraic equation to calculate the breakeven point. The answer provided by solving
the equation may, sometimes, need to be rounded to whole numbers of units or lot
sizes. The rounding of breakeven point units is always dine upward because this will
provide a small profit rather than the small loss that would be shown from rounding
downward” (Rainbom,Barfield and Kinney,1993:124)
33
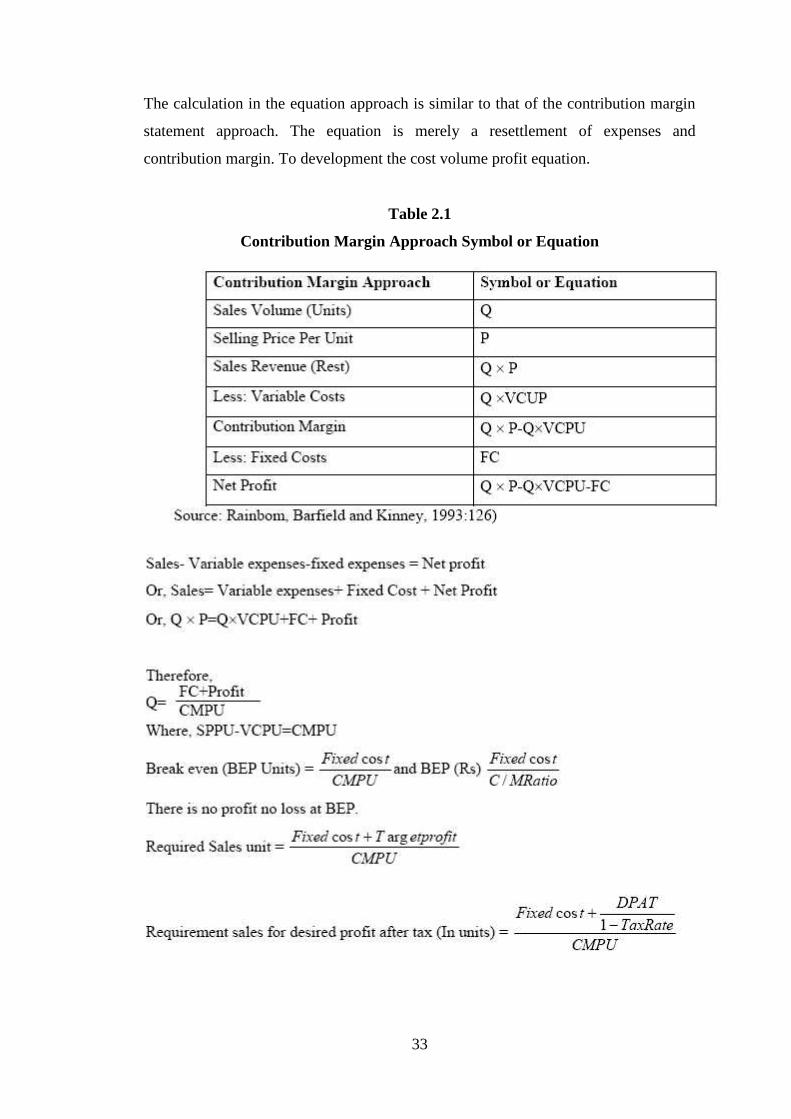
The calculation in the equation approach is similar to that of the contribution margin
statement approach. The equation is merely a resettlement of expenses and
contribution margin. To development the cost volume profit equation.
Table 2.1
Contribution Margin Approach Symbol or Equation
34
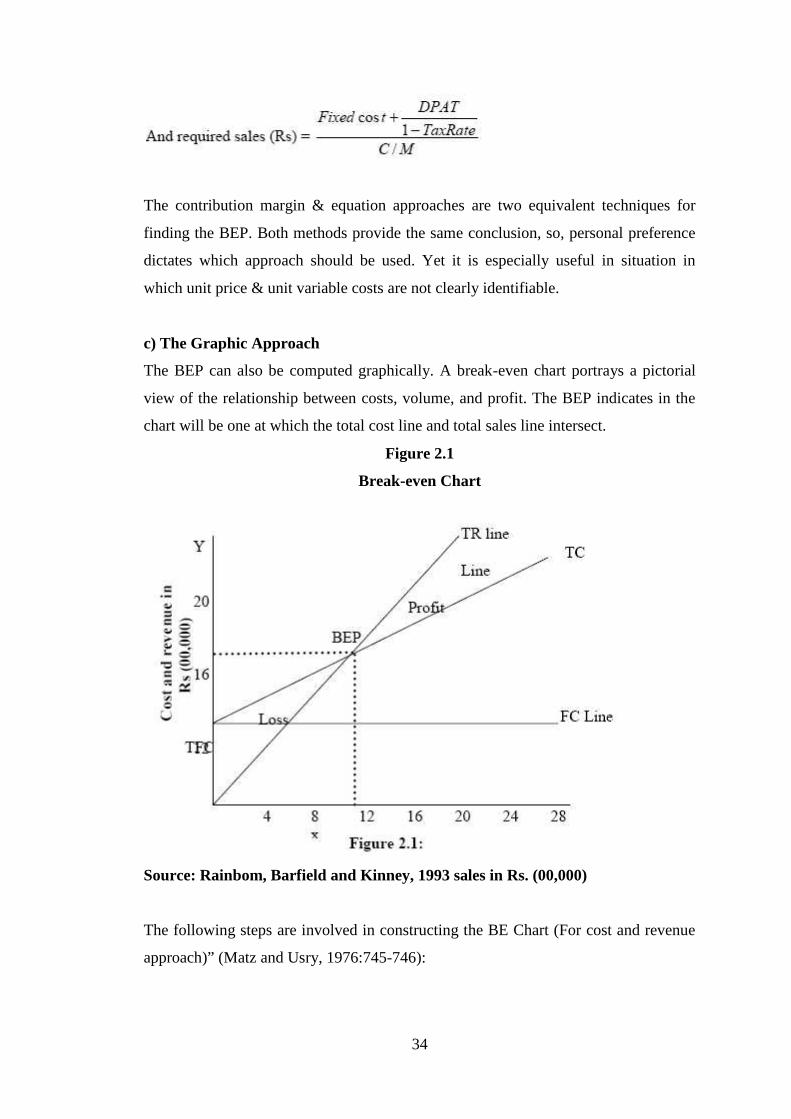
The contribution margin & equation approaches are two equivalent techniques for
finding the BEP. Both methods provide the same conclusion, so, personal preference
dictates which approach should be used. Yet it is especially useful in situation in
which unit price & unit variable costs are not clearly identifiable.
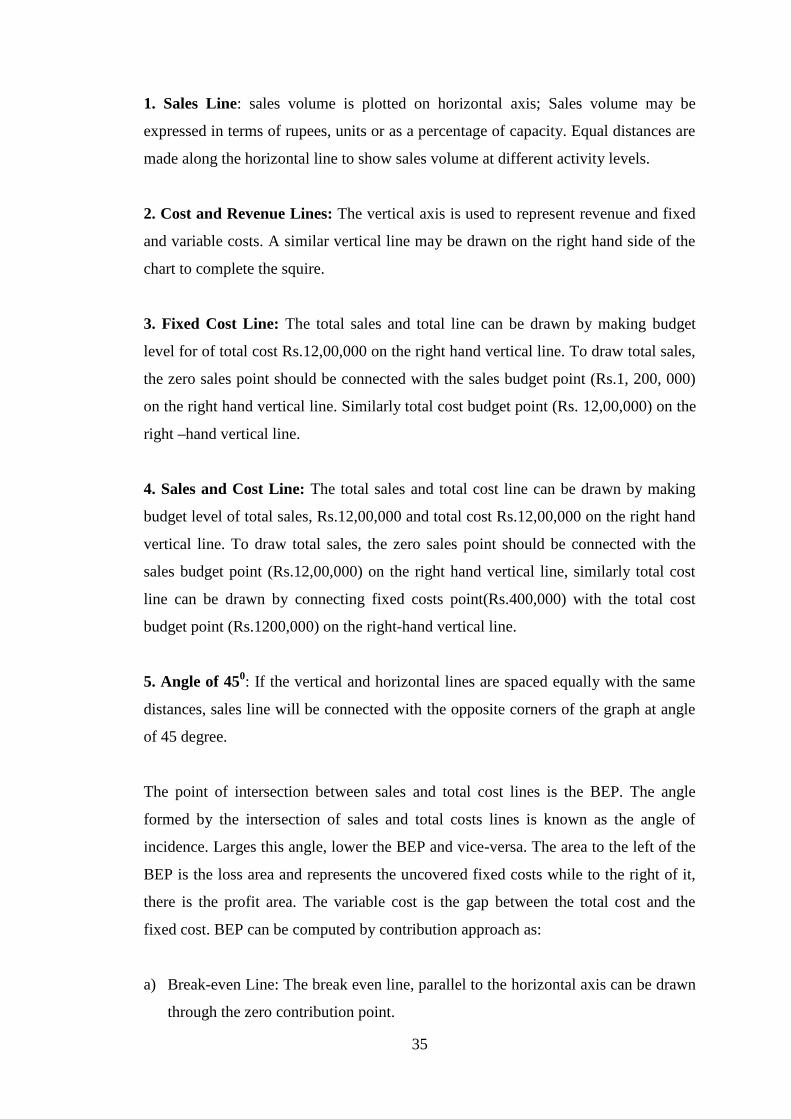
c) The Graphic Approach
The BEP can also be computed graphically. A break-even chart portrays a pictorial
view of the relationship between costs, volume, and profit. The BEP indicates in the
chart will be one at which the total cost line and total sales line intersect.
Figure 2.1
Break-even Chart
Source: Rainbom, Barfield and Kinney, 1993 sales in Rs. (00,000)
The following steps are involved in constructing the BE Chart (For cost and revenue
approach)” (Matz and Usry, 1976:745-746):
35
1. Sales Line: sales volume is plotted on horizontal axis; Sales volume may be
expressed in terms of rupees, units or as a percentage of capacity. Equal distances are
made along the horizontal line to show sales volume at different activity levels.
2. Cost and Revenue Lines: The vertical axis is used to represent revenue and fixed
and variable costs. A similar vertical line may be drawn on the right hand side of the
chart to complete the squire.
3. Fixed Cost Line: The total sales and total line can be drawn by making budget
level for of total cost Rs.12,00,000 on the right hand vertical line. To draw total sales,
the zero sales point should be connected with the sales budget point (Rs.1, 200, 000)
on the right hand vertical line. Similarly total cost budget point (Rs. 12,00,000) on the
right –hand vertical line.
4. Sales and Cost Line: The total sales and total cost line can be drawn by making
budget level of total sales, Rs.12,00,000 and total cost Rs.12,00,000 on the right hand
vertical line. To draw total sales, the zero sales point should be connected with the
sales budget point (Rs.12,00,000) on the right hand vertical line, similarly total cost
line can be drawn by connecting fixed costs point(Rs.400,000) with the total cost
budget point (Rs.1200,000) on the right-hand vertical line.
5. Angle of 450: If the vertical and horizontal lines are spaced equally with the same
distances, sales line will be connected with the opposite corners of the graph at angle
of 45 degree.
The point of intersection between sales and total cost lines is the BEP. The angle
formed by the intersection of sales and total costs lines is known as the angle of
incidence. Larges this angle, lower the BEP and vice-versa. The area to the left of the
BEP is the loss area and represents the uncovered fixed costs while to the right of it,
there is the profit area. The variable cost is the gap between the total cost and the
fixed cost. BEP can be computed by contribution approach as:
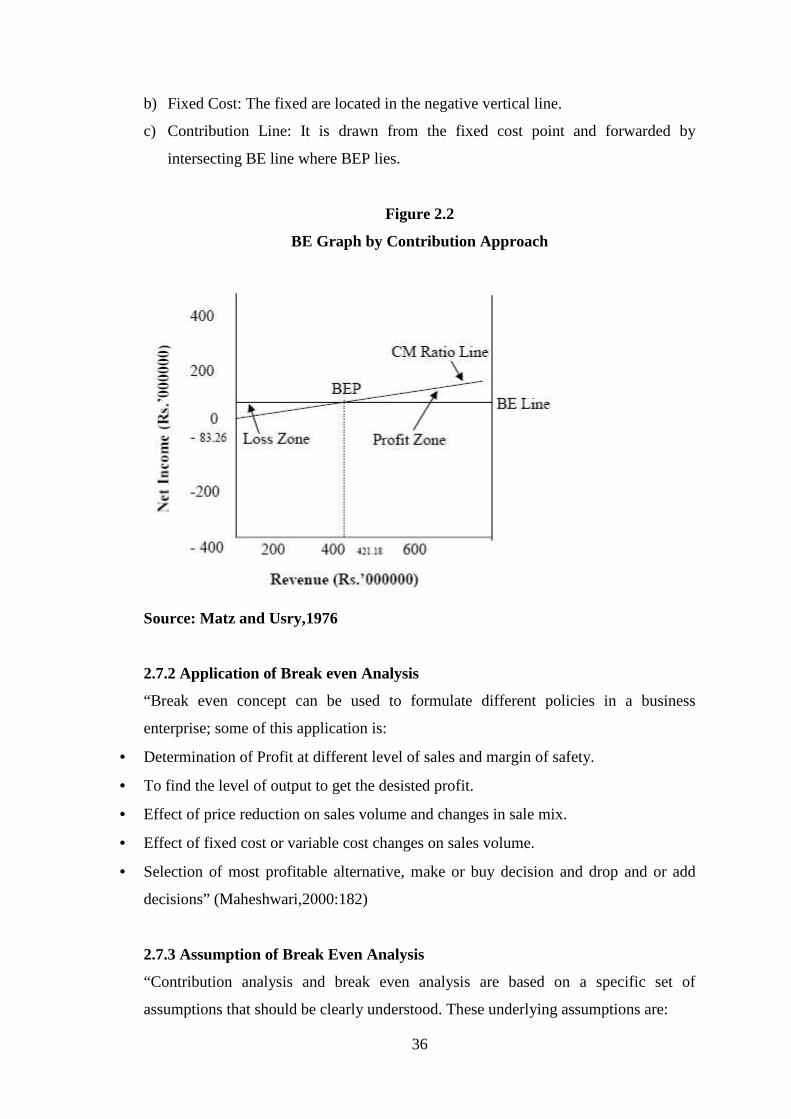
a) Break-even Line: The break even line, parallel to the horizontal axis can be drawn
through the zero contribution point.
36
b) Fixed Cost: The fixed are located in the negative vertical line.
c) Contribution Line: It is drawn from the fixed cost point and forwarded by
intersecting BE line where BEP lies.
Figure 2.2
BE Graph by Contribution Approach
Source: Matz and Usry,1976
2.7.2 Application of Break even Analysis
“Break even concept can be used to formulate different policies in a business
enterprise; some of this application is:
Determination of Profit at different level of sales and margin of safety.
To find the level of output to get the desisted profit.
Effect of price reduction on sales volume and changes in sale mix.
Effect of fixed cost or variable cost changes on sales volume.
Selection of most profitable alternative, make or buy decision and drop and or add
decisions” (Maheshwari,2000:182)
2.7.3 Assumption of Break Even Analysis
“Contribution analysis and break even analysis are based on a specific set of
assumptions that should be clearly understood. These underlying assumptions are:
37
• All cost can be classified into two parts; fixed cost and variable cost, there are no
costs other than fixed and variable.
• There is a relevant range of validity (Activity) for using the result s of the analysis and
sales change.
• There is only one product or in case of multi products, the sales mix among the
products remains constant.
• Basic management policy about operation will not change materially in short run.
• The general price level (Inflation defilation) will remain essentially stable in the short
run.
• Sales and production levels are synchronized, that is inventory remains essentially
constant or zero.
• Efficiency and productivity per person will remain essentially unchanged in the short
run”(Maheshwari, 2000:182-183).
If any of the above assumption were changed, revised budget would be needed for a
new analysis.
2.7.4 Limitation of Break-even Analysis
Break even analysis in many business situations can be used for effective decision
making but there are many short comings or limitations in its analysis &
interpretations.” Some of these can be listed as;
The assumptions of producer’s market phenomenon not hold goods for all types of
commodities.
The fixed cost may remain constant as well as the variable costs may not vary n fixed
proportions at different levels of output.
With variation in the prices of the items or services which also depend on the factors
affecting the demand and supply will certainly affect the demand of the commodity.
This phenomenon is not covered in even analysis.
Identification of fixed and variable costs involved in production process is very
complicated. A shift in product mix may change the break even point.
Customers may be given certain discount on purchase to promote sales. This revenue
may not be perfectly variable with level of sales output”(Maheswari,2000: 183-184).
38
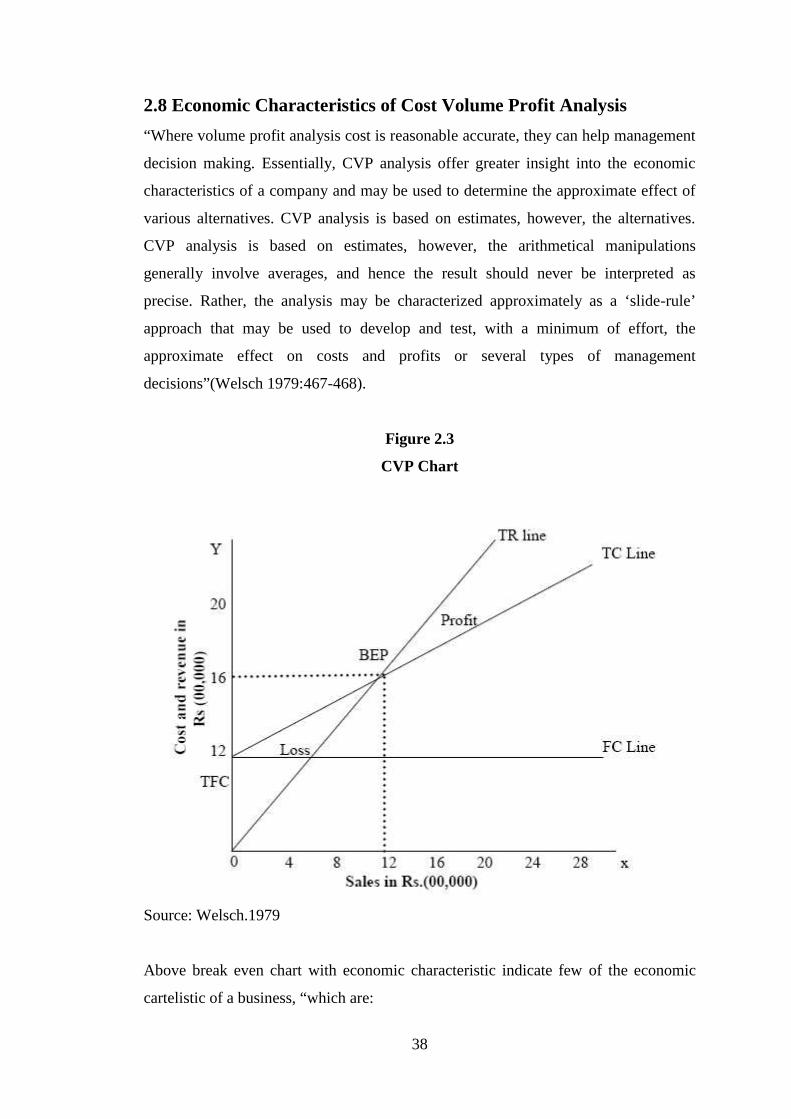
2.8 Economic Characteristics of Cost Volume Profit Analysis
“Where volume profit analysis cost is reasonable accurate, they can help management
decision making. Essentially, CVP analysis offer greater insight into the economic
characteristics of a company and may be used to determine the approximate effect of
various alternatives. CVP analysis is based on estimates, however, the alternatives.
CVP analysis is based on estimates, however, the arithmetical manipulations
generally involve averages, and hence the result should never be interpreted as
precise. Rather, the analysis may be characterized approximately as a ‘slide-rule’
approach that may be used to develop and test, with a minimum of effort, the
approximate effect on costs and profits or several types of management
decisions”(Welsch 1979:467-468).
Figure 2.3
CVP Chart
Source: Welsch.1979
Above break even chart with economic characteristic indicate few of the economic
cartelistic of a business, “which are:
39
Fixed cost, variable costs and total coasts at varying volumes.
The profit and loss potential before & after income taxes at varying volumes.
The margin of safety is the relationship of budget volume to break even volume.
The preferred dividend or danger point the point below which preferred dividends
are not earned.
The deal point, the point where management earns only the “going” rate on the
investment.
The common dividend or unhealthy points below earnings are insufficient to pay
the preferred dividend and the expected dividend on the common stock”
(Welsch,1979:468).
All these points and as other can be completed if data are developed for cost volume
profit purpose.
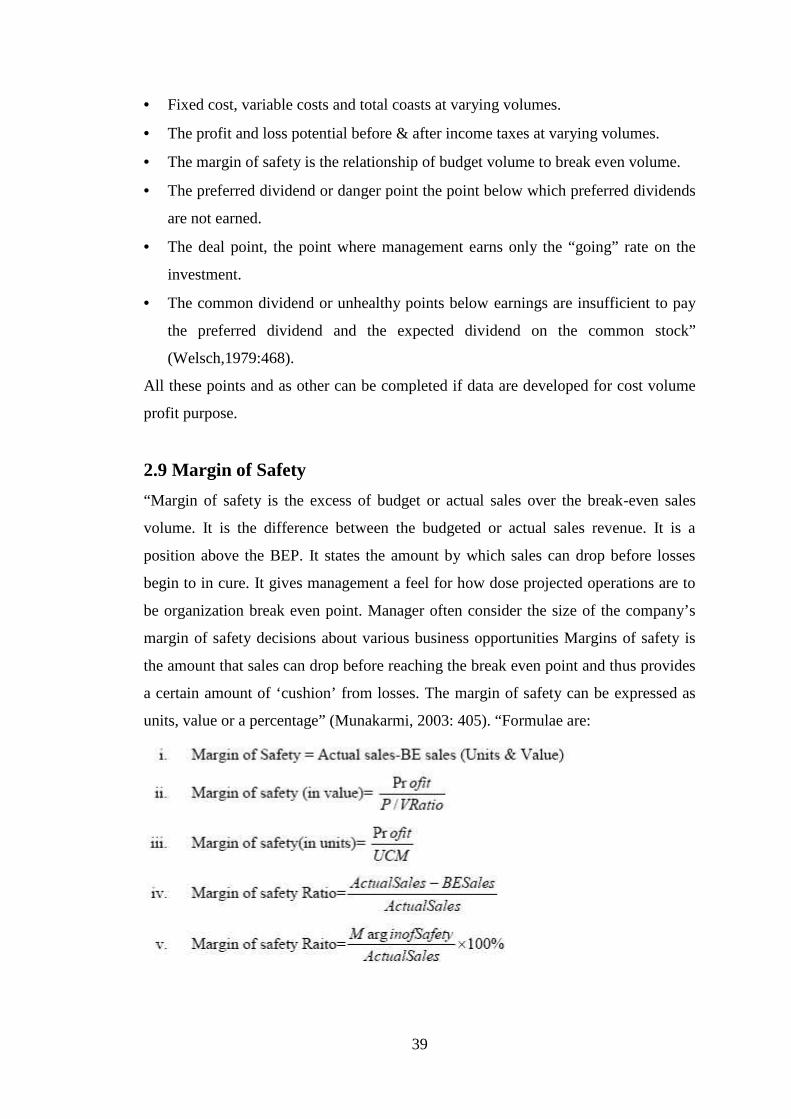
2.9 Margin of Safety
“Margin of safety is the excess of budget or actual sales over the break-even sales
volume. It is the difference between the budgeted or actual sales revenue. It is a
position above the BEP. It states the amount by which sales can drop before losses
begin to in cure. It gives management a feel for how dose projected operations are to
be organization break even point. Manager often consider the size of the company’s
margin of safety decisions about various business opportunities Margins of safety is
the amount that sales can drop before reaching the break even point and thus provides
a certain amount of ‘cushion’ from losses. The margin of safety can be expressed as
units, value or a percentage” (Munakarmi, 2003: 405). “Formulae are:
40
The larger is the safety margin the greater the chance for the company to earn
profit(i.e. larger the margin of safety safer the company). A high margin of safety is
particularly significant in times of depression when the demand for the company’s or
firm’s product is falling. Low margin of safety may result of firm which has low
contribution ratio. When both the margin of safety may result of firm which has low
contribution ratio are low, management should think the possibilities of increasing the
selling price it does not adversely affect the sales volume or reducing variables costs
by bringing improvement in manufacturing process”(munakarmi,2003:407).
The following steps are needed to rectify margin of safety:
• With increasing selling price.
• With increasing sales volume, if the capacity of fixed cost is not fully utilized.
• With reducing fixed cost if possible.
• With reducing variable cost (with reducing the cost of raw materials, wages and
other direct cost).
• With substituting product like by more profitable one.
2.10. Cost volume Profit Analysis for Multi Product Firms
“Sale mix can be defined as the relative combination of two or more product
represented in total. It is not only the sales revenue that makes profit. The proportion
of sales contributed by different product greatly changes the amount of profit.
Managers try to achiever that combination or mix that will yield the greatest amount
of profit. If a company sells more than one product, these may not be equally
profitable. So, the company’s profit will depend upon the ratio of each products sale
to total sales revenues.
Profit will be greater if high margin item make up a relatively large proportion of total
sales than if sales consist mostly of low margin items. Changes in sales mix can cause
great variations in a company’s profit. A shift to low margin item can cause the total
profit to decrease even though total sales increase on the contrary, a shift in the sales
mix from low margin items to high margin item can cause the reserve effect total
profit may increase even though total sales decrease”(Bajracharya, Ojha, Goet &
Sharma,2004:260).
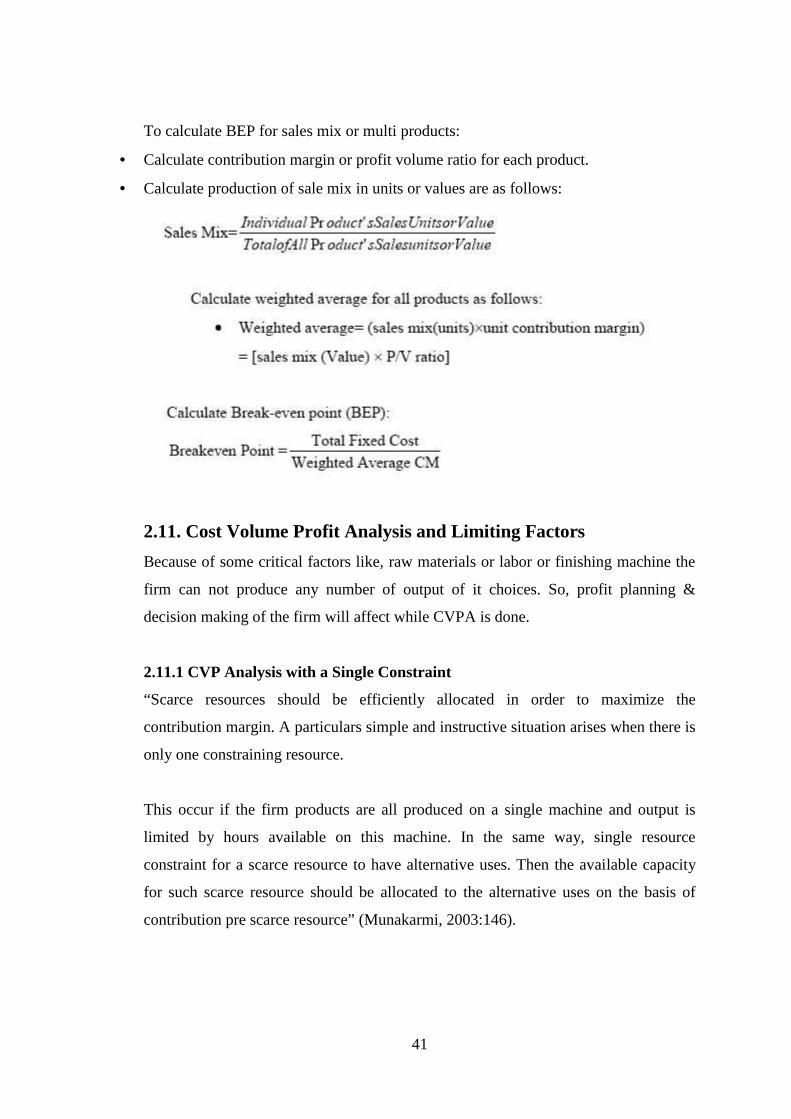
41
To calculate BEP for sales mix or multi products:
Calculate contribution margin or profit volume ratio for each product.
Calculate production of sale mix in units or values are as follows:
2.11. Cost Volume Profit Analysis and Limiting Factors
Because of some critical factors like, raw materials or labor or finishing machine the
firm can not produce any number of output of it choices. So, profit planning &
decision making of the firm will affect while CVPA is done.
2.11.1 CVP Analysis with a Single Constraint
“Scarce resources should be efficiently allocated in order to maximize the
contribution margin. A particulars simple and instructive situation arises when there is
only one constraining resource.
This occur if the firm products are all produced on a single machine and output is
limited by hours available on this machine. In the same way, single resource
constraint for a scarce resource to have alternative uses. Then the available capacity
for such scarce resource should be allocated to the alternative uses on the basis of
contribution pre scarce resource” (Munakarmi, 2003:146).
42
2.11.2 CVP Analysis with Multiple Constraints
“Where more than one scarce resource exists the optimum production programmed
can’t easily be established by the simple process applied in single resource constraint.
Under the circumstances simple allocation of resource or the basis of contribution
margin per unit is neither feasible nor desirable. Contribution margin per unit of
scared resource may be different for different ranking of product, because production
processes are affected by many constrains factors rather than single constraint. In such
situation, linear programming technique may used to optimize product mix. The linear
programming formulation is required to determine a production plan which
maximizes contribution from the product mix Linear programming is mathematical
technique which shows how to arrive the optimum results, allocation available
resources in a meaningful manner. It is basically concerned with the problem of
allocating limit resources among competitive activities in an optimum manner. It is a
technique to optimize the allocation of scarce resources in product mix problems
which provides a valuable extension to cost volume profit analysis” (Munakarmi,
2003:148).
2.12. CVP Analysis under Condition of Uncertainty
CVP analysis can be used for various purposes such as choosing between machine
and products, planning of profit and mist significant fixing up of selling price.
Management uses this as a convenient tool of profit planning with giving
consideration of risk and uncertainty involved in it.
Although, margin of safety ratio explains the degree of sensitivity of the project and
product in general but it fails to explain certainty un the product and also between the
alternatives. To overcome such a difficulty risk and uncertainty analysis like in any
other management decision making can also be used in CVP analysis. The objective
in CVP analysis under condition of uncertainty is to assess the probability distribution
of the profit volume under given distribution of one or more factors, sales price or
profits. “Profitability distribution approach is a simple statistical tool which may be
used to measure the risk and uncertainty involved in CVP analysis. A probability
distribution theory normally suggests for postulation of various possibility of
happening of the event in consideration. This may be done either taking into
considerations of the experience in the pat or may be done by considering the personal
43
intuition of the persons doing so .In business reference of past experience are hardly
available not a person is likely to behave in the same manner in the similar situation in
different time. Therefore, personal judgments plays significant role in the
management decision making. The conditions thus postulated are assigned probability
(i.e. ones judgments towards likeliness of happening of the condition forecasted). It
must be understood that probability assigned here is a subjective probability based in
personal judgments of the man making such an analysis’ (Pandey, 2003: 17).
2.13 Assumptions Underlying CVP Analysis
“Break even analysis is the most useful techniques of profit planning and control. It is
a device to explain the relationship between cost volume and profit. The discussion of
the CVP analysis (or Break even analysis) so far is based on the following
assumptions;
• Cost Segregation: The total cost can be separated into fixed and variable
components. Constant fixed cost is the total fixed cost that remains unchanged
with changes in sales volume. Constant unit variable cost is the variable cost per
unit and total variable cost changes in direct proportion to the sales volume.
• Constant Selling price: The selling price per unit remains the constant that it does
not change with volume or because of other factors.
• Constant sale mix: The firm manufactures only one product or if there are
multiple products, the sales mix does not change.
• Synchronized production and sales; production and sales are synchronized, that is
inventories remain the same” (Pandey, 1994: 241).
2.14 Limitation CVP Analysis
Assumption limits the utility ad general applicability of the CVP analysis. Therefore
the analysis should recognize these limitations and adjust data, wherever possible, to
get meaningful results.
“The CVP analysis suffers from the following limitations:
• It is difficult to separate costs into fixed and variable components.
• It is not correct to assume that total fixed cost would remain unchanged over the
entire range of volume.
• The assumptions of constant selling price and unit variable cost are not valid.
44
• It is difficult to use the break even analysis for a multi product firms.
• The break even analysis is a break run concept and has a limited use in long range
planning.
• The break even analysis is a static tool” (Pandey, 1999:214).
2.15 Special Problems in Cost Volume Profit Analysis
“Cost volume profit analysis is applied to individual products or parts of a business
and all the product or activities combined. In later case, there are three special
problems may be encountered” (Welsch, Hilton and Gordon, 2001:513-518).
2.15.1 The Activity Base
When two or more products or activities are combined is combined for break even
analysis the activity base must be in additive units using a common denominator of
volume or output in multiple products. Therefore for the company as a whole, net
sales amount are usually the only satisfactory common denominator because
manufacturing, selling and administrative activities are expressed in combination.
2.15.2 The Change in Inventory
Usually the budgeted changes in inventories (i.e. finished goods and work in progress)
are in material in amount and thus may be disregarded in cist volume profit analysis.
On the other hand, when the change in budgeted inventory is significant, it should be
included in the analysis. Including the effect of inventory changes in CVP analysis
requires subjective judgment about what management might do (about making
inventory changes) at different volume, levels and the conceptual precision that is
desired. Management considers two practical approaches or policies in inventory
changes of used a) Disregard and inventory changes b) include the inventory changes.
2.15.3 The Non Operating Income and Expenses
Non operating income (grains) and expenses (loss) and extra ordinary gains and losses
of material in amount cause another problem in CVP analysis. The basic issue is
whether they should be included or excluded. Extra ordinary gains and losses are none
recurring and unusual, therefore they should be excluded. Non-operating incomes and
45
expenses are recurring but they are not related to ongoing operations. Management
considers the policy may be to (a) include the non operating incomes and expenses.
2.16 Sensitivity Analysis
Sensitivity analysis is the measurement of elasticity of the change in CVP factors in
break -even point or given profit. The strategist should focus more on the factor,
which is more sensitive or responsive for profit. To measure the sensitivity of CVP
factors one can see the impact of certain percentage or amount change in volume price
or cost factors on net profit. In other word, sensitivity analysis is the measurement of
responsiveness in outcome with the changes in determinant variables. We know that
the goal of a business enterprise is to maximize profit. Profit is the excess of revenue
over the total costs.
Profit = Total sales revenue-Total costs
Net profit = Sales units x SPPU - Sales units x VCPU – fixed cost-taxes
So that, profit = FC (sales volume, selling price, VC, FC, taxes and so on.
“But none of the factors remain unchanged: sometimes the manager can intentionally
change the price and cost factors as a part of strategic decision. But the strategy
should focus more on the factor, which is the more sensitive or responsive for profit.
SO to measure the sensitivity of CVP factors, we can see the impact of certain
percentage or amount change in volume, price or cost factors on net profit”
(Bajracharaya, Ojha, Goet & Sharma 2004:245).
2.17 Risk Measurement: The Operating Leverage and Break Even Point
Operating leverage tells us how profit change in sales. It is evident that profit changes
more rapidly than sales. Why do profit change more rapidly than the sales? It is
because some costs do not change say if sales decline variable costs also decline in
the same ratio so that contribution margin also decline proportionately. But fixed
costs do not decline so, the net operating income decline more rapidly. The something
applies in the case of increase well. Sales revenues changes but some parts of costs,
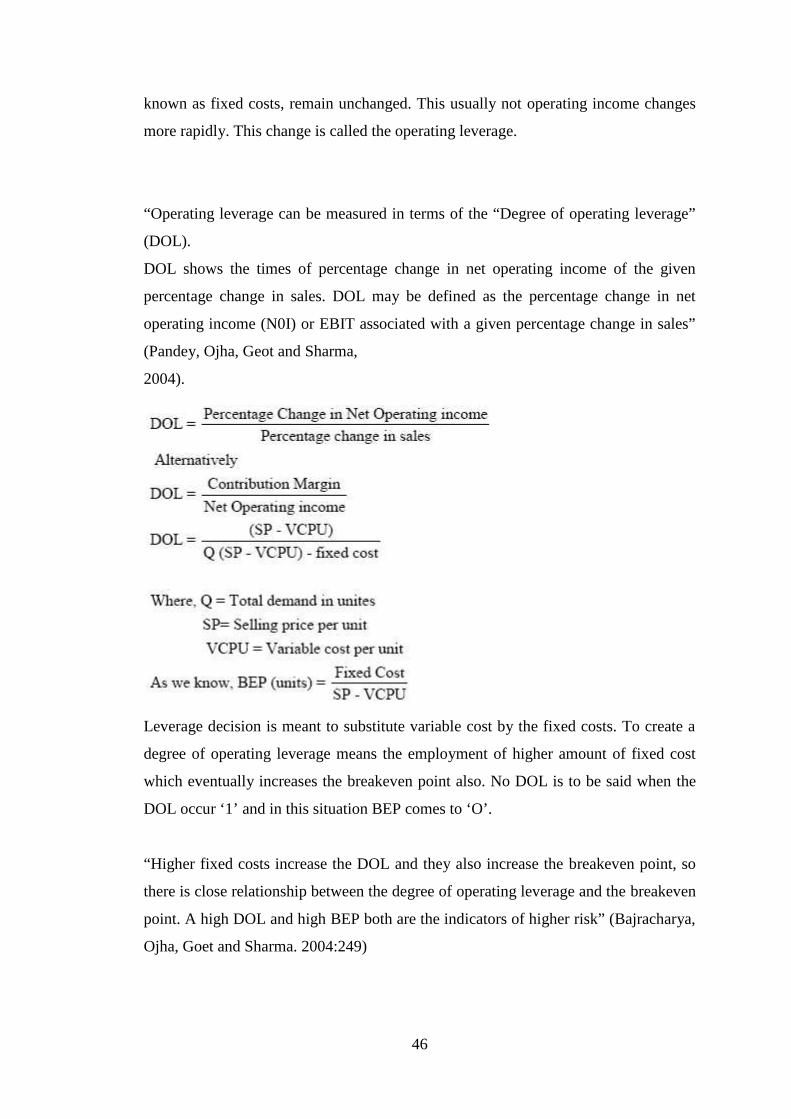
46
known as fixed costs, remain unchanged. This usually not operating income changes
more rapidly. This change is called the operating leverage.
“Operating leverage can be measured in terms of the “Degree of operating leverage”
(DOL).
DOL shows the times of percentage change in net operating income of the given
percentage change in sales. DOL may be defined as the percentage change in net
operating income (N0I) or EBIT associated with a given percentage change in sales”
(Pandey, Ojha, Geot and Sharma,
2004).
Leverage decision is meant to substitute variable cost by the fixed costs. To create a
degree of operating leverage means the employment of higher amount of fixed cost
which eventually increases the breakeven point also. No DOL is to be said when the
DOL occur ‘1’ and in this situation BEP comes to ‘O’.
“Higher fixed costs increase the DOL and they also increase the breakeven point, so
there is close relationship between the degree of operating leverage and the breakeven
point. A high DOL and high BEP both are the indicators of higher risk” (Bajracharya,
Ojha, Goet and Sharma. 2004:249)
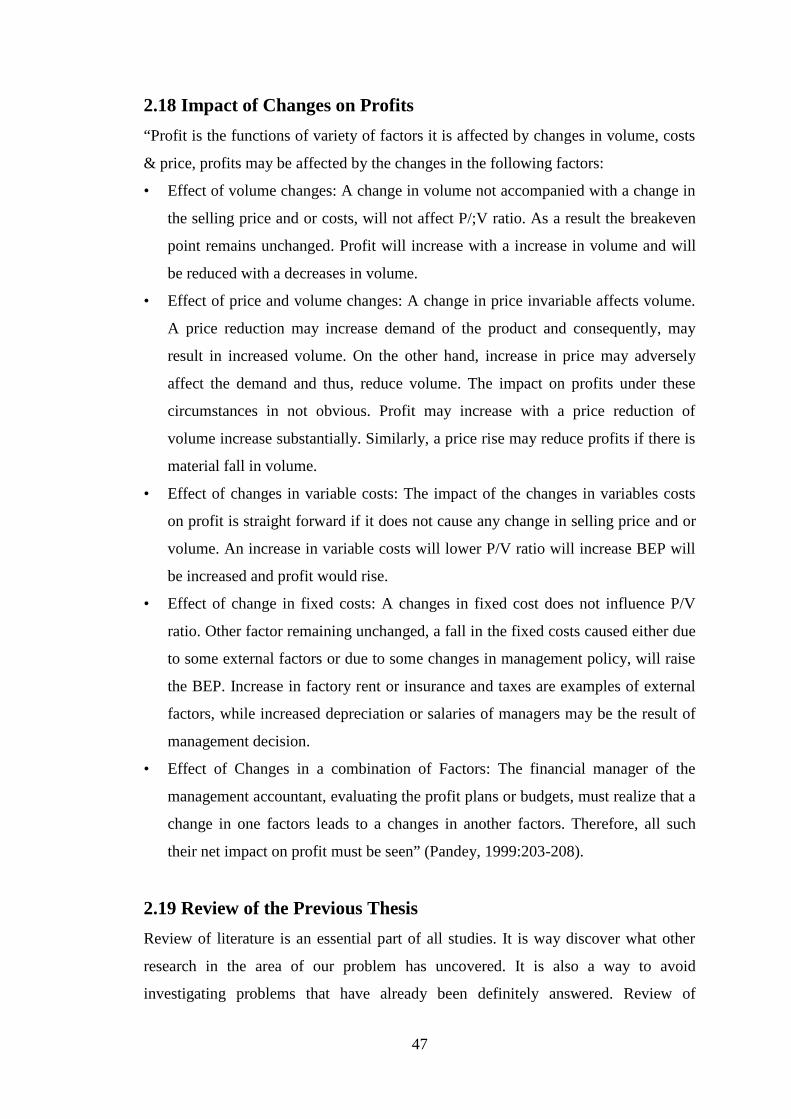
47
2.18 Impact of Changes on Profits
“Profit is the functions of variety of factors it is affected by changes in volume, costs
& price, profits may be affected by the changes in the following factors:
• Effect of volume changes: A change in volume not accompanied with a change in
the selling price and or costs, will not affect P/;V ratio. As a result the breakeven
point remains unchanged. Profit will increase with a increase in volume and will
be reduced with a decreases in volume.
• Effect of price and volume changes: A change in price invariable affects volume.
A price reduction may increase demand of the product and consequently, may
result in increased volume. On the other hand, increase in price may adversely
affect the demand and thus, reduce volume. The impact on profits under these
circumstances in not obvious. Profit may increase with a price reduction of
volume increase substantially. Similarly, a price rise may reduce profits if there is
material fall in volume.
• Effect of changes in variable costs: The impact of the changes in variables costs
on profit is straight forward if it does not cause any change in selling price and or
volume. An increase in variable costs will lower P/V ratio will increase BEP will
be increased and profit would rise.
• Effect of change in fixed costs: A changes in fixed cost does not influence P/V
ratio. Other factor remaining unchanged, a fall in the fixed costs caused either due
to some external factors or due to some changes in management policy, will raise
the BEP. Increase in factory rent or insurance and taxes are examples of external
factors, while increased depreciation or salaries of managers may be the result of
management decision.
• Effect of Changes in a combination of Factors: The financial manager of the
management accountant, evaluating the profit plans or budgets, must realize that a
change in one factors leads to a changes in another factors. Therefore, all such
their net impact on profit must be seen” (Pandey, 1999:203-208).
2.19 Review of the Previous Thesis
Review of literature is an essential part of all studies. It is way discover what other
research in the area of our problem has uncovered. It is also a way to avoid
investigating problems that have already been definitely answered. Review of
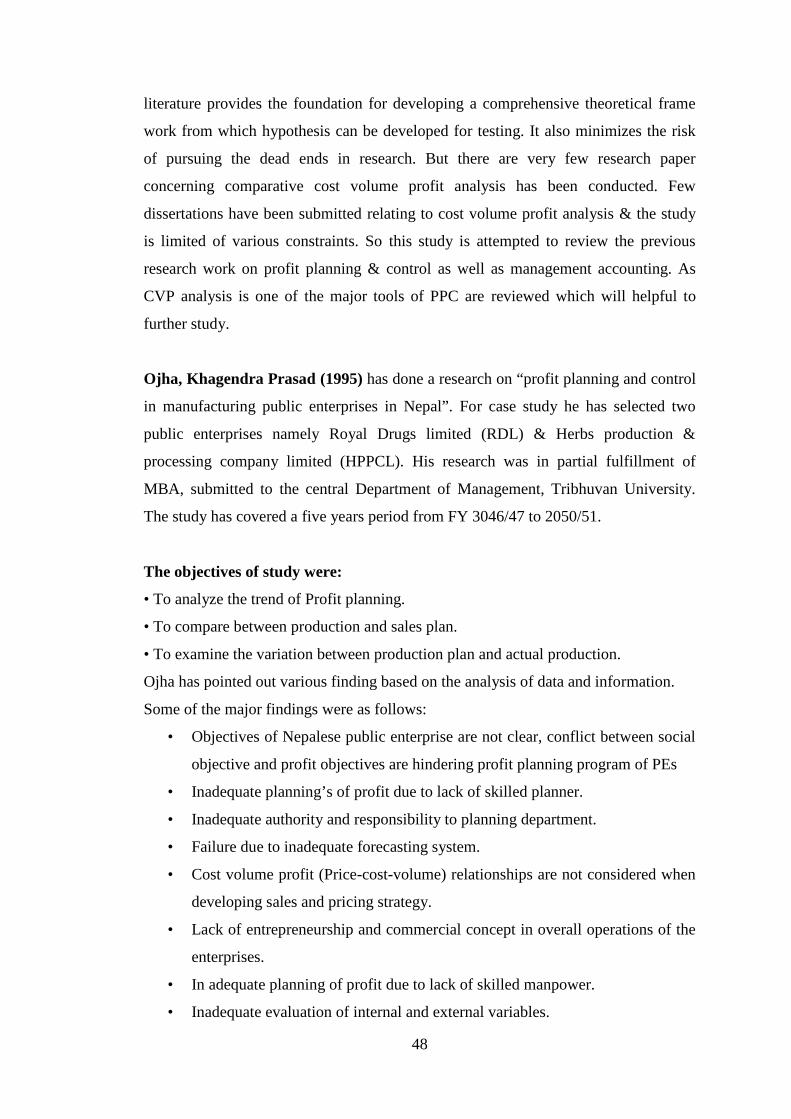
48
literature provides the foundation for developing a comprehensive theoretical frame
work from which hypothesis can be developed for testing. It also minimizes the risk
of pursuing the dead ends in research. But there are very few research paper
concerning comparative cost volume profit analysis has been conducted. Few
dissertations have been submitted relating to cost volume profit analysis & the study
is limited of various constraints. So this study is attempted to review the previous
research work on profit planning & control as well as management accounting. As
CVP analysis is one of the major tools of PPC are reviewed which will helpful to
further study.
Ojha, Khagendra Prasad (1995) has done a research on “profit planning and control
in manufacturing public enterprises in Nepal”. For case study he has selected two
public enterprises namely Royal Drugs limited (RDL) & Herbs production &
processing company limited (HPPCL). His research was in partial fulfillment of
MBA, submitted to the central Department of Management, Tribhuvan University.
The study has covered a five years period from FY 3046/47 to 2050/51.
The objectives of study were:
• To analyze the trend of Profit planning.
• To compare between production and sales plan.
• To examine the variation between production plan and actual production.
Ojha has pointed out various finding based on the analysis of data and information.
Some of the major findings were as follows:
• Objectives of Nepalese public enterprise are not clear, conflict between social
objective and profit objectives are hindering profit planning program of PEs
• Inadequate planning’s of profit due to lack of skilled planner.
• Inadequate authority and responsibility to planning department.
• Failure due to inadequate forecasting system.
• Cost volume profit (Price-cost-volume) relationships are not considered when
developing sales and pricing strategy.
• Lack of entrepreneurship and commercial concept in overall operations of the
enterprises.
• In adequate planning of profit due to lack of skilled manpower.
• Inadequate evaluation of internal and external variables.
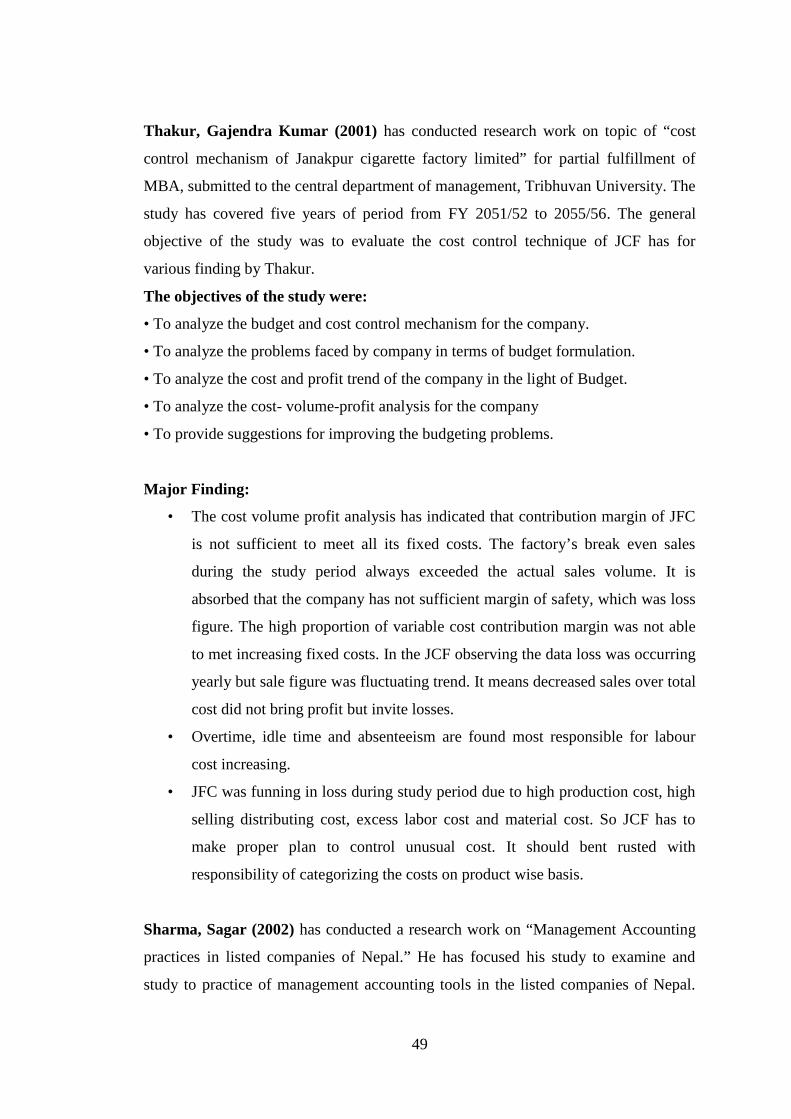
49
Thakur, Gajendra Kumar (2001) has conducted research work on topic of “cost
control mechanism of Janakpur cigarette factory limited” for partial fulfillment of
MBA, submitted to the central department of management, Tribhuvan University. The
study has covered five years of period from FY 2051/52 to 2055/56. The general
objective of the study was to evaluate the cost control technique of JCF has for
various finding by Thakur.
The objectives of the study were:
• To analyze the budget and cost control mechanism for the company.
• To analyze the problems faced by company in terms of budget formulation.
• To analyze the cost and profit trend of the company in the light of Budget.
• To analyze the cost- volume-profit analysis for the company
• To provide suggestions for improving the budgeting problems.
Major Finding:
• The cost volume profit analysis has indicated that contribution margin of JFC
is not sufficient to meet all its fixed costs. The factory’s break even sales
during the study period always exceeded the actual sales volume. It is
absorbed that the company has not sufficient margin of safety, which was loss
figure. The high proportion of variable cost contribution margin was not able
to met increasing fixed costs. In the JCF observing the data loss was occurring
yearly but sale figure was fluctuating trend. It means decreased sales over total
cost did not bring profit but invite losses.
• Overtime, idle time and absenteeism are found most responsible for labour
cost increasing.
• JFC was funning in loss during study period due to high production cost, high
selling distributing cost, excess labor cost and material cost. So JCF has to
make proper plan to control unusual cost. It should bent rusted with
responsibility of categorizing the costs on product wise basis.
Sharma, Sagar (2002) has conducted a research work on “Management Accounting
practices in listed companies of Nepal.” He has focused his study to examine and
study to practice of management accounting tools in the listed companies of Nepal.
50
Mr. Sharma’s research study is based only on primary data. Stratified random
sampling with proportionate allocation of percentage is followed up draw the sample.
The objectives of the study were:
• To identify the areas where management accounting tools can be applied to make
strengthen the companies.
• To identify the present practice of management accounting tools in Nepalese
Manufacturing Enterprises.
• To identify the problem faced by Nepalese Manufacturing Enterprises in applying
management accounting tools.
• To make recommendations to avoid difficulties in applying management
accounting tools in Nepalese Manufacturing Enterprises.
Major Findings were:
• Management accounting is to help managers in overall managerial activities by
providing information and helping in planning, controlling and decision making.
• Lack of information and extra cost burden are the main reason behind not
practicing such tools.
• Different types of management accounting tools which are taught in the colleges
are not found applying by the listed companies of Nepal.
• Nepalese listed companies are in infant stage in practicing of management
accounting tool such as capital budgeting, annual budgeting, cash flow, ratio
analysis, activity costing, cost volume profit relation etc.
• Regarding the tools practiced by the Nepalese manufacturing companies for
measuring and controlling their overall performance. From the study it is cleared
that 60% of the manufacturing companies measure their performance on the basis
of profit or loss made by them during the year while 26% of the companies
practiced for measuring and controlling performance of the company. Where as
budgetary costing and break– even- point both were followed by 7%.
• Regarding the technique practiced by the Nepalese manufacturing companied for
pricing the product. From study it is cleared that 60% of the companies practice
cost plus pricing, while 26% of the companies practice going rare pricing and 7%
of the companies practiced target return pricing and break even pricing for their
51
product. Therefore, from the study it is cleared that cost plus pricing technique is
widely used by Nepalese manufacturing companies.
• Regarding the joint cost allocation tools practiced by the Nepalese manufacturing
companies. From the study 47% of the companies practiced joint cost allocation a
unit or production basis. 40% of the manufacturing firm had their own method for
joint cost allocation. Such as ratio method, department wise and 13% of the
manufacturing companies practice sales value methods for allocating joint cost.
• Regarding the practice of transfer price in the Nepalese manufacturing companies,
it is cleared that 67% of the manufacturing companies practiced cost base transfer
pricing 26% of manufacturing companies practiced market based transfer pricing
whereas 7% of the manufacturing companies practiced negotiated transfer price
for their product
• Regarding the decision-making and control process followed by Nepalese
manufacturing firm, it is cleared that 73% of Nepalese manufacturing companies
practiced control during the work period.20% practice control before work has to
be start technique, where as 7% practiced controls after finish the work. From the
table, control during the work period is most practiced techniques for decision
making and control process.
• Regarding the present problem faced by Nepalese manufacturing companies in
decision making process, it is cleared that 53% Nepalese manufacturing
companies face the problem of skilled manpower in decision making process.
27% of manufacturing companies face the problem of undefined objective and
20% companies face infrastructure problem in decision making process. While no
one companies has lack of knowledge in decision making process.
Rijal, Madav (2005) has conducted a research on “cost volume profit analysis tools
to measure effectiveness of profit planning and control: A case study of NEBICO
private limited.” He has centered his study to examine CVP analysis as a tool in
manufacturing industry and to analyze the CVP and its impact in profit planning. For
the practical fulfillment of MBS submitted to Shanker Dev Campus, Tribhuvan
University, Rijal has analyzed the five years financial statement and has pointed out
various objectives and findings:
52
The objectives of the study were:
• To analyze the cost volume profit for the company.
• To compare between production and sales plan.
• To examine the variation between production plan and actual production.
The major findings were:
• The company’s variable cost is in proportion than fixed cost in total cost amount,
which contribute for lower contribution Margin.
• The company has high fixed cost (i.e. salary and wages, technical and computer
fees, deprecation interest, provident fund and subsidies)
• Company has no any plan to reduce cost. There is lack of effective cost control
programs or techniques.
• The profit trend of the company is not satisfactory. As compared to profit,
proportion is very low with fluctuated trend.
• The company has no detailed of any systematic expenses plan. The fixed cost,
variable cost, mixed expenses plan are the necessary elements for profit planning
and control.
• The company has no effective inventory policy. The inventory management, row
material handling and controlling system are not efficient and effective.
• The board of directors is the main authority in price fixing and it directly
interferes to price of biscuit and confectionary products.
• Nebico Pvt. Ltd has not proper practice of segregating the costs into fixed and
variable or controllable and non controllable.
• There is no proper co-ordination among production, administration, distribution of
inventory and sales department.
• Nebico has not utilized its capacity.
Dhakal, Dipendra Raj (2005) has conducted research work on “Cost volume profit
analysis as a tools to measure the effectiveness of profit planning and control: A Case
Study of Gorkhakhali Rubber industry Limited” in the partial fulfillment for MBS,
submitted to Shanker Dev Campus, T.U. Dhakal has covered five years period for FY
2050/57 to 2060/61 and listed some objectives and finding.
53
The objectives of the study were:
• To analyze the cost volume profit for the company.
• To measure the effectiveness of profit planning and control tools.
• To examine the variation between production plan and actual production.
Major Findings were:
• Sales plan of GRIL is not properly maintained. The industry uses the various methods
for sales planning like market survey, distribution network etc. but up to date record
are not maintained. So they have poor budgeting system.
• GRIL is not practicing the scientific ad appropriate cost classification technique costs
are classified into fixed and variable as per the decision of the management. Out of
the total cost of GRIL, variable cost is almost 60% in every year which cause the low
contribution margin.
• GRIL is in high interest bracket, out of the total fixed costs almost 60% is to be paid
for interest. And the profitability of the company id greatly influenced by high fixed
cost.
• This industry does not have any detailed and systematic practice of planning of cost
which is one of the essential elements of profit planning and control.
• Lack of coordination between top and lower level of management.
• GRIL is facing problem fluctuating international price of rubber. Sometimes it also
faces the problem of row material scarcity as well.
• Out of the two main product truck tires, the truck tires are more profitable than non
truck tyres as shown by the product contribution margin.
• The financial position of the industry is not satisfactory. Gross profit margin ratio and
net profit margin ration are not satisfactory.
Namdak, Tenzin (2005) has submitted the thesis on the topic “Cost Volume Profit
analysis of Diary Development Corporation.” Mr. Namdak had concerned his study to
determine the relationship between cost volume and profit and profitability of the
DDC. His research covered the time period of five years from fiscal year 2055/56 to
2059/60.
54
The major findings were as follows:
• DDC has been planning only on short-term basis.
• The practice of CVP analysis has not been use yet.
• There is no practice of segregating cost into fixed ad variables.
• Over- Utilization of capacity resulting in increasing operation and maintenance cost
every year.
• The profitability of DDC is very low.
Shrestha, Dharma Raj (2006) had conducted a research entitled “Cost, Volume and
Profit Analysis of Commercial Bank (A Case Study of Himalayan Bank Limited)”
Mr. Shrestha has concerned his study on indentifying and evaluating the current
practice of CVP Analysis and its effectiveness in Commercial Bank in Nepla with
special reference to HBL.
The objectives were:
• To study the relationship of cost, volume and profit as an applicable tools of
budgeting.
• To evaluate the profitability, financial position and sensitivity analysis of HBL.
• To analyze the cost, volume and profit of the Commercial Bank and its impact in
profit planning.
• To provide relevant suggestion, recommendation and practical idea for improving
competitiveness strength of HBL.
The major findings were as follows:
• HBL Investments are growing fast.
• Loan and Bill Purchase growth trend is fluctuating.
• There is high correlation between loan/bill growth and interest income growth.
• There is no practice of CVP Analysis.
• All levels of management is not involved in profit planning and decision making of
the Bank.
• Lack of system of SWOT Analysis.
• Margin of Safety is high than BEP Sales. It means well performance of the Bank.
55
Dahal, Rabin (2008) has submitted a research on “Profit planning system and
financial condition of Nepal electricity authority”. He has covered five years period.
The objectives of the study were:
• To analyze the profit planning tools for the company.
• To analyze the cost-volume- profit for the company.
• To segregate the costs of company into fixed and variable costs and unit variable
cost.
Major Findings were:
• NEA has a practice of preparing both systemic (long range) and (tactical short range)
profit plan.
• Overheads are not classified systematically and it creates problem to analyze is
expenses properly.
• NEA is playing a huge amount of interest every year and it is suffering from high
fixed costs.
• CVP analysis of the authority has the satisfactory position and also flexible budget
analysis, the authority is able to earn operating profit of its utilized capacity.
• The authority does not maintain its periodic performance report systematically.
• The company had not practice of classification of costs into fixed costs and variable
cost.
• The total fixed costs of the company were increasing annually.
• Advertisement, salary and allowance, communication expenses, insurance premium,
depreciation and interest on long term loan were higher portion of total fixed cost and
the amount of these items were highly incremental condition.
• The variable costs were also at increasing trends, and vital items were material with
direct expenses on purchase, royalty, sales promotion expenses, transportation and
insurance expenses, salary and wages, leakage and breakage, complementary
expenses, traveling expenses and water.
Aryal, Chaturbhuj (2009) has conducted a research entitled “CVP analysis as a tool
to measure effectiveness of PPC” (A case study of Herbs Production and Processing
Co.Ltd.). He used primary and secondary data collected and used seven years data.
56
The major findings were as follows:
• Budgets were prepared on traditional method.
• HPPCL has high burden of management and administration expenses and interest
only, which is directly influencing the profitability.
• There was not practice of separating cost into fixed and variable. The cost were
roughly classified and that classification to use financial tools, like as flexible budget,
CVP, cost of goods sold and degree of operating leverage and profit margin ratio.
• HPPCL is suffering from huge losses. So in every year has negative net profit margin
ratio.
• Profit volume ratio of the company is in fluctuated trend, which affects on BEP to the
company.
• BEP of the company is always higher than Actual sales. So He Company should not
maintain its expanses.
2.20 Research Gap
Research Gap helps us to identify the need or significance of this study by finding the
lapses or gaps that was addressed by the previous studies. In the meantime it also
helps to duplicate the work of other researches and start from where previous studies
have ended thus finding the new avenues of study.
During the work of the research, many above mentioned related literatures were
studied. It has been evident from the study that there has been a lot of researches and
literature in terms of CVP Analysis, however there is very rare study in case of CVP
Analysis of Services Industry in general and Banking Industry in specific. It is not
only the case of Nepal but worldwide, the proper use of management accounting is
being mostly made in Manufacturing Sector or logistics sector but not in other
services sectors like Hotels, Hospitals and Banks. It doesn’t however undermine the
importance of the use of management accounting, CVP Analysis in particular in those
industries.
Most of the case studies made in the field of CVP Analysis are that of manufacturing
companies only in above case. There is only one study that I found related to my topic
of Banking Industry CVP Analysis made by Mr. Dharma Raj Shrestha (2006) titled
57
“Cost, Volume and Profit Analysis of Commercial Bank (A Case Study of Himalayan
Bank Limited)”. I found that there are considerable research gaps in that research
though it is highly appreciable that Mr. Shrestha has tried to cover new topic in this
section. The current research will cover following additional points in addition to that
of Mr. Shrestha’s study:
Cost Segregation: Proper cost segregation into fixed and variable costs is the
most important part in CVP Analysis. Though efforts have been made in
segregation of cost in the research of Mr. Shrestha, I find that there is quite
mismatch in the spirit of the costs in view of the industry. For example, Electricity
has been kept as variable costs in his study, however it would only be variable in
terms of the manufacturing industry where the power consumption is directly
proportional to the no. of goods produced. In case of Banking electricity is
required no matter whether there is customers coming in or not. So my research
would try to appropriately segregate the costs, to the most rational way it can be
making suitable assumptions.
Weighted Average Interest Spread Rate: Bank is an intermediary which accepts
deposits by paying interest and lends money by taking interest. The spread is the
profit to the bank after deducting its other expenses. Hence, as the matter of fact,
BEP should be founded on the basis of this interest spread rate and only few other
variable costs. Previous research doesn’t recognize the importance of this fact and
doesn’t distinguish the calculation of this specific industry from any other
industries.
CD Ration, CRR and SLR: Banks are regulated by the Central Bank that devises
the monetary policy to stabilize and control the money supply hence balancing the
Balance of Payment, Inflation, Economic Growth and other economic indicators.
In that note, it puts forth many restrictions in term of CD Ration, CRR and SLR.
Previous study of Mr. Shrestha has totally ignored this point.
Case specific BEP Analysis: CVP Analysis is a strong tool for decision making
of management and deciding on case by case basis any of the ventures of the
organization. For instance in deciding whether to open a new branch or not,
whether to launch a new product or not, whether to install a new ATM or not,
whether to take a new corporate deposit or not, payment of remittance or not etc.
58
CHAPTER - THREE
RESEARCH METHODOLOGY
3.1 Research Design
“In order to make any types of research a well research design is necessary, which
fulfills the objectives of the study. The research design is the strategy for conduction
research. It describes the general framework for collecting, analyzing and evaluating
data after identifying (i)what the researcher want to know, and (ii) what has to be
dealt with in order to obtain required information” (Wolf and Pant,1999:209).
This study attempted to show the relationship among cost, volume and profit. Cost
volume profit analysis of Bottlers Nepal is presented and analyzed. But the qualities
aspect of the research such as effectiveness of CVP analysis of the firm, views of
various manager and personal and the theoretical aspects are explained in the portion
wherever necessary.
3.2 Nature and Size of Population
Due to various circumstances it could not be possible to attempt all the number of
research population in this research. So, researcher has taken Bottlers Nepal Limited.
3.3 Sources of Data
There are vital role of data in research to clear and achieve research objectives.
Without the data, methodology cannot be utilized to bring the conclusion.
For the purpose of C-V-P Analysis of the Bottlers Nepal Limited, the data were
collected from both the sources of data, which are as follow:
3.3.1 Primary Data
Primary data is original in nature. For the purpose of research work, primary data
were collected. Basically, the following techniques were adopted:
a) Observation
b) Direct meeting
59
3.3.2 Secondary Data
It is the published data which has been used by first person or other. Only primary
data can’t fulfill the requirement of the research work. So, adoption of secondary data
is also suitable to accomplish the objectives of study. The following procedures were
adopted for secondary data.
a) Library
b) Companies Publications
c) Books and Journals/ Magazines
d) Booklets, and
e) Internet and websites etc
The output of the research work depends upon accuracy of the applied data. So, the
researcher tried to collect up to data and accurate data as far as possible.
3.4 Tools of Data Analysis
The following two techniques were used to explain the collection data.
3.4.1 Descriptive Techniques
These techniques were used to simplify the research report for better understanding as
well as analysis and interpretation of the collection data in theoretical form.
3.4.2 Quantitative Techniques
Descriptive techniques would be enough to prepare excellent research report. To
fulfill the gap, or make the research report attractive and for better understanding the
following profit planning tools were used:
C-V-P Analysis Tools
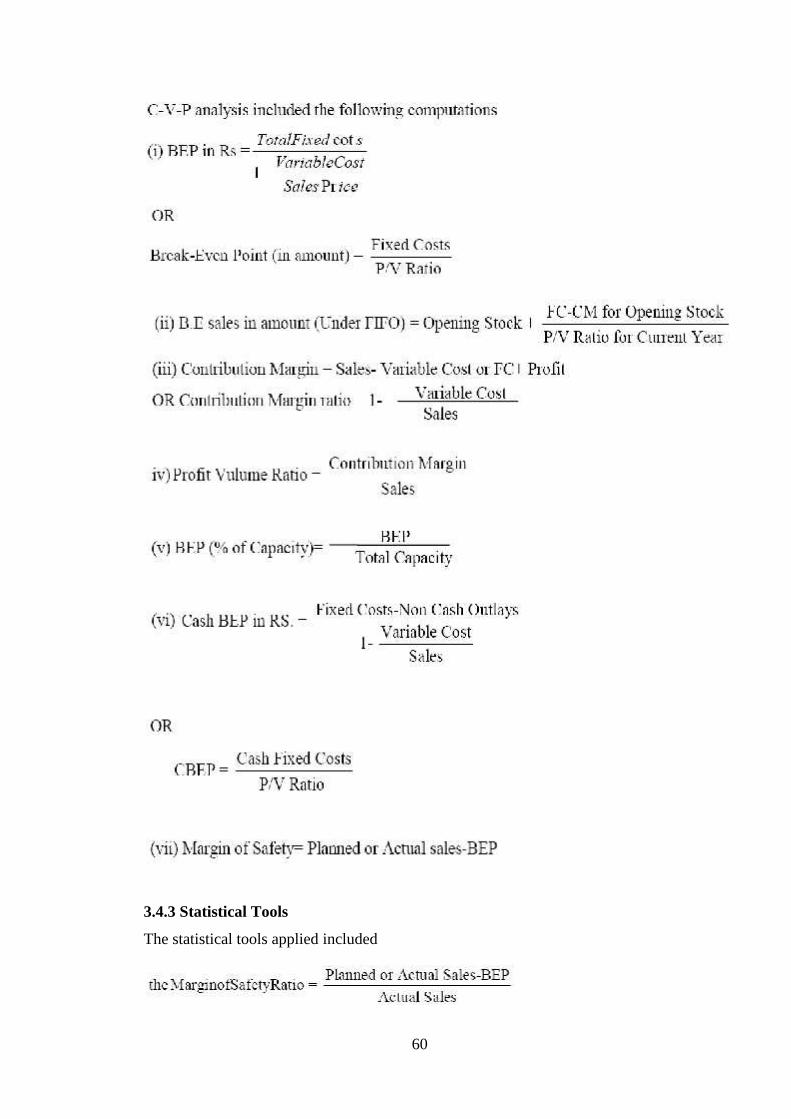
60
3.4.3 Statistical Tools
The statistical tools applied included
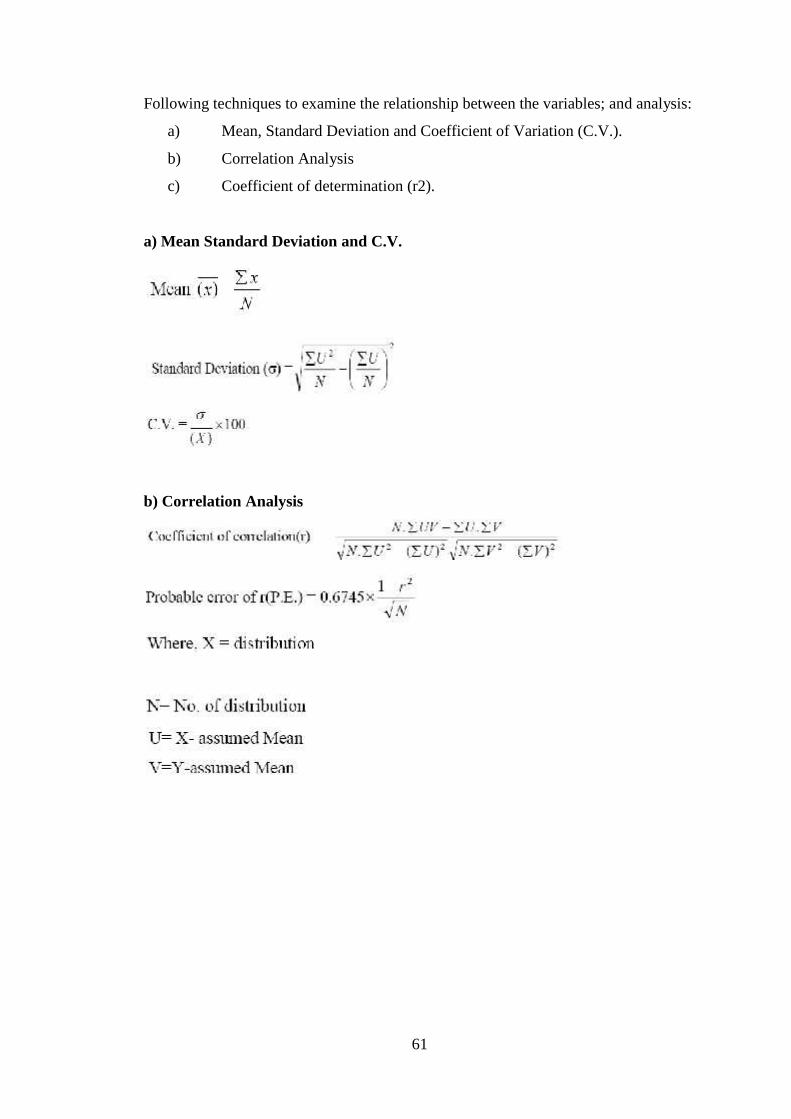
61
Following techniques to examine the relationship between the variables; and analysis:
a) Mean, Standard Deviation and Coefficient of Variation (C.V.).
b) Correlation Analysis
c) Coefficient of determination (r2).
a) Mean Standard Deviation and C.V.
b) Correlation Analysis
62
CHAPTER - FOUR
DATA PRESENTATION AND ANALYSIS
4.1 Introduction
CVP Analysis as already discussed above gives us the idea of the effective use of cost
as well as indicates the benchmark level of business or sales required to reach a break-
even point or earn a required return on investment. CVP analysis gives us quick
review of the performance and helps in setting standards for further performance. The
uniqueness of the CVP Analysis of banking from other organizations is that in case of
banking the highest amount of variable cost is the interest expense, similarly major
income is its yield in loan that is the amount of interest it receives from the loans.
The other fact is that as I have been talking from the initial part of this research paper,
Banking Industry as a whole is in very expansionary mode. The recent increment in
the no. of financial institutions as well as branch expansion of these financial
institutions has made this industry a very highly competitive sector. There is only
possibility of survival for the financial institution only if the institution reaches near
the customers, but in the other side of the story there is possibility that the bank may
run into loss due to the operational costs of the branch which is very high indeed. So
this research paper will try to focus on the various aspects of the Banking Functions
and its costs and profitability in specific reference to the Shangri-la Development
Bank Limited.
4.2 Sources and Utilization of Funds of SDBL
We can see from the table below (Table No.: 4.1) the position of sources and
utilization of Funds of SDBL. We can infer out two things from the below statements.
The trend of fund utilization has declined during the year 2065-66 however it
improved during the year 2066-67 again. The other point that can be concluded from
the table below is that there is concentration of the Portfolio in Loans and Advances
only. During the Year 2064-65 only there is investments amounted to Rs. 10,00,000
(Ten Lakhs) else during the two other years at the year end date there is no
investments other than Loans and Advances.
In consultation with SDBL Management it was found out that though there was no
other investment in the year end during the year 2066-67, however there was various
investments made during various period of that fiscal year to earn appropriate returns.
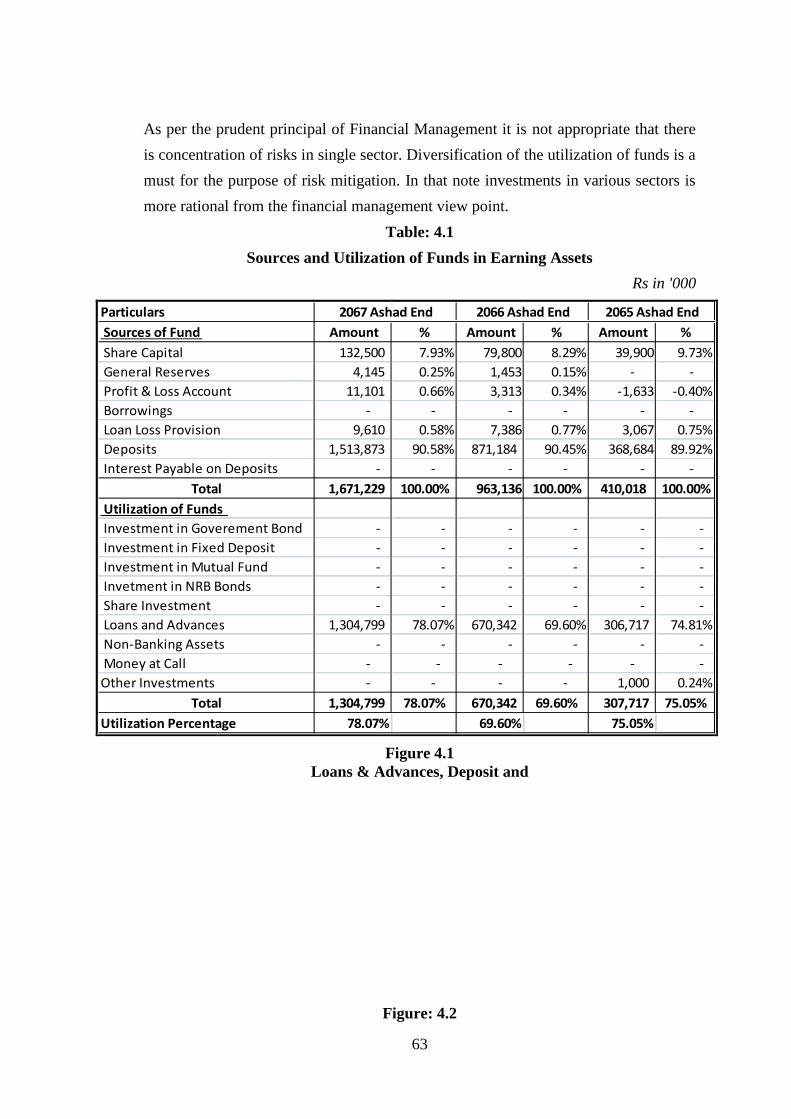
63
As per the prudent principal of Financial Management it is not appropriate that there
is concentration of risks in single sector. Diversification of the utilization of funds is a
must for the purpose of risk mitigation. In that note investments in various sectors is
more rational from the financial management view point.
Table: 4.1
Sources and Utilization of Funds in Earning Assets
Rs in '000
Particulars Sources of Fund Amount % Amount % Amount % Share Capital 132,500 7.93% 79,800 8.29% 39,900 9.73% General Reserves 4,145 0.25% 1,453 0.15% - - Profit & Loss Account 11,101 0.66% 3,313 0.34% -1,633 -0.40% Borrowings - - - - - - Loan Loss Provision 9,610 0.58% 7,386 0.77% 3,067 0.75% Deposits 1,513,873 90.58% 871,184 90.45% 368,684 89.92% Interest Payable on Deposits - - - - - -
Total 1,671,229 100.00% 963,136 100.00% 410,018 100.00% Utilization of Funds Investment in Goverement Bond - - - - - - Investment in Fixed Deposit - - - - - - Investment in Mutual Fund - - - - - - Invetment in NRB Bonds - - - - - - Share Investment - - - - - - Loans and Advances 1,304,799 78.07% 670,342 69.60% 306,717 74.81% Non-Banking Assets - - - - - - Money at Call - - - - - -Other Investments - - - - 1,000 0.24%
Total 1,304,799 78.07% 670,342 69.60% 307,717 75.05%Utilization Percentage 78.07% 69.60% 75.05%
2067 Ashad End 2066 Ashad End 2065 Ashad End
Figure 4.1Loans & Advances, Deposit and
Figure: 4.2
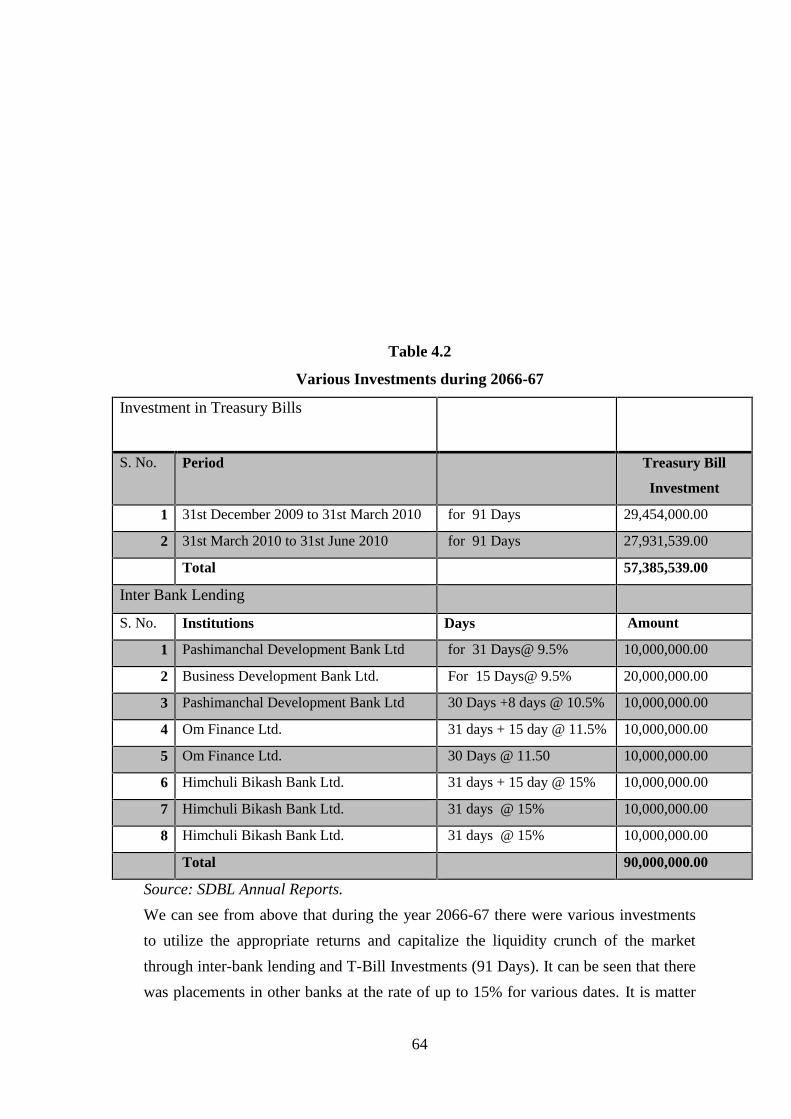
64
Table 4.2
Various Investments during 2066-67
Investment in Treasury Bills
S. No. Period Treasury Bill
Investment
1 31st December 2009 to 31st March 2010 for 91 Days 29,454,000.00
2 31st March 2010 to 31st June 2010 for 91 Days 27,931,539.00
Total 57,385,539.00
Inter Bank Lending
S. No. Institutions Days Amount
1 Pashimanchal Development Bank Ltd for 31 Days@ 9.5% 10,000,000.00
2 Business Development Bank Ltd. For 15 Days@ 9.5% 20,000,000.00
3 Pashimanchal Development Bank Ltd 30 Days +8 days @ 10.5% 10,000,000.00
4 Om Finance Ltd. 31 days + 15 day @ 11.5% 10,000,000.00
5 Om Finance Ltd. 30 Days @ 11.50 10,000,000.00
6 Himchuli Bikash Bank Ltd. 31 days + 15 day @ 15% 10,000,000.00
7 Himchuli Bikash Bank Ltd. 31 days @ 15% 10,000,000.00
8 Himchuli Bikash Bank Ltd. 31 days @ 15% 10,000,000.00
Total 90,000,000.00
Source: SDBL Annual Reports.
We can see from above that during the year 2066-67 there were various investments
to utilize the appropriate returns and capitalize the liquidity crunch of the market
through inter-bank lending and T-Bill Investments (91 Days). It can be seen that there
was placements in other banks at the rate of up to 15% for various dates. It is matter
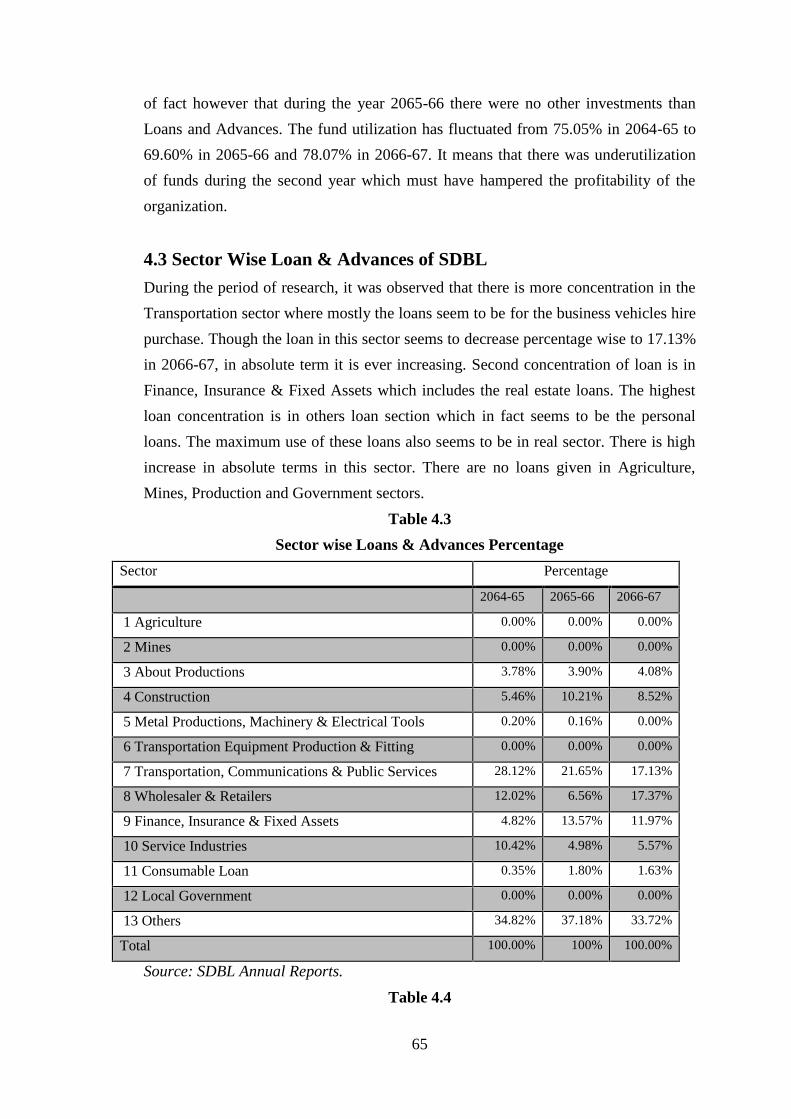
65
of fact however that during the year 2065-66 there were no other investments than
Loans and Advances. The fund utilization has fluctuated from 75.05% in 2064-65 to
69.60% in 2065-66 and 78.07% in 2066-67. It means that there was underutilization
of funds during the second year which must have hampered the profitability of the
organization.
4.3 Sector Wise Loan & Advances of SDBL
During the period of research, it was observed that there is more concentration in the
Transportation sector where mostly the loans seem to be for the business vehicles hire
purchase. Though the loan in this sector seems to decrease percentage wise to 17.13%
in 2066-67, in absolute term it is ever increasing. Second concentration of loan is in
Finance, Insurance & Fixed Assets which includes the real estate loans. The highest
loan concentration is in others loan section which in fact seems to be the personal
loans. The maximum use of these loans also seems to be in real sector. There is high
increase in absolute terms in this sector. There are no loans given in Agriculture,
Mines, Production and Government sectors.
Table 4.3
Sector wise Loans & Advances Percentage
Sector Percentage
2064-65 2065-66 2066-67
1 Agriculture 0.00% 0.00% 0.00%
2 Mines 0.00% 0.00% 0.00%
3 About Productions 3.78% 3.90% 4.08%
4 Construction 5.46% 10.21% 8.52%
5 Metal Productions, Machinery & Electrical Tools 0.20% 0.16% 0.00%
6 Transportation Equipment Production & Fitting 0.00% 0.00% 0.00%
7 Transportation, Communications & Public Services 28.12% 21.65% 17.13%
8 Wholesaler & Retailers 12.02% 6.56% 17.37%
9 Finance, Insurance & Fixed Assets 4.82% 13.57% 11.97%
10 Service Industries 10.42% 4.98% 5.57%
11 Consumable Loan 0.35% 1.80% 1.63%
12 Local Government 0.00% 0.00% 0.00%
13 Others 34.82% 37.18% 33.72%
Total 100.00% 100% 100.00%
Source: SDBL Annual Reports.
Table 4.4
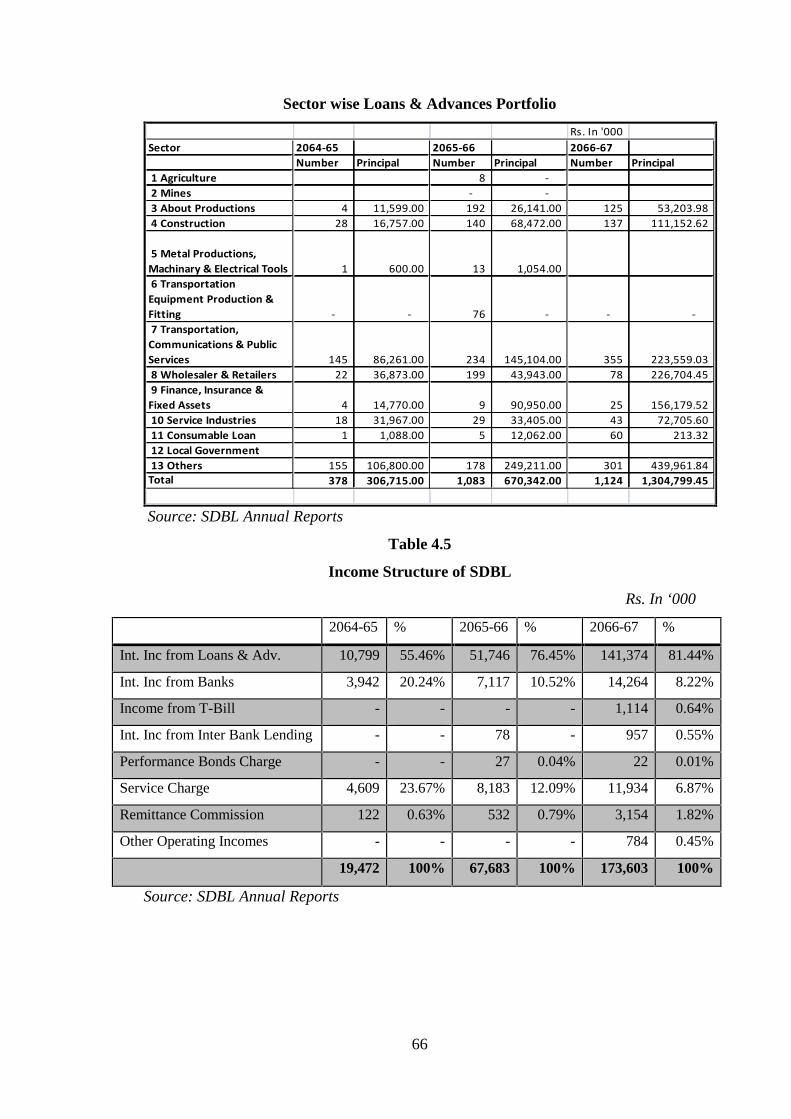
66
Sector wise Loans & Advances Portfolio
Rs. In '000Sector 2064-65 2065-66 2066-67
Number Principal Number Principal Number Principal 1 Agriculture 8 - 2 Mines - - 3 About Productions 4 11,599.00 192 26,141.00 125 53,203.98 4 Construction 28 16,757.00 140 68,472.00 137 111,152.62
5 Metal Productions,Machinary & Electrical Tools 1 600.00 13 1,054.00 6 TransportationEquipment Production &Fitting - - 76 - - - 7 Transportation,Communications & PublicServices 145 86,261.00 234 145,104.00 355 223,559.03 8 Wholesaler & Retailers 22 36,873.00 199 43,943.00 78 226,704.45 9 Finance, Insurance &Fixed Assets 4 14,770.00 9 90,950.00 25 156,179.52 10 Service Industries 18 31,967.00 29 33,405.00 43 72,705.60 11 Consumable Loan 1 1,088.00 5 12,062.00 60 213.32 12 Local Government 13 Others 155 106,800.00 178 249,211.00 301 439,961.84Total 378 306,715.00 1,083 670,342.00 1,124 1,304,799.45
Source: SDBL Annual Reports
Table 4.5
Income Structure of SDBL
Rs. In ‘000
2064-65 % 2065-66 % 2066-67 %
Int. Inc from Loans & Adv. 10,799 55.46% 51,746 76.45% 141,374 81.44%
Int. Inc from Banks 3,942 20.24% 7,117 10.52% 14,264 8.22%
Income from T-Bill - - - - 1,114 0.64%
Int. Inc from Inter Bank Lending - - 78 - 957 0.55%
Performance Bonds Charge - - 27 0.04% 22 0.01%
Service Charge 4,609 23.67% 8,183 12.09% 11,934 6.87%
Remittance Commission 122 0.63% 532 0.79% 3,154 1.82%
Other Operating Incomes - - - - 784 0.45%
19,472 100% 67,683 100% 173,603 100%
Source: SDBL Annual Reports
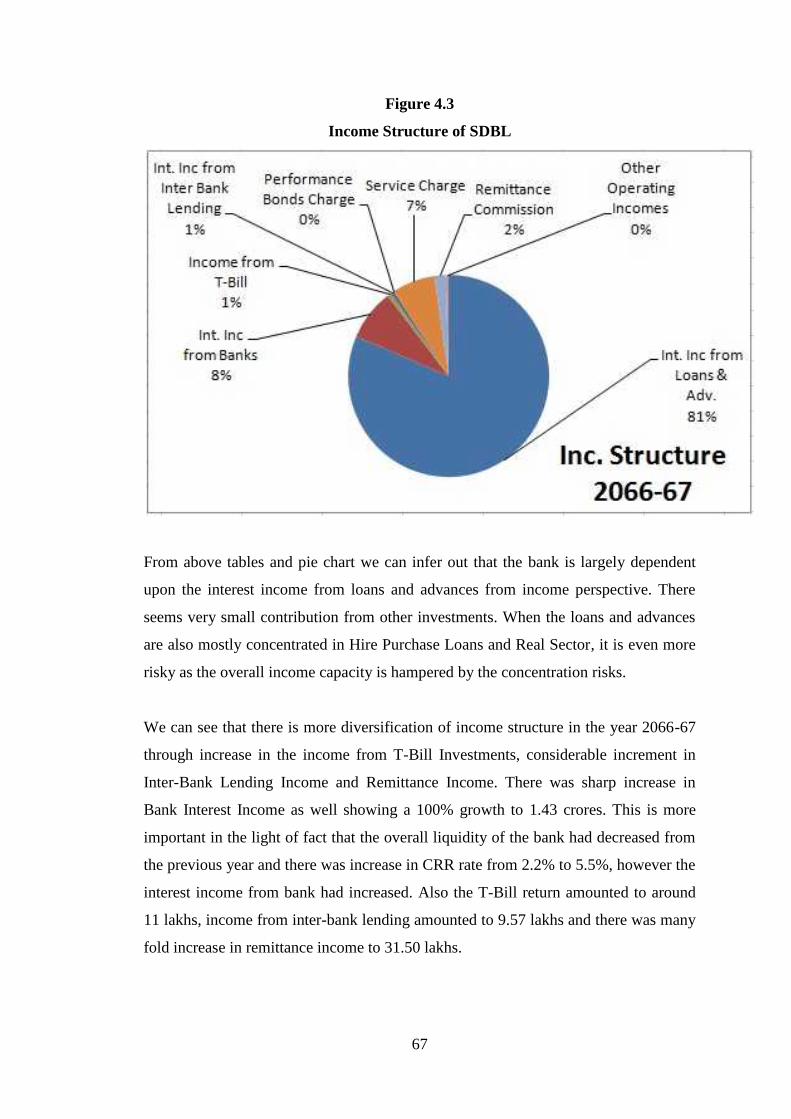
67
Figure 4.3
Income Structure of SDBL
From above tables and pie chart we can infer out that the bank is largely dependent
upon the interest income from loans and advances from income perspective. There
seems very small contribution from other investments. When the loans and advances
are also mostly concentrated in Hire Purchase Loans and Real Sector, it is even more
risky as the overall income capacity is hampered by the concentration risks.
We can see that there is more diversification of income structure in the year 2066-67
through increase in the income from T-Bill Investments, considerable increment in
Inter-Bank Lending Income and Remittance Income. There was sharp increase in
Bank Interest Income as well showing a 100% growth to 1.43 crores. This is more
important in the light of fact that the overall liquidity of the bank had decreased from
the previous year and there was increase in CRR rate from 2.2% to 5.5%, however the
interest income from bank had increased. Also the T-Bill return amounted to around
11 lakhs, income from inter-bank lending amounted to 9.57 lakhs and there was many
fold increase in remittance income to 31.50 lakhs.
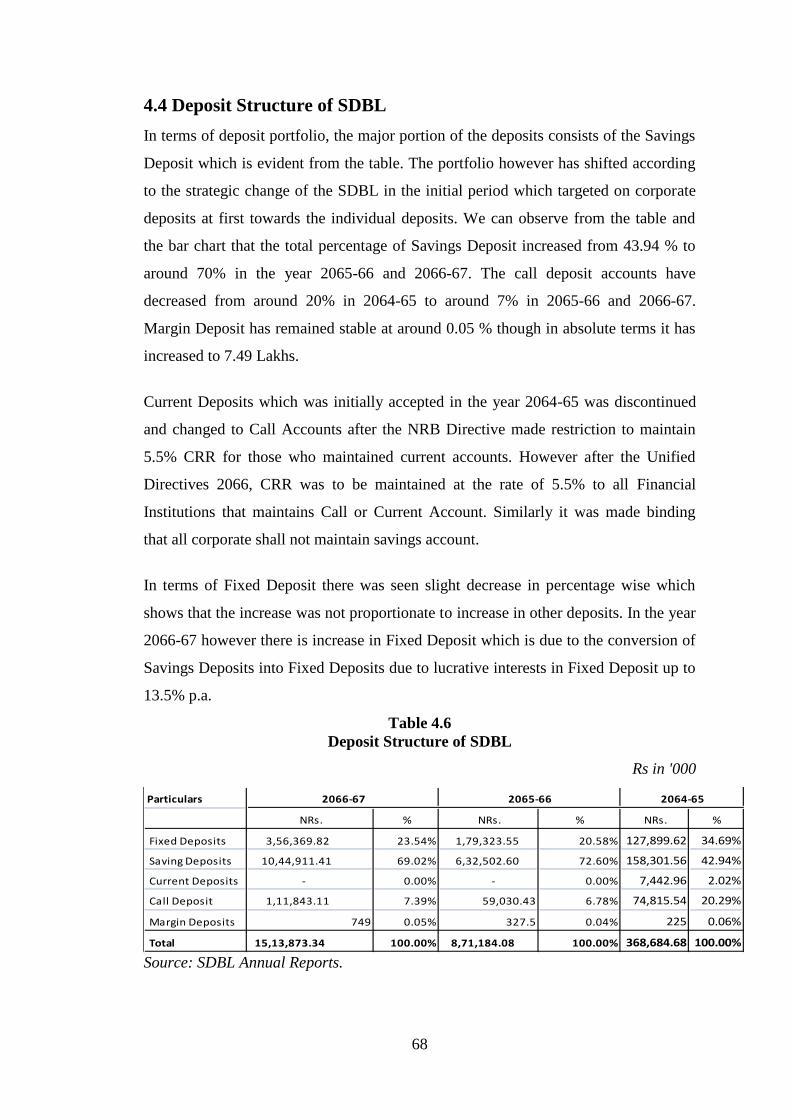
68
4.4 Deposit Structure of SDBL
In terms of deposit portfolio, the major portion of the deposits consists of the Savings
Deposit which is evident from the table. The portfolio however has shifted according
to the strategic change of the SDBL in the initial period which targeted on corporate
deposits at first towards the individual deposits. We can observe from the table and
the bar chart that the total percentage of Savings Deposit increased from 43.94 % to
around 70% in the year 2065-66 and 2066-67. The call deposit accounts have
decreased from around 20% in 2064-65 to around 7% in 2065-66 and 2066-67.
Margin Deposit has remained stable at around 0.05 % though in absolute terms it has
increased to 7.49 Lakhs.
Current Deposits which was initially accepted in the year 2064-65 was discontinued
and changed to Call Accounts after the NRB Directive made restriction to maintain
5.5% CRR for those who maintained current accounts. However after the Unified
Directives 2066, CRR was to be maintained at the rate of 5.5% to all Financial
Institutions that maintains Call or Current Account. Similarly it was made binding
that all corporate shall not maintain savings account.
In terms of Fixed Deposit there was seen slight decrease in percentage wise which
shows that the increase was not proportionate to increase in other deposits. In the year
2066-67 however there is increase in Fixed Deposit which is due to the conversion of
Savings Deposits into Fixed Deposits due to lucrative interests in Fixed Deposit up to
13.5% p.a.
Table 4.6Deposit Structure of SDBL
Rs in '000
Particulars
NRs. % NRs. % NRs. %
Fixed Deposits 3,56,369.82 23.54% 1,79,323.55 20.58% 127,899.62 34.69%
Saving Deposits 10,44,911.41 69.02% 6,32,502.60 72.60% 158,301.56 42.94%
Current Deposits - 0.00% - 0.00% 7,442.96 2.02%
Call Deposit 1,11,843.11 7.39% 59,030.43 6.78% 74,815.54 20.29%
Margin Deposits 749 0.05% 327.5 0.04% 225 0.06%
Total 15,13,873.34 100.00% 8,71,184.08 100.00% 368,684.68 100.00%
2066-67 2065-66 2064-65
Source: SDBL Annual Reports.
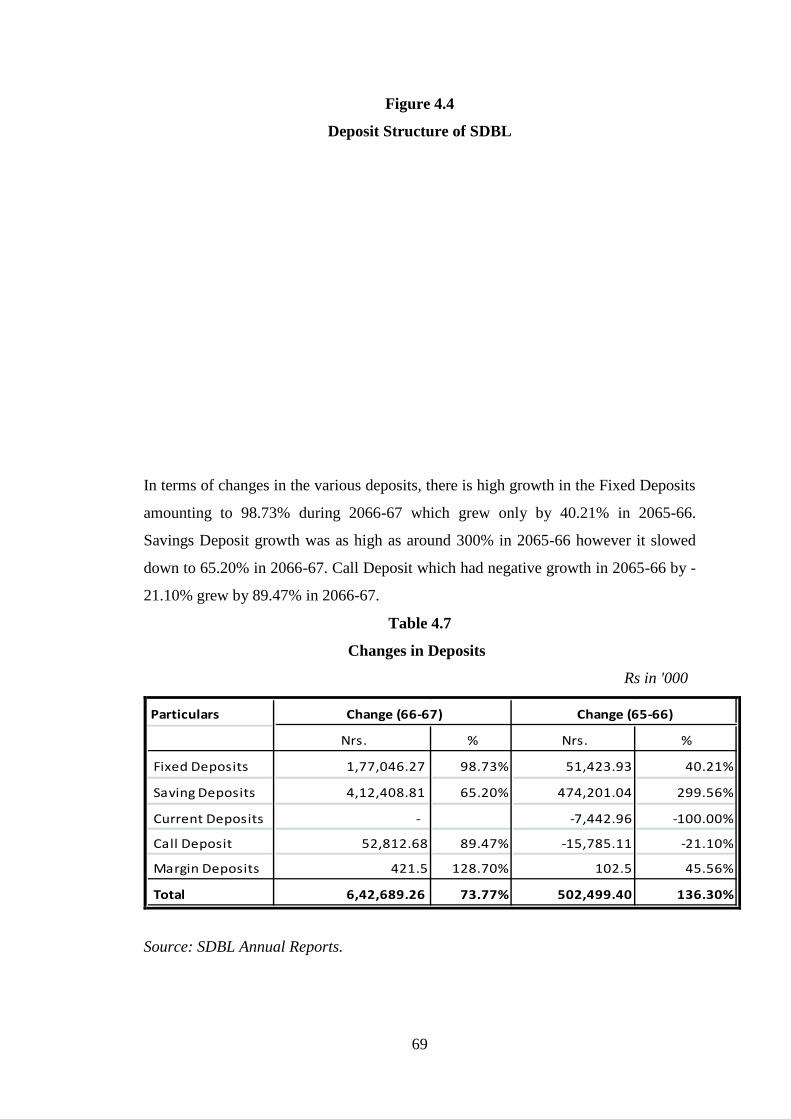
69
Figure 4.4
Deposit Structure of SDBL
In terms of changes in the various deposits, there is high growth in the Fixed Deposits
amounting to 98.73% during 2066-67 which grew only by 40.21% in 2065-66.
Savings Deposit growth was as high as around 300% in 2065-66 however it slowed
down to 65.20% in 2066-67. Call Deposit which had negative growth in 2065-66 by -
21.10% grew by 89.47% in 2066-67.
Table 4.7
Changes in Deposits
Rs in '000
Particulars
Nrs. % Nrs. %
Fixed Deposits 1,77,046.27 98.73% 51,423.93 40.21%
Saving Deposits 4,12,408.81 65.20% 474,201.04 299.56%
Current Deposits - -7,442.96 -100.00%
Call Deposit 52,812.68 89.47% -15,785.11 -21.10%
Margin Deposits 421.5 128.70% 102.5 45.56%
Total 6,42,689.26 73.77% 502,499.40 136.30%
Change (65-66)Change (66-67)
Source: SDBL Annual Reports.
70
4.5 CVP Analysis
As mentioned in the Research Gap, CVP Analysis in case of banks is quite different
from other industries due to the fact that it has unique nature of products, regulations
and functioning. In case of banks, basically the input material is the deposit funds
collected from the public and its output is the loans and advances or other services for
which it receives the interests and commissions.
Previous research of Mr. Dharma Raj Shrestha (2006) basically ignored this
uniqueness of banking industry. In current research, I have tried to incorporate these
distinctive features of banking in the CVP analysis and also come across the BEP as
per the traditional way.
In calculating the BEP in traditional way as well, I have tried to more rationally
categorize the fixed and variable costs as well as proper segregation of semi-variable
costs into fixed and variable costs.
So two methods of BEP Calculation through CVP Analysis is used:
4.5.1 CVP Analysis through Weighted Average Spread Rate (Assumptive Basis)
Banking as explained in the previous chapter is purely an intermediary organization
that intakes the deposit by paying some interest and utilizes this fund by giving loans
and advances or making investments from which it earns returns. The margin or
difference between the two commonly called the spread is what sustains the other
expenses of the organization and finally earns profit for its investors.
The lack of consideration of this fact was found in previous research. Hence in
addition to the traditional way of calculating BEP, this bottom up approach is utilized
on basis of few assumptions rather than directly calculating the interest income and
interest expense to find an ideal situation of breakeven point.
Explanation and Method:
In this unique way of calculating the Break Even Point, it is tried to find out what
amount of Deposit is required at the current weighted average spread rate to cover all
the expenses of the bank. At first Weighted Average Spread Rate is calculated.
71
Weighted Average Spread Rate is the difference between the Weighted Average
Cost of Fund and Weighted Average Yield on Loan.
Weighted Average Spread Rate = Weighted Average Cost of Fund – Weighted Average Yield
Weighted Average Cost of Fund is the average interest rate given in the deposits.
There can be various types of deposits on which the rates can be varied. Weighted
Average of these interest rates is taken on basis of weight of the composition of the
deposits types.
Weighted Average Yield is the average earnings or interest rate on the loans and
advances. There can be various types of loans and advances which yield at various
rates. Weighted Average of these interest rates is taken on basis of weight of the
composition of the loan types.
One approach of performing of CVP Analysis is by simply taking this Weighted
Average Spread Rate as the Contribution Margin and thus calculating the expenses.
However in terms of the Banking Industry’s uniqueness again it will be a big mistake
as there are several norms specific to this Industry.
Banks deal in liquid funds. If a customer approaches the bank to withdraw his/her
deposit, the bank has to pay him/her immediately without default. In case the bank
cannot refund the amount, then it will be insolvent. Thus to avoid this liquidity risks,
bank cannot lend all the amount of deposit it has collected. The general banking norm
is that 20% of the total deposit is kept as the Net Liquidity, hence if Rs. 100 is
collected as Deposit from the public it is only Rs. 80 that lending can be made. It is
commonly called the CD Ratio. While in the later period the amount of capital and
accumulated reserves and surplus will also play a significant role in lending
capability, in initial periods this capability may be ignored. We can see that the Fund
Utilization Ration is almost similar to this norm. Since Shangri-la Development Bank
Limited is only in the 3rd Year of operation, its capital and reserves are utilized in the
capital expenses.
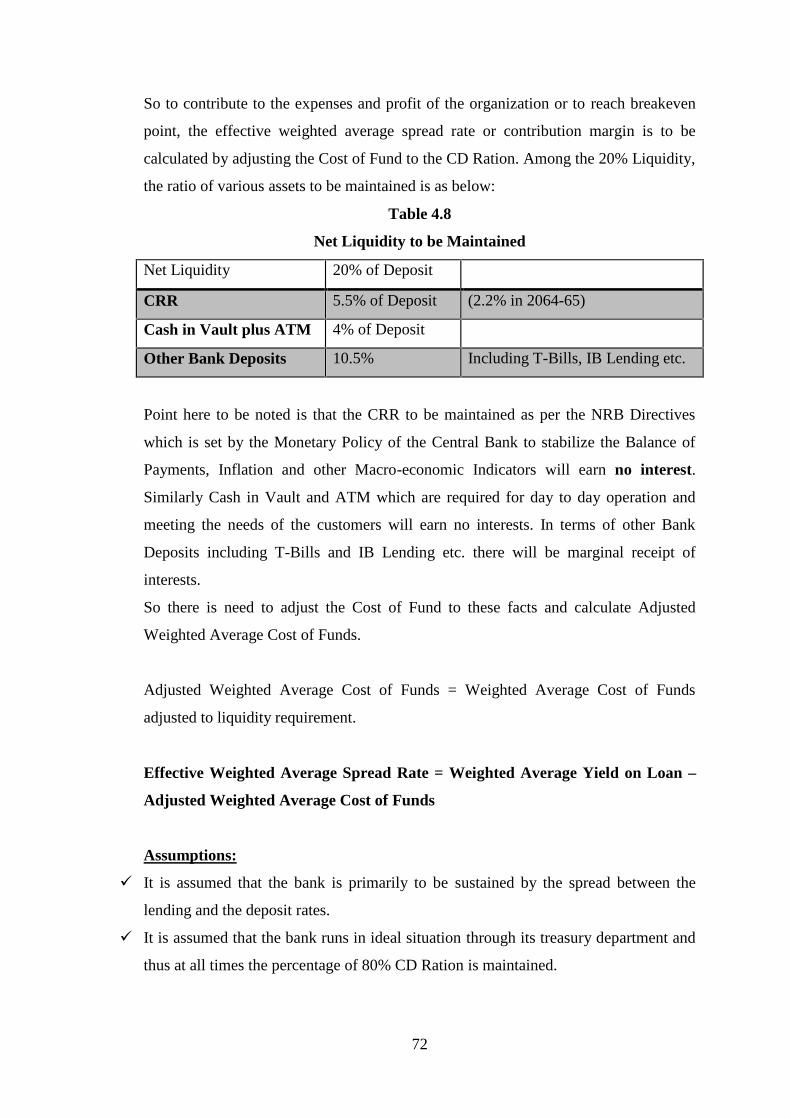
72
So to contribute to the expenses and profit of the organization or to reach breakeven
point, the effective weighted average spread rate or contribution margin is to be
calculated by adjusting the Cost of Fund to the CD Ration. Among the 20% Liquidity,
the ratio of various assets to be maintained is as below:
Table 4.8
Net Liquidity to be Maintained
Net Liquidity 20% of Deposit
CRR 5.5% of Deposit (2.2% in 2064-65)
Cash in Vault plus ATM 4% of Deposit
Other Bank Deposits 10.5% Including T-Bills, IB Lending etc.
Point here to be noted is that the CRR to be maintained as per the NRB Directives
which is set by the Monetary Policy of the Central Bank to stabilize the Balance of
Payments, Inflation and other Macro-economic Indicators will earn no interest.
Similarly Cash in Vault and ATM which are required for day to day operation and
meeting the needs of the customers will earn no interests. In terms of other Bank
Deposits including T-Bills and IB Lending etc. there will be marginal receipt of
interests.
So there is need to adjust the Cost of Fund to these facts and calculate Adjusted
Weighted Average Cost of Funds.
Adjusted Weighted Average Cost of Funds = Weighted Average Cost of Funds
adjusted to liquidity requirement.
Effective Weighted Average Spread Rate = Weighted Average Yield on Loan –
Adjusted Weighted Average Cost of Funds
Assumptions:
It is assumed that the bank is primarily to be sustained by the spread between the
lending and the deposit rates.
It is assumed that the bank runs in ideal situation through its treasury department and
thus at all times the percentage of 80% CD Ration is maintained.
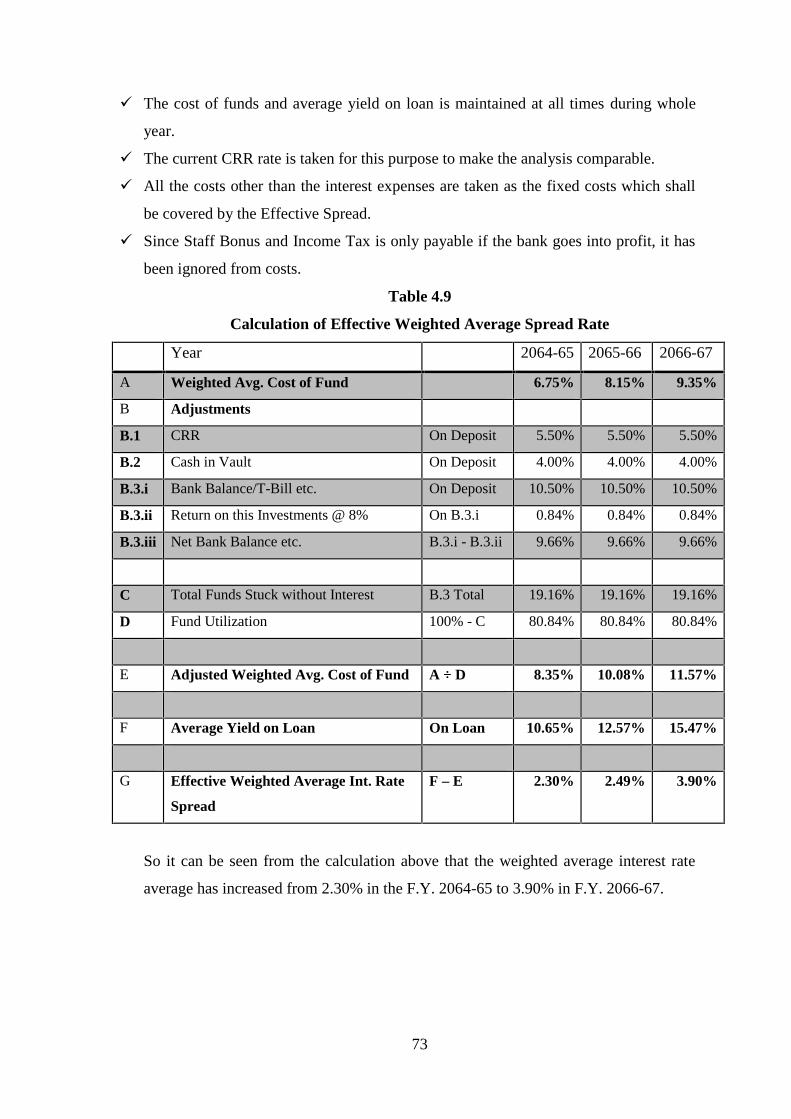
73
The cost of funds and average yield on loan is maintained at all times during whole
year.
The current CRR rate is taken for this purpose to make the analysis comparable.
All the costs other than the interest expenses are taken as the fixed costs which shall
be covered by the Effective Spread.
Since Staff Bonus and Income Tax is only payable if the bank goes into profit, it has
been ignored from costs.
Table 4.9
Calculation of Effective Weighted Average Spread Rate
Year 2064-65 2065-66 2066-67
A Weighted Avg. Cost of Fund 6.75% 8.15% 9.35%
B Adjustments
B.1 CRR On Deposit 5.50% 5.50% 5.50%
B.2 Cash in Vault On Deposit 4.00% 4.00% 4.00%
B.3.i Bank Balance/T-Bill etc. On Deposit 10.50% 10.50% 10.50%
B.3.ii Return on this Investments @ 8% On B.3.i 0.84% 0.84% 0.84%
B.3.iii Net Bank Balance etc. B.3.i - B.3.ii 9.66% 9.66% 9.66%
C Total Funds Stuck without Interest B.3 Total 19.16% 19.16% 19.16%
D Fund Utilization 100% - C 80.84% 80.84% 80.84%
E Adjusted Weighted Avg. Cost of Fund A ÷ D 8.35% 10.08% 11.57%
F Average Yield on Loan On Loan 10.65% 12.57% 15.47%
G Effective Weighted Average Int. Rate
Spread
F – E 2.30% 2.49% 3.90%
So it can be seen from the calculation above that the weighted average interest rate
average has increased from 2.30% in the F.Y. 2064-65 to 3.90% in F.Y. 2066-67.
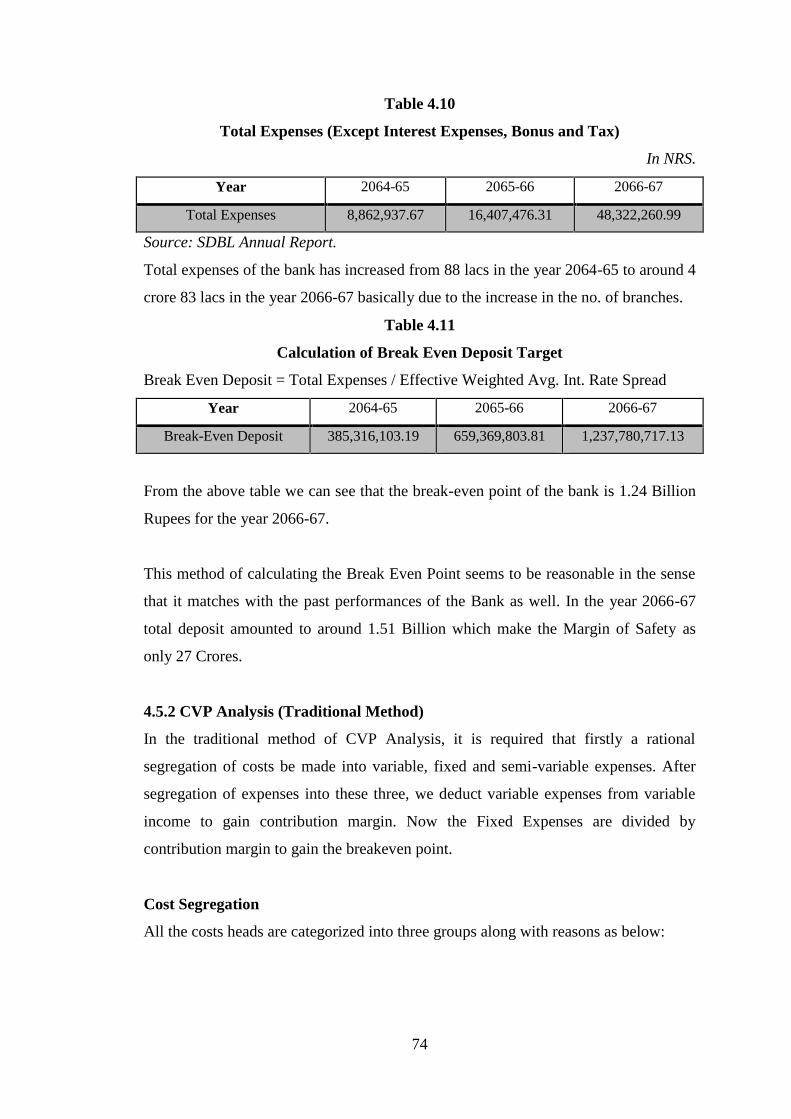
74
Table 4.10
Total Expenses (Except Interest Expenses, Bonus and Tax)
In NRS.
Year 2064-65 2065-66 2066-67
Total Expenses 8,862,937.67 16,407,476.31 48,322,260.99
Source: SDBL Annual Report.
Total expenses of the bank has increased from 88 lacs in the year 2064-65 to around 4
crore 83 lacs in the year 2066-67 basically due to the increase in the no. of branches.
Table 4.11
Calculation of Break Even Deposit Target
Break Even Deposit = Total Expenses / Effective Weighted Avg. Int. Rate Spread
Year 2064-65 2065-66 2066-67
Break-Even Deposit 385,316,103.19 659,369,803.81 1,237,780,717.13
From the above table we can see that the break-even point of the bank is 1.24 Billion
Rupees for the year 2066-67.
This method of calculating the Break Even Point seems to be reasonable in the sense
that it matches with the past performances of the Bank as well. In the year 2066-67
total deposit amounted to around 1.51 Billion which make the Margin of Safety as
only 27 Crores.
4.5.2 CVP Analysis (Traditional Method)
In the traditional method of CVP Analysis, it is required that firstly a rational
segregation of costs be made into variable, fixed and semi-variable expenses. After
segregation of expenses into these three, we deduct variable expenses from variable
income to gain contribution margin. Now the Fixed Expenses are divided by
contribution margin to gain the breakeven point.
Cost Segregation
All the costs heads are categorized into three groups along with reasons as below:
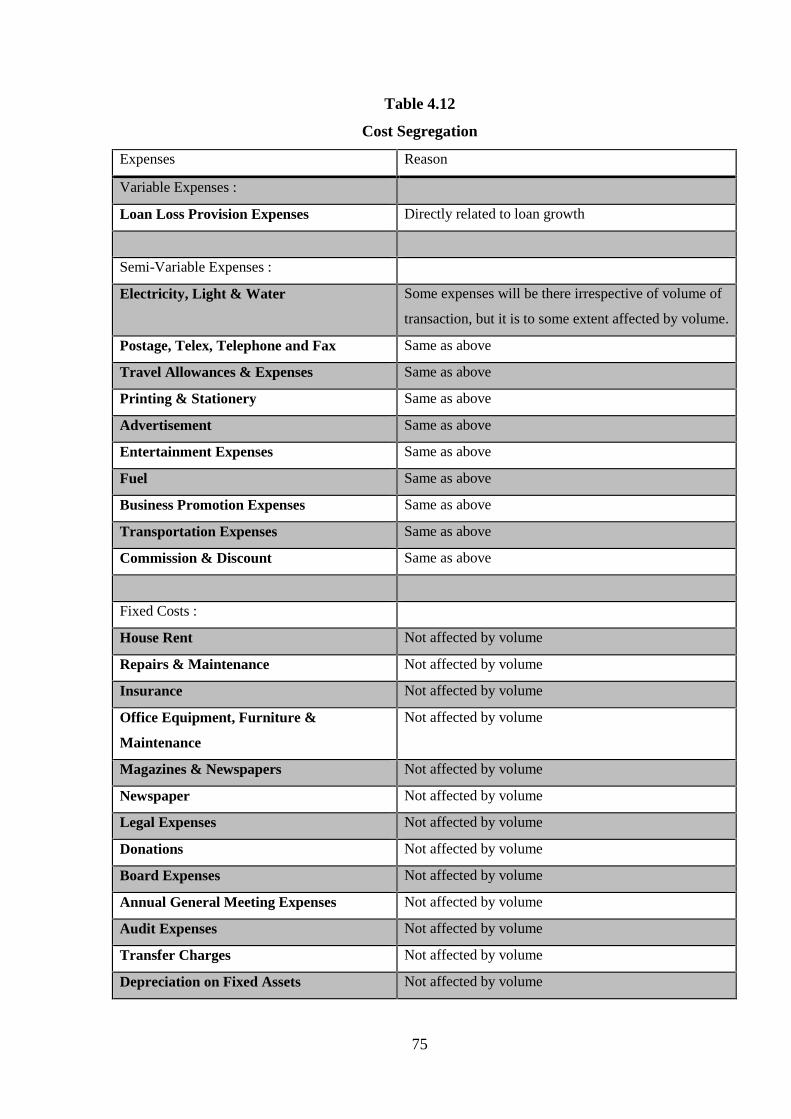
75
Table 4.12
Cost Segregation
Expenses Reason
Variable Expenses :
Loan Loss Provision Expenses Directly related to loan growth
Semi-Variable Expenses :
Electricity, Light & Water Some expenses will be there irrespective of volume of
transaction, but it is to some extent affected by volume.
Postage, Telex, Telephone and Fax Same as above
Travel Allowances & Expenses Same as above
Printing & Stationery Same as above
Advertisement Same as above
Entertainment Expenses Same as above
Fuel Same as above
Business Promotion Expenses Same as above
Transportation Expenses Same as above
Commission & Discount Same as above
Fixed Costs :
House Rent Not affected by volume
Repairs & Maintenance Not affected by volume
Insurance Not affected by volume
Office Equipment, Furniture &
Maintenance
Not affected by volume
Magazines & Newspapers Not affected by volume
Newspaper Not affected by volume
Legal Expenses Not affected by volume
Donations Not affected by volume
Board Expenses Not affected by volume
Annual General Meeting Expenses Not affected by volume
Audit Expenses Not affected by volume
Transfer Charges Not affected by volume
Depreciation on Fixed Assets Not affected by volume
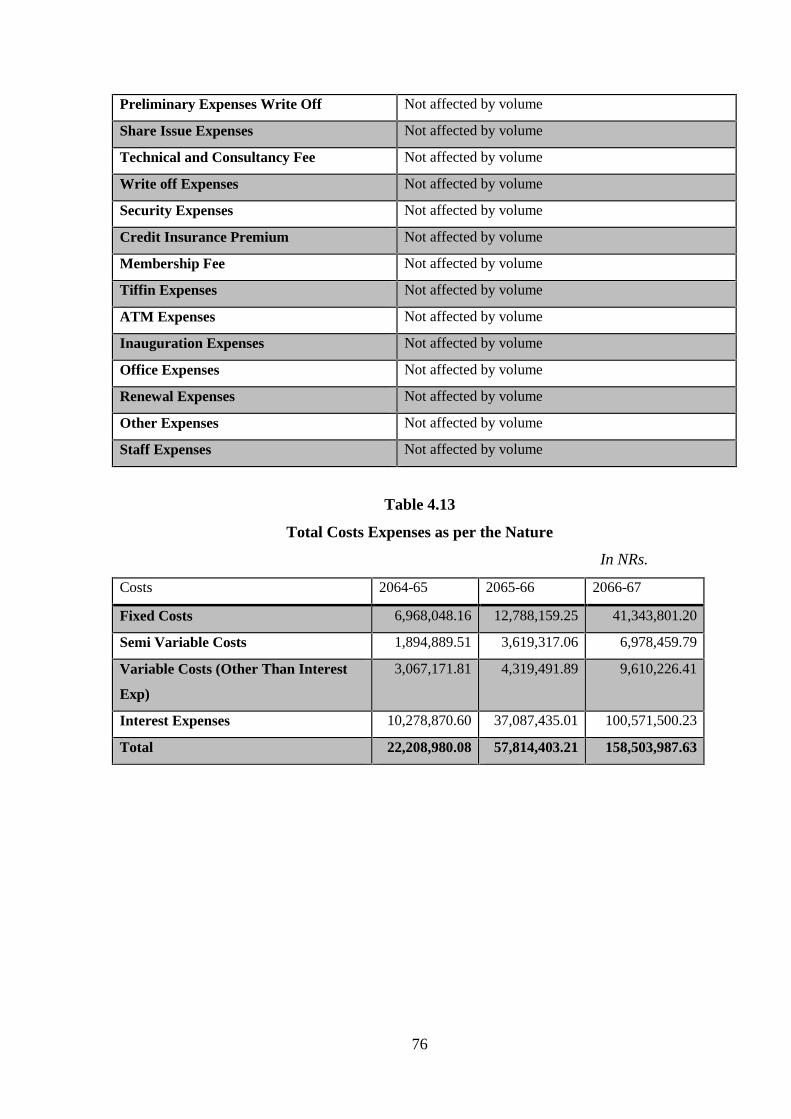
76
Preliminary Expenses Write Off Not affected by volume
Share Issue Expenses Not affected by volume
Technical and Consultancy Fee Not affected by volume
Write off Expenses Not affected by volume
Security Expenses Not affected by volume
Credit Insurance Premium Not affected by volume
Membership Fee Not affected by volume
Tiffin Expenses Not affected by volume
ATM Expenses Not affected by volume
Inauguration Expenses Not affected by volume
Office Expenses Not affected by volume
Renewal Expenses Not affected by volume
Other Expenses Not affected by volume
Staff Expenses Not affected by volume
Table 4.13
Total Costs Expenses as per the Nature
In NRs.
Costs 2064-65 2065-66 2066-67
Fixed Costs 6,968,048.16 12,788,159.25 41,343,801.20
Semi Variable Costs 1,894,889.51 3,619,317.06 6,978,459.79
Variable Costs (Other Than Interest
Exp)
3,067,171.81 4,319,491.89 9,610,226.41
Interest Expenses 10,278,870.60 37,087,435.01 100,571,500.23
Total 22,208,980.08 57,814,403.21 158,503,987.63
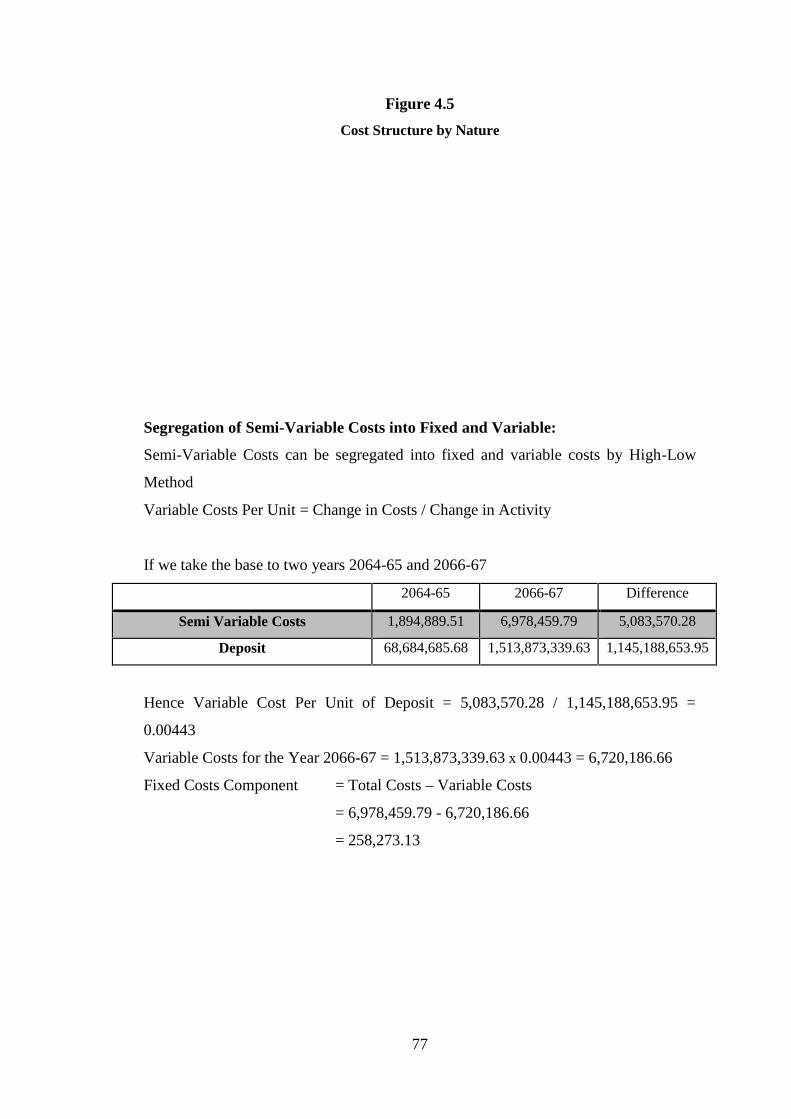
77
Figure 4.5
Cost Structure by Nature
Segregation of Semi-Variable Costs into Fixed and Variable:
Semi-Variable Costs can be segregated into fixed and variable costs by High-Low
Method
Variable Costs Per Unit = Change in Costs / Change in Activity
If we take the base to two years 2064-65 and 2066-67
2064-65 2066-67 Difference
Semi Variable Costs 1,894,889.51 6,978,459.79 5,083,570.28
Deposit 68,684,685.68 1,513,873,339.63 1,145,188,653.95
Hence Variable Cost Per Unit of Deposit = 5,083,570.28 / 1,145,188,653.95 =
0.00443
Variable Costs for the Year 2066-67 = 1,513,873,339.63 x 0.00443 = 6,720,186.66
Fixed Costs Component = Total Costs – Variable Costs
= 6,978,459.79 - 6,720,186.66
= 258,273.13
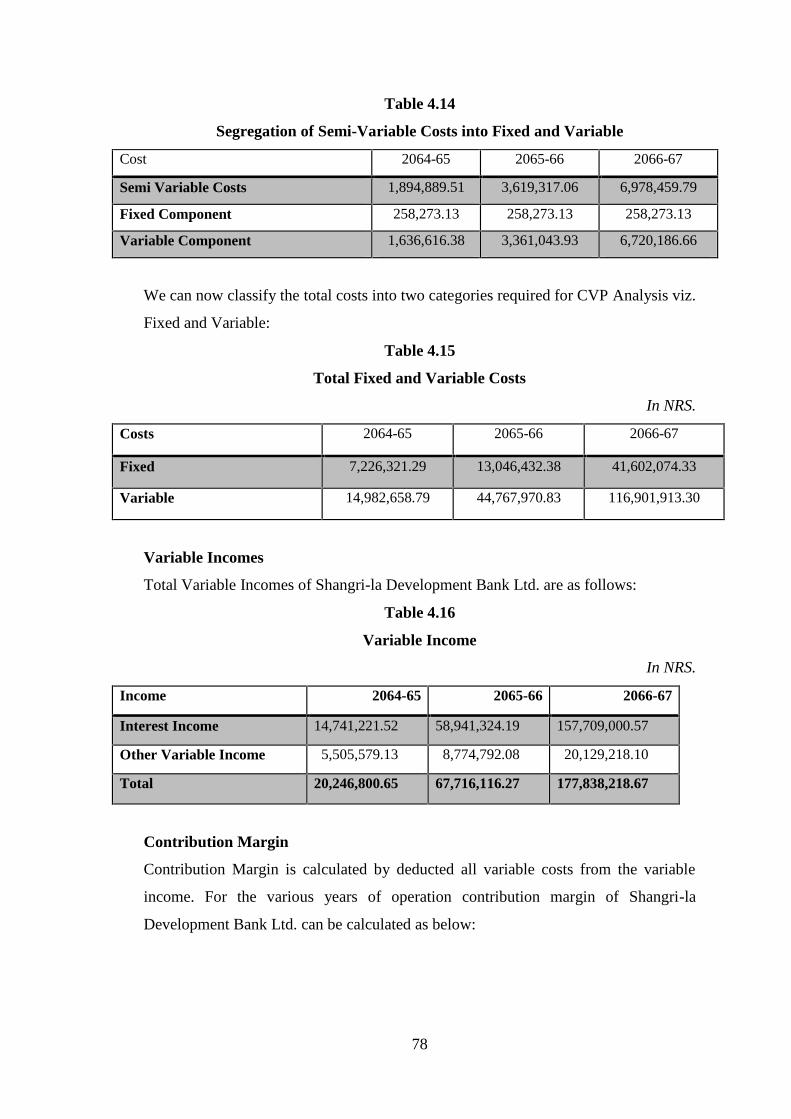
78
Table 4.14
Segregation of Semi-Variable Costs into Fixed and Variable
Cost 2064-65 2065-66 2066-67
Semi Variable Costs 1,894,889.51 3,619,317.06 6,978,459.79
Fixed Component 258,273.13 258,273.13 258,273.13
Variable Component 1,636,616.38 3,361,043.93 6,720,186.66
We can now classify the total costs into two categories required for CVP Analysis viz.
Fixed and Variable:
Table 4.15
Total Fixed and Variable Costs
In NRS.
Costs 2064-65 2065-66 2066-67
Fixed 7,226,321.29 13,046,432.38 41,602,074.33
Variable 14,982,658.79 44,767,970.83 116,901,913.30
Variable Incomes
Total Variable Incomes of Shangri-la Development Bank Ltd. are as follows:
Table 4.16
Variable Income
In NRS.
Income 2064-65 2065-66 2066-67
Interest Income 14,741,221.52 58,941,324.19 157,709,000.57
Other Variable Income 5,505,579.13 8,774,792.08 20,129,218.10
Total 20,246,800.65 67,716,116.27 177,838,218.67
Contribution Margin
Contribution Margin is calculated by deducted all variable costs from the variable
income. For the various years of operation contribution margin of Shangri-la
Development Bank Ltd. can be calculated as below:
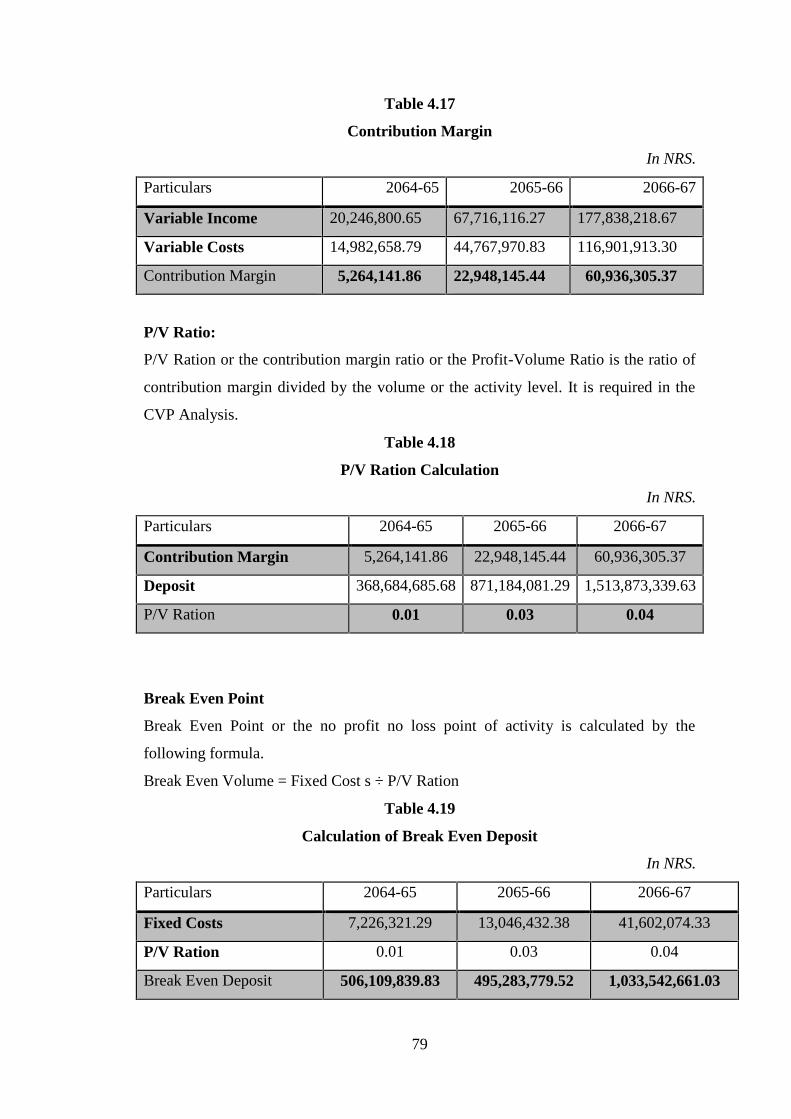
79
Table 4.17
Contribution Margin
In NRS.
Particulars 2064-65 2065-66 2066-67
Variable Income 20,246,800.65 67,716,116.27 177,838,218.67
Variable Costs 14,982,658.79 44,767,970.83 116,901,913.30
Contribution Margin 5,264,141.86 22,948,145.44 60,936,305.37
P/V Ratio:
P/V Ration or the contribution margin ratio or the Profit-Volume Ratio is the ratio of
contribution margin divided by the volume or the activity level. It is required in the
CVP Analysis.
Table 4.18
P/V Ration Calculation
In NRS.
Particulars 2064-65 2065-66 2066-67
Contribution Margin 5,264,141.86 22,948,145.44 60,936,305.37
Deposit 368,684,685.68 871,184,081.29 1,513,873,339.63
P/V Ration 0.01 0.03 0.04
Break Even Point
Break Even Point or the no profit no loss point of activity is calculated by the
following formula.
Break Even Volume = Fixed Cost s ÷ P/V Ration
Table 4.19
Calculation of Break Even Deposit
In NRS.
Particulars 2064-65 2065-66 2066-67
Fixed Costs 7,226,321.29 13,046,432.38 41,602,074.33
P/V Ration 0.01 0.03 0.04
Break Even Deposit 506,109,839.83 495,283,779.52 1,033,542,661.03
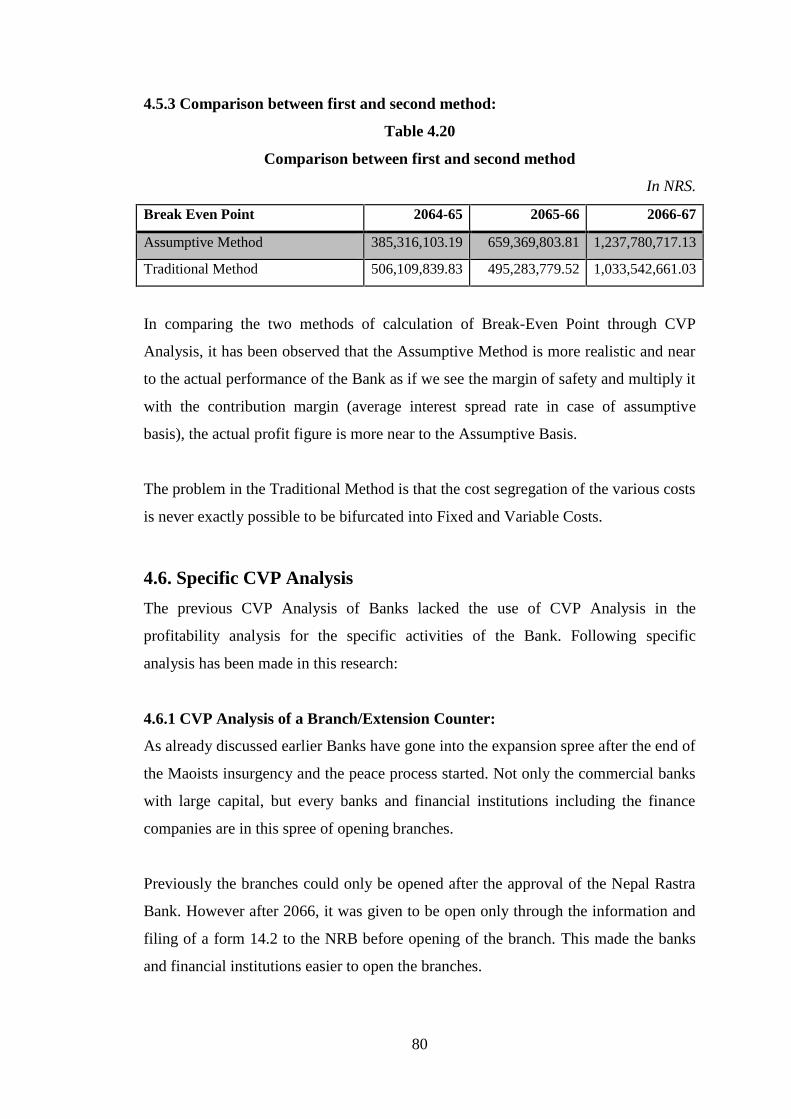
80
4.5.3 Comparison between first and second method:
Table 4.20
Comparison between first and second method
In NRS.
Break Even Point 2064-65 2065-66 2066-67
Assumptive Method 385,316,103.19 659,369,803.81 1,237,780,717.13
Traditional Method 506,109,839.83 495,283,779.52 1,033,542,661.03
In comparing the two methods of calculation of Break-Even Point through CVP
Analysis, it has been observed that the Assumptive Method is more realistic and near
to the actual performance of the Bank as if we see the margin of safety and multiply it
with the contribution margin (average interest spread rate in case of assumptive
basis), the actual profit figure is more near to the Assumptive Basis.
The problem in the Traditional Method is that the cost segregation of the various costs
is never exactly possible to be bifurcated into Fixed and Variable Costs.
4.6. Specific CVP Analysis
The previous CVP Analysis of Banks lacked the use of CVP Analysis in the
profitability analysis for the specific activities of the Bank. Following specific
analysis has been made in this research:
4.6.1 CVP Analysis of a Branch/Extension Counter:
As already discussed earlier Banks have gone into the expansion spree after the end of
the Maoists insurgency and the peace process started. Not only the commercial banks
with large capital, but every banks and financial institutions including the finance
companies are in this spree of opening branches.
Previously the branches could only be opened after the approval of the Nepal Rastra
Bank. However after 2066, it was given to be open only through the information and
filing of a form 14.2 to the NRB before opening of the branch. This made the banks
and financial institutions easier to open the branches.
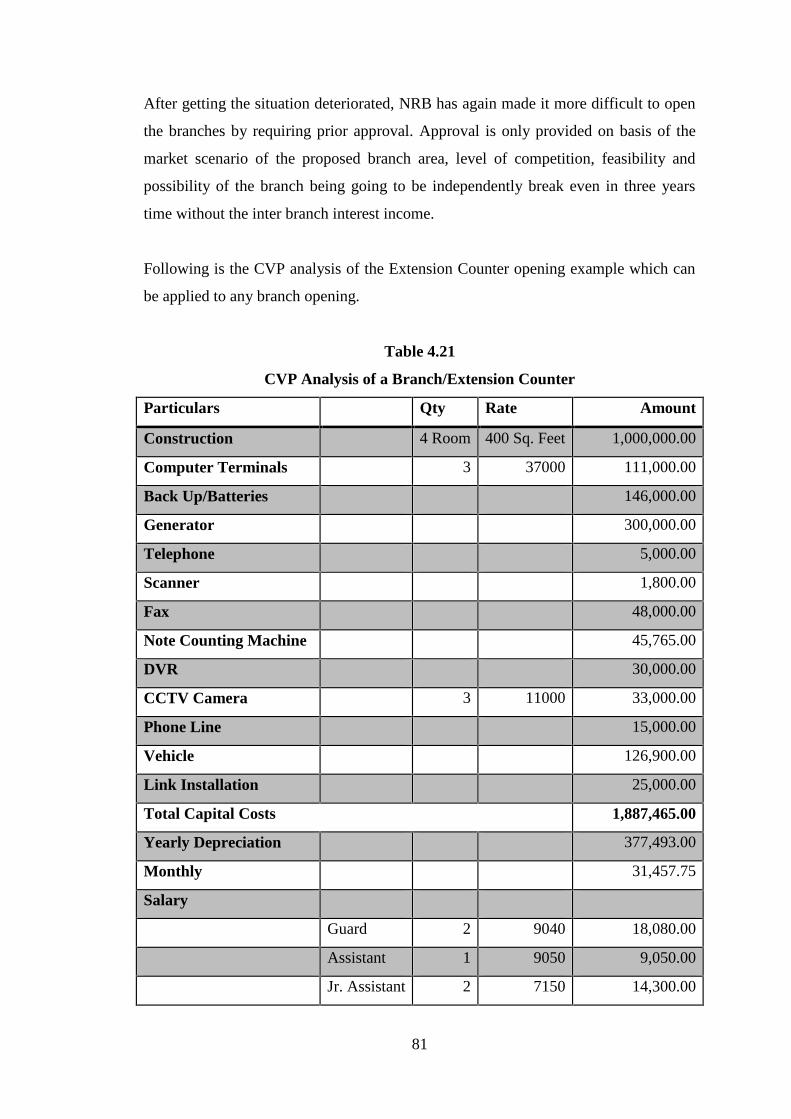
81
After getting the situation deteriorated, NRB has again made it more difficult to open
the branches by requiring prior approval. Approval is only provided on basis of the
market scenario of the proposed branch area, level of competition, feasibility and
possibility of the branch being going to be independently break even in three years
time without the inter branch interest income.
Following is the CVP analysis of the Extension Counter opening example which can
be applied to any branch opening.
Table 4.21
CVP Analysis of a Branch/Extension Counter
Particulars Qty Rate Amount
Construction 4 Room 400 Sq. Feet 1,000,000.00
Computer Terminals 3 37000 111,000.00
Back Up/Batteries 146,000.00
Generator 300,000.00
Telephone 5,000.00
Scanner 1,800.00
Fax 48,000.00
Note Counting Machine 45,765.00
DVR 30,000.00
CCTV Camera 3 11000 33,000.00
Phone Line 15,000.00
Vehicle 126,900.00
Link Installation 25,000.00
Total Capital Costs 1,887,465.00
Yearly Depreciation 377,493.00
Monthly 31,457.75
Salary
Guard 2 9040 18,080.00
Assistant 1 9050 9,050.00
Jr. Assistant 2 7150 14,300.00
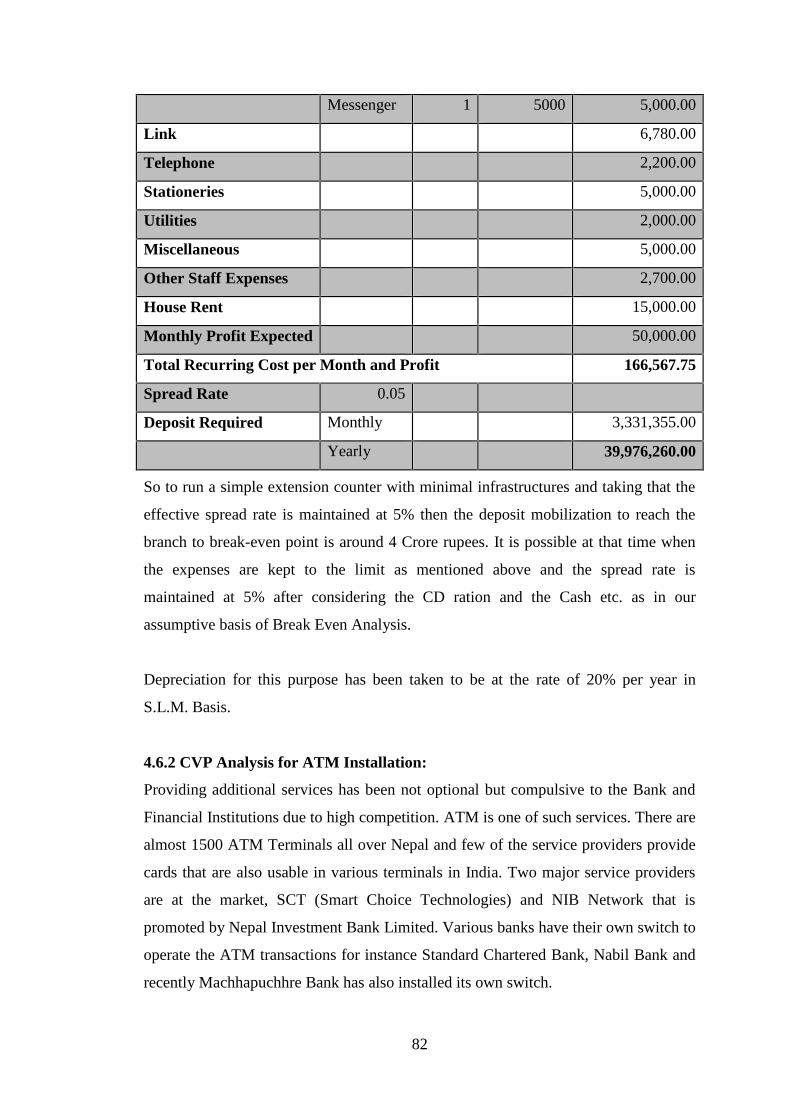
82
Messenger 1 5000 5,000.00
Link 6,780.00
Telephone 2,200.00
Stationeries 5,000.00
Utilities 2,000.00
Miscellaneous 5,000.00
Other Staff Expenses 2,700.00
House Rent 15,000.00
Monthly Profit Expected 50,000.00
Total Recurring Cost per Month and Profit 166,567.75
Spread Rate 0.05
Deposit Required Monthly 3,331,355.00
Yearly 39,976,260.00
So to run a simple extension counter with minimal infrastructures and taking that the
effective spread rate is maintained at 5% then the deposit mobilization to reach the
branch to break-even point is around 4 Crore rupees. It is possible at that time when
the expenses are kept to the limit as mentioned above and the spread rate is
maintained at 5% after considering the CD ration and the Cash etc. as in our
assumptive basis of Break Even Analysis.
Depreciation for this purpose has been taken to be at the rate of 20% per year in
S.L.M. Basis.
4.6.2 CVP Analysis for ATM Installation:
Providing additional services has been not optional but compulsive to the Bank and
Financial Institutions due to high competition. ATM is one of such services. There are
almost 1500 ATM Terminals all over Nepal and few of the service providers provide
cards that are also usable in various terminals in India. Two major service providers
are at the market, SCT (Smart Choice Technologies) and NIB Network that is
promoted by Nepal Investment Bank Limited. Various banks have their own switch to
operate the ATM transactions for instance Standard Chartered Bank, Nabil Bank and
recently Machhapuchhre Bank has also installed its own switch.
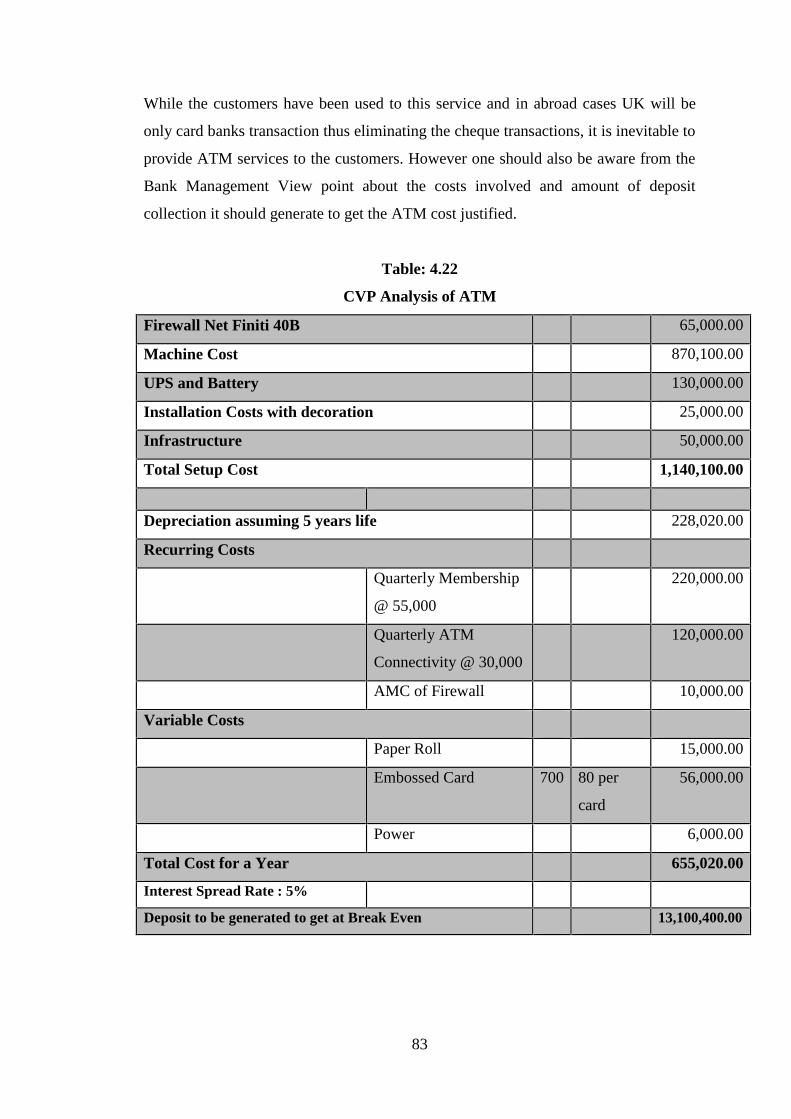
83
While the customers have been used to this service and in abroad cases UK will be
only card banks transaction thus eliminating the cheque transactions, it is inevitable to
provide ATM services to the customers. However one should also be aware from the
Bank Management View point about the costs involved and amount of deposit
collection it should generate to get the ATM cost justified.
Table: 4.22
CVP Analysis of ATM
Firewall Net Finiti 40B 65,000.00
Machine Cost 870,100.00
UPS and Battery 130,000.00
Installation Costs with decoration 25,000.00
Infrastructure 50,000.00
Total Setup Cost 1,140,100.00
Depreciation assuming 5 years life 228,020.00
Recurring Costs
Quarterly Membership
@ 55,000
220,000.00
Quarterly ATM
Connectivity @ 30,000
120,000.00
AMC of Firewall 10,000.00
Variable Costs
Paper Roll 15,000.00
Embossed Card 700 80 per
card
56,000.00
Power 6,000.00
Total Cost for a Year 655,020.00
Interest Spread Rate : 5%
Deposit to be generated to get at Break Even 13,100,400.00
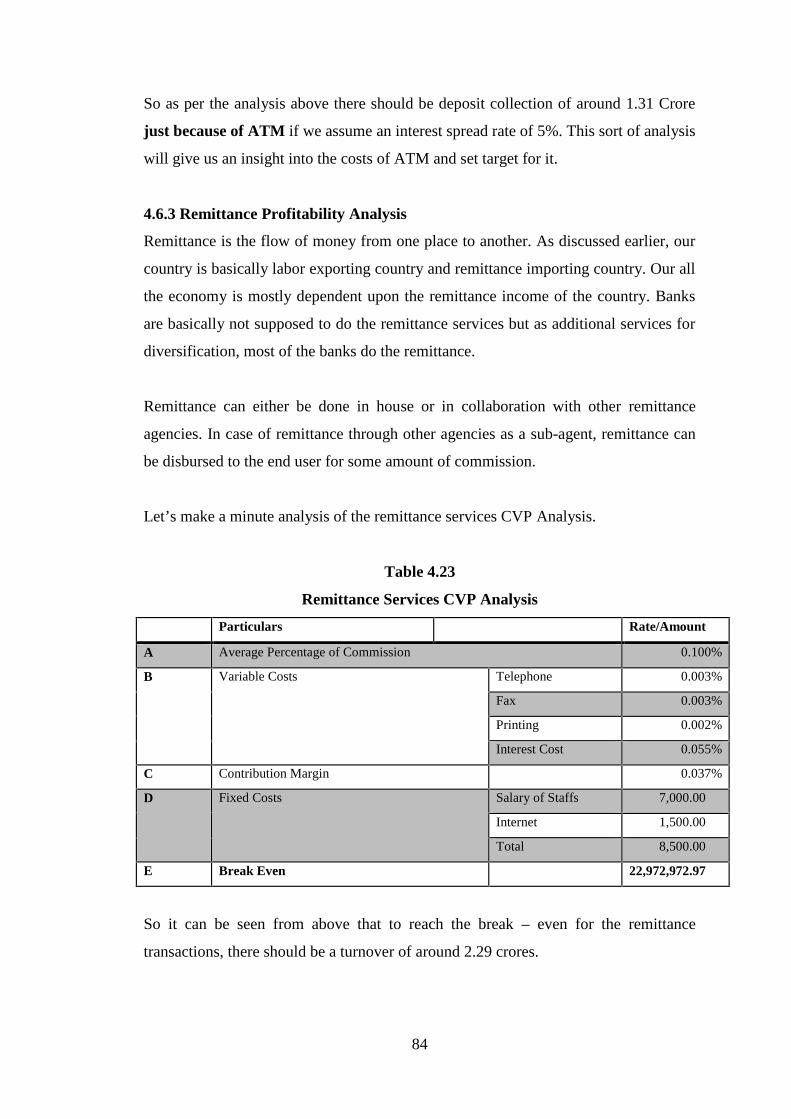
84
So as per the analysis above there should be deposit collection of around 1.31 Crore
just because of ATM if we assume an interest spread rate of 5%. This sort of analysis
will give us an insight into the costs of ATM and set target for it.
4.6.3 Remittance Profitability Analysis
Remittance is the flow of money from one place to another. As discussed earlier, our
country is basically labor exporting country and remittance importing country. Our all
the economy is mostly dependent upon the remittance income of the country. Banks
are basically not supposed to do the remittance services but as additional services for
diversification, most of the banks do the remittance.
Remittance can either be done in house or in collaboration with other remittance
agencies. In case of remittance through other agencies as a sub-agent, remittance can
be disbursed to the end user for some amount of commission.
Let’s make a minute analysis of the remittance services CVP Analysis.
Table 4.23
Remittance Services CVP Analysis
Particulars Rate/Amount
A Average Percentage of Commission 0.100%
B Variable Costs Telephone 0.003%
Fax 0.003%
Printing 0.002%
Interest Cost 0.055%
C Contribution Margin 0.037%
D Fixed Costs Salary of Staffs 7,000.00
Internet 1,500.00
Total 8,500.00
E Break Even 22,972,972.97
So it can be seen from above that to reach the break – even for the remittance
transactions, there should be a turnover of around 2.29 crores.
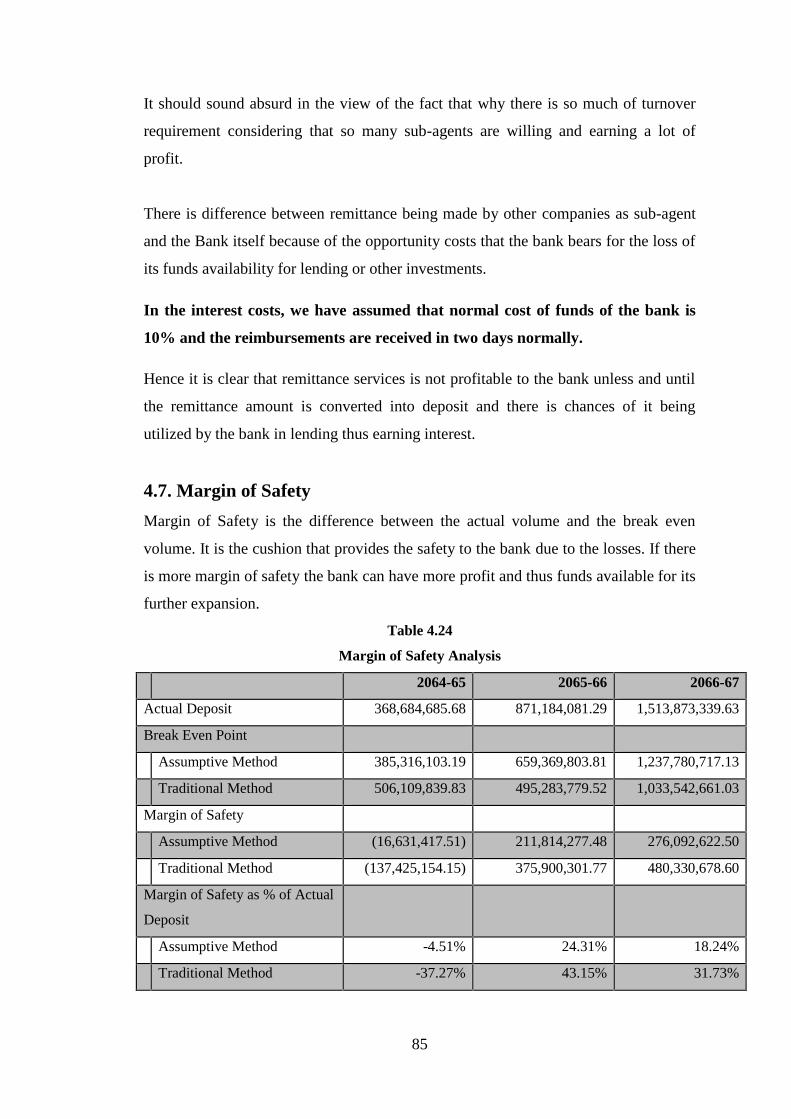
85
It should sound absurd in the view of the fact that why there is so much of turnover
requirement considering that so many sub-agents are willing and earning a lot of
profit.
There is difference between remittance being made by other companies as sub-agent
and the Bank itself because of the opportunity costs that the bank bears for the loss of
its funds availability for lending or other investments.
In the interest costs, we have assumed that normal cost of funds of the bank is
10% and the reimbursements are received in two days normally.
Hence it is clear that remittance services is not profitable to the bank unless and until
the remittance amount is converted into deposit and there is chances of it being
utilized by the bank in lending thus earning interest.
4.7. Margin of Safety
Margin of Safety is the difference between the actual volume and the break even
volume. It is the cushion that provides the safety to the bank due to the losses. If there
is more margin of safety the bank can have more profit and thus funds available for its
further expansion.
Table 4.24
Margin of Safety Analysis
2064-65 2065-66 2066-67
Actual Deposit 368,684,685.68 871,184,081.29 1,513,873,339.63
Break Even Point
Assumptive Method 385,316,103.19 659,369,803.81 1,237,780,717.13
Traditional Method 506,109,839.83 495,283,779.52 1,033,542,661.03
Margin of Safety
Assumptive Method (16,631,417.51) 211,814,277.48 276,092,622.50
Traditional Method (137,425,154.15) 375,900,301.77 480,330,678.60
Margin of Safety as % of Actual
Deposit
Assumptive Method -4.51% 24.31% 18.24%
Traditional Method -37.27% 43.15% 31.73%
86
We can see from above that there is fluctuation in the Margin of Safety in both of the
Assumptive and Traditional Method. While the Bank is in loss in the first year of
operation, it is right that the appropriate level of deposit was not attained to be in
break-even point.
The margin of safety increased to 24.32% in assumptive method (43.15% in
Traditional Method) in 2065-66, however it is seen that it declined to 18.24% in
assumptive method (31.73% in Traditional Method) in the year 2066-67.
4.8. Major Findings
On careful scrutiny and analysis of the all the data and their trends in relation to
various factors and aspects, many useful findings have been made. The major focus of
the study was to make the CVP analysis and scrutinize all the factors that are related
to calculate the Break Even Point of the bank. Banking as said earlier is a unique
organization where traditional way of BEP Analysis should be modified a bit to get
the analysis done in a better way.
The major breakthrough of this research paper is that it was possible to integrate the
CD Ratio into the better calculation of break-even point. It has also been established
through this research paper that the interest rate spread is the contribution margin for
banks if appropriately adjusted. If we are able to properly categorize all the costs into
fixed and variable, then only the traditional way of calculating the break-even point
will work.
Let me categorically summarize the major findings of the research paper which can be
an insight to the Shangri-la Development Bank Limited Management as well as
banking industry as a whole:
1. Fund Utilization:
Fund Utilization percentage is the amount of fund utilized in the earning assets
from the amount of available funds for investing or lending by the bank. It affects
a lot in the calculation of the Break Even Point because if there are idle funds,
then the contribution margin or the interest rate spread will decrease accordingly.
87
It has been seen that the Fund Utilization of Shangri-la Development Bank
Limited has been quite fluctuating at times. It fluctuated from 78.07% to 69.60%
in 2064-65 and 2065-66. It shows that most of the funds have been used in capital
expenditures and there are idle funds as well which has not been utilized
efficiently. In the year 2066-67 however the fund utilization has gone up. It is
however noticed that still the maximum utilization of available funds is not made
and there are still surplus amount of funds.
The Bank made many investments in government issued Treasury Bills of 91
Days as well as made Inter – Bank Lending when there was market crunch at the
rate of up to 15% and made an income of 2,071,447.30 during the year.
2. Sector Wise Loan and Advances:
The highest amount of concentration of loans and advances seems to be in 5
sectors namely in order of concentration Wholesaler & Retails, Transportation,
Finance Insurance & Fixed Assets, Construction and Service Industries. Though
the concentration of loan in Transportation sector seems to decrease in the year
2066-67 percentage wise, in absolute terms it has been increasing.
Realty sector loan given during the boom period of real estate business also covers
quite a good percentage. In the other loans section which covers 1/3 or 33.72% of
the total loan, major loans given are in real estate sector as personal loans.
So there seems to be big amount of concentration in Hire Purchase and Real
Estate Loans during the year 2066-67.
3. Income Structure:
Structure of income is also important in CVP analysis of banks. As it is evident
the major chunk of income is from Interest Income from Loans & Advances.
Around 81.44% of total income falls in this category. It is seen that there is
increase in income from other sources like inter-bank lending and investment
income during the year however. The contribution of Remittance Commission has
increased in the year 2066-67 by an absolute amount of income of Rs. 31.54 Lacs.
88
Service Charges covers around 7 % of the total income. Interest Income from
Deposit in other Banks is around 8% of the total income which amounted to 1.43
Crore in absolute terms.
4. Deposit Structure:
Deposit Structure of Bank affects the profitability in the sense that if there are
higher amount of corporate deposits then the fund utilization will be affected as
liquidity has to be maintained higher. Also in case of higher portfolio of fixed
deposits, cost of fund will be higher.
In seeing the deposit portfolio of Shangri-la Development Bank, it is seen that it
has an ideal combination of Deposit with the appropriate mix of all the types of
deposit.
There is 23.54% of Fixed Deposits where as Call Deposit stands at 7.39%. The
major part is covered by Savings Deposit which stands at 69.02% of total deposit
portfolio.
5. CVP Analysis on Assumptive Basis:
In the assumptive basis the unique nature of the Banking Industry is taken into
consideration and thus the CD Ration and Weighted Average Interest Spread Rate
is taken as base for the calculations.
Following points were noted in this CVP Analysis:
a. Effective Weighted Average Interest Rate Spread: Spread Rate is the
difference between the interest income rate and interest expense rate. In
this research however it is adjusted to the required liquidity of 20% and
again the income while maintaining that liquidity (through deposit in other
banks) is also taken consideration into. Though if we directly calculate the
weighted average interest rate spread, it will be around 4 to 6 percentage
during the three years. But when adjusted to the liquidity it is merely
2.30%, 2.49% and 3.90% in 2064-65, 2065-66 & 2066-67 respectively.
89
b. Total Expenses: In assumptive basis, it has been assumed that all the costs
except the interest expenses are fixed in nature and for the bank to go into
profits, all these expenses has to be covered. Staff Bonus and Tax
Expenses however is ignored as it will only be given if there is any profit.
The total expenses of the Bank have gone up highly in exponential way
due to massive branch expansion. It was only 88.62 Lacs during 2064-65,
however it increase to 164.07 Lacs during 2065-66 and 483.22 Lacs during
2066-67.
c. Break Even Deposit Target: Break Even Deposit target was reached by
dividing the Total Expenses by Effective Weighted Average Interest Rate
Spread. It seems that the Break Even Point is 38.53 Crores in 2064-65,
65.94 Crores in 2065-66 and 123.78 Crores in 2066-67. In the first year of
operation the bank had gone into loss, so in that sense the it matched with
the actual results when the deposit was less than the breakeven point in
that year.
6. CVP Analysis (Traditional Way):
In the traditional way of calculation of Break Even Point, all the costs are
separated into variable and fixed costs. Variable Costs are those costs which vary
in proportion to the volume of transaction whereas fixed costs are those costs
which do not change in respect to the increase or decrease in the transaction
volume. Though it is very difficult to exactly divide the costs into these two
categories, and in view of the fact that there are few costs which are neither
exactly variable nor exactly fixed but a mixture of two, the break even analysis on
this basis is not that accurate though it gives some benchmark points.
Semi-Variable Costs can be bifurcated into fixed and variable components as per
the various methods like High-Low Method or Least – Square Method. In this
research paper, it has been separated through High – Low Method.
1. Cost Segregation: It has been seen that there are a total of around 63.45%
Interest Costs, 6.06% other variable costs, 26.08% Fixed Costs and 4.40%
Semi Variable Costs. On further bifurcation of semi-variable costs and
90
thus dividing total of all the costs into fixed and variable only it is seen
that around 26.25% i.e. 41,602,074.33 Rs. is Fixed in nature. Whereas
73.75% i.e. 116,901,913.30 Rs. is variable in nature in the Fiscal Year
2066-67. This high percentage is due to the inclusion of Interest Expenses
which is the major input cost of sales for the Banks.
2. Variable Income: Total Variable Income of the Bank increased from 2.02
Crores in 2064-65 to 6.77 Crores in 2065-66 and 17.78 Crores in 2066-67.
3. Contribution Margin and P/V Ration: Contribution Margin is the
difference between the variable income and variable costs of the Bank.
P/V Ratio refers to the ratio of contribution margin and the volume of
transaction which is the Deposit Amount in case of Banking. It can be seen
that the contribution margin of bank has steady growth from 52.64 Lacs in
2064-65, 229.48 Lacs in 2065-66 and 609.36 Lacs in 2066-67. The P/V
Ratio of the bank also increase from 0.01 in 2064-65 to 0.03 in 2065-66
and 0.04 in 2066-67.
4. Break Even Deposit: As per the traditional method the Break Even Point
is reached by dividing the total fixed costs by the P/V Ratio. As per the
calculations, the Break Even Deposit has been shown as 50.61 Crores in
2064-65, 49.53 Crores in 2065-66 and 103.35 Crores in 2066-67.
7. Specific CVP Analysis:
Banking has been a very competitive business with all the cut-throat competition
due to the no. of banks and financial institutions that are crowded in small market.
But while providing various services to the customers or while conducting various
activities, it will be beneficial if we know the profitability of those operations.
Making CVP Analysis enables us to know when the break-even point is reachable
and thus helps us set the target for those services. 3 different activities were taken
for specific CVP Analysis:
a. CVP Analysis of a Branch Expansion: Branch expansion spree is ever
on after the loosening of the provisions by the NRB. On analyzing simple
91
extension counter with minimal capital expenses of around 18.87 Lacs
depreciated at the rate of 20% on S.L.M. Basis and Recurring Costs per
month of 166,567.75 along with profit of 50,000 per month, assuming that
spread rate is 5%, Deposit required to be maintained is 3.99 Crores.
b. ATM CVP Analysis: ATM installation has been a fashion but the fact that
it has a lot of costs associated with it is often ignored. It might be a
surprising fact to many people even the bankers that 2 Rs. is charged to the
bank even if the bank’s own customer uses the card in its own ATM
Terminal. In view of this fact a small CVP Analysis is done for ATM. It is
seen that with Setup Cost of 11.40 Lacs, Recurring and Variable costs of
6.55 Lacs, the Break Even Deposit required to be collected JUST
BECAUSE OF THE ATM INSTALLATION is 1.31 Crores.
c. Remittance: Remittance though is the back bone of the country, is not that
beneficial to the Banks in view of the fact that the funds that are stuck in
the Remittance Receivables have alternative use opportunity in high
interest earning loans and advances or other investments. It is seen that it
requires a transaction of 2.297 Crores of transactions to reach breakeven
point just to cover the salary of a staff and the interest costs.
8. Margin of Safety:
Margin of Safety is the cushion to the loss of capital. The more Margin of Safety
more is the amount of profit and the capability of the bank to bear the costs of
operating. In this regard it is seen that the Margin of Safety was negative in the
year 2064-65 however it gradually improved in subsequent years. It is seen that as
per the Assumptive Basis the margin of safety percentage to the actual deposit
was -4.51%, 24.31% and 18.24% in 2064-65, 2065-66 and 2066-67 respectively.
Similarly as per the Traditional Method the Margin of Safety is calculated to be -
37.27%, 43.15% and 31.73% in 2064-65, 2065-66 and 2066-67 respectively.
92
CHAPTER - FIVE
SUMMARY, CONCLUSION AND RECOMMENDATION
5.1 Summary
Profit is the life blood of the organization without which it cannot sustain its
operation. The only target or the objective of any organization is to be in profit or in
surplus thus being able to give returns to its investors and grow for the future. In this
regard CVP Analysis gives the insight into the current situation of profitability of the
operations of the business. We know that even a small shop owner who sells
vegetables has his calculations of how much sales he needs to earn certain amount of
profit. CVP Analysis is no different from what he does but it is just the extension of it
in a more scientific way involving figures and formulas.
It helps the organization to set the target or benchmark for its operation and increase it
profit. The General Economy of the World went into recession after the financial slow
down in 2008 which is still in recovering phase. It was due to the real estate boom and
speculations that made the credit risk high thus resulting into the liquidity crunch and
finally the financial system failure that the recession occurred. The financial slow
down is estimated to be the worst after the Great Depression in 1930s.
Nepalese Economy though not directly affected by this slow down was bit hampered
as a aftershock. Nepalese Economy which has been going into boom due to the
excessive export of labor force into various countries since long history of foreign
labor starting from the Gurkha Army recruitment. The real estate sector got into the
boom when the speculations started until there was circular from the NRB on Poush
5th 2067 marking the maximum limit on the lending in this sector. Due to the real
estate boom the banks went into quick turnover profits and thus started expanding the
branches in a spree mode which is still in continuation but now basically because of
the compulsion of deposit collection.
After the pessimistic approach by the NRB through the Monetary Policy for 2067-68,
the real estate sector has gone down on its knees. Banks are now feeling the pressure
of maintaining the profitability.
93
The main objective of this study is to supplement the prior studies in CVP Analysis
and provide an insight into this analysis specific to the Banking Industry by utilizing
the experiences in this sector. The uniqueness of the sector due to its trading in money
and the nature of the various costs which was ignored in any other previous research
papers has been included in this research to provide a more factual analysis, thus
pioneering the new ways of CVP Analysis. However it should be noticed that the
basic principles of CVP Analysis are never compromised or breached in the study.
The study was done by getting to the every details of the bank and tabulating the
necessary data wherever necessary thus facilitating the analysis. Two methods of
analysis was used one on the Traditional Way and other on the Assumptive Way
which seemed more reliable to the actual results. Break Even Points are calculated
and the Margin of Safety illustrated thus giving the insight into the performance of the
organization and showing where the management focus is required.
In the additional part of this study, specific analysis of various activities of the Bank is
carried out. So the CVP Analysis has been tried to be used in every part wherever it
can be to make the research more practical and useful. For illustration purposes,
specific activities of branch opening, ATM Installation and Remittance services are
included in the analysis.
5.2 Conclusions
The research paper in overall has been able to reach considerable amount of
deductions which are beneficial for the study as well as the organization and banking
industry as a whole. On the basis of various observations, analysis and testing of data
several insights has been found regarding the performance of the Shangri-la
Development Bank Ltd.
We can summarize the conclusions reached in following points:
Overall economy of the world though not directly influencing the Nepalese
Economy, it has indirectly been affecting it in aftershocks of the economic
slowdown.
Nepalese economy is basically driven by the remittance and it would be in
jeopardy if the remittance flow is decreased.
94
Banking is the only industry which has survived all the ups and downs and has
been in continuous good performance steadily.
Banking Industries went into boom with the 1990’s adoption of free economy
policy and more sprees after the end of Maoists insurgency.
CVP analysis in banking industry is a rare work and amount of researches done is
very little. Banks have not been adopting this analysis policy and SDBL is not an
exception in this case.
CVP analysis considering the unique nature of business of banks can be done
through the assumptive basis and on traditional way of calculation of contribution
margin.
Seeing at the banks performances, the fund utilization of Shangri-la Development
Bank is not at the fullest it could utilize and thus the profitability of the bank is hit
by it.
Though there is seemingly high interest spread rate or the contribution margin,
there seems to be very low effective weighted average interest rate spread while
considering the fund utilization. This should be increased if the bank wants to
decrease the Break Even Point.
The margin of safety is very low and so is the profitability of the bank. It is
basically due to two factors, low CD Ratio and the high costs due to increase in
no. of branches. We can see that the total costs have sky rocketed in very high
proportion in 3 years. The increase of branches from 1 to 4 in second year and 4 to
12 in third year of operation has made the costs to increase many folds.
We can see that the contribution margin is in increasing trend. However it has
been out smarted by the increase in costs of the bank due to expansion. This
shows that branch expansion should be made only after proper CVP Analysis.
Opening a simple branch requires a deposit target of 4 Crore if a minimal
infrastructure is maintained. It can go high along with the costs involved.
ATM is a costly affair for banks. To reach the cost break even it is required to
increase the deposit by around 1.31 Crores just due to ATM installation.
Remittance is not that beneficial to bank if the amount received from remittance is
not converted into deposit of the bank. In that case it can be lend and profit can be
earned in it. Else to simply cover the cost of a person and internet connection,
95
more than 2 Crore payments has to be made even when 100 Rs. commissions is
received in every 100,000 Rs. of payment.
5.3 Recommendations
No research paper or study is beneficial unless we derive some recommendation out
of it. On basis of the detailed study that has been performed many insights are reached
based on which various conclusions are derived and thus following recommendations
can be suggested to the management as well as other bankers.
1. Frequent use of CVP Analysis:
CVP Analysis should be a part and parcel of the management decisions and it
should be integrated into the MIS. Only then an informed decision can be reached
and ultimately the organization can be run in a rational way.
SDBL as well doesn’t seem to be using the CVP Analysis in more frequent way. It
is recommended that it use it more often in any decision like product introduction,
branch opening, etc.
2. Improvement in Fund Utilization:
It has been noticed that there is fluctuation in the fund utilization trend which has
hampered the profitability of the second year of operation. It is thus recommended
that the Fund Utilization be made stable and consistent along with some more
increment in its usage.
This can be done through the proper matching of funds so that the funds are not
remained idle. If suppose we are going to open a new branch we should be aware
that deposit mobilization will be there. So it should be proactively thought how
this should be utilized without delay. Pipeline of lending applications should be
prepared considering the amount of deposit that is expected to be collected.
3. Improvement of Margin of Safety:
It is seen that the profitability of Shangri-la Development Bank Limited is not that
encouraging and so is the Margin of Safety. It can be seen that there is decrease in
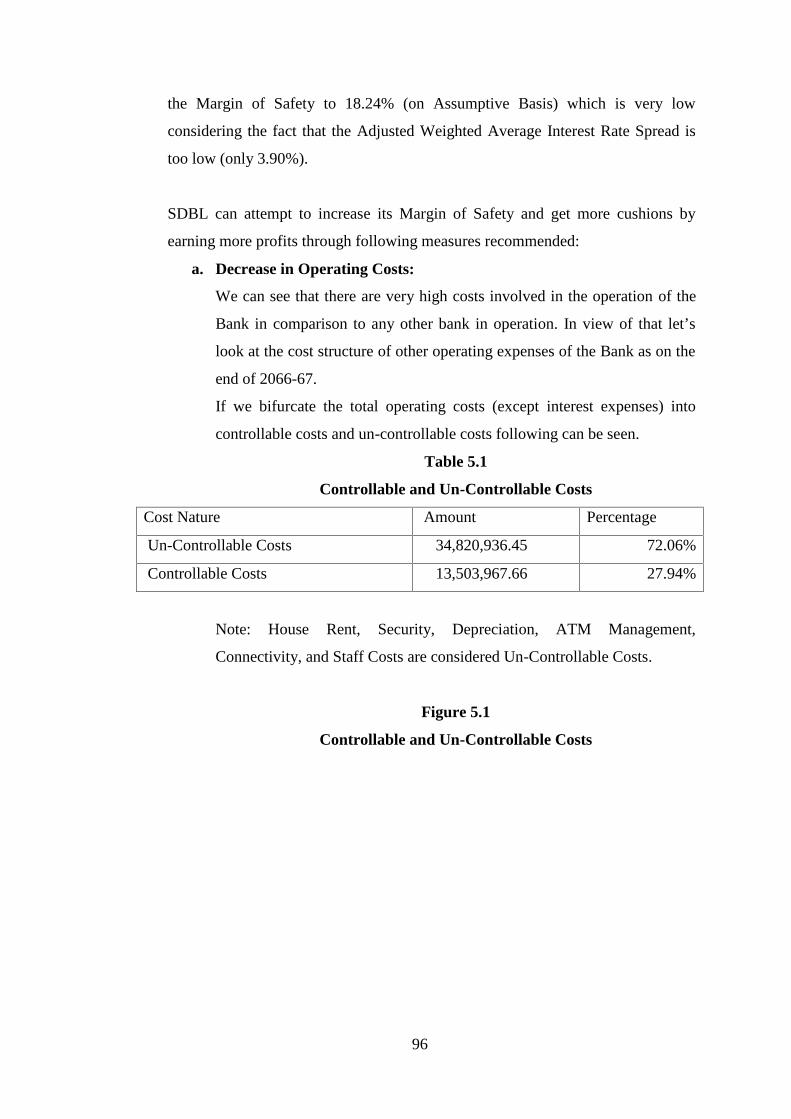
96
the Margin of Safety to 18.24% (on Assumptive Basis) which is very low
considering the fact that the Adjusted Weighted Average Interest Rate Spread is
too low (only 3.90%).
SDBL can attempt to increase its Margin of Safety and get more cushions by
earning more profits through following measures recommended:
a. Decrease in Operating Costs:
We can see that there are very high costs involved in the operation of the
Bank in comparison to any other bank in operation. In view of that let’s
look at the cost structure of other operating expenses of the Bank as on the
end of 2066-67.
If we bifurcate the total operating costs (except interest expenses) into
controllable costs and un-controllable costs following can be seen.
Table 5.1
Controllable and Un-Controllable Costs
Cost Nature Amount Percentage
Un-Controllable Costs 34,820,936.45 72.06%
Controllable Costs 13,503,967.66 27.94%
Note: House Rent, Security, Depreciation, ATM Management,
Connectivity, and Staff Costs are considered Un-Controllable Costs.
Figure 5.1
Controllable and Un-Controllable Costs
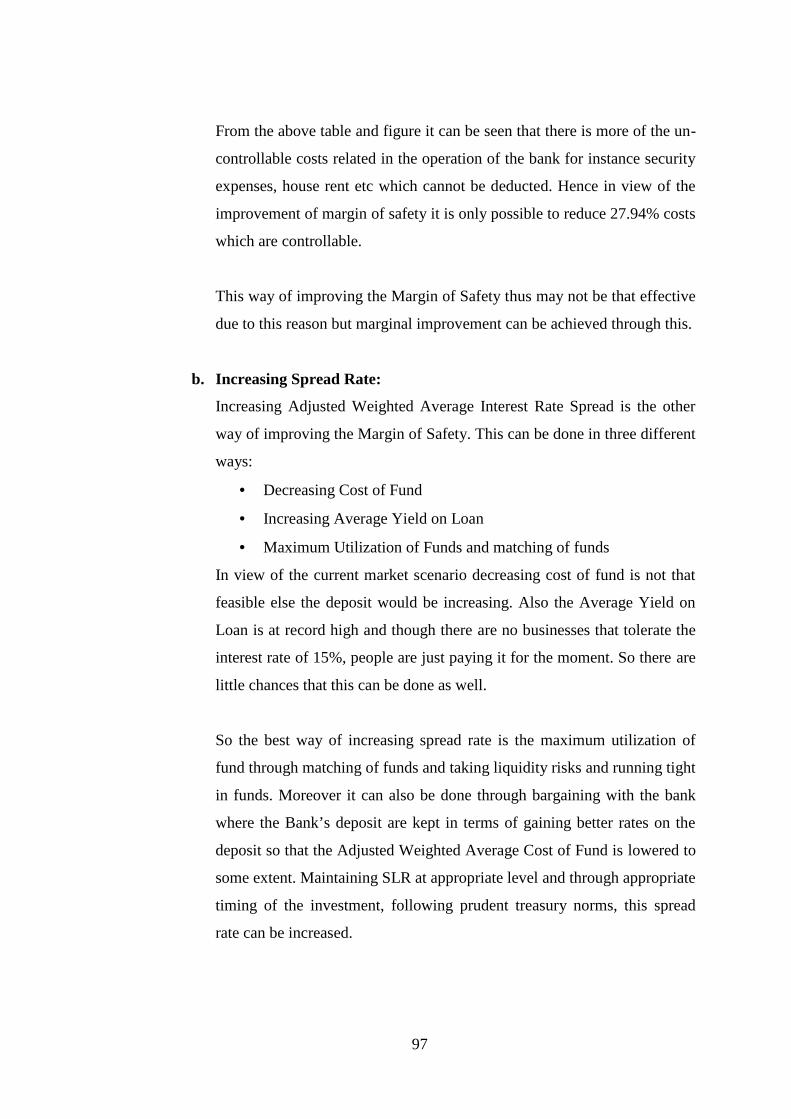
97
From the above table and figure it can be seen that there is more of the un-
controllable costs related in the operation of the bank for instance security
expenses, house rent etc which cannot be deducted. Hence in view of the
improvement of margin of safety it is only possible to reduce 27.94% costs
which are controllable.
This way of improving the Margin of Safety thus may not be that effective
due to this reason but marginal improvement can be achieved through this.
b. Increasing Spread Rate:
Increasing Adjusted Weighted Average Interest Rate Spread is the other
way of improving the Margin of Safety. This can be done in three different
ways:
Decreasing Cost of Fund
Increasing Average Yield on Loan
Maximum Utilization of Funds and matching of funds
In view of the current market scenario decreasing cost of fund is not that
feasible else the deposit would be increasing. Also the Average Yield on
Loan is at record high and though there are no businesses that tolerate the
interest rate of 15%, people are just paying it for the moment. So there are
little chances that this can be done as well.
So the best way of increasing spread rate is the maximum utilization of
fund through matching of funds and taking liquidity risks and running tight
in funds. Moreover it can also be done through bargaining with the bank
where the Bank’s deposit are kept in terms of gaining better rates on the
deposit so that the Adjusted Weighted Average Cost of Fund is lowered to
some extent. Maintaining SLR at appropriate level and through appropriate
timing of the investment, following prudent treasury norms, this spread
rate can be increased.
98
4. Decreasing Fixed Costs:
The other way of increasing Margin of Safety is by decreasing the Fixed Costs.
We can see that maximum of the costs are fixed and most of them are
uncontrollable. Hence cost reduction measures rather than cost control shall be
used. For instance to decrease house rent, it is not possible to review the contract
with the House Owner rather if the office space is high, then it should be sub-let to
decrease the costs.
5. Increasing Deposit and Lending:
While we see that most of other options are only partially effective in lieu of their
own constraints, the most feasible option to increase the Margin of Safety is to
increase the Deposit.
Margin of Safety is the difference between the actual deposit and the break even
deposit. Hence if we increase the actual deposit then there will be automatic
increment in Margin of Safety.
Considering that the bank has got 12 branches excessive marketing has to be done
so that the deposit growth is better according to the branches. Bank should try to
capitalize on its network strength and provide better services. Also the staff should
be better trained and made them to provide good services so that customers are
ready to put more deposit and take more loans.
99
BIBLIOGRAPHY
Agrawal, A.N. and Lal, Kundan, (1989). Economics of Development and Planning.
New Delhi: Vikas Publishing Hose Pvt.Ltd.
Dangol, R.M. and Prajapati, K., (2001). Accounting for Financial Analysis and
Planning. Kathmandu: Taleju Prakashan.
Dangol, Ratna Man (1997). Management Accounting. Kathmandu: Taleju Prakashan.
Dean, Joel (1971). Managerial Economics. New Dilhi: Prentice Hall of India.
Dewette, K.K. (1981). Modern Economic Theory. New Delhi: S. Chand and Company.
Fago, G. (2003). Profit Planning and Control. Kathmandu: Buddha Academic
Enterprises Pvt.Ltd.
Garrison, R.H. (1985). Managerial Accounting. Texas: Business Publication Inc. Plan.
George, R. Terry (1968). Principle of Management. Wood Mlions: Richard Irwin Inc.
Home.
Giri, T.P. (1994). Accounting Practices. Kathmandu: EKTA Publication
Gupta, S.C. (1997). Advanced Accounts. New Delhi: S. Chand and Company.
Gupta, S.P. (1990). Statistical Methods. New Delhi: Tata McGraw Hill Publishing
Company.
Gupta, S.P.(1995). Management Accounting. Agra: Shahitya Bhawan Publication.
Hiltion, R.W. (1997). Managerial Accounting. USA: McGraw-Hill Inc.
100
Horngren, C.T. (1991). Introduction to Management Accounting, New Delhi: Prentice
Hall of India.
Horngren, C.T., Foster, George and Dattar, S.M. (1999). Cost Accounting: A
Management Approach. New Delhi: Prentice Hall of India Pvt. Ltd.
Institute of Chartered Accountants of India, 2009. Cost Management
Institute of Chartered Accountants of India, 2009. Management Accounting and
Financial Analysis.
Jain, S.P. and Narang, K.L. (1993). Advanced Accounting. New Delhi: Kalyani
Publishers.
Jawahar, Lal, (1996). Cost Accounting. New Delhi: Tata McGraw Hill Publishing
Company.
Kaplan, R.S. and Atkinson, A.A. (1998). Advances Management Accounting. New
York Printice Hall International.
Khan, M.Y. and Jain, P.K., (1993). Management Accounting. New Delhi: Tata McGraw
Hill Publishing Company.
Khan, M.Y. and jain, P.K. (1996). Financial Management. New Delhi: Tata McGraw
Hill Publishing Compnay.
Kulkarni, P.V. (1985). Financial Management. New Delhi: Indian Himalayan
Publication House.
Lynch, R.M. and Willamson, R.W. (1999). Accounting for Management. New Delhi:
Tata McGraw Hill Publishing Company.
Maheshwori, S.N. (2000). Management Accounting and Financial Control. New
Delhi: Sultan Chand & Sons Educational Publishers.
101
Munankarmi, S.P. (2003). Management Accounting. Kathmandu: Buddha Academic
Enterprises Pvt.Ltd.
Pandey, I.M. (1987). Financial Management. New Delhi: Vikas Publishing House
Pvt.Ltd.
Pandey, I.M. (1994). Management Accounting. New Delhi: Vikas Publishing House
Pvt.Ltd.
Paul, S.Kr. (1996). Management Accounting. Calcutta: New Central Books Agency
Pvt.Ltd.
Rathnam, P.V. (1994). Budgeting. New Delhi: Indian Himalayan Publication Hose.
Saxena, V.K. and Vashist, C.D. (1995). Advance Cost and Management Accounting
New Delhi: Sultan chand & Sons Educational Publishers.
Sharma, R.K. and Gupta, K.S. (1993). Management Accounting. New Delhi: Kalyani
Publishes.
Van Horn, J.C. (1998). Financial Management and Policy. New Delhi: Prentice Hall of
India.
Welsch, G.A,. Hilton, R.W. nd Gordern, P.N. (1992). Budgeting: Profit Planning and
Controlling. New Delhi: Prentice Hall of India Pvt. Ltd.
Welsch, G.A. (1979). Budgeting: Profit Planning and Control. New Delhi: Prentice
Hall of Indian Pvt.Ltd.
Welsch, G.A., Hilton, R.W. and Gordon, P.N. (2001). Budgeting: Profit Planning and
Controlling. New Delhi: Prentice Hall of India Pvt.Ltd.
102
Weston, J.F. and Brigham, E.F. (1990). Essentials of Managerial Finance. Chicago: The
Dryden Press.
Weston, J.F. and Copland, J.E. (1992). Managerial Finance. Chicago. The Dryden Press.
Unpublished Master Level Thesis:
Aryal Chaturbhuj, (2009). “CVP analysis as a tool to measure effectiveness of PPC (A
Case Study Herbs Production and Processing Com.Ltd.)”. A Master Degree
Thesis, Submitted to Shanker Dev Campus, Ramsahapath, Kathmandu.
Dahal, Rabin (2008), “Profit planning system and financial condition of Nepal
electricity authority”. An Unpublished Master Level Thesis, Central Department
of Management, Tribhuvan University.
Dhakal, Dipendra Raj (2005). Cost Volume Profit Analysis as a tool to measure the
effectiveness of profit planning and control: A Case Study of Gorakhkali
Rubber Industry Limited". An Unpublished Master level Thesis, Shanker Dev
Campus.
Namdak, Tenzin (2005). “Cost Volume Profit analysis of Diary Development
Corporation.” An Unpublished Master Level Thesis, Central Department,
Tribhuvan University.
Ojha, Khagendra Prasad (1995). "Profit Planning in Manufacturing Public Enterprises:
A Case Study of Royal Drugs Limited and Herbal Production and processing
Company Limited". An Unpublished Master Level Thesis, Central Department of
Management, Tribhuvan University.
Rijal, Madhav (2005). "Cost Volume Profit Analysis as a Tool to Measure Effectiveness
of Profit Planning and Control. A Case Study of NEBICO Pvt.Ltd".An
Unpublished Master level Thesis, Shanker Dev Campus.
103
'Shrestha, Dharma Raj (2006). “Cost, Volume and Profit Analysis of Commercial Bank”
(A Case Study of Himalayan Bank Limited) A Master Degree Thesis, Submitted
to Shanker Dev Campus, Ramsahapath, Kathmandu.
'Sharma, Sagar (2002). "Management Accounting Practices in the Listed Companies of
Nepal". An Unpublished Masters Level Thesis, Shanker Dev Campus.
'Thakur, Gajendra Kumar (2001). "Cost Control Mechanixm of Janakpur Cigarette
Factory Limited". An Unpublished Masters Level Thesis, Shanker Dev Campus.
Journals, Report and Articles:
Bank and Financial Institutions Statistics: Nepal Rastra Bank
Central Bureau of Statistics, 2004. Nepal Living Standard Survey-2004, Vol.-II,
Kathmandu.
Central Bureau of Statistics, 2004. Nepal Living Standard Survey-2004, Vol. – 1,
Kathmandu.
Ministry of Finance, HMG/N. 2009. Budget Speech, FY 2006-07, Kathmandu.
Ministry of Finance, Nepal Government, 2010. Economic Survey, FY 2009-10,
Kathmandu.
Ministry of Finance, Nepal Government,2009. Economic Survey, FY 2008-09,
Kathmandu.
Ministry of Finance, Nepal Government, 2008. Economic Survey, FY 2007-08,
Kathmandu.
Ministry of Finance, Nepal Government, 2007. Economic Survey, FY 2006-07,
Kathmandu.
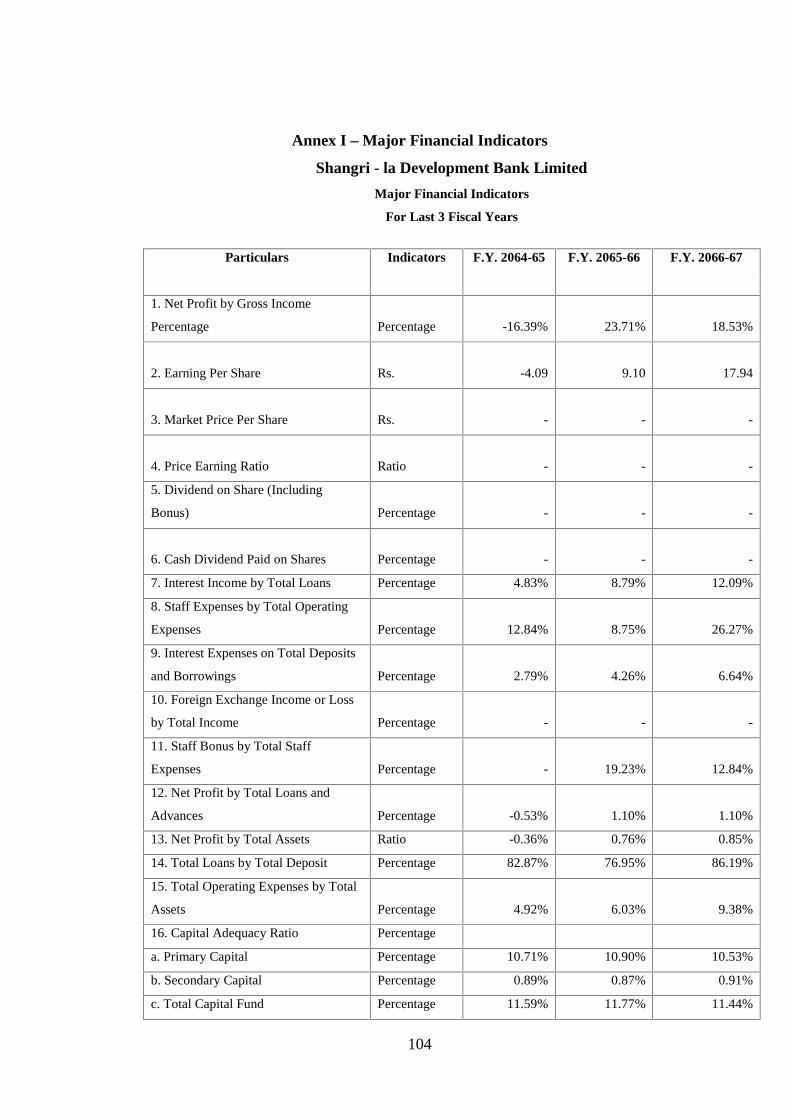
104
Annex I – Major Financial Indicators
Shangri - la Development Bank Limited
Major Financial Indicators
For Last 3 Fiscal Years
Particulars Indicators F.Y. 2064-65 F.Y. 2065-66 F.Y. 2066-67
1. Net Profit by Gross Income
Percentage Percentage -16.39% 23.71% 18.53%
2. Earning Per Share Rs. -4.09 9.10 17.94
3. Market Price Per Share Rs. - - -
4. Price Earning Ratio Ratio - - -
5. Dividend on Share (Including
Bonus) Percentage - - -
6. Cash Dividend Paid on Shares Percentage - - -
7. Interest Income by Total Loans Percentage 4.83% 8.79% 12.09%
8. Staff Expenses by Total Operating
Expenses Percentage 12.84% 8.75% 26.27%
9. Interest Expenses on Total Deposits
and Borrowings Percentage 2.79% 4.26% 6.64%
10. Foreign Exchange Income or Loss
by Total Income Percentage - - -
11. Staff Bonus by Total Staff
Expenses Percentage - 19.23% 12.84%
12. Net Profit by Total Loans and
Advances Percentage -0.53% 1.10% 1.10%
13. Net Profit by Total Assets Ratio -0.36% 0.76% 0.85%
14. Total Loans by Total Deposit Percentage 82.87% 76.95% 86.19%
15. Total Operating Expenses by Total
Assets Percentage 4.92% 6.03% 9.38%
16. Capital Adequacy Ratio Percentage
a. Primary Capital Percentage 10.71% 10.90% 10.53%
b. Secondary Capital Percentage 0.89% 0.87% 0.91%
c. Total Capital Fund Percentage 11.59% 11.77% 11.44%
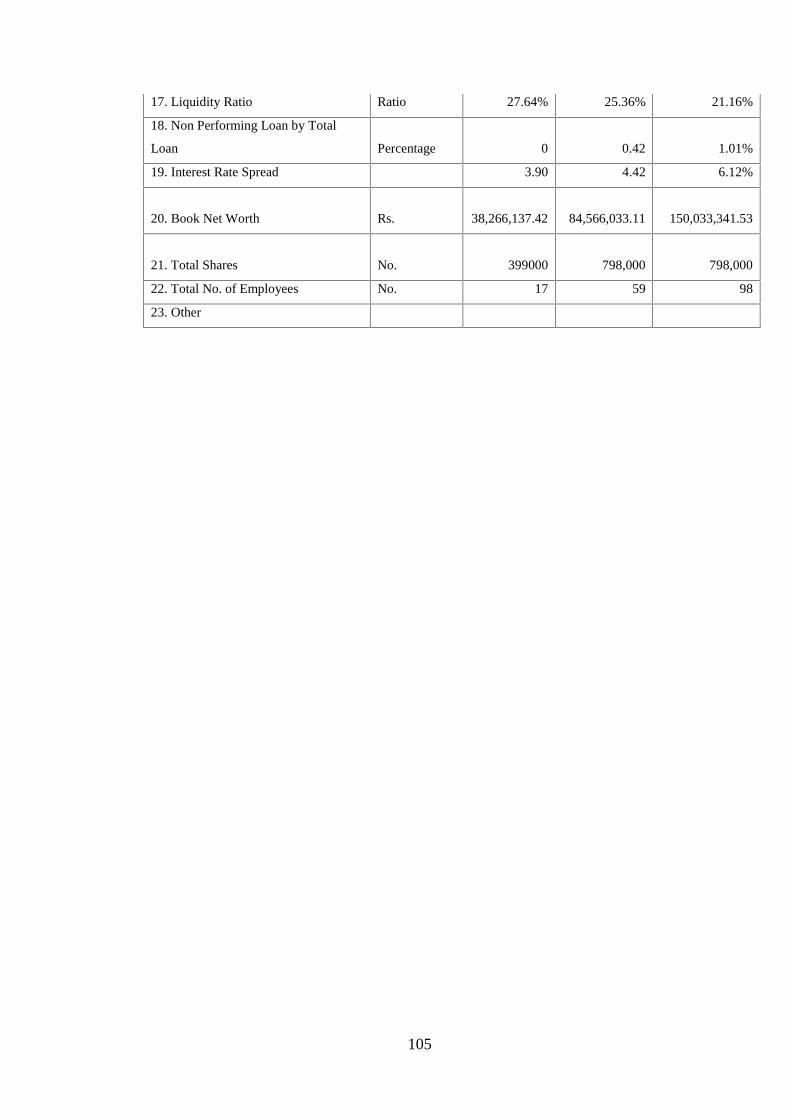
105
17. Liquidity Ratio Ratio 27.64% 25.36% 21.16%
18. Non Performing Loan by Total
Loan Percentage 0 0.42 1.01%
19. Interest Rate Spread 3.90 4.42 6.12%
20. Book Net Worth Rs. 38,266,137.42 84,566,033.11 150,033,341.53
21. Total Shares No. 399000 798,000 798,000
22. Total No. of Employees No. 17 59 98
23. Other

106
Annex II - Organizational Structure of SDBL
106
Annex II - Organizational Structure of SDBL
106
Annex II - Organizational Structure of SDBL
Related Documents