opportunities Channelling VEDANTA LIMITED INTEGRATED REPORT AND ANNUAL ACCOUNTS 2017-18

Welcome message from author
This document is posted to help you gain knowledge. Please leave a comment to let me know what you think about it! Share it to your friends and learn new things together.
Transcript
opportunities
Channelling
VEDANTA LIMITED
INTEGRATED REPORT AND ANNUAL ACCOUNTS
2017-18V
EDA
NTA
LIMITED
Integrated Report and A
nnual Accounts 20
17-18
About the ReportThis is the first Integrated Report of Vedanta Limited. The Report aims to provide a holistic picture of our financial and non-financial performance to our stakeholders. It aims to present the Company’s preparedness for short, medium and long-term value creation across financial, environmental, social and governance aspects. It is in line with the Regulation 34 of the SEBI (Listing Obligations and Disclosure Requirements) Regulations, 2015 and SEBI circular on voluntary adoption of Integrated Reporting, dated February 6, 2017.
The non-financial information, value-creation process, strategic framework, material issues and other key content elements of the Report are presented as per the Integrated Reporting <IR> framework of the Integrated Reporting Council (IIRC).
Regarding the Financial Statements 2018We have provided consolidated and standalone financial statements in our printed Report prepared in accordance with the Indian Accounting Standards (Ind AS) notified under the Companies (Indian Accounting Standards) Rules, 2015 (as amended from time to time).
In line with our ambition and value creation, this Report is structured around our stakeholders and reflects our transition, successes and future aspirations.
Our primary stakeholders that Vedanta impacts, and who influence our ability to achieve our vision, have been identified as our people, shareholders, principals, suppliers, customers, communities and the environment.
Our material matters are derived by considering the factors that could substantially affect our ability to create value in the short, medium, or long term and these matters have formed the content of the Report.
An independent audit was performed by SR Batliboi & Co., LLP, expressing an unmodified opinion. The opinion on the financial statements is included in the IAR, on pages 188 and 271.
Scope and BoundaryThis Report covers information on manufacturing operations of Vedanta Limited, its subsidiaries, raw material locations and corporate offices.
Board responsibilityThe Board of Directors acknowledges its responsibilities to ensure the integrity of this Integrated Report. The Board believes the Report addresses all material issues and presents the integrated performance of the Group and its impact in a fair and accurate manner. The Board authorized this Report for release on 3 May, 2018.
Management Assurance Statement
Forward-looking statementsCertain statements in this document constitute ‘forward-looking statements’ which involve known and unknown risks and opportunities, other uncertainties and important factors that could turn out to be materially different following the publication of actual results.
These forward-looking statements speak only as of the date of this document. The Company undertakes no obligation to update publicly, or release any revisions, to these forward-looking statements, to reflect events or circumstances after the date of this document, or to reflect the occurrence of anticipated events.
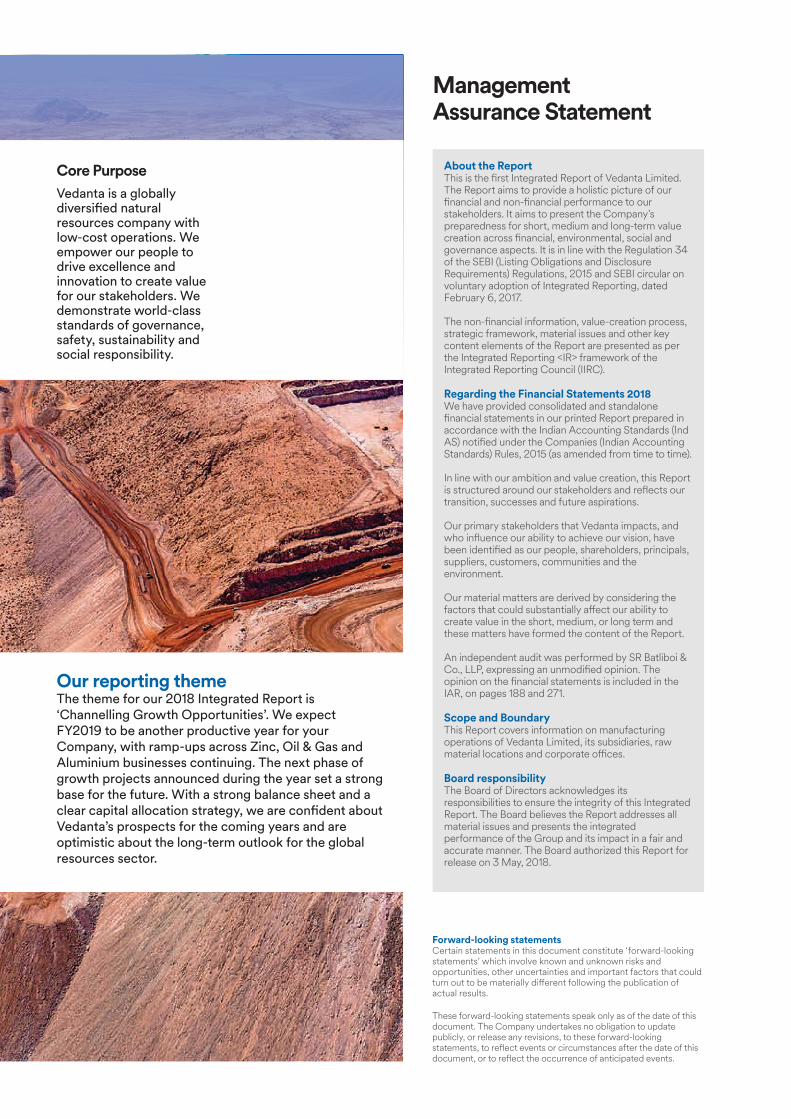
Core PurposeVedanta is a globally diversified natural resources company with low-cost operations. We empower our people to drive excellence and innovation to create value for our stakeholders. We demonstrate world-class standards of governance, safety, sustainability and social responsibility.
Our reporting themeThe theme for our 2018 Integrated Report is ‘Channelling Growth Opportunities’. We expect FY2019 to be another productive year for your Company, with ramp-ups across Zinc, Oil & Gas and Aluminium businesses continuing. The next phase of growth projects announced during the year set a strong base for the future. With a strong balance sheet and a clear capital allocation strategy, we are confident about Vedanta’s prospects for the coming years and are optimistic about the long-term outlook for the global resources sector.
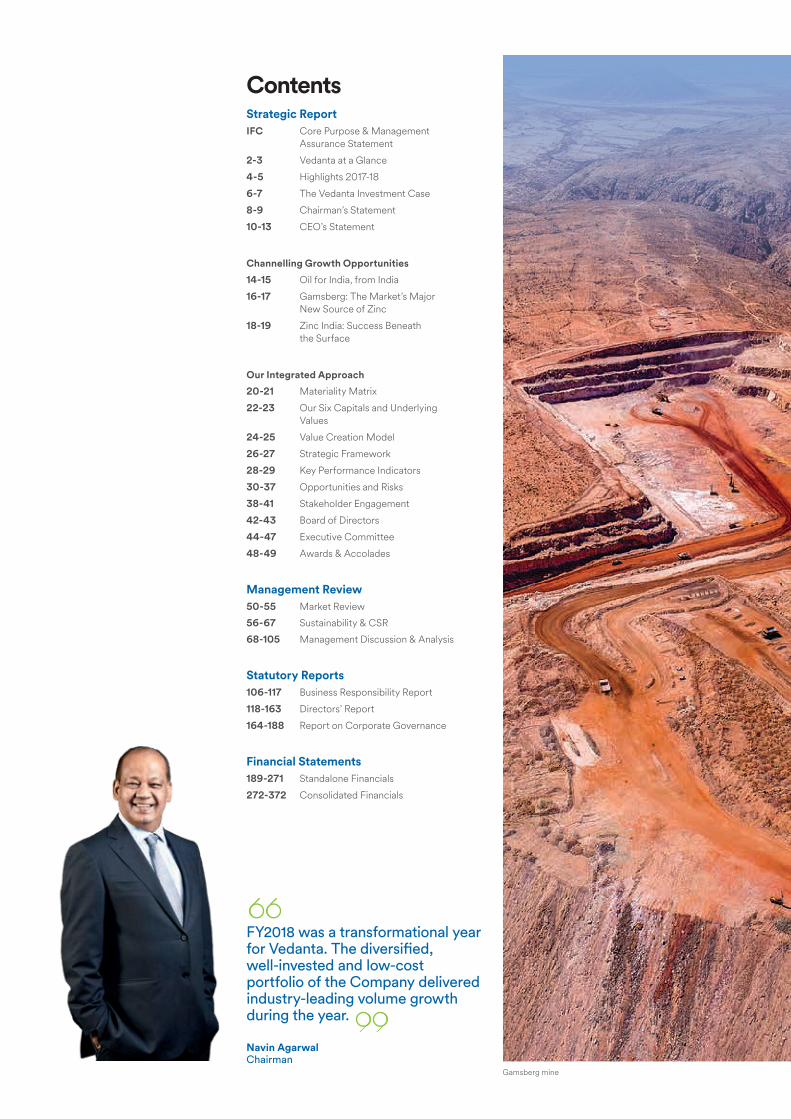
FY2018 was a transformational yearfor Vedanta. The diversified, well-invested and low-cost portfolio of the Company delivered industry-leading volume growth during the year.
Navin AgarwalChairman
Gamsberg mine
ContentsStrategic ReportIFC Core Purpose & Management
Assurance Statement
2-3 Vedanta at a Glance
4-5 Highlights 2017-18
6-7 The Vedanta Investment Case
8-9 Chairman’s Statement
10-13 CEO’s Statement
Channelling Growth Opportunities
14-15 Oil for India, from India
16-17 Gamsberg: The Market’s Major New Source of Zinc
18-19 Zinc India: Success Beneath the Surface
Our Integrated Approach
20-21 Materiality Matrix
22-23 Our Six Capitals and Underlying Values
24-25 Value Creation Model
26-27 Strategic Framework
28-29 Key Performance Indicators
30-37 Opportunities and Risks
38-41 Stakeholder Engagement
42-43 Board of Directors
44-47 Executive Committee
48-49 Awards & Accolades
Management Review50-55 Market Review
56-67 Sustainability & CSR
68-105 Management Discussion & Analysis
Statutory Reports106-117 Business Responsibility Report
118-163 Directors’ Report
164-188 Report on Corporate Governance
Financial Statements189-271 Standalone Financials
272-372 Consolidated Financials
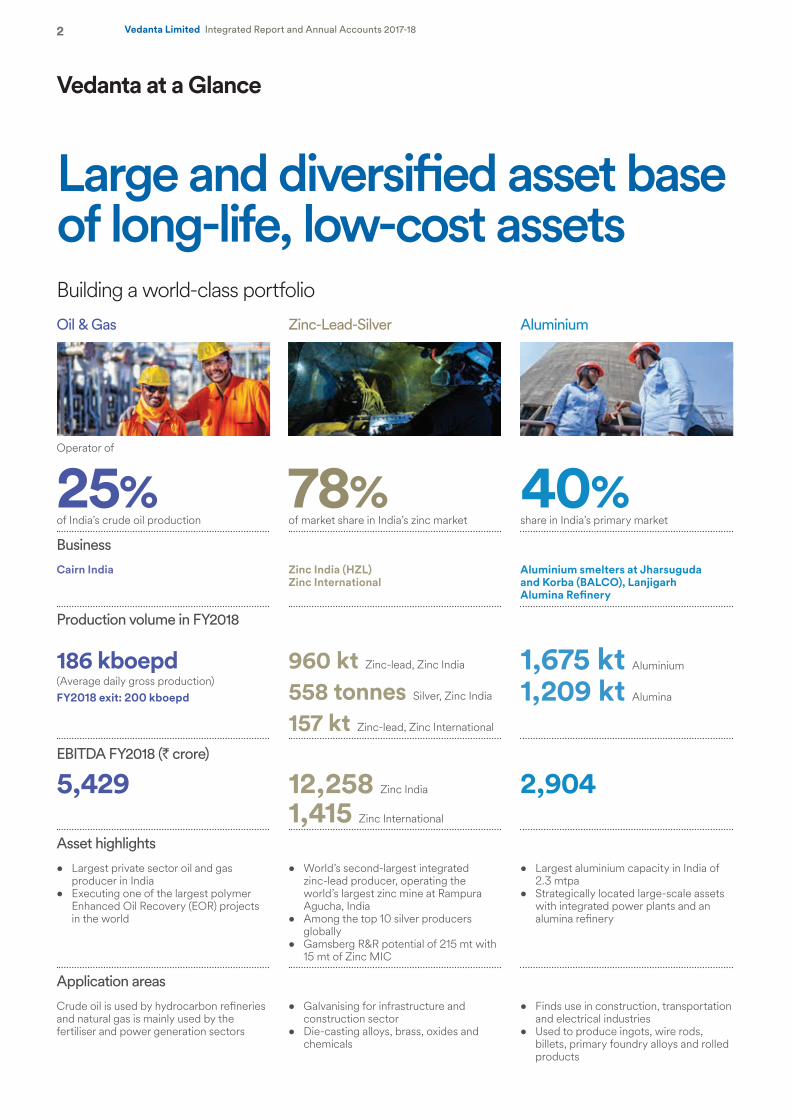
Vedanta at a Glance
Building a world-class portfolio
Large and diversified asset base of long-life, low-cost assets
Oil & Gas Zinc-Lead-Silver Aluminium Power Copper Iron Ore
Operator of
25%of India’s crude oil production
78%of market share in India’s zinc market
40%share in India’s primary market
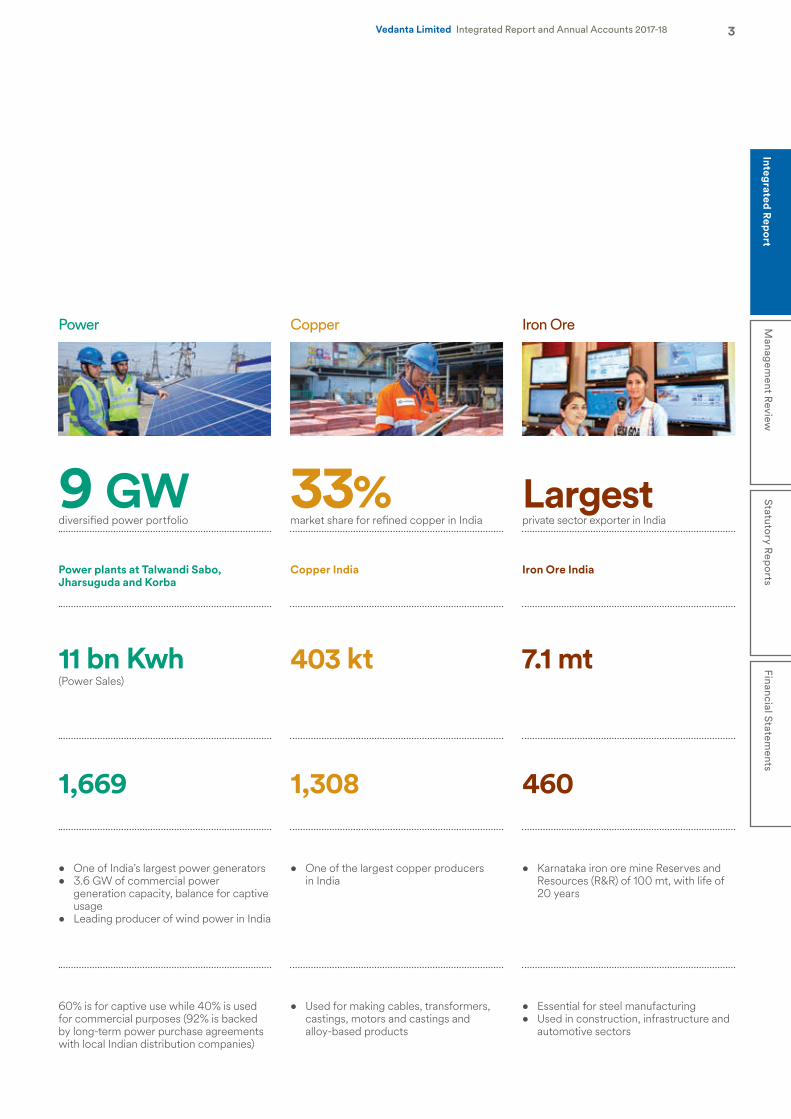
9 GWdiversified power portfolio
33%market share for refined copper in India
Largestprivate sector exporter in India
Business
Cairn India Zinc India (HZL)Zinc International
Aluminium smelters at Jharsuguda and Korba (BALCO), Lanjigarh Alumina Refinery
Power plants at Talwandi Sabo, Jharsuguda and Korba
Copper India Iron Ore India
Production volume in FY2018
186 kboepd (Average daily gross production)FY2018 exit: 200 kboepd
960 kt Zinc-lead, Zinc India
558 tonnes Silver, Zinc India
157 kt Zinc-lead, Zinc International
1,675 kt Aluminium
1,209 kt Alumina
11 bn Kwh (Power Sales)
403 kt 7.1 mt
EBITDA FY2018 (` crore)
5,429 12,258 Zinc India
1,415 Zinc International
2,904 1,669 1,308 460
Asset highlights
• Largest private sector oil and gas producer in India
• Executing one of the largest polymer Enhanced Oil Recovery (EOR) projects in the world
• World’s second-largest integrated zinc-lead producer, operating the world’s largest zinc mine at Rampura Agucha, India
• Among the top 10 silver producers globally
• Gamsberg R&R potential of 215 mt with 15 mt of Zinc MIC
• Largest aluminium capacity in India of 2.3 mtpa
• Strategically located large-scale assets with integrated power plants and an alumina refinery
• One of India’s largest power generators• 3.6 GW of commercial power
generation capacity, balance for captive usage
• Leading producer of wind power in India
• One of the largest copper producers in India
• Karnataka iron ore mine Reserves and Resources (R&R) of 100 mt, with life of 20 years
Application areas
Crude oil is used by hydrocarbon refineries and natural gas is mainly used by the fertiliser and power generation sectors
• Galvanising for infrastructure and construction sector
• Die-casting alloys, brass, oxides and chemicals
• Finds use in construction, transportation and electrical industries
• Used to produce ingots, wire rods, billets, primary foundry alloys and rolled products
60% is for captive use while 40% is used for commercial purposes (92% is backed by long-term power purchase agreements with local Indian distribution companies)
• Used for making cables, transformers, castings, motors and castings and alloy-based products
• Essential for steel manufacturing• Used in construction, infrastructure and
automotive sectors
2 Vedanta Limited Integrated Report and Annual Accounts 2017-18
Building a world-class portfolioOil & Gas Zinc-Lead-Silver Aluminium Power Copper Iron Ore
Operator of
25%of India’s crude oil production
78%of market share in India’s zinc market
40%share in India’s primary market
9 GWdiversified power portfolio
33%market share for refined copper in India
Largestprivate sector exporter in India
Business
Cairn India Zinc India (HZL)Zinc International
Aluminium smelters at Jharsuguda and Korba (BALCO), Lanjigarh Alumina Refinery
Power plants at Talwandi Sabo, Jharsuguda and Korba
Copper India Iron Ore India
Production volume in FY2018
186 kboepd (Average daily gross production)FY2018 exit: 200 kboepd
960 kt Zinc-lead, Zinc India
558 tonnes Silver, Zinc India
157 kt Zinc-lead, Zinc International
1,675 kt Aluminium
1,209 kt Alumina
11 bn Kwh (Power Sales)
403 kt 7.1 mt
EBITDA FY2018 (` crore)
5,429 12,258 Zinc India
1,415 Zinc International
2,904 1,669 1,308 460
Asset highlights
• Largest private sector oil and gas producer in India
• Executing one of the largest polymer Enhanced Oil Recovery (EOR) projects in the world
• World’s second-largest integrated zinc-lead producer, operating the world’s largest zinc mine at Rampura Agucha, India
• Among the top 10 silver producers globally
• Gamsberg R&R potential of 215 mt with 15 mt of Zinc MIC
• Largest aluminium capacity in India of 2.3 mtpa
• Strategically located large-scale assets with integrated power plants and an alumina refinery
• One of India’s largest power generators• 3.6 GW of commercial power
generation capacity, balance for captive usage
• Leading producer of wind power in India
• One of the largest copper producers in India
• Karnataka iron ore mine Reserves and Resources (R&R) of 100 mt, with life of 20 years
Application areas
Crude oil is used by hydrocarbon refineries and natural gas is mainly used by the fertiliser and power generation sectors
• Galvanising for infrastructure and construction sector
• Die-casting alloys, brass, oxides and chemicals
• Finds use in construction, transportation and electrical industries
• Used to produce ingots, wire rods, billets, primary foundry alloys and rolled products
60% is for captive use while 40% is used for commercial purposes (92% is backed by long-term power purchase agreements with local Indian distribution companies)
• Used for making cables, transformers, castings, motors and castings and alloy-based products
• Essential for steel manufacturing• Used in construction, infrastructure and
automotive sectors
3Integrated R
eport
Managem
ent Review
Statutory R
eports
Financial Statements
Vedanta Limited Integrated Report and Annual Accounts 2017-18
4 Vedanta Limited Integrated Report and Annual Accounts 2017-18
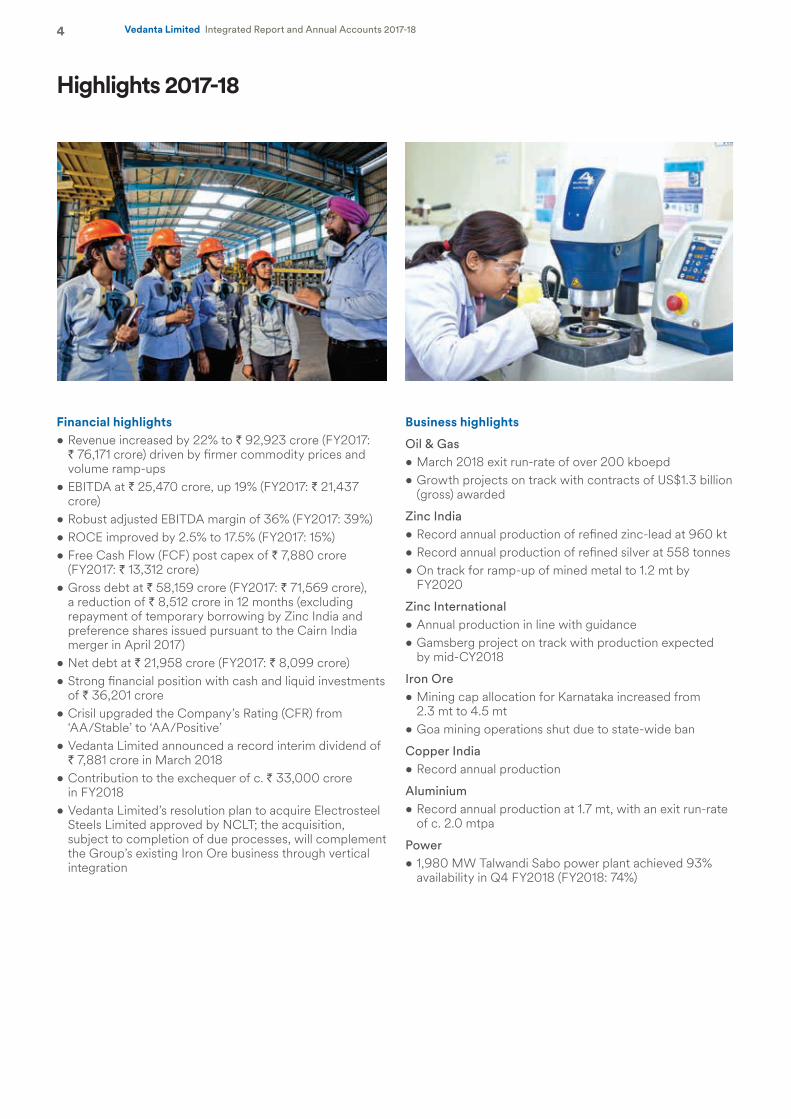
Highlights 2017-18
Financial highlights• Revenue increased by 22% to ` 92,923 crore (FY2017:
` 76,171 crore) driven by firmer commodity prices and volume ramp-ups
• EBITDA at ` 25,470 crore, up 19% (FY2017: ` 21,437 crore)
• Robust adjusted EBITDA margin of 36% (FY2017: 39%) • ROCE improved by 2.5% to 17.5% (FY2017: 15%)• Free Cash Flow (FCF) post capex of ` 7,880 crore
(FY2017: ` 13,312 crore)• Gross debt at ` 58,159 crore (FY2017: ` 71,569 crore),
a reduction of ` 8,512 crore in 12 months (excluding repayment of temporary borrowing by Zinc India and preference shares issued pursuant to the Cairn India merger in April 2017)
• Net debt at ` 21,958 crore (FY2017: ` 8,099 crore)• Strong financial position with cash and liquid investments
of ` 36,201 crore• Crisil upgraded the Company’s Rating (CFR) from
‘AA/Stable’ to ‘AA/Positive’• Vedanta Limited announced a record interim dividend of
` 7,881 crore in March 2018• Contribution to the exchequer of c. ` 33,000 crore
in FY2018• Vedanta Limited’s resolution plan to acquire Electrosteel
Steels Limited approved by NCLT; the acquisition, subject to completion of due processes, will complement the Group’s existing Iron Ore business through vertical integration
Business highlights
Oil & Gas• March 2018 exit run-rate of over 200 kboepd• Growth projects on track with contracts of US$1.3 billion
(gross) awarded
Zinc India• Record annual production of refined zinc-lead at 960 kt• Record annual production of refined silver at 558 tonnes• On track for ramp-up of mined metal to 1.2 mt by
FY2020
Zinc International• Annual production in line with guidance• Gamsberg project on track with production expected
by mid-CY2018
Iron Ore• Mining cap allocation for Karnataka increased from
2.3 mt to 4.5 mt• Goa mining operations shut due to state-wide ban
Copper India• Record annual production
Aluminium• Record annual production at 1.7 mt, with an exit run-rate
of c. 2.0 mtpa
Power• 1,980 MW Talwandi Sabo power plant achieved 93%
availability in Q4 FY2018 (FY2018: 74%)
2016 2017 2018
67,9
93
76,17
1 92,9
23
2016 2017 2018
15,18
4
21,4
37 25,4
70
2016 2017 2018
3.5
19.5 21
.2
2016 2017 2018
4.5%
15.0
% 17.5
%
5Integrated R
eport
Managem
ent Review
Statutory R
eports
Financial Statements
Vedanta Limited Integrated Report and Annual Accounts 2017-18
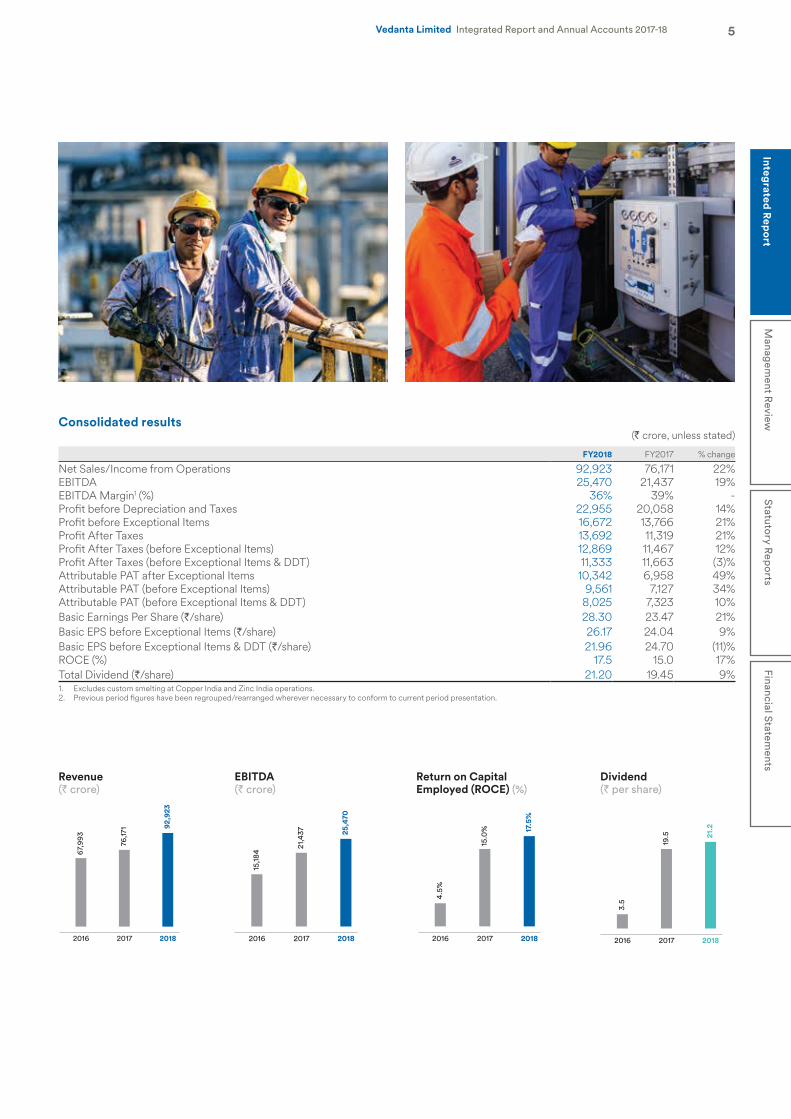
Consolidated results(̀ crore, unless stated)
FY2018 FY2017 % change
Net Sales/Income from Operations 92,923 76,171 22%EBITDA 25,470 21,437 19%EBITDA Margin1 (%) 36% 39% -Profit before Depreciation and Taxes 22,955 20,058 14%Profit before Exceptional Items 16,672 13,766 21%Profit After Taxes 13,692 11,319 21%Profit After Taxes (before Exceptional Items) 12,869 11,467 12%Profit After Taxes (before Exceptional Items & DDT) 11,333 11,663 (3)%Attributable PAT after Exceptional Items 10,342 6,958 49%Attributable PAT (before Exceptional Items) 9,561 7,127 34%Attributable PAT (before Exceptional Items & DDT) 8,025 7,323 10%Basic Earnings Per Share (`/share) 28.30 23.47 21%Basic EPS before Exceptional Items (`/share) 26.17 24.04 9%Basic EPS before Exceptional Items & DDT (`/share) 21.96 24.70 (11)%ROCE (%) 17.5 15.0 17%Total Dividend (`/share) 21.20 19.45 9%1. Excludes custom smelting at Copper India and Zinc India operations.2. Previous period figures have been regrouped/rearranged wherever necessary to conform to current period presentation.
Revenue(` crore)
EBITDA(` crore)
Dividend(` per share)
Return on Capital Employed (ROCE) (%)
2014 2015 2016 2017 2018
10,6
51
9,61
8
3,86
9
4,57
2
5,46
9
2014 2015 2016 2017 2018
17,13
9
13,0
42
17,0
61
17,8
85
13,3
49
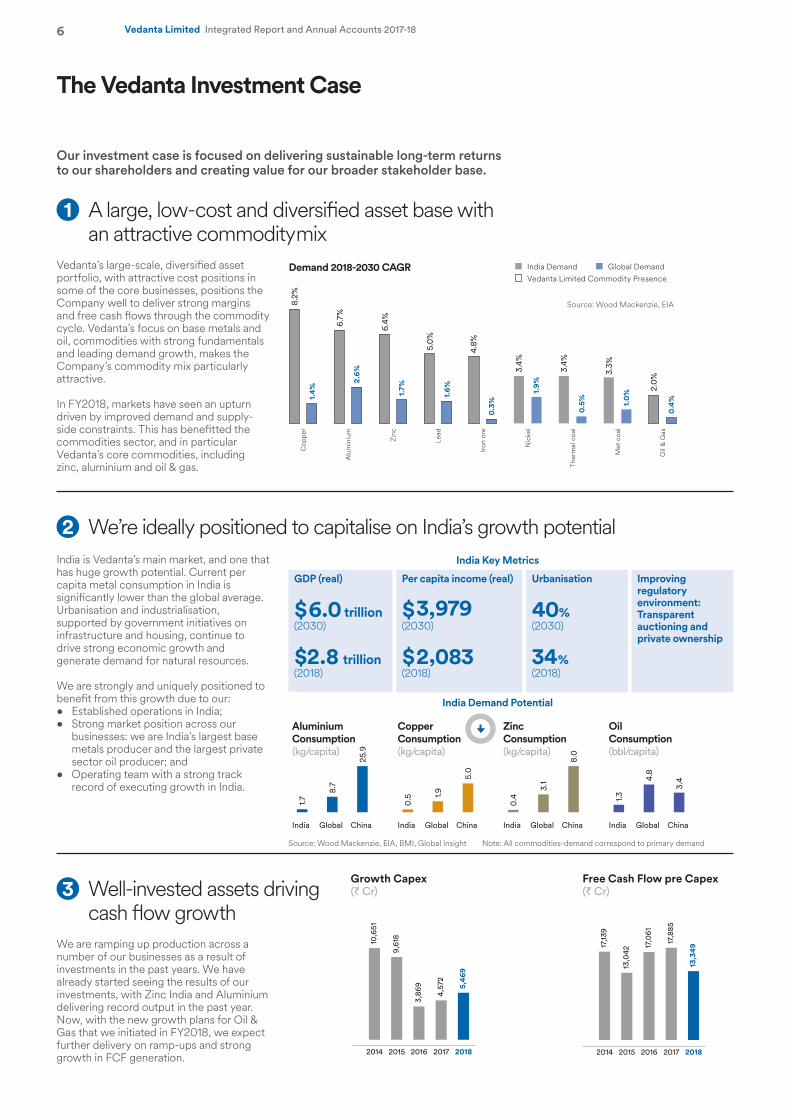
Demand 2018-2030 CAGR
8.2%
6.7%
6.4%
5.0
%
4.8%
3.4%
3.4%
3.3%
2.0
%
1.4%
2.6%
1.7%
1.6%
0.3%
1.9%
0.5% 1.
0%
0.4%
■ India Demand ■ Global Demand Vedanta Limited Commodity Presence
Cop
per
Alu
min
ium
Zin
c
Lead
Iron
ore
Nic
kel
Ther
mal
coa
l
Met
coa
l
Oil
& G
as
Source: Wood Mackenzie, EIA
6 Vedanta Limited Integrated Report and Annual Accounts 2017-18
The Vedanta Investment Case
1 A large, low-cost and diversified asset base with an attractive commodity mix
Vedanta’s large-scale, diversified asset portfolio, with attractive cost positions in some of the core businesses, positions the Company well to deliver strong margins and free cash flows through the commodity cycle. Vedanta’s focus on base metals and oil, commodities with strong fundamentals and leading demand growth, makes the Company’s commodity mix particularly attractive.
In FY2018, markets have seen an upturn driven by improved demand and supply-side constraints. This has benefitted the commodities sector, and in particular Vedanta’s core commodities, including zinc, aluminium and oil & gas.
Our investment case is focused on delivering sustainable long-term returns to our shareholders and creating value for our broader stakeholder base.
3 Well-invested assets driving cash flow growth
We are ramping up production across a number of our businesses as a result of investments in the past years. We have already started seeing the results of our investments, with Zinc India and Aluminium delivering record output in the past year. Now, with the new growth plans for Oil & Gas that we initiated in FY2018, we expect further delivery on ramp-ups and strong growth in FCF generation.
Growth Capex (` Cr)
Free Cash Flow pre Capex (` Cr)
Source: Wood Mackenzie, EIA, BMI, Global Insight Note: All commodities-demand correspond to primary demand
2 We’re ideally positioned to capitalise on India’s growth potentialIndia is Vedanta’s main market, and one that has huge growth potential. Current per capita metal consumption in India is significantly lower than the global average. Urbanisation and industrialisation, supported by government initiatives on infrastructure and housing, continue to drive strong economic growth and generate demand for natural resources.
We are strongly and uniquely positioned to benefit from this growth due to our:• Established operations in India;• Strong market position across our
businesses: we are India’s largest base metals producer and the largest private sector oil producer; and
• Operating team with a strong track record of executing growth in India.
India Demand Potential
India Key Metrics
GDP (real)
$6.0 trillion(2030)
$2.8 trillion(2018)
Urbanisation
40%(2030)
34%(2018)
Improving regulatory environment: Transparent auctioning and private ownership
India Global China
1.7
8.7
25.9
Aluminium Consumption (kg/capita)
India Global China
0.5 1.9
5.0
Copper Consumption (kg/capita)
India Global China
0.4
3.1
8.0
Zinc Consumption (kg/capita)
India Global China
1.3
4.8
3.4
OilConsumption (bbl/capita)
Per capita income (real)
$3,979(2030)
$2,083(2018)
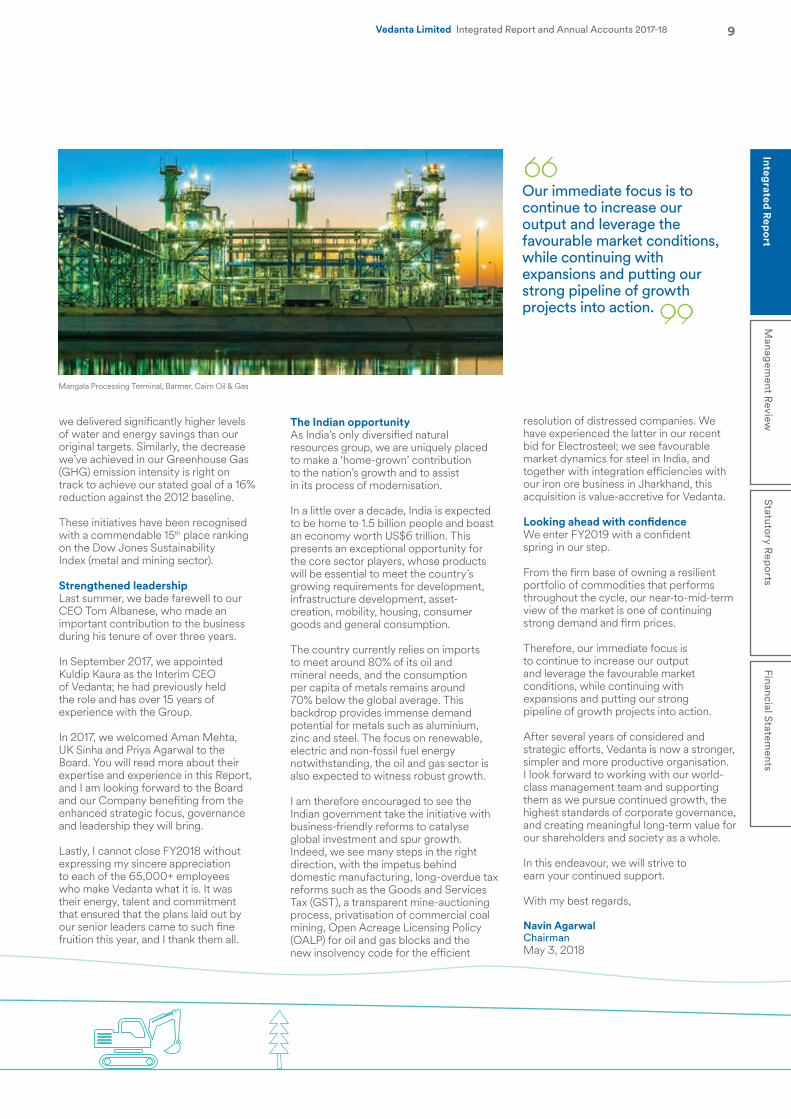
Zinc-lead Silver
7.2x or 16% CAGR
Copper Aluminium Power Iron Ore Oil & Gas
FY17FY16FY15FY14FY13FY12FY11FY10FY09FY08FY07FY06FY05FY040
500
1,000
1,500
2,000
2,500
3,000
Designcapacity
c. 55%
Cop
per
Equi
vale
nt P
rodu
ctio
n (k
t)
FY18
2014 2015 2016 2017 2018
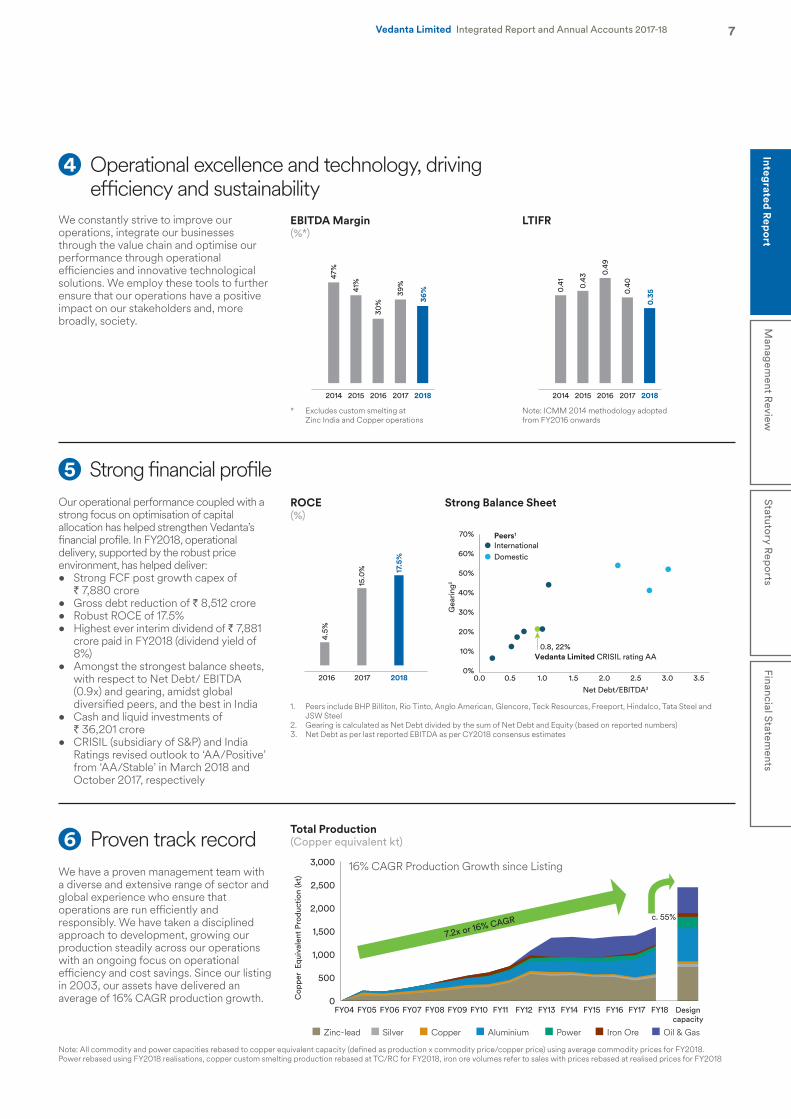
47%
41%
30%
39%
36%
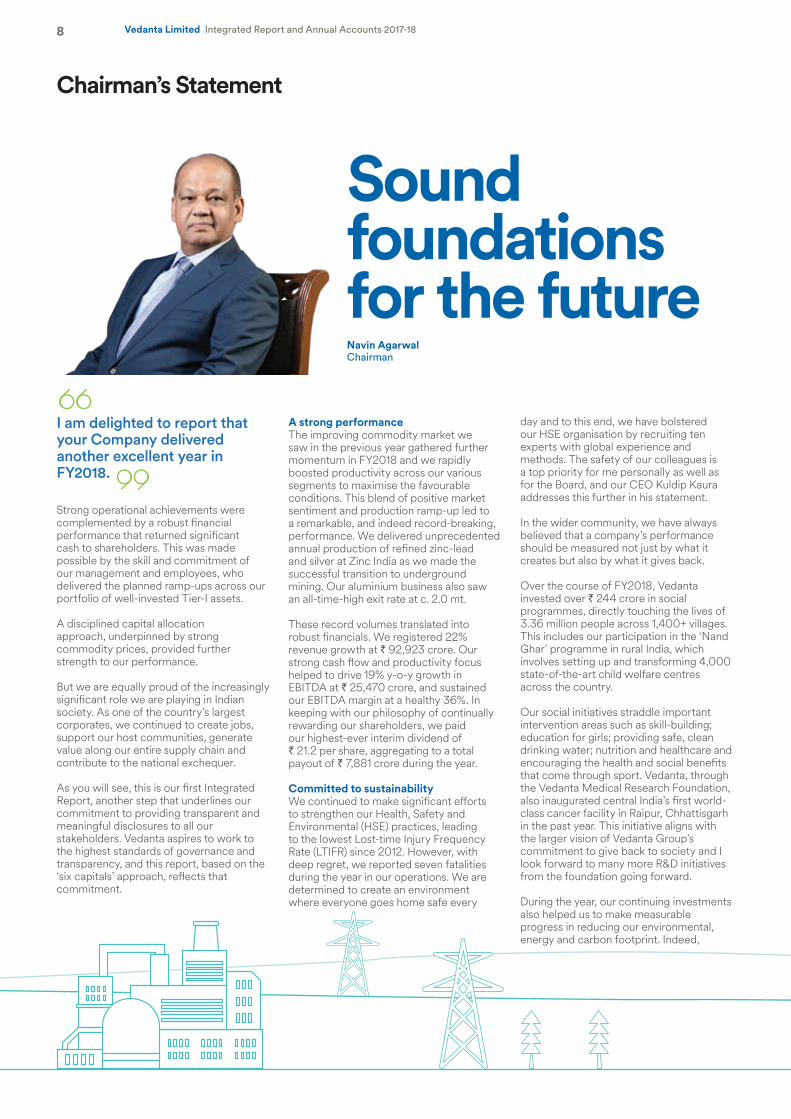
2016 2017 2018
15.
0% 17.
5%
4.5
%
2014 2015 2016 2017 2018
0.41 0.43
0.49
0.40
0.35
0.0 0.5 1.0 1.5 2.0 2.5 3.0 3.5
10%
0%
20%
30%
40%
70%
60%
50%
Gea
ring
2
Net Debt/EBITDA3
Peers1
International
Domestic
Vedanta Limited CRISIL rating AA0.8, 22%
7Integrated R
eport
Managem
ent Review
Statutory R
eports
Financial Statements
Vedanta Limited Integrated Report and Annual Accounts 2017-18
4 Operational excellence and technology, driving efficiency and sustainability
We constantly strive to improve our operations, integrate our businesses through the value chain and optimise our performance through operational efficiencies and innovative technological solutions. We employ these tools to further ensure that our operations have a positive impact on our stakeholders and, more broadly, society.
EBITDA Margin (%*)
LTIFR
* Excludes custom smelting at Zinc India and Copper operations
Note: ICMM 2014 methodology adopted from FY2016 onwards
5 Strong financial profileROCE(%)
Strong Balance SheetOur operational performance coupled with a strong focus on optimisation of capital allocation has helped strengthen Vedanta’s financial profile. In FY2018, operational delivery, supported by the robust price environment, has helped deliver:• Strong FCF post growth capex of
` 7,880 crore• Gross debt reduction of ` 8,512 crore • Robust ROCE of 17.5%• Highest ever interim dividend of ` 7,881
crore paid in FY2018 (dividend yield of 8%)
• Amongst the strongest balance sheets, with respect to Net Debt/ EBITDA (0.9x) and gearing, amidst global diversified peers, and the best in India
• Cash and liquid investments of ` 36,201 crore
• CRISIL (subsidiary of S&P) and India Ratings revised outlook to ‘AA/Positive’ from ‘AA/Stable’ in March 2018 and October 2017, respectively
1. Peers include BHP Billiton, Rio Tinto, Anglo American, Glencore, Teck Resources, Freeport, Hindalco, Tata Steel and JSW Steel
2. Gearing is calculated as Net Debt divided by the sum of Net Debt and Equity (based on reported numbers) 3. Net Debt as per last reported EBITDA as per CY2018 consensus estimates
6 Proven track recordWe have a proven management team with a diverse and extensive range of sector and global experience who ensure that operations are run efficiently and responsibly. We have taken a disciplined approach to development, growing our production steadily across our operations with an ongoing focus on operational efficiency and cost savings. Since our listing in 2003, our assets have delivered an average of 16% CAGR production growth.
Total Production(Copper equivalent kt)
16% CAGR Production Growth since Listing
Note: All commodity and power capacities rebased to copper equivalent capacity (defined as production x commodity price/copper price) using average commodity prices for FY2018. Power rebased using FY2018 realisations, copper custom smelting production rebased at TC/RC for FY2018, iron ore volumes refer to sales with prices rebased at realised prices for FY2018
8 Vedanta Limited Integrated Report and Annual Accounts 2017-18
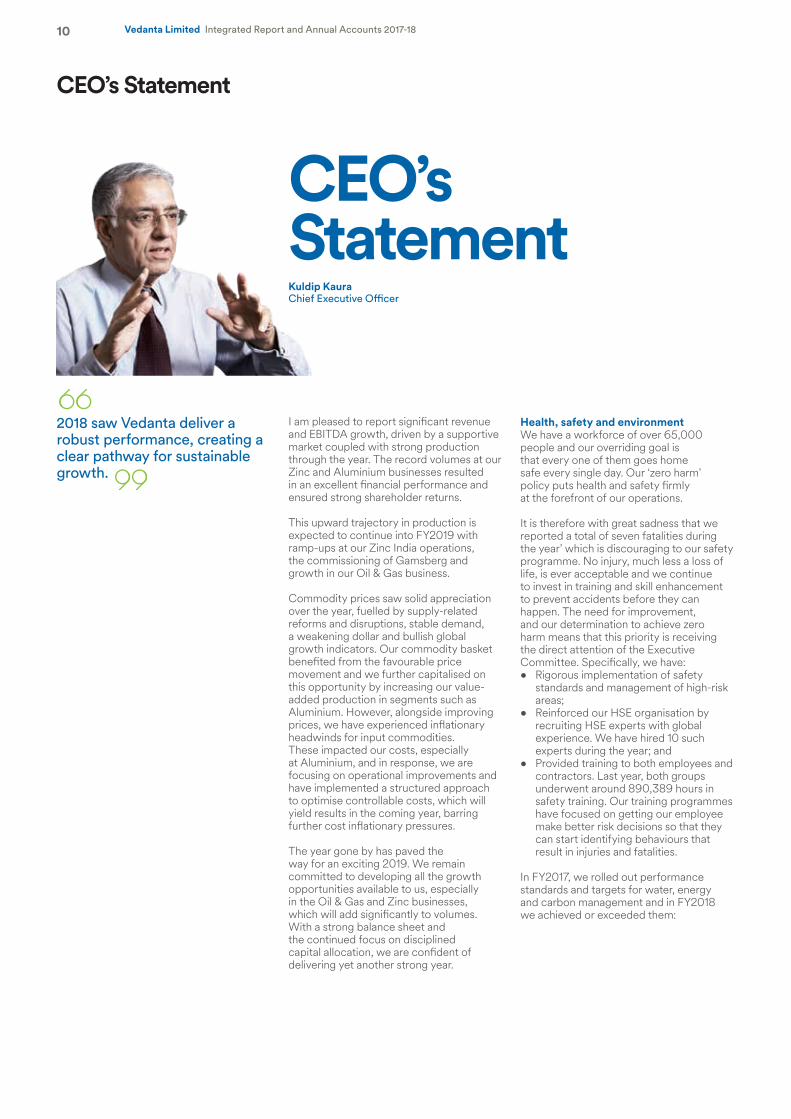
Chairman’s Statement
Sound foundations for the futureNavin AgarwalChairman
I am delighted to report that your Company delivered another excellent year in FY2018.
A strong performanceThe improving commodity market we saw in the previous year gathered further momentum in FY2018 and we rapidly boosted productivity across our various segments to maximise the favourable conditions. This blend of positive market sentiment and production ramp-up led to a remarkable, and indeed record-breaking, performance. We delivered unprecedented annual production of refined zinc-lead and silver at Zinc India as we made the successful transition to underground mining. Our aluminium business also saw an all-time-high exit rate at c. 2.0 mt.
These record volumes translated into robust financials. We registered 22% revenue growth at ` 92,923 crore. Our strong cash flow and productivity focus helped to drive 19% y-o-y growth in EBITDA at ` 25,470 crore, and sustained our EBITDA margin at a healthy 36%. In keeping with our philosophy of continually rewarding our shareholders, we paid our highest-ever interim dividend of ` 21.2 per share, aggregating to a total payout of ` 7,881 crore during the year.
Committed to sustainabilityWe continued to make significant efforts to strengthen our Health, Safety and Environmental (HSE) practices, leading to the lowest Lost-time Injury Frequency Rate (LTIFR) since 2012. However, with deep regret, we reported seven fatalities during the year in our operations. We are determined to create an environment where everyone goes home safe every
Strong operational achievements were complemented by a robust financial performance that returned significant cash to shareholders. This was made possible by the skill and commitment of our management and employees, who delivered the planned ramp-ups across our portfolio of well-invested Tier-I assets.
A disciplined capital allocation approach, underpinned by strong commodity prices, provided further strength to our performance.
But we are equally proud of the increasingly significant role we are playing in Indian society. As one of the country’s largest corporates, we continued to create jobs, support our host communities, generate value along our entire supply chain and contribute to the national exchequer.
As you will see, this is our first Integrated Report, another step that underlines our commitment to providing transparent and meaningful disclosures to all our stakeholders. Vedanta aspires to work to the highest standards of governance and transparency, and this report, based on the ‘six capitals’ approach, reflects that commitment.
day and to this end, we have bolstered our HSE organisation by recruiting ten experts with global experience and methods. The safety of our colleagues is a top priority for me personally as well as for the Board, and our CEO Kuldip Kaura addresses this further in his statement.
In the wider community, we have always believed that a company’s performance should be measured not just by what it creates but also by what it gives back.
Over the course of FY2018, Vedanta invested over ` 244 crore in social programmes, directly touching the lives of 3.36 million people across 1,400+ villages. This includes our participation in the ‘Nand Ghar’ programme in rural India, which involves setting up and transforming 4,000 state-of-the-art child welfare centres across the country.
Our social initiatives straddle important intervention areas such as skill-building; education for girls; providing safe, clean drinking water; nutrition and healthcare and encouraging the health and social benefits that come through sport. Vedanta, through the Vedanta Medical Research Foundation, also inaugurated central India’s first world-class cancer facility in Raipur, Chhattisgarh in the past year. This initiative aligns with the larger vision of Vedanta Group’s commitment to give back to society and I look forward to many more R&D initiatives from the foundation going forward.
During the year, our continuing investments also helped us to make measurable progress in reducing our environmental, energy and carbon footprint. Indeed,
9Integrated R
eport
Managem
ent Review
Statutory R
eports
Financial Statements
Vedanta Limited Integrated Report and Annual Accounts 2017-18
The Indian opportunityAs India’s only diversified natural resources group, we are uniquely placed to make a ‘home-grown’ contribution to the nation’s growth and to assist in its process of modernisation.
In a little over a decade, India is expected to be home to 1.5 billion people and boast an economy worth US$6 trillion. This presents an exceptional opportunity for the core sector players, whose products will be essential to meet the country’s growing requirements for development, infrastructure development, asset-creation, mobility, housing, consumer goods and general consumption.
The country currently relies on imports to meet around 80% of its oil and mineral needs, and the consumption per capita of metals remains around 70% below the global average. This backdrop provides immense demand potential for metals such as aluminium, zinc and steel. The focus on renewable, electric and non-fossil fuel energy notwithstanding, the oil and gas sector is also expected to witness robust growth.
I am therefore encouraged to see the Indian government take the initiative with business-friendly reforms to catalyse global investment and spur growth. Indeed, we see many steps in the right direction, with the impetus behind domestic manufacturing, long-overdue tax reforms such as the Goods and Services Tax (GST), a transparent mine-auctioning process, privatisation of commercial coal mining, Open Acreage Licensing Policy (OALP) for oil and gas blocks and the new insolvency code for the efficient
we delivered significantly higher levels of water and energy savings than our original targets. Similarly, the decrease we’ve achieved in our Greenhouse Gas (GHG) emission intensity is right on track to achieve our stated goal of a 16% reduction against the 2012 baseline.
These initiatives have been recognised with a commendable 15th place ranking on the Dow Jones Sustainability Index (metal and mining sector).
Strengthened leadershipLast summer, we bade farewell to our CEO Tom Albanese, who made an important contribution to the business during his tenure of over three years.
In September 2017, we appointed Kuldip Kaura as the Interim CEO of Vedanta; he had previously held the role and has over 15 years of experience with the Group.
In 2017, we welcomed Aman Mehta, UK Sinha and Priya Agarwal to the Board. You will read more about their expertise and experience in this Report, and I am looking forward to the Board and our Company benefiting from the enhanced strategic focus, governance and leadership they will bring.
Lastly, I cannot close FY2018 without expressing my sincere appreciation to each of the 65,000+ employees who make Vedanta what it is. It was their energy, talent and commitment that ensured that the plans laid out by our senior leaders came to such fine fruition this year, and I thank them all.
resolution of distressed companies. We have experienced the latter in our recent bid for Electrosteel; we see favourable market dynamics for steel in India, and together with integration efficiencies with our iron ore business in Jharkhand, this acquisition is value-accretive for Vedanta.
Looking ahead with confidenceWe enter FY2019 with a confident spring in our step.
From the firm base of owning a resilient portfolio of commodities that performs throughout the cycle, our near-to-mid-term view of the market is one of continuing strong demand and firm prices.
Therefore, our immediate focus is to continue to increase our output and leverage the favourable market conditions, while continuing with expansions and putting our strong pipeline of growth projects into action.
After several years of considered and strategic efforts, Vedanta is now a stronger, simpler and more productive organisation. I look forward to working with our world-class management team and supporting them as we pursue continued growth, the highest standards of corporate governance, and creating meaningful long-term value for our shareholders and society as a whole.
In this endeavour, we will strive to earn your continued support.
With my best regards,
Navin AgarwalChairmanMay 3, 2018
Our immediate focus is to continue to increase our output and leverage the favourable market conditions, while continuing with expansions and putting our strong pipeline of growth projects into action.
Mangala Processing Terminal, Barmer, Cairn Oil & Gas
10 Vedanta Limited Integrated Report and Annual Accounts 2017-18
CEO’s Statement
CEO’s StatementKuldip KauraChief Executive Officer
2018 saw Vedanta deliver a robust performance, creating a clear pathway for sustainable growth.
I am pleased to report significant revenue and EBITDA growth, driven by a supportive market coupled with strong production through the year. The record volumes at our Zinc and Aluminium businesses resulted in an excellent financial performance and ensured strong shareholder returns.
This upward trajectory in production is expected to continue into FY2019 with ramp-ups at our Zinc India operations, the commissioning of Gamsberg and growth in our Oil & Gas business.
Commodity prices saw solid appreciation over the year, fuelled by supply-related reforms and disruptions, stable demand, a weakening dollar and bullish global growth indicators. Our commodity basket benefited from the favourable price movement and we further capitalised on this opportunity by increasing our value-added production in segments such as Aluminium. However, alongside improving prices, we have experienced inflationary headwinds for input commodities. These impacted our costs, especially at Aluminium, and in response, we are focusing on operational improvements and have implemented a structured approach to optimise controllable costs, which will yield results in the coming year, barring further cost inflationary pressures.
The year gone by has paved the way for an exciting 2019. We remain committed to developing all the growth opportunities available to us, especially in the Oil & Gas and Zinc businesses, which will add significantly to volumes. With a strong balance sheet and the continued focus on disciplined capital allocation, we are confident of delivering yet another strong year.
Health, safety and environmentWe have a workforce of over 65,000 people and our overriding goal is that every one of them goes home safe every single day. Our ‘zero harm’ policy puts health and safety firmly at the forefront of our operations.
It is therefore with great sadness that we reported a total of seven fatalities during the year’ which is discouraging to our safety programme. No injury, much less a loss of life, is ever acceptable and we continue to invest in training and skill enhancement to prevent accidents before they can happen. The need for improvement, and our determination to achieve zero harm means that this priority is receiving the direct attention of the Executive Committee. Specifically, we have:• Rigorous implementation of safety
standards and management of high-risk areas;
• Reinforced our HSE organisation by recruiting HSE experts with global experience. We have hired 10 such experts during the year; and
• Provided training to both employees and contractors. Last year, both groups underwent around 890,389 hours in safety training. Our training programmes have focused on getting our employee make better risk decisions so that they can start identifying behaviours that result in injuries and fatalities.
In FY2017, we rolled out performance standards and targets for water, energy and carbon management and in FY2018 we achieved or exceeded them:
11Integrated R
eport
Managem
ent Review
Statutory R
eports
Financial Statements
Vedanta Limited Integrated Report and Annual Accounts 2017-18
1 Reduction expectations are calculated on GHG/tonne of product to ensure that non-production related factors such as change in prices do not influence the GHG numbers and as a result, they are a reflection of actual efficiency gains in the system
FY2018: A productive yearAt Vedanta, our portfolio ranks alongside some of the best Tier-I assets in the world. In FY2018, we displayed our ability to deliver record production across those assets while maintaining our place in the lower half of the cost curve across most of our businesses.
At Zinc India, record production exceeded our guidance for the year, with Rampura Agucha successfully transitioning to underground production. Record silver production also surpassed our original guidance with excellent output at Sindesar Khurd.
Record production also continued at Copper India and in Aluminium, where we exited with a run rate of around 2 mt.
However, our strong progress in increasing volumes was to some extent offset by rising raw material input costs, in particular, for coal and alumina. We are actively engaging in enhancing operating efficiencies, by producing more captive alumina, achieving better materialisation of coal linkages and thereby working towards reducing the controllable costs.
At Goa, our iron ore operations are currently shut down. The Honourable Supreme Court of India directed the halting of all mining operations in the state, effective March 16, 2018, pending the granting of fresh mining leases and environmental clearances. Given our commitment in the region and the considerable impact on the local economy, we hope that the Government
• We achieved 140% of our water savings target, saving 1.3 million m3 of water.
• We surpassed our energy savings target, achieving to 280% (2.44 mn GJ) of the savings expected.
• Last year, we stated that we had targeted reducing our GHG intensity by 16%1 by 2020, from a 2012 baseline. I am pleased to inform you that nearly two years before the target date, we are already at 14% and have built real momentum towards achieving our goal.
This is part of a wider aim to see our businesses continue to improve their sustainability practices. On the Dow Jones Sustainability Index for the Metal & Mining sector, Hindustan Zinc improved its overall ranking to 11th and was inducted into the prestigious Dow Jones Yearbook. In the Environmental Category, Hindustan Zinc moved from the 11th to the 3rd place and Vedanta Limited improved its ranking from 17th to 15th.
will provide clarity around the process to apply for the licences and facilitate restarting operations as soon as possible. Due to the uncertainty around this process, the Company has taken an impairment of ` 1,726 crore in FY2018.
At Tuticorin, our copper smelting operations were shut at the end of March, initially for scheduled maintenance activities. The shutdown has since been extended as the Company’s annual renewal of its consent to operate was rejected by the Tamil Nadu State Pollution Control Board, pending additional clarifications. The Company is working with the relevant regulatory authorities to expedite the restart of the operations.
Our growth agendaThis year, we also invested significantly in the next phase of our growth and have made delivering on our various growth opportunities a strategic priority as detailed below:
• Oil & Gas: Our vision is to contribute 50% of the country’s domestic crude oil production by increasing our gross production to 500,000 boepd. Working towards this goal, we announced growth projects, including Enhanced Oil Recovery (EOR), tight oil and gas projects, upgrade of liquid-handling facilities and exploration, for which key contracts have been awarded to world-class partners. These projects, along with an exit run rate of 200,000 boepd in March 2018, will pave the way to achieve 300,000 boepd in the near-term and 500,000 boepd in the medium-term.
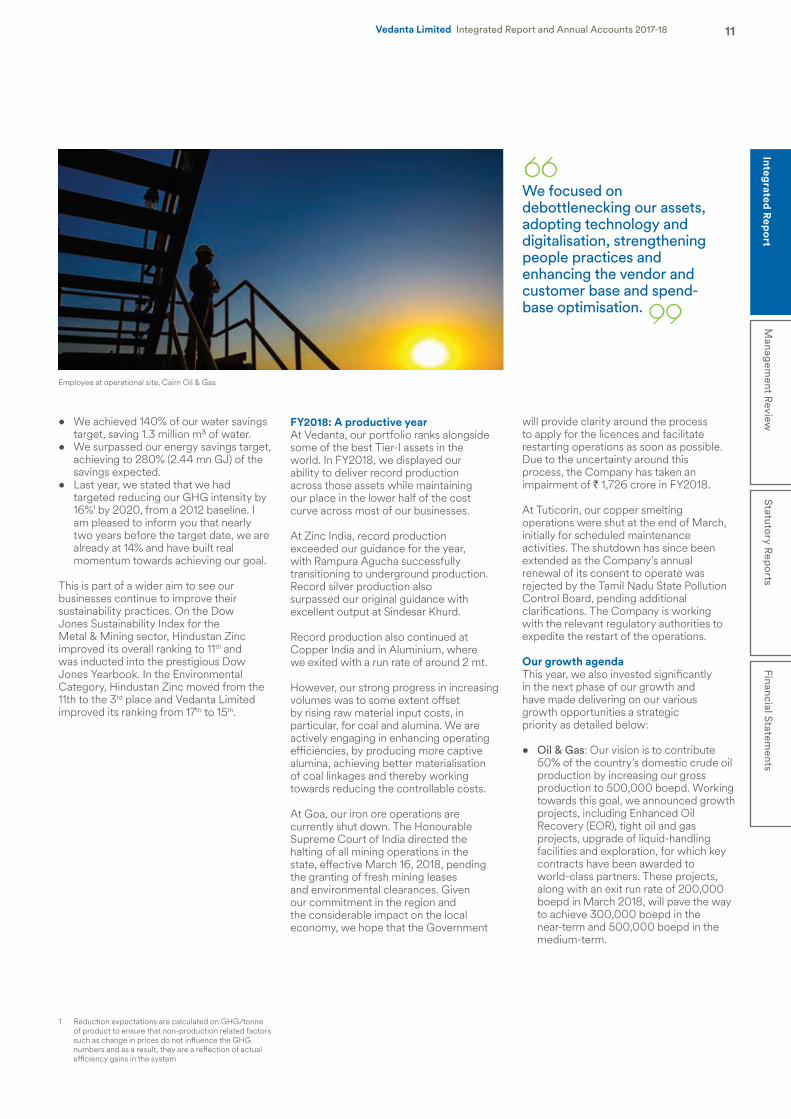
We focused on debottlenecking our assets, adopting technology and digitalisation, strengthening people practices and enhancing the vendor and customer base and spend-base optimisation.
Employee at operational site, Cairn Oil & Gas
12 Vedanta Limited Integrated Report and Annual Accounts 2017-18
• Zinc: Our current expansion will take us to over 1.5 mtpa of zinc production with Zinc India ramping up to 1.2 mt and Gamsberg to 250 kt in the near-term. Our expanding reserve and resource base at both Zinc India and Gamsberg provides us with an opportunity to increase production beyond this level to about 2 mt in the medium-term. With this in mind, the Zinc India board has approved the expansion from 1.2 mt to 1.35 mt and corresponding silver production potential of over 900 tonnes.
• Aluminium: We achieved a record run-rate of 2 mt as we exited the year and are now focused on delivering a steady production of 2 mt. We also hope to proceed with the expansion of the Lanjigarh refinery, subject to further clarity on bauxite supply.
• Copper: We are continuing our Tuticorin II expansion by 400 ktpa. When complete (target: FY2020), we will be one of the world’s largest single-location copper smelters.
• We moved to acquire Electrosteel towards the end of the year and this is now subject to regulatory approvals. We see favourable market dynamics for steel in India and, together with integration efficiencies with our iron ore business, we regard this acquisition as value-accretive for Vedanta.
As we deliver on growth across our various businesses, we continue to maintain our disciplined approach to investment: potential projects will be evaluated against a range of metrics, including operational and technical factors, pricing and market considerations and robust return on capital.
Deleveraging and strengthening our balance sheetIn FY2018, we also delivered on our strategic priority to deleverage our balance sheet, with a reduction of gross debt at Vedanta Limited by ` 8,512 crore as a
result of strong cash flows and productive utilisation of cash and investment balances.
However, increased shareholder returns at both Hindustan Zinc and Vedanta Limited, and the corresponding tax and dividend outflow, resulted in higher net debt. This year, a strategic priority will be to optimise capital allocation and strengthen our balance sheet through strong business cash flows.
During the year, we delivered a ROCE of 17.5% as compared to 15% last year. Vedanta’s balance sheet is amongst the strongest amidst global diversified peers and the best in India, with respect to ND / EBITDA and gearing. We were pleased to see our rating outlook improve from ‘stable’ to ‘positive’ (by CRISIL, an S&P company) and India Ratings provided a current rating of ‘AA/Positive’.
Operational excellenceIn FY2018, we also delivered on our strategic priority of asset optimisation. We focused on debottlenecking our assets, adopting technology and digitalisation, strengthening people practices and enhancing the vendor and customer base and spend-base optimisation. We are making concerted efforts to drive all-round operational excellence, benchmarking our operations with global leaders to
CEO’s Statement continued
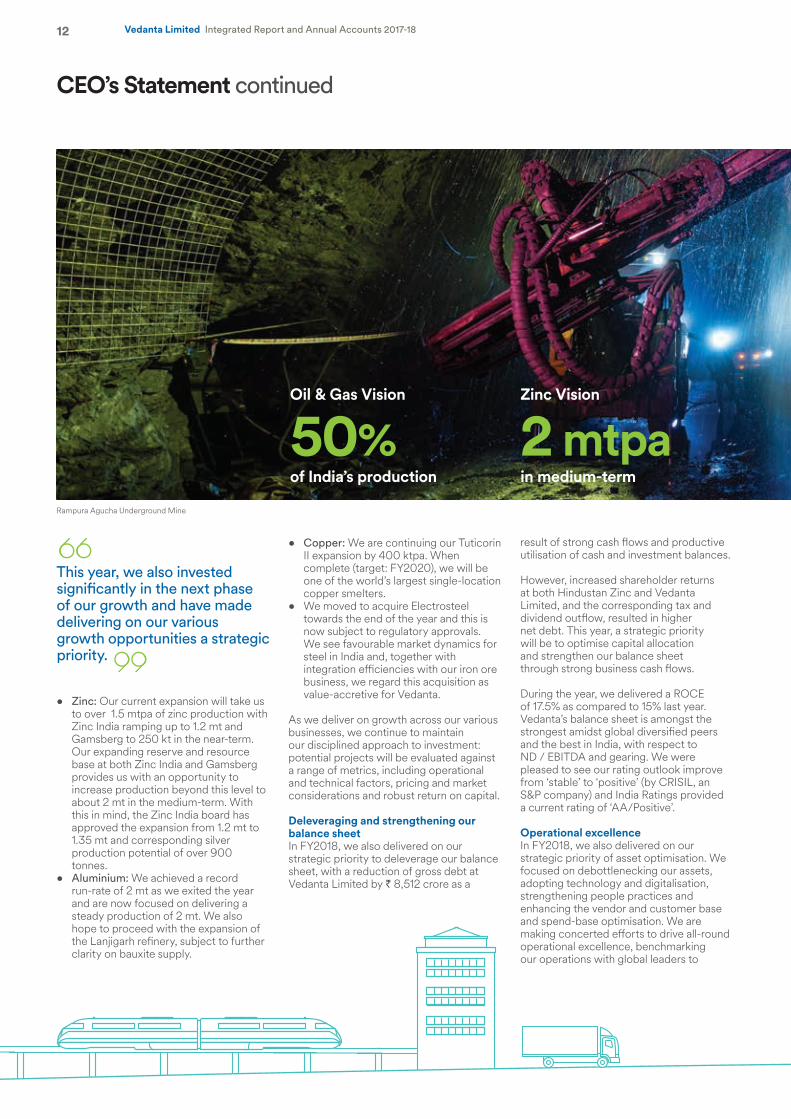
This year, we also invested significantly in the next phase of our growth and have made delivering on our various growth opportunities a strategic priority.
Oil & Gas Vision
50%of India’s production
Zinc Vision
2 mtpain medium-term
Rampura Agucha Underground Mine
13Integrated R
eport
Managem
ent Review
Statutory R
eports
Financial Statements
Vedanta Limited Integrated Report and Annual Accounts 2017-18
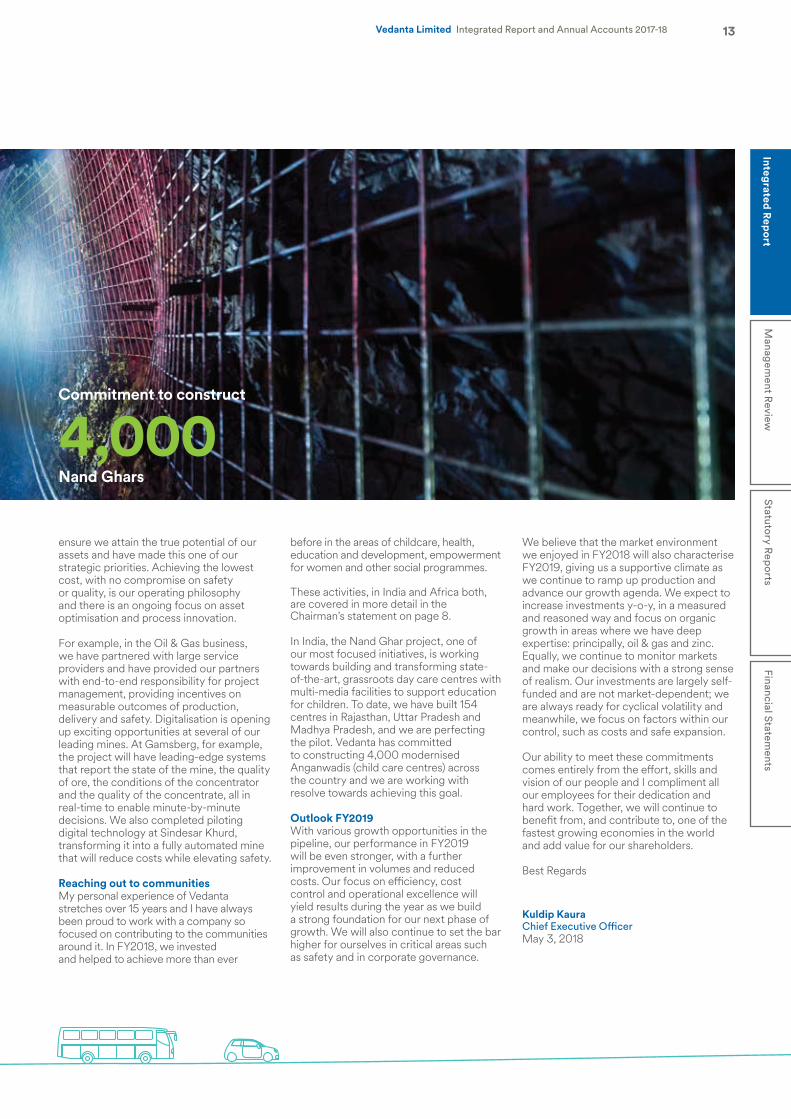
Commitment to construct
4,000Nand Ghars
ensure we attain the true potential of our assets and have made this one of our strategic priorities. Achieving the lowest cost, with no compromise on safety or quality, is our operating philosophy and there is an ongoing focus on asset optimisation and process innovation.
For example, in the Oil & Gas business, we have partnered with large service providers and have provided our partners with end-to-end responsibility for project management, providing incentives on measurable outcomes of production, delivery and safety. Digitalisation is opening up exciting opportunities at several of our leading mines. At Gamsberg, for example, the project will have leading-edge systems that report the state of the mine, the quality of ore, the conditions of the concentrator and the quality of the concentrate, all in real-time to enable minute-by-minute decisions. We also completed piloting digital technology at Sindesar Khurd, transforming it into a fully automated mine that will reduce costs while elevating safety.
Reaching out to communitiesMy personal experience of Vedanta stretches over 15 years and I have always been proud to work with a company so focused on contributing to the communities around it. In FY2018, we invested and helped to achieve more than ever
before in the areas of childcare, health, education and development, empowerment for women and other social programmes.
These activities, in India and Africa both, are covered in more detail in the Chairman’s statement on page 8.
In India, the Nand Ghar project, one of our most focused initiatives, is working towards building and transforming state-of-the-art, grassroots day care centres with multi-media facilities to support education for children. To date, we have built 154 centres in Rajasthan, Uttar Pradesh and Madhya Pradesh, and we are perfecting the pilot. Vedanta has committed to constructing 4,000 modernised Anganwadis (child care centres) across the country and we are working with resolve towards achieving this goal.
Outlook FY2019With various growth opportunities in the pipeline, our performance in FY2019 will be even stronger, with a further improvement in volumes and reduced costs. Our focus on efficiency, cost control and operational excellence will yield results during the year as we build a strong foundation for our next phase of growth. We will also continue to set the bar higher for ourselves in critical areas such as safety and in corporate governance.
We believe that the market environment we enjoyed in FY2018 will also characterise FY2019, giving us a supportive climate as we continue to ramp up production and advance our growth agenda. We expect to increase investments y-o-y, in a measured and reasoned way and focus on organic growth in areas where we have deep expertise: principally, oil & gas and zinc. Equally, we continue to monitor markets and make our decisions with a strong sense of realism. Our investments are largely self-funded and are not market-dependent; we are always ready for cyclical volatility and meanwhile, we focus on factors within our control, such as costs and safe expansion.
Our ability to meet these commitments comes entirely from the effort, skills and vision of our people and I compliment all our employees for their dedication and hard work. Together, we will continue to benefit from, and contribute to, one of the fastest growing economies in the world and add value for our shareholders.
Best Regards
Kuldip KauraChief Executive OfficerMay 3, 2018
14 Vedanta Limited Integrated Report and Annual Accounts 2017-18
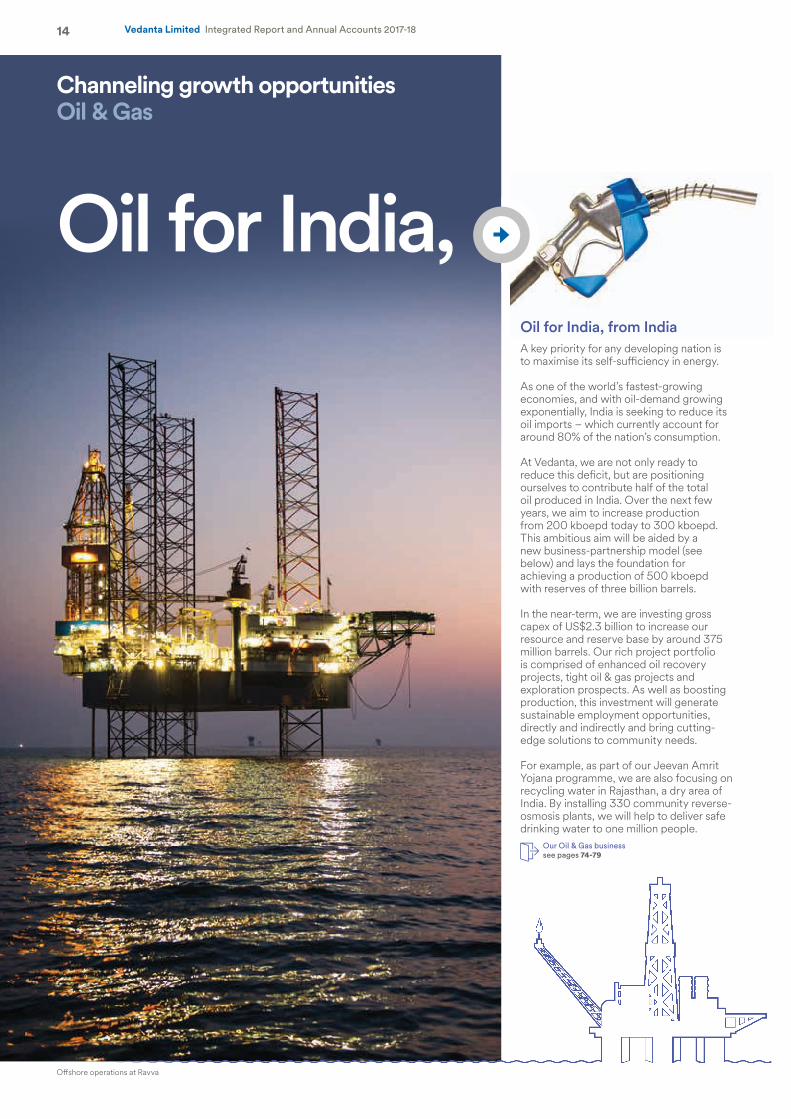
Oil for India,Oil for India, from IndiaA key priority for any developing nation is to maximise its self-sufficiency in energy.
As one of the world’s fastest-growing economies, and with oil-demand growing exponentially, India is seeking to reduce its oil imports – which currently account for around 80% of the nation’s consumption.
At Vedanta, we are not only ready to reduce this deficit, but are positioning ourselves to contribute half of the total oil produced in India. Over the next few years, we aim to increase production from 200 kboepd today to 300 kboepd. This ambitious aim will be aided by a new business-partnership model (see below) and lays the foundation for achieving a production of 500 kboepd with reserves of three billion barrels.
In the near-term, we are investing gross capex of US$2.3 billion to increase our resource and reserve base by around 375 million barrels. Our rich project portfolio is comprised of enhanced oil recovery projects, tight oil & gas projects and exploration prospects. As well as boosting production, this investment will generate sustainable employment opportunities, directly and indirectly and bring cutting-edge solutions to community needs.
For example, as part of our Jeevan Amrit Yojana programme, we are also focusing on recycling water in Rajasthan, a dry area of India. By installing 330 community reverse-osmosis plants, we will help to deliver safe drinking water to one million people.
Our Oil & Gas business see pages 74-79
Offshore operations at Ravva
Channeling growth opportunitiesOil & Gas
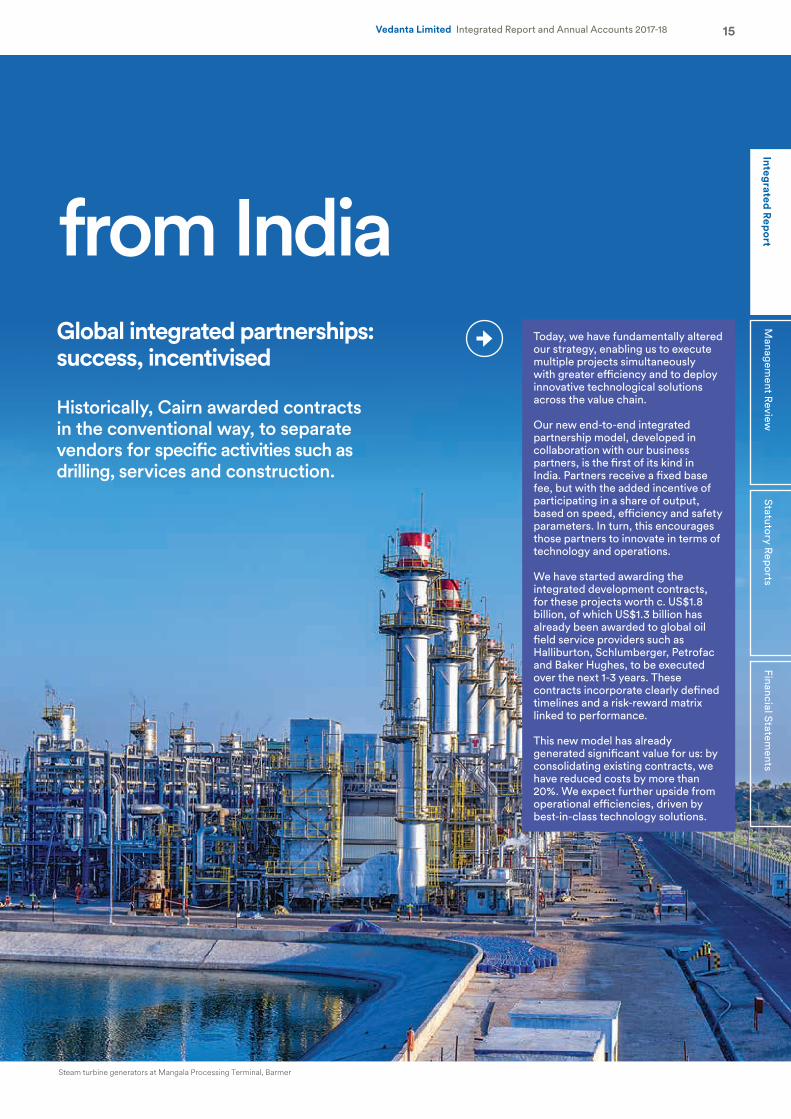
Today, we have fundamentally altered our strategy, enabling us to execute multiple projects simultaneously with greater efficiency and to deploy innovative technological solutions across the value chain.
Our new end-to-end integrated partnership model, developed in collaboration with our business partners, is the first of its kind in India. Partners receive a fixed base fee, but with the added incentive of participating in a share of output, based on speed, efficiency and safety parameters. In turn, this encourages those partners to innovate in terms of technology and operations.
We have started awarding the integrated development contracts, for these projects worth c. US$1.8 billion, of which US$1.3 billion has already been awarded to global oil field service providers such as Halliburton, Schlumberger, Petrofac and Baker Hughes, to be executed over the next 1-3 years. These contracts incorporate clearly defined timelines and a risk-reward matrix linked to performance.
This new model has already generated significant value for us: by consolidating existing contracts, we have reduced costs by more than 20%. We expect further upside from operational efficiencies, driven by best-in-class technology solutions.
15Vedanta Limited Integrated Report and Annual Accounts 2017-18Financial Statem
entsStatutory R
eports
Managem
ent Review
Integrated Rep
ortfrom IndiaGlobal integrated partnerships: success, incentivised
Historically, Cairn awarded contracts in the conventional way, to separate vendors for specific activities such as drilling, services and construction.
Steam turbine generators at Mangala Processing Terminal, Barmer
16 Vedanta Limited Integrated Report and Annual Accounts 2017-18
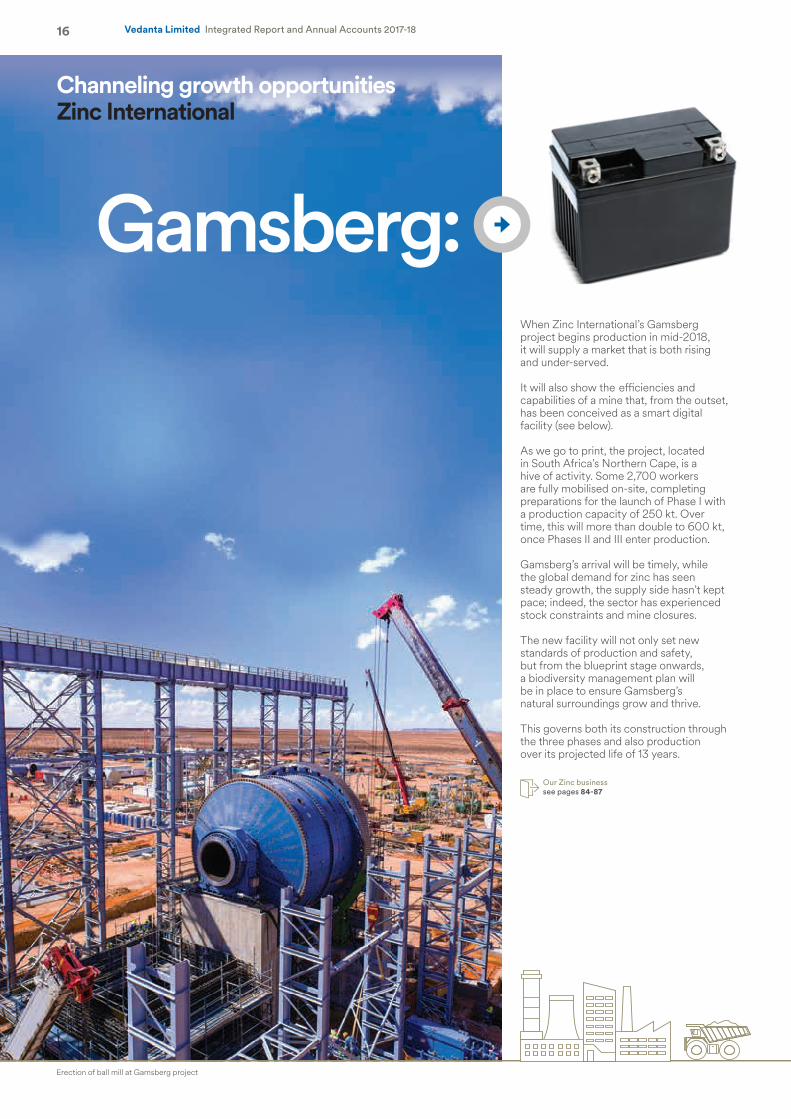
Channeling growth opportunitiesZinc International
Gamsberg: When Zinc International’s Gamsberg project begins production in mid-2018, it will supply a market that is both rising and under-served.
It will also show the efficiencies and capabilities of a mine that, from the outset, has been conceived as a smart digital facility (see below).
As we go to print, the project, located in South Africa’s Northern Cape, is a hive of activity. Some 2,700 workers are fully mobilised on-site, completing preparations for the launch of Phase I with a production capacity of 250 kt. Over time, this will more than double to 600 kt, once Phases II and III enter production.
Gamsberg’s arrival will be timely, while the global demand for zinc has seen steady growth, the supply side hasn’t kept pace; indeed, the sector has experienced stock constraints and mine closures.
The new facility will not only set new standards of production and safety, but from the blueprint stage onwards, a biodiversity management plan will be in place to ensure Gamsberg’s natural surroundings grow and thrive.
This governs both its construction through the three phases and also production over its projected life of 13 years.
Our Zinc business see pages 84-87
Erection of ball mill at Gamsberg project
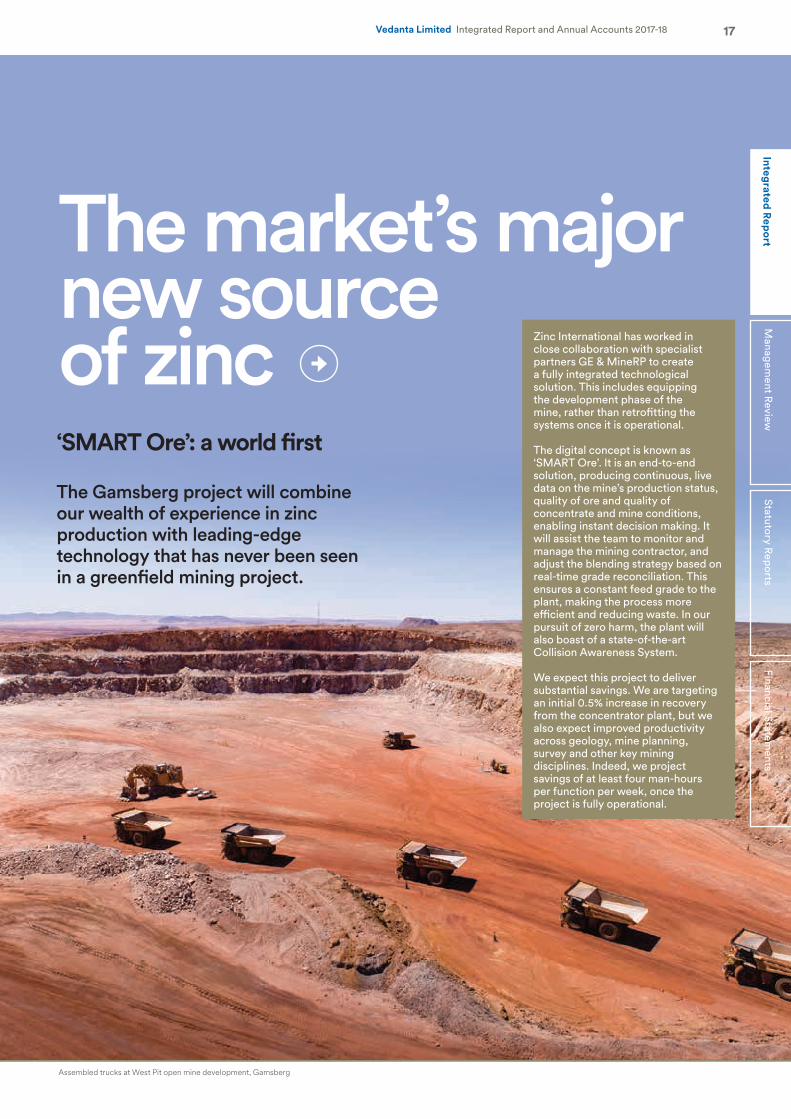
Zinc International has worked in close collaboration with specialist partners GE & MineRP to create a fully integrated technological solution. This includes equipping the development phase of the mine, rather than retrofitting the systems once it is operational.
The digital concept is known as ‘SMART Ore’. It is an end-to-end solution, producing continuous, live data on the mine’s production status, quality of ore and quality of concentrate and mine conditions, enabling instant decision making. It will assist the team to monitor and manage the mining contractor, and adjust the blending strategy based on real-time grade reconciliation. This ensures a constant feed grade to the plant, making the process more efficient and reducing waste. In our pursuit of zero harm, the plant will also boast of a state-of-the-art Collision Awareness System.
We expect this project to deliver substantial savings. We are targeting an initial 0.5% increase in recovery from the concentrator plant, but we also expect improved productivity across geology, mine planning, survey and other key mining disciplines. Indeed, we project savings of at least four man-hours per function per week, once the project is fully operational.
17Vedanta Limited Integrated Report and Annual Accounts 2017-18Financial Statem
entsStatutory R
eports
Managem
ent Review
Integrated Rep
ortThe market’s major new source of zinc‘SMART Ore’: a world first
The Gamsberg project will combine our wealth of experience in zinc production with leading-edge technology that has never been seen in a greenfield mining project.
Assembled trucks at West Pit open mine development, Gamsberg
18 Vedanta Limited Integrated Report and Annual Accounts 2017-18
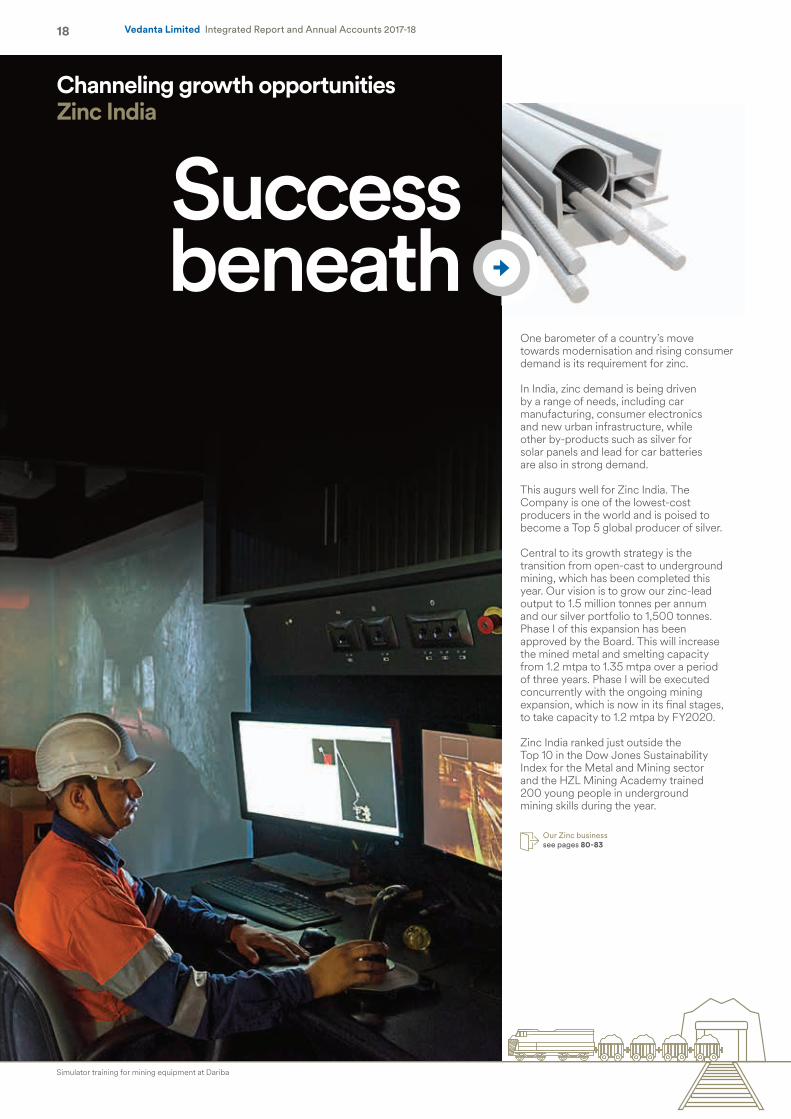
Channeling growth opportunitiesZinc India
Successbeneath
One barometer of a country’s move towards modernisation and rising consumer demand is its requirement for zinc.
In India, zinc demand is being driven by a range of needs, including car manufacturing, consumer electronics and new urban infrastructure, while other by-products such as silver for solar panels and lead for car batteries are also in strong demand.
This augurs well for Zinc India. The Company is one of the lowest-cost producers in the world and is poised to become a Top 5 global producer of silver.
Central to its growth strategy is the transition from open-cast to underground mining, which has been completed this year. Our vision is to grow our zinc-lead output to 1.5 million tonnes per annum and our silver portfolio to 1,500 tonnes. Phase I of this expansion has been approved by the Board. This will increase the mined metal and smelting capacity from 1.2 mtpa to 1.35 mtpa over a period of three years. Phase I will be executed concurrently with the ongoing mining expansion, which is now in its final stages, to take capacity to 1.2 mtpa by FY2020.
Zinc India ranked just outside the Top 10 in the Dow Jones Sustainability Index for the Metal and Mining sector and the HZL Mining Academy trained 200 young people in underground mining skills during the year.
Our Zinc business see pages 80-83
Simulator training for mining equipment at Dariba
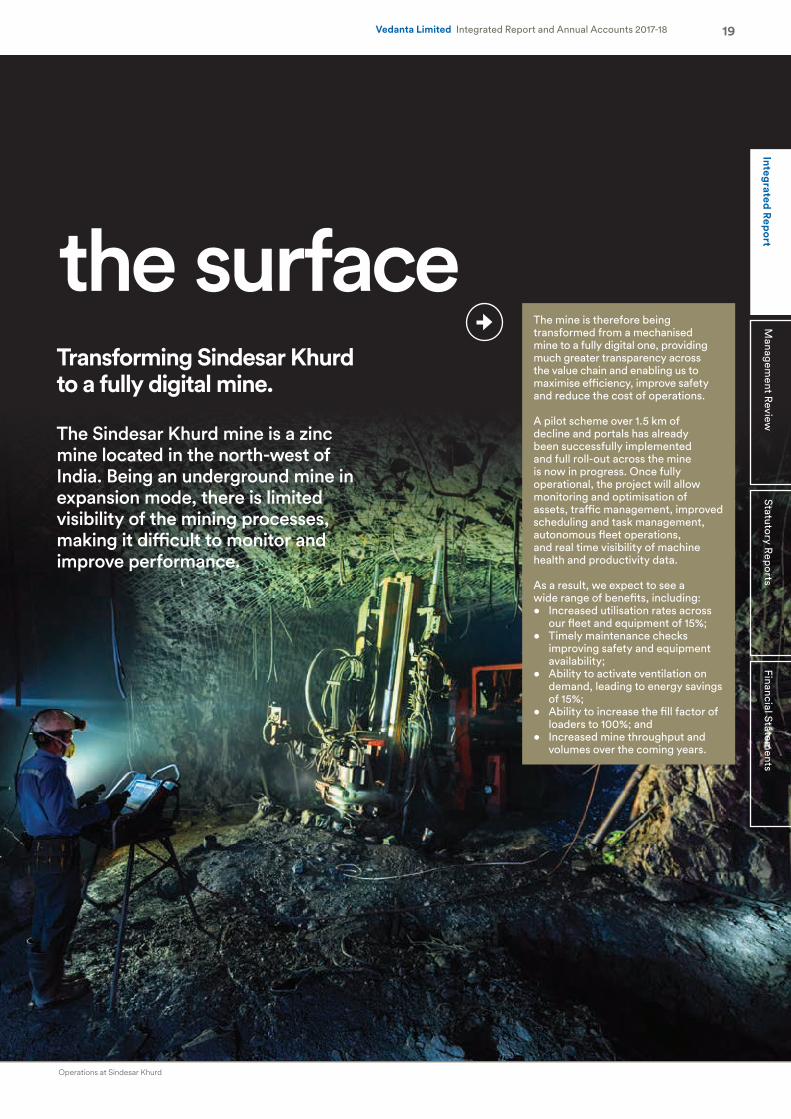
The mine is therefore being transformed from a mechanised mine to a fully digital one, providing much greater transparency across the value chain and enabling us to maximise efficiency, improve safety and reduce the cost of operations.
A pilot scheme over 1.5 km of decline and portals has already been successfully implemented and full roll-out across the mine is now in progress. Once fully operational, the project will allow monitoring and optimisation of assets, traffic management, improved scheduling and task management, autonomous fleet operations, and real time visibility of machine health and productivity data.
As a result, we expect to see a wide range of benefits, including:• Increased utilisation rates across
our fleet and equipment of 15%;• Timely maintenance checks
improving safety and equipment availability;
• Ability to activate ventilation on demand, leading to energy savings of 15%;
• Ability to increase the fill factor of loaders to 100%; and
• Increased mine throughput and volumes over the coming years.
19Vedanta Limited Integrated Report and Annual Accounts 2017-18Financial Statem
entsStatutory R
eports
Managem
ent Review
Integrated Rep
ortthe surfaceTransforming Sindesar Khurd to a fully digital mine.
The Sindesar Khurd mine is a zinc mine located in the north-west of India. Being an underground mine in expansion mode, there is limited visibility of the mining processes, making it difficult to monitor and improve performance.
Operations at Sindesar Khurd
20 Vedanta Limited Integrated Report and Annual Accounts 2017-18
Materiality matrix
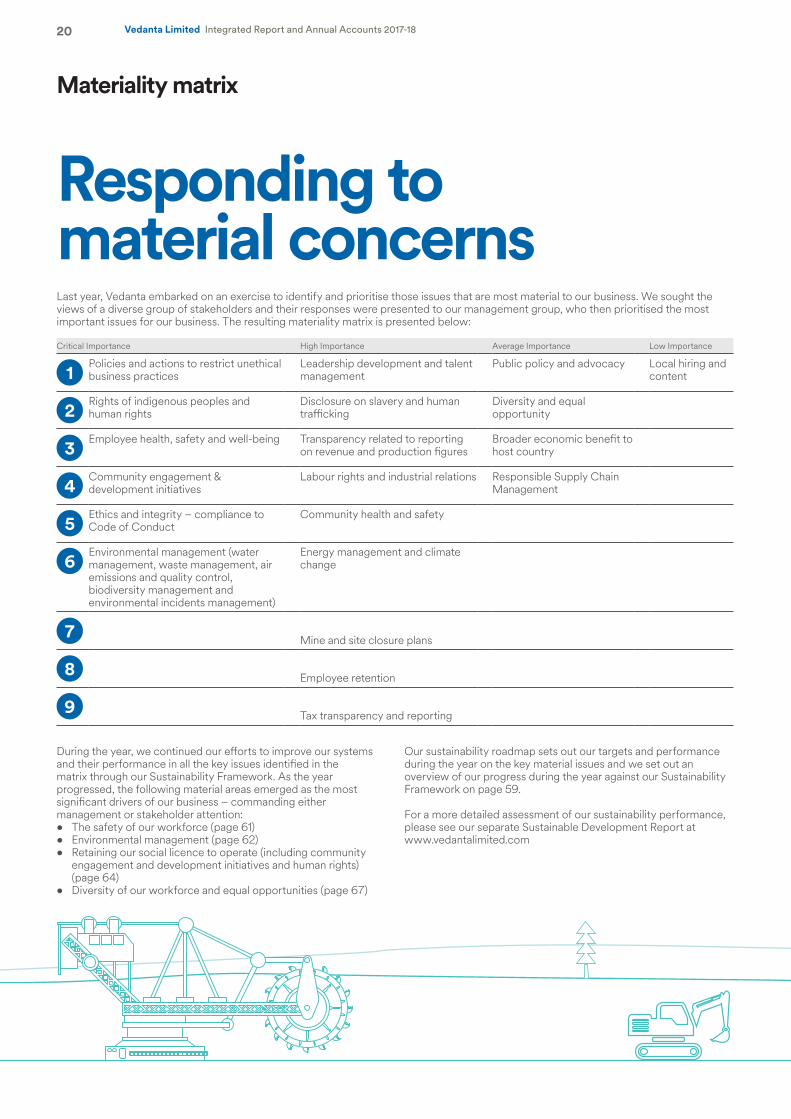
Responding to material concernsLast year, Vedanta embarked on an exercise to identify and prioritise those issues that are most material to our business. We sought the views of a diverse group of stakeholders and their responses were presented to our management group, who then prioritised the most important issues for our business. The resulting materiality matrix is presented below:
Critical Importance High Importance Average Importance Low Importance
1Policies and actions to restrict unethical business practices
Leadership development and talent management
Public policy and advocacy Local hiring and content
2Rights of indigenous peoples and human rights
Disclosure on slavery and human trafficking
Diversity and equal opportunity
3Employee health, safety and well-being Transparency related to reporting
on revenue and production figuresBroader economic benefit to host country
4Community engagement & development initiatives
Labour rights and industrial relations Responsible Supply Chain Management
5Ethics and integrity – compliance to Code of Conduct
Community health and safety
6Environmental management (water management, waste management, air emissions and quality control, biodiversity management and environmental incidents management)
Energy management and climate change
7 Mine and site closure plans
8 Employee retention
9 Tax transparency and reporting
During the year, we continued our efforts to improve our systems and their performance in all the key issues identified in the matrix through our Sustainability Framework. As the year progressed, the following material areas emerged as the most significant drivers of our business – commanding either management or stakeholder attention:• The safety of our workforce (page 61)• Environmental management (page 62)• Retaining our social licence to operate (including community
engagement and development initiatives and human rights) (page 64)
• Diversity of our workforce and equal opportunities (page 67)
Our sustainability roadmap sets out our targets and performance during the year on the key material issues and we set out an overview of our progress during the year against our Sustainability Framework on page 59.
For a more detailed assessment of our sustainability performance, please see our separate Sustainable Development Report at www.vedantalimited.com
21Vedanta Limited Integrated Report and Annual Accounts 2017-18Financial Statem
entsStatutory R
eports
Managem
ent Review
Integrated Rep
ort
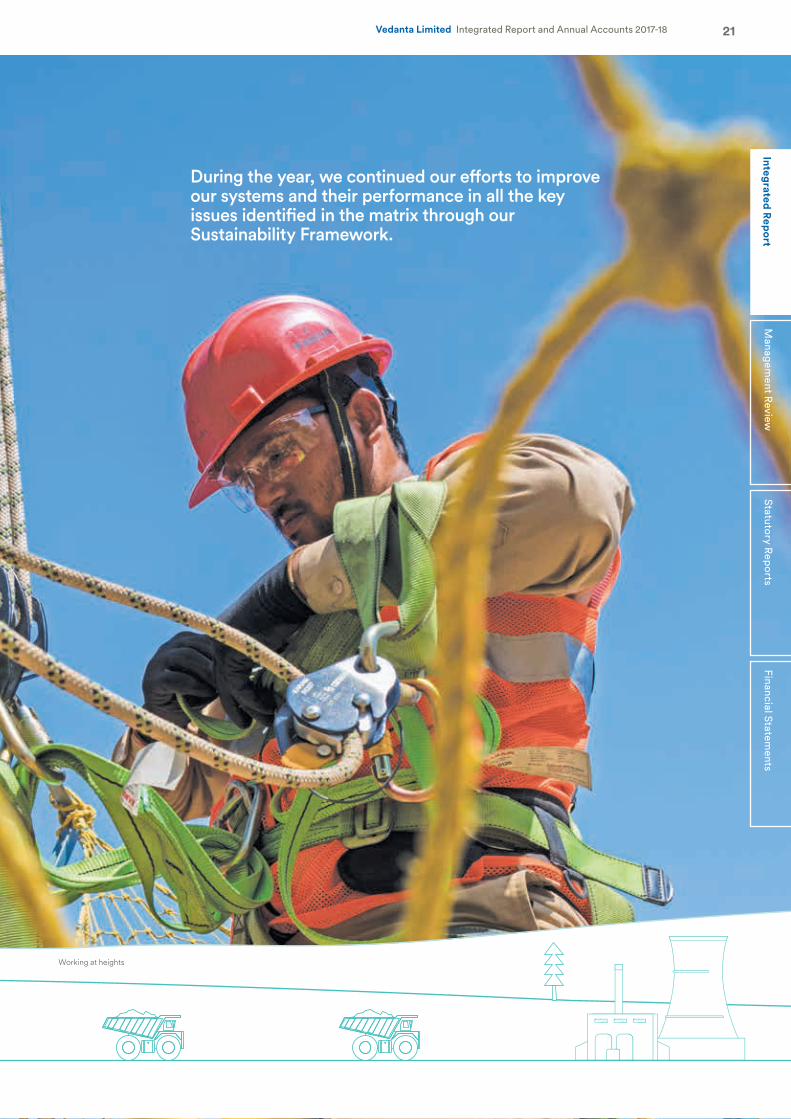
During the year, we continued our efforts to improve our systems and their performance in all the key issues identified in the matrix through our Sustainability Framework.
Working at heights
22 Vedanta Limited Integrated Report and Annual Accounts 2017-18
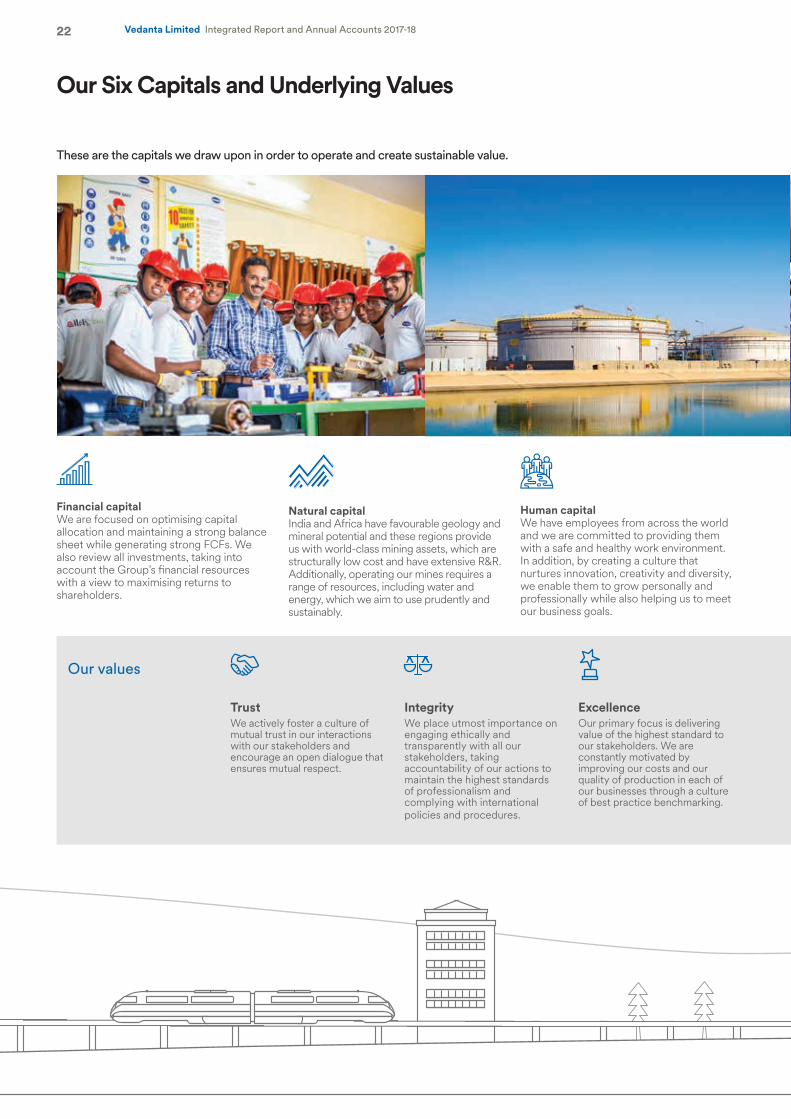
Our Six Capitals and Underlying Values
TrustWe actively foster a culture of mutual trust in our interactions with our stakeholders and encourage an open dialogue that ensures mutual respect.
IntegrityWe place utmost importance on engaging ethically and transparently with all our stakeholders, taking accountability of our actions to maintain the highest standards of professionalism and complying with international policies and procedures.
ExcellenceOur primary focus is delivering value of the highest standard to our stakeholders. We are constantly motivated by improving our costs and our quality of production in each of our businesses through a culture of best practice benchmarking.
Our values
Financial capitalWe are focused on optimising capital allocation and maintaining a strong balance sheet while generating strong FCFs. We also review all investments, taking into account the Group’s financial resources with a view to maximising returns to shareholders.
Natural capitalIndia and Africa have favourable geology and mineral potential and these regions provide us with world-class mining assets, which are structurally low cost and have extensive R&R. Additionally, operating our mines requires a range of resources, including water and energy, which we aim to use prudently and sustainably.
Human capitalWe have employees from across the world and we are committed to providing them with a safe and healthy work environment. In addition, by creating a culture that nurtures innovation, creativity and diversity, we enable them to grow personally and professionally while also helping us to meet our business goals.
These are the capitals we draw upon in order to operate and create sustainable value.
23Integrated R
eport
Managem
ent Review
Statutory R
eports
Financial Statements
Vedanta Limited Integrated Report and Annual Accounts 2017-18
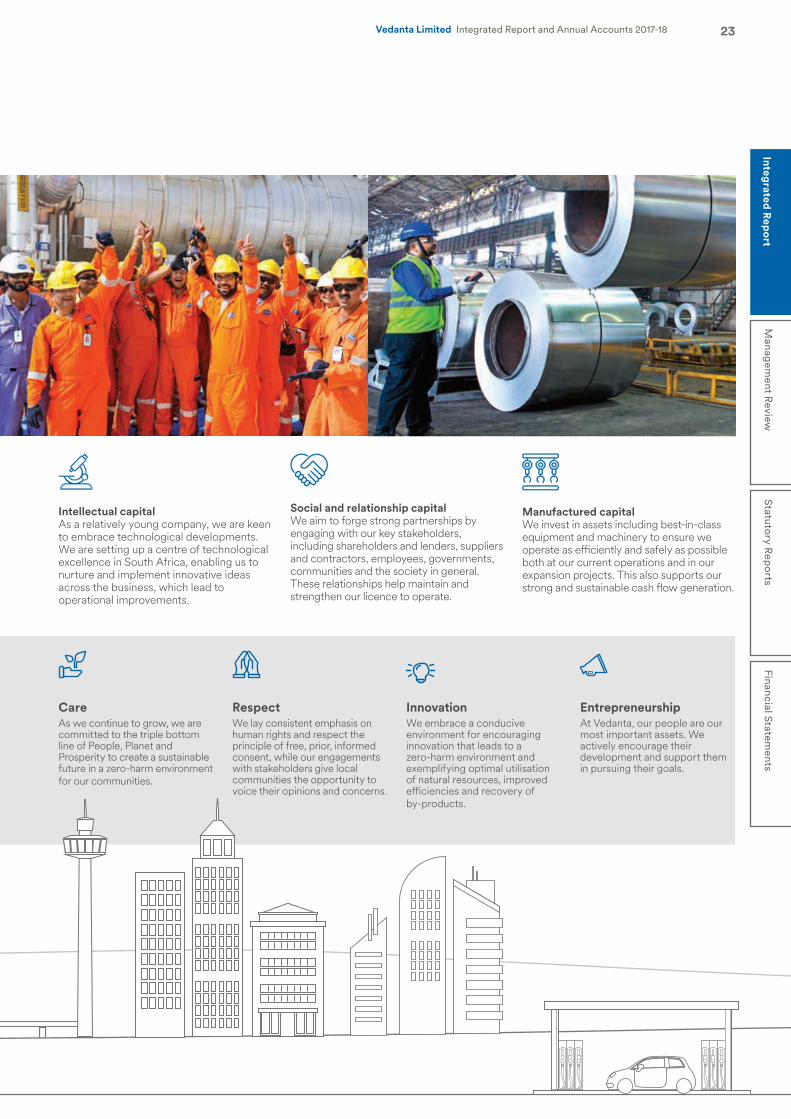
CareAs we continue to grow, we are committed to the triple bottom line of People, Planet and Prosperity to create a sustainable future in a zero-harm environment for our communities.
RespectWe lay consistent emphasis on human rights and respect the principle of free, prior, informed consent, while our engagements with stakeholders give local communities the opportunity to voice their opinions and concerns.
InnovationWe embrace a conducive environment for encouraging innovation that leads to a zero-harm environment and exemplifying optimal utilisation of natural resources, improved efficiencies and recovery of by-products.
EntrepreneurshipAt Vedanta, our people are our most important assets. We actively encourage their development and support them in pursuing their goals.
Intellectual capitalAs a relatively young company, we are keen to embrace technological developments. We are setting up a centre of technological excellence in South Africa, enabling us to nurture and implement innovative ideas across the business, which lead to operational improvements.
Social and relationship capitalWe aim to forge strong partnerships by engaging with our key stakeholders, including shareholders and lenders, suppliers and contractors, employees, governments, communities and the society in general. These relationships help maintain and strengthen our licence to operate.
Manufactured capitalWe invest in assets including best-in-class equipment and machinery to ensure we operate as efficiently and safely as possible both at our current operations and in our expansion projects. This also supports our strong and sustainable cash flow generation.
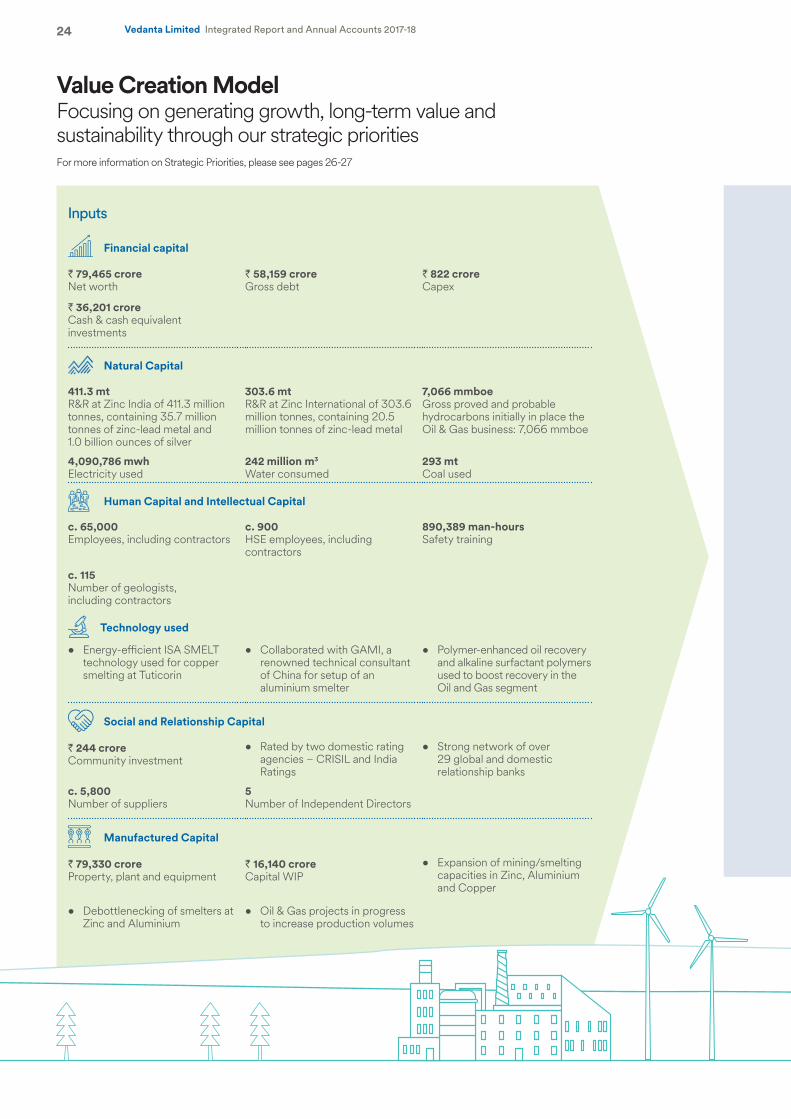
Value Creation Model
24 Vedanta Limited Integrated Report and Annual Accounts 2017-18
Inputs
Financial capital
` 79,465 croreNet worth
` 58,159 croreGross debt
` 822 croreCapex
` 36,201 croreCash & cash equivalent investments
Natural Capital
411.3 mtR&R at Zinc India of 411.3 million tonnes, containing 35.7 million tonnes of zinc-lead metal and 1.0 billion ounces of silver
303.6 mtR&R at Zinc International of 303.6 million tonnes, containing 20.5 million tonnes of zinc-lead metal
7,066 mmboe Gross proved and probable hydrocarbons initially in place the Oil & Gas business: 7,066 mmboe
4,090,786 mwhElectricity used
242 million m3
Water consumed293 mtCoal used
Human Capital and Intellectual Capital
c. 65,000Employees, including contractors
c. 900 HSE employees, including contractors
890,389 man-hoursSafety training
c. 115 Number of geologists,including contractors
Technology used
• Energy-efficient ISA SMELT technology used for copper smelting at Tuticorin
• Collaborated with GAMI, a renowned technical consultant of China for setup of an aluminium smelter
• Polymer-enhanced oil recovery and alkaline surfactant polymers used to boost recovery in the Oil and Gas segment
Social and Relationship Capital
` 244 croreCommunity investment
• Rated by two domestic rating agencies – CRISIL and India Ratings
• Strong network of over 29 global and domestic relationship banks
c. 5,800Number of suppliers
5Number of Independent Directors
Manufactured Capital
` 79,330 croreProperty, plant and equipment
` 16,140 crore Capital WIP
• Expansion of mining/smelting capacities in Zinc, Aluminium and Copper
• Debottlenecking of smelters at Zinc and Aluminium
• Oil & Gas projects in progress to increase production volumes
Focusing on generating growth, long-term value and sustainability through our strategic priorities For more information on Strategic Priorities, please see pages 26-27
25Integrated R
eport
Managem
ent Review
Statutory R
eports
Financial Statements
Vedanta Limited Integrated Report and Annual Accounts 2017-18
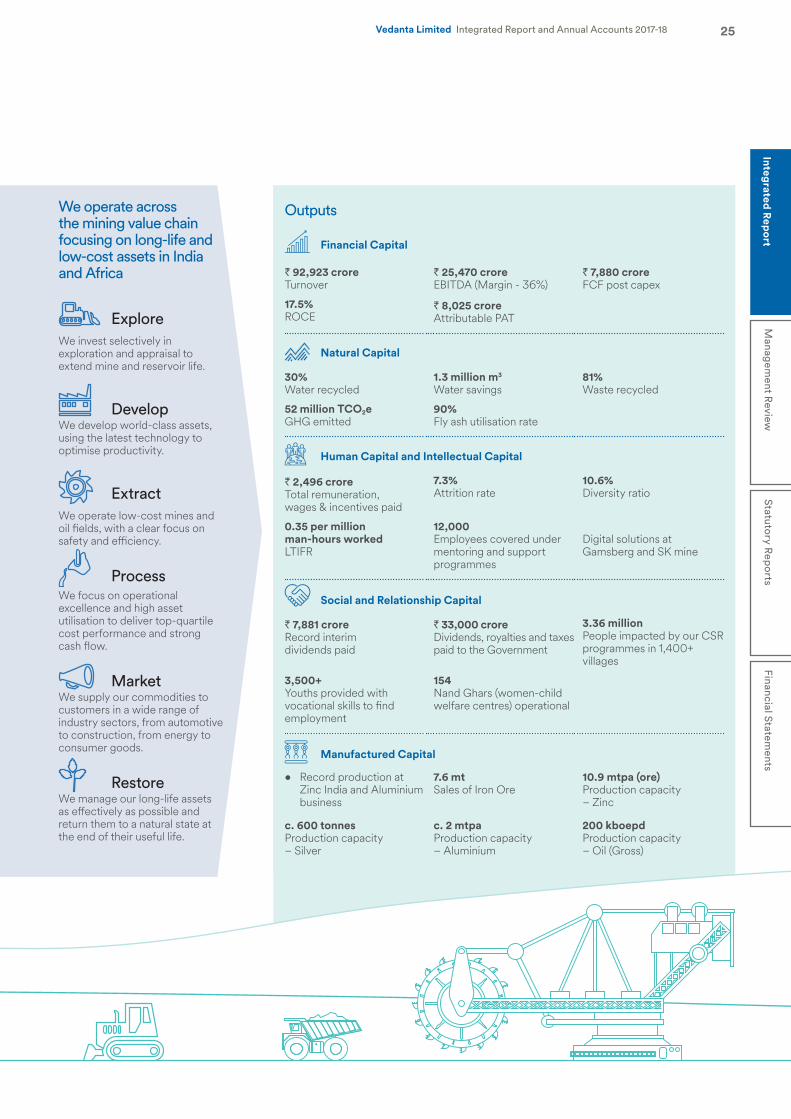
Outputs
Financial Capital
` 92,923 croreTurnover
` 25,470 croreEBITDA (Margin - 36%)
` 7,880 croreFCF post capex
17.5% ROCE
` 8,025 croreAttributable PAT
Natural Capital
30%Water recycled
1.3 million m3
Water savings 81%Waste recycled
52 million TCO2eGHG emitted
90%Fly ash utilisation rate
Human Capital and Intellectual Capital
` 2,496 croreTotal remuneration, wages & incentives paid
7.3% Attrition rate
10.6% Diversity ratio
0.35 per million man-hours workedLTIFR
12,000Employees covered under mentoring and support programmes
Digital solutions at Gamsberg and SK mine
Social and Relationship Capital
` 7,881 crore Record interimdividends paid
` 33,000 croreDividends, royalties and taxes paid to the Government
3.36 millionPeople impacted by our CSR programmes in 1,400+ villages
3,500+Youths provided with vocational skills to find employment
154Nand Ghars (women-child welfare centres) operational
Manufactured Capital
• Record production at Zinc India and Aluminium business
7.6 mtSales of Iron Ore
10.9 mtpa (ore)Production capacity– Zinc
c. 600 tonnesProduction capacity– Silver
c. 2 mtpaProduction capacity– Aluminium
200 kboepdProduction capacity– Oil (Gross)
We operate across the mining value chain focusing on long-life and low-cost assets in India and Africa
ExploreWe invest selectively in exploration and appraisal to extend mine and reservoir life.
Develop We develop world-class assets, using the latest technology to optimise productivity.
Extract
We operate low-cost mines and oil fields, with a clear focus on safety and efficiency.
ProcessWe focus on operational excellence and high asset utilisation to deliver top-quartile cost performance and strong cash flow.
Market We supply our commodities to customers in a wide range of industry sectors, from automotive to construction, from energy to consumer goods.
Restore We manage our long-life assets as effectively as possible and return them to a natural state at the end of their useful life.
26 Vedanta Limited Integrated Report and Annual Accounts 2017-18
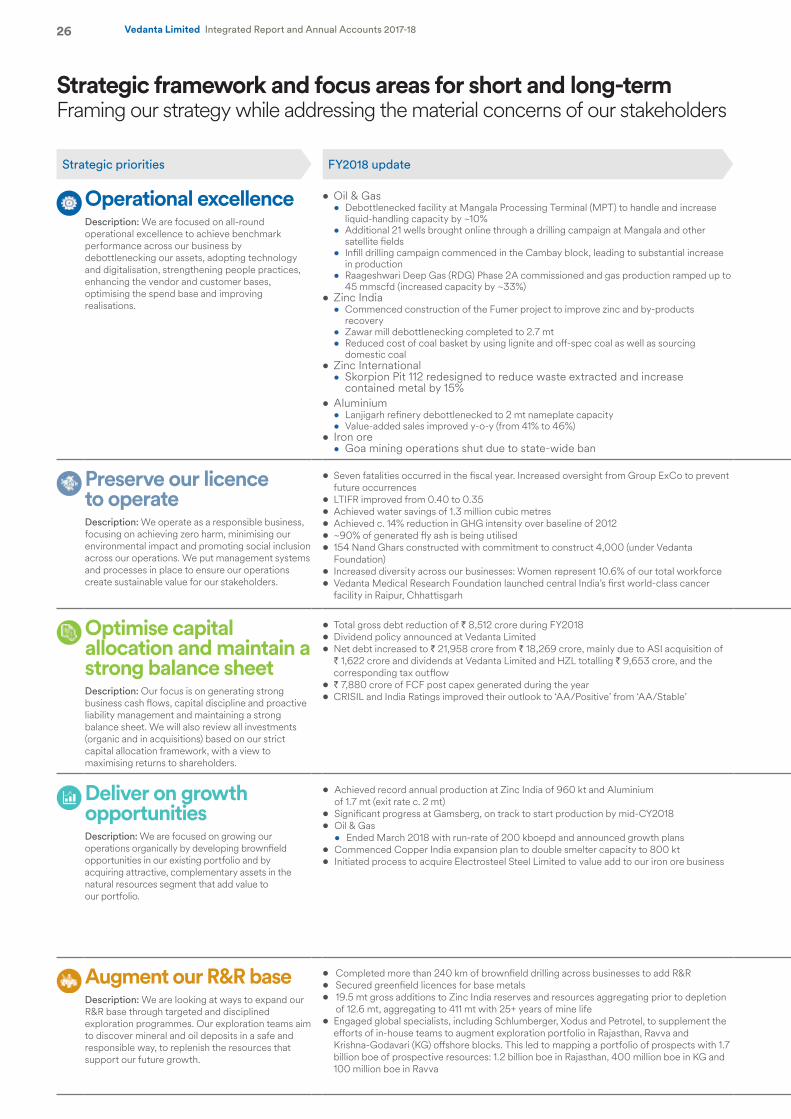
Strategic priorities FY2018 update Objectives for FY2019 KPIs Risks
Operational excellenceDescription: We are focused on all-round operational excellence to achieve benchmark performance across our business by debottlenecking our assets, adopting technology and digitalisation, strengthening people practices, enhancing the vendor and customer bases, optimising the spend base and improving realisations.
• Oil & Gas• Debottlenecked facility at Mangala Processing Terminal (MPT) to handle and increase
liquid-handling capacity by ~10%• Additional 21 wells brought online through a drilling campaign at Mangala and other
satellite fields• Infill drilling campaign commenced in the Cambay block, leading to substantial increase
in production• Raageshwari Deep Gas (RDG) Phase 2A commissioned and gas production ramped up to
45 mmscfd (increased capacity by ~33%)• Zinc India
• Commenced construction of the Fumer project to improve zinc and by-products recovery
• Zawar mill debottlenecking completed to 2.7 mt• Reduced cost of coal basket by using lignite and off-spec coal as well as sourcing
domestic coal• Zinc International
• Skorpion Pit 112 redesigned to reduce waste extracted and increase contained metal by 15%
• Aluminium• Lanjigarh refinery debottlenecked to 2 mt nameplate capacity• Value-added sales improved y-o-y (from 41% to 46%)
• Iron ore• Goa mining operations shut due to state-wide ban
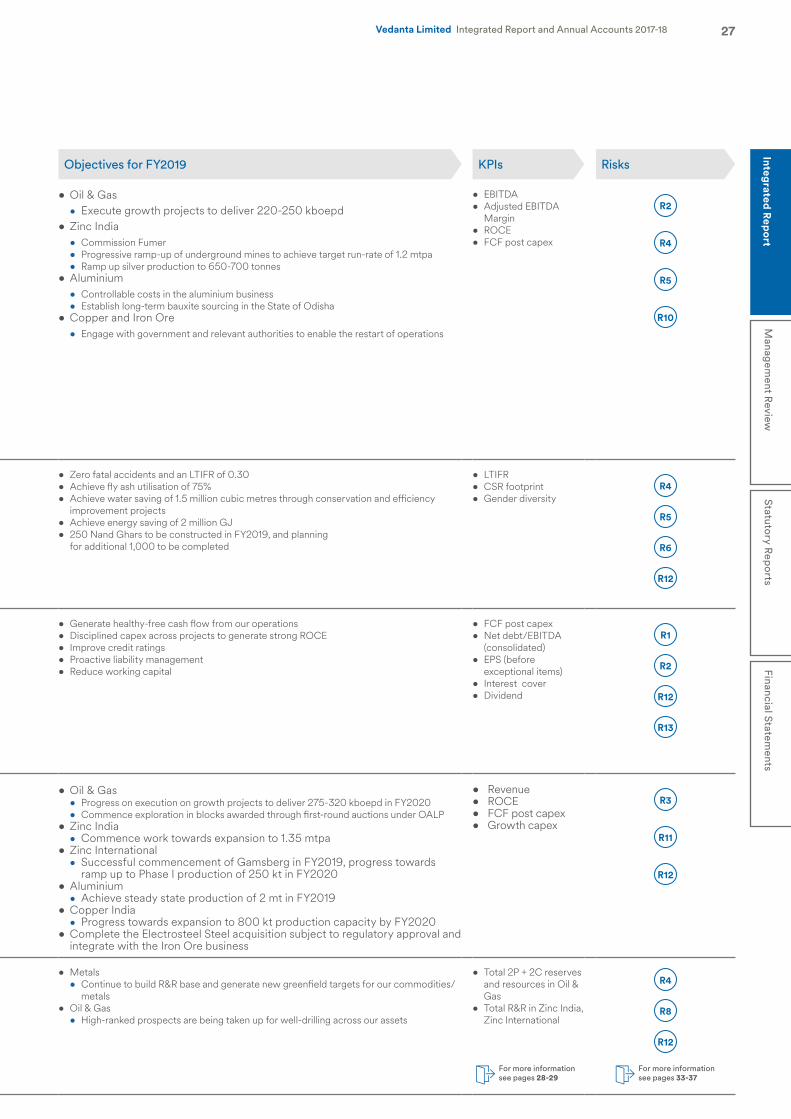
• Oil & Gas• Execute growth projects to deliver 220-250 kboepd
• Zinc India• Commission Fumer• Progressive ramp-up of underground mines to achieve target run-rate of 1.2 mtpa• Ramp up silver production to 650-700 tonnes
• Aluminium• Controllable costs in the aluminium business• Establish long-term bauxite sourcing in the State of Odisha
• Copper and Iron Ore• Engage with government and relevant authorities to enable the restart of operations
• EBITDA• Adjusted EBITDA
Margin• ROCE• FCF post capex
R2
R4
R5
R10
Preserve our licence to operateDescription: We operate as a responsible business, focusing on achieving zero harm, minimising our environmental impact and promoting social inclusion across our operations. We put management systems and processes in place to ensure our operations create sustainable value for our stakeholders.
• Seven fatalities occurred in the fiscal year. Increased oversight from Group ExCo to prevent future occurrences
• LTIFR improved from 0.40 to 0.35 • Achieved water savings of 1.3 million cubic metres• Achieved c. 14% reduction in GHG intensity over baseline of 2012• ~90% of generated fly ash is being utilised• 154 Nand Ghars constructed with commitment to construct 4,000 (under Vedanta
Foundation)• Increased diversity across our businesses: Women represent 10.6% of our total workforce • Vedanta Medical Research Foundation launched central India’s first world-class cancer
facility in Raipur, Chhattisgarh
• Zero fatal accidents and an LTIFR of 0.30• Achieve fly ash utilisation of 75%• Achieve water saving of 1.5 million cubic metres through conservation and efficiency
improvement projects• Achieve energy saving of 2 million GJ• 250 Nand Ghars to be constructed in FY2019, and planning
for additional 1,000 to be completed
• LTIFR• CSR footprint• Gender diversity
R4
R5
R6
R12
Optimise capital allocation and maintain a strong balance sheetDescription: Our focus is on generating strong business cash flows, capital discipline and proactive liability management and maintaining a strong balance sheet. We will also review all investments (organic and in acquisitions) based on our strict capital allocation framework, with a view to maximising returns to shareholders.
• Total gross debt reduction of ` 8,512 crore during FY2018• Dividend policy announced at Vedanta Limited• Net debt increased to ` 21,958 crore from ` 18,269 crore, mainly due to ASI acquisition of
` 1,622 crore and dividends at Vedanta Limited and HZL totalling ` 9,653 crore, and the corresponding tax outflow
• ̀ 7,880 crore of FCF post capex generated during the year• CRISIL and India Ratings improved their outlook to ‘AA/Positive’ from ‘AA/Stable’
• Generate healthy-free cash flow from our operations• Disciplined capex across projects to generate strong ROCE• Improve credit ratings• Proactive liability management• Reduce working capital
• FCF post capex• Net debt/EBITDA
(consolidated)• EPS (before
exceptional items)• Interest cover• Dividend
R1
R2
R12
R13
Deliver on growth opportunitiesDescription: We are focused on growing our operations organically by developing brownfield opportunities in our existing portfolio and by acquiring attractive, complementary assets in the natural resources segment that add value to our portfolio.
• Achieved record annual production at Zinc India of 960 kt and Aluminium of 1.7 mt (exit rate c. 2 mt)
• Significant progress at Gamsberg, on track to start production by mid-CY2018• Oil & Gas • Ended March 2018 with run-rate of 200 kboepd and announced growth plans• Commenced Copper India expansion plan to double smelter capacity to 800 kt• Initiated process to acquire Electrosteel Steel Limited to value add to our iron ore business
• Oil & Gas• Progress on execution on growth projects to deliver 275-320 kboepd in FY2020• Commence exploration in blocks awarded through first-round auctions under OALP
• Zinc India• Commence work towards expansion to 1.35 mtpa
• Zinc International• Successful commencement of Gamsberg in FY2019, progress towards
ramp up to Phase I production of 250 kt in FY2020• Aluminium
• Achieve steady state production of 2 mt in FY2019• Copper India
• Progress towards expansion to 800 kt production capacity by FY2020• Complete the Electrosteel Steel acquisition subject to regulatory approval and
integrate with the Iron Ore business
• Revenue• ROCE• FCF post capex• Growth capex
R3
R11
R12
Augment our R&R baseDescription: We are looking at ways to expand our R&R base through targeted and disciplined exploration programmes. Our exploration teams aim to discover mineral and oil deposits in a safe and responsible way, to replenish the resources that support our future growth.
• Completed more than 240 km of brownfield drilling across businesses to add R&R• Secured greenfield licences for base metals• 19.5 mt gross additions to Zinc India reserves and resources aggregating prior to depletion
of 12.6 mt, aggregating to 411 mt with 25+ years of mine life• Engaged global specialists, including Schlumberger, Xodus and Petrotel, to supplement the
efforts of in-house teams to augment exploration portfolio in Rajasthan, Ravva and Krishna-Godavari (KG) offshore blocks. This led to mapping a portfolio of prospects with 1.7 billion boe of prospective resources: 1.2 billion boe in Rajasthan, 400 million boe in KG and 100 million boe in Ravva
• Metals • Continue to build R&R base and generate new greenfield targets for our commodities/
metals• Oil & Gas
• High-ranked prospects are being taken up for well-drilling across our assets
• Total 2P + 2C reserves and resources in Oil & Gas
• Total R&R in Zinc India, Zinc International
R4
R8
R12
Strategic framework and focus areas for short and long-termFraming our strategy while addressing the material concerns of our stakeholders
27Integrated R
eport
Managem
ent Review
Statutory R
eports
Financial Statements
Vedanta Limited Integrated Report and Annual Accounts 2017-18
Strategic priorities FY2018 update Objectives for FY2019 KPIs Risks
Operational excellenceDescription: We are focused on all-round operational excellence to achieve benchmark performance across our business by debottlenecking our assets, adopting technology and digitalisation, strengthening people practices, enhancing the vendor and customer bases, optimising the spend base and improving realisations.
• Oil & Gas• Debottlenecked facility at Mangala Processing Terminal (MPT) to handle and increase
liquid-handling capacity by ~10%• Additional 21 wells brought online through a drilling campaign at Mangala and other
satellite fields• Infill drilling campaign commenced in the Cambay block, leading to substantial increase
in production• Raageshwari Deep Gas (RDG) Phase 2A commissioned and gas production ramped up to
45 mmscfd (increased capacity by ~33%)• Zinc India
• Commenced construction of the Fumer project to improve zinc and by-products recovery
• Zawar mill debottlenecking completed to 2.7 mt• Reduced cost of coal basket by using lignite and off-spec coal as well as sourcing
domestic coal• Zinc International
• Skorpion Pit 112 redesigned to reduce waste extracted and increase contained metal by 15%
• Aluminium• Lanjigarh refinery debottlenecked to 2 mt nameplate capacity• Value-added sales improved y-o-y (from 41% to 46%)
• Iron ore• Goa mining operations shut due to state-wide ban
• Oil & Gas• Execute growth projects to deliver 220-250 kboepd
• Zinc India• Commission Fumer• Progressive ramp-up of underground mines to achieve target run-rate of 1.2 mtpa• Ramp up silver production to 650-700 tonnes
• Aluminium• Controllable costs in the aluminium business• Establish long-term bauxite sourcing in the State of Odisha
• Copper and Iron Ore• Engage with government and relevant authorities to enable the restart of operations
• EBITDA• Adjusted EBITDA
Margin• ROCE• FCF post capex
R2
R4
R5
R10
Preserve our licence to operateDescription: We operate as a responsible business, focusing on achieving zero harm, minimising our environmental impact and promoting social inclusion across our operations. We put management systems and processes in place to ensure our operations create sustainable value for our stakeholders.
• Seven fatalities occurred in the fiscal year. Increased oversight from Group ExCo to prevent future occurrences
• LTIFR improved from 0.40 to 0.35 • Achieved water savings of 1.3 million cubic metres• Achieved c. 14% reduction in GHG intensity over baseline of 2012• ~90% of generated fly ash is being utilised• 154 Nand Ghars constructed with commitment to construct 4,000 (under Vedanta
Foundation)• Increased diversity across our businesses: Women represent 10.6% of our total workforce • Vedanta Medical Research Foundation launched central India’s first world-class cancer
facility in Raipur, Chhattisgarh
• Zero fatal accidents and an LTIFR of 0.30• Achieve fly ash utilisation of 75%• Achieve water saving of 1.5 million cubic metres through conservation and efficiency
improvement projects• Achieve energy saving of 2 million GJ• 250 Nand Ghars to be constructed in FY2019, and planning
for additional 1,000 to be completed
• LTIFR• CSR footprint• Gender diversity
R4
R5
R6
R12
Optimise capital allocation and maintain a strong balance sheetDescription: Our focus is on generating strong business cash flows, capital discipline and proactive liability management and maintaining a strong balance sheet. We will also review all investments (organic and in acquisitions) based on our strict capital allocation framework, with a view to maximising returns to shareholders.
• Total gross debt reduction of ` 8,512 crore during FY2018• Dividend policy announced at Vedanta Limited• Net debt increased to ` 21,958 crore from ` 18,269 crore, mainly due to ASI acquisition of
` 1,622 crore and dividends at Vedanta Limited and HZL totalling ` 9,653 crore, and the corresponding tax outflow
• ̀ 7,880 crore of FCF post capex generated during the year• CRISIL and India Ratings improved their outlook to ‘AA/Positive’ from ‘AA/Stable’
• Generate healthy-free cash flow from our operations• Disciplined capex across projects to generate strong ROCE• Improve credit ratings• Proactive liability management• Reduce working capital
• FCF post capex• Net debt/EBITDA
(consolidated)• EPS (before
exceptional items)• Interest cover• Dividend
R1
R2
R12
R13
Deliver on growth opportunitiesDescription: We are focused on growing our operations organically by developing brownfield opportunities in our existing portfolio and by acquiring attractive, complementary assets in the natural resources segment that add value to our portfolio.
• Achieved record annual production at Zinc India of 960 kt and Aluminium of 1.7 mt (exit rate c. 2 mt)
• Significant progress at Gamsberg, on track to start production by mid-CY2018• Oil & Gas • Ended March 2018 with run-rate of 200 kboepd and announced growth plans• Commenced Copper India expansion plan to double smelter capacity to 800 kt• Initiated process to acquire Electrosteel Steel Limited to value add to our iron ore business
• Oil & Gas• Progress on execution on growth projects to deliver 275-320 kboepd in FY2020• Commence exploration in blocks awarded through first-round auctions under OALP
• Zinc India• Commence work towards expansion to 1.35 mtpa
• Zinc International• Successful commencement of Gamsberg in FY2019, progress towards
ramp up to Phase I production of 250 kt in FY2020• Aluminium
• Achieve steady state production of 2 mt in FY2019• Copper India
• Progress towards expansion to 800 kt production capacity by FY2020• Complete the Electrosteel Steel acquisition subject to regulatory approval and
integrate with the Iron Ore business
• Revenue• ROCE• FCF post capex• Growth capex
R3
R11
R12
Augment our R&R baseDescription: We are looking at ways to expand our R&R base through targeted and disciplined exploration programmes. Our exploration teams aim to discover mineral and oil deposits in a safe and responsible way, to replenish the resources that support our future growth.
• Completed more than 240 km of brownfield drilling across businesses to add R&R• Secured greenfield licences for base metals• 19.5 mt gross additions to Zinc India reserves and resources aggregating prior to depletion
of 12.6 mt, aggregating to 411 mt with 25+ years of mine life• Engaged global specialists, including Schlumberger, Xodus and Petrotel, to supplement the
efforts of in-house teams to augment exploration portfolio in Rajasthan, Ravva and Krishna-Godavari (KG) offshore blocks. This led to mapping a portfolio of prospects with 1.7 billion boe of prospective resources: 1.2 billion boe in Rajasthan, 400 million boe in KG and 100 million boe in Ravva
• Metals • Continue to build R&R base and generate new greenfield targets for our commodities/
metals• Oil & Gas
• High-ranked prospects are being taken up for well-drilling across our assets
• Total 2P + 2C reserves and resources in Oil & Gas
• Total R&R in Zinc India, Zinc International
R4
R8
R12
For more information see pages 28-29
For more information see pages 33-37
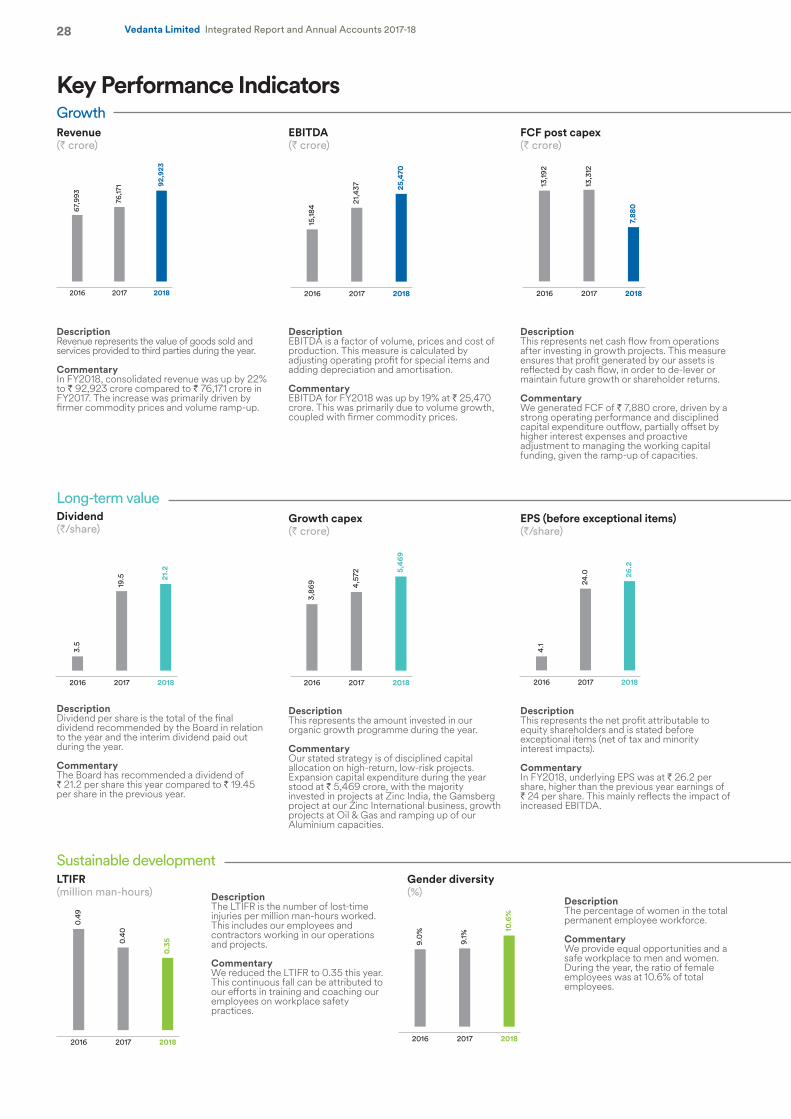
2016 2017 2018
9.0%
9.1%
10.6
%
2016 2017 2018
4.1
24.0 26
.2
2016 2017 2018
3,86
9 4,57
2 5,46
9
2016 2017 2018
3.5
19.5 21
.2
2016 2017 2018
13,19
2
13,3
12
7,88
0
2016 2017 2018
67,9
93
76,17
1 92,9
23
2016 2017 2018
15,18
4
21,4
37 25,4
70
2016 2017 2018
0.49
0.40
0.35
DescriptionThe LTIFR is the number of lost-time injuries per million man-hours worked. This includes our employees and contractors working in our operations and projects.
CommentaryWe reduced the LTIFR to 0.35 this year. This continuous fall can be attributed to our efforts in training and coaching our employees on workplace safety practices.
LTIFR(million man-hours)
28 Vedanta Limited Integrated Report and Annual Accounts 2017-18
Key Performance IndicatorsGrowth
DescriptionRevenue represents the value of goods sold and services provided to third parties during the year.
CommentaryIn FY2018, consolidated revenue was up by 22% to ` 92,923 crore compared to ` 76,171 crore in FY2017. The increase was primarily driven by firmer commodity prices and volume ramp-up.
Revenue(` crore)
DescriptionEBITDA is a factor of volume, prices and cost of production. This measure is calculated by adjusting operating profit for special items and adding depreciation and amortisation.
CommentaryEBITDA for FY2018 was up by 19% at ` 25,470 crore. This was primarily due to volume growth, coupled with firmer commodity prices.
EBITDA(` crore)
DescriptionThis represents net cash flow from operations after investing in growth projects. This measure ensures that profit generated by our assets is reflected by cash flow, in order to de-lever or maintain future growth or shareholder returns.
CommentaryWe generated FCF of ` 7,880 crore, driven by a strong operating performance and disciplined capital expenditure outflow, partially offset by higher interest expenses and proactive adjustment to managing the working capital funding, given the ramp-up of capacities.
FCF post capex(` crore)
Sustainable development
Long-term value
DescriptionDividend per share is the total of the final dividend recommended by the Board in relation to the year and the interim dividend paid out during the year.
CommentaryThe Board has recommended a dividend of ` 21.2 per share this year compared to ` 19.45 per share in the previous year.
Dividend(`/share)
DescriptionThis represents the amount invested in our organic growth programme during the year.
CommentaryOur stated strategy is of disciplined capital allocation on high-return, low-risk projects. Expansion capital expenditure during the year stood at ` 5,469 crore, with the majority invested in projects at Zinc India, the Gamsberg project at our Zinc International business, growth projects at Oil & Gas and ramping up of our Aluminium capacities.
Growth capex(` crore)
DescriptionThis represents the net profit attributable to equity shareholders and is stated before exceptional items (net of tax and minority interest impacts).
CommentaryIn FY2018, underlying EPS was at ` 26.2 per share, higher than the previous year earnings of ` 24 per share. This mainly reflects the impact of increased EBITDA.
EPS (before exceptional items) (`/share)
DescriptionThe percentage of women in the total permanent employee workforce.
CommentaryWe provide equal opportunities and a safe workplace to men and women. During the year, the ratio of female employees was at 10.6% of total employees.
Gender diversity(%)
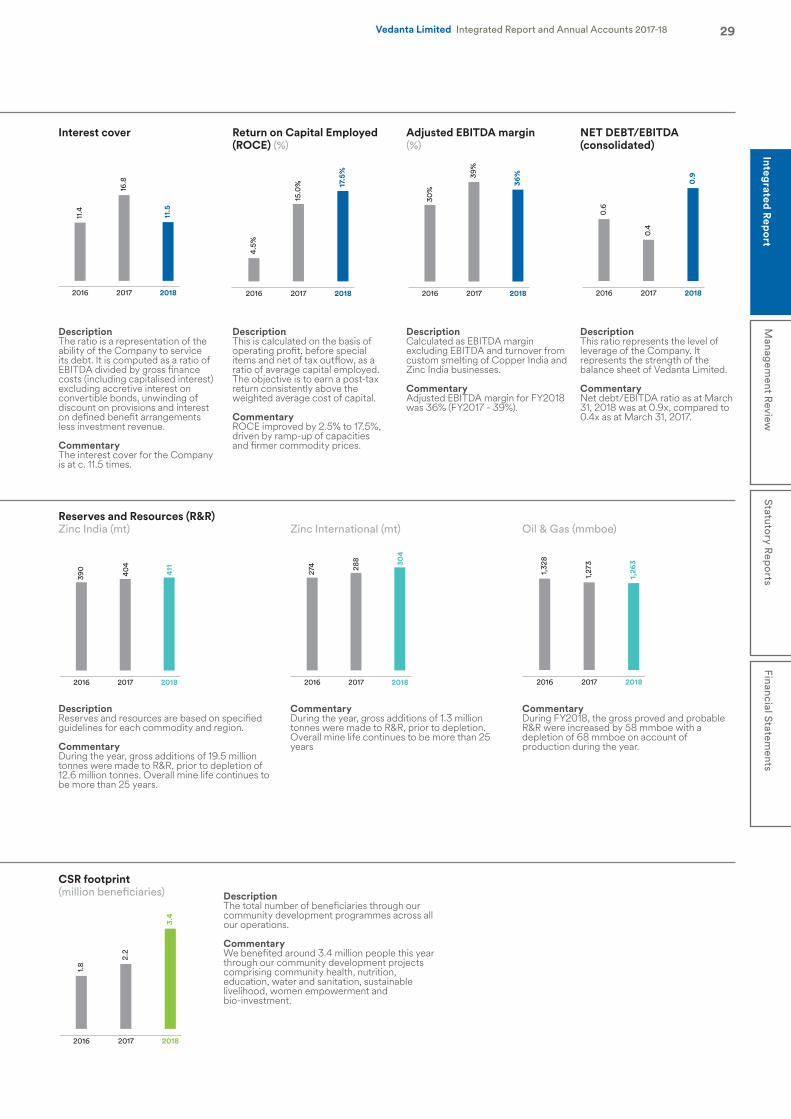
2016 2017 2018
4.5%
15.0
% 17.5
%
2016 2017 2018
390 40
4
411
2016 2017 2018
1.8
2.2
3.4
2016 2017 2018
30%
39%
36%
2016 2017 2018
0.6
0.4
0.9
2016 2017 2018
274 2
88 304
2016 2017 2018
1,32
8
1,27
3
1,26
3
2016 2017 2018
11.4
16.8
11.5
29Integrated R
eport
Managem
ent Review
Statutory R
eports
Financial Statements
Vedanta Limited Integrated Report and Annual Accounts 2017-18
DescriptionThis is calculated on the basis of operating profit, before special items and net of tax outflow, as a ratio of average capital employed. The objective is to earn a post-tax return consistently above the weighted average cost of capital.
CommentaryROCE improved by 2.5% to 17.5%, driven by ramp-up of capacities and firmer commodity prices.
Return on Capital Employed (ROCE) (%)
DescriptionCalculated as EBITDA margin excluding EBITDA and turnover from custom smelting of Copper India and Zinc India businesses.
CommentaryAdjusted EBITDA margin for FY2018 was 36% (FY2017 - 39%).
Adjusted EBITDA margin(%)
DescriptionThis ratio represents the level of leverage of the Company. It represents the strength of the balance sheet of Vedanta Limited.
CommentaryNet debt/EBITDA ratio as at March 31, 2018 was at 0.9x, compared to 0.4x as at March 31, 2017.
NET DEBT/EBITDA (consolidated)
DescriptionThe ratio is a representation of the ability of the Company to service its debt. It is computed as a ratio of EBITDA divided by gross finance costs (including capitalised interest) excluding accretive interest on convertible bonds, unwinding of discount on provisions and interest on defined benefit arrangements less investment revenue.
CommentaryThe interest cover for the Company is at c. 11.5 times.
Interest cover
DescriptionThe total number of beneficiaries through our community development programmes across all our operations.
CommentaryWe benefited around 3.4 million people this year through our community development projects comprising community health, nutrition, education, water and sanitation, sustainable livelihood, women empowerment and bio-investment.
CSR footprint(million beneficiaries)
Reserves and Resources (R&R)Zinc India (mt)
CommentaryDuring the year, gross additions of 1.3 million tonnes were made to R&R, prior to depletion. Overall mine life continues to be more than 25 years
Zinc International (mt)
CommentaryDuring FY2018, the gross proved and probable R&R were increased by 58 mmboe with a depletion of 68 mmboe on account of production during the year.
Oil & Gas (mmboe)
DescriptionReserves and resources are based on specified guidelines for each commodity and region.
CommentaryDuring the year, gross additions of 19.5 million tonnes were made to R&R, prior to depletion of 12.6 million tonnes. Overall mine life continues to be more than 25 years.
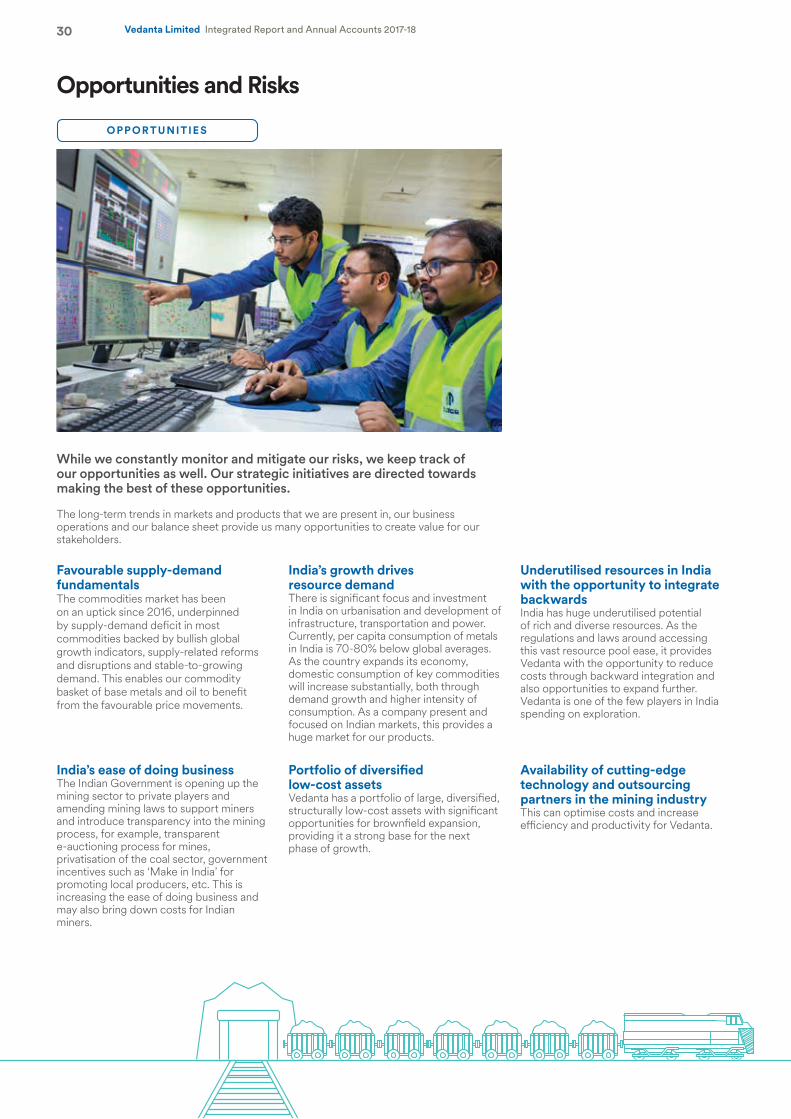
30 Vedanta Limited Integrated Report and Annual Accounts 2017-18
Opportunities and Risks
Favourable supply-demand fundamentals The commodities market has been on an uptick since 2016, underpinned by supply-demand deficit in most commodities backed by bullish global growth indicators, supply-related reforms and disruptions and stable-to-growing demand. This enables our commodity basket of base metals and oil to benefit from the favourable price movements.
India’s growth drives resource demand There is significant focus and investment in India on urbanisation and development of infrastructure, transportation and power. Currently, per capita consumption of metals in India is 70-80% below global averages. As the country expands its economy, domestic consumption of key commodities will increase substantially, both through demand growth and higher intensity of consumption. As a company present and focused on Indian markets, this provides a huge market for our products.
Underutilised resources in India with the opportunity to integrate backwards India has huge underutilised potential of rich and diverse resources. As the regulations and laws around accessing this vast resource pool ease, it provides Vedanta with the opportunity to reduce costs through backward integration and also opportunities to expand further. Vedanta is one of the few players in India spending on exploration.
India’s ease of doing business The Indian Government is opening up the mining sector to private players and amending mining laws to support miners and introduce transparency into the mining process, for example, transparent e-auctioning process for mines, privatisation of the coal sector, government incentives such as ‘Make in India’ for promoting local producers, etc. This is increasing the ease of doing business and may also bring down costs for Indian miners.
Portfolio of diversified low-cost assets Vedanta has a portfolio of large, diversified, structurally low-cost assets with significant opportunities for brownfield expansion, providing it a strong base for the next phase of growth.
Availability of cutting-edge technology and outsourcing partners in the mining industry This can optimise costs and increase efficiency and productivity for Vedanta.
While we constantly monitor and mitigate our risks, we keep track of our opportunities as well. Our strategic initiatives are directed towards making the best of these opportunities.
The long-term trends in markets and products that we are present in, our business operations and our balance sheet provide us many opportunities to create value for our stakeholders.
O PP O R TU NITIES
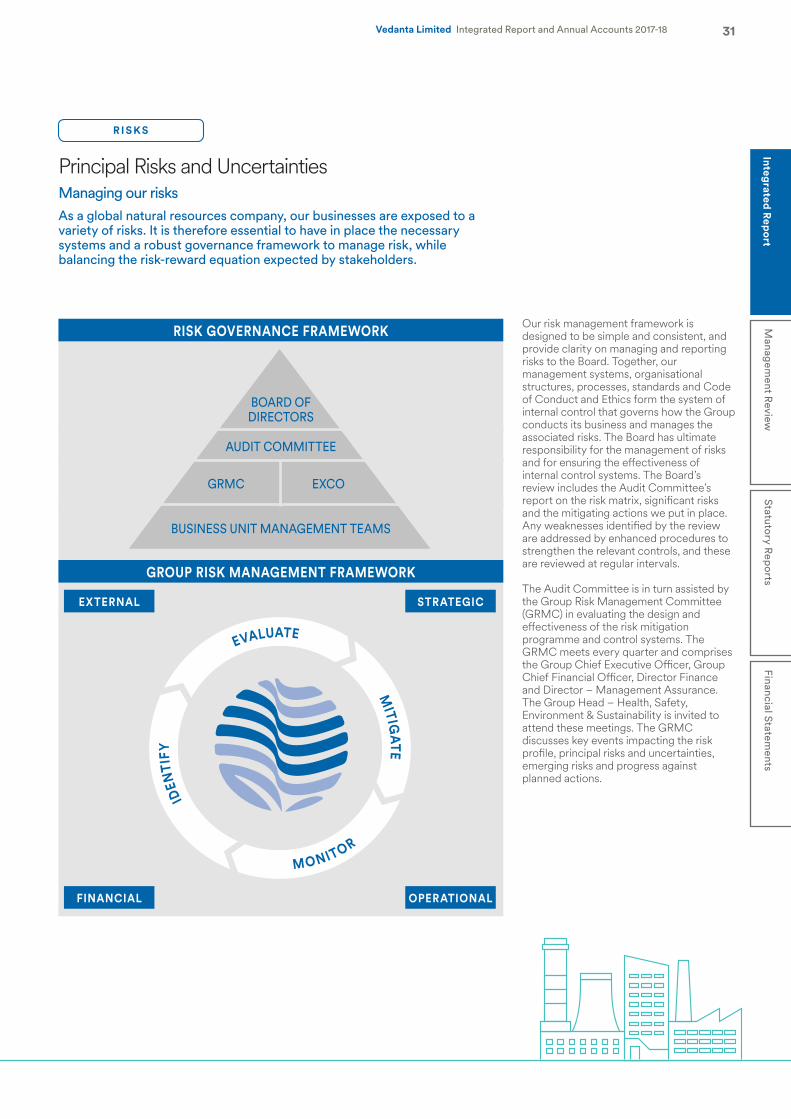
31Integrated R
eport
Managem
ent Review
Statutory R
eports
Financial Statements
Vedanta Limited Integrated Report and Annual Accounts 2017-18
Principal Risks and UncertaintiesManaging our risksAs a global natural resources company, our businesses are exposed to a variety of risks. It is therefore essential to have in place the necessary systems and a robust governance framework to manage risk, while balancing the risk-reward equation expected by stakeholders.
Our risk management framework is designed to be simple and consistent, and provide clarity on managing and reporting risks to the Board. Together, our management systems, organisational structures, processes, standards and Code of Conduct and Ethics form the system of internal control that governs how the Group conducts its business and manages the associated risks. The Board has ultimate responsibility for the management of risks and for ensuring the effectiveness of internal control systems. The Board’s review includes the Audit Committee’s report on the risk matrix, significant risks and the mitigating actions we put in place. Any weaknesses identified by the review are addressed by enhanced procedures to strengthen the relevant controls, and these are reviewed at regular intervals.
The Audit Committee is in turn assisted by the Group Risk Management Committee (GRMC) in evaluating the design and effectiveness of the risk mitigation programme and control systems. The GRMC meets every quarter and comprises the Group Chief Executive Officer, Group Chief Financial Officer, Director Finance and Director – Management Assurance. The Group Head – Health, Safety, Environment & Sustainability is invited to attend these meetings. The GRMC discusses key events impacting the risk profile, principal risks and uncertainties, emerging risks and progress against planned actions.
R I S KS
IDEN
TIFY
EVALUATE
MONITOR
MITIG
ATE
RISK GOVERNANCE FRAMEWORK
GROUP RISK MANAGEMENT FRAMEWORK
EXTERNAL STRATEGIC
OPERATIONALFINANCIAL
BOARD OF DIRECTORS
AUDIT COMMITTEE
GRMC EXCO
BUSINESS UNIT MANAGEMENT TEAMS
32 Vedanta Limited Integrated Report and Annual Accounts 2017-18
Opportunities and Risks continued
Since it is critical to the delivery of the Group’s strategic objectives, risk management is embedded in business-critical activities, functions and processes. The risk management framework helps the Company by aligning operating controls with the objectives of the Group. It is designed to manage rather than eliminate the risk of failure to achieve business objectives and provides reasonable and not absolute assurance against material misstatement or loss. Materiality and risk tolerance are key considerations in our decision making. The responsibility for identifying and managing risk lies with every manager and business leader.
In addition to this structure, other key risk governance and oversight committees include:
• Finance Standing Committee, with oversight of treasury-related risks. This is a committee of the Board and is attended by the Group CFO, business CFOs, Group Treasury Head and the Treasury Heads at the respective businesses; and
• The Group Capex Sub-Committee, which evaluates the risks associated with any capital investment decisions and institutes a risk management framework in expansion projects.
There is also a Vedanta Sustainability Committee at Group level, which looks at sustainability-related risks.
At a business level, formal discussions on risk management occur at review meetings at least once a quarter. The respective businesses review their major risks and changes in their nature and extent since the last assessment, and discuss the control measures that are in place and further action plans. The control measures stated in the risk matrix are also periodically reviewed by the business management teams to verify their continued effectiveness. These meetings are chaired by the respective business CEOs and attended by CXOs, senior management and appropriate functional heads. Risk officers have been formally nominated at each of the operating businesses as well as
at Group level. Their role is to create awareness of risks at the Senior Management level and to develop and nurture a risk management culture. Risk mitigation plans form an integral part of the performance management process. Structured discussions on risk management also happen at business level with regard to their respective risk matrix and mitigation plans. The leadership teams in the businesses are accountable for governance of the risk management framework and they provide regular updates to the GRMC.
Each of the businesses has developed its own risk matrix and risk register, which is reviewed by their respective management committee/ executive committee, chaired by their CEOs. In addition, each business has developed its own risk register depending on the size of its operations and number of Strategic Business Unites (SBUs)/ locations. Risks across these risk registers are aggregated and evaluated and the Group’s principal risks are identified based on the frequency, and potential magnitude and impact of the risks identified.
This element is an important component of the overall internal control process, from which the Board obtains assurance. The scope of work, authority and resources of Management Assurance Services (MAS) are regularly reviewed by the Audit Committee. The responsibilities of MAS include recommending improvements in the control environment and reviewing compliance with our philosophy, policies and procedures. The planning of internal audits is approached from a risk perspective. In preparing the internal audit plan, reference is made to the risk matrix, and inputs are sought from senior management, business teams and members of the Audit Committee. In addition, we make reference to past audit experience, financial analysis and the current economic and business environment.
Each of the principal subsidiaries has procedures in place to ensure that sufficient internal controls are maintained. These procedures include a monthly
meeting of the relevant management committee and quarterly meeting of the Audit Committee of that subsidiary. Any adverse findings are reported to the Audit Committee. The Chairman of the Audit Committee may request MAS and/or the external auditor to look at certain areas identified by risk management and the internal control framework. The findings by MAS are presented monthly to the Executive Committee and to the Audit Committee periodically. Due to the limitations inherent in any system of internal control, this system is designed to meet the Group’s particular needs, and the risks to which it is exposed, rather than to eliminate the risk altogether. Therefore, it can only provide reasonable and not absolute assurance against material misstatement or loss.
The order in which these risks appear in the section below does not necessarily reflect the likelihood of their occurrence or the relative magnitude of their impact on our business. The risk direction of each risk has been reviewed based on events, economic conditions, changes in business environment and regulatory changes during the year. While Vedanta’s risk management framework is designed to help the organisation meet its objectives, there can be no guarantee that the Group’s risk management activities will mitigate or prevent these or other risks from occurring.
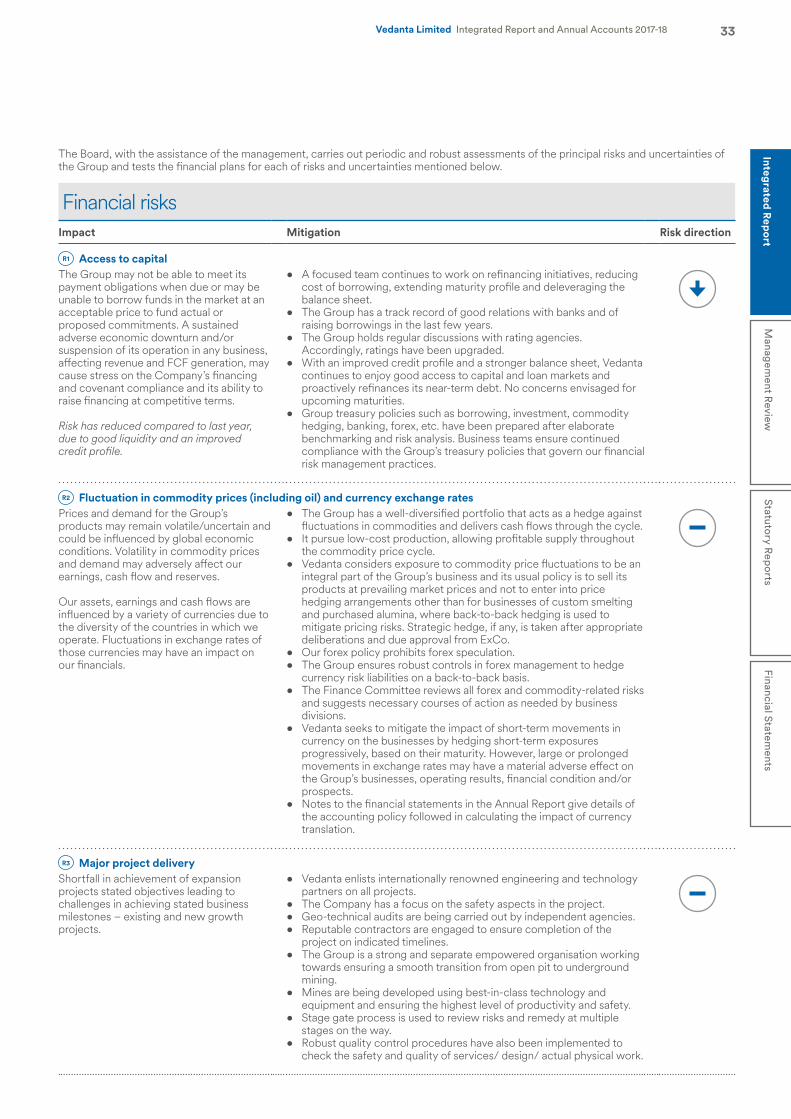
33Integrated R
eport
Managem
ent Review
Statutory R
eports
Financial Statements
Vedanta Limited Integrated Report and Annual Accounts 2017-18
The Board, with the assistance of the management, carries out periodic and robust assessments of the principal risks and uncertainties of the Group and tests the financial plans for each of risks and uncertainties mentioned below.
Financial risksImpact Mitigation Risk direction
R1 Access to capitalThe Group may not be able to meet its payment obligations when due or may be unable to borrow funds in the market at an acceptable price to fund actual or proposed commitments. A sustained adverse economic downturn and/or suspension of its operation in any business, affecting revenue and FCF generation, may cause stress on the Company’s financing and covenant compliance and its ability to raise financing at competitive terms.
Risk has reduced compared to last year, due to good liquidity and an improved credit profile.
• A focused team continues to work on refinancing initiatives, reducing cost of borrowing, extending maturity profile and deleveraging the balance sheet.
• The Group has a track record of good relations with banks and of raising borrowings in the last few years.
• The Group holds regular discussions with rating agencies. Accordingly, ratings have been upgraded.
• With an improved credit profile and a stronger balance sheet, Vedanta continues to enjoy good access to capital and loan markets and proactively refinances its near-term debt. No concerns envisaged for upcoming maturities.
• Group treasury policies such as borrowing, investment, commodity hedging, banking, forex, etc. have been prepared after elaborate benchmarking and risk analysis. Business teams ensure continued compliance with the Group’s treasury policies that govern our financial risk management practices.
R2 Fluctuation in commodity prices (including oil) and currency exchange ratesPrices and demand for the Group’s products may remain volatile/uncertain and could be influenced by global economic conditions. Volatility in commodity prices and demand may adversely affect our earnings, cash flow and reserves.
Our assets, earnings and cash flows are influenced by a variety of currencies due to the diversity of the countries in which we operate. Fluctuations in exchange rates of those currencies may have an impact on our financials.
• The Group has a well-diversified portfolio that acts as a hedge against fluctuations in commodities and delivers cash flows through the cycle.
• It pursue low-cost production, allowing profitable supply throughout the commodity price cycle.
• Vedanta considers exposure to commodity price fluctuations to be an integral part of the Group’s business and its usual policy is to sell its products at prevailing market prices and not to enter into price hedging arrangements other than for businesses of custom smelting and purchased alumina, where back-to-back hedging is used to mitigate pricing risks. Strategic hedge, if any, is taken after appropriate deliberations and due approval from ExCo.
• Our forex policy prohibits forex speculation. • The Group ensures robust controls in forex management to hedge
currency risk liabilities on a back-to-back basis.• The Finance Committee reviews all forex and commodity-related risks
and suggests necessary courses of action as needed by business divisions.
• Vedanta seeks to mitigate the impact of short-term movements in currency on the businesses by hedging short-term exposures progressively, based on their maturity. However, large or prolonged movements in exchange rates may have a material adverse effect on the Group’s businesses, operating results, financial condition and/or prospects.
• Notes to the financial statements in the Annual Report give details of the accounting policy followed in calculating the impact of currency translation.
R3 Major project deliveryShortfall in achievement of expansion projects stated objectives leading to challenges in achieving stated business milestones – existing and new growth projects.
• Vedanta enlists internationally renowned engineering and technology partners on all projects.
• The Company has a focus on the safety aspects in the project.• Geo-technical audits are being carried out by independent agencies.• Reputable contractors are engaged to ensure completion of the
project on indicated timelines. • The Group is a strong and separate empowered organisation working
towards ensuring a smooth transition from open pit to underground mining.
• Mines are being developed using best-in-class technology and equipment and ensuring the highest level of productivity and safety.
• Stage gate process is used to review risks and remedy at multiple stages on the way.
• Robust quality control procedures have also been implemented to check the safety and quality of services/ design/ actual physical work.
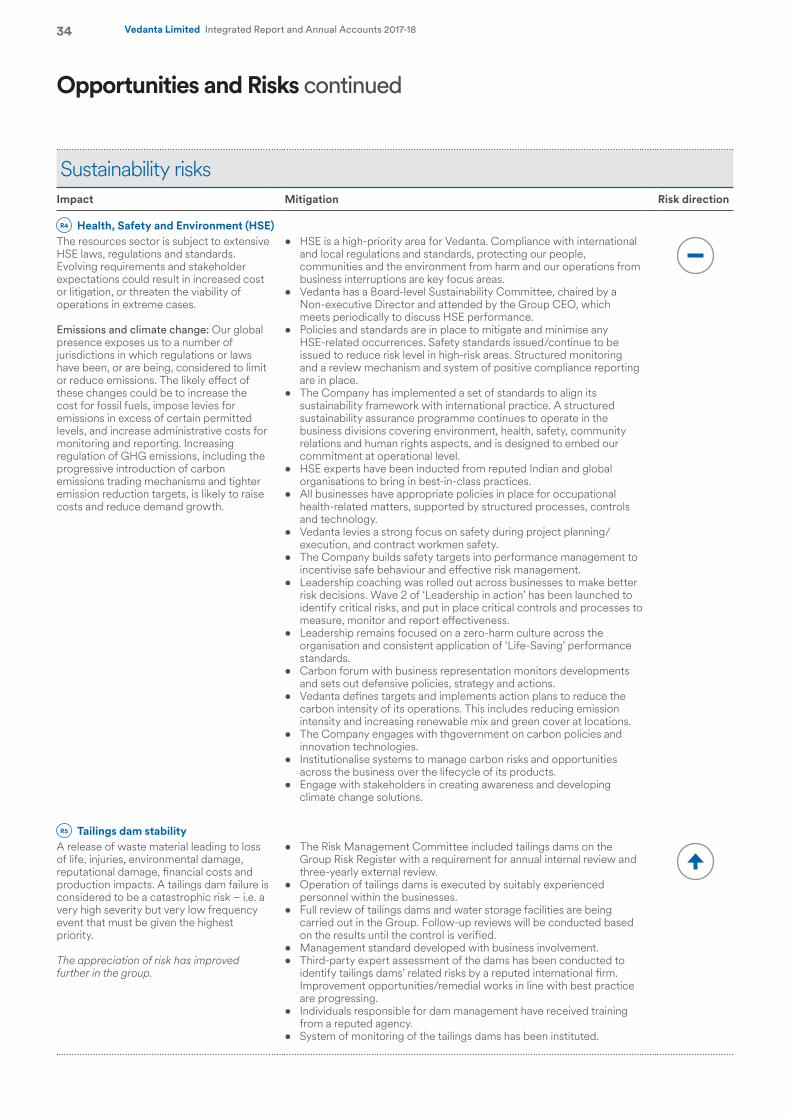
34 Vedanta Limited Integrated Report and Annual Accounts 2017-18
Sustainability risksImpact Mitigation Risk direction
R4 Health, Safety and Environment (HSE)The resources sector is subject to extensive HSE laws, regulations and standards. Evolving requirements and stakeholder expectations could result in increased cost or litigation, or threaten the viability of operations in extreme cases.
Emissions and climate change: Our global presence exposes us to a number of jurisdictions in which regulations or laws have been, or are being, considered to limit or reduce emissions. The likely effect of these changes could be to increase the cost for fossil fuels, impose levies for emissions in excess of certain permitted levels, and increase administrative costs for monitoring and reporting. Increasing regulation of GHG emissions, including the progressive introduction of carbon emissions trading mechanisms and tighter emission reduction targets, is likely to raise costs and reduce demand growth.
• HSE is a high-priority area for Vedanta. Compliance with international and local regulations and standards, protecting our people, communities and the environment from harm and our operations from business interruptions are key focus areas.
• Vedanta has a Board-level Sustainability Committee, chaired by a Non-executive Director and attended by the Group CEO, which meets periodically to discuss HSE performance.
• Policies and standards are in place to mitigate and minimise any HSE-related occurrences. Safety standards issued/continue to be issued to reduce risk level in high-risk areas. Structured monitoring and a review mechanism and system of positive compliance reporting are in place.
• The Company has implemented a set of standards to align its sustainability framework with international practice. A structured sustainability assurance programme continues to operate in the business divisions covering environment, health, safety, community relations and human rights aspects, and is designed to embed our commitment at operational level.
• HSE experts have been inducted from reputed Indian and global organisations to bring in best-in-class practices.
• All businesses have appropriate policies in place for occupational health-related matters, supported by structured processes, controls and technology.
• Vedanta levies a strong focus on safety during project planning/execution, and contract workmen safety.
• The Company builds safety targets into performance management to incentivise safe behaviour and effective risk management.
• Leadership coaching was rolled out across businesses to make better risk decisions. Wave 2 of ‘Leadership in action’ has been launched to identify critical risks, and put in place critical controls and processes to measure, monitor and report effectiveness.
• Leadership remains focused on a zero-harm culture across the organisation and consistent application of ‘Life-Saving’ performance standards.
• Carbon forum with business representation monitors developments and sets out defensive policies, strategy and actions.
• Vedanta defines targets and implements action plans to reduce the carbon intensity of its operations. This includes reducing emission intensity and increasing renewable mix and green cover at locations.
• The Company engages with thgovernment on carbon policies and innovation technologies.
• Institutionalise systems to manage carbon risks and opportunities across the business over the lifecycle of its products.
• Engage with stakeholders in creating awareness and developing climate change solutions.
R5 Tailings dam stabilityA release of waste material leading to loss of life, injuries, environmental damage, reputational damage, financial costs and production impacts. A tailings dam failure is considered to be a catastrophic risk – i.e. a very high severity but very low frequency event that must be given the highest priority.
The appreciation of risk has improved further in the group.
• The Risk Management Committee included tailings dams on the Group Risk Register with a requirement for annual internal review and three-yearly external review.
• Operation of tailings dams is executed by suitably experienced personnel within the businesses.
• Full review of tailings dams and water storage facilities are being carried out in the Group. Follow-up reviews will be conducted based on the results until the control is verified.
• Management standard developed with business involvement. • Third-party expert assessment of the dams has been conducted to
identify tailings dams’ related risks by a reputed international firm. Improvement opportunities/remedial works in line with best practice are progressing.
• Individuals responsible for dam management have received training from a reputed agency.
• System of monitoring of the tailings dams has been instituted.
Opportunities and Risks continued
35Integrated R
eport
Managem
ent Review
Statutory R
eports
Financial Statements
Vedanta Limited Integrated Report and Annual Accounts 2017-18
Sustainability risks continuedImpact Mitigation Risk direction
R6 Managing relationship with stakeholdersThe continued success of our existing operations and future projects are in part dependent on broad support and a healthy relationship with our respective local communities. Failure to identify and manage local concerns and expectations can have a negative impact on relations and therefore affect the organisation’s reputation and social licence to operate and grow.
• CSR approach to community programmes is governed by the following key considerations: the needs of the local people and the development plan in line with the new Companies Act in India; CSR guidelines; CSR National Voluntary Guidelines of the Ministry of Corporate Affairs, Government of India and the UN’s Sustainable Development Goals SDGs.
• CSR Committees at business-level decide the focus areas of CSR, budget and their respective programmes.
• Sustainable development programmes are driven by stakeholder engagement and consultation along with baseline studies and need-based assessments.
• Periodic meetings with existing and potential Socially Responsible Investment (SRI) investors, lenders and analysts, as well as hosting a Sustainable Development Day in London, helps in two-way engagement and understanding the material issues for stakeholders.
• Every business has a dedicated CSR team. Key focus areas for CSR are healthcare, children’s wellbeing and education, community development (infrastructure), skilling of youth, sports and culture, agriculture and animal husbandry, drinking water and sanitation, women’s empowerment, environment restoration and protection, and programmes of national importance. We have a dedicated team of over 161 CSR personnel.
• Our CSR programmes help communities identify their priorities through participatory need assessment programmes and work closely with them to design programmes that seek to make progress towards improvements in the quality of life of local communities.
• Our business leadership teams have periodic engagements with the local communities to build relations based on trust and mutual benefit. Our businesses seek to identify and minimise any potentially negative operational impacts and risks through responsible behaviour – acting transparently and ethically, promoting dialogue and complying with commitments to stakeholders.
• The Company integrates its sustainability objectives into long-term plans.
Operational risksImpact Mitigation Risk direction
R7 Challenges to operationalise investments in the Aluminium and Power businessSome of our projects have been completed (pending commissioning) and may be subject to a number of challenges during the operationalisation phase. These may also include challenges around sourcing raw materials and infrastructure-related aspects.
Risk reduced compared to last year, due to ramp-up at Jharsuguda progressing satisfactorily.
• Global technical experts have been inducted to strengthen operational excellence.
• Operationalisation of Jharsuguda facilities is progressing satisfactorily. • Building of new intermediate facilities/infrastructure is progressing
well.• There is a continuous focus on plant operating efficiency improvement
programme to achieve design parameters, manpower rationalisation, logistics infrastructure and cost reduction initiatives.
• Vedanta continues to pursue developing sources of bauxite.• There is continuous augmentation of power security and
infrastructure.• Coal security is being strengthened by pursuing additional coal
linkages.• Key raw material linkages for alumina/aluminium business:
Infrastructure-related challenges are being addressed.• Strong management team continues to work towards sustainable low
cost of production, operational excellence and securing key raw material linkages.
• Talwandi Sabo Power Limited (TSPL) power plant matters are being addressed in a structured manner by a competent team.
36 Vedanta Limited Integrated Report and Annual Accounts 2017-18
Operational risks continuedImpact Mitigation Risk direction
R8 Discovery riskIncreased production rates from our growth-oriented operations place demand on exploration and prospecting initiatives to replace reserves and resources at a pace faster than depletion. A failure in our ability to discover new reserves, enhance existing reserves or develop new operations in sufficient quantities to maintain or grow the current level of our reserves could negatively affect our prospects. There are numerous uncertainties inherent in estimating ore and oil and gas reserves, and geological, technical and economic assumptions that are valid at the time of estimation. These may change significantly when new information becomes available.
• Vedanta has a dedicated exploration cell with continuous focus on enhancing exploration capabilities.
• There is appropriate organisation and adequate financial allocation in place for exploration.
• Our strategic priority is to add to our reserves and resources by extending resources at a faster rate than we deplete them, through continuous focus on the drilling and exploration programme.
• The Company will continue to work towards long-term supply contracts with mines to secure sufficient supply where required.
• Exploration-related systems are being strengthened and new technologies being utilised wherever appropriate.
• International technical experts and agencies are working closely with our exploration team to build on this target.
R9 Breaches in information/IT securityLike many global organisations, our reliance on computers and network technology is increasing. These systems could be subject to security breaches resulting in theft, disclosure or corruption of key/strategic information. Security breaches could also result in misappropriation of funds or disruptions to our business operations.
• Group-level standards and policies are in place to ensure uniformity in security stance and assessments.
• Chief Information Security Officer (CISO) at Group-level focuses on formulating the necessary frameworks, policies and procedures, and for leading any agreed Group-wide initiatives to mitigate risks.
• Various initiatives have been taken up to strengthen IT/ cyber security controls in the last few years.
• Cyber security risk is being addressed through increased standards, ongoing monitoring of threats and awareness initiatives throughout the organisation.
• IT system is in place to monitor logical access controls. • The Company will continue to carry out periodic IT security reviews by
experts and improve IT security standards.
R10 Loss of assets or profit due to natural calamitiesOur operations may be subject to a number of circumstances not wholly within the Group’s control. These include damage to or breakdown of equipment or infrastructure, unexpected geological variations or technical issues, extreme weather conditions and natural disasters – any of which could adversely affect production and/or costs.
• Vedanta has taken appropriate Group insurance cover to mitigate this risk.
• An external agency reviews the risk portfolio and adequacy of this cover and assists us in our insurance portfolio.
• Our underwriters are reputed institutions and have the capacity to underwrite our risk.
• An established mechanism of periodic insurance review is in place at all entities. However, any occurrence not fully covered by insurance could have an adverse effect on the Group’s business.
• The Company will continue to focus on capability building within the Group.
R11 Extension of production sharing contract of Cairn beyond 2020 at less favourable termsCairn India has 70% participating interest in Rajasthan Block. The Production Sharing Contract (PSC) of Rajasthan Block runs till 2020. Extension of the PSC of Cairn beyond 2020 at less favourable terms may have implications.
The Government of India notified PSC extension policy, which applies to Rajasthan Barmer block.
• There is ongoing dialogue with the Government and relevant stakeholders.
• Cairn Steering Committee is regularly reviewing the updates/progress, including plans to meet the timelines, and is continuously engaging with the stakeholders concerned.
• Carrying value factors additional 10% profit petroleum share, hence mitigating financial/ balance sheet risk.
Opportunities and Risks continued
37Integrated R
eport
Managem
ent Review
Statutory R
eports
Financial Statements
Vedanta Limited Integrated Report and Annual Accounts 2017-18
Compliance risksImpact Mitigation Risk direction
R12 Regulatory and legal riskWe have operations in many countries around the globe. These may be impacted because of legal and regulatory changes in the countries in which we operate, resulting in higher operating costs, and restrictions such as the imposition or increase in royalties or taxation rates, export duty, impacts on mining rights/bans, and change in legislation.
• The Group and its business divisions monitor regulatory developments on an ongoing basis.
• Business-level teams identify and meet regulatory obligations and respond to emerging requirements.
• Focus has been to communicate our responsible mining credentials through representations to government and industry associations.
• The Group will continue to demonstrate its commitment to sustainability by proactive environmental, safety and CSR practices. The Group ensures ongoing engagement with local community/ media/ NGOs.
• The Group ensures that its subsidiaries are SOX compliant.• A common compliance monitoring system is being implemented in
Group companies. Legal requirements and a responsible person for compliance have been mapped in the system.
• Legal counsel continues to work on strengthening the framework in the Group and on resolution of matters.
• Group-wide online portal is being rolled out for compliance reporting. Appropriate escalation and review mechanisms are in place.
• Competent in-house legal organisation is in place at all the businesses and the legal teams have been strengthened with induction of senior legal professionals across all Group companies.
• Standard Operating Procedures (SOPs) have been implemented across our businesses for compliance monitoring.
• Contract management framework has been strengthened with the issue of boiler plate clauses across the Group, which will form part of all contracts. All key contract types are standardised.
• Framework for monitoring performance against anti-bribery and corruption guidelines is also in place.
R13 Tax-related mattersOur businesses are in a tax regime and changes in any tax structure or any tax-related litigation may impact our profitability.
• The Tax Council reviews all key tax litigations and provides advice to the Group.
• Robust organisation is in place at business- and Group-level to handle tax-related matters.
• The Group engages, consults and takes opinion of reputable tax consulting firms.
• Reliance is placed on appropriate legal opinion and precedence.• The Group continues to take appropriate legal opinions and actions on
tax matters to mitigate the impact of any actions on the Group and its subsidiaries.
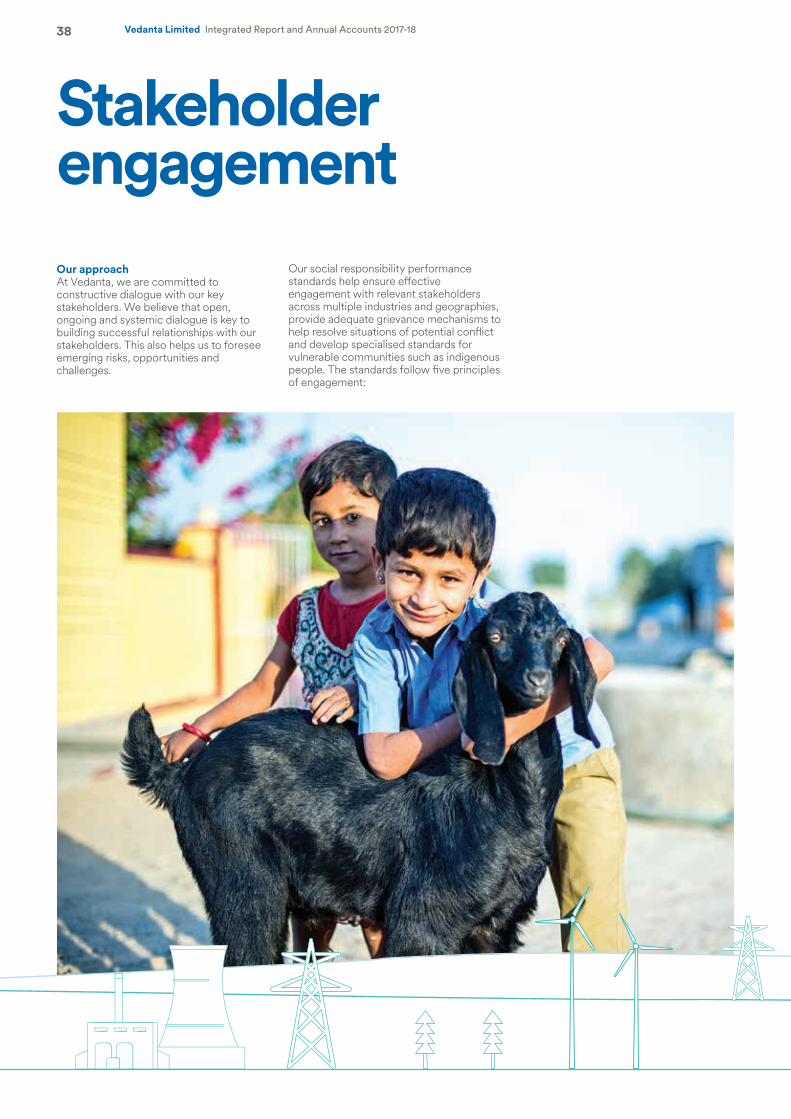
Vedanta Limited Integrated Report and Annual Accounts 2017-1838
Stakeholder engagementOur approachAt Vedanta, we are committed to constructive dialogue with our key stakeholders. We believe that open, ongoing and systemic dialogue is key to building successful relationships with our stakeholders. This also helps us to foresee emerging risks, opportunities and challenges.
Our social responsibility performance standards help ensure effective engagement with relevant stakeholders across multiple industries and geographies, provide adequate grievance mechanisms to help resolve situations of potential conflict and develop specialised standards for vulnerable communities such as indigenous people. The standards follow five principles of engagement:
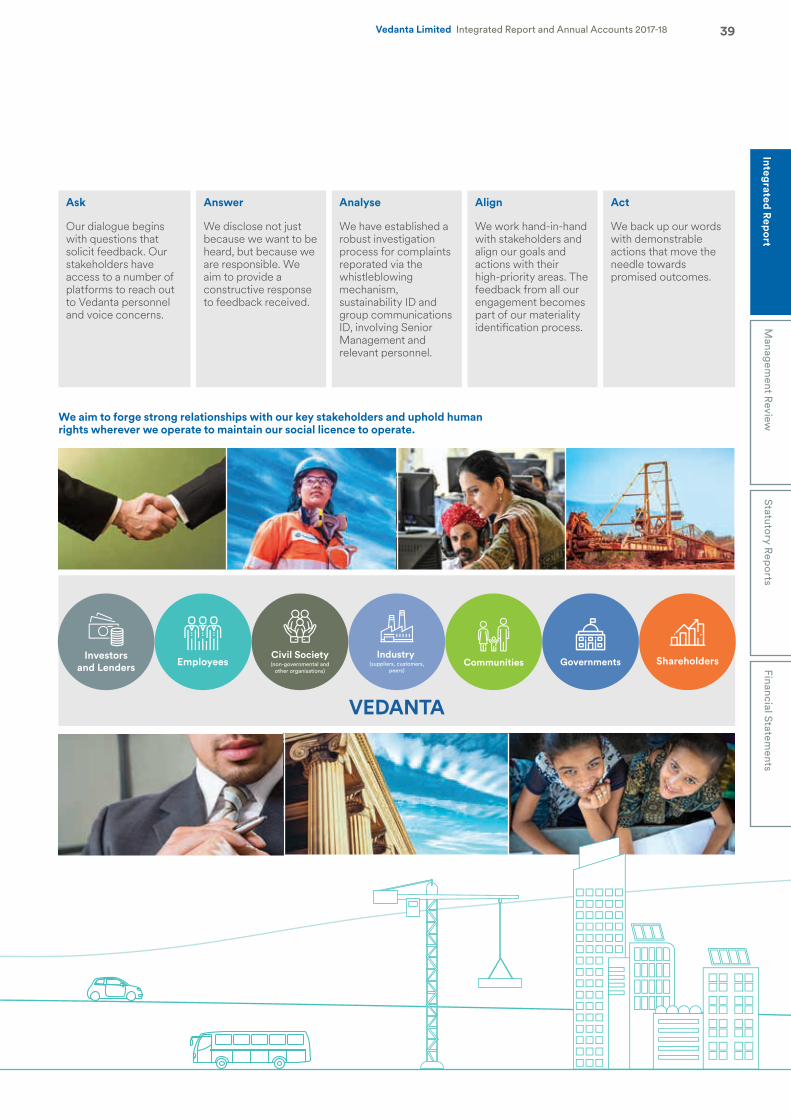
We aim to forge strong relationships with our key stakeholders and uphold human rights wherever we operate to maintain our social licence to operate.
VEDANTA
Governments
Vedanta Limited Integrated Report and Annual Accounts 2017-18 39Integrated R
eport
Managem
ent Review
Statutory R
eports
Financial Statements
Ask
Our dialogue begins with questions that solicit feedback. Our stakeholders have access to a number of platforms to reach out to Vedanta personnel and voice concerns.
Answer
We disclose not just because we want to be heard, but because we are responsible. We aim to provide a constructive response to feedback received.
Analyse
We have established a robust investigation process for complaints reporated via the whistleblowing mechanism, sustainability ID and group communications ID, involving Senior Management and relevant personnel.
Align
We work hand-in-hand with stakeholders and align our goals and actions with their high-priority areas. The feedback from all our engagement becomes part of our materiality identification process.
Act
We back up our words with demonstrable actions that move the needle towards promised outcomes.
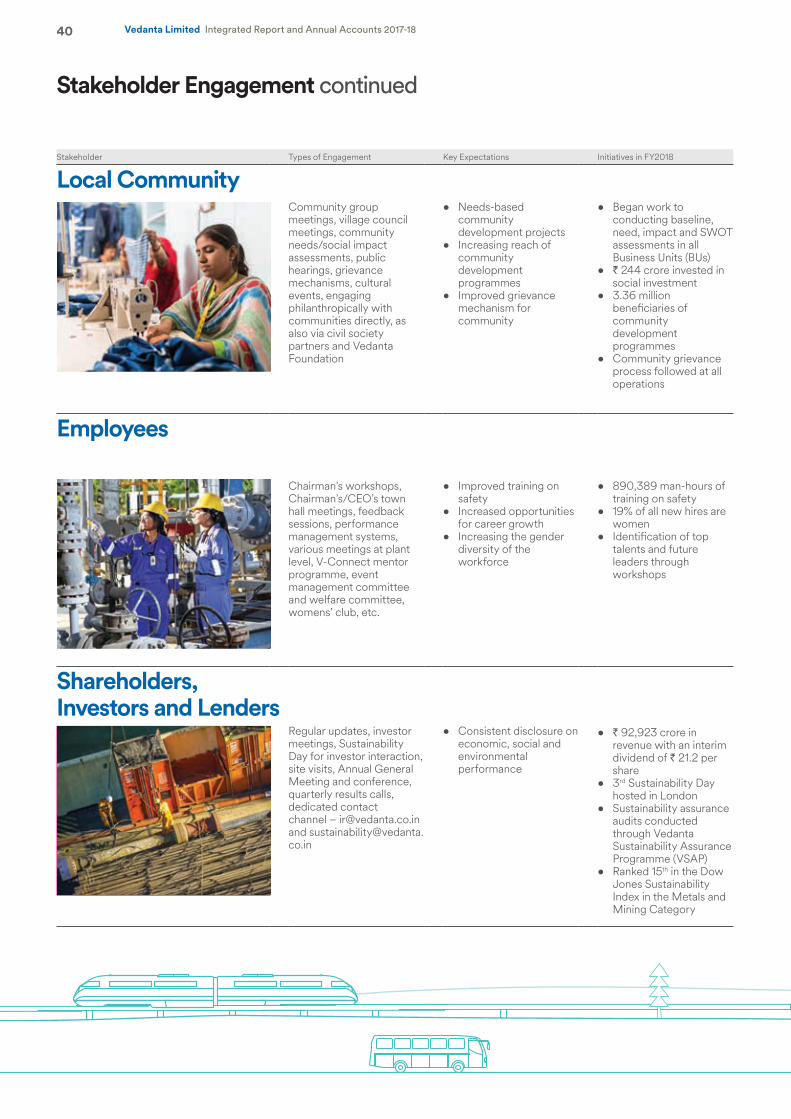
Vedanta Limited Integrated Report and Annual Accounts 2017-1840
Stakeholder Types of Engagement Key Expectations Initiatives in FY2018
Local CommunityCommunity group meetings, village council meetings, community needs/social impact assessments, public hearings, grievance mechanisms, cultural events, engaging philanthropically with communities directly, as also via civil society partners and Vedanta Foundation
• Needs-based community development projects
• Increasing reach of community development programmes
• Improved grievance mechanism for community
• Began work to conducting baseline, need, impact and SWOT assessments in all Business Units (BUs)
• ` 244 crore invested in social investment
• 3.36 million beneficiaries of community development programmes
• Community grievance process followed at all operations
Employees
Chairman’s workshops, Chairman’s/CEO’s town hall meetings, feedback sessions, performance management systems, various meetings at plant level, V-Connect mentor programme, event management committee and welfare committee, womens’ club, etc.
• Improved training on safety
• Increased opportunities for career growth
• Increasing the gender diversity of the workforce
• 890,389 man-hours of training on safety
• 19% of all new hires are women
• Identification of top talents and future leaders through workshops
Shareholders, Investors and Lenders
Regular updates, investor meetings, Sustainability Day for investor interaction, site visits, Annual General Meeting and conference, quarterly results calls, dedicated contact channel – [email protected] and [email protected]
• Consistent disclosure on economic, social and environmental performance
• ` 92,923 crore in revenue with an interim dividend of ` 21.2 per share
• 3rd Sustainability Day hosted in London
• Sustainability assurance audits conducted through Vedanta Sustainability Assurance Programme (VSAP)
• Ranked 15th in the Dow Jones Sustainability Index in the Metals and Mining Category
Stakeholder Engagement continued
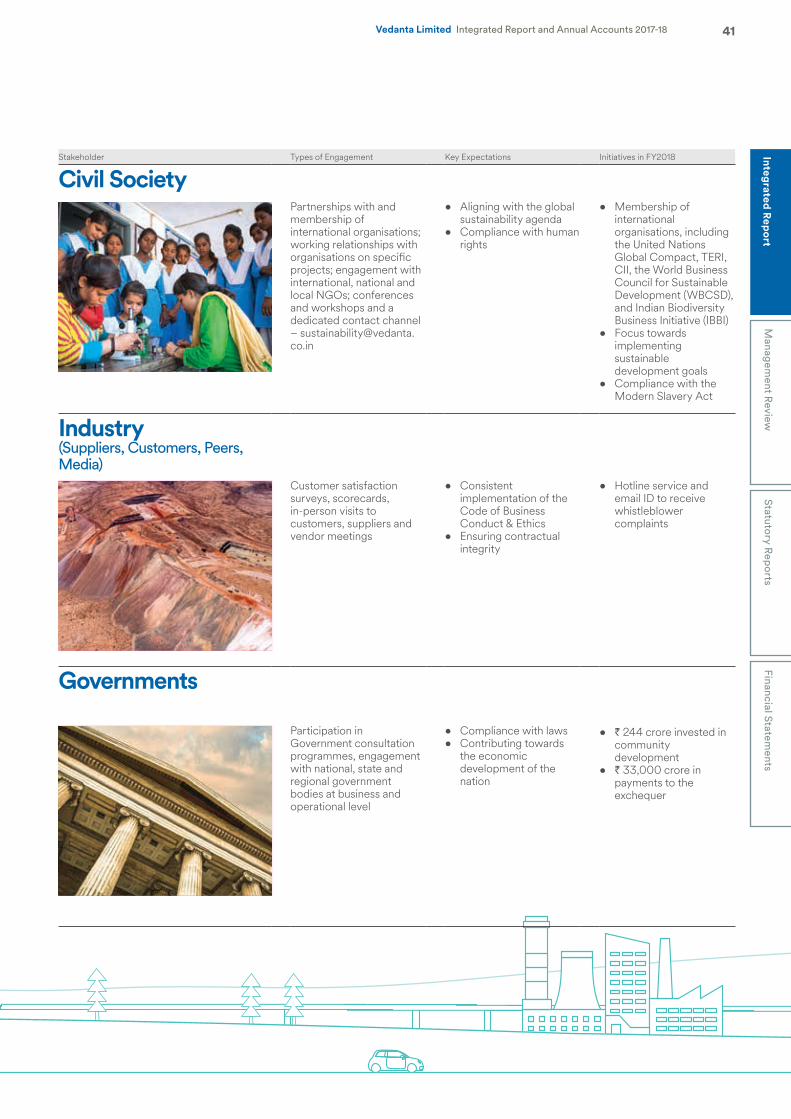
Vedanta Limited Integrated Report and Annual Accounts 2017-18 41Integrated R
eport
Managem
ent Review
Statutory R
eports
Financial Statements
Stakeholder Types of Engagement Key Expectations Initiatives in FY2018
Civil SocietyPartnerships with and membership of international organisations; working relationships with organisations on specific projects; engagement with international, national and local NGOs; conferences and workshops and a dedicated contact channel – [email protected]
• Aligning with the global sustainability agenda
• Compliance with human rights
• Membership of international organisations, including the United Nations Global Compact, TERI, CII, the World Business Council for Sustainable Development (WBCSD), and Indian Biodiversity Business Initiative (IBBI)
• Focus towards implementing sustainable development goals
• Compliance with the Modern Slavery Act
Industry (Suppliers, Customers, Peers, Media)
Customer satisfaction surveys, scorecards, in-person visits to customers, suppliers and vendor meetings
• Consistent implementation of the Code of Business Conduct & Ethics
• Ensuring contractual integrity
• Hotline service and email ID to receive whistleblower complaints
Governments
Participation in Government consultation programmes, engagement with national, state and regional government bodies at business and operational level
• Compliance with laws• Contributing towards
the economic development of the nation
• ` 244 crore invested in community development
• ` 33,000 crore in payments to the exchequer
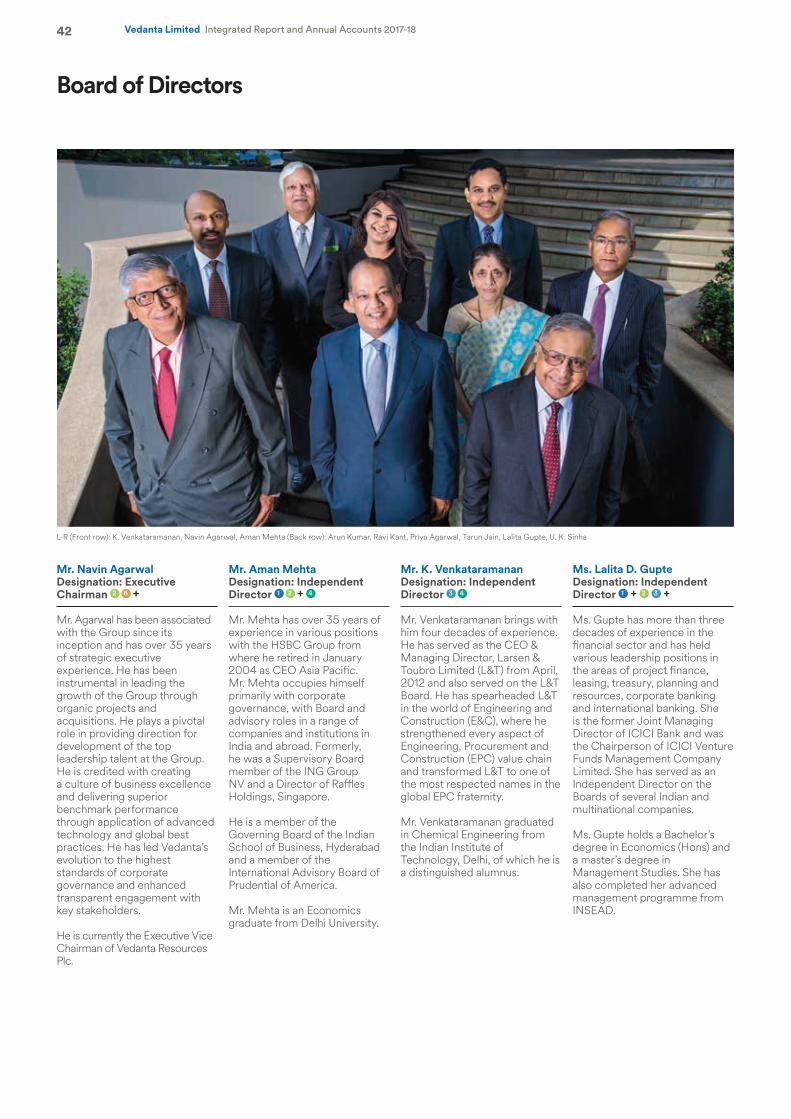
Vedanta Limited Integrated Report and Annual Accounts 2017-1842
Board of Directors
Mr. Aman MehtaDesignation: Independent Director 1 2 + 4
Mr. Mehta has over 35 years of experience in various positions with the HSBC Group from where he retired in January 2004 as CEO Asia Pacific. Mr. Mehta occupies himself primarily with corporate governance, with Board and advisory roles in a range of companies and institutions in India and abroad. Formerly, he was a Supervisory Board member of the ING Group NV and a Director of Raffles Holdings, Singapore.
He is a member of the Governing Board of the Indian School of Business, Hyderabad and a member of the International Advisory Board of Prudential of America.
Mr. Mehta is an Economics graduate from Delhi University.
Mr. Navin AgarwalDesignation: Executive Chairman 2 6 +
Mr. Agarwal has been associated with the Group since its inception and has over 35 years of strategic executive experience. He has been instrumental in leading the growth of the Group through organic projects and acquisitions. He plays a pivotal role in providing direction for development of the top leadership talent at the Group. He is credited with creating a culture of business excellence and delivering superior benchmark performance through application of advanced technology and global best practices. He has led Vedanta’s evolution to the highest standards of corporate governance and enhanced transparent engagement with key stakeholders.
He is currently the Executive Vice Chairman of Vedanta Resources Plc.
Mr. K. VenkataramananDesignation: Independent Director 3 4
Mr. Venkataramanan brings with him four decades of experience. He has served as the CEO & Managing Director, Larsen & Toubro Limited (L&T) from April, 2012 and also served on the L&T Board. He has spearheaded L&T in the world of Engineering and Construction (E&C), where he strengthened every aspect of Engineering, Procurement and Construction (EPC) value chain and transformed L&T to one of the most respected names in the global EPC fraternity.
Mr. Venkataramanan graduated in Chemical Engineering from the Indian Institute of Technology, Delhi, of which he is a distinguished alumnus.
L-R (Front row): K. Venkataramanan, Navin Agarwal, Aman Mehta (Back row): Arun Kumar, Ravi Kant, Priya Agarwal, Tarun Jain, Lalita Gupte, U. K. Sinha
Ms. Lalita D. GupteDesignation: Independent Director 1 + 2 3 +
Ms. Gupte has more than three decades of experience in the financial sector and has held various leadership positions in the areas of project finance, leasing, treasury, planning and resources, corporate banking and international banking. She is the former Joint Managing Director of ICICI Bank and was the Chairperson of ICICI Venture Funds Management Company Limited. She has served as an Independent Director on the Boards of several Indian and multinational companies.
Ms. Gupte holds a Bachelor’s degree in Economics (Hons) and a master’s degree in Management Studies. She has also completed her advanced management programme from INSEAD.
Vedanta Limited Integrated Report and Annual Accounts 2017-18 43Integrated R
eport
Managem
ent Review
Statutory R
eports
Financial Statements
Mr. U. K. SinhaDesignation: Independent Director 1 3 4
Mr. Sinha has over three decades of experience and has served as the Chairman of Securities and Exchange Board of India (SEBI) from February 2011 to March 2017. He was instrumental in bringing about key capital market reforms. Under his leadership, SEBI introduced significant regulatory amendments to the various acts enhancing corporate governance and disclosure norms. Prior to joining SEBI, he was the Chairman & MD of UTI Asset Management Company Pvt. Ltd. Mr. Sinha has also worked for the Department of Economic Affairs under the Ministry of Finance.
Mr. Tarun JainDesignation: Whole-time Director 3 4 5 6 7
Mr. Jain has over 35 years of diversified experience in strategic financial matters including, corporate finance, corporate strategy, business development, and mergers and acquisitions.
Mr. Jain is a graduate of the Institute of Cost and Works Accountants of India, a fellow member of the Institute of Chartered Accountants of India and the Institute of Company Secretaries of India.
Mr. Ravi KantDesignation: Independent Director 1 2 4 +
Mr. Kant has served as the Managing Director and Vice Chairman of Tata Motors, and Director of Electronics at Philips. He has worked with Titan Company, LML, Kinetic Engineering, Hawkins and Hindustan Aluminium. He has been the chairman/member of several reputed organisations such as Voltas, Tata Industries, Tata Advanced Materials, Jaguar Land Rover, Tata Daewoo Korea, Tata Thailand, etc. Currently he is on the Boards of Vedanta Limited, Hawkins India and Kone Finland.
He is currently the Chairman of IIIT Allahabad. He is on the advisory board of Accenture India and of China Europe International Business School, Shanghai, and business schools at IIT Bombay and Kharagpur. He also served as Chairman, Advisory Board at Akhandhyoti Eye Hospital.
Ms. Priya AgarwalDesignation: Non-executive Director 4
Ms. Agarwal brings with her experience in public relations with Ogilvy & Mather and in human resources with Korn Ferry International, Vedanta Resources and HDFC Bank and in strategic planning with Rediffusion Young & Rubicam.
She has completed her B.Sc. in Psychology with Business Management from the University of Warwick.
Key to committees1 Audit Committee2 Nomination and
Remuneration Committee3 Stakeholder Relationship Committee4 Corporate Social Responsibility
Committee5 Risk Management Committee6 Committee of Directors7 Financial Standing Committee+ Chairperson of the Committee
Mr. G. R. Arun KumarDesignation: Whole-time Director and Chief Financial Officer 3 5 6 7
Mr. Kumar has over 23 years of experience in serving global multinationals such as Hindustan Unilever and General Electric. Prior to joining Vedanta, he was the CFO for General Electric’s Asia-Pacific Lighting & Appliances businesses based out of Shanghai. He is responsible for the overall health of balance sheet, driving performance in profit and cash, treasury, investor relations, credit ratings, tax, secretarial, controllership, recording & reporting and other key strategic matters from time to time.
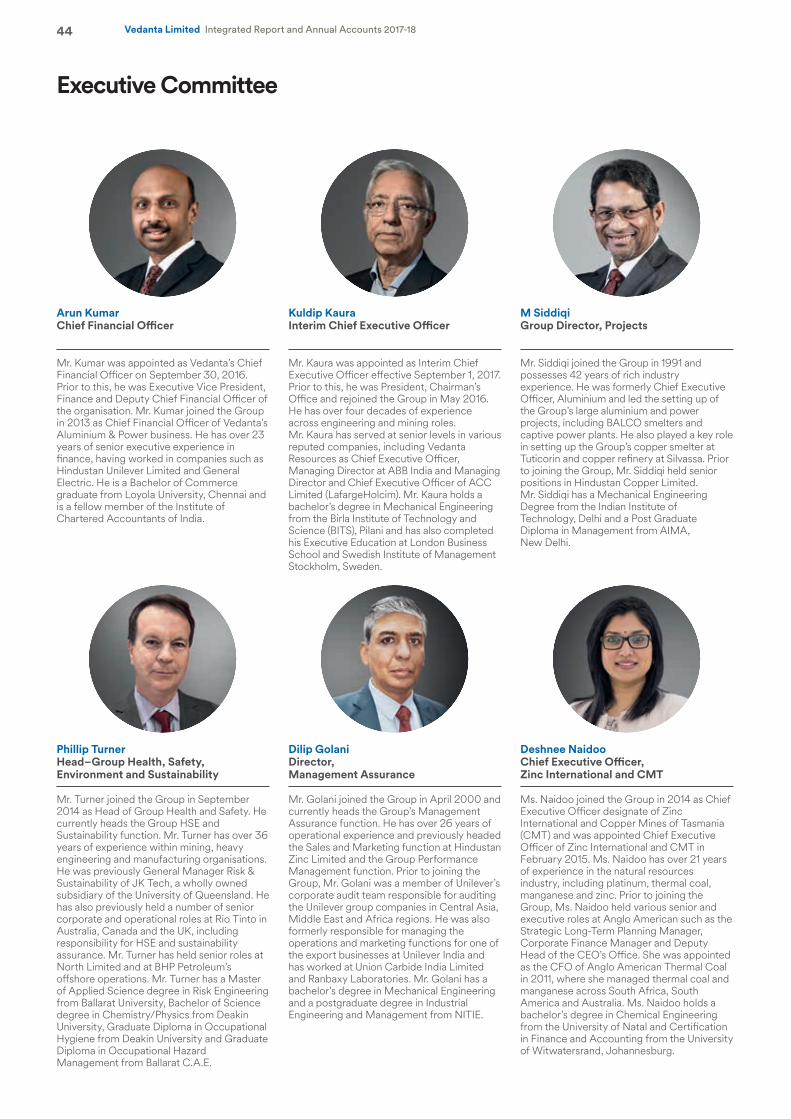
Vedanta Limited Integrated Report and Annual Accounts 2017-1844
Executive Committee
Arun KumarChief Financial Officer
Mr. Kumar was appointed as Vedanta’s Chief Financial Officer on September 30, 2016. Prior to this, he was Executive Vice President, Finance and Deputy Chief Financial Officer of the organisation. Mr. Kumar joined the Group in 2013 as Chief Financial Officer of Vedanta’s Aluminium & Power business. He has over 23 years of senior executive experience in finance, having worked in companies such as Hindustan Unilever Limited and General Electric. He is a Bachelor of Commerce graduate from Loyola University, Chennai and is a fellow member of the Institute of Chartered Accountants of India.
Kuldip KauraInterim Chief Executive Officer
Mr. Kaura was appointed as Interim Chief Executive Officer effective September 1, 2017. Prior to this, he was President, Chairman’s Office and rejoined the Group in May 2016. He has over four decades of experience across engineering and mining roles. Mr. Kaura has served at senior levels in various reputed companies, including Vedanta Resources as Chief Executive Officer, Managing Director at ABB India and Managing Director and Chief Executive Officer of ACC Limited (LafargeHolcim). Mr. Kaura holds a bachelor’s degree in Mechanical Engineering from the Birla Institute of Technology and Science (BITS), Pilani and has also completed his Executive Education at London Business School and Swedish Institute of Management Stockholm, Sweden.
M SiddiqiGroup Director, Projects
Mr. Siddiqi joined the Group in 1991 and possesses 42 years of rich industry experience. He was formerly Chief Executive Officer, Aluminium and led the setting up of the Group’s large aluminium and power projects, including BALCO smelters and captive power plants. He also played a key role in setting up the Group’s copper smelter at Tuticorin and copper refinery at Silvassa. Prior to joining the Group, Mr. Siddiqi held senior positions in Hindustan Copper Limited. Mr. Siddiqi has a Mechanical Engineering Degree from the Indian Institute of Technology, Delhi and a Post Graduate Diploma in Management from AIMA, New Delhi.
Phillip TurnerHead–Group Health, Safety, Environment and Sustainability
Mr. Turner joined the Group in September 2014 as Head of Group Health and Safety. He currently heads the Group HSE and Sustainability function. Mr. Turner has over 36 years of experience within mining, heavy engineering and manufacturing organisations. He was previously General Manager Risk & Sustainability of JK Tech, a wholly owned subsidiary of the University of Queensland. He has also previously held a number of senior corporate and operational roles at Rio Tinto in Australia, Canada and the UK, including responsibility for HSE and sustainability assurance. Mr. Turner has held senior roles at North Limited and at BHP Petroleum’s offshore operations. Mr. Turner has a Master of Applied Science degree in Risk Engineering from Ballarat University, Bachelor of Science degree in Chemistry/Physics from Deakin University, Graduate Diploma in Occupational Hygiene from Deakin University and Graduate Diploma in Occupational Hazard Management from Ballarat C.A.E.
Dilip GolaniDirector, Management Assurance
Mr. Golani joined the Group in April 2000 and currently heads the Group’s Management Assurance function. He has over 26 years of operational experience and previously headed the Sales and Marketing function at Hindustan Zinc Limited and the Group Performance Management function. Prior to joining the Group, Mr. Golani was a member of Unilever’s corporate audit team responsible for auditing the Unilever group companies in Central Asia, Middle East and Africa regions. He was also formerly responsible for managing the operations and marketing functions for one of the export businesses at Unilever India and has worked at Union Carbide India Limited and Ranbaxy Laboratories. Mr. Golani has a bachelor’s degree in Mechanical Engineering and a postgraduate degree in Industrial Engineering and Management from NITIE.
Deshnee NaidooChief Executive Officer, Zinc International and CMT
Ms. Naidoo joined the Group in 2014 as Chief Executive Officer designate of Zinc International and Copper Mines of Tasmania (CMT) and was appointed Chief Executive Officer of Zinc International and CMT in February 2015. Ms. Naidoo has over 21 years of experience in the natural resources industry, including platinum, thermal coal, manganese and zinc. Prior to joining the Group, Ms. Naidoo held various senior and executive roles at Anglo American such as the Strategic Long-Term Planning Manager, Corporate Finance Manager and Deputy Head of the CEO’s Office. She was appointed as the CFO of Anglo American Thermal Coal in 2011, where she managed thermal coal and manganese across South Africa, South America and Australia. Ms. Naidoo holds a bachelor’s degree in Chemical Engineering from the University of Natal and Certification in Finance and Accounting from the University of Witwatersrand, Johannesburg.
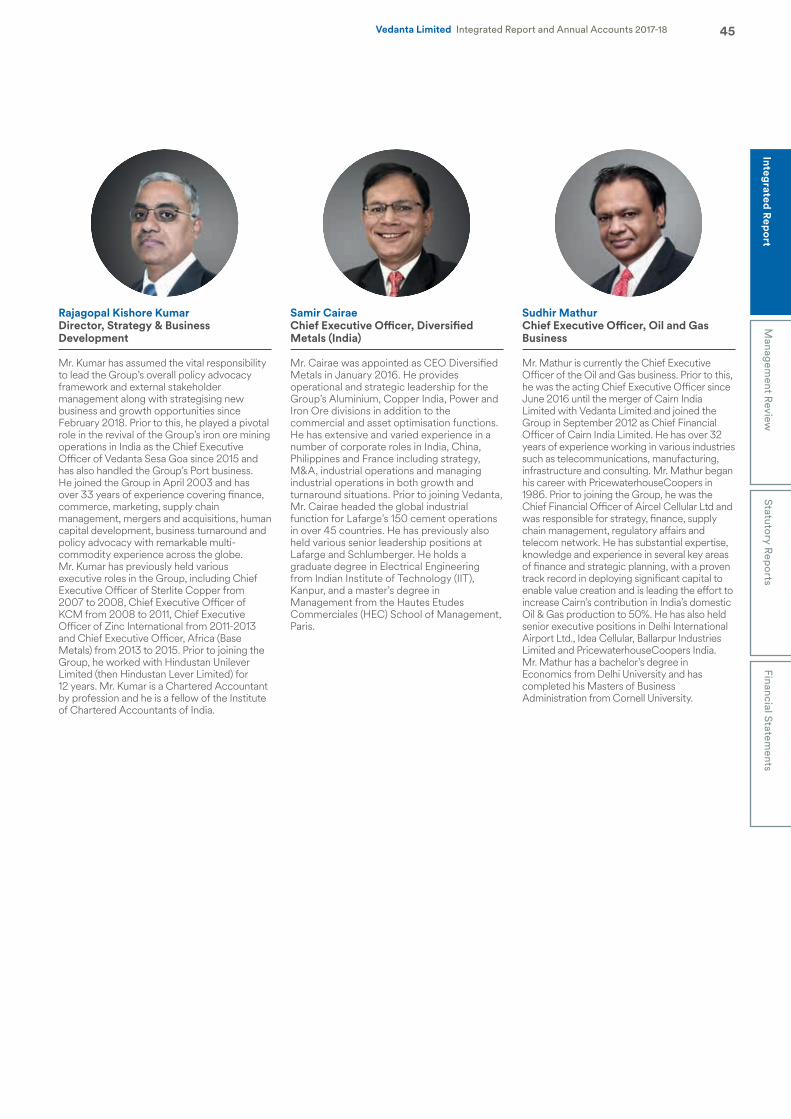
Vedanta Limited Integrated Report and Annual Accounts 2017-18 45Integrated R
eport
Managem
ent Review
Statutory R
eports
Financial Statements
Rajagopal Kishore KumarDirector, Strategy & Business Development
Mr. Kumar has assumed the vital responsibility to lead the Group’s overall policy advocacy framework and external stakeholder management along with strategising new business and growth opportunities since February 2018. Prior to this, he played a pivotal role in the revival of the Group’s iron ore mining operations in India as the Chief Executive Officer of Vedanta Sesa Goa since 2015 and has also handled the Group’s Port business. He joined the Group in April 2003 and has over 33 years of experience covering finance, commerce, marketing, supply chain management, mergers and acquisitions, human capital development, business turnaround and policy advocacy with remarkable multi-commodity experience across the globe. Mr. Kumar has previously held various executive roles in the Group, including Chief Executive Officer of Sterlite Copper from 2007 to 2008, Chief Executive Officer of KCM from 2008 to 2011, Chief Executive Officer of Zinc International from 2011-2013 and Chief Executive Officer, Africa (Base Metals) from 2013 to 2015. Prior to joining the Group, he worked with Hindustan Unilever Limited (then Hindustan Lever Limited) for 12 years. Mr. Kumar is a Chartered Accountant by profession and he is a fellow of the Institute of Chartered Accountants of India.
Samir CairaeChief Executive Officer, Diversified Metals (India)
Mr. Cairae was appointed as CEO Diversified Metals in January 2016. He provides operational and strategic leadership for the Group’s Aluminium, Copper India, Power and Iron Ore divisions in addition to the commercial and asset optimisation functions. He has extensive and varied experience in a number of corporate roles in India, China, Philippines and France including strategy, M&A, industrial operations and managing industrial operations in both growth and turnaround situations. Prior to joining Vedanta, Mr. Cairae headed the global industrial function for Lafarge’s 150 cement operations in over 45 countries. He has previously also held various senior leadership positions at Lafarge and Schlumberger. He holds a graduate degree in Electrical Engineering from Indian Institute of Technology (IIT), Kanpur, and a master’s degree in Management from the Hautes Etudes Commerciales (HEC) School of Management, Paris.
Sudhir MathurChief Executive Officer, Oil and Gas Business
Mr. Mathur is currently the Chief Executive Officer of the Oil and Gas business. Prior to this, he was the acting Chief Executive Officer since June 2016 until the merger of Cairn India Limited with Vedanta Limited and joined the Group in September 2012 as Chief Financial Officer of Cairn India Limited. He has over 32 years of experience working in various industries such as telecommunications, manufacturing, infrastructure and consulting. Mr. Mathur began his career with PricewaterhouseCoopers in 1986. Prior to joining the Group, he was the Chief Financial Officer of Aircel Cellular Ltd and was responsible for strategy, finance, supply chain management, regulatory affairs and telecom network. He has substantial expertise, knowledge and experience in several key areas of finance and strategic planning, with a proven track record in deploying significant capital to enable value creation and is leading the effort to increase Cairn’s contribution in India’s domestic Oil & Gas production to 50%. He has also held senior executive positions in Delhi International Airport Ltd., Idea Cellular, Ballarpur Industries Limited and PricewaterhouseCoopers India. Mr. Mathur has a bachelor’s degree in Economics from Delhi University and has completed his Masters of Business Administration from Cornell University.
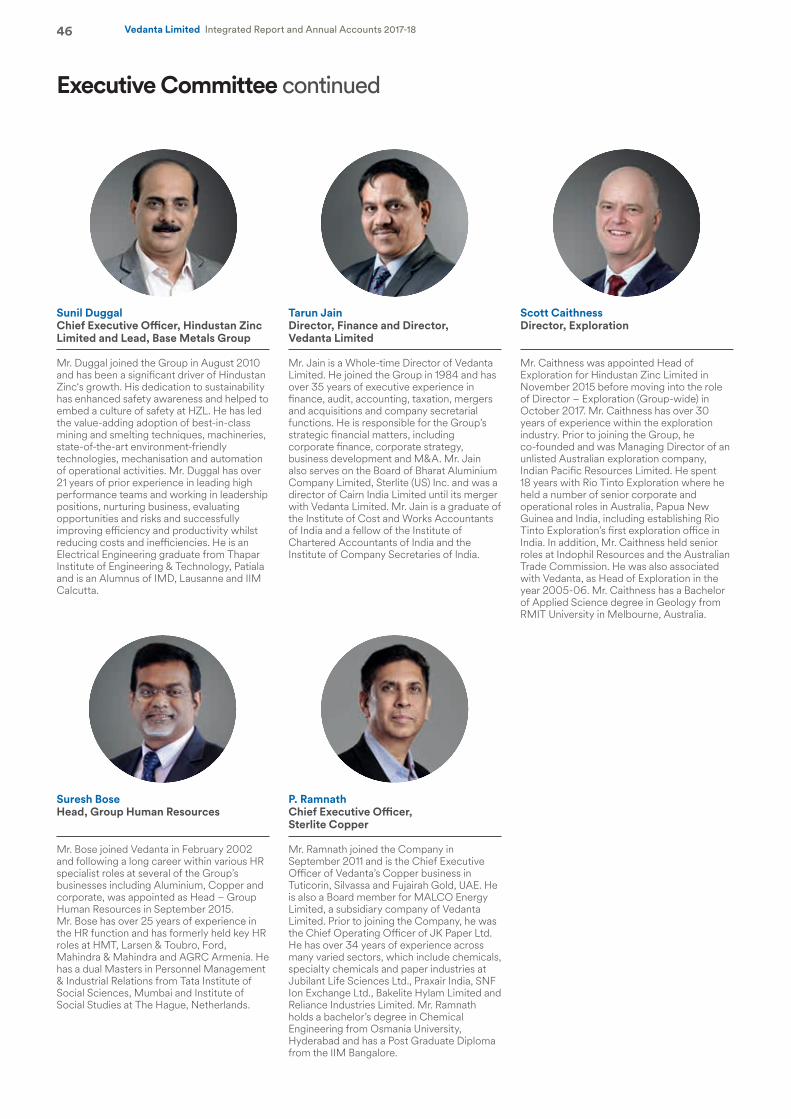
Vedanta Limited Integrated Report and Annual Accounts 2017-1846
Sunil DuggalChief Executive Officer, Hindustan Zinc Limited and Lead, Base Metals Group
Mr. Duggal joined the Group in August 2010 and has been a significant driver of Hindustan Zinc‘s growth. His dedication to sustainability has enhanced safety awareness and helped to embed a culture of safety at HZL. He has led the value-adding adoption of best-in-class mining and smelting techniques, machineries, state-of-the-art environment-friendly technologies, mechanisation and automation of operational activities. Mr. Duggal has over 21 years of prior experience in leading high performance teams and working in leadership positions, nurturing business, evaluating opportunities and risks and successfully improving efficiency and productivity whilst reducing costs and inefficiencies. He is an Electrical Engineering graduate from Thapar Institute of Engineering & Technology, Patiala and is an Alumnus of IMD, Lausanne and IIM Calcutta.
Executive Committee continued
Tarun JainDirector, Finance and Director, Vedanta Limited
Mr. Jain is a Whole-time Director of Vedanta Limited. He joined the Group in 1984 and has over 35 years of executive experience in finance, audit, accounting, taxation, mergers and acquisitions and company secretarial functions. He is responsible for the Group’s strategic financial matters, including corporate finance, corporate strategy, business development and M&A. Mr. Jain also serves on the Board of Bharat Aluminium Company Limited, Sterlite (US) Inc. and was a director of Cairn India Limited until its merger with Vedanta Limited. Mr. Jain is a graduate of the Institute of Cost and Works Accountants of India and a fellow of the Institute of Chartered Accountants of India and the Institute of Company Secretaries of India.
Scott CaithnessDirector, Exploration
Mr. Caithness was appointed Head of Exploration for Hindustan Zinc Limited in November 2015 before moving into the role of Director – Exploration (Group-wide) in October 2017. Mr. Caithness has over 30 years of experience within the exploration industry. Prior to joining the Group, he co-founded and was Managing Director of an unlisted Australian exploration company, Indian Pacific Resources Limited. He spent 18 years with Rio Tinto Exploration where he held a number of senior corporate and operational roles in Australia, Papua New Guinea and India, including establishing Rio Tinto Exploration’s first exploration office in India. In addition, Mr. Caithness held senior roles at Indophil Resources and the Australian Trade Commission. He was also associated with Vedanta, as Head of Exploration in the year 2005-06. Mr. Caithness has a Bachelor of Applied Science degree in Geology from RMIT University in Melbourne, Australia.
Suresh BoseHead, Group Human Resources
Mr. Bose joined Vedanta in February 2002 and following a long career within various HR specialist roles at several of the Group’s businesses including Aluminium, Copper and corporate, was appointed as Head – Group Human Resources in September 2015. Mr. Bose has over 25 years of experience in the HR function and has formerly held key HR roles at HMT, Larsen & Toubro, Ford, Mahindra & Mahindra and AGRC Armenia. He has a dual Masters in Personnel Management & Industrial Relations from Tata Institute of Social Sciences, Mumbai and Institute of Social Studies at The Hague, Netherlands.
P. RamnathChief Executive Officer, Sterlite Copper
Mr. Ramnath joined the Company in September 2011 and is the Chief Executive Officer of Vedanta’s Copper business in Tuticorin, Silvassa and Fujairah Gold, UAE. He is also a Board member for MALCO Energy Limited, a subsidiary company of Vedanta Limited. Prior to joining the Company, he was the Chief Operating Officer of JK Paper Ltd. He has over 34 years of experience across many varied sectors, which include chemicals, specialty chemicals and paper industries at Jubilant Life Sciences Ltd., Praxair India, SNF Ion Exchange Ltd., Bakelite Hylam Limited and Reliance Industries Limited. Mr. Ramnath holds a bachelor’s degree in Chemical Engineering from Osmania University, Hyderabad and has a Post Graduate Diploma from the IIM Bangalore.
Vedanta Limited Integrated Report and Annual Accounts 2017-18 47Integrated R
eport
Managem
ent Review
Statutory R
eports
Financial Statements
Naveen SinghalChief Executive Officer, Sesa Goa - Iron Ore Business
Mr. Singhal is the Chief Executive Officer of Vedanta Sesa Goa Iron Ore, the Iron Ore business vertical of Vedanta Limited. Mr. Singhal comes with over three decades of experience, of which 22 years has been in the natural resources arena, having handled various portfolios in metals & mining and cement industry. Mr. Singhal joined Vedanta in 2003 and was instrumental in driving the growth projects in Hindustan Zinc from conceptualisation to commissioning through best-in-class mining and smelting technologies, mechanisation and automation alongside effective stakeholder management. He has been a key pillar to bring about strategic alignment in business with his strong techno-commercial mind set. Prior to joining Vedanta, he served in leadership roles at Swaraj Mazda, Shri Ram and Dunkan Goenka Group and played a pivotal role in the areas of supply chain management, assets acquisition, business turnaround strategy, general management and project management. Mr. Singhal has a bachelor’s degree in Mechanical and Industrial Engineering from IIT, Roorkee and has a post graduate diploma in Industrial Engineering and Management from NITIE, Mumbai.
Arun AroraHead, Corporate Communications
Mr. Arora joined Vedanta Group in 2014, as Chief Communications Officer, Cairn Oil & Gas. He assumed charge of Group Communications in September, 2017. He has over 30 years of experience in various facets of communications, including branding, advertising, media, social & digital media, publications, crisis communication and internal communication with employees and various stakeholders. Mr. Arora has a degree in Mechanical Engineering and has pursued his MBA in marketing, along with additional qualification in Journalism and Mass Communications. Prior to joining Vedanta group, he headed communication functions for organisations such as Escorts, Maruti Suzuki, GMR DIAL, Jindal Steel & Power and GVK, encompassing sectors such as automobiles, airports, infrastructure, power, roads, steel, mining and oil & gas.
Ajay Kumar DixitChief Executive Officer, Alumina and Power
Mr. Dixit joined the Company in 2015 and is currently operating as CEO Alumina effective February 2017, prior to which he was operating as CEO, Power for Vedanta Limited since May 2015. Prior to joining the Company, Mr. Dixit worked at Siemens for nearly 36 years, in various profiles in the industry and energy sectors before taking over as CEO – Energy sector for South Asia. At Vedanta, he is leading the power plant units vertical with a capacity of over 9 GW and driving strategies to achieve the full potential of the business. Mr. Dixit is an electrical engineer from Delhi College of Engineering.
Abhijit PatiChief Executive Officer, Aluminium, Jharsuguda
Mr. Pati joined the Group in 2008 and is currently operating as CEO Aluminium, Jharsuguda, effective from December 2016. Prior to this, he was handling the Group’s Aluminium business since March 2015, with his wealth of knowledge gained in over 28 years in the industry. He has been a significant driver of the Company’s aluminium growth. Mr. Pati is a two-times gold medal holder and an honours graduate in Chemical Engineering from the prestigious Calcutta University and holds an MBA from IMI Delhi.
Vikas SharmaChief Executive Officer, BALCO
Mr. Sharma joined the Company in 2012 and is currently the Chief Executive Officer of BALCO effective March 2017, prior to which he was associated with HZL as COO Smelters, HZL. Mr. Sharma is known as a result-driven individual in the industry, with experience of over 29 years in various national and multinational companies. He holds the experience of serving HMT, Praxair, JSW and AMP in various key positions. He has done his B.E. (Mechanical) Honours from Engineering College, Kota and MBA (Marketing) from Sikkim Manipal University.
Vedanta Limited Integrated Report and Annual Accounts 2017-1848
Awards and Accolades
Sl. No.Name of Awards Category/Recognition Recipient
Operational Excellence 1 Frost & Sullivan and FICCI’s ‘India
Manufacturing Excellence Award’Future Ready Factory Award – Metals Sector, Large Business
BALCO
2 Frost & Sullivan and FICCI’s India Manufacturing Excellence Award’
Future Ready Factory Award – Metals Sector, Large Business
Sterlite Copper
3 India Today’s Safaigiri Award Best Public Private Partnership (PPP) Model for Sewage Treatment Plant
HZL
4 CII-SR-EHS Excellence Award ‘5-Star’ for Excellence in EHS Practices Cairn Oil & Gas
5 Par Excellence Award in 5th National Conclave of Quality Circle Forum of India
5S & Kaizen HZL
Sustainable Development & CSR 6 Innov Award Gold for CSR Nand Ghar, Vedanta Limited
7 Golden Peacock Occupational Health & Safety Award
Oil-Production Cairn Oil & Gas
8 BT CSR Excellence Award Promotion of Education Sterlite Copper
9 India CSR Community Initiative Award Sustainable Livelihood category Vedanta Limited – Lanjigarh
10 Greentech Safety Gold Award Mines & Metal Sector Vedanta Limited – Lanjigarh
11 The ET 2 Good 4 Good Certificate Excellent management of various Community Development
BALCO
12 Best Risk Management Practices Award by ECGC
Contribution by Indian exporters in building Brand India
HZL
13 CNBC TV18 and ICICI Lombard – India Risk Management Award
Best Risk Management Framework and Systems - Sustainability
HZL
14 FAME Excellence Award Platinum Category, ‘Women Empowerment’ project
Vedanta Limited – Lanjigarh
15 GreenTech Safety Gold Award Power Thermal Sector TSPL
16 ET Now CSR Award Health, Water & Water Management Cairn Oil & Gas
17 FICCI Road Safety Awards Safe Vehicles Category Cairn Oil & Gas
18 ET Now CSR Leadership Award Best CSR Practices HZL
19 Kalinga Safety Gold Award Excellence in Safety Vedanta Limited – Lanjigarh
20 CII-IGBC Green Building Platinum Award Existing Green Building HZL
Human Resources 21 CII National HR Excellence Award Significant achievement in HR Excellence Vedanta Limited – Jharsuguda
22 Golden Peacock HR Excellence Award Mining & Metallurgy Sterlite Copper
Innovation & Technology 23 IPPAI Innovation Award Energy Conservation in the category of
best sustained innovations amongst the innovations
Vedanta Limited - Jharsuguda
24 FICCI Safety Systems Excellence Award Large Size category Mining Sector Cairn Oil & Gas
Vedanta Limited Integrated Report and Annual Accounts 2017-18 49Integrated R
eport
Managem
ent Review
Statutory R
eports
Financial Statements
Sl. No.Name of Awards Category/Recognition Recipient
Energy Conservation 25 ‘Excellent Energy Efficient Unit’ Award by CII Excellence in Energy Management Sterlite Copper
26 CII National Award for Excellence in Water Management
Water Management Sesa Goa
27 D.L. Shah Gold Award Project Implementation in reduction of Specific Coal Consumption (SCC) in 540 MW Power Plant.
BALCO
28 Rajasthan Energy Conservation Award Best energy conservation practices HZL
Industry Achiever/National Contributor 29 Overall Diamond Arrow Award Mining Companies in Operations in
NamibiaZinc International
30 Future Women Leader & Summit Awards • Business Woman of the Year• Social Leader of the Year• Woman Leader of the Year• Science & Technology Leader of
the Year
Sesa Goa
Business Awards 31 Leaders Award 2017 Excellent management in the area of
Sustainability, Environmental Management, HSE Practices, Legal Compliance and Stakeholder and Community Engagement
BALCO
Corporate Awards 32 Corporate Treasurer Awards Best Financial Planning and Analysis
StrategyVedanta Limited
33 FTI’s India Disclosure Index – Corporate Disclosure Champion
Metals & Mining Category Vedanta Limited
34 CT Awards Asia’s Best Treasury and Finance Strategies of 2017 – Best Financial Planning & Analysis Strategy
Vedanta Limited
35 Institutional Investor Magazine’s Asia Rankings
Basic Materials Category(Best CEO by Sell-side – FirstBest Investor Relations – Third)
Vedanta Limited
36 The Asset Triple A Treasury, Trade, Supply Chain and Risk Management Awards
Best Structured Trade Finance Solution: Structured trade finance deal to meet working capital demands
Vedanta Limited
37 LACP 2017 Vision Awards Annual Report Competition- Top 5 Indian Reports of 2017- Silver Award (for excellence within
industry on development of organisation’s annual report for past fiscal year)
Vedanta Limited
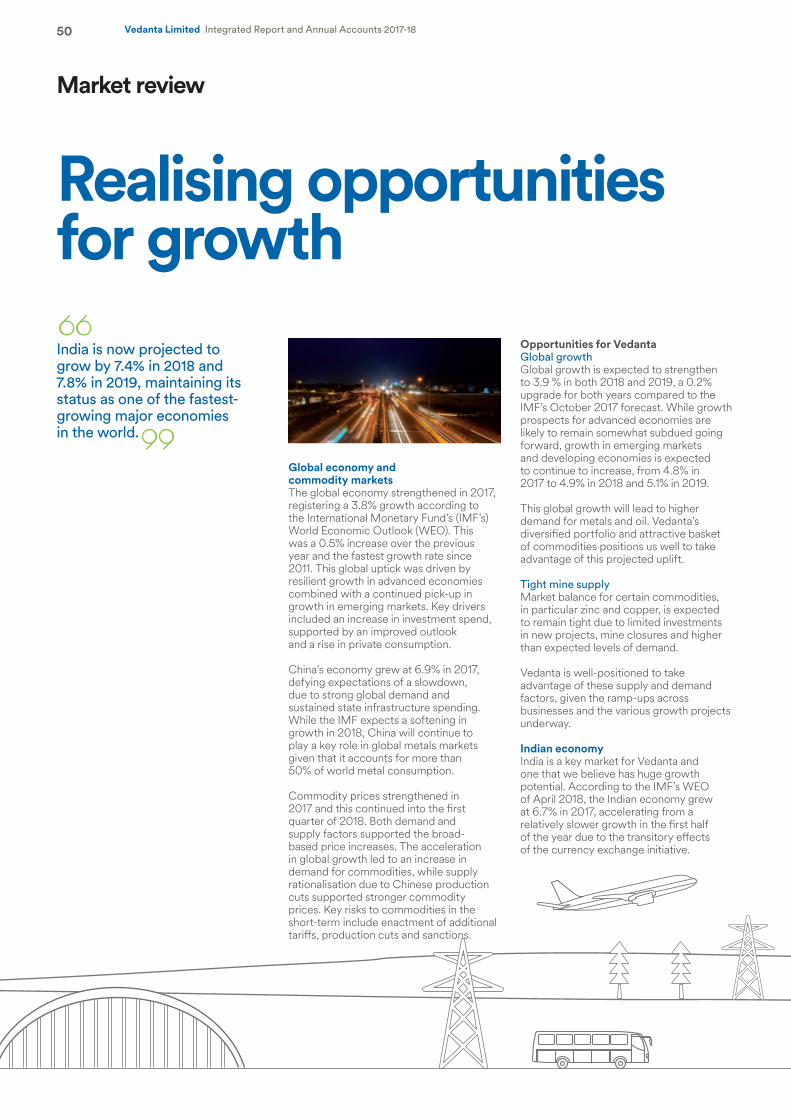
50 Vedanta Limited Integrated Report and Annual Accounts 2017-18
Market review
Realising opportunities for growthIndia is now projected to grow by 7.4% in 2018 and 7.8% in 2019, maintaining its status as one of the fastest-growing major economies in the world.
Global economy and commodity marketsThe global economy strengthened in 2017, registering a 3.8% growth according to the International Monetary Fund’s (IMF’s) World Economic Outlook (WEO). This was a 0.5% increase over the previous year and the fastest growth rate since 2011. This global uptick was driven by resilient growth in advanced economies combined with a continued pick-up in growth in emerging markets. Key drivers included an increase in investment spend, supported by an improved outlook and a rise in private consumption.
China’s economy grew at 6.9% in 2017, defying expectations of a slowdown, due to strong global demand and sustained state infrastructure spending. While the IMF expects a softening in growth in 2018, China will continue to play a key role in global metals markets given that it accounts for more than 50% of world metal consumption.
Commodity prices strengthened in 2017 and this continued into the first quarter of 2018. Both demand and supply factors supported the broad-based price increases. The acceleration in global growth led to an increase in demand for commodities, while supply rationalisation due to Chinese production cuts supported stronger commodity prices. Key risks to commodities in the short-term include enactment of additional tariffs, production cuts and sanctions.
Opportunities for VedantaGlobal growthGlobal growth is expected to strengthen to 3.9 % in both 2018 and 2019, a 0.2% upgrade for both years compared to the IMF’s October 2017 forecast. While growth prospects for advanced economies are likely to remain somewhat subdued going forward, growth in emerging markets and developing economies is expected to continue to increase, from 4.8% in 2017 to 4.9% in 2018 and 5.1% in 2019.
This global growth will lead to higher demand for metals and oil. Vedanta’s diversified portfolio and attractive basket of commodities positions us well to take advantage of this projected uplift.
Tight mine supplyMarket balance for certain commodities, in particular zinc and copper, is expected to remain tight due to limited investments in new projects, mine closures and higher than expected levels of demand.
Vedanta is well-positioned to take advantage of these supply and demand factors, given the ramp-ups across businesses and the various growth projects underway.
Indian economyIndia is a key market for Vedanta and one that we believe has huge growth potential. According to the IMF’s WEO of April 2018, the Indian economy grew at 6.7% in 2017, accelerating from a relatively slower growth in the first half of the year due to the transitory effects of the currency exchange initiative.
51Integrated R
eport
Managem
ent Review
Statutory Rep
ortsFinancial Statem
entsVedanta Limited Integrated Report and Annual Accounts 2017-18
increased clarity on the licencing around mining. Key regulatory reforms around opening commercial coal mining to the private sector and the launch of Open Acreage Licensing (OAL) in the Oil & Gas sector to improve exploration are some of steps in the past year towards creating a more favourable mining environment.
Positive demographic factors such as an increasing workforce and urbanisation are driving a greater need for infrastructure development. The Indian Government continues to invest in the infrastructure sector, having increased its spending in the Union Budget 2018-19. In September 2017, the Government launched ‘Saubhagya’, a new scheme to ensure electrification of all remaining willing households in the country. In October 2017, the Government launched ‘Bharatmala’, a new programme to optimise efficiency of road traffic by bridging critical infrastructure gaps. Initiatives like these would be a major driver for economic growth.
Looking ahead, we expect to see a continued focus and further investments
A number of major reforms were undertaken in 2017. On July 1, 2017, India launched its biggest tax reform, the Goods and Services Tax (GST). The implementation of the GST will help reduce internal barriers to trade and increase efficiency and tax compliance. The GST eliminates cascading of taxes and encourages ‘Make in India’, thus driving growth momentum. In a separate reform, major stressed assets were marked for resolution under the Insolvency and Bankruptcy Code 2016, to ensure a time-bound insolvency resolution, helping corporates clean balance sheets and reduce debt.
These policy measures have improved external confidence in the Indian economy and are set to provide a boost to economic growth. More importantly, they have enabled India to jump 30 places in the World Bank’s Ease of Doing Business rankings and resulted in the first upgrade in its sovereign debt ratings for 14 years – to ‘Baa2’ from ‘Baa3’.
Opportunities for VedantaAn India-focused growth agendaIndia is now projected to grow by 7.4% in 2018 and 7.8% in 2019, maintaining its status as one of the fastest-growing major economies in the world, according to the IMF’s WEO. In the medium-term, growth is expected to rise gradually as structural reforms continue to be implemented, raising productivity and incentivising private investment. An amended MMDRA (Mines and Mineral Development and Regulation Act) in 2015 has brought
in the infrastructure, transportation and power sectors. We also anticipate changes in Government policy to incentivise domestic metal and energy production and to reduce dependence on imports. These initiatives will lead to an increasing demand for domestically produced metals.
Vedanta, as the only diversified natural resources company in India, is uniquely positioned to leverage India’s growth potential by catering to that demand. With such a vast domestic market, everything we produce in India, we aim to sell in India.
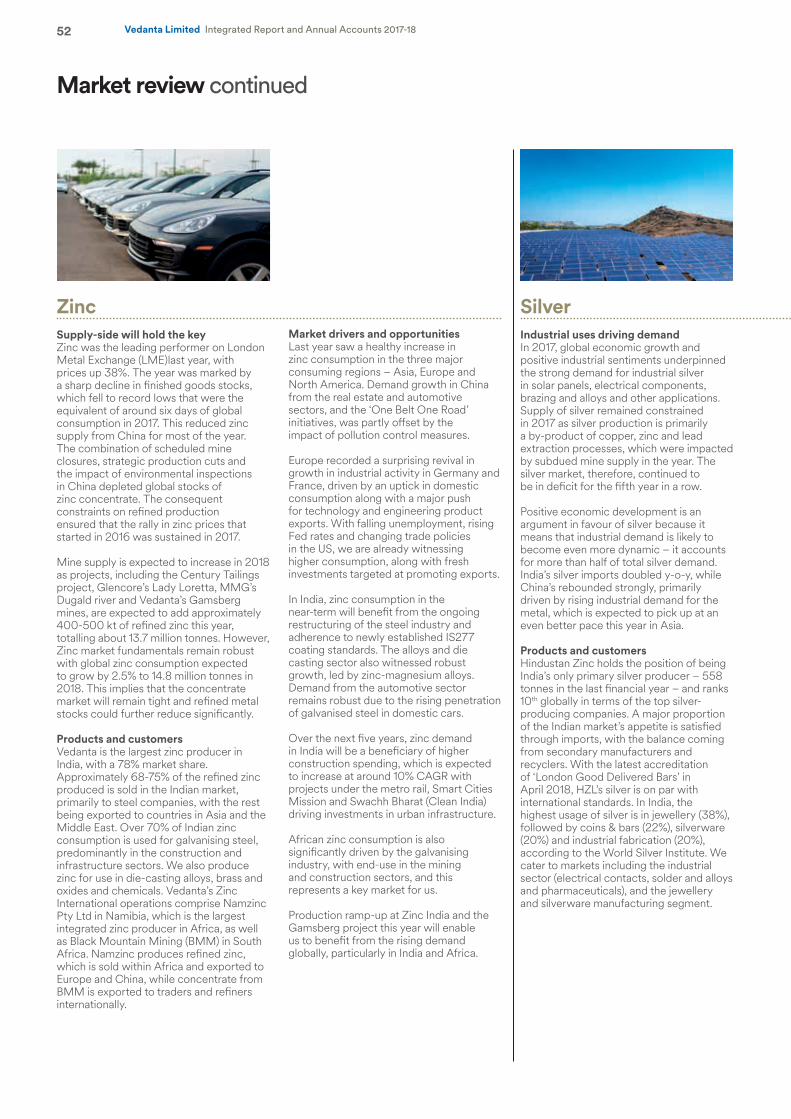
52 Vedanta Limited Integrated Report and Annual Accounts 2017-18
Market drivers and opportunitiesLast year saw a healthy increase in zinc consumption in the three major consuming regions – Asia, Europe and North America. Demand growth in China from the real estate and automotive sectors, and the ‘One Belt One Road’ initiatives, was partly offset by the impact of pollution control measures.
Europe recorded a surprising revival in growth in industrial activity in Germany and France, driven by an uptick in domestic consumption along with a major push for technology and engineering product exports. With falling unemployment, rising Fed rates and changing trade policies in the US, we are already witnessing higher consumption, along with fresh investments targeted at promoting exports.
In India, zinc consumption in the near-term will benefit from the ongoing restructuring of the steel industry and adherence to newly established IS277 coating standards. The alloys and die casting sector also witnessed robust growth, led by zinc-magnesium alloys. Demand from the automotive sector remains robust due to the rising penetration of galvanised steel in domestic cars.
Over the next five years, zinc demand in India will be a beneficiary of higher construction spending, which is expected to increase at around 10% CAGR with projects under the metro rail, Smart Cities Mission and Swachh Bharat (Clean India) driving investments in urban infrastructure.
African zinc consumption is also significantly driven by the galvanising industry, with end-use in the mining and construction sectors, and this represents a key market for us.
Production ramp-up at Zinc India and the Gamsberg project this year will enable us to benefit from the rising demand globally, particularly in India and Africa.
ZincSupply-side will hold the keyZinc was the leading performer on London Metal Exchange (LME)last year, with prices up 38%. The year was marked by a sharp decline in finished goods stocks, which fell to record lows that were the equivalent of around six days of global consumption in 2017. This reduced zinc supply from China for most of the year. The combination of scheduled mine closures, strategic production cuts and the impact of environmental inspections in China depleted global stocks of zinc concentrate. The consequent constraints on refined production ensured that the rally in zinc prices that started in 2016 was sustained in 2017.
Mine supply is expected to increase in 2018 as projects, including the Century Tailings project, Glencore’s Lady Loretta, MMG’s Dugald river and Vedanta’s Gamsberg mines, are expected to add approximately 400-500 kt of refined zinc this year, totalling about 13.7 million tonnes. However, Zinc market fundamentals remain robust with global zinc consumption expected to grow by 2.5% to 14.8 million tonnes in 2018. This implies that the concentrate market will remain tight and refined metal stocks could further reduce significantly.
Products and customersVedanta is the largest zinc producer in India, with a 78% market share. Approximately 68-75% of the refined zinc produced is sold in the Indian market, primarily to steel companies, with the rest being exported to countries in Asia and the Middle East. Over 70% of Indian zinc consumption is used for galvanising steel, predominantly in the construction and infrastructure sectors. We also produce zinc for use in die-casting alloys, brass and oxides and chemicals. Vedanta’s Zinc International operations comprise Namzinc Pty Ltd in Namibia, which is the largest integrated zinc producer in Africa, as well as Black Mountain Mining (BMM) in South Africa. Namzinc produces refined zinc, which is sold within Africa and exported to Europe and China, while concentrate from BMM is exported to traders and refiners internationally.
SilverIndustrial uses driving demandIn 2017, global economic growth and positive industrial sentiments underpinned the strong demand for industrial silver in solar panels, electrical components, brazing and alloys and other applications. Supply of silver remained constrained in 2017 as silver production is primarily a by-product of copper, zinc and lead extraction processes, which were impacted by subdued mine supply in the year. The silver market, therefore, continued to be in deficit for the fifth year in a row.
Positive economic development is an argument in favour of silver because it means that industrial demand is likely to become even more dynamic – it accounts for more than half of total silver demand. India’s silver imports doubled y-o-y, while China’s rebounded strongly, primarily driven by rising industrial demand for the metal, which is expected to pick up at an even better pace this year in Asia.
Products and customersHindustan Zinc holds the position of being India’s only primary silver producer – 558 tonnes in the last financial year – and ranks 10th globally in terms of the top silver-producing companies. A major proportion of the Indian market’s appetite is satisfied through imports, with the balance coming from secondary manufacturers and recyclers. With the latest accreditation of ‘London Good Delivered Bars’ in April 2018, HZL’s silver is on par with international standards. In India, the highest usage of silver is in jewellery (38%), followed by coins & bars (22%), silverware (20%) and industrial fabrication (20%), according to the World Silver Institute. We cater to markets including the industrial sector (electrical contacts, solder and alloys and pharmaceuticals), and the jewellery and silverware manufacturing segment.
Market review continued
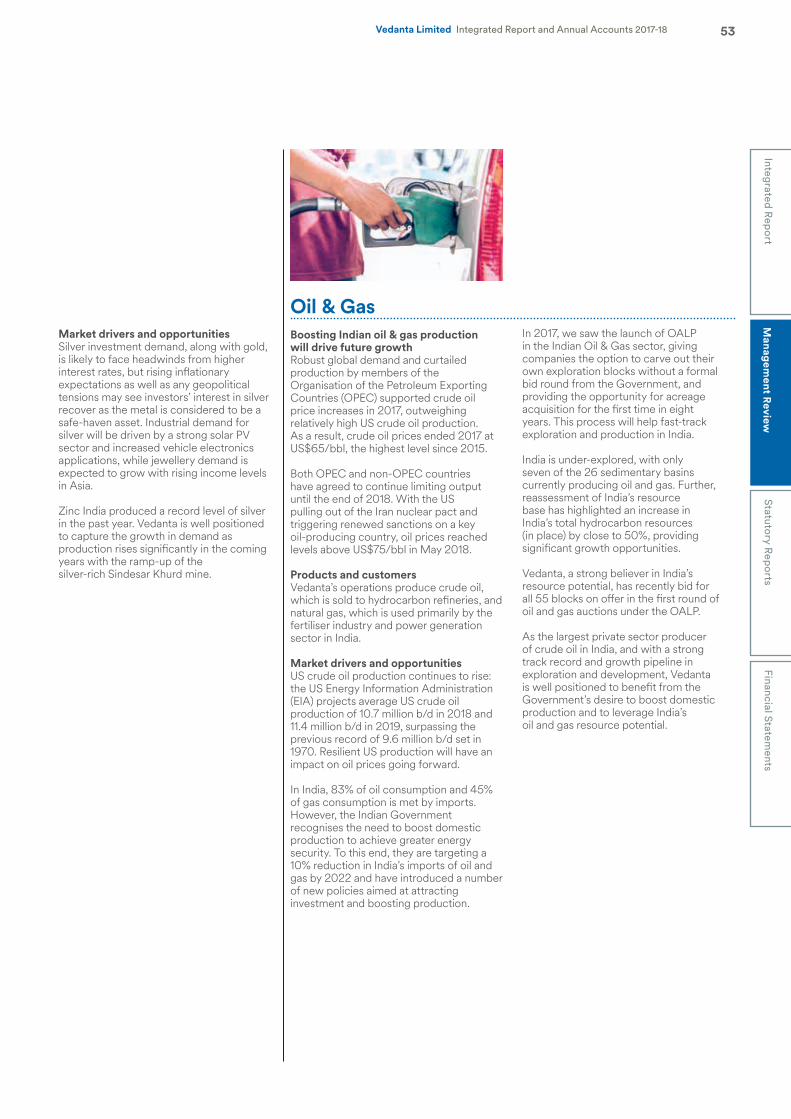
53Integrated R
eport
Managem
ent Review
Statutory Rep
ortsFinancial Statem
entsVedanta Limited Integrated Report and Annual Accounts 2017-18
Oil & GasBoosting Indian oil & gas production will drive future growthRobust global demand and curtailed production by members of the Organisation of the Petroleum Exporting Countries (OPEC) supported crude oil price increases in 2017, outweighing relatively high US crude oil production. As a result, crude oil prices ended 2017 at US$65/bbl, the highest level since 2015.
Both OPEC and non-OPEC countries have agreed to continue limiting output until the end of 2018. With the US pulling out of the Iran nuclear pact and triggering renewed sanctions on a key oil-producing country, oil prices reached levels above US$75/bbl in May 2018.
Products and customersVedanta’s operations produce crude oil, which is sold to hydrocarbon refineries, and natural gas, which is used primarily by the fertiliser industry and power generation sector in India.
Market drivers and opportunitiesUS crude oil production continues to rise: the US Energy Information Administration (EIA) projects average US crude oil production of 10.7 million b/d in 2018 and 11.4 million b/d in 2019, surpassing the previous record of 9.6 million b/d set in 1970. Resilient US production will have an impact on oil prices going forward.
In India, 83% of oil consumption and 45% of gas consumption is met by imports. However, the Indian Government recognises the need to boost domestic production to achieve greater energy security. To this end, they are targeting a 10% reduction in India’s imports of oil and gas by 2022 and have introduced a number of new policies aimed at attracting investment and boosting production.
Market drivers and opportunitiesSilver investment demand, along with gold, is likely to face headwinds from higher interest rates, but rising inflationary expectations as well as any geopolitical tensions may see investors’ interest in silver recover as the metal is considered to be a safe-haven asset. Industrial demand for silver will be driven by a strong solar PV sector and increased vehicle electronics applications, while jewellery demand is expected to grow with rising income levels in Asia.
Zinc India produced a record level of silver in the past year. Vedanta is well positioned to capture the growth in demand as production rises significantly in the coming years with the ramp-up of the silver-rich Sindesar Khurd mine.
In 2017, we saw the launch of OALP in the Indian Oil & Gas sector, giving companies the option to carve out their own exploration blocks without a formal bid round from the Government, and providing the opportunity for acreage acquisition for the first time in eight years. This process will help fast-track exploration and production in India.
India is under-explored, with only seven of the 26 sedimentary basins currently producing oil and gas. Further, reassessment of India’s resource base has highlighted an increase in India’s total hydrocarbon resources (in place) by close to 50%, providing significant growth opportunities.
Vedanta, a strong believer in India’s resource potential, has recently bid for all 55 blocks on offer in the first round of oil and gas auctions under the OALP.
As the largest private sector producer of crude oil in India, and with a strong track record and growth pipeline in exploration and development, Vedanta is well positioned to benefit from the Government’s desire to boost domestic production and to leverage India’s oil and gas resource potential.
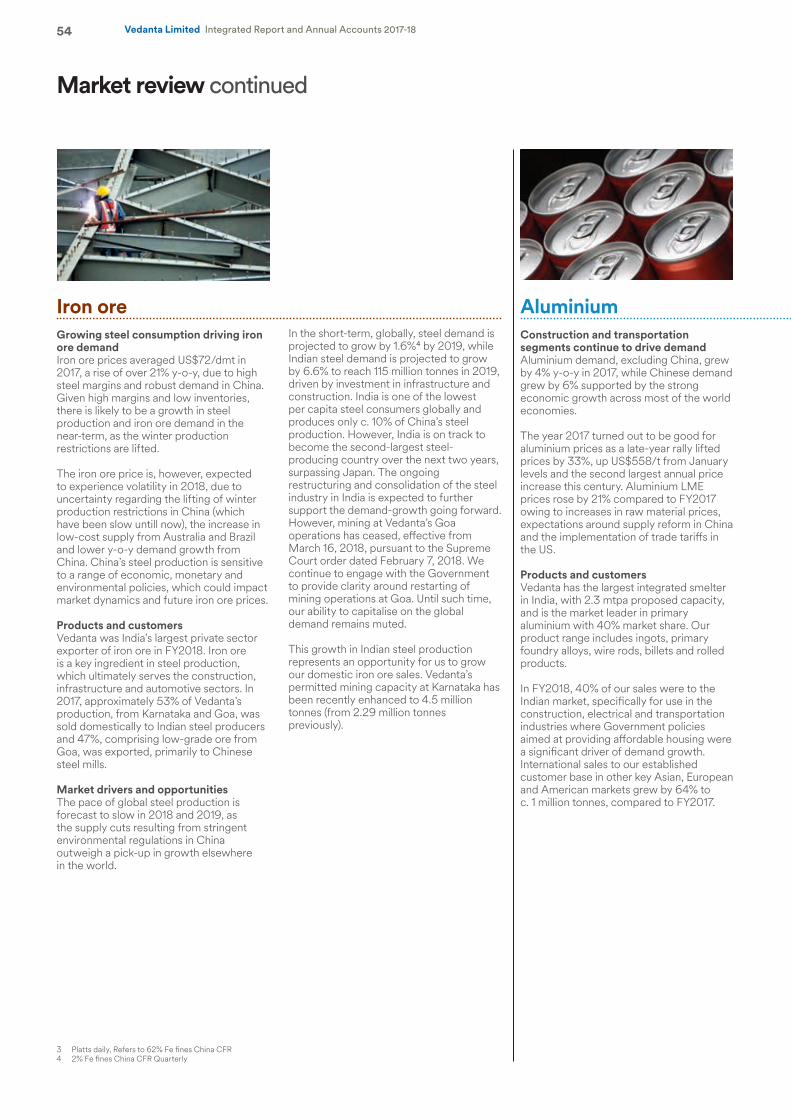
54 Vedanta Limited Integrated Report and Annual Accounts 2017-18
Iron oreGrowing steel consumption driving iron ore demandIron ore prices averaged US$72/dmt in 2017, a rise of over 21% y-o-y, due to high steel margins and robust demand in China. Given high margins and low inventories, there is likely to be a growth in steel production and iron ore demand in the near-term, as the winter production restrictions are lifted.
The iron ore price is, however, expected to experience volatility in 2018, due to uncertainty regarding the lifting of winter production restrictions in China (which have been slow untill now), the increase in low-cost supply from Australia and Brazil and lower y-o-y demand growth from China. China’s steel production is sensitive to a range of economic, monetary and environmental policies, which could impact market dynamics and future iron ore prices.
Products and customersVedanta was India’s largest private sector exporter of iron ore in FY2018. Iron ore is a key ingredient in steel production, which ultimately serves the construction, infrastructure and automotive sectors. In 2017, approximately 53% of Vedanta’s production, from Karnataka and Goa, was sold domestically to Indian steel producers and 47%, comprising low-grade ore from Goa, was exported, primarily to Chinese steel mills.
Market drivers and opportunitiesThe pace of global steel production is forecast to slow in 2018 and 2019, as the supply cuts resulting from stringent environmental regulations in China outweigh a pick-up in growth elsewhere in the world.
Market review continued
In the short-term, globally, steel demand is projected to grow by 1.6%4 by 2019, while Indian steel demand is projected to grow by 6.6% to reach 115 million tonnes in 2019, driven by investment in infrastructure and construction. India is one of the lowest per capita steel consumers globally and produces only c. 10% of China’s steel production. However, India is on track to become the second-largest steel-producing country over the next two years, surpassing Japan. The ongoing restructuring and consolidation of the steel industry in India is expected to further support the demand-growth going forward. However, mining at Vedanta’s Goa operations has ceased, effective from March 16, 2018, pursuant to the Supreme Court order dated February 7, 2018. We continue to engage with the Government to provide clarity around restarting of mining operations at Goa. Until such time, our ability to capitalise on the global demand remains muted.
This growth in Indian steel production represents an opportunity for us to grow our domestic iron ore sales. Vedanta’s permitted mining capacity at Karnataka has been recently enhanced to 4.5 million tonnes (from 2.29 million tonnes previously).
AluminiumConstruction and transportation segments continue to drive demandAluminium demand, excluding China, grew by 4% y-o-y in 2017, while Chinese demand grew by 6% supported by the strong economic growth across most of the world economies.
The year 2017 turned out to be good for aluminium prices as a late-year rally lifted prices by 33%, up US$558/t from January levels and the second largest annual price increase this century. Aluminium LME prices rose by 21% compared to FY2017 owing to increases in raw material prices, expectations around supply reform in China and the implementation of trade tariffs in the US.
Products and customersVedanta has the largest integrated smelter in India, with 2.3 mtpa proposed capacity, and is the market leader in primary aluminium with 40% market share. Our product range includes ingots, primary foundry alloys, wire rods, billets and rolled products.
In FY2018, 40% of our sales were to the Indian market, specifically for use in the construction, electrical and transportation industries where Government policies aimed at providing affordable housing were a significant driver of demand growth. International sales to our established customer base in other key Asian, European and American markets grew by 64% to c. 1 million tonnes, compared to FY2017.
3 Platts daily, Refers to 62% Fe fines China CFR4 2% Fe fines China CFR Quarterly
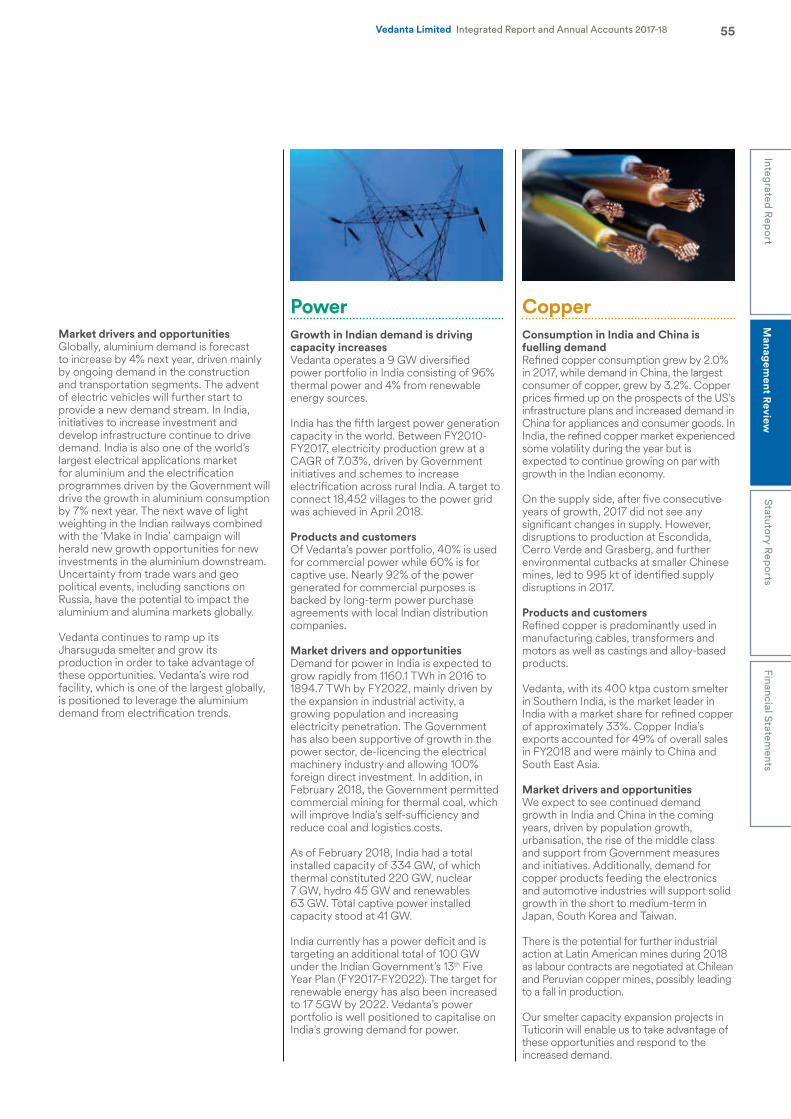
55Integrated R
eport
Managem
ent Review
Statutory Rep
ortsFinancial Statem
entsVedanta Limited Integrated Report and Annual Accounts 2017-18
Market drivers and opportunitiesGlobally, aluminium demand is forecast to increase by 4% next year, driven mainly by ongoing demand in the construction and transportation segments. The advent of electric vehicles will further start to provide a new demand stream. In India, initiatives to increase investment and develop infrastructure continue to drive demand. India is also one of the world’s largest electrical applications market for aluminium and the electrification programmes driven by the Government will drive the growth in aluminium consumption by 7% next year. The next wave of light weighting in the Indian railways combined with the ‘Make in India’ campaign will herald new growth opportunities for new investments in the aluminium downstream. Uncertainty from trade wars and geo political events, including sanctions on Russia, have the potential to impact the aluminium and alumina markets globally.
Vedanta continues to ramp up its Jharsuguda smelter and grow its production in order to take advantage of these opportunities. Vedanta’s wire rod facility, which is one of the largest globally, is positioned to leverage the aluminium demand from electrification trends.
PowerGrowth in Indian demand is driving capacity increasesVedanta operates a 9 GW diversified power portfolio in India consisting of 96% thermal power and 4% from renewable energy sources.
India has the fifth largest power generation capacity in the world. Between FY2010-FY2017, electricity production grew at a CAGR of 7.03%, driven by Government initiatives and schemes to increase electrification across rural India. A target to connect 18,452 villages to the power grid was achieved in April 2018.
Products and customersOf Vedanta’s power portfolio, 40% is used for commercial power while 60% is for captive use. Nearly 92% of the power generated for commercial purposes is backed by long-term power purchase agreements with local Indian distribution companies.
Market drivers and opportunitiesDemand for power in India is expected to grow rapidly from 1160.1 TWh in 2016 to 1894.7 TWh by FY2022, mainly driven by the expansion in industrial activity, a growing population and increasing electricity penetration. The Government has also been supportive of growth in the power sector, de-licencing the electrical machinery industry and allowing 100% foreign direct investment. In addition, in February 2018, the Government permitted commercial mining for thermal coal, which will improve India’s self-sufficiency and reduce coal and logistics costs.
As of February 2018, India had a total installed capacity of 334 GW, of which thermal constituted 220 GW, nuclear 7 GW, hydro 45 GW and renewables 63 GW. Total captive power installed capacity stood at 41 GW.
India currently has a power deficit and is targeting an additional total of 100 GW under the Indian Government’s 13th Five Year Plan (FY2017-FY2022). The target for renewable energy has also been increased to 17 5GW by 2022. Vedanta’s power portfolio is well positioned to capitalise on India’s growing demand for power.
CopperConsumption in India and China is fuelling demandRefined copper consumption grew by 2.0% in 2017, while demand in China, the largest consumer of copper, grew by 3.2%. Copper prices firmed up on the prospects of the US’s infrastructure plans and increased demand in China for appliances and consumer goods. In India, the refined copper market experienced some volatility during the year but is expected to continue growing on par with growth in the Indian economy.
On the supply side, after five consecutive years of growth, 2017 did not see any significant changes in supply. However, disruptions to production at Escondida, Cerro Verde and Grasberg, and further environmental cutbacks at smaller Chinese mines, led to 995 kt of identified supply disruptions in 2017.
Products and customersRefined copper is predominantly used in manufacturing cables, transformers and motors as well as castings and alloy-based products.
Vedanta, with its 400 ktpa custom smelter in Southern India, is the market leader in India with a market share for refined copper of approximately 33%. Copper India’s exports accounted for 49% of overall sales in FY2018 and were mainly to China and South East Asia.
Market drivers and opportunitiesWe expect to see continued demand growth in India and China in the coming years, driven by population growth, urbanisation, the rise of the middle class and support from Government measures and initiatives. Additionally, demand for copper products feeding the electronics and automotive industries will support solid growth in the short to medium-term in Japan, South Korea and Taiwan.
There is the potential for further industrial action at Latin American mines during 2018 as labour contracts are negotiated at Chilean and Peruvian copper mines, possibly leading to a fall in production.
Our smelter capacity expansion projects in Tuticorin will enable us to take advantage of these opportunities and respond to the increased demand.
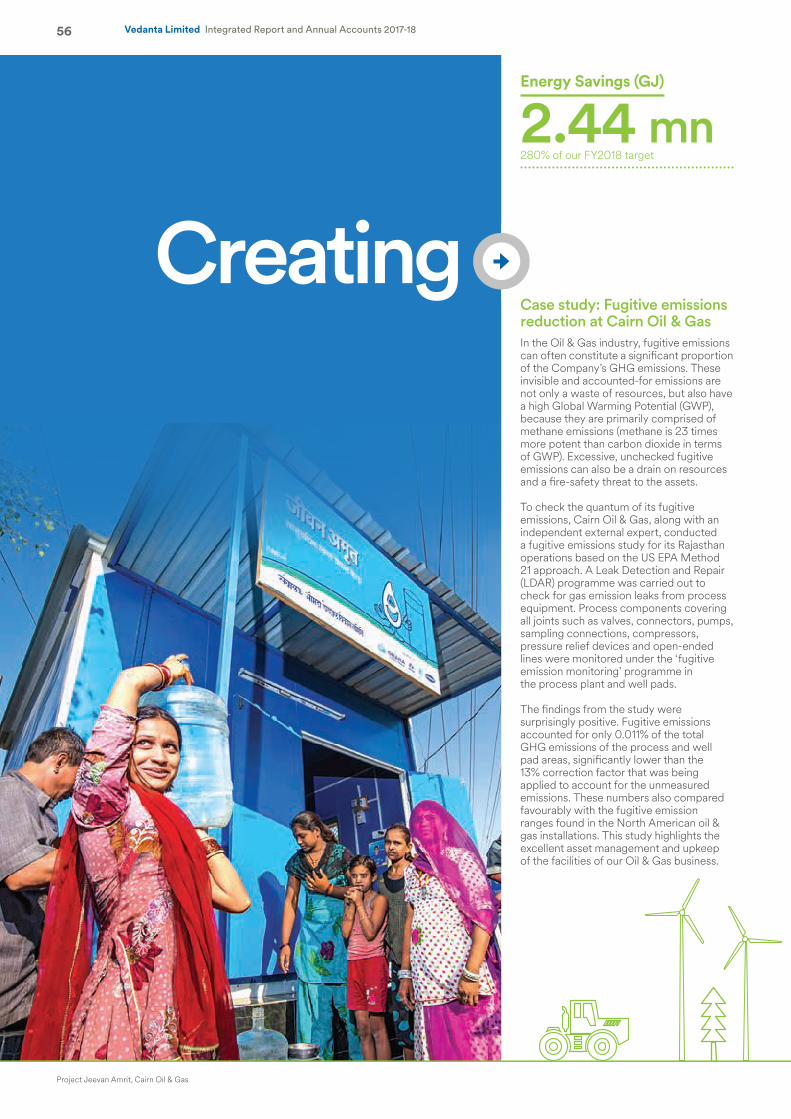
56 Vedanta Limited Integrated Report and Annual Accounts 2017-18
CreatingCase study: Fugitive emissions reduction at Cairn Oil & GasIn the Oil & Gas industry, fugitive emissions can often constitute a significant proportion of the Company’s GHG emissions. These invisible and accounted-for emissions are not only a waste of resources, but also have a high Global Warming Potential (GWP), because they are primarily comprised of methane emissions (methane is 23 times more potent than carbon dioxide in terms of GWP). Excessive, unchecked fugitive emissions can also be a drain on resources and a fire-safety threat to the assets.
To check the quantum of its fugitive emissions, Cairn Oil & Gas, along with an independent external expert, conducted a fugitive emissions study for its Rajasthan operations based on the US EPA Method 21 approach. A Leak Detection and Repair (LDAR) programme was carried out to check for gas emission leaks from process equipment. Process components covering all joints such as valves, connectors, pumps, sampling connections, compressors, pressure relief devices and open-ended lines were monitored under the ‘fugitive emission monitoring’ programme in the process plant and well pads.
The findings from the study were surprisingly positive. Fugitive emissions accounted for only 0.011% of the total GHG emissions of the process and well pad areas, significantly lower than the 13% correction factor that was being applied to account for the unmeasured emissions. These numbers also compared favourably with the fugitive emission ranges found in the North American oil & gas installations. This study highlights the excellent asset management and upkeep of the facilities of our Oil & Gas business.
Energy Savings (GJ)
2.44 mn280% of our FY2018 target
Project Jeevan Amrit, Cairn Oil & Gas
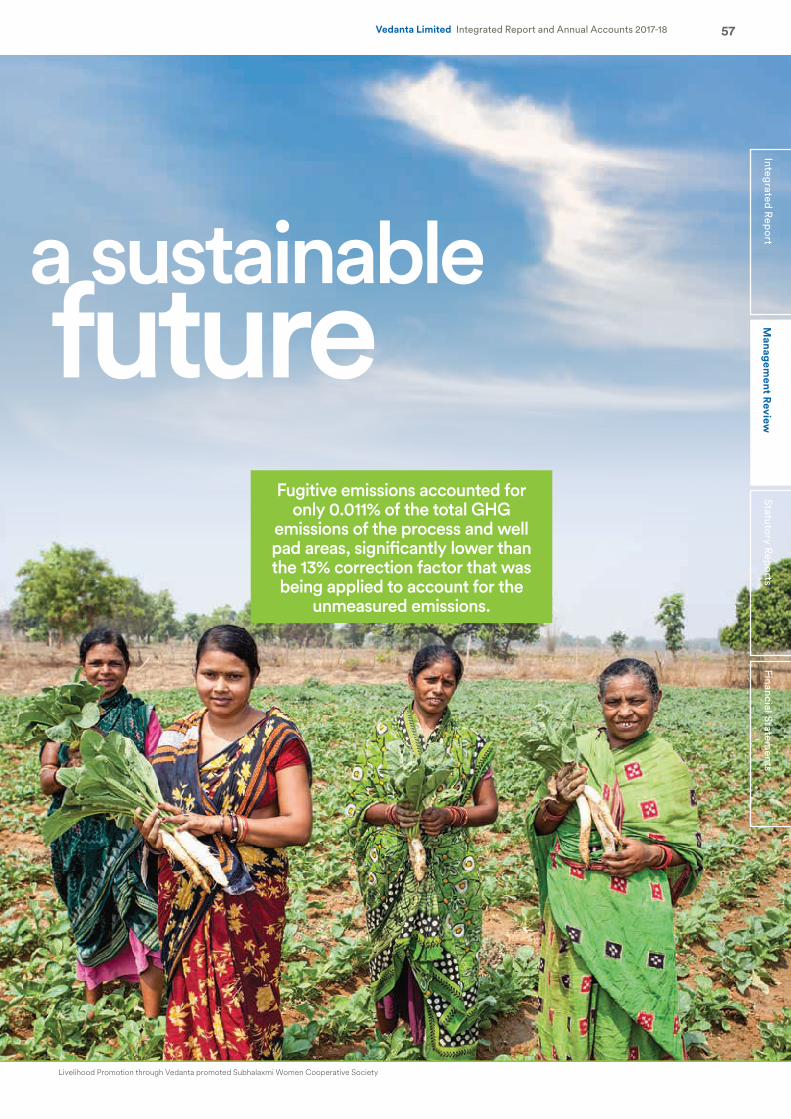
57Vedanta Limited Integrated Report and Annual Accounts 2017-18Financial Statem
entsStatutory R
eports
Managem
ent Review
Integrated Rep
orta sustainablefuture
Fugitive emissions accounted for only 0.011% of the total GHG
emissions of the process and well pad areas, significantly lower than the 13% correction factor that was being applied to account for the
unmeasured emissions.
Livelihood Promotion through Vedanta promoted Subhalaxmi Women Cooperative Society
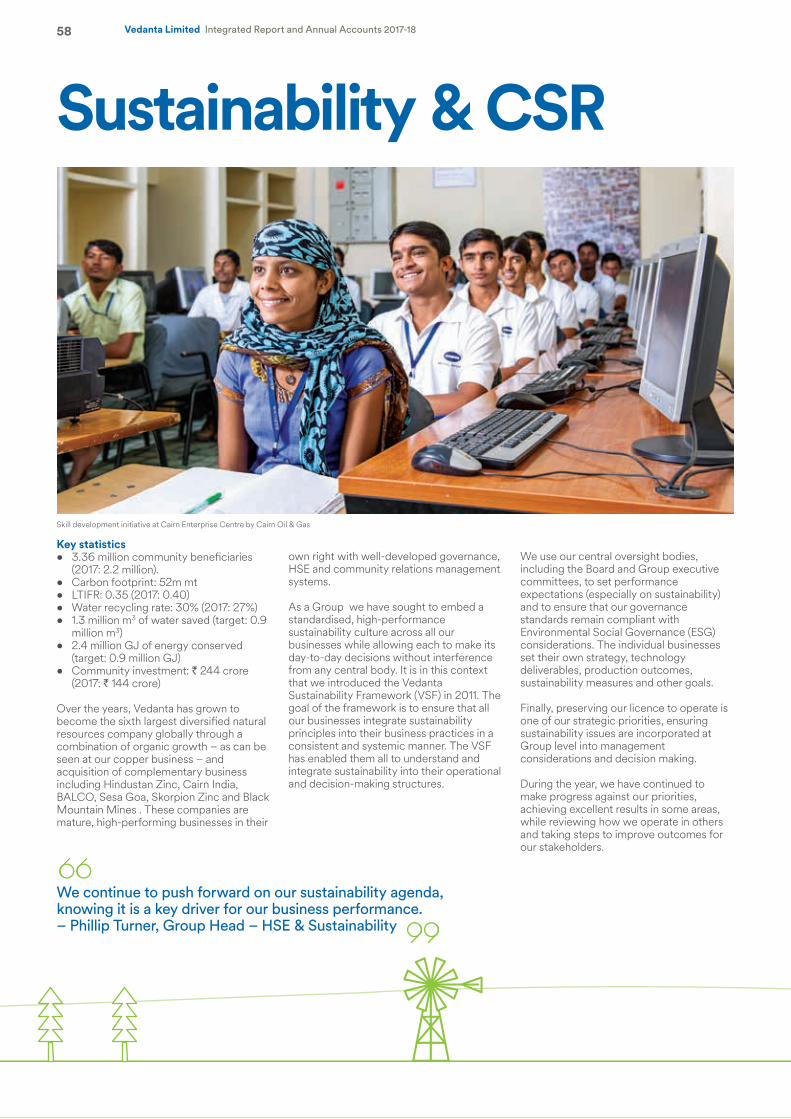
58 Vedanta Limited Integrated Report and Annual Accounts 2017-18
Key statistics• 3.36 million community beneficiaries
(2017: 2.2 million).• Carbon footprint: 52m mt• LTIFR: 0.35 (2017: 0.40)• Water recycling rate: 30% (2017: 27%)• 1.3 million m3 of water saved (target: 0.9
million m3)• 2.4 million GJ of energy conserved
(target: 0.9 million GJ)• Community investment: ` 244 crore
(2017: ` 144 crore)
Over the years, Vedanta has grown to become the sixth largest diversified natural resources company globally through a combination of organic growth – as can be seen at our copper business – and acquisition of complementary business including Hindustan Zinc, Cairn India, BALCO, Sesa Goa, Skorpion Zinc and Black Mountain Mines . These companies are mature, high-performing businesses in their
own right with well-developed governance, HSE and community relations management systems.
As a Group we have sought to embed a standardised, high-performance sustainability culture across all our businesses while allowing each to make its day-to-day decisions without interference from any central body. It is in this context that we introduced the Vedanta Sustainability Framework (VSF) in 2011. The goal of the framework is to ensure that all our businesses integrate sustainability principles into their business practices in a consistent and systemic manner. The VSF has enabled them all to understand and integrate sustainability into their operational and decision-making structures.
We use our central oversight bodies, including the Board and Group executive committees, to set performance expectations (especially on sustainability) and to ensure that our governance standards remain compliant with Environmental Social Governance (ESG) considerations. The individual businesses set their own strategy, technology deliverables, production outcomes, sustainability measures and other goals.
Finally, preserving our licence to operate is one of our strategic priorities, ensuring sustainability issues are incorporated at Group level into management considerations and decision making.
During the year, we have continued to make progress against our priorities, achieving excellent results in some areas, while reviewing how we operate in others and taking steps to improve outcomes for our stakeholders.
We continue to push forward on our sustainability agenda, knowing it is a key driver for our business performance. – Phillip Turner, Group Head – HSE & Sustainability
Sustainability & CSR
Skill development initiative at Cairn Enterprise Centre by Cairn Oil & Gas
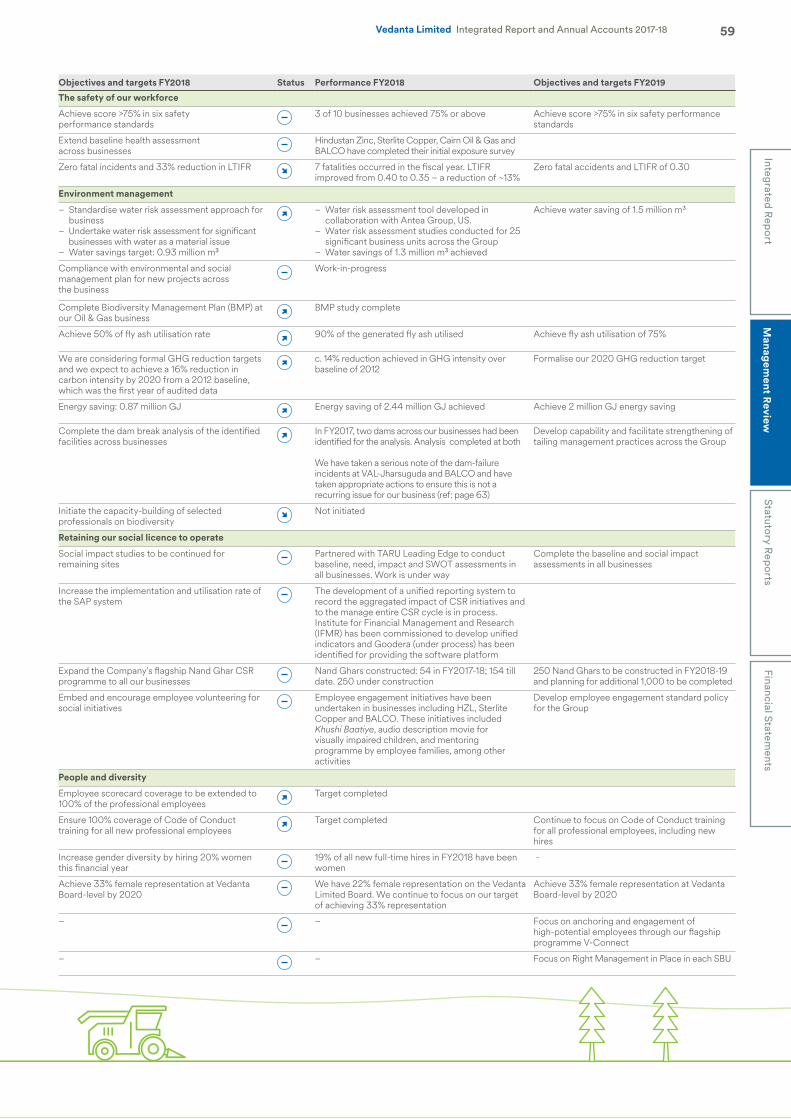
59Integrated R
eport
Managem
ent Review
Statutory Rep
ortsFinancial Statem
entsVedanta Limited Integrated Report and Annual Accounts 2017-18
Objectives and targets FY2018 Status Performance FY2018 Objectives and targets FY2019
The safety of our workforce
Achieve score >75% in six safety performance standards
3 of 10 businesses achieved 75% or above Achieve score >75% in six safety performance standards
Extend baseline health assessment across businesses
Hindustan Zinc, Sterlite Copper, Cairn Oil & Gas and BALCO have completed their initial exposure survey
Zero fatal incidents and 33% reduction in LTIFR 7 fatalities occurred in the fiscal year. LTIFR improved from 0.40 to 0.35 – a reduction of ~13%
Zero fatal accidents and LTIFR of 0.30
Environment management
– Standardise water risk assessment approach for business
– Undertake water risk assessment for significant businesses with water as a material issue
– Water savings target: 0.93 million m3
– Water risk assessment tool developed in collaboration with Antea Group, US.
– Water risk assessment studies conducted for 25 significant business units across the Group
– Water savings of 1.3 million m3 achieved
Achieve water saving of 1.5 million m3
Compliance with environmental and social management plan for new projects across the business
Work-in-progress
Complete Biodiversity Management Plan (BMP) at our Oil & Gas business
BMP study complete
Achieve 50% of fly ash utilisation rate 90% of the generated fly ash utilised Achieve fly ash utilisation of 75%
We are considering formal GHG reduction targets and we expect to achieve a 16% reduction in carbon intensity by 2020 from a 2012 baseline, which was the first year of audited data
c. 14% reduction achieved in GHG intensity over baseline of 2012
Formalise our 2020 GHG reduction target
Energy saving: 0.87 million GJ Energy saving of 2.44 million GJ achieved Achieve 2 million GJ energy saving
Complete the dam break analysis of the identified facilities across businesses
In FY2017, two dams across our businesses had been identified for the analysis. Analysis completed at both
We have taken a serious note of the dam-failure incidents at VAL-Jharsuguda and BALCO and have taken appropriate actions to ensure this is not a recurring issue for our business (ref: page 63)
Develop capability and facilitate strengthening of tailing management practices across the Group
Initiate the capacity-building of selected professionals on biodiversity
Not initiated
Retaining our social licence to operate
Social impact studies to be continued for remaining sites
Partnered with TARU Leading Edge to conduct baseline, need, impact and SWOT assessments in all businesses. Work is under way
Complete the baseline and social impact assessments in all businesses
Increase the implementation and utilisation rate of the SAP system
The development of a unified reporting system to record the aggregated impact of CSR initiatives and to the manage entire CSR cycle is in process. Institute for Financial Management and Research (IFMR) has been commissioned to develop unified indicators and Goodera (under process) has been identified for providing the software platform
Expand the Company's flagship Nand Ghar CSR programme to all our businesses
Nand Ghars constructed: 54 in FY2017-18; 154 till date. 250 under construction
250 Nand Ghars to be constructed in FY2018-19 and planning for additional 1,000 to be completed
Embed and encourage employee volunteering for social initiatives
Employee engagement initiatives have been undertaken in businesses including HZL, Sterlite Copper and BALCO. These initiatives included Khushi Baatiye, audio description movie for visually impaired children, and mentoring programme by employee families, among other activities
Develop employee engagement standard policy for the Group
People and diversity
Employee scorecard coverage to be extended to 100% of the professional employees
Target completed
Ensure 100% coverage of Code of Conduct training for all new professional employees
Target completed Continue to focus on Code of Conduct training for all professional employees, including new hires
Increase gender diversity by hiring 20% women this financial year
19% of all new full-time hires in FY2018 have been women
-
Achieve 33% female representation at Vedanta Board-level by 2020
We have 22% female representation on the Vedanta Limited Board. We continue to focus on our target of achieving 33% representation
Achieve 33% female representation at Vedanta Board-level by 2020
– – Focus on anchoring and engagement of high-potential employees through our flagship programme V-Connect
– – Focus on Right Management in Place in each SBU
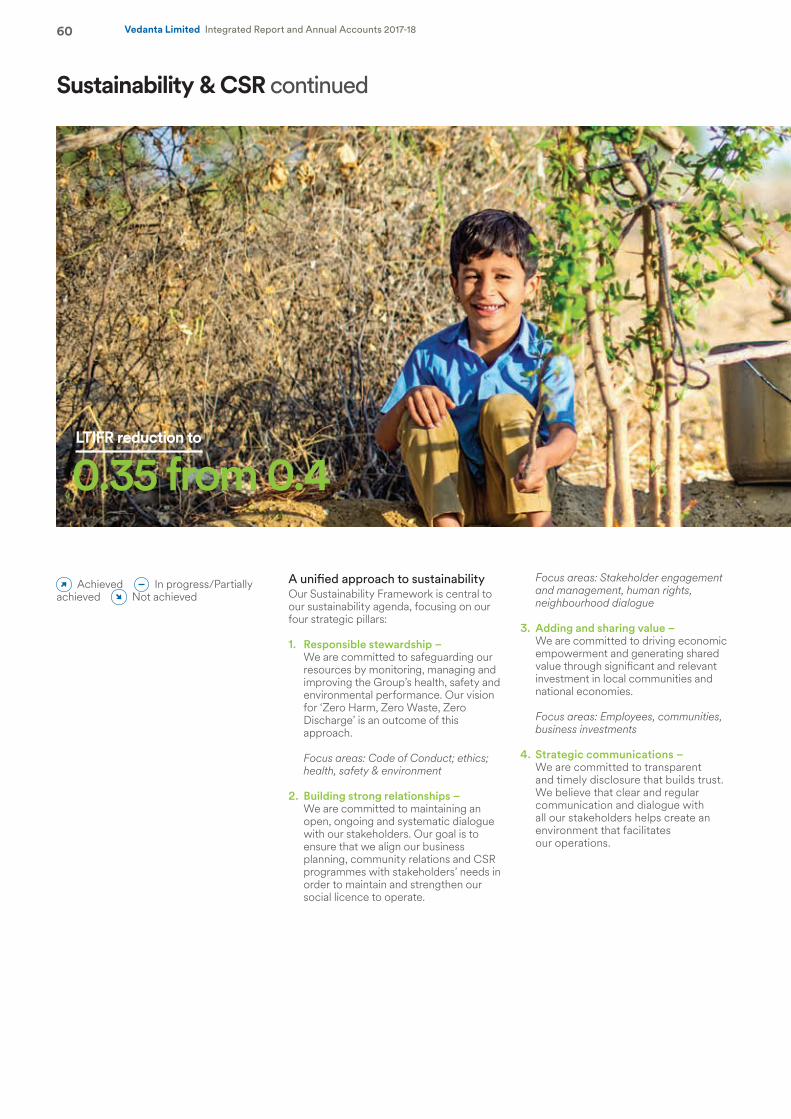
60 Vedanta Limited Integrated Report and Annual Accounts 2017-18
Focus areas: Stakeholder engagement and management, human rights, neighbourhood dialogue
3. Adding and sharing value – We are committed to driving economic empowerment and generating shared value through significant and relevant investment in local communities and national economies.
Focus areas: Employees, communities, business investments
4. Strategic communications – We are committed to transparent and timely disclosure that builds trust. We believe that clear and regular communication and dialogue with all our stakeholders helps create an environment that facilitates our operations.
Sustainability & CSR continued
Achieved In progress/Partially achieved Not achieved
A unified approach to sustainabilityOur Sustainability Framework is central to our sustainability agenda, focusing on our four strategic pillars:
1. Responsible stewardship – We are committed to safeguarding our resources by monitoring, managing and improving the Group’s health, safety and environmental performance. Our vision for ‘Zero Harm, Zero Waste, Zero Discharge’ is an outcome of this approach.
Focus areas: Code of Conduct; ethics; health, safety & environment
2. Building strong relationships – We are committed to maintaining an open, ongoing and systematic dialogue with our stakeholders. Our goal is to ensure that we align our business planning, community relations and CSR programmes with stakeholders’ needs in order to maintain and strengthen our social licence to operate.
LTIFR reduction to
0.35 from 0.4
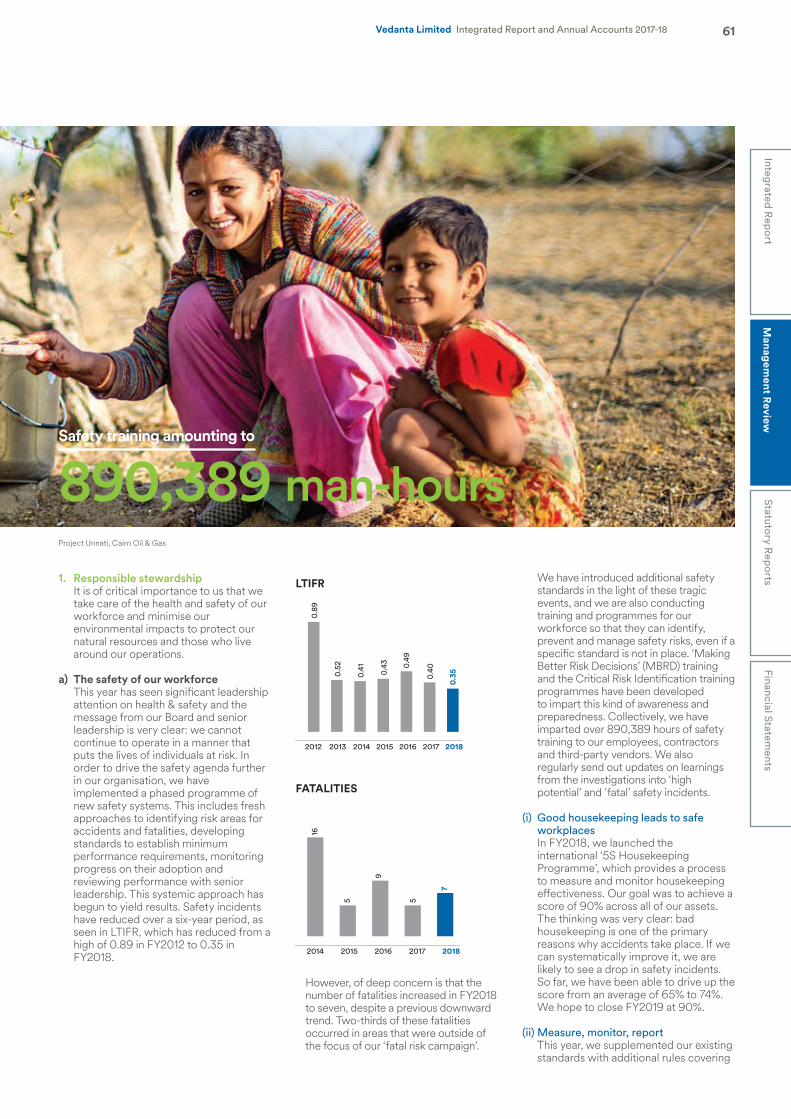
61Integrated R
eport
Managem
ent Review
Statutory Rep
ortsFinancial Statem
entsVedanta Limited Integrated Report and Annual Accounts 2017-18
1. Responsible stewardship It is of critical importance to us that we
take care of the health and safety of our workforce and minimise our environmental impacts to protect our natural resources and those who live around our operations.
a) The safety of our workforce This year has seen significant leadership
attention on health & safety and the message from our Board and senior leadership is very clear: we cannot continue to operate in a manner that puts the lives of individuals at risk. In order to drive the safety agenda further in our organisation, we have implemented a phased programme of new safety systems. This includes fresh approaches to identifying risk areas for accidents and fatalities, developing standards to establish minimum performance requirements, monitoring progress on their adoption and reviewing performance with senior leadership. This systemic approach has begun to yield results. Safety incidents have reduced over a six-year period, as seen in LTIFR, which has reduced from a high of 0.89 in FY2012 to 0.35 in FY2018.
201420132012 2015 2016 2017 2018
0.89
0.52
0.41 0.43
0.35
0.49
0.40
LTIFR
2014 2015 2016 2017 2018
16
9
7
5 5
FATALITIES
However, of deep concern is that the number of fatalities increased in FY2018 to seven, despite a previous downward trend. Two-thirds of these fatalities occurred in areas that were outside of the focus of our ‘fatal risk campaign’.
Safety training amounting to
890,389 man-hours
We have introduced additional safety standards in the light of these tragic events, and we are also conducting training and programmes for our workforce so that they can identify, prevent and manage safety risks, even if a specific standard is not in place. ‘Making Better Risk Decisions’ (MBRD) training and the Critical Risk Identification training programmes have been developed to impart this kind of awareness and preparedness. Collectively, we have imparted over 890,389 hours of safety training to our employees, contractors and third-party vendors. We also regularly send out updates on learnings from the investigations into ‘high potential’ and ’fatal’ safety incidents.
(i) Good housekeeping leads to safe workplaces
In FY2018, we launched the international ‘5S Housekeeping Programme’, which provides a process to measure and monitor housekeeping effectiveness. Our goal was to achieve a score of 90% across all of our assets. The thinking was very clear: bad housekeeping is one of the primary reasons why accidents take place. If we can systematically improve it, we are likely to see a drop in safety incidents. So far, we have been able to drive up the score from an average of 65% to 74%. We hope to close FY2019 at 90%.
(ii) Measure, monitor, report This year, we supplemented our existing
standards with additional rules covering
Project Unnati, Cairn Oil & Gas
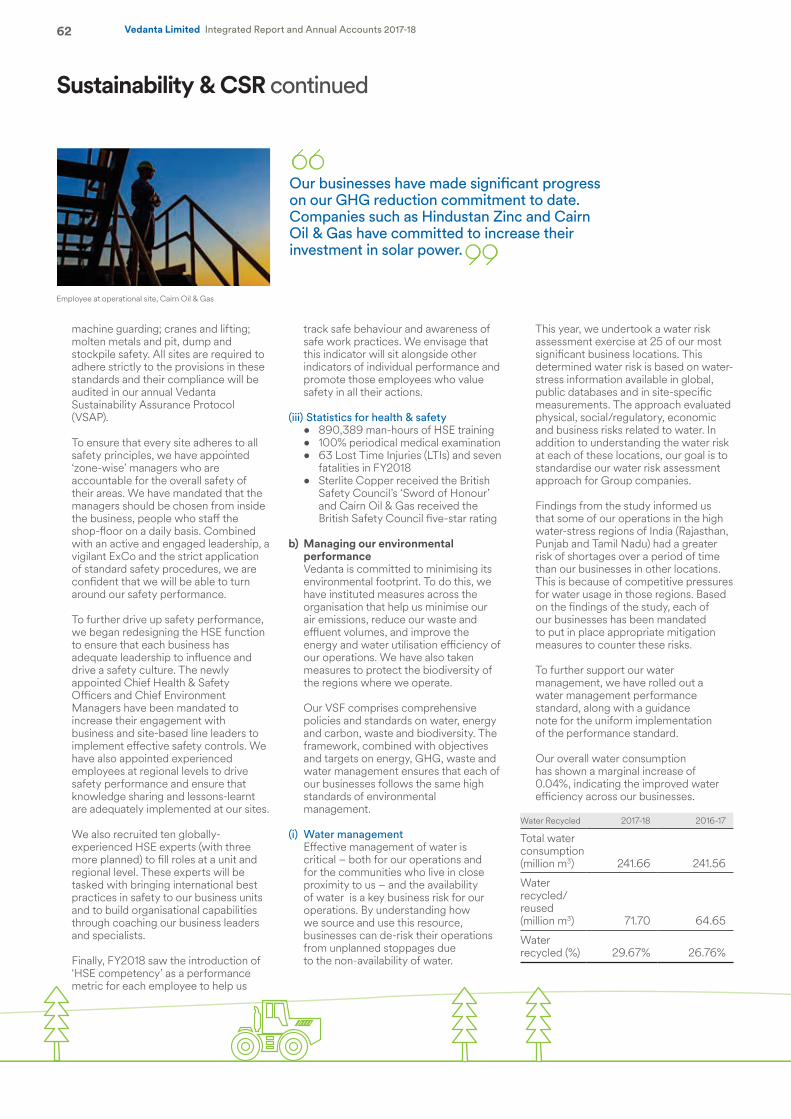
62 Vedanta Limited Integrated Report and Annual Accounts 2017-18
Our businesses have made significant progress on our GHG reduction commitment to date. Companies such as Hindustan Zinc and Cairn Oil & Gas have committed to increase their investment in solar power.
machine guarding; cranes and lifting; molten metals and pit, dump and stockpile safety. All sites are required to adhere strictly to the provisions in these standards and their compliance will be audited in our annual Vedanta Sustainability Assurance Protocol (VSAP).
To ensure that every site adheres to all safety principles, we have appointed ‘zone-wise’ managers who are accountable for the overall safety of their areas. We have mandated that the managers should be chosen from inside the business, people who staff the shop-floor on a daily basis. Combined with an active and engaged leadership, a vigilant ExCo and the strict application of standard safety procedures, we are confident that we will be able to turn around our safety performance.
To further drive up safety performance, we began redesigning the HSE function to ensure that each business has adequate leadership to influence and drive a safety culture. The newly appointed Chief Health & Safety Officers and Chief Environment Managers have been mandated to increase their engagement with business and site-based line leaders to implement effective safety controls. We have also appointed experienced employees at regional levels to drive safety performance and ensure that knowledge sharing and lessons-learnt are adequately implemented at our sites.
We also recruited ten globally-experienced HSE experts (with three more planned) to fill roles at a unit and regional level. These experts will be tasked with bringing international best practices in safety to our business units and to build organisational capabilities through coaching our business leaders and specialists.
Finally, FY2018 saw the introduction of ‘HSE competency’ as a performance metric for each employee to help us
track safe behaviour and awareness of safe work practices. We envisage that this indicator will sit alongside other indicators of individual performance and promote those employees who value safety in all their actions.
(iii) Statistics for health & safety• 890,389 man-hours of HSE training• 100% periodical medical examination• 63 Lost Time Injuries (LTIs) and seven
fatalities in FY2018• Sterlite Copper received the British
Safety Council’s ‘Sword of Honour’ and Cairn Oil & Gas received the British Safety Council five-star rating
b) Managing our environmental performance
Vedanta is committed to minimising its environmental footprint. To do this, we have instituted measures across the organisation that help us minimise our air emissions, reduce our waste and effluent volumes, and improve the energy and water utilisation efficiency of our operations. We have also taken measures to protect the biodiversity of the regions where we operate.
Our VSF comprises comprehensive policies and standards on water, energy and carbon, waste and biodiversity. The framework, combined with objectives and targets on energy, GHG, waste and water management ensures that each of our businesses follows the same high standards of environmental management.
(i) Water management Effective management of water is
critical – both for our operations and for the communities who live in close proximity to us – and the availability of water ☺is a key business risk for our operations. By understanding how we source and use this resource, businesses can de-risk their operations from unplanned stoppages due to the non-availability of water.
This year, we undertook a water risk assessment exercise at 25 of our most significant business locations. This determined water risk is based on water-stress information available in global, public databases and in site-specific measurements. The approach evaluated physical, social/regulatory, economic and business risks related to water. In addition to understanding the water risk at each of these locations, our goal is to standardise our water risk assessment approach for Group companies.
Findings from the study informed us that some of our operations in the high water-stress regions of India (Rajasthan, Punjab and Tamil Nadu) had a greater risk of shortages over a period of time than our businesses in other locations. This is because of competitive pressures for water usage in those regions. Based on the findings of the study, each of our businesses has been mandated to put in place appropriate mitigation measures to counter these risks.
To further support our water management, we have rolled out a water management performance standard, along with a guidance note for the uniform implementation of the performance standard.
Our overall water consumption has shown a marginal increase of 0.04%, indicating the improved water efficiency across our businesses.
Water Recycled 2017-18 2016-17
Total water consumption (million m3) 241.66 241.56
Water recycled/reused (million m3) 71.70 64.65
Water recycled (%) 29.67% 26.76%
Sustainability & CSR continued
Employee at operational site, Cairn Oil & Gas
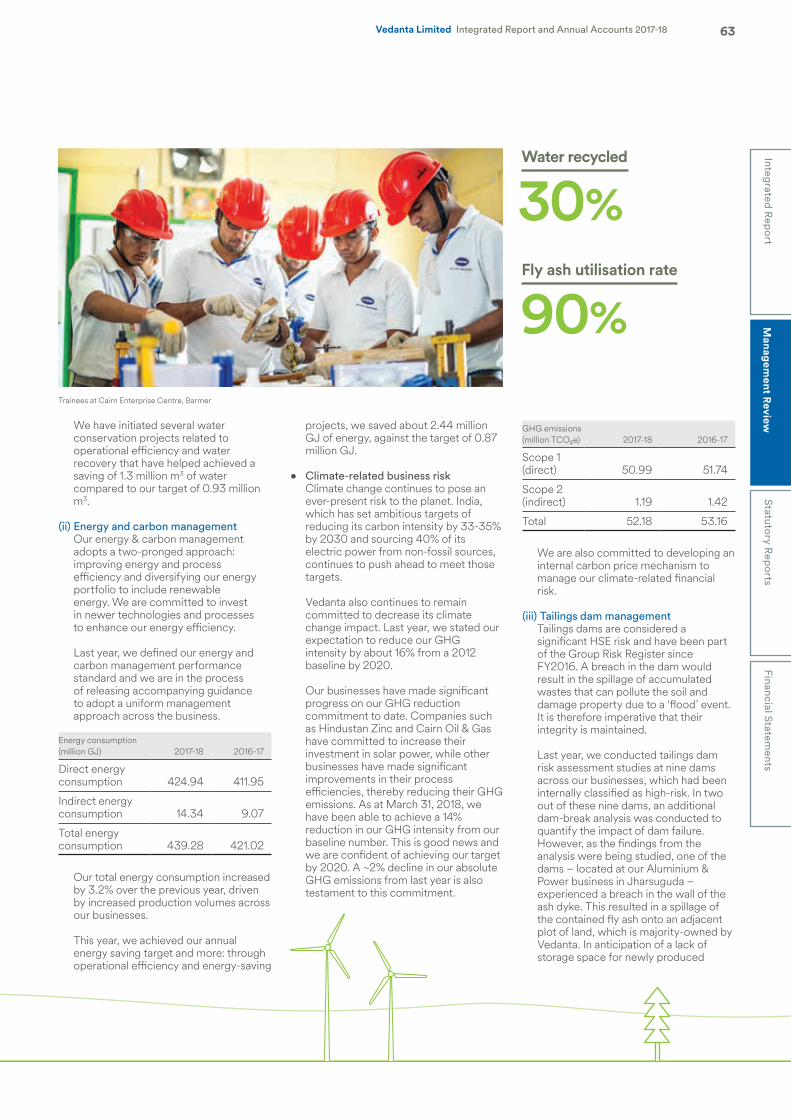
63Integrated R
eport
Managem
ent Review
Statutory Rep
ortsFinancial Statem
entsVedanta Limited Integrated Report and Annual Accounts 2017-18
Water recycled
Fly ash utilisation rate
30%
90%
We have initiated several water conservation projects related to operational efficiency and water recovery that have helped achieved a saving of 1.3 million m3 of water compared to our target of 0.93 million m3.
(ii) Energy and carbon management Our energy & carbon management
adopts a two-pronged approach: improving energy and process efficiency and diversifying our energy portfolio to include renewable energy. We are committed to invest in newer technologies and processes to enhance our energy efficiency.
Last year, we defined our energy and carbon management performance standard and we are in the process of releasing accompanying guidance to adopt a uniform management approach across the business.
Energy consumption (million GJ) 2017-18 2016-17
Direct energy consumption 424.94 411.95
Indirect energy consumption 14.34 9.07
Total energy consumption 439.28 421.02
Our total energy consumption increased by 3.2% over the previous year, driven by increased production volumes across our businesses.
This year, we achieved our annual energy saving target and more: through operational efficiency and energy-saving
projects, we saved about 2.44 million GJ of energy, against the target of 0.87 million GJ.
• Climate-related business riskClimate change continues to pose an ever-present risk to the planet. India, which has set ambitious targets of reducing its carbon intensity by 33-35% by 2030 and sourcing 40% of its electric power from non-fossil sources, continues to push ahead to meet those targets.
Vedanta also continues to remain committed to decrease its climate change impact. Last year, we stated our expectation to reduce our GHG intensity by about 16% from a 2012 baseline by 2020.
Our businesses have made significant progress on our GHG reduction commitment to date. Companies such as Hindustan Zinc and Cairn Oil & Gas have committed to increase their investment in solar power, while other businesses have made significant improvements in their process efficiencies, thereby reducing their GHG emissions. As at March 31, 2018, we have been able to achieve a 14% reduction in our GHG intensity from our baseline number. This is good news and we are confident of achieving our target by 2020. A ~2% decline in our absolute GHG emissions from last year is also testament to this commitment.
GHG emissions (million TCO2e) 2017-18 2016-17
Scope 1 (direct) 50.99 51.74
Scope 2 (indirect) 1.19 1.42
Total 52.18 53.16
We are also committed to developing an internal carbon price mechanism to manage our climate-related financial risk.
(iii) Tailings dam managementTailings dams are considered a significant HSE risk and have been part of the Group Risk Register since FY2016. A breach in the dam would result in the spillage of accumulated wastes that can pollute the soil and damage property due to a ‘flood’ event. It is therefore imperative that their integrity is maintained.
Last year, we conducted tailings dam risk assessment studies at nine dams across our businesses, which had been internally classified as high-risk. In two out of these nine dams, an additional dam-break analysis was conducted to quantify the impact of dam failure. However, as the findings from the analysis were being studied, one of the dams – located at our Aluminium & Power business in Jharsuguda – experienced a breach in the wall of the ash dyke. This resulted in a spillage of the contained fly ash onto an adjacent plot of land, which is majority-owned by Vedanta. In anticipation of a lack of storage space for newly produced
Trainees at Cairn Enterprise Centre, Barmer
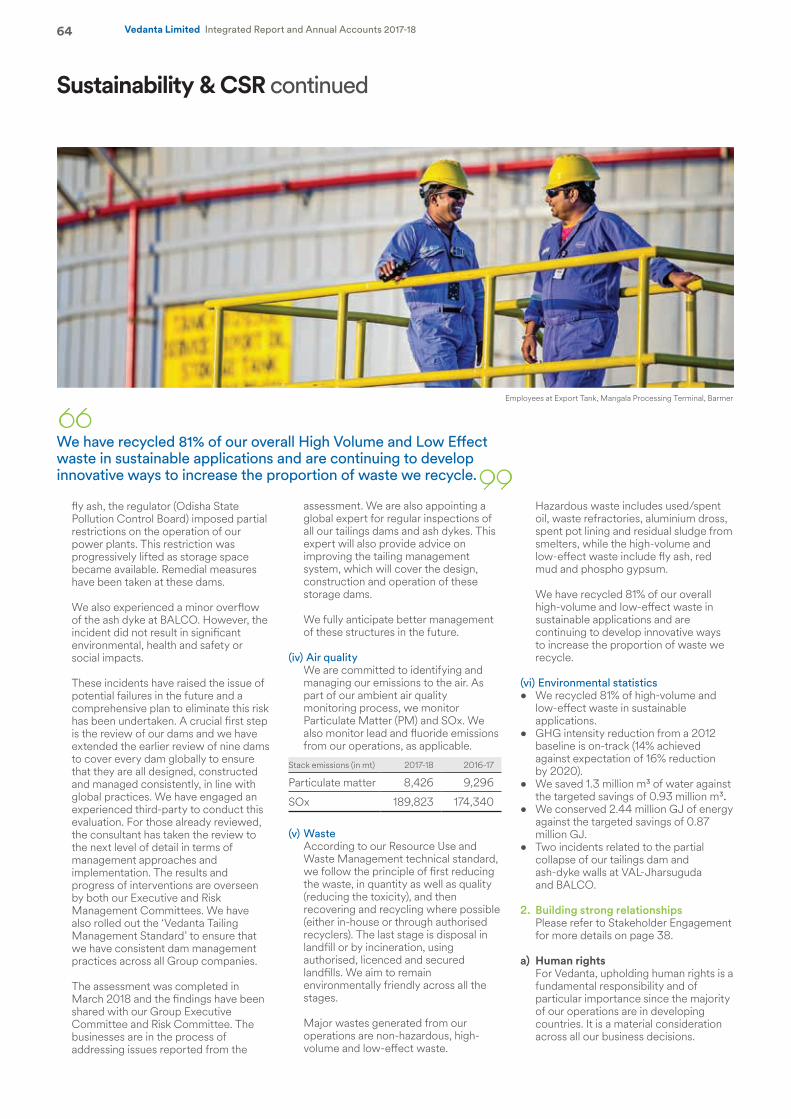
64 Vedanta Limited Integrated Report and Annual Accounts 2017-18
fly ash, the regulator (Odisha State Pollution Control Board) imposed partial restrictions on the operation of our power plants. This restriction was progressively lifted as storage space became available. Remedial measures have been taken at these dams.
We also experienced a minor overflow of the ash dyke at BALCO. However, the incident did not result in significant environmental, health and safety or social impacts.
These incidents have raised the issue of potential failures in the future and a comprehensive plan to eliminate this risk has been undertaken. A crucial first step is the review of our dams and we have extended the earlier review of nine dams to cover every dam globally to ensure that they are all designed, constructed and managed consistently, in line with global practices. We have engaged an experienced third-party to conduct this evaluation. For those already reviewed, the consultant has taken the review to the next level of detail in terms of management approaches and implementation. The results and progress of interventions are overseen by both our Executive and Risk Management Committees. We have also rolled out the ‘Vedanta Tailing Management Standard’ to ensure that we have consistent dam management practices across all Group companies.
The assessment was completed in March 2018 and the findings have been shared with our Group Executive Committee and Risk Committee. The businesses are in the process of addressing issues reported from the
assessment. We are also appointing a global expert for regular inspections of all our tailings dams and ash dykes. This expert will also provide advice on improving the tailing management system, which will cover the design, construction and operation of these storage dams.
We fully anticipate better management of these structures in the future.
(iv) Air qualityWe are committed to identifying and managing our emissions to the air. As part of our ambient air quality monitoring process, we monitor Particulate Matter (PM) and SOx. We also monitor lead and fluoride emissions from our operations, as applicable.
Stack emissions (in mt) 2017-18 2016-17
Particulate matter 8,426 9,296
SOx 189,823 174,340
(v) WasteAccording to our Resource Use and Waste Management technical standard, we follow the principle of first reducing the waste, in quantity as well as quality (reducing the toxicity), and then recovering and recycling where possible (either in-house or through authorised recyclers). The last stage is disposal in landfill or by incineration, using authorised, licenced and secured landfills. We aim to remain environmentally friendly across all the stages.
Major wastes generated from our operations are non-hazardous, high-volume and low-effect waste.
Hazardous waste includes used/spent oil, waste refractories, aluminium dross, spent pot lining and residual sludge from smelters, while the high-volume and low-effect waste include fly ash, red mud and phospho gypsum.
We have recycled 81% of our overall high-volume and low-effect waste in sustainable applications and are continuing to develop innovative ways to increase the proportion of waste we recycle.
(vi) Environmental statistics• We recycled 81% of high-volume and
low-effect waste in sustainable applications.
• GHG intensity reduction from a 2012 baseline is on-track (14% achieved against expectation of 16% reduction by 2020).
• We saved 1.3 million m3 of water against the targeted savings of 0.93 million m3.
• We conserved 2.44 million GJ of energy against the targeted savings of 0.87 million GJ.
• Two incidents related to the partial collapse of our tailings dam and ash-dyke walls at VAL-Jharsuguda and BALCO.
2. Building strong relationshipsPlease refer to Stakeholder Engagement for more details on page 38.
a) Human rightsFor Vedanta, upholding human rights is a fundamental responsibility and of particular importance since the majority of our operations are in developing countries. It is a material consideration across all our business decisions.
We have recycled 81% of our overall High Volume and Low Effect waste in sustainable applications and are continuing to develop innovative ways to increase the proportion of waste we recycle.
Employees at Export Tank, Mangala Processing Terminal, Barmer
Sustainability & CSR continued

65Integrated R
eport
Managem
ent Review
Statutory Rep
ortsFinancial Statem
entsVedanta Limited Integrated Report and Annual Accounts 2017-18
Our Human Rights Policy is aligned to the UN Guiding Principles on business and human rights and includes strict prohibition of child or forced labour – either directly or through contract labour.
Additionally, our Code of Business Conduct and Ethics underpins our approach to protect the fundamental rights of all our direct and indirect employees, communities and immediate supply chain.
We uphold our workers’ right to freedom of association at all our operations. The collective bargaining agreements are based on transparent and fair discussions between the management and union representatives. Our Suppliers’ Code of Conduct is implemented as part of the terms and conditions of supplier contracts across the Group and all new suppliers are required to sign, endorse and practice this Code. We also have a Supplier & Contractor Sustainability Management Policy. Both the Code and the Policy clearly communicate our expectations of our suppliers: to operate in compliance with all relevant legislation and follow our policies while executing work for us, or on our behalf.
(i) A note on our operations in TuticorinThis year, our social licence to operate was challenged by communities living around our Sterlite Copper plant in Tuticorin. The protests, while widespread, are based on misinformation around the perceived pollution caused by the plant. The fears stem from historic incidents, for which the Company received legal sanctions in 2013. However, it has since taken corrective measures to ensure that incidents of pollution are not repeated and the plant now operates well within regulatory limits for air emissions. It is also a zero liquid discharge operation, which means that there is no possibility of effluents polluting local water sources.
We are working with the communities as well as the regulatory bodies to arrive at a solution to the questions raised. We are mindful that pollution will remain a key issue in the region, which is an industry cluster with more than 60 manufacturing units (including thermal power plants, dyeing units and other large-, medium- and small-scale industries), and we would like to play a key role in reaching long-term solutions that incorporate the views of all stakeholders. We are committed to running our operations responsibly and our door remains open for dialogue.
(ii) Modern Slavery Act, 2015 In accordance with the UK’s Modern Slavery Act, (MSA) 2015, we have updated our Supplier Code of Conduct and Contract Conditions and our Code of Business Conduct and Ethics to ensure the prevention of modern slavery and human trafficking in our operations and supply chain.
We have also introduced the MSA framework at all our business units. Under this framework, we have a system in place for training of vendors/suppliers, due-diligence and self-declaration. We perform audits periodically to make sure that all business units follow this framework rigorously.
Implementation of the compliance framework for MSA rests with our Group Commercial team. They have been tasked with ensuring that all our vendors meet the stringent requirements of the Act.
3. Adding and sharing valueOur operations are predominantly located in the developing economies of India and Africa. We believe that we have an important role to play in developing the societies and communities where we operate, enabling them to share in the value we create.
a) Our approachWe are committed to giving back to the stakeholders who play a vital role in powering our growth. Reducing the social and economic divide by generating economic value, distributing wealth, investing in employees and enhancing standards of living are all key elements of our sustainability framework. We not only drive economic growth through taxes, royalties, wages and supplier contracts, but our operations also help to provide the products these communities need to further their development, for example, through infrastructure and housing.
b) CommunitiesProactive engagement with communities helps to resolve concerns they may have about our operations. It also allows us to understand their expectations from the Company, thereby helping us develop a comprehensive engagement strategy. This strategy includes creating opportunities for employment, using the services of local vendors, and implementing focused CSR and community development activities. Collectively, these actions allow us to create a positive social impact.
The majority of our initiatives are identified, developed and carried out in collaboration with local government bodies and community organisations. This ‘4Ps’ (public-private-people-partnership) model has inspired us to participate in ambitious long-term projects such as the Nand Ghar initiative.
In FY2018, Vedanta spent ` 244 crore on social investments and CSR activities. This is an increase of 69% over the previous year, when we spent ` 144 crore on social investment. This money is spent across 1,400-plus villages, benefiting nearly 3.36 million people.
c) Project updates
(i) Project Nand GharThe Nand Ghar Project is our commitment to transform the lives of 85 million children and 20 million women across 1.37 million Anganwadis in India, by building a world-class model of pre-school education, healthcare, nutrition and women’s empowerment. The Nand Ghars provide a best-in-class curriculum through e-learning, healthcare with a doctor at the doorstep, hygienic pre-packed meals for nutrition and customised skills training for empowering women economically across India. Today, there are 154 Nand Ghars across Rajasthan, Uttar Pradesh, Madhya Pradesh, Goa and Uttarakhand and our commitment is to construct 4,000 centres across 11 states in India.
Their impact is paving the way for the Anganwadis model across the country.
(ii) Children’s well-being and education Our focus is on building the capacity of the next generation to create a long-term sustainable impact. Educational programmes include a wide range of activities covering pre-school through to higher education. The total reach of all our education projects extends to some 21 million children. ‘Khushi’ is one of the largest collaborative projects with the Government, which aims to strengthen the functioning of 3,089 Anganwadis across five districts of Rajasthan. This programme alone impacts nearly 64,000 children. Other programmes in the education space are focusing on creating better teaching and learning environment.
(iii) HealthcareGood health is the cornerstone of community well-being. While we have always invested in healthcare (through mobile health vans, camps and so forth), we are now focusing on creating world-class healthcare facilities, especially in areas where these do not exist. This year saw the opening of the
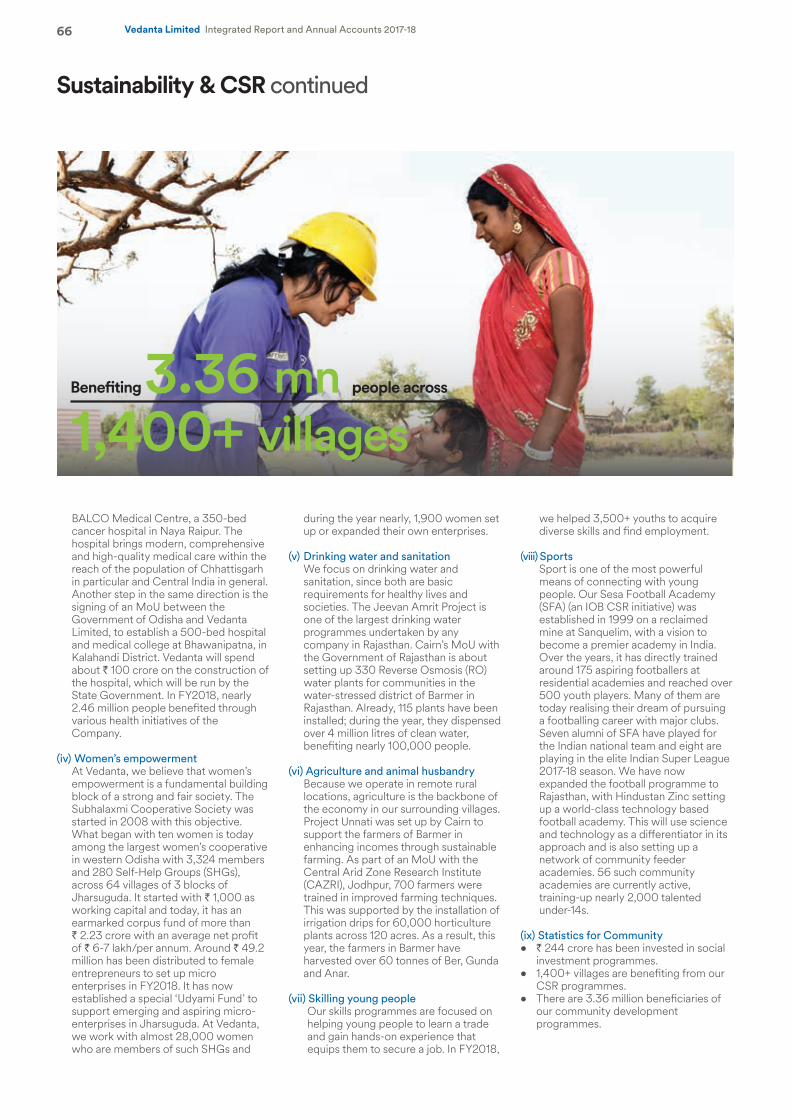
66 Vedanta Limited Integrated Report and Annual Accounts 2017-18
BALCO Medical Centre, a 350-bed cancer hospital in Naya Raipur. The hospital brings modern, comprehensive and high-quality medical care within the reach of the population of Chhattisgarh in particular and Central India in general. Another step in the same direction is the signing of an MoU between the Government of Odisha and Vedanta Limited, to establish a 500-bed hospital and medical college at Bhawanipatna, in Kalahandi District. Vedanta will spend about ` 100 crore on the construction of the hospital, which will be run by the State Government. In FY2018, nearly 2.46 million people benefited through various health initiatives of the Company.
(iv) Women’s empowermentAt Vedanta, we believe that women’s empowerment is a fundamental building block of a strong and fair society. The Subhalaxmi Cooperative Society was started in 2008 with this objective. What began with ten women is today among the largest women’s cooperative in western Odisha with 3,324 members and 280 Self-Help Groups (SHGs), across 64 villages of 3 blocks of Jharsuguda. It started with ` 1,000 as working capital and today, it has an earmarked corpus fund of more than ` 2.23 crore with an average net profit of ` 6-7 lakh/per annum. Around ` 49.2 million has been distributed to female entrepreneurs to set up micro enterprises in FY2018. It has now established a special ‘Udyami Fund’ to support emerging and aspiring micro-enterprises in Jharsuguda. At Vedanta, we work with almost 28,000 women who are members of such SHGs and
during the year nearly, 1,900 women set up or expanded their own enterprises.
(v) Drinking water and sanitationWe focus on drinking water and sanitation, since both are basic requirements for healthy lives and societies. The Jeevan Amrit Project is one of the largest drinking water programmes undertaken by any company in Rajasthan. Cairn’s MoU with the Government of Rajasthan is about setting up 330 Reverse Osmosis (RO) water plants for communities in the water-stressed district of Barmer in Rajasthan. Already, 115 plants have been installed; during the year, they dispensed over 4 million litres of clean water, benefiting nearly 100,000 people.
(vi) Agriculture and animal husbandryBecause we operate in remote rural locations, agriculture is the backbone of the economy in our surrounding villages. Project Unnati was set up by Cairn to support the farmers of Barmer in enhancing incomes through sustainable farming. As part of an MoU with the Central Arid Zone Research Institute (CAZRI), Jodhpur, 700 farmers were trained in improved farming techniques. This was supported by the installation of irrigation drips for 60,000 horticulture plants across 120 acres. As a result, this year, the farmers in Barmer have harvested over 60 tonnes of Ber, Gunda and Anar.
(vii) Skilling young people Our skills programmes are focused on helping young people to learn a trade and gain hands-on experience that equips them to secure a job. In FY2018,
we helped 3,500+ youths to acquire diverse skills and find employment.
(viii) Sports Sport is one of the most powerful means of connecting with young people. Our Sesa Football Academy (SFA) (an IOB CSR initiative) was established in 1999 on a reclaimed mine at Sanquelim, with a vision to become a premier academy in India. Over the years, it has directly trained around 175 aspiring footballers at residential academies and reached over 500 youth players. Many of them are today realising their dream of pursuing a footballing career with major clubs. Seven alumni of SFA have played for the Indian national team and eight are playing in the elite Indian Super League 2017-18 season. We have now expanded the football programme to Rajasthan, with Hindustan Zinc setting up a world-class technology based football academy. This will use science and technology as a differentiator in its approach and is also setting up a network of community feeder academies. 56 such community academies are currently active, training-up nearly 2,000 talented under-14s.
(ix) Statistics for Community• ` 244 crore has been invested in social
investment programmes.• 1,400+ villages are benefiting from our
CSR programmes. • There are 3.36 million beneficiaries of
our community development programmes.
Benefiting 3.36 mn people across
1,400+ villages
Sustainability & CSR continued
67Integrated R
eport
Managem
ent Review
Statutory Rep
ortsFinancial Statem
entsVedanta Limited Integrated Report and Annual Accounts 2017-18
People and CultureVedanta has always aspired to build a culture that demonstrates world-class standards in safety, environment and sustainability. People are our most valuable asset and we are committed to providing all our employees with a safe and healthy work environment.
Our culture exemplifies our core values and nurtures innovation, creativity and diversity. We align our business goals with individual goals and enable our employees to grow both personally and professionally.
DiversityDiversity remains a strong focus. We are committed to providing equal opportunities to our employees regardless of their race, nationality, religion, gender or age. We are pleased with our progress to date on gender diversity and women now represent 10.6% of our total workforce and 22% of our Board. We have set ourselves a target to reach over 33% women at senior levels by 2020 and aim to achieve 20% female diversity amongst our employees.
Since most of our operations are in remote areas, we place a strong emphasis on recruiting employees from among the local population. A significant percentage of the Senior Management and our employees are recruited from the country in which our operations are located.
RecruitmentWe have put a range of initiatives in place to support us in hiring skilled professionals.
Global Internship Programme (GIP)We initiated the programme in FY2017 with the objective of attracting best talent from the world’s leading universities. We select candidates from first-year MBA students from premier B-schools, including Harvard, INSEAD, London Business School and Indian Institute of Management (Ahmedabad and Bangalore) with the goal of creating lasting business value by onboarding world-class talent. Internships provide these candidates with an opportunity to work with top management, especially the C-suite, on live projects that directly impact the business. They work in a dynamic, fast-paced team environment and conclude their internship having gained broad experience in several facets of the natural resources industry.
Vedanta Leadership Development Programme (VLDP)In FY2017, we also launched the Vedanta Leadership Development Programme (VLPD) for full-time hires. The programme aims to build organisational capability for the future by onboarding best-in-class young talent from top management and technology institutes as full-time employees. We nurture them to be our leaders of tomorrow by providing them with a tailored programme including induction, job rotation and a range of roles,
opportunities, job rotations and anchoring.
During the first year, 19 students joined the programme and in the second year, 28 students have been recruited.
Right Management in Place (RMIP) - Strategic hiringWe introduced a recruitment drive to fill several leadership positions, including expat/specialist positions to realign the organisation structure and strengthen our management teams across the business. Hiring for these positions focused on recruitment from best-practice companies.
Talent Management and DevelopmentWe focus on retaining and developing talent from within the Company to take on future leadership roles.
Internal growth workshops We have always aimed to be an organisation headed by ‘leaders from within.’ Recognising internal talent and promoting them to leadership roles has been a driving factor in our rapid growth. Aligned with this philosophy, the Group conducts ‘Chairman’s Internal Growth Workshops’ to identify potential candidates across the Group. These workshops have resulted in the identification of 500+ cross-functional, high-potential new leaders in the Group’s businesses to date, who have taken up significantly enhanced roles and responsibilities. Our Internal Growth Workshops have also enabled us to reduce our lateral hiring significantly for critical roles across the Group in the past two years.
‘V Connect’ initiativeThis initiative was launched across the Group in association with AON as an anchoring/mentoring and training programme covering all 12,000 professionals. The key output has been to derive enhanced engagement levels from employees. To facilitate the programme, a dedicated app – Aon Lead – was introduced. The app allows participants to schedule their ‘connects’ with their mentor, get the latest business updates from around the globe, access articles and videos that focus on effective leadership and skill-building and participate in quizzes and learning challenges. To date, more than 5,000 conversations have been completed using the app.
Performance Management and Total RewardsWe ensure that we monitor and reward performance.
V-Perform: One performance system for one VedantaV-Perform is a pan-Vedanta initiative to standardise our Performance Management System (PMS) and processes by leveraging technology. This assists the functions, teams and individuals in tracking performance, generating analytics and
taking steps to ensure they are achieving Vedanta’s overall business plan and targets. To enhance our safety performance in the workplace and achieve our ultimate vision of zero harm, a safety competency assessment process has also been initiated as part of V-Perform to strengthen our existing safety management system.
Employee Stock Option Scheme (ESOS) 2017To reward our employees and enable them to share in the financial success of the Company, we have launched an ESOS, following statutory and shareholder approval.
ESOS 2017 covers the Company’s 2,832 employees and aims at rewarding them with wealth creation opportunities, encouraging high-growth performance and reinforcing employee pride. The scheme was launched after obtaining statutory approvals, including shareholders’ approval in 2016.
One Vedanta network As an international company employing thousands of people working across a range of remote and diverse geographic locations, we recognise the importance of fostering a culture of transparency, collaboration and knowledge-sharing across the organisation to keep employees informed and engaged. As social networking platforms continue to grow in popularity, we have developed One Vedanta – a platform on Workplace by Facebook – which enables all Vedanta employees to share content with their peers using a range of interactive tools such as live videos, news feeds, posts and media upload options.
The platform was launched in early 2017 and currently, more than 13,000 employees are signed up to this employee engagement tool with 4,000 active conversations per week. On November 29, 2017, a new ‘Chairman Connect’ bot application was launched on One Vedanta by our Chairman, Anil Agarwal. This application aims to give every employee direct access to the Chairman and leadership team to share ideas and feedback and to post questions. Mr. Agarwal’s vision is to tap into the rich pool of ideas and experiences shared by employees and to make Vedanta an open and connected organisation.
68 Vedanta Limited Integrated Report and Annual Accounts 2017-18
Mining (Proprietary) Limited (BMM), whose assets include the Black Mountain mine and the Gamsberg mine project located in South Africa. The Company has 100% ownership in Skorpion and 74% ownership in BMM. Our Zinc project in Gamsberg is progressing well and on track for first production by mid CY2018.
The Company’s oil & gas business is owned and operated by Vedanta Limited, one of the largest independent oil and gas exploration and production companies and the largest private producer of crude oil in India. It has a world-class resource base, with interest in five blocks in India and one in South Africa. Cairn India’s resource base is located in four strategically focused areas namely one block in Rajasthan, one on the west coast of India, three on the east coast of India and one in South Africa.
The Company’s iron ore business is wholly owned by Vedanta Limited and Sesa Resources Limited and consists of exploration, mining and processing of iron ore, pig iron and metallurgical coke and power generation. The mining operations are carried out in the State of Goa and
Vedanta Limited is a diversified natural resource company with portfolio of large, world-class, low-cost, scalable assets, located in proximity to high growth markets. The Company operates in the Oil & Gas, Zinc, Lead, Silver, Copper, Iron Ore, Aluminium and Commercial Power sectors.
The Company’s zinc business in India is owned and operated by Hindustan Zinc Limited (HZL) in which the Company has a 64.9% interest and 29.54% is owned by Government of India. HZL’s operations include five zinc-lead mines, four zinc smelters, two lead smelters, one zinc-lead smelter, seven sulphuric acid plants, one silver refinery plant and six captive power plants in the state of Rajasthan. It also has zinc, lead, silver processing and refining facilities in the State of Uttarakhand. The Company has wind power plants in the States of Rajasthan, Gujarat, Karnataka, Tamil Nadu and Maharashtra.
The Company’s international zinc business comprises of Skorpion mine and refinery in Namibia operated through THL Zinc Namibia Holdings (Proprietary) Limited (Skorpion). It also has Black Mountain
Karnataka. On February 7, 2018, the Supreme Court of India passed its final order wherein it set aside the second renewal of the mining leases granted by the State of Goa. The Court directed all lease holders under the second renewal to stop all mining operations with effect from March 16, 2018 until fresh mining leases (not fresh renewals or other renewals) and fresh environment clearances are granted.
The Company’s copper business is owned and operated by Vedanta Limited, Copper mines of Tasmania Pty. Ltd. (‘CMT‘), Australia, and Fujairah Gold FZE in the UAE. Its custom smelting assets includes a copper smelter, a refinery, a phosphoric acid plant, a sulphuric acid plant, a copper rod plant and two captive power plants at Tuticorin in Southern India, and a refinery and two copper rod plants at Silvassa in Western India. In addition, the Company owns and operates the Mt. Lyell copper
Management Discussion & Analysis
69Integrated R
eport
Managem
ent Review
Statutory Rep
ortsFinancial Statem
entsVedanta Limited Integrated Report and Annual Accounts 2017-18
establishment of 1,980 MW (three units of 660 MW each) thermal coal-based commercial power facilities.
The other power operations include Vedanta Limited’s 600 MW thermal coal-based commercial power facility at Jharsuguda, a 600 MW thermal coal-based commercial power facility at BALCO, 274 MW of wind power plants commissioned by HZL and 100 MW power plant at MALCO Energy Limited (MEL)situated at Mettur Dam in Tamil Nadu in Southern India. 100 MW MEL power plant has been put under care and maintenance effective from May 26, 2017.
The Company’s other activities include operation of its Vizag General Cargo Berth Private Limited (‘VGCB’) in which the Company owns a 100% interest. The Vizag port business includes coal handling facilities and general cargo berth at the outer harbor of Visakhapatnam port on India’s east coast.
mine in Tasmania, Australia through its subsidiary, CMT, which is currently suspended and is under care & maintenance since July 2014, and a precious metal refinery and copper rod plant in Fujairah through its subsidiary Fujairah Gold FZE.
The Company’s aluminium business is owned and operated by Vedanta Limited and Bharat Aluminium Company Limited (BALCO) in which Vedanta Limited has a 51% interest and balance is owned by the Government of India. Vedanta Limited’s Aluminium operations include an Alumina refinery and a 90 MW captive power plant (CPP) at Lanjigarh, two smelters (500 kt & 1,250 kt) and two CPPs (1,215 MW & 1,800 MW) at Jharsuguda, both at Odisha in Eastern India. BALCO’s operations include two bauxite mines, three CPPs (270 MW, 540 MW and 600 MW), and two smelters (570 kt) and fabrication facilities at Chattisgarh in central India.
The Company’s power business includes Talwandi Sabo Power Limited (TSPL), a wholly owned subsidiary of the Vedanta Limited TSPL had signed a power purchase agreement with the Punjab State Power Corporation Limited (PSPCL) for the
In December 2017, Vedanta Limited’s wholly owned subsidiary, Cairn India Holdings Limited acquired a 51% stake in AvanStrate Inc. (ASI), a Japanese manufacturer of LCD glass substrate for US$158 million.
Vedanta Limited was declared successful resolution applicant by the Committee of Creditors for Electrosteel Steels Limited under the Corporate Insolvency Resolution Process of the insolvency and Bankruptcy Code, 2016 (IBC). Subsequently, The National Company Law Tribunal, Kolkata Bench, has approved the terms of the Resolution Plan submitted by the Company, to acquire Electrosteel Steels Limited (‘Electrosteel’) on April 17, 2018.
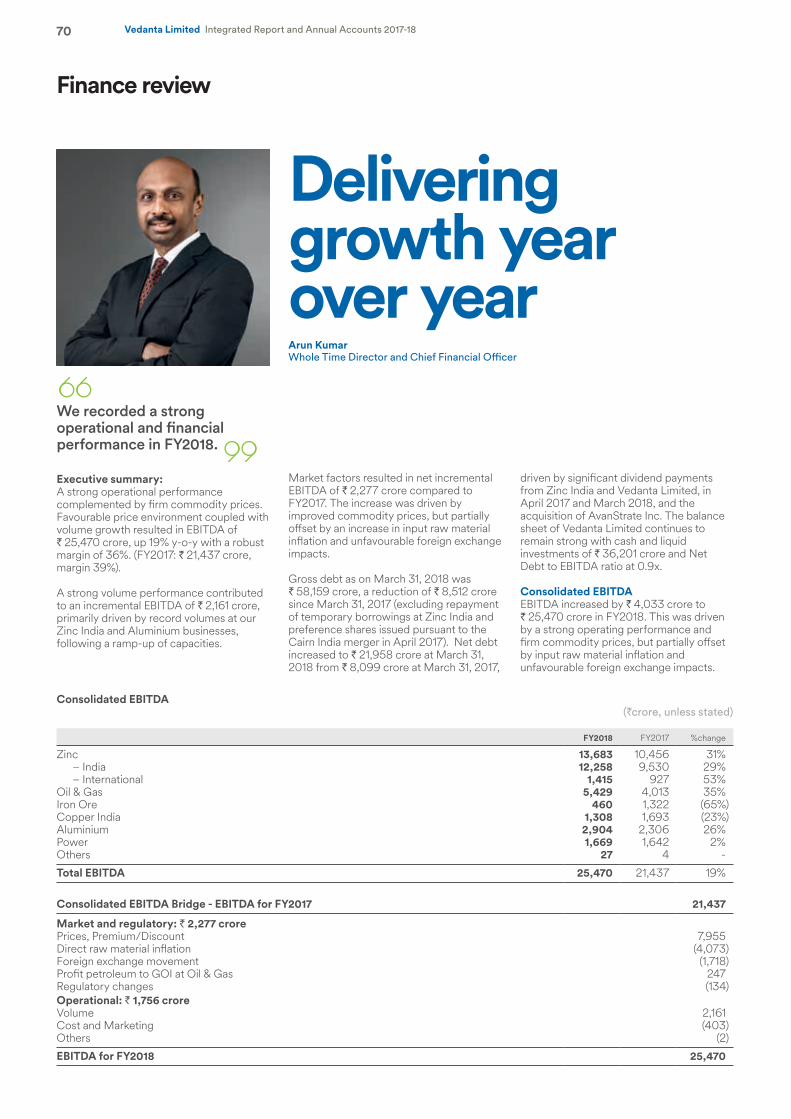
70 Vedanta Limited Integrated Report and Annual Accounts 2017-18
Finance review
Delivering growth year over yearArun KumarWhole Time Director and Chief Financial Officer
We recorded a strong operational and financial performance in FY2018.
Executive summary: A strong operational performance complemented by firm commodity prices.Favourable price environment coupled with volume growth resulted in EBITDA of ` 25,470 crore, up 19% y-o-y with a robust margin of 36%. (FY2017: ` 21,437 crore, margin 39%).
A strong volume performance contributed to an incremental EBITDA of ` 2,161 crore, primarily driven by record volumes at our Zinc India and Aluminium businesses, following a ramp-up of capacities.
Market factors resulted in net incremental EBITDA of ` 2,277 crore compared to FY2017. The increase was driven by improved commodity prices, but partially offset by an increase in input raw material inflation and unfavourable foreign exchange impacts.
Gross debt as on March 31, 2018 was ` 58,159 crore, a reduction of ` 8,512 crore since March 31, 2017 (excluding repayment of temporary borrowings at Zinc India and preference shares issued pursuant to the Cairn India merger in April 2017). Net debt increased to ` 21,958 crore at March 31, 2018 from ` 8,099 crore at March 31, 2017,
driven by significant dividend payments from Zinc India and Vedanta Limited, in April 2017 and March 2018, and the acquisition of AvanStrate Inc. The balance sheet of Vedanta Limited continues to remain strong with cash and liquid investments of ` 36,201 crore and Net Debt to EBITDA ratio at 0.9x.
Consolidated EBITDA EBITDA increased by ` 4,033 crore to ` 25,470 crore in FY2018. This was driven by a strong operating performance and firm commodity prices, but partially offset by input raw material inflation and unfavourable foreign exchange impacts.
Consolidated EBITDA(`crore, unless stated)
FY2018 FY2017 %change
Zinc 13,683 10,456 31%– India 12,258 9,530 29%– International 1,415 927 53%
Oil & Gas 5,429 4,013 35%Iron Ore 460 1,322 (65%)Copper India 1,308 1,693 (23%)Aluminium 2,904 2,306 26%Power 1,669 1,642 2%Others 27 4 -
Total EBITDA 25,470 21,437 19%
Consolidated EBITDA Bridge - EBITDA for FY2017 21,437
Market and regulatory: ` 2,277 crorePrices, Premium/Discount 7,955 Direct raw material inflation (4,073)Foreign exchange movement (1,718)Profit petroleum to GOI at Oil & Gas 247 Regulatory changes (134) Operational: ` 1,756 croreVolume 2,161 Cost and Marketing (403)Others (2)
EBITDA for FY2018 25,470
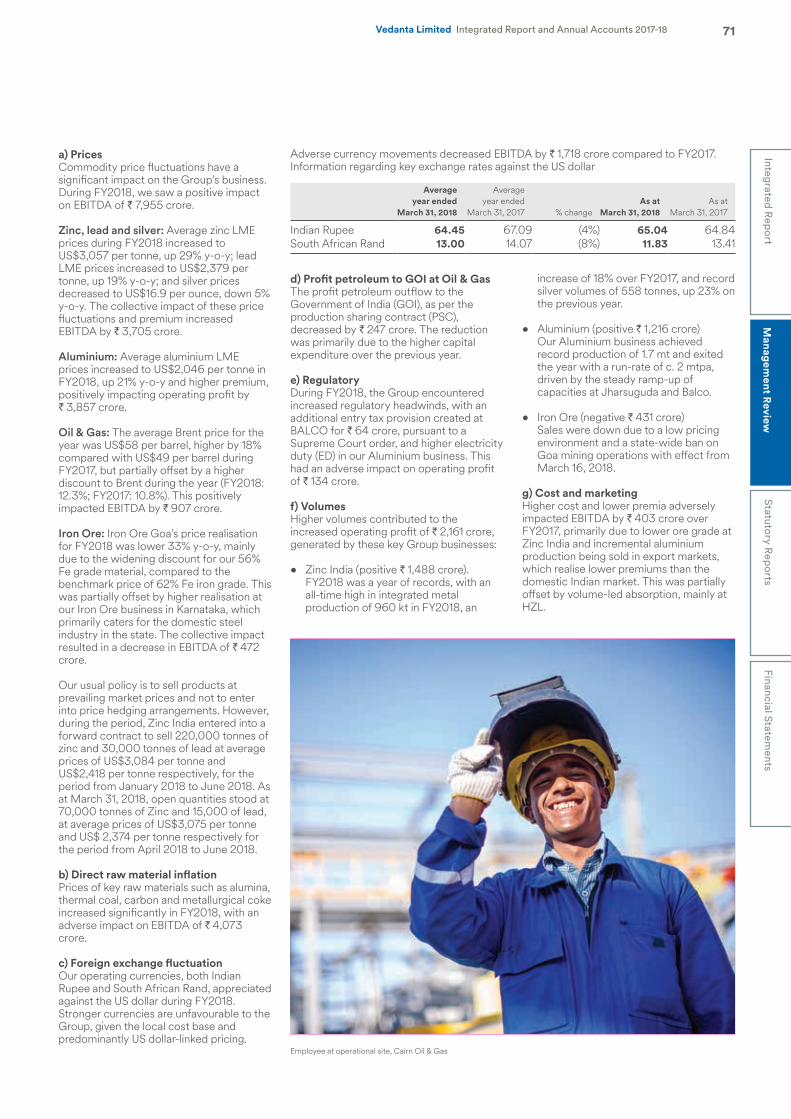
71Integrated R
eport
Managem
ent Review
Statutory Rep
ortsFinancial Statem
entsVedanta Limited Integrated Report and Annual Accounts 2017-18
a) PricesCommodity price fluctuations have a significant impact on the Group’s business. During FY2018, we saw a positive impact on EBITDA of ` 7,955 crore.
Zinc, lead and silver: Average zinc LME prices during FY2018 increased to US$3,057 per tonne, up 29% y-o-y; lead LME prices increased to US$2,379 per tonne, up 19% y-o-y; and silver prices decreased to US$16.9 per ounce, down 5% y-o-y. The collective impact of these price fluctuations and premium increased EBITDA by ` 3,705 crore.
Aluminium: Average aluminium LME prices increased to US$2,046 per tonne in FY2018, up 21% y-o-y and higher premium, positively impacting operating profit by ` 3,857 crore.
Oil & Gas: The average Brent price for the year was US$58 per barrel, higher by 18% compared with US$49 per barrel during FY2017, but partially offset by a higher discount to Brent during the year (FY2018: 12.3%; FY2017: 10.8%). This positively impacted EBITDA by ` 907 crore.
Iron Ore: Iron Ore Goa’s price realisation for FY2018 was lower 33% y-o-y, mainly due to the widening discount for our 56% Fe grade material, compared to the benchmark price of 62% Fe iron grade. This was partially offset by higher realisation at our Iron Ore business in Karnataka, which primarily caters for the domestic steel industry in the state. The collective impact resulted in a decrease in EBITDA of ` 472 crore.
Our usual policy is to sell products at prevailing market prices and not to enter into price hedging arrangements. However, during the period, Zinc India entered into a forward contract to sell 220,000 tonnes of zinc and 30,000 tonnes of lead at average prices of US$3,084 per tonne and US$2,418 per tonne respectively, for the period from January 2018 to June 2018. As at March 31, 2018, open quantities stood at 70,000 tonnes of Zinc and 15,000 of lead, at average prices of US$3,075 per tonne and US$ 2,374 per tonne respectively for the period from April 2018 to June 2018.
b) Direct raw material inflationPrices of key raw materials such as alumina, thermal coal, carbon and metallurgical coke increased significantly in FY2018, with an adverse impact on EBITDA of ` 4,073 crore.
c) Foreign exchange fluctuationOur operating currencies, both Indian Rupee and South African Rand, appreciated against the US dollar during FY2018. Stronger currencies are unfavourable to the Group, given the local cost base and predominantly US dollar-linked pricing.
Adverse currency movements decreased EBITDA by ` 1,718 crore compared to FY2017. Information regarding key exchange rates against the US dollar
Averageyear ended
March 31, 2018
Averageyear ended
March 31, 2017 % change As at
March 31, 2018As at
March 31, 2017
Indian Rupee 64.45 67.09 (4%) 65.04 64.84South African Rand 13.00 14.07 (8%) 11.83 13.41
d) Profit petroleum to GOI at Oil & Gas The profit petroleum outflow to the Government of India (GOI), as per the production sharing contract (PSC), decreased by ` 247 crore. The reduction was primarily due to the higher capital expenditure over the previous year.
e) RegulatoryDuring FY2018, the Group encountered increased regulatory headwinds, with an additional entry tax provision created at BALCO for ` 64 crore, pursuant to a Supreme Court order, and higher electricity duty (ED) in our Aluminium business. This had an adverse impact on operating profit of ` 134 crore.
f) VolumesHigher volumes contributed to the increased operating profit of ` 2,161 crore, generated by these key Group businesses:
• Zinc India (positive ` 1,488 crore). FY2018 was a year of records, with an
all-time high in integrated metal production of 960 kt in FY2018, an
increase of 18% over FY2017, and record silver volumes of 558 tonnes, up 23% on the previous year.
• Aluminium (positive ` 1,216 crore) Our Aluminium business achieved
record production of 1.7 mt and exited the year with a run-rate of c. 2 mtpa, driven by the steady ramp-up of capacities at Jharsuguda and Balco.
• Iron Ore (negative ` 431 crore) Sales were down due to a low pricing
environment and a state-wide ban on Goa mining operations with effect from March 16, 2018.
g) Cost and marketingHigher cost and lower premia adversely impacted EBITDA by ` 403 crore over FY2017, primarily due to lower ore grade at Zinc India and incremental aluminium production being sold in export markets, which realise lower premiums than the domestic Indian market. This was partially offset by volume-led absorption, mainly at HZL.
Employee at operational site, Cairn Oil & Gas
72 Vedanta Limited Integrated Report and Annual Accounts 2017-18
Income statement(`crore, unless stated)
FY2018 FY2017 %change
Net Sales/Income from Operations 92,923 76,171 22%EBITDA 25,470 21,437 19%EBITDA Margin1 (%) 36% 39% –Finance Cost 5,783 5,855 (1%)Other Income 3,574 4,581 (22%)Profit before Depreciation and Taxes 22,955 20,058 14%Depreciation and Amortisation 6,283 6,292 –
Profit before Exceptional Items 16,672 13,766 21%
Exceptional Items2 (2,897) 114 –Taxes3 5,877 2,333 –Profit After Taxes 13,692 11,319 21%Profit After Taxes (before Exceptional Items) 12,869 11,467 12%Profit After Taxes (before Exceptional Items & DDT) 11,333 11,663 (3%)Minority Interest 3,350 4,358 (23%)Attributable PAT after Exceptional Items 10,342 6,958 49%Attributable PAT (before Exceptional Items) 9,561 7,127 34%Attributable PAT (before Exceptional Items & DDT) 8,025 7,323 10%
Basic Earnings per share (`/share) 28.30 23.47 21%
Basic EPS before Exceptional Items (`/share) 26.17 24.04 9%Basic EPS before Exceptional Items & DDT (`/share) 21.96 24.70 (11%)Exchange Rate (`/$) – Average 64.45 67.09 (4%)Exchange Rate (`/$) – Closing 65.04 64.84 0%
1) Excludes custom smelting at Copper India and Zinc India Operations.2) Exceptional Items gross of tax3) Tax includes tax charge on Exceptional Items of ` 2,074 crore in FY2018 (FY2017: charge of ` 34 crore); DDT included in Tax Expense in FY2018 is credit of ` 1,536 crore
(FY2017: charge of ` 196 crore)4) Previous period figures have been regrouped/rearranged wherever necessary to conform to current period presentation.
73Integrated R
eport
Managem
ent Review
Statutory Rep
ortsFinancial Statem
entsVedanta Limited Integrated Report and Annual Accounts 2017-18
RevenueRevenue for the year was ` 92,923 crore, up 22% y-o-y. The increase was mainly on account of ramp-up of capacities at Aluminium, record production from Zinc India and improved commodity prices partly offset by unfavourable foreign exchange movements and lower sales at Iron ore.
EBITDA and EBITDA MarginEBITDA for the year was ` 25,470 crore, up 19% y-o-y on account of record production from Zinc India and Aluminium and improved commodity prices. This was partially offset by raw material inflation, unfavourable foreign exchange movements, and, lower sales at Iron ore Goa. We maintained industry leading robust EBITDA margin of 36% for the year (FY2017: 39%)
Depreciation and AmortisationDepreciation for the year was ` 6,283 crore compared to ` 6,292 crore in FY2017 on account of lower depreciation charge at oil & gas business. This was due to the change in method of calculation of Unit of Production (UOP) charge to ‘Proved and Developed Oil and Gas Reserves’ (1P) in accordance with the Guidance Note on Accounting for Oil and Gas Producing Activities, which was effective April 1, 2017, compared to the earlier approach of ‘Proved and Probable Reserves’ (2P). This was mostly offset by increase in depreciation at Aluminium business on account of capitalisation of aluminium pots and relining expenses, higher depreciation at Zinc India driven by higher production.
Net InterestThe blended cost of borrowings was 7.8% for FY2018 as compared to with 8.3% in FY2017.
Finance cost for FY2018 was `5,783 crore was marginally lower compared to ` 5,855 crore in FY2017 on account of de-leveraging during the year and lower interest rates, partially offset by dividends on preference shares issued to the
shareholders of Cairn India pursuant to the merger with the Company in April, interest cost on temporary borrowings at Zinc India and capitalisation of pots at Aluminium business.
Other Income for FY2018 was at `3,574 crore lower by `1,007 crore primarily owing to lower investment corpus due to special dividend payments by Zinc India and Vedanta Limited and deleveraging during the year, lower return on investments due to sharp rise in G-Sec yields resulting in mark-to-market losses on investments.
Exceptional ItemsThe exceptional gains during the year was `2,897 crore mainly on account of reversal of previously recorded impairment of `7,016 crore at our Oil & Gas business following the progress on the key growth projects which are expected to result in enhanced recovery of resources; partially offset by impairment of Iron Ore Goa assets of ` 2,329 crore due to suspension of mining operations from March 16, 2018 pursuant to Supreme Court Order dated February 7, 2018 and reclassification of foreign currency translation reserve of ` 1,485 crore relating to subsidiary investment companies under liquidation.
TaxationTax expense (before exceptional items and DDT) for the year FY2018 was at ` 5,339 crore, implying tax rate of 32% compared to ` 2,103 crore and a tax rate of 15% in FY2017.
Effective tax rate was higher on account of phasing out of investment allowance claims, change in cess rate from 3% to 4% as per Finance Act, 2018 and change in profit mix.
Attributable Profit after Tax (before Exceptional Items and DDT)Attributable PAT before exceptional items & DDT was ` 8,025 crore in FY2018 compared to ` 7,323 in FY2017 (up 10% y-o-y).
Earnings per ShareEarnings per share before exceptional items & DDT for FY2018 were ` 21.96 per share as compared to ` 24.70 per share in FY2017.
DividendConsidering the record interim dividend of `21.20 per share, the Board has decided not to declare a final dividend in FY2018. The total dividend for FY2018 is `21.20 per share which will be `7,881 crore.
Shareholders FundTotal Shareholders fund as on March 31, 2018 aggregated ` 63,508 crore as compared to ` 60,500 crore as at March 31, 2017. The increase was primarily on account of profit during the year partially offset by special dividend payout.
Net Fixed AssetsThe net fixed assets as on March 31, 2018 were ` 112,334 crore. This comprises of ` 16,140 crore as Capital work-in-progress as on March 31, 2018.
Balance SheetWe continue to have a strong balance sheet with cash and liquid investments of ` 36,201 crore as on March 31, 2018 which is mostly invested in debt related mutual funds, bank deposits and bonds.
Gross debt as on March 31, 2018 was ` 58,159 crore, a reduction of ` 8,512 crore since March 31, 2017 (excluding repayment of temporary borrowings at Zinc India and preference shares issued pursuant to the Cairn India merger in April 2017). Gross debt comprises term debt of c. ` 33,200 crore and short-term working capital loans (including preference shares) of c. ` 25,000 crore. The loan in ` currency is 93% and balance 7% in foreign currency. Average debt maturity is c.2 years as at March 31, 2018.
In April 2017, Crisil upgraded the credit rating of the Company to AA/Stable and further improved the same to AA/Positive in March 2018.
Employees at Raageshwari Gas Terminal, Barmer, Cairn Oil & Gas
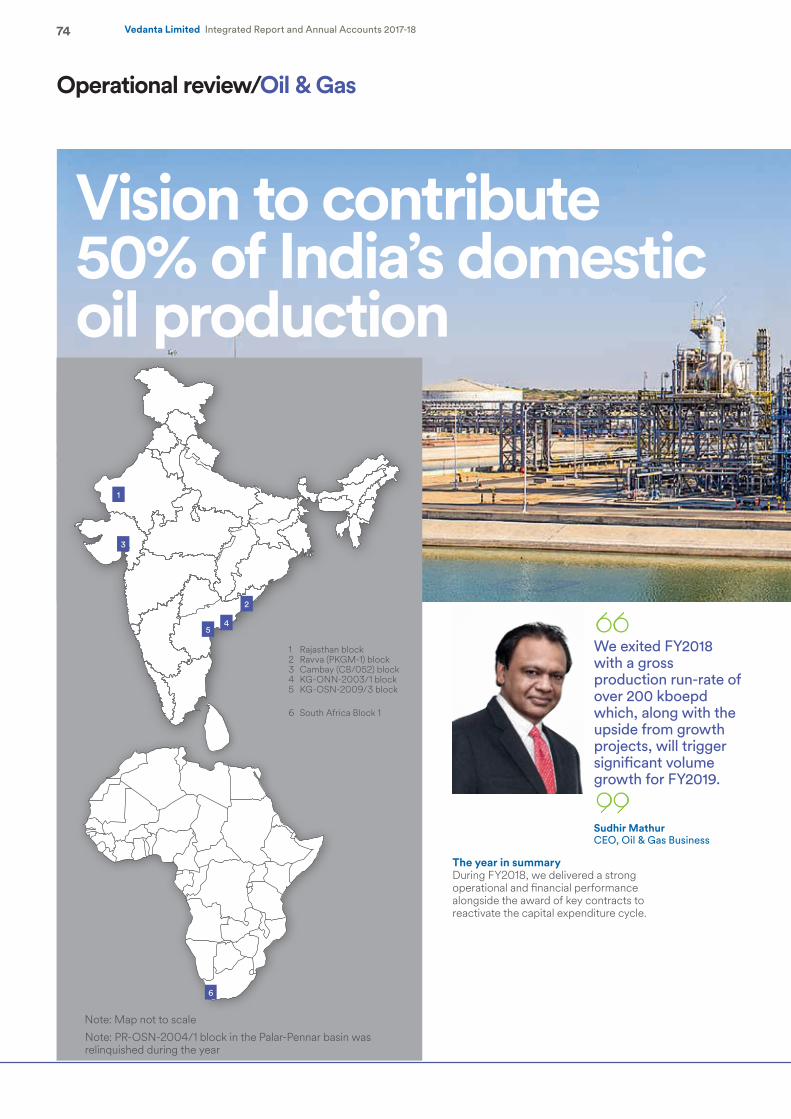
74 Vedanta Limited Integrated Report and Annual Accounts 2017-18
Operational review/Oil & Gas
Vision to contribute 50% of India’s domestic oil production
The year in summaryDuring FY2018, we delivered a strong operational and financial performance alongside the award of key contracts to reactivate the capital expenditure cycle.
We exited FY2018 with a gross production run-rate of over 200 kboepd which, along with the upside from growth projects, will trigger significant volume growth for FY2019.
Sudhir MathurCEO, Oil & Gas Business
1 Rajasthan block2 Ravva (PKGM-1) block3 Cambay (CB/052) block4 KG-ONN-2003/1 block5 KG-OSN-2009/3 block
6 South Africa Block 1
Note: PR-OSN-2004/1 block in the Palar-Pennar basin was relinquished during the year
Note: Map not to scale
6
1
3
2
45
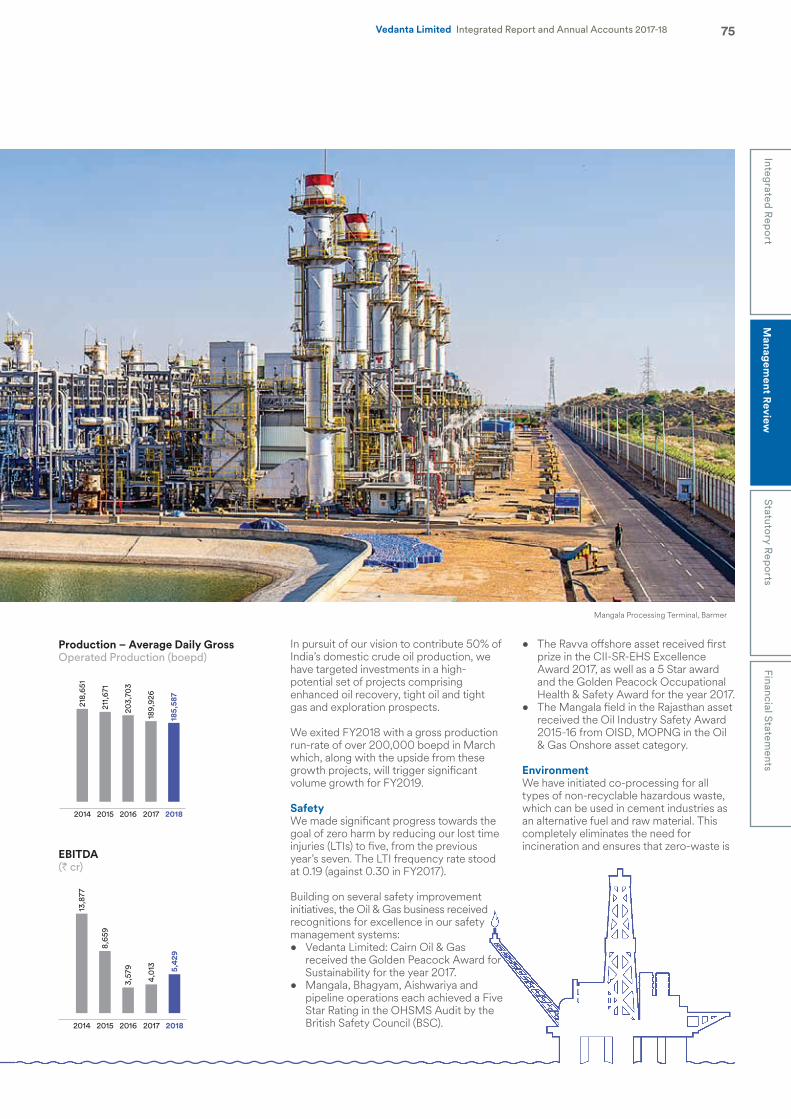
2014 2015 2016 2017 2018
218
,651
211
,671
20
3,70
3
189
,926
185
,587
2014 2015 2016 2017 2018
13,
877
8,6
59
3,5
79
4,0
13 5,4
29
75Integrated R
eport
Managem
ent Review
Statutory Rep
ortsFinancial Statem
entsVedanta Limited Integrated Report and Annual Accounts 2017-18
In pursuit of our vision to contribute 50% of India’s domestic crude oil production, we have targeted investments in a high-potential set of projects comprising enhanced oil recovery, tight oil and tight gas and exploration prospects.
We exited FY2018 with a gross production run-rate of over 200,000 boepd in March which, along with the upside from these growth projects, will trigger significant volume growth for FY2019.
SafetyWe made significant progress towards the goal of zero harm by reducing our lost time injuries (LTIs) to five, from the previous year’s seven. The LTI frequency rate stood at 0.19 (against 0.30 in FY2017).
Building on several safety improvement initiatives, the Oil & Gas business received recognitions for excellence in our safety management systems:• Vedanta Limited: Cairn Oil & Gas
received the Golden Peacock Award for Sustainability for the year 2017.
• Mangala, Bhagyam, Aishwariya and pipeline operations each achieved a Five Star Rating in the OHSMS Audit by the British Safety Council (BSC).
• The Ravva offshore asset received first prize in the CII-SR-EHS Excellence Award 2017, as well as a 5 Star award and the Golden Peacock Occupational Health & Safety Award for the year 2017.
• The Mangala field in the Rajasthan asset received the Oil Industry Safety Award 2015-16 from OISD, MOPNG in the Oil & Gas Onshore asset category.
EnvironmentWe have initiated co-processing for all types of non-recyclable hazardous waste, which can be used in cement industries as an alternative fuel and raw material. This completely eliminates the need for incineration and ensures that zero-waste is
Production – Average Daily GrossOperated Production (boepd)
EBITDA(` cr)
Mangala Processing Terminal, Barmer
76 Vedanta Limited Integrated Report and Annual Accounts 2017-18
Production performance
Unit FY2018 FY2017 % change
Gross production boepd 185,587 189,926 (2%)Rajasthan boepd 157,983 161,571 (2%)Ravva boepd 17,195 18,602 (8%)Cambay boepd 10,408 9,753 7%Oil bopd 177,678 184,734 (4%)Gas mmscfd 47.4 31.2 52%Net production – working interest boepd 118,620 121,186 (2%)Oil bopd 114,774 118,976 (4%)Gas mmscfd 23.1 13.3 74%Gross production mmboe 67.7 69.3 (2%)Working interest production mmboe 43.3 44.2 (2%)
Prices
FY2018 FY2017 % change
Average Brent prices – US$/barrel 57.5 48.6 18%
Financial performance(`crore, unless stated)
FY2018 FY2017 % change
Revenue 9,536 8,204 16%EBITDA 5,429 4,013 35%EBITDA margin 57% 49% –
Raageshwari Deep Gas (RDG) in Rajasthan increased to an average of 37 mmscfd in FY2018 (44 mmscfd in Q4), with gas sales post-captive consumption of 22 mmscfd from an average production of 26 mmscfd in FY2017, with gas sales post-captive consumption at 10 mmscfd.
Ravva blockProduction from the Ravva block was down by 8% at an average rate of 17,195 boepd, owing to natural decline. Closing of the water-producing zones in two wells, and gas lift optimisation, has helped to enhance production rates from the field, partially offsetting the natural decline.
Cambay blockProduction from the Cambay block was up by 7% at an average rate of 10,408 boepd. This was primarily due to the start of the infill drilling campaign, together with effective reservoir management practices.
At Cambay, we began the four-well infill campaign in January 2018 to enhance production volumes. Drilling of the first well
sent to landfill. To date, around 4,592 mt of non-recyclable hazardous waste has been safely and sustainably handled using the co-processing route.
The Oil & Gas business has also carried out a fugitive emission monitoring study for all its operating assets. This revealed that there has been no significant leakage of fugitive emissions to the atmosphere, and that we are succeeding in minimising our greenhouse gas emissions.
OperationsAverage gross production for FY2018 was 185,587 barrels of oil equivalent per day (boepd), 2% lower y-o-y primarily due to natural field decline, partially offset by volume ramp-up from infill wells in Mangala and Cambay and continued effective reservoir management practices across assets. All three blocks – Rajasthan, Ravva and Cambay – continued to record a plant uptime of over 99% (FY2017: 99%).
Production details by block are summarised below.
Rajasthan blockRajasthan block production was 2% lower at an average rate of 157,983 boepd. This reduction was due to natural decline in the field. However, the decline was partially offset by encouraging results from the new wells added as part of the Mangala infill activity, the ramp-up of Raageshwari Deep Gas (RDG) Phase I and the continuing efficacy of our reservoir management practices.
At Rajasthan, the drilling programme of 15 infill wells at the Mangala field started during Q2 FY2018. Of these, 13 wells have been brought online with the remaining two wells to be completed in Q1 FY2019.
In order to boost volumes from satellite fields, we began an eight-well drilling campaign. Four wells in NI and NE have been brought online and the remainder are expected to be completed in Q1 FY2019.
RDG Phase I ramped up fully to 45 million standard cubic feet per day (mmscfd) during FY2018. Gas production from
Open Acreage Licencing Policy provides an opportunity to acquire acreages from all open sedimentary basins of India. We have submitted bids for all the 55 blocks on offer.
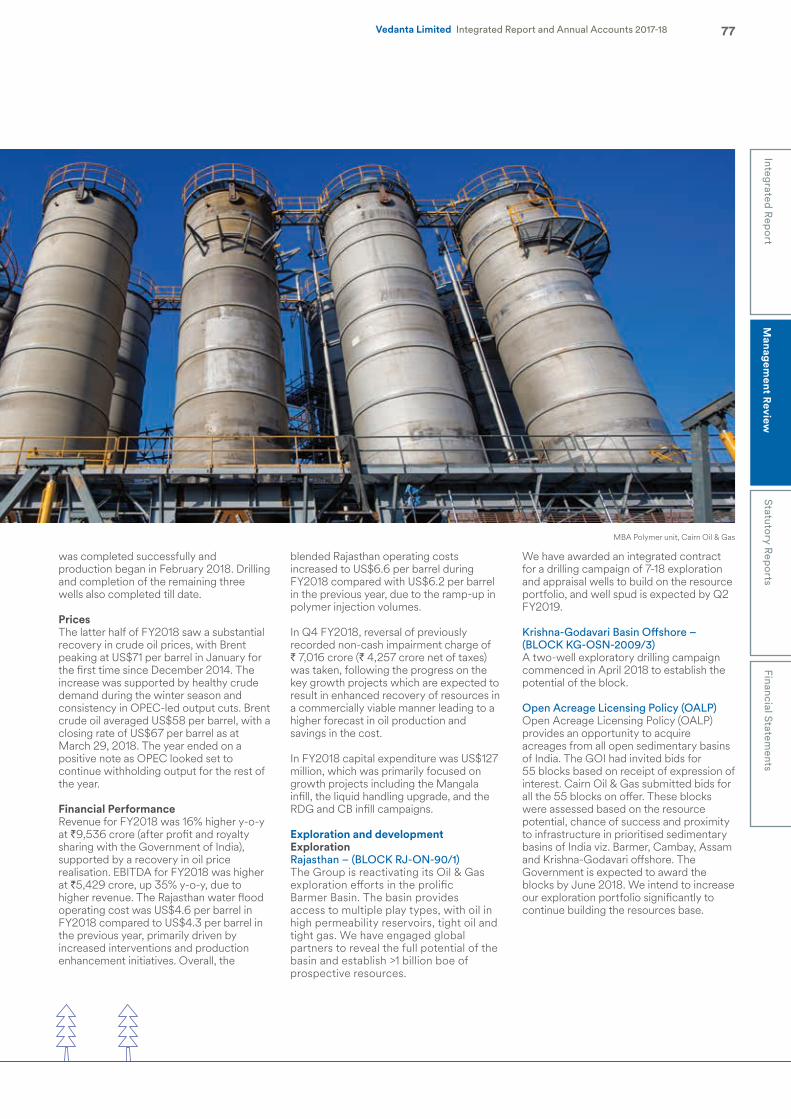
77Integrated R
eport
Managem
ent Review
Statutory Rep
ortsFinancial Statem
entsVedanta Limited Integrated Report and Annual Accounts 2017-18
was completed successfully and production began in February 2018. Drilling and completion of the remaining three wells also completed till date.
PricesThe latter half of FY2018 saw a substantial recovery in crude oil prices, with Brent peaking at US$71 per barrel in January for the first time since December 2014. The increase was supported by healthy crude demand during the winter season and consistency in OPEC-led output cuts. Brent crude oil averaged US$58 per barrel, with a closing rate of US$67 per barrel as at March 29, 2018. The year ended on a positive note as OPEC looked set to continue withholding output for the rest of the year.
Financial PerformanceRevenue for FY2018 was 16% higher y-o-y at `9,536 crore (after profit and royalty sharing with the Government of India), supported by a recovery in oil price realisation. EBITDA for FY2018 was higher at `5,429 crore, up 35% y-o-y, due to higher revenue. The Rajasthan water flood operating cost was US$4.6 per barrel in FY2018 compared to US$4.3 per barrel in the previous year, primarily driven by increased interventions and production enhancement initiatives. Overall, the
blended Rajasthan operating costs increased to US$6.6 per barrel during FY2018 compared with US$6.2 per barrel in the previous year, due to the ramp-up in polymer injection volumes.
In Q4 FY2018, reversal of previously recorded non-cash impairment charge of ` 7,016 crore (` 4,257 crore net of taxes) was taken, following the progress on the key growth projects which are expected to result in enhanced recovery of resources in a commercially viable manner leading to a higher forecast in oil production and savings in the cost.
In FY2018 capital expenditure was US$127 million, which was primarily focused on growth projects including the Mangala infill, the liquid handling upgrade, and the RDG and CB infill campaigns.
Exploration and developmentExplorationRajasthan – (BLOCK RJ-ON-90/1)The Group is reactivating its Oil & Gas exploration efforts in the prolific Barmer Basin. The basin provides access to multiple play types, with oil in high permeability reservoirs, tight oil and tight gas. We have engaged global partners to reveal the full potential of the basin and establish >1 billion boe of prospective resources.
We have awarded an integrated contract for a drilling campaign of 7-18 exploration and appraisal wells to build on the resource portfolio, and well spud is expected by Q2 FY2019.
Krishna-Godavari Basin Offshore – (BLOCK KG-OSN-2009/3)A two-well exploratory drilling campaign commenced in April 2018 to establish the potential of the block.
Open Acreage Licensing Policy (OALP) Open Acreage Licensing Policy (OALP) provides an opportunity to acquire acreages from all open sedimentary basins of India. The GOI had invited bids for 55 blocks based on receipt of expression of interest. Cairn Oil & Gas submitted bids for all the 55 blocks on offer. These blocks were assessed based on the resource potential, chance of success and proximity to infrastructure in prioritised sedimentary basins of India viz. Barmer, Cambay, Assam and Krishna-Godavari offshore. The Government is expected to award the blocks by June 2018. We intend to increase our exploration portfolio significantly to continue building the resources base.
MBA Polymer unit, Cairn Oil & Gas
78 Vedanta Limited Integrated Report and Annual Accounts 2017-18
Other projectsSurface facility upgradeIn order to maximise production at the Mangala Processing Terminal (MPT), we are focusing on increasing liquid handling capacity to handle additional volumes. We are planning a series of measures to increase the liquid handling and water injection capacities in a phased manner.
Outlook The Oil & Gas business has reactivated its capital expenditure programme with the objectives of enhancing the exploration portfolio, executing development projects to add incremental volumes and maintaining robust operations to generate free cash flow post-capex.
For FY2019, we expect to achieve a significant growth in production volume, with total volumes in the range of 220-250 kboepd through executing our growth projects, with opex of sub-$7/boe. We estimate the net capex commitment at US$600-800 million.
Strategic prioritiesOur focus and priorities will be to:• evaluate further opportunities to expand
the exploration portfolio through OALP and other opportunities;
• execute growth projects within schedule and cost;
• further progress on execution on growth projects to deliver 275-320 kboepd in FY2020;
• continue to progress towards zero harm, zero waste and zero discharge; and
• continue to operate at a low cost-base and generate free cash flow post-capex.
Development The Oil & Gas business has a robust portfolio of development opportunities with the potential to deliver incremental volumes. In order to execute these projects on time and within budget, we have decided on a fundamental change to our project execution strategy. We have devised an ‘integrated project development’ strategy, with an in-built risk and reward mechanism to drive incremental value from the schedule and recoveries. This new model is being delivered in partnership with leading global oil field service companies.
Mangala infill – 45 wellsWe are embarking on a significant drilling programme of an additional 45 infill wells in the prolific Mangala field, with an estimated ultimate recovery of 18 million barrels. The contract for the project has been awarded, with first oil expected in Q1 FY2019.
Enhanced oil recovery (EOR) projects The valuable learning we gained from the successful implementation of the Mangala polymer EOR project, is being leveraged to enhance production from the Bhagyam and Aishwariya fields. The contracts for these EOR projects have been awarded and preparations are on track with first oil expected in Q1 FY2019. We are targeting incremental recovery of 40 million barrels.
MBA alkaline surfactant polymer (ASP)Following a successful pilot test at the Mangala field, the way is now clear to implement the world’s largest alkaline surfactant polymer (ASP) project. The work, which will enable incremental recovery from this prolific field, entails drilling wells and developing infrastructure facilities at the Mangala Processing Terminal.
The drilling contract for the ASP implementation has been awarded, and the contract for facilities will be awarded in due course.
With full-field implementation of ASP in the MBA fields, we estimate potential incremental recovery of around 200 million barrels of oil, with first oil expected in Q3 FY2019.
Tight Oil & Gas projectsTight oil: Aishwariya Barmer Hill (ABH)The Aishwariya Barmer Hill (ABH) stage I production from seven existing wells began during Q2 FY2018. ABH stage II consists of drilling and fracking 39 new wells, creating new surface facilities including well hook-ups, pipeline augmentation and installing a de-gassing facility. The contract for tight oil wells and facilities has been awarded, and work is ongoing on the surface facility for ABH. We expect to start drilling in Q1 FY2019 with first oil expected in Q3 FY2019.
Raageshwari Deep Gas (RDG) developmentGas development in the RDG field in Rajasthan continues to be a strategic priority. Phase I of the project, to ramp up production to 45 mmscfd, was completed in December 2017. Phase II is being executed through an integrated development approach to ramp up overall Rajasthan gas production to ~150 mmscfd, and condensate production of 5 kboepd. We have awarded contracts, both for the drilling of wells and the gas terminal. Drilling will begin in Q1 FY2019.
Tight oil appraisal fieldsWe had made 38 discoveries in the Rajasthan Block, with some comprising complex tight oil reservoirs. In order to monetise them, we will carry out appraisal activities through global technology partnerships over the next 12-15 months, prior to conceptualising and developing a full-field development plan. Contract for appraisal of 4 fields targeting 190 mmboe of resources has been awarded.
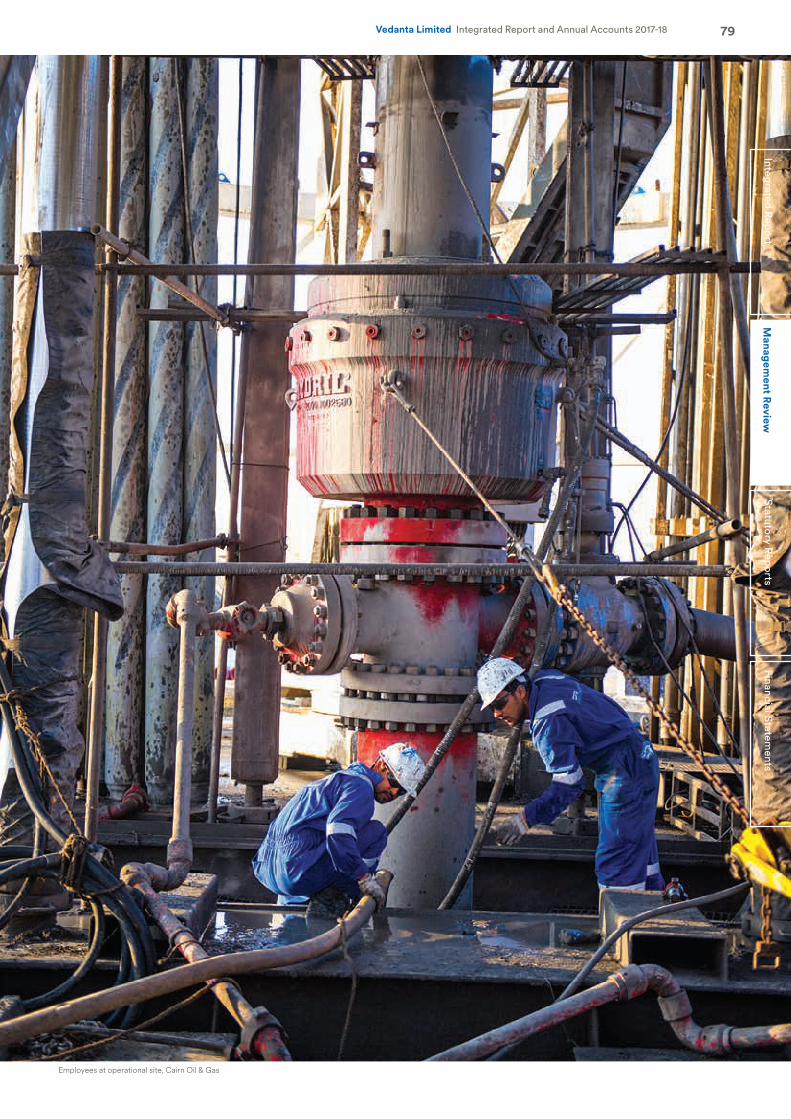
79Vedanta Limited Integrated Report and Annual Accounts 2017-18Financial Statem
entsStatutory R
eports
Managem
ent Review
Integrated Rep
ort
Employees at operational site, Cairn Oil & Gas
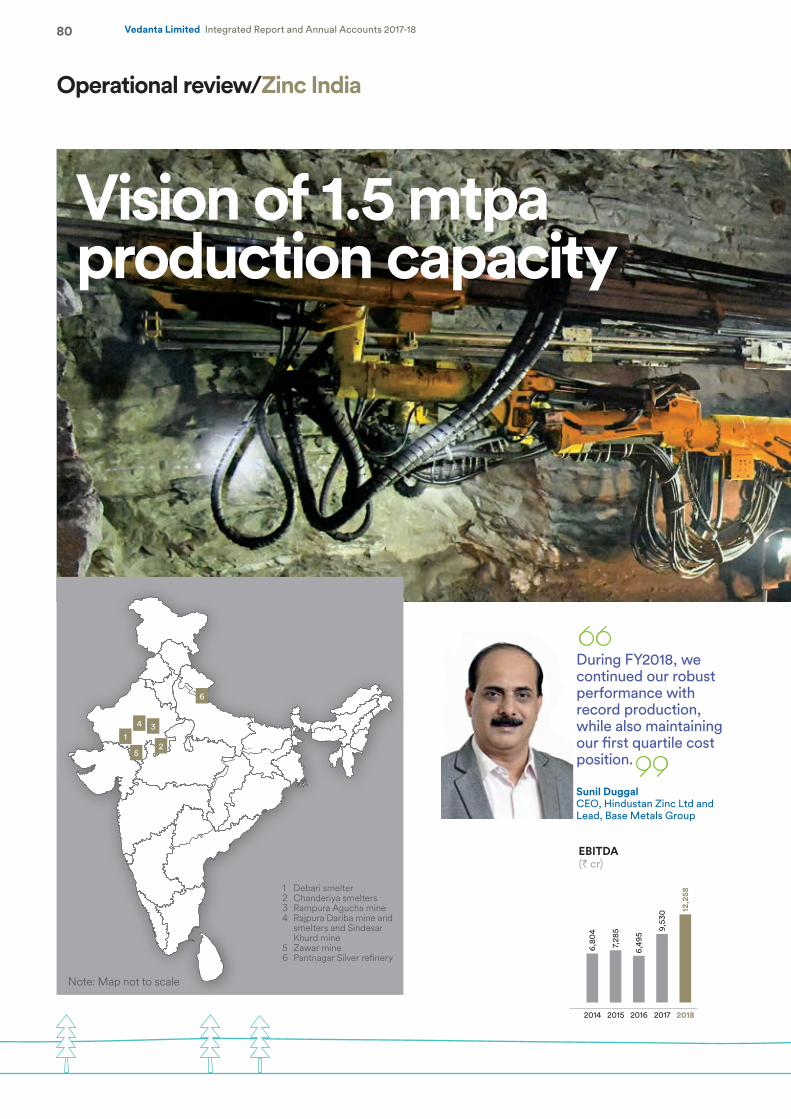
2014 2015 2016 2017 2018
6,8
04
7,2
85
6,4
95
9,5
30
12,
258
EBITDA(` cr)
80 Vedanta Limited Integrated Report and Annual Accounts 2017-18
Operational review/Zinc India
Vision of 1.5 mtpa production capacity
During FY2018, we continued our robust performance with record production, while also maintaining our first quartile cost position.
Sunil DuggalCEO, Hindustan Zinc Ltd and Lead, Base Metals Group
1 Debari smelter2 Chanderiya smelters3 Rampura Agucha mine4 Rajpura Dariba mine and
smelters and Sindesar Khurd mine
5 Zawar mine6 Pantnagar Silver refinery
Note: Map not to scale
1
4 3
6
25
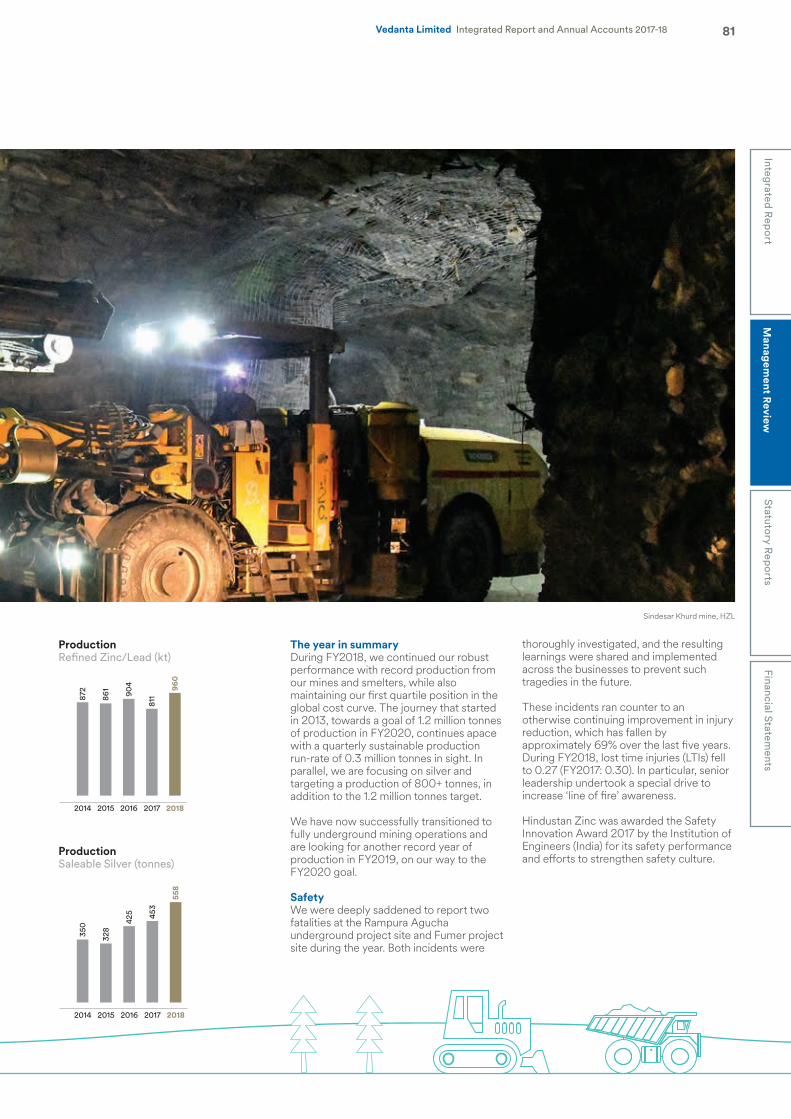
2014 2015 2016 2017 2018
872
861 9
04
811
960
2014 2015 2016 2017 2018
350
328
425
453
558
81Integrated R
eport
Managem
ent Review
Statutory Rep
ortsFinancial Statem
entsVedanta Limited Integrated Report and Annual Accounts 2017-18
The year in summaryDuring FY2018, we continued our robust performance with record production from our mines and smelters, while also maintaining our first quartile position in the global cost curve. The journey that started in 2013, towards a goal of 1.2 million tonnes of production in FY2020, continues apace with a quarterly sustainable production run-rate of 0.3 million tonnes in sight. In parallel, we are focusing on silver and targeting a production of 800+ tonnes, in addition to the 1.2 million tonnes target.
We have now successfully transitioned to fully underground mining operations and are looking for another record year of production in FY2019, on our way to the FY2020 goal.
SafetyWe were deeply saddened to report two fatalities at the Rampura Agucha underground project site and Fumer project site during the year. Both incidents were
thoroughly investigated, and the resulting learnings were shared and implemented across the businesses to prevent such tragedies in the future.
These incidents ran counter to an otherwise continuing improvement in injury reduction, which has fallen by approximately 69% over the last five years. During FY2018, lost time injuries (LTIs) fell to 0.27 (FY2017: 0.30). In particular, senior leadership undertook a special drive to increase ‘line of fire’ awareness.
Hindustan Zinc was awarded the Safety Innovation Award 2017 by the Institution of Engineers (India) for its safety performance and efforts to strengthen safety culture.
ProductionRefined Zinc/Lead (kt)
ProductionSaleable Silver (tonnes)
Sindesar Khurd mine, HZL
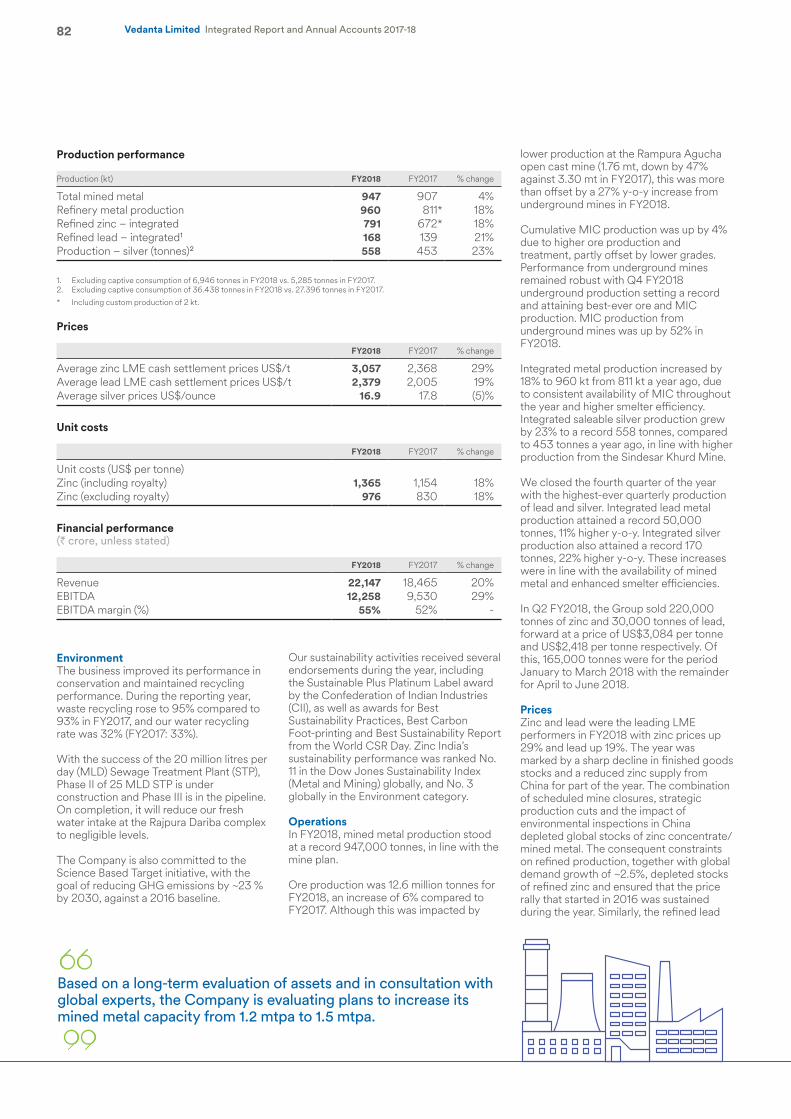
82 Vedanta Limited Integrated Report and Annual Accounts 2017-18
Production performance
Production (kt) FY2018 FY2017 % change
Total mined metal 947 907 4%Refinery metal production 960 811* 18%Refined zinc – integrated 791 672* 18%Refined lead – integrated1 168 139 21%Production – silver (tonnes)2 558 453 23%
1. Excluding captive consumption of 6,946 tonnes in FY2018 vs. 5,285 tonnes in FY2017.2. Excluding captive consumption of 36.438 tonnes in FY2018 vs. 27.396 tonnes in FY2017.
* Including custom production of 2 kt.
Prices
FY2018 FY2017 % change
Average zinc LME cash settlement prices US$/t 3,057 2,368 29%Average lead LME cash settlement prices US$/t 2,379 2,005 19%Average silver prices US$/ounce 16.9 17.8 (5)%
Unit costs
FY2018 FY2017 % change
Unit costs (US$ per tonne)Zinc (including royalty) 1,365 1,154 18%Zinc (excluding royalty) 976 830 18%
Financial performance(` crore, unless stated)
FY2018 FY2017 % change
Revenue 22,147 18,465 20%EBITDA 12,258 9,530 29%EBITDA margin (%) 55% 52% -
lower production at the Rampura Agucha open cast mine (1.76 mt, down by 47% against 3.30 mt in FY2017), this was more than offset by a 27% y-o-y increase from underground mines in FY2018.
Cumulative MIC production was up by 4% due to higher ore production and treatment, partly offset by lower grades. Performance from underground mines remained robust with Q4 FY2018 underground production setting a record and attaining best-ever ore and MIC production. MIC production from underground mines was up by 52% in FY2018.
Integrated metal production increased by 18% to 960 kt from 811 kt a year ago, due to consistent availability of MIC throughout the year and higher smelter efficiency. Integrated saleable silver production grew by 23% to a record 558 tonnes, compared to 453 tonnes a year ago, in line with higher production from the Sindesar Khurd Mine.
We closed the fourth quarter of the year with the highest-ever quarterly production of lead and silver. Integrated lead metal production attained a record 50,000 tonnes, 11% higher y-o-y. Integrated silver production also attained a record 170 tonnes, 22% higher y-o-y. These increases were in line with the availability of mined metal and enhanced smelter efficiencies.
In Q2 FY2018, the Group sold 220,000 tonnes of zinc and 30,000 tonnes of lead, forward at a price of US$3,084 per tonne and US$2,418 per tonne respectively. Of this, 165,000 tonnes were for the period January to March 2018 with the remainder for April to June 2018.
PricesZinc and lead were the leading LME performers in FY2018 with zinc prices up 29% and lead up 19%. The year was marked by a sharp decline in finished goods stocks and a reduced zinc supply from China for part of the year. The combination of scheduled mine closures, strategic production cuts and the impact of environmental inspections in China depleted global stocks of zinc concentrate/mined metal. The consequent constraints on refined production, together with global demand growth of ~2.5%, depleted stocks of refined zinc and ensured that the price rally that started in 2016 was sustained during the year. Similarly, the refined lead
EnvironmentThe business improved its performance in conservation and maintained recycling performance. During the reporting year, waste recycling rose to 95% compared to 93% in FY2017, and our water recycling rate was 32% (FY2017: 33%).
With the success of the 20 million litres per day (MLD) Sewage Treatment Plant (STP), Phase II of 25 MLD STP is under construction and Phase III is in the pipeline. On completion, it will reduce our fresh water intake at the Rajpura Dariba complex to negligible levels.
The Company is also committed to the Science Based Target initiative, with the goal of reducing GHG emissions by ~23 % by 2030, against a 2016 baseline.
Our sustainability activities received several endorsements during the year, including the Sustainable Plus Platinum Label award by the Confederation of Indian Industries (CII), as well as awards for Best Sustainability Practices, Best Carbon Foot-printing and Best Sustainability Report from the World CSR Day. Zinc India’s sustainability performance was ranked No. 11 in the Dow Jones Sustainability Index (Metal and Mining) globally, and No. 3 globally in the Environment category.
OperationsIn FY2018, mined metal production stood at a record 947,000 tonnes, in line with the mine plan.
Ore production was 12.6 million tonnes for FY2018, an increase of 6% compared to FY2017. Although this was impacted by
Based on a long-term evaluation of assets and in consultation with global experts, the Company is evaluating plans to increase its mined metal capacity from 1.2 mtpa to 1.5 mtpa.
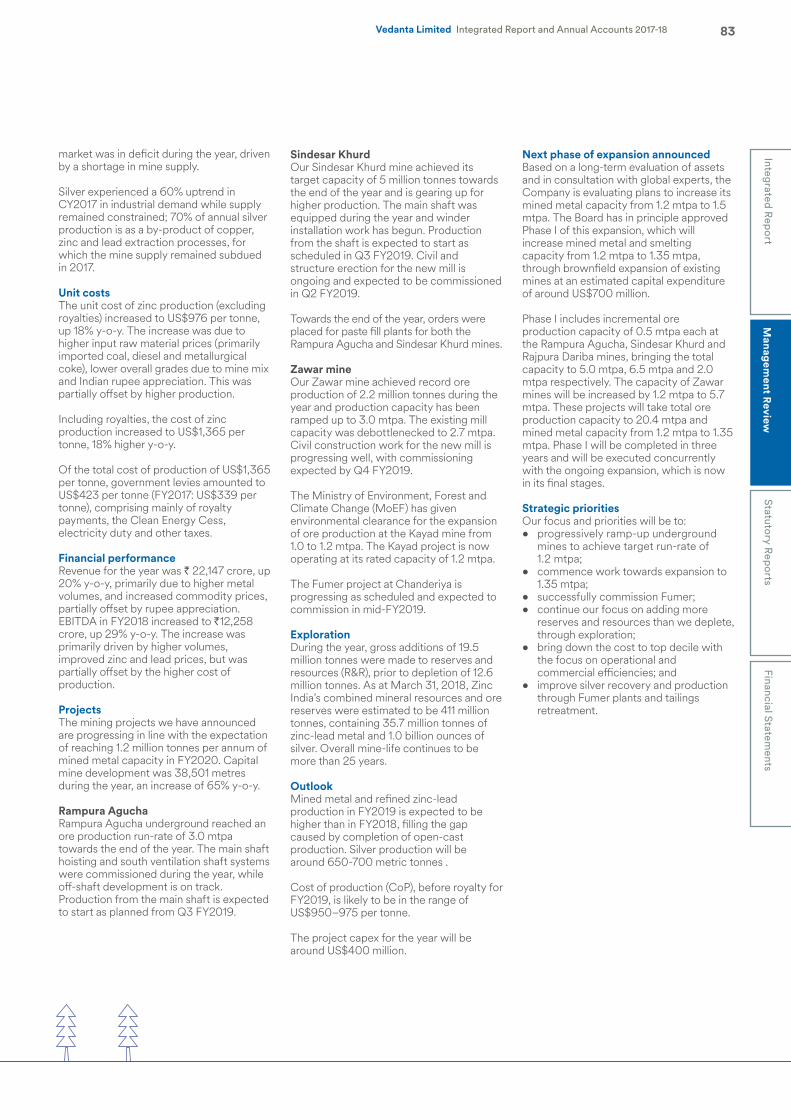
83Integrated R
eport
Managem
ent Review
Statutory Rep
ortsFinancial Statem
entsVedanta Limited Integrated Report and Annual Accounts 2017-18
market was in deficit during the year, driven by a shortage in mine supply.
Silver experienced a 60% uptrend in CY2017 in industrial demand while supply remained constrained; 70% of annual silver production is as a by-product of copper, zinc and lead extraction processes, for which the mine supply remained subdued in 2017.
Unit costsThe unit cost of zinc production (excluding royalties) increased to US$976 per tonne, up 18% y-o-y. The increase was due to higher input raw material prices (primarily imported coal, diesel and metallurgical coke), lower overall grades due to mine mix and Indian rupee appreciation. This was partially offset by higher production.
Including royalties, the cost of zinc production increased to US$1,365 per tonne, 18% higher y-o-y.
Of the total cost of production of US$1,365 per tonne, government levies amounted to US$423 per tonne (FY2017: US$339 per tonne), comprising mainly of royalty payments, the Clean Energy Cess, electricity duty and other taxes.
Financial performanceRevenue for the year was ` 22,147 crore, up 20% y-o-y, primarily due to higher metal volumes, and increased commodity prices, partially offset by rupee appreciation. EBITDA in FY2018 increased to `12,258 crore, up 29% y-o-y. The increase was primarily driven by higher volumes, improved zinc and lead prices, but was partially offset by the higher cost of production.
ProjectsThe mining projects we have announced are progressing in line with the expectation of reaching 1.2 million tonnes per annum of mined metal capacity in FY2020. Capital mine development was 38,501 metres during the year, an increase of 65% y-o-y.
Rampura Agucha Rampura Agucha underground reached an ore production run-rate of 3.0 mtpa towards the end of the year. The main shaft hoisting and south ventilation shaft systems were commissioned during the year, while off-shaft development is on track. Production from the main shaft is expected to start as planned from Q3 FY2019.
Sindesar Khurd Our Sindesar Khurd mine achieved its target capacity of 5 million tonnes towards the end of the year and is gearing up for higher production. The main shaft was equipped during the year and winder installation work has begun. Production from the shaft is expected to start as scheduled in Q3 FY2019. Civil and structure erection for the new mill is ongoing and expected to be commissioned in Q2 FY2019.
Towards the end of the year, orders were placed for paste fill plants for both the Rampura Agucha and Sindesar Khurd mines.
Zawar mine Our Zawar mine achieved record ore production of 2.2 million tonnes during the year and production capacity has been ramped up to 3.0 mtpa. The existing mill capacity was debottlenecked to 2.7 mtpa. Civil construction work for the new mill is progressing well, with commissioning expected by Q4 FY2019.
The Ministry of Environment, Forest and Climate Change (MoEF) has given environmental clearance for the expansion of ore production at the Kayad mine from 1.0 to 1.2 mtpa. The Kayad project is now operating at its rated capacity of 1.2 mtpa.
The Fumer project at Chanderiya is progressing as scheduled and expected to commission in mid-FY2019.
ExplorationDuring the year, gross additions of 19.5 million tonnes were made to reserves and resources (R&R), prior to depletion of 12.6 million tonnes. As at March 31, 2018, Zinc India’s combined mineral resources and ore reserves were estimated to be 411 million tonnes, containing 35.7 million tonnes of zinc-lead metal and 1.0 billion ounces of silver. Overall mine-life continues to be more than 25 years.
OutlookMined metal and refined zinc-lead production in FY2019 is expected to be higher than in FY2018, filling the gap caused by completion of open-cast production. Silver production will be around 650-700 metric tonnes .
Cost of production (CoP), before royalty for FY2019, is likely to be in the range of US$950–975 per tonne.
The project capex for the year will be around US$400 million.
Next phase of expansion announcedBased on a long-term evaluation of assets and in consultation with global experts, the Company is evaluating plans to increase its mined metal capacity from 1.2 mtpa to 1.5 mtpa. The Board has in principle approved Phase I of this expansion, which will increase mined metal and smelting capacity from 1.2 mtpa to 1.35 mtpa, through brownfield expansion of existing mines at an estimated capital expenditure of around US$700 million.
Phase I includes incremental ore production capacity of 0.5 mtpa each at the Rampura Agucha, Sindesar Khurd and Rajpura Dariba mines, bringing the total capacity to 5.0 mtpa, 6.5 mtpa and 2.0 mtpa respectively. The capacity of Zawar mines will be increased by 1.2 mtpa to 5.7 mtpa. These projects will take total ore production capacity to 20.4 mtpa and mined metal capacity from 1.2 mtpa to 1.35 mtpa. Phase I will be completed in three years and will be executed concurrently with the ongoing expansion, which is now in its final stages.
Strategic prioritiesOur focus and priorities will be to:• progressively ramp-up underground
mines to achieve target run-rate of 1.2 mtpa;
• commence work towards expansion to 1.35 mtpa;
• successfully commission Fumer;• continue our focus on adding more
reserves and resources than we deplete, through exploration;
• bring down the cost to top decile with the focus on operational and commercial efficiencies; and
• improve silver recovery and production through Fumer plants and tailings retreatment.
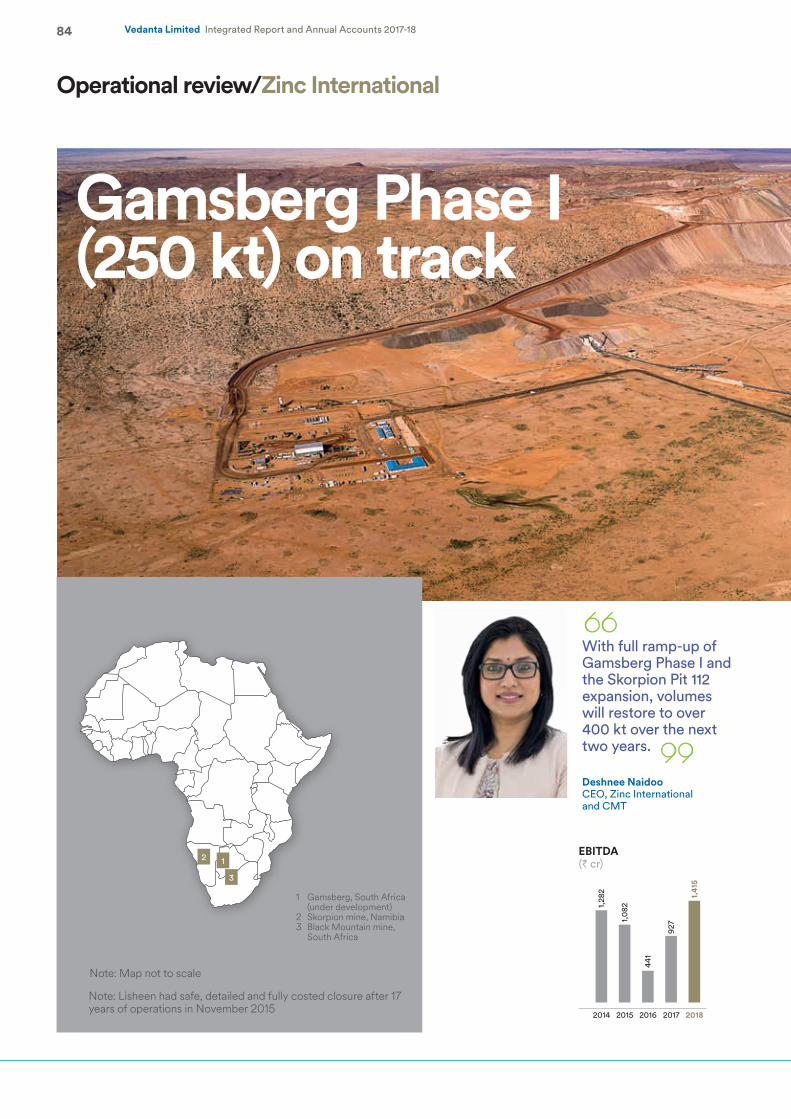
2014 2015 2016 2017 2018
1,28
2
1,0
82
441
927
1,4
15
EBITDA(` cr)
84 Vedanta Limited Integrated Report and Annual Accounts 2017-18
Operational review/Zinc International
Gamsberg Phase I (250 kt) on track
Note: Lisheen had safe, detailed and fully costed closure after 17 years of operations in November 2015
With full ramp-up of Gamsberg Phase I and the Skorpion Pit 112 expansion, volumes will restore to over 400 kt over the next two years.
Deshnee NaidooCEO, Zinc International and CMT
1 Gamsberg, South Africa (under development)
2 Skorpion mine, Namibia3 Black Mountain mine, South Africa
2
3
1
Note: Map not to scale
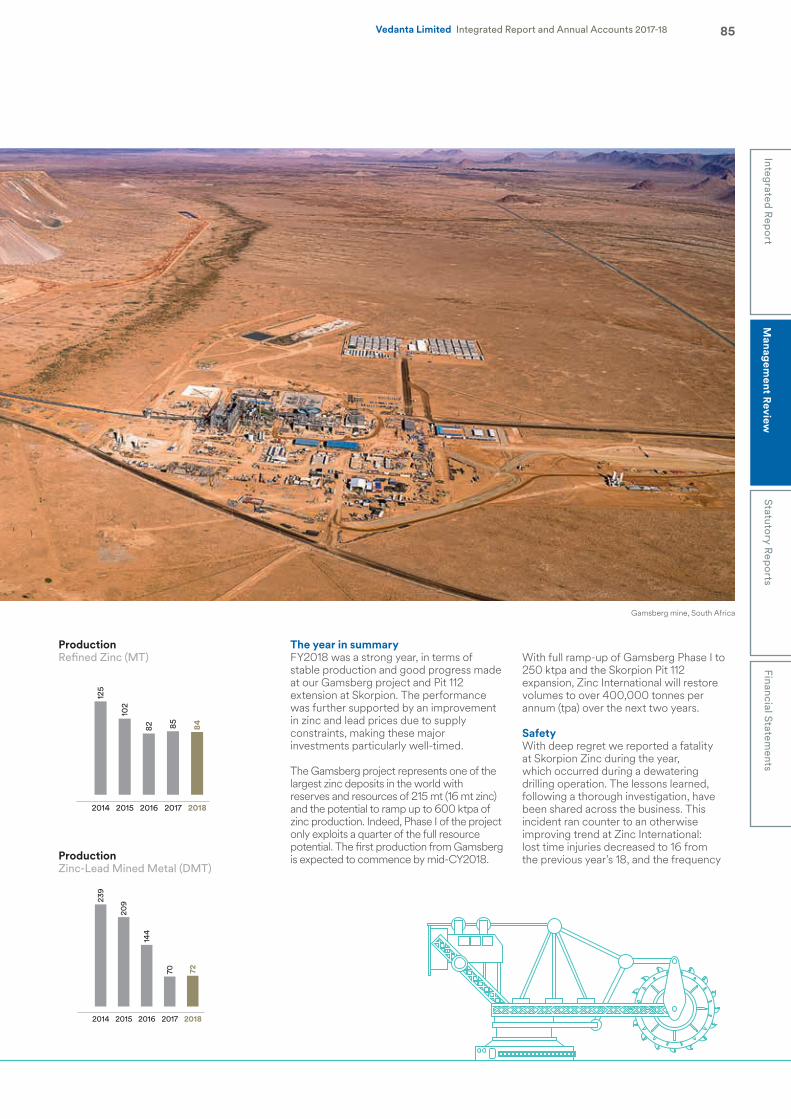
2014 2015 2016 2017 2018
125
10
2
82 85
84
2014 2015 2016 2017 2018
239
20
9
144
70
72
85Integrated R
eport
Managem
ent Review
Statutory Rep
ortsFinancial Statem
entsVedanta Limited Integrated Report and Annual Accounts 2017-18
The year in summaryFY2018 was a strong year, in terms of stable production and good progress made at our Gamsberg project and Pit 112 extension at Skorpion. The performance was further supported by an improvement in zinc and lead prices due to supply constraints, making these major investments particularly well-timed.
The Gamsberg project represents one of the largest zinc deposits in the world with reserves and resources of 215 mt (16 mt zinc) and the potential to ramp up to 600 ktpa of zinc production. Indeed, Phase I of the project only exploits a quarter of the full resource potential. The first production from Gamsberg is expected to commence by mid-CY2018.
With full ramp-up of Gamsberg Phase I to 250 ktpa and the Skorpion Pit 112 expansion, Zinc International will restore volumes to over 400,000 tonnes per annum (tpa) over the next two years.
SafetyWith deep regret we reported a fatality at Skorpion Zinc during the year, which occurred during a dewatering drilling operation. The lessons learned, following a thorough investigation, have been shared across the business. This incident ran counter to an otherwise improving trend at Zinc International: lost time injuries decreased to 16 from the previous year’s 18, and the frequency
ProductionRefined Zinc (MT)
ProductionZinc-Lead Mined Metal (DMT)
Gamsberg mine, South Africa
86 Vedanta Limited Integrated Report and Annual Accounts 2017-18
Production performance
FY2018 FY2017 % Change
Total production (kt) 157 156 –Production – mined metal (kt)BMM 72 70 3%Refined metal Skorpion 84 85 (1)%
Unit costs
FY2018 FY2017 % Change
Zinc (US$ per tonne) unit cost 1,603 1,417 13%
Financial performance (` crore, unless stated)
FY2018 FY2017 % Change
Revenue 3,446 2,230 55%EBITDA 1,415 927 53%EBITDA margin 41% 42% –
higher maintenance costs at BMM and lower than planned Copper credits at BMM. This was partly offset by the improvements in energy cost and TCRC savings.
Financial performanceDuring the year, revenue increased by 55% to ` 3,446 crore, driven by higher sales volumes and improved price realisations, partially offset by rupee appreciation. The same factors lifted EBITDA to ` 1,415 crore, up 53% from ` 927 crore in FY2017. This was partially offset by a higher cost of production.
ProjectsAt Gamsberg, we are on track for the cold commissioning of the concentrator plant in Q1 FY2019. The ore extraction from the South Pit is also on schedule, till March 2018 we completed 80% of pre-stripping and excavated 56 million tonnes of waste. Completion works of mechanical equipment erection, and infrastructure for power and water pipelines for the concentrator, are in progress. We are targeting 500 kt of ore stockpile ahead of the first feed to the concentrator plant.
The first phase of the project is expected to have a mine life of 13 years, replacing the production lost by the closure of the Lisheen mine and restoring volumes to over 400,000 tpa at Zinc International. First production is on track for commencement in mid-CY2018, with 9-12 months for ramp-up to full production of 250,000 tpa. Cost of production is estimated at $1000-1150 per tonne of MIC. Indeed, Phase 1 of the project only exploits a quarter of the full resource potential. We see Gamsberg reaching a potential of 600 ktpa through modular expansion in future through Phase 2 and Phase 3 projects. Gamsberg Phase 2 can start immediately after completion of Phase 1 and will have some synergies with Phase 1. The mine plans have been developed and an expanded mega pit design has been completed to enable a faster and efficient Phase 2 execution. In terms of output, we can expect to add another 200 to 250 ktpa metal in concentrate in 2-3 years.
At Skorpion, the Pit 112 extension project is progressing well, and waste stripping has ramped up to its peak run-rate. ~45% of waste stripping was completed by the end
rate showed a significant decline to 1.36 (FY2017: 2.24), despite the increased activities of the Gamsberg project.
Zinc International has further strengthened its efforts in managing risk across its operations with emphasis on business partner selection, on-boarding and management, robust risk management systems and safety culture programmes aimed at achieving our goal of ‘zero harm, zero waste and zero discharge’. We achieved a significant improvement in dust control and monitoring, as well as a reduction in lead in blood levels – indeed, zero cases above legal limits were reported for the year.
Environment There were no Level 3 and Level 4 incidents reported. The water recycling rate improved to 38% compared to 22% in FY2017. A total of four properties (21,900 ha against a compliance target of 12,900 ha) were purchased in accordance with the Gamsberg biodiversity offset agreement.
OperationsProduction for FY2018 stood at 157,000 tonnes, in line with the previous year. Higher production at BMM, due to higher grades and improved recoveries from
process improvements were partially offset by the planned maintenance shutdown at Skorpion’s acid plant in Q1 FY2018, and lower levels of ex-pit ore.
Skorpion’s production was slightly down on FY2017, impacted by a combination of the planned maintenance shutdown of the acid plant in Q1 FY2018; early closure of Pit 103 for geotechnical reasons; and blending challenges to make up the required plant feed grade (from lower zinc grade stockpiles and high calcium ore).
At BMM, production was 3% higher than the previous year. The increase was due to higher grades from mine plan resequencing, improved drilling accuracy, and higher than planned recoveries from plant flotation optimisation.
Unit costsThe unit cost of production increased by 13% to US$1,603 per tonne, up from US$1,417 in the previous year. This was mainly driven by a combination of reallocation of capitalised stripping costs of Pit 112 at Skorpion due to early ore production, unfavourable local currency appreciation, higher usage of purchased oxides and sulphur at Skorpion,
As at March 31, 2018, Zinc International’s combined mineral resources and ore reserves were estimated at 304 MT.
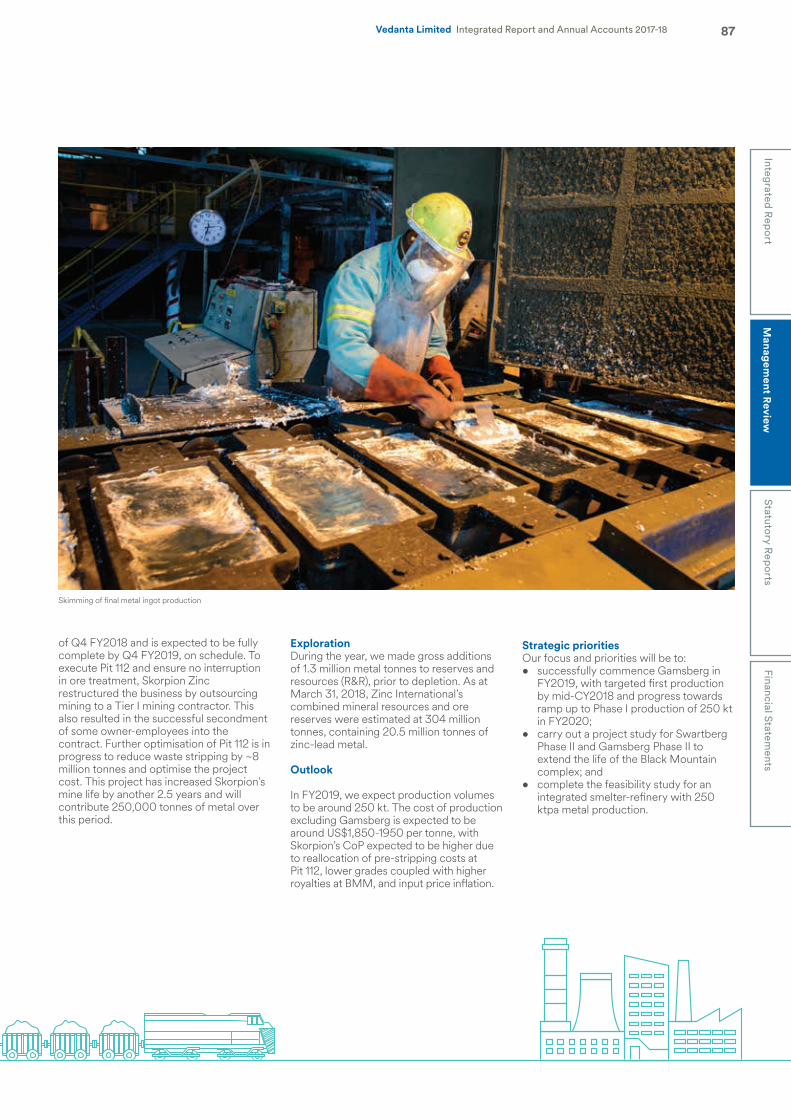
Skimming of final metal ingot production
87Integrated R
eport
Managem
ent Review
Statutory Rep
ortsFinancial Statem
entsVedanta Limited Integrated Report and Annual Accounts 2017-18
of Q4 FY2018 and is expected to be fully complete by Q4 FY2019, on schedule. To execute Pit 112 and ensure no interruption in ore treatment, Skorpion Zinc restructured the business by outsourcing mining to a Tier I mining contractor. This also resulted in the successful secondment of some owner-employees into the contract. Further optimisation of Pit 112 is in progress to reduce waste stripping by ~8 million tonnes and optimise the project cost. This project has increased Skorpion’s mine life by another 2.5 years and will contribute 250,000 tonnes of metal over this period.
ExplorationDuring the year, we made gross additions of 1.3 million metal tonnes to reserves and resources (R&R), prior to depletion. As at March 31, 2018, Zinc International’s combined mineral resources and ore reserves were estimated at 304 million tonnes, containing 20.5 million tonnes of zinc-lead metal.
Outlook
In FY2019, we expect production volumes to be around 250 kt. The cost of production excluding Gamsberg is expected to be around US$1,850-1950 per tonne, with Skorpion’s CoP expected to be higher due to reallocation of pre-stripping costs at Pit 112, lower grades coupled with higher royalties at BMM, and input price inflation.
Strategic prioritiesOur focus and priorities will be to:• successfully commence Gamsberg in
FY2019, with targeted first production by mid-CY2018 and progress towards ramp up to Phase I production of 250 kt in FY2020;
• carry out a project study for Swartberg Phase II and Gamsberg Phase II to extend the life of the Black Mountain complex; and
• complete the feasibility study for an integrated smelter-refinery with 250 ktpa metal production.
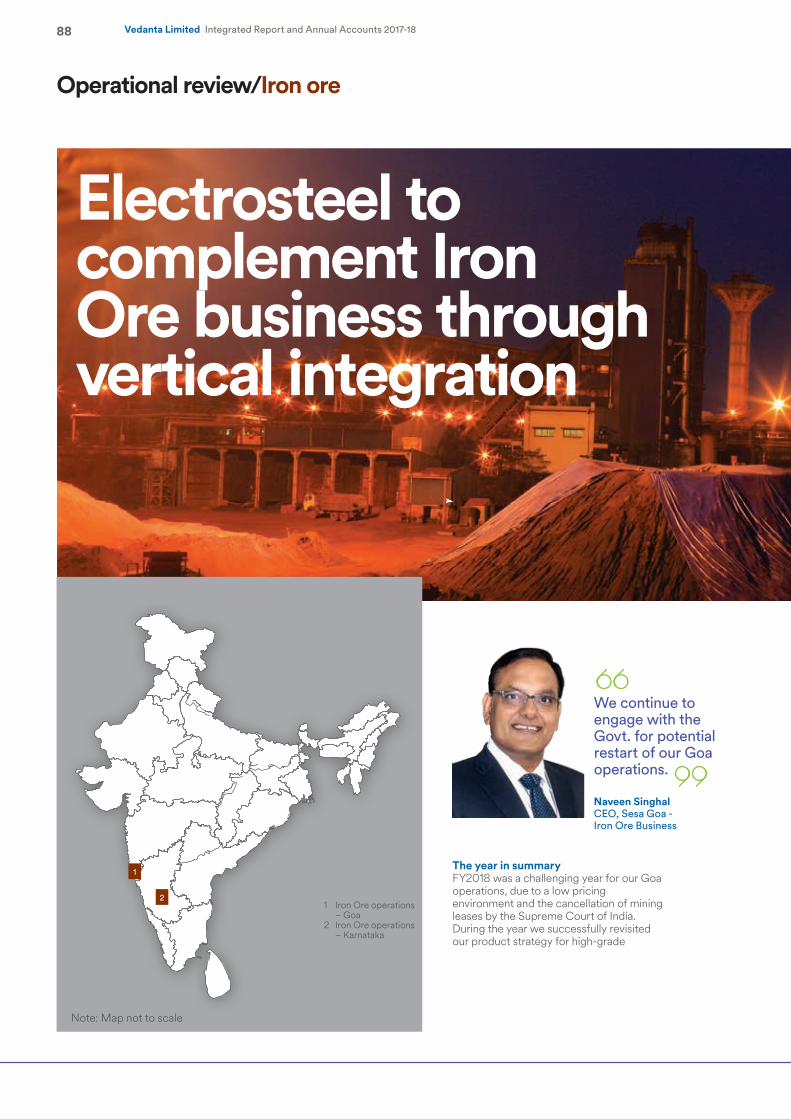
88 Vedanta Limited Integrated Report and Annual Accounts 2017-18
Operational review/Iron ore
The year in summaryFY2018 was a challenging year for our Goa operations, due to a low pricing environment and the cancellation of mining leases by the Supreme Court of India. During the year we successfully revisited our product strategy for high-grade
We continue to engage with the Govt. for potential restart of our Goa operations.
Naveen SinghalCEO, Sesa Goa - Iron Ore Business
Note: Map not to scale
Electrosteel to complement Iron Ore business through vertical integration
1 Iron Ore operations – Goa
2 Iron Ore operations – Karnataka
1
2
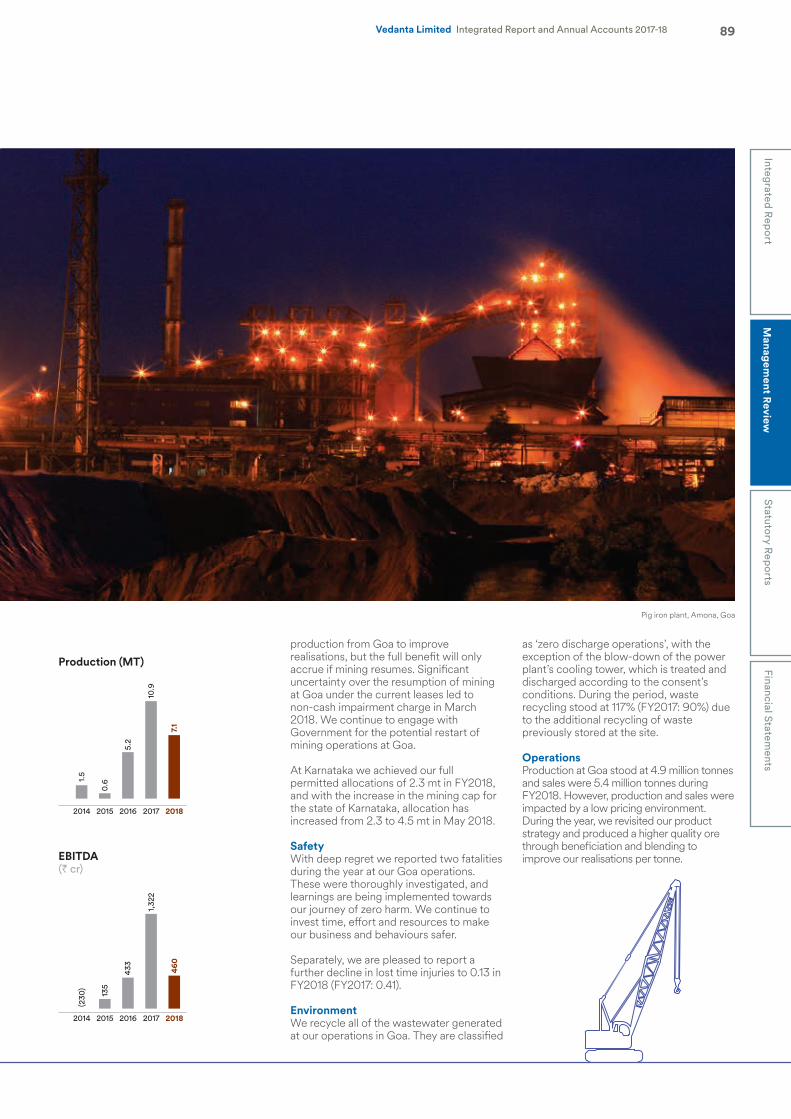
2014 2015 2016 2017 2018
1.5
0.6
5.2
10.
9
7.1
2014 2015 2016 2017 2018
(230
)
135
433
1,32
2
460
Pig iron plant, Amona, Goa
89Integrated R
eport
Managem
ent Review
Statutory Rep
ortsFinancial Statem
entsVedanta Limited Integrated Report and Annual Accounts 2017-18
production from Goa to improve realisations, but the full benefit will only accrue if mining resumes. Significant uncertainty over the resumption of mining at Goa under the current leases led to non-cash impairment charge in March 2018. We continue to engage with Government for the potential restart of mining operations at Goa.
At Karnataka we achieved our full permitted allocations of 2.3 mt in FY2018, and with the increase in the mining cap for the state of Karnataka, allocation has increased from 2.3 to 4.5 mt in May 2018.
SafetyWith deep regret we reported two fatalities during the year at our Goa operations. These were thoroughly investigated, and learnings are being implemented towards our journey of zero harm. We continue to invest time, effort and resources to make our business and behaviours safer.
Separately, we are pleased to report a further decline in lost time injuries to 0.13 in FY2018 (FY2017: 0.41).
EnvironmentWe recycle all of the wastewater generated at our operations in Goa. They are classified
as ‘zero discharge operations’, with the exception of the blow-down of the power plant’s cooling tower, which is treated and discharged according to the consent’s conditions. During the period, waste recycling stood at 117% (FY2017: 90%) due to the additional recycling of waste previously stored at the site.
OperationsProduction at Goa stood at 4.9 million tonnes and sales were 5.4 million tonnes during FY2018. However, production and sales were impacted by a low pricing environment. During the year, we revisited our product strategy and produced a higher quality ore through beneficiation and blending to improve our realisations per tonne.
Production (MT)
EBITDA(` cr)
90 Vedanta Limited Integrated Report and Annual Accounts 2017-18
Production performance
FY2018 FY2017 % Change
Production (dmt)Saleable ore 7.1 10.9 (35%)Goa 4.9 8.8 (44%)Karnataka 2.2 2.1 2%Pig iron (kt) 646 708 (9%)Sales (dmt)Iron ore 7.6 10.2 (26)%Goa 5.4 7.4 (26%)Karnataka 2.2 2.7 (21%)Pig iron (kt) 645 714 (10%)
Financial performance(` crore, unless stated)
FY2018 FY2017 % Change
Revenue 3,174 4,291 (26%)EBITDA 460 1,322 (65%)EBITDA margin 14% 31%
OutlookThe Company continues to explore all legal avenues to secure the reinstatement of mining operations in Goa.
At Karnataka, the production is expected to be 4.5 mt.
Strategic prioritiesOur focus and priorities will be to:• enhance environmental clearance limits in
Karnataka, and ramp up to full capacity;• bring about a resumption of mining
operations in Goa through continuous engagement with the Government and the judiciary; and
• increase our footprint in iron ore by continuing to participate in auctions across the country, including Jharkhand.
However, on 7 February, the Honourable Supreme Court of India issued a judgement directing that all mining operations in the state of Goa were to cease with effect from March 16, 2018. Pursuant to this order, we halted our mining activities. We have an inventory of 0.9 million tonnes, which will be sold in Q1 FY2019.
At Karnataka, we produced and sold 2.2 million tonnes during FY2018, in line with the allocated environmental clearance (EC) limits. The Honourable Supreme Court has increased the cap on production of iron ore for the state from 30 to 35 million tonnes, and accordingly increase in our allocation for Karnataka from 2.3 to 4.5 million tonnes in May 2018.
During the year, pig iron production was 9% lower y-o-y at 646,000 tonnes. This was due to lower metallurgical coke availability, caused by weather-related supply disruptions in Australia in Q1 FY2018 and a local contractors’ strike in Q2 FY2018.
PricesPrices for 62% Fe grade averaged US$68.43 per tonne on a CFR basis, which was flat compared to the previous year. The net realisation for our grades at Goa was 33% lower y-o-y, primarily driven by the widening of the discount.
Our Iron Ore business in Karnataka, which primarily caters to the domestic steel industry in the state, saw a 49% increase in net realisations where the prices are discovered through e-auctions.
Financial performanceIn FY2018, EBITDA decreased to `460 crore compared with `1,322 crore in FY2017. This was mainly due to lower volume and realisations at Goa, partly offset by higher realisations at Karnataka.
In light of the Supreme Court of India judgement above, the Company has taken an impairment (non-cash item) of `1,726 crore net of taxes (`2,329 crore gross of taxes).
Production from Karnataka is expected to be 4.5 mt in FY2019.
91M
anagement R
eviewVedanta Limited Integrated Report and Annual Accounts 2017-18
Integrated Rep
ortFinancial Statem
entsStatutory R
eports
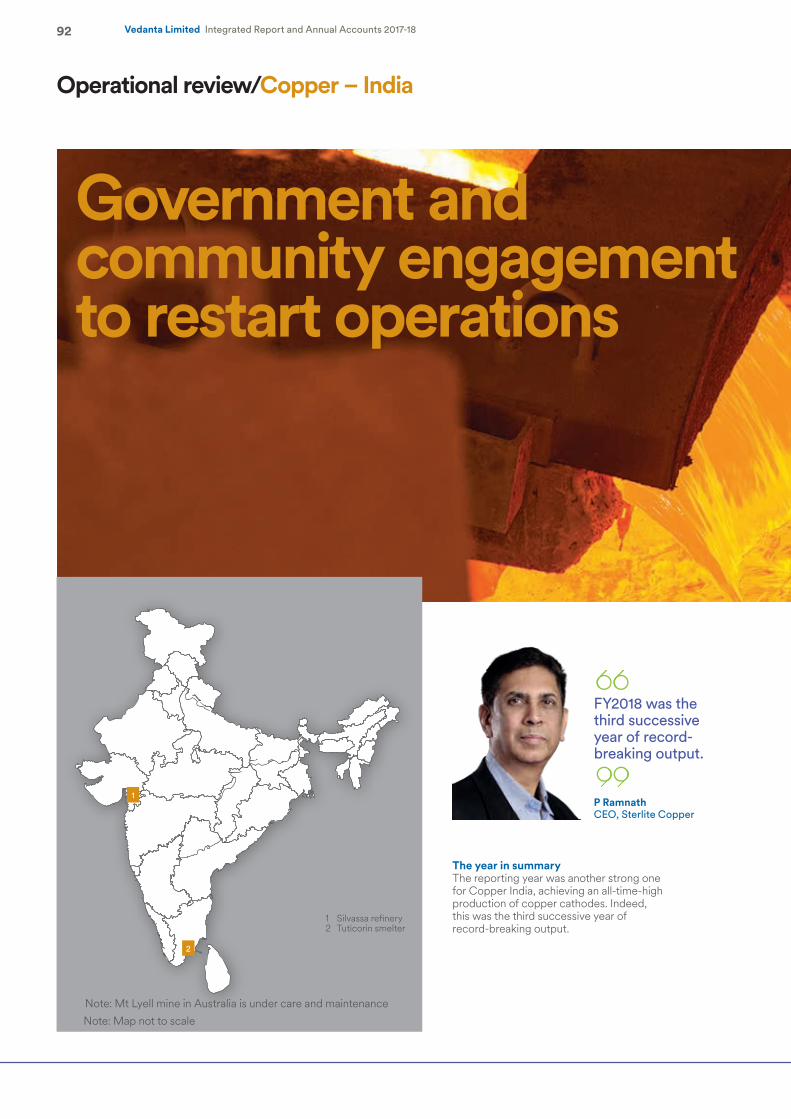
92 Vedanta Limited Integrated Report and Annual Accounts 2017-18
Operational review/Copper – India
The year in summaryThe reporting year was another strong one for Copper India, achieving an all-time-high production of copper cathodes. Indeed, this was the third successive year of record-breaking output.
FY2018 was the third successive year of record-breaking output.
P RamnathCEO, Sterlite Copper
1 Silvassa refinery2 Tuticorin smelter
Note: Mt Lyell mine in Australia is under care and maintenance Note: Map not to scale
Government and community engagement to restart operations
1
2
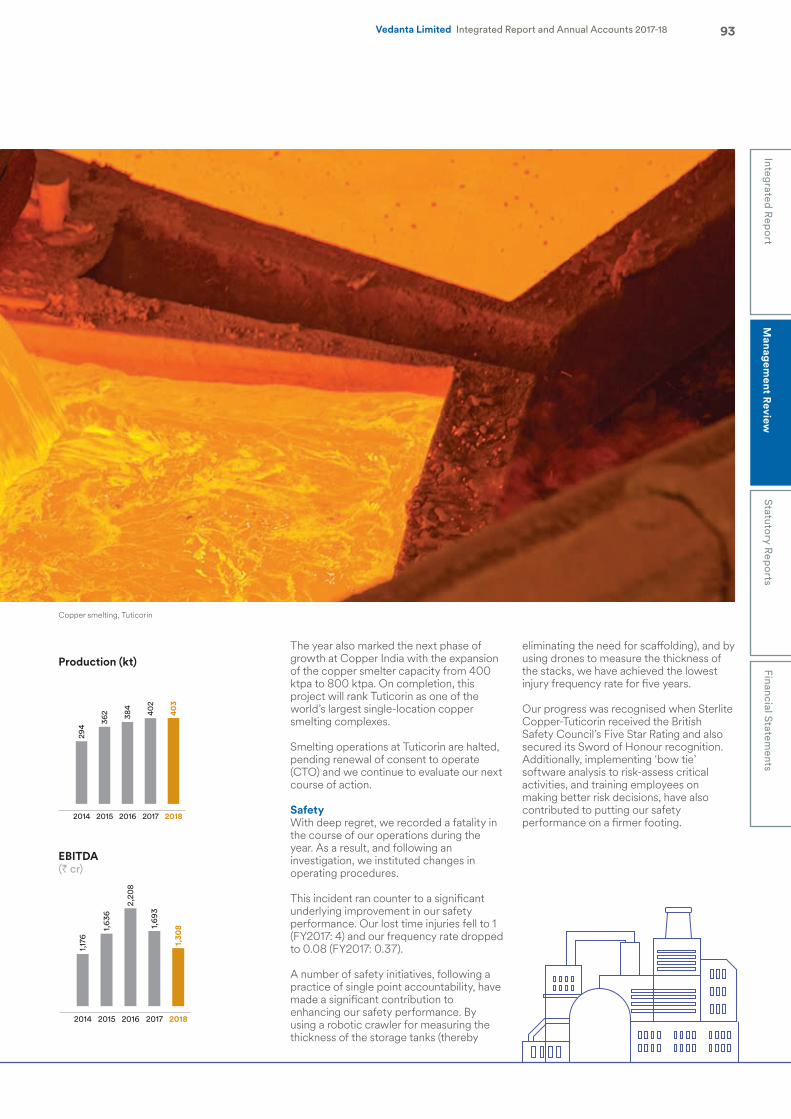
2014 2015 2016 2017 2018
294
362 3
84 40
2
403
2014 2015 2016 2017 2018
1,17
6
1,63
6
2,2
08
1,69
3
1,3
08
93Integrated R
eport
Managem
ent Review
Statutory Rep
ortsFinancial Statem
entsVedanta Limited Integrated Report and Annual Accounts 2017-18
The year also marked the next phase of growth at Copper India with the expansion of the copper smelter capacity from 400 ktpa to 800 ktpa. On completion, this project will rank Tuticorin as one of the world’s largest single-location copper smelting complexes.
Smelting operations at Tuticorin are halted, pending renewal of consent to operate (CTO) and we continue to evaluate our next course of action.
SafetyWith deep regret, we recorded a fatality in the course of our operations during the year. As a result, and following an investigation, we instituted changes in operating procedures.
This incident ran counter to a significant underlying improvement in our safety performance. Our lost time injuries fell to 1 (FY2017: 4) and our frequency rate dropped to 0.08 (FY2017: 0.37).
A number of safety initiatives, following a practice of single point accountability, have made a significant contribution to enhancing our safety performance. By using a robotic crawler for measuring the thickness of the storage tanks (thereby
eliminating the need for scaffolding), and by using drones to measure the thickness of the stacks, we have achieved the lowest injury frequency rate for five years.
Our progress was recognised when Sterlite Copper-Tuticorin received the British Safety Council’s Five Star Rating and also secured its Sword of Honour recognition. Additionally, implementing ‘bow tie’ software analysis to risk-assess critical activities, and training employees on making better risk decisions, have also contributed to putting our safety performance on a firmer footing.
Production (kt)
EBITDA(` cr)
Copper smelting, Tuticorin
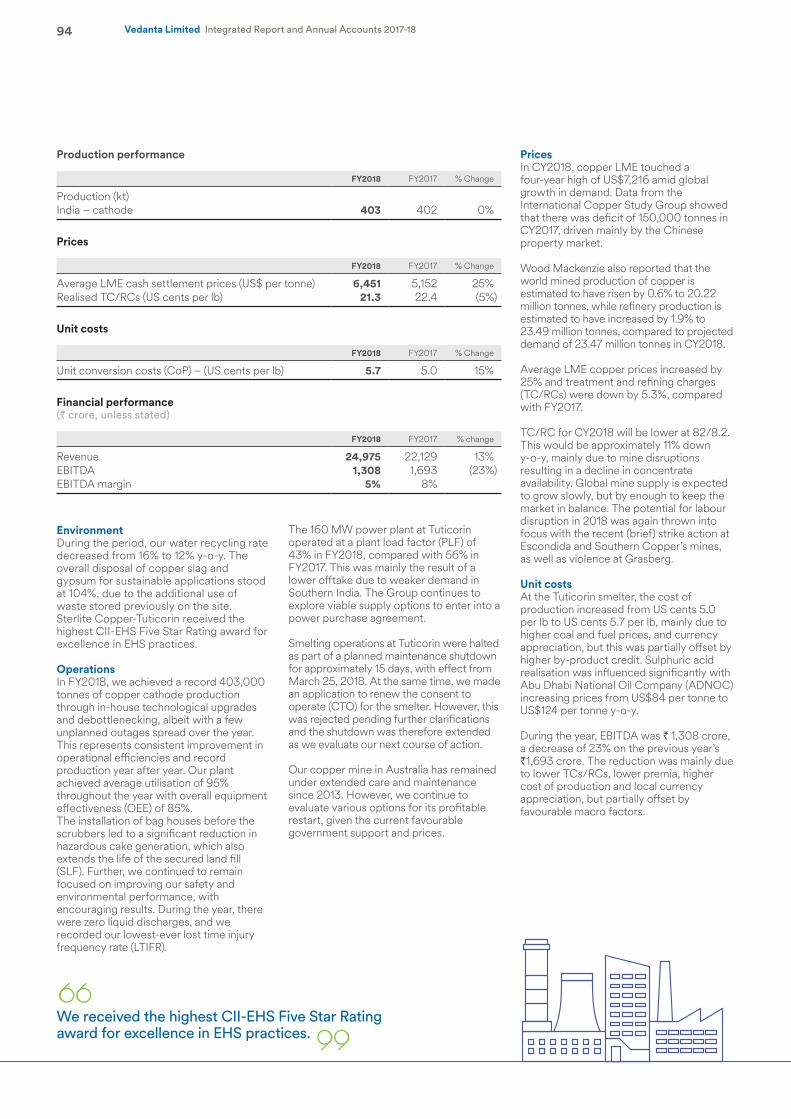
94 Vedanta Limited Integrated Report and Annual Accounts 2017-18
Production performance
FY2018 FY2017 % Change
Production (kt)India – cathode 403 402 0%
Prices
FY2018 FY2017 % Change
Average LME cash settlement prices (US$ per tonne) 6,451 5,152 25%Realised TC/RCs (US cents per lb) 21.3 22.4 (5%)
Unit costs
FY2018 FY2017 % Change
Unit conversion costs (CoP) – (US cents per lb) 5.7 5.0 15%
Financial performance(` crore, unless stated)
FY2018 FY2017 % change
Revenue 24,975 22,129 13%EBITDA 1,308 1,693 (23%)EBITDA margin 5% 8%
PricesIn CY2018, copper LME touched a four-year high of US$7,216 amid global growth in demand. Data from the International Copper Study Group showed that there was deficit of 150,000 tonnes in CY2017, driven mainly by the Chinese property market.
Wood Mackenzie also reported that the world mined production of copper is estimated to have risen by 0.6% to 20.22 million tonnes, while refinery production is estimated to have increased by 1.9% to 23.49 million tonnes, compared to projected demand of 23.47 million tonnes in CY2018.
Average LME copper prices increased by 25% and treatment and refining charges (TC/RCs) were down by 5.3%, compared with FY2017.
TC/RC for CY2018 will be lower at 82/8.2. This would be approximately 11% down y-o-y, mainly due to mine disruptions resulting in a decline in concentrate availability. Global mine supply is expected to grow slowly, but by enough to keep the market in balance. The potential for labour disruption in 2018 was again thrown into focus with the recent (brief) strike action at Escondida and Southern Copper’s mines, as well as violence at Grasberg.
Unit costsAt the Tuticorin smelter, the cost of production increased from US cents 5.0 per lb to US cents 5.7 per lb, mainly due to higher coal and fuel prices, and currency appreciation, but this was partially offset by higher by-product credit. Sulphuric acid realisation was influenced significantly with Abu Dhabi National Oil Company (ADNOC) increasing prices from US$84 per tonne to US$124 per tonne y-o-y.
During the year, EBITDA was ` 1,308 crore, a decrease of 23% on the previous year’s `1,693 crore. The reduction was mainly due to lower TCs/RCs, lower premia, higher cost of production and local currency appreciation, but partially offset by favourable macro factors.
EnvironmentDuring the period, our water recycling rate decreased from 16% to 12% y-o-y. The overall disposal of copper slag and gypsum for sustainable applications stood at 104%, due to the additional use of waste stored previously on the site. Sterlite Copper-Tuticorin received the highest CII-EHS Five Star Rating award for excellence in EHS practices.
OperationsIn FY2018, we achieved a record 403,000 tonnes of copper cathode production through in-house technological upgrades and debottlenecking, albeit with a few unplanned outages spread over the year. This represents consistent improvement in operational efficiencies and record production year after year. Our plant achieved average utilisation of 95% throughout the year with overall equipment effectiveness (OEE) of 85%. The installation of bag houses before the scrubbers led to a significant reduction in hazardous cake generation, which also extends the life of the secured land fill (SLF). Further, we continued to remain focused on improving our safety and environmental performance, with encouraging results. During the year, there were zero liquid discharges, and we recorded our lowest-ever lost time injury frequency rate (LTIFR).
The 160 MW power plant at Tuticorin operated at a plant load factor (PLF) of 43% in FY2018, compared with 56% in FY2017. This was mainly the result of a lower offtake due to weaker demand in Southern India. The Group continues to explore viable supply options to enter into a power purchase agreement.
Smelting operations at Tuticorin were halted as part of a planned maintenance shutdown for approximately 15 days, with effect from March 25, 2018. At the same time, we made an application to renew the consent to operate (CTO) for the smelter. However, this was rejected pending further clarifications and the shutdown was therefore extended as we evaluate our next course of action.
Our copper mine in Australia has remained under extended care and maintenance since 2013. However, we continue to evaluate various options for its profitable restart, given the current favourable government support and prices.
We received the highest CII-EHS Five Star Rating award for excellence in EHS practices.
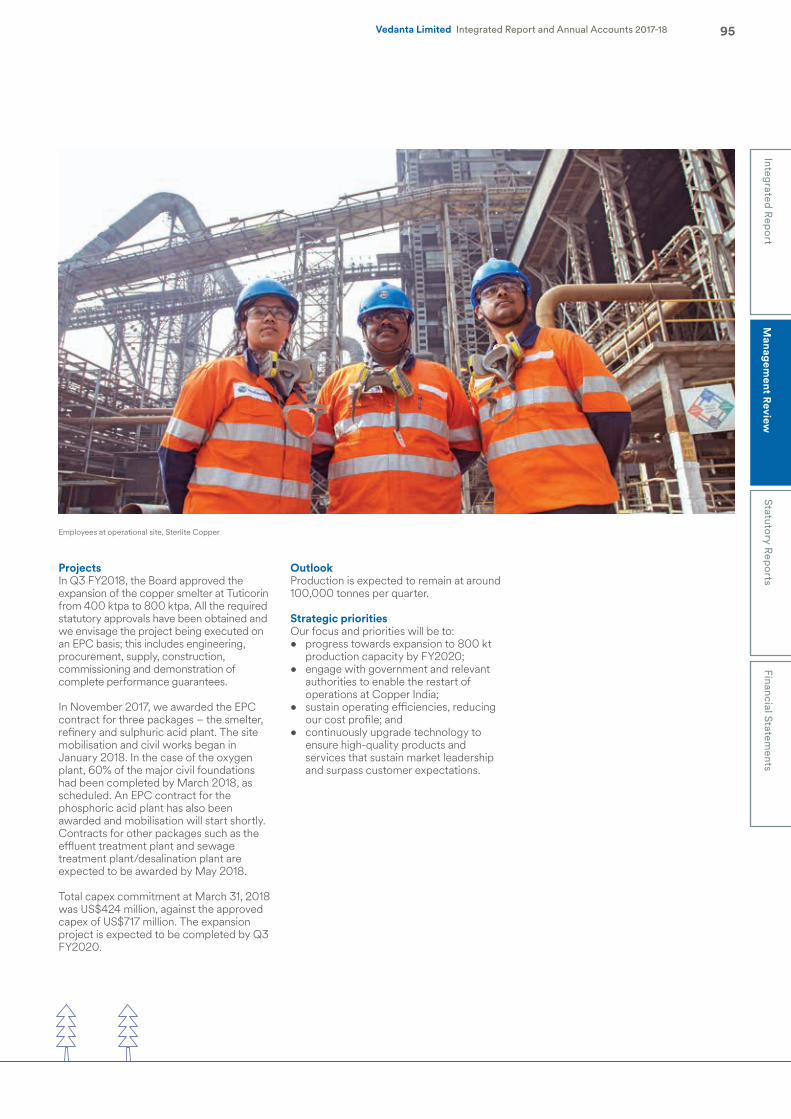
Employees at operational site, Sterlite Copper
95Integrated R
eport
Managem
ent Review
Statutory Rep
ortsFinancial Statem
entsVedanta Limited Integrated Report and Annual Accounts 2017-18
ProjectsIn Q3 FY2018, the Board approved the expansion of the copper smelter at Tuticorin from 400 ktpa to 800 ktpa. All the required statutory approvals have been obtained and we envisage the project being executed on an EPC basis; this includes engineering, procurement, supply, construction, commissioning and demonstration of complete performance guarantees.
In November 2017, we awarded the EPC contract for three packages – the smelter, refinery and sulphuric acid plant. The site mobilisation and civil works began in January 2018. In the case of the oxygen plant, 60% of the major civil foundations had been completed by March 2018, as scheduled. An EPC contract for the phosphoric acid plant has also been awarded and mobilisation will start shortly. Contracts for other packages such as the effluent treatment plant and sewage treatment plant/desalination plant are expected to be awarded by May 2018.
Total capex commitment at March 31, 2018 was US$424 million, against the approved capex of US$717 million. The expansion project is expected to be completed by Q3 FY2020.
OutlookProduction is expected to remain at around 100,000 tonnes per quarter.
Strategic prioritiesOur focus and priorities will be to:• progress towards expansion to 800 kt
production capacity by FY2020;• engage with government and relevant
authorities to enable the restart of operations at Copper India;
• sustain operating efficiencies, reducing our cost profile; and
• continuously upgrade technology to ensure high-quality products and services that sustain market leadership and surpass customer expectations.
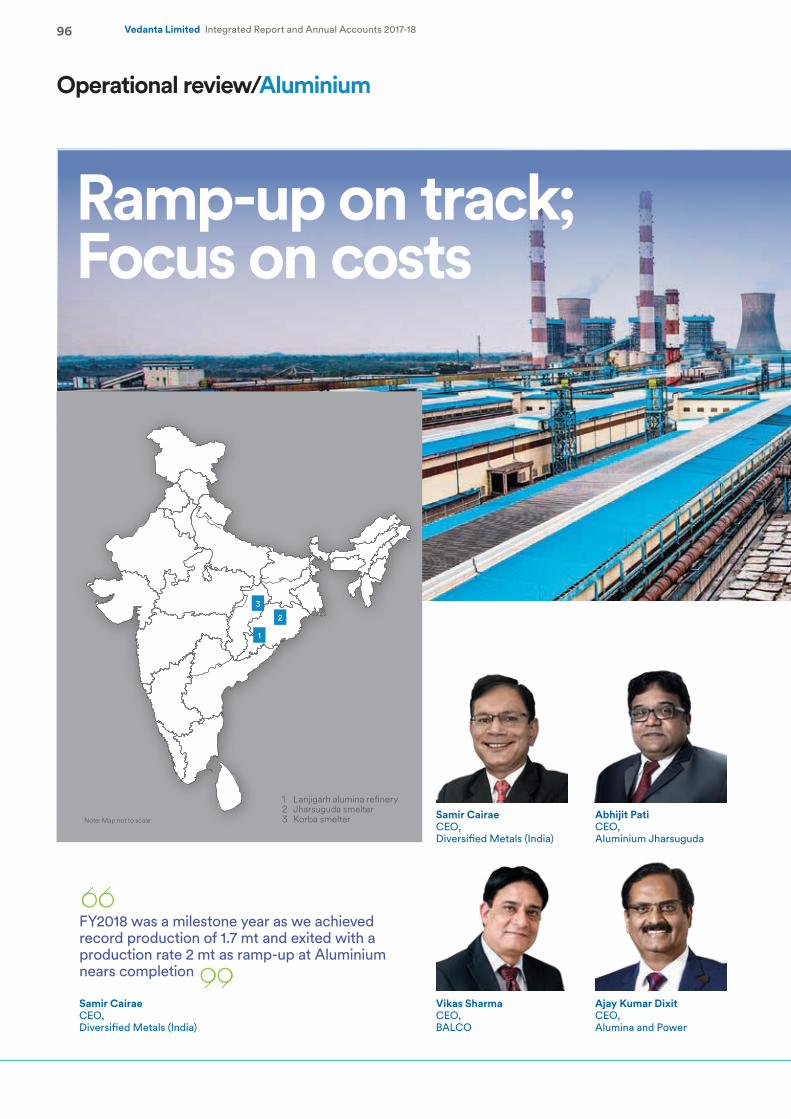
Abhijit PatiCEO, Aluminium Jharsuguda
Vikas SharmaCEO, BALCO
Ajay Kumar Dixit CEO, Alumina and Power
FY2018 was a milestone year as we achieved record production of 1.7 mt and exited with a production rate 2 mt as ramp-up at Aluminium nears completion
Samir Cairae CEO, Diversified Metals (India)
96 Vedanta Limited Integrated Report and Annual Accounts 2017-18
Operational review/Aluminium
Ramp-up on track; Focus on costs
1 Lanjigarh alumina refinery2 Jharsuguda smelter3 Korba smelter Samir Cairae
CEO, Diversified Metals (India)
Note: Map not to scale
1
2
3
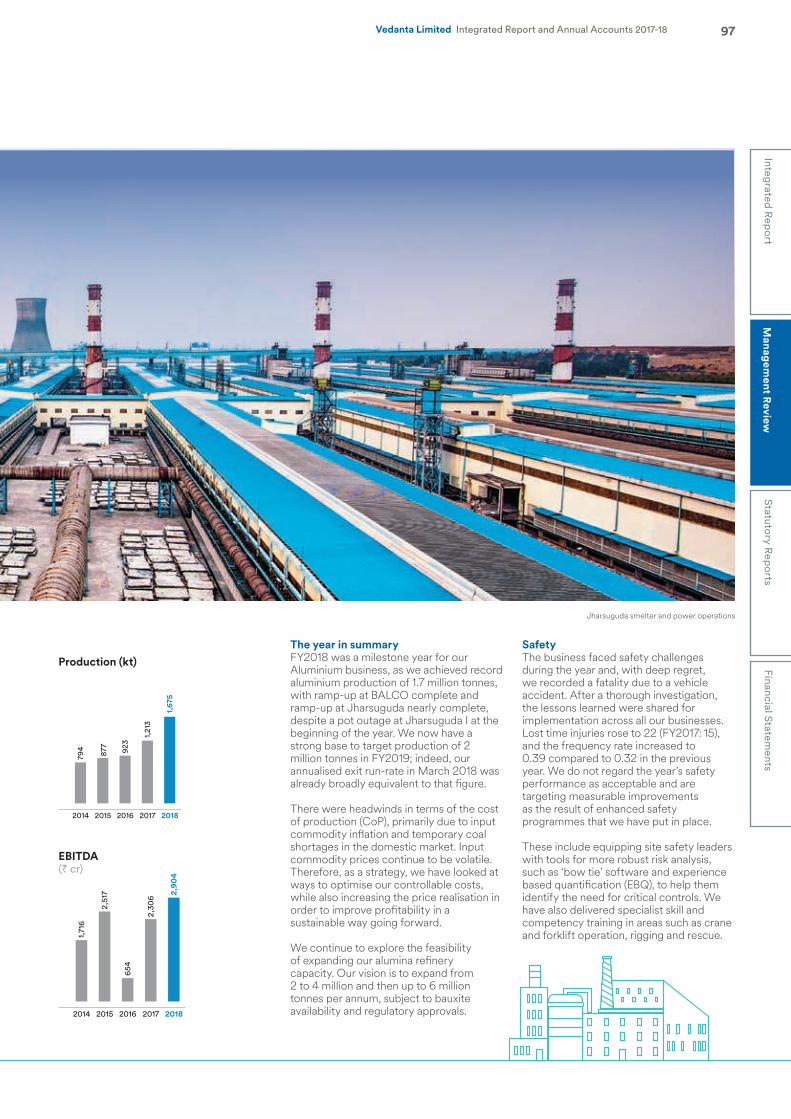
Jharsuguda smelter and power operations
2014 2015 2016 2017 2018
794 8
77 923
1,21
3
1,6
75
2014 2015 2016 2017 2018
1,71
6
2,5
17
654
2,3
06 2
,904
97Integrated R
eport
Managem
ent Review
Statutory Rep
ortsFinancial Statem
entsVedanta Limited Integrated Report and Annual Accounts 2017-18
The year in summaryFY2018 was a milestone year for our Aluminium business, as we achieved record aluminium production of 1.7 million tonnes, with ramp-up at BALCO complete and ramp-up at Jharsuguda nearly complete, despite a pot outage at Jharsuguda I at the beginning of the year. We now have a strong base to target production of 2 million tonnes in FY2019; indeed, our annualised exit run-rate in March 2018 was already broadly equivalent to that figure.
There were headwinds in terms of the cost of production (CoP), primarily due to input commodity inflation and temporary coal shortages in the domestic market. Input commodity prices continue to be volatile. Therefore, as a strategy, we have looked at ways to optimise our controllable costs, while also increasing the price realisation in order to improve profitability in a sustainable way going forward.
We continue to explore the feasibility of expanding our alumina refinery capacity. Our vision is to expand from 2 to 4 million and then up to 6 million tonnes per annum, subject to bauxite availability and regulatory approvals.
SafetyThe business faced safety challenges during the year and, with deep regret, we recorded a fatality due to a vehicle accident. After a thorough investigation, the lessons learned were shared for implementation across all our businesses. Lost time injuries rose to 22 (FY2017: 15), and the frequency rate increased to 0.39 compared to 0.32 in the previous year. We do not regard the year’s safety performance as acceptable and are targeting measurable improvements as the result of enhanced safety programmes that we have put in place.
These include equipping site safety leaders with tools for more robust risk analysis, such as ‘bow tie’ software and experience based quantification (EBQ), to help them identify the need for critical controls. We have also delivered specialist skill and competency training in areas such as crane and forklift operation, rigging and rescue.
Production (kt)
EBITDA(` cr)
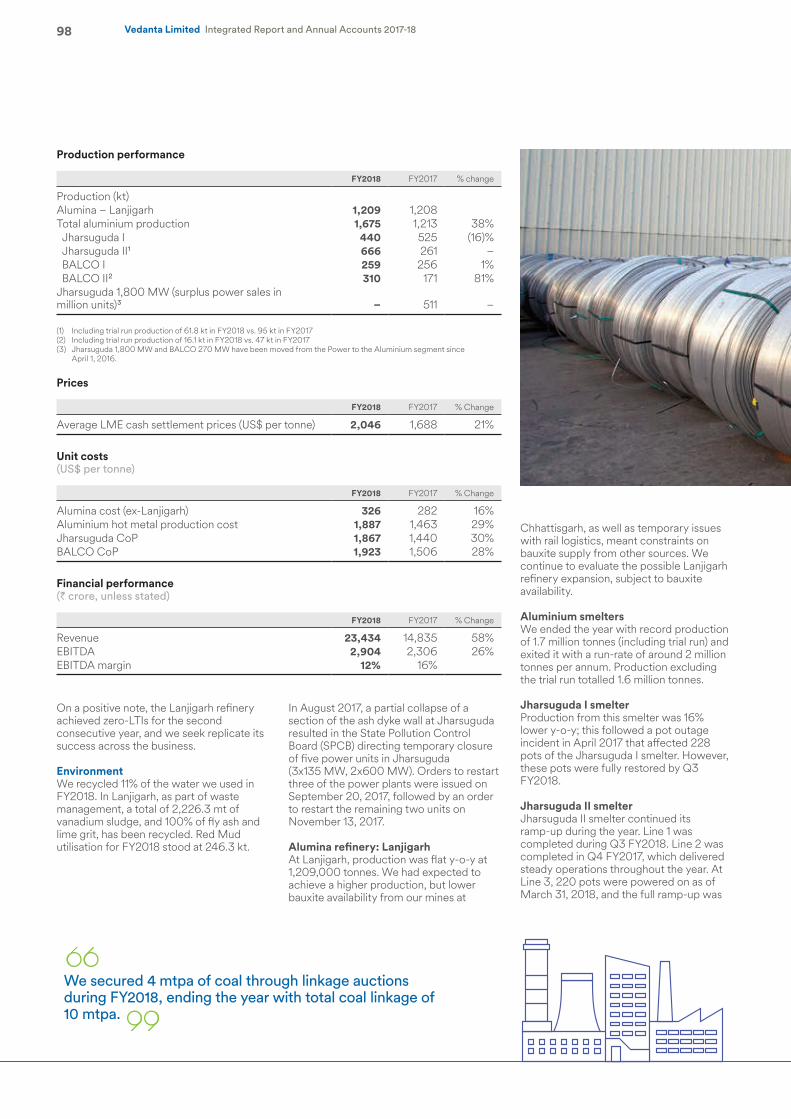
98 Vedanta Limited Integrated Report and Annual Accounts 2017-18
Production performance
FY2018 FY2017 % change
Production (kt)Alumina – Lanjigarh 1,209 1,208 Total aluminium production 1,675 1,213 38% Jharsuguda I 440 525 (16)% Jharsuguda II1 666 261 – BALCO I 259 256 1% BALCO II2 310 171 81%Jharsuguda 1,800 MW (surplus power sales in million units)3 – 511 –
(1) Including trial run production of 61.8 kt in FY2018 vs. 95 kt in FY2017(2) Including trial run production of 16.1 kt in FY2018 vs. 47 kt in FY2017(3) Jharsuguda 1,800 MW and BALCO 270 MW have been moved from the Power to the Aluminium segment since
April 1, 2016.
Prices
FY2018 FY2017 % Change
Average LME cash settlement prices (US$ per tonne) 2,046 1,688 21%
Unit costs(US$ per tonne)
FY2018 FY2017 % Change
Alumina cost (ex-Lanjigarh) 326 282 16%Aluminium hot metal production cost 1,887 1,463 29%Jharsuguda CoP 1,867 1,440 30%BALCO CoP 1,923 1,506 28%
Financial performance(` crore, unless stated)
FY2018 FY2017 % Change
Revenue 23,434 14,835 58%EBITDA 2,904 2,306 26%EBITDA margin 12% 16%
Chhattisgarh, as well as temporary issues with rail logistics, meant constraints on bauxite supply from other sources. We continue to evaluate the possible Lanjigarh refinery expansion, subject to bauxite availability.
Aluminium smeltersWe ended the year with record production of 1.7 million tonnes (including trial run) and exited it with a run-rate of around 2 million tonnes per annum. Production excluding the trial run totalled 1.6 million tonnes.
Jharsuguda I smelterProduction from this smelter was 16% lower y-o-y; this followed a pot outage incident in April 2017 that affected 228 pots of the Jharsuguda I smelter. However, these pots were fully restored by Q3 FY2018.
Jharsuguda II smelterJharsuguda II smelter continued its ramp-up during the year. Line 1 was completed during Q3 FY2018. Line 2 was completed in Q4 FY2017, which delivered steady operations throughout the year. At Line 3, 220 pots were powered on as of March 31, 2018, and the full ramp-up was
On a positive note, the Lanjigarh refinery achieved zero-LTIs for the second consecutive year, and we seek replicate its success across the business.
EnvironmentWe recycled 11% of the water we used in FY2018. In Lanjigarh, as part of waste management, a total of 2,226.3 mt of vanadium sludge, and 100% of fly ash and lime grit, has been recycled. Red Mud utilisation for FY2018 stood at 246.3 kt.
In August 2017, a partial collapse of a section of the ash dyke wall at Jharsuguda resulted in the State Pollution Control Board (SPCB) directing temporary closure of five power units in Jharsuguda (3x135 MW, 2x600 MW). Orders to restart three of the power plants were issued on September 20, 2017, followed by an order to restart the remaining two units on November 13, 2017.
Alumina refinery: LanjigarhAt Lanjigarh, production was flat y-o-y at 1,209,000 tonnes. We had expected to achieve a higher production, but lower bauxite availability from our mines at
We secured 4 mtpa of coal through linkage auctions during FY2018, ending the year with total coal linkage of 10 mtpa.
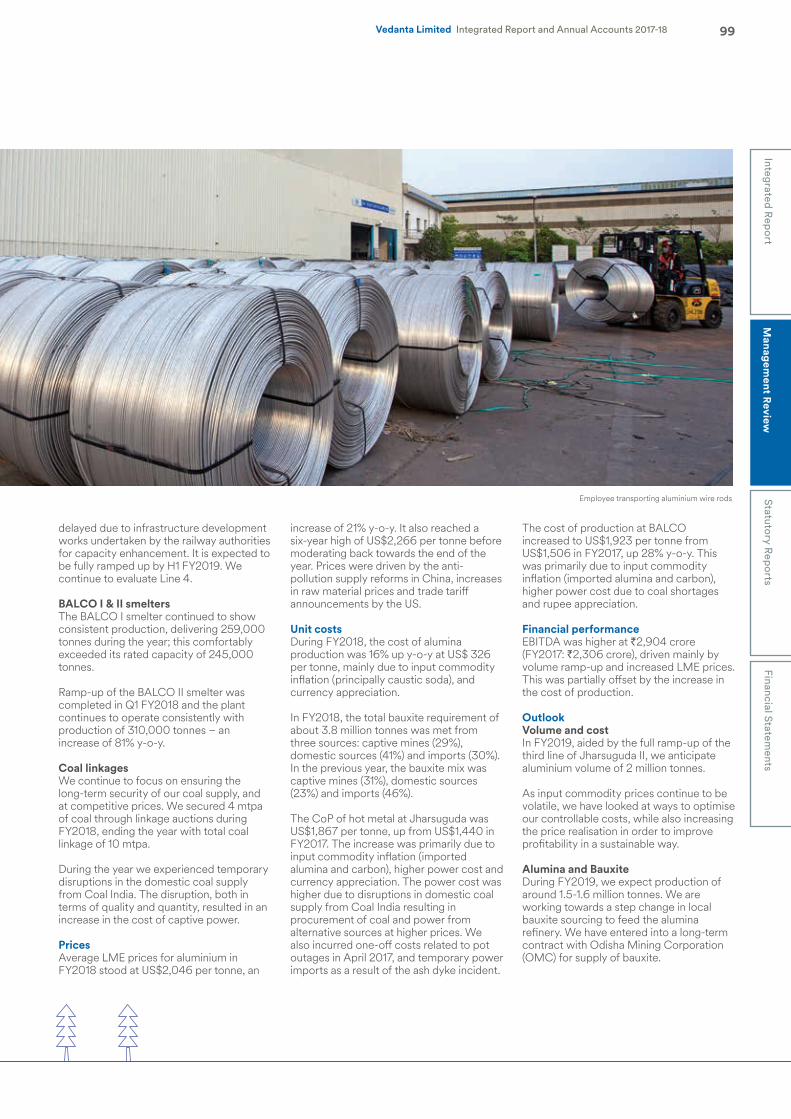
Employee transporting aluminium wire rods
99Integrated R
eport
Managem
ent Review
Statutory Rep
ortsFinancial Statem
entsVedanta Limited Integrated Report and Annual Accounts 2017-18
delayed due to infrastructure development works undertaken by the railway authorities for capacity enhancement. It is expected to be fully ramped up by H1 FY2019. We continue to evaluate Line 4.
BALCO I & II smeltersThe BALCO I smelter continued to show consistent production, delivering 259,000 tonnes during the year; this comfortably exceeded its rated capacity of 245,000 tonnes.
Ramp-up of the BALCO II smelter was completed in Q1 FY2018 and the plant continues to operate consistently with production of 310,000 tonnes – an increase of 81% y-o-y.
Coal linkagesWe continue to focus on ensuring the long-term security of our coal supply, and at competitive prices. We secured 4 mtpa of coal through linkage auctions during FY2018, ending the year with total coal linkage of 10 mtpa.
During the year we experienced temporary disruptions in the domestic coal supply from Coal India. The disruption, both in terms of quality and quantity, resulted in an increase in the cost of captive power.
PricesAverage LME prices for aluminium in FY2018 stood at US$2,046 per tonne, an
increase of 21% y-o-y. It also reached a six-year high of US$2,266 per tonne before moderating back towards the end of the year. Prices were driven by the anti-pollution supply reforms in China, increases in raw material prices and trade tariff announcements by the US.
Unit costsDuring FY2018, the cost of alumina production was 16% up y-o-y at US$ 326 per tonne, mainly due to input commodity inflation (principally caustic soda), and currency appreciation.
In FY2018, the total bauxite requirement of about 3.8 million tonnes was met from three sources: captive mines (29%), domestic sources (41%) and imports (30%). In the previous year, the bauxite mix was captive mines (31%), domestic sources (23%) and imports (46%).
The CoP of hot metal at Jharsuguda was US$1,867 per tonne, up from US$1,440 in FY2017. The increase was primarily due to input commodity inflation (imported alumina and carbon), higher power cost and currency appreciation. The power cost was higher due to disruptions in domestic coal supply from Coal India resulting in procurement of coal and power from alternative sources at higher prices. We also incurred one-off costs related to pot outages in April 2017, and temporary power imports as a result of the ash dyke incident.
The cost of production at BALCO increased to US$1,923 per tonne from US$1,506 in FY2017, up 28% y-o-y. This was primarily due to input commodity inflation (imported alumina and carbon), higher power cost due to coal shortages and rupee appreciation.
Financial performanceEBITDA was higher at `2,904 crore (FY2017: `2,306 crore), driven mainly by volume ramp-up and increased LME prices. This was partially offset by the increase in the cost of production.
OutlookVolume and costIn FY2019, aided by the full ramp-up of the third line of Jharsuguda II, we anticipate aluminium volume of 2 million tonnes.
As input commodity prices continue to be volatile, we have looked at ways to optimise our controllable costs, while also increasing the price realisation in order to improve profitability in a sustainable way.
Alumina and Bauxite During FY2019, we expect production of around 1.5-1.6 million tonnes. We are working towards a step change in local bauxite sourcing to feed the alumina refinery. We have entered into a long-term contract with Odisha Mining Corporation (OMC) for supply of bauxite.
100 Vedanta Limited Integrated Report and Annual Accounts 2017-18
Power In FY2019, we aim to improve the realisations from the 10 mtpa of coal linkages already in place, and increase linkages further. We are also hopeful that the disruption in coal supply experienced in FY2018 will not continue into the next reporting year.
We are also working towards reduction in GCV losses as well as improvement in plant operating parameters which should deliver higher PLFs and reduction in non-coal costs.
Marketing We are targeting an increase in value-added production in FY2019 to 1.0 million tonnes. We will also be focusing on increasing the domestic and OEM sales further.
Cost of productionWe expect a reduction in COP by c.US$120-170/t in FY2019 by optimising controllable costs and through elimination of one-offs. This will imply a COP of US$1,725-1,775/t, assuming costs of imported alumina, coal e-auctions and carbon at average FY2018 levels. We are targeting a medium-term COP target of US$1,500/t with continued focus on sourcing of low cost bauxite, alternate sourcing of alumina, improved plant operating parameters, an increase in linkage coal mix and strategic partnerships with carbon suppliers.
Strategic prioritiesOur focus and priorities will be to:• achieve steady state production of 2 mt
in FY2019;• reduce controllable costs in the
aluminium business; • firm up bauxite sourcing and the
supply chain, and diversify imported alumina sourcing;
• improve coal linkage realisation (10 mtpa) and further increase coal linkage;
• improve power plant operating parameters and reduction in non-coal cost; and
• improve realisations through gaining a higher domestic market share, and by increasing our value-added product (VAP).
We expect a reduction in COP by c. US$120-170/t in FY2019 by optimising controllable costs and through elimination of one-offs.
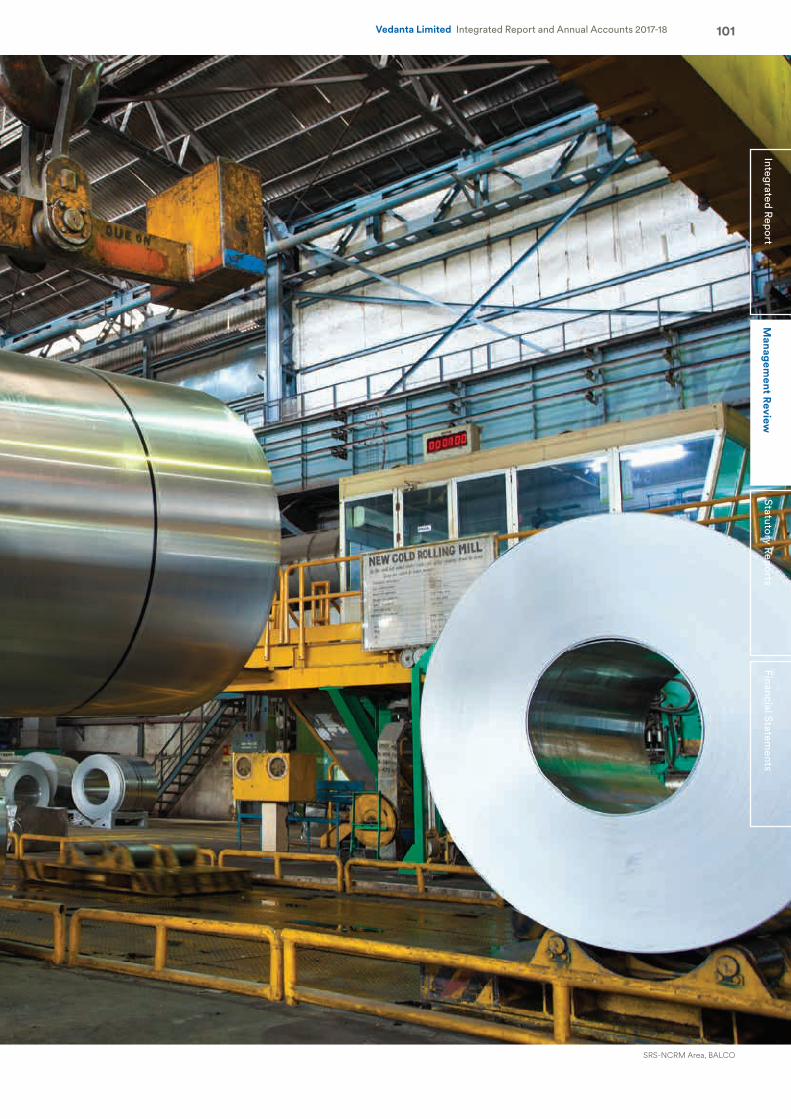
SRS-NCRM Area, BALCO
101Vedanta Limited Integrated Report and Annual Accounts 2017-18Financial Statem
entsStatutory R
eports
Managem
ent Review
Integrated Rep
ort
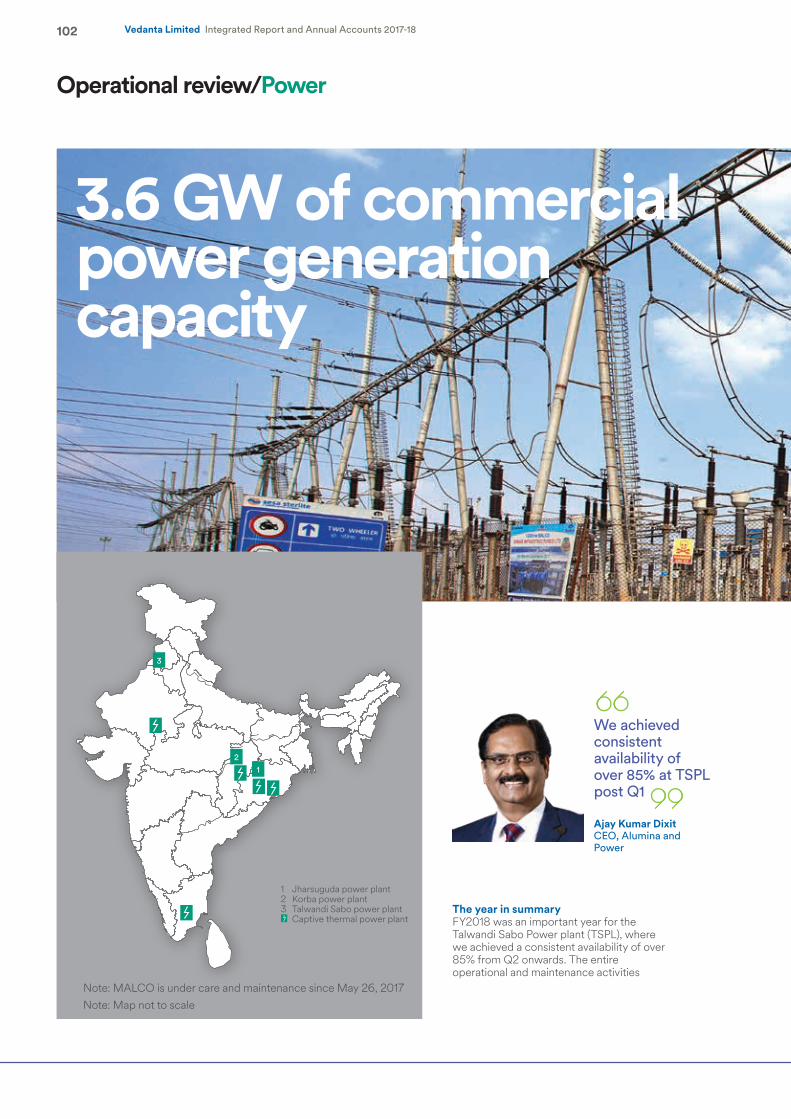
12
3
102 Vedanta Limited Integrated Report and Annual Accounts 2017-18
Operational review/Power
3.6 GW of commercial power generation capacity
The year in summaryFY2018 was an important year for the Talwandi Sabo Power plant (TSPL), where we achieved a consistent availability of over 85% from Q2 onwards. The entire operational and maintenance activities
We achieved consistent availability of over 85% at TSPL post Q1
Ajay Kumar DixitCEO, Alumina and Power
1 Jharsuguda power plant2 Korba power plant3 Talwandi Sabo power plant Captive thermal power plant
Note: MALCO is under care and maintenance since May 26, 2017 Note: Map not to scale
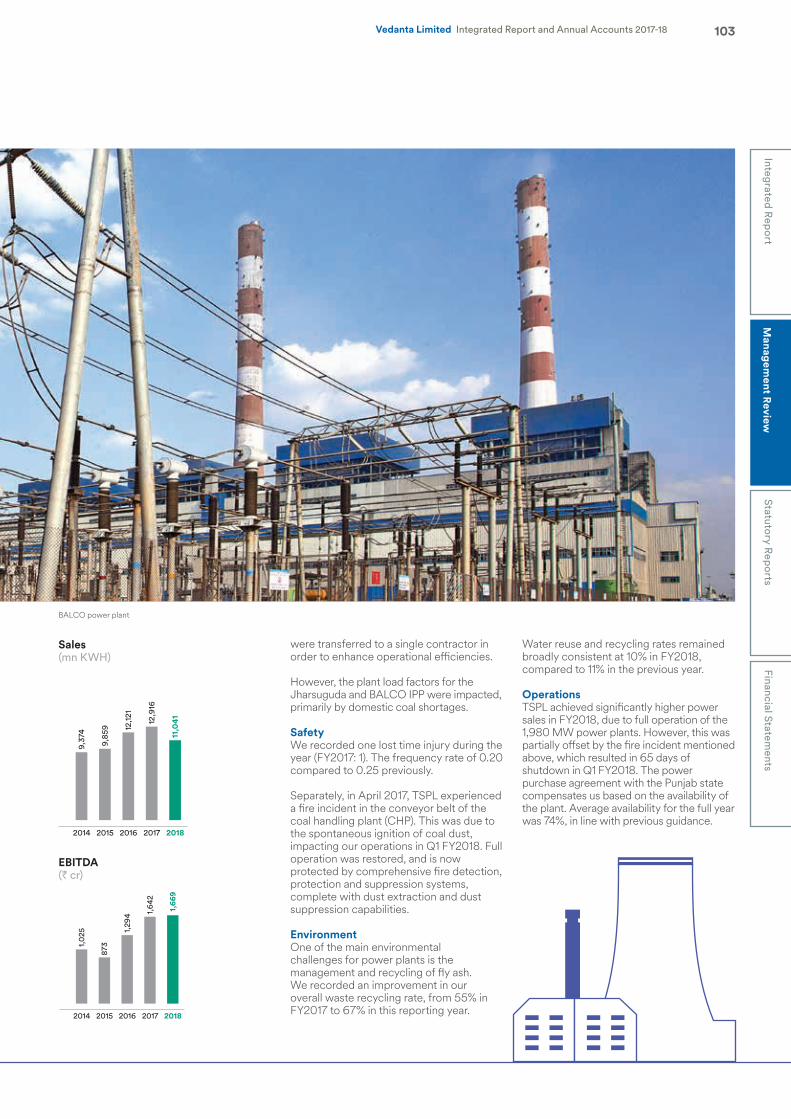
2014 2015 2016 2017 2018
9,3
74
9,8
59 12,
121
12,
916
11,
041
2014 2015 2016 2017 2018
1,0
25
873
1,29
4 1,64
2
1,6
69
103Integrated R
eport
Managem
ent Review
Statutory Rep
ortsFinancial Statem
entsVedanta Limited Integrated Report and Annual Accounts 2017-18
were transferred to a single contractor in order to enhance operational efficiencies.
However, the plant load factors for the Jharsuguda and BALCO IPP were impacted, primarily by domestic coal shortages.
Safety We recorded one lost time injury during the year (FY2017: 1). The frequency rate of 0.20 compared to 0.25 previously.
Separately, in April 2017, TSPL experienced a fire incident in the conveyor belt of the coal handling plant (CHP). This was due to the spontaneous ignition of coal dust, impacting our operations in Q1 FY2018. Full operation was restored, and is now protected by comprehensive fire detection, protection and suppression systems, complete with dust extraction and dust suppression capabilities.
EnvironmentOne of the main environmental challenges for power plants is the management and recycling of fly ash. We recorded an improvement in our overall waste recycling rate, from 55% in FY2017 to 67% in this reporting year.
Water reuse and recycling rates remained broadly consistent at 10% in FY2018, compared to 11% in the previous year.
OperationsTSPL achieved significantly higher power sales in FY2018, due to full operation of the 1,980 MW power plants. However, this was partially offset by the fire incident mentioned above, which resulted in 65 days of shutdown in Q1 FY2018. The power purchase agreement with the Punjab state compensates us based on the availability of the plant. Average availability for the full year was 74%, in line with previous guidance.
Sales(mn KWH)
EBITDA(` cr)
BALCO power plant
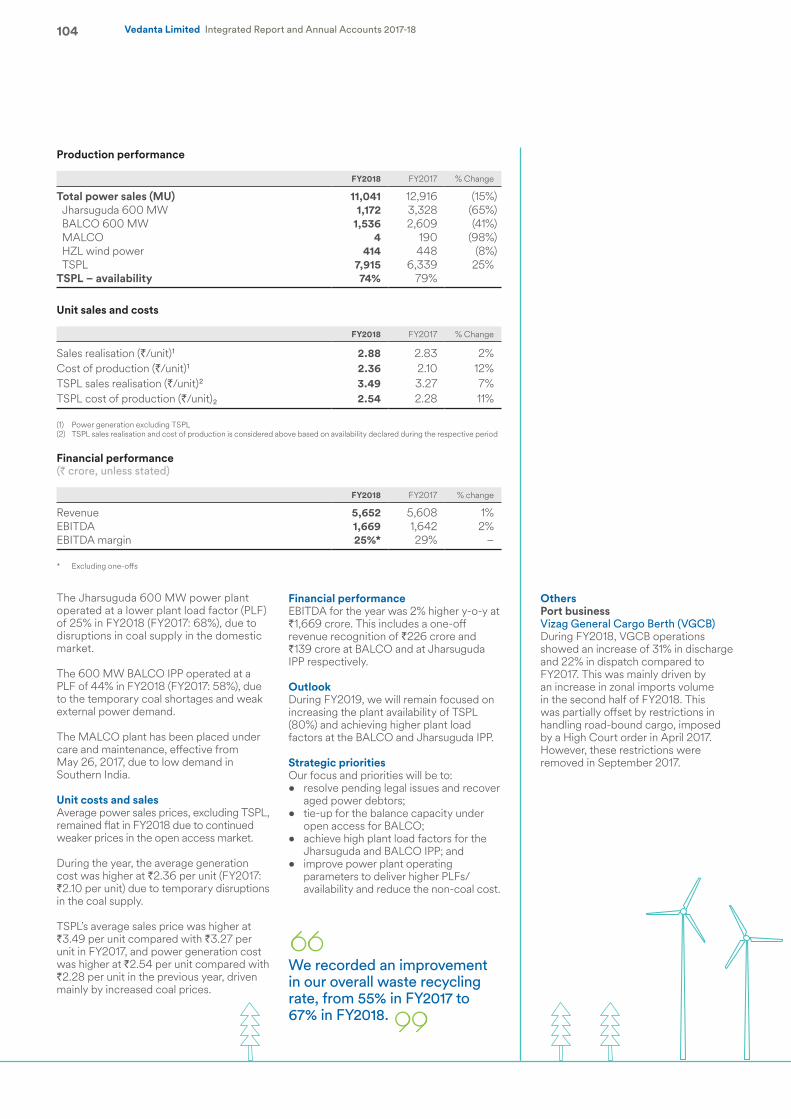
OthersPort businessVizag General Cargo Berth (VGCB)During FY2018, VGCB operations showed an increase of 31% in discharge and 22% in dispatch compared to FY2017. This was mainly driven by an increase in zonal imports volume in the second half of FY2018. This was partially offset by restrictions in handling road-bound cargo, imposed by a High Court order in April 2017. However, these restrictions were removed in September 2017.
104 Vedanta Limited Integrated Report and Annual Accounts 2017-18
Production performance
FY2018 FY2017 % Change
Total power sales (MU) 11,041 12,916 (15%) Jharsuguda 600 MW 1,172 3,328 (65%) BALCO 600 MW 1,536 2,609 (41%) MALCO 4 190 (98%) HZL wind power 414 448 (8%) TSPL 7,915 6,339 25%TSPL – availability 74% 79%
Unit sales and costs
FY2018 FY2017 % Change
Sales realisation (`/unit)1 2.88 2.83 2%Cost of production (`/unit)1 2.36 2.10 12%TSPL sales realisation (`/unit)2 3.49 3.27 7%TSPL cost of production (`/unit)2 2.54 2.28 11%
(1) Power generation excluding TSPL(2) TSPL sales realisation and cost of production is considered above based on availability declared during the respective period
Financial performance(` crore, unless stated)
FY2018 FY2017 % change
Revenue 5,652 5,608 1%EBITDA 1,669 1,642 2%EBITDA margin 25%* 29% –
* Excluding one-offs
The Jharsuguda 600 MW power plant operated at a lower plant load factor (PLF) of 25% in FY2018 (FY2017: 68%), due to disruptions in coal supply in the domestic market.
The 600 MW BALCO IPP operated at a PLF of 44% in FY2018 (FY2017: 58%), due to the temporary coal shortages and weak external power demand.
The MALCO plant has been placed under care and maintenance, effective from May 26, 2017, due to low demand in Southern India.
Unit costs and salesAverage power sales prices, excluding TSPL, remained flat in FY2018 due to continued weaker prices in the open access market.
During the year, the average generation cost was higher at `2.36 per unit (FY2017: `2.10 per unit) due to temporary disruptions in the coal supply.
TSPL’s average sales price was higher at `3.49 per unit compared with `3.27 per unit in FY2017, and power generation cost was higher at `2.54 per unit compared with `2.28 per unit in the previous year, driven mainly by increased coal prices.
Financial performanceEBITDA for the year was 2% higher y-o-y at `1,669 crore. This includes a one-off revenue recognition of `226 crore and `139 crore at BALCO and at Jharsuguda IPP respectively.
OutlookDuring FY2019, we will remain focused on increasing the plant availability of TSPL (80%) and achieving higher plant load factors at the BALCO and Jharsuguda IPP.
Strategic prioritiesOur focus and priorities will be to:• resolve pending legal issues and recover
aged power debtors;• tie-up for the balance capacity under
open access for BALCO; • achieve high plant load factors for the
Jharsuguda and BALCO IPP; and• improve power plant operating
parameters to deliver higher PLFs/availability and reduce the non-coal cost.
We recorded an improvement in our overall waste recycling rate, from 55% in FY2017 to 67% in FY2018.
Export tank, Mangala Processing Terminal, Barmer, Cairn Oil & Gas
105Vedanta Limited Integrated Report and Annual Accounts 2017-18Financial Statem
entsStatutory R
eports
Managem
ent Review
Integrated Rep
ort
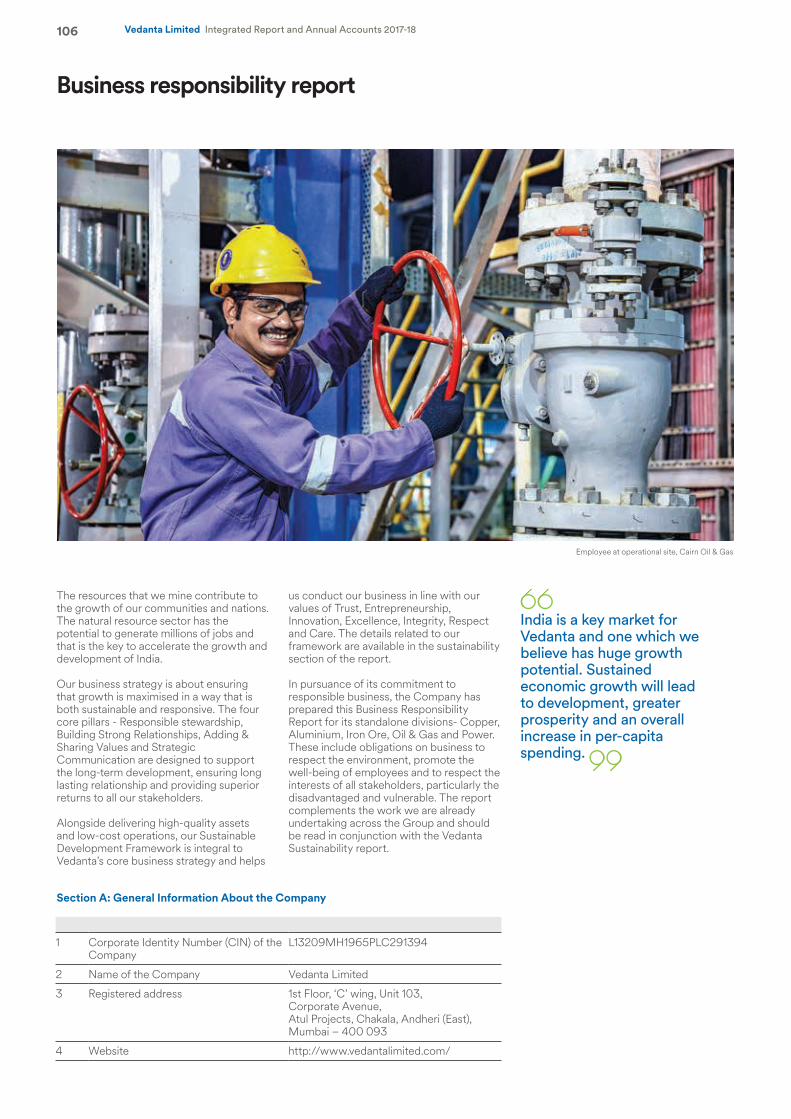
106 Vedanta Limited Integrated Report and Annual Accounts 2017-18
Business responsibility report
The resources that we mine contribute to the growth of our communities and nations. The natural resource sector has the potential to generate millions of jobs and that is the key to accelerate the growth and development of India.
Our business strategy is about ensuring that growth is maximised in a way that is both sustainable and responsive. The four core pillars - Responsible stewardship, Building Strong Relationships, Adding & Sharing Values and Strategic Communication are designed to support the long-term development, ensuring long lasting relationship and providing superior returns to all our stakeholders.
Alongside delivering high-quality assets and low-cost operations, our Sustainable Development Framework is integral to Vedanta’s core business strategy and helps
us conduct our business in line with our values of Trust, Entrepreneurship, Innovation, Excellence, Integrity, Respect and Care. The details related to our framework are available in the sustainability section of the report.
In pursuance of its commitment to responsible business, the Company has prepared this Business Responsibility Report for its standalone divisions- Copper, Aluminium, Iron Ore, Oil & Gas and Power. These include obligations on business to respect the environment, promote the well-being of employees and to respect the interests of all stakeholders, particularly the disadvantaged and vulnerable. The report complements the work we are already undertaking across the Group and should be read in conjunction with the Vedanta Sustainability report.
Section A: General Information About the Company
1 Corporate Identity Number (CIN) of the Company
L13209MH1965PLC291394
2 Name of the Company Vedanta Limited
3 Registered address 1st Floor, ‘C’ wing, Unit 103, Corporate Avenue, Atul Projects, Chakala, Andheri (East), Mumbai – 400 093
4 Website http://www.vedantalimited.com/
India is a key market for Vedanta and one which we believe has huge growth potential. Sustained economic growth will lead to development, greater prosperity and an overall increase in per-capita spending.
Employee at operational site, Cairn Oil & Gas
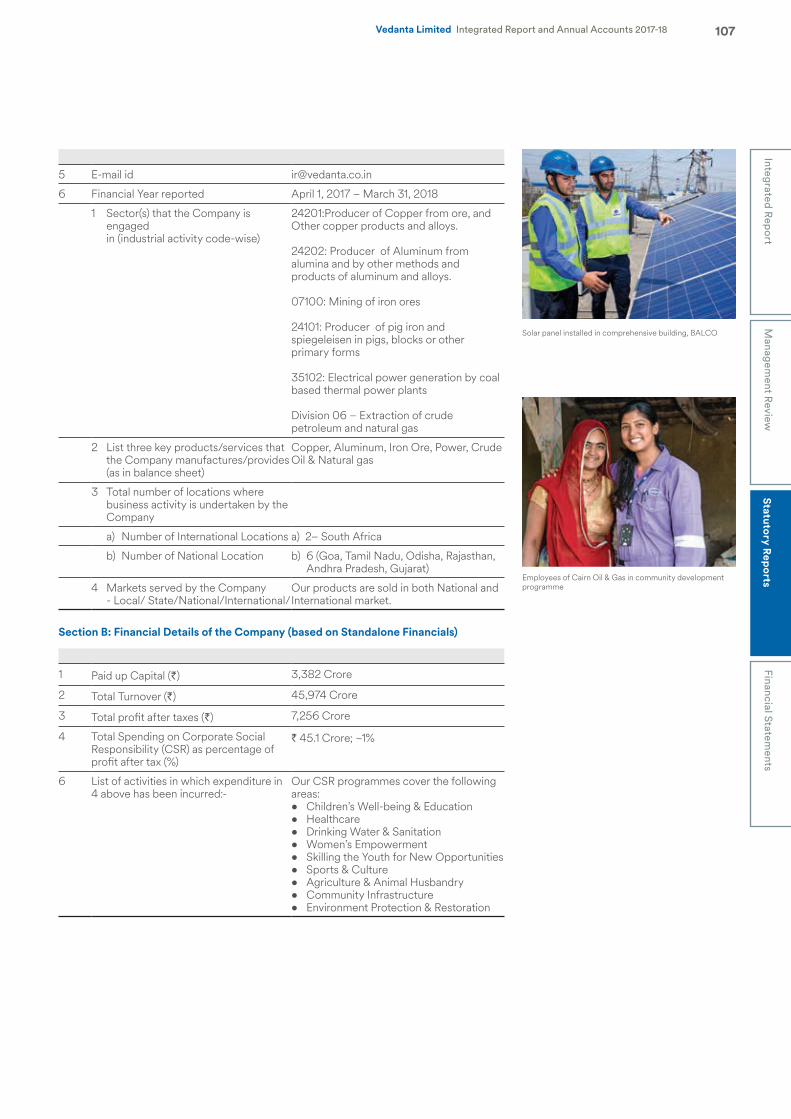
107Integrated R
eport
Financial Statements
Vedanta Limited Integrated Report and Annual Accounts 2017-18M
anagement R
eviewStatutory R
eports
5 E-mail id [email protected]
6 Financial Year reported April 1, 2017 – March 31, 2018
1 Sector(s) that the Company is engaged in (industrial activity code-wise)
24201:Producer of Copper from ore, and Other copper products and alloys.
24202: Producer of Aluminum from alumina and by other methods and products of aluminum and alloys.
07100: Mining of iron ores
24101: Producer of pig iron and spiegeleisen in pigs, blocks or other primary forms
35102: Electrical power generation by coal based thermal power plants
Division 06 – Extraction of crude petroleum and natural gas
2 List three key products/services that the Company manufactures/provides (as in balance sheet)
Copper, Aluminum, Iron Ore, Power, Crude Oil & Natural gas
3 Total number of locations where business activity is undertaken by the Company
a) Number of International Locations a) 2– South Africa
b) Number of National Location b) 6 (Goa, Tamil Nadu, Odisha, Rajasthan, Andhra Pradesh, Gujarat)
4 Markets served by the Company - Local/ State/National/International/
Our products are sold in both National andInternational market.
Section B: Financial Details of the Company (based on Standalone Financials)
1 Paid up Capital (`) 3,382 Crore
2 Total Turnover (`) 45,974 Crore
3 Total profit after taxes (`) 7,256 Crore
4 Total Spending on Corporate Social Responsibility (CSR) as percentage of profit after tax (%)
` 45.1 Crore; ~1%
6 List of activities in which expenditure in 4 above has been incurred:-
Our CSR programmes cover the following areas: • Children’s Well-being & Education• Healthcare• Drinking Water & Sanitation• Women’s Empowerment• Skilling the Youth for New Opportunities• Sports & Culture• Agriculture & Animal Husbandry • Community Infrastructure• Environment Protection & Restoration
Employees of Cairn Oil & Gas in community development programme
Solar panel installed in comprehensive building, BALCO
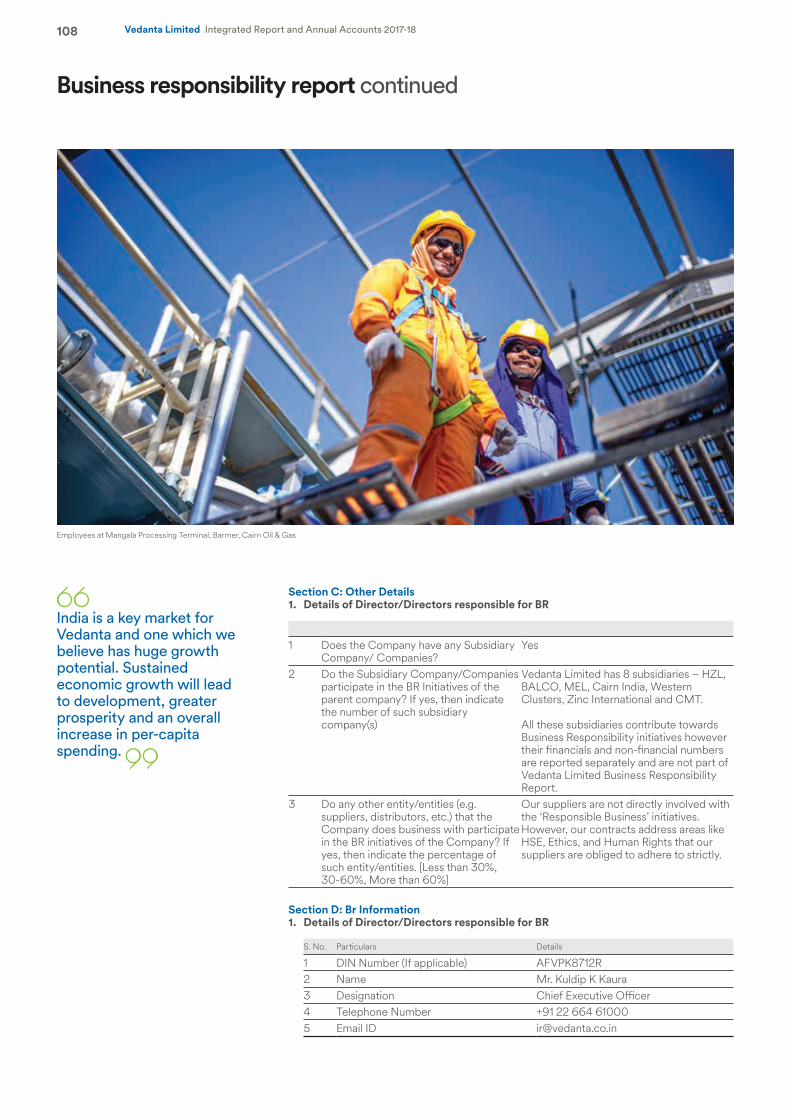
108 Vedanta Limited Integrated Report and Annual Accounts 2017-18
Business responsibility report continued
Section C: Other Details1. Details of Director/Directors responsible for BR
1 Does the Company have any Subsidiary Company/ Companies?
Yes
2 Do the Subsidiary Company/Companies participate in the BR Initiatives of the parent company? If yes, then indicate the number of such subsidiary company(s)
Vedanta Limited has 8 subsidiaries – HZL, BALCO, MEL, Cairn India, Western Clusters, Zinc International and CMT.
All these subsidiaries contribute towardsBusiness Responsibility initiatives however their financials and non-financial numbers are reported separately and are not part of Vedanta Limited Business Responsibility Report.
3 Do any other entity/entities (e.g. suppliers, distributors, etc.) that the Company does business with participate in the BR initiatives of the Company? If yes, then indicate the percentage of such entity/entities. [Less than 30%, 30-60%, More than 60%]
Our suppliers are not directly involved with the ‘Responsible Business’ initiatives. However, our contracts address areas like HSE, Ethics, and Human Rights that our suppliers are obliged to adhere to strictly.
Section D: Br Information1. Details of Director/Directors responsible for BR
S. No. Particulars Details
1 DIN Number (If applicable) AFVPK8712R2 Name Mr. Kuldip K Kaura3 Designation Chief Executive Officer4 Telephone Number +91 22 664 610005 Email ID [email protected]
India is a key market for Vedanta and one which we believe has huge growth potential. Sustained economic growth will lead to development, greater prosperity and an overall increase in per-capita spending.
Employees at Mangala Processing Terminal, Barmer, Cairn Oil & Gas
109Integrated R
eport
Financial Statements
Vedanta Limited Integrated Report and Annual Accounts 2017-18M
anagement R
eviewStatutory R
eports
2a.Principle-wise (as per NVGs) BR Policy/policies (Reply in Y/N) Name of principles:
P1 – Businesses should conduct and govern themselves with Ethics, Transparency and Accountability
P2 – Businesses should provide goods and services that are safe and contribute to sustainability throughout their lifecycle
P3 – Businesses should promote the well-being of all employees
P4 – Businesses should respect the interests of, and be responsive towards all stakeholders, especially those who are disadvantaged, vulnerable and marginalised
P5 – Businesses should respect and promote human rights
P6 – Businesses should respect, protect, and make efforts to restore the environment
P7 – Businesses, when engaged in influencing public and regulatory policy, should do so in a responsible manner
P8 – Businesses should support inclusive growth and equitable development
P9 – Businesses should engage with and provide value to their customers and consumers in a responsible manner
S. No. Questions P1 P2 P3 P4 P5 P6 P7 P8 P9
Do you have a policy/policies for:
1 Has the policy been formulated in consultation with the relevant stakeholders?
Y Y Y Y Y Y Y Y Y
2 Does the policy conform to any national/ international standards? If yes, specify. (50 words)
Y Y Y Y Y Y Y Y Y
3 Has the policy been approved by the Board?Has it been signed by MD/Owner/CEO/Appropriate Board Director?
Y Y Y Y Y Y Y Y Y
4 Does the Company have a specified committee of the Board/ Director/Official to oversee the implementation of the policy?
Y Y Y Y Y Y Y Y Y
5 Indicate the link for the policy to be viewed online? http://www.vedantalimited.com/investor-relations/corporate-governance.aspx
6 Has the policy been formally communicated to all relevant internal and external stakeholders?
Y Y Y Y Y Y Y Y Y
7 Does the Company have in-house structureto implement the policy/policies?
Y Y Y Y Y Y Y Y Y
8 Does the Company have a grievance redressal mechanism related to the policy/ policies to address stakeholders’ grievances related to the policy/ policies?
Y Y Y Y Y Y Y Y Y
9 Has the Company carried out independentaudit/evaluation of the working of this policy by an internal or external agency?
Each year, the Company undertakes an audit exercise, conducted by an external agency to evaluate the workings of these policies. This audit is known as the Vedanta Sustainability Assurance Protocol (VSAP) audit. The VSAP audit is conducted across all of our significant sites.
The elements of all the above referred nine National Voluntary Guideline Principles are either enshrined in our
Business Code of Conduct and Ethics or we also have separate Sustainability policies for them. Our Business Code of Conduct and Ethics is aligned to the UK Bribery Act.
All the sustainability policies of the Company are based on the Vedanta Sustainable Development Framework, which are aligned with the IFC guidelines, ICMM, OECD and UNGC principles. Further both Business Code of Conduct and Ethics and Sustainability Policies are available online for both internal and external stakeholders and have been approved by Board.
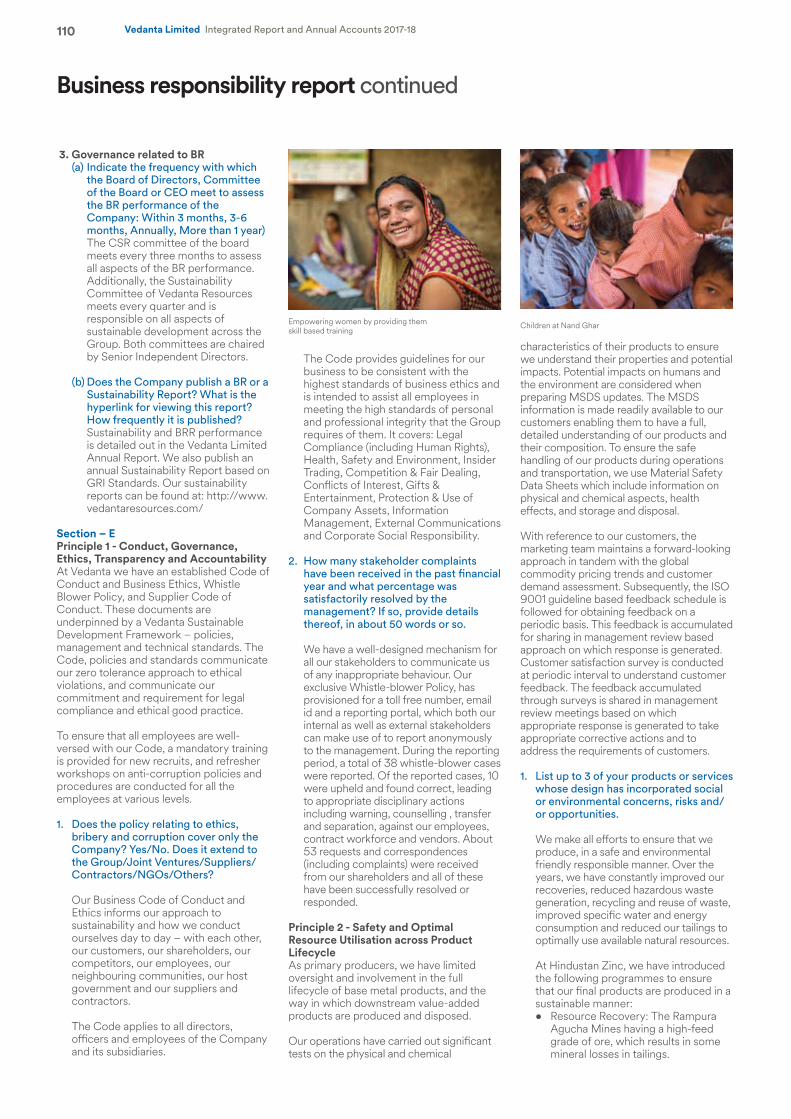
110 Vedanta Limited Integrated Report and Annual Accounts 2017-18
3. Governance related to BR(a) Indicate the frequency with which
the Board of Directors, Committee of the Board or CEO meet to assess the BR performance of the Company: Within 3 months, 3-6 months, Annually, More than 1 year)
The CSR committee of the board meets every three months to assess all aspects of the BR performance. Additionally, the Sustainability Committee of Vedanta Resources meets every quarter and is responsible on all aspects of sustainable development across the Group. Both committees are chaired by Senior Independent Directors.
(b) Does the Company publish a BR or a Sustainability Report? What is the hyperlink for viewing this report? How frequently it is published?
Sustainability and BRR performance is detailed out in the Vedanta Limited Annual Report. We also publish an annual Sustainability Report based on GRI Standards. Our sustainability reports can be found at: http://www.vedantaresources.com/
Section – E Principle 1 - Conduct, Governance, Ethics, Transparency and AccountabilityAt Vedanta we have an established Code of Conduct and Business Ethics, Whistle Blower Policy, and Supplier Code of Conduct. These documents are underpinned by a Vedanta Sustainable Development Framework – policies, management and technical standards. The Code, policies and standards communicate our zero tolerance approach to ethical violations, and communicate our commitment and requirement for legal compliance and ethical good practice.
To ensure that all employees are well-versed with our Code, a mandatory training is provided for new recruits, and refresher workshops on anti-corruption policies and procedures are conducted for all the employees at various levels.
1. Does the policy relating to ethics, bribery and corruption cover only the Company? Yes/No. Does it extend to the Group/Joint Ventures/Suppliers/ Contractors/NGOs/Others?
Our Business Code of Conduct and Ethics informs our approach to sustainability and how we conduct ourselves day to day – with each other, our customers, our shareholders, our competitors, our employees, our neighbouring communities, our host government and our suppliers and contractors.
The Code applies to all directors, officers and employees of the Company and its subsidiaries.
The Code provides guidelines for our business to be consistent with the highest standards of business ethics and is intended to assist all employees in meeting the high standards of personal and professional integrity that the Group requires of them. It covers: Legal Compliance (including Human Rights), Health, Safety and Environment, Insider Trading, Competition & Fair Dealing, Conflicts of Interest, Gifts & Entertainment, Protection & Use of Company Assets, Information Management, External Communications and Corporate Social Responsibility.
2. How many stakeholder complaints have been received in the past financial year and what percentage was satisfactorily resolved by the management? If so, provide details thereof, in about 50 words or so.
We have a well-designed mechanism for all our stakeholders to communicate us of any inappropriate behaviour. Our exclusive Whistle-blower Policy, has provisioned for a toll free number, email id and a reporting portal, which both our internal as well as external stakeholders can make use of to report anonymously to the management. During the reporting period, a total of 38 whistle-blower cases were reported. Of the reported cases, 10 were upheld and found correct, leading to appropriate disciplinary actions including warning, counselling , transfer and separation, against our employees, contract workforce and vendors. About 53 requests and correspondences (including complaints) were received from our shareholders and all of these have been successfully resolved or responded.
Principle 2 - Safety and Optimal Resource Utilisation across Product LifecycleAs primary producers, we have limited oversight and involvement in the full lifecycle of base metal products, and the way in which downstream value-added products are produced and disposed.
Our operations have carried out significant tests on the physical and chemical
characteristics of their products to ensure we understand their properties and potential impacts. Potential impacts on humans and the environment are considered when preparing MSDS updates. The MSDS information is made readily available to our customers enabling them to have a full, detailed understanding of our products and their composition. To ensure the safe handling of our products during operations and transportation, we use Material Safety Data Sheets which include information on physical and chemical aspects, health effects, and storage and disposal.
With reference to our customers, the marketing team maintains a forward-looking approach in tandem with the global commodity pricing trends and customer demand assessment. Subsequently, the ISO 9001 guideline based feedback schedule is followed for obtaining feedback on a periodic basis. This feedback is accumulated for sharing in management review based approach on which response is generated. Customer satisfaction survey is conducted at periodic interval to understand customer feedback. The feedback accumulated through surveys is shared in management review meetings based on which appropriate response is generated to take appropriate corrective actions and to address the requirements of customers.
1. List up to 3 of your products or services whose design has incorporated social or environmental concerns, risks and/or opportunities.
We make all efforts to ensure that we produce, in a safe and environmental friendly responsible manner. Over the years, we have constantly improved our recoveries, reduced hazardous waste generation, recycling and reuse of waste, improved specific water and energy consumption and reduced our tailings to optimally use available natural resources.
At Hindustan Zinc, we have introduced the following programmes to ensure that our final products are produced in a sustainable manner:• Resource Recovery: The Rampura
Agucha Mines having a high-feed grade of ore, which results in some mineral losses in tailings.
Business responsibility report continued
Empowering women by providing them skill based training
Children at Nand Ghar
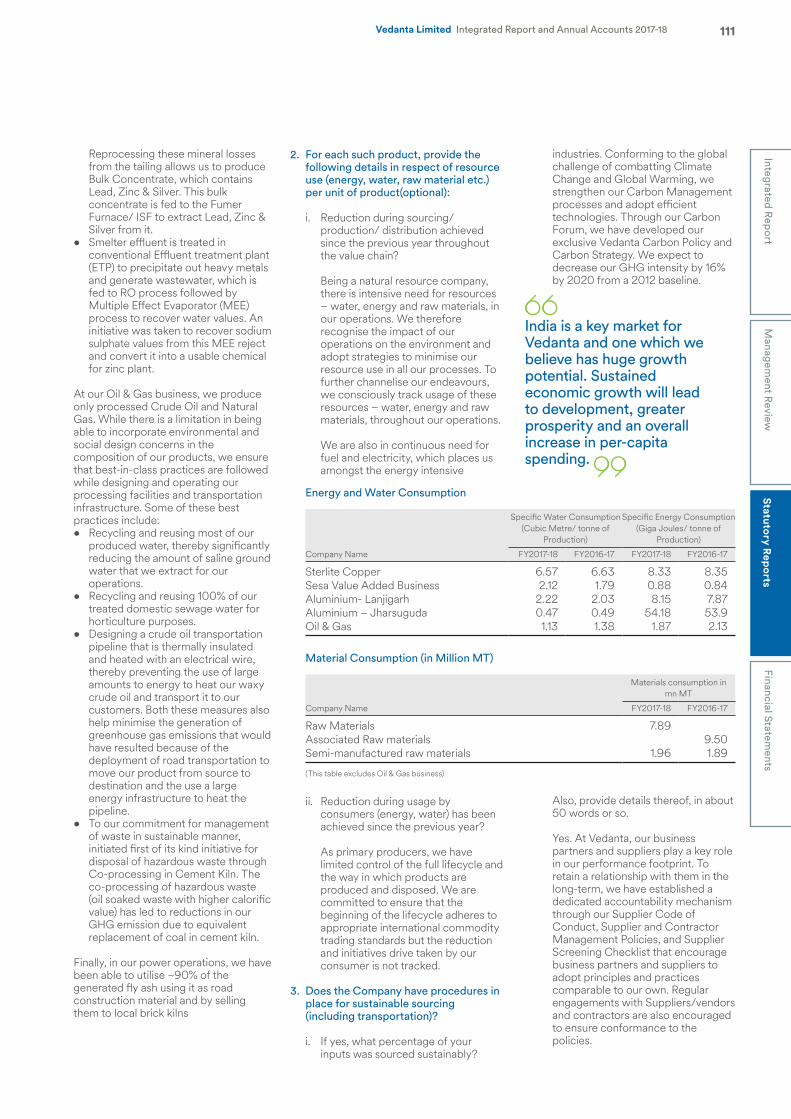
111Integrated R
eport
Financial Statements
Vedanta Limited Integrated Report and Annual Accounts 2017-18M
anagement R
eviewStatutory R
eports
Reprocessing these mineral losses from the tailing allows us to produce Bulk Concentrate, which contains Lead, Zinc & Silver. This bulk concentrate is fed to the Fumer Furnace/ ISF to extract Lead, Zinc & Silver from it.
• Smelter effluent is treated in conventional Effluent treatment plant (ETP) to precipitate out heavy metals and generate wastewater, which is fed to RO process followed by Multiple Effect Evaporator (MEE) process to recover water values. An initiative was taken to recover sodium sulphate values from this MEE reject and convert it into a usable chemical for zinc plant.
At our Oil & Gas business, we produce only processed Crude Oil and Natural Gas. While there is a limitation in being able to incorporate environmental and social design concerns in the composition of our products, we ensure that best-in-class practices are followed while designing and operating our processing facilities and transportation infrastructure. Some of these best practices include:• Recycling and reusing most of our
produced water, thereby significantly reducing the amount of saline ground water that we extract for our operations.
• Recycling and reusing 100% of our treated domestic sewage water for horticulture purposes.
• Designing a crude oil transportation pipeline that is thermally insulated and heated with an electrical wire, thereby preventing the use of large amounts to energy to heat our waxy crude oil and transport it to our customers. Both these measures also help minimise the generation of greenhouse gas emissions that would have resulted because of the deployment of road transportation to move our product from source to destination and the use a large energy infrastructure to heat the pipeline.
• To our commitment for management of waste in sustainable manner, initiated first of its kind initiative for disposal of hazardous waste through Co-processing in Cement Kiln. The co-processing of hazardous waste (oil soaked waste with higher calorific value) has led to reductions in our GHG emission due to equivalent replacement of coal in cement kiln.
Finally, in our power operations, we have been able to utilise ~90% of the generated fly ash using it as road construction material and by selling them to local brick kilns
2. For each such product, provide the following details in respect of resource use (energy, water, raw material etc.) per unit of product(optional):
i. Reduction during sourcing/production/ distribution achieved since the previous year throughout the value chain?
Being a natural resource company, there is intensive need for resources – water, energy and raw materials, in our operations. We therefore recognise the impact of our operations on the environment and adopt strategies to minimise our resource use in all our processes. To further channelise our endeavours, we consciously track usage of these resources – water, energy and raw materials, throughout our operations.
We are also in continuous need for fuel and electricity, which places us amongst the energy intensive
industries. Conforming to the global challenge of combatting Climate Change and Global Warming, we strengthen our Carbon Management processes and adopt efficient technologies. Through our Carbon Forum, we have developed our exclusive Vedanta Carbon Policy and Carbon Strategy. We expect to decrease our GHG intensity by 16% by 2020 from a 2012 baseline.
Energy and Water Consumption
Company Name
Specific Water Consumption(Cubic Metre/ tonne of
Production)
Specific Energy Consumption(Giga Joules/ tonne of
Production)
FY2017-18 FY2016-17 FY2017-18 FY2016-17
Sterlite Copper 6.57 6.63 8.33 8.35Sesa Value Added Business 2.12 1.79 0.88 0.84Aluminium- Lanjigarh 2.22 2.03 8.15 7.87Aluminium – Jharsuguda 0.47 0.49 54.18 53.9Oil & Gas 1.13 1.38 1.87 2.13
Material Consumption (in Million MT)
Company Name
Materials consumption in mn MT
FY2017-18 FY2016-17
Raw Materials 7.89Associated Raw materials 9.50Semi-manufactured raw materials 1.96 1.89
(This table excludes Oil & Gas business)
ii. Reduction during usage by consumers (energy, water) has been achieved since the previous year?
As primary producers, we have limited control of the full lifecycle and the way in which products are produced and disposed. We are committed to ensure that the beginning of the lifecycle adheres to appropriate international commodity trading standards but the reduction and initiatives drive taken by our consumer is not tracked.
3. Does the Company have procedures in place for sustainable sourcing (including transportation)?
i. If yes, what percentage of your inputs was sourced sustainably?
Also, provide details thereof, in about 50 words or so.
Yes. At Vedanta, our business partners and suppliers play a key role in our performance footprint. To retain a relationship with them in the long-term, we have established a dedicated accountability mechanism through our Supplier Code of Conduct, Supplier and Contractor Management Policies, and Supplier Screening Checklist that encourage business partners and suppliers to adopt principles and practices comparable to our own. Regular engagements with Suppliers/vendors and contractors are also encouraged to ensure conformance to the policies.
India is a key market for Vedanta and one which we believe has huge growth potential. Sustained economic growth will lead to development, greater prosperity and an overall increase in per-capita spending.
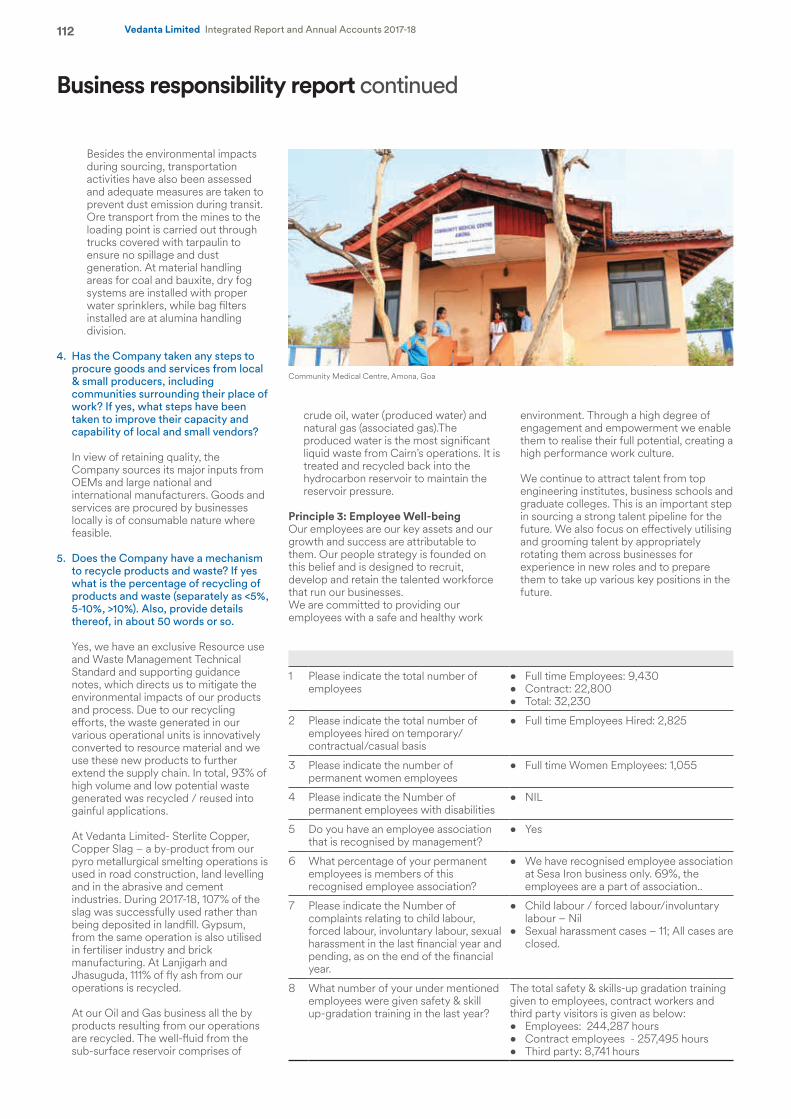
112 Vedanta Limited Integrated Report and Annual Accounts 2017-18
Besides the environmental impacts during sourcing, transportation activities have also been assessed and adequate measures are taken to prevent dust emission during transit. Ore transport from the mines to the loading point is carried out through trucks covered with tarpaulin to ensure no spillage and dust generation. At material handling areas for coal and bauxite, dry fog systems are installed with proper water sprinklers, while bag filters installed are at alumina handling division.
4. Has the Company taken any steps to procure goods and services from local & small producers, including communities surrounding their place of work? If yes, what steps have been taken to improve their capacity and capability of local and small vendors?
In view of retaining quality, the Company sources its major inputs from OEMs and large national and international manufacturers. Goods and services are procured by businesses locally is of consumable nature where feasible.
5. Does the Company have a mechanism to recycle products and waste? If yes what is the percentage of recycling of products and waste (separately as <5%, 5-10%, >10%). Also, provide details thereof, in about 50 words or so.
Yes, we have an exclusive Resource use and Waste Management Technical Standard and supporting guidance notes, which directs us to mitigate the environmental impacts of our products and process. Due to our recycling efforts, the waste generated in our various operational units is innovatively converted to resource material and we use these new products to further extend the supply chain. In total, 93% of high volume and low potential waste generated was recycled / reused into gainful applications.
At Vedanta Limited- Sterlite Copper, Copper Slag – a by-product from our pyro metallurgical smelting operations is used in road construction, land levelling and in the abrasive and cement industries. During 2017-18, 107% of the slag was successfully used rather than being deposited in landfill. Gypsum, from the same operation is also utilised in fertiliser industry and brick manufacturing. At Lanjigarh and Jhasuguda, 111% of fly ash from our operations is recycled.
At our Oil and Gas business all the by products resulting from our operations are recycled. The well-fluid from the sub-surface reservoir comprises of
crude oil, water (produced water) and natural gas (associated gas).The produced water is the most significant liquid waste from Cairn’s operations. It is treated and recycled back into the hydrocarbon reservoir to maintain the reservoir pressure.
Principle 3: Employee Well-beingOur employees are our key assets and our growth and success are attributable to them. Our people strategy is founded on this belief and is designed to recruit, develop and retain the talented workforce that run our businesses.We are committed to providing our employees with a safe and healthy work
environment. Through a high degree of engagement and empowerment we enable them to realise their full potential, creating a high performance work culture.
We continue to attract talent from top engineering institutes, business schools and graduate colleges. This is an important step in sourcing a strong talent pipeline for the future. We also focus on effectively utilising and grooming talent by appropriately rotating them across businesses for experience in new roles and to prepare them to take up various key positions in the future.
1 Please indicate the total number of employees
• Full time Employees: 9,430• Contract: 22,800• Total: 32,230
2 Please indicate the total number of employees hired on temporary/ contractual/casual basis
• Full time Employees Hired: 2,825
3 Please indicate the number of permanent women employees
• Full time Women Employees: 1,055
4 Please indicate the Number of permanent employees with disabilities
• NIL
5 Do you have an employee association that is recognised by management?
• Yes
6 What percentage of your permanent employees is members of this recognised employee association?
• We have recognised employee association at Sesa Iron business only. 69%, the employees are a part of association..
7 Please indicate the Number of complaints relating to child labour, forced labour, involuntary labour, sexual harassment in the last financial year and pending, as on the end of the financial year.
• Child labour / forced labour/involuntary labour – Nil
• Sexual harassment cases – 11; All cases are closed.
8 What number of your under mentioned employees were given safety & skill up-gradation training in the last year?
The total safety & skills-up gradation training given to employees, contract workers and third party visitors is given as below: • Employees: 244,287 hours• Contract employees - 257,495 hours • Third party: 8,741 hours
Business responsibility report continued
Community Medical Centre, Amona, Goa
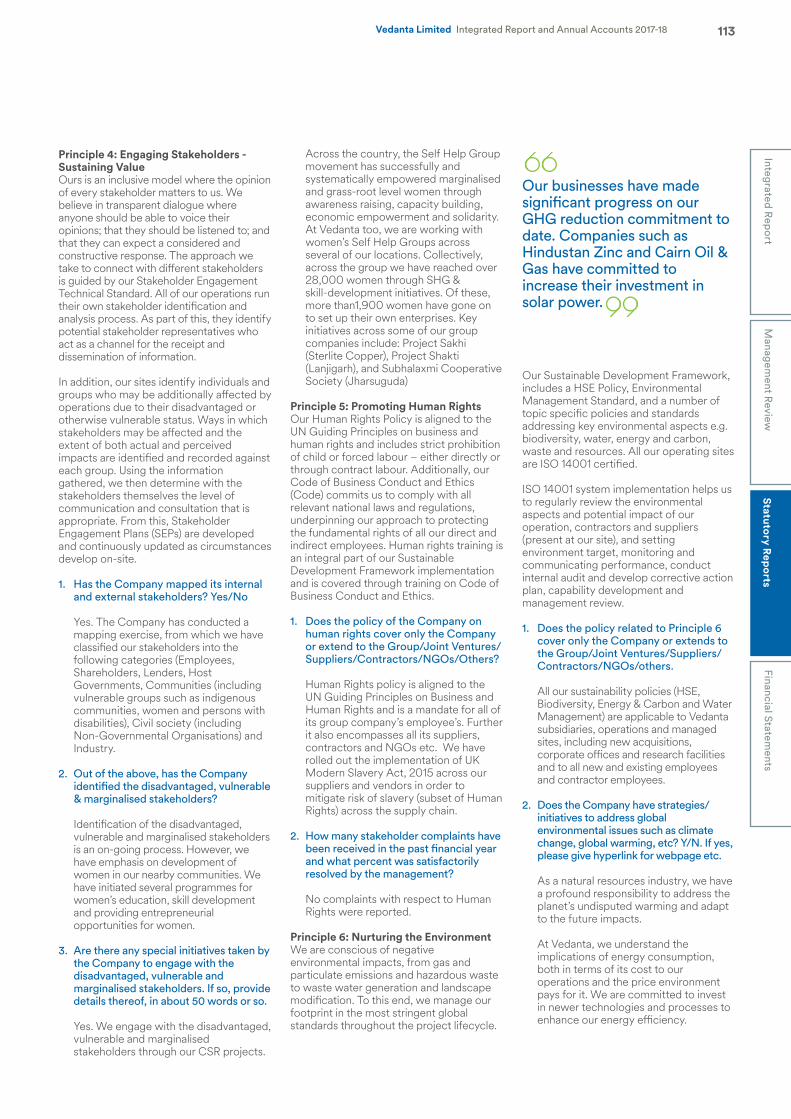
113Integrated R
eport
Financial Statements
Vedanta Limited Integrated Report and Annual Accounts 2017-18M
anagement R
eviewStatutory R
eports
Principle 4: Engaging Stakeholders - Sustaining ValueOurs is an inclusive model where the opinion of every stakeholder matters to us. We believe in transparent dialogue where anyone should be able to voice their opinions; that they should be listened to; and that they can expect a considered and constructive response. The approach we take to connect with different stakeholders is guided by our Stakeholder Engagement Technical Standard. All of our operations run their own stakeholder identification and analysis process. As part of this, they identify potential stakeholder representatives who act as a channel for the receipt and dissemination of information.
In addition, our sites identify individuals and groups who may be additionally affected by operations due to their disadvantaged or otherwise vulnerable status. Ways in which stakeholders may be affected and the extent of both actual and perceived impacts are identified and recorded against each group. Using the information gathered, we then determine with the stakeholders themselves the level of communication and consultation that is appropriate. From this, Stakeholder Engagement Plans (SEPs) are developed and continuously updated as circumstances develop on-site.
1. Has the Company mapped its internal and external stakeholders? Yes/No
Yes. The Company has conducted a mapping exercise, from which we have classified our stakeholders into the following categories (Employees, Shareholders, Lenders, Host Governments, Communities (including vulnerable groups such as indigenous communities, women and persons with disabilities), Civil society (including Non-Governmental Organisations) and Industry.
2. Out of the above, has the Company identified the disadvantaged, vulnerable & marginalised stakeholders?
Identification of the disadvantaged, vulnerable and marginalised stakeholders is an on-going process. However, we have emphasis on development of women in our nearby communities. We have initiated several programmes for women’s education, skill development and providing entrepreneurial opportunities for women.
3. Are there any special initiatives taken by the Company to engage with the disadvantaged, vulnerable and marginalised stakeholders. If so, provide details thereof, in about 50 words or so.
Yes. We engage with the disadvantaged, vulnerable and marginalised stakeholders through our CSR projects.
Across the country, the Self Help Group movement has successfully and systematically empowered marginalised and grass-root level women through awareness raising, capacity building, economic empowerment and solidarity. At Vedanta too, we are working with women’s Self Help Groups across several of our locations. Collectively, across the group we have reached over 28,000 women through SHG & skill-development initiatives. Of these, more than1,900 women have gone on to set up their own enterprises. Key initiatives across some of our group companies include: Project Sakhi (Sterlite Copper), Project Shakti (Lanjigarh), and Subhalaxmi Cooperative Society (Jharsuguda)
Principle 5: Promoting Human RightsOur Human Rights Policy is aligned to the UN Guiding Principles on business and human rights and includes strict prohibition of child or forced labour – either directly or through contract labour. Additionally, our Code of Business Conduct and Ethics (Code) commits us to comply with all relevant national laws and regulations, underpinning our approach to protecting the fundamental rights of all our direct and indirect employees. Human rights training is an integral part of our Sustainable Development Framework implementation and is covered through training on Code of Business Conduct and Ethics.
1. Does the policy of the Company on human rights cover only the Company or extend to the Group/Joint Ventures/ Suppliers/Contractors/NGOs/Others?
Human Rights policy is aligned to the UN Guiding Principles on Business and Human Rights and is a mandate for all of its group company’s employee’s. Further it also encompasses all its suppliers, contractors and NGOs etc. We have rolled out the implementation of UK Modern Slavery Act, 2015 across our suppliers and vendors in order to mitigate risk of slavery (subset of Human Rights) across the supply chain.
2. How many stakeholder complaints have been received in the past financial year and what percent was satisfactorily resolved by the management?
No complaints with respect to Human Rights were reported.
Principle 6: Nurturing the EnvironmentWe are conscious of negative environmental impacts, from gas and particulate emissions and hazardous waste to waste water generation and landscape modification. To this end, we manage our footprint in the most stringent global standards throughout the project lifecycle.
Our Sustainable Development Framework, includes a HSE Policy, Environmental Management Standard, and a number of topic specific policies and standards addressing key environmental aspects e.g. biodiversity, water, energy and carbon, waste and resources. All our operating sites are ISO 14001 certified.
ISO 14001 system implementation helps us to regularly review the environmental aspects and potential impact of our operation, contractors and suppliers (present at our site), and setting environment target, monitoring and communicating performance, conduct internal audit and develop corrective action plan, capability development and management review.
1. Does the policy related to Principle 6 cover only the Company or extends to the Group/Joint Ventures/Suppliers/ Contractors/NGOs/others.
All our sustainability policies (HSE, Biodiversity, Energy & Carbon and Water Management) are applicable to Vedanta subsidiaries, operations and managed sites, including new acquisitions, corporate offices and research facilities and to all new and existing employees and contractor employees.
2. Does the Company have strategies/
initiatives to address global environmental issues such as climate change, global warming, etc? Y/N. If yes, please give hyperlink for webpage etc.
As a natural resources industry, we have a profound responsibility to address the planet’s undisputed warming and adapt to the future impacts.
At Vedanta, we understand the implications of energy consumption, both in terms of its cost to our operations and the price environment pays for it. We are committed to invest in newer technologies and processes to enhance our energy efficiency.
Our businesses have made significant progress on our GHG reduction commitment to date. Companies such as Hindustan Zinc and Cairn Oil & Gas have committed to increase their investment in solar power.
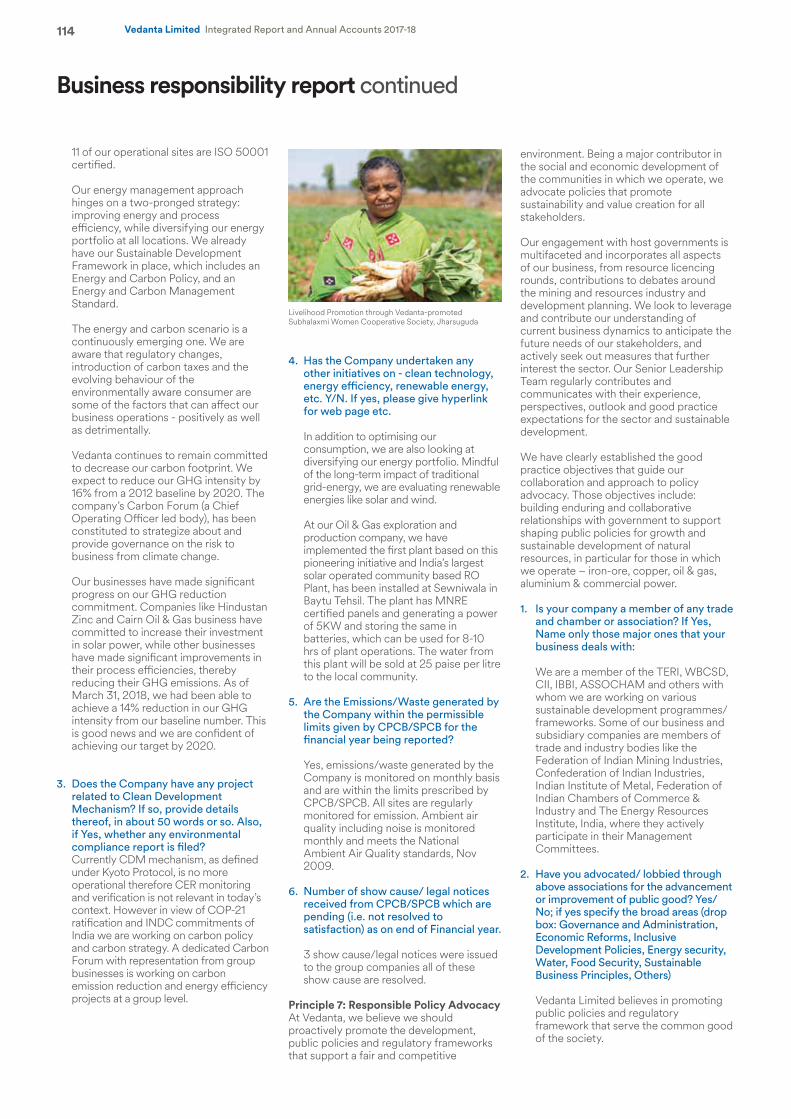
114 Vedanta Limited Integrated Report and Annual Accounts 2017-18
11 of our operational sites are ISO 50001 certified.
Our energy management approach hinges on a two-pronged strategy: improving energy and process efficiency, while diversifying our energy portfolio at all locations. We already have our Sustainable Development Framework in place, which includes an Energy and Carbon Policy, and an Energy and Carbon Management Standard.
The energy and carbon scenario is a continuously emerging one. We are aware that regulatory changes, introduction of carbon taxes and the evolving behaviour of the environmentally aware consumer are some of the factors that can affect our business operations - positively as well as detrimentally.
Vedanta continues to remain committed to decrease our carbon footprint. We expect to reduce our GHG intensity by 16% from a 2012 baseline by 2020. The company’s Carbon Forum (a Chief Operating Officer led body), has been constituted to strategize about and provide governance on the risk to business from climate change.
Our businesses have made significant progress on our GHG reduction commitment. Companies like Hindustan Zinc and Cairn Oil & Gas business have committed to increase their investment in solar power, while other businesses have made significant improvements in their process efficiencies, thereby reducing their GHG emissions. As of March 31, 2018, we had been able to achieve a 14% reduction in our GHG intensity from our baseline number. This is good news and we are confident of achieving our target by 2020.
3. Does the Company have any project related to Clean Development Mechanism? If so, provide details thereof, in about 50 words or so. Also, if Yes, whether any environmental compliance report is filed?
Currently CDM mechanism, as defined under Kyoto Protocol, is no more operational therefore CER monitoring and verification is not relevant in today’s context. However in view of COP-21 ratification and INDC commitments of India we are working on carbon policy and carbon strategy. A dedicated Carbon Forum with representation from group businesses is working on carbon emission reduction and energy efficiency projects at a group level.
4. Has the Company undertaken any other initiatives on - clean technology, energy efficiency, renewable energy, etc. Y/N. If yes, please give hyperlink for web page etc.
In addition to optimising our consumption, we are also looking at diversifying our energy portfolio. Mindful of the long-term impact of traditional grid-energy, we are evaluating renewable energies like solar and wind.
At our Oil & Gas exploration and production company, we have implemented the first plant based on this pioneering initiative and India’s largest solar operated community based RO Plant, has been installed at Sewniwala in Baytu Tehsil. The plant has MNRE certified panels and generating a power of 5KW and storing the same in batteries, which can be used for 8-10 hrs of plant operations. The water from this plant will be sold at 25 paise per litre to the local community.
5. Are the Emissions/Waste generated by the Company within the permissible limits given by CPCB/SPCB for the financial year being reported?
Yes, emissions/waste generated by the Company is monitored on monthly basis and are within the limits prescribed by CPCB/SPCB. All sites are regularly monitored for emission. Ambient air quality including noise is monitored monthly and meets the National Ambient Air Quality standards, Nov 2009.
6. Number of show cause/ legal notices received from CPCB/SPCB which are pending (i.e. not resolved to satisfaction) as on end of Financial year.
3 show cause/legal notices were issued to the group companies all of these show cause are resolved.
Principle 7: Responsible Policy AdvocacyAt Vedanta, we believe we should proactively promote the development, public policies and regulatory frameworks that support a fair and competitive
environment. Being a major contributor in the social and economic development of the communities in which we operate, we advocate policies that promote sustainability and value creation for all stakeholders.
Our engagement with host governments is multifaceted and incorporates all aspects of our business, from resource licencing rounds, contributions to debates around the mining and resources industry and development planning. We look to leverage and contribute our understanding of current business dynamics to anticipate the future needs of our stakeholders, and actively seek out measures that further interest the sector. Our Senior Leadership Team regularly contributes and communicates with their experience, perspectives, outlook and good practice expectations for the sector and sustainable development.
We have clearly established the good practice objectives that guide our collaboration and approach to policy advocacy. Those objectives include: building enduring and collaborative relationships with government to support shaping public policies for growth and sustainable development of natural resources, in particular for those in which we operate – iron-ore, copper, oil & gas, aluminium & commercial power.
1. Is your company a member of any trade and chamber or association? If Yes, Name only those major ones that your business deals with:
We are a member of the TERI, WBCSD, CII, IBBI, ASSOCHAM and others with whom we are working on various sustainable development programmes/ frameworks. Some of our business and subsidiary companies are members of trade and industry bodies like the Federation of Indian Mining Industries, Confederation of Indian Industries, Indian Institute of Metal, Federation of Indian Chambers of Commerce & Industry and The Energy Resources Institute, India, where they actively participate in their Management Committees.
2. Have you advocated/ lobbied through above associations for the advancement or improvement of public good? Yes/No; if yes specify the broad areas (drop box: Governance and Administration, Economic Reforms, Inclusive Development Policies, Energy security, Water, Food Security, Sustainable Business Principles, Others)
Vedanta Limited believes in promoting public policies and regulatory framework that serve the common good of the society.
Business responsibility report continued
Livelihood Promotion through Vedanta-promoted Subhalaxmi Women Cooperative Society, Jharsuguda
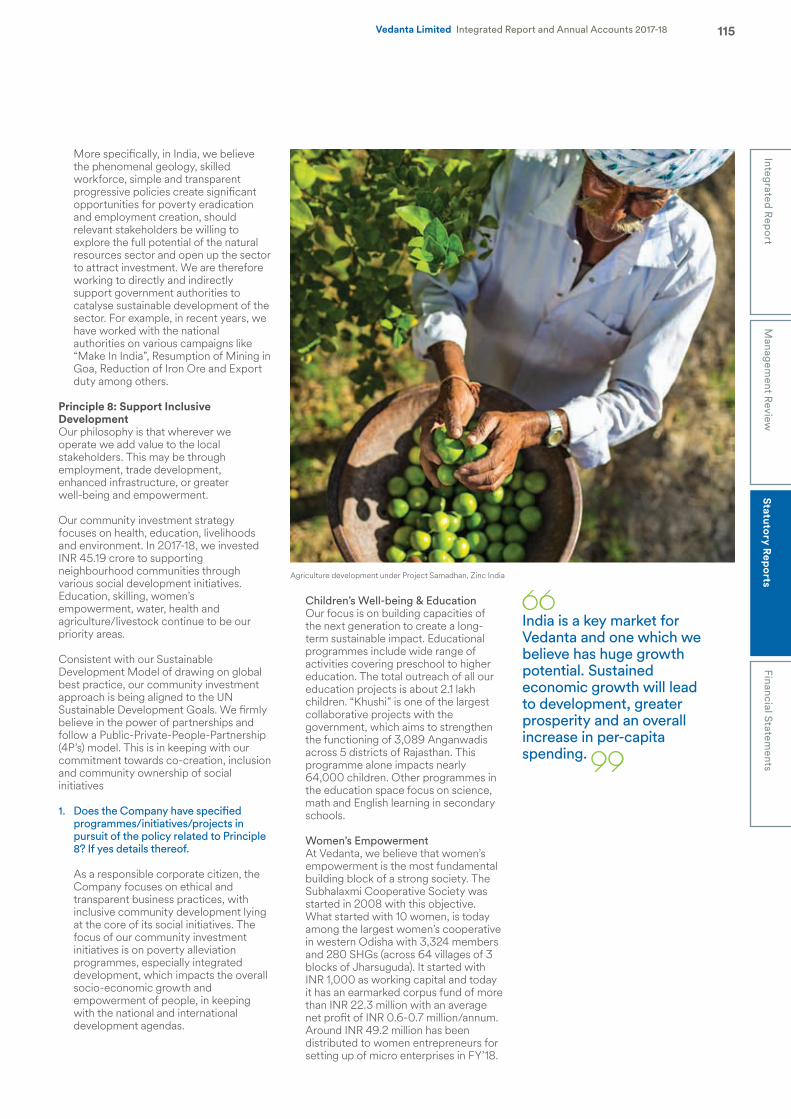
115Integrated R
eport
Financial Statements
Vedanta Limited Integrated Report and Annual Accounts 2017-18M
anagement R
eviewStatutory R
eports
More specifically, in India, we believe the phenomenal geology, skilled workforce, simple and transparent progressive policies create significant opportunities for poverty eradication and employment creation, should relevant stakeholders be willing to explore the full potential of the natural resources sector and open up the sector to attract investment. We are therefore working to directly and indirectly support government authorities to catalyse sustainable development of the sector. For example, in recent years, we have worked with the national authorities on various campaigns like “Make In India”, Resumption of Mining in Goa, Reduction of Iron Ore and Export duty among others.
Principle 8: Support Inclusive DevelopmentOur philosophy is that wherever we operate we add value to the local stakeholders. This may be through employment, trade development, enhanced infrastructure, or greater well-being and empowerment.
Our community investment strategy focuses on health, education, livelihoods and environment. In 2017-18, we invested INR 45.19 crore to supporting neighbourhood communities through various social development initiatives. Education, skilling, women’s empowerment, water, health and agriculture/livestock continue to be our priority areas.
Consistent with our Sustainable Development Model of drawing on global best practice, our community investment approach is being aligned to the UN Sustainable Development Goals. We firmly believe in the power of partnerships and follow a Public-Private-People-Partnership (4P’s) model. This is in keeping with our commitment towards co-creation, inclusion and community ownership of social initiatives
1. Does the Company have specified programmes/initiatives/projects in pursuit of the policy related to Principle 8? If yes details thereof.
As a responsible corporate citizen, the Company focuses on ethical and transparent business practices, with inclusive community development lying at the core of its social initiatives. The focus of our community investment initiatives is on poverty alleviation programmes, especially integrated development, which impacts the overall socio-economic growth and empowerment of people, in keeping with the national and international development agendas.
Children’s Well-being & Education Our focus is on building capacities of
the next generation to create a long-term sustainable impact. Educational programmes include wide range of activities covering preschool to higher education. The total outreach of all our education projects is about 2.1 lakh children. “Khushi” is one of the largest collaborative projects with the government, which aims to strengthen the functioning of 3,089 Anganwadis across 5 districts of Rajasthan. This programme alone impacts nearly 64,000 children. Other programmes in the education space focus on science, math and English learning in secondary schools.
Women’s Empowerment At Vedanta, we believe that women’s
empowerment is the most fundamental building block of a strong society. The Subhalaxmi Cooperative Society was started in 2008 with this objective. What started with 10 women, is today among the largest women’s cooperative in western Odisha with 3,324 members and 280 SHGs (across 64 villages of 3 blocks of Jharsuguda). It started with INR 1,000 as working capital and today it has an earmarked corpus fund of more than INR 22.3 million with an average net profit of INR 0.6-0.7 million/annum. Around INR 49.2 million has been distributed to women entrepreneurs for setting up of micro enterprises in FY’18.
India is a key market for Vedanta and one which we believe has huge growth potential. Sustained economic growth will lead to development, greater prosperity and an overall increase in per-capita spending.
Agriculture development under Project Samadhan, Zinc India
116 Vedanta Limited Integrated Report and Annual Accounts 2017-18
It has now set up a special fund called “UDYAMI FUND” to support emerging & aspiring microenterprises in Jharsuguda. We work with almost 28,000 women who are members of such Self-Help Groups (SHGs), and during the year, nearly 1,900 women set up/expanded their own enterprises.
Drinking Water and Sanitation We focus on drinking water and
sanitation considering both as basic requirement of healthy life. Jeevan Amrit Project is among the largest drinking water programmes undertaken by any company in Rajasthan. Cairn’s Memorandum of Understanding (MoU) with the Government of Rajasthan is about setting up 330 community Reverse Osmosis (RO) water plants in the water stressed district of Barmer in Rajasthan. As part of the MoU, 115 RO plants have already been installed. During the year, these plants dispensed over 4 million litres of clean water, benefitting nearly 100,000 people.
Agriculture and Animal Husbandry Agriculture is the backbone of the
economy in all of our surrounding villages as we mainly operate in remote, rural locations. Project Unnati of Cairn was set up to support the farmers of Barmer in enhancing incomes through sustainable farming. As part of an MoU with Central Arid Zone Research Institute (CAZRI), Jodhpur – a unit of Indian Council for Agriculture Research (ICAR), 700 framers were trained in improved farming techniques. This was supported with the installation of drips for 60,000 horticulture plants in 120 acres. As a result, this year, the farmers in Barmer have harvested over 60 tonnes of Ber, Gunda, and Anar.
Skilling the Youth Our skills programmes are focused on
helping young people learn a trade and gain “hands on” experience and subsequently find a job. In FY2017-18, 3500+ youths acquired diverse skills and were placed.
Sports Sports is the most powerful means to
connect with the youth. Our Sesa Football Academy (an IOB CSR initiative) was established in 1999 on a reclaimed mine at Sanquelim, with a vision to become a premier academy in India. Over the years, Sesa Football Academy has directly trained around 123 trainees at the residential academies and impacted over 500 youth players. Many of them are today pursuing their football career with major clubs. Seven alumni of SFA have played for the Indian national team and eight are playing in the elite Indian Super League 2017-18 season. We have now expanded the football programmes to Rajasthan, with Hindustan Zinc setting up a world-class technology based Football Academy. This Academy will use science and technology as a differentiator in its approach, and is also setting up a network of community feeder academies. 56 such community academies are currently active, grooming close to 2000 under-14 talented players.
2. Are the programmes/projects undertaken through in-house team/ own foundation/external NGO/ government structures/any other organisation?
We implement our programmes through all the following modes – directly through our Corporate Social Responsibility team and in partnership with government and civil society organisations. We also actively encourage our own employees to contribute towards these social initiatives.
3. Have you done any impact assessment of your initiative?
Yes, we assess the impact created by our projects by engaging external agencies at periodic intervals.
4. What is your company’s direct contribution to community development projects- Amount in INR and the details of the projects undertaken.
The total amount spent on all CSR activities and projects during the FY2017-18 was ` 45.19 crore. The major thrust areas for our programmes are – a. Children’s Well-being & Educationb. Women’s Empowerment c. Health Programmes for the
Communityd. Drinking Water & Sanitatione. Agriculture & Animal Husbandryf. Skilling the Youth for new
opportunities g. Environment Protection &
Restoration h. Sports & Culture i. Development of Community
Infrastructure j. Participate in programmes of national
importance including but not limited to disaster mitigation, rescue, relief and rehabilitation
5. Have you taken steps to ensure that this community development initiative is successfully adopted by the community? Please explain in 50 words, or so.
Most of our programmes emerge from a community needs assessment and are delivered in close partnership with them. Several of our initiatives, such as women’s self-help groups, are now completely run and managed by the community members themselves. Our role is chiefly that of a catalyst in the whole process.
Principle 9: Providing Customer ValueOur growth and success are directly linked to and co-dependent on the success of our customers, who are predominantly large industrial downstream producers with whom we deal directly. We understand that meeting customer expectations is crucial to the growth of our business, particularly when we have such a significant presence in the market. We are therefore committed to ensuring that our raw materials meet the required London Metal Exchange (LME) standards for entering the commodity market.
Our businesses have made significant progress on our GHG reduction commitment to date. Companies such as Hindustan Zinc and Cairn Oil & Gas have committed to increase their investment in solar power.
Business responsibility report continued
117Integrated R
eport
Financial Statements
Vedanta Limited Integrated Report and Annual Accounts 2017-18M
anagement R
eviewStatutory R
eports
Our subsidiaries have defined systems and practices in place to understand and meet customer expectations. We constantly engage with customers through our marketing and customer service personnel.
All our activities are focused on ensuring our customers’ needs are met in an appropriate and timely manner.
Honouring our contract obligations on price, quality and quantity is crucial to building the business’ credibility with customers. We sell our commodities on price circulars that are linked to the commodity index, ensuring a clear and transparent process. Alongside the timely delivery of our products, their quality must be assured and in compliance with agreed technical standards, with the certification of all deliveries vital for ensuring that customers trust the product and that its quality has been verified. Assistance is also provided to customers both by our internal experts and by international consultant visits, together with workshops and seminars on technical issues and product development for first use.
1. What percentage of customer complaints/consumer cases are pending as on the end of financial year.
NIL complaints pending at the end of FY2017-18.
2. Does the Company display product information on the product label, over and above what is mandated as per local laws? Yes/No/N.A. /Remarks (additional information)
Yes. Our copper cathodes, aluminium are all internationally known brands registered with the LME (London Metal
India is a key market for Vedanta and one which we believe has huge growth potential. Sustained economic growth will lead to development, greater prosperity and an overall increase in per-capita spending.
Exchange). LME standards signify highest product quality, uniform physical characteristics and consistency of products. Our products meet all necessary and benchmark national and global regulations, standards and guidelines. This re-emphasizes our capability and commitment to meet world-class standards. For continuous quality improvement, Quality Management Systems are in place, which comply with the ISO 9001:2008 standard requirements.
3. Is there any case filed by any stakeholder against the Company regarding unfair trade practices, irresponsible advertising and/or anti-competitive behaviour during the last five years and pending as on end of financial year. If so, provide details thereof, in about 50 words or so
NIL
4. Did your company carry out any consumer survey/ consumer satisfaction trends?
Feedback is a continuous process at our operations and we leverage feedback for continual improvement in product and service quality, for benchmarking ourselves with industry standards and identifying scope and future opportunities to increase customer value.
Various approaches are used for feedback process which include frequent meets, online feedback system and customers surveys. A robust customer complaint tracking system ensures quick resolution and undisrupted operations for customers. As such no major concerns were raised by any of our customer
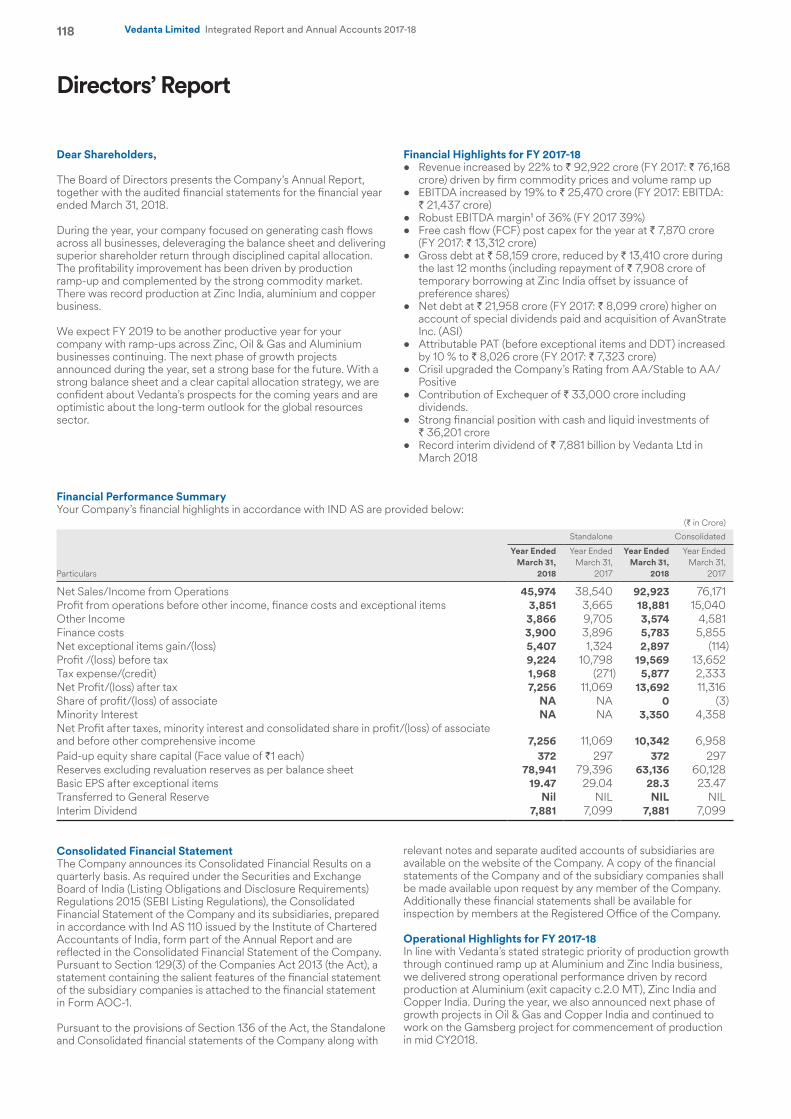
118 Vedanta Limited Integrated Report and Annual Accounts 2017-18
Directors’ Report
Dear Shareholders,
The Board of Directors presents the Company’s Annual Report, together with the audited financial statements for the financial year ended March 31, 2018.
During the year, your company focused on generating cash flows across all businesses, deleveraging the balance sheet and delivering superior shareholder return through disciplined capital allocation. The profitability improvement has been driven by production ramp-up and complemented by the strong commodity market. There was record production at Zinc India, aluminium and copper business.
We expect FY 2019 to be another productive year for your company with ramp-ups across Zinc, Oil & Gas and Aluminium businesses continuing. The next phase of growth projects announced during the year, set a strong base for the future. With a strong balance sheet and a clear capital allocation strategy, we are confident about Vedanta’s prospects for the coming years and are optimistic about the long-term outlook for the global resources sector.
Financial Performance Summary Your Company’s financial highlights in accordance with IND AS are provided below:
(` in Crore)
Particulars
Standalone Consolidated
Year EndedMarch 31,
2018
Year EndedMarch 31,
2017
Year EndedMarch 31,
2018
Year EndedMarch 31,
2017
Net Sales/Income from Operations 45,974 38,540 92,923 76,171Profit from operations before other income, finance costs and exceptional items 3,851 3,665 18,881 15,040Other Income 3,866 9,705 3,574 4,581Finance costs 3,900 3,896 5,783 5,855Net exceptional items gain/(loss) 5,407 1,324 2,897 (114)Profit /(loss) before tax 9,224 10,798 19,569 13,652Tax expense/(credit) 1,968 (271) 5,877 2,333Net Profit/(loss) after tax 7,256 11,069 13,692 11,316Share of profit/(loss) of associate NA NA 0 (3)Minority Interest NA NA 3,350 4,358Net Profit after taxes, minority interest and consolidated share in profit/(loss) of associate and before other comprehensive income 7,256 11,069 10,342 6,958Paid-up equity share capital (Face value of `1 each) 372 297 372 297Reserves excluding revaluation reserves as per balance sheet 78,941 79,396 63,136 60,128Basic EPS after exceptional items 19.47 29.04 28.3 23.47Transferred to General Reserve Nil NIL NIL NILInterim Dividend 7,881 7,099 7,881 7,099
Financial Highlights for FY 2017-18 • Revenue increased by 22% to ` 92,922 crore (FY 2017: ` 76,168
crore) driven by firm commodity prices and volume ramp up• EBITDA increased by 19% to ` 25,470 crore (FY 2017: EBITDA:
` 21,437 crore)• Robust EBITDA margin1 of 36% (FY 2017 39%) • Free cash flow (FCF) post capex for the year at ` 7,870 crore
(FY 2017: ` 13,312 crore)• Gross debt at ` 58,159 crore, reduced by ` 13,410 crore during
the last 12 months (including repayment of ` 7,908 crore of temporary borrowing at Zinc India offset by issuance of preference shares)
• Net debt at ` 21,958 crore (FY 2017: ` 8,099 crore) higher on account of special dividends paid and acquisition of AvanStrate Inc. (ASI)
• Attributable PAT (before exceptional items and DDT) increased by 10 % to ` 8,026 crore (FY 2017: ` 7,323 crore)
• Crisil upgraded the Company’s Rating from AA/Stable to AA/Positive
• Contribution of Exchequer of ` 33,000 crore including dividends.
• Strong financial position with cash and liquid investments of ` 36,201 crore
• Record interim dividend of ` 7,881 billion by Vedanta Ltd in March 2018
Consolidated Financial Statement The Company announces its Consolidated Financial Results on a quarterly basis. As required under the Securities and Exchange Board of India (Listing Obligations and Disclosure Requirements) Regulations 2015 (SEBI Listing Regulations), the Consolidated Financial Statement of the Company and its subsidiaries, prepared in accordance with Ind AS 110 issued by the Institute of Chartered Accountants of India, form part of the Annual Report and are reflected in the Consolidated Financial Statement of the Company. Pursuant to Section 129(3) of the Companies Act 2013 (the Act), a statement containing the salient features of the financial statement of the subsidiary companies is attached to the financial statement in Form AOC-1.
Pursuant to the provisions of Section 136 of the Act, the Standalone and Consolidated financial statements of the Company along with
relevant notes and separate audited accounts of subsidiaries are available on the website of the Company. A copy of the financial statements of the Company and of the subsidiary companies shall be made available upon request by any member of the Company. Additionally these financial statements shall be available for inspection by members at the Registered Office of the Company.
Operational Highlights for FY 2017-18In line with Vedanta’s stated strategic priority of production growth through continued ramp up at Aluminium and Zinc India business, we delivered strong operational performance driven by record production at Aluminium (exit capacity c.2.0 MT), Zinc India and Copper India. During the year, we also announced next phase of growth projects in Oil & Gas and Copper India and continued to work on the Gamsberg project for commencement of production in mid CY2018.
119Integrated R
eport
Managem
ent Review
Statutory R
eports
Financial Statements
Vedanta Limited Integrated Report and Annual Accounts 2017-18
Some of the key operational highlights for FY 2018 are:• Record annual production at Zinc India and Aluminium business• Oil & Gas: Mar 18 Exit run rate of 200,000 boepd; Growth
projects on track to enable significant volume growth in FY 19• Zinc International : Gamsberg project on track with production
expected by mid CY 2018• Aluminum: Record annual production at 1.7mt; with an exit run
rate of c.2.0 mtpa• Iron Ore: Increase in company-wise mining cap allocation in
Karnataka expected in Q1 FY2019• Power: 1,980 MW Talwandi Sabo Power Plant operating at 93%
availability in Q4FY 18
Capital ExpenditureWe continue to take a disciplined approach to growth through prudent capital allocation. During the year FY 2018, we commenced the next phase of growth in our Oil & Gas business with a near term target of about 300kboepd. With positive fundamentals in place, we have also commenced the expansion of the 400kt copper smelter at Tuticorin in Southern India to 800kt. Completion of this project will place Tuticorin as one of the largest single-location copper smelting complexes in the world. Both these projects are having robust returns. The Zinc projects both at Zinc India & Zinc International are progressing well. We are geared up for commencement of production at the Gamsberg project from Mid Calendar Year 2018 (CY 2018).
During FY 2018, we have spent ` 5,306 Cr on Growth projects and it is likely to be higher around ` 9,700 Cr in FY 2019 primarily driven by higher capex at Oil & Gas.
DividendThe Board of Directors approved the payment of 1st interim dividend @2120% of INR 21.20 per equity share of ` 1 each on March 13, 2018. In view of the record interim dividend declared in March, 2018, no final dividend is recommended.
The Board of Directors further approved a Dividend @7.5% p.a. on the Redeemable Non-Convertible Preference Shares (Preference Shares) of face value ` 10/- each as per the terms of issuance. These preference shares were issued and allotted on April 28, 2017 pursuant to the Scheme of Arrangement between shareholders and creditors of Vedanta Limited and Cairn India Limited (“Scheme”) and the dividend was payable uptil the end of the Financial Year March 31, 2018.
Transfer to General Reserve The Company proposes NIL transfer to General Reserve out of its total profit of ` 7256 Crore for the financial year.
Share CapitalThe Authorised Share Capital of the Company is ` 74,12,01,00,000 divided into 44,020,100,000 (Four Thousand Four Hundred and Two Crores and One Lakh only) number of equity shares of ` 1/- (Rupee One) each and 3,010,000,000 (Three Hundred and One Crore) Preference Shares of ` 10/- (Rupees Ten) each.
Bidding under Insolvency and Bankruptcy Code 2016Under the Insolvency and Bankruptcy Code 2016, the Reserve Bank of India (RBI) mandated banks to refer their defaulting customers/ NPA accounts to National Company Law Tribunal (NCLT). The companies referred to the NCLT for initiating insolvency proceedings, included few steel companies with significant production capacity.
Whilst globally, following two decades of significant steel expansion in China, global steel capacity is high, India remains a significant exception to this. Given India’s size of economy, population and existing steel capacity it is expected that the steel sector in India will grow rapidly over the coming few years. In view of this and the synergies from its Iron ore business, your Company bid for two of
the steel assets up for auction. The companies under consideration own state of the art and technologically advanced steel plants. These acquisitions will provide your Company ready operating capacities instead of investing time and effort in a greenfield project.
On March 31, 2018, your Company was declared as the successful resolution applicant by the Committee of Creditors for Electrosteel Steels Limited (“ESL”) under the Corporate Insolvency Resolution Process of the Bankruptcy Code, and received a letter of intent from the Committee of Creditors. The Company has accepted the terms of the letter of intent and the closing of the transaction will be subject to compliance with applicable regulatory requirements and the final terms approved by the NCLT.
The Company’s other bid is for a steel asset in Gujarat, India. The auction process and evaluation of bids for this asset is on-going.
Credit Rating Your Company is rated by CRISIL Limited (CRISIL) and India Ratings and Research Private Limited (India Rating) for its banking facilities in line with Basel II norms.
During the year, CRISIL changed the outlook on Company’s long-term bank facilities and its Non-Convertible Debentures (NCDs) programme to CRISIL AA / Positive Outlook from CRISIL AA / Stable. The Company has the highest short-term rating on its working capital and Commercial Paper programme at CRISIL A1+. The agency expects that the structural improvement in cost structure along with continued focus on deleveraging shall help improve the credit profile of your Company. The agency shall be guided by extent of gross debt and structural improvements in business driving the lower leverage levels for further positive rating action.
India Ratings changed the Company’s ratings on long-term scale to IND AA / Positive from IND AA / Negative during the year and short-term rating are maintained at IND A1+. The agency is monitoring the improvement in leverage along with ramp-up of operations to upgrade the ratings while resolving the outlook.
Sustainability Your Company’s Sustainable Development is integral to the core business strategy. We continue to be a transparent and responsible corporate citizen; committed to a ‘social license to operate’ and partner with communities, local governments and academic institutions to help catalyse socio-economic development in the areas where we operate.
The Company reaffirms its Core Values of Trust, Entrepreneurship, Innovation, Excellence, Integrity, Respect and Care, which are the basis of Company’s Sustainable Development Model. The model continues to be centered on the four strategic pillars: Responsible Stewardship; Building Strong Relationships; Adding and Sharing Value; and Strategic Communications.
With the Sustainable Development model, we built the Sustainable Development framework, which is aligned to global best practices and standards, including the United Nations Global Compact’s (UNGC) 10 principles; the International Finance Corporation (IFC) performance standards; the International Council on Mining and Metals (ICMM) principles; UN Sustainable Development Goals (SDGs); and the Organisation for Economic Cooperation and Development (OECD) promoted Multinational Guidelines.
This robust framework provides the business and the leadership teams the parameters on which to assess, monitor, review key sustainability priorities, such as safety, health, environment, stakeholder engagement and community development activities, as per the Company’s approach on ‘social license to operate’.
120 Vedanta Limited Integrated Report and Annual Accounts 2017-18
The Vedanta Sustainability Assurance Programme (VSAP) has been the bedrock in promoting transparency and compliance of all our businesses with the Group’s Sustainable Development Framework. In continuation with last year, the big focus areas have been on implementation of six key safety performance standards across the Group; VSAP process has categorically focused on compliance level to these standards and highlighted areas of improvement.
During the year, we focused heavily on safety performance of your businesses under the overarching umbrella of Health, Safety and Environment (HSE) best practices. Community engagement and development programmes were geared with emphasis on need assessments and longevity of the project and related outcomes/benefits.
Our resolve is strong and we continue to work towards achieving zero harm.
Vedanta’s teams across businesses are driving various capacity-building and behavioural programmes. Our awareness campaigns aim to entrench a culture of safety and risk awareness. Training programmes on ‘Making Better Risk decisions’ is one such programme rolled out across the businesses to improve safety decision making of leaders at all levels, particularly those on the front line. Similarly, ‘Experience Based Quantification’ (EBQ) using Bow Tie Risk Assessment methodologies were utilised to identify critical risks from safety and environmental perspective for key businesses. In FY 2017-18, over 874,296 hours of safety training were delivered to employees and contractors.
After an encouraging COP21 conference in Paris, which resulted in more than 174 countries ratify the agreement, the global climate agenda continues to push ahead, despite the United States withdrawing from the agreement. India, which had set ambitious targets of reducing its carbon intensity by 33-35% by 2030 and to source 40% of its electric power from non-fossil fuel based sources, continues to move forward to meet those targets.
Our Company remains committed to decreasing its carbon footprint. Last year we stated our expectation to reduce our GHG intensity by 16% from a 2012 baseline by 2020. This expectation emerged from the Carbon Forum that was constituted to develop our carbon strategy and provide governance on the risk to business from climate change.
Our businesses have made significant progress on our GHG reduction commitment. Hindustan Zinc Limited and Oil & Gas business have committed to increase their investment in solar power, while other businesses have made significant improvements in their process efficiencies, thereby reducing their GHG intensity emissions. As of March 31, 2018, we had been able to achieve about 14% reduction in our GHG intensity from our baseline number. We are confident of achieving our target by 2020.
We are also committed to develop an internal carbon price mechanism to manage our climate related financial risk. We believe that climate resilience is the best approach we can take to safe-guard our climate related business risks and we are committed to work with all our stakeholders in achieving this goal.
We ensure that our Biodiversity Management Plans are in place, and our environmental footprint follows the most rigorous global standards. We have developed specific objectives and targets, particularly with regards to water and energy management.
Finding innovative ways to reduce waste is a priority for us. We remain committed to our agenda of “Zero Harm, Zero Waste, Zero Discharge”. This year we are able to recycle more than 90% of the fly ash that was generated at our power plants. Large volumes of our high-calorific hazardous wastes are also sent to the cement industry to be used as clinker fuel, thereby preventing them from
being sent to secure landfills. This year, we have recycled 83% of our overall High Volume and Low Effect waste in sustainable applications and are continuing to develop new and innovative ways to increase the proportion of waste we recycle.
We are present in some of the world’s most unique, remote and underdeveloped regions. We are committed to respect, learn from and create a shared understanding with our communities. Connecting with our communities is not just the right thing to do; it is a fundamental imperative of our ‘license to operate’.
Our spend on our social investment and CSR programmes thereby reaffirm our commitment to ensuring the well-being of the communities who live in proximity to our operations.
Periodic meetings with Socially Responsible Investors (SRI) and lenders were undertaken and an update was provided in the Group Sustainability Committee meeting.
This year, we encountered strong opposition from the local community to our plant in Tuticorin. We are working with the communities as well as the regulatory bodies to arrive at a solution to the questions raised. We are committed to responsibly run our operations.
We remain positive that our overall sustainability journey is headed in the right direction. Our sustainability framework is robust and in line with global practices on engaging with civil society, communicating performance on community development, human rights as well as addressing legacy issues. We are confident that it will help us achieve higher levels of performance in the years to come.
A separate detailed report on Company’s Sustainability Development also forms part of the Annual Report.
Digitalization & TechnologyThe technology landscape is continuously changing at a rapid pace. This dynamic change creates an opportunity to adopt and develop competitive advantage. Adapting cutting edge technology to create incremental value is in Company’s DNA. The agility to inculcate technology as part of business has been demonstrated over the years in each sphere of business.
In the current environment, Company recognises the need to develop a comprehensive digital strategy and drive transformational change across the organisation that instils digital expertise in all facets of the business and creates value proposition for all its stakeholders.
In order to manage the complex digital transformations across business units, the Company has taken on board resources for the position of ‘Chief Digital Officer’ (CDO) in each of its key business unit. These resources have brought global expertise in digital transformation initiatives. This position is an integral part of the Business Executive Committee. These positions are part of the top thought leadership and shall have the critical responsibility for developing and implementing Company’s digital strategy.
Your Company is committed to adopt digital technology in the organization to make data driven decisions, to generate efficiencies, improve planning, lower risk, create safer working environments while unlocking more value from the resources.
The Company is also institutionalizing ‘new ways of working’ through these digital-led business transformation programmes including:• Adopting agile approaches accelerating time to business value;• Taking a more persona-centric and design-thinking led approach
on new digital business solutions design;• Driving a Minimum Viable Product (MVP) based approach in
progressively industrializing digital business solutions;
Directors’ Report continued
121Integrated R
eport
Managem
ent Review
Statutory R
eports
Financial Statements
Vedanta Limited Integrated Report and Annual Accounts 2017-18
• Re-skilling and cross-skilling teams for new age technologies and skills.
A series of measures have been put in place to drive the digital transformation across business units. Some of these key initiatives include:• Use of Drones for Pipeline monitoring & Mining Stockpile
Measurement;• Digitalization of underground mining operations at HZL (SKM &
RAUG);• Integrated Operations thru Connected Assets at Oil & Gas; • Big Data Analytics & Decision Support for Predictive
Maintenance at Oil & Gas;• Asset Optimization using Predictive Maintenance at Sterlite
Copper;• Smart Ore Digitalization Project at Gamsberg in Zinc
International;• Integrated Mine Operations Management System at Iron Ore;• Asset Optimization using Machine Learning at Iron Ore;• Coal Supply Chain Digitalization at Aluminium business,
Jharsuguda.
The focus for FY2019 shall be scale up the transformation efforts and reap the benefits of technology adaption.
Corporate Social Responsibility Your Company works towards a larger goal of creating enduring value for the communities it works in. Towards that end, we undertake various need based community programmes as part of our Corporate Social Responsibility (CSR). Putting the last as first being the top most priority, the Company has committed to align its CSR activities to the evolving and dynamic priorities of Nation and State besides local needs.
For almost all our programmes, a bottom up community engagement approach is a non-negotiable. This collaborative approach ensures community ownership, suitable project design, effective delivery and post-project sustainability. Apart from communities, we also strongly believe in partnering with government agencies, development organizations, corporates, civil society organisations & community based organizations to carry our durable and meaningful initiatives.
All our CSR programmes are governed by the Vedanta CSR Policy, the Technical Standard 19, and each entity specific Standard Operating Procedures for CSR. The documents are periodically revised. Further, in order to benefit from diverse perspectives, and in keeping with a culture of collective leadership, Vedanta has formed a CSR Council. The council comprises of business leaders and CSR executives from the different Business Units. The Council is responsible for governance, synergy and cross-learning across the Group CSR efforts. It meets every month and reviews the performance, spends and outcome of CSR programmes for all Business Units. The council is instrumental in implementing improvement projects to create a seamless enabling eco-system for Business Units to carry out best-in-class community development programmes.
We have a CSR Committee comprising majority of Independent Directors. The Committee provides strategic direction for CSR activities, and approves its plans and budgets. It also reviews the programmes and guides the CSR Teams towards running well-governed and impactful community programmes.
Brief Overview on Community Development Programmes for 2017-18 is as under:
1. Nand Ghar and Children’s Well-being Projects – The Nand Ghar Project is the company’s flagship national initiative, which aims to build new-age Anganwadis for ensuring the health and learning of young children in rural areas, and also as a platform for women’s empowerment and skilling. The Project ultimately
aims to impact 85 million children and 20 million women across 1.37 million Anganwadis in the country. As on date, 101 Greenfield and 53 Brownfield Nand Ghars are operational across – states of the country. Construction is on-going at another 72 Greenfield and 200 Brownfield Nand Ghars.
Khushi is a Hindustan Zinc initiative, focusing on strengthening the functioning of the Integrated Child Development Services (ICDS) programme in 3089 Anganwadi centres of 5 Districts of Rajasthan. The programme is the largest such Public–Private–People initiative in the ICDS space covering 64,000 children in the age group of 3-6 years and aims to improve children’s attendance, retention, learning levels, health status and community engagement. Children’s attendance at these centres has gone up from 44% last year to 59% this year. A unique Anganwadi Grading Tool was developed and used to rate each one of the 3089 Anganwadis. 25,000 community meetings were held during the year, and community contributions equivalent to INR 5.43 million were mobilized.
2. Women’s empowerment – Vedanta is endeavouring to provide equal opportunities to women through multiple initiatives. Subhalaxmi Cooperative Society at Jharsuguda is one such flagship initiative of Vedanta Limited, Jharsuguda. Subhalaxmi, which started in 2008 with 10 women, has now emerged as one of the largest women’s cooperative in western Odisha with 3324 members and 280 Self Help Groups across 64 villages of 3 blocks of Jharsuguda. It started with INR 1000 as working capital and today it has accumulated corpus fund of more than INR 22 million with an average net profit of INR 6-7 lacs/annum. Loans of around INR 49.2 million were provided to women entrepreneurs for setting up their own micro enterprises in FY’18. Subhalaxmi now has a special fund called “UDYAMI FUND (Start-up Fund)” to support emerging & aspiring micro-entrepreneurs in Jharsuguda.
On similar lines, the Sakhi programme at HZL now has 1299 SHGs (Self-help groups) reaching to nearly 16,620 women. During the year, 9397 women took loans amounting to INR 79 million. The main purposes for which the loans were taken were household consumption, agriculture, health & sanitation, animal husbandry, including 280 women who used the loans to become entrepreneurs (either by setting up new or expanding existing enterprises).
3. Health Care – Health is another critical area of engagement for us, and we work to bring affordable healthcare within reach of our communities. Aarogya, a healthcare Initiative of the Company at Lanjigarh, is a commitment to improve the health status of less privileged community in Kalahandi region. Vedanta Hospital is a 20 bedded state of art medical facility well-equipped with doctors, physiotherapist and visiting specialists providing 24X7 ambulance service for referrals with a daily footfall of more than 150 patients. The hospital services are recognized for sickle cell detection, Rashtriya Bima Suraksha Yojana, Institutional delivery under Janani Suraksha Yojana, Cleft & Palate Surgery and Antenatal check-up under Pradhan Mantri Surakshit Matrutwa Abhiyan.
VMRF Vedanta Medical Research Foundation (VMRF), a voluntary,
non-profit organisation, has been initiated by Bharat Aluminium Company Limited, subsidiary company (BALCO), to contribute to the prevention, control and eradication of cancer and its related illnesses. VMRF’s first flagship initiative has been the establishment of ‘Balco Medical Centre’ - a 170-bed, state-of-the-art tertiary care oncology facility in Naya Raipur, in close proximity of our Aluminium plants at Korba, Lanjigarh and Jharsuguda. The proposed hospital envisages bringing modern, comprehensive and high quality medical care within the reach of the population of Central India in general and Chhattisgarh in particular.
122 Vedanta Limited Integrated Report and Annual Accounts 2017-18
Hospital at Kalahandi With a commitment of ‘Giving back to Society’, Vedanta Limited
has signed a Memorandum of Understanding (MoU) with Government of Odisha to establish a 500 bed hospital for Government Medical College at Bhawanipatna with an investment of ` 100 crores. The MoU was signed on March 27, 2018 at Odisha State Secretariat. The Hon’ble Chief Minister of Odisha congratulated Vedanta for coming forward to set up the hospital for Medical College and partner the Government in crucial areas of development for the people of Kalahandi.
4. Agriculture and Animal Husbandry – Given that most of our neighbourhood communities still depend on agriculture and animal husbandry, we follow a livelihood development approach of integrating agriculture, dairy, water management, technology, farmer’s organizations and market outreach. Project Unnati, a Cairn CSR initiative, was set up to support the farmers of Barmer in enhancing their incomes through sustainable farming. As part of a MoU with Central Arid Zone Research Institute (CAZRI), Jodhpur – a unit of Indian Council for Agriculture Research (ICAR), 700 framers were trained in high tech farming techniques. This was supported by the installation of drips for 60,000 horticulture plants in 120 acres. As a result, this year, the farmers in Barmer have harvested over 60 tonnes of Ber, Gunda, and Anar.
5. Skilling the youth – Skill development is the need of the hour, and can have a huge impact on creating livelihoods opportunities for millions of families. Our aim is to channelize the untapped potential of youth and help them become employable in the growing economy. Vedanta IL&FS Institute of Skills at BALCO, Korba imparts ‘hands-on’ training to youth in five different trades – Industrial Stitching, Fitter Fabrication, Welding Assistant, Electrician and Hospitality. The Institute has provided assured placements to more than 6,700 students since operationalisation. Sterlite Copper’s Tamira Muthukkal project has provided skills training and employability to some 2,000 youth from the Thoothukudi district since its inception.
6. Environment protection & restoration – We understand the interdependency between our operations and the natural environment. As a natural resource company, our prime focus is on protecting and restoring nature. At Talwandi Sabo Power Limited, wholly owned subsidiary (TSPL), Mansa, Punjab, individual household level soak pits were constructed in partnership with MGNREGA and Gram Panchayat in 2 villages. Looking to the success of the project, Department of Rural Development, Punjab directed all 22 districts to replicate the same model on a pilot basis.
7. Sports & Culture – Sports and culture have the ability to attract and mobilize youth as well as foster stronger community bonding. Sesa Football Academy (SFA), an Iron Ore Business’s CSR initiative, was established in 1999 on a reclaimed mine at Sanquelim with a vision to become a premier academy in India. Until now, the Academy at Sanquelim has passed out 123 boys, some of whom have represented India internationally and many are pursuing their football career with major clubs. Seven alumni of SFA have played for the Indian national team and 8 are playing in the elite Indian Super League 2017-18 seasons. Taking forward the commitment and passion to nurture girl child through sports, SFA launched the ‘Vedanta Women’s Football League’ on November 6, 2017 with the support of Goa Football Association (GFA). Vedanta created history through this first of its kind league by providing women footballers a prominent platform to showcase their talent and skills. 137 women footballers hailing from all over Goa participated in this league through 6 teams and made it a grand success.
8. Community Infrastructure – While human development is the key, but infrastructure also plays an important role. Developing and maintaining social infrastructure are critical for rural
development and over all nation building. Company is supporting operational villages in developing basic infrastructure in villages, such as school toilets, drinking water projects, sports infra, local drains, community centres etc. as per local needs.
During the year, the Company’s divisions spent INR 45.19 Crore on CSR activities, while on a consolidated basis it spent about INR 244.33 Crore on CSR.
A brief overview of CSR initiatives forms part of this Directors Report and is annexed hereto as Annexure A’.
Your Company’s CSR Policy addresses the Company’s commitment to conduct its business in a socially responsible, ethical and environmentally friendly manner; and to continuously work towards improving the quality of life of the communities in the areas where it operates.
The policy may be viewed here: http://www.vedantalimited.com/media/85867/csr_policy_final.pdf
Business Responsibility Report A detailed Business Responsibility Report in terms of the provisions of Regulation 34 of the SEBI Listing Regulations is available as a separate section in this annual report.
Human Resources (HR) Human resources play a significant role in your Company’s growth strategy. Your Company emphasised on talent nurturing, retention and engaging in a constructive relationship with employees with a focus on productivity and efficiency and underlining safe working practices. The significant focus areas during the year comprised the following:
V – Perform:One Performance System for One VedantaV-Perform is a pan-Vedanta initiative to standardize the Performance Management System (PMS) system and process across all Vedanta Group companies by leveraging technology. This would enable the functions, teams and individuals in tracking performance, generating analytics and taking proactive decisions towards achieving Company’s overall business plan and targets. The online V-perform portal delivers a consistent user experience for all ~12k professionals across Vedanta, starting from goal setting to the quarterly / mid-year appraisal and finally the year-end assessment. In addition to this, the portal facilitates open dialogue and feedback discussion between the managers and the team members to ensure transparency and efficiency in all PMS related activities.
As a next step toward enhancing our Safety performance at workplace and achieving our ultimate vision of “Zero Harm”, Safety Competency Assessment process was initiated as part of V-Perform to strengthen our existing Safety Management System by means of training, skills, experience and knowledge that an employee’s possess and their ability to apply them to perform a task safely which will enable to mitigate the risk and ensure that employees are well organized and safe all the time at Workplace.
Leadership Development and Talent ManagementInternal Growth Workshops: Vedanta has always aspired to design an organization which is led by our “Leaders from Within”. Identifying internal talent and elevating them to enhanced leadership roles has been the driving factor in our journey of rapid growth. In line with this philosophy, the Group conducts ‘Chairman’s Internal Growth Workshops’ through which we have identified 500+ high potential New Leaders till date across various functions in the Group’s businesses who have taken up significantly elevated roles and responsibilities. Meeting Growth Aspirations of the employees and ensuring Internal Mobility of High Quality Talent has been the highlight of this endeavor. The New Leaders have been empowered through various key strategic initiatives across
Directors’ Report continued
123Integrated R
eport
Managem
ent Review
Statutory R
eports
Financial Statements
Vedanta Limited Integrated Report and Annual Accounts 2017-18
the Group and regular feedback sessions which have ensured they are in the right track of being the “Leaders of Tomorrow”. Our Internal Growth Workshops have also enabled us to reduce our lateral hiring significantly for critical roles across the Group in past two years.
‘V Connect’ Initiative: The V – Connect programme was launched across Vedanta Group as one of a kind anchoring/ mentoring programme covering all 12,000 professionals with regular talent stories and anchoring conversations across all the businesses. It was launched in association with AON and the key output from this initiative has been to derive enhanced engagement levels from the employees. This initiative has also ensured transparent communication of organizational growth vision and key priorities in our roadmap for being the best in class employer in the industry. To facilitate smooth functioning of the programme, a specialized app – “Aon Lead” was introduced. The App allows participants to schedule their connects; get latest business updates from around the globe; access to articles and videos that focus on effective leadership, skill-building; and participate in quizzes/learning challenges. Till date, more than 5000 conversations have been completed for the employees across Vedanta.
Right Management in Place (RMIP) - Strategic HiringIn our endeavour to strengthen management teams across business, realigning the organisation structure and bridging the critical gaps in each of the business, we initiated recruitment drive along with the business for various leadership positions including Expats / Specialist Positions. Hiring for these positions was initiated with focus on recruitment from best practices companies / diversity.
During the year, we focused on building and strengthening HSE function and technical capability in the organization. We hired around 28 technical experts across businesses which include 10 global HSE experts to head the HSE function at each of our businesses in India and Africa and these individuals bring onboard rich and diverse experience from their past global organizations like BHP, Rio Tinto, BP, Sheel, Chevron, GE, DuPont, Alcoa, Anglo etc.
Global Internship Programme (GIP)The Programme was introduced in FY 2016-17 with the aim to hire bright students from premier global university. Vedanta attracts first year MBA students from premier B-schools with the aim to create lasting business value by bringing on board world class talent. The B-Schools include Harvard, Wharton, INSEAD & London Business School among the international campuses and the top three IIM’s- Ahmedabad, Bangalore & Calcutta among the national campuses.
The interns work with top management, especially the C-suite on real-time projects impacting business directly. They work in a fast-paced dynamic team environment, and finish the internship having gained broad experience in various aspects of the natural resources industry.
The programme would help us in the following ways:1. The Young Talent will bring in fresh insights and global benchmark
practices to our business.2. Add value by driving projects which leverage their analytical skills. 3. This Young Talent can potentially become Brand Ambassadors
for Vedanta globally and help in building our Employer Brand. Approximately 39 students have been a part of the programme:
Last year we also launched a similar programme for full time hires VLDP- Vedanta Leadership Development Programme. In VLDP our focus is to hire full time employees from the top management and technology institutes which include IIM Ahmedabad, Bangalore, Calcutta and IIT Bombay, Kharagpur, Madras. The aim of VLDP is to build organizational capability for the future by bringing on board best-in-class young talent from premier institutes and developing them to be the future Leaders of Vedanta by providing them with the right induction, roles, opportunities, job rotations and anchoring.
During the first year 19 students joined and in the second year 28 students will be joining us for the programme.
“Vedanta’s unprecedented growth over the years is owing to its entrepreneurial culture and strong focus on continuous benchmarking and innovation. As part of this continuous improvement journey, Manpower Analytics forms an integral piece in the strategic decision making to embark on the next level of growth. The recent study conducted by a reputed firm on Manpower Analytics brought out some interesting facts – • Vedanta believes in growth from within and giving enhanced
roles to the High potential employees within the organization thereby maintaining the Value Systems and Culture fabric intact. The Pay for performance Culture emerged clearly during the study as the Mid Layer in the organizational pyramid came out to be higher than benchmark owing to early career growth and higher responsibilities at relatively younger experience level.
• Although Executive Diversity at Vedanta is one of the leading in the industry, the company has taken stringent targets to further bridge the gap and move upto 33% at Board & 20% at the professional employee population level. When looked at providing avenues for growth and higher compensation, the study also showcased that Vedanta is an equal opportunity employer.
• The Benchmarking exercise of comparing to the Global Best in the industry we operate in highlighted improvement Potential in Manpower Productivity.
During the year, Company has received recognitions at Forums like CII, Golden Peacock, Ek Kaam Desh Ke Naam (NGO) in fields of HR excellence, HR Tech and HR Innovation. The Company is committed to provide equal opportunities to all its employees, irrespective of gender, nationality and background.
Your Company’s, Jharsuguda unit has received special recognition towards their Commitment to Engagement. Aon Hewitt has acknowledged the efforts your organization is putting in, to be an Employer of Choice and its continued efforts on your journey towards being a Best Employer.
Employee Information and Related DisclosuresThe statement of Disclosure of Remuneration under Section 197 of the Act and Rule 5(1) of the Companies (Appointment and Remuneration of Managerial Personnel) Rules, 2014 (“Rules”) is appended as Annexure B to the Report.
The information, as per Rule 5(2) of the Rules, forms part of this Report. However, as per provision of Section 136 of the Act and Rule 5(2), the Report and the Financial Statements are being sent to the Members of the Company excluding the statement of particulars of employees under Rule 5(2) of the Rules. The statement shall be available for inspection at the Company’s Registered Office and any Member interested in obtaining a copy of the said statement may write to the Company Secretary.
Employees Stock Option PlanIn order to motivate, incentivize and reward employees, your Company introduced ‘Vedanta Limited Employee Stock Option Scheme 2016’ (“the Scheme”) to provide equity based incentives to the permanent employees of the Company including holding/subsidiary companies. The Scheme is a conditional share plan for rewarding performance on pre-determined performance criteria and continued employment with the Company. The pre-determined performance criteria shall focus on rewarding employees for Company performance vis a vis competition and also for achievement of internal operational metrics. The Scheme is currently administered through Vedanta Limited ESOS Trust (ESOS Trust) which is authorized by the Shareholders to acquire the Company’s shares from secondary market from time to time, for implementation of the Scheme.

124 Vedanta Limited Integrated Report and Annual Accounts 2017-18
The Company’s shareholders by way of postal ballot on December 12, 2016 have approved the Scheme.
During the year under review 10,088,960 options were granted to 2806 employees including Whole Time Director and Key Managerial Personnel.
Pursuant to the provisions of SEBI (Share Based Employee Benefits), Regulations, 2014 (“Employee Benefits Regulations”), disclosure with respect to the ESOS Scheme of the Company as on March 31, 2018 is annexed as Annexure C to this report and has also been uploaded on the Company’s website at www.Vedantalimited.com.
The stock option Scheme is in compliance with Employee Benefits Regulations and there have been no material changes to the plan during the financial year.
A certificate from M/s S.R. Batliboi & Co. LLP, Chartered Accountants, Statutory Auditors, with respect to the implementation of the Company’s ESOS schemes, would be placed before the shareholders at the ensuing AGM. A copy of the same will also be available for inspection at the Company’s Registered Office.
Vigil Mechanism The Company has in place a robust vigil mechanism for reporting genuine concerns through the Company’s Whistle Blower Policy. As per the Policy adopted by various businesses in the Group, all complaints are reported to the Director – Management Assurance, who is independent of operating management and the businesses. In line with global practices, dedicated email IDs, a centralised database, a 24X7 whistle blower hotline and a web-based portal have been created to facilitate receipt of complaints. All employees and stakeholders can register their integrity related concerns either by calling the toll free number or by writing on the web-based portal which is managed by an independent third party. The hotline provides multiple local language options. All cases reported as part of whistle blower mechanism are taken to their logical conclusion within a reasonable timeframe. After the investigation, established cases are brought to the Group Ethics Committee for decision-making. All Whistle Blower cases are periodically presented and reported to the Company’s Audit Committee. The details of this process are also provided in the Corporate Governance Report and the Whistle Blower Policy is posted on the Company’s website.
Prevention of Sexual Harassment at WorkplaceThe Company has zero tolerance for sexual harassment at workplace and has adopted a Policy on prevention, prohibition and redressal of sexual harassment at workplace in line with the provisions of the Sexual Harassment of Women at Workplace (Prevention, Prohibition and Redressal) Act, 2013 and the Rules thereunder for prevention and redressal of complaints of sexual harassment at workplace.
As part of Vedanta Group, your Company is an equal opportunity employer and believes in providing opportunity and key positions to women professionals. The Group has endeavoured to encourage women professionals by creating proper policies to tackle issues relating to safe and proper working conditions, and create and maintain a healthy and conducive work environment that is free from discrimination. This includes discrimination on any basis, including gender, as well as any form of sexual harassment. During the period under review, 11 complaints were received and resolved. Seven employees were separated on account of complaints. Your Company has constituted Internal Complaints Committee (ICC) for various business divisions and offices, as per the requirements of the Sexual Harassment of Women at Workplace (Prevention, Prohibition and Redressal) Act, 2013.
Corporate Governance ReportThe Company is committed to maintain the highest standards of Corporate Governance and adhere to the Corporate Governance
requirements set out by the SEBI. The Company has also implemented several best Corporate Governance practices as prevalent globally. The report on Corporate Governance as stipulated under the SEBI Listing Regulations forms an integral part of this Report
The requisite certificate from the Auditors of the Company confirming compliance with the conditions of Corporate Governance is attached to the report on Corporate Governance.
Internal Financial Controls Your Board has devised systems, policies and procedures / frameworks, which are currently operational within your Company for ensuring the orderly and efficient conduct of its business, which includes adherence to policies, safeguarding its assets, prevention and detection of frauds and errors, accuracy and completeness of the accounting records and timely preparation of reliable financial information. In line with best practices, the Audit Committee and the Board reviews these internal control systems to ensure they remain effective and are achieving their intended purpose. Where weaknesses, if any, are identified as a result of the reviews, new procedures are put in place to strengthen controls. These controls are in turn reviewed at regular intervals.
The systems/frameworks include proper delegation of authority, operating philosophies, policies and procedures, effective IT systems aligned to business requirements, an internal audit framework, an ethics framework, a risk management framework and adequate segregation of duties to ensure an acceptable level of risk. Documented controls are in place for business processes and IT general controls. Key controls are tested by entities to assure that these are operating effectively. Besides, the Company has also adopted an SAP GRC (Governance, Risk and Compliance) framework to strengthen the internal control and segregation of duties/access. It also follows a half-yearly process of management certification through the Control Self-Assessment framework, which includes financial controls/exposures.
The Company has documented Standard Operating Procedures (SOP) for procurement, project / expansion management capital expenditure, human resources, sales and marketing, finance, treasury, compliance, safety, health, and environment (SHE), and manufacturing.
The Group’s internal audit activity is managed through the Management Assurance Services (‘MAS’) function. It is an important element of the overall process by which the Audit Committee and the Board obtains the assurance on the effectiveness of relevant internal controls.
The scope of work, authority, and resources of MAS are regularly reviewed by the Audit Committee. Besides, its work is supported by the services of leading international accountancy firms.
The Company’s system of internal audit includes: covering monthly physical verification of inventory, a monthly review of accounts and a quarterly review of critical business processes. To enhance internal controls, the internal audit follows a stringent grading mechanism, focusing on the implementation of recommendations of internal auditors. The internal auditors make periodic presentations on audit observations, including the status of follow-up to the Audit Committee.
The Company is also required to comply with the Sarbanes Oxley Act Sec 404, which pertains to Internal Controls over Financial Reporting (ICOFR). Through the SOX 404 compliance programme, which is aligned to the COSO framework, the Audit Committee and the Board also gains assurance from the management on the adequacy and effectiveness of ICOFR.
In addition, as part of their role, the Board and its Committees routinely monitor the Group’s material business risks. Due to the
Directors’ Report continued
125Integrated R
eport
Managem
ent Review
Statutory R
eports
Financial Statements
Vedanta Limited Integrated Report and Annual Accounts 2017-18
limitations inherent in any risk management system, the process for identifying, evaluating, and managing the material business risks is designed to manage, rather than eliminate risk. Besides it created to provide reasonable, but not absolute assurance against material misstatement or loss.
Since the Company has strong internal control systems which are further strengthened by periodic reviews as required under the SEBI Listing Regulations and SOX compliance by the Statutory Auditors, the CEO and CFO recommend to the Board continued strong internal financial controls.
Based on the information provided, nothing has come to the attention of the Directors to indicate that any material breakdown in the function of these controls, procedures or systems occurred during the year under review. There have been no significant changes in the Company’s internal financial controls during the year that have materially affected, or are reasonably likely to materially affect its internal financial controls.
There are inherent limitations to the effectiveness of any system of disclosure controls and procedures, including the possibility of human error and the circumvention or overriding of the controls and procedures. Accordingly, even effective disclosure controls and procedures can only provide reasonable assurance of achieving their objectives. Moreover, in the design and evaluation of the Company’s disclosure controls and procedures, the management was required to apply its judgment in evaluating the cost-benefit relationship of possible controls and procedures.
Further, the Audit Committee annually evaluates the internal financial controls for ensuring that the Company has implemented robust systems/ framework of internal financial controls viz. the policies and procedures adopted by the company for ensuring the orderly and efficient conduct of its business, including adherence to companys policies, the safeguarding of its assets, the prevention and detection of frauds and errors, the accuracy and completeness of the accounting records, and the timely preparation of reliable financial information.
Risk Management Your businesses are exposed to a variety of risks, which are inherent to a global mining and resources organisation. The effective management of risk is critical to support the delivery of the Group’s strategic objectives. Risk management is embedded in the organization’s processes and the risk framework helps the organisation meet its objectives by aligning operating controls with the mission and vision of the Group set by the Board.
As part of our governance philosophy, the Board has a Risk Management Committee to ensure a robust risk management system. The details of Committee and its terms of reference are set out in the Corporate Governance Report, which is part of the Board’s Report and is available as a separate section in this Annual Report.
Our risk-management framework is designed to be simple, consistent and clear for managing and reporting risks from the Group’s businesses to the Board. Our management systems, organisational structures, processes, standards and code of conduct together form the system of internal controls that govern how we conduct business and manage associated risks. We have a multi-layered risk management framework to effectively mitigate the various risks, which our businesses are exposed to in the course of their operations.
The Risk Management Committee supports the Audit Committee and the Board in developing the group-wide risk-management framework. Risks are identified through a consistently applied methodology. The Company has put in place a mechanism to identify, assess, monitor and mitigate various risks to key business objectives.
Major risks identified by businesses and functions are systematically addressed through mitigating actions. Risk officers have also been formally nominated at operating businesses, as well as at Group level, to develop the risk-management culture within the businesses.
For a detailed risk analysis, you may like to refer to the risk section in the Management Discussion Analysis Report which forms part of this Annual Report.
Management Discussion and Analysis A detailed report on the Management Discussion and Analysis in terms of the provisions of Regulation 34 of the SEBI Listing Regulations is provided as a separate chapter in this Annual Report.
Significant & Material Orders passed by the Regulators or Courts or TribunalsProvided below are the significant and material orders which have been passed by any regulators or courts or tribunals against the Company impacting the going concern status and Company’s operations in future:
1. Iron-Ore Division – Goa OperationsSupreme Court in the Goa Mining matter in 2014 declared that the deemed mining leases of the lessees in Goa expired on 22.11.1987 and the maximum of 20 years renewal period of the deemed mining leases in Goa under the MMDR Act had also expired on 22.11.2007 and directed state to grant fresh mining leases.
Thereafter, various mining leases were renewed by the state government before and on the date the MMDR Amendment Ordinance 2015 came into effect (i.e. January 12, 2015).
These renewal of mining leases were challenged before the SC by Goa Foundation and others in 2015 as being arbitrary and against the judgment of the SC in the earlier Goa mining matter. The Supreme Court passed the judgment in the matters on February 7, 2018 wherein it set aside the second renewal of the mining leases granted by the State of Goa. The court directed all lease holders operating under a second renewal to stop all mining operations with effect from March 16, 2018 until fresh mining leases (not fresh renewals or other renewals) in accordance with the provisions of the MMDR Act, 1957 and fresh environmental clearances are granted. For further course of action we are in the process of evaluation and are awaiting clarity from the government.
2. Copper DivisionCopper division of Vedanta Limited has received an order from Tamil Nadu Pollution Control Board on 09.04.2018 whereby they have rejected the Company’s application for renewal of Consent to Operate (CTO) for the 400,000 Metric Tonnes Per Annum(MTPA) Copper Smelter plant in Tuticorin. In furtherance to the order of TNPCB rejecting the Company’s application, the Company decided to shut its Copper smelting operations at Tuticorin and has filed an appeal with TNPCB Appellate authority against the order. During the pendency of the appeal the TNPCB vide its order dated May 23, 2018 ordered disconnection of electricity supply and closure of the Company’s Copper Smelter plant. Post this the Govt of Tamil Nadu on May 28, 2018 ordered the permanent closure of the plant. The Company is taking all the necessary steps to restart its operations in Tuticorin.
In a separate proceeding, the Madurai Bench of the Madras High Court in a PIL filed against the company, has stated that the application for renewal for Environmental Clearance for Copper Smelter Plant 2 project, shall be processed after conduct of mandatory public hearing and the application shall be decided by the competent authority on or before September 23, 2018. In the interim, High Court ordered the company to cease construction and all other activities onsite for the proposed project. The company is taking all necessary steps to restart the project.
126 Vedanta Limited Integrated Report and Annual Accounts 2017-18
Board of DirectorsAppointment(s)The Board on the recommendation of the Nomination & Remuneration Committee (NRC) at its meeting held on March 13, 2018, approved the appointment of Mr. UK Sinha (DIN: 00010336), as an Additional Non Executive Independent Director w.e.f. March 13, 2018 to August 10, 2021. The appointment is subject to the approval of the Members at the ensuing Annual General Meeting (AGM).
Mr. Sinha has served as the Chairman of SEBI from February 2011 to March 2017. He was instrumental in bringing about key capital market reforms. Under his leadership, SEBI introduced significant regulatory amendments to the various acts enhancing corporate governance and disclosure norms.
Mr. K. Venkataramanan and Mr. Aman Mehta were appointed as Independent Non Executive Directors w.e.f April 01, 2017 and May 17, 2017 respectively and Ms. Priya Agarwal was appointed as a Non Executive Director w.e.f. May 17, 2017. The said appointments were confirmed by the Members at the 52nd AGM on July 14, 2017.
Mr. Kuldip Kumar Kaura was appointed as an Interim CEO of the Company w.e.f September 01, 2017. In his over four decades of experience across engineering and mining roles, Mr. Kaura has served at senior levels in various reputable companies, including Vedanta Resources Plc as Chief Executive Officer, Managing Director at ABB, India and Managing Director and Chief Executive Officer of a cement major in India, ACC Limited (LafargeHolcim).
Re-appointment(s)In accordance with the provisions of Act and the Articles of Association of the Company, Mr. GR Arun Kumar (DIN:01874769), Whole Time Director & CFO, is retiring by rotation and has offered himself for re-appointment.
Further, on the recommendation of the Nomination & Remuneration and based on the performance evaluation, the Board through circular resolution dated January 20, 2018 reappointed Mr. Ravi Kant & Ms. Lalita D Gupte as Independent Directors for a second and final term from January 29, 2018 till August 10, 2021. The reappointment is subject to the shareholder’s approval at the forthcoming AGM.
The Board on the recommendation of the NRC reappointed Mr. Tarun Jain as the Company’s Whole Time Director for a further period from April 01, 2018 till March 31, 2019. The appointment is subject to the shareholder’s approval.
Brief profiles of Mr. UK Sinha, Mr. Ravi Kant, Ms. Lalita D Gupte, Mr. Tarun Jain and Mr. GR Arun Kumar along with the disclosures required pursuant to SEBI Listing Regulations and the Act are given in the Notice of the AGM.
Attention of the Members is invited to the relevant items in the Notice of the AGM and the Explanatory Statement thereto.
All Independent Directors have provided declarations that they meet the criteria of independence as laid out under Section 149(6) of Act and the SEBI Listing Regulations.
Cessation(s)We express our profound grief and sorrow over the sad demise of Mr. Naresh Chandra on July 09, 2017 who served as an Independent Director of your Company. Mr. Chandra was a statesman and a visionary, and was instrumental in the industrial reforms and progressive policies. The Board places its deep sympathy and condolences to his family.
Mr. Thomas Albanese superannuated as the Whole Time Director and CEO of the Company w.e.f. August 31, 2017.
The Board places on record its appreciation for the valuable services and significant contribution rendered by Mr. Albanese during his tenure.
The details of training and familiarization programmes and Annual Board Evaluation process for Directors have been provided under the Corporate Governance Report.
The policy on Director’s appointment and remuneration including criteria for determining qualifications, positive attributes, independence of Director, and also remuneration for Key Managerial Personnel and other employees forms part of Corporate Governance Report of this Annual Report.
Key Managerial PersonnelThe following Directors/Executives are KMPs of the Company during Fiscal 2018:
Mr. Navin Agarwal, Executive Chairman Mr. Tarun Jain, Whole Time DirectorMr. GR Arun Kumar, Whole Time Director & Chief Financial OfficerMs. Bhumika Sood, Company Secretary & Compliance Officer
Number of Board MeetingsThe Board of Directors met nine times during the year. The details of Board Meetings are laid out in Corporate Governance report, which forms a part of this annual report.
Audit CommitteeThe composition of the Audit Committee is in compliance with the provisions of Section 177 of the Act and Regulation 18 of the SEBI Listing Regulations. As on March 31, 2018, the Audit Committee of the Board comprises of four (4) Non-Executive Directors all of whom are Independent. The Chairperson of the Audit Committee is a Non-Executive Independent Director.
The Board has accepted all recommendations made by the Audit Committee during the year.
Auditors• Statutory AuditorsM/s S.R. Batliboi & Co. LLP, Chartered Accountants (FRN: 301003E) were appointed as Statutory Auditors of your Company at the AGM held on June 29, 2016 for a term of five consecutive years i.e., until the conclusion of the 56th AGM. M/s S.R. Batliboi & Co. LLP have confirmed their independence and eligibility under the provisions of the Act & SEBI Listing Regulations.
The report of the Statutory Auditors along with notes to Schedules is enclosed to this Report. The observations made in the Auditors’ Report are self-explanatory and therefore do not call for any further comments.
During the year under review, the Auditors have not reported any matter under Section 143 (12) of the Act, therefore no detail is required to be disclosed under Section 134 (3)(ca) of the Act.
• Cost AuditorAs per Section 148 of the Act, the Company is required to have the audit of its cost records conducted by a Cost Accountant in practice. The Board of your Company has on the recommendation of the Audit Committee, approved the appointment of M/s Shome and Banerjee as Cost Auditors for its oil & gas Business and M/s Ramnath Iyer & Co as Cost Auditors for its copper, aluminium, iron ore and electricity Business to conduct cost audits pertaining to relevant products prescribed under the Companies (Cost Records and Audit) Rules, 2014 as amended from time to time for the year ending March 31, 2018 at a remuneration of ` 5,00,000 p.a and ` 14,00,000/-p.a (plus applicable taxes and reimbursement of out of pocket expenses, if any), respectively. Further M/s Ramnath Iyer & Co have been appointed as the Lead Cost Auditors of the Company.
Directors’ Report continued
127Integrated R
eport
Managem
ent Review
Statutory R
eports
Financial Statements
Vedanta Limited Integrated Report and Annual Accounts 2017-18
• Secretarial Auditor Pursuant to the provisions of Section 204 of the Act and the Companies (Appointment and Remuneration of managerial Personnel) Rules, 2014, the Company has appointed M/s Chandrasekaran & Associates, a firm of Company Secretaries in practice to undertake the Secretarial Audit of the Company for FY 2018. The Report of the Secretarial Audit in Form MR-3 is annexed herewith as Annexure D. The Secretarial Audit Report does not contain any qualifications, reservation, adverse remarks or disclaimer.
Subsidiaries/Joint Ventures/Associate Companies The Company has 52 subsidiaries (15 direct and 37 indirect) as at March 31, 2018, as disclosed in the accounts.
During the year and till date the following changes have taken place in subsidiary companies:
Subsidiary companies formed/acquired:• Avanstrate (Japan) Inc. (ASI) acquired on December 28, 2017• Avanstrate (Korea) Inc. acquired on December 28, 2017• Avanstrate (Taiwan) Inc. acquired on December 28, 2017• Vedanta Star Limited incorporated on April 23, 2018
As at March 31, 2018, the Company has 5 associate companies and joint ventures.
Associate Companies and Joint Ventures:• RoshSkor Township (Pty) Ltd• Gaurav Overseas Private Limited• Goa Maritime Private Limited• Madanpur South Coal Company Limited• Rampia Coal Mines and Energy Private Limited
Details of Loans/Guarantees/Investment made by the Company Particulars of loans given, investments made, guarantees given and securities provided along with the purpose for which the loan or guarantee or security is proposed to be utilised as per the provisions of Section 186 of the Act are provided in the standalone financial statement (Please refer to Notes to the standalone financial statement).
As per the SEBI Listing Regulations, a policy on material subsidiaries as approved by the Board of Directors, may be accessed on the Company’s website: www.vedantalimited.com.
Transfer of Unpaid and Unclaimed amounts to Investor Education and Protection Fund (IEPF)The Company sends letters to all shareholders, whose dividends are unclaimed so as to ensure that they receive their rightful dues.
During the year, the Company has transferred a sum of ` 1,49,03,948/- to Investor Education & Protection Fund (IEPF), the amount which was due & payable and remained unclaimed and unpaid for a period of seven (7) years as provided in Section 125 of the Act and the rules made thereunder. Despite the reminder letters sent to each shareholder, this amount remained unclaimed and hence was transferred.
In accordance with the provisions of the Section 124(6) of the Act and Rule 6(3)(a) of the Investor Education and Protection Fund Authority (Accounting, Audit, Transfer and Refund) Rules, 2016, (IEPF Rules), the Company is required to Transfer 10,60,879 equity shares of Re.1 each held by 986 shareholders to IEPF. The said shares correspond to the dividend which has remained unclaimed for a period of seven consecutive years from the financial year
2009-10. The equity shares wherein, disputes are pending and Court Order(s) are Nil. All the remaining shares, as mentioned above, have been transferred to IEPF. Subsequent to the transfer, the concerned shareholders can claim the said shares along with the dividend(s) from IEPF in accordance with the prescribed procedure and on submission of such documents as prescribed under the IEPF Rules.
The Company has already sent a specific communication to the concerned shareholders at their address registered with the Company and also published notice in The Free Press Journal and Navshakti providing the details of the shares due for transfer and to enable shareholders to take appropriate action.
Fixed Deposits As reported last year, the Company has discontinued the renewal of its fixed deposits on maturity. As at March 31, 2018, all fixed deposits had matured, while deposits amounting to ` 54,000 remained unclaimed. Since the matter is sub judice, the Company is maintaining status quo.
Extract of Annual ReturnThe details forming part of the extract of the Annual Return in form MGT 9 is annexed hereto as ‘Annexure E’
Related Party TransactionsIn line with the requirements of the Act and SEBI Listing Regulations, your Company has formulated a Policy on Related Party Transaction (RPT) which is also available on Company’s website (http://www.vedantalimited.com/investor-relations/corporate-governance.aspx). The Policy intends to ensure that proper reporting, approval and disclosure processes are in place for all transactions between the Company and Related Parties.
The Company presents a detailed landscape of all RPTs to the Audit Committee, specifying the nature, value, and terms and conditions of the transaction. The Company has developed a Related Party Transactions Manual-Standard Operating Procedures to identify and monitor all such transactions.
All contracts/arrangements/transactions entered by the Company during the financial year with related parties were on an arm’s length basis, in the ordinary course of business and were in compliance with the applicable provisions of the Act and SEBI Listing Regulations.
During the Fiscal 2018, there have been no materially significant RPTs between the Company and Directors, management, subsidiaries or relatives, as defined under Section 188 of the Act and Regulations 23 the SEBI Listing Regulations.
Accordingly, the disclosure required u/s 134(3)(h) of the Act in Form AOC-2 is not applicable to your Company.
Material Changes & Commitment affecting the Financial Position of the CompanyThere are no material changes affecting the financial position of the Company subsequent to the close of the Fiscal 2018 till the date of this Report.
Energy Conservation, Technology Absorption, Foreign Exchange Earnings And Outgo The information on conservation of energy, technology absorption stipulated under Section 134(3)(m) of the Act read with Rule, 8 of The Companies (Accounts) Rules, 2014, is annexed herewith as ‘Annexure F’
128 Vedanta Limited Integrated Report and Annual Accounts 2017-18
The details of the Foreign Exchange Earnings and Outgo are as follows:
(` Crores)
Particulars
Year Ended31 March,
2018
Year Ended31 March,
2017
Expenditure in foreign currency 1,551 1,282Earnings in foreign currency 28,394 21,138CIF Value of Imports 28,900 19,322
Directors Responsibility Statement Pursuant to section 134 of the Act, with respect to Directors’ Responsibility Statement it is hereby confirmed that:
a. in the preparation of the annual accounts, the applicable accounting standards has been followed and there is no material departures from the same;
b. your Directors selected such accounting policies and applied them consistently and made judgments and estimates that are reasonable and prudent so as to give a true and fair view of the state of affairs of the Company at the end of the financial year, i.e., 31 March, 2018 and of the profit and loss of the Company for that period;
c. your Directors have taken proper and sufficient care for the maintenance of adequate accounting records in accordance with the provisions of the Companies Act, 2013 for safeguarding the Company’s assets and for preventing and detecting fraud and other irregularities;
d. your Directors have prepared the annual accounts on a going concern basis;
e. your Directors have laid down internal financial controls to be followed by the Company and that such internal financial controls are adequate and are operating effectively; and
f. your Directors have devised proper systems to ensure compliance with the provisions of all applicable laws and that such systems were adequate and operating effectively.
AcknowledgementYour Directors place on record their deep appreciation to employees at all levels for their hard work, dedication and commitment. The enthusiasm and unstinting efforts of the employees have enabled the Company to remain as industry leader.
The Board also extends its appreciation for the support and co-operation your Company has been receiving from its customers, vendors, dealers, investors, suppliers, business associates and others associated with the Company. Your Company looks upon them as partners in its progress and has shared with them the rewards of growth. It will be the Company’s endeavour to build and nurture relationships with all its stakeholders.
The Directors also take this opportunity to acknowledge the support and assistance extended to us by the Government of India, various State Governments and government departments, financial institutions, bankers, stock exchanges, communities, shareholders and investors at large for their continued support.
For and on behalf of the Board of DirectorsPlace: Mumbai Navin AgarwalDated: May 03, 2018 Executive Chairman
Directors’ Report continued
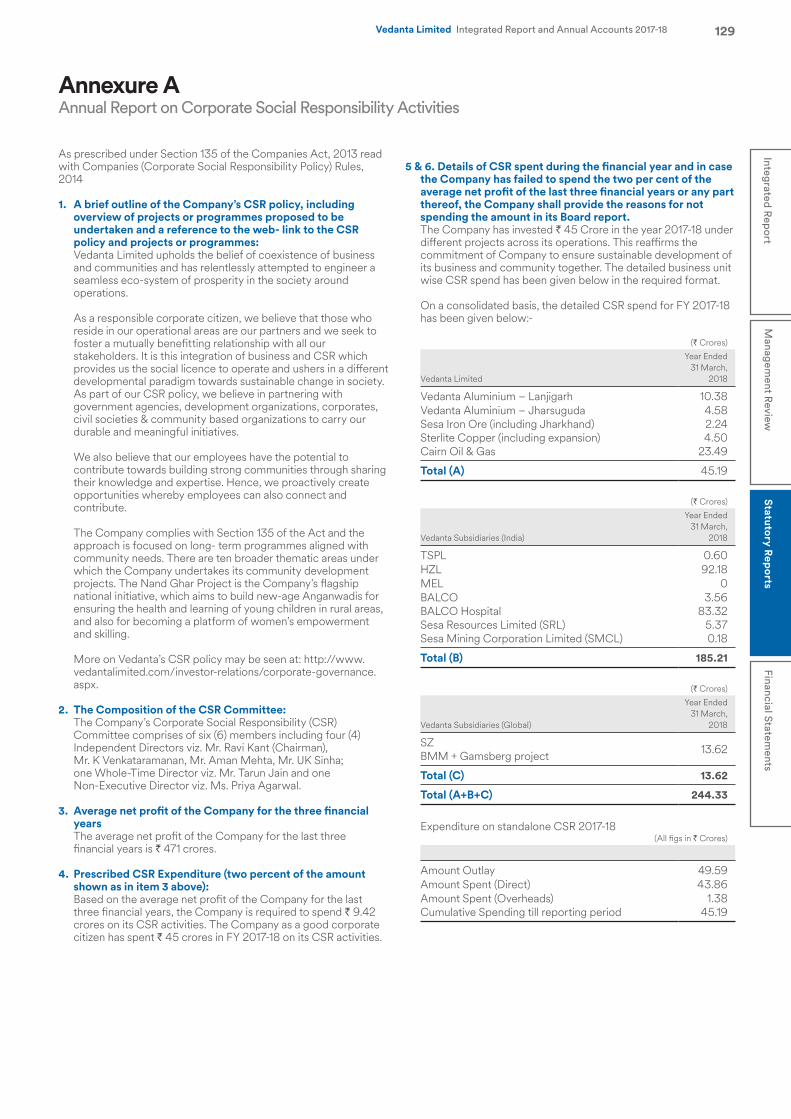
129Integrated R
eport
Managem
ent Review
Statutory R
eports
Financial Statements
Vedanta Limited Integrated Report and Annual Accounts 2017-18
As prescribed under Section 135 of the Companies Act, 2013 read with Companies (Corporate Social Responsibility Policy) Rules, 2014
1. A brief outline of the Company’s CSR policy, including overview of projects or programmes proposed to be undertaken and a reference to the web- link to the CSR policy and projects or programmes:
Vedanta Limited upholds the belief of coexistence of business and communities and has relentlessly attempted to engineer a seamless eco-system of prosperity in the society around operations.
As a responsible corporate citizen, we believe that those who reside in our operational areas are our partners and we seek to foster a mutually benefitting relationship with all our stakeholders. It is this integration of business and CSR which provides us the social licence to operate and ushers in a different developmental paradigm towards sustainable change in society. As part of our CSR policy, we believe in partnering with government agencies, development organizations, corporates, civil societies & community based organizations to carry our durable and meaningful initiatives.
We also believe that our employees have the potential to contribute towards building strong communities through sharing their knowledge and expertise. Hence, we proactively create opportunities whereby employees can also connect and contribute.
The Company complies with Section 135 of the Act and the approach is focused on long- term programmes aligned with community needs. There are ten broader thematic areas under which the Company undertakes its community development projects. The Nand Ghar Project is the Company’s flagship national initiative, which aims to build new-age Anganwadis for ensuring the health and learning of young children in rural areas, and also for becoming a platform of women’s empowerment and skilling.
More on Vedanta’s CSR policy may be seen at: http://www.vedantalimited.com/investor-relations/corporate-governance.aspx.
2. The Composition of the CSR Committee: The Company’s Corporate Social Responsibility (CSR)
Committee comprises of six (6) members including four (4) Independent Directors viz. Mr. Ravi Kant (Chairman), Mr. K Venkataramanan, Mr. Aman Mehta, Mr. UK Sinha; one Whole-Time Director viz. Mr. Tarun Jain and one Non-Executive Director viz. Ms. Priya Agarwal.
3. Average net profit of the Company for the three financial years
The average net profit of the Company for the last three financial years is ` 471 crores.
4. Prescribed CSR Expenditure (two percent of the amount shown as in item 3 above):
Based on the average net profit of the Company for the last three financial years, the Company is required to spend ` 9.42 crores on its CSR activities. The Company as a good corporate citizen has spent ` 45 crores in FY 2017-18 on its CSR activities.
5 & 6. Details of CSR spent during the financial year and in case the Company has failed to spend the two per cent of the average net profit of the last three financial years or any part thereof, the Company shall provide the reasons for not spending the amount in its Board report.
The Company has invested ` 45 Crore in the year 2017-18 under different projects across its operations. This reaffirms the commitment of Company to ensure sustainable development of its business and community together. The detailed business unit wise CSR spend has been given below in the required format.
On a consolidated basis, the detailed CSR spend for FY 2017-18 has been given below:-
(` Crores)
Vedanta Limited
Year Ended31 March,
2018
Vedanta Aluminium – Lanjigarh 10.38Vedanta Aluminium – Jharsuguda 4.58Sesa Iron Ore (including Jharkhand) 2.24Sterlite Copper (including expansion) 4.50Cairn Oil & Gas 23.49
Total (A) 45.19
(` Crores)
Vedanta Subsidiaries (India)
Year Ended31 March,
2018
TSPL 0.60HZL 92.18MEL 0BALCO 3.56BALCO Hospital 83.32Sesa Resources Limited (SRL) 5.37Sesa Mining Corporation Limited (SMCL) 0.18
Total (B) 185.21
(` Crores)
Vedanta Subsidiaries (Global)
Year Ended31 March,
2018
SZ 13.62BMM + Gamsberg project
Total (C) 13.62
Total (A+B+C) 244.33
Expenditure on standalone CSR 2017-18(All figs in ` Crores)
Amount Outlay 49.59Amount Spent (Direct) 43.86Amount Spent (Overheads) 1.38Cumulative Spending till reporting period 45.19
Annexure AAnnual Report on Corporate Social Responsibility Activities
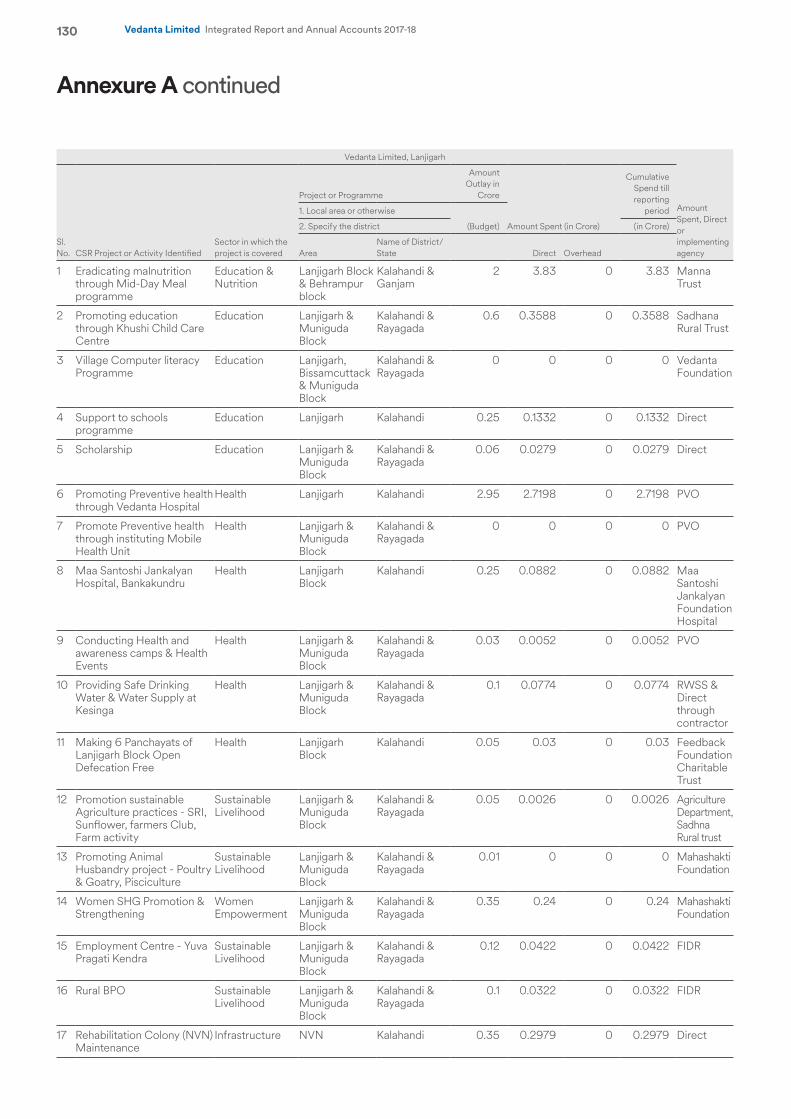
130 Vedanta Limited Integrated Report and Annual Accounts 2017-18
Vedanta Limited, Lanjigarh
Sl. No. CSR Project or Activity Identified
Sector in which the project is covered
Project or Programme
Amount Outlay in
Crore
Amount Spent (in Crore)
Cumulative Spend till reporting
period Amount Spent, Direct or implementing agency
1. Local area or otherwise
(Budget)2. Specify the district (in Crore)
AreaName of District/State Direct Overhead
1 Eradicating malnutrition through Mid-Day Meal programme
Education & Nutrition
Lanjigarh Block & Behrampur block
Kalahandi & Ganjam
2 3.83 0 3.83 Manna Trust
2 Promoting education through Khushi Child Care Centre
Education Lanjigarh & Muniguda Block
Kalahandi & Rayagada
0.6 0.3588 0 0.3588 Sadhana Rural Trust
3 Village Computer literacy Programme
Education Lanjigarh, Bissamcuttack & Muniguda Block
Kalahandi & Rayagada
0 0 0 0 Vedanta Foundation
4 Support to schools programme
Education Lanjigarh Kalahandi 0.25 0.1332 0 0.1332 Direct
5 Scholarship Education Lanjigarh & Muniguda Block
Kalahandi & Rayagada
0.06 0.0279 0 0.0279 Direct
6 Promoting Preventive health through Vedanta Hospital
Health Lanjigarh Kalahandi 2.95 2.7198 0 2.7198 PVO
7 Promote Preventive health through instituting Mobile Health Unit
Health Lanjigarh & Muniguda Block
Kalahandi & Rayagada
0 0 0 0 PVO
8 Maa Santoshi Jankalyan Hospital, Bankakundru
Health Lanjigarh Block
Kalahandi 0.25 0.0882 0 0.0882 Maa Santoshi Jankalyan Foundation Hospital
9 Conducting Health and awareness camps & Health Events
Health Lanjigarh & Muniguda Block
Kalahandi & Rayagada
0.03 0.0052 0 0.0052 PVO
10 Providing Safe Drinking Water & Water Supply at Kesinga
Health Lanjigarh & Muniguda Block
Kalahandi & Rayagada
0.1 0.0774 0 0.0774 RWSS & Direct through contractor
11 Making 6 Panchayats of Lanjigarh Block Open Defecation Free
Health Lanjigarh Block
Kalahandi 0.05 0.03 0 0.03 Feedback Foundation Charitable Trust
12 Promotion sustainable Agriculture practices - SRI, Sunflower, farmers Club, Farm activity
Sustainable Livelihood
Lanjigarh & Muniguda Block
Kalahandi & Rayagada
0.05 0.0026 0 0.0026 Agriculture Department, Sadhna Rural trust
13 Promoting Animal Husbandry project - Poultry & Goatry, Pisciculture
Sustainable Livelihood
Lanjigarh & Muniguda Block
Kalahandi & Rayagada
0.01 0 0 0 Mahashakti Foundation
14 Women SHG Promotion & Strengthening
Women Empowerment
Lanjigarh & Muniguda Block
Kalahandi & Rayagada
0.35 0.24 0 0.24 Mahashakti Foundation
15 Employment Centre - Yuva Pragati Kendra
Sustainable Livelihood
Lanjigarh & Muniguda Block
Kalahandi & Rayagada
0.12 0.0422 0 0.0422 FIDR
16 Rural BPO Sustainable Livelihood
Lanjigarh & Muniguda Block
Kalahandi & Rayagada
0.1 0.0322 0 0.0322 FIDR
17 Rehabilitation Colony (NVN) Maintenance
Infrastructure NVN Kalahandi 0.35 0.2979 0 0.2979 Direct
Annexure A continued
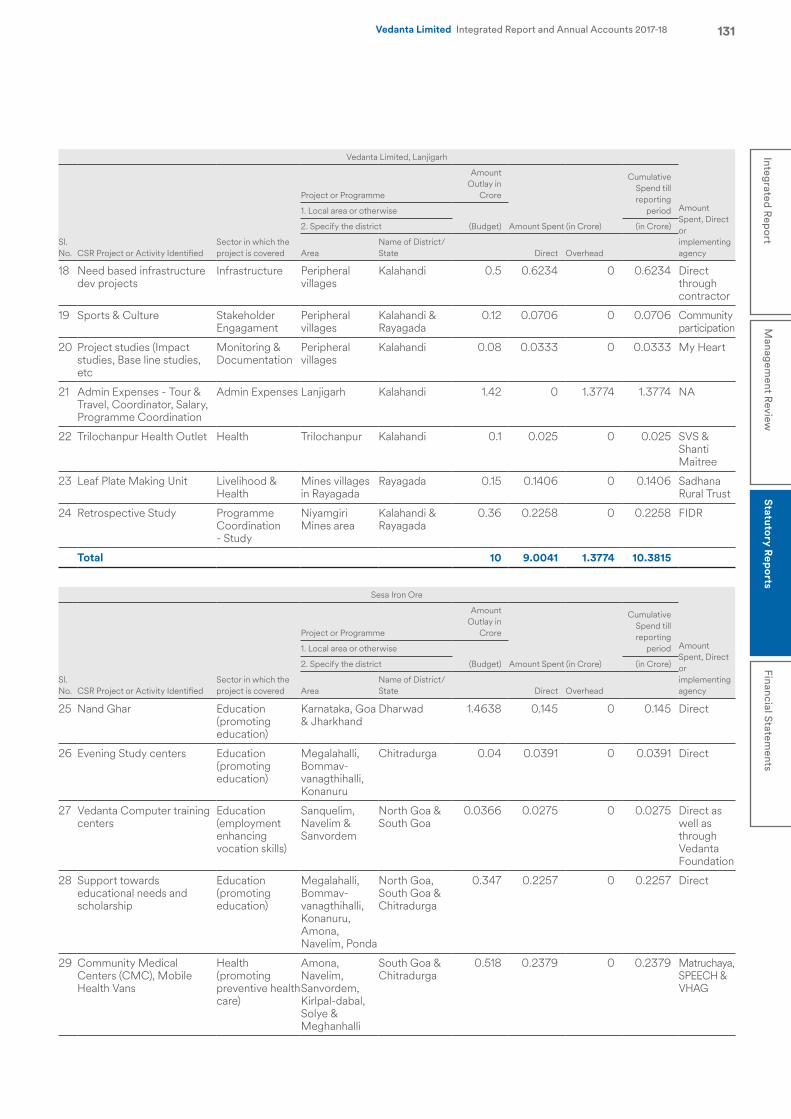
131Integrated R
eport
Managem
ent Review
Statutory R
eports
Financial Statements
Vedanta Limited Integrated Report and Annual Accounts 2017-18
Vedanta Limited, Lanjigarh
Sl. No. CSR Project or Activity Identified
Sector in which the project is covered
Project or Programme
Amount Outlay in
Crore
Amount Spent (in Crore)
Cumulative Spend till reporting
period Amount Spent, Direct or implementing agency
1. Local area or otherwise
(Budget)2. Specify the district (in Crore)
AreaName of District/State Direct Overhead
18 Need based infrastructure dev projects
Infrastructure Peripheral villages
Kalahandi 0.5 0.6234 0 0.6234 Direct through contractor
19 Sports & Culture Stakeholder Engagament
Peripheral villages
Kalahandi & Rayagada
0.12 0.0706 0 0.0706 Community participation
20 Project studies (Impact studies, Base line studies, etc
Monitoring & Documentation
Peripheral villages
Kalahandi 0.08 0.0333 0 0.0333 My Heart
21 Admin Expenses - Tour & Travel, Coordinator, Salary, Programme Coordination
Admin Expenses Lanjigarh Kalahandi 1.42 0 1.3774 1.3774 NA
22 Trilochanpur Health Outlet Health Trilochanpur Kalahandi 0.1 0.025 0 0.025 SVS & Shanti Maitree
23 Leaf Plate Making Unit Livelihood & Health
Mines villages in Rayagada
Rayagada 0.15 0.1406 0 0.1406 Sadhana Rural Trust
24 Retrospective Study Programme Coordination - Study
Niyamgiri Mines area
Kalahandi & Rayagada
0.36 0.2258 0 0.2258 FIDR
Total 10 9.0041 1.3774 10.3815
Sesa Iron Ore
Sl. No. CSR Project or Activity Identified
Sector in which the project is covered
Project or Programme
Amount Outlay in
Crore
Amount Spent (in Crore)
Cumulative Spend till reporting
period Amount Spent, Direct or implementing agency
1. Local area or otherwise
(Budget)2. Specify the district (in Crore)
AreaName of District/State Direct Overhead
25 Nand Ghar Education (promoting education)
Karnataka, Goa & Jharkhand
Dharwad 1.4638 0.145 0 0.145 Direct
26 Evening Study centers Education (promoting education)
Megalahalli, Bommav-vanagthihalli, Konanuru
Chitradurga 0.04 0.0391 0 0.0391 Direct
27 Vedanta Computer training centers
Education (employment enhancing vocation skills)
Sanquelim, Navelim & Sanvordem
North Goa & South Goa
0.0366 0.0275 0 0.0275 Direct as well as through Vedanta Foundation
28 Support towards educational needs and scholarship
Education (promoting education)
Megalahalli, Bommav-vanagthihalli, Konanuru, Amona, Navelim, Ponda
North Goa, South Goa & Chitradurga
0.347 0.2257 0 0.2257 Direct
29 Community Medical Centers (CMC), Mobile Health Vans
Health (promoting preventive health care)
Amona, Navelim, Sanvordem, Kirlpal-dabal, Solye & Meghanhalli
South Goa & Chitradurga
0.518 0.2379 0 0.2379 Matruchaya, SPEECH & VHAG
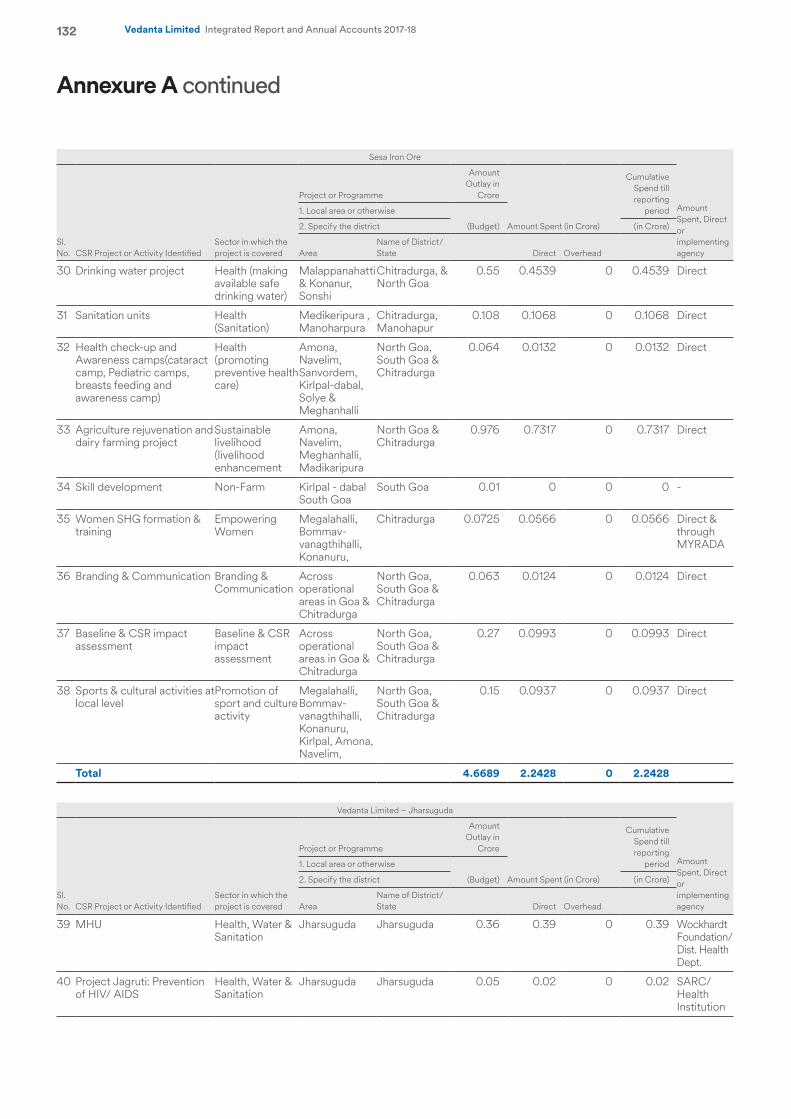
132 Vedanta Limited Integrated Report and Annual Accounts 2017-18
Sesa Iron Ore
Sl. No. CSR Project or Activity Identified
Sector in which the project is covered
Project or Programme
Amount Outlay in
Crore
Amount Spent (in Crore)
Cumulative Spend till reporting
period Amount Spent, Direct or implementing agency
1. Local area or otherwise
(Budget)2. Specify the district (in Crore)
AreaName of District/State Direct Overhead
30 Drinking water project Health (making available safe drinking water)
Malappanahatti & Konanur, Sonshi
Chitradurga, & North Goa
0.55 0.4539 0 0.4539 Direct
31 Sanitation units Health (Sanitation)
Medikeripura , Manoharpura
Chitradurga, Manohapur
0.108 0.1068 0 0.1068 Direct
32 Health check-up and Awareness camps(cataract camp, Pediatric camps, breasts feeding and awareness camp)
Health (promoting preventive health care)
Amona, Navelim, Sanvordem, Kirlpal-dabal, Solye & Meghanhalli
North Goa, South Goa & Chitradurga
0.064 0.0132 0 0.0132 Direct
33 Agriculture rejuvenation and dairy farming project
Sustainable livelihood (livelihood enhancement
Amona, Navelim, Meghanhalli, Madikaripura
North Goa & Chitradurga
0.976 0.7317 0 0.7317 Direct
34 Skill development Non-Farm Kirlpal - dabal South Goa
South Goa 0.01 0 0 0 -
35 Women SHG formation & training
Empowering Women
Megalahalli, Bommav-vanagthihalli, Konanuru,
Chitradurga 0.0725 0.0566 0 0.0566 Direct & through MYRADA
36 Branding & Communication Branding & Communication
Across operational areas in Goa & Chitradurga
North Goa, South Goa & Chitradurga
0.063 0.0124 0 0.0124 Direct
37 Baseline & CSR impact assessment
Baseline & CSR impact assessment
Across operational areas in Goa & Chitradurga
North Goa, South Goa & Chitradurga
0.27 0.0993 0 0.0993 Direct
38 Sports & cultural activities at local level
Promotion of sport and culture activity
Megalahalli, Bommav-vanagthihalli, Konanuru, Kirlpal, Amona, Navelim,
North Goa, South Goa & Chitradurga
0.15 0.0937 0 0.0937 Direct
Total 4.6689 2.2428 0 2.2428
Vedanta Limited – Jharsuguda
Sl. No. CSR Project or Activity Identified
Sector in which the project is covered
Project or Programme
Amount Outlay in
Crore
Amount Spent (in Crore)
Cumulative Spend till reporting
period Amount Spent, Direct or implementing agency
1. Local area or otherwise
(Budget)2. Specify the district (in Crore)
AreaName of District/State Direct Overhead
39 MHU Health, Water & Sanitation
Jharsuguda Jharsuguda 0.36 0.39 0 0.39 Wockhardt Foundation/ Dist. Health Dept.
40 Project Jagruti: Prevention of HIV/ AIDS
Health, Water & Sanitation
Jharsuguda Jharsuguda 0.05 0.02 0 0.02 SARC/ Health Institution
Annexure A continued
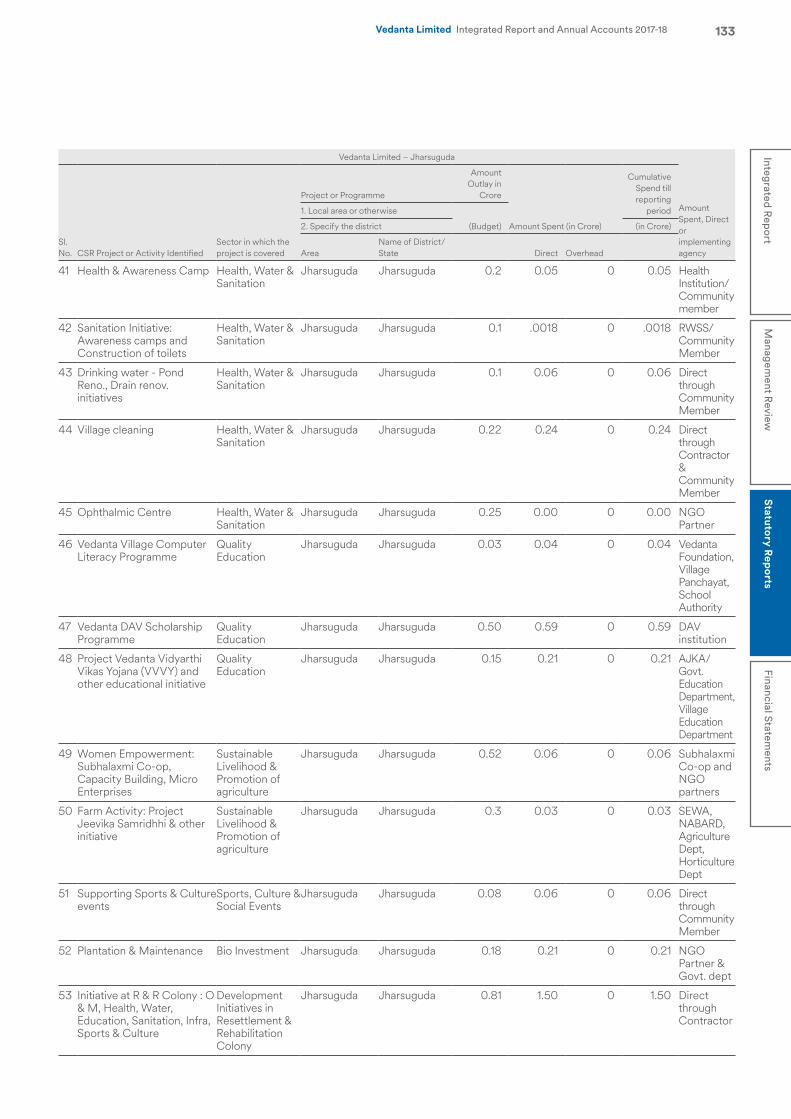
133Integrated R
eport
Managem
ent Review
Statutory R
eports
Financial Statements
Vedanta Limited Integrated Report and Annual Accounts 2017-18
Vedanta Limited – Jharsuguda
Sl. No. CSR Project or Activity Identified
Sector in which the project is covered
Project or Programme
Amount Outlay in
Crore
Amount Spent (in Crore)
Cumulative Spend till reporting
period Amount Spent, Direct or implementing agency
1. Local area or otherwise
(Budget)2. Specify the district (in Crore)
AreaName of District/State Direct Overhead
41 Health & Awareness Camp Health, Water & Sanitation
Jharsuguda Jharsuguda 0.2 0.05 0 0.05 Health Institution/ Community member
42 Sanitation Initiative: Awareness camps and Construction of toilets
Health, Water & Sanitation
Jharsuguda Jharsuguda 0.1 .0018 0 .0018 RWSS/ Community Member
43 Drinking water - Pond Reno., Drain renov. initiatives
Health, Water & Sanitation
Jharsuguda Jharsuguda 0.1 0.06 0 0.06 Direct through Community Member
44 Village cleaning Health, Water & Sanitation
Jharsuguda Jharsuguda 0.22 0.24 0 0.24 Direct through Contractor & Community Member
45 Ophthalmic Centre Health, Water & Sanitation
Jharsuguda Jharsuguda 0.25 0.00 0 0.00 NGO Partner
46 Vedanta Village Computer Literacy Programme
Quality Education
Jharsuguda Jharsuguda 0.03 0.04 0 0.04 Vedanta Foundation, Village Panchayat, School Authority
47 Vedanta DAV Scholarship Programme
Quality Education
Jharsuguda Jharsuguda 0.50 0.59 0 0.59 DAV institution
48 Project Vedanta Vidyarthi Vikas Yojana (VVVY) and other educational initiative
Quality Education
Jharsuguda Jharsuguda 0.15 0.21 0 0.21 AJKA/ Govt. Education Department, Village Education Department
49 Women Empowerment: Subhalaxmi Co-op, Capacity Building, Micro Enterprises
Sustainable Livelihood & Promotion of agriculture
Jharsuguda Jharsuguda 0.52 0.06 0 0.06 Subhalaxmi Co-op and NGO partners
50 Farm Activity: Project Jeevika Samridhhi & other initiative
Sustainable Livelihood & Promotion of agriculture
Jharsuguda Jharsuguda 0.3 0.03 0 0.03 SEWA, NABARD, Agriculture Dept, Horticulture Dept
51 Supporting Sports & Culture events
Sports, Culture & Social Events
Jharsuguda Jharsuguda 0.08 0.06 0 0.06 Direct through Community Member
52 Plantation & Maintenance Bio Investment Jharsuguda Jharsuguda 0.18 0.21 0 0.21 NGO Partner & Govt. dept
53 Initiative at R & R Colony : O & M, Health, Water, Education, Sanitation, Infra, Sports & Culture
Development Initiatives in Resettlement & Rehabilitation Colony
Jharsuguda Jharsuguda 0.81 1.50 0 1.50 Direct through Contractor
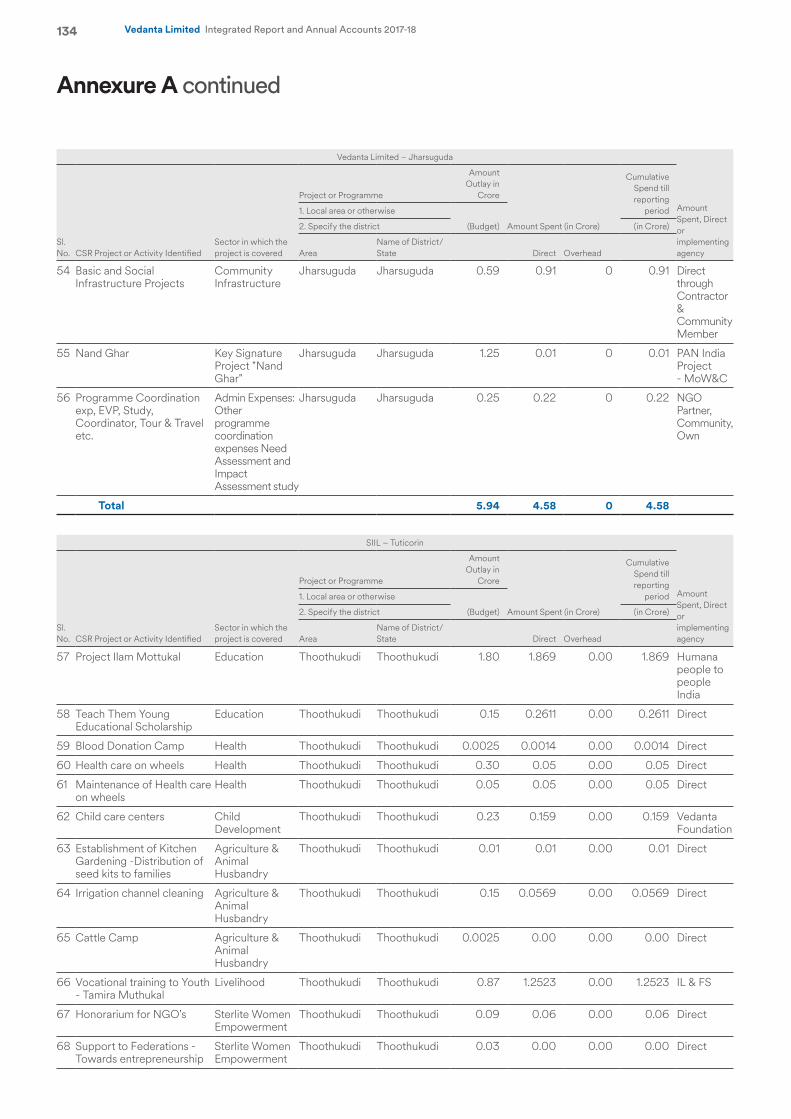
134 Vedanta Limited Integrated Report and Annual Accounts 2017-18
Vedanta Limited – Jharsuguda
Sl. No. CSR Project or Activity Identified
Sector in which the project is covered
Project or Programme
Amount Outlay in
Crore
Amount Spent (in Crore)
Cumulative Spend till reporting
period Amount Spent, Direct or implementing agency
1. Local area or otherwise
(Budget)2. Specify the district (in Crore)
AreaName of District/State Direct Overhead
54 Basic and Social Infrastructure Projects
Community Infrastructure
Jharsuguda Jharsuguda 0.59 0.91 0 0.91 Direct through Contractor & Community Member
55 Nand Ghar Key Signature Project "Nand Ghar"
Jharsuguda Jharsuguda 1.25 0.01 0 0.01 PAN India Project - MoW&C
56 Programme Coordination exp, EVP, Study, Coordinator, Tour & Travel etc.
Admin Expenses: Other programme coordination expenses Need Assessment and Impact Assessment study
Jharsuguda Jharsuguda 0.25 0.22 0 0.22 NGO Partner, Community, Own
Total 5.94 4.58 0 4.58
SIIL – Tuticorin
Sl. No. CSR Project or Activity Identified
Sector in which the project is covered
Project or Programme
Amount Outlay in
Crore
Amount Spent (in Crore)
Cumulative Spend till reporting
period Amount Spent, Direct or implementing agency
1. Local area or otherwise
(Budget)2. Specify the district (in Crore)
AreaName of District/State Direct Overhead
57 Project Ilam Mottukal Education Thoothukudi Thoothukudi 1.80 1.869 0.00 1.869 Humana people to people India
58 Teach Them Young Educational Scholarship
Education Thoothukudi Thoothukudi 0.15 0.2611 0.00 0.2611 Direct
59 Blood Donation Camp Health Thoothukudi Thoothukudi 0.0025 0.0014 0.00 0.0014 Direct
60 Health care on wheels Health Thoothukudi Thoothukudi 0.30 0.05 0.00 0.05 Direct
61 Maintenance of Health care on wheels
Health Thoothukudi Thoothukudi 0.05 0.05 0.00 0.05 Direct
62 Child care centers Child Development
Thoothukudi Thoothukudi 0.23 0.159 0.00 0.159 Vedanta Foundation
63 Establishment of Kitchen Gardening -Distribution of seed kits to families
Agriculture & Animal Husbandry
Thoothukudi Thoothukudi 0.01 0.01 0.00 0.01 Direct
64 Irrigation channel cleaning Agriculture & Animal Husbandry
Thoothukudi Thoothukudi 0.15 0.0569 0.00 0.0569 Direct
65 Cattle Camp Agriculture & Animal Husbandry
Thoothukudi Thoothukudi 0.0025 0.00 0.00 0.00 Direct
66 Vocational training to Youth - Tamira Muthukal
Livelihood Thoothukudi Thoothukudi 0.87 1.2523 0.00 1.2523 IL & FS
67 Honorarium for NGO's Sterlite Women Empowerment
Thoothukudi Thoothukudi 0.09 0.06 0.00 0.06 Direct
68 Support to Federations - Towards entrepreneurship
Sterlite Women Empowerment
Thoothukudi Thoothukudi 0.03 0.00 0.00 0.00 Direct
Annexure A continued
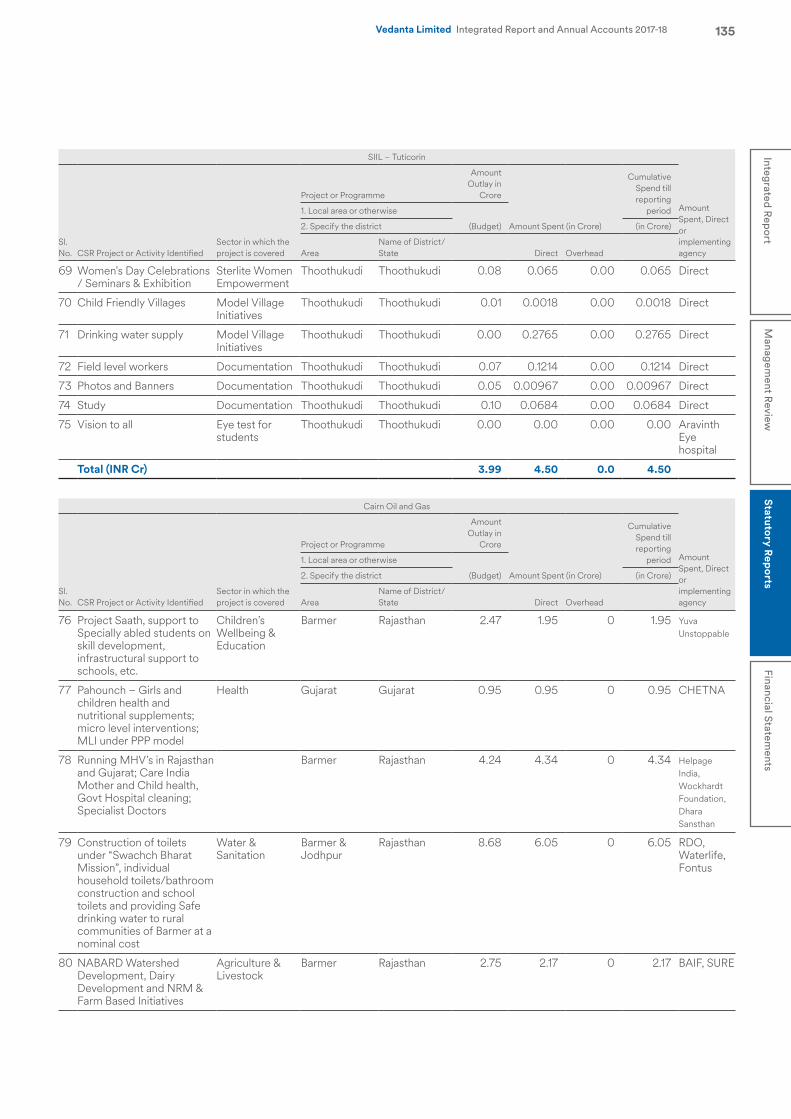
135Integrated R
eport
Managem
ent Review
Statutory R
eports
Financial Statements
Vedanta Limited Integrated Report and Annual Accounts 2017-18
SIIL – Tuticorin
Sl. No. CSR Project or Activity Identified
Sector in which the project is covered
Project or Programme
Amount Outlay in
Crore
Amount Spent (in Crore)
Cumulative Spend till reporting
period Amount Spent, Direct or implementing agency
1. Local area or otherwise
(Budget)2. Specify the district (in Crore)
AreaName of District/State Direct Overhead
69 Women's Day Celebrations / Seminars & Exhibition
Sterlite Women Empowerment
Thoothukudi Thoothukudi 0.08 0.065 0.00 0.065 Direct
70 Child Friendly Villages Model Village Initiatives
Thoothukudi Thoothukudi 0.01 0.0018 0.00 0.0018 Direct
71 Drinking water supply Model Village Initiatives
Thoothukudi Thoothukudi 0.00 0.2765 0.00 0.2765 Direct
72 Field level workers Documentation Thoothukudi Thoothukudi 0.07 0.1214 0.00 0.1214 Direct
73 Photos and Banners Documentation Thoothukudi Thoothukudi 0.05 0.00967 0.00 0.00967 Direct
74 Study Documentation Thoothukudi Thoothukudi 0.10 0.0684 0.00 0.0684 Direct
75 Vision to all Eye test for students
Thoothukudi Thoothukudi 0.00 0.00 0.00 0.00 Aravinth Eye hospital
Total (INR Cr) 3.99 4.50 0.0 4.50
Cairn Oil and Gas
Sl. No. CSR Project or Activity Identified
Sector in which the project is covered
Project or Programme
Amount Outlay in
Crore
Amount Spent (in Crore)
Cumulative Spend till reporting
period Amount Spent, Direct or implementing agency
1. Local area or otherwise
(Budget)2. Specify the district (in Crore)
AreaName of District/State Direct Overhead
76 Project Saath, support to Specially abled students on skill development, infrastructural support to schools, etc.
Children’s Wellbeing & Education
Barmer Rajasthan 2.47 1.95 0 1.95 Yuva Unstoppable
77 Pahounch – Girls and children health and nutritional supplements; micro level interventions; MLI under PPP model
Health Gujarat Gujarat 0.95 0.95 0 0.95 CHETNA
78 Running MHV’s in Rajasthan and Gujarat; Care India Mother and Child health, Govt Hospital cleaning; Specialist Doctors
Barmer Rajasthan 4.24 4.34 0 4.34 Helpage India, Wockhardt Foundation, Dhara Sansthan
79 Construction of toilets under “Swachch Bharat Mission”, individual household toilets/bathroom construction and school toilets and providing Safe drinking water to rural communities of Barmer at a nominal cost
Water & Sanitation
Barmer & Jodhpur
Rajasthan 8.68 6.05 0 6.05 RDO, Waterlife, Fontus
80 NABARD Watershed Development, Dairy Development and NRM & Farm Based Initiatives
Agriculture & Livestock
Barmer Rajasthan 2.75 2.17 0 2.17 BAIF, SURE
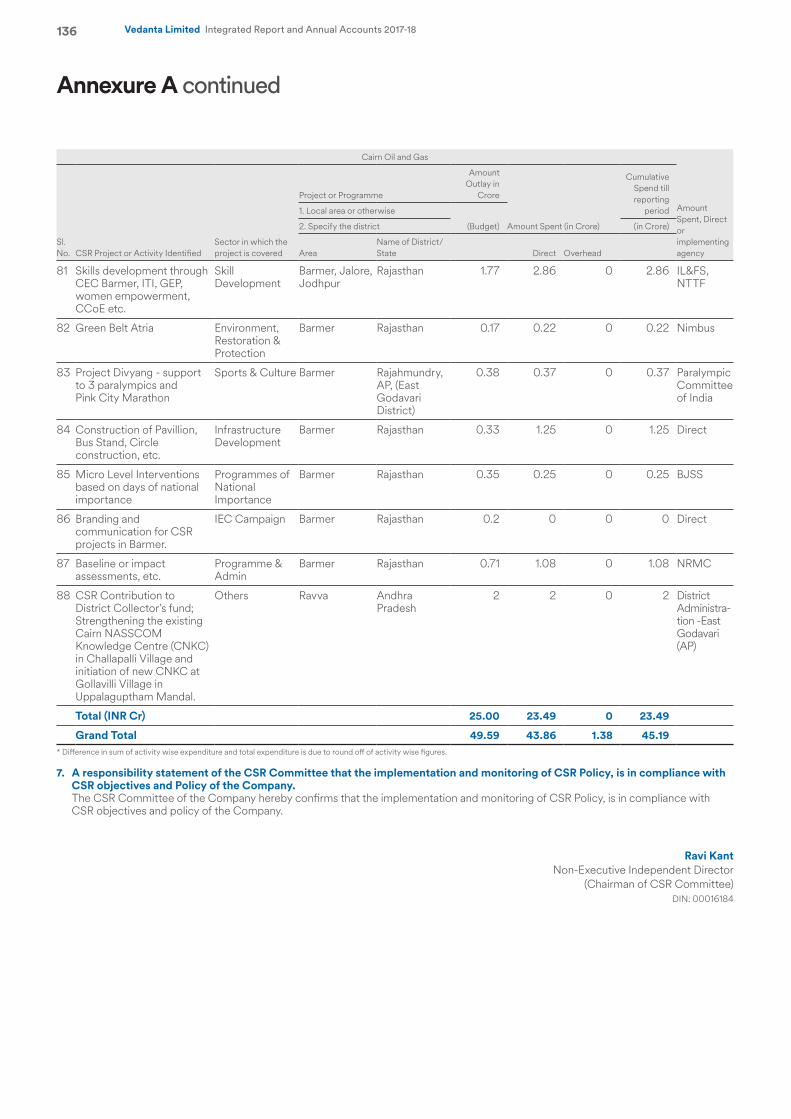
136 Vedanta Limited Integrated Report and Annual Accounts 2017-18
Cairn Oil and Gas
Sl. No. CSR Project or Activity Identified
Sector in which the project is covered
Project or Programme
Amount Outlay in
Crore
Amount Spent (in Crore)
Cumulative Spend till reporting
period Amount Spent, Direct or implementing agency
1. Local area or otherwise
(Budget)2. Specify the district (in Crore)
AreaName of District/State Direct Overhead
81 Skills development through CEC Barmer, ITI, GEP, women empowerment, CCoE etc.
Skill Development
Barmer, Jalore, Jodhpur
Rajasthan 1.77 2.86 0 2.86 IL&FS, NTTF
82 Green Belt Atria Environment, Restoration & Protection
Barmer Rajasthan 0.17 0.22 0 0.22 Nimbus
83 Project Divyang - support to 3 paralympics and Pink City Marathon
Sports & Culture Barmer Rajahmundry, AP, (East Godavari District)
0.38 0.37 0 0.37 Paralympic Committee of India
84 Construction of Pavillion, Bus Stand, Circle construction, etc.
Infrastructure Development
Barmer Rajasthan 0.33 1.25 0 1.25 Direct
85 Micro Level Interventions based on days of national importance
Programmes of National Importance
Barmer Rajasthan 0.35 0.25 0 0.25 BJSS
86 Branding and communication for CSR projects in Barmer.
IEC Campaign Barmer Rajasthan 0.2 0 0 0 Direct
87 Baseline or impact assessments, etc.
Programme & Admin
Barmer Rajasthan 0.71 1.08 0 1.08 NRMC
88 CSR Contribution to District Collector’s fund; Strengthening the existing Cairn NASSCOM Knowledge Centre (CNKC) in Challapalli Village and initiation of new CNKC at Gollavilli Village in Uppalaguptham Mandal.
Others Ravva Andhra Pradesh
2 2 0 2 District Administra-tion -East Godavari (AP)
Total (INR Cr) 25.00 23.49 0 23.49
Grand Total 49.59 43.86 1.38 45.19* Difference in sum of activity wise expenditure and total expenditure is due to round off of activity wise figures.
7. A responsibility statement of the CSR Committee that the implementation and monitoring of CSR Policy, is in compliance with CSR objectives and Policy of the Company.
The CSR Committee of the Company hereby confirms that the implementation and monitoring of CSR Policy, is in compliance with CSR objectives and policy of the Company.
Ravi KantNon-Executive Independent Director
(Chairman of CSR Committee)DIN: 00016184
Annexure A continued
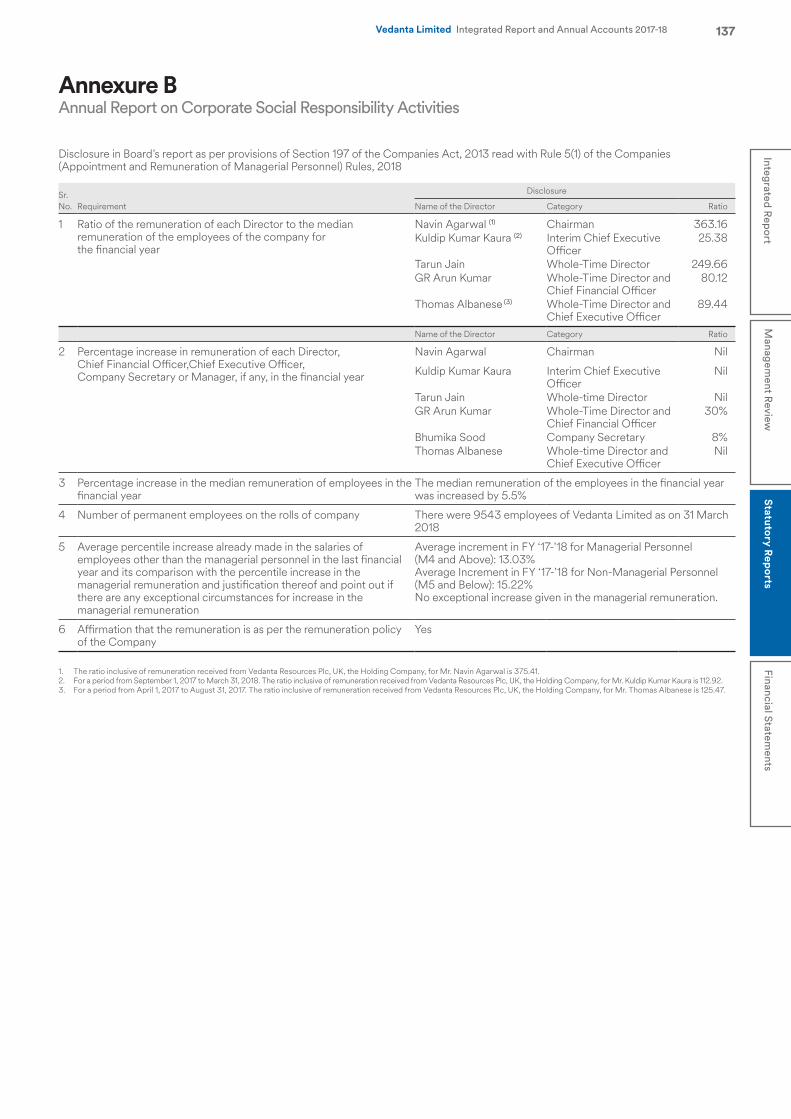
137Integrated R
eport
Managem
ent Review
Statutory R
eports
Financial Statements
Vedanta Limited Integrated Report and Annual Accounts 2017-18
Disclosure in Board’s report as per provisions of Section 197 of the Companies Act, 2013 read with Rule 5(1) of the Companies (Appointment and Remuneration of Managerial Personnel) Rules, 2018
Sr. No. Requirement
Disclosure
Name of the Director Category Ratio
1 Ratio of the remuneration of each Director to the median remuneration of the employees of the company for the financial year
Navin Agarwal (1) Chairman 363.16Kuldip Kumar Kaura (2) Interim Chief Executive
Officer25.38
Tarun Jain Whole-Time Director 249.66GR Arun Kumar Whole-Time Director and
Chief Financial Officer80.12
Thomas Albanese (3) Whole-Time Director and Chief Executive Officer
89.44
Name of the Director Category Ratio
2 Percentage increase in remuneration of each Director, Chief Financial Officer,Chief Executive Officer, Company Secretary or Manager, if any, in the financial year
Navin Agarwal Chairman Nil
Kuldip Kumar Kaura Interim Chief Executive Officer
Nil
Tarun Jain Whole-time Director NilGR Arun Kumar Whole-Time Director and
Chief Financial Officer 30%
Bhumika Sood Company Secretary 8%Thomas Albanese Whole-time Director and
Chief Executive OfficerNil
3 Percentage increase in the median remuneration of employees in the financial year
The median remuneration of the employees in the financial year was increased by 5.5%
4 Number of permanent employees on the rolls of company There were 9543 employees of Vedanta Limited as on 31 March 2018
5 Average percentile increase already made in the salaries of employees other than the managerial personnel in the last financial year and its comparison with the percentile increase in the managerial remuneration and justification thereof and point out if there are any exceptional circumstances for increase in the managerial remuneration
Average increment in FY ‘17-’18 for Managerial Personnel (M4 and Above): 13.03% Average Increment in FY ‘17-’18 for Non-Managerial Personnel (M5 and Below): 15.22% No exceptional increase given in the managerial remuneration.
6 Affirmation that the remuneration is as per the remuneration policy of the Company
Yes
1. The ratio inclusive of remuneration received from Vedanta Resources Plc, UK, the Holding Company, for Mr. Navin Agarwal is 375.41.2. For a period from September 1, 2017 to March 31, 2018. The ratio inclusive of remuneration received from Vedanta Resources Plc, UK, the Holding Company, for Mr. Kuldip Kumar Kaura is 112.92. 3. For a period from April 1, 2017 to August 31, 2017. The ratio inclusive of remuneration received from Vedanta Resources Plc, UK, the Holding Company, for Mr. Thomas Albanese is 125.47.
Annexure BAnnual Report on Corporate Social Responsibility Activities
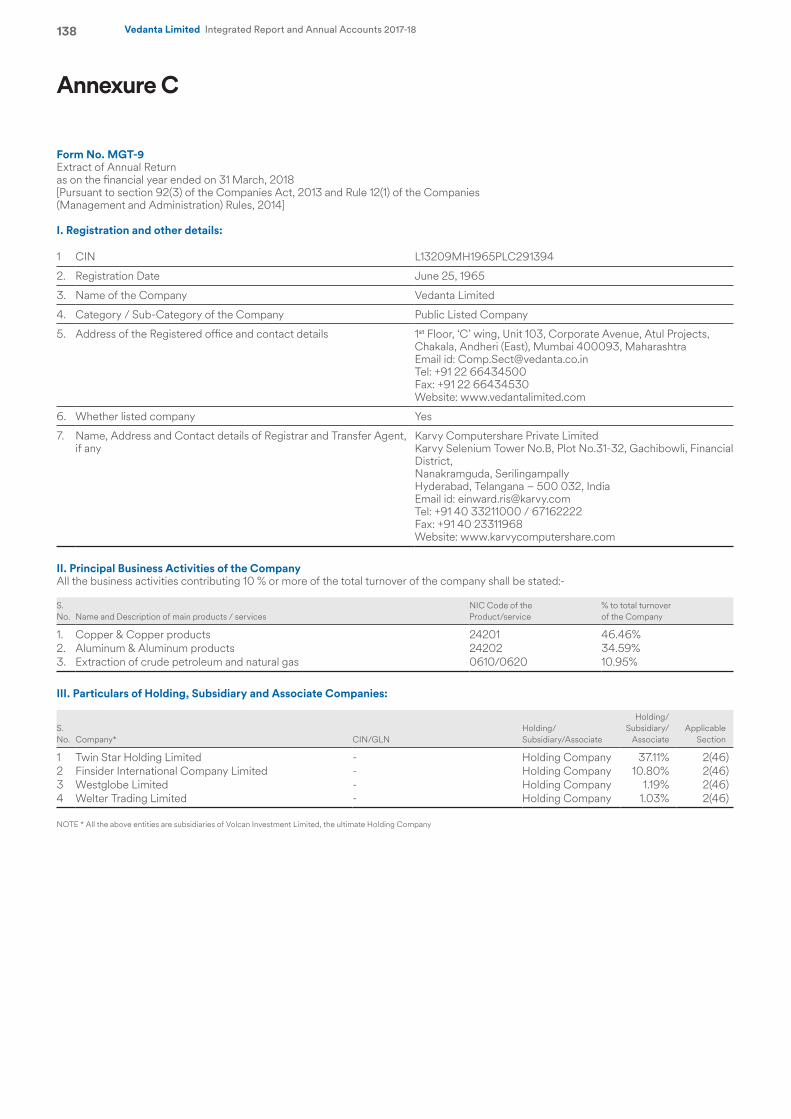
138 Vedanta Limited Integrated Report and Annual Accounts 2017-18
Annexure C
Form No. MGT-9Extract of Annual Returnas on the financial year ended on 31 March, 2018[Pursuant to section 92(3) of the Companies Act, 2013 and Rule 12(1) of the Companies(Management and Administration) Rules, 2014]
I. Registration and other details:
1 CIN L13209MH1965PLC291394
2. Registration Date June 25, 1965
3. Name of the Company Vedanta Limited
4. Category / Sub-Category of the Company Public Listed Company
5. Address of the Registered office and contact details 1st Floor, ‘C’ wing, Unit 103, Corporate Avenue, Atul Projects, Chakala, Andheri (East), Mumbai 400093, MaharashtraEmail id: [email protected]: +91 22 66434500Fax: +91 22 66434530Website: www.vedantalimited.com
6. Whether listed company Yes
7. Name, Address and Contact details of Registrar and Transfer Agent, if any
Karvy Computershare Private LimitedKarvy Selenium Tower No.B, Plot No.31-32, Gachibowli, Financial District,Nanakramguda, SerilingampallyHyderabad, Telangana – 500 032, IndiaEmail id: [email protected]: +91 40 33211000 / 67162222Fax: +91 40 23311968Website: www.karvycomputershare.com
II. Principal Business Activities of the CompanyAll the business activities contributing 10 % or more of the total turnover of the company shall be stated:-
S. No. Name and Description of main products / services
NIC Code of the Product/service
% to total turnover of the Company
1. Copper & Copper products 24201 46.46%2. Aluminum & Aluminum products 24202 34.59%3. Extraction of crude petroleum and natural gas 0610/0620 10.95%
III. Particulars of Holding, Subsidiary and Associate Companies:
S. No. Company* CIN/GLN
Holding/ Subsidiary/Associate
Holding/ Subsidiary/
AssociateApplicable
Section
1 Twin Star Holding Limited - Holding Company 37.11% 2(46)2 Finsider International Company Limited - Holding Company 10.80% 2(46)3 Westglobe Limited - Holding Company 1.19% 2(46)4 Welter Trading Limited - Holding Company 1.03% 2(46)
NOTE * All the above entities are subsidiaries of Volcan Investment Limited, the ultimate Holding Company
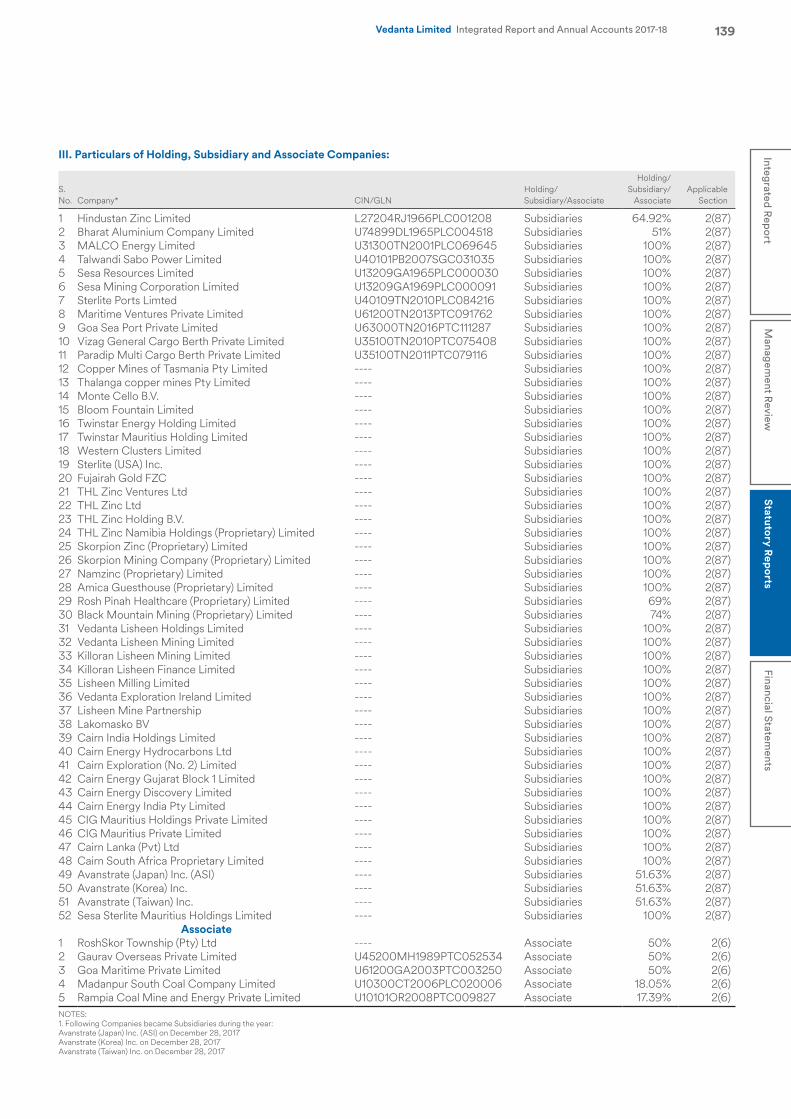
139Integrated R
eport
Managem
ent Review
Statutory R
eports
Financial Statements
Vedanta Limited Integrated Report and Annual Accounts 2017-18
III. Particulars of Holding, Subsidiary and Associate Companies:
S. No. Company* CIN/GLN
Holding/ Subsidiary/Associate
Holding/ Subsidiary/
AssociateApplicable
Section
1 Hindustan Zinc Limited L27204RJ1966PLC001208 Subsidiaries 64.92% 2(87)2 Bharat Aluminium Company Limited U74899DL1965PLC004518 Subsidiaries 51% 2(87)3 MALCO Energy Limited U31300TN2001PLC069645 Subsidiaries 100% 2(87)4 Talwandi Sabo Power Limited U40101PB2007SGC031035 Subsidiaries 100% 2(87)5 Sesa Resources Limited U13209GA1965PLC000030 Subsidiaries 100% 2(87)6 Sesa Mining Corporation Limited U13209GA1969PLC000091 Subsidiaries 100% 2(87)7 Sterlite Ports Limted U40109TN2010PLC084216 Subsidiaries 100% 2(87)8 Maritime Ventures Private Limited U61200TN2013PTC091762 Subsidiaries 100% 2(87)9 Goa Sea Port Private Limited U63000TN2016PTC111287 Subsidiaries 100% 2(87)10 Vizag General Cargo Berth Private Limited U35100TN2010PTC075408 Subsidiaries 100% 2(87)11 Paradip Multi Cargo Berth Private Limited U35100TN2011PTC079116 Subsidiaries 100% 2(87)12 Copper Mines of Tasmania Pty Limited ---- Subsidiaries 100% 2(87)13 Thalanga copper mines Pty Limited ---- Subsidiaries 100% 2(87)14 Monte Cello B.V. ---- Subsidiaries 100% 2(87)15 Bloom Fountain Limited ---- Subsidiaries 100% 2(87)16 Twinstar Energy Holding Limited ---- Subsidiaries 100% 2(87)17 Twinstar Mauritius Holding Limited ---- Subsidiaries 100% 2(87)18 Western Clusters Limited ---- Subsidiaries 100% 2(87)19 Sterlite (USA) Inc. ---- Subsidiaries 100% 2(87)20 Fujairah Gold FZC ---- Subsidiaries 100% 2(87)21 THL Zinc Ventures Ltd ---- Subsidiaries 100% 2(87)22 THL Zinc Ltd ---- Subsidiaries 100% 2(87)23 THL Zinc Holding B.V. ---- Subsidiaries 100% 2(87)24 THL Zinc Namibia Holdings (Proprietary) Limited ---- Subsidiaries 100% 2(87)25 Skorpion Zinc (Proprietary) Limited ---- Subsidiaries 100% 2(87)26 Skorpion Mining Company (Proprietary) Limited ---- Subsidiaries 100% 2(87)27 Namzinc (Proprietary) Limited ---- Subsidiaries 100% 2(87)28 Amica Guesthouse (Proprietary) Limited ---- Subsidiaries 100% 2(87)29 Rosh Pinah Healthcare (Proprietary) Limited ---- Subsidiaries 69% 2(87)30 Black Mountain Mining (Proprietary) Limited ---- Subsidiaries 74% 2(87)31 Vedanta Lisheen Holdings Limited ---- Subsidiaries 100% 2(87)32 Vedanta Lisheen Mining Limited ---- Subsidiaries 100% 2(87)33 Killoran Lisheen Mining Limited ---- Subsidiaries 100% 2(87)34 Killoran Lisheen Finance Limited ---- Subsidiaries 100% 2(87)35 Lisheen Milling Limited ---- Subsidiaries 100% 2(87)36 Vedanta Exploration Ireland Limited ---- Subsidiaries 100% 2(87)37 Lisheen Mine Partnership ---- Subsidiaries 100% 2(87)38 Lakomasko BV ---- Subsidiaries 100% 2(87)39 Cairn India Holdings Limited ---- Subsidiaries 100% 2(87)40 Cairn Energy Hydrocarbons Ltd ---- Subsidiaries 100% 2(87)41 Cairn Exploration (No. 2) Limited ---- Subsidiaries 100% 2(87)42 Cairn Energy Gujarat Block 1 Limited ---- Subsidiaries 100% 2(87)43 Cairn Energy Discovery Limited ---- Subsidiaries 100% 2(87)44 Cairn Energy India Pty Limited ---- Subsidiaries 100% 2(87)45 CIG Mauritius Holdings Private Limited ---- Subsidiaries 100% 2(87)46 CIG Mauritius Private Limited ---- Subsidiaries 100% 2(87)47 Cairn Lanka (Pvt) Ltd ---- Subsidiaries 100% 2(87)48 Cairn South Africa Proprietary Limited ---- Subsidiaries 100% 2(87)49 Avanstrate (Japan) Inc. (ASI) ---- Subsidiaries 51.63% 2(87)50 Avanstrate (Korea) Inc. ---- Subsidiaries 51.63% 2(87)51 Avanstrate (Taiwan) Inc. ---- Subsidiaries 51.63% 2(87)52 Sesa Sterlite Mauritius Holdings Limited ---- Subsidiaries 100% 2(87)
Associate 1 RoshSkor Township (Pty) Ltd ---- Associate 50% 2(6)2 Gaurav Overseas Private Limited U45200MH1989PTC052534 Associate 50% 2(6)3 Goa Maritime Private Limited U61200GA2003PTC003250 Associate 50% 2(6)4 Madanpur South Coal Company Limited U10300CT2006PLC020006 Associate 18.05% 2(6)5 Rampia Coal Mine and Energy Private Limited U10101OR2008PTC009827 Associate 17.39% 2(6)NOTES:1. Following Companies became Subsidiaries during the year:Avanstrate (Japan) Inc. (ASI) on December 28, 2017Avanstrate (Korea) Inc. on December 28, 2017Avanstrate (Taiwan) Inc. on December 28, 2017
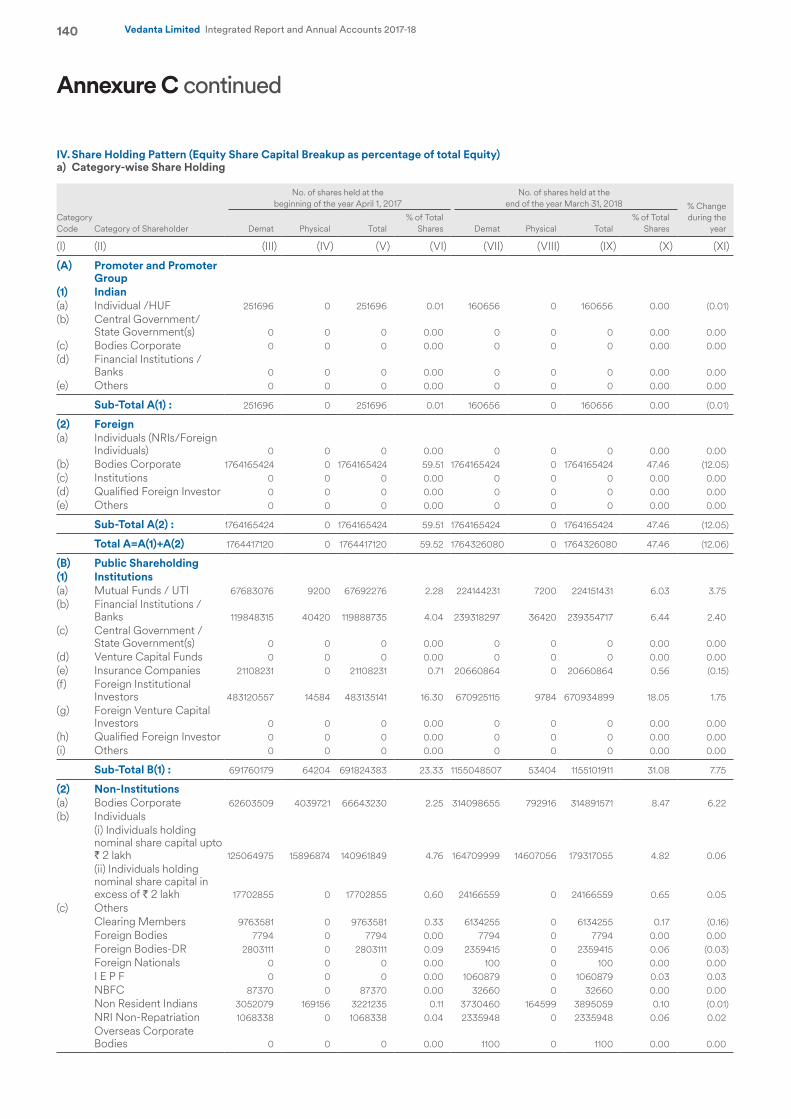
140 Vedanta Limited Integrated Report and Annual Accounts 2017-18
IV. Share Holding Pattern (Equity Share Capital Breakup as percentage of total Equity)a) Category-wise Share Holding
Category Code Category of Shareholder
No. of shares held at the beginning of the year April 1, 2017
No. of shares held at the end of the year March 31, 2018 % Change
during the year Demat Physical Total
% of Total Shares Demat Physical Total
% of Total Shares
(I) (II) (III) (IV) (V) (VI) (VII) (VIII) (IX) (X) (XI)
(A) Promoter and Promoter Group
(1) Indian (a) Individual /HUF 251696 0 251696 0.01 160656 0 160656 0.00 (0.01)(b) Central Government/
State Government(s) 0 0 0 0.00 0 0 0 0.00 0.00(c) Bodies Corporate 0 0 0 0.00 0 0 0 0.00 0.00(d) Financial Institutions /
Banks 0 0 0 0.00 0 0 0 0.00 0.00(e) Others 0 0 0 0.00 0 0 0 0.00 0.00
Sub-Total A(1) : 251696 0 251696 0.01 160656 0 160656 0.00 (0.01)
(2) Foreign (a) Individuals (NRIs/Foreign
Individuals) 0 0 0 0.00 0 0 0 0.00 0.00(b) Bodies Corporate 1764165424 0 1764165424 59.51 1764165424 0 1764165424 47.46 (12.05)(c) Institutions 0 0 0 0.00 0 0 0 0.00 0.00(d) Qualified Foreign Investor 0 0 0 0.00 0 0 0 0.00 0.00(e) Others 0 0 0 0.00 0 0 0 0.00 0.00
Sub-Total A(2) : 1764165424 0 1764165424 59.51 1764165424 0 1764165424 47.46 (12.05)
Total A=A(1)+A(2) 1764417120 0 1764417120 59.52 1764326080 0 1764326080 47.46 (12.06)
(B) Public Shareholding (1) Institutions (a) Mutual Funds / UTI 67683076 9200 67692276 2.28 224144231 7200 224151431 6.03 3.75(b) Financial Institutions /
Banks 119848315 40420 119888735 4.04 239318297 36420 239354717 6.44 2.40(c) Central Government /
State Government(s) 0 0 0 0.00 0 0 0 0.00 0.00(d) Venture Capital Funds 0 0 0 0.00 0 0 0 0.00 0.00(e) Insurance Companies 21108231 0 21108231 0.71 20660864 0 20660864 0.56 (0.15)(f) Foreign Institutional
Investors 483120557 14584 483135141 16.30 670925115 9784 670934899 18.05 1.75(g) Foreign Venture Capital
Investors 0 0 0 0.00 0 0 0 0.00 0.00(h) Qualified Foreign Investor 0 0 0 0.00 0 0 0 0.00 0.00(i) Others 0 0 0 0.00 0 0 0 0.00 0.00
Sub-Total B(1) : 691760179 64204 691824383 23.33 1155048507 53404 1155101911 31.08 7.75
(2) Non-Institutions (a) Bodies Corporate 62603509 4039721 66643230 2.25 314098655 792916 314891571 8.47 6.22(b) Individuals
(i) Individuals holding nominal share capital upto ` 2 lakh 125064975 15896874 140961849 4.76 164709999 14607056 179317055 4.82 0.06
(ii) Individuals holding nominal share capital in excess of ` 2 lakh 17702855 0 17702855 0.60 24166559 0 24166559 0.65 0.05
(c) Others Clearing Members 9763581 0 9763581 0.33 6134255 0 6134255 0.17 (0.16) Foreign Bodies 7794 0 7794 0.00 7794 0 7794 0.00 0.00 Foreign Bodies-DR 2803111 0 2803111 0.09 2359415 0 2359415 0.06 (0.03) Foreign Nationals 0 0 0 0.00 100 0 100 0.00 0.00 I E P F 0 0 0 0.00 1060879 0 1060879 0.03 0.03 NBFC 87370 0 87370 0.00 32660 0 32660 0.00 0.00 Non Resident Indians 3052079 169156 3221235 0.11 3730460 164599 3895059 0.10 (0.01) NRI Non-Repatriation 1068338 0 1068338 0.04 2335948 0 2335948 0.06 0.02
Overseas Corporate Bodies 0 0 0 0.00 1100 0 1100 0.00 0.00
Annexure C continued
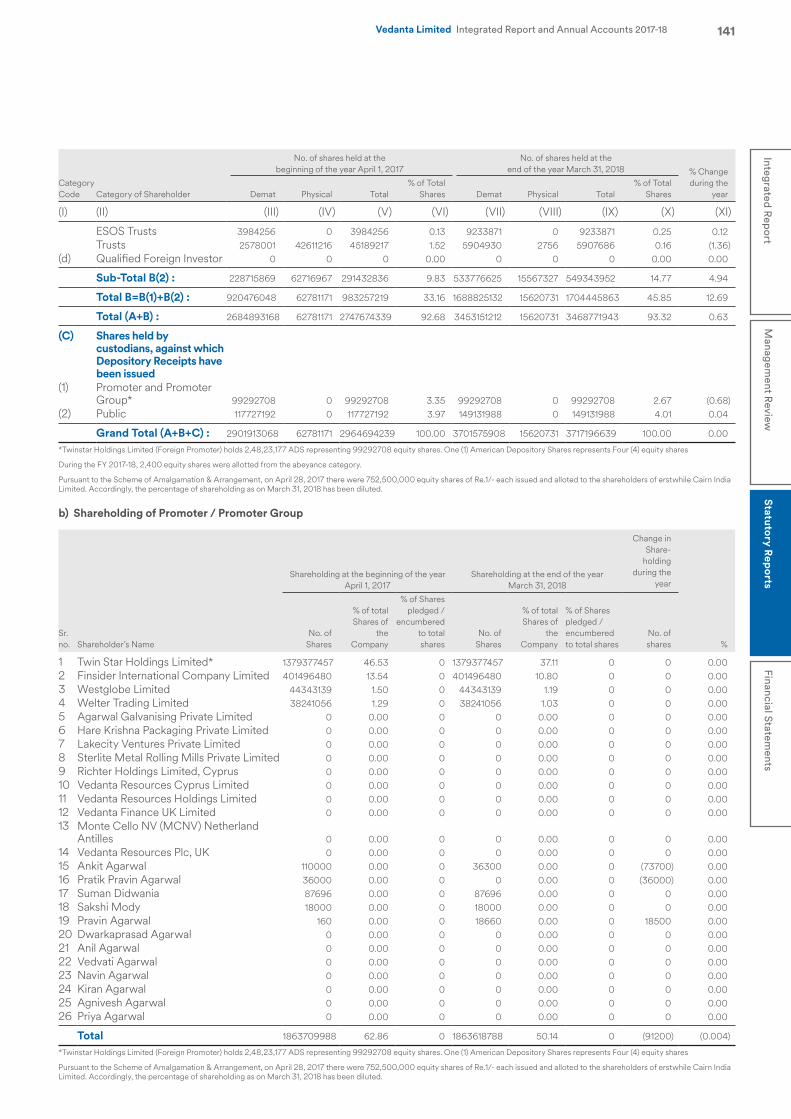
141Integrated R
eport
Managem
ent Review
Statutory R
eports
Financial Statements
Vedanta Limited Integrated Report and Annual Accounts 2017-18
Category Code Category of Shareholder
No. of shares held at the beginning of the year April 1, 2017
No. of shares held at the end of the year March 31, 2018 % Change
during the year Demat Physical Total
% of Total Shares Demat Physical Total
% of Total Shares
(I) (II) (III) (IV) (V) (VI) (VII) (VIII) (IX) (X) (XI)
ESOS Trusts 3984256 0 3984256 0.13 9233871 0 9233871 0.25 0.12 Trusts 2578001 42611216 45189217 1.52 5904930 2756 5907686 0.16 (1.36)(d) Qualified Foreign Investor 0 0 0 0.00 0 0 0 0.00 0.00
Sub-Total B(2) : 228715869 62716967 291432836 9.83 533776625 15567327 549343952 14.77 4.94
Total B=B(1)+B(2) : 920476048 62781171 983257219 33.16 1688825132 15620731 1704445863 45.85 12.69
Total (A+B) : 2684893168 62781171 2747674339 92.68 3453151212 15620731 3468771943 93.32 0.63
(C) Shares held by custodians, against which Depository Receipts have been issued
(1) Promoter and Promoter Group* 99292708 0 99292708 3.35 99292708 0 99292708 2.67 (0.68)
(2) Public 117727192 0 117727192 3.97 149131988 0 149131988 4.01 0.04
Grand Total (A+B+C) : 2901913068 62781171 2964694239 100.00 3701575908 15620731 3717196639 100.00 0.00
*Twinstar Holdings Limited (Foreign Promoter) holds 2,48,23,177 ADS representing 99292708 equity shares. One (1) American Depository Shares represents Four (4) equity shares
During the FY 2017-18, 2,400 equity shares were allotted from the abeyance category.
Pursuant to the Scheme of Amalgamation & Arrangement, on April 28, 2017 there were 752,500,000 equity shares of Re.1/- each issued and alloted to the shareholders of erstwhile Cairn India Limited. Accordingly, the percentage of shareholding as on March 31, 2018 has been diluted.
b) Shareholding of Promoter / Promoter Group
Sr. no. Shareholder’s Name
Shareholding at the beginning of the year April 1, 2017
Shareholding at the end of the year March 31, 2018
Change in Share-
holding during the
year
%No. of
Shares
% of total Shares of
the Company
% of Shares pledged /
encumbered to total shares
No. of Shares
% of total Shares of
the Company
% of Shares pledged / encumbered to total shares
No. of shares
1 Twin Star Holdings Limited* 1379377457 46.53 0 1379377457 37.11 0 0 0.002 Finsider International Company Limited 401496480 13.54 0 401496480 10.80 0 0 0.003 Westglobe Limited 44343139 1.50 0 44343139 1.19 0 0 0.004 Welter Trading Limited 38241056 1.29 0 38241056 1.03 0 0 0.005 Agarwal Galvanising Private Limited 0 0.00 0 0 0.00 0 0 0.006 Hare Krishna Packaging Private Limited 0 0.00 0 0 0.00 0 0 0.007 Lakecity Ventures Private Limited 0 0.00 0 0 0.00 0 0 0.008 Sterlite Metal Rolling Mills Private Limited 0 0.00 0 0 0.00 0 0 0.009 Richter Holdings Limited, Cyprus 0 0.00 0 0 0.00 0 0 0.0010 Vedanta Resources Cyprus Limited 0 0.00 0 0 0.00 0 0 0.0011 Vedanta Resources Holdings Limited 0 0.00 0 0 0.00 0 0 0.0012 Vedanta Finance UK Limited 0 0.00 0 0 0.00 0 0 0.0013 Monte Cello NV (MCNV) Netherland
Antilles 0 0.00 0 0 0.00 0 0 0.0014 Vedanta Resources Plc, UK 0 0.00 0 0 0.00 0 0 0.0015 Ankit Agarwal 110000 0.00 0 36300 0.00 0 (73700) 0.0016 Pratik Pravin Agarwal 36000 0.00 0 0 0.00 0 (36000) 0.0017 Suman Didwania 87696 0.00 0 87696 0.00 0 0 0.0018 Sakshi Mody 18000 0.00 0 18000 0.00 0 0 0.0019 Pravin Agarwal 160 0.00 0 18660 0.00 0 18500 0.0020 Dwarkaprasad Agarwal 0 0.00 0 0 0.00 0 0 0.0021 Anil Agarwal 0 0.00 0 0 0.00 0 0 0.0022 Vedvati Agarwal 0 0.00 0 0 0.00 0 0 0.0023 Navin Agarwal 0 0.00 0 0 0.00 0 0 0.0024 Kiran Agarwal 0 0.00 0 0 0.00 0 0 0.0025 Agnivesh Agarwal 0 0.00 0 0 0.00 0 0 0.0026 Priya Agarwal 0 0.00 0 0 0.00 0 0 0.00
Total 1863709988 62.86 0 1863618788 50.14 0 (91200) (0.004)
*Twinstar Holdings Limited (Foreign Promoter) holds 2,48,23,177 ADS representing 99292708 equity shares. One (1) American Depository Shares represents Four (4) equity shares
Pursuant to the Scheme of Amalgamation & Arrangement, on April 28, 2017 there were 752,500,000 equity shares of Re.1/- each issued and alloted to the shareholders of erstwhile Cairn India Limited. Accordingly, the percentage of shareholding as on March 31, 2018 has been diluted.
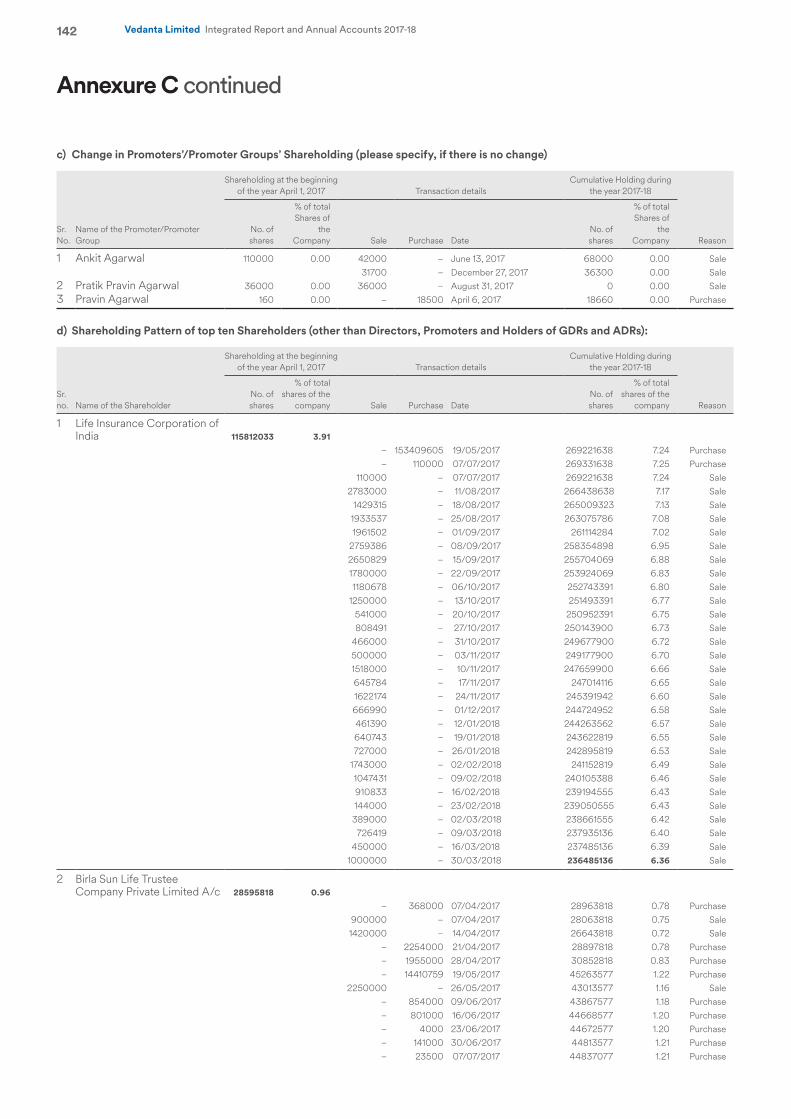
142 Vedanta Limited Integrated Report and Annual Accounts 2017-18
c) Change in Promoters’/Promoter Groups’ Shareholding (please specify, if there is no change)
Sr. No.
Name of the Promoter/Promoter Group
Shareholding at the beginning of the year April 1, 2017 Transaction details
Cumulative Holding during the year 2017-18
ReasonNo. of shares
% of total Shares of
the Company Sale Purchase Date
No. of shares
% of total Shares of
the Company
1 Ankit Agarwal 110000 0.00 42000 – June 13, 2017 68000 0.00 Sale 31700 – December 27, 2017 36300 0.00 Sale2 Pratik Pravin Agarwal 36000 0.00 36000 – August 31, 2017 0 0.00 Sale3 Pravin Agarwal 160 0.00 – 18500 April 6, 2017 18660 0.00 Purchase
d) Shareholding Pattern of top ten Shareholders (other than Directors, Promoters and Holders of GDRs and ADRs):
Sr. no. Name of the Shareholder
Shareholding at the beginning of the year April 1, 2017 Transaction details
Cumulative Holding during the year 2017-18
ReasonNo. of shares
% of total shares of the
company Sale Purchase DateNo. of shares
% of total shares of the
company
1 Life Insurance Corporation of India 115812033 3.91
– 153409605 19/05/2017 269221638 7.24 Purchase– 110000 07/07/2017 269331638 7.25 Purchase
110000 – 07/07/2017 269221638 7.24 Sale2783000 – 11/08/2017 266438638 7.17 Sale
1429315 – 18/08/2017 265009323 7.13 Sale1933537 – 25/08/2017 263075786 7.08 Sale1961502 – 01/09/2017 261114284 7.02 Sale
2759386 – 08/09/2017 258354898 6.95 Sale2650829 – 15/09/2017 255704069 6.88 Sale1780000 – 22/09/2017 253924069 6.83 Sale1180678 – 06/10/2017 252743391 6.80 Sale
1250000 – 13/10/2017 251493391 6.77 Sale541000 – 20/10/2017 250952391 6.75 Sale808491 – 27/10/2017 250143900 6.73 Sale
466000 – 31/10/2017 249677900 6.72 Sale500000 – 03/11/2017 249177900 6.70 Sale1518000 – 10/11/2017 247659900 6.66 Sale645784 – 17/11/2017 247014116 6.65 Sale1622174 – 24/11/2017 245391942 6.60 Sale666990 – 01/12/2017 244724952 6.58 Sale461390 – 12/01/2018 244263562 6.57 Sale640743 – 19/01/2018 243622819 6.55 Sale727000 – 26/01/2018 242895819 6.53 Sale
1743000 – 02/02/2018 241152819 6.49 Sale1047431 – 09/02/2018 240105388 6.46 Sale910833 – 16/02/2018 239194555 6.43 Sale144000 – 23/02/2018 239050555 6.43 Sale389000 – 02/03/2018 238661555 6.42 Sale726419 – 09/03/2018 237935136 6.40 Sale
450000 – 16/03/2018 237485136 6.39 Sale1000000 – 30/03/2018 236485136 6.36 Sale
2 Birla Sun Life Trustee Company Private Limited A/c 28595818 0.96
– 368000 07/04/2017 28963818 0.78 Purchase900000 – 07/04/2017 28063818 0.75 Sale1420000 – 14/04/2017 26643818 0.72 Sale
– 2254000 21/04/2017 28897818 0.78 Purchase– 1955000 28/04/2017 30852818 0.83 Purchase– 14410759 19/05/2017 45263577 1.22 Purchase
2250000 – 26/05/2017 43013577 1.16 Sale– 854000 09/06/2017 43867577 1.18 Purchase– 801000 16/06/2017 44668577 1.20 Purchase– 4000 23/06/2017 44672577 1.20 Purchase– 141000 30/06/2017 44813577 1.21 Purchase– 23500 07/07/2017 44837077 1.21 Purchase
Annexure C continued
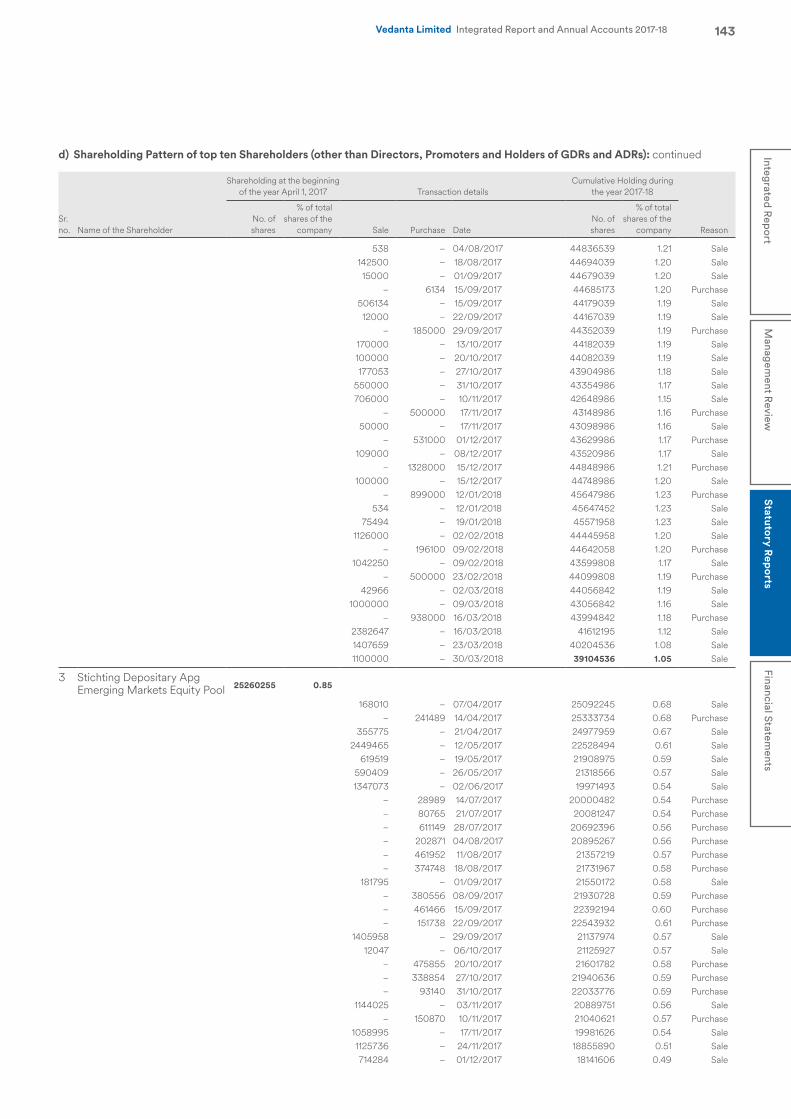
143Integrated R
eport
Managem
ent Review
Statutory R
eports
Financial Statements
Vedanta Limited Integrated Report and Annual Accounts 2017-18
Sr. no. Name of the Shareholder
Shareholding at the beginning of the year April 1, 2017 Transaction details
Cumulative Holding during the year 2017-18
ReasonNo. of shares
% of total shares of the
company Sale Purchase DateNo. of shares
% of total shares of the
company
538 – 04/08/2017 44836539 1.21 Sale142500 – 18/08/2017 44694039 1.20 Sale15000 – 01/09/2017 44679039 1.20 Sale
– 6134 15/09/2017 44685173 1.20 Purchase506134 – 15/09/2017 44179039 1.19 Sale
12000 – 22/09/2017 44167039 1.19 Sale– 185000 29/09/2017 44352039 1.19 Purchase
170000 – 13/10/2017 44182039 1.19 Sale100000 – 20/10/2017 44082039 1.19 Sale177053 – 27/10/2017 43904986 1.18 Sale
550000 – 31/10/2017 43354986 1.17 Sale706000 – 10/11/2017 42648986 1.15 Sale
– 500000 17/11/2017 43148986 1.16 Purchase50000 – 17/11/2017 43098986 1.16 Sale
– 531000 01/12/2017 43629986 1.17 Purchase109000 – 08/12/2017 43520986 1.17 Sale
– 1328000 15/12/2017 44848986 1.21 Purchase100000 – 15/12/2017 44748986 1.20 Sale
– 899000 12/01/2018 45647986 1.23 Purchase534 – 12/01/2018 45647452 1.23 Sale
75494 – 19/01/2018 45571958 1.23 Sale1126000 – 02/02/2018 44445958 1.20 Sale
– 196100 09/02/2018 44642058 1.20 Purchase1042250 – 09/02/2018 43599808 1.17 Sale
– 500000 23/02/2018 44099808 1.19 Purchase42966 – 02/03/2018 44056842 1.19 Sale
1000000 – 09/03/2018 43056842 1.16 Sale– 938000 16/03/2018 43994842 1.18 Purchase
2382647 – 16/03/2018 41612195 1.12 Sale1407659 – 23/03/2018 40204536 1.08 Sale1100000 – 30/03/2018 39104536 1.05 Sale
3 Stichting Depositary Apg Emerging Markets Equity Pool 25260255 0.85
168010 – 07/04/2017 25092245 0.68 Sale– 241489 14/04/2017 25333734 0.68 Purchase
355775 – 21/04/2017 24977959 0.67 Sale2449465 – 12/05/2017 22528494 0.61 Sale
619519 – 19/05/2017 21908975 0.59 Sale590409 – 26/05/2017 21318566 0.57 Sale1347073 – 02/06/2017 19971493 0.54 Sale
– 28989 14/07/2017 20000482 0.54 Purchase– 80765 21/07/2017 20081247 0.54 Purchase– 611149 28/07/2017 20692396 0.56 Purchase– 202871 04/08/2017 20895267 0.56 Purchase– 461952 11/08/2017 21357219 0.57 Purchase– 374748 18/08/2017 21731967 0.58 Purchase
181795 – 01/09/2017 21550172 0.58 Sale– 380556 08/09/2017 21930728 0.59 Purchase– 461466 15/09/2017 22392194 0.60 Purchase– 151738 22/09/2017 22543932 0.61 Purchase
1405958 – 29/09/2017 21137974 0.57 Sale12047 – 06/10/2017 21125927 0.57 Sale
– 475855 20/10/2017 21601782 0.58 Purchase– 338854 27/10/2017 21940636 0.59 Purchase– 93140 31/10/2017 22033776 0.59 Purchase
1144025 – 03/11/2017 20889751 0.56 Sale– 150870 10/11/2017 21040621 0.57 Purchase
1058995 – 17/11/2017 19981626 0.54 Sale1125736 – 24/11/2017 18855890 0.51 Sale714284 – 01/12/2017 18141606 0.49 Sale
d) Shareholding Pattern of top ten Shareholders (other than Directors, Promoters and Holders of GDRs and ADRs): continued
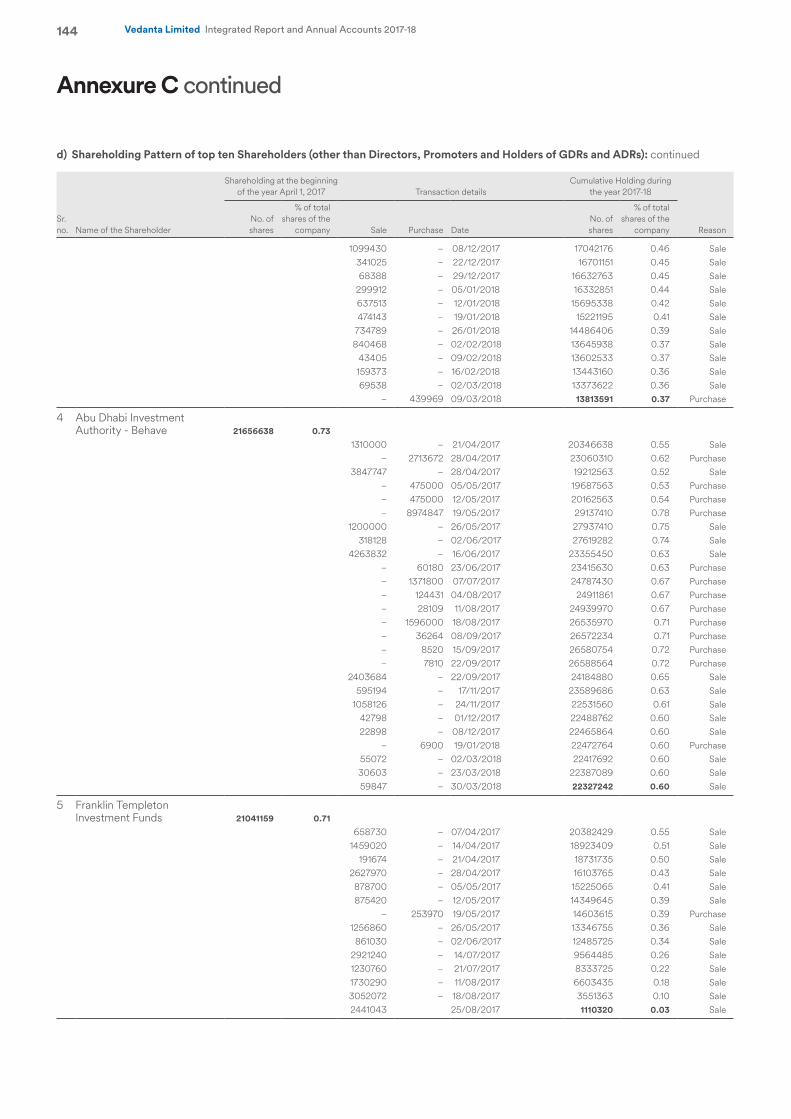
144 Vedanta Limited Integrated Report and Annual Accounts 2017-18
Sr. no. Name of the Shareholder
Shareholding at the beginning of the year April 1, 2017 Transaction details
Cumulative Holding during the year 2017-18
ReasonNo. of shares
% of total shares of the
company Sale Purchase DateNo. of shares
% of total shares of the
company
1099430 – 08/12/2017 17042176 0.46 Sale341025 – 22/12/2017 16701151 0.45 Sale68388 – 29/12/2017 16632763 0.45 Sale
299912 – 05/01/2018 16332851 0.44 Sale637513 – 12/01/2018 15695338 0.42 Sale474143 – 19/01/2018 15221195 0.41 Sale
734789 – 26/01/2018 14486406 0.39 Sale840468 – 02/02/2018 13645938 0.37 Sale
43405 – 09/02/2018 13602533 0.37 Sale159373 – 16/02/2018 13443160 0.36 Sale69538 – 02/03/2018 13373622 0.36 Sale
– 439969 09/03/2018 13813591 0.37 Purchase
4 Abu Dhabi Investment Authority - Behave 21656638 0.73
1310000 – 21/04/2017 20346638 0.55 Sale– 2713672 28/04/2017 23060310 0.62 Purchase
3847747 – 28/04/2017 19212563 0.52 Sale– 475000 05/05/2017 19687563 0.53 Purchase– 475000 12/05/2017 20162563 0.54 Purchase– 8974847 19/05/2017 29137410 0.78 Purchase
1200000 – 26/05/2017 27937410 0.75 Sale318128 – 02/06/2017 27619282 0.74 Sale
4263832 – 16/06/2017 23355450 0.63 Sale– 60180 23/06/2017 23415630 0.63 Purchase– 1371800 07/07/2017 24787430 0.67 Purchase– 124431 04/08/2017 24911861 0.67 Purchase– 28109 11/08/2017 24939970 0.67 Purchase– 1596000 18/08/2017 26535970 0.71 Purchase– 36264 08/09/2017 26572234 0.71 Purchase– 8520 15/09/2017 26580754 0.72 Purchase– 7810 22/09/2017 26588564 0.72 Purchase
2403684 – 22/09/2017 24184880 0.65 Sale595194 – 17/11/2017 23589686 0.63 Sale
1058126 – 24/11/2017 22531560 0.61 Sale42798 – 01/12/2017 22488762 0.60 Sale22898 – 08/12/2017 22465864 0.60 Sale
– 6900 19/01/2018 22472764 0.60 Purchase55072 – 02/03/2018 22417692 0.60 Sale30603 – 23/03/2018 22387089 0.60 Sale59847 – 30/03/2018 22327242 0.60 Sale
5 Franklin Templeton Investment Funds 21041159 0.71
658730 – 07/04/2017 20382429 0.55 Sale1459020 – 14/04/2017 18923409 0.51 Sale
191674 – 21/04/2017 18731735 0.50 Sale2627970 – 28/04/2017 16103765 0.43 Sale878700 – 05/05/2017 15225065 0.41 Sale875420 – 12/05/2017 14349645 0.39 Sale
– 253970 19/05/2017 14603615 0.39 Purchase1256860 – 26/05/2017 13346755 0.36 Sale
861030 – 02/06/2017 12485725 0.34 Sale2921240 – 14/07/2017 9564485 0.26 Sale1230760 – 21/07/2017 8333725 0.22 Sale1730290 – 11/08/2017 6603435 0.18 Sale3052072 – 18/08/2017 3551363 0.10 Sale2441043 25/08/2017 1110320 0.03 Sale
d) Shareholding Pattern of top ten Shareholders (other than Directors, Promoters and Holders of GDRs and ADRs): continued
Annexure C continued
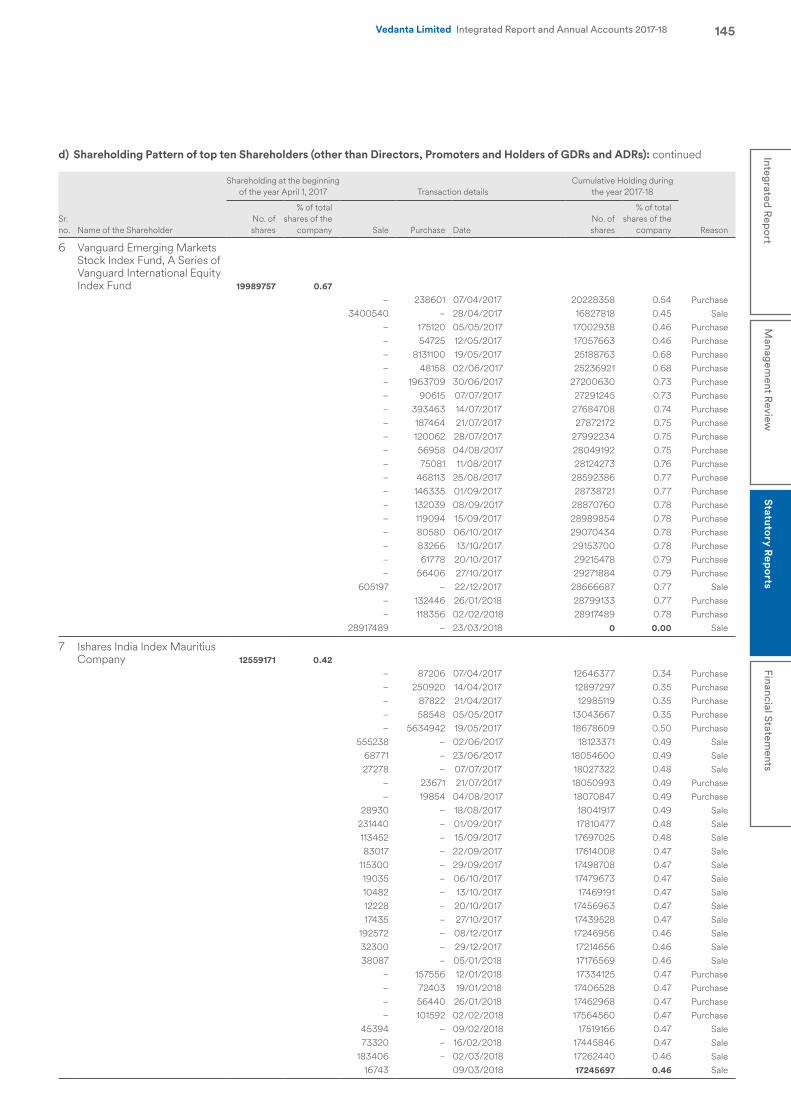
145Integrated R
eport
Managem
ent Review
Statutory R
eports
Financial Statements
Vedanta Limited Integrated Report and Annual Accounts 2017-18
Sr. no. Name of the Shareholder
Shareholding at the beginning of the year April 1, 2017 Transaction details
Cumulative Holding during the year 2017-18
ReasonNo. of shares
% of total shares of the
company Sale Purchase DateNo. of shares
% of total shares of the
company
6 Vanguard Emerging Markets Stock Index Fund, A Series of Vanguard International Equity Index Fund 19989757 0.67
– 238601 07/04/2017 20228358 0.54 Purchase3400540 – 28/04/2017 16827818 0.45 Sale
– 175120 05/05/2017 17002938 0.46 Purchase– 54725 12/05/2017 17057663 0.46 Purchase– 8131100 19/05/2017 25188763 0.68 Purchase– 48158 02/06/2017 25236921 0.68 Purchase– 1963709 30/06/2017 27200630 0.73 Purchase– 90615 07/07/2017 27291245 0.73 Purchase– 393463 14/07/2017 27684708 0.74 Purchase– 187464 21/07/2017 27872172 0.75 Purchase– 120062 28/07/2017 27992234 0.75 Purchase– 56958 04/08/2017 28049192 0.75 Purchase– 75081 11/08/2017 28124273 0.76 Purchase– 468113 25/08/2017 28592386 0.77 Purchase– 146335 01/09/2017 28738721 0.77 Purchase– 132039 08/09/2017 28870760 0.78 Purchase– 119094 15/09/2017 28989854 0.78 Purchase – 80580 06/10/2017 29070434 0.78 Purchase– 83266 13/10/2017 29153700 0.78 Purchase– 61778 20/10/2017 29215478 0.79 Purchase– 56406 27/10/2017 29271884 0.79 Purchase
605197 – 22/12/2017 28666687 0.77 Sale– 132446 26/01/2018 28799133 0.77 Purchase– 118356 02/02/2018 28917489 0.78 Purchase
28917489 – 23/03/2018 0 0.00 Sale
7 Ishares India Index Mauritius Company 12559171 0.42
– 87206 07/04/2017 12646377 0.34 Purchase– 250920 14/04/2017 12897297 0.35 Purchase – 87822 21/04/2017 12985119 0.35 Purchase– 58548 05/05/2017 13043667 0.35 Purchase– 5634942 19/05/2017 18678609 0.50 Purchase
555238 – 02/06/2017 18123371 0.49 Sale68771 – 23/06/2017 18054600 0.49 Sale27278 – 07/07/2017 18027322 0.48 Sale
– 23671 21/07/2017 18050993 0.49 Purchase– 19854 04/08/2017 18070847 0.49 Purchase
28930 – 18/08/2017 18041917 0.49 Sale231440 – 01/09/2017 17810477 0.48 Sale113452 – 15/09/2017 17697025 0.48 Sale83017 – 22/09/2017 17614008 0.47 Sale
115300 – 29/09/2017 17498708 0.47 Sale19035 – 06/10/2017 17479673 0.47 Sale10482 – 13/10/2017 17469191 0.47 Sale12228 – 20/10/2017 17456963 0.47 Sale17435 – 27/10/2017 17439528 0.47 Sale
192572 – 08/12/2017 17246956 0.46 Sale32300 – 29/12/2017 17214656 0.46 Sale38087 – 05/01/2018 17176569 0.46 Sale
– 157556 12/01/2018 17334125 0.47 Purchase– 72403 19/01/2018 17406528 0.47 Purchase– 56440 26/01/2018 17462968 0.47 Purchase– 101592 02/02/2018 17564560 0.47 Purchase
45394 – 09/02/2018 17519166 0.47 Sale73320 – 16/02/2018 17445846 0.47 Sale
183406 – 02/03/2018 17262440 0.46 Sale16743 09/03/2018 17245697 0.46 Sale
d) Shareholding Pattern of top ten Shareholders (other than Directors, Promoters and Holders of GDRs and ADRs): continued
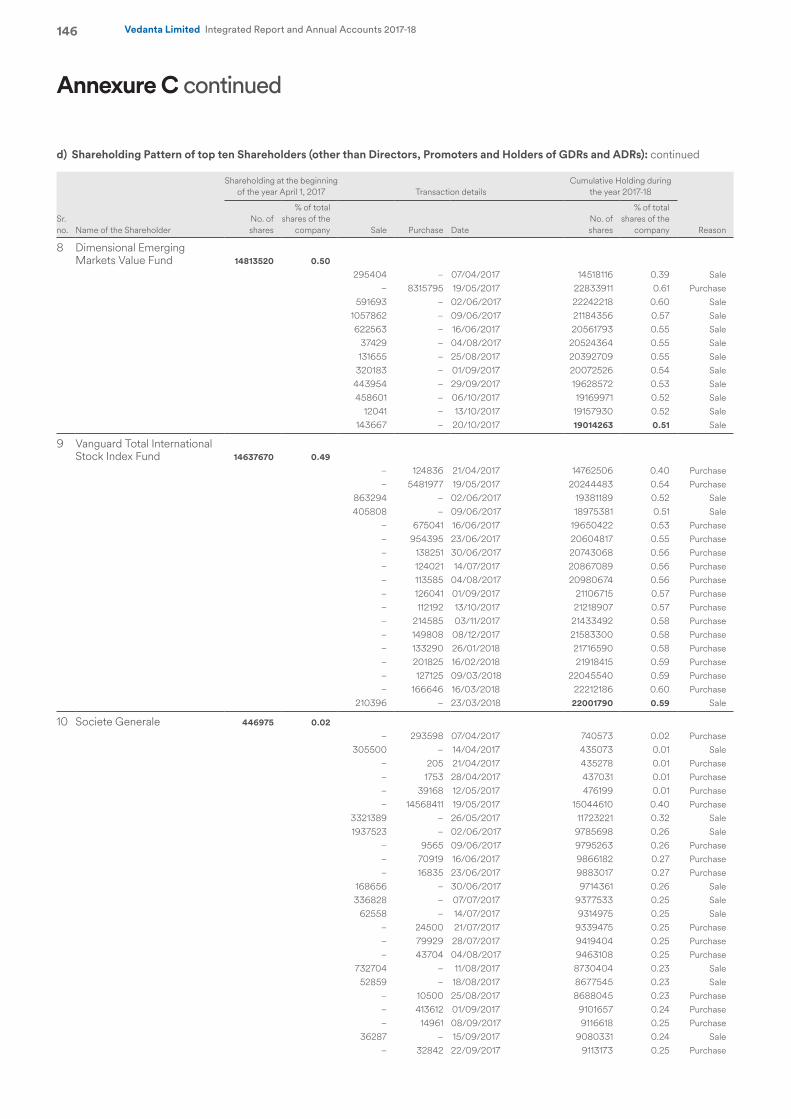
146 Vedanta Limited Integrated Report and Annual Accounts 2017-18
Sr. no. Name of the Shareholder
Shareholding at the beginning of the year April 1, 2017 Transaction details
Cumulative Holding during the year 2017-18
ReasonNo. of shares
% of total shares of the
company Sale Purchase DateNo. of shares
% of total shares of the
company
8 Dimensional Emerging Markets Value Fund 14813520 0.50
295404 – 07/04/2017 14518116 0.39 Sale– 8315795 19/05/2017 22833911 0.61 Purchase
591693 – 02/06/2017 22242218 0.60 Sale1057862 – 09/06/2017 21184356 0.57 Sale622563 – 16/06/2017 20561793 0.55 Sale
37429 – 04/08/2017 20524364 0.55 Sale131655 – 25/08/2017 20392709 0.55 Sale
320183 – 01/09/2017 20072526 0.54 Sale443954 – 29/09/2017 19628572 0.53 Sale458601 – 06/10/2017 19169971 0.52 Sale
12041 – 13/10/2017 19157930 0.52 Sale143667 – 20/10/2017 19014263 0.51 Sale
9 Vanguard Total International Stock Index Fund 14637670 0.49
– 124836 21/04/2017 14762506 0.40 Purchase– 5481977 19/05/2017 20244483 0.54 Purchase
863294 – 02/06/2017 19381189 0.52 Sale405808 – 09/06/2017 18975381 0.51 Sale
– 675041 16/06/2017 19650422 0.53 Purchase– 954395 23/06/2017 20604817 0.55 Purchase– 138251 30/06/2017 20743068 0.56 Purchase– 124021 14/07/2017 20867089 0.56 Purchase– 113585 04/08/2017 20980674 0.56 Purchase– 126041 01/09/2017 21106715 0.57 Purchase– 112192 13/10/2017 21218907 0.57 Purchase– 214585 03/11/2017 21433492 0.58 Purchase– 149808 08/12/2017 21583300 0.58 Purchase– 133290 26/01/2018 21716590 0.58 Purchase– 201825 16/02/2018 21918415 0.59 Purchase– 127125 09/03/2018 22045540 0.59 Purchase– 166646 16/03/2018 22212186 0.60 Purchase
210396 – 23/03/2018 22001790 0.59 Sale
10 Societe Generale 446975 0.02 – 293598 07/04/2017 740573 0.02 Purchase
305500 – 14/04/2017 435073 0.01 Sale – 205 21/04/2017 435278 0.01 Purchase – 1753 28/04/2017 437031 0.01 Purchase– 39168 12/05/2017 476199 0.01 Purchase– 14568411 19/05/2017 15044610 0.40 Purchase
3321389 – 26/05/2017 11723221 0.32 Sale1937523 – 02/06/2017 9785698 0.26 Sale
– 9565 09/06/2017 9795263 0.26 Purchase– 70919 16/06/2017 9866182 0.27 Purchase– 16835 23/06/2017 9883017 0.27 Purchase
168656 – 30/06/2017 9714361 0.26 Sale336828 – 07/07/2017 9377533 0.25 Sale
62558 – 14/07/2017 9314975 0.25 Sale– 24500 21/07/2017 9339475 0.25 Purchase– 79929 28/07/2017 9419404 0.25 Purchase– 43704 04/08/2017 9463108 0.25 Purchase
732704 – 11/08/2017 8730404 0.23 Sale52859 – 18/08/2017 8677545 0.23 Sale
– 10500 25/08/2017 8688045 0.23 Purchase– 413612 01/09/2017 9101657 0.24 Purchase– 14961 08/09/2017 9116618 0.25 Purchase
36287 – 15/09/2017 9080331 0.24 Sale– 32842 22/09/2017 9113173 0.25 Purchase
d) Shareholding Pattern of top ten Shareholders (other than Directors, Promoters and Holders of GDRs and ADRs): continued
Annexure C continued
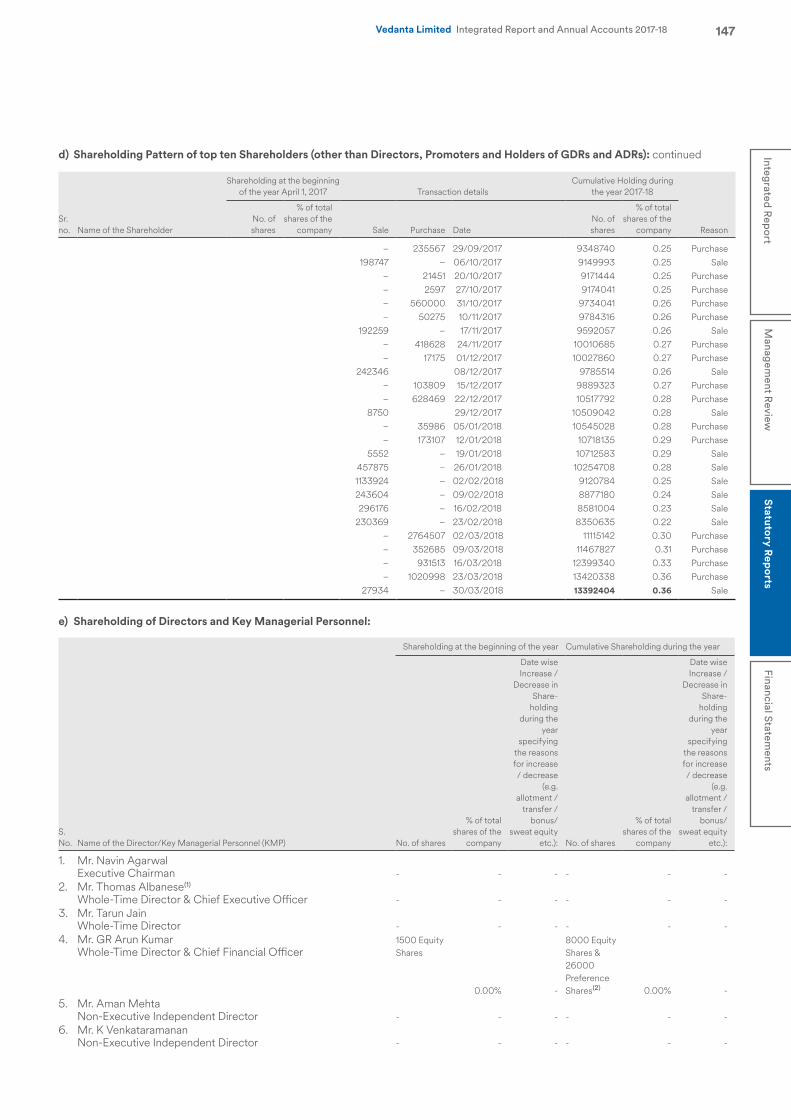
147Integrated R
eport
Managem
ent Review
Statutory R
eports
Financial Statements
Vedanta Limited Integrated Report and Annual Accounts 2017-18
Sr. no. Name of the Shareholder
Shareholding at the beginning of the year April 1, 2017 Transaction details
Cumulative Holding during the year 2017-18
ReasonNo. of shares
% of total shares of the
company Sale Purchase DateNo. of shares
% of total shares of the
company
– 235567 29/09/2017 9348740 0.25 Purchase198747 – 06/10/2017 9149993 0.25 Sale
– 21451 20/10/2017 9171444 0.25 Purchase– 2597 27/10/2017 9174041 0.25 Purchase– 560000 31/10/2017 9734041 0.26 Purchase– 50275 10/11/2017 9784316 0.26 Purchase
192259 – 17/11/2017 9592057 0.26 Sale– 418628 24/11/2017 10010685 0.27 Purchase– 17175 01/12/2017 10027860 0.27 Purchase
242346 08/12/2017 9785514 0.26 Sale– 103809 15/12/2017 9889323 0.27 Purchase– 628469 22/12/2017 10517792 0.28 Purchase
8750 29/12/2017 10509042 0.28 Sale– 35986 05/01/2018 10545028 0.28 Purchase– 173107 12/01/2018 10718135 0.29 Purchase
5552 – 19/01/2018 10712583 0.29 Sale457875 – 26/01/2018 10254708 0.28 Sale1133924 – 02/02/2018 9120784 0.25 Sale243604 – 09/02/2018 8877180 0.24 Sale296176 – 16/02/2018 8581004 0.23 Sale
230369 – 23/02/2018 8350635 0.22 Sale – 2764507 02/03/2018 11115142 0.30 Purchase – 352685 09/03/2018 11467827 0.31 Purchase – 931513 16/03/2018 12399340 0.33 Purchase – 1020998 23/03/2018 13420338 0.36 Purchase
27934 – 30/03/2018 13392404 0.36 Sale
e) Shareholding of Directors and Key Managerial Personnel:
S. No. Name of the Director/Key Managerial Personnel (KMP)
Shareholding at the beginning of the year Cumulative Shareholding during the year
No. of shares
% of total shares of the
company
Date wise Increase /
Decrease in Share-
holding during the
year specifying
the reasons for increase / decrease
(e.g. allotment /
transfer / bonus/
sweat equity etc.): No. of shares
% of total shares of the
company
Date wise Increase /
Decrease in Share-
holding during the
year specifying
the reasons for increase / decrease
(e.g. allotment /
transfer / bonus/
sweat equity etc.):
1. Mr. Navin Agarwal Executive Chairman - - - - - -
2. Mr. Thomas Albanese(1)
Whole-Time Director & Chief Executive Officer - - - - - -3. Mr. Tarun Jain
Whole-Time Director - - - - - -4. Mr. GR Arun Kumar
Whole-Time Director & Chief Financial Officer1500 Equity Shares
0.00% -
8000 Equity Shares & 26000 Preference Shares(2) 0.00% -
5. Mr. Aman MehtaNon-Executive Independent Director - - - - - -
6. Mr. K VenkataramananNon-Executive Independent Director - - - - - -
d) Shareholding Pattern of top ten Shareholders (other than Directors, Promoters and Holders of GDRs and ADRs): continued
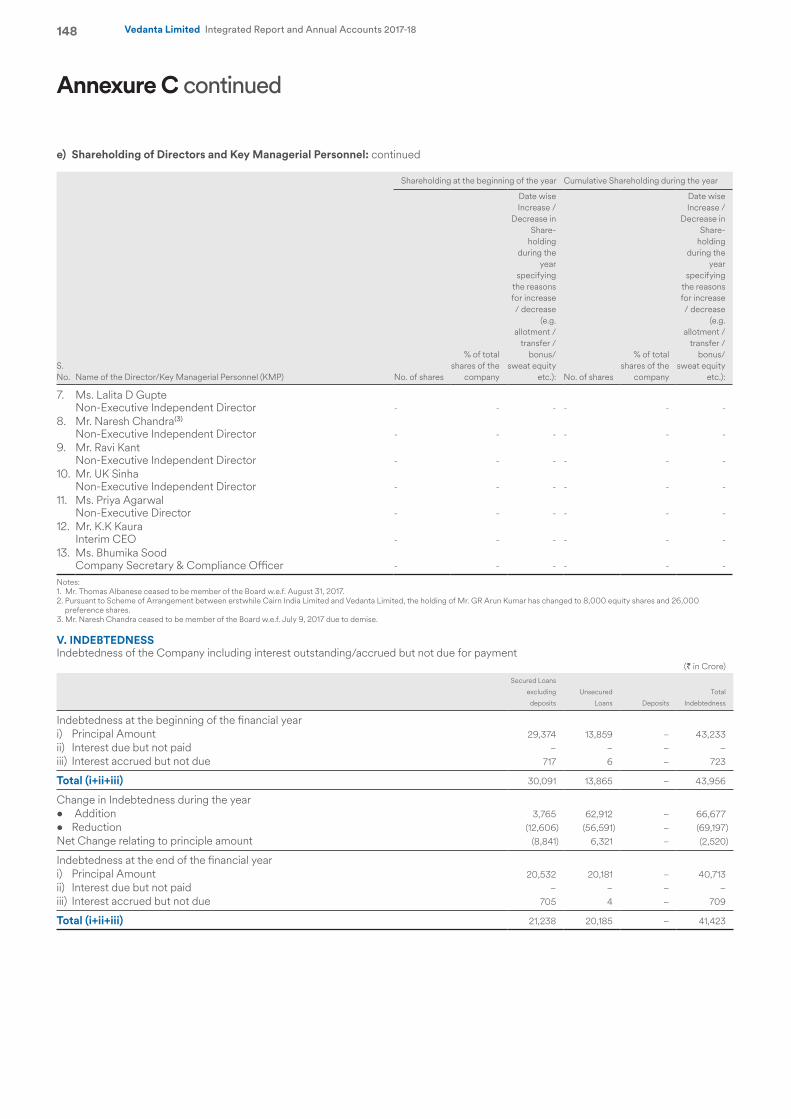
148 Vedanta Limited Integrated Report and Annual Accounts 2017-18
S. No. Name of the Director/Key Managerial Personnel (KMP)
Shareholding at the beginning of the year Cumulative Shareholding during the year
No. of shares
% of total shares of the
company
Date wise Increase /
Decrease in Share-
holding during the
year specifying
the reasons for increase / decrease
(e.g. allotment /
transfer / bonus/
sweat equity etc.): No. of shares
% of total shares of the
company
Date wise Increase /
Decrease in Share-
holding during the
year specifying
the reasons for increase / decrease
(e.g. allotment /
transfer / bonus/
sweat equity etc.):
7. Ms. Lalita D GupteNon-Executive Independent Director - - - - - -
8. Mr. Naresh Chandra(3)
Non-Executive Independent Director - - - - - -9. Mr. Ravi Kant
Non-Executive Independent Director - - - - - -10. Mr. UK Sinha
Non-Executive Independent Director - - - - - -11. Ms. Priya Agarwal
Non-Executive Director - - - - - -12. Mr. K.K Kaura
Interim CEO - - - - - -13. Ms. Bhumika Sood
Company Secretary & Compliance Officer - - - - - -
Notes:1. Mr. Thomas Albanese ceased to be member of the Board w.e.f. August 31, 2017.2. Pursuant to Scheme of Arrangement between erstwhile Cairn India Limited and Vedanta Limited, the holding of Mr. GR Arun Kumar has changed to 8,000 equity shares and 26,000
preference shares.3. Mr. Naresh Chandra ceased to be member of the Board w.e.f. July 9, 2017 due to demise.
V. INDEBTEDNESS Indebtedness of the Company including interest outstanding/accrued but not due for payment
(` in Crore)
Secured Loans
excluding
deposits
Unsecured
Loans Deposits
Total
Indebtedness
Indebtedness at the beginning of the financial yeari) Principal Amount 29,374 13,859 – 43,233ii) Interest due but not paid – – – –iii) Interest accrued but not due 717 6 – 723
Total (i+ii+iii) 30,091 13,865 – 43,956
Change in Indebtedness during the year• Addition 3,765 62,912 – 66,677• Reduction (12,606) (56,591) – (69,197)Net Change relating to principle amount (8,841) 6,321 – (2,520)
Indebtedness at the end of the financial yeari) Principal Amount 20,532 20,181 – 40,713ii) Interest due but not paid – – – –iii) Interest accrued but not due 705 4 – 709
Total (i+ii+iii) 21,238 20,185 – 41,423
e) Shareholding of Directors and Key Managerial Personnel: continued
Annexure C continued
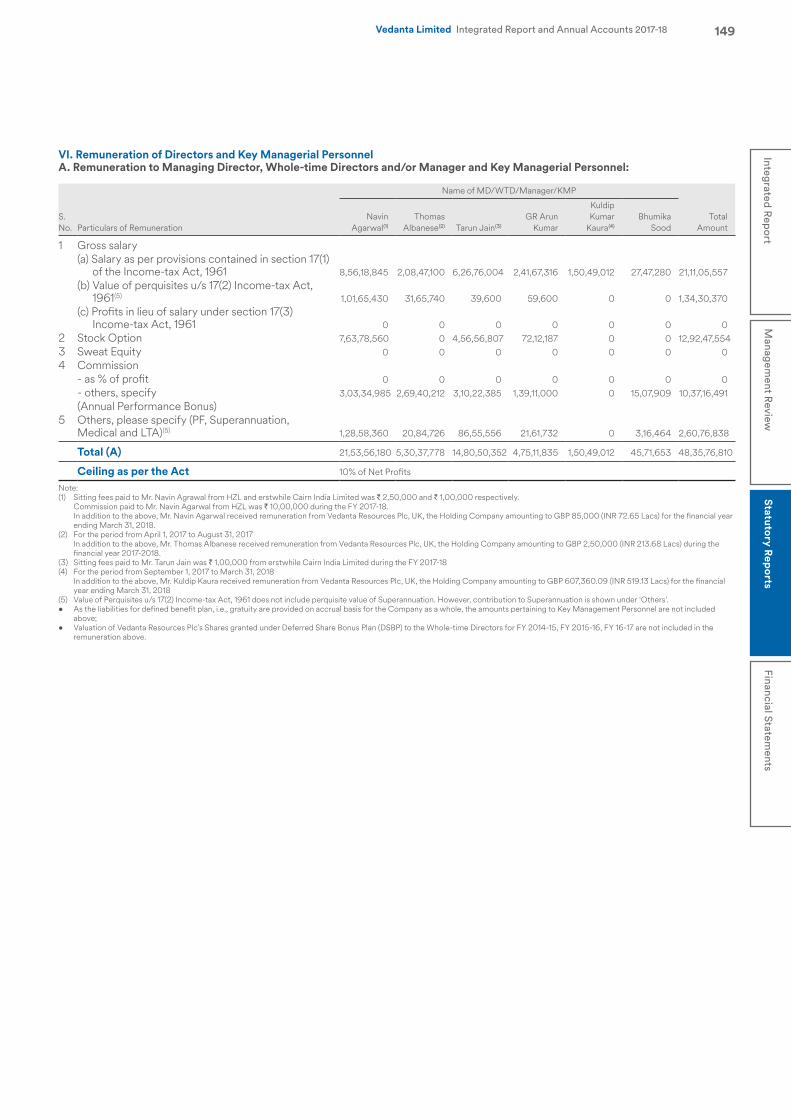
149Integrated R
eport
Managem
ent Review
Statutory R
eports
Financial Statements
Vedanta Limited Integrated Report and Annual Accounts 2017-18
VI. Remuneration of Directors and Key Managerial PersonnelA. Remuneration to Managing Director, Whole-time Directors and/or Manager and Key Managerial Personnel:
S. No. Particulars of Remuneration
Name of MD/WTD/Manager/KMP
Total Amount
Navin Agarwal(1)
Thomas Albanese(2) Tarun Jain(3)
GR Arun Kumar
Kuldip Kumar
Kaura(4)
Bhumika Sood
1 Gross salary(a) Salary as per provisions contained in section 17(1)
of the Income-tax Act, 1961 8,56,18,845 2,08,47,100 6,26,76,004 2,41,67,316 1,50,49,012 27,47,280 21,11,05,557(b) Value of perquisites u/s 17(2) Income-tax Act,
1961(5) 1,01,65,430 31,65,740 39,600 59,600 0 0 1,34,30,370(c) Profits in lieu of salary under section 17(3)
Income-tax Act, 1961 0 0 0 0 0 0 02 Stock Option 7,63,78,560 0 4,56,56,807 72,12,187 0 0 12,92,47,5543 Sweat Equity 0 0 0 0 0 0 04 Commission
- as % of profit 0 0 0 0 0 0 0- others, specify 3,03,34,985 2,69,40,212 3,10,22,385 1,39,11,000 0 15,07,909 10,37,16,491(Annual Performance Bonus)
5 Others, please specify (PF, Superannuation, Medical and LTA)(5) 1,28,58,360 20,84,726 86,55,556 21,61,732 0 3,16,464 2,60,76,838
Total (A) 21,53,56,180 5,30,37,778 14,80,50,352 4,75,11,835 1,50,49,012 45,71,653 48,35,76,810
Ceiling as per the Act 10% of Net Profits
Note: (1) Sitting fees paid to Mr. Navin Agrawal from HZL and erstwhile Cairn India Limited was ` 2,50,000 and ` 1,00,000 respectively. Commission paid to Mr. Navin Agarwal from HZL was ` 10,00,000 during the FY 2017-18. In addition to the above, Mr. Navin Agarwal received remuneration from Vedanta Resources Plc, UK, the Holding Company amounting to GBP 85,000 (INR 72.65 Lacs) for the financial year
ending March 31, 2018.(2) For the period from April 1, 2017 to August 31, 2017 In addition to the above, Mr. Thomas Albanese received remuneration from Vedanta Resources Plc, UK, the Holding Company amounting to GBP 2,50,000 (INR 213.68 Lacs) during the
financial year 2017-2018.(3) Sitting fees paid to Mr. Tarun Jain was ` 1,00,000 from erstwhile Cairn India Limited during the FY 2017-18(4) For the period from September 1, 2017 to March 31, 2018 In addition to the above, Mr. Kuldip Kaura received remuneration from Vedanta Resources Plc, UK, the Holding Company amounting to GBP 607,360.09 (INR 519.13 Lacs) for the financial
year ending March 31, 2018(5) Value of Perquisites u/s 17(2) Income-tax Act, 1961 does not include perquisite value of Superannuation. However, contribution to Superannuation is shown under ‘Others’.• As the liabilities for defined benefit plan, i.e., gratuity are provided on accrual basis for the Company as a whole, the amounts pertaining to Key Management Personnel are not included
above;• Valuation of Vedanta Resources Plc’s Shares granted under Deferred Share Bonus Plan (DSBP) to the Whole-time Directors for FY 2014-15, FY 2015-16, FY 16-17 are not included in the
remuneration above.
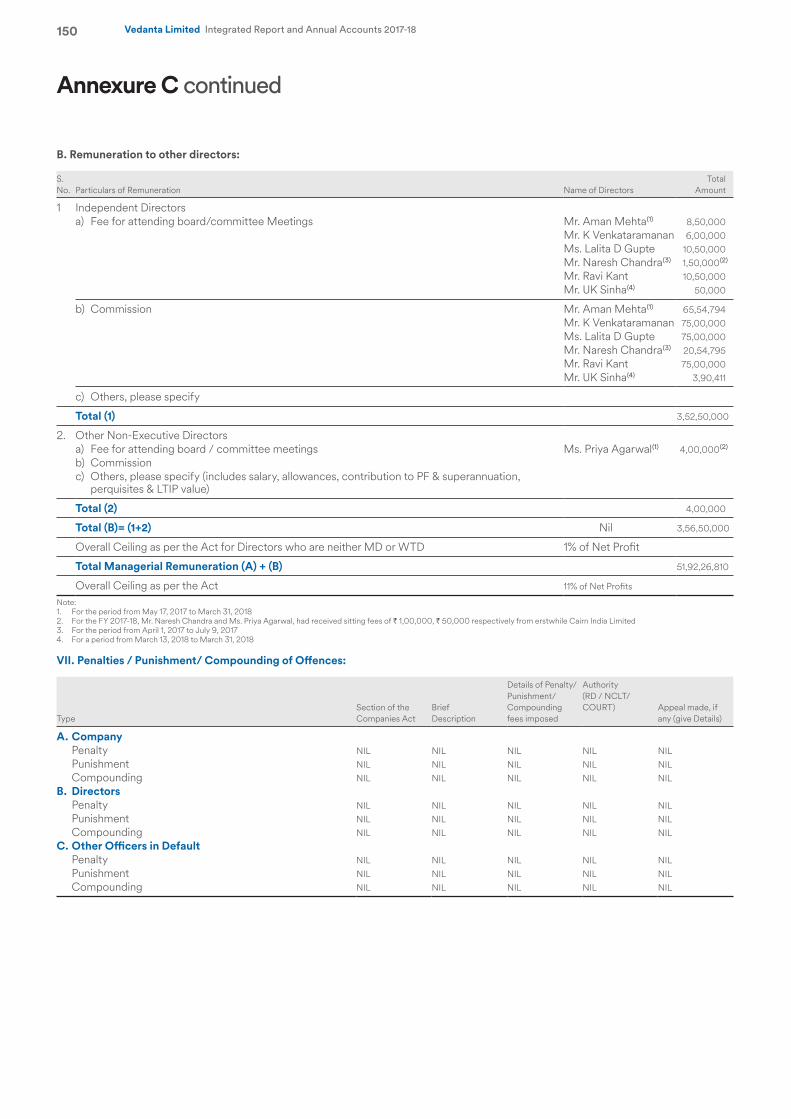
150 Vedanta Limited Integrated Report and Annual Accounts 2017-18
B. Remuneration to other directors:
S. No. Particulars of Remuneration Name of Directors
Total Amount
1 Independent Directors a) Fee for attending board/committee Meetings Mr. Aman Mehta(1) 8,50,000
Mr. K Venkataramanan 6,00,000Ms. Lalita D Gupte 10,50,000Mr. Naresh Chandra(3) 1,50,000(2)
Mr. Ravi Kant 10,50,000Mr. UK Sinha(4) 50,000
b) Commission Mr. Aman Mehta(1) 65,54,794Mr. K Venkataramanan 75,00,000Ms. Lalita D Gupte 75,00,000Mr. Naresh Chandra(3) 20,54,795Mr. Ravi Kant 75,00,000Mr. UK Sinha(4) 3,90,411
c) Others, please specify
Total (1) 3,52,50,000
2. Other Non-Executive Directorsa) Fee for attending board / committee meetings Ms. Priya Agarwal(1) 4,00,000(2)
b) Commissionc) Others, please specify (includes salary, allowances, contribution to PF & superannuation,
perquisites & LTIP value)
Total (2) 4,00,000
Total (B)= (1+2) Nil 3,56,50,000
Overall Ceiling as per the Act for Directors who are neither MD or WTD 1% of Net Profit
Total Managerial Remuneration (A) + (B) 51,92,26,810
Overall Ceiling as per the Act 11% of Net Profits
Note:1. For the period from May 17, 2017 to March 31, 20182. For the FY 2017-18, Mr. Naresh Chandra and Ms. Priya Agarwal, had received sitting fees of ` 1,00,000, ` 50,000 respectively from erstwhile Cairn India Limited3. For the period from April 1, 2017 to July 9, 2017 4. For a period from March 13, 2018 to March 31, 2018
VII. Penalties / Punishment/ Compounding of Offences:
TypeSection of the Companies Act
Brief Description
Details of Penalty/ Punishment/ Compounding fees imposed
Authority (RD / NCLT/ COURT) Appeal made, if
any (give Details)
A. Company Penalty NIL NIL NIL NIL NIL Punishment NIL NIL NIL NIL NIL Compounding NIL NIL NIL NIL NILB. Directors Penalty NIL NIL NIL NIL NIL Punishment NIL NIL NIL NIL NIL Compounding NIL NIL NIL NIL NILC. Other Officers in Default Penalty NIL NIL NIL NIL NIL Punishment NIL NIL NIL NIL NIL Compounding NIL NIL NIL NIL NIL
Annexure C continued
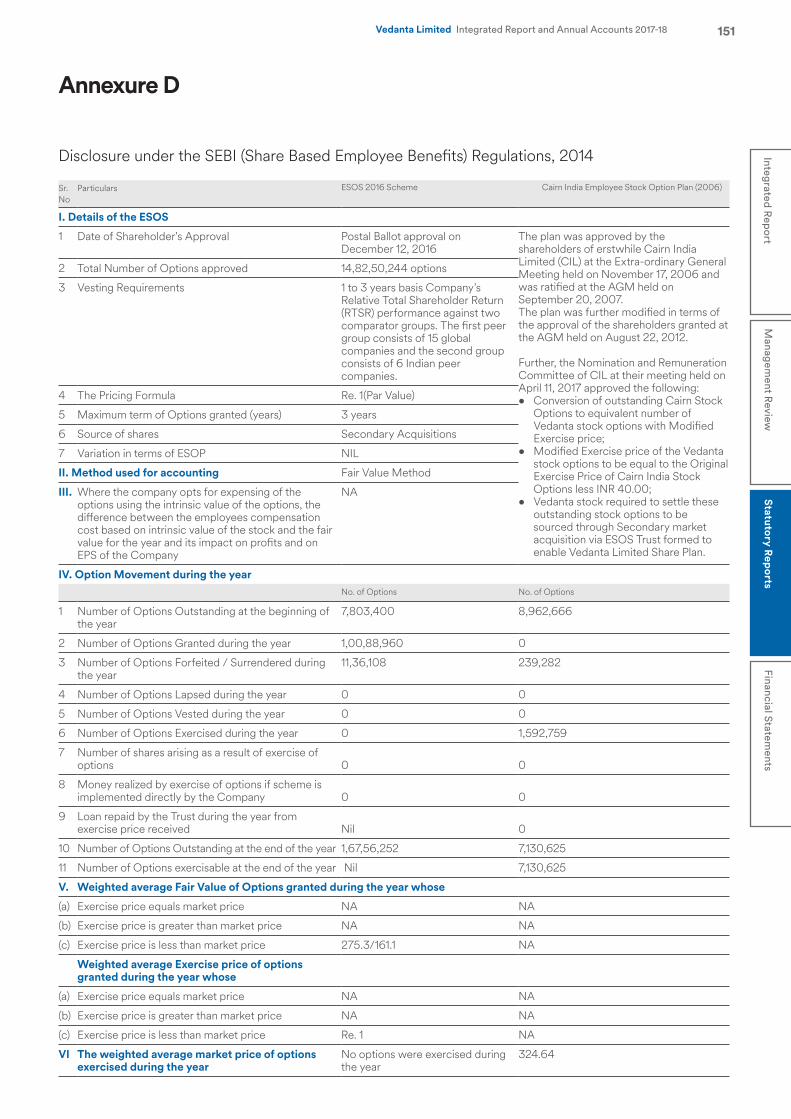
151Integrated R
eport
Managem
ent Review
Statutory R
eports
Financial Statements
Vedanta Limited Integrated Report and Annual Accounts 2017-18
Annexure D
Disclosure under the SEBI (Share Based Employee Benefits) Regulations, 2014
Sr. No
Particulars ESOS 2016 Scheme Cairn India Employee Stock Option Plan (2006)
I. Details of the ESOS
1 Date of Shareholder's Approval Postal Ballot approval on December 12, 2016
The plan was approved by the shareholders of erstwhile Cairn India Limited (CIL) at the Extra-ordinary General Meeting held on November 17, 2006 and was ratified at the AGM held on September 20, 2007.The plan was further modified in terms of the approval of the shareholders granted at the AGM held on August 22, 2012.
Further, the Nomination and Remuneration Committee of CIL at their meeting held on April 11, 2017 approved the following:• Conversion of outstanding Cairn Stock
Options to equivalent number of Vedanta stock options with Modified Exercise price;
• Modified Exercise price of the Vedanta stock options to be equal to the Original Exercise Price of Cairn India Stock Options less INR 40.00;
• Vedanta stock required to settle these outstanding stock options to be sourced through Secondary market acquisition via ESOS Trust formed to enable Vedanta Limited Share Plan.
2 Total Number of Options approved 14,82,50,244 options
3 Vesting Requirements 1 to 3 years basis Company’s Relative Total Shareholder Return (RTSR) performance against two comparator groups. The first peer group consists of 15 global companies and the second group consists of 6 Indian peer companies.
4 The Pricing Formula Re. 1(Par Value)
5 Maximum term of Options granted (years) 3 years
6 Source of shares Secondary Acquisitions
7 Variation in terms of ESOP NIL
II. Method used for accounting Fair Value Method
III. Where the company opts for expensing of the options using the intrinsic value of the options, the difference between the employees compensation cost based on intrinsic value of the stock and the fair value for the year and its impact on profits and on EPS of the Company
NA
IV. Option Movement during the yearNo. of Options No. of Options
1 Number of Options Outstanding at the beginning of the year
7,803,400 8,962,666
2 Number of Options Granted during the year 1,00,88,960 0
3 Number of Options Forfeited / Surrendered during the year
11,36,108 239,282
4 Number of Options Lapsed during the year 0 0
5 Number of Options Vested during the year 0 0
6 Number of Options Exercised during the year 0 1,592,759
7 Number of shares arising as a result of exercise of options 0 0
8 Money realized by exercise of options if scheme is implemented directly by the Company 0 0
9 Loan repaid by the Trust during the year from exercise price received Nil 0
10 Number of Options Outstanding at the end of the year 1,67,56,252 7,130,625
11 Number of Options exercisable at the end of the year Nil 7,130,625
V. Weighted average Fair Value of Options granted during the year whose
(a) Exercise price equals market price NA NA
(b) Exercise price is greater than market price NA NA
(c) Exercise price is less than market price 275.3/161.1 NA
Weighted average Exercise price of options granted during the year whose
(a) Exercise price equals market price NA NA
(b) Exercise price is greater than market price NA NA
(c) Exercise price is less than market price Re. 1 NA
VI The weighted average market price of options exercised during the year
No options were exercised during the year
324.64
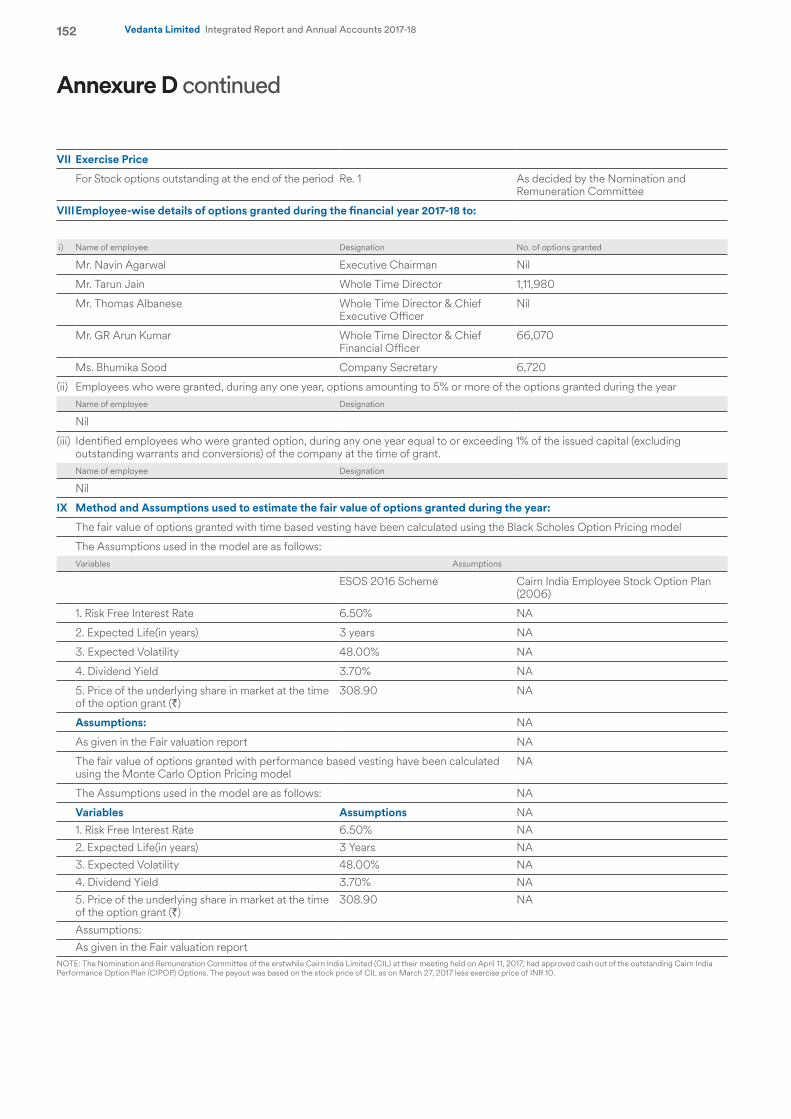
152 Vedanta Limited Integrated Report and Annual Accounts 2017-18
VII Exercise Price
For Stock options outstanding at the end of the period Re. 1 As decided by the Nomination and Remuneration Committee
VIIIEmployee-wise details of options granted during the financial year 2017-18 to:
i) Name of employee Designation No. of options granted
Mr. Navin Agarwal Executive Chairman Nil
Mr. Tarun Jain Whole Time Director 1,11,980
Mr. Thomas Albanese Whole Time Director & Chief Executive Officer
Nil
Mr. GR Arun Kumar Whole Time Director & Chief Financial Officer
66,070
Ms. Bhumika Sood Company Secretary 6,720
(ii) Employees who were granted, during any one year, options amounting to 5% or more of the options granted during the year Name of employee Designation
Nil
(iii) Identified employees who were granted option, during any one year equal to or exceeding 1% of the issued capital (excluding outstanding warrants and conversions) of the company at the time of grant.
Name of employee Designation
Nil
IX Method and Assumptions used to estimate the fair value of options granted during the year:
The fair value of options granted with time based vesting have been calculated using the Black Scholes Option Pricing model
The Assumptions used in the model are as follows:Variables Assumptions
ESOS 2016 Scheme Cairn India Employee Stock Option Plan (2006)
1. Risk Free Interest Rate 6.50% NA
2. Expected Life(in years) 3 years NA
3. Expected Volatility 48.00% NA
4. Dividend Yield 3.70% NA
5. Price of the underlying share in market at the time of the option grant (`)
308.90 NA
Assumptions: NA
As given in the Fair valuation report NA
The fair value of options granted with performance based vesting have been calculated using the Monte Carlo Option Pricing model
NA
The Assumptions used in the model are as follows: NA
Variables Assumptions NA1. Risk Free Interest Rate 6.50% NA2. Expected Life(in years) 3 Years NA3. Expected Volatility 48.00% NA4. Dividend Yield 3.70% NA5. Price of the underlying share in market at the time of the option grant (`)
308.90 NA
Assumptions: As given in the Fair valuation report
NOTE: The Nomination and Remuneration Committee of the erstwhile Cairn India Limited (CIL) at their meeting held on April 11, 2017, had approved cash out of the outstanding Cairn India Performance Option Plan (CIPOP) Options. The payout was based on the stock price of CIL as on March 27, 2017 less exercise price of INR 10.
Annexure D continued
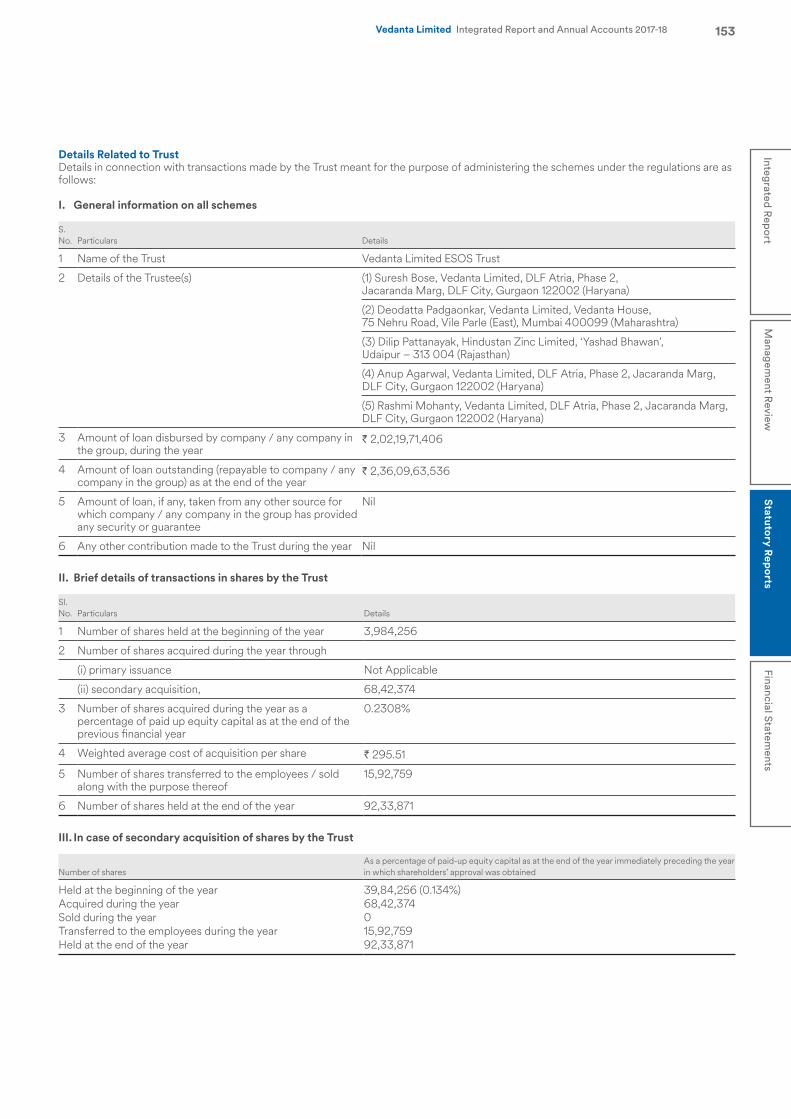
153Integrated R
eport
Managem
ent Review
Statutory R
eports
Financial Statements
Vedanta Limited Integrated Report and Annual Accounts 2017-18
Details Related to TrustDetails in connection with transactions made by the Trust meant for the purpose of administering the schemes under the regulations are as follows:
I. General information on all schemes
S. No. Particulars Details
1 Name of the Trust Vedanta Limited ESOS Trust
2 Details of the Trustee(s) (1) Suresh Bose, Vedanta Limited, DLF Atria, Phase 2,Jacaranda Marg, DLF City, Gurgaon 122002 (Haryana)
(2) Deodatta Padgaonkar, Vedanta Limited, Vedanta House, 75 Nehru Road, Vile Parle (East), Mumbai 400099 (Maharashtra)
(3) Dilip Pattanayak, Hindustan Zinc Limited, ‘Yashad Bhawan’, Udaipur – 313 004 (Rajasthan)
(4) Anup Agarwal, Vedanta Limited, DLF Atria, Phase 2, Jacaranda Marg, DLF City, Gurgaon 122002 (Haryana)
(5) Rashmi Mohanty, Vedanta Limited, DLF Atria, Phase 2, Jacaranda Marg, DLF City, Gurgaon 122002 (Haryana)
3 Amount of loan disbursed by company / any company in the group, during the year
` 2,02,19,71,406
4 Amount of loan outstanding (repayable to company / any company in the group) as at the end of the year
` 2,36,09,63,536
5 Amount of loan, if any, taken from any other source for which company / any company in the group has provided any security or guarantee
Nil
6 Any other contribution made to the Trust during the year Nil
II. Brief details of transactions in shares by the Trust
Sl. No. Particulars Details
1 Number of shares held at the beginning of the year 3,984,256
2 Number of shares acquired during the year through
(i) primary issuance Not Applicable
(ii) secondary acquisition, 68,42,374
3 Number of shares acquired during the year as a percentage of paid up equity capital as at the end of the previous financial year
0.2308%
4 Weighted average cost of acquisition per share ` 295.51
5 Number of shares transferred to the employees / sold along with the purpose thereof
15,92,759
6 Number of shares held at the end of the year 92,33,871
III. In case of secondary acquisition of shares by the Trust
Number of sharesAs a percentage of paid-up equity capital as at the end of the year immediately preceding the year in which shareholders’ approval was obtained
Held at the beginning of the year 39,84,256 (0.134%)Acquired during the year 68,42,374 Sold during the year 0 Transferred to the employees during the year 15,92,759Held at the end of the year 92,33,871
154 Vedanta Limited Integrated Report and Annual Accounts 2017-18
Annexure ESecretarial Audit Reportfor the financial year ended March 31, 2018
The Members, Vedanta Limited 1st Floor, C Wing,Unit No. 103, Corporate Avenue, Atul ProjectsChakala, Andheri(East)Mumbai-400093
We have conducted the secretarial audit of the compliance of applicable statutory provisions and the adherence to good corporate practices by Vedanta Limited (hereinafter called the company). Secretarial Audit was conducted in a manner that provided us a reasonable basis for evaluating the corporate conducts / statutory compliances and expressing our opinion thereon.
Based on our verification of the Company’s books, papers, minute books, forms and returns filed and other records maintained by the company and also the information provided by the Company, its officers, agents and authorized representatives during the conduct of secretarial audit. We hereby report that in our opinion, the company has, during the audit period covering the financial year ended on March 31, 2018 complied with the statutory provisions listed hereunder and also that the Company has proper Board-processes and compliance-mechanism in place to the extent, in the manner and subject to the reporting made hereinafter:
We have examined the books, papers, minute books, forms and returns filed and other records maintained by the Company for the financial year ended on March 31, 2018 according to the provisions of:
(i) The Companies Act, 2013 (the Act) and the rules made thereunder;
(ii) The Securities Contracts (Regulation) Act, 1956 (‘SCRA’) and the rules made thereunder;
(iii) The Depositories Act, 1996 and the Regulations and Bye-laws framed thereunder to the extent of Regulation 55A;
(iv) Foreign Exchange Management Act, 1999 and the rules and regulations made thereunder to the extent of Foreign Direct Investment, Overseas Direct Investment and External Commercial Borrowings;
(v) The following Regulations and Guidelines prescribed under the Securities and Exchange Board of India Act, 1992 (‘SEBI Act’):-a) The Securities and Exchange Board of India (Substantial
Acquisition of Shares and Takeovers) Regulations, 2011; b) The Securities and Exchange Board of India (Prohibition of
Insider Trading) Regulations, 2015; c) The Securities and Exchange Board of India (Issue of Capital
and Disclosure Requirements) Regulations, 2009; d) The Securities and Exchange Board of India (Share Based
employee Benefits) Regulations, 2014; e) The Securities and Exchange Board of India (Issue and Listing
of Debt Securities) Regulations, 2008; f) The Securities and Exchange Board of India (Registrars to an
Issue and Share Transfer Agents) Regulations, 1993 regarding the Companies Act and dealing with client to the extent of securities issued;
g) The Securities and Exchange Board of India (Delisting of Equity Shares) Regulations, 2009; Not Applicable
h) The Securities and Exchange Board of India (Buyback of Securities) Regulations, 1998. Not Applicable
(vi) The other laws, as informed and certified by the management of the Company which are specifically applicable to the Company based on their Sectors/Businesses are:a) Mines and Minerals (Development Regulation) Act, 2015 and
rules and regulations made thereunder;b) Indian Boilers Act, 1923 and rules and regulations made
thereunder; c) Manufacture, Storage and Import of Hazardous Chemical
Rules, 1989. We have also examined compliance with the applicable clauses of the following: a) Secretarial Standards issued by The Institute of Company
Secretaries of India. b) SEBI (Listing Obligations and Disclosure Requirements)
Regulations, 2015.
During the period under review the Company has generally complied with the provisions of the Act, Rules, Regulations, Guidelines, Standards, etc. mentioned above.
We further report that,
The Board of Directors of the Company is duly constituted with proper balance of Executive Directors, Non-Executive Directors and Independent Directors. The changes in the composition of the Board of Directors that took place during the period under review were carried out in compliance with the provisions of the Act.
Adequate notice is given to all directors to schedule the Board Meetings, agenda and detailed notes on agenda were sent in advance(and at a Shorter Notice for which necessary approvals obtained), and a system exists for seeking and obtaining further information and clarifications on the agenda items before the meeting and for meaningful participation at the meeting.
All decisions at Board Meetings and Committee Meetings are carried out unanimously as recorded in the minutes of the meetings of the Board of Directors or Committee of the Board, as the case may be.
We further report that there are adequate systems and processes in the company commensurate with the size and operations of the company to monitor and ensure compliance with applicable laws, rules, regulations and guidelines.
We further report that during the audit period following major events have happened which are deemed to have major bearing on the company’s affairs in pursuance of the above referred laws, rules, regulations, guidelines, standards, etc.
1. Cairn India Limited has merged with the Company vide National Company Law Tribunal, Mumbai Bench order dated 23rd March 2017 effective from April 11th 2017.
155Integrated R
eport
Managem
ent Review
Statutory R
eports
Financial Statements
Vedanta Limited Integrated Report and Annual Accounts 2017-18
2. The Company has issued 752,500,000 equity shares of ` 1/- each fully paid up pursuant to scheme of arrangement between Cairn India Limited and Vedanta Limited as approved by National Company Law Tribunal, Mumbai Bench dated 23rd March 2017.
3. The Company has issued 3,010,000,000 Non-Convertible Non-Cumulative Redeemable Preference shares of ` 10/- each fully paid up pursuant to scheme of arrangement between Cairn India Limited and Vedanta Limited as approved by National Company Law Tribunal, Mumbai Bench dated 23rd March 2017.
4. The Company has issued Non-Convertible Debentures of ` 4,850 Crores during the period under review.
5. The Company has redeemed Non-Convertible Debentures of ` 3500 Crores during the period under review.
Date: 27.04.2018Place: Delhi
For Chandrasekaran AssociatesCompany Secretaries
Dr. S ChandrasekaranCompany SecretariesSenior PartnerMembership No. 1644Certificate of Practice No. 715Note: This report is to be read with our letter of even date which is annexed as Annexure-A to this report and forms an integral part of this report.
The Members, Vedanta Limited 1st Floor, C Wing,Unit No. 103, Corporate Avenue, Atul ProjectsChakala, Andheri(East)Mumbai-400093
1. Maintenance of secretarial record is the responsibility of the management of the Company. Our responsibility is to express an opinion on these secretarial records based on our audit.
2. We have followed the audit practices and processes as were appropriate to obtain reasonable assurance about the correctness of the contents of the secretarial records. The verification was done on the random test basis to ensure that correct facts are reflected in secretarial records. We believe that the processes and practices, we followed provide a reasonable basis for our opinion.
3. We have not verified the correctness and appropriateness of financial records and Books of Accounts of the Company.
4. Where ever required, we have obtained the Management representation about the compliance of laws, rules and regulations and happening of events etc.
5. The compliance of the provisions of Corporate and other applicable laws, rules, regulations, standards is the responsibility of management. Our examination was limited to the verification of procedures on the random test basis.
6. The Secretarial Audit report is neither an assurance as to the future viability of the company nor of the efficacy or effectiveness with which the management has conducted the affairs of the Company.
Date: 27.04.2018Place: Delhi
For Chandrasekaran AssociatesCompany Secretaries
Dr. S ChandrasekaranCompany SecretariesSenior PartnerMembership No. 1644Certificate of Practice No. 715
Annexure-A to the Secretarial Audit Report
156 Vedanta Limited Integrated Report and Annual Accounts 2017-18
Annexure F
(A) Conservation of Energy:a) Conservation of natural resources continues to be the key
focus area of your Company. Some of the important steps taken in this direction follow.
Oil & Gas Business:Rajasthan Operationsi. Maximized uptime of Vapour Recovery Units to minimize the gas
flaring, and also avoided flaring during milling operations.ii. Optimized usage of Steam Driven Pumps and optimized the
efficiency of injection water heater. iii. Operation of Steam Turbine Generators (STGs) achieved at
>99% of rated capacity, thus reducing the grid power consumption. Further, STGs efficiency was improved by replacement of Separate Oil purification unit for Actuator.
iv. Energy efficiency improvement by installing Automatic Tube Cleaning System in heater exchangers.
v. VFD driven second stage condensate pump for pumping condensate into first stage separator at RGT (Efficiency improvement towards energy demand from 37 KW to 16 KW).
vi. Existing One Number Multi Plunger 2nd Stage pump with 37KW Motor replaced with Penta Flex wobble plate plunger pump with VFD Operated 15KW Motor. Hence power is saved by approximately 264 KWHr/ Day.
vii. Installation of separate Lighting Transformer from 430 V to 390 V which led to saving of 26,472.5 KW per annum.
Ravva Operationsi. Implemented two turbine operation of gas turbines instead of
three gas turbines during lower ambient temperature season, which has considerably reduced the fuel gas internal consumption (for plant operation) by ~4,38,892 SCM.
Cambay Operationsi. Automation of Crude Transfer Pump for optimizing pump
runhours.ii. Installation of Tip Seals in HCDP Condenser Fans, thereby
optimizing operating cycle of the fans.iii. Installation of Occupancy Sensor in office areas to optimize
lighting.iv. Installation of 150 LED Lights.v. Water sumps interconnection for energy conservation. vi. Hot oil heaters efficiency improvement by replacement of
refractory material.vii. PGBC after cooler fins internal cleaning by condensate and
chemical herewith increasing the efficiency and reduction in power consumption.
viii.Sludge reduction in Adani tanks using sludge breaker chemical by which fuel consumption for trucking back of sludge to Suvali terminal was eliminated.
ix. PGC after cooler temperature set point reduction, by which load on HCDP chillers reduced.
x. No waste oil sales by internal reprocessing.
Copper Business:i. Optimization of Smelter Scrubber Quenching water consumption.ii. Optimization of seal water consumption by recycling of the
same.iii. Improving the vacuum of waste heat steam turbine generator to
increase the power generation.iv. Usage of Energy efficient LED lighting (Conversion of around
25% of total lighting load).v. Reduction of fresh water consumption by improving the return
water consumption .vi. Condensate recovery in CPP.vii. Upgradation plant air compressor-C with energy efficient.viii.Variable speed drive for Tail gas scrubber recirculation pumps.ix. Optimize use of cooling water pumps and compressors in TPP.
Iron Ore Business:VABi. Coke oven stack bottom tapping to optimize the coke oven flue
gas heat intake in power plant boiler benefiting an increase in power generation by 2 MW.
ii. Utilization of excess BFG of BF3 by interconnection of Power plant 2 BFG duct with Power plant 1 benefiting an additional generation of 2.5 MW.
iii. Replacement of old water pumps of BF3 complex water pumping station with the energy efficient pumps and motors achieving power savings of 132 KW.
iv. Usage of blast furnace waste dust in sinter mix and oxygen enrichment in sinter combustion burner to reduce coke breeze consumption from 65 kg/TS to 60 Kg/TS.
v. Introduction of pulverized coal injection 50Kg/THM in PID-1 which is a replacement fuel to Coke.
vi. Retrofitting of pumping station of power plant having 2 river water pumps with a single energy efficient pump achieving power saving of 65 KW.
vii. Replacement of impeller of HBS CA fan with energy efficient one in PID-II achieving power saving of 46 KW.
viii.Sinter plant operation on 2 chill fans instead of 3 fans for around 40% of time by providing pneumatic gates for facilitating cleaning of wind box as and when required (Saving- 112 KW).
ix. Proportioning de-dusting fan optimization during monsoon season by regulating damper to 40% for power saving achieving power saving of 56 KW.
x. Automation of lights in PID-II for auto switching ON-OFF resulting in stoppage of wastage of power. (Saving- 10 KW)
xi. Initiated replacement of conventional lamps with the LED lamps in Value Addition Business in phased manner. (Saving- 20 KW)
xii. CT make-up pump discharge line orifice fixing. (Saving- 10 KW)xiii.Optimization in working pressure of compressor in PP-2.
(Saving- 10 KW) IOGi. Conversion of HPSV/MH lamps into LED fittings in Street lights,
high mast tower, Plant lighting and Haulage lighting of IOG. (Saving- 180,000 KWH)
ii. Operation of 250 HP Dewatering pump on VFD in place of conventional starter in Codli mine and use of VFD in Appron feeder. (Saving- 200,000 KWH)
iii. Impeller trimming of 425 HP Dewatering pump for energy conservation in Sonshi mine. (Saving- 240,000 KWH)
iv. Conversion of Office conventional light into Energy Efficient LED lights. (Saving- 5,000 KWH)
v. Automation to reduce idle running of conveyor in Bicholim and Codli mine. (Saving- 15,000 KWH)
vi. New Electrical operated Lighting tower installed near Stack -1, Pit-1 Stack and unfinished ore stack at EQU weighbridge and replaced mobile lighting tower DG-sets to avoid diesel consumption in Codli (VL). (Saving- 2 KL of Diesel)
vii. Operation of 425 HP *2 Nos. Dewatering pumps running of Electrical grid power instead of DG set in Codli (VL). (Saving- 70 KL of Diesel)
IOKFuel consumption and engine emission levels of the transport vehicles and earth moving equipment, together with the optimization of electrical energy consumption in all activities, remains a focus area.i. Installation of APFC panel in plant which has improved the
power factor and reduced the energy losses (Annual Saving – 37.27 KL of Diesel).
ii. Installation of LED Lighting in mobile lightning towers by replacing 1,000 W metal halide lamps with 300 W LED lamps and Haul road lights HPSV 250W to 90W (Annual Saving- 40 KL of Diesel)
iii. Replacement of High mask lighting tower with LED at railway siding (Annual Saving-17.48 KL of Diesel).
iv. Arresting of compressed air leakage as identified during the Energy audit (Annual Saving- 6.25 KL of Diesel)
v. Automation of mobile lighting device in mines resulting in reduction of extra diesel consumption (Annual Saving- 7.98 KL of Diesel).
157Integrated R
eport
Managem
ent Review
Statutory R
eports
Financial Statements
Vedanta Limited Integrated Report and Annual Accounts 2017-18
Power Business:2400MW Jharsuguda:i. Reduction in 200 KW power consumption of service water by
stopping one service water pump.ii. Auxiliary power reduction of 150 KW by running single seal air
fan for 6 Mills in service by reducing header pressure.iii. Savings of 44 KW to HVAC condenser without effecting
condenser performance.iv. Reduce the loading and unloading set points of individual
compressors by 0.5 Kpa, saving of 2 KW/MT of ash conveying.v. Reduction of specific power consumption to 1.98 KW/MT of
coal feeding by increasing conveyor loading/utilization.vi. Replace the existing 1000 no. of Halogen lamps with LED for
streetlights & Boiler, saving of 130 KW.vii. SWAS room pump loading reduction by reducing the flow by
5 KW.
1215 MW Jharsuguda:i. Cooling Tower fills replacement done in 8 units, Retrofit of BFP
Recirculation valves in all units, Condenser bullet cleaning in four unit, APH seals replacement done in four unit, Selective Soot blowing, CW Interconnection done in between unit 8 & 9 to improve vacuum & reduce auxiliary power consumption.
ii. Sliding pressure operation during partial load to save 5.2 Kcal/KWH in heat rate and 200 KW in BFP consumption.
iii. Reduction of unaccounted loss by 15 Kcal and reduce turbine heat rate from 2,113 to 2,098 Kcal.
iv. Establish mill operating window to improve air fuel ratio up to 1.1.
v. Periodic Condenser tube cleaning by bullet to reduce condenser DP upto design level and improve vacuum.
vi. Optimization of RH spray and RH steam temperature, water chemistry, running of drives & stopping idle equipment.
vii. U#8,6,2 all FF bag replacement with new bag (emission reduced from 48 µmg/m3 to 30 µmg/m3).
viii.Reduction of number of running mill during part load operation.ix. Stopping of One CW pump Load <500MW.
Aluminium Business: Smelter Plant Jharsuguda: Electrical Energy:DC Energy saving1. SGL100% cathode implementation2. Shandong cathode implementation
AC auxiliary Energy savingi. Drive installed in CT-1 with temperature feedback control in
Casthouse.ii. Installation of VFD in pump house.iii. FTP Air slide fan running hour optimization.iv. Implementation of 100% LED street lights in Smelter Plant-1.v. Optimization of Cooling tower running hour.vi. Replacement of LED lights in office and MCC area.vii. Installation of 10KW capacity Solar Power Plant.viii.Rectifier conversion efficiency improvement.
Lanjigarh- RefineryThe following major energy conservation measures are taken at Lanjigarh:-• Conversion of plant Street light to LED including high-mast
light.• Conversion of colony Street lights to LED.• Increase of throughput of Ball Mill-3 from 300 TPH to
320 TPH.• Bauxite Benefication Project.
Lanjigarh- CGPP• Internal modification in coal mill (2 nos).• Cooling tower fan hub modification.• Replacement of recirculation valve in BFP.• LED conversion from conventional lighting system in
switchyards.
(B) Additional investments and proposals, if any, being implemented for reduction of consumption of energy
Oil & Gas Business:Rajasthan Operationsi. 2nd number Multi Plunger 2nd Stage pump with 37 KW Motor to
also be replaced with Penta Flex wobble plate plunger pump with VFD Operated 15 KW Motor. Saving expected around 264 KWHr/day
ii. Replacement of Conventional type 250 W MV lamps Street Light fitting with LED type (65 nos.) to be taken up, with expected saving around 107 kWh per day.
iii. Replacement of Florescent tube light with LED tube light (425 Nos.) to be taken up in substation building and Security building in RGT and well pads, with expected saving around 165 KWH per day.
Ravva Operationsi. Installation of 24V, 0.37KW DC Motor with Solar power driven
instead of existing gas lift offshore chemical injection pumps to reduce gas lifting gas consumption at offshore platforms.
ii. VFD to be installed for LP flare blower motor. Reduction in energy consumption is estimated as 165,564 KWH as 75 KW motor which operates at 32.34KW will be operated at 11.6 KW.
iii. Replacing 40 nos. of 70W HPSV lamps with energy efficient 32W LED light fittings in plant.
iv. Replacing 500 nos. of 4 feet 36W fluorescent lamps with energy efficient 20W LED tubes in plant offices & LQ.
v. Replacing 15 nos. of existing 250W HPSV lamps in plant with energy efficient 90W LED lights in plant.
Cambay Operationsi. Installation of 150 LED Lights.
Copper Business:i. VFD for SAP-1 SFO-14 and SFO-9 blower (500KW). ii. Vapor absorption machine for chilled water application.iii. Replacement of conventional lights into LED lights.iv. Alternate green fuel for furnace oil.v. Planning to setup Sewage treatment plant to treat Municipal
sewage to generate fresh water for plant & nearby villages usage.
vi. Planning to setup Desalination plant to self-sustain on the water requirement.
Iron Ore Business:VABi. Replacement of conventional light fixtures with LED across
Value Addition Business.ii. Replacement of 2 nos. of HT Blower motors of Blast Furnace 1
and 2 with an Energy efficient motors.iii. Replacement of cooling tower pump at PID-1 with energy
efficient pump.iv. Replacement of return water pump at PID-1 with energy efficient
pump.v. Downsizing of screening de-dusting and propitiating dedusting
fan impellers.
IOG i. Lighting using conventional fixtures of around 900KW capacity
is planned to be converted into LED fixtures to obtain a saving of around 50%.
ii. Study of introducing inverter technology based Air conditioning systems with a saving of approx. 30% of energy utilized.
iii. Introducing VFD starter panels in 90% of de watering associated pumping systems with a saving of around 35 % in energy expended.
IOKi. Grid power supply for the plant operations instead of DG thus
reducing the direct consumption.ii. Increasing the efficiency of 220 KW cone crusher 2 motor as a
result of Energy audit (Potential Annual Saving – 1.1 KL of Diesel).
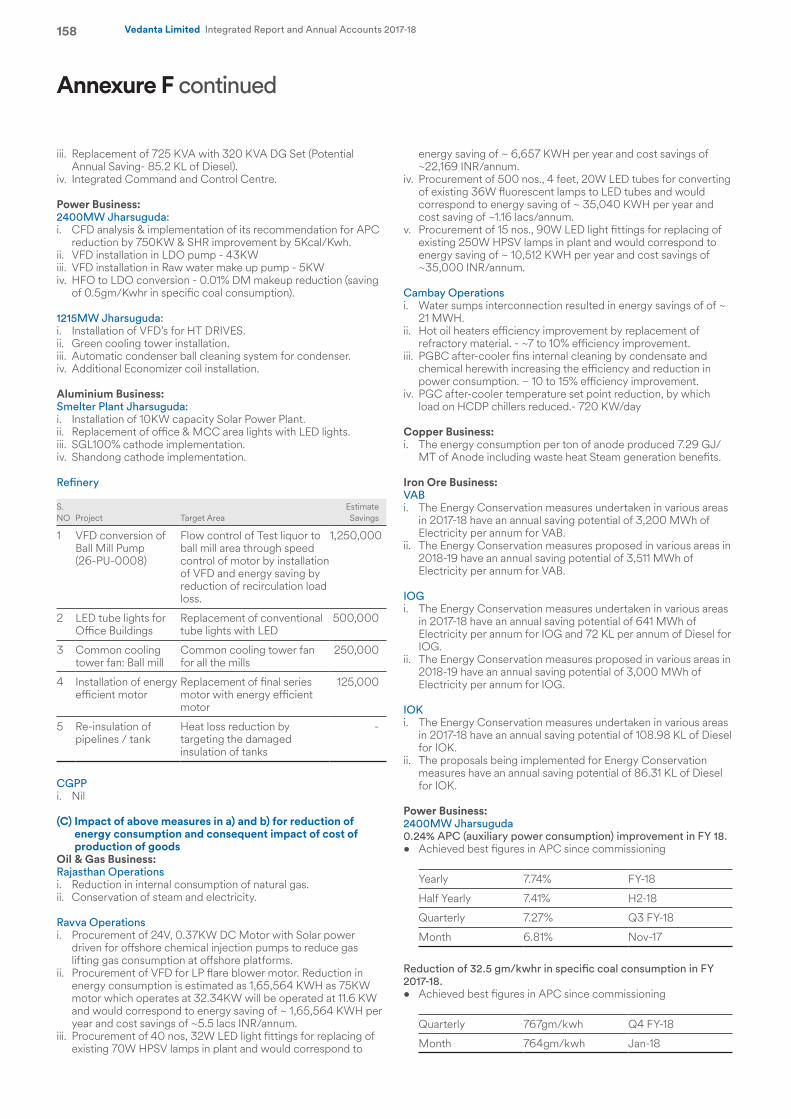
158 Vedanta Limited Integrated Report and Annual Accounts 2017-18
iii. Replacement of 725 KVA with 320 KVA DG Set (Potential Annual Saving- 85.2 KL of Diesel).
iv. Integrated Command and Control Centre.
Power Business:2400MW Jharsuguda:i. CFD analysis & implementation of its recommendation for APC
reduction by 750KW & SHR improvement by 5Kcal/Kwh.ii. VFD installation in LDO pump - 43KWiii. VFD installation in Raw water make up pump - 5KWiv. HFO to LDO conversion - 0.01% DM makeup reduction (saving
of 0.5gm/Kwhr in specific coal consumption).
1215MW Jharsuguda:i. Installation of VFD’s for HT DRIVES.ii. Green cooling tower installation.iii. Automatic condenser ball cleaning system for condenser. iv. Additional Economizer coil installation.
Aluminium Business:Smelter Plant Jharsuguda:i. Installation of 10KW capacity Solar Power Plant. ii. Replacement of office & MCC area lights with LED lights.iii. SGL100% cathode implementation.iv. Shandong cathode implementation.
Refinery
S. NO Project Target Area
Estimate Savings
1 VFD conversion of Ball Mill Pump (26-PU-0008)
Flow control of Test liquor to ball mill area through speed control of motor by installation of VFD and energy saving by reduction of recirculation load loss.
1,250,000
2 LED tube lights for Office Buildings
Replacement of conventional tube lights with LED
500,000
3 Common cooling tower fan: Ball mill
Common cooling tower fan for all the mills
250,000
4 Installation of energy efficient motor
Replacement of final series motor with energy efficient motor
125,000
5 Re-insulation of pipelines / tank
Heat loss reduction by targeting the damaged insulation of tanks
-
CGPPi. Nil
(C) Impact of above measures in a) and b) for reduction of energy consumption and consequent impact of cost of production of goods
Oil & Gas Business:Rajasthan Operationsi. Reduction in internal consumption of natural gas.ii. Conservation of steam and electricity.
Ravva Operationsi. Procurement of 24V, 0.37KW DC Motor with Solar power
driven for offshore chemical injection pumps to reduce gas lifting gas consumption at offshore platforms.
ii. Procurement of VFD for LP flare blower motor. Reduction in energy consumption is estimated as 1,65,564 KWH as 75KW motor which operates at 32.34KW will be operated at 11.6 KW and would correspond to energy saving of ~ 1,65,564 KWH per year and cost savings of ~5.5 lacs INR/annum.
iii. Procurement of 40 nos, 32W LED light fittings for replacing of existing 70W HPSV lamps in plant and would correspond to
energy saving of ~ 6,657 KWH per year and cost savings of ~22,169 INR/annum.
iv. Procurement of 500 nos., 4 feet, 20W LED tubes for converting of existing 36W fluorescent lamps to LED tubes and would correspond to energy saving of ~ 35,040 KWH per year and cost saving of ~1.16 lacs/annum.
v. Procurement of 15 nos., 90W LED light fittings for replacing of existing 250W HPSV lamps in plant and would correspond to energy saving of ~ 10,512 KWH per year and cost savings of ~35,000 INR/annum.
Cambay Operationsi. Water sumps interconnection resulted in energy savings of of ~
21 MWH.ii. Hot oil heaters efficiency improvement by replacement of
refractory material. - ~7 to 10% efficiency improvement.iii. PGBC after-cooler fins internal cleaning by condensate and
chemical herewith increasing the efficiency and reduction in power consumption. – 10 to 15% efficiency improvement.
iv. PGC after-cooler temperature set point reduction, by which load on HCDP chillers reduced.- 720 KW/day
Copper Business:i. The energy consumption per ton of anode produced 7.29 GJ/
MT of Anode including waste heat Steam generation benefits.
Iron Ore Business:VABi. The Energy Conservation measures undertaken in various areas
in 2017-18 have an annual saving potential of 3,200 MWh of Electricity per annum for VAB.
ii. The Energy Conservation measures proposed in various areas in 2018-19 have an annual saving potential of 3,511 MWh of Electricity per annum for VAB.
IOGi. The Energy Conservation measures undertaken in various areas
in 2017-18 have an annual saving potential of 641 MWh of Electricity per annum for IOG and 72 KL per annum of Diesel for IOG.
ii. The Energy Conservation measures proposed in various areas in 2018-19 have an annual saving potential of 3,000 MWh of Electricity per annum for IOG.
IOKi. The Energy Conservation measures undertaken in various areas
in 2017-18 have an annual saving potential of 108.98 KL of Diesel for IOK.
ii. The proposals being implemented for Energy Conservation measures have an annual saving potential of 86.31 KL of Diesel for IOK.
Power Business:2400MW Jharsuguda0.24% APC (auxiliary power consumption) improvement in FY 18.• Achieved best figures in APC since commissioning
Yearly 7.74% FY-18
Half Yearly 7.41% H2-18
Quarterly 7.27% Q3 FY-18
Month 6.81% Nov-17
Reduction of 32.5 gm/kwhr in specific coal consumption in FY 2017-18.• Achieved best figures in APC since commissioning
Quarterly 767gm/kwh Q4 FY-18
Month 764gm/kwh Jan-18
Annexure F continued
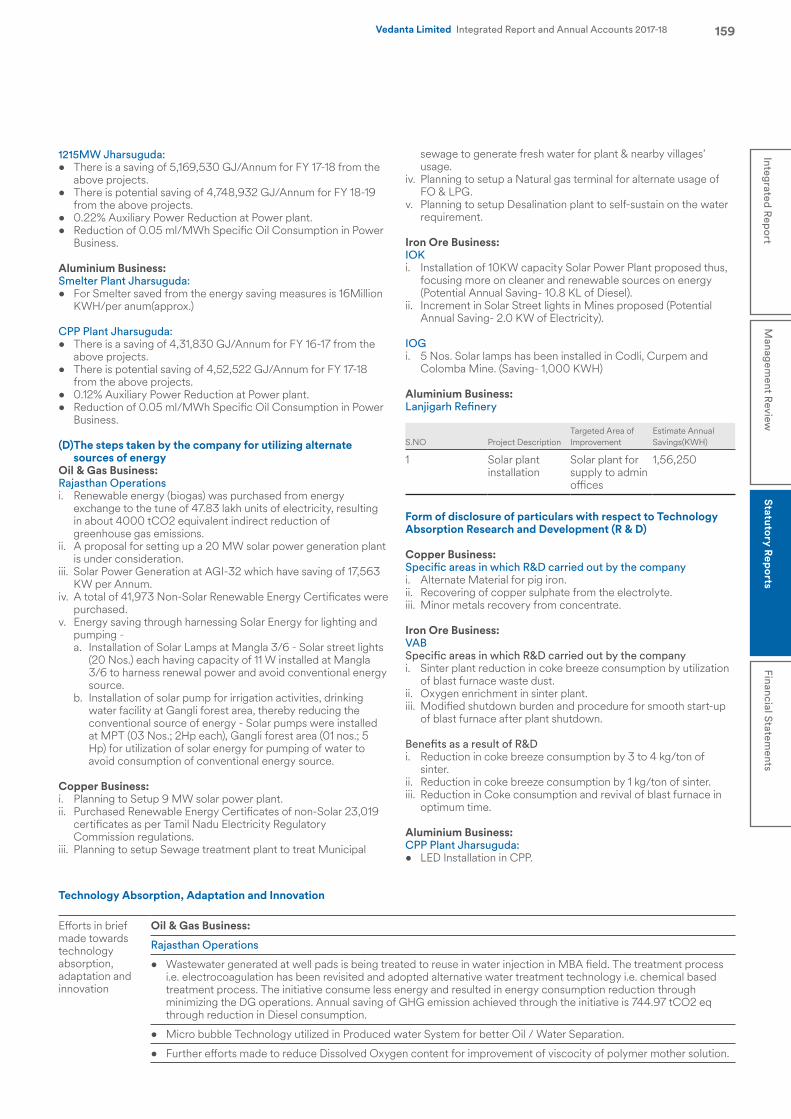
159Integrated R
eport
Managem
ent Review
Statutory R
eports
Financial Statements
Vedanta Limited Integrated Report and Annual Accounts 2017-18
1215MW Jharsuguda:• There is a saving of 5,169,530 GJ/Annum for FY 17-18 from the
above projects.• There is potential saving of 4,748,932 GJ/Annum for FY 18-19
from the above projects.• 0.22% Auxiliary Power Reduction at Power plant.• Reduction of 0.05 ml/MWh Specific Oil Consumption in Power
Business.
Aluminium Business:Smelter Plant Jharsuguda:• For Smelter saved from the energy saving measures is 16Million
KWH/per anum(approx.)
CPP Plant Jharsuguda:• There is a saving of 4,31,830 GJ/Annum for FY 16-17 from the
above projects.• There is potential saving of 4,52,522 GJ/Annum for FY 17-18
from the above projects.• 0.12% Auxiliary Power Reduction at Power plant. • Reduction of 0.05 ml/MWh Specific Oil Consumption in Power
Business. (D) The steps taken by the company for utilizing alternate
sources of energyOil & Gas Business:Rajasthan Operationsi. Renewable energy (biogas) was purchased from energy
exchange to the tune of 47.83 lakh units of electricity, resulting in about 4000 tCO2 equivalent indirect reduction of greenhouse gas emissions.
ii. A proposal for setting up a 20 MW solar power generation plant is under consideration.
iii. Solar Power Generation at AGI-32 which have saving of 17,563 KW per Annum.
iv. A total of 41,973 Non-Solar Renewable Energy Certificates were purchased.
v. Energy saving through harnessing Solar Energy for lighting and pumping - a. Installation of Solar Lamps at Mangla 3/6 - Solar street lights
(20 Nos.) each having capacity of 11 W installed at Mangla 3/6 to harness renewal power and avoid conventional energy source.
b. Installation of solar pump for irrigation activities, drinking water facility at Gangli forest area, thereby reducing the conventional source of energy - Solar pumps were installed at MPT (03 Nos.; 2Hp each), Gangli forest area (01 nos.; 5 Hp) for utilization of solar energy for pumping of water to avoid consumption of conventional energy source.
Copper Business:i. Planning to Setup 9 MW solar power plant.ii. Purchased Renewable Energy Certificates of non-Solar 23,019
certificates as per Tamil Nadu Electricity Regulatory Commission regulations.
iii. Planning to setup Sewage treatment plant to treat Municipal
sewage to generate fresh water for plant & nearby villages’ usage.
iv. Planning to setup a Natural gas terminal for alternate usage of FO & LPG.
v. Planning to setup Desalination plant to self-sustain on the water requirement.
Iron Ore Business:IOKi. Installation of 10KW capacity Solar Power Plant proposed thus,
focusing more on cleaner and renewable sources on energy (Potential Annual Saving- 10.8 KL of Diesel).
ii. Increment in Solar Street lights in Mines proposed (Potential Annual Saving- 2.0 KW of Electricity).
IOGi. 5 Nos. Solar lamps has been installed in Codli, Curpem and
Colomba Mine. (Saving- 1,000 KWH)
Aluminium Business:Lanjigarh Refinery
S.NO Project DescriptionTargeted Area of Improvement
Estimate Annual Savings(KWH)
1 Solar plant installation
Solar plant for supply to admin offices
1,56,250
Form of disclosure of particulars with respect to Technology Absorption Research and Development (R & D)
Copper Business:Specific areas in which R&D carried out by the companyi. Alternate Material for pig iron.ii. Recovering of copper sulphate from the electrolyte.iii. Minor metals recovery from concentrate.
Iron Ore Business:VABSpecific areas in which R&D carried out by the companyi. Sinter plant reduction in coke breeze consumption by utilization
of blast furnace waste dust.ii. Oxygen enrichment in sinter plant.iii. Modified shutdown burden and procedure for smooth start-up
of blast furnace after plant shutdown.
Benefits as a result of R&Di. Reduction in coke breeze consumption by 3 to 4 kg/ton of
sinter.ii. Reduction in coke breeze consumption by 1 kg/ton of sinter.iii. Reduction in Coke consumption and revival of blast furnace in
optimum time.
Aluminium Business:CPP Plant Jharsuguda:• LED Installation in CPP.
Technology Absorption, Adaptation and Innovation
Efforts in brief made towards technology absorption, adaptation and innovation
Oil & Gas Business:
Rajasthan Operations
• Wastewater generated at well pads is being treated to reuse in water injection in MBA field. The treatment process i.e. electrocoagulation has been revisited and adopted alternative water treatment technology i.e. chemical based treatment process. The initiative consume less energy and resulted in energy consumption reduction through minimizing the DG operations. Annual saving of GHG emission achieved through the initiative is 744.97 tCO2 eq through reduction in Diesel consumption.
• Micro bubble Technology utilized in Produced water System for better Oil / Water Separation.
• Further efforts made to reduce Dissolved Oxygen content for improvement of viscocity of polymer mother solution.
160 Vedanta Limited Integrated Report and Annual Accounts 2017-18
Cambay Asset
• LA-07 is an oil well not completed with Gas lift, hence the well could not be operated with artificial lift. To overcome the limitation a Straddle gas lift system was installed successfully across the circulation sliding sleeve.
• Wells LB-5 and LB-9 in Cambay required gas lift for production enhancement. However, LB platform does not have a Gas lift compressor. As an innovative solution, new Gas zone was perforated and accessed in LB-7 and this Gas was successfully diverted to LB-5 and LB-9 for utilization as Gas lift.
• Well GA-03 had earlier loaded and been shut-in. During a brainstorming workshop for revival of shut-in wells, the well was picked up for attempting revival. The well was initially unable to flow into production header and had shallow sand fill. The sand fill was cleared and well was initially flown into a closed drain drum (CDD) for unloading against zero backpressure. The well was later successfully diverted to production header and revived.
• Sludge reduction in Adani tanks using sludge breaker chemical by which trucking back of sludge to Suvali terminal eliminated.
Ravva Asset
Innovative design and fabrication of a tool,- Modified Gas Lift Orifice (MGLO), was developed in-house to facilitate Gas lift in wells that do not have artificial lift jewellery or require deeper gas lift injection in order to increase production. Successfully commissioned in some wells at Ravva.
Iron Ore Business:
VAB:
a. Pulverized coal injection in blast furnace 1 & 2.
b. Ore addition in ladle.
c. Usage of Maximum Low Grade Goan Iron Ore in Blast Furnace.
d. Use of high thermal conductivity bricks for oven bed.
e. Hydraulic compacting station in Battery-1.
f. Oven flue arch modification from semicircular arch to flat arch to improve productivity.
IOK
a. Installation of Truck simulator to check the proficiency of the operator.
b. Installation of LDR (Light Detecting Resistors) and Proximity sensors for Auto on-off of Haul road lighting with respect to Haul trucks travelling.
Power Business:
2400MW Jharsuguda
• Implementation of Online boiler tube leakage detection system.
1215MW Jharsuguda:
• Automatic online Condenser ball cleaning system.
• Economizer coil addition.
• Green cooling tower.
Aluminium Business:
CPP Plant Jharsuguda:
• Selective Soot blowing in boilers.
• Condenser bullet Cleaning.
• HFO to LDO Conversion.
• Isolation of SWAS grab sample.
• Governor Tuning by solvina for the first time in India.
• Augmentation of new CT fills.
• Condenser tube cleaning.
• Conversion of 2nd elevation HFO guns to LDO.
Benefits derived as a result of above efforts e.g., product improvement, cost reduction, product development, importsubstitution
Oil & Gas Business:
Cambay Asset
• LA-07 had a low reservoir pressure and it was suspected the well will not sustain on self or fail to revive on self in case of shut-down. Installation of Straddle Gas lift ensured sustained 650 BOPD production from the well.
• The innovative strategy to route LB-7 gas as artificial lift for LB-5 and LB-9 wells added 200 BOPD of additional production on a platform that was not equipped to support artificial lift.
• Activating GA-03 with sustained efforts and out of the box thinking added ~1,000 BOPD production.
Annexure F continued
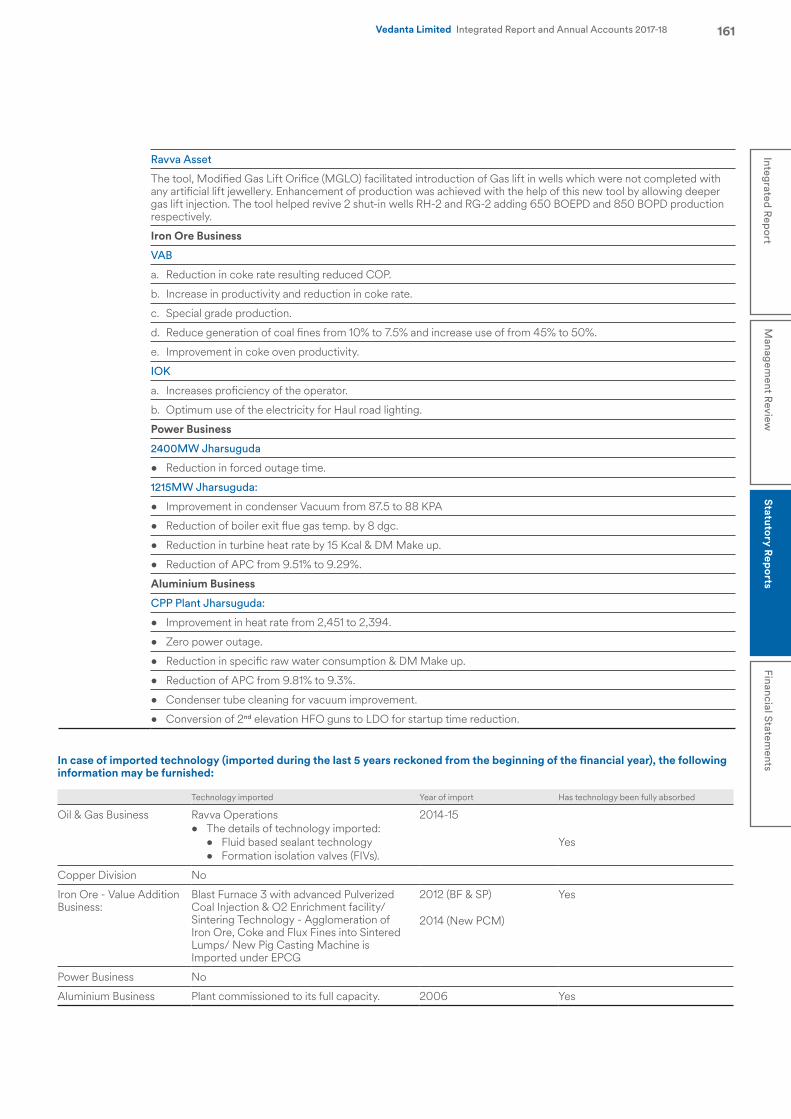
161Integrated R
eport
Managem
ent Review
Statutory R
eports
Financial Statements
Vedanta Limited Integrated Report and Annual Accounts 2017-18
Ravva Asset
The tool, Modified Gas Lift Orifice (MGLO) facilitated introduction of Gas lift in wells which were not completed with any artificial lift jewellery. Enhancement of production was achieved with the help of this new tool by allowing deeper gas lift injection. The tool helped revive 2 shut-in wells RH-2 and RG-2 adding 650 BOEPD and 850 BOPD production respectively.
Iron Ore Business
VAB
a. Reduction in coke rate resulting reduced COP.
b. Increase in productivity and reduction in coke rate.
c. Special grade production.
d. Reduce generation of coal fines from 10% to 7.5% and increase use of from 45% to 50%.
e. Improvement in coke oven productivity.
IOK
a. Increases proficiency of the operator.
b. Optimum use of the electricity for Haul road lighting.
Power Business
2400MW Jharsuguda
• Reduction in forced outage time.
1215MW Jharsuguda:
• Improvement in condenser Vacuum from 87.5 to 88 KPA
• Reduction of boiler exit flue gas temp. by 8 dgc.
• Reduction in turbine heat rate by 15 Kcal & DM Make up.
• Reduction of APC from 9.51% to 9.29%.
Aluminium Business
CPP Plant Jharsuguda:
• Improvement in heat rate from 2,451 to 2,394.
• Zero power outage.
• Reduction in specific raw water consumption & DM Make up.
• Reduction of APC from 9.81% to 9.3%.
• Condenser tube cleaning for vacuum improvement.
• Conversion of 2nd elevation HFO guns to LDO for startup time reduction.
In case of imported technology (imported during the last 5 years reckoned from the beginning of the financial year), the following information may be furnished:
Technology imported Year of import Has technology been fully absorbed
Oil & Gas Business Ravva Operations 2014-15• The details of technology imported:
• Fluid based sealant technology Yes• Formation isolation valves (FIVs).
Copper Division No
Iron Ore - Value Addition Business:
Blast Furnace 3 with advanced Pulverized Coal Injection & O2 Enrichment facility/ Sintering Technology - Agglomeration of Iron Ore, Coke and Flux Fines into Sintered Lumps/ New Pig Casting Machine is Imported under EPCG
2012 (BF & SP) Yes
2014 (New PCM)
Power Business No
Aluminium Business Plant commissioned to its full capacity. 2006 Yes
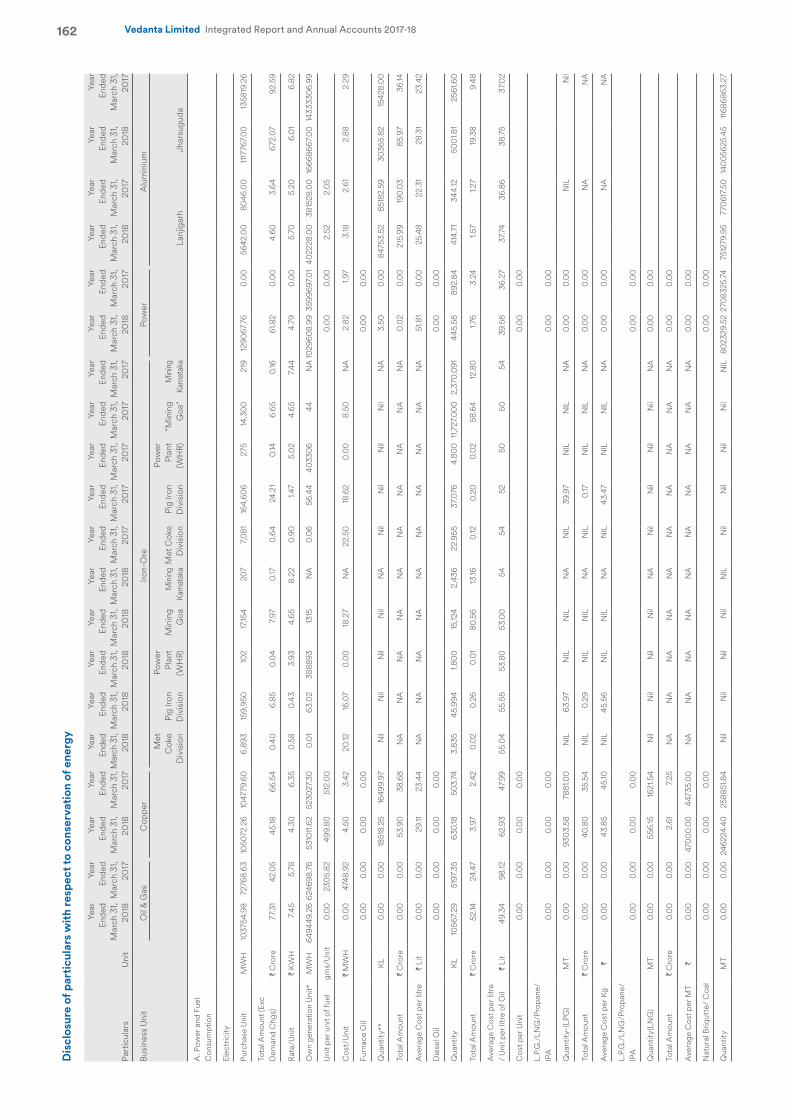
162 Vedanta Limited Integrated Report and Annual Accounts 2017-18
Dis
clos
ure
of p
arti
cula
rs w
ith
resp
ect t
o co
nser
vati
on o
f ene
rgy
Part
icul
ars
Uni
t
Year
En
ded
Mar
ch 3
1, 20
18
Year
En
ded
Mar
ch 3
1, 20
17
Year
En
ded
Mar
ch 3
1, 20
18
Year
En
ded
Mar
ch 3
1, 20
17
Year
En
ded
Mar
ch 3
1, 20
18
Year
En
ded
Mar
ch 3
1, 20
18
Year
En
ded
Mar
ch 3
1, 20
18
Year
En
ded
Mar
ch 3
1, 20
18
Year
En
ded
Mar
ch 3
1, 20
18
Year
En
ded
Mar
ch 3
1, 20
17
Year
En
ded
Mar
ch 3
1, 20
17
Year
En
ded
Mar
ch 3
1, 20
17
Year
En
ded
Mar
ch 3
1, 20
17
Year
En
ded
Mar
ch 3
1, 20
17
Year
En
ded
Mar
ch 3
1, 20
18
Year
En
ded
Mar
ch 3
1, 20
17
Year
En
ded
Mar
ch 3
1, 20
18
Year
En
ded
Mar
ch 3
1, 20
17
Year
En
ded
Mar
ch 3
1, 20
18
Year
En
ded
Mar
ch 3
1, 20
17
Busi
ness
Uni
tO
il &
Gas
Cop
per
Iron-
Ore
Pow
erA
lum
iniu
m
Met
C
oke
Div
isio
nPi
g Iro
n D
ivis
ion
Pow
er
Plan
t (W
HR)
Min
ing
Goa
Min
ing
Karn
atak
aM
et C
oke
Div
isio
nPi
g Iro
n D
ivis
ion
Pow
er
Plan
t (W
HR)
“Min
ing
Goa
”M
inin
g Ka
rnat
aka
Lanj
igar
hJh
arsu
guda
A. P
ower
and
Fue
l C
onsu
mpt
ion
Elec
tric
ity
Purc
hase
Uni
tM
WH
1037
54.9
872
768.
6310
5072
.26
1047
79.6
0 6
,893
15
9,95
0
102
17,15
4 2
07
7,0
81
164,
606
275
14
,30
0
219
12
9067
.76
0.0
056
42.0
080
46.0
011
1776
7.0
013
5819
.26
Tota
l Am
ount
(Exc
D
eman
d C
hgs)
` C
rore
77.3
142
.05
45.18
66.5
4 0
.40
6
.85
0.0
4 7
.97
0.17
0
.64
24.
21
0.14
6
.65
0.16
61
.82
0.0
04.
603.
6467
2.07
92.5
9
Rate
/Uni
t`
KW
H7.
455.
784.
306.
35 0
.58
0.4
3 3
.93
4.6
5 8
.22
0.9
0
1.47
5
.02
4.6
5 7
.44
4.79
0.0
05.
705.
206.
01
6.82
Ow
n ge
nera
tion
Uni
t*M
WH
6494
49.2
662
4698
.76
5310
11.6
252
3027
.30
0.0
163
.02
3888
9313
15N
A0.
06
56.4
440
330
644
NA
1029
608.
9935
9969
7.0
140
2228
.00
3815
28.0
016
6686
67.0
014
3333
06.
99
Uni
t per
uni
t of f
uel
gms/
Uni
t0.
00
230
5.82
499.
8051
2.0
00.
00
0.0
02.
522.
05
Cos
t/U
nit
` M
WH
0.0
047
48.9
24.
503.
4220
.1216
.07
0.0
018
.27
NA
22.5
018
.62
0.0
08.
50N
A2.
821.9
73.
182.
612.
882.
29
Furn
ace
Oil
0.0
00.
00
0.0
00.
00
0.0
00.
00
Qua
ntity
**K
L0.
00
0.0
018
518.
2516
499.
97N
ilN
ilN
ilN
ilN
AN
ilN
ilN
ilN
ilN
A3.
500.
00
8475
3.52
8518
2.59
3036
5.82
1542
8.0
0
Tota
l Am
ount
` C
rore
0.0
00.
00
53.9
038
.68
NA
NA
NA
NA
NA
NA
NA
NA
NA
NA
0.0
20.
00
215.
9919
0.0
385
.97
36.14
Ave
rage
Cos
t per
litr
e`
Lit
0.0
00.
00
29.11
23.4
4N
AN
AN
AN
AN
AN
AN
AN
AN
AN
A51
.81
0.0
025
.48
22.3
128
.31
23.4
2
Die
sel O
il0.
00
0.0
00.
00
0.0
00.
00
0.0
0
Qua
ntity
KL
1056
7.29
5197
.35
630.
1850
3.74
3.83
545
.994
1.80
015
,124
2,43
622
.955
37.0
764.
800
11,7
27.0
00
2,37
0.0
9144
5.58
892.
8441
4.71
344.
1250
01.8
125
61.6
0
Tota
l Am
ount
` C
rore
52.14
24.4
73.
972.
420.
02
0.26
0.0
180
.56
13.16
0.12
0.20
0.0
258
.64
12.8
01.7
63.
241.5
71.2
719
.38
9.48
Ave
rage
Cos
t per
litr
e /
Uni
t per
litr
e of
Oil
` Li
t49
.34
98.12
62.9
347
.99
55.0
455
.55
53.8
053
.00
5454
5250
5054
39.5
836
.27
37.7
436
.86
38.7
537
.02
Cos
t per
Uni
t0.
00
0.0
00.
00
0.0
00.
00
0.0
0
L.P.
G./
LNG
/Pro
pane
/IP
A0.
00
0.0
00.
00
0.0
00.
00
0.0
0
Qua
ntity
-(LP
G)
MT
0.0
00.
00
930
3.58
7881
.00
NIL
63.9
7N
ILN
ILN
AN
IL39
.97
NIL
NIL
NA
0.0
00.
00
NIL
Nil
Tota
l Am
ount
` C
rore
0.0
00.
00
40.8
035
.54
NIL
0.29
NIL
NIL
NA
NIL
0.17
NIL
NIL
NA
0.0
00.
00
NA
NA
Ave
rage
Cos
t per
Kg
` 0.
00
0.0
043
.85
45.10
NIL
45.5
6N
ILN
ILN
AN
IL43
.47
NIL
NIL
NA
0.0
00.
00
NA
NA
L.P.
G./
LNG
/Pro
pane
/IP
A0.
00
0.0
00.
00
0.0
00.
00
0.0
0
Qua
ntity
(LN
G)
MT
0.0
00.
00
556.
1516
21.5
4N
ilN
ilN
ilN
ilN
AN
ilN
ilN
ilN
ilN
A0.
00
0.0
0
Tota
l Am
ount
` C
rore
0.0
00.
00
2.61
7.25
NA
NA
NA
NA
NA
NA
NA
NA
NA
NA
0.0
00.
00
Ave
rage
Cos
t per
MT
` 0.
00
0.0
047
00
0.0
044
735.
00
NA
NA
NA
NA
NA
NA
NA
NA
NA
NA
0.0
00.
00
Nat
ural
Briq
utte
/ C
oal
0.0
00.
00
0.0
00.
00
0.0
00.
00
Qua
ntity
MT
0.0
00.
00
2462
24.4
025
8851
.84
Nil
Nil
Nil
Nil
NIL
Nil
Nil
Nil
Nil
NIL
8023
29.5
227
083
25.7
475
1279
.95
770
617.
5014
00
5625
.45
1168
6863
.27
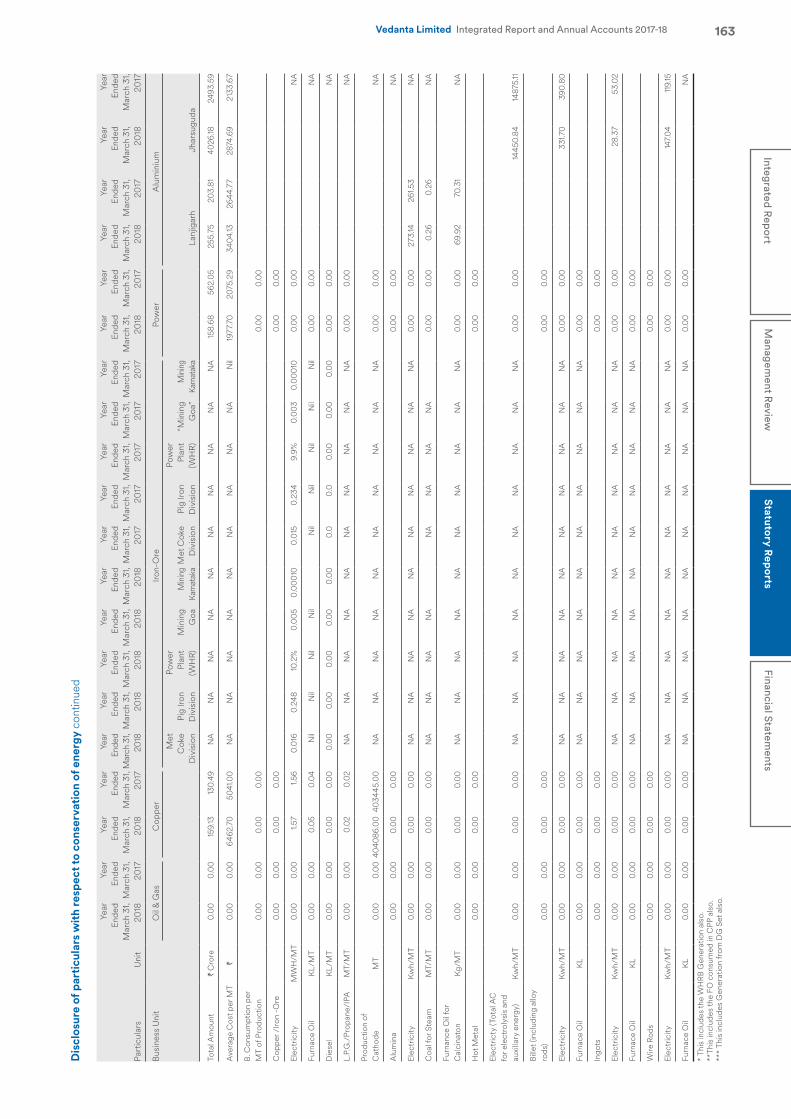
163Integrated R
eport
Managem
ent Review
Statutory R
eports
Financial Statements
Vedanta Limited Integrated Report and Annual Accounts 2017-18
Dis
clos
ure
of p
arti
cula
rs w
ith
resp
ect t
o co
nser
vati
on o
f ene
rgy
cont
inue
d
Part
icul
ars
Uni
t
Year
En
ded
Mar
ch 3
1, 20
18
Year
En
ded
Mar
ch 3
1, 20
17
Year
En
ded
Mar
ch 3
1, 20
18
Year
En
ded
Mar
ch 3
1, 20
17
Year
En
ded
Mar
ch 3
1, 20
18
Year
En
ded
Mar
ch 3
1, 20
18
Year
En
ded
Mar
ch 3
1, 20
18
Year
En
ded
Mar
ch 3
1, 20
18
Year
En
ded
Mar
ch 3
1, 20
18
Year
En
ded
Mar
ch 3
1, 20
17
Year
En
ded
Mar
ch 3
1, 20
17
Year
En
ded
Mar
ch 3
1, 20
17
Year
En
ded
Mar
ch 3
1, 20
17
Year
En
ded
Mar
ch 3
1, 20
17
Year
En
ded
Mar
ch 3
1, 20
18
Year
En
ded
Mar
ch 3
1, 20
17
Year
En
ded
Mar
ch 3
1, 20
18
Year
En
ded
Mar
ch 3
1, 20
17
Year
En
ded
Mar
ch 3
1, 20
18
Year
En
ded
Mar
ch 3
1, 20
17
Busi
ness
Uni
tO
il &
Gas
Cop
per
Iron-
Ore
Pow
erA
lum
iniu
m
Met
C
oke
Div
isio
nPi
g Iro
n D
ivis
ion
Pow
er
Plan
t (W
HR)
Min
ing
Goa
Min
ing
Karn
atak
aM
et C
oke
Div
isio
nPi
g Iro
n D
ivis
ion
Pow
er
Plan
t (W
HR)
“Min
ing
Goa
”M
inin
g Ka
rnat
aka
Lanj
igar
hJh
arsu
guda
Tota
l Am
ount
` C
rore
0.0
00.
00
159.
1313
0.49
NA
NA
NA
NA
NA
NA
NA
NA
NA
NA
158.
6856
2.0
525
5.75
203.
8140
26.18
2493
.59
Ave
rage
Cos
t per
MT
` 0.
00
0.0
064
62.7
050
41.0
0N
AN
AN
AN
AN
AN
AN
AN
AN
AN
il19
77.7
020
75.2
934
04.
1326
44.7
728
74.6
921
33.6
7
B. C
onsu
mpt
ion
per
MT
of P
rodu
ctio
n0.
00
0.0
00.
00
0.0
00.
00
0.0
0
Cop
per /
Iron
-Ore
0.0
00.
00
0.0
00.
00
0.0
00.
00
Elec
tric
ityM
WH
/MT
0.0
00.
00
1.57
1.56
0.0
160.
248
10.2
%0.
00
50.
00
010
0.0
150.
234
9.9%
0.0
03
0.0
00
100.
00
0.0
0N
A
Furn
ace
Oil
KL/
MT
0.0
00.
00
0.0
50.
04
Nil
Nil
Nil
Nil
Nil
Nil
Nil
Nil
Nil
0.0
00.
00
NA
Die
sel
KL/
MT
0.0
00.
00
0.0
00.
00
0.0
00.
00
0.0
00.
00
0.0
00.
00.
00.
00
0.0
00.
00
0.0
00.
00
NA
L.P.
G./
Prop
ane/
IPA
MT/
MT
0.0
00.
00
0.0
20.
02
NA
NA
NA
NA
NA
NA
NA
NA
NA
NA
0.0
00.
00
NA
Prod
uctio
n of
C
atho
deM
T0.
00
0.0
040
4086
.00
4034
45.0
0N
AN
AN
AN
AN
AN
AN
AN
AN
AN
A0.
00
0.0
0N
A
Alu
min
a0.
00
0.0
00.
00
0.0
00.
00
0.0
0N
A
Elec
tric
ityKw
h/M
T0.
00
0.0
00.
00
0.0
0N
AN
AN
AN
AN
AN
AN
AN
AN
AN
A0.
00
0.0
027
3.14
261.5
3N
A
Coa
l for
Ste
amM
T/M
T0.
00
0.0
00.
00
0.0
0N
AN
AN
AN
AN
AN
AN
AN
A0.
00
0.0
00.
260.
26N
A
Furn
ance
Oil
for
Cal
cina
ton
Kg/M
T0.
00
0.0
00.
00
0.0
0N
AN
AN
AN
AN
AN
AN
AN
AN
AN
A0.
00
0.0
069
.92
70.3
1N
A
Hot
Met
al0.
00
0.0
00.
00
0.0
00.
00
0.0
0
Elec
tric
ty (T
otal
AC
fo
r ele
ctro
lysi
s an
d au
xilla
ry e
nerg
y)Kw
h/M
T0.
00
0.0
00.
00
0.0
0N
AN
AN
AN
AN
AN
AN
AN
AN
AN
A0.
00
0.0
014
450.
8414
875.
11
Bille
t (in
clud
ing
allo
y ro
ds)
0.0
00.
00
0.0
00.
00
0.0
00.
00
Elec
tric
ityKw
h/M
T0.
00
0.0
00.
00
0.0
0N
AN
AN
AN
AN
AN
AN
AN
AN
AN
A0.
00
0.0
033
1.70
390.
80
Furn
ace
Oil
KL
0.0
00.
00
0.0
00.
00
NA
NA
NA
NA
NA
NA
NA
NA
NA
NA
0.0
00.
00
Ingo
ts0.
00
0.0
00.
00
0.0
00.
00
0.0
0
Elec
tric
ityKw
h/M
T0.
00
0.0
00.
00
0.0
0N
AN
AN
AN
AN
AN
AN
AN
AN
AN
A0.
00
0.0
028
.37
53.0
2
Furn
ace
Oil
KL
0.0
00.
00
0.0
00.
00
NA
NA
NA
NA
NA
NA
NA
NA
NA
NA
0.0
00.
00
Wire
Rod
s0.
00
0.0
00.
00
0.0
00.
00
0.0
0
Elec
tric
ityKw
h/M
T0.
00
0.0
00.
00
0.0
0N
AN
AN
AN
AN
AN
AN
AN
AN
AN
A0.
00
0.0
014
7.0
411
9.15
Furn
ace
Oil
KL
0.0
00.
00
0.0
00.
00
NA
NA
NA
NA
NA
NA
NA
NA
NA
NA
0.0
00.
00
NA
* Th
is in
clud
es th
e W
HRB
Gen
erat
ion
also
.**
This
incl
udes
the
FO c
onsu
med
in C
PP a
lso.
***
This
incl
udes
Gen
erat
ion
from
DG
Set
als
o.
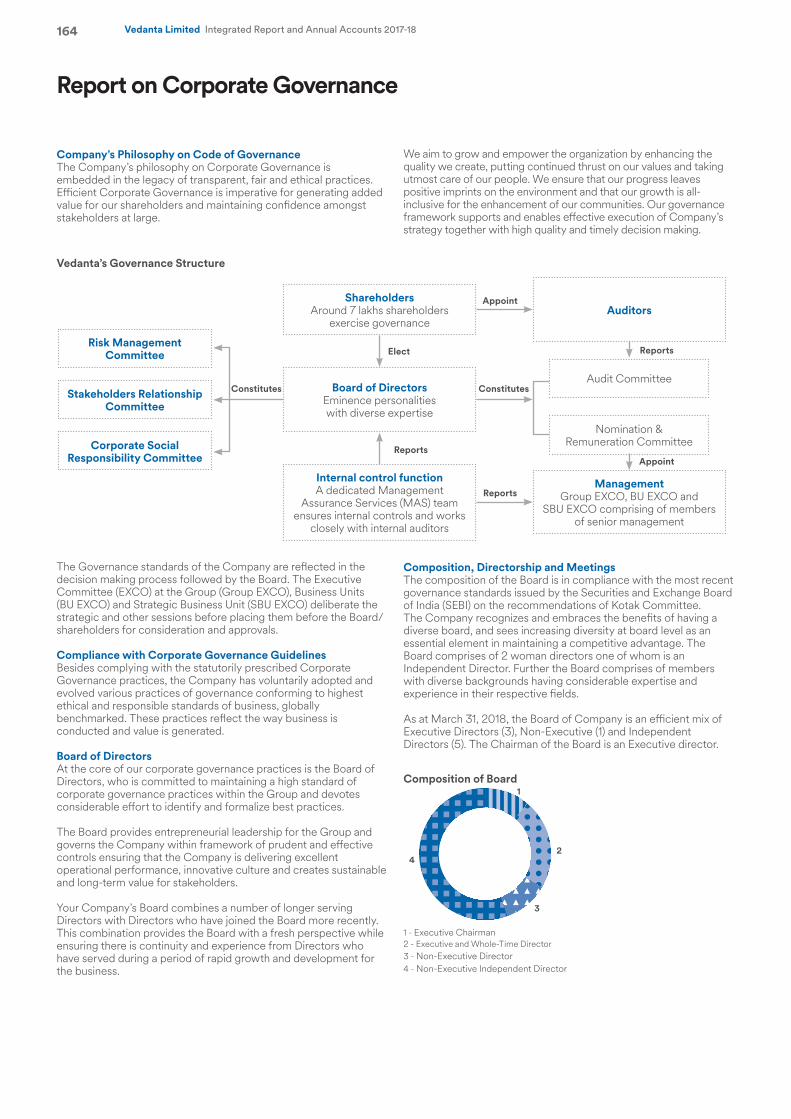
164 Vedanta Limited Integrated Report and Annual Accounts 2017-18
Report on Corporate Governance
Company’s Philosophy on Code of GovernanceThe Company’s philosophy on Corporate Governance is embedded in the legacy of transparent, fair and ethical practices. Efficient Corporate Governance is imperative for generating added value for our shareholders and maintaining confidence amongst stakeholders at large.
We aim to grow and empower the organization by enhancing the quality we create, putting continued thrust on our values and taking utmost care of our people. We ensure that our progress leaves positive imprints on the environment and that our growth is all-inclusive for the enhancement of our communities. Our governance framework supports and enables effective execution of Company’s strategy together with high quality and timely decision making.
The Governance standards of the Company are reflected in the decision making process followed by the Board. The Executive Committee (EXCO) at the Group (Group EXCO), Business Units (BU EXCO) and Strategic Business Unit (SBU EXCO) deliberate the strategic and other sessions before placing them before the Board/ shareholders for consideration and approvals.
Compliance with Corporate Governance GuidelinesBesides complying with the statutorily prescribed Corporate Governance practices, the Company has voluntarily adopted and evolved various practices of governance conforming to highest ethical and responsible standards of business, globally benchmarked. These practices reflect the way business is conducted and value is generated.
Board of DirectorsAt the core of our corporate governance practices is the Board of Directors, who is committed to maintaining a high standard of corporate governance practices within the Group and devotes considerable effort to identify and formalize best practices.
The Board provides entrepreneurial leadership for the Group and governs the Company within framework of prudent and effective controls ensuring that the Company is delivering excellent operational performance, innovative culture and creates sustainable and long-term value for stakeholders.
Your Company’s Board combines a number of longer serving Directors with Directors who have joined the Board more recently. This combination provides the Board with a fresh perspective while ensuring there is continuity and experience from Directors who have served during a period of rapid growth and development for the business.
Composition, Directorship and MeetingsThe composition of the Board is in compliance with the most recent governance standards issued by the Securities and Exchange Board of India (SEBI) on the recommendations of Kotak Committee. The Company recognizes and embraces the benefits of having a diverse board, and sees increasing diversity at board level as an essential element in maintaining a competitive advantage. The Board comprises of 2 woman directors one of whom is an Independent Director. Further the Board comprises of members with diverse backgrounds having considerable expertise and experience in their respective fields.
As at March 31, 2018, the Board of Company is an efficient mix of Executive Directors (3), Non-Executive (1) and Independent Directors (5). The Chairman of the Board is an Executive director.
Vedanta’s Governance Structure
Risk Management Committee
Stakeholders Relationship Committee
Corporate Social Responsibility Committee
ShareholdersAround 7 lakhs shareholders
exercise governance
Board of DirectorsEminence personalities with diverse expertise
Internal control functionA dedicated Management
Assurance Services (MAS) team ensures internal controls and works
closely with internal auditors
Audit Committee
Nomination & Remuneration Committee
Auditors
ManagementGroup EXCO, BU EXCO and
SBU EXCO comprising of members of senior management
Constitutes
Reports
Reports
Appoint
ReportsElect
Appoint
Constitutes
Composition of Board
1 - Executive Chairman2 - Executive and Whole-Time Director3 - Non-Executive Director4 - Non-Executive Independent Director
1
2
3
4
Vedanta Limited Integrated Report and Annual Accounts 2017-18 165Integrated R
eport
Managem
ent Review
Statutory R
eports
Financial Statements
Vedanta Limited Integrated Report and Annual Accounts 2017-18
The Chairman leads the Board and upholds the highest standards of integrity, probity and corporate governance through setting clear expectations in terms of culture and values, as well as in terms of the style and tone of board discussions. The Chairman promotes constructive relationship and effective communication between the Directors.
There is a clear demarcation of duties and responsibilities among the position of the Chairman of the Board and Chief Executive Officer of the Company to ensure best corporate performance. The Board composition is in conformity with the provisions of the Companies Act, 2013 and Regulation 17 of the SEBI (Listing Obligations and Disclosure Requirements) Regulations, 2015 (Listing Regulations).
Detailed profile of the Directors can be viewed on the website at www.vedantalimited.com.
Mr. Kuldip Kumar Kaura - Interim Chief Executive Officer, Mr. GR Arun Kumar – Whole-Time Director & Chief Financial Officer and Ms. Bhumika Sood – Company Secretary are the Key Managerial Personnel (KMPs) of the Company. During the year under review, following changes took place in the position of Directors/ Key Managerial Personnel (KMPs) of the Company:• Mr. Naresh Chandra, Independent Director ceased to be a
member of the Board and committees effective July 9, 2017 due to demise. The Directors placed on record their deep appreciation for his valuable guidance.
• Mr. Aman Mehta appointed as an Independent Director and Ms. Priya Agarwal was appointed as Non- Executive Director on the Board w.e.f. May 17, 2017. The appointment was approved by the shareholders of the Company in the 52nd Annual General Meeting held on July 14, 2017
• The term of Mr. Thomas Albanese as Whole-Time Director and Chief Executive Officer (CEO) was extended by the Board till August 31, 2017. Mr. Albanese superannuated as the CEO and member of the Board w.e.f. August 31, 2017.
• Ms. Lalita D. Gupte and Mr. Ravi Kant were re-appointed as Independent Directors for a second and final term w.e.f January 29, 2018 till August 10, 2021 subject to approval of the shareholders in the forthcoming Annual General Meeting.
• Mr. UK Sinha was appointed by the Board at its meeting held on March 13, 2018 w.e.f. the closing of business hours of March, 13, 2018.
• Mr. Tarun Jain was re-appointed as the Whole-Time Director by the Board at their meeting held on March 28, 2018 w.e.f. April 1, 2018.
Mr. Kaura was appointed as an Interim Chief Executive Officer (CEO) of the Company w.e.f. September 1, 2017.
The Company follows a structured process of decision-making by the Board and its Committees. To ensure smooth conduct of the meetings, an annual calendar of the Board and Committee meetings is prepared in advance in consultation with the Board members. The detailed agenda along with the explanatory notes and annexures are circulated in advance of the meeting to the respective Board and Committee members. In special and exceptional circumstances, the agenda is sent at a shorter notice, with due adherence to the applicable provisions including Secretarial Standards issued by the Institute of Company Secretaries of India.
Additionally, in case of business exigencies, resolutions/matters are passed by way of circulation and if required the same is supported by an audio call to explain the rationale. During the year ten (10) matters/resolutions were approved through circulation.
Total nine (9) board meetings were held during the financial year. All Directors have demonstrated high levels of availability and responsiveness for additional meetings and discussions whenever these have been required. The maximum gap between any two meetings was not more than one hundred and twenty (120) days.
Video / tele-conferencing facilities were facilitated to Directors travelling in India or abroad for participation in the meeting on requirement basis.
Table 1: Details of attendance at Board Meetings
S. No. Date of MeetingBoard
Strength
No. of Directors Attended
Present %
1 11-Apr-17 8 8 100%2 15-May-17 8 7 87.5%3 25-Jul-17 9 9 100%4 31-Aug-17 9 8* 100%5 02-Nov-17 8 8 100%6 19-Dec-17 8 6 75%7 31-Jan-18 8 8 100%8 13-Mar-18 8 8 100%9 28-Mar-18 9 9 100%*Ms. Lalita D. Gupte, Mr. Ravi Kant and Mr. Thomas Albanese attended the meeting through audio call.
Composition of the Board, other Directorship(s)/ Committee Membership(s)/ Chairmanship(s) as on March 31, 2018 and attendance of directors at Board Meetings, Last Annual General Meeting (AGM) are as given in Table – 2.
None of the Director is a Director in more than 10 public limited companies or acts as an Independent Director in more than 7 listed companies or 3 listed companies in case he/she serves as a Whole-time Director in any listed company (as specified in Regulation 25 of the Listing Regulations).
Further, none of the Directors are members of more than 10 board level committees of Indian public limited companies, nor are they Chairman of more than 5 committees, across all companies in which they are directors. The necessary disclosures regarding committee positions have been received.
None of the Directors are related to other Directors as specified under Companies Act & Listing Regulations.
166 Vedanta Limited Integrated Report and Annual Accounts 2017-18
Table – 2
Name of Directors DIN Category
No. of Board meetings held during his / her tenure and attended in
2017-18
Whether attended last AGM held on July 14, 2017
Number of Directorships in other entities including this
entity
Number of Committee# positions
held in public companies* including
this entity
Held Attended % All@ Listed Member Chairman
Navin Agarwal 00006303 Executive Chairman 9 9 100 Yes 4 2 - -Aman Mehta(1) 00009364 Independent Director 7 6 90 Yes 6 6 7 1K Venkataramanan 00001647 Independent Director 9 9 100 No 6 3 1 -Lalita D. Gupte(2) 00043559 Independent Director 9 9(9) 100 Yes 6 6(3) 8 2Naresh Chandra(10) 00015833 Independent Director 2 1 50 NA - - - -Ravi Kant(2) 00016184 Independent Director 9 8(9) 90 Yes 3 2 1 -UK Sinha(8) 00010336 Independent Director 1 1 100 NA 3 2 2 -Priya Agarwal(1) 05162177 Non-Executive Director 7 6 90 Yes 1 1 - -Tarun Jain(4) 00006843 Whole- Time Director 9 9 100 Yes 3 2(5) 2 -GR Arun Kumar 01874769 Whole- Time Director &
Chief Financial Officer 9 9 100 Yes 9 2(6) 2(7) -Thomas Albanese (11) 06853915 Whole- Time Director &
Chief Executive Officer 4 4(9) 100 Yes - - - -# only Audit Committee and Stakeholders Relationship Committee has been considered as per Regulation 26 of the Listing Regulations.* excluding private limited companies, foreign companies and companies under Section 8 of Companies Act, 2013, trusts and alternate directorships as per Regulation 26 of the Listing Regulations.@ excludes foreign companies but includes Private Companies and companies under Section 8 of the Companies Act, 2013. (1) Appointed w.e.f. May 17, 2017.(2) Re-appointed as Independent Directors for a second and final term w.e.f. January 29, 2018 till August 10, 2021.(3) Ms. Lalita D. Gupte is a Director in India Infradebt Limited whose only Debt Securities are listed.(4) Re-appointed as Whole-Time Director w.e.f. April 1, 2018.(5) Mr. Tarun Jain is a Director in Bharat Aluminum Company Limited whose only Debt Securities are listed.(6) Mr. GR Arun Kumar is a Director in Vizag General Cargo Berth Private Limited whose only Debt Securities are listed.(7) Mr. GR Arun Kumar is a member of the Audit Committee of Vizag General Cargo Berth Private Limited whose only Debt Securities are listed.(8) Appointed as Non-Executive Independent Director on the Board of the Company w.e.f. close of business hours on March 13, 2018.(9) Attended the meeting held on August 31, 2017 through audio call.(10) Mr. Naresh Chandra ceased to be a Director on the Board w.e.f. July 9, 2017 due to demise.(11) Mr. Thomas Albanese superannuated from the position of Whole-Time Director and CEO w.e.f. end of business hours on August 31, 2017 consequent to contract completion.
Matters reserved for the Board and delegated authorities A formal schedule of matters of commercial and financial importance are reserved for the board. This covers areas such as: setting the Group’s purpose and strategic vision; monitoring the performance of delivery of the approved strategy; approving major investments, acquisitions and divestments; the oversight of risk and the setting of the Group’s risk appetite; and reviewing the Group’s governance framework.
The Board has delegated some of its responsibilities to the board committees, and details of how the committees have fuelled on behalf of the Board are provided in the report.
Information Supplied to the BoardOne of the prerequisites for value-generating work by the Board is that the Board has a firm grasp on the operations and on events in the outside world. We achieve this through a well-structured body of material for the Board.
The Board has complete access to all the relevant information within the Company. All Board meetings are governed by a structured agenda which is backed by comprehensive background information.
The Company leverages technology and synergizes it with the green initiatives to the optimum. As a part of green initiative, all the agenda papers and notes are circulated to the Directors through an electronic platform. This ensures greater security, and provides the Directors with a more efficient way of working, by combining good governance with the use of the latest technology.
Compliance reports of all laws applicable to Company is presented before the Board on quarterly basis. The minutes of the Board meetings of the Company’s subsidiaries and a statement of all significant transactions and arrangements entered into by the subsidiary companies are also placed before the Board.
Expositions covering various aspects of business, major subsidiaries, global and domestic business environment, safety and environment related matters, strategy and risk management practices are given to the Board.
Throughout the year, Directors are also provided with detailed briefing materials on the performance of the Company and market analysis on the performance of, and prospects for, the business. Updates on relevant statutory changes and judicial pronouncements around industry related laws are regularly circulated to the directors. Each director has complete access to any Company information and full freedom to interact with senior management.
Business reviews by the Group EXCO, Business EXCO and SBU EXCO on the performance and operation of the Company is conducted on monthly basis and update to the Board is given in the quarterly meetings. Board has constituted various committees and sub-committees with clearly agreed reporting procedures and are guided by the charter prescribing the terms of reference.
Important decisions taken by the Board and its committees are promptly communicated to the concerned departments or divisions.
The Company also has an effective post Board Meeting follow up procedure. Action taken report on the decisions taken in a meeting is placed at the immediately succeeding meeting for information of the Board.
Board Familiarisation and Induction ProgrammeA formal and comprehensive induction about the Company, its operations and the industry in which the Company operates, is given to all the new directors including site visits and meetings with members of the Board and other key senior executives including Business CEOs and CFOs. They are also introduced to the organization structure, strategy, constitution, policies and board procedures.
A formal letter of appointment setting out the role, functions, duties and responsibilities, details regarding remuneration, training and development and performance evaluation process is given to Independent Directors at the time of their appointment.
The Directors are also provided with induction materials including Company’s corporate profile, its organizational structure, the Company’s history and milestones, latest annual report, Code of
Report on Corporate Governance continued
Vedanta Limited Integrated Report and Annual Accounts 2017-18 167Integrated R
eport
Managem
ent Review
Statutory R
eports
Financial Statements
Vedanta Limited Integrated Report and Annual Accounts 2017-18
Conduct and Business Ethics, the Code for Prevention of Insider Trading and other applicable codes. They are also periodically updated on all business related issues and new initiatives.
Following the initial induction, a continuing understanding of the business is developed through appropriate business engagements. In addition, Executive Committee members and other senior executives make expositions on business and performance of various divisions and units including subsidiaries in the Board and committee meetings. They are also apprised about risk assessment and minimization procedure.
The Board is kept abreast of performance and Company’s operations/ updates/ major developments affecting the business by reports from the Chief Executive Officer on quarterly basis.
Detailed familiarisation programme for Directors is available on the Company’s website at www.vedantalimited.com.
Board IndependenceThe independent directors bring an element of objectivity to the board processes and an objective view in the board deliberations. They provide a valuable outside perspective to the deliberations of the board and contribute significantly to the decision making process.
All Independent Directors have provided an affirmation of their independence as required under the provisions of the Companies Act, 2013 and Listing Regulations.
There are no material pecuniary relationships or transactions between the Independent Directors and the Company, except for sitting fees and commission drawn by them for attending the meeting of the Board and Committee(s) thereof. None of the Non-Executive Directors hold any shares or convertible instruments in the Company.
Selection/Appointment Procedure The Nominations and Remuneration Committee has in place a formal and transparent process for the appointment of new Independent Directors on the Board. The committee, based on defined criteria, makes recommendations to the Board on the induction of new directors.
As per the Company’s Nomination and Remuneration Policy the following steps are carried for selection of new Board member(s):
• The Nomination and Remuneration Committee (‘NRC’) takes into consideration the knowledge, professional & functional expertise and background, industry orientation, accomplished personalities, diverse academic, professional or technical qualification, age and more before recommending a new member to the Board for their approval for appointment;
• In case of appointment of Independent Directors, the NRC additionally satisfies itself with regard to the independence of the Directors vis-à-vis the Company so as to enable the Board to discharge its functions and duties effectively;
• The NRC ensures that the candidates identified for appointment as Directors are not disqualified for appointment under Section 164 and other applicable provisions of the Companies Act, 2013;
• In case of re-appointment, performance evaluation and engagement level is considered by the NRC and recommendations are made to the Board.
Separate Meeting of Independent DirectorsIndependent Directors play a pivotal role in maintaining a transparent working environment in the company.
The Company facilitates the conduct of separate meetings of the Independent Directors without the presence of Non-Independent Directors and management of the Company to enable them to interact and discuss about the performance of the Company and the Board, risk faced by it, competition, strategy, leadership
strengths and weaknesses, governance, compliance, board movements, human resources matters etc. These meetings afford an opportunity to the Independent Directors for exchanging valuable views.
The Independent Directors also meet with the Statutory Auditors to discuss internal audit effectiveness, environment control and invite their general feedback. Independent Director updates the Audit and the Board about the outcome of the meetings and action, if any, required to be taken by the Company.
During the year under review, the Independent Directors met once on March 28, 2018 to discuss:• The performance of the Chairperson of the Company, taking
into account the views of Executive and Non-Executive Directors;
• The performance of the Non-Independent Directors and the Board as a whole;
• The quality, quantity and timeliness of flow of information between the Company management and the Board.
Risk Mitigation PlanYour Company has in place comprehensive risk assessment and minimization procedures, which are reviewed by the Risk Management Committee periodically to ensure that management controls risk through means of properly defined framework. The Audit Committee of the Company also reviews the risk matrix and mitigation plan from time to time. A separate section on principal risks and uncertainties is covered in the Management Discussions & Analysis.
Insider Trading Prohibition PolicyYour Company has a robust mechanism in place to prevent insider trading and have formulated the Insider Trading Prohibition Policy (‘Policy’) which serve as a guiding charter for all the concerned persons associated with the Company and defines the principles and the restrictions to be observed while dealing or proposing to deal in any transaction w.r.t. the Securities of the Company and related matters. The objective of the Policy is to prevent misuse of any Unpublished Price Sensitive Information (UPSI) and prohibit any insider trading activity, in order to protect the interest of the shareholders at large.
In view of the recent corporate restructuring and to cater to the ever changing environment considering the size and operations of the Company, the Board of Directors of the Company in its meeting held on January 31, 2018 have revised the Insider Trading Prohibition Policy.
The Policy specifies the procedures and restrictions to be followed by Directors, employees of the Company and other associated/ connected person before undertaking any transaction in securities of the Company. The Policy is available on the website of the Company at www.vedantalimited.com.
The Company has in place designated Insider Trading Monitoring Committee comprising of senior executive members viz., Chief Financial Officer (CFO); Company Secretary (CS); and Group Chief Human Resource Officer (CHRO)/ VP Group HR. The Committee is responsible for the overall administration of the Policy and actively reviews the transaction undertaken by the Insiders.Tracking of the trading in securities of the Company by the Insiders is done by our Registrar & Share Transfer Agent, M/s Karvy Computershare (P) Ltd. Reports w.r.t. the transaction executed by the Insiders are reported to the Committee on weekly basis.
An annual disclosure is also taken from all the Insiders of the Company disclosing their shareholding in the Company as at the year end.
Various knowledge sharing emails/ updates are sent to the Insiders in order to monitor and prevent any non-compliance of the Policy/
168 Vedanta Limited Integrated Report and Annual Accounts 2017-18
SEBI (Prohibition of Insider Trading) Regulations, 2015. As a way forward towards digitization, the Company is in the process of developing an automated tool for monitoring and reporting of trades done by the Insider.
Code of Business Conduct and Ethics The Company remains committed to the highest standards of business conduct and expects all of its employees to act accordingly. The Code of Business Conduct and Ethics (‘COC/Code’) as adopted by the Board is applicable to all the Directors, senior management and employees of the Company. The COC is available on the website of the Company at www.vedantalimited.com.
The Code underpins our social, ethical and environmental commitments and sends a clear message to our stakeholders of our commitment to responsible business practice.
The Code also includes within its ambit the provisions of US Foreign Corrupt Practices Act (FCPA) and UK Bribery Act (UKBA). Accordingly, the Company and all officials acting on behalf of the Company including its subsidiaries and affiliates ensure due compliance with the FCPA and UKBA and all applicable anti-corruption laws, in doing business anywhere in the world.
The Company has received affirmations from the Board and Senior Management confirming their compliance with the Code for the year ended March 31, 2018. An annual declaration signed by the Interim Chief Executive Officer (CEO) to this effect is attached as Annexure I to this Report.
CertificationThe certification provided by Interim CEO and CFO w.r.t. the financial statements as required under Listing Regulations was placed before the Board and the same is provided as Annexure II to this report.
Board CommitteesThe Board is assisted by six (6) principal committees each of which is responsible for reviewing and dealing with matters within its own terms of reference. The Board is responsible for constituting, assigning, co-opting and fixing the terms of reference of various Committees and the same is updated from time to time with reference to best corporate governance practices.
The Company Secretary officiates as the Secretary of the committee(s).
These Committees have optimum representation of the members of the Board with requisite expertise who hold meetings at such intervals as is deemed necessary to effectively perform the tasks assigned to them.Each Committee is directed and guided by its Charter defining its purpose, scope, responsibilities and authorities, among others.
The proceedings of all committee meetings are circulated to the members of the committee and the minutes of the meetings of all the committees are placed before the Board for its review and noting.
Details on the role and composition of these Committees, including the number of meetings held during the financial year and the related attendance are provided below.
As on March 31, 2018 the Board has following six (6) committees as detailed below:
Report on Corporate Governance continued
Audit Committee1. Lalita D. Gupte,
Independent Director (Chairperson)
2. Ravi Kant, Independent Director
3. Aman Mehta, Independent Director
4. UK Sinha, Independent Director
1Nomination and Remuneration Committee1. Aman Mehta,
Independent Director (Chairperson)2. Lalita D. Gupte,
Independent Director3. Ravi Kant, Independent
Director4. Navin Agarwal,
Executive Chairman
2Stakeholder Relationship Committee1. Lalita D. Gupte,
Independent Director (Chairperson)
2. K Venkatramanan, Independent Director
3. UK Sinha, Independent Director
4. Tarun Jain, Whole-Time Director
5. GR Arun Kumar, Whole-Time Director & Chief Financial Officer
3Corporate Social Responsibility Committee1. Ravi Kant, Independent
Director (Chairperson)2. Aman Mehta,
Independent Director3. K. Venkatramanan,
Independent Director4. UK Sinha, Independent
Director5. Tarun Jain, Whole-Time
Director6. Priya Agarwal, Non-
Executive Director
4
Risk Management Committee1. Tarun Jain, Whole-Time
Director2. GR Arun Kumar,
Whole-Time Director & Chief Financial Officer
3. Dilip Golani, Head Management
Assurance4. Deodatta Padgaonkar,
Risk Officer
5Committee Of Drectors1. Navin Agarwal,
Executive Chairman2. Tarun Jain, Whole-Time
Director3. GR Arun Kumar,
Whole-Time Director & Chief Financial Officer
6Finance Standing Committee of Directors1. Tarun Jain, Whole-Time
Director2. GR Arun Kumar,
Whole-Time Director & Chief Financial Officer
7
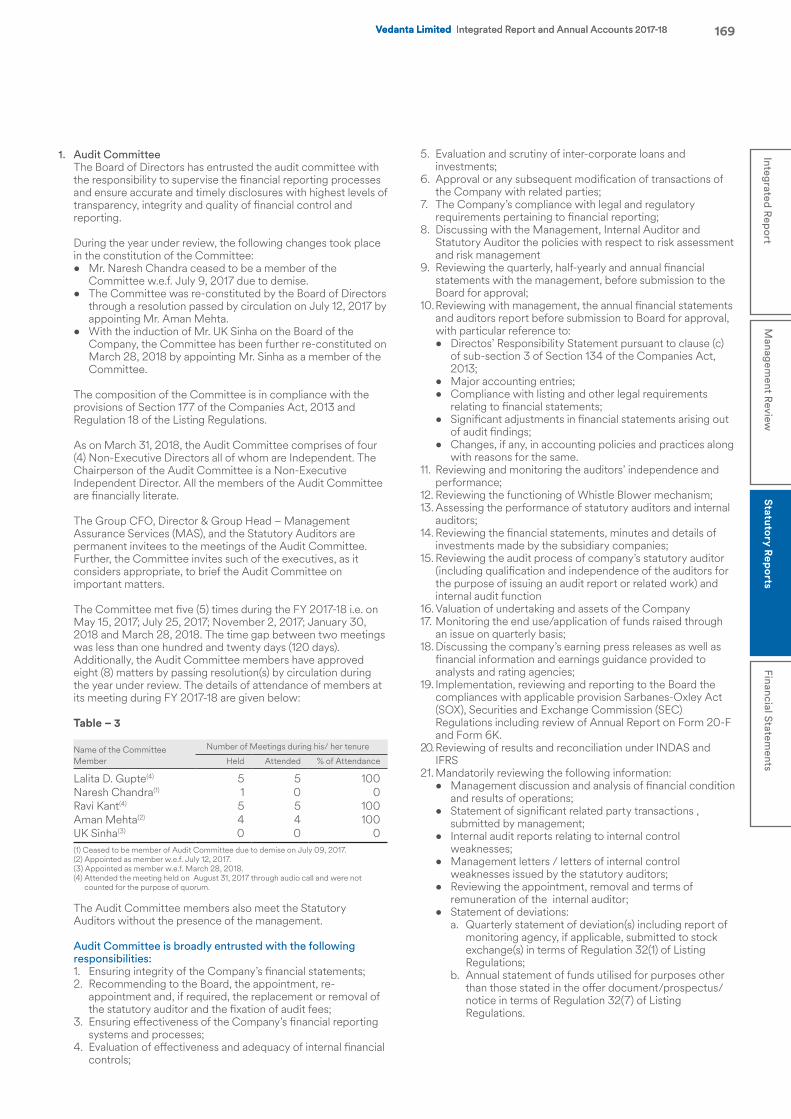
Vedanta Limited Integrated Report and Annual Accounts 2017-18 169Integrated R
eport
Managem
ent Review
Statutory R
eports
Financial Statements
Vedanta Limited Integrated Report and Annual Accounts 2017-18
1. Audit Committee The Board of Directors has entrusted the audit committee with
the responsibility to supervise the financial reporting processes and ensure accurate and timely disclosures with highest levels of transparency, integrity and quality of financial control and reporting.
During the year under review, the following changes took place in the constitution of the Committee:• Mr. Naresh Chandra ceased to be a member of the
Committee w.e.f. July 9, 2017 due to demise.• The Committee was re-constituted by the Board of Directors
through a resolution passed by circulation on July 12, 2017 by appointing Mr. Aman Mehta.
• With the induction of Mr. UK Sinha on the Board of the Company, the Committee has been further re-constituted on March 28, 2018 by appointing Mr. Sinha as a member of the Committee.
The composition of the Committee is in compliance with the provisions of Section 177 of the Companies Act, 2013 and Regulation 18 of the Listing Regulations.
As on March 31, 2018, the Audit Committee comprises of four (4) Non-Executive Directors all of whom are Independent. The Chairperson of the Audit Committee is a Non-Executive Independent Director. All the members of the Audit Committee are financially literate.
The Group CFO, Director & Group Head – Management Assurance Services (MAS), and the Statutory Auditors are permanent invitees to the meetings of the Audit Committee. Further, the Committee invites such of the executives, as it considers appropriate, to brief the Audit Committee on important matters.
The Committee met five (5) times during the FY 2017-18 i.e. on May 15, 2017; July 25, 2017; November 2, 2017; January 30, 2018 and March 28, 2018. The time gap between two meetings was less than one hundred and twenty days (120 days). Additionally, the Audit Committee members have approved eight (8) matters by passing resolution(s) by circulation during the year under review. The details of attendance of members at its meeting during FY 2017-18 are given below:
Table – 3
Name of the Committee Member
Number of Meetings during his/ her tenure
Held Attended % of Attendance
Lalita D. Gupte(4) 5 5 100Naresh Chandra(1) 1 0 0Ravi Kant(4) 5 5 100Aman Mehta(2) 4 4 100UK Sinha(3) 0 0 0(1) Ceased to be member of Audit Committee due to demise on July 09, 2017.(2) Appointed as member w.e.f. July 12, 2017.(3) Appointed as member w.e.f. March 28, 2018.(4) Attended the meeting held on August 31, 2017 through audio call and were not
counted for the purpose of quorum.
The Audit Committee members also meet the Statutory Auditors without the presence of the management.
Audit Committee is broadly entrusted with the following responsibilities:1. Ensuring integrity of the Company’s financial statements;2. Recommending to the Board, the appointment, re-
appointment and, if required, the replacement or removal of the statutory auditor and the fixation of audit fees;
3. Ensuring effectiveness of the Company’s financial reporting systems and processes;
4. Evaluation of effectiveness and adequacy of internal financial controls;
5. Evaluation and scrutiny of inter-corporate loans and investments;
6. Approval or any subsequent modification of transactions of the Company with related parties;
7. The Company’s compliance with legal and regulatory requirements pertaining to financial reporting;
8. Discussing with the Management, Internal Auditor and Statutory Auditor the policies with respect to risk assessment and risk management
9. Reviewing the quarterly, half-yearly and annual financial statements with the management, before submission to the Board for approval;
10. Reviewing with management, the annual financial statements and auditors report before submission to Board for approval, with particular reference to:
• Directos’ Responsibility Statement pursuant to clause (c) of sub-section 3 of Section 134 of the Companies Act, 2013;
• Major accounting entries;• Compliance with listing and other legal requirements
relating to financial statements;• Significant adjustments in financial statements arising out
of audit findings;• Changes, if any, in accounting policies and practices along
with reasons for the same.11. Reviewing and monitoring the auditors’ independence and
performance;12. Reviewing the functioning of Whistle Blower mechanism;13. Assessing the performance of statutory auditors and internal
auditors;14. Reviewing the financial statements, minutes and details of
investments made by the subsidiary companies;15. Reviewing the audit process of company’s statutory auditor
(including qualification and independence of the auditors for the purpose of issuing an audit report or related work) and internal audit function
16. Valuation of undertaking and assets of the Company17. Monitoring the end use/application of funds raised through
an issue on quarterly basis;18. Discussing the company’s earning press releases as well as
financial information and earnings guidance provided to analysts and rating agencies;
19. Implementation, reviewing and reporting to the Board the compliances with applicable provision Sarbanes-Oxley Act (SOX), Securities and Exchange Commission (SEC) Regulations including review of Annual Report on Form 20-F and Form 6K.
20. Reviewing of results and reconciliation under INDAS and IFRS
21. Mandatorily reviewing the following information:• Management discussion and analysis of financial condition
and results of operations;• Statement of significant related party transactions ,
submitted by management;• Internal audit reports relating to internal control
weaknesses; • Management letters / letters of internal control
weaknesses issued by the statutory auditors; • Reviewing the appointment, removal and terms of
remuneration of the internal auditor;• Statement of deviations:
a. Quarterly statement of deviation(s) including report of monitoring agency, if applicable, submitted to stock exchange(s) in terms of Regulation 32(1) of Listing Regulations;
b. Annual statement of funds utilised for purposes other than those stated in the offer document/prospectus/notice in terms of Regulation 32(7) of Listing Regulations.
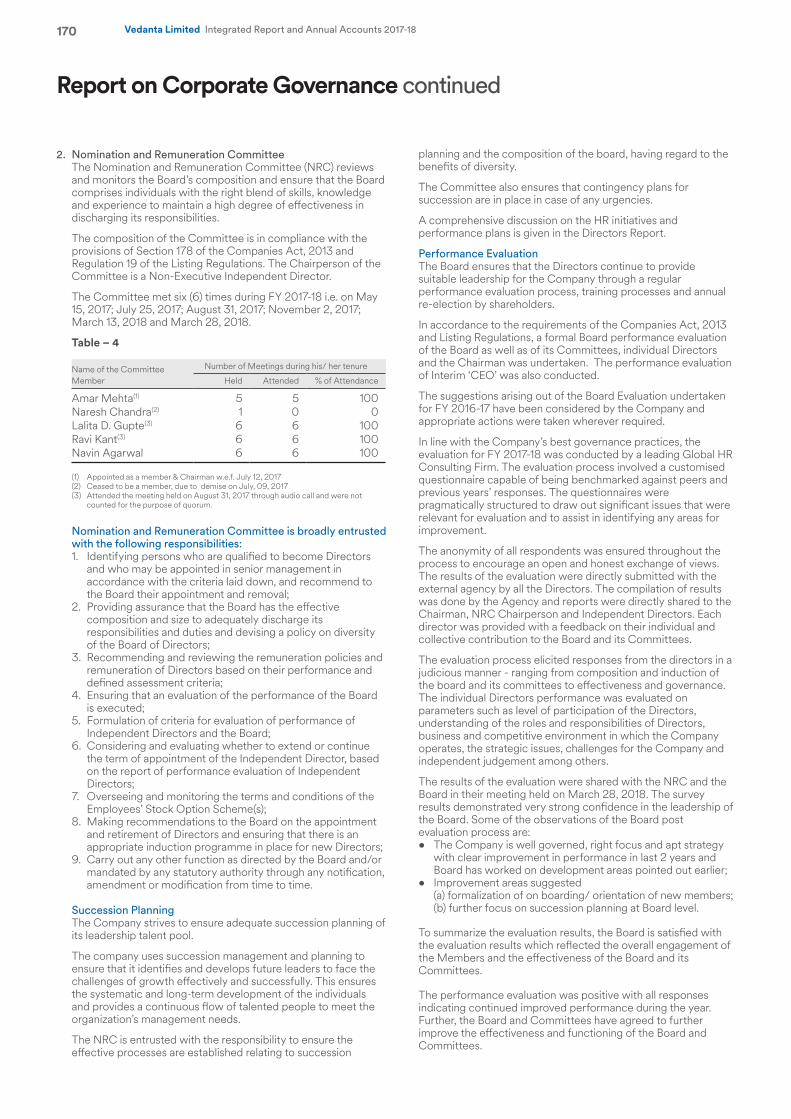
170 Vedanta Limited Integrated Report and Annual Accounts 2017-18
2. Nomination and Remuneration Committee The Nomination and Remuneration Committee (NRC) reviews
and monitors the Board’s composition and ensure that the Board comprises individuals with the right blend of skills, knowledge and experience to maintain a high degree of effectiveness in discharging its responsibilities.
The composition of the Committee is in compliance with the provisions of Section 178 of the Companies Act, 2013 and Regulation 19 of the Listing Regulations. The Chairperson of the Committee is a Non-Executive Independent Director.
The Committee met six (6) times during FY 2017-18 i.e. on May 15, 2017; July 25, 2017; August 31, 2017; November 2, 2017; March 13, 2018 and March 28, 2018.
Table – 4
Name of the Committee Member
Number of Meetings during his/ her tenure
Held Attended % of Attendance
Amar Mehta(1) 5 5 100Naresh Chandra(2) 1 0 0Lalita D. Gupte(3) 6 6 100Ravi Kant(3) 6 6 100Navin Agarwal 6 6 100
(1) Appointed as a member & Chairman w.e.f. July 12, 2017 (2) Ceased to be a member, due to demise on July, 09, 2017 (3) Attended the meeting held on August 31, 2017 through audio call and were not
counted for the purpose of quorum.
Nomination and Remuneration Committee is broadly entrusted with the following responsibilities:1. Identifying persons who are qualified to become Directors
and who may be appointed in senior management in accordance with the criteria laid down, and recommend to the Board their appointment and removal;
2. Providing assurance that the Board has the effective composition and size to adequately discharge its responsibilities and duties and devising a policy on diversity of the Board of Directors;
3. Recommending and reviewing the remuneration policies and remuneration of Directors based on their performance and defined assessment criteria;
4. Ensuring that an evaluation of the performance of the Board is executed;
5. Formulation of criteria for evaluation of performance of Independent Directors and the Board;
6. Considering and evaluating whether to extend or continue the term of appointment of the Independent Director, based on the report of performance evaluation of Independent Directors;
7. Overseeing and monitoring the terms and conditions of the Employees’ Stock Option Scheme(s);
8. Making recommendations to the Board on the appointment and retirement of Directors and ensuring that there is an appropriate induction programme in place for new Directors;
9. Carry out any other function as directed by the Board and/or mandated by any statutory authority through any notification, amendment or modification from time to time.
Succession Planning The Company strives to ensure adequate succession planning of
its leadership talent pool.
The company uses succession management and planning to ensure that it identifies and develops future leaders to face the challenges of growth effectively and successfully. This ensures the systematic and long-term development of the individuals and provides a continuous flow of talented people to meet the organization’s management needs.
The NRC is entrusted with the responsibility to ensure the effective processes are established relating to succession
planning and the composition of the board, having regard to the benefits of diversity.
The Committee also ensures that contingency plans for succession are in place in case of any urgencies.
A comprehensive discussion on the HR initiatives and performance plans is given in the Directors Report.
Performance Evaluation The Board ensures that the Directors continue to provide
suitable leadership for the Company through a regular performance evaluation process, training processes and annual re-election by shareholders.
In accordance to the requirements of the Companies Act, 2013 and Listing Regulations, a formal Board performance evaluation of the Board as well as of its Committees, individual Directors and the Chairman was undertaken. The performance evaluation of Interim ‘CEO’ was also conducted.
The suggestions arising out of the Board Evaluation undertaken for FY 2016-17 have been considered by the Company and appropriate actions were taken wherever required.
In line with the Company’s best governance practices, the evaluation for FY 2017-18 was conducted by a leading Global HR Consulting Firm. The evaluation process involved a customised questionnaire capable of being benchmarked against peers and previous years’ responses. The questionnaires were pragmatically structured to draw out significant issues that were relevant for evaluation and to assist in identifying any areas for improvement.
The anonymity of all respondents was ensured throughout the process to encourage an open and honest exchange of views. The results of the evaluation were directly submitted with the external agency by all the Directors. The compilation of results was done by the Agency and reports were directly shared to the Chairman, NRC Chairperson and Independent Directors. Each director was provided with a feedback on their individual and collective contribution to the Board and its Committees.
The evaluation process elicited responses from the directors in a judicious manner - ranging from composition and induction of the board and its committees to effectiveness and governance. The individual Directors performance was evaluated on parameters such as level of participation of the Directors, understanding of the roles and responsibilities of Directors, business and competitive environment in which the Company operates, the strategic issues, challenges for the Company and independent judgement among others.
The results of the evaluation were shared with the NRC and the Board in their meeting held on March 28, 2018. The survey results demonstrated very strong confidence in the leadership of the Board. Some of the observations of the Board post evaluation process are: • The Company is well governed, right focus and apt strategy
with clear improvement in performance in last 2 years and Board has worked on development areas pointed out earlier;
• Improvement areas suggested (a) formalization of on boarding/ orientation of new members; (b) further focus on succession planning at Board level.
To summarize the evaluation results, the Board is satisfied with the evaluation results which reflected the overall engagement of the Members and the effectiveness of the Board and its Committees.
The performance evaluation was positive with all responses indicating continued improved performance during the year. Further, the Board and Committees have agreed to further improve the effectiveness and functioning of the Board and Committees.
Report on Corporate Governance continued
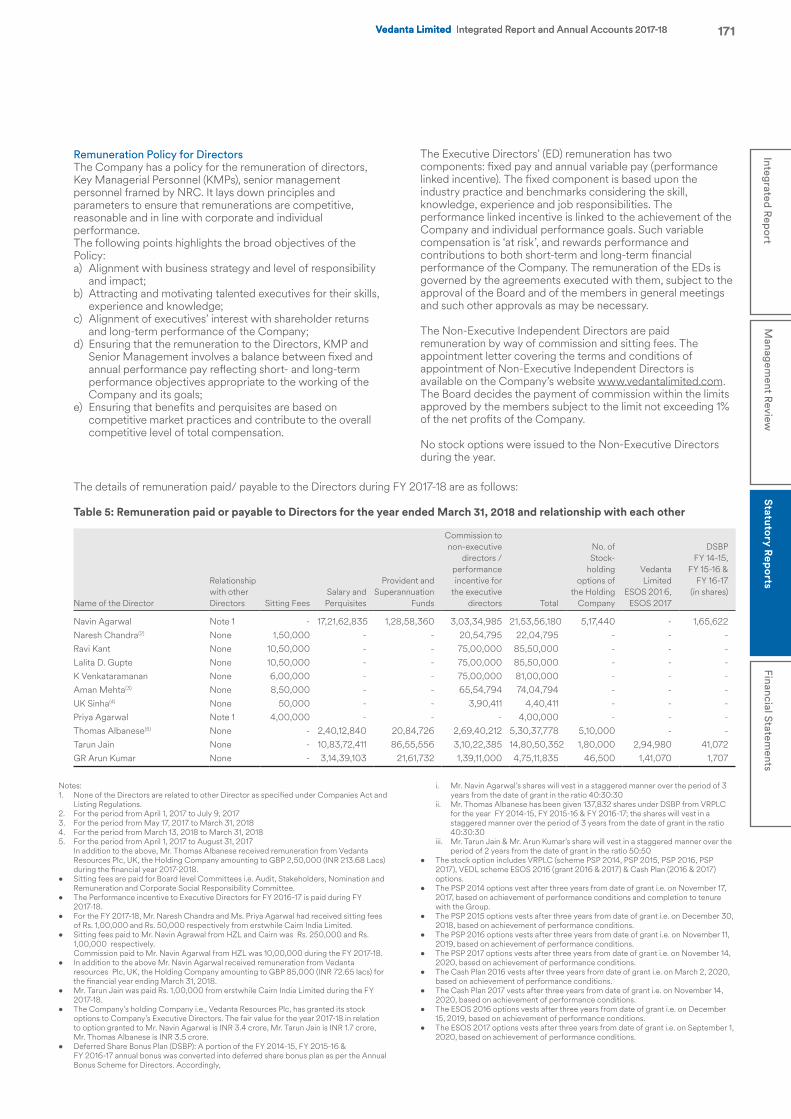
Vedanta Limited Integrated Report and Annual Accounts 2017-18 171Integrated R
eport
Managem
ent Review
Statutory R
eports
Financial Statements
Vedanta Limited Integrated Report and Annual Accounts 2017-18
Remuneration Policy for Directors The Company has a policy for the remuneration of directors,
Key Managerial Personnel (KMPs), senior management personnel framed by NRC. It lays down principles and parameters to ensure that remunerations are competitive, reasonable and in line with corporate and individual performance.
The following points highlights the broad objectives of the Policy:a) Alignment with business strategy and level of responsibility
and impact;b) Attracting and motivating talented executives for their skills,
experience and knowledge;c) Alignment of executives’ interest with shareholder returns
and long-term performance of the Company;d) Ensuring that the remuneration to the Directors, KMP and
Senior Management involves a balance between fixed and annual performance pay reflecting short- and long-term performance objectives appropriate to the working of the Company and its goals;
e) Ensuring that benefits and perquisites are based on competitive market practices and contribute to the overall competitive level of total compensation.
The Executive Directors’ (ED) remuneration has two components: fixed pay and annual variable pay (performance linked incentive). The fixed component is based upon the industry practice and benchmarks considering the skill, knowledge, experience and job responsibilities. The performance linked incentive is linked to the achievement of the Company and individual performance goals. Such variable compensation is ‘at risk’, and rewards performance and contributions to both short-term and long-term financial performance of the Company. The remuneration of the EDs is governed by the agreements executed with them, subject to the approval of the Board and of the members in general meetings and such other approvals as may be necessary.
The Non-Executive Independent Directors are paid remuneration by way of commission and sitting fees. The appointment letter covering the terms and conditions of appointment of Non-Executive Independent Directors is available on the Company’s website www.vedantalimited.com. The Board decides the payment of commission within the limits approved by the members subject to the limit not exceeding 1% of the net profits of the Company.
No stock options were issued to the Non-Executive Directors during the year.
The details of remuneration paid/ payable to the Directors during FY 2017-18 are as follows:
Table 5: Remuneration paid or payable to Directors for the year ended March 31, 2018 and relationship with each other
Name of the Director
Relationship with other Directors Sitting Fees
Salary and Perquisites
Provident and Superannuation
Funds
Commission to non-executive
directors / performance incentive for
the executive directors Total
No. of Stock-
holding options of
the Holding Company
Vedanta Limited
ESOS 201 6, ESOS 2017
DSBP FY 14-15,
FY 15-16 & FY 16-17
(in shares)
Navin Agarwal Note 1 - 17,21,62,835 1,28,58,360 3,03,34,985 21,53,56,180 5,17,440 - 1,65,622Naresh Chandra(2) None 1,50,000 - - 20,54,795 22,04,795 - - -Ravi Kant None 10,50,000 - - 75,00,000 85,50,000 - - -Lalita D. Gupte None 10,50,000 - - 75,00,000 85,50,000 - - -K Venkataramanan None 6,00,000 - - 75,00,000 81,00,000 - - -Aman Mehta(3) None 8,50,000 - - 65,54,794 74,04,794 - - -UK Sinha(4) None 50,000 - - 3,90,411 4,40,411 - - -Priya Agarwal Note 1 4,00,000 - - - 4,00,000 - - -Thomas Albanese(5) None - 2,40,12,840 20,84,726 2,69,40,212 5,30,37,778 5,10,000 - -Tarun Jain None - 10,83,72,411 86,55,556 3,10,22,385 14,80,50,352 1,80,000 2,94,980 41,072GR Arun Kumar None - 3,14,39,103 21,61,732 1,39,11,000 4,75,11,835 46,500 1,41,070 1,707
Notes: 1. None of the Directors are related to other Director as specified under Companies Act and
Listing Regulations.2. For the period from April 1, 2017 to July 9, 20173. For the period from May 17, 2017 to March 31, 20184. For the period from March 13, 2018 to March 31, 20185. For the period from April 1, 2017 to August 31, 2017 In addition to the above, Mr. Thomas Albanese received remuneration from Vedanta
Resources Plc, UK, the Holding Company amounting to GBP 2,50,000 (INR 213.68 Lacs) during the financial year 2017-2018.
• Sitting fees are paid for Board level Committees i.e. Audit, Stakeholders, Nomination and Remuneration and Corporate Social Responsibility Committee.
• The Performance incentive to Executive Directors for FY 2016-17 is paid during FY 2017-18.
• For the FY 2017-18, Mr. Naresh Chandra and Ms. Priya Agarwal had received sitting fees of Rs. 1,00,000 and Rs. 50,000 respectively from erstwhile Cairn India Limited.
• Sitting fees paid to Mr. Navin Agrawal from HZL and Cairn was Rs. 250,000 and Rs. 1,00,000 respectively.
Commission paid to Mr. Navin Agarwal from HZL was 10,00,000 during the FY 2017-18.• In addition to the above Mr. Navin Agarwal received remuneration from Vedanta
resources Plc, UK, the Holding Company amounting to GBP 85,000 (INR 72.65 lacs) for the financial year ending March 31, 2018.
• Mr. Tarun Jain was paid Rs. 1,00,000 from erstwhile Cairn India Limited during the FY 2017-18.
• The Company’s holding Company i.e., Vedanta Resources Plc, has granted its stock options to Company’s Executive Directors. The fair value for the year 2017-18 in relation to option granted to Mr. Navin Agarwal is INR 3.4 crore, Mr. Tarun Jain is INR 1.7 crore, Mr. Thomas Albanese is INR 3.5 crore.
• Deferred Share Bonus Plan (DSBP): A portion of the FY 2014-15, FY 2015-16 & FY 2016-17 annual bonus was converted into deferred share bonus plan as per the Annual Bonus Scheme for Directors. Accordingly,
i. Mr. Navin Agarwal’s shares will vest in a staggered manner over the period of 3 years from the date of grant in the ratio 40:30:30
ii. Mr. Thomas Albanese has been given 137,832 shares under DSBP from VRPLC for the year FY 2014-15, FY 2015-16 & FY 2016-17; the shares will vest in a staggered manner over the period of 3 years from the date of grant in the ratio 40:30:30
iii. Mr. Tarun Jain & Mr. Arun Kumar’s share will vest in a staggered manner over the period of 2 years from the date of grant in the ratio 50:50
• The stock option includes VRPLC (scheme PSP 2014, PSP 2015, PSP 2016, PSP 2017), VEDL scheme ESOS 2016 (grant 2016 & 2017) & Cash Plan (2016 & 2017) options.
• The PSP 2014 options vest after three years from date of grant i.e. on November 17, 2017, based on achievement of performance conditions and completion to tenure with the Group.
• The PSP 2015 options vests after three years from date of grant i.e. on December 30, 2018, based on achievement of performance conditions.
• The PSP 2016 options vests after three years from date of grant i.e. on November 11, 2019, based on achievement of performance conditions.
• The PSP 2017 options vests after three years from date of grant i.e. on November 14, 2020, based on achievement of performance conditions.
• The Cash Plan 2016 vests after three years from date of grant i.e. on March 2, 2020, based on achievement of performance conditions.
• The Cash Plan 2017 vests after three years from date of grant i.e. on November 14, 2020, based on achievement of performance conditions.
• The ESOS 2016 options vests after three years from date of grant i.e. on December 15, 2019, based on achievement of performance conditions.
• The ESOS 2017 options vests after three years from date of grant i.e. on September 1, 2020, based on achievement of performance conditions.
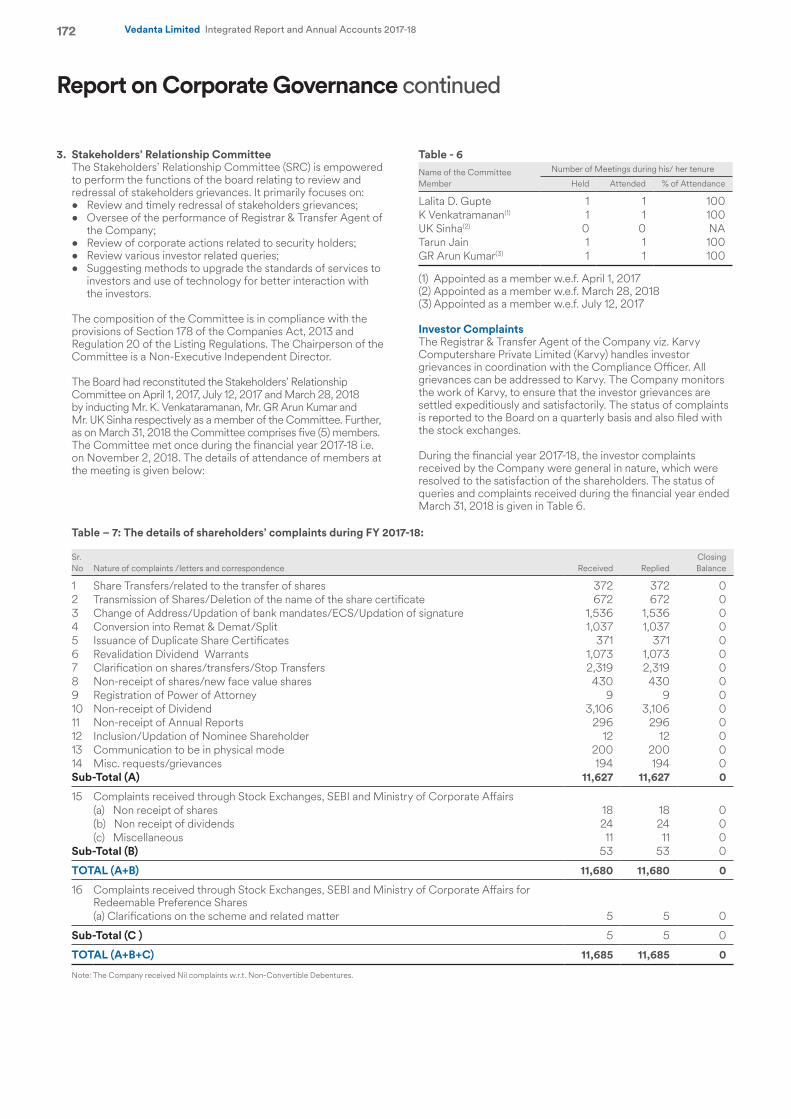
172 Vedanta Limited Integrated Report and Annual Accounts 2017-18
3. Stakeholders’ Relationship Committee The Stakeholders’ Relationship Committee (SRC) is empowered
to perform the functions of the board relating to review and redressal of stakeholders grievances. It primarily focuses on:• Review and timely redressal of stakeholders grievances;• Oversee of the performance of Registrar & Transfer Agent of
the Company;• Review of corporate actions related to security holders;• Review various investor related queries;• Suggesting methods to upgrade the standards of services to
investors and use of technology for better interaction with the investors.
The composition of the Committee is in compliance with the provisions of Section 178 of the Companies Act, 2013 and Regulation 20 of the Listing Regulations. The Chairperson of the Committee is a Non-Executive Independent Director.
The Board had reconstituted the Stakeholders’ Relationship Committee on April 1, 2017, July 12, 2017 and March 28, 2018 by inducting Mr. K. Venkataramanan, Mr. GR Arun Kumar and Mr. UK Sinha respectively as a member of the Committee. Further, as on March 31, 2018 the Committee comprises five (5) members.
The Committee met once during the financial year 2017-18 i.e. on November 2, 2018. The details of attendance of members at the meeting is given below:
Table - 6 Name of the Committee Member
Number of Meetings during his/ her tenure
Held Attended % of Attendance
Lalita D. Gupte 1 1 100K Venkatramanan(1) 1 1 100UK Sinha(2) 0 0 NATarun Jain 1 1 100GR Arun Kumar(3) 1 1 100
(1) Appointed as a member w.e.f. April 1, 2017 (2) Appointed as a member w.e.f. March 28, 2018 (3) Appointed as a member w.e.f. July 12, 2017
Investor Complaints The Registrar & Transfer Agent of the Company viz. Karvy
Computershare Private Limited (Karvy) handles investor grievances in coordination with the Compliance Officer. All grievances can be addressed to Karvy. The Company monitors the work of Karvy, to ensure that the investor grievances are settled expeditiously and satisfactorily. The status of complaints is reported to the Board on a quarterly basis and also filed with the stock exchanges.
During the financial year 2017-18, the investor complaints received by the Company were general in nature, which were resolved to the satisfaction of the shareholders. The status of queries and complaints received during the financial year ended March 31, 2018 is given in Table 6.
Table – 7: The details of shareholders’ complaints during FY 2017-18:
Sr. No Nature of complaints /letters and correspondence Received Replied
Closing Balance
1 Share Transfers/related to the transfer of shares 372 372 02 Transmission of Shares/Deletion of the name of the share certificate 672 672 03 Change of Address/Updation of bank mandates/ECS/Updation of signature 1,536 1,536 04 Conversion into Remat & Demat/Split 1,037 1,037 05 Issuance of Duplicate Share Certificates 371 371 06 Revalidation Dividend Warrants 1,073 1,073 07 Clarification on shares/transfers/Stop Transfers 2,319 2,319 08 Non-receipt of shares/new face value shares 430 430 09 Registration of Power of Attorney 9 9 010 Non-receipt of Dividend 3,106 3,106 011 Non-receipt of Annual Reports 296 296 012 Inclusion/Updation of Nominee Shareholder 12 12 013 Communication to be in physical mode 200 200 014 Misc. requests/grievances 194 194 0Sub-Total (A) 11,627 11,627 0
15 Complaints received through Stock Exchanges, SEBI and Ministry of Corporate Affairs (a) Non receipt of shares 18 18 0(b) Non receipt of dividends 24 24 0(c) Miscellaneous 11 11 0
Sub-Total (B) 53 53 0
TOTAL (A+B) 11,680 11,680 0
16 Complaints received through Stock Exchanges, SEBI and Ministry of Corporate Affairs for Redeemable Preference Shares (a) Clarifications on the scheme and related matter 5 5 0
Sub-Total (C ) 5 5 0
TOTAL (A+B+C) 11,685 11,685 0
Note: The Company received Nil complaints w.r.t. Non-Convertible Debentures.
Report on Corporate Governance continued
Vedanta Limited Integrated Report and Annual Accounts 2017-18 173Integrated R
eport
Managem
ent Review
Statutory R
eports
Financial Statements
Vedanta Limited Integrated Report and Annual Accounts 2017-18
4. Corporate Social Responsibility (CSR) Committee The CSR Committee is responsible for fulfilling the CSR
objectives of the Company. The composition of the Committee is in compliance with the provisions of Section 135 of the Companies Act, 2013 and provisions made thereunder. The Board reconstituted the Committee on April 1, 2017, by appointing Mr. K. Ventaramanan as member; on July 12, 2017 by appointing Mr. Ravi Kant as Chairman and Mr. Aman Mehta and Ms. Priya Agarwal as the members of the Committee; and on March 28, 2018 with the induction of Mr. UK Sinha on the Board of the Company. The Chairperson of the Committee is a Non-Executive Independent Director. The Committee comprises six (6) members including four (4) Independent Directors; one (1) Non-Executive Director and one (1) Whole-Time Director.
The Committee met two times during the financial year 2017-18 i.e. on May 15, 2017 and January 30, 2018. The details of attendance of members at the meeting is given below:
Table – 8
Name of the Committee Member
Number of Meetings during his/ her tenure
Held Attended % of Attendance
Ravi Kant 2 2 100Aman Mehta(1) 1 1 100K Venkatramanan(2) 2 2 100Naresh Chandra(3) 1 0 0UK Sinha(4) 0 0 NAPriya Agarwal(1) 1 1 100Tarun Jain 2 2 100Thomas Albanese(5) 1 0 0
(1) Appointed as a member w.e.f. July 12, 2017 (2) Appointed as a member w.e.f. April 1, 2017 (3) Ceased to be a member w.e.f. July 9, 2017 (4) Appointed as a member w.e.f. March 28, 2018 (5) Ceased to be a member w.e.f. August 31, 2017
Corporate Social Responsibility Committee is entrusted with the following responsibilities:1. Formulating and recommending to the Board the CSR Policy
and activities to be undertaken by the Company in compliance with provisions of the Companies Act, 2013 and the rules made thereunder;
2. Recommending the amount of expenditure to be incurred on CSR activities of the Company;
3. Overseeing the implementation of CSR activities and projects;
4. Evaluating performance of the Company in the area of CSR;5. Monitoring implementation of CSR Policy of the Company
from time to time;6. Carry out any other function as directed by the Board and/or
mandated by any statutory authority through any notification, amendment or modification from time to time.
5. Risk Management Committee The Company has a duly constituted Risk Management
Committee (RMC) which assists the Board in oversight and review of the risk management framework as well as the assessment of risks, their management and mitigation procedures under the aegis of the overall business risk management framework.
The constitution of the Committee is in compliance with Regulation 21 of the Listing Regulations. As on March 31, 2018, the Committee comprises three (3) members including two (2) Executive Directors and one (1) member from the Senior Management. The Committee also has an appointed Risk Officer. The meetings of the Committee are chaired by the Director as specified in Regulation 21 of the Listing Regulations.
During the financial year 2017-18, the Committee met three (3) on June 28, 2017, October 12, 2017 and January 12, 2018.
Risk Management Committee is entrusted with the following responsibilities:1. Framing, reviewing and monitoring the Risk Management
Policy and Plan of the Company and to recommend to the Audit Committee/ Board for approval/ changes;
2. On a continuous basis attaining reasonable assurance from the management that all known and emerging risks have been identified and accordingly mitigated/managed;
3. Assessing risks and procedures and minimising the same;4. Ensuring suitable measures are taken to attain prudent
balance between the overall risk and reward associated with it.
Re-Constitution of Internal Board CommitteesThe board has also constituted various internal committees, as a means of improving board effectiveness and efficiency where more focused, specialized and technically oriented discussions are required. As on April 1, 2017 there were four (4) internal Board committees as highlighted below:• CFO Committee• Committee of Directors• Committee of Directors for Issuance of Share Certificates • Share & Debenture Transfer Committee
In order to have more efficient and effective control and seamless management, the scope and composition of the Committee of Directors was revised by the Board of Directors of the Company in their meeting held on November 2, 2017.
Further, the Board in its meeting held on November 2, 2017 has consolidated the ‘CFO Committee’ and the ‘Committee of Directors for Issuance of Share Certificates’ and renamed the same as ‘Finance Standing Committee of Directors’.
The following are the internal committees of the Board as on March 31, 2018. A brief description of the Committee including their roles, responsibilities and constitution is also provided in the report.• Share & Debenture Transfer Committee• Finance Standing Committee of Directors• Committee of Directors
Share & Debenture Transfer CommitteeThe Committee comprises of three (3) members, Mr. GR Arun Kumar, Whole-Time Director & Chief Financial Officer, Ms. Pooja Yadava, GM Legal and Ms. Bhumika Sood, Company Secretary & Compliance Officer. During the year the Committee met eighteen (18) times.
The role of Share & Debenture Transfer Committee primarily includes the following:• Allotment of shares, debentures or any other securities;• Approval of transfer or transmission of shares, debentures or any
other securities;• Issue of duplicate certificates and new certificates on split/
consolidation/renewal/ demat /remat of shares/ debentures/other securities issued by the company from time to time.
The number of pending share transfers as on March 31, 2018 is Nil.
Finance Standing CommitteeThe Finance Standing Committee (FSC) of Directors is entrusted with the responsibility to consider and approve the finance and treasury related proposal within the overall limits approved by the Board. The Committee comprises of two (2) Executive Directors. The Company meets as and when required. During FY 2017-18, the committee met two (2) times on December 22, 2017 and March 26, 2018.
174 Vedanta Limited Integrated Report and Annual Accounts 2017-18
Committee of DirectorsThe Committee of Directors (COD) is responsible to consider, review and approve all borrowing proposals, within the overall limits approved by the Board from time to time. The Committee facilitates seamless operations and cater to various day-to-day requirements. The Committee meets as and when deem necessary. The scope of the Committee was revised in the Board meeting held on November 2, 2017.
As on March 31, 2018, the Committee comprises three (3) Executive Directors. The Committee met five (5) times during the financial year 2017-18.
The Committee operates within the overall responsibilities and powers entrusted upon the Committee by the Board.
Executive Committee (EXCO)The Executive Committee of the Company ensures implementation of the Board’s fiduciary, strategic and generative plans, policies, and
decisions consistent with the organization’s Vision, Mission and Guiding Principles. The brief profile of EXCO members forms part of the Annual Report. EXCO meetings are conducted on monthly basis and are presided by the Group CEO. The CFOs/Deputy CFOs, COO’s, Head Finance, Business EXCO members of respective businesses and subsidiaries are also invitees to EXCO meetings. The Chairman of the Company often attends the EXCO meetings.
The role and responsibilities of the Committee covers the following broad areas:• Regular evaluation of the Company’s various business divisions
and key subsidiaries;• Assessment of Policy framework;• Functional review is carried out by the functional EXCO for
ensuring centralised and explicit focus to each function; and• Review on Health, Safety and Environment.
General Body MeetingsAnnual General MeetingsThe details of the Annual General Meetings held during the last three years and special resolutions passed thereat are provided under in Table – 9
Table – 9: Last Three Annual General Meetings:
Year Location Date & Time Special Resolutions passed
2014-15 Panjim Community Centre Near Four Pillars, Mala, Panaji, Goa
July 11, 2015 at 11.00 a.m. • To approve offer or invitation for subscription of Non-Convertible Debentures or other Debt Securities on Private Placement basis.
2015-16 Main Hall of Institute Menezes Braganza, Panaji, Goa - 403 001
June 29, 2016 at 11.00 a.m. • To approve an offer or invitation for subscription of Non-Convertible Debentures or other Debt Securities upto Rs. 20,000 Crore on a Private Placement basis;
• To waive the excess remuneration paid to Mr. Navin Agarwal, Whole-Time Director (DIN: 00006303) of the Company for FY 2013-14.
2016-17 Rangsharda Auditorium, K.C. Marg, Bandra Reclamation, Bandra (West), Mumbai - 400 050.
July 14, 2017 at 10.30 a.m. • To consider appointment of Mr. G.R. Arun Kumar as Whole Time Director, designated as Chief Financial Officer (CFO) of the Company for the period from November 22, 2016 to November 21, 2019
• To consider re-appointment of Mr. Thomas Albanese as Whole Time Director designated as Chief Executive Officer (CEO) of the Company for the period from April 1, 2017 to August 31, 2017
• To approve offer or invitation to subscribe the Non-Convertible Debentures or other Debt Securities upto INR 20,000 crores on a Private Placement basis
• To waive the excess remuneration paid to Mr. Navin Agarwal, Whole-Time Director (DIN:00006303) of the Company for FY 2013-14
Postal BallotThere were no resolutions passed during the year 2017-18 through postal ballot
Further, none of the businesses that are proposed to be transacted at the forthcoming AGM require passing a resolution through postal ballot. Also, there is no immediate proposal for passing any resolution through postal ballot.
Report on Corporate Governance continued
Vedanta Limited Integrated Report and Annual Accounts 2017-18 175Integrated R
eport
Managem
ent Review
Statutory R
eports
Financial Statements
Vedanta Limited Integrated Report and Annual Accounts 2017-18
Means of CommunicationEffective communication of information to the shareholders forms a vital part of Corporate Governance.
Financial Results The Company intimates Quarterly/Half-Yearly/Annual Results to stock exchanges, immediately after the Board meetings at which they are approved.
The results of the Company are also published within 48 hours of the conclusion of the meeting in at least one prominent national and one regional newspaper having wide circulation.
The quarterly financial results during FY 2017-18 were published in the newspaper as detailed below:
Quarter(FY 2017-18) Date of Board Meeting Date of Publication Newspaper
1 July 25, 2017 July 26, 2017 Business StandardMaharashtra Times Economic Times
2 November 2, 2017 November 3, 2017 Financial Express JansattaNavshakti (Marathi) Free Press JournalBusiness StandardEconomic Times
3 January 31, 2018 February 1, 2018 Business Standard Economic Times Financial Express Maharashtra Times
4 May 3, 2018 May 4, 2018 Business Standard, Financial Express, Economic Times, Maharashtra Times
Further, the financial results are also displayed on the Company’s website: www.vedantalimited.com and posted on NSE Electronic Application Processing System (NEAPS) and BSE Corporate Compliance & Listing Centre (the Listing Centre).
Further, as a good corporate governance practice, the Company sends its quarterly financial results to shareholders whose email ids are registered with the depository participants through email after they are approved by the Board and disseminated to the stock exchanges.
Website The Company’s corporate website www.vedantalimited.com gives comprehensive information about the management, vision, mission, policies, corporate governance, sustainability and investor relations.
The section on ‘Investor Relations’ serves to inform the shareholders, by giving up-to-date financial results, annual reports, shareholding patterns, official news releases, financial analysis reports, schedule of analyst meet, Notices and other general information about the Company.
News Releases Official news releases are sent to stock exchanges and simultaneously displayed on the Company’s website: www.vedantalimited.com.
Presentations made to Institutional Investors and Analysts
The schedule of analyst/institutional investor meets and detailed presentations made to them are sent to stock exchanges and simultaneously are also posted on the Company’s website: www.vedantalimited.com.
Annual Report In consonance with the Company’s sustainability initiatives, the Company sends soft copies of Annual Reports to those shareholders whose email ids are registered with the Company. Hard copies are also sent to those shareholders whose email ids are not registered. Shareholders are requested to support this green initiative by registering/updating their e-mail addresses for receiving electronic communications.
The complete Annual Report and Accounts of the Company are available on the Company’s website: www.vedantalimited.com.
Filing with Stock Exchanges All filings with the stock exchanges are displayed on NEAPS and the Listing Centre
Chairman Communique Printed copy of the Chairman’s speech is distributed to each shareholder at the AGM. The speech is also placed on the website of the Company and published in the newspaper for better circulation.
176 Vedanta Limited Integrated Report and Annual Accounts 2017-18
General Shareholder Informationa) Annual General Meeting for FY 2017-18 The Board welcomes the opportunity to enter into dialogue with the shareholders at the forthcoming Annual General Meeting (AGM)
and views it as an opportunity to engage with all the shareholders on the performance of the business they own.
The AGM is scheduled as per the below details:
Date : August 24, 2018 Time : 10:30 a.m. IST Venue : Rangsharda Auditorium, K.C. Marg, Bandra Reclamation, Bandra (West), Mumbai – 400 050
A separate Notice of Meeting, containing an explanation of the items of special business, has been sent to shareholders and is available on the Company’s website.
b) Financial Year: April 1 to March 31 For the year ended March 31, 2018, the financial results were considered and approved by the Board in their meeting held on the
following dates:
First Quarter Ended Results : July 25, 2017 Second Quarter and Half Year Ended Results : November 2, 2017 Third Quarter Ended Results : January 31, 2018 Fourth Quarter and Year Ended Results : May 3, 2018
The tentative dates of meeting of the Board to consider and approve the quarterly financial results for FY 2018-19 are as follows:
First Quarter Ended Results : End July 2018 Second Quarter and Half Year Ended Results : End October 2018 Third Quarter Ended Results : End January 2019 Fourth Quarter and Year Ended Results : End April 2019
c) Dividend During the year, the Company has paid the following dividend:
Date of Board Meeting Type of Security Type of Dividend Amount of Dividend Record Date
March 13, 2018 Equity Shares Interim Dividend Rs. 21.20 per share Wednesday, March 21, 2018 Preference Shares Preference Dividend Rs. 0.75 per share on
Pro-rata basis
The Board have not recommended any final dividend.
d) Book Closure The Register of Members and Share Transfer Books of the Company will remain closed from Monday, August 20, 2018 to Thursday,
August 23, 2018 (both days inclusive).
e) Listing Details
Scrip Code ISIN code
BSE Limited (BSE)Phiroze Jeejeebhoy Towers, Dalal Street, Mumbai - 400 001
Equity 500295 INE205A01025
Preference (7.50% Non-Cumulative Non-Convertible RedeemablePreference Shares of Rs.10/- each fully paid up) 700134 INE205A04011
National Stock Exchange of India Limited (NSE) Exchange Plaza, Plot No. C/1, G-Block, Bandra Kurla Complex, Bandra(East), Mumbai - 400 051
Equity VEDL INE205A01025
Preference (7.50% Non-Cumulative Non-Convertible RedeemablePreference Shares of Rs.10/- each fully paid up) VEDL P1 INE205A04011
New York Stock Exchange (NYSE) American Depository Shares (ADS) VEDL
CUSIP92242Y100
The Company’s Non-Convertible Debentures are listed on the BSE Limited (BSE). The company has paid annual listing fees as applicable to BSE Limited, National Stock Exchange of India Limited and New York Stock Exchange.
Report on Corporate Governance continued
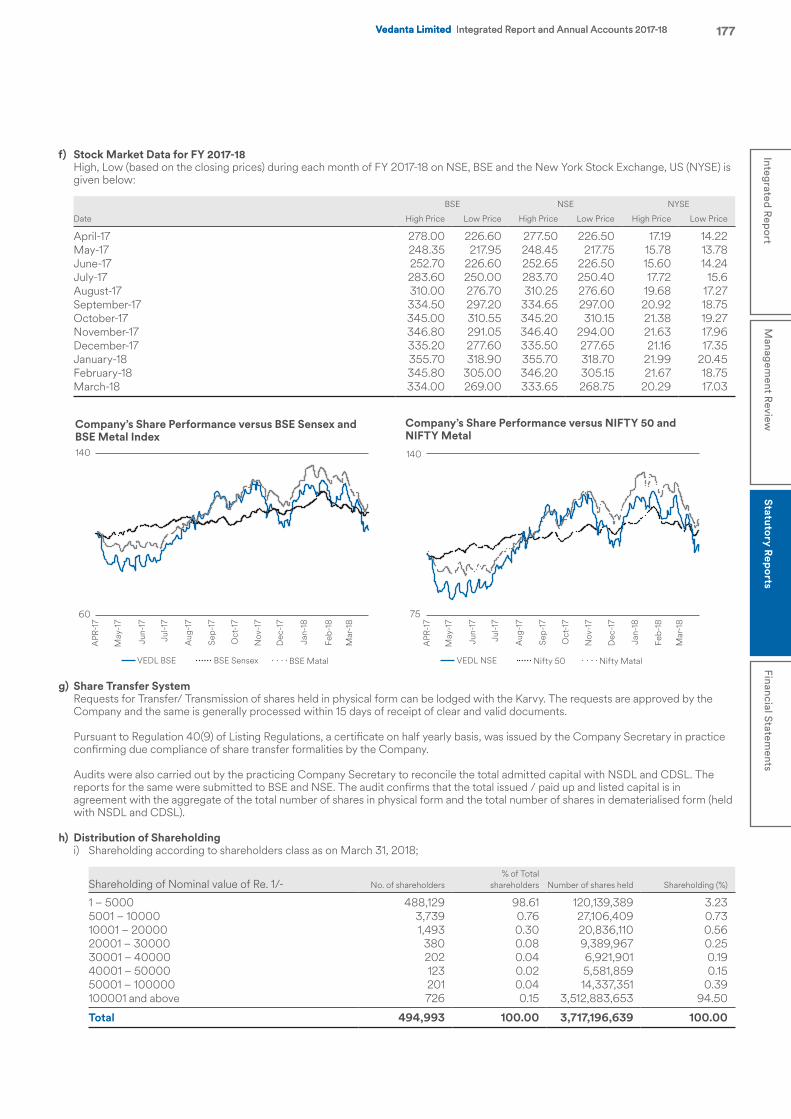
Vedanta Limited Integrated Report and Annual Accounts 2017-18 177Integrated R
eport
Managem
ent Review
Statutory R
eports
Financial Statements
Vedanta Limited Integrated Report and Annual Accounts 2017-18
f) Stock Market Data for FY 2017-18 High, Low (based on the closing prices) during each month of FY 2017-18 on NSE, BSE and the New York Stock Exchange, US (NYSE) is
given below:
Date
BSE NSE NYSE
High Price Low Price High Price Low Price High Price Low Price
April-17 278.00 226.60 277.50 226.50 17.19 14.22May-17 248.35 217.95 248.45 217.75 15.78 13.78June-17 252.70 226.60 252.65 226.50 15.60 14.24July-17 283.60 250.00 283.70 250.40 17.72 15.6August-17 310.00 276.70 310.25 276.60 19.68 17.27September-17 334.50 297.20 334.65 297.00 20.92 18.75October-17 345.00 310.55 345.20 310.15 21.38 19.27November-17 346.80 291.05 346.40 294.00 21.63 17.96December-17 335.20 277.60 335.50 277.65 21.16 17.35January-18 355.70 318.90 355.70 318.70 21.99 20.45February-18 345.80 305.00 346.20 305.15 21.67 18.75March-18 334.00 269.00 333.65 268.75 20.29 17.03
g) Share Transfer System Requests for Transfer/ Transmission of shares held in physical form can be lodged with the Karvy. The requests are approved by the
Company and the same is generally processed within 15 days of receipt of clear and valid documents.
Pursuant to Regulation 40(9) of Listing Regulations, a certificate on half yearly basis, was issued by the Company Secretary in practice confirming due compliance of share transfer formalities by the Company.
Audits were also carried out by the practicing Company Secretary to reconcile the total admitted capital with NSDL and CDSL. The reports for the same were submitted to BSE and NSE. The audit confirms that the total issued / paid up and listed capital is in agreement with the aggregate of the total number of shares in physical form and the total number of shares in dematerialised form (held with NSDL and CDSL).
h) Distribution of Shareholdingi) Shareholding according to shareholders class as on March 31, 2018;
Shareholding of Nominal value of Re. 1/- No. of shareholders% of Total
shareholders Number of shares held Shareholding (%)
1 – 5000 488,129 98.61 120,139,389 3.235001 – 10000 3,739 0.76 27,106,409 0.7310001 – 20000 1,493 0.30 20,836,110 0.5620001 – 30000 380 0.08 9,389,967 0.2530001 – 40000 202 0.04 6,921,901 0.1940001 – 50000 123 0.02 5,581,859 0.1550001 – 100000 201 0.04 14,337,351 0.39100001 and above 726 0.15 3,512,883,653 94.50
Total 494,993 100.00 3,717,196,639 100.00
Company’s Share Performance versus BSE Sensex and BSE Metal Index
Company’s Share Performance versus NIFTY 50 and NIFTY Metal
140 140
60 75
APR
-17
APR
-17
May
-17
May
-17
VEDL BSE VEDL NSE BSE Sensex Nifty 50 BSE Matal Nifty Matal
Jun-
17
Jun-
17
Jul-1
7
Jul-1
7
Aug
-17
Aug
-17
Sep-
17
Sep-
17
Oct
-17
Oct
-17
Nov
-17
Nov
-17
Dec
-17
Dec
-17
Jan-
18
Jan-
18
Feb-
18
Feb-
18
Mar
-18
Mar
-18
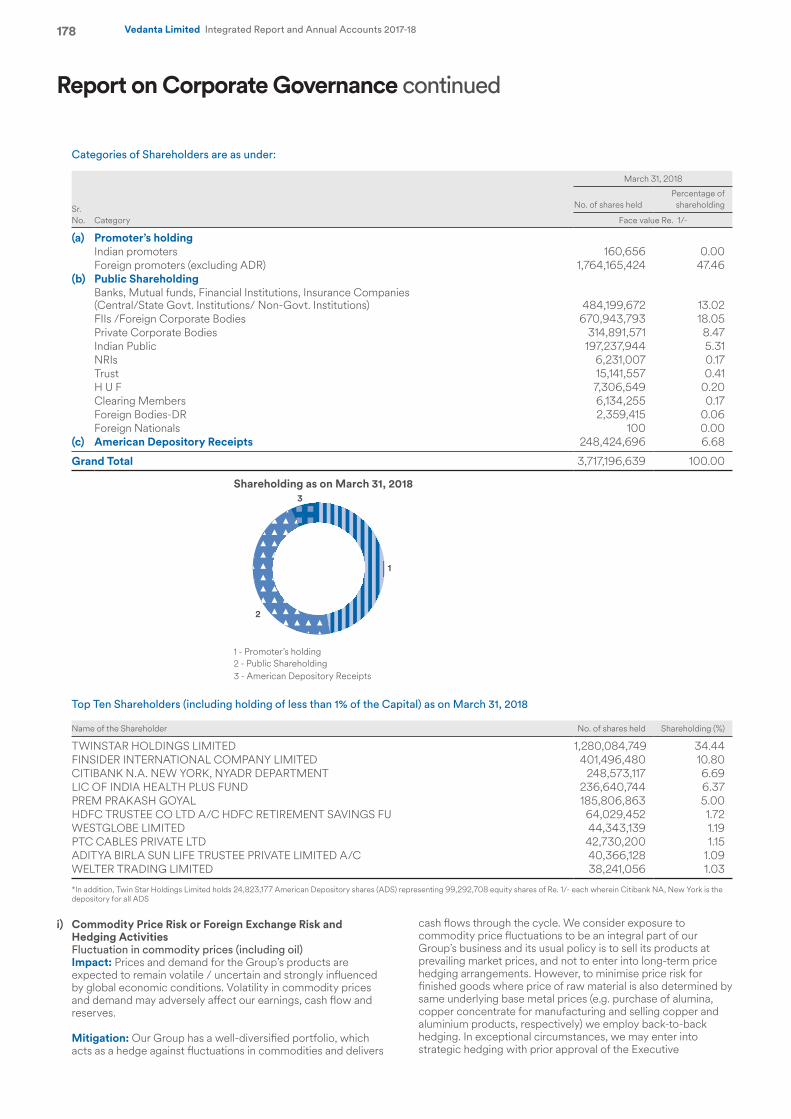
178 Vedanta Limited Integrated Report and Annual Accounts 2017-18
Categories of Shareholders are as under:
Sr. No. Category
March 31, 2018
No. of shares held Percentage of
shareholding
Face value Re. 1/-
(a) Promoter’s holding Indian promoters 160,656 0.00Foreign promoters (excluding ADR) 1,764,165,424 47.46
(b) Public Shareholding Banks, Mutual funds, Financial Institutions, Insurance Companies (Central/State Govt. Institutions/ Non-Govt. Institutions) 484,199,672 13.02FIIs /Foreign Corporate Bodies 670,943,793 18.05Private Corporate Bodies 314,891,571 8.47Indian Public 197,237,944 5.31NRIs 6,231,007 0.17Trust 15,141,557 0.41H U F 7,306,549 0.20Clearing Members 6,134,255 0.17Foreign Bodies-DR 2,359,415 0.06Foreign Nationals 100 0.00
(c) American Depository Receipts 248,424,696 6.68
Grand Total 3,717,196,639 100.00
Top Ten Shareholders (including holding of less than 1% of the Capital) as on March 31, 2018
Name of the Shareholder No. of shares held Shareholding (%)
TWINSTAR HOLDINGS LIMITED 1,280,084,749 34.44FINSIDER INTERNATIONAL COMPANY LIMITED 401,496,480 10.80CITIBANK N.A. NEW YORK, NYADR DEPARTMENT 248,573,117 6.69LIC OF INDIA HEALTH PLUS FUND 236,640,744 6.37PREM PRAKASH GOYAL 185,806,863 5.00HDFC TRUSTEE CO LTD A/C HDFC RETIREMENT SAVINGS FU 64,029,452 1.72WESTGLOBE LIMITED 44,343,139 1.19PTC CABLES PRIVATE LTD 42,730,200 1.15ADITYA BIRLA SUN LIFE TRUSTEE PRIVATE LIMITED A/C 40,366,128 1.09WELTER TRADING LIMITED 38,241,056 1.03
*In addition, Twin Star Holdings Limited holds 24,823,177 American Depository shares (ADS) representing 99,292,708 equity shares of Re. 1/- each wherein Citibank NA, New York is the depository for all ADS
i) Commodity Price Risk or Foreign Exchange Risk and Hedging Activities
Fluctuation in commodity prices (including oil) Impact: Prices and demand for the Group’s products are
expected to remain volatile / uncertain and strongly influenced by global economic conditions. Volatility in commodity prices and demand may adversely affect our earnings, cash flow and reserves.
Mitigation: Our Group has a well-diversified portfolio, which acts as a hedge against fluctuations in commodities and delivers
cash flows through the cycle. We consider exposure to commodity price fluctuations to be an integral part of our Group’s business and its usual policy is to sell its products at prevailing market prices, and not to enter into long-term price hedging arrangements. However, to minimise price risk for finished goods where price of raw material is also determined by same underlying base metal prices (e.g. purchase of alumina, copper concentrate for manufacturing and selling copper and aluminium products, respectively) we employ back-to-back hedging. In exceptional circumstances, we may enter into strategic hedging with prior approval of the Executive
Report on Corporate Governance continued
Shareholding as on March 31, 2018
1 - Promoter’s holding2 - Public Shareholding3 - American Depository Receipts
1
2
3
Vedanta Limited Integrated Report and Annual Accounts 2017-18 179Integrated R
eport
Managem
ent Review
Statutory R
eports
Financial Statements
Vedanta Limited Integrated Report and Annual Accounts 2017-18
Committee. The Group monitors the commodity markets closely to determine the effect of price fluctuations on earnings, capital expenditure and cash flows.
Currency exchange rate fluctuations Impact: Our assets, earnings and cash flows are influenced by a
variety of currencies due to the diversity of the countries in which we operate. Fluctuations in exchange rates of those currencies may have an impact on our financials. Although the majority of the Group’s revenue is tied to commodity prices that are typically priced by reference to the US dollar, a significant part of its expenses are incurred and paid in local currency. Moreover, some of the Group borrowings are denominated in US dollars, while a large percentage of cash and liquid investments are held in other currencies, mainly in the Indian rupee. Any material fluctuations of these currencies against the US dollar could result in lower profitability or in higher cash outflows towards debt obligations.
Mitigation: We do not speculate in forex. We have developed robust controls in forex management to monitor, measure and hedge currency risk liabilities. The Finance Standing Committee (FSC), reviews the forex-related matters periodically and suggests necessary courses of action as may be needed by businesses from time to time, and within the overall framework of the forex policy.
Exposures on foreign currency loans are managed through the Group wide hedging policy, which is reviewed periodically to ensure that the results from fluctuating currency exchange rates are appropriately managed. The Group strives to achieve asset liability offset of foreign currency exposures and only the net position is hedged. The Group uses forward exchange contracts, currency swaps and other derivatives to hedge the effects of movements in exchange rates on foreign currency denominated assets and liabilities. The sources of foreign exchange risk are outstanding amounts payable for imported raw materials, capital goods and other supplies as well as financing transactions and loans denominated in foreign currencies. The Group is also exposed to foreign exchange risk on its net investment in foreign operations. Most of these transactions are denominated in US dollars. Short-term net exposures are hedged progressively based on their maturity. A more conservative approach has been adopted for project expenditures to avoid budget overruns, where cost of the project is calculated taking into account the hedge cost. However all new long-term borrowing exposures are being hedged. The hedge mechanisms are reviewed periodically to ensure that the risk from fluctuating currency exchange rates is appropriately managed.
j) Dematerialisation of Shares qnd Liquidity The Company’s shares are compulsorily traded in dematerialised
form on the stock exchanges. As on March 31, 2018, over 99% shares of the Company were held in dematerialised form.
The number of shares held in dematerialised form and physical mode as on March 31, 2018 is detailed below:
Form/Mode No. of Shares In Percentage
DematerialisedForm:NSDL 3,325,197,879 89.45%CDSL 376,378,029 10.12%Physical Mode 15,620,731 0.42%
Total 3,717,196,639 100%
Note: 1. 308232 equity shares are pending for allotment and listing hence, are kept under
abeyance category since they are under dispute. 2. The Company has allotted 2400 equity shares of Re.1/- each on March 26, 2018 in
physical mode from the abeyance category. The application for listing of these shares with BSE Limited and The National Stock Exchange of India Limited has been filed by the Company on April 10, 2018 and the approval is awaited.
The equity shares of the Company are freely tradable in the market and are among the most liquid and actively traded shares in the stock exchanges.
k) Outstanding GDRS/ADRS/Warrants/Options In June 2007 and July 2009, Company issued 150,000,000
and 131,906,011 ADS, which are listed and traded on the New York Stock Exchange (NYSE). Pursuant to the Scheme of Amalgamation and Arrangement, ADS were listed with NYSE of which 62,106,174 representing ADS were outstanding as on March 31, 2018. As of the year end, there were nine (9) registered holders of the ADS. Citibank N.A., New York acts as the Depository for the ADS / ADR issued by the Company.
l) Unclaimed Shares Pursuant to the SEBI Circular and Regulation 39 of the Listing
Regulations regarding the procedure to be adopted for unclaimed shares issued in physical form in public issue or otherwise the Company has a separate demat account in the title of ‘Vedanta Limited – Unclaimed Suspense Account with M/s Karvy Stock Broking Limited.
DescriptionNo. of
shareholdersNo. of Equity shares
of Re. 1 each
Aggregate number of shareholders and the outstanding shares in the suspense account lying at the beginning of the year;
1,042 13,54,845
Number shares of Sesa Goa Limited transferred to the unclaimed suspense account during the year;
3,389 28,21,712
Number of shareholders who approached issuer for transfer of shares from suspense account during the year;
(48) 91,659
Number of shareholders to whom shares were transferred from suspense account during the year;
0 0
Number of shares transferred to IEPF account pursuant to Investor Education and Protection Fund Authority (Accounting, Audit, Transfer and Refund) Rules, 2016 read with Amendment Rules, 2017
(410) 688,680
Aggregate number of shareholders and the outstanding shares in the suspense account lying at the end of the year. The voting rights on these shares shall remain frozen till the rightful owner of such shares claims the shares. 3,973 3,396,218
180 Vedanta Limited Integrated Report and Annual Accounts 2017-18
m) Listing of Debt Securities The following Secured Redeemable Non-Convertible Debentures (NCDs) are listed with the BSE Limited and ISIN number with
National Securities Depositories Limited:
S. No ISIN Number Issuance date Maturity date Coupon ratePayment frequency
Embedded opt on if any
No. of NCDs (face value of Rs.
10 lakh each)Amount
(in Crores)
1 INE268A07145* 5-Apr-13 5-Apr-23 9.10% Annually Call/Put option date: 05 April 2018
25000 2500
2 INE268A07152 4-Jul-13 4-Jul-23 9.17% Annually Call/Put option date: 04 July 2018
7500 750
3 INE268A07160 5-Jul-13 5-Jul-23 9.17% Annually Call/Put option date: 05 July 2018
4500 450
4 INE205A07030 17-Aug-15 17-Aug-20 9.45% Annually NA 20000 2000
5 INE205A07048 30-Sep-16 20-Apr-20 8.70% Interest compounded annually and payable at maturity
NA 6000 600
6 INE205A07055 30-Sep-16 27-Sep-19 8.65% Interest compounded annually and payable at maturity
NA 1500 150
7 INE205A07063 7-Oct-16 15-Apr-21 8.75% Interest compounded annually and payable at maturity
NA 2500 250
8 INE205A07071 7-Oct-16 15-Sep-21 8.75% Interest compounded annually and payable at maturity
NA 2500 250
9 INE205A07089 28-Oct-16 28-Oct-19 8.25% Annually NA 3000 300
10 INE205A07097 22-Nov-16 22- Apr-20 7.95% Annually Call/Put option date: 22 Nov 2019
3000 300
11 INE205A07105 30-Nov-16 29-Nov-19 7.50% Annually NA 2000 200
12 INE205A07113 31-May-17 31-May-19 7.60% Annually NA 3500 350
13 INE205A07121 20-Dec-17 4-Dec-20 7.80% Annually NA 5000 500
*The Company exercised the call option and redeemed the debentures (ISIN no. INE268A07145) on April 5, 2018 as per Information Memorandum
Debenture Trustees: Axis Trustee Services Limited 2nd Floor, Wadia International Centre, Pandurang Budhkar Marg, Worli, Mumbai – 400 025
n) Plant Locations
Division Location
Copper Anodes (Smelter), Refinery, Continuous Cast Copper Rods
• SIPCOT Industrial Complex, Madurai By-pass Road, T.V. Puram PO, Tuticorin – 628 002 Tamil Nadu, India.
Copper Cathodes (Refinery) and Continuous Cast Copper Rods / Wire
• 1/1/2 Chinchpada, Silvassa – 396 230 Union Territory of Dadra and Nagar Haveli, India
Continuous Cast Copper Rods • 209-B, Piparia Industrial Estate, Piparia, Silvassa – 396 230, Union Territory of Dadra and Nagar Haveli, India
Iron Ore – Mining • Megalahally Office Complex, Megalahally Village, Hireguntanur, Hobli, Chitradurga Taluk and district, Karnataka, India*
Pig Iron Division 1 • Sy NO 39,41,36/1 (p) 37 (P), 42/1 (p) 43/1 (p) Amona, P.O. Marcel, Bicholim, Goa - 403107, India
Metallurgical Coke (Met Coke) • 207, Navelim, Sankhalim, Bicholim Goa - 403505, India
PIG Iron Division 2 • SY No 177 N 120 (P) Navelim P.O. Sanquelim Bicholim Goa 403505
Aluminium Smelters • PMO Office, Bhurkahamuda, PO-Sripura, Dist – Jharsuguda, Odisha – 768 202, India
Report on Corporate Governance continued
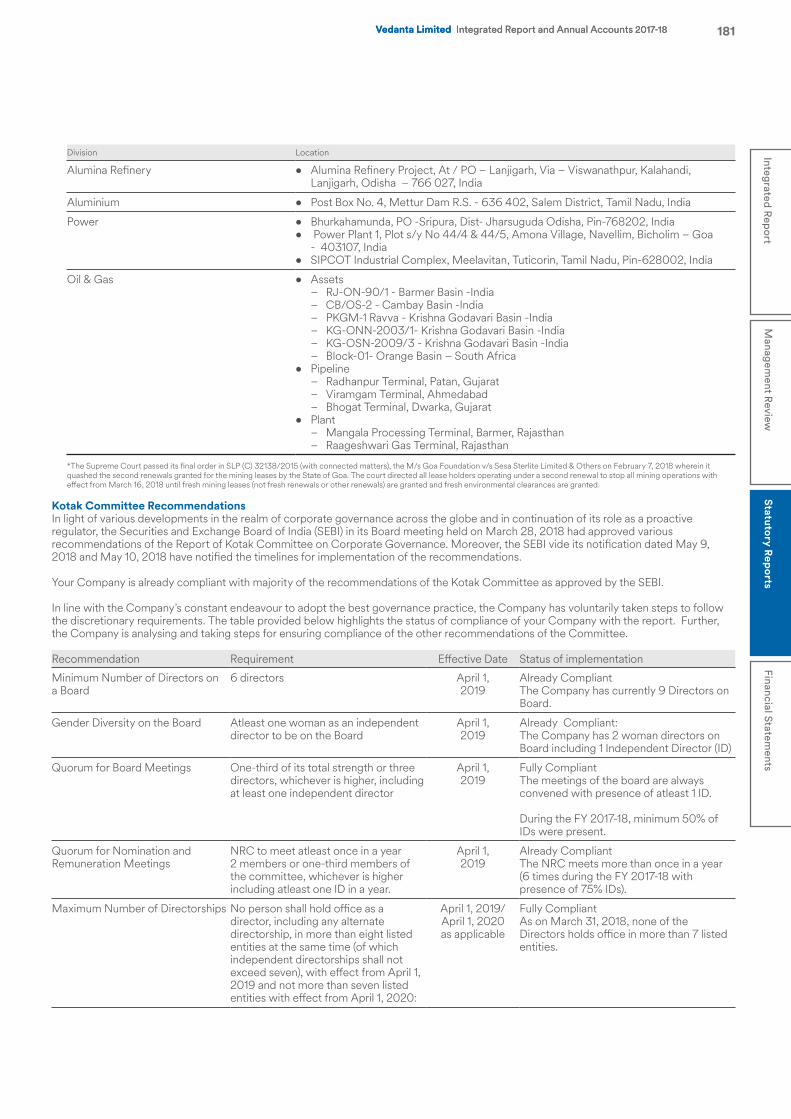
Vedanta Limited Integrated Report and Annual Accounts 2017-18 181Integrated R
eport
Managem
ent Review
Statutory R
eports
Financial Statements
Vedanta Limited Integrated Report and Annual Accounts 2017-18
Division Location
Alumina Refinery • Alumina Refinery Project, At / PO – Lanjigarh, Via – Viswanathpur, Kalahandi, Lanjigarh, Odisha – 766 027, India
Aluminium • Post Box No. 4, Mettur Dam R.S. - 636 402, Salem District, Tamil Nadu, India
Power • Bhurkahamunda, PO -Sripura, Dist- Jharsuguda Odisha, Pin-768202, India• Power Plant 1, Plot s/y No 44/4 & 44/5, Amona Village, Navellim, Bicholim – Goa
- 403107, India• SIPCOT Industrial Complex, Meelavitan, Tuticorin, Tamil Nadu, Pin-628002, India
Oil & Gas • Assets – RJ-ON-90/1 - Barmer Basin -India – CB/OS-2 - Cambay Basin -India – PKGM-1 Ravva - Krishna Godavari Basin -India – KG-ONN-2003/1- Krishna Godavari Basin -India – KG-OSN-2009/3 - Krishna Godavari Basin -India – Block-01- Orange Basin – South Africa
• Pipeline – Radhanpur Terminal, Patan, Gujarat – Viramgam Terminal, Ahmedabad – Bhogat Terminal, Dwarka, Gujarat
• Plant – Mangala Processing Terminal, Barmer, Rajasthan – Raageshwari Gas Terminal, Rajasthan
*The Supreme Court passed its final order in SLP (C) 32138/2015 (with connected matters), the M/s Goa Foundation v/s Sesa Sterlite Limited & Others on February 7, 2018 wherein it quashed the second renewals granted for the mining leases by the State of Goa. The court directed all lease holders operating under a second renewal to stop all mining operations with effect from March 16, 2018 until fresh mining leases (not fresh renewals or other renewals) are granted and fresh environmental clearances are granted.
Kotak Committee RecommendationsIn light of various developments in the realm of corporate governance across the globe and in continuation of its role as a proactive regulator, the Securities and Exchange Board of India (SEBI) in its Board meeting held on March 28, 2018 had approved various recommendations of the Report of Kotak Committee on Corporate Governance. Moreover, the SEBI vide its notification dated May 9, 2018 and May 10, 2018 have notified the timelines for implementation of the recommendations.
Your Company is already compliant with majority of the recommendations of the Kotak Committee as approved by the SEBI.
In line with the Company’s constant endeavour to adopt the best governance practice, the Company has voluntarily taken steps to follow the discretionary requirements. The table provided below highlights the status of compliance of your Company with the report. Further, the Company is analysing and taking steps for ensuring compliance of the other recommendations of the Committee.
Recommendation Requirement Effective Date Status of implementation
Minimum Number of Directors on a Board
6 directors April 1, 2019
Already CompliantThe Company has currently 9 Directors on Board.
Gender Diversity on the Board Atleast one woman as an independent director to be on the Board
April 1, 2019
Already Compliant:The Company has 2 woman directors on Board including 1 Independent Director (ID)
Quorum for Board Meetings One-third of its total strength or three directors, whichever is higher, including at least one independent director
April 1, 2019
Fully CompliantThe meetings of the board are always convened with presence of atleast 1 ID.
During the FY 2017-18, minimum 50% of IDs were present.
Quorum for Nomination and Remuneration Meetings
NRC to meet atleast once in a year2 members or one-third members of the committee, whichever is higher including atleast one ID in a year.
April 1, 2019
Already Compliant The NRC meets more than once in a year (6 times during the FY 2017-18 with presence of 75% IDs).
Maximum Number of Directorships No person shall hold office as a director, including any alternate directorship, in more than eight listed entities at the same time (of which independent directorships shall not exceed seven), with effect from April 1, 2019 and not more than seven listed entities with effect from April 1, 2020:
April 1, 2019/ April 1, 2020 as applicable
Fully CompliantAs on March 31, 2018, none of the Directors holds office in more than 7 listed entities.
182 Vedanta Limited Integrated Report and Annual Accounts 2017-18
Other Disclosuresa) Framework for monitoring Subsidiary Companies As per the recommendation of the Kotak Committee on
Corporate Governance, the definition of the material subsidiary as per the provision of Regulation 16(1)(c) has been amended. As per the recommendation, “material subsidiary” means a subsidiary whose income or networth exceeds 10% of the consolidated income or networth of the listed entity.
In terms of clause (c) of sub-regulation (1) of Regulation 16 of the existing Listing Regulations ‘material subsidiary’ means a subsidiary, whose income or net worth exceeds twenty percent of the consolidated income or net worth respectively, of the listed entity and its subsidiaries in the immediately preceding accounting year.
In compliance with the said regulation, the Company has a policy on Determining Material Subsidiary, which has been approved by the Board and the same has been displayed on the Company’s website at http://www.vedantalimited.com.
As on March 31, 2018, there is no material unlisted subsidiary of the Company in terms of the provisions of Regulation 24(1) of the Listing Regulations.
The management of subsidiary companies is carried out by their separate Board of Directors who are empowered to exercise all the duties and rights for efficient monitoring and management of the companies. The Company oversees and monitors the performance of subsidiary companies by following means: i. The Audit Committee reviews the financial statements and,
in particular, the investments made by the subsidiary companies;
ii. The minutes of the Board meeting of the subsidiary companies is placed before the Board of the Company for their review;
iii. A statement of all significant transactions of the subsidiary companies is placed before the Board of Directors of the Company for its review.
b) Materially Significant Related Party Transactions Pursuant to Section 188 of the Companies Act, 2013 and
Regulation 23 of the Listing Regulations, all the Related Party Transactions were at arm’s length price and the same were duly approved by the Audit Committee.
Explanation to sub-regulation (1) of Regulation 23 of Listing Regulations provides that “A transaction with a related party shall be considered material if the transaction(s) to be entered into individually or taken together with previous transactions during a financial year, exceeds ten percent of the annual
Recommendation Requirement Effective Date Status of implementation
Eligibility Criteria for Independent Directors
IDs to provide confirmation that:• They are or were not a promoter of
the listed entity or its holding, subsidiary or associate company or
• member of the promoter group of the listed entity;
• who is not a non-independent director of another company on the board of which any non-independent director of the listed entity is an independent director.
October 1, 2018
Fully CompliantThe Company has already taken confirmations from the IDs for FY 18-19 in this regard.
Alternate Directors for Independent Directors
No person to be appointed or continue as an alternate director for an Independent Director.
October 1, 2018
Fully Compliant
Role of Audit Committee Role of the Audit Committee to include reviewing the utilization of loans and/ or advances from/investment by the holding company in the subsidiary exceeding rupees 100 crore or 10% of the asset size of the subsidiary, whichever is lower.
April 1, 2019
Fully CompliantThe details are placed before the Board
Role of Risk Management Committee (RMC)
RMC to meet atleast once in a year.
The role of RMC shall specifically cover cyber security.
April 1, 2019
Already Compliant During the FY 2017-18, RMC met 3 times. Further, the role of RMC already includes cyber security.
Material Transaction by unlisted subsidiary companies
The unlisted subsidiary to bring to the board of the listed entity a statement of all the significant transactions entered into by the unlisted subsidiary.
April 1, 2019
Already CompliantThe minutes of meetings of Audit Committee and Board of subsidiary companies are placed at the Board and Audit committee of the Company.
Timeline for Annual General Meetings of Listed Entities
AGM to be conducted within a period of five months from the date of closing of the financial year with effect from the financial year beginning April 1, 2018.
April 1, 2019
Already Compliant:AGM is conducted in the month of July every year.
Disclosure on website Separate section on website for investors and to provide all information mandated under Regulation 46 of the Listing Regulations.
April 1, 2019
Already Compliant
Report on Corporate Governance continued
Vedanta Limited Integrated Report and Annual Accounts 2017-18 183Integrated R
eport
Managem
ent Review
Statutory R
eports
Financial Statements
Vedanta Limited Integrated Report and Annual Accounts 2017-18
consolidated turnover of the listed entity as per the last audited financial statements of the listed entity.”
Further, as per the recommendations of the Kotak Committee, a transaction involving payments made to a related party with respect to brand usage or royalty shall be considered material if the transaction(s) to be entered into individually or taken together with previous transactions during a financial year, exceeds two percent of the annual consolidated turnover of the listed entity as per the last audited financial statements of the listed entity.
Proper disclosures by the members of the Board of Directors
and KMPs relating to material financial and commercial transactions whether held directly/ indirectly or on behalf of third parties were given to the Board.
In compliance with the said regulation, the Company has a policy on Related Party Transactions, which has been approved by the Board and the same has been displayed on the Company’s website at http://www.vedantalimited.com.
A comprehensive list of related party transactions as required under IndAS 24 as prescribed in Companies (Indian Accounting Standard) Rules, 2015 and Companies (Indian Accounting Standard) Amendment Rules, 2016, forms part of Notes to the Financial Statements in the Annual Report.
c) Non-Compliance by the Company, Penalties, Strictures imposed by Stock Exchange or SEBI or any Statutory Authority on any matter related to Capital Markets during the last three years
There has been no non-compliance by the Company or penalty, strictures imposed by stock exchange or SEBI or any statutory authority on any matter related to capital markets during the last three years.
d) Vigil Mechanism/Whistle Blower Policy Your Company is committed to highest standards of ethical,
moral and legal business conduct. The Company has in place a Whistle Blower Policy, as part of vigil mechanism which provides appropriate avenues to the Directors and employees to bring to the attention of the management instances of unethical behaviour, actual or suspected incidents of fraud or violation of the Company’s Code of Conduct that could adversely impact the Company’s operations, business performance and / or reputation.
The Audit Committee has laid down certain procedures governing the receipt, retention and treatment of complaints regarding the Company’s accounting, internal accounting controls or auditing matters, and protecting the confidential, anonymous reporting by Director(s) or employee(s) or any other person regarding questionable accounting or auditing matters.
The Company also has a designated email id [email protected] for reporting complaints. Further, the complaints can also be lodged on the web-based portal www.vedanta.ethicspoint.com.
The Whistle Blower Policy forms part of the Code of Business Conduct and Ethics, and the same has been displayed on the Company’s website at http://www.vedantalimited.com.
During the year, the concerns reported under this mechanism have been scrutinised and appropriate actions were undertaken. It is also affirmed that no personnel has been denied access to the Audit Committee.
Discretionary Requirements Status of implementation of discretionary requirements as mentioned in Part E of Schedule II under Listing Regulations is as follows:
Requirement Status
The Board A non-executive chairperson may be entitled to maintain a chairperson’s office at the listed entity’s expense and also allowed reimbursement of expenses incurred in performance of his duties.
The Board of the Company is chaired by an Executive Director who maintains the Chairman’s office at the Company’s expense.
Shareholder Rights A half-yearly declaration of financial performance including summary of the significant events in last six-months, may be sent to each household of shareholders.
Quarterly financial results were sent to those shareholders whose email id was registered with the Company.
Modified opinion(s) in audit report To move towards a regime of financial statements with unmodified audit opinion.
There was no qualification by the auditors on the financial statements of the Company.
Separate posts of chairperson and chief executive officer
Appoint separate persons to the post of chairperson and managing director or chief executive officer.
The office of Chairman and Chief Executive Officer of the Company are held by different individuals.
Reporting of internal auditor Internal auditor may report directly to the audit committee.
The same is reported by briefing the Audit Committee through discussion and presentation of the observations, review, comments and recommendations, amongst others in the Internal Audit presentation by the Company’s Internal Auditor.
184 Vedanta Limited Integrated Report and Annual Accounts 2017-18
Disclosures of the compliance with Corporate Governance requirements specified in Regulation 17 to 27 and Clauses (b) to (i) of Sub-Regulation (2) of Regulation 46 of Listing Regulations
S. No. Particulars Regulation
Compliance Status
(Yes/No/NA) Complied with the following
1 Board of Directors 17 Yes • Composition {17(1)}• Frequency of Meetings {17(2)}• Review of Compliance Report {17(3)}• Plans for orderly succession for appointments {17(4)}• Code of Conduct {17(5)}• Fees / compensation to Non-Executive Directors {17(6)}• Minimum information to be placed before the Board {17(7)}• Compliance Certificate {17(8)}• Risk assessment and management {17(9)}• Performance evaluation of Independent Directors {17(10)}
2 Audit Committee 18 Yes • Composition {18(1)}• Meetings {18(2)(a) and (b)}• Powers of the Committee {18(2)(c)}• Role of the Committee and review of information by the Committee {18(3)}
3 Nomination and Remuneration Committee
19 Yes • Composition {19(1)}• Chairperson {19(2) and (3)}• Role of the Committee {19(4)}
4 Stakeholder Relationship Committee
20 Yes • Composition {20(1)}• Chairperson {20(2)}• Other Members {20(3)}• Role of the Committee {20(4)}
5 Risk Management Committee
21 Yes • Composition {21(1) and (2)}• Chairperson {21(3)}• Role of the Committee {21(4)}
6 Vigil Mechanism 22 Yes • Formulation of Vigil Mechanism for Directors and employees {22(1)}• Director access to Chairperson of Audit Committee {22(2)}
7 Related Party Transactions
23 Yes • Policy on Materiality of Related Party Transactions and dealing with Related Party Transactions {23(1)}
• Approval including omnibus approval of Audit Committee {23(2) and (3)}• Review of Related Party Transactions• There were no material Related Party Transactions
8 Subsidiaries of the Entity
24 Yes • There was no material subsidiary of the Company and as a result the other compliance in respect of material subsidiary were not applicable {24(1)}
• Review of financial statements of unlisted subsidiary by the Audit Committee {24(2)}
• Minutes of Meetings of Board of unlisted subsidiary placed at meeting of the listed entity {24(3)}
• Significant transactions and arrangements of unlisted subsidiary {24(4)}
9 Obligations with respect to Independent Directors
25 Yes • Maximum directorships and tenure {25(1) and (2)}• Meetings of Independent Directors {25(3) and (4)}• Replacement {25(6)}• Familiarisation of Independent Directors {25(7)}
10 Obligations with respect to Directors and Senior Management
26 Yes • Memberships / Chairmanships in Committees {26(1) and (2)}• Affirmation on compliance of Code of Conduct by Directors and Senior
Management {26(3)}• Disclosure of shareholding by Non-Executive Directors {26(4)}• Disclosures by Senior Management about potential conflicts of interest {26(5)}
11 Other Corporate Governance Requirements
27 Yes • Compliance with discretionary requirements {27(1)}• Filing of quarterly compliance report on Corporate Governance {27(2)}
12 Website 46 Yes • Maintaining Functional Website {46(1)}• Details disseminated on website {46(2)}• Contents on website and updating the website {46(3)}
Report on Corporate Governance continued
Vedanta Limited Integrated Report and Annual Accounts 2017-18 185Integrated R
eport
Managem
ent Review
Statutory R
eports
Financial Statements
Vedanta Limited Integrated Report and Annual Accounts 2017-18
Good Governance Policies of the CompanyThe company constantly strives to conduct its business and strengthen its relationships in a dignified, distinctive and responsible manner. The Company has adopted several policies and guidelines for ethical and transparent conduct of its business and operations. These include:• Insider Trading Prohibition Policy;• Policy on Prevention of Sexual Harassment at Work Place;• Dividend Distribution Policy;• Policy for determination material events/UPSI and archival; • Nomination & Remuneration Policy;• Related Party Transaction Policy;• Determing Material Subsidiary Policy;
• Corporate Social Responsibility Policy;• Biodiversity Policy;• Energy and Carbon Policy;• HIV AIDS Policy;• Health, Safety & Environment Policy;• Human Rights Policy;• Supplier and Contractor Management Policy;• Water Management Policy.
The policies are also available on the website of the Company at http://www.vedantalimited.com.
o) Address for Correspondence
Company’s Registered Office AddressVedanta Limited 1st Floor, ‘C’ Wing, Unit 103, Corporate Avenue, Atul Projects, Chakala, Andheri (East), Mumbai – 400 093, Maharashtra, India.T +91 22 66434500 /Fax +91 22 66434530Email id : [email protected]: www.vedantalimited.comCIN : L13209MH1965PLC291394
Registrar and Transfer AgentKarvy Computershare Private LimitedKarvy Selenium Tower B,Plot 31-32, Gachibowli Financial District,NanakramgudaHyderabad – 500 032Tel: +91 40 6716 2222Fax: +91 40 2300 1153Email: [email protected]
Compliance OfficerMs. Bhumika SoodCompany Secretary & Compliance OfficerTel : +91 124 – 4593 000Email : [email protected]
Investor Relations Ms. Rashmi MohantyGroup Head Treasury & Director – Investor Relations Phone : +91 124 – 4593 000Email : [email protected]
Corporate Communications Mr. Arun AroraHead, Group CommunicationsTel : +91 124 – 4593 000Email : [email protected]
Retail Shareholders Ms. Bhumika SoodCompany Secretary & Compliance OfficerTel : +91 124 – 4593 000Email : [email protected]
Annexure I
Declaration by Chief Executive Officer on Code of Business Conduct and Ethics of the Company
As Interim Chief Executive Officer of Vedanta Limited and as required under the provisions of Securities and Exchange Board of India (Listing Obligations and Disclosure Requirements) Regulations, 2015, I, Kuldip Kumar Kaura, hereby declare that all members of the Board and senior management personnel have affirmed compliance with the Code of Business Conduct and Ethics of the Company for FY 2017-18.
For Vedanta LimitedKuldip Kumar Kaura
Place: Mumbai Interim Chief Executive OfficerDate May 03, 2018
186 Vedanta Limited Integrated Report and Annual Accounts 2017-18
Annexure II
Certification
We, Kuldip Kumar Kaura, Interim Chief Executive Officer and GR Arun Kumar, Whole-Time Director & Chief Financial Officer, certify that:
A. We have reviewed financial statements and the cash flow statement for the year and that to the best of our knowledge and belief:(1) These statements do not contain any materially untrue statement or omit any material fact or contain statements that might be
misleading;(2) These statements together present a true and fair view of the Company’s affairs and are in compliance with existing accounting
standards, applicable laws and regulations.
B. There are, to the best of our knowledge and belief, no transactions entered into by the Company during the year, which are fraudulent, illegal or violative of the Company’s code of conduct.
C. We accept responsibility for establishing and maintaining internal controls for financial reporting. We have evaluated the effectiveness of internal control systems of the Company pertaining to financial reporting, and we have not noticed any deficiency in the design of operation of such internal controls, or of which we are aware that needs to be rectified, or informed to the auditors and the Audit Committee.
D. During the year it was disclosed to the Auditors and the Audit Committee that:(1) There were no significant changes in internal control over financial reporting;(2) No significant changes in accounting policies were made during the year that require disclosure in the notes to the financial
statements; and(3) No instances of significant fraud and the involvement therein, if any, of the management or an employee having a significant role in
the Company’s internal control system over financial reporting, has come to our notice.
Kuldip Kumar Kaura GR Arun KumarInterim Chief Executive Officer Whole-Time Director & ChiefPAN: AFVPK8712R Financial Officer
DIN: 01874769Place: MumbaiDate: May 03, 2018
Report on Corporate Governance continued
Vedanta Limited Integrated Report and Annual Accounts 2017-18 187Integrated R
eport
Managem
ent Review
Statutory R
eports
Financial Statements
Vedanta Limited Integrated Report and Annual Accounts 2017-18
Auditor’s Report on compliance with the conditions of Corporate Governance as per provisions of Chapter IV of Securities and Exchange Board of India (Listing Obligations and Disclosure Requirements) Regulations, 2015
The MembersVedanta Limited1st Floor, ‘C’ WingUnit 103, Corporate Avenue, Atul ProjectsChakala, Andheri (E),Mumbai
1. The accompanying Corporate Governance Report prepared by Vedanta Limited (hereinafter the “Company”), contains details as required by the provisions of Chapter IV of Securities and Exchange Board of India (Listing Obligations and Disclosure Requirements) Regulations, 2015, as amended (“the Listing Regulations”) (‘Applicable criteria’) with respect to Corporate Governance for the year ended March 31, 2018.
Management’s Responsibility2. The preparation of the Corporate Governance Report is the responsibility of the Management of the Company including the
preparation and maintenance of all relevant supporting records and documents. This responsibility also includes the design, implementation and maintenance of internal control relevant to the preparation and presentation of the Corporate Governance Report.
3. The Management along with the Board of Directors are also responsible for ensuring that the Company complies with the conditions of Corporate Governance as stipulated in the Listing Regulations, issued by the Securities and Exchange Board of India.
Auditors’ Responsibility4. Pursuant to the requirements of the Listing Regulations, our responsibility is to express a reasonable assurance in the form of an opinion
whether the Company has complied with the specific requirements of the Listing Regulations referred to in paragraph 1 above.
5. We conducted our examination of the Corporate Governance Report in accordance with the Guidance Note on Reports or Certificates for Special Purposes and the Guidance Note on Certification of Corporate Governance, both issued by the Institute of Chartered Accountants of India (“ICAI”). The Guidance Note on Reports or Certificates for Special Purposes requires that we comply with the ethical requirements of the Code of Ethics issued by the Institute of Chartered Accountants of India.
6. We have complied with the relevant applicable requirements of the Standard on Quality Control (SQC) 1, Quality Control for Firms that perform Audits and Reviews of Historical Financial Information, and other Assurance and Related Services Engagements.
7. The procedures selected depend on the auditor’s judgement, including the assessment of the risks associated in compliance of the Corporate Governance Report with the applicable criteria. Summary of key procedures performed include:
i. Reading and understanding of the information prepared by the Company and included in its Corporate Governance Report;
ii. Obtained and verified that the composition of the Board of Directors w.r.t executive and non-executive directors has been met throughout the reporting period;
iii. Obtained and read the Directors register as on March 31, 2018 and verified that at-least one women director was on the Board during the year;
iv. Obtained and read the minutes of the following committee meetings held from April 1, 2017 to March 31, 2018: (a) Board of Directors meeting; (b) Audit committee; (c) Nomination and remuneration committee; (d) Stakeholders Relationship Committee; and (e) Risk management committee
v. Obtained necessary representations and declarations from directors of the Company including the independent directors ; and
vi. Performed necessary inquiries with the management and also obtained necessary specific representations from management.
The above-mentioned procedures include examining evidence supporting the particulars in the Corporate Governance Report on a test basis. Further, our scope of work under this report did not involve us performing audit tests for the purposes of expressing an opinion on the fairness or accuracy of any of the financial information or the financial statements of the Company taken as a whole.
188 Vedanta Limited Integrated Report and Annual Accounts 2017-18
Opinion8. Based on the procedures performed by us as referred in paragraph 7 above, and according to the information and explanations given to
us, we are of the opinion that the Company has complied with the conditions of Corporate Governance as stipulated in the Listing Regulations, as applicable as at March 31, 2018, referred to in paragraph 1 above.
Other matters and Restriction on Use9. This report is neither an assurance as to the future viability of the Company nor the efficiency or effectiveness with which the
management has conducted the affairs of the Company.
10. This report is addressed to and provided to the members of the Company solely for the purpose of enabling it to comply with its obligations under the Listing Regulations with reference to Corporate Governance Report accompanied with by a report thereon from the statutory auditors and should not be used by any other person or for any other purpose. Accordingly, we do not accept or assume any liability or any duty of care or for any other purpose or to any other party to whom it is shown or into whose hands it may come without our prior consent in writing. We have no responsibility to update this report for events and circumstances occurring after the date of this report.
For S.R. Batliboi & Co. LLPChartered AccountantsICAI Firm Registration Number: 301003E/E300005
per Raj AgrawalPartnerMembership Number: 82028
Place: MumbaiDate: May 03, 2018
Report on Corporate Governance continued

189Integrated R
eport
Managem
ent Review
Statutory R
eports
Financial Statements
Vedanta Limited Integrated Report and Annual Accounts 2017-18
StandaloneFinancial Statements
190 Vedanta Limited Integrated Report and Annual Accounts 2017-18
Independent Auditor’s Report
To the Members of Vedanta Limited Report on the Standalone Ind AS Financial StatementsWe have audited the accompanying standalone Ind AS financial statements of Vedanta Limited (“the Company”), which comprise the Balance Sheet as at March 31, 2018, the Statement of Profit and Loss, including the statement of Other Comprehensive Income, the Cash Flow Statement and the Statement of Changes in Equity for the year then ended, and a summary of significant accounting policies and other explanatory information.
Management’s Responsibility for the Standalone Ind AS Financial StatementsThe Company’s Board of Directors is responsible for the matters stated in Section 134(5) of the Companies Act, 2013 (“the Act”) with respect to the preparation of these standalone Ind AS financial statements that give a true and fair view of the financial position, financial performance including other comprehensive income, cash flows and changes in equity of the Company in accordance with accounting principles generally accepted in India, including the Indian Accounting Standards (Ind AS) specified under section 133 of the Act., read with the Companies (Indian Accounting Standards) Rules, 2015, as amended. This responsibility also includes maintenance of adequate accounting records in accordance with the provisions of the Act for safeguarding of the assets of the Company and for preventing and detecting frauds and other irregularities; selection and application of appropriate accounting policies; making judgments and estimates that are reasonable and prudent; and the design, implementation and maintenance of adequate internal financial control that were operating effectively for ensuring the accuracy and completeness of the accounting records, relevant to the preparation and presentation of the Ind AS financial statements that give a true and fair view and are free from material misstatement(s), whether due to fraud or error.
Auditor’s ResponsibilityOur responsibility is to express an opinion on these standalone Ind AS financial statements based on our audit. We have taken into account the provisions of the Act, the accounting and auditing standards and matters which are required to be included in the audit report under the provisions of the Act and the Rules made thereunder. We conducted our audit of the standalone Ind AS financial statements in accordance with the Standards on Auditing, issued by the Institute of Chartered Accountants of India, as specified under Section 143(10) of the Act. Those Standards require that we comply with ethical requirements and plan and perform the audit to obtain reasonable assurance about whether the financial statements are free from material misstatement.
An audit involves performing procedures to obtain audit evidence about the amounts and disclosures in the financial statements. The procedures selected depend on the auditor’s judgment, including the assessment of the risks of material misstatement of the standalone Ind AS financial statements, whether due to fraud or error. In making those risk assessments, the auditor considers internal financial control relevant to the Company’s preparation of the standalone Ind AS financial statements that give a true and fair view in order to design audit procedures that are appropriate in the circumstances. An audit also includes evaluating the appropriateness of accounting policies used and the reasonableness of the accounting estimates made by the Company’s Directors, as well as evaluating the overall presentation of the standalone Ind AS financial statements. We believe that the audit evidence we have obtained is sufficient and appropriate to provide a basis for our audit opinion on the standalone Ind AS financial statements.
OpinionIn our opinion and to the best of our information and according to the explanations given to us, the standalone Ind AS financial statements give the information required by the Act in the manner so required and give a true and fair view in conformity with the
accounting principles generally accepted in India, of the state of affairs of the Company as at March 31, 2018, its profits including other comprehensive income, its cash flows and the changes in equity for the year ended on that date.
Report on Other Legal and Regulatory Requirements1. As required by the Companies (Auditor’s report) Order, 2016
(“the Order”) issued by the Central Government of India in terms of sub-section (11) of section 143 of the Act, we give in the Annexure 1 a statement on the matters specified in paragraphs 3 and 4 of the Order.
2. As required by section 143 (3) of the Act, we report that:
(a) We have sought and obtained all the information and explanations which to the best of our knowledge and belief were necessary for the purpose of our audit;
(b) In our opinion, proper books of account as required by law have been kept by the Company so far as it appears from our examination of those books;
(c) The Balance Sheet, Statement of Profit and Loss including the Statement of Other Comprehensive Income, the Cash Flow Statement and Statement of Changes in Equity dealt with by this Report are in agreement with the books of account;
(d) In our opinion, the aforesaid standalone Ind AS financial statements comply with the Accounting Standards specified under section 133 of the Act, read with Companies (Indian Accounting Standards) Rules, 2015, as amended;
(e) On the basis of written representations received from the directors as on March 31, 2018, and taken on record by the Board of Directors, none of the directors is disqualified as on March 31, 2018, from being appointed as a director in terms of section 164 (2) of the Act;
(f) With respect to the adequacy of the internal financial controls over financial reporting of the Company and the operating effectiveness of such controls, refer to our separate Report in “Annexure 2” to this report;
(g) With respect to the other matters to be included in the Auditor’s Report in accordance with Rule 11 of the Companies (Audit and Auditors) Rules, 2014, in our opinion and to the best of our information and according to the explanations given to us:
i. The Company has disclosed the impact of pending litigations on its financial position in its standalone Ind AS financial statements – Refer Note 49 to the financial statements;
ii. The Company did not have any long-term contracts including derivative contracts for which there were any material foreseeable losses;
iii. There has been no delay in transferring amounts, required to be transferred, to the Investor Education and Protection Fund by the Company.
For S.R. Batliboi & Co. LLPChartered Accountants
ICAI Firm Registration Number: 301003E/E300005
per Raj AgrawalPlace: Gurugram PartnerDate: May 03, 2018 Membership Number: 82028
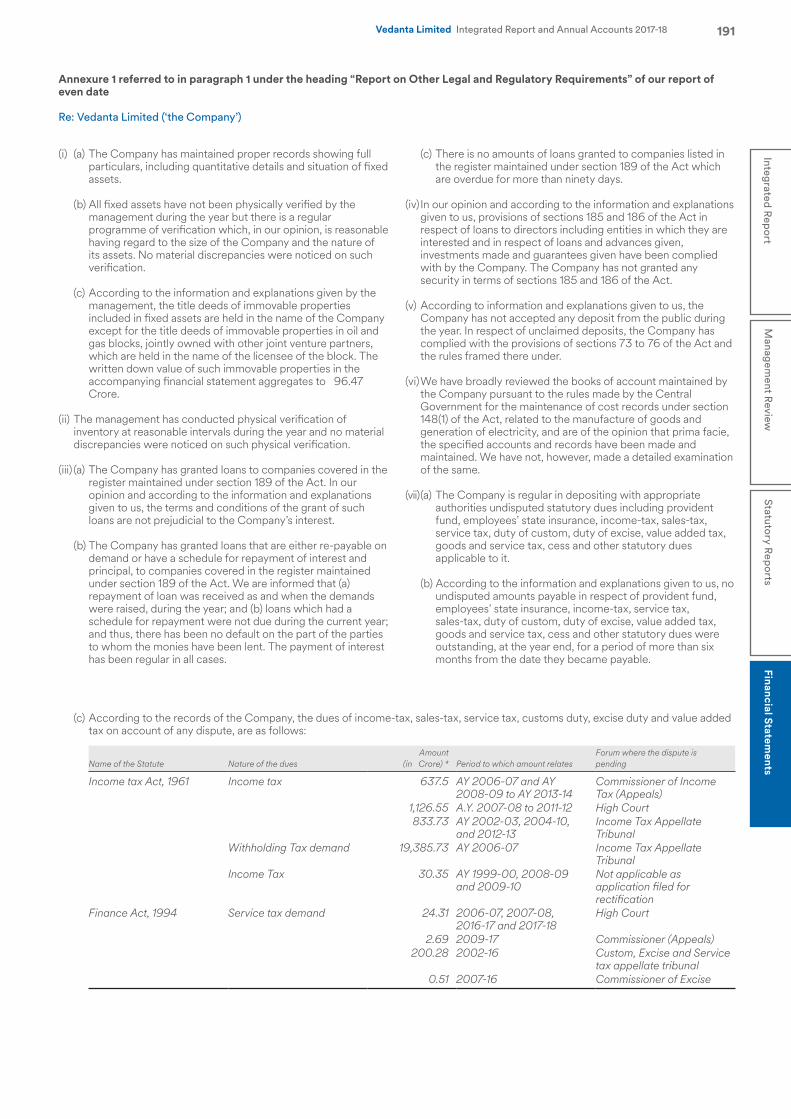
191Integrated R
eport
Managem
ent Review
Statutory R
eports
Financial Statements
Vedanta Limited Integrated Report and Annual Accounts 2017-18
(i) (a) The Company has maintained proper records showing full particulars, including quantitative details and situation of fixed assets.
(b) All fixed assets have not been physically verified by the management during the year but there is a regular programme of verification which, in our opinion, is reasonable having regard to the size of the Company and the nature of its assets. No material discrepancies were noticed on such verification.
(c) According to the information and explanations given by the management, the title deeds of immovable properties included in fixed assets are held in the name of the Company except for the title deeds of immovable properties in oil and gas blocks, jointly owned with other joint venture partners, which are held in the name of the licensee of the block. The written down value of such immovable properties in the accompanying financial statement aggregates to ₹ 96.47 Crore.
(ii) The management has conducted physical verification of inventory at reasonable intervals during the year and no material discrepancies were noticed on such physical verification.
(iii) (a) The Company has granted loans to companies covered in the register maintained under section 189 of the Act. In our opinion and according to the information and explanations given to us, the terms and conditions of the grant of such loans are not prejudicial to the Company’s interest.
(b) The Company has granted loans that are either re-payable on demand or have a schedule for repayment of interest and principal, to companies covered in the register maintained under section 189 of the Act. We are informed that (a) repayment of loan was received as and when the demands were raised, during the year; and (b) loans which had a schedule for repayment were not due during the current year; and thus, there has been no default on the part of the parties to whom the monies have been lent. The payment of interest has been regular in all cases.
(c) There is no amounts of loans granted to companies listed in the register maintained under section 189 of the Act which are overdue for more than ninety days.
(iv) In our opinion and according to the information and explanations given to us, provisions of sections 185 and 186 of the Act in respect of loans to directors including entities in which they are interested and in respect of loans and advances given, investments made and guarantees given have been complied with by the Company. The Company has not granted any security in terms of sections 185 and 186 of the Act.
(v) According to information and explanations given to us, the Company has not accepted any deposit from the public during the year. In respect of unclaimed deposits, the Company has complied with the provisions of sections 73 to 76 of the Act and the rules framed there under.
(vi) We have broadly reviewed the books of account maintained by the Company pursuant to the rules made by the Central Government for the maintenance of cost records under section 148(1) of the Act, related to the manufacture of goods and generation of electricity, and are of the opinion that prima facie, the specified accounts and records have been made and maintained. We have not, however, made a detailed examination of the same.
(vii) (a) The Company is regular in depositing with appropriate authorities undisputed statutory dues including provident fund, employees’ state insurance, income-tax, sales-tax, service tax, duty of custom, duty of excise, value added tax, goods and service tax, cess and other statutory dues applicable to it.
(b) According to the information and explanations given to us, no undisputed amounts payable in respect of provident fund, employees’ state insurance, income-tax, service tax, sales-tax, duty of custom, duty of excise, value added tax, goods and service tax, cess and other statutory dues were outstanding, at the year end, for a period of more than six months from the date they became payable.
Annexure 1 referred to in paragraph 1 under the heading “Report on Other Legal and Regulatory Requirements” of our report of even date
Re: Vedanta Limited (‘the Company’)
(c) According to the records of the Company, the dues of income-tax, sales-tax, service tax, customs duty, excise duty and value added tax on account of any dispute, are as follows:
Name of the Statute Nature of the dues Amount
(in ₹ Crore) * Period to which amount relatesForum where the dispute is pending
Income tax Act, 1961 Income tax 637.5 AY 2006-07 and AY 2008-09 to AY 2013-14
Commissioner of Income Tax (Appeals)
1,126.55 A.Y. 2007-08 to 2011-12 High Court833.73 AY 2002-03, 2004-10,
and 2012-13Income Tax Appellate Tribunal
Withholding Tax demand 19,385.73 AY 2006-07 Income Tax Appellate Tribunal
Income Tax 30.35 AY 1999-00, 2008-09 and 2009-10
Not applicable as application filed for rectification
Finance Act, 1994 Service tax demand 24.31 2006-07, 2007-08, 2016-17 and 2017-18
High Court
2.69 2009-17 Commissioner (Appeals)200.28 2002-16 Custom, Excise and Service
tax appellate tribunal0.51 2007-16 Commissioner of Excise
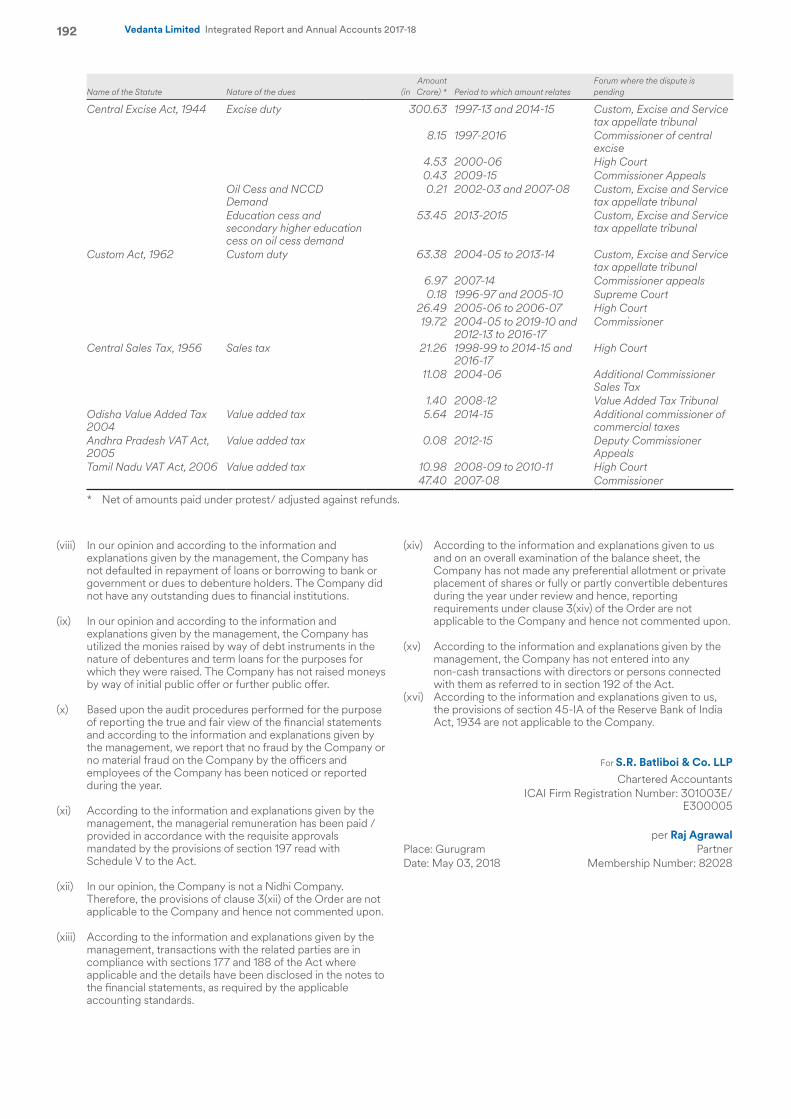
192 Vedanta Limited Integrated Report and Annual Accounts 2017-18
(viii) In our opinion and according to the information and explanations given by the management, the Company has not defaulted in repayment of loans or borrowing to bank or government or dues to debenture holders. The Company did not have any outstanding dues to financial institutions.
(ix) In our opinion and according to the information and explanations given by the management, the Company has utilized the monies raised by way of debt instruments in the nature of debentures and term loans for the purposes for which they were raised. The Company has not raised moneys by way of initial public offer or further public offer.
(x) Based upon the audit procedures performed for the purpose of reporting the true and fair view of the financial statements and according to the information and explanations given by the management, we report that no fraud by the Company or no material fraud on the Company by the officers and employees of the Company has been noticed or reported during the year.
(xi) According to the information and explanations given by the management, the managerial remuneration has been paid / provided in accordance with the requisite approvals mandated by the provisions of section 197 read with Schedule V to the Act.
(xii) In our opinion, the Company is not a Nidhi Company. Therefore, the provisions of clause 3(xii) of the Order are not applicable to the Company and hence not commented upon.
(xiii) According to the information and explanations given by the management, transactions with the related parties are in compliance with sections 177 and 188 of the Act where applicable and the details have been disclosed in the notes to the financial statements, as required by the applicable accounting standards.
(xiv) According to the information and explanations given to us and on an overall examination of the balance sheet, the Company has not made any preferential allotment or private placement of shares or fully or partly convertible debentures during the year under review and hence, reporting requirements under clause 3(xiv) of the Order are not applicable to the Company and hence not commented upon.
(xv) According to the information and explanations given by the management, the Company has not entered into any non-cash transactions with directors or persons connected with them as referred to in section 192 of the Act.
(xvi) According to the information and explanations given to us, the provisions of section 45-IA of the Reserve Bank of India Act, 1934 are not applicable to the Company.
For S.R. Batliboi & Co. LLPChartered Accountants
ICAI Firm Registration Number: 301003E/E300005
per Raj AgrawalPlace: Gurugram PartnerDate: May 03, 2018 Membership Number: 82028
Name of the Statute Nature of the dues Amount
(in ₹ Crore) * Period to which amount relatesForum where the dispute is pending
Central Excise Act, 1944 Excise duty 300.63 1997-13 and 2014-15 Custom, Excise and Service tax appellate tribunal
8.15 1997-2016 Commissioner of central excise
4.53 2000-06 High Court0.43 2009-15 Commissioner Appeals
Oil Cess and NCCD Demand
0.21 2002-03 and 2007-08 Custom, Excise and Service tax appellate tribunal
Education cess and secondary higher education cess on oil cess demand
53.45 2013-2015 Custom, Excise and Service tax appellate tribunal
Custom Act, 1962 Custom duty 63.38 2004-05 to 2013-14 Custom, Excise and Service tax appellate tribunal
6.97 2007-14 Commissioner appeals0.18 1996-97 and 2005-10 Supreme Court
26.49 2005-06 to 2006-07 High Court19.72 2004-05 to 2019-10 and
2012-13 to 2016-17Commissioner
Central Sales Tax, 1956 Sales tax 21.26 1998-99 to 2014-15 and 2016-17
High Court
11.08 2004-06 Additional Commissioner Sales Tax
1.40 2008-12 Value Added Tax TribunalOdisha Value Added Tax 2004
Value added tax 5.64 2014-15 Additional commissioner of commercial taxes
Andhra Pradesh VAT Act, 2005
Value added tax 0.08 2012-15 Deputy Commissioner Appeals
Tamil Nadu VAT Act, 2006 Value added tax 10.98 2008-09 to 2010-11 High Court47.40 2007-08 Commissioner
* Net of amounts paid under protest/ adjusted against refunds.
193Integrated R
eport
Managem
ent Review
Statutory R
eports
Financial Statements
Vedanta Limited Integrated Report and Annual Accounts 2017-18
We have audited the internal financial controls over financial reporting of Vedanta Limited (“the Company”) as of March 31, 2018 in conjunction with our audit of the standalone Ind AS financial statements of the Company for the year ended on that date.
Management’s Responsibility for Internal Financial ControlsThe Company’s Management is responsible for establishing and maintaining internal financial controls based on the internal control over financial reporting criteria established under the Committee of Sponsoring Organizations of the Treadway Commission (2013 framework) (“COSO 2013 criteria”), which considers the essential components of internal control stated in the Guidance Note on Audit of Internal Financial Controls Over Financial Reporting issued by the Institute of Chartered Accountants of India. These responsibilities include the design, implementation and maintenance of adequate internal financial controls that were operating effectively for ensuring the orderly and efficient conduct of its business, including adherence to the Company’s policies, the safeguarding of its assets, the prevention and detection of frauds and errors, the accuracy and completeness of the accounting records, and the timely preparation of reliable financial information, as required under the Act.
Auditor’s ResponsibilityOur responsibility is to express an opinion on the Company’s internal financial controls over financial reporting based on our audit. We conducted our audit in accordance with the Guidance Note on Audit of Internal Financial Controls Over Financial Reporting (the “Guidance Note”) and the Standards on Auditing as specified under section 143(10) of the Act, to the extent applicable to an audit of internal financial controls, and, both issued by the Institute of Chartered Accountants of India. Those Standards and the Guidance Note require that we comply with ethical requirements and plan and perform the audit to obtain reasonable assurance about whether adequate internal financial controls over financial reporting was established and maintained and if such controls operated effectively in all material respects.
Our audit involves performing procedures to obtain audit evidence about the adequacy of the internal financial controls system over financial reporting and their operating effectiveness. Our audit of internal financial controls over financial reporting included obtaining an understanding of internal financial controls over financial reporting, assessing the risk that a material weakness exists, and testing and evaluating the design and operating effectiveness of internal control based on the assessed risk. The procedures selected depend on the auditor’s judgement, including the assessment of the risks of material misstatement of the financial statements, whether due to fraud or error. We believe that the audit evidence we have obtained is sufficient and appropriate to provide a basis for our audit opinion on the internal financial controls system over financial reporting.
Meaning of Internal Financial Controls Over Financial Reporting
A company’s internal financial control over financial reporting is a process designed to provide reasonable assurance regarding the reliability of financial reporting and the preparation of financial statements for external purposes in accordance with generally accepted accounting principles. A company’s internal financial control over financial reporting includes those policies and procedures that (1) pertain to the maintenance of records that, in reasonable detail, accurately and fairly reflect the transactions and dispositions of the assets of the company; (2) provide reasonable assurance that transactions are recorded as necessary to permit preparation of financial statements in accordance with generally accepted accounting principles, and that receipts and expenditures of the company are being made only in accordance with authorisations of management and directors of the company; and (3) provide reasonable assurance regarding prevention or timely detection of unauthorised acquisition, use, or disposition of the company’s assets that could have a material effect on the financial statements.
Inherent Limitations of Internal Financial Controls Over Financial ReportingBecause of the inherent limitations of internal financial controls over financial reporting, including the possibility of collusion or improper management override of controls, material misstatements due to error or fraud may occur and not be detected. Also, projections of any evaluation of the internal financial controls over financial reporting to future periods are subject to the risk that the internal financial control over financial reporting may become inadequate because of changes in conditions, or that the degree of compliance with the policies or procedures may deteriorate.
OpinionIn our opinion, the Company has, in all material respects, an adequate internal financial controls system over financial reporting and such internal financial controls over financial reporting were operating effectively as at March 31, 2018, based on the internal control over financial reporting in COSO 2013 criteria, considering the essential components of internal control stated in the Guidance Note on Audit of Internal Financial Controls Over Financial Reporting issued by the Institute of Chartered Accountants of India.
For S.R. Batliboi & Co. LLPChartered Accountants
ICAI Firm Registration Number: 301003E/E300005
per Raj AgrawalPlace: Gurugram PartnerDate: May 03, 2018 Membership Number: 82028
Annexure 2 referred to in para 2(f) under the heading “Report on Other Legal and Regulatory Requirements” to the independent Auditor’s Report of even date on the Standalone Ind AS Financial Statements of Vedanta Limited
Report on the Internal Financial Controls under Clause (i) of Sub-section 3 of Section 143 of the Companies Act, 2013 (“the Act”)
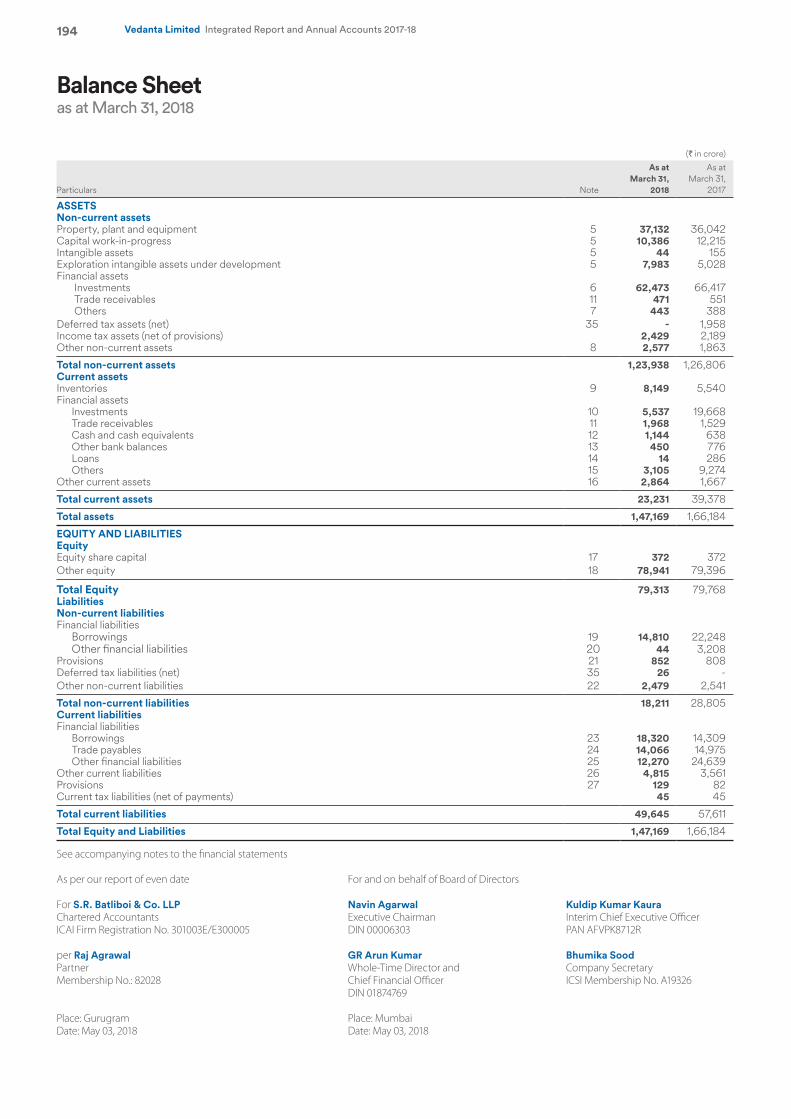
194 Vedanta Limited Integrated Report and Annual Accounts 2017-18
Balance Sheetas at March 31, 2018
(` in crore)
Particulars Note
As at March 31,
2018
As at March 31,
2017
ASSETS Non-current assets Property, plant and equipment 5 37,132 36,042 Capital work-in-progress 5 10,386 12,215 Intangible assets 5 44 155 Exploration intangible assets under development 5 7,983 5,028 Financial assets
Investments 6 62,473 66,417 Trade receivables 11 471 551 Others 7 443 388
Deferred tax assets (net) 35 - 1,958 Income tax assets (net of provisions) 2,429 2,189 Other non-current assets 8 2,577 1,863
Total non-current assets 1,23,938 1,26,806 Current assets Inventories 9 8,149 5,540 Financial assets
Investments 10 5,537 19,668 Trade receivables 11 1,968 1,529 Cash and cash equivalents 12 1,144 638 Other bank balances 13 450 776 Loans 14 14 286 Others 15 3,105 9,274
Other current assets 16 2,864 1,667
Total current assets 23,231 39,378
Total assets 1,47,169 1,66,184
EQUITY AND LIABILITIES Equity Equity share capital 17 372 372 Other equity 18 78,941 79,396
Total Equity 79,313 79,768 LiabilitiesNon-current liabilities Financial liabilities
Borrowings 19 14,810 22,248 Other financial liabilities 20 44 3,208
Provisions 21 852 808 Deferred tax liabilities (net) 35 26 - Other non-current liabilities 22 2,479 2,541
Total non-current liabilities 18,211 28,805 Current liabilities Financial liabilities
Borrowings 23 18,320 14,309 Trade payables 24 14,066 14,975 Other financial liabilities 25 12,270 24,639
Other current liabilities 26 4,815 3,561 Provisions 27 129 82 Current tax liabilities (net of payments) 45 45
Total current liabilities 49,645 57,611
Total Equity and Liabilities 1,47,169 1,66,184
See accompanying notes to the financial statements
As per our report of even date For and on behalf of Board of Directors
For S.R. Batliboi & Co. LLP Navin Agarwal Kuldip Kumar KauraChartered Accountants Executive Chairman Interim Chief Executive OfficerICAI Firm Registration No. 301003E/E300005 DIN 00006303 PAN AFVPK8712R
per Raj Agrawal GR Arun Kumar Bhumika SoodPartner Whole-Time Director and Company SecretaryMembership No.: 82028 Chief Financial Officer ICSI Membership No. A19326 DIN 01874769
Place: Gurugram Place: MumbaiDate: May 03, 2018 Date: May 03, 2018
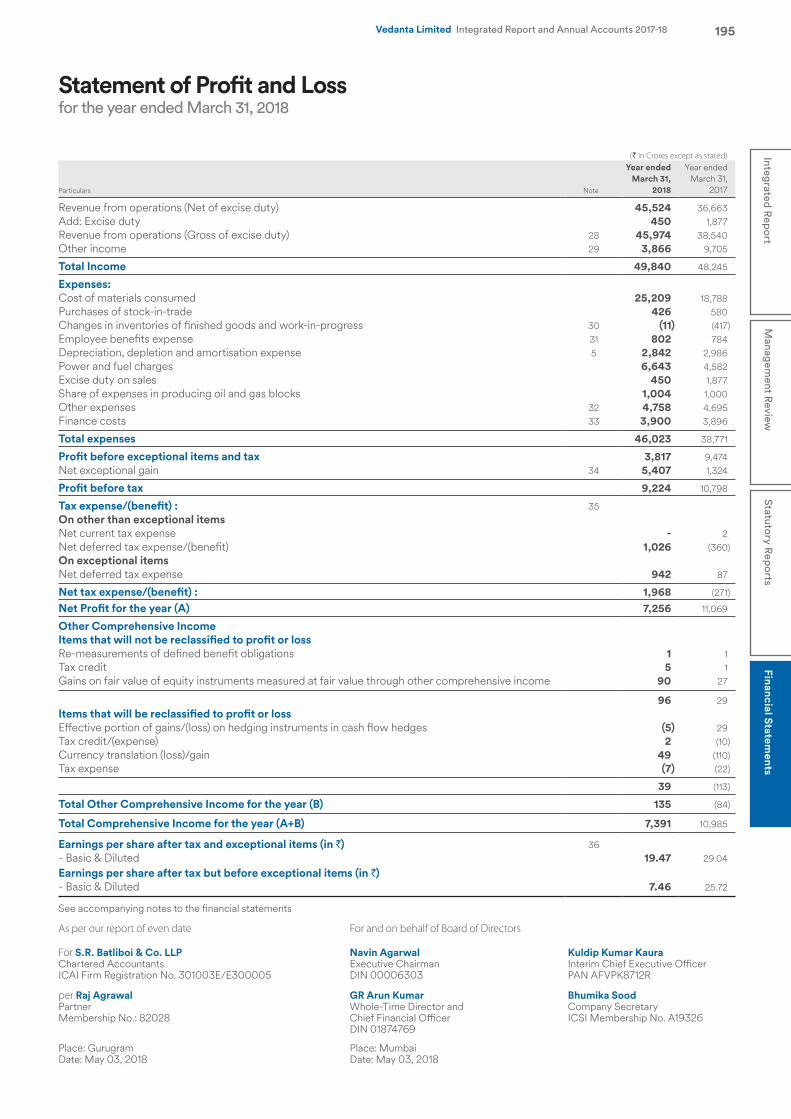
195Integrated R
eport
Managem
ent Review
Statutory R
eports
Financial Statements
Vedanta Limited Integrated Report and Annual Accounts 2017-18
Statement of Profit and Lossfor the year ended March 31, 2018
(` in Crores except as stated)
Particulars Note
Year ended March 31,
2018
Year ended March 31,
2017
Revenue from operations (Net of excise duty) 45,524 36,663 Add: Excise duty 450 1,877 Revenue from operations (Gross of excise duty) 28 45,974 38,540 Other income 29 3,866 9,705
Total Income 49,840 48,245
Expenses:Cost of materials consumed 25,209 18,788 Purchases of stock-in-trade 426 580 Changes in inventories of finished goods and work-in-progress 30 (11) (417)Employee benefits expense 31 802 784 Depreciation, depletion and amortisation expense 5 2,842 2,986 Power and fuel charges 6,643 4,582 Excise duty on sales 450 1,877 Share of expenses in producing oil and gas blocks 1,004 1,000 Other expenses 32 4,758 4,695 Finance costs 33 3,900 3,896
Total expenses 46,023 38,771
Profit before exceptional items and tax 3,817 9,474 Net exceptional gain 34 5,407 1,324
Profit before tax 9,224 10,798
Tax expense/(benefit) : 35On other than exceptional itemsNet current tax expense - 2Net deferred tax expense/(benefit) 1,026 (360)On exceptional itemsNet deferred tax expense 942 87
Net tax expense/(benefit) : 1,968 (271)
Net Profit for the year (A) 7,256 11,069
Other Comprehensive IncomeItems that will not be reclassified to profit or lossRe-measurements of defined benefit obligations 1 1 Tax credit 5 1 Gains on fair value of equity instruments measured at fair value through other comprehensive income 90 27
96 29 Items that will be reclassified to profit or lossEffective portion of gains/(loss) on hedging instruments in cash flow hedges (5) 29 Tax credit/(expense) 2 (10)Currency translation (loss)/gain 49 (110)Tax expense (7) (22)
39 (113)
Total Other Comprehensive Income for the year (B) 135 (84)
Total Comprehensive Income for the year (A+B) 7,391 10,985
Earnings per share after tax and exceptional items (in `) 36- Basic & Diluted 19.47 29.04
Earnings per share after tax but before exceptional items (in `)- Basic & Diluted 7.46 25.72
See accompanying notes to the financial statements
As per our report of even date For and on behalf of Board of Directors
For S.R. Batliboi & Co. LLP Navin Agarwal Kuldip Kumar KauraChartered Accountants Executive Chairman Interim Chief Executive OfficerICAI Firm Registration No. 301003E/E300005 DIN 00006303 PAN AFVPK8712R
per Raj Agrawal GR Arun Kumar Bhumika SoodPartner Whole-Time Director and Company SecretaryMembership No.: 82028 Chief Financial Officer ICSI Membership No. A19326 DIN 01874769
Place: Gurugram Place: MumbaiDate: May 03, 2018 Date: May 03, 2018
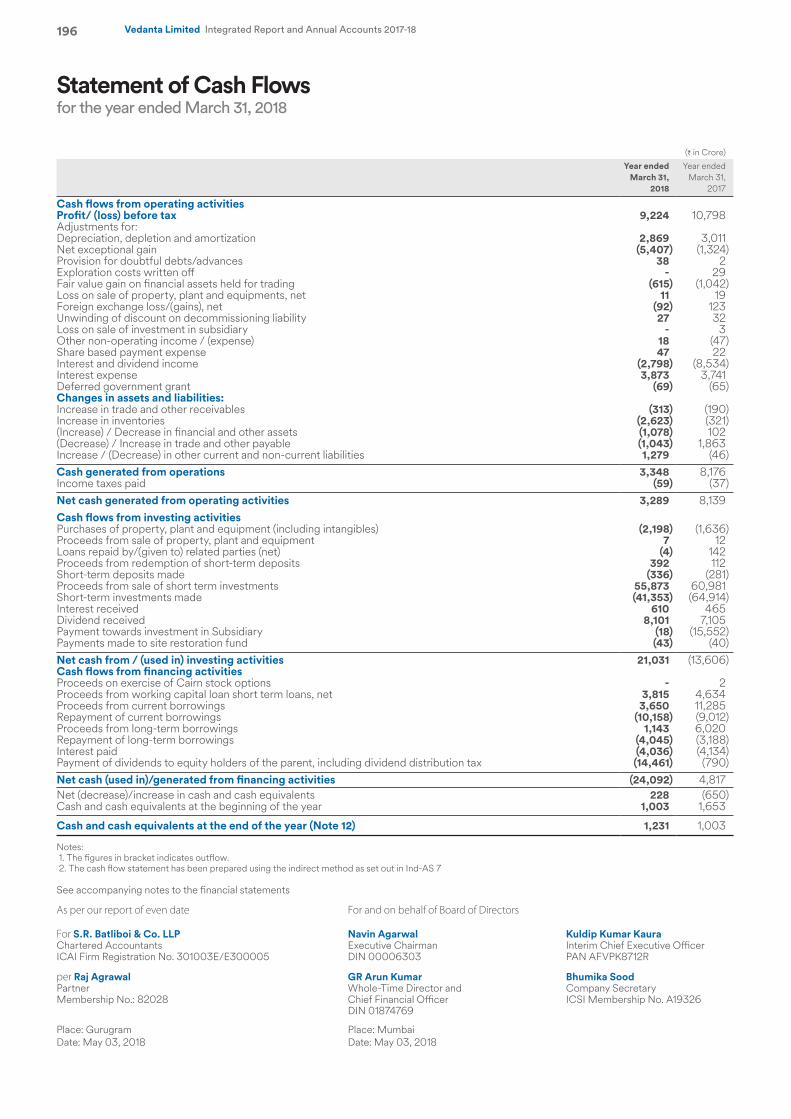
196 Vedanta Limited Integrated Report and Annual Accounts 2017-18
Statement of Cash Flows for the year ended March 31, 2018
(` in Crore)
Year ended March 31,
2018
Year ended March 31,
2017
Cash flows from operating activities Profit/ (loss) before tax 9,224 10,798 Adjustments for:Depreciation, depletion and amortization 2,869 3,011 Net exceptional gain (5,407) (1,324)Provision for doubtful debts/advances 38 2 Exploration costs written off - 29 Fair value gain on financial assets held for trading (615) (1,042)Loss on sale of property, plant and equipments, net 11 19 Foreign exchange loss/(gains), net (92) 123 Unwinding of discount on decommissioning liability 27 32 Loss on sale of investment in subsidiary - 3 Other non-operating income / (expense) 18 (47)Share based payment expense 47 22 Interest and dividend income (2,798) (8,534)Interest expense 3,873 3,741 Deferred government grant (69) (65)Changes in assets and liabilities: Increase in trade and other receivables (313) (190)Increase in inventories (2,623) (321)(Increase) / Decrease in financial and other assets (1,078) 102 (Decrease) / Increase in trade and other payable (1,043) 1,863 Increase / (Decrease) in other current and non-current liabilities 1,279 (46)Cash generated from operations 3,348 8,176 Income taxes paid (59) (37)Net cash generated from operating activities 3,289 8,139 Cash flows from investing activities Purchases of property, plant and equipment (including intangibles) (2,198) (1,636)Proceeds from sale of property, plant and equipment 7 12 Loans repaid by/(given to) related parties (net) (4) 142 Proceeds from redemption of short-term deposits 392 112 Short-term deposits made (336) (281)Proceeds from sale of short term investments 55,873 60,981 Short-term investments made (41,353) (64,914)Interest received 610 465 Dividend received 8,101 7,105 Payment towards investment in Subsidiary (18) (15,552)Payments made to site restoration fund (43) (40)Net cash from / (used in) investing activities 21,031 (13,606)Cash flows from financing activities Proceeds on exercise of Cairn stock options - 2 Proceeds from working capital loan short term loans, net 3,815 4,634 Proceeds from current borrowings 3,650 11,285 Repayment of current borrowings (10,158) (9,012)Proceeds from long-term borrowings 1,143 6,020 Repayment of long-term borrowings (4,045) (3,188)Interest paid (4,036) (4,134)Payment of dividends to equity holders of the parent, including dividend distribution tax (14,461) (790)Net cash (used in)/generated from financing activities (24,092) 4,817 Net (decrease)/increase in cash and cash equivalents 228 (650)Cash and cash equivalents at the beginning of the year 1,003 1,653
Cash and cash equivalents at the end of the year (Note 12) 1,231 1,003
Notes: 1. The figures in bracket indicates outflow. 2. The cash flow statement has been prepared using the indirect method as set out in Ind-AS 7
See accompanying notes to the financial statements
As per our report of even date For and on behalf of Board of Directors
For S.R. Batliboi & Co. LLP Navin Agarwal Kuldip Kumar KauraChartered Accountants Executive Chairman Interim Chief Executive OfficerICAI Firm Registration No. 301003E/E300005 DIN 00006303 PAN AFVPK8712R
per Raj Agrawal GR Arun Kumar Bhumika SoodPartner Whole-Time Director and Company SecretaryMembership No.: 82028 Chief Financial Officer ICSI Membership No. A19326 DIN 01874769
Place: Gurugram Place: MumbaiDate: May 03, 2018 Date: May 03, 2018
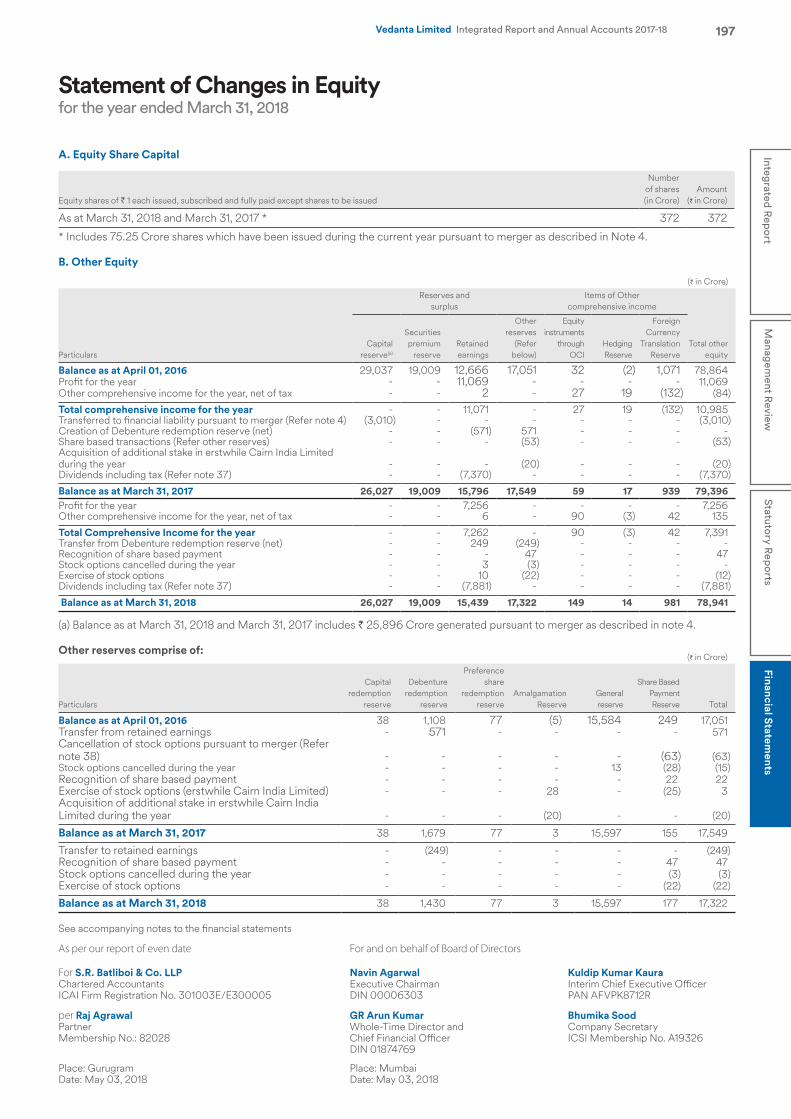
197Integrated R
eport
Managem
ent Review
Statutory R
eports
Financial Statements
Vedanta Limited Integrated Report and Annual Accounts 2017-18
Statement of Changes in Equityfor the year ended March 31, 2018
A. Equity Share Capital
Equity shares of ` 1 each issued, subscribed and fully paid except shares to be issued
Number of shares (in Crore)
Amount (` in Crore)
As at March 31, 2018 and March 31, 2017 * 372 372
* Includes 75.25 Crore shares which have been issued during the current year pursuant to merger as described in Note 4.
B. Other Equity
(` in Crore)
Particulars
Reserves and surplus
Items of Other comprehensive income
Total other equity
Capital reserve(a)
Securities premium
reserveRetained earnings
Other reserves
(Refer below)
Equity instruments
through OCI
Hedging Reserve
Foreign Currency
Translation Reserve
Balance as at April 01, 2016 29,037 19,009 12,666 17,051 32 (2) 1,071 78,864 Profit for the year - - 11,069 - - - - 11,069 Other comprehensive income for the year, net of tax - - 2 - 27 19 (132) (84)
Total comprehensive income for the year - - 11,071 - 27 19 (132) 10,985 Transferred to financial liability pursuant to merger (Refer note 4) (3,010) - - - - - - (3,010)Creation of Debenture redemption reserve (net) - - (571) 571 - - - - Share based transactions (Refer other reserves) - - - (53) - - - (53)Acquisition of additional stake in erstwhile Cairn India Limited during the year - - - (20) - - - (20)Dividends including tax (Refer note 37) - - (7,370) - - - - (7,370)
Balance as at March 31, 2017 26,027 19,009 15,796 17,549 59 17 939 79,396 Profit for the year - - 7,256 - - - - 7,256 Other comprehensive income for the year, net of tax - - 6 - 90 (3) 42 135
Total Comprehensive Income for the year - - 7,262 - 90 (3) 42 7,391 Transfer from Debenture redemption reserve (net) - - 249 (249) - - - - Recognition of share based payment - - - 47 - - - 47 Stock options cancelled during the year - - 3 (3) - - - - Exercise of stock options - - 10 (22) - - - (12)Dividends including tax (Refer note 37) - - (7,881) - - - - (7,881)
Balance as at March 31, 2018 26,027 19,009 15,439 17,322 149 14 981 78,941
(a) Balance as at March 31, 2018 and March 31, 2017 includes ` 25,896 Crore generated pursuant to merger as described in note 4.
Other reserves comprise of: (` in Crore)
Particulars
Capital redemption
reserve
Debenture redemption
reserve
Preference share
redemption reserve
Amalgamation Reserve
General reserve
Share Based Payment Reserve Total
Balance as at April 01, 2016 38 1,108 77 (5) 15,584 249 17,051 Transfer from retained earnings - 571 - - - - 571 Cancellation of stock options pursuant to merger (Refer note 38) - - - - - (63) (63)Stock options cancelled during the year - - - - 13 (28) (15)Recognition of share based payment - - - - - 22 22 Exercise of stock options (erstwhile Cairn India Limited) - - - 28 - (25) 3 Acquisition of additional stake in erstwhile Cairn India Limited during the year - - - (20) - - (20)
Balance as at March 31, 2017 38 1,679 77 3 15,597 155 17,549
Transfer to retained earnings - (249) - - - - (249)Recognition of share based payment - - - - - 47 47 Stock options cancelled during the year - - - - - (3) (3)Exercise of stock options - - - - - (22) (22)
Balance as at March 31, 2018 38 1,430 77 3 15,597 177 17,322
See accompanying notes to the financial statements
As per our report of even date For and on behalf of Board of Directors
For S.R. Batliboi & Co. LLP Navin Agarwal Kuldip Kumar KauraChartered Accountants Executive Chairman Interim Chief Executive OfficerICAI Firm Registration No. 301003E/E300005 DIN 00006303 PAN AFVPK8712R
per Raj Agrawal GR Arun Kumar Bhumika SoodPartner Whole-Time Director and Company SecretaryMembership No.: 82028 Chief Financial Officer ICSI Membership No. A19326 DIN 01874769
Place: Gurugram Place: MumbaiDate: May 03, 2018 Date: May 03, 2018
198 Vedanta Limited Integrated Report and Annual Accounts 2017-18
1 Company overview : Vedanta Limited, is a public limited Company domiciled in India and has its registered office at 1st Floor, ’C’ wing, Unit 103, Corporate Avenue, Atul Projects, Chakala, Andheri (East), Mumbai-400093, Maharashtra. Vedanta’s equity shares are listed on National Stock Exchange and Bombay Stock Exchange in India and its American Depository Shares (“ADS”) are listed on New York Stock Exchange in United States of America. Each ADS represents four equity shares. Vedanta is majority-owned by and is a controlled subsidiary of Vedanta Resources Plc, the London listed diversified natural resource Company.
The Company is principally engaged in the exploration, production and sale of aluminium, iron ore, copper, commercial power and oil and gas.
The Company’s aluminium business (Jharsuguda aluminium) principally consists of production of 2.0 mtpa alumina at Lanjigarh, Odisha, production of 0.5 mtpa aluminium at Jharsuguda, Odisha and captive power plants situated at Jharsuguda & Lanjigarh. The Company is also setting up a 1.25 mtpa aluminium smelter at Jharsuguda, 4.0 mtpa of alumina refinery at Lanjigarh and 210 MW power plant at Lanjigarh.
The Company’s iron ore business (Iron ore) consists of iron ore exploration, mining, beneficiation and exports. Vedanta has iron ore mining operations in the States of Goa and Karnataka. Vedanta is also in the business of manufacturing pig iron and metallurgical coke.
The Company’s copper business (Copper India) principally consists of custom smelting and includes a copper smelter, a refinery, a phosphoric acid plant and power plants at Tuticorin, Tamilnadu and a refinery and two copper rod plants at Silvassa in the Union Territory of Dadra and Nagar Haveli.
The Company’s power business comprises of 600 MW thermal coal based power facility in the State of Odisha.
The Company’s oil and gas business comprises of surveying, prospecting, drilling, exploring, acquiring, developing, producing, transporting, marketing, distributing and generally dealing in minerals, oils, petroleum, gas and related by-products and other activities incidental to the same. As part of its business activities, the Company also holds interests in its subsidiary companies which have been granted rights to explore and develop oil exploration blocks. The oil and gas business largely operates in the state of Gujarat, Rajasthan and Andhra Pradesh. (Refer note 4).
These are the Company’s separate financial statements. The details of Company’s material subsidiaries, associates and joint ventures is given in note 44.
2 Basis of preparation of financial statements : (a) Basis of preparation These financial statements have been prepared in accordance with Indian Accounting Standards (Ind AS) notified under the Companies (Indian Accounting Standards) Rules, 2015 (as amended from time to time).
These financial statements have been prepared in accordance with the accounting policies, set out below and were consistently applied to all periods presented unless otherwise stated.
Accounting policies are consistently applied except where newly issued accounting standard(s) is initially adopted on revision to an existing accounting standard requiring change in the accounting policy hitherto in use as disclosed below.
These financial statements are approved for issue by the Board of Directors on May 3, 2018.
Certain comparative figures appearing in these financial statements have been regrouped and/or reclassified to better reflect the nature of those items.
Amounts less than ` 0.50 Crore have been presented as “0”.
(b) Basis of measurement The financial statements have been prepared on a going concern basis using historical cost convention and on an accrual method of accounting, except for certain financial assets and liabilities which are measured at fair value as explained in the accounting policies below:
Application of new and revised standardsThe Company has adopted with effect from April 1, 2017, the following new amendment and pronouncements.• Ind AS 7 Statement of Cash Flows: Narrow-scope amendments: The amendments introduce an additional disclosure that will enable
users of financial statements to evaluate changes in liabilities arising from financing activities. The required disclosure is given in note 19(VI).
• Ind AS 102 Share-based Payment: Few amendments to clarify the classification and measurement of share-based payment transactions have been issued. This does not have any significant impact on the amounts reported in the financial statements.
• Guidance Note on Oil and Gas Accounting: The Institute of Chartered Accountants of India (‘ICAI’), on December 6, 2016 issued the revised Guidance Note on accounting for Oil and Gas producing activities (‘Guidance Note’), applicable from April 1, 2017.
Till March 31, 2017, proved and probable reserves (or 2P reserves) on entitlement interest basis were being considered for providing depletion on oil and gas assets. As per the Guidance Note, proved and developed reserves (or 1P reserves) on working interest basis are to be considered for computing depletion. The change has been applied prospectively and as a result, depreciation, depletion and amortization expense for the year is lower by ` 697 Crore and profit after tax is higher by ` 454 Crore.
Notes forming part of the Financial Statementsas at and for the year ended March 31, 2018
199Integrated R
eport
Managem
ent Review
Statutory R
eports
Financial Statements
Vedanta Limited Integrated Report and Annual Accounts 2017-18
3 Significant accounting policiesThe Company has applied the following accounting policies to all periods presented in the financial statements.
(a) Revenue recognitionRevenues are measured at the fair value of the consideration received or receivable, net of discounts, volume rebates, outgoing sales taxes/ goods & service tax and other indirect taxes excluding excise duty.
Excise duty is a liability of the manufacturer which forms part of the cost of production, irrespective of whether the goods are sold or not. Since the recovery of excise duty flows to Company on its own account, revenue includes excise duty.
• Sale of goods/rendering of services Revenues from sales of goods are recognised when all significant risks and rewards of ownership of the goods sold are transferred to
the customer which usually is on delivery of the goods to the shipping agent. Revenues from sale of by-products are included in revenue.
Certain of the Company’s sales contracts provide for provisional pricing based on the price on The London Metal Exchange (“LME”), as specified in the contract, when shipped. Final settlement of the price is based on the applicable price for a specified future period. The Company’s provisionally priced sales are marked to market using the relevant forward prices for the future period specified in the contract and is adjusted in revenue.
Revenue from oil, gas and condensate sales represents the Company’s share of oil, gas and condensate production, recognized on a direct entitlement basis, when significant risks and rewards of ownership are transferred to the buyers. Direct entitlement basis represents entitlement to variable physical volumes of hydrocarbons, representing recovery of the costs incurred and a stipulated share of the production remaining after such cost recovery. The stipulated share of production is arrived after reducing government’s share of profit petroleum which is accounted for when the obligation (legal or constructive), in respect of the same arises.
Revenue from sale of power is recognised when delivered and measured based on rates as per bilateral contractual agreements with buyers and at rate arrived at based on the principles laid down under the relevant Tariff Regulations as notified by the regulatory bodies, as applicable.
Revenue from rendering of services is recognised on the basis of work performed.
• Interest income Interest income from debt instruments is recognised using the effective interest rate method. The effective interest rate is the rate that
exactly discounts estimated future cash receipts through the expected life of the financial asset to the gross carrying amount of a financial asset. When calculating the effective interest rate, the Company estimates the expected cash flows by considering all the contractual terms of the financial instrument (for example, prepayment, extension, call and similar options) but does not consider the expected credit losses.
• Dividends Dividend income is recognised in the statement of profit and loss only when the right to receive payment is established, provided it is probable that the economic benefits associated with the dividend will flow to the Company, and the amount of the dividend can be measured reliably.
(b) Property, plant and equipment(i) Mining properties and leasesThe costs of mining properties and leases , which include the costs of acquiring and developing mining properties and mineral rights, are capitalised as property, plant and equipment under the heading “Mining property and leases” in the year in which they are incurred.
When a decision is taken that a mining property is viable for commercial production (i.e. when the Company determines that the mining property will provide sufficient and sustainable return relative to the risks and the Company decided to proceed with the mine development), all further pre-production primary development expenditure other than land, buildings, plant and equipment is capitalised as part of the cost of the mining property until the mining property is capable of commercial production.
The stripping cost incurred during the production phase of a surface mine is deferred to the extent the current period stripping cost exceeds the average period stripping cost over the life of mine and recognised as an asset if such cost provides a benefit in terms of improved access to ore in future periods and certain criteria are met. When the benefit from the stripping costs are realised in the current period, the stripping costs are accounted for as the cost of inventory. If the costs of inventory produced and the stripping activity asset are not separately identifiable, a relevant production measure is used to allocate the production stripping costs between the inventory produced and the stripping activity asset. The Company uses the expected volume of waste compared with the actual volume of waste extracted for a given value of ore production for the purpose of determining the cost of the stripping activity asset.
Deferred stripping cost are included in mining properties within property, plant and equipment and disclosed as a part of mining properties. After initial recognition, the stripping activity asset is depreciated on a unit of production method over the expected useful life of the identified component of the ore body.
In the circumstance where a property is abandoned, the cumulative capitalized costs relating to the property are written off in the same period i.e. when the Company determines that the mining property will not provide sufficient and sustainable returns relative to the risks and the Group decides not to proceed with the mine development.
Notes forming part of the Financial Statementsas at and for the year ended March 31, 2018
200 Vedanta Limited Integrated Report and Annual Accounts 2017-18
Commercial reserves are proved and probable reserves as defined by the ‘JORC’ code, ‘MORC’ code or ‘SAMREC’ code. Changes in the commercial reserves affecting unit of production calculations are dealt with prospectively over the revised remaining reserves.
(ii) Oil and gas assets- (developing/producing assets)For oil and gas, assets a successful efforts based accounting policy is followed.
All costs incurred after the technical feasibility and commercial viability of producing hydrocarbons has been demonstrated are capitalised within property, plant and equipment - development/producing assets on a field-by-field basis. Subsequent expenditure is capitalised only where it either enhances the economic benefits of the development/producing asset or replaces part of the existing development/producing asset. Any remaining costs associated with the part replaced are expensed.
Net proceeds from any disposal of development/producing assets are credited against the previously capitalised cost. A gain or loss on disposal of a development/producing asset is recognised in the statement of profit and loss to the extent that the net proceeds exceed or are less than the appropriate portion of the net capitalised costs of the asset.
(iii) Other property, plant and equipmentThe initial cost of property, plant and equipment comprises its purchase price, including import duties and non-refundable purchase taxes, and any directly attributable costs of bringing an asset to working condition and location for its intended use. It also includes the initial estimate of the costs of dismantling and removing the item and restoring the site on which it is located.
Land acquired free of cost or at below market rate from the government is recognized at fair value with corresponding credit to deferred income.
If significant parts of an item of property, plant and equipment have different useful lives, then they are accounted for as separate items (major components) of property, plant and equipment. Major inspection and overhaul expenditure is capitalized, if the recognition criteria are met.
Gains and losses on disposal of an item of property, plant and equipment computed as the difference between the net disposal proceeds and the carrying amount of the asset is included in the statement of profit and loss when the asset is derecognised.
(iv) Assets under constructionAssets under construction are capitalized in the assets under construction account. At the point when an asset is capable of operating in the manner intended by management, the cost of construction is transferred to the appropriate category of property, plant and equipment. Costs (net of income) associated with the commissioning of an asset and any obligations for decommissioning costs are capitalised until the period of commissioning has been completed and the asset is ready for its intended use.
(v) Depreciation, depletion and amortisation expenseMining properties and other assets in the course of development or construction and freehold land are not depreciated.
• Mining properties: The capitalised mining properties are amortised on a unit-of-production basis over the total estimated remaining commercial proved
and probable reserves of each property or group of properties and are subject to impairment review. Costs used in the unit of production calculation comprise the net book value of capitalised costs plus the estimated future capital expenditure required to access the commercial reserves. Changes in the estimates of commercial reserves or future capital expenditure are dealt with prospectively.
Leasehold land and buildings are depreciated on a straight-line basis over the period of the lease or, if shorter, their useful economic life.
• Oil and gas assets: (Refer note 2(b)) All expenditures carried within each field are amortised from the commencement of production on a unit of production basis, which is
the ratio of oil and gas production in the period to the estimated quantities of depletable reserves at the end of the period plus the production in the period, generally on a field-by-field basis or group of fields which are reliant on common infrastructure.
Depletable reserves are proved reserves for acquisition costs and proved and developed reserves for successful exploratory wells, development wells, processing facilities, distribution assets, estimated future abandonment cost and all other related costs. These assets are depleted within each cost centre. Reserves for this purpose are considered on working interest basis which are reassessed atleast annually. Impact of changes to reserves are accounted for prospectively.
Till March 31, 2017 depletable reserves were proven and probable oil and gas reserves. Costs used in the unit of production calculation comprise the net book value of capitalised costs plus the estimated future field development costs required to access these reserves.
• Other assets: Depreciation on other property, plant and equipment is calculated using the straight-line method (SLM) to allocate their cost, net of their
residual values, over their estimated useful lives (determined by the management based on technical estimates) given as below.
Management’s assessment of independent technical evaluation/advice takes into account, inter alia, the nature of the assets, the estimated usage of the assets, the operating conditions of the assets, past history of replacement and maintenance support.
Notes forming part of the Financial Statementsas at and for the year ended March 31, 2018
201Integrated R
eport
Managem
ent Review
Statutory R
eports
Financial Statements
Vedanta Limited Integrated Report and Annual Accounts 2017-18
Estimated useful lives of assets are as follows:
AssetUseful life (in years)
Buildings (Residential, factory etc.) 3-60Plant and equipment 15-40Railway siding 15Roads (grouped under buildings) 3-10Office equipment 3-6Furniture and fixture 8-10Vehicles 8-10Ships 25Aircraft 20River fleet 28
Major inspection and overhaul costs are depreciated over the estimated life of the economic benefit derived from such costs. The carrying amount of the remaining previous overhaul cost is charged to the statement of profit and loss if the next overhaul is undertaken earlier than the previously estimated life of the economic benefit.
The Company reviews the residual value and useful life of an asset at least at each financial year-end and, if expectations differ from previous estimates, the change(s) is accounted for as a change in accounting estimate.
(c) Intangible assetsIntangible assets acquired separately are measured on initial recognition at cost. Following initial recognition, intangible assets are carried at cost less accumulated amortization and accumulated impairment losses, if any.
Intangible assets are amortised over their estimated useful life on a straight line basis. Software is amortised over the estimated useful life of software license of five years. Amounts paid for securing mining rights are amortised over the period of the mining lease of 16-25 years.
The amortization period and the amortization method are reviewed at least at each financial year end. If the expected useful life of the asset is different from previous estimates, the change is accounted for prospectively as a change in accounting estimate.
(d) Exploration and evaluation intangible assetsExploration and evaluation expenditure incurred prior to obtaining the mining right or the legal right to explore are expensed as incurred
Exploration and evaluation expenditure incurred after obtaining the mining right or the legal right to explore are capitalised as exploration and evaluation assets (intangible assets) and stated at cost less impairment, if any. Exploration and evaluation assets are transferred to property, plant and equipment when the technical feasibility and commercial viability has been determined. Exploration intangible assets under development are assessed for impairment and impairment loss, if any, is recognised prior to reclassification.
Exploration expenditure includes all direct and allocated indirect expenditure associated with finding specific mineral resources which includes depreciation and applicable operating costs of related support equipments and facilities and other costs of exploration activities:
• Acquisition costs - costs associated with acquisition of licenses and rights to explore, including related professional fees.
• General exploration costs - costs of surveys and studies, rights of access to properties to conduct those studies (e.g., costs incurred for environment clearance, defense clearance, etc.), and salaries and other expenses of geologists, geophysical crews and other personnel conducting those studies.
• Costs of exploration drilling and equipping exploration and appraisal wells. Exploration expenditure incurred in the process of determining oil and gas exploration targets is capitalised within “Exploration and
evaluation assets” (intangible assets) and subsequently allocated to drilling activities. Exploration drilling costs are initially capitalised on a well-by-well basis until the success or otherwise of the well has been established. The success or failure of each exploration effort is judged on a well-by-well basis.
Following appraisal of successful exploration wells, if commercial reserves are established and technical feasibility for extraction demonstrated, then the related capitalised exploration costs are transferred into a single field cost center within property, plant and equipment - development/producing assets after testing for impairment. Where results of exploration drilling indicate the presence of hydrocarbons which are ultimately not considered commercially viable, all related costs are written off to the statement of profit and loss
Expenditure incurred on the acquisition of a license interest is initially capitalised on a license-by-license basis. Costs are held, undepleted, within exploration and evaluation assets until such time as the exploration phase on the license area is complete or commercial reserves have been discovered.
Net proceeds from any disposal of an exploration asset are initially credited against the previously capitalised costs. Any surplus/deficit is recognised in the statement of profit and loss.
Notes forming part of the Financial Statementsas at and for the year ended March 31, 2018
202 Vedanta Limited Integrated Report and Annual Accounts 2017-18
(e) Non-current assets held for saleNon-current assets and disposal groups are classified as held for sale if their carrying amount will be recovered through a sale transaction rather than through continuing use. This condition is regarded as met only when the sale is highly probable and the asset (or disposal group) is available for immediate sale in its present condition. Management must be committed to the sale which should be expected to qualify for recognition as a completed sale within one year from the date of classification.
Non-current assets and disposal group’s classified as held for sale are not depreciated and are measured at the lower of carrying amount and fair value less costs to sell. Such assets and disposal groups are presented separately on the face of the balance sheet. (f) Impairment of non-financial assets Impairment charges and reversals are assessed at the level of cash-generating units. A cash-generating unit (CGU) is the smallest identifiable group of assets that generate cash inflows that are largely independent of the cash inflows from other assets or group of assets.
The Company assess at each reporting date, whether there is an indication that an asset may be impaired. The Company conducts an internal review of asset values annually, which is used as a source of information to assess for any indications of impairment or reversal of previously recognised impairment losses. External factors, such as changes in expected future prices, costs and other market factors are also monitored to assess for indications of impairment or reversal of previously recognised impairment losses.
If any such indication exists then an impairment review is undertaken and the recoverable amount is calculated, as the higher of fair value less costs of disposal and the asset’s value in use.
Fair value less costs of disposal is the price that would be received to sell the asset in an orderly transaction between market participants and does not reflect the effects of factors that may be specific to the entity and not applicable to entities in general. Fair value for mineral and oil and gas assets is generally determined as the present value of the estimated future cash flows expected to arise from the continued use of the asset, including any expansion prospects, and its eventual disposal, using assumptions that an independent market participant may take into account. These cash flows are discounted at an appropriate post tax discount rate to arrive at the net present value.
Value in use is determined as the present value of the estimated future cash flows expected to arise from the continued use of the asset in its present form and its eventual disposal. The cash flows are discounted using a pre-tax discount rate that reflects current market assessments of the time value of money and the risks specific to the asset for which estimates of future cash flows have not been adjusted. Value in use is determined by applying assumptions specific to the Company’s continued use and cannot take into account future development. These assumptions are different to those used in calculating fair value and consequently the value in use calculation is likely to give a different result to a fair value calculation.
The carrying amount of the CGU is determined on a basis consistent with the way the recoverable amount of the CGU is determined.
If the recoverable amount of an asset or CGU is estimated to be less than its carrying amount, the carrying amount of the asset or CGU is reduced to its recoverable amount. An impairment loss is recognised in the statement of profit and loss.
Any reversal of the previously recognised impairment loss is limited to the extent that the asset’s carrying amount does not exceed the carrying amount that would have been determined if no impairment loss had previously been recognised.
Exploration and evaluation assets:In assessing whether there is any indication that an exploration and evaluation asset may be impaired, the Company considers, as a minimum, the following indications:• the period for which the entity has the right to explore in the specific area has expired during the period or will expire in the near future,
and is not expected to be renewed;• substantive expenditure on further exploration for and evaluation of mineral resources in the specific area is neither budgeted nor
planned;• exploration for and evaluation of mineral resources in the specific area have not led to the discovery of commercially viable quantities of
mineral resources and the entity has decided to discontinue such activities in the specific area; • sufficient data exist to indicate that, although a development in the specific area is likely to proceed, the carrying amount of the
exploration and evaluation asset is unlikely to be recovered in full from successful development or by sale; and• reserve information prepared annually by external experts.
When a potential impairment is identified, an assessment is performed for each area of interest in conjunction with the group of operating assets (representing a cash-generating unit) to which the exploration and evaluation assets is attributed. Exploration areas in which reserves have been discovered but require major capital expenditure before production can begin, are continually evaluated to ensure that commercial quantities of reserves exist or to ensure that additional exploration work is underway or planned. To the extent that capitalised expenditure is no longer expected to be recovered, it is charged to the statement of profit and loss.
(g) Financial instrumentsA financial instrument is any contract that gives rise to a financial asset of one entity and a financial liability or equity instrument of another entity.
(i) Financial Assets - Recognition All financial assets are recognised initially at fair value plus, in the case of financial assets not recorded at fair value through profit or loss, transaction costs that are attributable to the acquisition of the financial asset. Purchases or sales of financial assets that require delivery of assets within a time frame established by regulation or convention in the market place (regular way trades) are recognised on the trade date, i.e., the date that the Company commits to purchase or sell the asset.
Notes forming part of the Financial Statementsas at and for the year ended March 31, 2018
203Integrated R
eport
Managem
ent Review
Statutory R
eports
Financial Statements
Vedanta Limited Integrated Report and Annual Accounts 2017-18
For the purpose of subsequent measurement, financial assets are classified in four categories:• Debt instruments at amortised cost A ‘debt instrument’ is measured at the amortised cost if both the following conditions are met:
a) The asset is held within a business model whose objective is to hold assets for collecting contractual cash flows, andb) Contractual terms of the asset give rise on specified dates to cash flows that are solely payments of principal and interest (SPPI) on
the principal amount outstanding.
After initial measurement, such financial assets are subsequently measured at amortised cost using the effective interest rate (EIR) method. Amortised cost is calculated by taking into account any discount or premium on acquisition and fees or costs that are an integral part of the EIR. The EIR amortisation is included in interest income in the statement of profit and loss. The losses arising from impairment are recognised in the statement of profit and loss.
• Debt instruments at fair value through other comprehensive income (FVOCI) A ‘debt instrument’ is classified as at FVOCI if both of the following criteria are met:
a) The objective of the business model is achieved both by collecting contractual cash flows and selling the financial assets, and
b) The asset’s contractual cash flows represent SPPI.
Debt instruments included within the FVOCI category are measured initially as well as at each reporting date at fair value. Fair value movements are recognized in the other comprehensive income (OCI). However, the interest income, impairment losses & reversals and foreign exchange gain or loss are recognised in the statement of profit and loss. On derecognition of the asset, cumulative gain or loss previously recognised in OCI is reclassified from the equity to profit or loss. Interest earned whilst holding FVOCI debt instrument is reported as interest income using the EIR method.
• Debt instruments at fair value through profit or loss (FVTPL) FVTPL is a residual category for debt instruments. Any debt instrument, which does not meet the criteria for categorization as at
amortized cost or as FVOCI, is classified as at FVTPL. In addition, the Company may elect to designate a debt instrument, which otherwise meets amortized cost or FVOCI criteria, as at FVTPL. However, such election is allowed only if doing so reduces or eliminates a measurement or recognition inconsistency (referred to as ‘accounting mismatch’). The Company has not designated any debt instrument as at FVTPL. Debt instruments included within the FVTPL category are measured at fair value with all changes being recognized in the statement of profit and loss.
• Equity instruments All equity investments in scope of Ind AS 109 are measured at fair value. Equity instruments which are held for trading and contingent
consideration recognised by an acquirer in a business combination to which Ind AS 103 applies are classified as at FVTPL. For all other equity instruments, the Company may make an irrevocable election to present in other comprehensive income subsequent changes in the fair value. The Company makes such election on an instrument-by-instrument basis. The classification is made on initial recognition and is irrevocable. If the Company decides to classify an equity instrument as at FVOCI, then all fair value changes on the instrument, excluding dividends, are recognized in OCI. There is no recycling of the amounts from OCI to the statement of profit or loss, even on sale of investment. However, the Company may transfer the cumulative gain or loss within equity. For equity instruments which are classified as FVTPL all subsequent fair value changes are recognised in the statement of profit and loss.
(ii) Financial Assets - derecognitionThe Company derecognises a financial asset when the contractual rights to the cash flows from the asset expire, or it transfers the rights to receive the contractual cash flows on the financial asset in a transaction in which substantially all the risks and rewards of ownership of the financial asset are transferred. (iii) Impairment of financial assetsIn accordance with Ind AS 109, the Company applies expected credit loss (ECL) model for measurement and recognition of impairment loss on the following financial assets:• Financial assets that are debt instruments, and are measured at amortised cost e.g., loans, debt securities and deposits• Financial assets that are debt instruments and are measured as at FVOCI • Trade receivables or any contractual right to receive cash or another financial asset that result from transactions that are within the
scope of Ind AS 18
The Company follows ‘simplified approach’ for recognition of impairment loss allowance on trade receivables. The application of simplified approach does not require the Company to track changes in credit risk. Rather, it recognises impairment loss allowance based on lifetime ECLs at each reporting date, right from its initial recognition. At each reporting date, for recognition of impairment loss on other financial assets and risk exposure, the Company determines whether there has been a significant increase in the credit risk since initial recognition. If credit risk has not increased significantly, 12-month ECL is used to provide for impairment loss. However, if credit risk has increased significantly, lifetime ECL is used. If, in a subsequent period, credit quality of the instrument improves such that there is no longer a significant increase in credit risk since initial recognition, then the entity reverts to recognising impairment loss allowance based on 12-month ECL.
Notes forming part of the Financial Statementsas at and for the year ended March 31, 2018
204 Vedanta Limited Integrated Report and Annual Accounts 2017-18
Lifetime ECL are the expected credit losses resulting from all possible default events over the expected life of a financial instrument. The 12-month ECL is a portion of the lifetime ECL which results from default events that are possible within 12 months after the reporting date. ECL is the difference between all contractual cash flows that are due to the Company in accordance with the contract and all the cash flows that the entity expects to receive (i.e., all cash shortfalls), discounted at the original EIR.
ECL impairment loss allowance (or reversal) recognized during the year is recognized as income/ expense in the statement of profit and loss. The balance sheet presentation for various financial instruments is described below:
• Financial assets measured at amortised cost: ECL is presented as an allowance, i.e., as an integral part of the measurement of those assets in the balance sheet. Until the asset meets write-off criteria, the Company does not reduce impairment allowance from the gross carrying amount.
• Debt instruments measured at FVOCI: Since financial assets are already reflected at fair value, impairment allowance is not further reduced from its value. Rather, ECL amount is presented as ‘accumulated impairment amount’ in the OCI.
For assessing increase in credit risk and impairment loss, the Company combines financial instruments on the basis of shared credit risk characteristics with the objective of facilitating an analysis that is designed to enable significant increases in credit risk to be identified on a timely basis.
The Company does not have any purchased or originated credit-impaired financial assets, i.e., financial assets which are credit impaired on purchase/ origination.
(iv) Financial liabilities – Recognition & Subsequent measurementFinancial liabilities are classified, at initial recognition, as financial liabilities at fair value through profit or loss, or as loans, borrowings and payables, or as derivatives designated as hedging instruments in an effective hedge, as appropriate.
All financial liabilities are recognised initially at fair value and, in the case of financial liabilities at amortised cost, net of directly attributable transaction costs.
The Company’s financial liabilities include trade and other payables, loans and borrowings including bank overdrafts, financial guarantees and derivative financial instruments.
The subsequent measurement of financial liabilities depends on their classification, as described below:
• Financial liabilities at fair value through profit or loss Financial liabilities at fair value through profit or loss include financial liabilities held for trading and financial liabilities designated upon
initial recognition as at fair value through profit or loss. Financial liabilities are classified as held for trading if they are incurred for the purpose of repurchasing in the near term. This category also includes derivative financial instruments entered into by the Company that are not designated as hedging instruments in hedge relationships as defined by Ind AS 109. Separated embedded derivatives are also classified as held for trading unless they are designated as effective hedging instruments.
Gains or losses on liabilities held for trading are recognised in the statement of profit and loss.
Financial liabilities designated upon initial recognition at fair value through profit or loss are designated as such at the initial date of recognition, and only if the criteria in Ind AS 109 are satisfied. For liabilities designated as FVTPL, fair value gains/ losses attributable to changes in own credit risk are recognized in OCI. These gains/ loss are not subsequently transferred to the statement of profit and loss. However, the Company may transfer the cumulative gain or loss within equity. All other changes in fair value of such liability are recognised in the statement of profit or loss. The Company has not designated any financial liability as at fair value through profit and loss.
• Financial liabilities at amortised cost (Loans & Borrowings) After initial recognition, interest-bearing loans and borrowings are subsequently measured at amortised cost using the EIR method.
Gains and losses are recognised in the statement of profit and loss when the liabilities are derecognised as well as through the EIR amortisation process.
Amortised cost is calculated by taking into account any discount or premium on acquisition and fees or costs that are an integral part of the EIR. The EIR amortisation is included as finance costs in the statement of profit and loss.
(v) Financial liabilities - DerecognitionA financial liability is derecognised when the obligation under the liability is discharged or cancelled or expires. When an existing financial liability is replaced by another from the same lender on substantially different terms, or the terms of an existing liability are substantially modified, such an exchange or modification is treated as the derecognition of the original liability and the recognition of a new liability. The difference in the respective carrying amounts is recognised in the statement of profit and loss.
(vi) Embedded derivativesAn embedded derivative is a component of a hybrid (combined) instrument that also includes a non-derivative host contract – with the effect that some of the cash flows of the combined instrument vary in a way similar to a stand-alone derivative. An embedded derivative causes some or all of the cash flows that otherwise would be required by the contract to be modified according to a specified interest rate, financial instrument price, commodity price, foreign exchange rate, index of prices or rates, credit rating or credit index, or other variable, provided in the case of a non-financial variable that the variable is not specific to a party to the contract. Reassessment only occurs if there is either a change in the terms of the contract that significantly modifies the cash flows that would otherwise be required or a reclassification of a financial asset out of the fair value through profit or loss.
Notes forming part of the Financial Statementsas at and for the year ended March 31, 2018
205Integrated R
eport
Managem
ent Review
Statutory R
eports
Financial Statements
Vedanta Limited Integrated Report and Annual Accounts 2017-18
If the hybrid contract contains a host that is a financial asset within the scope of Ind AS 109, the Company does not separate embedded derivatives. Rather, it applies the classification requirements contained in Ind AS 109 to the entire hybrid contract. Derivatives embedded in all other host contracts are accounted for as separate derivatives and recorded at fair value if their economic characteristics and risks are not closely related to those of the host contracts and the host contracts are not held for trading or designated at fair value though profit or loss. These embedded derivatives are measured at fair value with changes in fair value recognised in the statement of profit and loss, unless designated as effective hedging instruments.
(vii) Equity instrumentsAn equity instrument is any contract that evidences a residual interest in the assets of any entity after deducting all of its liabilities. Equity instruments issued by the Company are recognised at the proceeds received, net of direct issue costs.
(viii) Offsetting of financial instrumentsFinancial assets and financial liabilities are offset and the net amount is reported in the balance sheet if there is a currently enforceable legal right to offset the recognised amounts and there is an intention to settle on a net basis, or to realise the asset and settle the liability simultaneously.
(ix) Derivative financial instruments and hedge accounting
Initial recognition and subsequent measurement
In order to hedge its exposure to foreign exchange, interest rate, and commodity price risks, the Company enters into forward, option, swap contracts and other derivative financial instruments. The Company does not hold derivative financial instruments for speculative purposes.
Such derivative financial instruments are initially recognised at fair value on the date on which a derivative contract is entered into and are subsequently re-measured at fair value. Derivatives are carried as financial assets when the fair value is positive and as financial liabilities when the fair value is negative.
Any gains or losses arising from changes in the fair value of derivatives are taken directly to the statement of profit and loss, except for the effective portion of cash flow hedges, which is recognised in OCI and later reclassified to the statement of profit and loss when the hedge item affects profit or loss or treated as basis adjustment if a hedged forecast transaction subsequently results in the recognition of a non-financial asset or non-financial liability.
For the purpose of hedge accounting, hedges are classified as:• Fair value hedges when hedging the exposure to changes in the fair value of a recognised asset or liability or an unrecognised firm
commitment • Cash flow hedges when hedging the exposure to variability in cash flows that is either attributable to a particular risk associated with a
recognised asset or liability or a highly probable forecast transaction or the foreign currency risk in an unrecognised firm commitment• Hedges of a net investment in a foreign operation
At the inception of a hedge relationship, the Company formally designates and documents the hedge relationship to which the Company wishes to apply hedge accounting. The documentation includes the Company’s risk management objective and strategy for undertaking hedge, the hedging/ economic relationship, the hedged item or transaction, the nature of the risk being hedged, hedge ratio and how the entity will assess the effectiveness of changes in the hedging instrument’s fair value in offsetting the exposure to changes in the hedged item’s fair value or cash flows attributable to the hedged risk. Such hedges are expected to be highly effective in achieving offsetting changes in fair value or cash flows and are assessed on an ongoing basis to determine that they actually have been highly effective throughout the financial reporting periods for which they were designated.
Hedges that meet the strict criteria for hedge accounting are accounted for, as described below:
i. Fair value hedgesChanges in the fair value of derivatives that are designated and qualify as fair value hedges are recognised in the statement of profit and loss immediately, together with any changes in the fair value of the hedged asset or liability that are attributable to the hedged risk.
When an unrecognised firm commitment is designated as a hedged item, the subsequent cumulative change in the fair value of the firm commitment attributable to the hedged risk is recognised as an asset or liability with a corresponding gain or loss recognised in profit or loss. Hedge accounting is discontinued when the Company revokes the hedge relationship, the hedging instrument or hedged item expires or is sold, terminated, or exercised or no longer meets the criteria for hedge accounting.
ii. Cash flow hedgesThe effective portion of the gain or loss on the hedging instrument is recognised in OCI in the cash flow hedge reserve, while any ineffective portion is recognised immediately in the statement of profit and loss.
Amounts recognised as OCI are transferred to profit or loss when the hedged transaction affects profit or loss, such as when the hedged financial income or financial expense is recognised or when a forecast sale occurs. When the hedged item is the cost of a non-financial asset or non-financial liability, the amounts recognised as OCI are transferred to the initial carrying amount of the non-financial asset or liability.
If the hedging instrument expires or is sold, terminated or exercised without replacement or rollover (as part of the hedging strategy), or if its designation as a hedge is revoked, or when the hedge no longer meets the criteria for hedge accounting, any cumulative gain or loss previously recognised in OCI remains separately in equity until the forecast transaction occurs or the foreign currency firm commitment is met.
Notes forming part of the Financial Statementsas at and for the year ended March 31, 2018
206 Vedanta Limited Integrated Report and Annual Accounts 2017-18
(h) Financial guaranteesFinancial guarantees issued by the Company on behalf of group companies are designated as ‘Insurance Contracts’. The Company assesses at the end of each reporting period whether its recognised insurance liabilities (if any) are adequate, using current estimates of future cash flows under its insurance contracts. If that assessment shows that the carrying amount of its insurance liabilities is inadequate in the light of the estimated future cash flows, the entire deficiency is recognised in the statement of profit and loss.
(i) Leases
Determining whether an arrangement contains leaseAt inception of an arrangement, the Company determines whether the arrangement is or contains a lease. The arrangement is, or contains, a lease if fulfilment of the arrangement is dependent on the use of a specific asset or assets and the arrangement conveys a right to use the asset or assets, even if that right is not explicitly specified in an arrangement.
At inception or on reassessment of an arrangement that contains lease, the Company separates payments and other consideration required by the arrangement into those for the lease and those for other elements on the basis of their relative fair values. If the Company concludes for a finance lease that it is impracticable to separate the payments reliably, then an asset and a liability are recognised at an amount equal to the fair value of the underlying asset; subsequently the liability is reduced as payments are made and an imputed finance cost on the liability is recognised using the Company’s incremental borrowing rate.
Company as a lesseeA lease is classified at the inception date as a finance lease or an operating lease. A lease that transfers substantially all the risks and rewards incidental to ownership to the Company is classified as a finance lease.
Finance leases are capitalised at the commencement of the lease at the inception date fair value of the leased property or, if lower, at the present value of the minimum lease payments. Lease payments are apportioned between finance charges and reduction of the lease liability so as to achieve a constant rate of interest on the remaining balance of the liability. Finance charges are recognised in finance costs in the statement of profit and loss, unless they are directly attributable to qualifying assets, in which case they are capitalized in accordance with the Company’s general policy on the borrowing costs. Contingent rentals are recognised as expenses in the periods in which they are incurred.
A leased asset is depreciated over the useful life of the asset. However, if there is no reasonable certainty that the Company will obtain ownership by the end of the lease term, the asset is depreciated over the shorter of the estimated useful life of the asset and the lease term
Operating lease payments are recognised as an expense in the statement of profit and loss on a straight-line basis over the lease term unless the payments are structured to increase in line with general inflation to compensate for the lessor’s expected inflationary cost increase.
Company as a lessorLeases in which the Company does not transfer substantially all the risks and rewards of ownership of an asset are classified as operating leases. Rental income from operating lease is recognised on a straight-line basis over the term of the relevant lease unless the payments are structured to increase in line with the general inflation to compensate for the lessor’s expected inflationary cost increase. Initial direct costs incurred in negotiating and arranging an operating lease are added to the carrying amount of the leased asset and recognised over the lease term on the same basis as rental income. Contingent rents are recognised as revenue in the period in which they are earned.
Leases are classified as finance leases when substantially all of the risks and rewards of ownership is transferred from the Company to the lessee. Amounts due from lessees under finance leases are recorded as receivables at the Company’s net investment in the leases. Finance lease income is allocated to accounting periods so as to reflect a constant periodic rate of return on the net investment outstanding in respect of the lease.
(j) InventoriesInventories including work-in-progress are stated at the lower of cost and net realisable value. Cost is determined on the following basis:• purchased copper concentrate is recorded at cost on a first-in, first-out (“”FIFO””) basis; all other materials including stores and spares
are valued on a weighted average basis except in Oil and Gas business where stores and spares are valued on FIFO basis;• finished products are valued at raw material cost plus costs of conversion, comprising labor costs and an attributable proportion of
manufacturing overheads based on normal levels of activity and are moved out of inventory on a FIFO basis, however, cost of finished goods of oil and condesate is determined on a quarterly weighted average basis; and
• By-products and scrap are valued at net realisable value.
Net realisable value is determined based on estimated selling price, less further costs expected to be incurred to completion and disposal.
(k) Government GrantGrants and subsidies from the government are recognised when there is reasonable assurance that (i) the Company will comply with the conditions attached to them, and (ii) the grant/subsidy will be received.
When the grant or subsidy relates to revenue, it is recognised as income on a systematic basis in the statement of profit and loss over the periods necessary to match them with the related costs, which they are intended to compensate.
Where the grant relates to an asset, it is recognised as deferred income and released to income in equal amounts over the expected useful life of the related asset and presented within other income.
When the Company receives grants of non-monetary assets, the asset and the grant are recorded at fair value amounts and released to profit or loss over the expected useful life in a pattern of consumption of the benefit of the underlying asset.
Notes forming part of the Financial Statementsas at and for the year ended March 31, 2018
207Integrated R
eport
Managem
ent Review
Statutory R
eports
Financial Statements
Vedanta Limited Integrated Report and Annual Accounts 2017-18
When loans or similar assistance are provided by governments or related institutions, with an interest rate below the current applicable market rate, the effect of this favorable interest is regarded as a government grant. The loan or assistance is initially recognised and measured at fair value and the government grant is measured as the difference between the initial carrying value of the loan and the proceeds received. The loan is subsequently measured as per the accounting policy applicable to financial liabilities.
(l) TaxationTax expense represents the sum of current tax and deferred tax.
Current tax is provided at amounts expected to be paid (or recovered) using the tax rates and laws that have been enacted or substantively enacted by the reporting date and includes any adjustment to tax payable in respect of previous years.
Subject to exceptions below, deferred tax is provided, using the balance sheet method, on all deductible temporary differences at the reporting date between the tax bases of assets and liabilities and their carrying amounts for financial reporting purposes, on carry forward of unused tax credits and unused tax loss;• deferred income tax is not recognised on the initial recognition of an asset or liability in a transaction that is not a business combination
and, at the time of the transaction, affects neither the accounting profit nor taxable profit or loss; and• deferred tax assets (including MAT credit entitlement) are recognised only to the extent that it is more likely than not that they will be
recovered.
Deferred tax assets and liabilities are measured at the tax rates that are expected to apply to the year when the asset is realized or the liability is settled, based on tax rates (and tax laws) that have been enacted or substantively enacted at the reporting date. Tax relating to items recognized outside profit or loss is recognised outside the statement of profit and loss (either in other comprehensive income or equity).
The carrying amount of deferred tax assets (including MAT credit entitlement) is reviewed at each reporting date and is adjusted to the extent that it is no longer probable that sufficient taxable profit will be available to allow all or part of the asset to be recovered.
Deferred tax assets and liabilities are offset when they relate to income taxes levied by the same taxation authority and the Company intends to settle its current tax assets and liabilities on a net basis.
(m) Retirement benefits schemes The Company operates or participates in a number of defined benefits and defined contribution schemes, the assets of which (where funded) are held in separately administered funds. For defined benefit schemes, the cost of providing benefits under the plans is determined by actuarial valuation separately for each plan using the projected unit credit method by third party qualified actuaries.
Remeasurements including, effects of asset ceiling and return on plan asets (excluding amounts included in interest on the net defined benefit liability) and actuarial gains and losses arising in the year are recognised in full in other comprehensive income and are not recycled to the statement of profit and loss.
Past service costs are recognised in profit or loss on the earlier of: - the date of the plan amendment or curtailment, and - the date that the Company recognises related restructuring costs
Net interest is calculated by applying a discount rate to the net defined benefit liability or asset at the beginning of the period. Defined benefit costs are split into current service cost, past service cost, net interest expense or income and remeasurement and gains and losses on curtailments and settlements. Current service cost and past service cost is recognised within cost of sales, administrative expenses and distribution expenses. Net interest expense or income is recognized with finance costs.
For defined contribution schemes, the amount charged to the statement of profit and loss in respect of pension costs and other post retirement benefits is the contributions payable in the year, recognised as and when the employee renders related services.
(n) Share-based paymentsCertain employees (including executive directors) of the Company receive part of their remuneration in the form of share-based payment transactions, whereby employees render services in exchange for shares or rights over shares (‘equity-settled transactions’).
The cost of equity-settled transactions with employees is measured at fair value of share awards at the date at which they are granted. The fair value of share award is determined with the assistance of an external valuer and the fair value at the grant date is expensed on a proportionate basis over the vesting period based on the Company’s estimate of shares that will eventually vest. The estimate of the number of awards likely to vest is reviewed at each balance sheet date up to the vesting date at which point the estimate is adjusted to reflect the current expectations. Amounts recharged to subsidiaries in respect of awards granted to employees of subsidiaries are recognised as inter-company debtors until repaid.
The resultant increase in equity is recorded in share based payment reserve.
In case of cash-settled transactions, a liability is recognised for the fair value of cash-settled transactions. The fair value is measured initially and at each reporting date up to and including the settlement date, with changes in fair value recognised in employee benefits expense. The fair value is expensed over the period until the vesting date with recognition of a corresponding liability. The fair value is determined with the assistance of an external valuer.
Additionally, VRPLC offers certain share based incentives under the Long-Term Incentive Plan (“LTIP”) to employees and directors of the Company. VRPLC recovers the proportionate cost (calculated based on the grant date fair value of the options granted) from the Company, which is charged to the statement of profit and loss.
Notes forming part of the Financial Statementsas at and for the year ended March 31, 2018
208 Vedanta Limited Integrated Report and Annual Accounts 2017-18
(o) Provisions, contingent liabilities and contingent assetsProvisions represent liabilities for which the amount or timing is uncertain. Provisions are recognized when the Company has a present obligation (legal or constructive), as a result of past events, and it is probable that an outflow of resources, that can be reliably estimated, will be required to settle such an obligation.
If the effect of the time value of money is material, provisions are determined by discounting the expected future cash flows to net present value using an appropriate pre-tax discount rate that reflects current market assessments of the time value of money and, where appropriate, the risks specific to the liability. Unwinding of the discount is recognized in the statement of profit and loss as a finance cost. Provisions are reviewed at each reporting date and are adjusted to reflect the current best estimate.
A contingent liability is a possible obligation that arises from past events whose existence will be confirmed by the occurrence or non-occurrence of one or more uncertain future events beyond the control of the Company or a present obligation that is not recognised because it is not probable that an outflow of resources will be required to settle the obligation. A contingent liability also arises in extremely rare cases where there is a liability that cannot be recognised because it cannot be measured reliably. The Company does not recognize a contingent liability but discloses its existence in the financial statements.
Contingent assets are not recognised but disclosed in the financial statements when an inflow of economic benefits is probable.
(p) Restoration, rehabilitation and environmental costsAn obligation to incur restoration, rehabilitation and environmental costs arises when environmental disturbance is caused by the development or ongoing production of a mine or oil fields. Such costs, discounted to net present value, are provided for and a corresponding amount is capitalised at the start of each project, as soon as the obligation to incur such costs arises. These costs are charged to the statement of profit and loss over the life of the operation through the depreciation of the asset and the unwinding of the discount on the provision. The cost estimates are reviewed periodically and are adjusted to reflect known developments which may have an impact on the cost estimates or life of operations. The cost of the related asset is adjusted for changes in the provision due to factors such as updated cost estimates, changes to lives of operations, new disturbance and revisions to discount rates. The adjusted cost of the asset is depreciated prospectively over the lives of the assets to which they relate. The unwinding of the discount is shown as finance cost in the statement of profit and loss.
Costs for the restoration of subsequent site damage, which is caused on an ongoing basis during production, are charged to the statement of profit and loss as extraction progresses. Where the costs of site restoration are not anticipated to be material, they are expensed as incurred.
(q) Accounting for foreign currency transactionsThe functional currency of the Company is determined as the currency of the primary economic environment in which it operates. For all principal businesses of the company, the functional currency is Indian rupee (`) with an exception of oil and gas business which has a US dollar functional currency as that is the currency of the primary economic environment in which it operates. The financial statements are presented in Indian rupee (`). All financial information presented in Indian Rupees has been rounded to the nearest Crore.
All exchange differences are included in the statement of profit and loss except those on monetary item designated as an effective hedging instrument of the currency risk of designated forecasted sales or purchases, which are recognized in the other comprehensive income.
The exchange differences on foreign currency borrowings relating to asset under construction, and for future productive use, are included in the cost of those assets when they are regarded as an adjustment to interest costs on those foreign currency borrowings.
The statement of profit and loss of oil and gas business is translated into Indian Rupees (INR) at the average rates of exchange during the year / exchange rates prevailing as on the date of the transaction. The Balance Sheet is translated at the exchange rate as at the reporting date. Exchange difference arising on translation is recognised in other comprehensive income and would be recycled to the statement of profit and loss as and when these operations are disposed off.
The Company had applied paragraph 46A of AS 11 under Indian GAAP. Ind AS 101 gives an option, which has been exercised by the Company, whereby a first time adopter can continue its Indian GAAP policy for accounting for exchange differences arising from translation of long-term foreign currency monetary items recognised in the Indian GAAP financial statements for the period ending immediately before the beginning of the first Ind AS financial reporting period. Hence, foreign exchange gain/loss on long-term foreign currency monetary items recognized upto March 31, 2016 has been deferred/capitalized. Such exchange differences arising on translation/settlement of long-term foreign currency monetary items and pertaining to the acquisition of a depreciable asset are amortised over the remaining useful lives of the assets.
From accounting periods commencing on or after April 01, 2016, exchange differences arising on translation/ settlement of long-term foreign currency monetary items, acquired post April 01, 2016, pertaining to the acquisition of a depreciable asset are charged to the statement of profit and loss.
(r) Earnings per shareThe Company presents basic and diluted earnings per share (“EPS”) data for its equity shares. Basic EPS is calculated by dividing the profit or loss attributable to equity shareholders of the Company by the weighted average number of equity shares outstanding during the year. Diluted EPS is determined by adjusting the profit or loss attributable to equity shareholders and the weighted average number of equity shares outstanding for the effects of all dilutive potential equity shares.
(s) Buyers’ CreditThe Company enters into arrangements whereby financial institutions make direct payments to suppliers for raw materials and project materials. The financial institutions are subsequently repaid by the Company at a later date providing working capital timing benefits. These are normally settled up to twelve months (for raw materials) and up to 36 months (for project materials). Where these arrangements are for
Notes forming part of the Financial Statementsas at and for the year ended March 31, 2018
209Integrated R
eport
Managem
ent Review
Statutory R
eports
Financial Statements
Vedanta Limited Integrated Report and Annual Accounts 2017-18
raw materials with a maturity of up to twelve months, the economic substance of the transaction is determined to be operating in nature and these are recognised as operational buyers’ credit (under Trade and other payables). Where these arrangements are for project materials with a maturity up to thirty six months, the economic substance of the transaction is determined to be financing in nature, and these are classified as projects buyers’ credit within borrowings in the balance sheet.
(t) Current and non-current classificationThe Company presents assets and liabilities in the balance sheet based on current / non-current classification.
An asset is classified as current when it satisfies any of the following criteria:- it is expected to be realized in, or is intended for sale or consumption in, the Company’s normal operating cycle.- it is held primarily for the purpose of being traded;- it is expected to be realized within 12 months after the reporting date; or- it is cash or cash equivalent unless it is restricted from being exchanged or used to settle a liability for at least 12 months after the
reporting date.
All other assets are classified as non-current.
A liability is classified as current when it satisfies any of the following criteria:- it is expected to be settled in the Company’s normal operating cycle;- it is held primarily for the purpose of being traded;- it is due to be settled within 12 months after the reporting date; or- the Company does not have an unconditional right to defer settlement of the liability for at least 12 months after the reporting date.
Terms of a liability that could, at the option of the counterparty, result in its settlement by the issue of equity instruments do not affect its classification.
All other liabilities are classified as non-current.Deferred tax assets and liabilities are classified as non current only.
(u) Borrowing costsBorrowing cost includes interest expense as per Effective Interest Rate (EIR) and exchange differences arising from foreign currency borrowings to the extent they are regarded as an adjustment to the interest cost.
Borrowing costs directly relating to the acquisition, construction or production of a qualifying capital project under construction are capitalised and added to the project cost during construction until such time that the assets are substantially ready for their intended use i.e. when they are capable of commercial production. Where funds are borrowed specifically to finance a qualifying capital project, the amount capitalised represents the actual borrowing costs incurred. Where surplus funds are available out of money borrowed specifically to finance a project, the income generated from such short-term investments is deducted from the total capitalized borrowing cost. Where the funds used to finance a project form part of general borrowings, the amount capitalised is calculated using a weighted average of rates applicable to relevant general borrowings of the Company during the year.
All other borrowing costs are recognised in the statement of profit and loss in the year in which they are incurred.
Capitalisation of interest on borrowings related to construction or development projects is ceased when substantially all activities that are necessary to make the assest ready for their intended use are complete or when delay occurs outside of the normal course of business.
EIR is the rate that exactly discounts the estimated future cash payments or receipts over the expected life of the financial liability or a shorter period, where appropriate, to the amortised cost of a financial liability. When calculating the effective interest rate, the Company estimates the expected cash flows by considering all the contractual terms of the financial instrument (for example, prepayment, extension, call and similar options).
(v) Cash and cash equivalentsCash and cash equivalents comprise cash at bank and on hand and short-term money market deposits which have a maturity of three months or less from the date of acquisition, that are readily convertible to known amounts of cash and which are subject to an insignificant risk of changes in value.
For the purpose of the statement of cash flows, cash and cash equivalents consist of cash and short-term deposits, as defined above, and additionally includes unpaid dividend account.
(w) Equity investment in subsidiaries, associates and joint venturesInvestments representing equity interest in subsidiaries, associates and joint ventures are carried at cost. A subsidiary is an entity that is controlled by the Company. Control is evidenced where the Company has the power over the investee or exposed, or has rights, to variable returns from its involvement with the investee and has the ability to affect those returns through its power over the investee. Power is demonstrated through existing rights that give the ability to direct relevant activities, which significantly affect the entity returns. An associate is an entity over which the Company is in a position to exercise significant influence over operating and financial policies.
Joint ArrangementsA Joint arrangement is an arrangement of which two or more parties have joint control. Joint control is considered when there is contractually agreed sharing of control of an arrangement, which exists only when decisions about the relevant activities require the unanimous consent of the parties sharing control. Investments in joint arrangements are classified as either joint operations or joint venture. The classification depends on the contractual rights and obligations of each investor, rather than the legal structure of the joint arrangement. A joint operation is a joint arrangement whereby the parties that have joint control of the arrangement have rights to the assets, and obligations for the liabilities, relating to the arrangement. A joint venture is a joint arrangement whereby the parties that have joint control of the arrangement have rights to the net assets of the arrangement.
Notes forming part of the Financial Statementsas at and for the year ended March 31, 2018
210 Vedanta Limited Integrated Report and Annual Accounts 2017-18
Joint OperationsThe Company has joint operations within its Oil and gas segment and participates in several unincorporated joint operations which involve the joint control of assets used in oil and gas exploration and producing activities. The Company accounts for its share of assets and income and expenditure of joint Operations in which it holds an interest. Liabilities in unincorporated joint ventures, where the Company is the Operator, is accounted for at gross values (including share of other partners) with a corresponding receivable from the venture partners. These have been included in the financial statements under the appropriate headings. (Details of joint operations are set out in note 44).
(x) Common Control transactionsA business combination involving entities or businesses under common control is a business combination in which all of the combining entities or businesses are ultimately controlled by the same party or parties both before and after the business combination and the control is not transitory. The transactions between entities under common control are specifically covered by Ind AS 103. Such transactions are accounted for using the pooling-of-interest method. The assets and liabilities of the acquired entity are recognised at their carrying amounts recorded in the parent entity’s consolidated financial statements with the exception of certain income tax and deferred tax assets. No adjustments are made to reflect fair values, or recognise any new assets or liabilities. The only adjustments that are made are to harmonise accounting policies. The components of equity of the acquired companies are added to the same components within the Company’s equity. The difference, if any, between the amounts recorded as share capital issued plus any additional consideration in the form of cash or other assets and the amount of share capital of the transferor is transferred to capital reserve. The Company’s shares issued in consideration for the acquired companies are recognized from the moment the acquired companies are included in these financial statements and the financial statements of the commonly controlled entities are combined, retrospectively, as if the transaction had occurred at the beginning of the earliest reporting period presented. However, the prior year comparative information is only adjusted for periods during which entities were under common control.
(y) Significant accounting estimates and judgementsThe preparation of the financial statements in conformity with Ind AS requires management to make judgements, estimates and assumptions that affect the application of accounting policies and the reported amounts of assets, liabilities, income, expenses and disclosures of contingent assets and liabilities at the date of these financial statements and the reported amounts of revenues and expenses for the years presented. Actual results may differ from these estimates under different assumptions and conditions.
Estimates and underlying assumptions are reviewed on an ongoing basis. Revisions to accounting estimates are recognised in the period in which the estimate is revised and future periods affected.
In particular, information about significant areas of estimation uncertainty and critical judgments in applying accounting policies that have the most significant effect on the amounts recognized in the financial statements are as given below:
1 Significant Estimates(i) Oil & Gas reservesSignificant technical and commercial judgements are required to determine the Company’s estimated oil and natural gas reserves. Reserves considered for computing depletion are proved reserves for acquisition costs and proved and developed reserves for successful exploratory wells, development wells, processing facilities, distribution assets, estimated future abandonment cost and all other related costs. Reserves for this purpose are considered on working interest basis which are reassessed atleast annually. Details of such reserves are given in note 43.
Changes in reserves as a result of change in management assumptions could impact the depreciation rates and the carrying value of assets.
(ii) Carrying value of exploration and evaluation assetsThe recoverability of a project is assessed under Ind AS 106. Exploration assets are assessed by comparing the carrying value to higher of fair value less cost of disposal or value in use if impairment indicators exists. Change to the valuation of exploration assets is an area of judgement. Further details on the Company’s accounting policies on this are set out in accounting policy above. The amounts for exploration and evaluation assets represent active exploration projects. These amounts will be written off to the statement of profit and loss as exploration costs unless commercial reserves are established or the determination process is not completed and there are no indications of impairment. The outcome of ongoing exploration, and therefore whether the carrying value of exploration and evaluation assets will ultimately be recovered, is inherently uncertain. Details of impairment charge/reversal impact and the assumptions used are disclosed in note 34 and carrying values of exploration and evaluation assets in note 5.
(iii) Carrying value of developing/producing oil and gas assetsManagement performs impairment tests on the Company’s developing/producing oil and gas assets where indicators of impairment are identified in accordance with Ind AS 36.
Notes forming part of the Financial Statementsas at and for the year ended March 31, 2018
211Integrated R
eport
Managem
ent Review
Statutory R
eports
Financial Statements
Vedanta Limited Integrated Report and Annual Accounts 2017-18
The impairment assessments are based on a range of estimates and assumptions, including:Estimates/assumptions Basis
Future production proved and probable reserves, resource estimates and, in certain cases, expansion projects
Commodity prices management’s best estimate benchmarked with external sources of information, to ensure they are within the range of available analyst forecast
Discount to price management’s best estimate based on historical prevailing discount
Extension of PSC assumed that PSC for Rajasthan block would be extended till 2030 on the expected commercial terms as per the announced government policy
Discount rates cost of capital risk-adjusted for the risk specific to the asset/ CGU
Any subsequent changes to cash flows due to changes in the above mentioned factors could impact the carrying value of the assets.
Details of carrying values and impairment charge/reversal and the assumptions and sensitivities used are disclosed in note 5 and 34 respectively.
(iv) Mining properties and leasesThe carrying value of mining property and leases is arrived at by depreciating the assets over the life of the mine using the unit of production method based on proved and probable reserves. The estimate of reserves is subject to assumptions relating to life of the mine and may change when new information becomes available. Changes in reserves as a result of factors such as production cost, recovery rates, grade of reserves or commodity prices could thus impact the carrying values of mining properties and leases and environmental and restoration provisions.
Management performs impairment tests when there is an indication of impairment. The impairment assessments are based on a range of estimates and assumptions, including:
Estimates/assumptions Basis
Future production proved and probable reserves, resource estimates (with an appropriate conversion factor) considering the expected permitted mining volumes and, in certain cases, expansion projects
Commodity prices management’s best estimate benchmarked with external sources of information, to ensure they are within the range of available analyst forecast
Exchange rates management best estimate benchmarked with external sources of information
Discount rates cost of capital risk-adjusted for the risk specific to the asset/ CGU
Details of carrying values and impairment charge/reversal and the assumptions used are disclosed in note 5 and 34.
(v) Assessment of impairment at Lanjigarh Refinery During financial year 2015-16, the Company has received the necessary approvals for expansion of the Lanjigarh refinery to 4 million tonnes per annum (MTPA). Accordingly, second stream operations were commenced in Alumina refinery from April 2016 and the refinery was debottlenecked to nameplate capacity of 2 MTPA in this year. We continue to explore the feasibility of expanding our alumina refinery capacity, from 2 to 4 million and then up to 6 million tonnes per annum, subject to bauxite availability and regulatory approvals.
The State of Odisha has abundant bauxite resources and given the initiatives by the Government of Odisha, management is confident that bauxite will be made available in the short to medium term. The Company has entered into agreements with various suppliers internationally and domestically to ensure the availability of bauxite to run its refinery.
Recoverability value assessment during the previous year ended March 31, 2017 including sensitivity analysis on the key assumptions indicated recoverable value exceeds the carrying value. No negative developments have occurred since the previous year and accordingly, it is not expected that the carrying amount would exceed the recoverable amount and hence the recoverable value for the year ended March 31, 2018 was not re-determined.
The carrying amounts of property plant and equipment related to alumina refinery operations at Lanjigarh and related mining assets as at March 31, 2018 is ` 8,326 Crore and March 31, 2017 is ` 8,690 Crore.
(vi) Assessment of Impairment of Goa iron ore mines: Pursuant to an order passed by the Hon’ble Supreme Court of India on February 07, 2018, the second renewal of the mining leases granted by the State of Goa in 2014-15 to all miners including Vedanta were cancelled. Consequentially all mining operations stopped with effect from March 16, 2018 until fresh mining leases (not fresh renewals or other renewals) and fresh environmental clearances are granted in accordance with the provisions of The Mines and Minerals (Development and Regulation) (MMDR) Act. Significant uncertainty exists over the resumption of mining at Goa under the current leases. The Company has assessed the recoverable value of all its assets and liabilities associated with existing mining leases which led to a non-cash impairment charge during the year.
Details of impairment charge and method of estimating recoverable value are disclosed in note 34.(vii) Restoration, rehabilitation and environmental costs:Provision is made for costs associated with restoration and rehabilitation of mining sites as soon as the obligation to incur such costs arises. Such restoration and closure costs are typical of extractive industries and they are normally incurred at the end of the life of the mine or oil fields. The costs are estimated on the basis of mine closure plans and the estimated discounted costs of dismantling and removing these facilities and the costs of restoration are capitalised as soon as the obligation to incur such costs arises.
Notes forming part of the Financial Statementsas at and for the year ended March 31, 2018
212 Vedanta Limited Integrated Report and Annual Accounts 2017-18
The provision for decommissioning oil and gas assets is based on the current estimates of the costs for removing and decommissioning production facilities, the forecast timing of settlement of decommissioning liabilities and the appropriate discount rate. A corresponding provision is created on the liability side. The capitalised asset is charged to the statement of profit and loss over the life of the asset through depreciation over the life of the operation and the provision is increased each period via unwinding the discount on the provision. Management estimates are based on local legislation and/or other agreements. The actual costs and cash outflows may differ from estimates because of changes in laws and regulations, changes in prices, analysis of site conditions and changes in restoration technology. Details of such provisions are set out in note 21 and 27.
(viii) Provisions and liabilitiesProvisions and liabilities are recognised in the period when it becomes probable that there will be a future outflow of funds resulting from past operations or events that can be reasonably estimated. The timing of recognition requires the application of judgement to existing facts and circumstances which may be subject to change especially when taken in the context of the legal environment in India. The actual cash outflows may take place over many years in the future and hence the carrying amounts of provisions and liabilities are regularly reviewed and adjusted to take into account the changing circumstances and other factors that influence the provisions and liabilities. This is set out in note 21 and 27.
(ix) The HZL and BALCO call optionsThe Company had exercised its call option to acquire the remaining 49% interest in BALCO and 29.5% interest in HZL. The Government of India has however, contested the validity of the options and disputed their valuation performed in terms of the relevant agreements the details of which are set out in note 6. In view of the lack of resolution on the options, the non-response to the exercise and valuation request from the Government of India, the resultant uncertainty surrounding the potential transaction and the valuation of the consideration payable, the Company considers the strike price of the options to be at fair value. Accordingly, the value of the option would be nil, and hence, the call options have not been recognized in the financial statements.
(x) Recoverability of deferred tax and other income tax assetsThe Company has carry forward tax losses, unabsorbed depreciation and MAT credit that are available for offset against future taxable profit. Deferred tax assets are recognised only to the extent that it is probable that taxable profit will be available against which the unused tax losses or tax credits can be utilized. This involves an assessment of when those assets are likely to reverse, and a judgement as to whether or not there will be sufficient taxable profits available to offset the assets. This requires assumptions regarding future profitability, which is inherently uncertain. To the extent assumptions regarding future profitability change, there can be an increase or decrease in the amounts recognised in respect of deferred tax assets and consequential impact in the statement of profit and loss.
Additionally, the Company has tax receivables on account of refund arising on account of past amalgamation and relating to various tax disputes. The recoverability of these receivables involve application of judgement as to the ultimate outcome of the tax assessment and litigations. This pertains to the application of the legislation, which in certain cases is based upon management’s interpretation of country specific tax law, in particular India, and the likelihood of settlement. Management uses in-house and external legal professionals to make informed decision.
The details of MAT assets (recognized and unrecognized) are set out in note 35.
(xi) Operations of Copper Business The renewal of consent to operate (CTO) under the Air and Water Acts for copper smelter in India was rejected by the State Pollution Control Board on April 09, 2018 for want of further clarifications and consequently, the operations have presently been suspended. The company has filed an appeal in the Tribunal. Even though there can be no assurance regarding the final outcome of the process, as per the company’s assessment, it is in compliance with the applicable regulations and expects the renewal of CTO in next few months.
The carrying value of assets as at March 31, 2018 is ` 2,131 Crore.
2 Significant Judgementa) Revenue recognition and receivable recovery in relation to the power business In certain cases, the Company’s power customers are disputing various contractual provisions of Power Purchase Agreements (PPA). Significant judgement is required in both assessing the tariff to be charged under the PPA in accordance with Ind AS 18 and to assess the recoverability of withheld revenue currently accounted for as receivables.
In assessing this critical judgment, management considered favourable external legal opinions the Company has obtained in relation to such claims. In addition the fact that the contracts are with government owned companies implies the credit risk is low (Refer note 11 (iv))
b) ContingenciesIn the normal course of business, contingent liabilities may arise from litigation, taxation and other claims against the Company. A tax provision is recognised when the Company has a present obligation as a result of a past event, it is probable that the Company will be required to settle that obligation.
Where it is management’s assessment that the outcome cannot be reliably quantified or is uncertain, the claims are disclosed as contingent liabilities unless the likelihood of an adverse outcome is remote. Such liabilities are disclosed in the notes but are not provided for in the financial statements.
When considering the classification of a legal or tax cases as probable, possible or remote, there is judgement involved. This pertains to the application of the legislation, which in certain cases is based upon management’s interpretation of country specific applicable law, in particular India, and the likelihood of settlement. Management uses in-house and external legal professionals to make informed decision.
Notes forming part of the Financial Statementsas at and for the year ended March 31, 2018
213Integrated R
eport
Managem
ent Review
Statutory R
eports
Financial Statements
Vedanta Limited Integrated Report and Annual Accounts 2017-18
Although there can be no assurance regarding the final outcome of the legal proceedings, the Company does not expect them to have a materially adverse impact on the Company’s financial position or profitability. The liabilities which are assessed as possible and hence are not recognised in these financial statements are disclosed in note 49.
c) Exceptional items:Exceptional items are those items that management considers, by virtue of their size or incidence (including but not limited to impairment charges and acquisition and restructuring related costs), should be disclosed separately to ensure that the financial information allows an understanding of the underlying performance of the business in the year, so as to facilitate comparison with prior periods. Also tax charges related to exceptional items and certain one-time tax effects are considered Exceptional. Such items are material by nature or amount to the year’s result and require separate disclosure in accordance with Ind AS.
The determination as to which items should be disclosed separately requires a degree of judgement. These are set out in note 34.
(z) Recently issued accounting pronouncements The following standards/amendment to standards have been issued but are not yet effective up to the date of issuance of the Company’s financial statements. Except specifically disclosed below, the Company is evaluating the requirements of these standards, improvements and amendments and has not yet determined the impact on the financial statements.
• Ind AS 115: Revenue from Contracts with Customers This standard outlines a single comprehensive model for entities to use in accounting for revenue arising from contracts with customers.
The standard replaces most of the current revenue recognition guidance. The core principle of the new standard is for companies to recognize revenue to depict the transfer of goods or services to customers in amounts that reflect the consideration to which the company expects to be entitled in exchange for those goods or services. The new standard also will result in enhanced disclosures about revenue, provide guidance for transactions that were not previously addressed comprehensively including service revenues and contract modifications and improve guidance for multiple element arrangements. The new Standard comes into effect for the annual reporting periods beginning on or after April 1, 2018.
In order to identify the potential impact of the standard on the Company’s financial statements, the Company has analyzed contracts of the relevant revenue streams of the Company. The work done is focused on evaluating the contractual arrangements across the Company’s principal revenue streams, particularly key terms and conditions which may impact revenue recognition and measurement of revenue.
Based on the work carried out, the area’s of impact in implementing Ind AS 115, on the Company results is detailed below.
The Company has products which are provisionally priced at the date revenue is recognised. Revenue in respect of such contracts will be recognised when control passes to the customer and will be measured at the amount the entity expects to be entitled – being the estimate of the price expected to be received at the end of the measurement period. Post transfer of control of goods, provisional pricing features will be accounted in accordance with Ind AS 109 “Financial Instruments” rather than Ind AS 115 and therefore the Ind AS 115 rules on variable consideration do not apply. These ‘provisional pricing’ adjustments i.e. the consideration received post transfer of control will continue to be included in the revenue on the face of the statement of profit and loss, and these would be disclosed by way of note to the financial statements.
On the basis of the analysis conducted, the new standard would result in identification of freight and insurance services as a separate performance obligation implying segregation of revenue on account of sale of goods and sale of services. The revenue on account of these services is required to be deferred and recognised over time as this obligation is fulfilled.
The overall effect of implementation of Ind AS 115 is not material on the recognition and measurement of revenues, though there would be significant additional disclosure requirements for the Company to comply with.
The Company will adopt the modified transitional approach to implementation where any transitional adjustment is recognised in retained earnings at April 01, 2018 without adjustment of comparatives and the new standard will only be applied to contracts that remain in force at that date.
• Other recently issued accounting pronouncements and not effective for the year ended March 31, 2018:
Standards not yet effective for the financial statements for the year ended March 31, 2018 Effective for annual periods beginning on or after
Amendments to Ind AS 12: Recognition of Deferred Tax Assets for Unrealised Losses April 01, 2018Amendment to Ind AS 21: Foreign Currency Transactions and Advance Consideration April 01, 2018Amendment to Ind AS 40: Investment Property April 01, 2018Amendment to Ind AS 28: Investments in Associates and Joint Ventures April 01, 2018Amendment to Ind AS 112: Disclosure of Interests in Other Entities April 01, 2018
Notes forming part of the Financial Statementsas at and for the year ended March 31, 2018
214 Vedanta Limited Integrated Report and Annual Accounts 2017-18
4 Merger of Cairn India Limited with Vedanta Limited(i) Vedanta Limited and Cairn India Limited (Cairn), had initially announced a scheme of merger between the two companies on June 14,
2015, terms whereof were amended on July 22, 2016 (“Scheme”). As per the terms of the Scheme, Cairn India Limited was to merge into Vedanta Limited and upon the merger becoming effective:
a) Non-controlling shareholders of Cairn India Limited were to receive one equity share in Vedanta Limited of face value ` 1 each and four 7.5% Redeemable Preference Shares (redeemable after 18 months from issuance) in Vedanta Limited with a face value of ` 10 each for each equity share held in Cairn India Limited.
b) No shares were to be issued to Vedanta Limited or any of its subsidiaries for their shareholding in Cairn India Limited. c) The employees of Cairn India Limited who were holding stock options in Cairn India Limited were to be compensated either in cash
or through issuance of stock options of Vedanta Limited.
d) The authorised share capital of Cairn India Limited aggregating to ` 2,250 Crore was to be assumed by the Company, resulting in an increase in its authorised share capital from ` 5,162 Crore (divided into 5,127 Crore equity shares of ` 1 each and 3.50 Crore preference shares of ` 10 each) to ` 7,412 Crore (divided into 4,402 Crore equity shares of ` 1 each and 301 Crore preference shares of ` 10 each).
All substantive approvals for effecting the merger of Cairn India Limited with Vedanta Limited were received by March 27, 2017 and therefore the same was accounted for in the previous financial year ended March 31, 2017. The Board of Directors of both the companies made the merger operative on April 11, 2017, whereafter Cairn India Limited ceased to exist.
(ii) Since the amalgamating entity, Cairn India Limited, was a subsidiary of the Company and both have in turn been controlled by a
common parent Vedanta Resources Plc, the transaction has been accounted for in accordance with the Appendix C to Ind AS 103 “Common Control Business Combination”, which requires retroactive accounting of the merger from the date common control was established. Accordingly, financial information as on April 1, 2015, being the earliest period presented in the annual standalone financial statements of the Company, and all periods thereafter, were restated to give effect of the merger.
(iii) The accounting effects arising out of merger are explained below:
a) Equity shares aggregating to ` 75 Crore required to be issued to the non-controlling shareholders of Cairn, has been accounted for as an item of equity on April 1, 2015, as equity shares proposed to be issued.
b) Upon the merger being substantively completed in March 2017, the liability towards issuance of preference shares of ` 3,010 Crore has been accounted for as a financial liability.
c) The carrying value of the assets, liabilities and reserves of Cairn India Limited as appearing in the consolidated financial statements of the Company have been recognised in the standalone financial statements of the Company. The said values relating to Cairn India Limited in the consolidated financial statements of the Company prior to the merger, were computed by restating past business combinations as permitted by Ind AS 101.
d) Sesa Resources Limited (‘SRL’), a wholly owned subsidiary of the Company, held investments in Cairn having a fair value of ` 956 Crore, which have been cancelled without any consideration. Accordingly, the said fair value, has been reduced from the carrying value of investments in SRL with a corresponding reduction in the value of Reserves and Surplus. As per the provisions of the Scheme necessary adjustment in the Reserves and Surplus has been carried through the Securities premium account.
e) Twin Star Mauritius Holdings Limited (‘TMHL’), an indirect wholly owned subsidiary, also held investments in Cairn and had corresponding liabilities which it had incurred to fund the purchase of investments in Cairn. As per the terms of the Scheme, the investments held by TMHL have been cancelled and accordingly, its liabilities have been reflected in the financial statements of the Company.
The net effects of ` 28,906 Crore arising out of the above adjustments have been recognised as a capital reserve on December 8, 2011, being the date of initial common control.
(iv) All changes to the liabilities arising on account of interest and exchange differences post December 8, 2011, of ` 11,311 Crore, have been recognised directly in retained earnings as of April 1, 2015 and net charge of ` 623 Crore in the statement of profit and loss as an “Exceptional item” for the financial year ended March 31, 2017.
(v) All the direct subsidiaries of Cairn India Limited, viz., Cairn India Holdings Limited (‘CIHL’) and CIG Mauritius Holding Private Limited have become the direct subsidiaries of the Company.
(vi) Further, some of the wholly owned subsidiaries of the Company had advanced monies to TMHL, either directly or through some other wholly owned subsidiaries. Pursuant to the merger being effective, the amounts recoverable from TMHL have been impaired by the said subsidiaries as TMHL’s investments in Cairn has been cancelled. This has had the effect of discharging the obligation reflected in the financial statements of the Company (refer ‘(iii)e’ above) with a corresponding reduction in the value of the Company’s investments in its direct subsidiaries. The net excess of liability being discharged over the carrying value of such investments of ` 1,993 Crore has been recognised as an exceptional gain in the statement of profit and loss during the previous year. During the current year, CIHL discharged the balance obligation ` 6,762 Crore which resulted in a further reduction in the carrying value of the said subsidiary by an equivalent amount.
Notes forming part of the Financial Statementsas at and for the year ended March 31, 2018
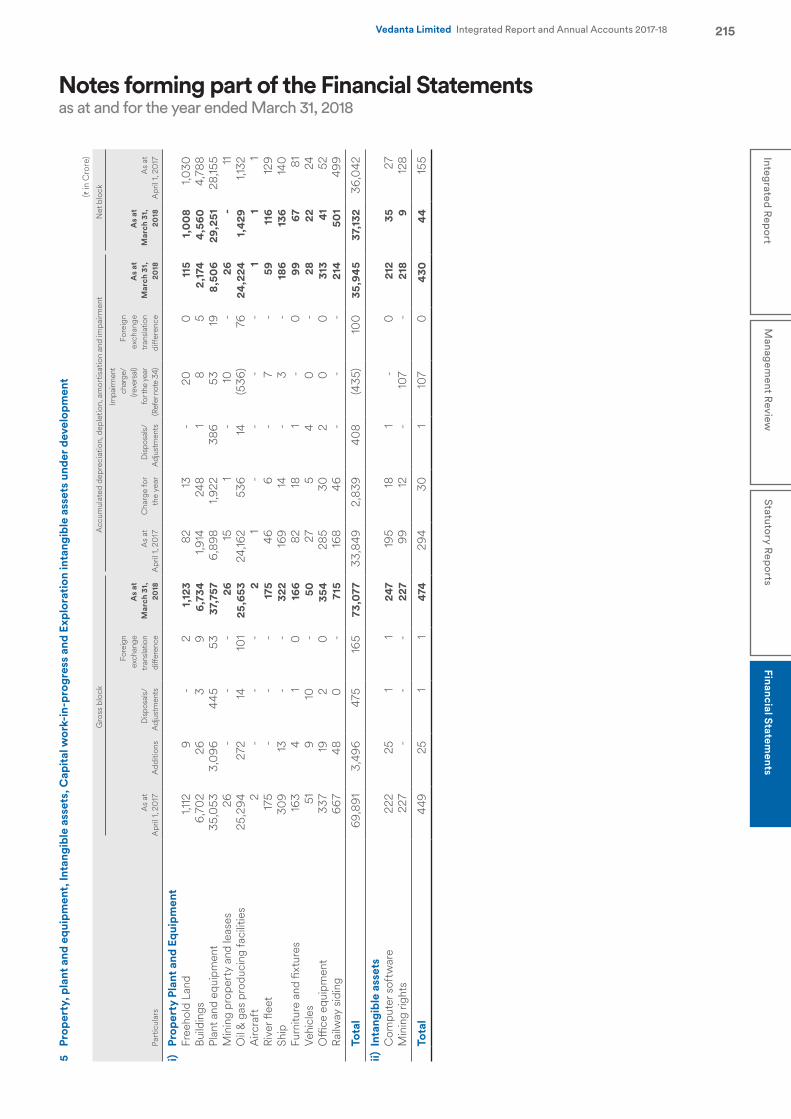
215Integrated R
eport
Managem
ent Review
Statutory R
eports
Financial Statements
Vedanta Limited Integrated Report and Annual Accounts 2017-18
5 Pr
oper
ty, p
lant
and
equ
ipm
ent,
Inta
ngib
le a
sset
s, C
apit
al w
ork-
in-p
rogr
ess
and
Expl
orat
ion
inta
ngib
le a
sset
s un
der d
evel
opm
ent
(` in
Cro
re)
Gro
ss b
lock
Acc
umul
ated
dep
reci
atio
n, d
eple
tion,
am
ortis
atio
n an
d im
pairm
ent
Net
blo
ck
Part
icul
ars
As
at
Apr
il 1,
2017
Add
ition
sD
ispos
als/
A
djus
tmen
ts
Fore
ign
exch
ange
tr
ansl
atio
n di
ffere
nce
As
at
Mar
ch 3
1,
2018
As
at
Apr
il 1,
2017
Cha
rge
for
the
year
Disp
osal
s/
Adj
ustm
ents
Impa
irmen
t ch
arge
/ (re
vers
al)
for t
he y
ear
(Ref
er n
ote
34)
Fore
ign
exch
ange
tr
ansl
atio
n di
ffere
nce
As
at
Mar
ch 3
1,
2018
As
at
Mar
ch 3
1,
2018
As
at
Apr
il 1,
2017
i)Pr
oper
ty P
lant
and
Equ
ipm
ent
Free
hold
Lan
d 1,
112
9
-
2
1,1
23
82
13
-
20
0
115
1,0
08
1,0
30
Build
ings
6,7
02
26
3
9
6,7
34
1,91
4 2
48
1 8
5
2
,174
4
,560
4
,788
Pl
ant a
nd e
quip
men
t 3
5,0
53
3,0
96
445
5
3 3
7,75
7 6
,898
1,
922
386
5
3 19
8
,50
6 2
9,25
1 2
8,15
5 M
inin
g pr
oper
ty a
nd le
ases
26
-
-
-
26
15
1 -
10
-
2
6 -
11
O
il &
gas
pro
duci
ng fa
cilit
ies
25,
294
272
14
10
1 2
5,65
3 2
4,16
2 5
36
14
(536
) 7
6 2
4,22
4 1
,429
1,
132
Airc
raft
2
-
-
-
2
1 -
-
-
-
1
1
1
Rive
r flee
t 17
5 -
-
-
1
75
46
6
-
7
-
59
116
129
Ship
30
9 13
-
-
3
22
169
14
-
3
-
186
1
36
140
Fu
rnitu
re a
nd fi
xtur
es 16
3 4
1
0 1
66
82
18
1 -
0
99
67
81
Vehi
cles
51
9
10
-
50
27
5
4
0 -
2
8 2
2 2
4 O
ffice
equ
ipm
ent
337
19
2
0
354
2
85
30
2
0
0 3
13
41
52
Railw
ay s
idin
g 6
67
48
0 -
7
15
168
46
-
-
-
214
5
01
499
Tota
l 6
9,89
1 3
,496
4
75
165
73,
077
33,
849
2,8
39
40
8 (4
35)
100
3
5,94
5 3
7,13
2 3
6,0
42
ii)In
tang
ible
ass
ets
Com
pute
r sof
twar
e 2
22
25
1 1
247
19
5 18
1
-
0 2
12
35
27
Min
ing
right
s 2
27
-
-
-
227
9
9 12
-
10
7 -
2
18
9
128
Tota
l 4
49
25
1 1
474
2
94
30
1
107
0 4
30
44
155
Notes forming part of the Financial Statementsas at and for the year ended March 31, 2018
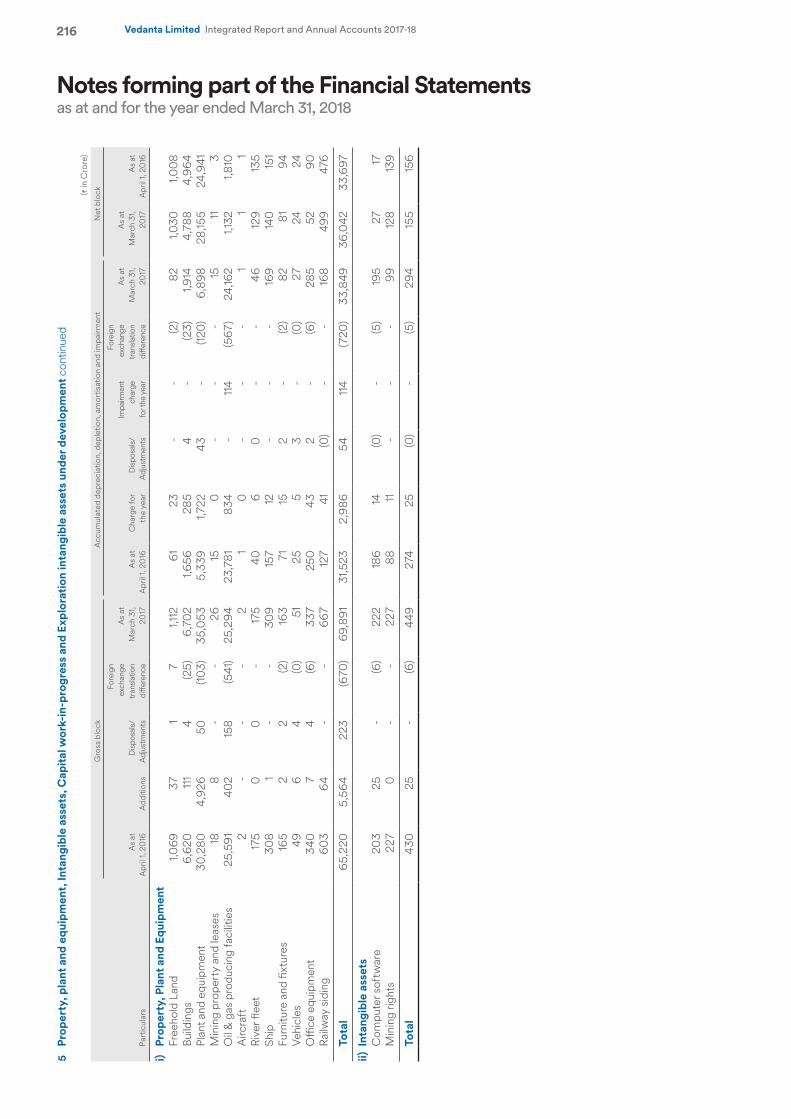
216 Vedanta Limited Integrated Report and Annual Accounts 2017-18
5 Pr
oper
ty, p
lant
and
equ
ipm
ent,
Inta
ngib
le a
sset
s, C
apit
al w
ork-
in-p
rogr
ess
and
Expl
orat
ion
inta
ngib
le a
sset
s un
der d
evel
opm
ent c
ontin
ued
(` in
Cro
re)
Gro
ss b
lock
Acc
umul
ated
dep
reci
atio
n, d
eple
tion,
am
ortis
atio
n an
d im
pairm
ent
Net
blo
ck
Part
icul
ars
As
at
Apr
il 1,
2016
Add
ition
sD
ispos
als/
A
djus
tmen
ts
Fore
ign
exch
ange
tr
ansl
atio
n di
ffere
nce
As
at
Mar
ch 3
1, 20
17 A
s at
A
pril
1, 20
16
Cha
rge
for
the
year
Disp
osal
s/
Adj
ustm
ents
Impa
irmen
t ch
arge
fo
r the
yea
r
Fore
ign
exch
ange
tr
ansl
atio
n di
ffere
nce
As
at
Mar
ch 3
1, 20
17
As
at
Mar
ch 3
1, 20
17A
s at
A
pril
1, 20
16
i)Pr
oper
ty, P
lant
and
Equ
ipm
ent
Free
hold
Lan
d 1,
069
3
7 1
7
1,11
2 6
1 2
3 -
-
(2
) 8
2 1,
030
1,
00
8 Bu
ildin
gs 6
,620
11
1 4
(2
5) 6
,70
2 1,
656
2
85
4
-
(23)
1,91
4 4
,788
4
,96
4 Pl
ant a
nd e
quip
men
t 3
0,2
80
4,9
26
50
(1
03)
35,
053
5
,339
1,
722
43
-
(120
) 6
,898
2
8,15
5 2
4,94
1 M
inin
g pr
oper
ty a
nd le
ases
18
8
-
-
26
15
0 -
-
-
15
11
3
O
il &
gas
pro
duci
ng fa
cilit
ies
25,
591
40
2 15
8 (5
41)
25,
294
23,
781
834
-
11
4 (5
67)
24,
162
1,13
2 1,
810
A
ircra
ft 2
-
-
-
2
1
0 -
-
-
1
1 1
Rive
r flee
t 17
5 0
0 -
17
5 4
0
6
0 -
-
4
6 12
9 13
5 Sh
ip 3
08
1 -
-
3
09
157
12
-
-
-
169
140
15
1 Fu
rnitu
re a
nd fi
xtur
es 16
5 2
2
(2)
163
71
15
2
-
(2)
82
81
94
Vehi
cles
49
6
4
(0)
51
25
5
3
-
(0)
27
24
24
Offi
ce e
quip
men
t 3
40
7
4
(6)
337
2
50
43
2
-
(6)
285
5
2 9
0
Railw
ay s
idin
g 6
03
64
-
-
667
12
7 4
1 (0
) -
-
16
8 4
99
476
Tota
l 6
5,22
0
5,5
64
223
(6
70)
69,
891
31,5
23
2,9
86
54
114
(720
) 3
3,84
9 3
6,0
42
33,
697
ii)In
tang
ible
ass
ets
Com
pute
r sof
twar
e 2
03
25
-
(6)
222
18
6 14
(0
) -
(5
) 19
5 2
7 17
M
inin
g rig
hts
227
0
-
-
227
8
8 11
-
-
-
9
9 12
8 13
9
Tota
l 4
30
25
-
(6)
449
274
2
5 (0
) -
(5
) 2
94
155
156
Notes forming part of the Financial Statementsas at and for the year ended March 31, 2018
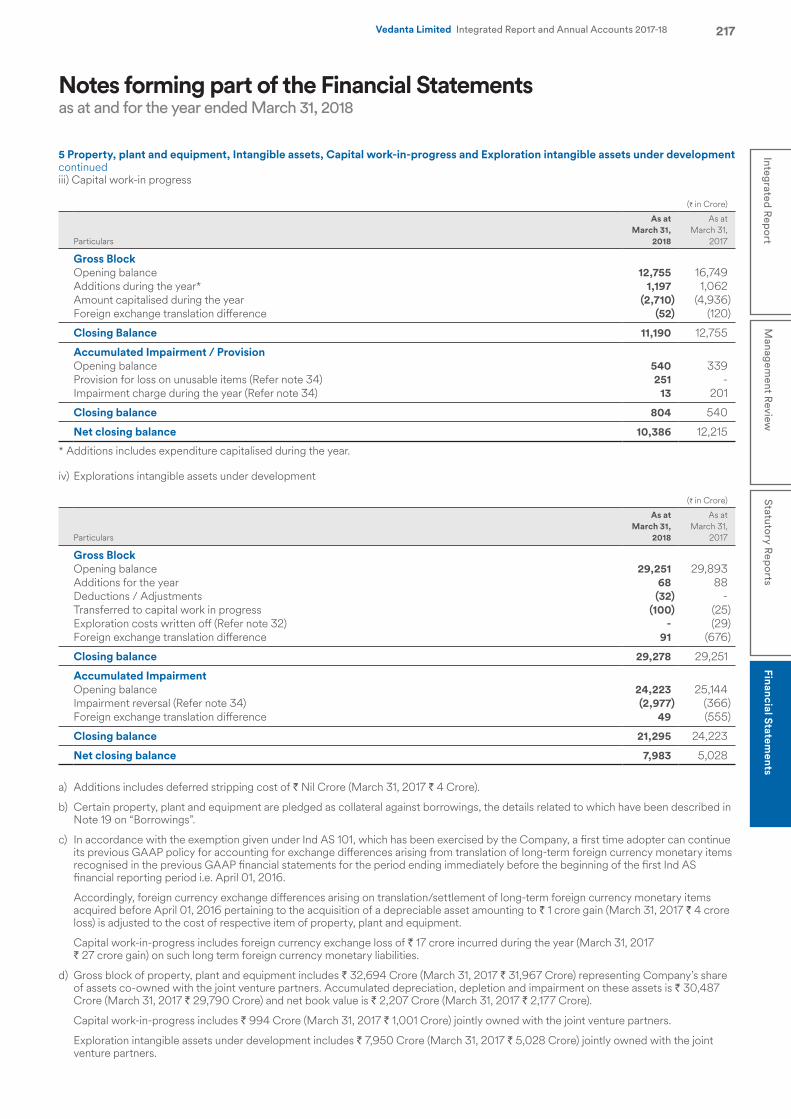
217Integrated R
eport
Managem
ent Review
Statutory R
eports
Financial Statements
Vedanta Limited Integrated Report and Annual Accounts 2017-18
5 Property, plant and equipment, Intangible assets, Capital work-in-progress and Exploration intangible assets under development continuediii) Capital work-in progress
(` in Crore)
Particulars
As at March 31,
2018
As at March 31,
2017
Gross BlockOpening balance 12,755 16,749 Additions during the year* 1,197 1,062 Amount capitalised during the year (2,710) (4,936)Foreign exchange translation difference (52) (120)
Closing Balance 11,190 12,755
Accumulated Impairment / ProvisionOpening balance 540 339 Provision for loss on unusable items (Refer note 34) 251 -Impairment charge during the year (Refer note 34) 13 201
Closing balance 804 540
Net closing balance 10,386 12,215
* Additions includes expenditure capitalised during the year.
iv) Explorations intangible assets under development
(` in Crore)
Particulars
As at March 31,
2018
As at March 31,
2017
Gross BlockOpening balance 29,251 29,893 Additions for the year 68 88 Deductions / Adjustments (32) -Transferred to capital work in progress (100) (25)Exploration costs written off (Refer note 32) - (29)Foreign exchange translation difference 91 (676)
Closing balance 29,278 29,251
Accumulated Impairment Opening balance 24,223 25,144 Impairment reversal (Refer note 34) (2,977) (366)Foreign exchange translation difference 49 (555)
Closing balance 21,295 24,223
Net closing balance 7,983 5,028
a) Additions includes deferred stripping cost of ` Nil Crore (March 31, 2017 ` 4 Crore).
b) Certain property, plant and equipment are pledged as collateral against borrowings, the details related to which have been described in Note 19 on “Borrowings”.
c) In accordance with the exemption given under Ind AS 101, which has been exercised by the Company, a first time adopter can continue its previous GAAP policy for accounting for exchange differences arising from translation of long-term foreign currency monetary items recognised in the previous GAAP financial statements for the period ending immediately before the beginning of the first Ind AS financial reporting period i.e. April 01, 2016.
Accordingly, foreign currency exchange differences arising on translation/settlement of long-term foreign currency monetary items acquired before April 01, 2016 pertaining to the acquisition of a depreciable asset amounting to ` 1 crore gain (March 31, 2017 ` 4 crore loss) is adjusted to the cost of respective item of property, plant and equipment.
Capital work-in-progress includes foreign currency exchange loss of ` 17 crore incurred during the year (March 31, 2017 ` 27 crore gain) on such long term foreign currency monetary liabilities.
d) Gross block of property, plant and equipment includes ` 32,694 Crore (March 31, 2017 ` 31,967 Crore) representing Company’s share of assets co-owned with the joint venture partners. Accumulated depreciation, depletion and impairment on these assets is ` 30,487 Crore (March 31, 2017 ` 29,790 Crore) and net book value is ` 2,207 Crore (March 31, 2017 ` 2,177 Crore).
Capital work-in-progress includes ` 994 Crore (March 31, 2017 ` 1,001 Crore) jointly owned with the joint venture partners.
Exploration intangible assets under development includes ` 7,950 Crore (March 31, 2017 ` 5,028 Crore) jointly owned with the joint venture partners.
Notes forming part of the Financial Statementsas at and for the year ended March 31, 2018
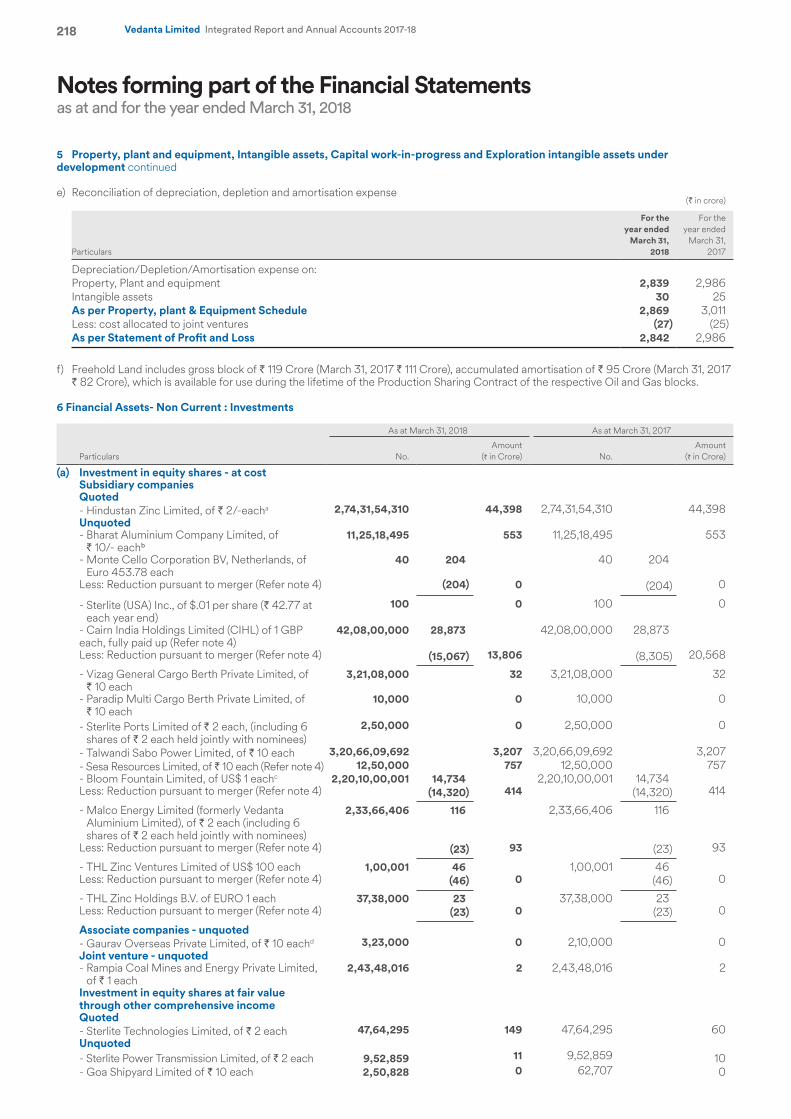
218 Vedanta Limited Integrated Report and Annual Accounts 2017-18
5 Property, plant and equipment, Intangible assets, Capital work-in-progress and Exploration intangible assets under development continued
e) Reconciliation of depreciation, depletion and amortisation expense(` in crore)
Particulars
For the year ended
March 31, 2018
For the year ended
March 31, 2017
Depreciation/Depletion/Amortisation expense on:Property, Plant and equipment 2,839 2,986 Intangible assets 30 25 As per Property, plant & Equipment Schedule 2,869 3,011 Less: cost allocated to joint ventures (27) (25)As per Statement of Profit and Loss 2,842 2,986
f) Freehold Land includes gross block of ` 119 Crore (March 31, 2017 ` 111 Crore), accumulated amortisation of ` 95 Crore (March 31, 2017 ` 82 Crore), which is available for use during the lifetime of the Production Sharing Contract of the respective Oil and Gas blocks.
6 Financial Assets- Non Current : Investments
Particulars
As at March 31, 2018 As at March 31, 2017
No. Amount
(` in Crore) No. Amount
(` in Crore)
(a) Investment in equity shares - at costSubsidiary companies Quoted- Hindustan Zinc Limited, of ` 2/-eacha 2,74,31,54,310 44,398 2,74,31,54,310 44,398 Unquoted- Bharat Aluminium Company Limited, of
` 10/- eachb11,25,18,495 553 11,25,18,495 553
- Monte Cello Corporation BV, Netherlands, of Euro 453.78 each
40 204 40 204
Less: Reduction pursuant to merger (Refer note 4) (204) 0 (204) 0
- Sterlite (USA) Inc., of $.01 per share (` 42.77 at each year end)
100 0 100 0
- Cairn India Holdings Limited (CIHL) of 1 GBP each, fully paid up (Refer note 4)
42,08,00,000 28,873 42,08,00,000 28,873
Less: Reduction pursuant to merger (Refer note 4) (15,067) 13,806 (8,305) 20,568
- Vizag General Cargo Berth Private Limited, of ` 10 each
3,21,08,000 32 3,21,08,000 32
- Paradip Multi Cargo Berth Private Limited, of ` 10 each
10,000 0 10,000 0
- Sterlite Ports Limited of ` 2 each, (including 6 shares of ` 2 each held jointly with nominees)
2,50,000 0 2,50,000 0
- Talwandi Sabo Power Limited, of ` 10 each 3,20,66,09,692 3,207 3,20,66,09,692 3,207 - Sesa Resources Limited, of ` 10 each (Refer note 4) 12,50,000 757 12,50,000 757 - Bloom Fountain Limited, of US$ 1 eachc 2,20,10,00,001 14,734 2,20,10,00,001 14,734 Less: Reduction pursuant to merger (Refer note 4) (14,320) 414 (14,320) 414
- Malco Energy Limited (formerly Vedanta Aluminium Limited), of ` 2 each (including 6 shares of ` 2 each held jointly with nominees)
2,33,66,406 116 2,33,66,406 116
Less: Reduction pursuant to merger (Refer note 4) (23) 93 (23) 93
- THL Zinc Ventures Limited of US$ 100 each 1,00,001 46 1,00,001 46 Less: Reduction pursuant to merger (Refer note 4) (46) 0 (46) 0
- THL Zinc Holdings B.V. of EURO 1 each 37,38,000 23 37,38,000 23 Less: Reduction pursuant to merger (Refer note 4) (23) 0 (23) 0
Associate companies - unquoted- Gaurav Overseas Private Limited, of ` 10 eachd 3,23,000 0 2,10,000 0 Joint venture - unquoted- Rampia Coal Mines and Energy Private Limited,
of ` 1 each 2,43,48,016 2 2,43,48,016 2
Investment in equity shares at fair value through other comprehensive incomeQuoted- Sterlite Technologies Limited, of ` 2 each 47,64,295 149 47,64,295 60 Unquoted- Sterlite Power Transmission Limited, of ` 2 each 9,52,859 11 9,52,859 10 - Goa Shipyard Limited of ` 10 each 2,50,828 0 62,707 0
Notes forming part of the Financial Statementsas at and for the year ended March 31, 2018
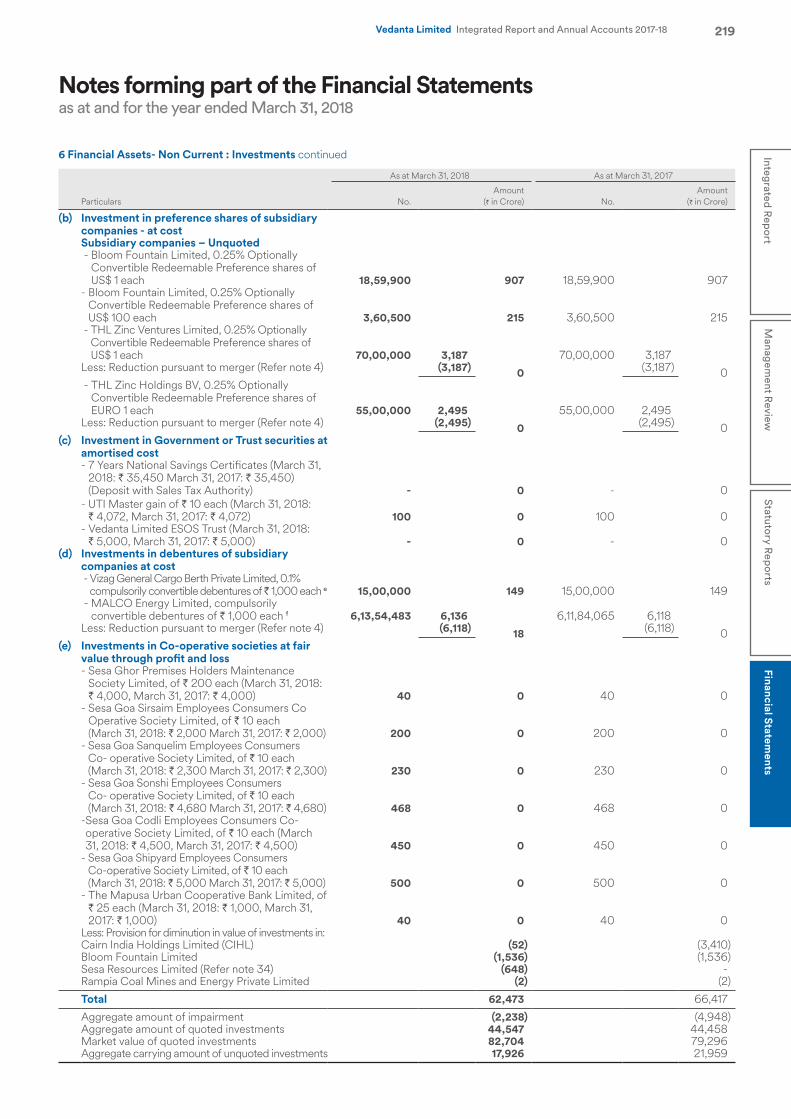
219Integrated R
eport
Managem
ent Review
Statutory R
eports
Financial Statements
Vedanta Limited Integrated Report and Annual Accounts 2017-18
Particulars
As at March 31, 2018 As at March 31, 2017
No. Amount
(` in Crore) No. Amount
(` in Crore)
(b) Investment in preference shares of subsidiary companies - at costSubsidiary companies – Unquoted - Bloom Fountain Limited, 0.25% Optionally
Convertible Redeemable Preference shares of US$ 1 each 18,59,900 907 18,59,900 907
- Bloom Fountain Limited, 0.25% Optionally Convertible Redeemable Preference shares of US$ 100 each 3,60,500 215 3,60,500 215
- THL Zinc Ventures Limited, 0.25% Optionally Convertible Redeemable Preference shares of US$ 1 each 70,00,000 3,187 70,00,000 3,187
Less: Reduction pursuant to merger (Refer note 4) (3,187) 0 (3,187) 0 - THL Zinc Holdings BV, 0.25% Optionally
Convertible Redeemable Preference shares of EURO 1 each 55,00,000 2,495 55,00,000 2,495
Less: Reduction pursuant to merger (Refer note 4) (2,495) 0 (2,495) 0 (c) Investment in Government or Trust securities at
amortised cost- 7 Years National Savings Certificates (March 31,
2018: ` 35,450 March 31, 2017: ` 35,450) (Deposit with Sales Tax Authority) - 0 - 0
- UTI Master gain of ` 10 each (March 31, 2018: ` 4,072, March 31, 2017: ` 4,072) 100 0 100 0
- Vedanta Limited ESOS Trust (March 31, 2018: ` 5,000, March 31, 2017: ` 5,000) - 0 - 0
(d) Investments in debentures of subsidiary companies at cost - Vizag General Cargo Berth Private Limited, 0.1%
compulsorily convertible debentures of ̀ 1,000 each e 15,00,000 149 15,00,000 149 - MALCO Energy Limited, compulsorily
convertible debentures of ` 1,000 each f 6,13,54,483 6,136 6,11,84,065 6,118 Less: Reduction pursuant to merger (Refer note 4) (6,118) 18 (6,118) 0
(e) Investments in Co-operative societies at fair value through profit and loss- Sesa Ghor Premises Holders Maintenance
Society Limited, of ` 200 each (March 31, 2018: ` 4,000, March 31, 2017: ` 4,000) 40 0 40 0
- Sesa Goa Sirsaim Employees Consumers Co Operative Society Limited, of ` 10 each (March 31, 2018: ` 2,000 March 31, 2017: ` 2,000) 200 0 200 0
- Sesa Goa Sanquelim Employees Consumers Co- operative Society Limited, of ` 10 each (March 31, 2018: ` 2,300 March 31, 2017: ` 2,300) 230 0 230 0
- Sesa Goa Sonshi Employees Consumers Co- operative Society Limited, of ` 10 each (March 31, 2018: ` 4,680 March 31, 2017: ` 4,680) 468 0 468 0
- Sesa Goa Codli Employees Consumers Co- operative Society Limited, of ` 10 each (March 31, 2018: ` 4,500, March 31, 2017: ` 4,500) 450 0 450 0
- Sesa Goa Shipyard Employees Consumers Co-operative Society Limited, of ` 10 each (March 31, 2018: ` 5,000 March 31, 2017: ` 5,000) 500 0 500 0
- The Mapusa Urban Cooperative Bank Limited, of ` 25 each (March 31, 2018: ` 1,000, March 31, 2017: ` 1,000) 40 0 40 0
Less: Provision for diminution in value of investments in:Cairn India Holdings Limited (CIHL) (52) (3,410)Bloom Fountain Limited (1,536) (1,536)Sesa Resources Limited (Refer note 34) (648) - Rampia Coal Mines and Energy Private Limited (2) (2)
Total 62,473 66,417
Aggregate amount of impairment (2,238) (4,948)Aggregate amount of quoted investments 44,547 44,458 Market value of quoted investments 82,704 79,296 Aggregate carrying amount of unquoted investments 17,926 21,959
6 Financial Assets- Non Current : Investments continued
Notes forming part of the Financial Statementsas at and for the year ended March 31, 2018
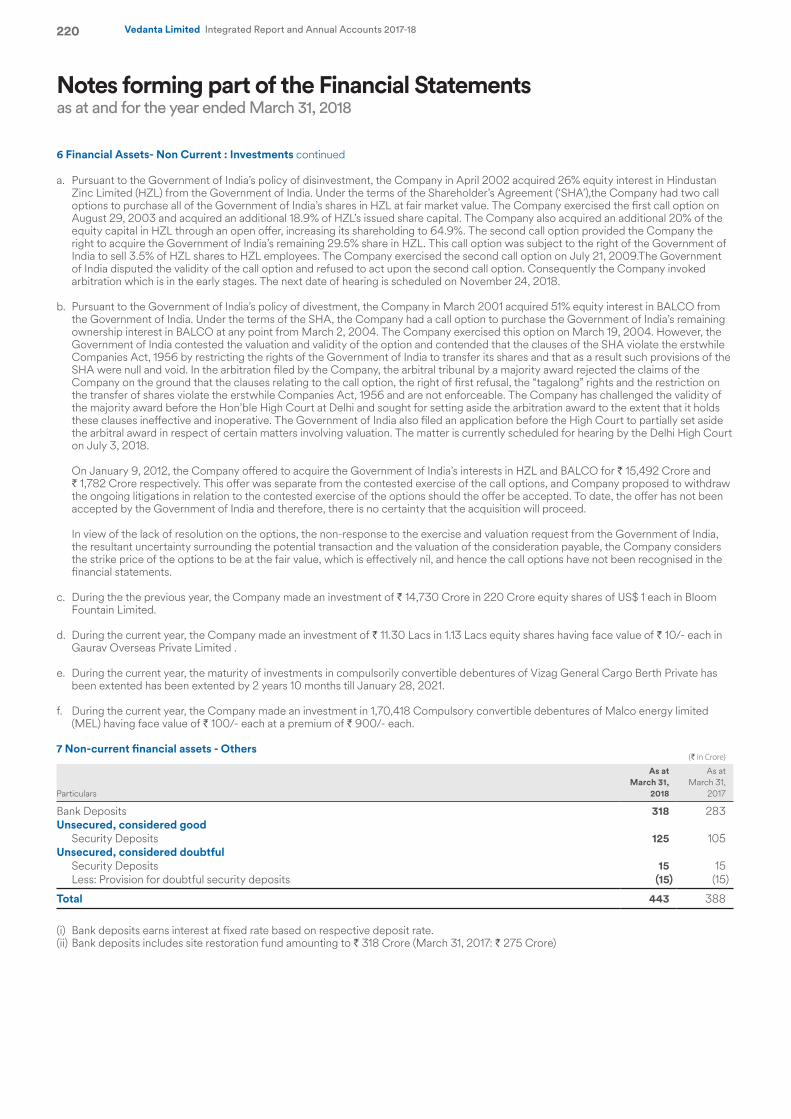
220 Vedanta Limited Integrated Report and Annual Accounts 2017-18
a. Pursuant to the Government of India’s policy of disinvestment, the Company in April 2002 acquired 26% equity interest in Hindustan Zinc Limited (HZL) from the Government of India. Under the terms of the Shareholder’s Agreement (‘SHA’),the Company had two call options to purchase all of the Government of India’s shares in HZL at fair market value. The Company exercised the first call option on August 29, 2003 and acquired an additional 18.9% of HZL’s issued share capital. The Company also acquired an additional 20% of the equity capital in HZL through an open offer, increasing its shareholding to 64.9%. The second call option provided the Company the right to acquire the Government of India’s remaining 29.5% share in HZL. This call option was subject to the right of the Government of India to sell 3.5% of HZL shares to HZL employees. The Company exercised the second call option on July 21, 2009.The Government of India disputed the validity of the call option and refused to act upon the second call option. Consequently the Company invoked arbitration which is in the early stages. The next date of hearing is scheduled on November 24, 2018.
b. Pursuant to the Government of India’s policy of divestment, the Company in March 2001 acquired 51% equity interest in BALCO from the Government of India. Under the terms of the SHA, the Company had a call option to purchase the Government of India’s remaining ownership interest in BALCO at any point from March 2, 2004. The Company exercised this option on March 19, 2004. However, the Government of India contested the valuation and validity of the option and contended that the clauses of the SHA violate the erstwhile Companies Act, 1956 by restricting the rights of the Government of India to transfer its shares and that as a result such provisions of the SHA were null and void. In the arbitration filed by the Company, the arbitral tribunal by a majority award rejected the claims of the Company on the ground that the clauses relating to the call option, the right of first refusal, the “tagalong” rights and the restriction on the transfer of shares violate the erstwhile Companies Act, 1956 and are not enforceable. The Company has challenged the validity of the majority award before the Hon’ble High Court at Delhi and sought for setting aside the arbitration award to the extent that it holds these clauses ineffective and inoperative. The Government of India also filed an application before the High Court to partially set aside the arbitral award in respect of certain matters involving valuation. The matter is currently scheduled for hearing by the Delhi High Court on July 3, 2018.
On January 9, 2012, the Company offered to acquire the Government of India’s interests in HZL and BALCO for ` 15,492 Crore and ` 1,782 Crore respectively. This offer was separate from the contested exercise of the call options, and Company proposed to withdraw the ongoing litigations in relation to the contested exercise of the options should the offer be accepted. To date, the offer has not been accepted by the Government of India and therefore, there is no certainty that the acquisition will proceed. In view of the lack of resolution on the options, the non-response to the exercise and valuation request from the Government of India, the resultant uncertainty surrounding the potential transaction and the valuation of the consideration payable, the Company considers the strike price of the options to be at the fair value, which is effectively nil, and hence the call options have not been recognised in the financial statements.
c. During the the previous year, the Company made an investment of ` 14,730 Crore in 220 Crore equity shares of US$ 1 each in Bloom
Fountain Limited.
d. During the current year, the Company made an investment of ` 11.30 Lacs in 1.13 Lacs equity shares having face value of ` 10/- each in Gaurav Overseas Private Limited .
e. During the current year, the maturity of investments in compulsorily convertible debentures of Vizag General Cargo Berth Private has been extented has been extented by 2 years 10 months till January 28, 2021.
f. During the current year, the Company made an investment in 1,70,418 Compulsory convertible debentures of Malco energy limited (MEL) having face value of ` 100/- each at a premium of ` 900/- each.
7 Non-current financial assets - Others (` in Crore)
Particulars
As at March 31,
2018
As at March 31,
2017
Bank Deposits 318 283 Unsecured, considered good
Security Deposits 125 105 Unsecured, considered doubtful
Security Deposits 15 15 Less: Provision for doubtful security deposits (15) (15)
Total 443 388
(i) Bank deposits earns interest at fixed rate based on respective deposit rate. (ii) Bank deposits includes site restoration fund amounting to ` 318 Crore (March 31, 2017: ` 275 Crore)
Notes forming part of the Financial Statementsas at and for the year ended March 31, 2018
6 Financial Assets- Non Current : Investments continued
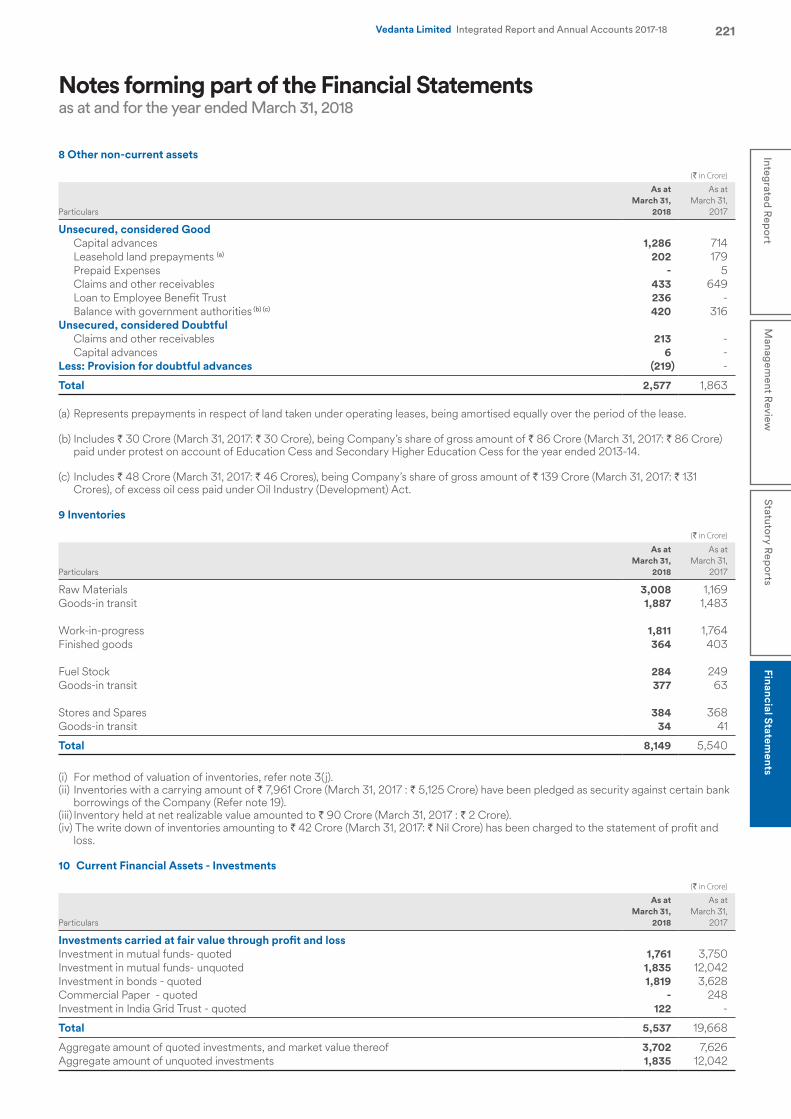
221Integrated R
eport
Managem
ent Review
Statutory R
eports
Financial Statements
Vedanta Limited Integrated Report and Annual Accounts 2017-18
8 Other non-current assets
(` in Crore)
Particulars
As at March 31,
2018
As at March 31,
2017
Unsecured, considered GoodCapital advances 1,286 714 Leasehold land prepayments (a) 202 179 Prepaid Expenses - 5 Claims and other receivables 433 649 Loan to Employee Benefit Trust 236 - Balance with government authorities (b) (c) 420 316
Unsecured, considered DoubtfulClaims and other receivables 213 - Capital advances 6 -
Less: Provision for doubtful advances (219) -
Total 2,577 1,863
(a) Represents prepayments in respect of land taken under operating leases, being amortised equally over the period of the lease.
(b) Includes ` 30 Crore (March 31, 2017: ` 30 Crore), being Company’s share of gross amount of ` 86 Crore (March 31, 2017: ` 86 Crore) paid under protest on account of Education Cess and Secondary Higher Education Cess for the year ended 2013-14.
(c) Includes ` 48 Crore (March 31, 2017: ` 46 Crores), being Company’s share of gross amount of ` 139 Crore (March 31, 2017: ` 131 Crores), of excess oil cess paid under Oil Industry (Development) Act.
9 Inventories
(` in Crore)
Particulars
As at March 31,
2018
As at March 31,
2017
Raw Materials 3,008 1,169 Goods-in transit 1,887 1,483
Work-in-progress 1,811 1,764 Finished goods 364 403
Fuel Stock 284 249 Goods-in transit 377 63
Stores and Spares 384 368 Goods-in transit 34 41
Total 8,149 5,540
(i) For method of valuation of inventories, refer note 3(j). (ii) Inventories with a carrying amount of ` 7,961 Crore (March 31, 2017 : ` 5,125 Crore) have been pledged as security against certain bank
borrowings of the Company (Refer note 19). (iii) Inventory held at net realizable value amounted to ` 90 Crore (March 31, 2017 : ` 2 Crore). (iv) The write down of inventories amounting to ` 42 Crore (March 31, 2017: ` Nil Crore) has been charged to the statement of profit and
loss.
10 Current Financial Assets - Investments
(` in Crore)
Particulars
As at March 31,
2018
As at March 31,
2017
Investments carried at fair value through profit and loss Investment in mutual funds- quoted 1,761 3,750 Investment in mutual funds- unquoted 1,835 12,042 Investment in bonds - quoted 1,819 3,628 Commercial Paper - quoted - 248 Investment in India Grid Trust - quoted 122 -
Total 5,537 19,668
Aggregate amount of quoted investments, and market value thereof 3,702 7,626 Aggregate amount of unquoted investments 1,835 12,042
Notes forming part of the Financial Statementsas at and for the year ended March 31, 2018
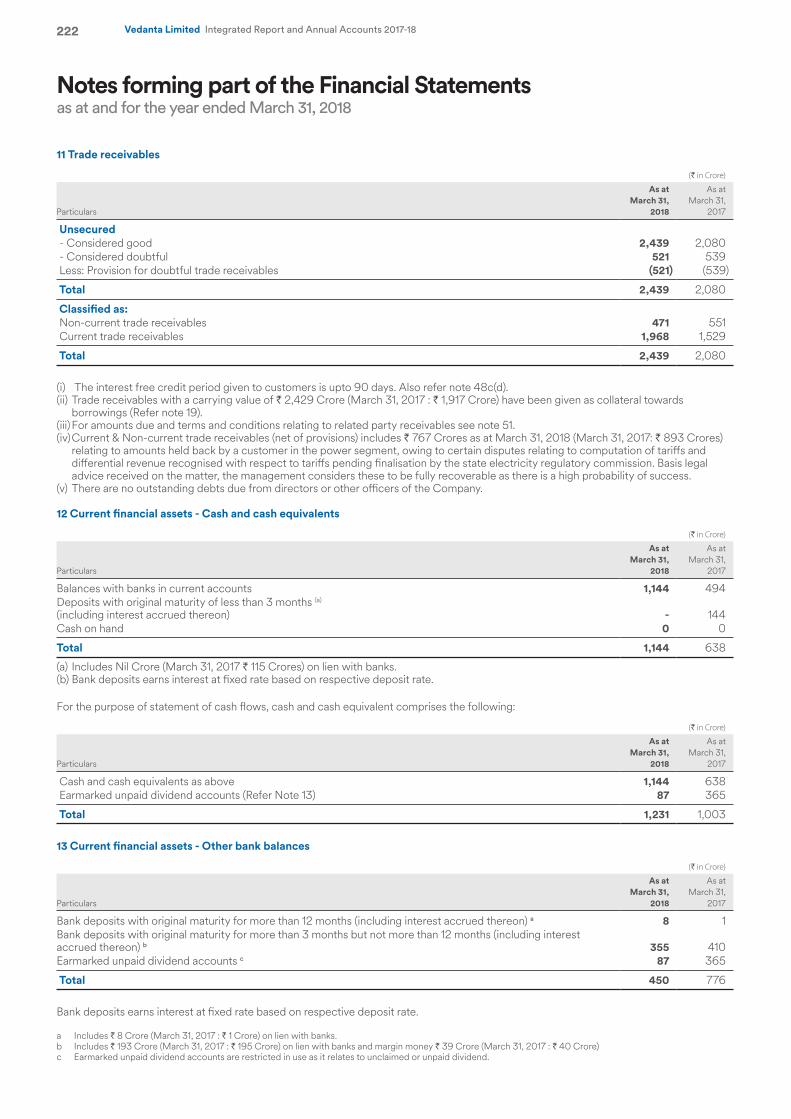
222 Vedanta Limited Integrated Report and Annual Accounts 2017-18
11 Trade receivables
(` in Crore)
Particulars
As at March 31,
2018
As at March 31,
2017
Unsecured - Considered good 2,439 2,080 - Considered doubtful 521 539 Less: Provision for doubtful trade receivables (521) (539)
Total 2,439 2,080
Classified as: Non-current trade receivables 471 551 Current trade receivables 1,968 1,529
Total 2,439 2,080
(i) The interest free credit period given to customers is upto 90 days. Also refer note 48c(d). (ii) Trade receivables with a carrying value of ` 2,429 Crore (March 31, 2017 : ` 1,917 Crore) have been given as collateral towards
borrowings (Refer note 19). (iii) For amounts due and terms and conditions relating to related party receivables see note 51. (iv) Current & Non-current trade receivables (net of provisions) includes ` 767 Crores as at March 31, 2018 (March 31, 2017: ` 893 Crores)
relating to amounts held back by a customer in the power segment, owing to certain disputes relating to computation of tariffs and differential revenue recognised with respect to tariffs pending finalisation by the state electricity regulatory commission. Basis legal advice received on the matter, the management considers these to be fully recoverable as there is a high probability of success.
(v) There are no outstanding debts due from directors or other officers of the Company. 12 Current financial assets - Cash and cash equivalents
(` in Crore)
Particulars
As at March 31,
2018
As at March 31,
2017
Balances with banks in current accounts 1,144 494 Deposits with original maturity of less than 3 months (a) (including interest accrued thereon) - 144 Cash on hand 0 0
Total 1,144 638
(a) Includes Nil Crore (March 31, 2017 ` 115 Crores) on lien with banks.(b) Bank deposits earns interest at fixed rate based on respective deposit rate.
For the purpose of statement of cash flows, cash and cash equivalent comprises the following:
(` in Crore)
Particulars
As at March 31,
2018
As at March 31,
2017
Cash and cash equivalents as above 1,144 638 Earmarked unpaid dividend accounts (Refer Note 13) 87 365
Total 1,231 1,003
13 Current financial assets - Other bank balances
(` in Crore)
Particulars
As at March 31,
2018
As at March 31,
2017
Bank deposits with original maturity for more than 12 months (including interest accrued thereon) a 8 1 Bank deposits with original maturity for more than 3 months but not more than 12 months (including interest accrued thereon) b 355 410 Earmarked unpaid dividend accounts c 87 365
Total 450 776
Bank deposits earns interest at fixed rate based on respective deposit rate. a Includes ` 8 Crore (March 31, 2017 : ` 1 Crore) on lien with banks. b Includes ` 193 Crore (March 31, 2017 : ` 195 Crore) on lien with banks and margin money ` 39 Crore (March 31, 2017 : ` 40 Crore) c Earmarked unpaid dividend accounts are restricted in use as it relates to unclaimed or unpaid dividend.
Notes forming part of the Financial Statementsas at and for the year ended March 31, 2018
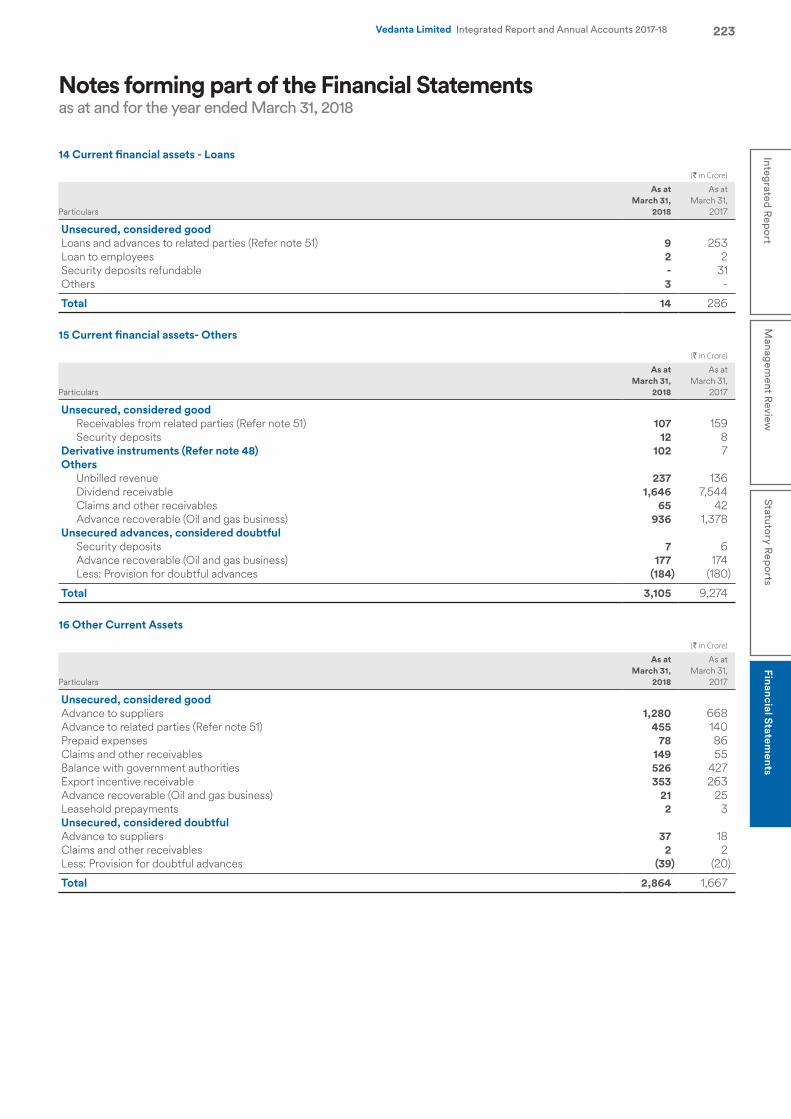
223Integrated R
eport
Managem
ent Review
Statutory R
eports
Financial Statements
Vedanta Limited Integrated Report and Annual Accounts 2017-18
14 Current financial assets - Loans
(` in Crore)
Particulars
As at March 31,
2018
As at March 31,
2017
Unsecured, considered good Loans and advances to related parties (Refer note 51) 9 253 Loan to employees 2 2 Security deposits refundable - 31 Others 3 -
Total 14 286
15 Current financial assets- Others
(` in Crore)
Particulars
As at March 31,
2018
As at March 31,
2017
Unsecured, considered good Receivables from related parties (Refer note 51) 107 159 Security deposits 12 8
Derivative instruments (Refer note 48) 102 7 Others
Unbilled revenue 237 136 Dividend receivable 1,646 7,544 Claims and other receivables 65 42 Advance recoverable (Oil and gas business) 936 1,378
Unsecured advances, considered doubtful Security deposits 7 6 Advance recoverable (Oil and gas business) 177 174 Less: Provision for doubtful advances (184) (180)
Total 3,105 9,274
16 Other Current Assets
(` in Crore)
Particulars
As at March 31,
2018
As at March 31,
2017
Unsecured, considered good Advance to suppliers 1,280 668 Advance to related parties (Refer note 51) 455 140 Prepaid expenses 78 86 Claims and other receivables 149 55 Balance with government authorities 526 427 Export incentive receivable 353 263 Advance recoverable (Oil and gas business) 21 25 Leasehold prepayments 2 3 Unsecured, considered doubtful Advance to suppliers 37 18 Claims and other receivables 2 2 Less: Provision for doubtful advances (39) (20)
Total 2,864 1,667
Notes forming part of the Financial Statementsas at and for the year ended March 31, 2018
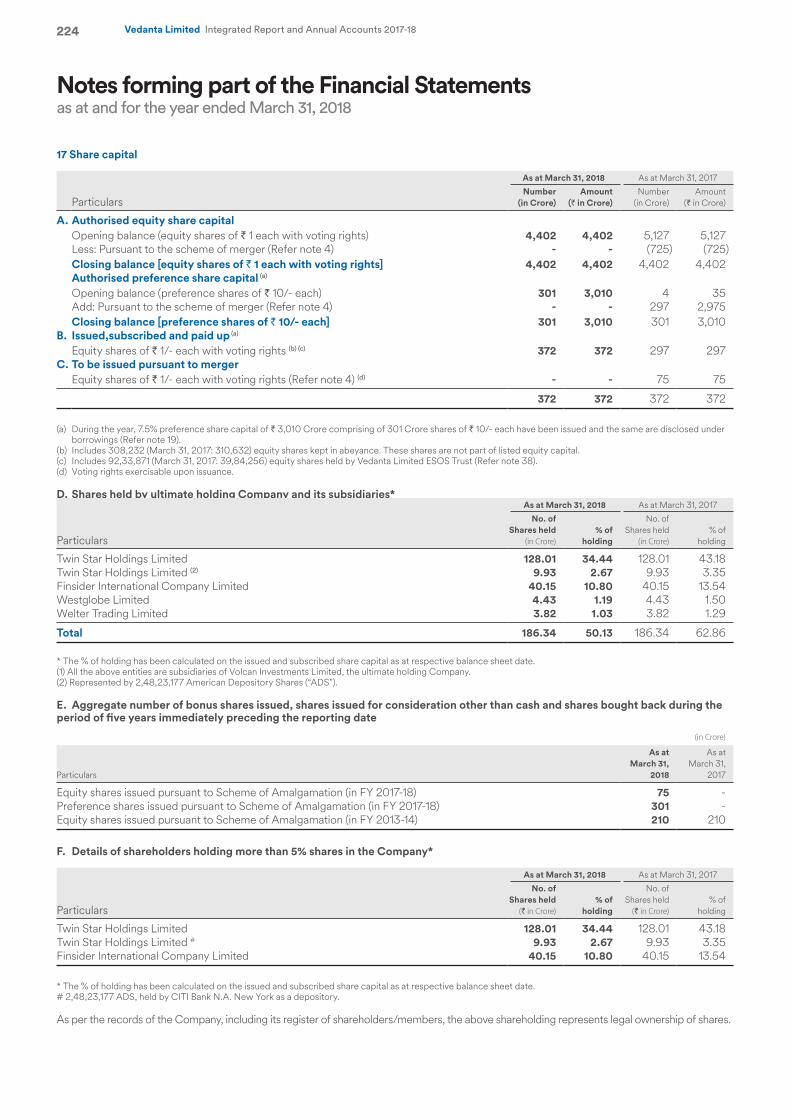
224 Vedanta Limited Integrated Report and Annual Accounts 2017-18
17 Share capital
Particulars
As at March 31, 2018 As at March 31, 2017
Number (in Crore)
Amount (` in Crore)
Number (in Crore)
Amount (` in Crore)
A. Authorised equity share capitalOpening balance (equity shares of ` 1 each with voting rights) 4,402 4,402 5,127 5,127 Less: Pursuant to the scheme of merger (Refer note 4) - - (725) (725)Closing balance [equity shares of ` 1 each with voting rights] 4,402 4,402 4,402 4,402 Authorised preference share capital (a)
Opening balance (preference shares of ` 10/- each) 301 3,010 4 35 Add: Pursuant to the scheme of merger (Refer note 4) - - 297 2,975 Closing balance [preference shares of ` 10/- each] 301 3,010 301 3,010
B. Issued,subscribed and paid up (a)
Equity shares of ` 1/- each with voting rights (b) (c) 372 372 297 297 C. To be issued pursuant to merger
Equity shares of ` 1/- each with voting rights (Refer note 4) (d) - - 75 75
372 372 372 372
(a) During the year, 7.5% preference share capital of ` 3,010 Crore comprising of 301 Crore shares of ` 10/- each have been issued and the same are disclosed under borrowings (Refer note 19).
(b) Includes 308,232 (March 31, 2017: 310,632) equity shares kept in abeyance. These shares are not part of listed equity capital.(c) Includes 92,33,871 (March 31, 2017: 39,84,256) equity shares held by Vedanta Limited ESOS Trust (Refer note 38). (d) Voting rights exercisable upon issuance.
D. Shares held by ultimate holding Company and its subsidiaries*
Particulars
As at March 31, 2018 As at March 31, 2017
No. of Shares held
(in Crore) % of
holding
No. of Shares held
(in Crore)% of
holding
Twin Star Holdings Limited 128.01 34.44 128.01 43.18 Twin Star Holdings Limited (2) 9.93 2.67 9.93 3.35 Finsider International Company Limited 40.15 10.80 40.15 13.54 Westglobe Limited 4.43 1.19 4.43 1.50 Welter Trading Limited 3.82 1.03 3.82 1.29
Total 186.34 50.13 186.34 62.86 * The % of holding has been calculated on the issued and subscribed share capital as at respective balance sheet date.(1) All the above entities are subsidiaries of Volcan Investments Limited, the ultimate holding Company.(2) Represented by 2,48,23,177 American Depository Shares (“ADS”).
E. Aggregate number of bonus shares issued, shares issued for consideration other than cash and shares bought back during the period of five years immediately preceding the reporting date
(in Crore)
Particulars
As at March 31,
2018
As at March 31,
2017
Equity shares issued pursuant to Scheme of Amalgamation (in FY 2017-18) 75 - Preference shares issued pursuant to Scheme of Amalgamation (in FY 2017-18) 301 - Equity shares issued pursuant to Scheme of Amalgamation (in FY 2013-14) 210 210
F. Details of shareholders holding more than 5% shares in the Company*
Particulars
As at March 31, 2018 As at March 31, 2017
No. of Shares held
(` in Crore) % of
holding
No. of Shares held
(` in Crore)% of
holding
Twin Star Holdings Limited 128.01 34.44 128.01 43.18 Twin Star Holdings Limited # 9.93 2.67 9.93 3.35 Finsider International Company Limited 40.15 10.80 40.15 13.54
* The % of holding has been calculated on the issued and subscribed share capital as at respective balance sheet date.# 2,48,23,177 ADS, held by CITI Bank N.A. New York as a depository.
As per the records of the Company, including its register of shareholders/members, the above shareholding represents legal ownership of shares.
Notes forming part of the Financial Statementsas at and for the year ended March 31, 2018
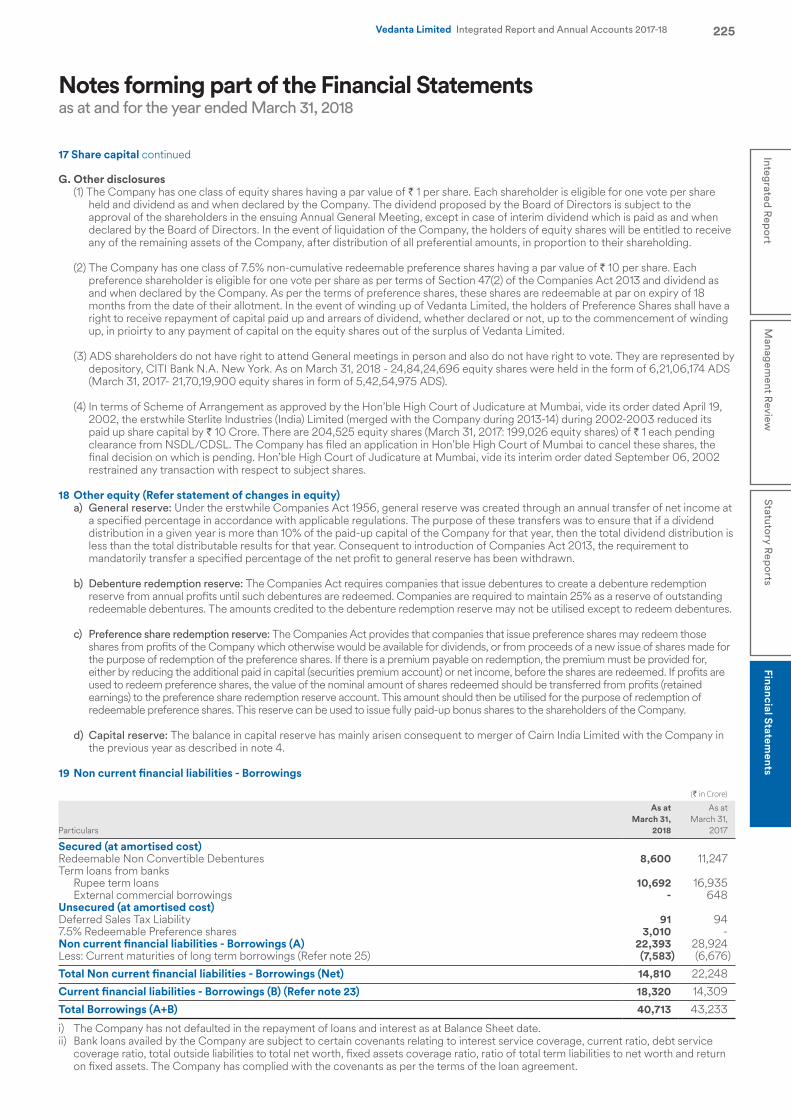
225Integrated R
eport
Managem
ent Review
Statutory R
eports
Financial Statements
Vedanta Limited Integrated Report and Annual Accounts 2017-18
G. Other disclosures (1) The Company has one class of equity shares having a par value of ` 1 per share. Each shareholder is eligible for one vote per share
held and dividend as and when declared by the Company. The dividend proposed by the Board of Directors is subject to the approval of the shareholders in the ensuing Annual General Meeting, except in case of interim dividend which is paid as and when declared by the Board of Directors. In the event of liquidation of the Company, the holders of equity shares will be entitled to receive any of the remaining assets of the Company, after distribution of all preferential amounts, in proportion to their shareholding.
(2) The Company has one class of 7.5% non-cumulative redeemable preference shares having a par value of ` 10 per share. Each preference shareholder is eligible for one vote per share as per terms of Section 47(2) of the Companies Act 2013 and dividend as and when declared by the Company. As per the terms of preference shares, these shares are redeemable at par on expiry of 18 months from the date of their allotment. In the event of winding up of Vedanta Limited, the holders of Preference Shares shall have a right to receive repayment of capital paid up and arrears of dividend, whether declared or not, up to the commencement of winding up, in prioirty to any payment of capital on the equity shares out of the surplus of Vedanta Limited.
(3) ADS shareholders do not have right to attend General meetings in person and also do not have right to vote. They are represented by depository, CITI Bank N.A. New York. As on March 31, 2018 - 24,84,24,696 equity shares were held in the form of 6,21,06,174 ADS (March 31, 2017- 21,70,19,900 equity shares in form of 5,42,54,975 ADS).
(4) In terms of Scheme of Arrangement as approved by the Hon’ble High Court of Judicature at Mumbai, vide its order dated April 19, 2002, the erstwhile Sterlite Industries (India) Limited (merged with the Company during 2013-14) during 2002-2003 reduced its paid up share capital by ` 10 Crore. There are 204,525 equity shares (March 31, 2017: 199,026 equity shares) of ` 1 each pending clearance from NSDL/CDSL. The Company has filed an application in Hon’ble High Court of Mumbai to cancel these shares, the final decision on which is pending. Hon’ble High Court of Judicature at Mumbai, vide its interim order dated September 06, 2002 restrained any transaction with respect to subject shares.
18 Other equity (Refer statement of changes in equity) a) General reserve: Under the erstwhile Companies Act 1956, general reserve was created through an annual transfer of net income at
a specified percentage in accordance with applicable regulations. The purpose of these transfers was to ensure that if a dividend distribution in a given year is more than 10% of the paid-up capital of the Company for that year, then the total dividend distribution is less than the total distributable results for that year. Consequent to introduction of Companies Act 2013, the requirement to mandatorily transfer a specified percentage of the net profit to general reserve has been withdrawn.
b) Debenture redemption reserve: The Companies Act requires companies that issue debentures to create a debenture redemption reserve from annual profits until such debentures are redeemed. Companies are required to maintain 25% as a reserve of outstanding redeemable debentures. The amounts credited to the debenture redemption reserve may not be utilised except to redeem debentures.
c) Preference share redemption reserve: The Companies Act provides that companies that issue preference shares may redeem those
shares from profits of the Company which otherwise would be available for dividends, or from proceeds of a new issue of shares made for the purpose of redemption of the preference shares. If there is a premium payable on redemption, the premium must be provided for, either by reducing the additional paid in capital (securities premium account) or net income, before the shares are redeemed. If profits are used to redeem preference shares, the value of the nominal amount of shares redeemed should be transferred from profits (retained earnings) to the preference share redemption reserve account. This amount should then be utilised for the purpose of redemption of redeemable preference shares. This reserve can be used to issue fully paid-up bonus shares to the shareholders of the Company.
d) Capital reserve: The balance in capital reserve has mainly arisen consequent to merger of Cairn India Limited with the Company in
the previous year as described in note 4.
19 Non current financial liabilities - Borrowings
(` in Crore)
Particulars
As at March 31,
2018
As at March 31,
2017
Secured (at amortised cost)Redeemable Non Convertible Debentures 8,600 11,247 Term loans from banks
Rupee term loans 10,692 16,935 External commercial borrowings - 648
Unsecured (at amortised cost)Deferred Sales Tax Liability 91 94 7.5% Redeemable Preference shares 3,010 - Non current financial liabilities - Borrowings (A) 22,393 28,924 Less: Current maturities of long term borrowings (Refer note 25) (7,583) (6,676)
Total Non current financial liabilities - Borrowings (Net) 14,810 22,248
Current financial liabilities - Borrowings (B) (Refer note 23) 18,320 14,309
Total Borrowings (A+B) 40,713 43,233
i) The Company has not defaulted in the repayment of loans and interest as at Balance Sheet date.ii) Bank loans availed by the Company are subject to certain covenants relating to interest service coverage, current ratio, debt service
coverage ratio, total outside liabilities to total net worth, fixed assets coverage ratio, ratio of total term liabilities to net worth and return on fixed assets. The Company has complied with the covenants as per the terms of the loan agreement.
Notes forming part of the Financial Statementsas at and for the year ended March 31, 2018
17 Share capital continued
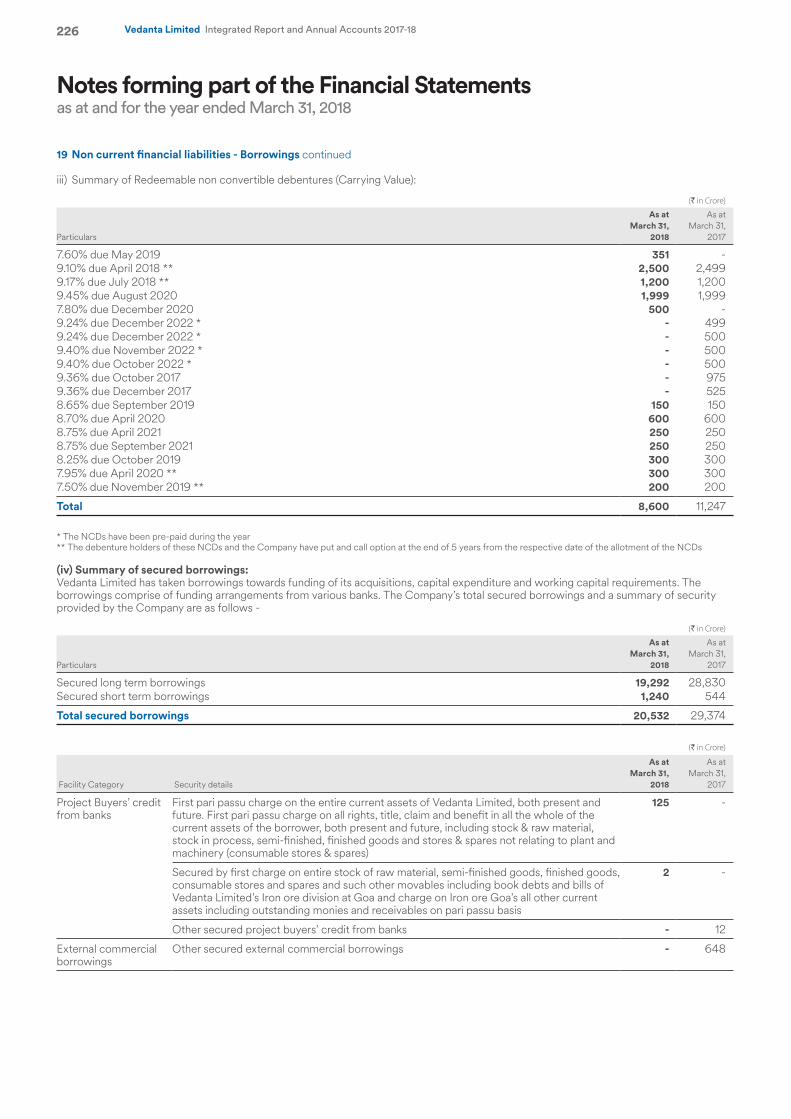
226 Vedanta Limited Integrated Report and Annual Accounts 2017-18
19 Non current financial liabilities - Borrowings continued
iii) Summary of Redeemable non convertible debentures (Carrying Value):
(` in Crore)
Particulars
As at March 31,
2018
As at March 31,
2017
7.60% due May 2019 351 - 9.10% due April 2018 ** 2,500 2,499 9.17% due July 2018 ** 1,200 1,200 9.45% due August 2020 1,999 1,999 7.80% due December 2020 500 - 9.24% due December 2022 * - 499 9.24% due December 2022 * - 500 9.40% due November 2022 * - 500 9.40% due October 2022 * - 500 9.36% due October 2017 - 975 9.36% due December 2017 - 525 8.65% due September 2019 150 150 8.70% due April 2020 600 600 8.75% due April 2021 250 250 8.75% due September 2021 250 250 8.25% due October 2019 300 300 7.95% due April 2020 ** 300 300 7.50% due November 2019 ** 200 200
Total 8,600 11,247
* The NCDs have been pre-paid during the year** The debenture holders of these NCDs and the Company have put and call option at the end of 5 years from the respective date of the allotment of the NCDs
(iv) Summary of secured borrowings: Vedanta Limited has taken borrowings towards funding of its acquisitions, capital expenditure and working capital requirements. The borrowings comprise of funding arrangements from various banks. The Company’s total secured borrowings and a summary of security provided by the Company are as follows -
(` in Crore)
Particulars
As at March 31,
2018
As at March 31,
2017
Secured long term borrowings 19,292 28,830 Secured short term borrowings 1,240 544
Total secured borrowings 20,532 29,374
(` in Crore)
Facility Category Security details
As at March 31,
2018
As at March 31,
2017
Project Buyers’ credit from banks
First pari passu charge on the entire current assets of Vedanta Limited, both present and future. First pari passu charge on all rights, title, claim and benefit in all the whole of the current assets of the borrower, both present and future, including stock & raw material, stock in process, semi-finished, finished goods and stores & spares not relating to plant and machinery (consumable stores & spares)
125 -
Secured by first charge on entire stock of raw material, semi-finished goods, finished goods, consumable stores and spares and such other movables including book debts and bills of Vedanta Limited’s Iron ore division at Goa and charge on Iron ore Goa’s all other current assets including outstanding monies and receivables on pari passu basis
2 -
Other secured project buyers’ credit from banks - 12
External commercial borrowings
Other secured external commercial borrowings - 648
Notes forming part of the Financial Statementsas at and for the year ended March 31, 2018
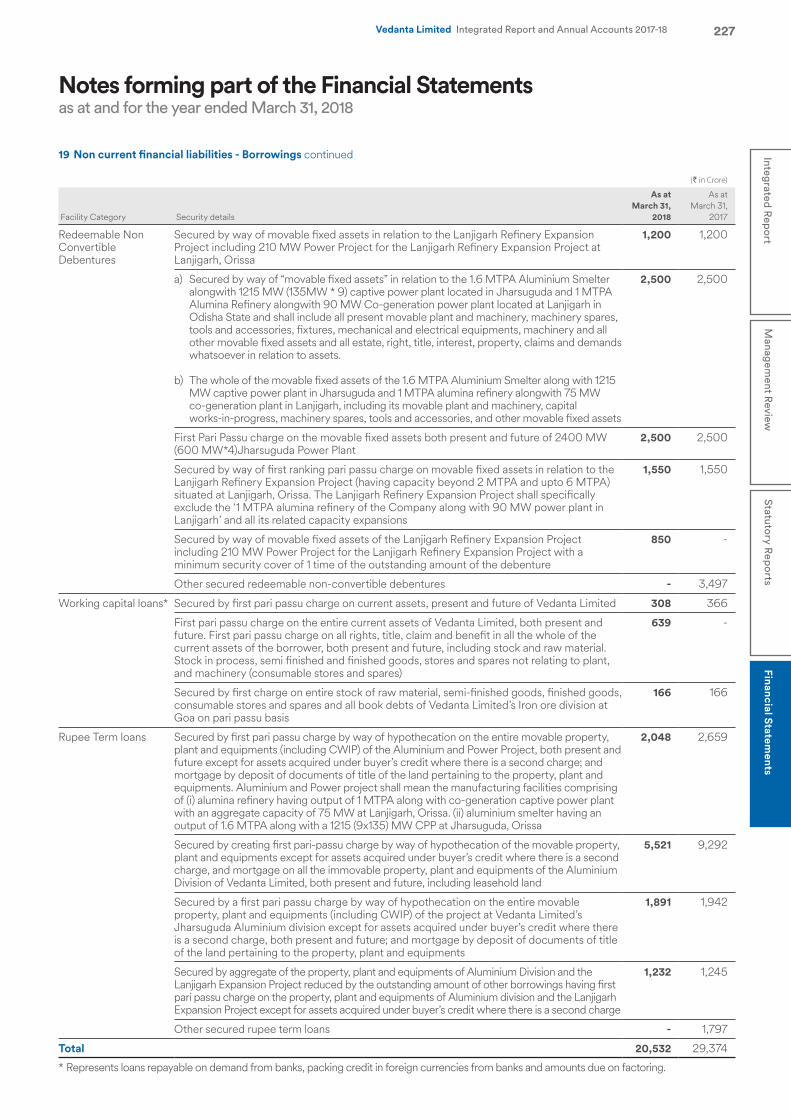
227Integrated R
eport
Managem
ent Review
Statutory R
eports
Financial Statements
Vedanta Limited Integrated Report and Annual Accounts 2017-18
19 Non current financial liabilities - Borrowings continued
(` in Crore)
Facility Category Security details
As at March 31,
2018
As at March 31,
2017
Redeemable Non Convertible Debentures
Secured by way of movable fixed assets in relation to the Lanjigarh Refinery Expansion Project including 210 MW Power Project for the Lanjigarh Refinery Expansion Project at Lanjigarh, Orissa
1,200 1,200
a) Secured by way of “movable fixed assets” in relation to the 1.6 MTPA Aluminium Smelter alongwith 1215 MW (135MW * 9) captive power plant located in Jharsuguda and 1 MTPA Alumina Refinery alongwith 90 MW Co-generation power plant located at Lanjigarh in Odisha State and shall include all present movable plant and machinery, machinery spares, tools and accessories, fixtures, mechanical and electrical equipments, machinery and all other movable fixed assets and all estate, right, title, interest, property, claims and demands whatsoever in relation to assets.
b) The whole of the movable fixed assets of the 1.6 MTPA Aluminium Smelter along with 1215 MW captive power plant in Jharsuguda and 1 MTPA alumina refinery alongwith 75 MW co-generation plant in Lanjigarh, including its movable plant and machinery, capital works-in-progress, machinery spares, tools and accessories, and other movable fixed assets
2,500 2,500
First Pari Passu charge on the movable fixed assets both present and future of 2400 MW (600 MW*4)Jharsuguda Power Plant
2,500 2,500
Secured by way of first ranking pari passu charge on movable fixed assets in relation to the Lanjigarh Refinery Expansion Project (having capacity beyond 2 MTPA and upto 6 MTPA) situated at Lanjigarh, Orissa. The Lanjigarh Refinery Expansion Project shall specifically exclude the ‘1 MTPA alumina refinery of the Company along with 90 MW power plant in Lanjigarh’ and all its related capacity expansions
1,550 1,550
Secured by way of movable fixed assets of the Lanjigarh Refinery Expansion Project including 210 MW Power Project for the Lanjigarh Refinery Expansion Project with a minimum security cover of 1 time of the outstanding amount of the debenture
850 -
Other secured redeemable non-convertible debentures - 3,497
Working capital loans* Secured by first pari passu charge on current assets, present and future of Vedanta Limited 308 366
First pari passu charge on the entire current assets of Vedanta Limited, both present and future. First pari passu charge on all rights, title, claim and benefit in all the whole of the current assets of the borrower, both present and future, including stock and raw material. Stock in process, semi finished and finished goods, stores and spares not relating to plant, and machinery (consumable stores and spares)
639 -
Secured by first charge on entire stock of raw material, semi-finished goods, finished goods, consumable stores and spares and all book debts of Vedanta Limited’s Iron ore division at Goa on pari passu basis
166 166
Rupee Term loans Secured by first pari passu charge by way of hypothecation on the entire movable property, plant and equipments (including CWIP) of the Aluminium and Power Project, both present and future except for assets acquired under buyer’s credit where there is a second charge; and mortgage by deposit of documents of title of the land pertaining to the property, plant and equipments. Aluminium and Power project shall mean the manufacturing facilities comprising of (i) alumina refinery having output of 1 MTPA along with co-generation captive power plant with an aggregate capacity of 75 MW at Lanjigarh, Orissa. (ii) aluminium smelter having an output of 1.6 MTPA along with a 1215 (9x135) MW CPP at Jharsuguda, Orissa
2,048 2,659
Secured by creating first pari-passu charge by way of hypothecation of the movable property, plant and equipments except for assets acquired under buyer’s credit where there is a second charge, and mortgage on all the immovable property, plant and equipments of the Aluminium Division of Vedanta Limited, both present and future, including leasehold land
5,521 9,292
Secured by a first pari passu charge by way of hypothecation on the entire movable property, plant and equipments (including CWIP) of the project at Vedanta Limited’s Jharsuguda Aluminium division except for assets acquired under buyer’s credit where there is a second charge, both present and future; and mortgage by deposit of documents of title of the land pertaining to the property, plant and equipments
1,891 1,942
Secured by aggregate of the property, plant and equipments of Aluminium Division and the Lanjigarh Expansion Project reduced by the outstanding amount of other borrowings having first pari passu charge on the property, plant and equipments of Aluminium division and the Lanjigarh Expansion Project except for assets acquired under buyer’s credit where there is a second charge
1,232 1,245
Other secured rupee term loans - 1,797
Total 20,532 29,374
* Represents loans repayable on demand from banks, packing credit in foreign currencies from banks and amounts due on factoring.
Notes forming part of the Financial Statementsas at and for the year ended March 31, 2018
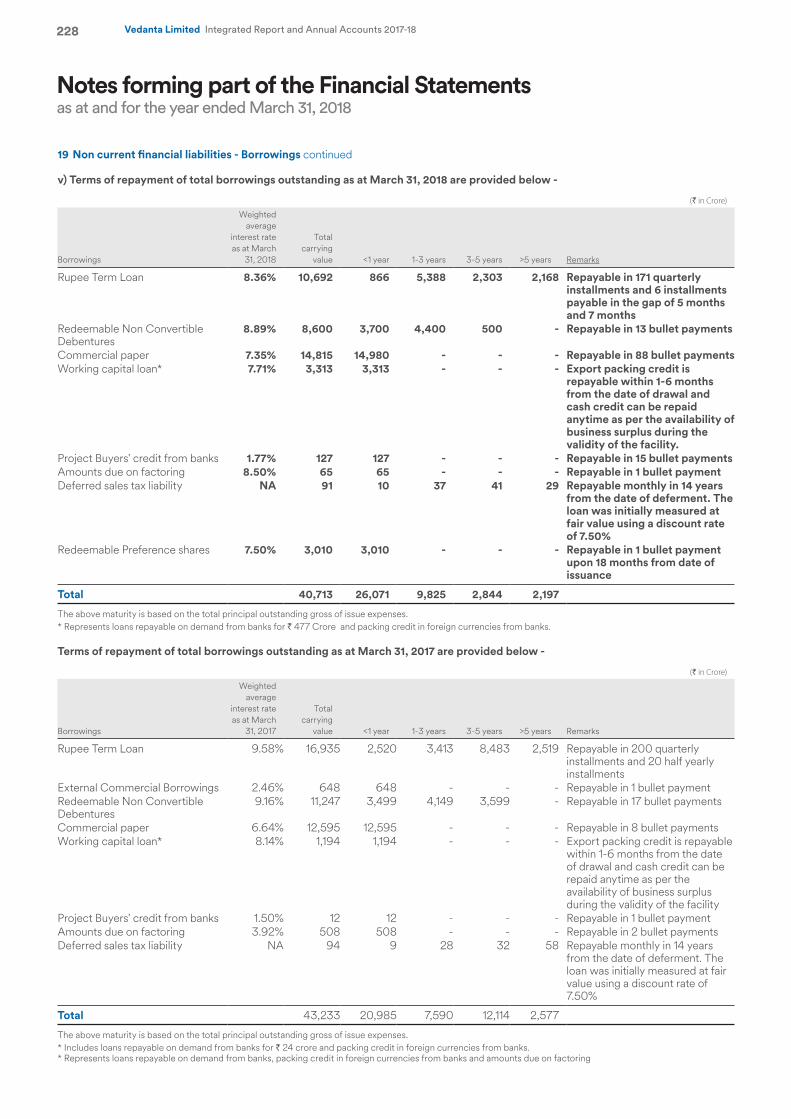
228 Vedanta Limited Integrated Report and Annual Accounts 2017-18
19 Non current financial liabilities - Borrowings continued
v) Terms of repayment of total borrowings outstanding as at March 31, 2018 are provided below -
(` in Crore)
Borrowings
Weighted average
interest rate as at March
31, 2018
Total carrying
value <1 year 1-3 years 3-5 years >5 years Remarks
Rupee Term Loan 8.36% 10,692 866 5,388 2,303 2,168 Repayable in 171 quarterly installments and 6 installments payable in the gap of 5 months and 7 months
Redeemable Non Convertible Debentures
8.89% 8,600 3,700 4,400 500 - Repayable in 13 bullet payments
Commercial paper 7.35% 14,815 14,980 - - - Repayable in 88 bullet paymentsWorking capital loan* 7.71% 3,313 3,313 - - - Export packing credit is
repayable within 1-6 months from the date of drawal and cash credit can be repaid anytime as per the availability of business surplus during the validity of the facility.
Project Buyers' credit from banks 1.77% 127 127 - - - Repayable in 15 bullet paymentsAmounts due on factoring 8.50% 65 65 - - - Repayable in 1 bullet paymentDeferred sales tax liability NA 91 10 37 41 29 Repayable monthly in 14 years
from the date of deferment. The loan was initially measured at fair value using a discount rate of 7.50%
Redeemable Preference shares 7.50% 3,010 3,010 - - - Repayable in 1 bullet payment upon 18 months from date of issuance
Total 40,713 26,071 9,825 2,844 2,197
The above maturity is based on the total principal outstanding gross of issue expenses.* Represents loans repayable on demand from banks for ` 477 Crore and packing credit in foreign currencies from banks.
Terms of repayment of total borrowings outstanding as at March 31, 2017 are provided below -
(` in Crore)
Borrowings
Weighted average
interest rate as at March
31, 2017
Total carrying
value <1 year 1-3 years 3-5 years >5 years Remarks
Rupee Term Loan 9.58% 16,935 2,520 3,413 8,483 2,519 Repayable in 200 quarterly installments and 20 half yearly installments
External Commercial Borrowings 2.46% 648 648 - - - Repayable in 1 bullet paymentRedeemable Non Convertible Debentures
9.16% 11,247 3,499 4,149 3,599 - Repayable in 17 bullet payments
Commercial paper 6.64% 12,595 12,595 - - - Repayable in 8 bullet paymentsWorking capital loan* 8.14% 1,194 1,194 - - - Export packing credit is repayable
within 1-6 months from the date of drawal and cash credit can be repaid anytime as per the availability of business surplus during the validity of the facility
Project Buyers' credit from banks 1.50% 12 12 - - - Repayable in 1 bullet paymentAmounts due on factoring 3.92% 508 508 - - - Repayable in 2 bullet paymentsDeferred sales tax liability NA 94 9 28 32 58 Repayable monthly in 14 years
from the date of deferment. The loan was initially measured at fair value using a discount rate of 7.50%
Total 43,233 20,985 7,590 12,114 2,577
The above maturity is based on the total principal outstanding gross of issue expenses.* Includes loans repayable on demand from banks for ` 24 crore and packing credit in foreign currencies from banks.* Represents loans repayable on demand from banks, packing credit in foreign currencies from banks and amounts due on factoring
Notes forming part of the Financial Statementsas at and for the year ended March 31, 2018

229Integrated R
eport
Managem
ent Review
Statutory R
eports
Financial Statements
Vedanta Limited Integrated Report and Annual Accounts 2017-18
19 Non current financial liabilities - Borrowings continued
(vi) Movement in borrowings during the year is provided below-
(` in Crore)
Particulars
Borrowings due within one year- Carrying
value
Borrowings due after one year -Carrying
value Total
Opening balance at April 1, 2016 10,251 23,217 33,468
Cash flow 6,907 2,832 9,739 Other non cash changes 3,827 (3,801) 26
As at April 1, 2017 20,985 22,248 43,233
Cash flow (2,693) (2,902) (5,595) Other non cash changes 7,611 (4,536) 3,075
As at March 31, 2018 25,903 14,810 40,713
Other non-cash changes comprises of amortisation of borrowing costs, foreign exchange difference on borrowings and reclassification between borrowings due within one year and borrowings due after one year. Additionally non cash changes for the year ended March 31, 2018 includes preference shares issued on merger (Refer Note 4).
20 Non current financial liabilities - Others
(` in Crore)
Particulars
As at March 31,
2018
As at March 31,
2017
Payables for purchase of property, plant and equipment 44 197 Security deposits from vendors & others - 1 Obligation for issuance of redeemable preference shares pursuant to merger (Refer note 4) a - 3,010
Total 44 3,208
(a) For terms and conditions refer note 17(G).
21 Non current - Provisions
(` in Crore)
Particulars
As at March 31,
2018
As at March 31,
2017
Provision for employee benefits (Refer note 39) a 32 51 Provision for restoration, rehabilitation and environmental costs b 820 757
Total 852 808
a) Includes gratuity, compensated absences, deferred cash bonus etc.
b) The movement in provisions for restoration, rehabilitation and environmental costs is as follows (Refer note 3(p)): (` in Crore)
Particulars
As at March 31,
2018
As at March 31,
2017
Opening balance 759 895 Additions during the year 8 4 Unwinding of discount 27 32 Revision in estimates 41 (151)Amount utilised during the year (1) - Unused amounts reversed (Refer note 34 (d)) (17) - Exchange differences 3 (21)
Closing balance 820 759
Classified as: Current - 2 Non current 820 757
Total 820 759
Notes forming part of the Financial Statementsas at and for the year ended March 31, 2018
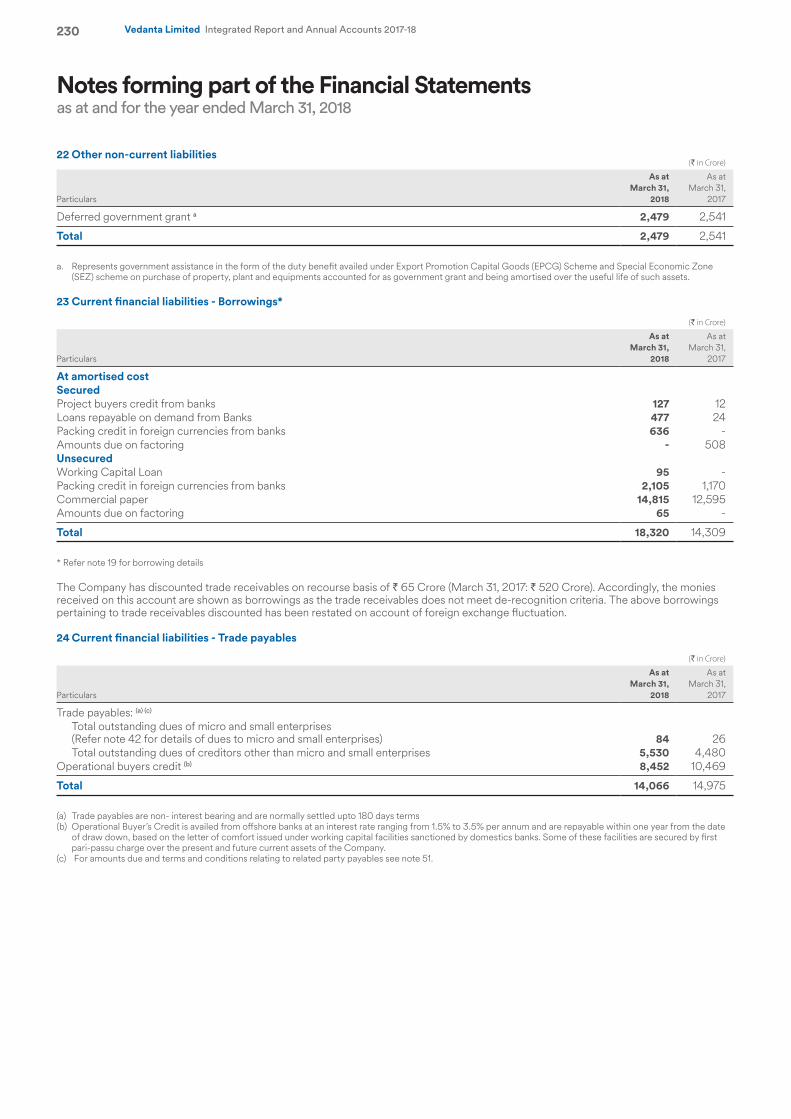
230 Vedanta Limited Integrated Report and Annual Accounts 2017-18
22 Other non-current liabilities (` in Crore)
Particulars
As at March 31,
2018
As at March 31,
2017
Deferred government grant a 2,479 2,541
Total 2,479 2,541
a. Represents government assistance in the form of the duty benefit availed under Export Promotion Capital Goods (EPCG) Scheme and Special Economic Zone (SEZ) scheme on purchase of property, plant and equipments accounted for as government grant and being amortised over the useful life of such assets.
23 Current financial liabilities - Borrowings*
(` in Crore)
Particulars
As at March 31,
2018
As at March 31,
2017
At amortised costSecuredProject buyers credit from banks 127 12 Loans repayable on demand from Banks 477 24 Packing credit in foreign currencies from banks 636 - Amounts due on factoring - 508 UnsecuredWorking Capital Loan 95 - Packing credit in foreign currencies from banks 2,105 1,170 Commercial paper 14,815 12,595 Amounts due on factoring 65 -
Total 18,320 14,309
* Refer note 19 for borrowing details The Company has discounted trade receivables on recourse basis of ` 65 Crore (March 31, 2017: ` 520 Crore). Accordingly, the monies received on this account are shown as borrowings as the trade receivables does not meet de-recognition criteria. The above borrowings pertaining to trade receivables discounted has been restated on account of foreign exchange fluctuation.
24 Current financial liabilities - Trade payables
(` in Crore)
Particulars
As at March 31,
2018
As at March 31,
2017
Trade payables: (a) (c)
Total outstanding dues of micro and small enterprises (Refer note 42 for details of dues to micro and small enterprises) 84 26 Total outstanding dues of creditors other than micro and small enterprises 5,530 4,480
Operational buyers credit (b) 8,452 10,469
Total 14,066 14,975
(a) Trade payables are non- interest bearing and are normally settled upto 180 days terms (b) Operational Buyer’s Credit is availed from offshore banks at an interest rate ranging from 1.5% to 3.5% per annum and are repayable within one year from the date
of draw down, based on the letter of comfort issued under working capital facilities sanctioned by domestics banks. Some of these facilities are secured by first pari-passu charge over the present and future current assets of the Company.
(c) For amounts due and terms and conditions relating to related party payables see note 51.
Notes forming part of the Financial Statementsas at and for the year ended March 31, 2018
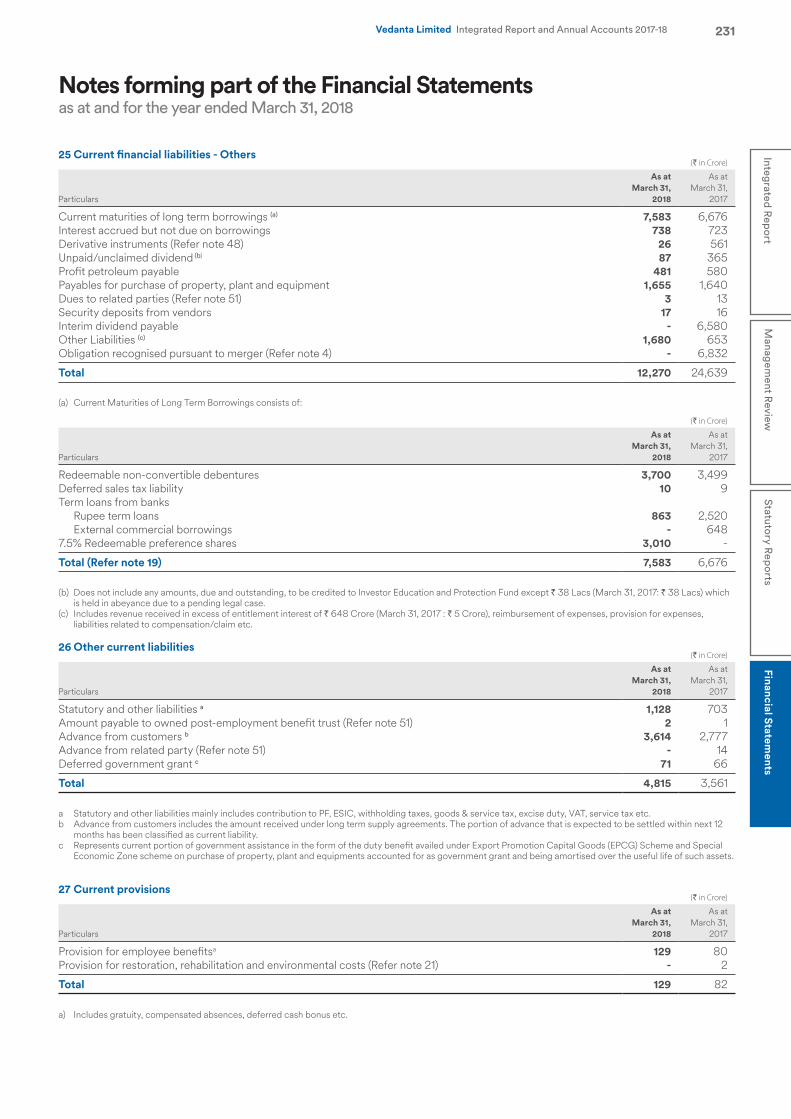
231Integrated R
eport
Managem
ent Review
Statutory R
eports
Financial Statements
Vedanta Limited Integrated Report and Annual Accounts 2017-18
25 Current financial liabilities - Others (` in Crore)
Particulars
As at March 31,
2018
As at March 31,
2017
Current maturities of long term borrowings (a) 7,583 6,676 Interest accrued but not due on borrowings 738 723 Derivative instruments (Refer note 48) 26 561 Unpaid/unclaimed dividend (b) 87 365 Profit petroleum payable 481 580 Payables for purchase of property, plant and equipment 1,655 1,640 Dues to related parties (Refer note 51) 3 13 Security deposits from vendors 17 16 Interim dividend payable - 6,580 Other Liabilities (c) 1,680 653 Obligation recognised pursuant to merger (Refer note 4) - 6,832
Total 12,270 24,639
(a) Current Maturities of Long Term Borrowings consists of:
(` in Crore)
Particulars
As at March 31,
2018
As at March 31,
2017
Redeemable non-convertible debentures 3,700 3,499 Deferred sales tax liability 10 9 Term loans from banks
Rupee term loans 863 2,520 External commercial borrowings - 648
7.5% Redeemable preference shares 3,010 -
Total (Refer note 19) 7,583 6,676
(b) Does not include any amounts, due and outstanding, to be credited to Investor Education and Protection Fund except ` 38 Lacs (March 31, 2017: ` 38 Lacs) which is held in abeyance due to a pending legal case.
(c) Includes revenue received in excess of entitlement interest of ` 648 Crore (March 31, 2017 : ` 5 Crore), reimbursement of expenses, provision for expenses, liabilities related to compensation/claim etc.
26 Other current liabilities
(` in Crore)
Particulars
As at March 31,
2018
As at March 31,
2017
Statutory and other liabilities a 1,128 703 Amount payable to owned post-employment benefit trust (Refer note 51) 2 1 Advance from customers b 3,614 2,777 Advance from related party (Refer note 51) - 14 Deferred government grant c 71 66
Total 4,815 3,561
a Statutory and other liabilities mainly includes contribution to PF, ESIC, withholding taxes, goods & service tax, excise duty, VAT, service tax etc.b Advance from customers includes the amount received under long term supply agreements. The portion of advance that is expected to be settled within next 12
months has been classified as current liability. c Represents current portion of government assistance in the form of the duty benefit availed under Export Promotion Capital Goods (EPCG) Scheme and Special
Economic Zone scheme on purchase of property, plant and equipments accounted for as government grant and being amortised over the useful life of such assets.
27 Current provisions (` in Crore)
Particulars
As at March 31,
2018
As at March 31,
2017
Provision for employee benefitsa 129 80 Provision for restoration, rehabilitation and environmental costs (Refer note 21) - 2
Total 129 82
a) Includes gratuity, compensated absences, deferred cash bonus etc.
Notes forming part of the Financial Statementsas at and for the year ended March 31, 2018
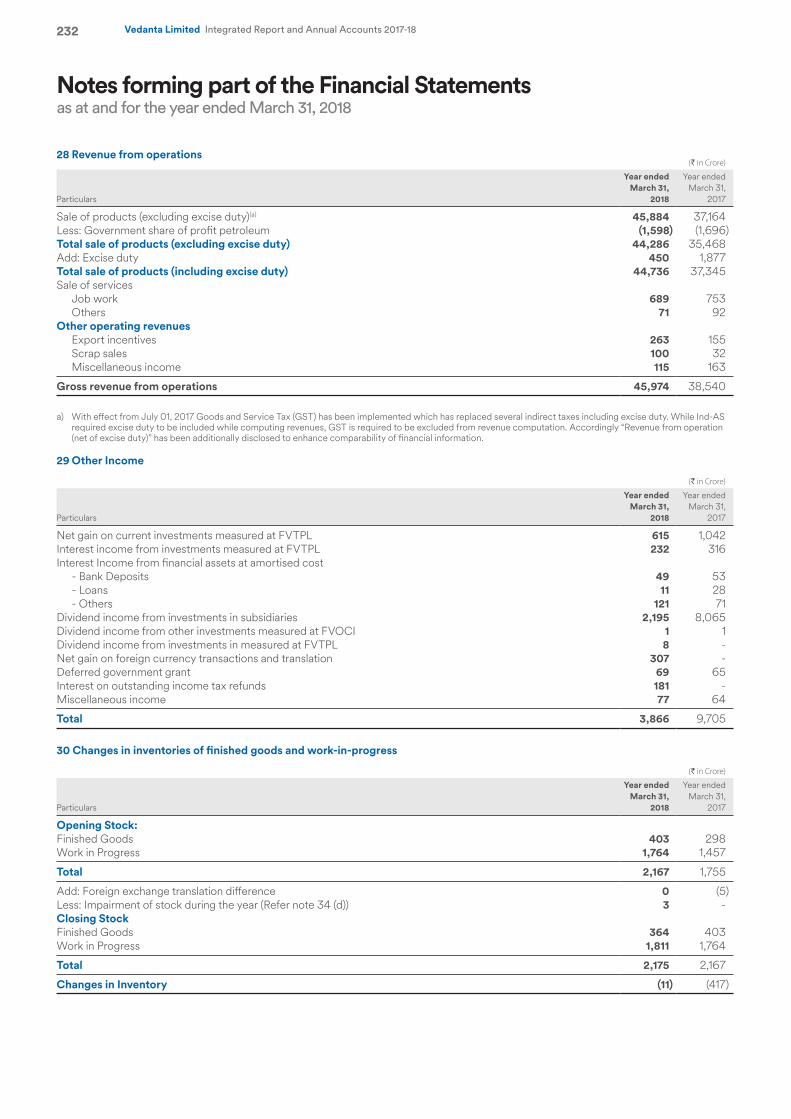
232 Vedanta Limited Integrated Report and Annual Accounts 2017-18
28 Revenue from operations (` in Crore)
Particulars
Year ended March 31,
2018
Year ended March 31,
2017
Sale of products (excluding excise duty)(a) 45,884 37,164 Less: Government share of profit petroleum (1,598) (1,696)Total sale of products (excluding excise duty) 44,286 35,468 Add: Excise duty 450 1,877 Total sale of products (including excise duty) 44,736 37,345 Sale of services
Job work 689 753 Others 71 92
Other operating revenuesExport incentives 263 155 Scrap sales 100 32 Miscellaneous income 115 163
Gross revenue from operations 45,974 38,540
a) With effect from July 01, 2017 Goods and Service Tax (GST) has been implemented which has replaced several indirect taxes including excise duty. While Ind-AS required excise duty to be included while computing revenues, GST is required to be excluded from revenue computation. Accordingly “Revenue from operation (net of excise duty)” has been additionally disclosed to enhance comparability of financial information.
29 Other Income
(` in Crore)
Particulars
Year ended March 31,
2018
Year ended March 31,
2017
Net gain on current investments measured at FVTPL 615 1,042 Interest income from investments measured at FVTPL 232 316 Interest Income from financial assets at amortised cost
- Bank Deposits 49 53 - Loans 11 28 - Others 121 71
Dividend income from investments in subsidiaries 2,195 8,065 Dividend income from other investments measured at FVOCI 1 1 Dividend income from investments in measured at FVTPL 8 - Net gain on foreign currency transactions and translation 307 - Deferred government grant 69 65 Interest on outstanding income tax refunds 181 - Miscellaneous income 77 64
Total 3,866 9,705
30 Changes in inventories of finished goods and work-in-progress
(` in Crore)
Particulars
Year ended March 31,
2018
Year ended March 31,
2017
Opening Stock:Finished Goods 403 298 Work in Progress 1,764 1,457
Total 2,167 1,755
Add: Foreign exchange translation difference 0 (5)Less: Impairment of stock during the year (Refer note 34 (d)) 3 - Closing StockFinished Goods 364 403 Work in Progress 1,811 1,764
Total 2,175 2,167
Changes in Inventory (11) (417)
Notes forming part of the Financial Statementsas at and for the year ended March 31, 2018
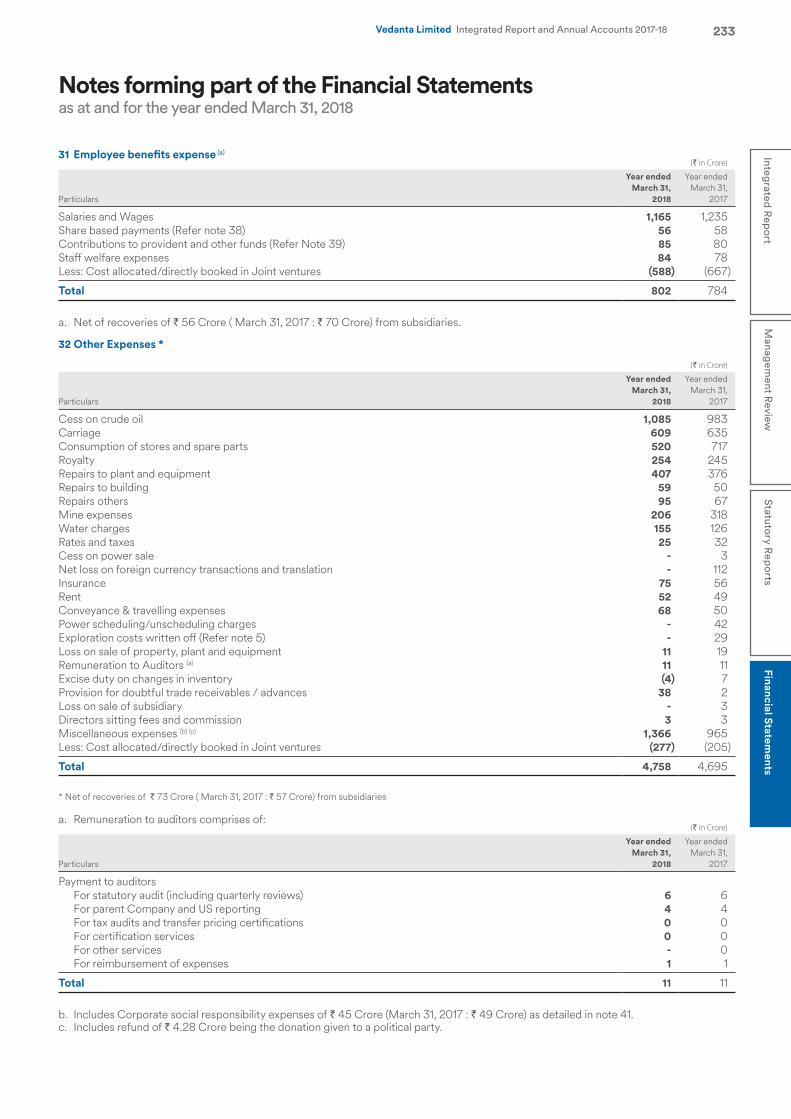
233Integrated R
eport
Managem
ent Review
Statutory R
eports
Financial Statements
Vedanta Limited Integrated Report and Annual Accounts 2017-18
31 Employee benefits expense (a)
(` in Crore)
Particulars
Year ended March 31,
2018
Year ended March 31,
2017
Salaries and Wages 1,165 1,235 Share based payments (Refer note 38) 56 58 Contributions to provident and other funds (Refer Note 39) 85 80 Staff welfare expenses 84 78 Less: Cost allocated/directly booked in Joint ventures (588) (667)
Total 802 784
a. Net of recoveries of ` 56 Crore ( March 31, 2017 : ` 70 Crore) from subsidiaries.
32 Other Expenses *
(` in Crore)
Particulars
Year ended March 31,
2018
Year ended March 31,
2017
Cess on crude oil 1,085 983Carriage 609 635Consumption of stores and spare parts 520 717Royalty 254 245Repairs to plant and equipment 407 376Repairs to building 59 50Repairs others 95 67Mine expenses 206 318Water charges 155 126Rates and taxes 25 32Cess on power sale - 3Net loss on foreign currency transactions and translation - 112Insurance 75 56Rent 52 49Conveyance & travelling expenses 68 50Power scheduling/unscheduling charges - 42Exploration costs written off (Refer note 5) - 29Loss on sale of property, plant and equipment 11 19Remuneration to Auditors (a) 11 11Excise duty on changes in inventory (4) 7Provision for doubtful trade receivables / advances 38 2Loss on sale of subsidiary - 3Directors sitting fees and commission 3 3Miscellaneous expenses (b) (c) 1,366 965Less: Cost allocated/directly booked in Joint ventures (277) (205)
Total 4,758 4,695
* Net of recoveries of ` 73 Crore ( March 31, 2017 : ` 57 Crore) from subsidiaries
a. Remuneration to auditors comprises of: (` in Crore)
Particulars
Year ended March 31,
2018
Year ended March 31,
2017
Payment to auditorsFor statutory audit (including quarterly reviews) 6 6For parent Company and US reporting 4 4For tax audits and transfer pricing certifications 0 0For certification services 0 0For other services - 0For reimbursement of expenses 1 1
Total 11 11
b. Includes Corporate social responsibility expenses of ` 45 Crore (March 31, 2017 : ` 49 Crore) as detailed in note 41.c. Includes refund of ` 4.28 Crore being the donation given to a political party.
Notes forming part of the Financial Statementsas at and for the year ended March 31, 2018
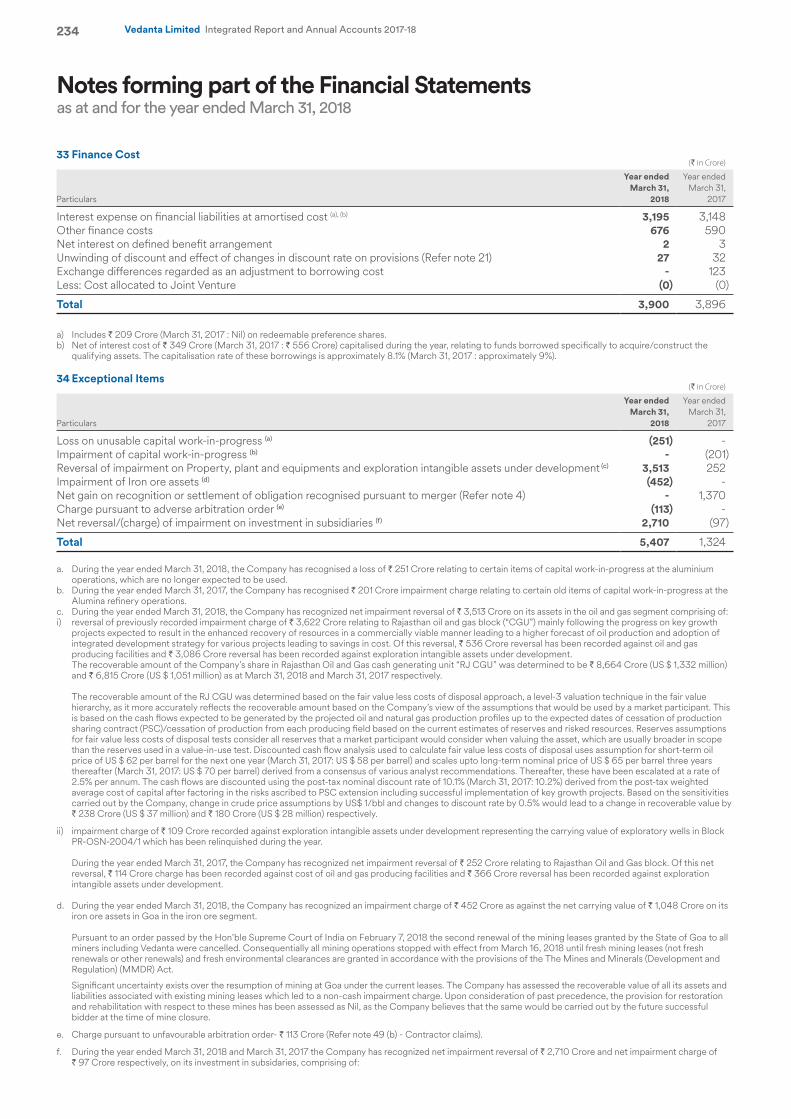
234 Vedanta Limited Integrated Report and Annual Accounts 2017-18
33 Finance Cost (` in Crore)
Particulars
Year ended March 31,
2018
Year ended March 31,
2017
Interest expense on financial liabilities at amortised cost (a), (b) 3,195 3,148 Other finance costs 676 590 Net interest on defined benefit arrangement 2 3 Unwinding of discount and effect of changes in discount rate on provisions (Refer note 21) 27 32 Exchange differences regarded as an adjustment to borrowing cost - 123Less: Cost allocated to Joint Venture (0) (0)
Total 3,900 3,896
a) Includes ` 209 Crore (March 31, 2017 : Nil) on redeemable preference shares. b) Net of interest cost of ` 349 Crore (March 31, 2017 : ` 556 Crore) capitalised during the year, relating to funds borrowed specifically to acquire/construct the
qualifying assets. The capitalisation rate of these borrowings is approximately 8.1% (March 31, 2017 : approximately 9%).
34 Exceptional Items (` in Crore)
Particulars
Year ended March 31,
2018
Year ended March 31,
2017
Loss on unusable capital work-in-progress (a) (251) - Impairment of capital work-in-progress (b) - (201)Reversal of impairment on Property, plant and equipments and exploration intangible assets under development (c) 3,513 252 Impairment of Iron ore assets (d) (452) - Net gain on recognition or settlement of obligation recognised pursuant to merger (Refer note 4) - 1,370 Charge pursuant to adverse arbitration order (e) (113) - Net reversal/(charge) of impairment on investment in subsidiaries (f) 2,710 (97)
Total 5,407 1,324
a. During the year ended March 31, 2018, the Company has recognised a loss of ` 251 Crore relating to certain items of capital work-in-progress at the aluminium operations, which are no longer expected to be used.
b. During the year ended March 31, 2017, the Company has recognised ` 201 Crore impairment charge relating to certain old items of capital work-in-progress at the Alumina refinery operations.
c. During the year ended March 31, 2018, the Company has recognized net impairment reversal of ` 3,513 Crore on its assets in the oil and gas segment comprising of: i) reversal of previously recorded impairment charge of ` 3,622 Crore relating to Rajasthan oil and gas block (“CGU”) mainly following the progress on key growth
projects expected to result in the enhanced recovery of resources in a commercially viable manner leading to a higher forecast of oil production and adoption of integrated development strategy for various projects leading to savings in cost. Of this reversal, ` 536 Crore reversal has been recorded against oil and gas producing facilities and ` 3,086 Crore reversal has been recorded against exploration intangible assets under development.
The recoverable amount of the Company’s share in Rajasthan Oil and Gas cash generating unit “RJ CGU” was determined to be ` 8,664 Crore (US $ 1,332 million) and ` 6,815 Crore (US $ 1,051 million) as at March 31, 2018 and March 31, 2017 respectively.
The recoverable amount of the RJ CGU was determined based on the fair value less costs of disposal approach, a level-3 valuation technique in the fair value
hierarchy, as it more accurately reflects the recoverable amount based on the Company’s view of the assumptions that would be used by a market participant. This is based on the cash flows expected to be generated by the projected oil and natural gas production profiles up to the expected dates of cessation of production sharing contract (PSC)/cessation of production from each producing field based on the current estimates of reserves and risked resources. Reserves assumptions for fair value less costs of disposal tests consider all reserves that a market participant would consider when valuing the asset, which are usually broader in scope than the reserves used in a value-in-use test. Discounted cash flow analysis used to calculate fair value less costs of disposal uses assumption for short-term oil price of US $ 62 per barrel for the next one year (March 31, 2017: US $ 58 per barrel) and scales upto long-term nominal price of US $ 65 per barrel three years thereafter (March 31, 2017: US $ 70 per barrel) derived from a consensus of various analyst recommendations. Thereafter, these have been escalated at a rate of 2.5% per annum. The cash flows are discounted using the post-tax nominal discount rate of 10.1% (March 31, 2017: 10.2%) derived from the post-tax weighted average cost of capital after factoring in the risks ascribed to PSC extension including successful implementation of key growth projects. Based on the sensitivities carried out by the Company, change in crude price assumptions by US$ 1/bbl and changes to discount rate by 0.5% would lead to a change in recoverable value by ` 238 Crore (US $ 37 million) and ` 180 Crore (US $ 28 million) respectively.
ii) impairment charge of ` 109 Crore recorded against exploration intangible assets under development representing the carrying value of exploratory wells in Block
PR-OSN-2004/1 which has been relinquished during the year. During the year ended March 31, 2017, the Company has recognized net impairment reversal of ` 252 Crore relating to Rajasthan Oil and Gas block. Of this net
reversal, ` 114 Crore charge has been recorded against cost of oil and gas producing facilities and ` 366 Crore reversal has been recorded against exploration intangible assets under development.
d. During the year ended March 31, 2018, the Company has recognized an impairment charge of ` 452 Crore as against the net carrying value of ` 1,048 Crore on its
iron ore assets in Goa in the iron ore segment.
Pursuant to an order passed by the Hon’ble Supreme Court of India on February 7, 2018 the second renewal of the mining leases granted by the State of Goa to all miners including Vedanta were cancelled. Consequentially all mining operations stopped with effect from March 16, 2018 until fresh mining leases (not fresh renewals or other renewals) and fresh environmental clearances are granted in accordance with the provisions of the The Mines and Minerals (Development and Regulation) (MMDR) Act.
Significant uncertainty exists over the resumption of mining at Goa under the current leases. The Company has assessed the recoverable value of all its assets and liabilities associated with existing mining leases which led to a non-cash impairment charge. Upon consideration of past precedence, the provision for restoration and rehabilitation with respect to these mines has been assessed as Nil, as the Company believes that the same would be carried out by the future successful bidder at the time of mine closure.
e. Charge pursuant to unfavourable arbitration order- ` 113 Crore (Refer note 49 (b) - Contractor claims). f. During the year ended March 31, 2018 and March 31, 2017 the Company has recognized net impairment reversal of ` 2,710 Crore and net impairment charge of
` 97 Crore respectively, on its investment in subsidaries, comprising of:
Notes forming part of the Financial Statementsas at and for the year ended March 31, 2018
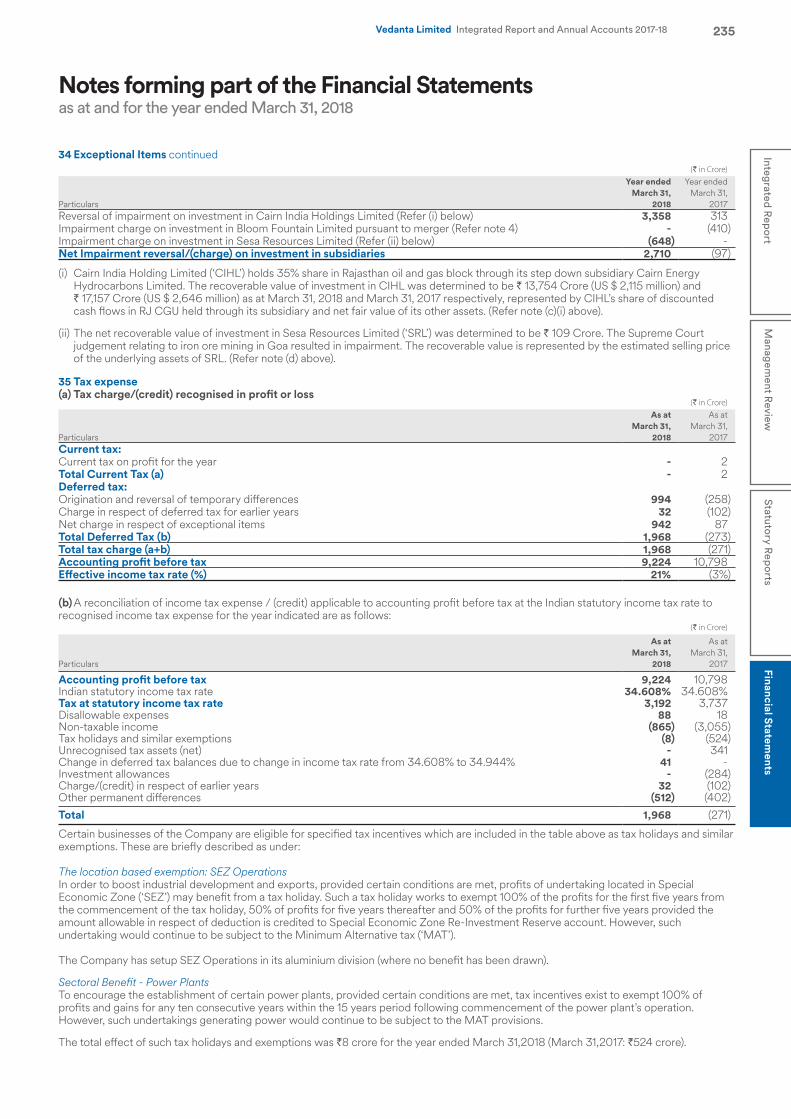
235Integrated R
eport
Managem
ent Review
Statutory R
eports
Financial Statements
Vedanta Limited Integrated Report and Annual Accounts 2017-18
(` in Crore)
Particulars
Year ended March 31,
2018
Year ended March 31,
2017Reversal of impairment on investment in Cairn India Holdings Limited (Refer (i) below) 3,358 313 Impairment charge on investment in Bloom Fountain Limited pursuant to merger (Refer note 4) - (410)Impairment charge on investment in Sesa Resources Limited (Refer (ii) below) (648) - Net Impairment reversal/(charge) on investment in subsidiaries 2,710 (97)
(i) Cairn India Holding Limited (‘CIHL’) holds 35% share in Rajasthan oil and gas block through its step down subsidiary Cairn Energy Hydrocarbons Limited. The recoverable value of investment in CIHL was determined to be ` 13,754 Crore (US $ 2,115 million) and ` 17,157 Crore (US $ 2,646 million) as at March 31, 2018 and March 31, 2017 respectively, represented by CIHL’s share of discounted cash flows in RJ CGU held through its subsidiary and net fair value of its other assets. (Refer note (c)(i) above).
(ii) The net recoverable value of investment in Sesa Resources Limited (‘SRL’) was determined to be ` 109 Crore. The Supreme Court judgement relating to iron ore mining in Goa resulted in impairment. The recoverable value is represented by the estimated selling price of the underlying assets of SRL. (Refer note (d) above).
35 Tax expense
(a) Tax charge/(credit) recognised in profit or loss (` in Crore)
Particulars
As at March 31,
2018
As at March 31,
2017Current tax:Current tax on profit for the year - 2 Total Current Tax (a) - 2 Deferred tax:Origination and reversal of temporary differences 994 (258)Charge in respect of deferred tax for earlier years 32 (102)Net charge in respect of exceptional items 942 87 Total Deferred Tax (b) 1,968 (273)Total tax charge (a+b) 1,968 (271)Accounting profit before tax 9,224 10,798Effective income tax rate (%) 21% (3%)
(b) A reconciliation of income tax expense / (credit) applicable to accounting profit before tax at the Indian statutory income tax rate to recognised income tax expense for the year indicated are as follows:
(` in Crore)
Particulars
As at March 31,
2018
As at March 31,
2017
Accounting profit before tax 9,224 10,798 Indian statutory income tax rate 34.608% 34.608%Tax at statutory income tax rate 3,192 3,737 Disallowable expenses 88 18 Non-taxable income (865) (3,055)Tax holidays and similar exemptions (8) (524)Unrecognised tax assets (net) - 341 Change in deferred tax balances due to change in income tax rate from 34.608% to 34.944% 41 - Investment allowances - (284)Charge/(credit) in respect of earlier years 32 (102)Other permanent differences (512) (402)Total 1,968 (271)
Certain businesses of the Company are eligible for specified tax incentives which are included in the table above as tax holidays and similar exemptions. These are briefly described as under:
The location based exemption: SEZ Operations In order to boost industrial development and exports, provided certain conditions are met, profits of undertaking located in Special Economic Zone (‘SEZ’) may benefit from a tax holiday. Such a tax holiday works to exempt 100% of the profits for the first five years from the commencement of the tax holiday, 50% of profits for five years thereafter and 50% of the profits for further five years provided the amount allowable in respect of deduction is credited to Special Economic Zone Re-Investment Reserve account. However, such undertaking would continue to be subject to the Minimum Alternative tax (‘MAT’).
The Company has setup SEZ Operations in its aluminium division (where no benefit has been drawn).
Sectoral Benefit - Power Plants To encourage the establishment of certain power plants, provided certain conditions are met, tax incentives exist to exempt 100% of profits and gains for any ten consecutive years within the 15 years period following commencement of the power plant’s operation. However, such undertakings generating power would continue to be subject to the MAT provisions.
The total effect of such tax holidays and exemptions was `8 crore for the year ended March 31,2018 (March 31,2017: `524 crore).
34 Exceptional Items continued
Notes forming part of the Financial Statementsas at and for the year ended March 31, 2018
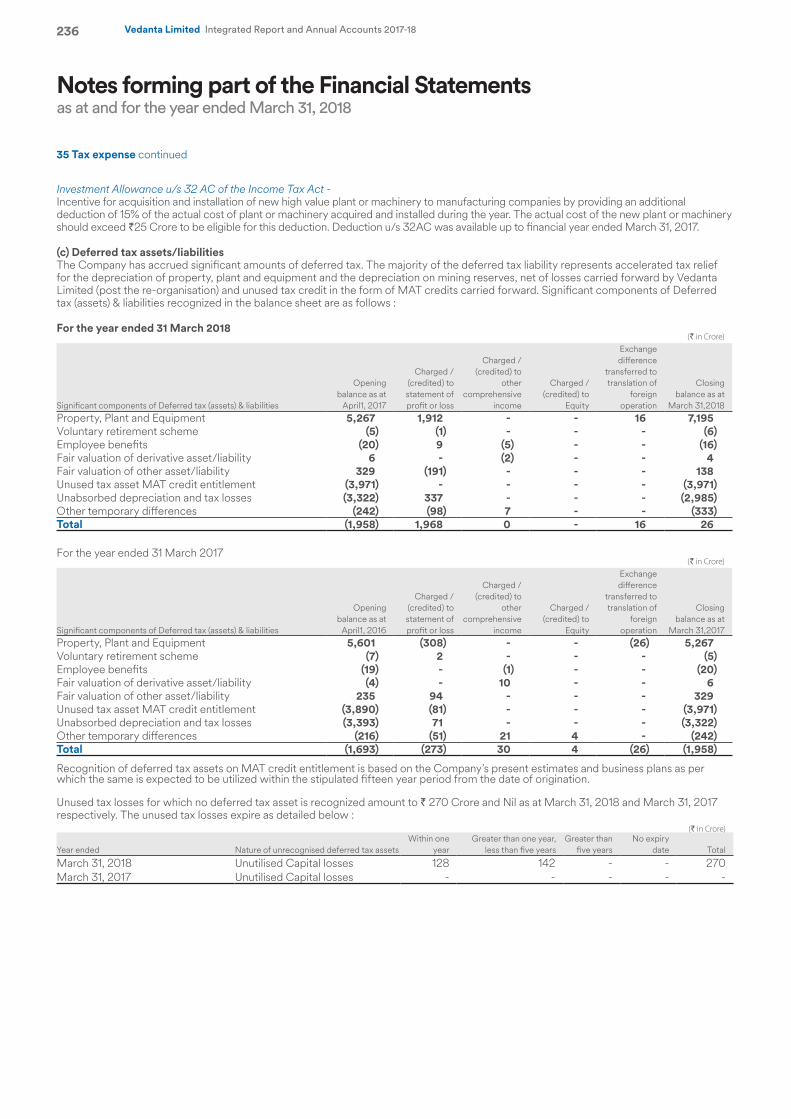
236 Vedanta Limited Integrated Report and Annual Accounts 2017-18
35 Tax expense continued
Investment Allowance u/s 32 AC of the Income Tax Act - Incentive for acquisition and installation of new high value plant or machinery to manufacturing companies by providing an additional deduction of 15% of the actual cost of plant or machinery acquired and installed during the year. The actual cost of the new plant or machinery should exceed `25 Crore to be eligible for this deduction. Deduction u/s 32AC was available up to financial year ended March 31, 2017.
(c) Deferred tax assets/liabilities The Company has accrued significant amounts of deferred tax. The majority of the deferred tax liability represents accelerated tax relief for the depreciation of property, plant and equipment and the depreciation on mining reserves, net of losses carried forward by Vedanta Limited (post the re-organisation) and unused tax credit in the form of MAT credits carried forward. Significant components of Deferred tax (assets) & liabilities recognized in the balance sheet are as follows :
For the year ended 31 March 2018 (` in Crore)
Significant components of Deferred tax (assets) & liabilities
Opening balance as at
April1, 2017
Charged / (credited) to statement of profit or loss
Charged / (credited) to
other comprehensive
income
Charged / (credited) to
Equity
Exchange difference
transferred to translation of
foreign operation
Closing balance as at
March 31,2018Property, Plant and Equipment 5,267 1,912 - - 16 7,195 Voluntary retirement scheme (5) (1) - - - (6)Employee benefits (20) 9 (5) - - (16)Fair valuation of derivative asset/liability 6 - (2) - - 4 Fair valuation of other asset/liability 329 (191) - - - 138 Unused tax asset MAT credit entitlement (3,971) - - - - (3,971)Unabsorbed depreciation and tax losses (3,322) 337 - - - (2,985)Other temporary differences (242) (98) 7 - - (333)Total (1,958) 1,968 0 - 16 26
For the year ended 31 March 2017 (` in Crore)
Significant components of Deferred tax (assets) & liabilities
Opening balance as at
April1, 2016
Charged / (credited) to statement of profit or loss
Charged / (credited) to
other comprehensive
income
Charged / (credited) to
Equity
Exchange difference
transferred to translation of
foreign operation
Closing balance as at
March 31,2017Property, Plant and Equipment 5,601 (308) - - (26) 5,267 Voluntary retirement scheme (7) 2 - - - (5)Employee benefits (19) - (1) - - (20)Fair valuation of derivative asset/liability (4) - 10 - - 6 Fair valuation of other asset/liability 235 94 - - - 329 Unused tax asset MAT credit entitlement (3,890) (81) - - - (3,971) Unabsorbed depreciation and tax losses (3,393) 71 - - - (3,322)Other temporary differences (216) (51) 21 4 - (242)Total (1,693) (273) 30 4 (26) (1,958)
Recognition of deferred tax assets on MAT credit entitlement is based on the Company’s present estimates and business plans as per which the same is expected to be utilized within the stipulated fifteen year period from the date of origination. Unused tax losses for which no deferred tax asset is recognized amount to ` 270 Crore and Nil as at March 31, 2018 and March 31, 2017 respectively. The unused tax losses expire as detailed below :
(` in Crore)
Year ended Nature of unrecognised deferred tax assetsWithin one
year Greater than one year,
less than five years Greater than
five years No expiry
date Total
March 31, 2018 Unutilised Capital losses 128 142 - - 270 March 31, 2017 Unutilised Capital losses - - - - -
Notes forming part of the Financial Statementsas at and for the year ended March 31, 2018
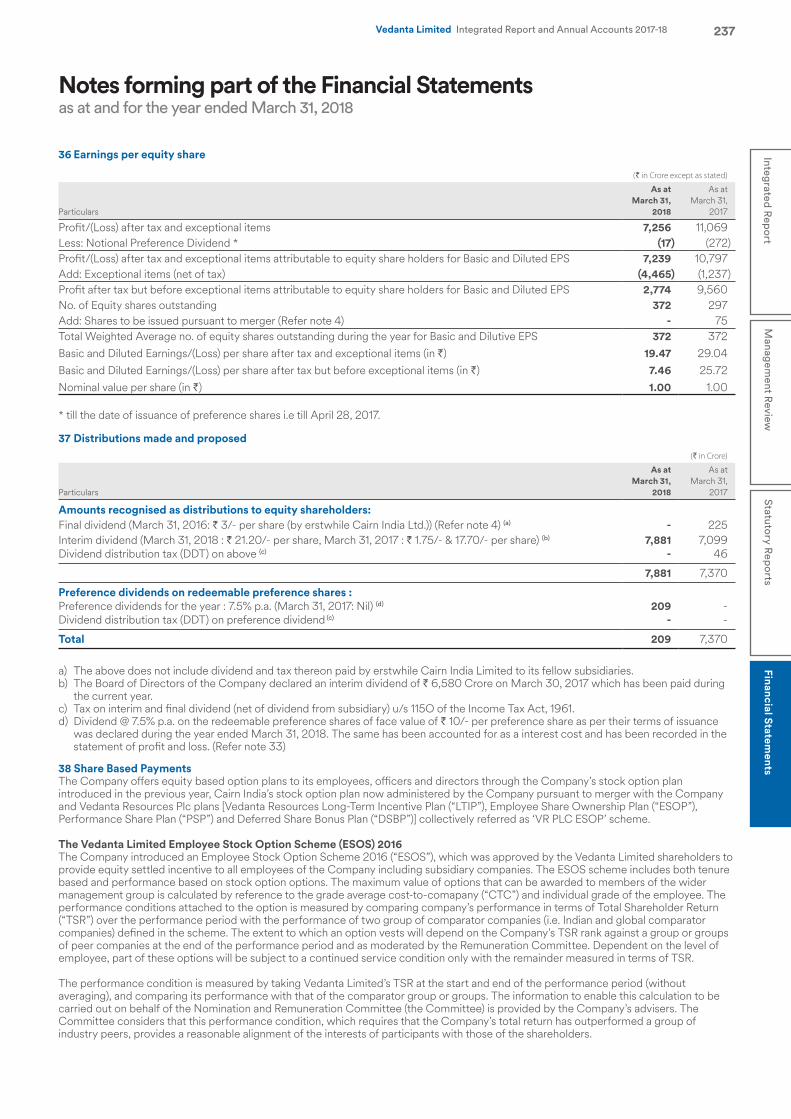
237Integrated R
eport
Managem
ent Review
Statutory R
eports
Financial Statements
Vedanta Limited Integrated Report and Annual Accounts 2017-18
36 Earnings per equity share
(` in Crore except as stated)
Particulars
As at March 31,
2018
As at March 31,
2017
Profit/(Loss) after tax and exceptional items 7,256 11,069 Less: Notional Preference Dividend * (17) (272)Profit/(Loss) after tax and exceptional items attributable to equity share holders for Basic and Diluted EPS 7,239 10,797 Add: Exceptional items (net of tax) (4,465) (1,237)Profit after tax but before exceptional items attributable to equity share holders for Basic and Diluted EPS 2,774 9,560 No. of Equity shares outstanding 372 297 Add: Shares to be issued pursuant to merger (Refer note 4) - 75 Total Weighted Average no. of equity shares outstanding during the year for Basic and Dilutive EPS 372 372 Basic and Diluted Earnings/(Loss) per share after tax and exceptional items (in `) 19.47 29.04 Basic and Diluted Earnings/(Loss) per share after tax but before exceptional items (in `) 7.46 25.72 Nominal value per share (in `) 1.00 1.00
* till the date of issuance of preference shares i.e till April 28, 2017.
37 Distributions made and proposed (` in Crore)
Particulars
As at March 31,
2018
As at March 31,
2017
Amounts recognised as distributions to equity shareholders:Final dividend (March 31, 2016: ` 3/- per share (by erstwhile Cairn India Ltd.)) (Refer note 4) (a) - 225 Interim dividend (March 31, 2018 : ` 21.20/- per share, March 31, 2017 : ` 1.75/- & 17.70/- per share) (b) 7,881 7,099 Dividend distribution tax (DDT) on above (c) - 46
7,881 7,370
Preference dividends on redeemable preference shares :Preference dividends for the year : 7.5% p.a. (March 31, 2017: Nil) (d) 209 - Dividend distribution tax (DDT) on preference dividend (c) - -
Total 209 7,370
a) The above does not include dividend and tax thereon paid by erstwhile Cairn India Limited to its fellow subsidiaries. b) The Board of Directors of the Company declared an interim dividend of ` 6,580 Crore on March 30, 2017 which has been paid during
the current year. c) Tax on interim and final dividend (net of dividend from subsidiary) u/s 115O of the Income Tax Act, 1961. d) Dividend @ 7.5% p.a. on the redeemable preference shares of face value of ` 10/- per preference share as per their terms of issuance
was declared during the year ended March 31, 2018. The same has been accounted for as a interest cost and has been recorded in the statement of profit and loss. (Refer note 33)
38 Share Based Payments The Company offers equity based option plans to its employees, officers and directors through the Company’s stock option plan introduced in the previous year, Cairn India’s stock option plan now administered by the Company pursuant to merger with the Company and Vedanta Resources Plc plans [Vedanta Resources Long-Term Incentive Plan (“LTIP”), Employee Share Ownership Plan (“ESOP”), Performance Share Plan (“PSP”) and Deferred Share Bonus Plan (“DSBP”)] collectively referred as ‘VR PLC ESOP’ scheme.
The Vedanta Limited Employee Stock Option Scheme (ESOS) 2016The Company introduced an Employee Stock Option Scheme 2016 (“ESOS”), which was approved by the Vedanta Limited shareholders to provide equity settled incentive to all employees of the Company including subsidiary companies. The ESOS scheme includes both tenure based and performance based on stock option options. The maximum value of options that can be awarded to members of the wider management group is calculated by reference to the grade average cost-to-comapany (“CTC”) and individual grade of the employee. The performance conditions attached to the option is measured by comparing company’s performance in terms of Total Shareholder Return (“TSR”) over the performance period with the performance of two group of comparator companies (i.e. Indian and global comparator companies) defined in the scheme. The extent to which an option vests will depend on the Company’s TSR rank against a group or groups of peer companies at the end of the performance period and as moderated by the Remuneration Committee. Dependent on the level of employee, part of these options will be subject to a continued service condition only with the remainder measured in terms of TSR.
The performance condition is measured by taking Vedanta Limited’s TSR at the start and end of the performance period (without averaging), and comparing its performance with that of the comparator group or groups. The information to enable this calculation to be carried out on behalf of the Nomination and Remuneration Committee (the Committee) is provided by the Company’s advisers. The Committee considers that this performance condition, which requires that the Company’s total return has outperformed a group of industry peers, provides a reasonable alignment of the interests of participants with those of the shareholders.
Notes forming part of the Financial Statementsas at and for the year ended March 31, 2018
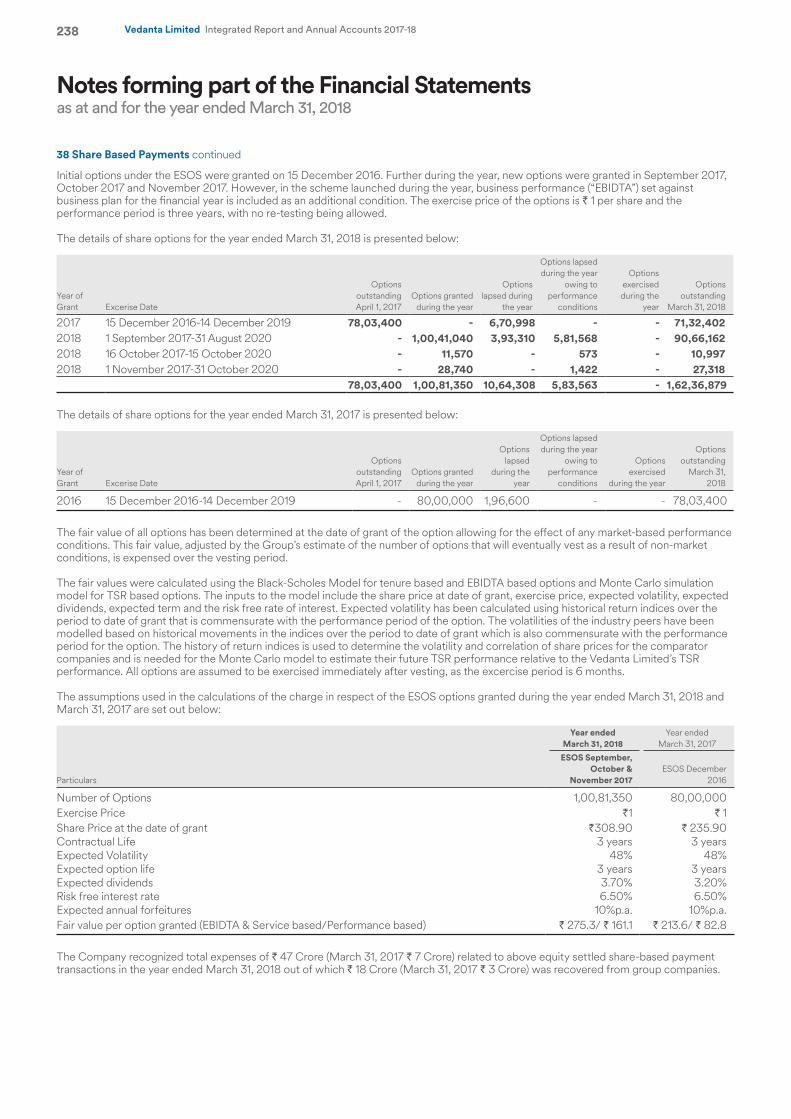
238 Vedanta Limited Integrated Report and Annual Accounts 2017-18
Initial options under the ESOS were granted on 15 December 2016. Further during the year, new options were granted in September 2017, October 2017 and November 2017. However, in the scheme launched during the year, business performance (“EBIDTA”) set against business plan for the financial year is included as an additional condition. The exercise price of the options is ` 1 per share and the performance period is three years, with no re-testing being allowed.
The details of share options for the year ended March 31, 2018 is presented below:
Year of Grant Excerise Date
Options outstanding April 1, 2017
Options granted during the year
Options lapsed during
the year
Options lapsed during the year
owing to performance
conditions
Options exercised during the
year
Options outstanding
March 31, 2018
2017 15 December 2016-14 December 2019 78,03,400 - 6,70,998 - - 71,32,4022018 1 September 2017-31 August 2020 - 1,00,41,040 3,93,310 5,81,568 - 90,66,1622018 16 October 2017-15 October 2020 - 11,570 - 573 - 10,9972018 1 November 2017-31 October 2020 - 28,740 - 1,422 - 27,318
78,03,400 1,00,81,350 10,64,308 5,83,563 - 1,62,36,879
The details of share options for the year ended March 31, 2017 is presented below:
Year of Grant Excerise Date
Options outstanding April 1, 2017
Options granted during the year
Options lapsed
during the year
Options lapsed during the year
owing to performance
conditions
Options exercised
during the year
Options outstanding
March 31, 2018
2016 15 December 2016-14 December 2019 - 80,00,000 1,96,600 - - 78,03,400
The fair value of all options has been determined at the date of grant of the option allowing for the effect of any market-based performance conditions. This fair value, adjusted by the Group’s estimate of the number of options that will eventually vest as a result of non-market conditions, is expensed over the vesting period.
The fair values were calculated using the Black-Scholes Model for tenure based and EBIDTA based options and Monte Carlo simulation model for TSR based options. The inputs to the model include the share price at date of grant, exercise price, expected volatility, expected dividends, expected term and the risk free rate of interest. Expected volatility has been calculated using historical return indices over the period to date of grant that is commensurate with the performance period of the option. The volatilities of the industry peers have been modelled based on historical movements in the indices over the period to date of grant which is also commensurate with the performance period for the option. The history of return indices is used to determine the volatility and correlation of share prices for the comparator companies and is needed for the Monte Carlo model to estimate their future TSR performance relative to the Vedanta Limited’s TSR performance. All options are assumed to be exercised immediately after vesting, as the excercise period is 6 months.
The assumptions used in the calculations of the charge in respect of the ESOS options granted during the year ended March 31, 2018 and March 31, 2017 are set out below:
Particulars
Year ended March 31, 2018
Year ended March 31, 2017
ESOS September, October &
November 2017ESOS December
2016
Number of Options 1,00,81,350 80,00,000Exercise Price `1 ` 1 Share Price at the date of grant `308.90 ` 235.90 Contractual Life 3 years 3 yearsExpected Volatility 48% 48%Expected option life 3 years 3 yearsExpected dividends 3.70% 3.20%Risk free interest rate 6.50% 6.50%Expected annual forfeitures 10%p.a. 10%p.a.Fair value per option granted (EBIDTA & Service based/Performance based) ` 275.3/ ` 161.1 ` 213.6/ ` 82.8
The Company recognized total expenses of ` 47 Crore (March 31, 2017 ` 7 Crore) related to above equity settled share-based payment transactions in the year ended March 31, 2018 out of which ` 18 Crore (March 31, 2017 ` 3 Crore) was recovered from group companies.
Notes forming part of the Financial Statementsas at and for the year ended March 31, 2018
38 Share Based Payments continued
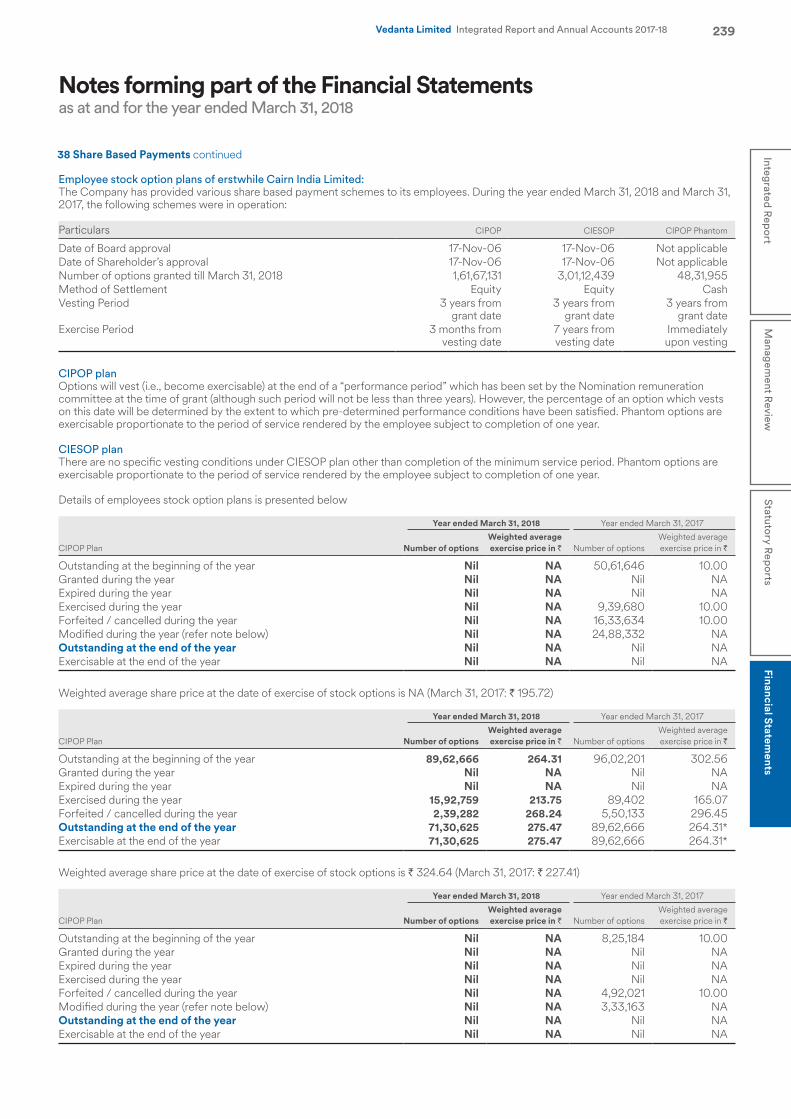
239Integrated R
eport
Managem
ent Review
Statutory R
eports
Financial Statements
Vedanta Limited Integrated Report and Annual Accounts 2017-18
Employee stock option plans of erstwhile Cairn India Limited: The Company has provided various share based payment schemes to its employees. During the year ended March 31, 2018 and March 31, 2017, the following schemes were in operation:
Particulars CIPOP CIESOP CIPOP Phantom
Date of Board approval 17-Nov-06 17-Nov-06 Not applicableDate of Shareholder’s approval 17-Nov-06 17-Nov-06 Not applicableNumber of options granted till March 31, 2018 1,61,67,131 3,01,12,439 48,31,955Method of Settlement Equity Equity CashVesting Period 3 years from
grant date3 years from
grant date3 years from
grant dateExercise Period 3 months from
vesting date7 years from vesting date
Immediately upon vesting
CIPOP plan Options will vest (i.e., become exercisable) at the end of a “performance period” which has been set by the Nomination remuneration committee at the time of grant (although such period will not be less than three years). However, the percentage of an option which vests on this date will be determined by the extent to which pre-determined performance conditions have been satisfied. Phantom options are exercisable proportionate to the period of service rendered by the employee subject to completion of one year. CIESOP planThere are no specific vesting conditions under CIESOP plan other than completion of the minimum service period. Phantom options are exercisable proportionate to the period of service rendered by the employee subject to completion of one year. Details of employees stock option plans is presented below
CIPOP Plan
Year ended March 31, 2018 Year ended March 31, 2017
Number of optionsWeighted average exercise price in ` Number of options
Weighted average exercise price in `
Outstanding at the beginning of the year Nil NA 50,61,646 10.00Granted during the year Nil NA Nil NAExpired during the year Nil NA Nil NAExercised during the year Nil NA 9,39,680 10.00Forfeited / cancelled during the year Nil NA 16,33,634 10.00Modified during the year (refer note below) Nil NA 24,88,332 NAOutstanding at the end of the year Nil NA Nil NAExercisable at the end of the year Nil NA Nil NA
Weighted average share price at the date of exercise of stock options is NA (March 31, 2017: ` 195.72)
CIPOP Plan
Year ended March 31, 2018 Year ended March 31, 2017
Number of optionsWeighted average exercise price in ` Number of options
Weighted average exercise price in `
Outstanding at the beginning of the year 89,62,666 264.31 96,02,201 302.56Granted during the year Nil NA Nil NAExpired during the year Nil NA Nil NAExercised during the year 15,92,759 213.75 89,402 165.07Forfeited / cancelled during the year 2,39,282 268.24 5,50,133 296.45Outstanding at the end of the year 71,30,625 275.47 89,62,666 264.31*Exercisable at the end of the year 71,30,625 275.47 89,62,666 264.31*
Weighted average share price at the date of exercise of stock options is ` 324.64 (March 31, 2017: ` 227.41)
CIPOP Plan
Year ended March 31, 2018 Year ended March 31, 2017
Number of optionsWeighted average exercise price in ` Number of options
Weighted average exercise price in `
Outstanding at the beginning of the year Nil NA 8,25,184 10.00Granted during the year Nil NA Nil NAExpired during the year Nil NA Nil NAExercised during the year Nil NA Nil NAForfeited / cancelled during the year Nil NA 4,92,021 10.00Modified during the year (refer note below) Nil NA 3,33,163 NAOutstanding at the end of the year Nil NA Nil NAExercisable at the end of the year Nil NA Nil NA
Notes forming part of the Financial Statementsas at and for the year ended March 31, 2018
38 Share Based Payments continued
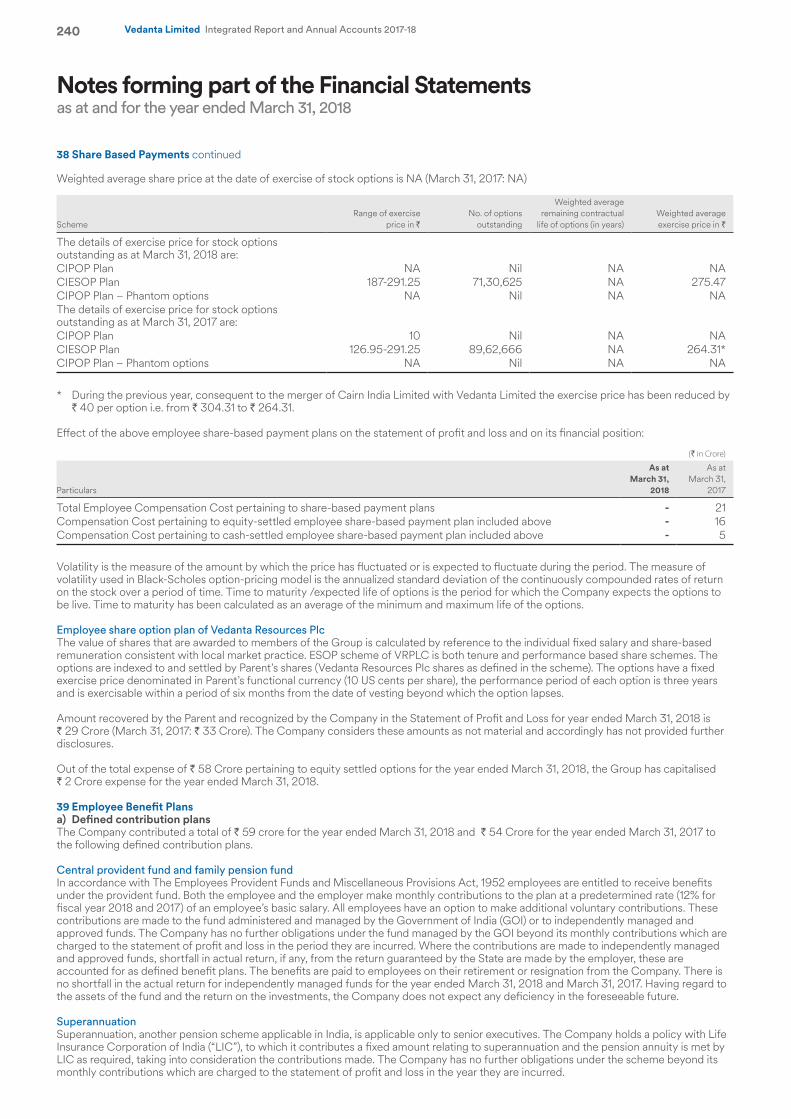
240 Vedanta Limited Integrated Report and Annual Accounts 2017-18
Weighted average share price at the date of exercise of stock options is NA (March 31, 2017: NA)
SchemeRange of exercise
price in `No. of options
outstanding
Weighted average remaining contractual
life of options (in years)Weighted average exercise price in `
The details of exercise price for stock options outstanding as at March 31, 2018 are:CIPOP Plan NA Nil NA NACIESOP Plan 187-291.25 71,30,625 NA 275.47 CIPOP Plan – Phantom options NA Nil NA NAThe details of exercise price for stock options outstanding as at March 31, 2017 are:CIPOP Plan 10 Nil NA NACIESOP Plan 126.95-291.25 89,62,666 NA 264.31*CIPOP Plan – Phantom options NA Nil NA NA
* During the previous year, consequent to the merger of Cairn India Limited with Vedanta Limited the exercise price has been reduced by ` 40 per option i.e. from ` 304.31 to ` 264.31.
Effect of the above employee share-based payment plans on the statement of profit and loss and on its financial position:
(` in Crore)
Particulars
As at March 31,
2018
As at March 31,
2017
Total Employee Compensation Cost pertaining to share-based payment plans - 21 Compensation Cost pertaining to equity-settled employee share-based payment plan included above - 16 Compensation Cost pertaining to cash-settled employee share-based payment plan included above - 5
Volatility is the measure of the amount by which the price has fluctuated or is expected to fluctuate during the period. The measure of volatility used in Black-Scholes option-pricing model is the annualized standard deviation of the continuously compounded rates of return on the stock over a period of time. Time to maturity /expected life of options is the period for which the Company expects the options to be live. Time to maturity has been calculated as an average of the minimum and maximum life of the options.
Employee share option plan of Vedanta Resources Plc The value of shares that are awarded to members of the Group is calculated by reference to the individual fixed salary and share-based remuneration consistent with local market practice. ESOP scheme of VRPLC is both tenure and performance based share schemes. The options are indexed to and settled by Parent’s shares (Vedanta Resources Plc shares as defined in the scheme). The options have a fixed exercise price denominated in Parent’s functional currency (10 US cents per share), the performance period of each option is three years and is exercisable within a period of six months from the date of vesting beyond which the option lapses.
Amount recovered by the Parent and recognized by the Company in the Statement of Profit and Loss for year ended March 31, 2018 is ` 29 Crore (March 31, 2017: ` 33 Crore). The Company considers these amounts as not material and accordingly has not provided further disclosures.
Out of the total expense of ` 58 Crore pertaining to equity settled options for the year ended March 31, 2018, the Group has capitalised ` 2 Crore expense for the year ended March 31, 2018.
39 Employee Benefit Plans a) Defined contribution plansThe Company contributed a total of ` 59 crore for the year ended March 31, 2018 and ` 54 Crore for the year ended March 31, 2017 to the following defined contribution plans.
Central provident fund and family pension fundIn accordance with The Employees Provident Funds and Miscellaneous Provisions Act, 1952 employees are entitled to receive benefits under the provident fund. Both the employee and the employer make monthly contributions to the plan at a predetermined rate (12% for fiscal year 2018 and 2017) of an employee’s basic salary. All employees have an option to make additional voluntary contributions. These contributions are made to the fund administered and managed by the Government of India (GOI) or to independently managed and approved funds. The Company has no further obligations under the fund managed by the GOI beyond its monthly contributions which are charged to the statement of profit and loss in the period they are incurred. Where the contributions are made to independently managed and approved funds, shortfall in actual return, if any, from the return guaranteed by the State are made by the employer, these are accounted for as defined benefit plans. The benefits are paid to employees on their retirement or resignation from the Company. There is no shortfall in the actual return for independently managed funds for the year ended March 31, 2018 and March 31, 2017. Having regard to the assets of the fund and the return on the investments, the Company does not expect any deficiency in the foreseeable future.
SuperannuationSuperannuation, another pension scheme applicable in India, is applicable only to senior executives. The Company holds a policy with Life Insurance Corporation of India (“LIC”), to which it contributes a fixed amount relating to superannuation and the pension annuity is met by LIC as required, taking into consideration the contributions made. The Company has no further obligations under the scheme beyond its monthly contributions which are charged to the statement of profit and loss in the year they are incurred.
Notes forming part of the Financial Statementsas at and for the year ended March 31, 2018
38 Share Based Payments continued
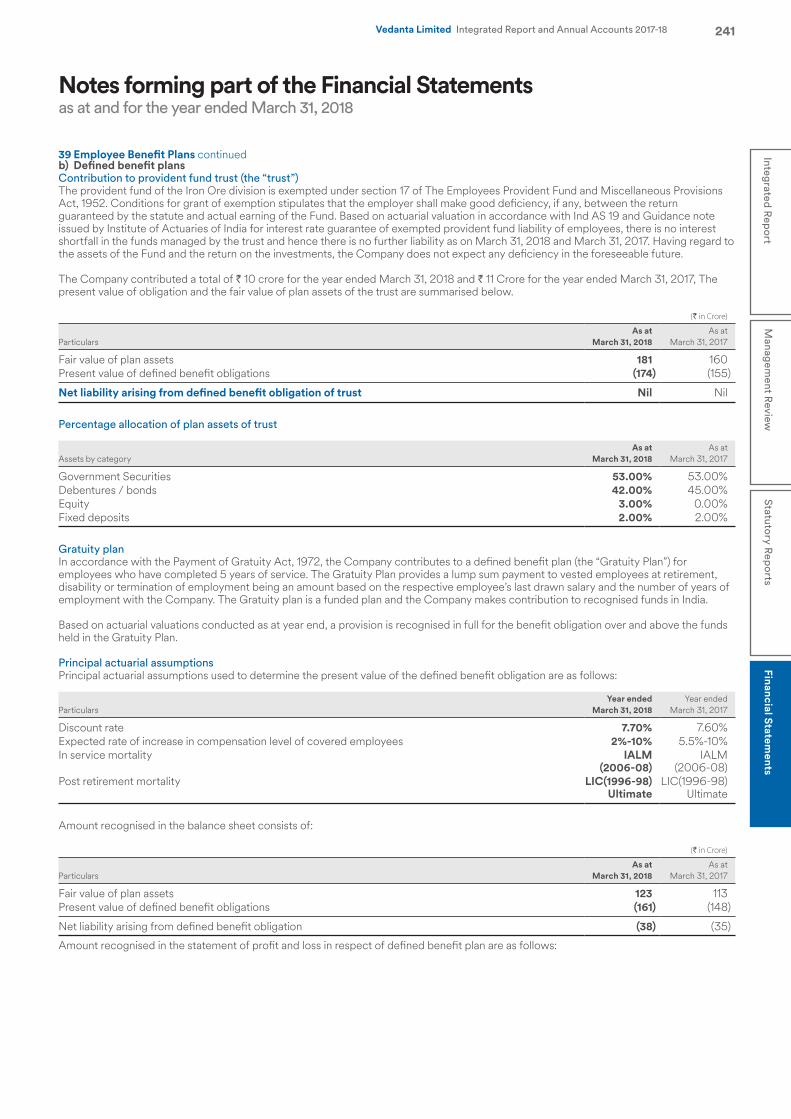
241Integrated R
eport
Managem
ent Review
Statutory R
eports
Financial Statements
Vedanta Limited Integrated Report and Annual Accounts 2017-18
b) Defined benefit plansContribution to provident fund trust (the “trust”)The provident fund of the Iron Ore division is exempted under section 17 of The Employees Provident Fund and Miscellaneous Provisions Act, 1952. Conditions for grant of exemption stipulates that the employer shall make good deficiency, if any, between the return guaranteed by the statute and actual earning of the Fund. Based on actuarial valuation in accordance with Ind AS 19 and Guidance note issued by Institute of Actuaries of India for interest rate guarantee of exempted provident fund liability of employees, there is no interest shortfall in the funds managed by the trust and hence there is no further liability as on March 31, 2018 and March 31, 2017. Having regard to the assets of the Fund and the return on the investments, the Company does not expect any deficiency in the foreseeable future.
The Company contributed a total of ` 10 crore for the year ended March 31, 2018 and ` 11 Crore for the year ended March 31, 2017, The present value of obligation and the fair value of plan assets of the trust are summarised below.
(` in Crore)
ParticularsAs at
March 31, 2018As at
March 31, 2017
Fair value of plan assets 181 160 Present value of defined benefit obligations (174) (155)
Net liability arising from defined benefit obligation of trust Nil Nil
Percentage allocation of plan assets of trust
Assets by category As at
March 31, 2018As at
March 31, 2017
Government Securities 53.00% 53.00%Debentures / bonds 42.00% 45.00%Equity 3.00% 0.00%Fixed deposits 2.00% 2.00%
Gratuity plan In accordance with the Payment of Gratuity Act, 1972, the Company contributes to a defined benefit plan (the “Gratuity Plan”) for employees who have completed 5 years of service. The Gratuity Plan provides a lump sum payment to vested employees at retirement, disability or termination of employment being an amount based on the respective employee’s last drawn salary and the number of years of employment with the Company. The Gratuity plan is a funded plan and the Company makes contribution to recognised funds in India. Based on actuarial valuations conducted as at year end, a provision is recognised in full for the benefit obligation over and above the funds held in the Gratuity Plan. Principal actuarial assumptions Principal actuarial assumptions used to determine the present value of the defined benefit obligation are as follows:
Particulars Year ended
March 31, 2018Year ended
March 31, 2017
Discount rate 7.70% 7.60%Expected rate of increase in compensation level of covered employees 2%-10% 5.5%-10%In service mortality IALM
(2006-08)IALM
(2006-08)Post retirement mortality LIC(1996-98)
UltimateLIC(1996-98)
Ultimate
Amount recognised in the balance sheet consists of:
(` in Crore)
Particulars As at
March 31, 2018As at
March 31, 2017
Fair value of plan assets 123 113 Present value of defined benefit obligations (161) (148)
Net liability arising from defined benefit obligation (38) (35)
Amount recognised in the statement of profit and loss in respect of defined benefit plan are as follows:
39 Employee Benefit Plans continued
Notes forming part of the Financial Statementsas at and for the year ended March 31, 2018
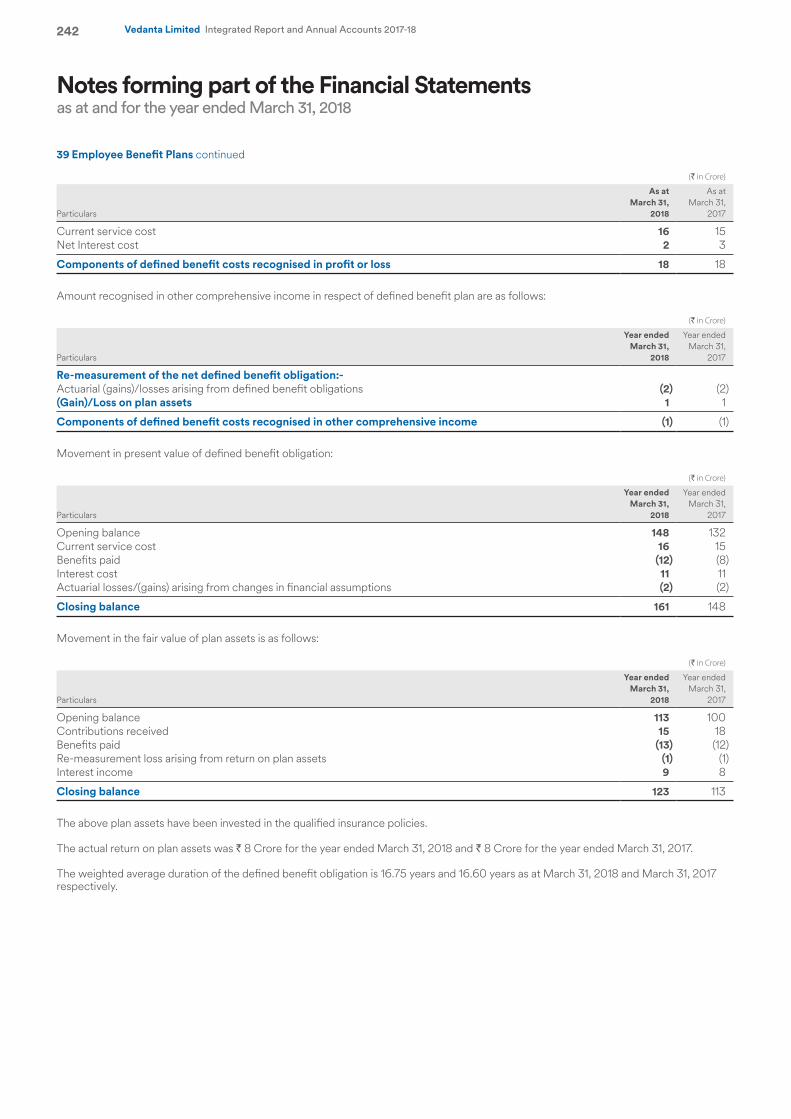
242 Vedanta Limited Integrated Report and Annual Accounts 2017-18
(` in Crore)
Particulars
As at March 31,
2018
As at March 31,
2017
Current service cost 16 15 Net Interest cost 2 3
Components of defined benefit costs recognised in profit or loss 18 18
Amount recognised in other comprehensive income in respect of defined benefit plan are as follows:
(` in Crore)
Particulars
Year ended March 31,
2018
Year ended March 31,
2017
Re-measurement of the net defined benefit obligation:-Actuarial (gains)/losses arising from defined benefit obligations (2) (2)(Gain)/Loss on plan assets 1 1
Components of defined benefit costs recognised in other comprehensive income (1) (1)
Movement in present value of defined benefit obligation:
(` in Crore)
Particulars
Year ended March 31,
2018
Year ended March 31,
2017
Opening balance 148 132 Current service cost 16 15 Benefits paid (12) (8)Interest cost 11 11 Actuarial losses/(gains) arising from changes in financial assumptions (2) (2)
Closing balance 161 148
Movement in the fair value of plan assets is as follows:
(` in Crore)
Particulars
Year ended March 31,
2018
Year ended March 31,
2017
Opening balance 113 100 Contributions received 15 18 Benefits paid (13) (12)Re-measurement loss arising from return on plan assets (1) (1) Interest income 9 8
Closing balance 123 113
The above plan assets have been invested in the qualified insurance policies.
The actual return on plan assets was ` 8 Crore for the year ended March 31, 2018 and ` 8 Crore for the year ended March 31, 2017.
The weighted average duration of the defined benefit obligation is 16.75 years and 16.60 years as at March 31, 2018 and March 31, 2017 respectively.
Notes forming part of the Financial Statementsas at and for the year ended March 31, 2018
39 Employee Benefit Plans continued

243Integrated R
eport
Managem
ent Review
Statutory R
eports
Financial Statements
Vedanta Limited Integrated Report and Annual Accounts 2017-18
The Company expects to contribute ` 20 Crore to the funded defined benefit plans in fiscal year 2019. Sensitivity analysis Below is the sensitivity analysis determined for significant actuarial assumptions for the determination of defined benefit obligations and based on reasonably possible changes of the respective assumptions occurring at the end of the reporting period while holding all other assumptions constant.
(` in Crore)
Increase / (Decrease) in defined benefit obligation
Year ended March 31,
2018
Year ended March 31,
2017
Discount rateIncrease by 0.50% (6) (6)Decrease by 0.50% 6 6Expected rate of increase in compensation level of covered employeesIncrease by 0.50% 7 7Decrease by 0.50% (6) (6)
The above sensitivity analysis may not be representative of the actual benefit obligation as it is unlikely that the change in assumptions would occur in isolation of one another as some of the assumptions may be correlated. In presenting the above sensitivity analysis, the present value of defined benefit obligation has been calculated using the projected unit credit method at the end of reporting period, which is the same as that applied in calculating the defined benefit obligation liability recognized in the balance sheet.
Risk analysis Company is exposed to a number of risks in the defined benefit plans. Most significant risks pertaining to defined benefit plans and, management’s estimation of the impact of these risks are as follows:
Investment risk The Gratuity plan is funded with Life Insurance Corporation of India (LIC) and ICICI Prudential Life (ICICI). Company does not have any liberty to manage the fund provided to LIC and ICICI. The present value of the defined benefit plan liability is calculated using a discount rate determined by reference to Government of India bonds. If the return on plan asset is below this rate, it will create a plan deficit.
Interest risk A decrease in the interest rate on plan assets will increase the plan liability.
Longevity risk / Life expectancy The present value of the defined benefit plan liability is calculated by reference to the best estimate of the mortality of plan participants both during and at the end of the employment. An increase in the life expectancy of the plan participants will increase the plan liability
Salary growth risk The present value of the defined benefit plan liability is calculated by reference to the future salaries of plan participants. An increase in the salary of the plan participants will increase the plan liability.
40 Capital management The Company’s objectives when managing capital is to safeguard continuity, maintain a strong credit rating and healthy capital ratios in order to support its business and provide adequate return to shareholders through continuing growth. The Company’s overall strategy remains unchanged from previous year.
The Company sets the amount of capital required on the basis of annual business and long-term operating plans which include capital and other strategic investments.
The funding requirements are met through a mixture of equity, internal fund generation and other non-current borrowings. The Company’s policy is to use current and non-current borrowings to meet anticipated funding requirements.
The Company monitors capital on the basis of the gearing ratio which is net debt divided by total capital (equity plus net debt) . The Company is not subject to any externally imposed capital requirements.
Net debt are non-current and current debts as reduced by cash and cash equivalents, other bank balances and current investments. Equity comprises all components including other comprehensive income.
Notes forming part of the Financial Statementsas at and for the year ended March 31, 2018
39 Employee Benefit Plans continued
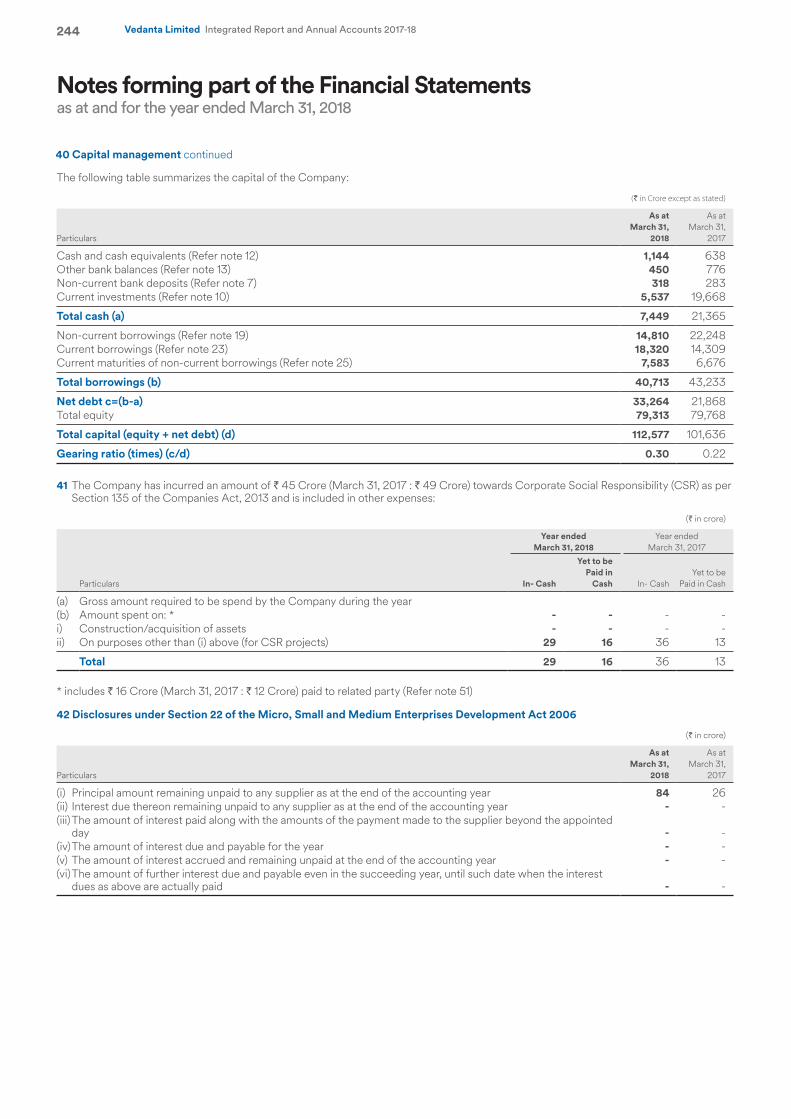
244 Vedanta Limited Integrated Report and Annual Accounts 2017-18
The following table summarizes the capital of the Company:
(` in Crore except as stated)
Particulars
As at March 31,
2018
As at March 31,
2017
Cash and cash equivalents (Refer note 12) 1,144 638 Other bank balances (Refer note 13) 450 776 Non-current bank deposits (Refer note 7) 318 283 Current investments (Refer note 10) 5,537 19,668
Total cash (a) 7,449 21,365
Non-current borrowings (Refer note 19) 14,810 22,248 Current borrowings (Refer note 23) 18,320 14,309 Current maturities of non-current borrowings (Refer note 25) 7,583 6,676
Total borrowings (b) 40,713 43,233
Net debt c=(b-a) 33,264 21,868 Total equity 79,313 79,768
Total capital (equity + net debt) (d) 112,577 101,636
Gearing ratio (times) (c/d) 0.30 0.22
41 The Company has incurred an amount of ` 45 Crore (March 31, 2017 : ` 49 Crore) towards Corporate Social Responsibility (CSR) as per Section 135 of the Companies Act, 2013 and is included in other expenses:
(` in crore)
Particulars
Year ended March 31, 2018
Year ended March 31, 2017
In- Cash
Yet to be Paid in
Cash In- CashYet to be
Paid in Cash
(a) Gross amount required to be spend by the Company during the year(b) Amount spent on: * - - - - i) Construction/acquisition of assets - - - - ii) On purposes other than (i) above (for CSR projects) 29 16 36 13
Total 29 16 36 13
* includes ` 16 Crore (March 31, 2017 : ` 12 Crore) paid to related party (Refer note 51)
42 Disclosures under Section 22 of the Micro, Small and Medium Enterprises Development Act 2006
(` in crore)
Particulars
As at March 31,
2018
As at March 31,
2017
(i) Principal amount remaining unpaid to any supplier as at the end of the accounting year 84 26 (ii) Interest due thereon remaining unpaid to any supplier as at the end of the accounting year - - (iii) The amount of interest paid along with the amounts of the payment made to the supplier beyond the appointed
day - - (iv) The amount of interest due and payable for the year - - (v) The amount of interest accrued and remaining unpaid at the end of the accounting year - - (vi) The amount of further interest due and payable even in the succeeding year, until such date when the interest
dues as above are actually paid - -
Notes forming part of the Financial Statementsas at and for the year ended March 31, 2018
40 Capital management continued
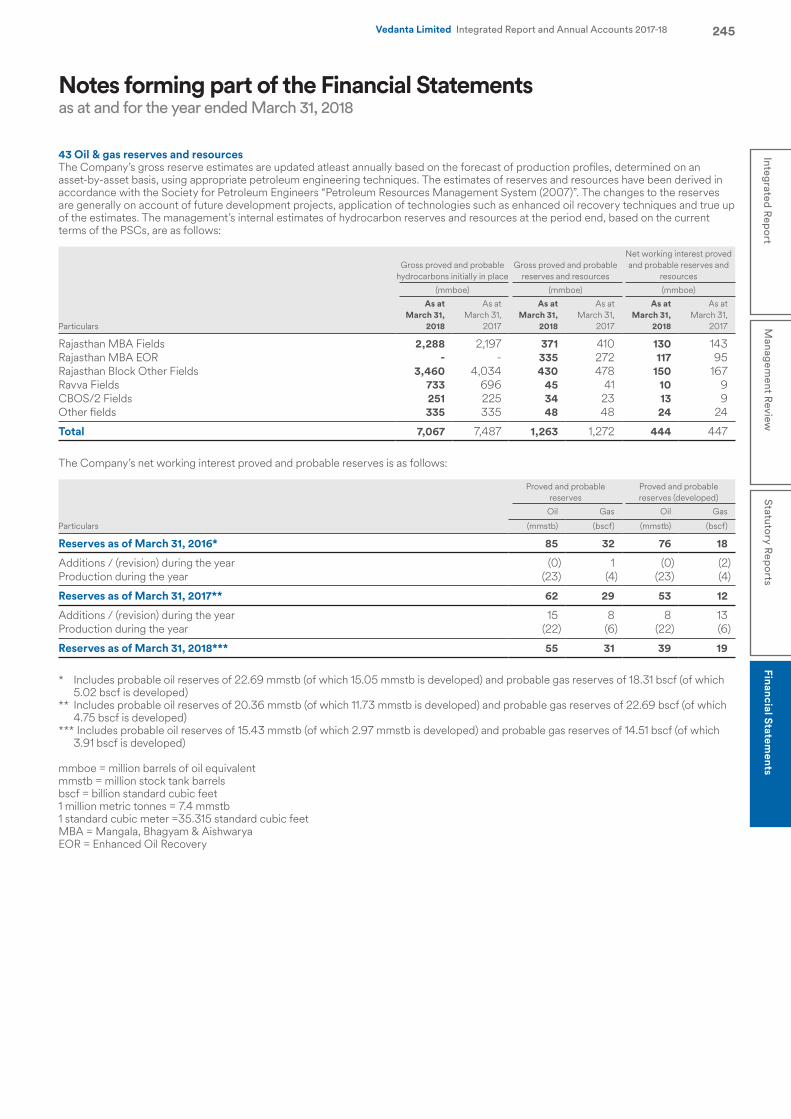
245Integrated R
eport
Managem
ent Review
Statutory R
eports
Financial Statements
Vedanta Limited Integrated Report and Annual Accounts 2017-18
43 Oil & gas reserves and resourcesThe Company’s gross reserve estimates are updated atleast annually based on the forecast of production profiles, determined on an asset-by-asset basis, using appropriate petroleum engineering techniques. The estimates of reserves and resources have been derived in accordance with the Society for Petroleum Engineers “Petroleum Resources Management System (2007)”. The changes to the reserves are generally on account of future development projects, application of technologies such as enhanced oil recovery techniques and true up of the estimates. The management’s internal estimates of hydrocarbon reserves and resources at the period end, based on the current terms of the PSCs, are as follows:
Particulars
Gross proved and probable hydrocarbons initially in place
Gross proved and probable reserves and resources
Net working interest proved and probable reserves and
resources
(mmboe) (mmboe) (mmboe)
As at March 31,
2018
As at March 31,
2017
As at March 31,
2018
As at March 31,
2017
As at March 31,
2018
As at March 31,
2017
Rajasthan MBA Fields 2,288 2,197 371 410 130 143 Rajasthan MBA EOR - - 335 272 117 95 Rajasthan Block Other Fields 3,460 4,034 430 478 150 167 Ravva Fields 733 696 45 41 10 9 CBOS/2 Fields 251 225 34 23 13 9 Other fields 335 335 48 48 24 24
Total 7,067 7,487 1,263 1,272 444 447
The Company’s net working interest proved and probable reserves is as follows:
Particulars
Proved and probable reserves
Proved and probable reserves (developed)
Oil Gas Oil Gas
(mmstb) (bscf) (mmstb) (bscf)
Reserves as of March 31, 2016* 85 32 76 18
Additions / (revision) during the year (0) 1 (0) (2)Production during the year (23) (4) (23) (4)
Reserves as of March 31, 2017** 62 29 53 12
Additions / (revision) during the year 15 8 8 13 Production during the year (22) (6) (22) (6)
Reserves as of March 31, 2018*** 55 31 39 19
* Includes probable oil reserves of 22.69 mmstb (of which 15.05 mmstb is developed) and probable gas reserves of 18.31 bscf (of which 5.02 bscf is developed)
** Includes probable oil reserves of 20.36 mmstb (of which 11.73 mmstb is developed) and probable gas reserves of 22.69 bscf (of which 4.75 bscf is developed)
*** Includes probable oil reserves of 15.43 mmstb (of which 2.97 mmstb is developed) and probable gas reserves of 14.51 bscf (of which 3.91 bscf is developed)
mmboe = million barrels of oil equivalent mmstb = million stock tank barrels bscf = billion standard cubic feet1 million metric tonnes = 7.4 mmstb 1 standard cubic meter =35.315 standard cubic feet MBA = Mangala, Bhagyam & AishwaryaEOR = Enhanced Oil Recovery
Notes forming part of the Financial Statementsas at and for the year ended March 31, 2018
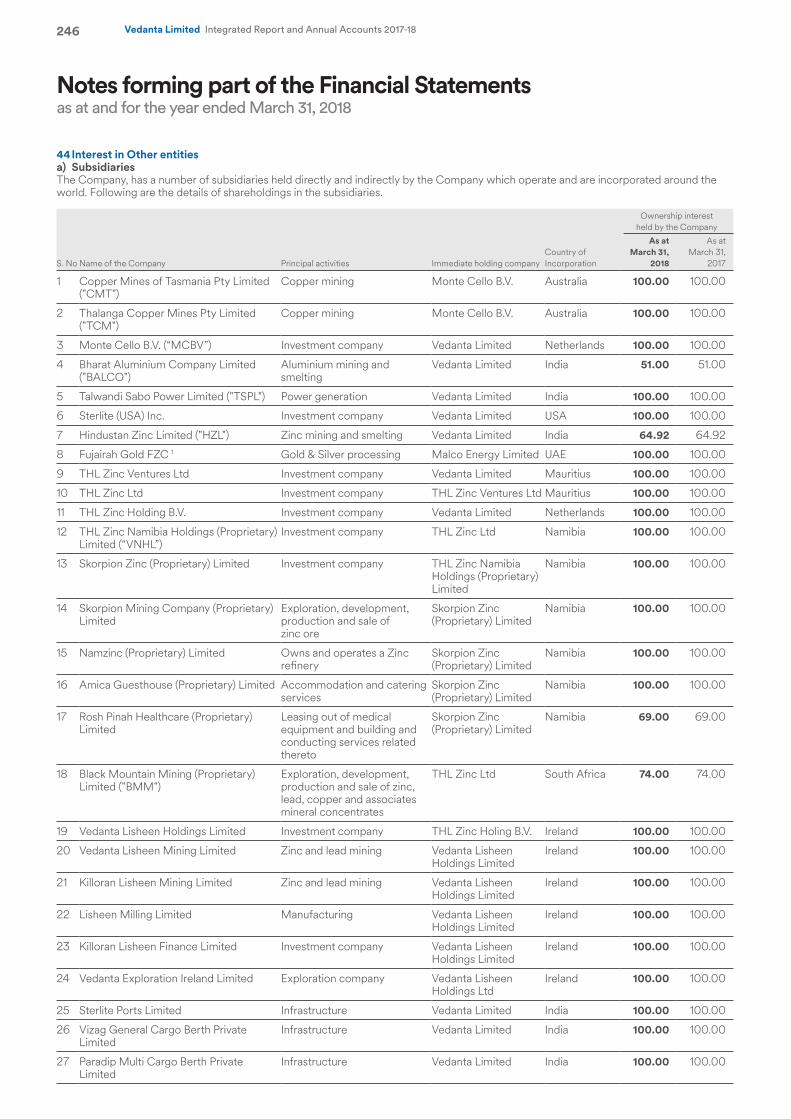
246 Vedanta Limited Integrated Report and Annual Accounts 2017-18
44 Interest in Other entitiesa) SubsidiariesThe Company, has a number of subsidiaries held directly and indirectly by the Company which operate and are incorporated around the world. Following are the details of shareholdings in the subsidiaries.
Ownership interest held by the Company
S. No Name of the Company Principal activities Immediate holding companyCountry of Incorporation
As at March 31,
2018
As at March 31,
2017
1 Copper Mines of Tasmania Pty Limited ("CMT")
Copper mining Monte Cello B.V. Australia 100.00 100.00
2 Thalanga Copper Mines Pty Limited ("TCM")
Copper mining Monte Cello B.V. Australia 100.00 100.00
3 Monte Cello B.V. (“MCBV”) Investment company Vedanta Limited Netherlands 100.00 100.00
4 Bharat Aluminium Company Limited ("BALCO")
Aluminium mining and smelting
Vedanta Limited India 51.00 51.00
5 Talwandi Sabo Power Limited ("TSPL") Power generation Vedanta Limited India 100.00 100.00
6 Sterlite (USA) Inc. Investment company Vedanta Limited USA 100.00 100.00
7 Hindustan Zinc Limited ("HZL") Zinc mining and smelting Vedanta Limited India 64.92 64.92
8 Fujairah Gold FZC 1 Gold & Silver processing Malco Energy Limited UAE 100.00 100.00
9 THL Zinc Ventures Ltd Investment company Vedanta Limited Mauritius 100.00 100.00
10 THL Zinc Ltd Investment company THL Zinc Ventures Ltd Mauritius 100.00 100.00
11 THL Zinc Holding B.V. Investment company Vedanta Limited Netherlands 100.00 100.00
12 THL Zinc Namibia Holdings (Proprietary) Limited (“VNHL”)
Investment company THL Zinc Ltd Namibia 100.00 100.00
13 Skorpion Zinc (Proprietary) Limited Investment company THL Zinc Namibia Holdings (Proprietary) Limited
Namibia 100.00 100.00
14 Skorpion Mining Company (Proprietary) Limited
Exploration, development, production and sale of zinc ore
Skorpion Zinc (Proprietary) Limited
Namibia 100.00 100.00
15 Namzinc (Proprietary) Limited Owns and operates a Zinc refinery
Skorpion Zinc (Proprietary) Limited
Namibia 100.00 100.00
16 Amica Guesthouse (Proprietary) Limited Accommodation and catering services
Skorpion Zinc (Proprietary) Limited
Namibia 100.00 100.00
17 Rosh Pinah Healthcare (Proprietary) Limited
Leasing out of medical equipment and building and conducting services related thereto
Skorpion Zinc (Proprietary) Limited
Namibia 69.00 69.00
18 Black Mountain Mining (Proprietary) Limited ("BMM")
Exploration, development, production and sale of zinc, lead, copper and associates mineral concentrates
THL Zinc Ltd South Africa 74.00 74.00
19 Vedanta Lisheen Holdings Limited Investment company THL Zinc Holing B.V. Ireland 100.00 100.00
20 Vedanta Lisheen Mining Limited Zinc and lead mining Vedanta Lisheen Holdings Limited
Ireland 100.00 100.00
21 Killoran Lisheen Mining Limited Zinc and lead mining Vedanta Lisheen Holdings Limited
Ireland 100.00 100.00
22 Lisheen Milling Limited Manufacturing Vedanta Lisheen Holdings Limited
Ireland 100.00 100.00
23 Killoran Lisheen Finance Limited Investment company Vedanta Lisheen Holdings Limited
Ireland 100.00 100.00
24 Vedanta Exploration Ireland Limited Exploration company Vedanta Lisheen Holdings Ltd
Ireland 100.00 100.00
25 Sterlite Ports Limited Infrastructure Vedanta Limited India 100.00 100.00
26 Vizag General Cargo Berth Private Limited
Infrastructure Vedanta Limited India 100.00 100.00
27 Paradip Multi Cargo Berth Private Limited
Infrastructure Vedanta Limited India 100.00 100.00
Notes forming part of the Financial Statementsas at and for the year ended March 31, 2018
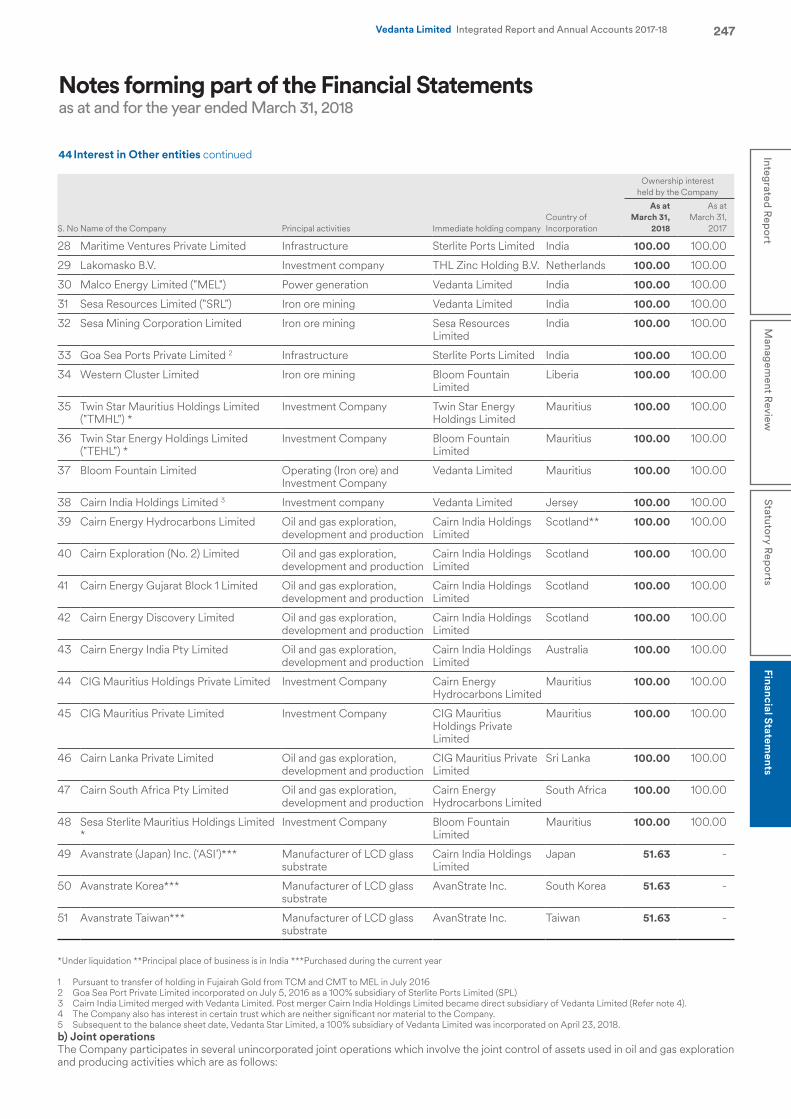
247Integrated R
eport
Managem
ent Review
Statutory R
eports
Financial Statements
Vedanta Limited Integrated Report and Annual Accounts 2017-18
Ownership interest held by the Company
S. No Name of the Company Principal activities Immediate holding companyCountry of Incorporation
As at March 31,
2018
As at March 31,
2017
28 Maritime Ventures Private Limited Infrastructure Sterlite Ports Limited India 100.00 100.00
29 Lakomasko B.V. Investment company THL Zinc Holding B.V. Netherlands 100.00 100.00
30 Malco Energy Limited ("MEL") Power generation Vedanta Limited India 100.00 100.00
31 Sesa Resources Limited ("SRL") Iron ore mining Vedanta Limited India 100.00 100.00
32 Sesa Mining Corporation Limited Iron ore mining Sesa Resources Limited
India 100.00 100.00
33 Goa Sea Ports Private Limited 2 Infrastructure Sterlite Ports Limited India 100.00 100.00
34 Western Cluster Limited Iron ore mining Bloom Fountain Limited
Liberia 100.00 100.00
35 Twin Star Mauritius Holdings Limited ("TMHL") *
Investment Company Twin Star Energy Holdings Limited
Mauritius 100.00 100.00
36 Twin Star Energy Holdings Limited ("TEHL") *
Investment Company Bloom Fountain Limited
Mauritius 100.00 100.00
37 Bloom Fountain Limited Operating (Iron ore) and Investment Company
Vedanta Limited Mauritius 100.00 100.00
38 Cairn India Holdings Limited 3 Investment company Vedanta Limited Jersey 100.00 100.00
39 Cairn Energy Hydrocarbons Limited Oil and gas exploration, development and production
Cairn India Holdings Limited
Scotland** 100.00 100.00
40 Cairn Exploration (No. 2) Limited Oil and gas exploration, development and production
Cairn India Holdings Limited
Scotland 100.00 100.00
41 Cairn Energy Gujarat Block 1 Limited Oil and gas exploration, development and production
Cairn India Holdings Limited
Scotland 100.00 100.00
42 Cairn Energy Discovery Limited Oil and gas exploration, development and production
Cairn India Holdings Limited
Scotland 100.00 100.00
43 Cairn Energy India Pty Limited Oil and gas exploration, development and production
Cairn India Holdings Limited
Australia 100.00 100.00
44 CIG Mauritius Holdings Private Limited Investment Company Cairn Energy Hydrocarbons Limited
Mauritius 100.00 100.00
45 CIG Mauritius Private Limited Investment Company CIG Mauritius Holdings Private Limited
Mauritius 100.00 100.00
46 Cairn Lanka Private Limited Oil and gas exploration, development and production
CIG Mauritius Private Limited
Sri Lanka 100.00 100.00
47 Cairn South Africa Pty Limited Oil and gas exploration, development and production
Cairn Energy Hydrocarbons Limited
South Africa 100.00 100.00
48 Sesa Sterlite Mauritius Holdings Limited *
Investment Company Bloom Fountain Limited
Mauritius 100.00 100.00
49 Avanstrate (Japan) Inc. (‘ASI’)*** Manufacturer of LCD glass substrate
Cairn India Holdings Limited
Japan 51.63 -
50 Avanstrate Korea*** Manufacturer of LCD glass substrate
AvanStrate Inc. South Korea 51.63 -
51 Avanstrate Taiwan*** Manufacturer of LCD glass substrate
AvanStrate Inc. Taiwan 51.63 -
*Under liquidation **Principal place of business is in India ***Purchased during the current year
1 Pursuant to transfer of holding in Fujairah Gold from TCM and CMT to MEL in July 20162 Goa Sea Port Private Limited incorporated on July 5, 2016 as a 100% subsidiary of Sterlite Ports Limited (SPL)3 Cairn India Limited merged with Vedanta Limited. Post merger Cairn India Holdings Limited became direct subsidiary of Vedanta Limited (Refer note 4).4 The Company also has interest in certain trust which are neither significant nor material to the Company.5 Subsequent to the balance sheet date, Vedanta Star Limited, a 100% subsidiary of Vedanta Limited was incorporated on April 23, 2018. b) Joint operationsThe Company participates in several unincorporated joint operations which involve the joint control of assets used in oil and gas exploration and producing activities which are as follows:
44 Interest in Other entities continued
Notes forming part of the Financial Statementsas at and for the year ended March 31, 2018
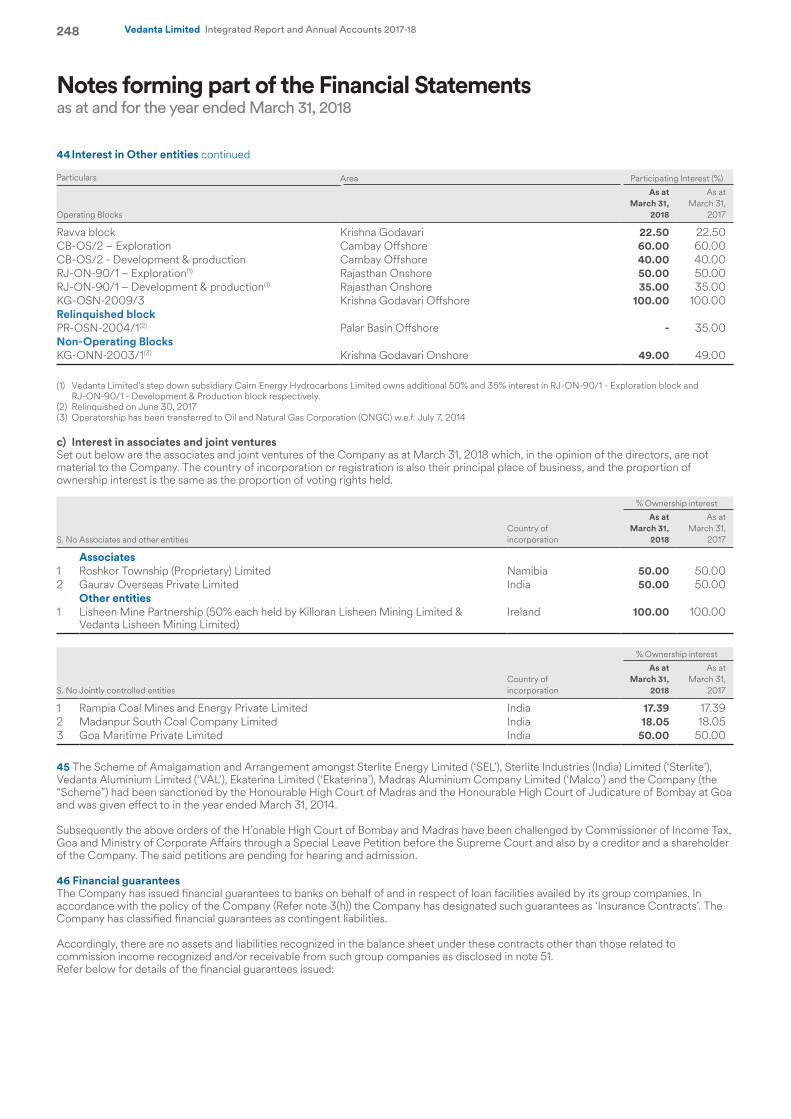
248 Vedanta Limited Integrated Report and Annual Accounts 2017-18
Particulars Area Participating Interest (%)
Operating Blocks
As at March 31,
2018
As at March 31,
2017
Ravva block Krishna Godavari 22.50 22.50 CB-OS/2 – Exploration Cambay Offshore 60.00 60.00 CB-OS/2 - Development & production Cambay Offshore 40.00 40.00 RJ-ON-90/1 – Exploration(1) Rajasthan Onshore 50.00 50.00 RJ-ON-90/1 – Development & production(1) Rajasthan Onshore 35.00 35.00 KG-OSN-2009/3 Krishna Godavari Offshore 100.00 100.00 Relinquished blockPR-OSN-2004/1(2) Palar Basin Offshore - 35.00 Non-Operating Blocks KG-ONN-2003/1(3) Krishna Godavari Onshore 49.00 49.00
(1) Vedanta Limited’s step down subsidiary Cairn Energy Hydrocarbons Limited owns additional 50% and 35% interest in RJ-ON-90/1 - Exploration block and RJ-ON-90/1 - Development & Production block respectively.
(2) Relinquished on June 30, 2017(3) Operatorship has been transferred to Oil and Natural Gas Corporation (ONGC) w.e.f. July 7, 2014
c) Interest in associates and joint ventures Set out below are the associates and joint ventures of the Company as at March 31, 2018 which, in the opinion of the directors, are not material to the Company. The country of incorporation or registration is also their principal place of business, and the proportion of ownership interest is the same as the proportion of voting rights held.
% Ownership interest
S. No Associates and other entitiesCountry of incorporation
As at March 31,
2018
As at March 31,
2017
Associates1 Roshkor Township (Proprietary) Limited Namibia 50.00 50.00 2 Gaurav Overseas Private Limited India 50.00 50.00
Other entities1 Lisheen Mine Partnership (50% each held by Killoran Lisheen Mining Limited &
Vedanta Lisheen Mining Limited)Ireland 100.00 100.00
% Ownership interest
S. No Jointly controlled entitiesCountry of incorporation
As at March 31,
2018
As at March 31,
2017
1 Rampia Coal Mines and Energy Private Limited India 17.39 17.39 2 Madanpur South Coal Company Limited India 18.05 18.05 3 Goa Maritime Private Limited India 50.00 50.00
45 The Scheme of Amalgamation and Arrangement amongst Sterlite Energy Limited (‘SEL’), Sterlite Industries (India) Limited (‘Sterlite’), Vedanta Aluminium Limited (‘VAL’), Ekaterina Limited (‘Ekaterina’), Madras Aluminium Company Limited (‘Malco’) and the Company (the “Scheme”) had been sanctioned by the Honourable High Court of Madras and the Honourable High Court of Judicature of Bombay at Goa and was given effect to in the year ended March 31, 2014.
Subsequently the above orders of the H’onable High Court of Bombay and Madras have been challenged by Commissioner of Income Tax, Goa and Ministry of Corporate Affairs through a Special Leave Petition before the Supreme Court and also by a creditor and a shareholder of the Company. The said petitions are pending for hearing and admission.
46 Financial guaranteesThe Company has issued financial guarantees to banks on behalf of and in respect of loan facilities availed by its group companies. In accordance with the policy of the Company (Refer note 3(h)) the Company has designated such guarantees as ‘Insurance Contracts’. The Company has classified financial guarantees as contingent liabilities.
Accordingly, there are no assets and liabilities recognized in the balance sheet under these contracts other than those related to commission income recognized and/or receivable from such group companies as disclosed in note 51.Refer below for details of the financial guarantees issued:
44 Interest in Other entities continued
Notes forming part of the Financial Statementsas at and for the year ended March 31, 2018

249Integrated R
eport
Managem
ent Review
Statutory R
eports
Financial Statements
Vedanta Limited Integrated Report and Annual Accounts 2017-18
(` in crore)
Company Name
As at March 31,
2018
As at March 31,
2017 Purpose
Talwandi Sabo Power Limited 9,000 10,693 Borrowing for long term power agreement.
Vizag General Cargo Berth Private Limited 483 458 Buyers credit for capital expenditure, custom bonds and term loan facility.
Bharat Aluminium Company Limited - 2,500 Short term commercial paper
Copper Mines of Tasmania Pty Limited 31 30 Environmental and closure obligations relating to Mining leases granted
Thalanga Copper Mines Pty Limited 23 23 Environmental and closure obligations relating to Mining leases granted
Western Cluster Limited - 32 Extending banking facilities Cairn India Holdings Limited 3,224 - For the purpose of external borrowings.
47 LeasesOperating lease commitments – as lesseeThe Company is having an operating lease in relation to the office premises, with a non-cancellable lease period of 3 years. There are no restrictions imposed by lease arrangements and there are no subleases. There are no contingent rents. The information required with respect to non-cancellable leases are as follow:
(` in crore)
Particulars
As at March 31,
2018
As at March 31,
2017
Within one year 1 1 Later than one year but not later than five years 0 1Later than five years - 0
Total 1 2
Lease payments recognized as expenses on non-cancellable lease during the year is ` 1 Crore (March 31, 2017: ` 28Crore)
48 Financial instrumentsThis section gives an overview of the significance of financial instruments for the Company and provides additional information on the balance sheet. Details of significant accounting policies, including the criteria for recognition, the basis of measurement and the basis on which income and expenses are recognised, in respect of each class of financial asset, financial liability and equity instrument are disclosed in Note 2 and Note 3.
A. Financial assets and liabilities:The accounting classification of each category of financial instruments, and their carrying amounts, are set out below:
As at March 31, 2018 (` in crore)
Financial Assets
Fair value through profit or
loss
Fair value through
other comprehen-sive income
Amortised cost
Total carrying
valueTotal fair
value
Investments* 5,537 160 - 5,697 5,697 Trade receivables - - 2,439 2,439 2,439 Cash and cash equivalents - - 1,144 1,144 1,144 Other bank balances - - 450 450 450 Loans - - 14 14 14 Derivatives 20 82 - 102 102 Other financial assets - - 3,446 3,446 3,446
Total 5,557 242 7,493 13,292 13,292
(` in crore)
Financial Liabilities
Fair value through profit or
loss
Fair value through
other comprehen-sive income
Amortised cost
Total carrying
valueTotal fair
value
Borrowings - - 40,713 40,713 40,762 Trade payables - - 14,066 14,066 14,066 Derivatives 26 0 - 26 26 Other financial liabilities - - 4,705 4,705 4,705
Total 26 0 59,484 59,510 59,559
Notes forming part of the Financial Statementsas at and for the year ended March 31, 2018
46 Financial guarantees continued
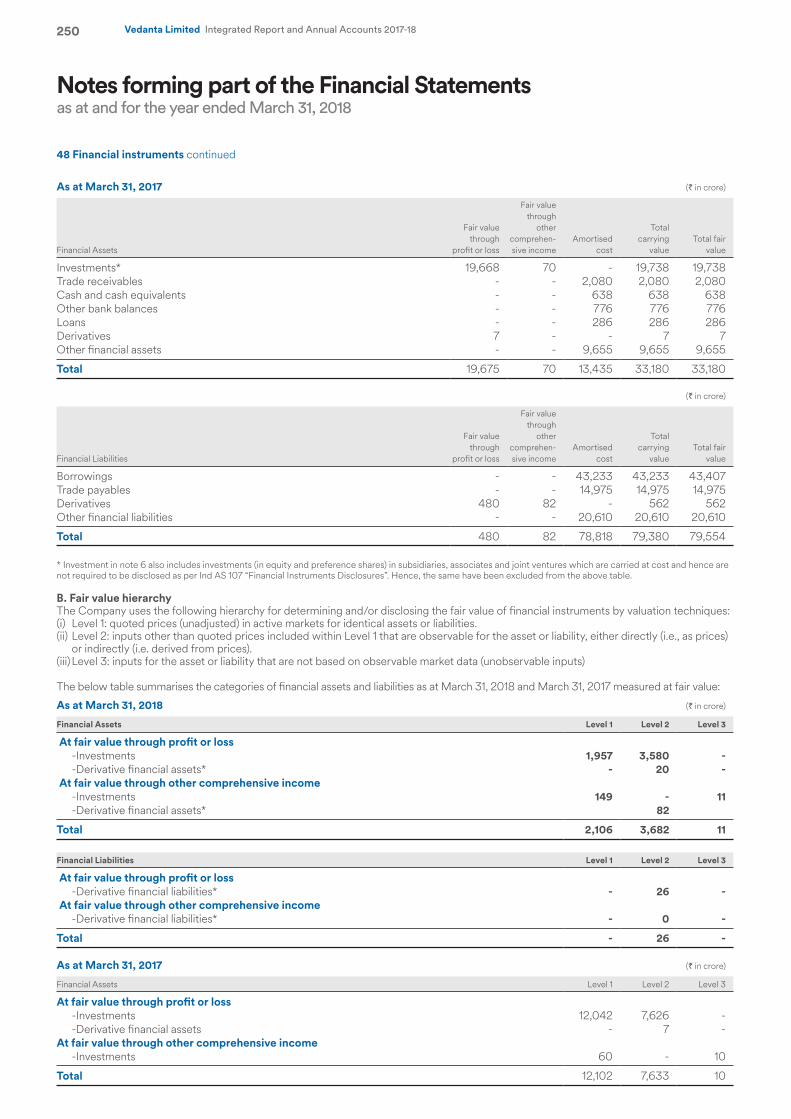
250 Vedanta Limited Integrated Report and Annual Accounts 2017-18
As at March 31, 2017 (` in crore)
Financial Assets
Fair value through
profit or loss
Fair value through
other comprehen-sive income
Amortised cost
Total carrying
valueTotal fair
value
Investments* 19,668 70 - 19,738 19,738 Trade receivables - - 2,080 2,080 2,080 Cash and cash equivalents - - 638 638 638 Other bank balances - - 776 776 776 Loans - - 286 286 286 Derivatives 7 - - 7 7 Other financial assets - - 9,655 9,655 9,655
Total 19,675 70 13,435 33,180 33,180
(` in crore)
Financial Liabilities
Fair value through
profit or loss
Fair value through
other comprehen-sive income
Amortised cost
Total carrying
valueTotal fair
value
Borrowings - - 43,233 43,233 43,407 Trade payables - - 14,975 14,975 14,975 Derivatives 480 82 - 562 562 Other financial liabilities - - 20,610 20,610 20,610
Total 480 82 78,818 79,380 79,554
* Investment in note 6 also includes investments (in equity and preference shares) in subsidiaries, associates and joint ventures which are carried at cost and hence are not required to be disclosed as per Ind AS 107 “Financial Instruments Disclosures”. Hence, the same have been excluded from the above table.
B. Fair value hierarchyThe Company uses the following hierarchy for determining and/or disclosing the fair value of financial instruments by valuation techniques:(i) Level 1: quoted prices (unadjusted) in active markets for identical assets or liabilities.(ii) Level 2: inputs other than quoted prices included within Level 1 that are observable for the asset or liability, either directly (i.e., as prices)
or indirectly (i.e. derived from prices).(iii) Level 3: inputs for the asset or liability that are not based on observable market data (unobservable inputs)
The below table summarises the categories of financial assets and liabilities as at March 31, 2018 and March 31, 2017 measured at fair value:
As at March 31, 2018 (` in crore)
Financial Assets Level 1 Level 2 Level 3
At fair value through profit or loss -Investments 1,957 3,580 - -Derivative financial assets* - 20 - At fair value through other comprehensive income -Investments 149 - 11 -Derivative financial assets* 82
Total 2,106 3,682 11
Financial Liabilities Level 1 Level 2 Level 3
At fair value through profit or loss -Derivative financial liabilities* - 26 - At fair value through other comprehensive income -Derivative financial liabilities* - 0 -
Total - 26 -
As at March 31, 2017 (` in crore)
Financial Assets Level 1 Level 2 Level 3
At fair value through profit or loss -Investments 12,042 7,626 - -Derivative financial assets - 7 - At fair value through other comprehensive income -Investments 60 - 10
Total 12,102 7,633 10
Notes forming part of the Financial Statementsas at and for the year ended March 31, 2018
48 Financial instruments continued
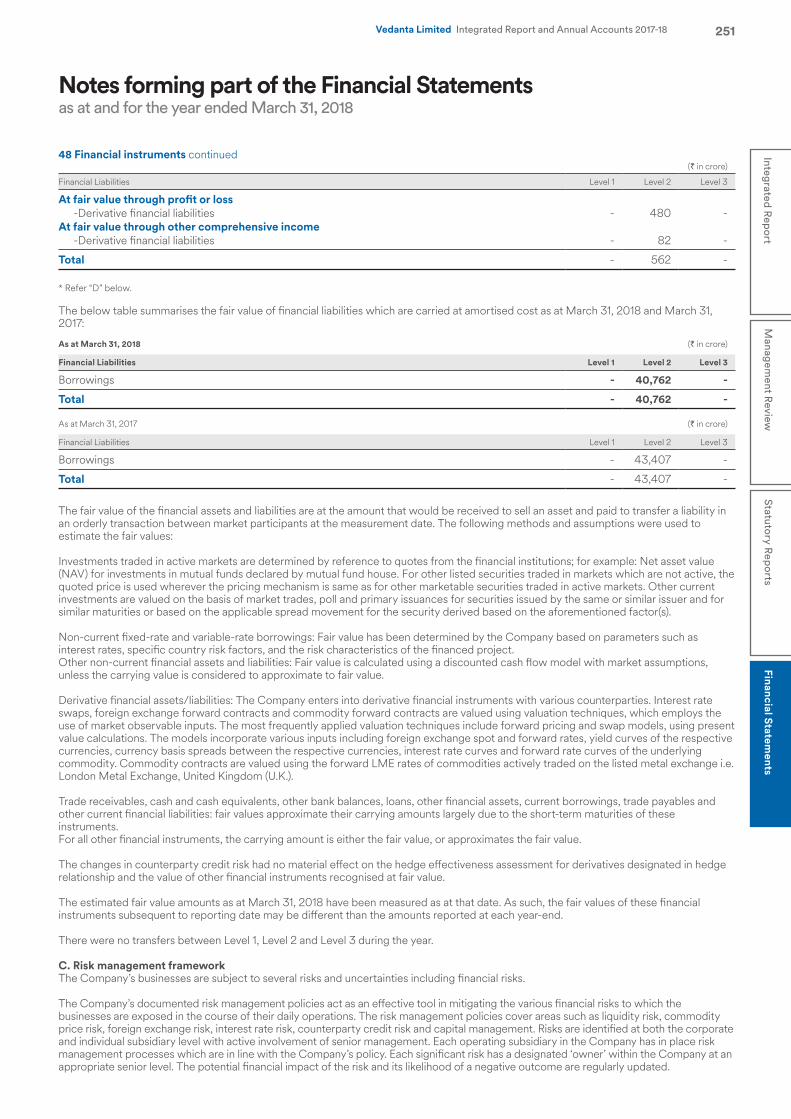
251Integrated R
eport
Managem
ent Review
Statutory R
eports
Financial Statements
Vedanta Limited Integrated Report and Annual Accounts 2017-18
(` in crore)
Financial Liabilities Level 1 Level 2 Level 3
At fair value through profit or loss -Derivative financial liabilities - 480 - At fair value through other comprehensive income -Derivative financial liabilities - 82 -
Total - 562 -
* Refer “D” below.
The below table summarises the fair value of financial liabilities which are carried at amortised cost as at March 31, 2018 and March 31, 2017:
As at March 31, 2018 (` in crore)
Financial Liabilities Level 1 Level 2 Level 3
Borrowings - 40,762 -
Total - 40,762 -
As at March 31, 2017 (` in crore)
Financial Liabilities Level 1 Level 2 Level 3
Borrowings - 43,407 -
Total - 43,407 -
The fair value of the financial assets and liabilities are at the amount that would be received to sell an asset and paid to transfer a liability in an orderly transaction between market participants at the measurement date. The following methods and assumptions were used to estimate the fair values:
Investments traded in active markets are determined by reference to quotes from the financial institutions; for example: Net asset value (NAV) for investments in mutual funds declared by mutual fund house. For other listed securities traded in markets which are not active, the quoted price is used wherever the pricing mechanism is same as for other marketable securities traded in active markets. Other current investments are valued on the basis of market trades, poll and primary issuances for securities issued by the same or similar issuer and for similar maturities or based on the applicable spread movement for the security derived based on the aforementioned factor(s).
Non-current fixed-rate and variable-rate borrowings: Fair value has been determined by the Company based on parameters such as interest rates, specific country risk factors, and the risk characteristics of the financed project.Other non-current financial assets and liabilities: Fair value is calculated using a discounted cash flow model with market assumptions, unless the carrying value is considered to approximate to fair value.
Derivative financial assets/liabilities: The Company enters into derivative financial instruments with various counterparties. Interest rate swaps, foreign exchange forward contracts and commodity forward contracts are valued using valuation techniques, which employs the use of market observable inputs. The most frequently applied valuation techniques include forward pricing and swap models, using present value calculations. The models incorporate various inputs including foreign exchange spot and forward rates, yield curves of the respective currencies, currency basis spreads between the respective currencies, interest rate curves and forward rate curves of the underlying commodity. Commodity contracts are valued using the forward LME rates of commodities actively traded on the listed metal exchange i.e. London Metal Exchange, United Kingdom (U.K.).
Trade receivables, cash and cash equivalents, other bank balances, loans, other financial assets, current borrowings, trade payables and other current financial liabilities: fair values approximate their carrying amounts largely due to the short-term maturities of these instruments.For all other financial instruments, the carrying amount is either the fair value, or approximates the fair value.
The changes in counterparty credit risk had no material effect on the hedge effectiveness assessment for derivatives designated in hedge relationship and the value of other financial instruments recognised at fair value.
The estimated fair value amounts as at March 31, 2018 have been measured as at that date. As such, the fair values of these financial instruments subsequent to reporting date may be different than the amounts reported at each year-end.
There were no transfers between Level 1, Level 2 and Level 3 during the year.
C. Risk management frameworkThe Company’s businesses are subject to several risks and uncertainties including financial risks.
The Company’s documented risk management policies act as an effective tool in mitigating the various financial risks to which the businesses are exposed in the course of their daily operations. The risk management policies cover areas such as liquidity risk, commodity price risk, foreign exchange risk, interest rate risk, counterparty credit risk and capital management. Risks are identified at both the corporate and individual subsidiary level with active involvement of senior management. Each operating subsidiary in the Company has in place risk management processes which are in line with the Company’s policy. Each significant risk has a designated ‘owner’ within the Company at an appropriate senior level. The potential financial impact of the risk and its likelihood of a negative outcome are regularly updated.
Notes forming part of the Financial Statementsas at and for the year ended March 31, 2018
48 Financial instruments continued
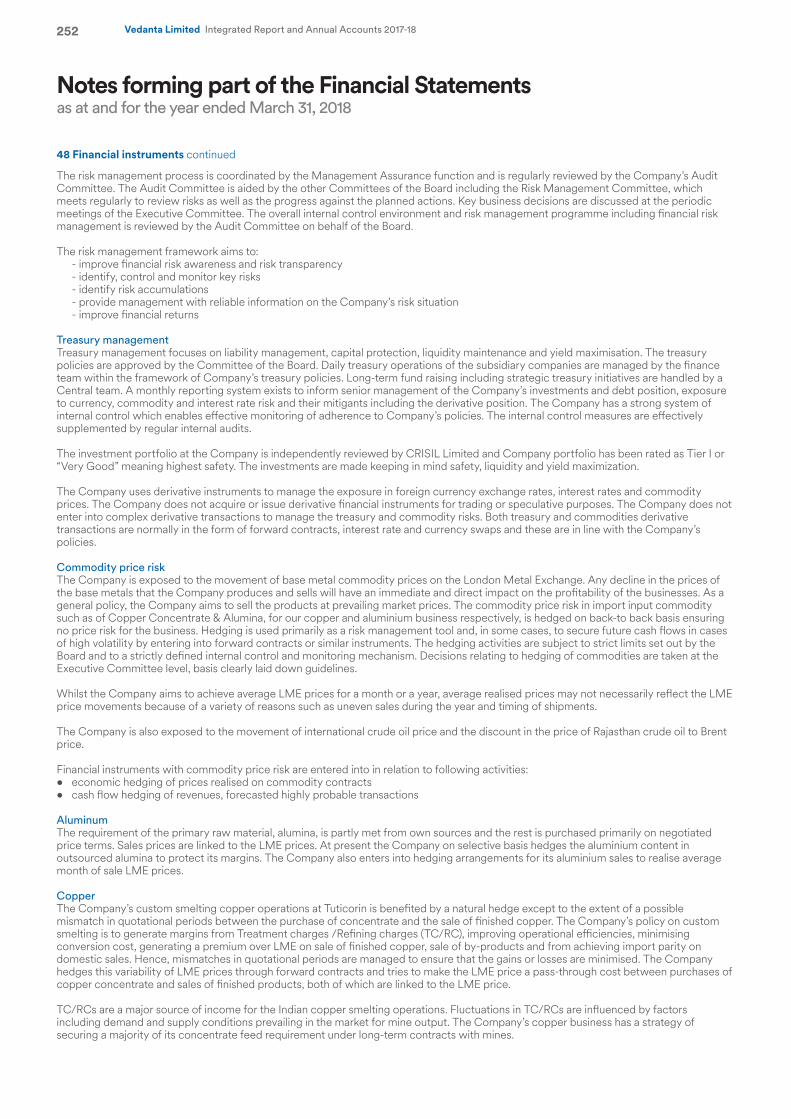
252 Vedanta Limited Integrated Report and Annual Accounts 2017-18
The risk management process is coordinated by the Management Assurance function and is regularly reviewed by the Company’s Audit Committee. The Audit Committee is aided by the other Committees of the Board including the Risk Management Committee, which meets regularly to review risks as well as the progress against the planned actions. Key business decisions are discussed at the periodic meetings of the Executive Committee. The overall internal control environment and risk management programme including financial risk management is reviewed by the Audit Committee on behalf of the Board.
The risk management framework aims to: - improve financial risk awareness and risk transparency - identify, control and monitor key risks - identify risk accumulations - provide management with reliable information on the Company’s risk situation - improve financial returns
Treasury managementTreasury management focuses on liability management, capital protection, liquidity maintenance and yield maximisation. The treasury policies are approved by the Committee of the Board. Daily treasury operations of the subsidiary companies are managed by the finance team within the framework of Company’s treasury policies. Long-term fund raising including strategic treasury initiatives are handled by a Central team. A monthly reporting system exists to inform senior management of the Company’s investments and debt position, exposure to currency, commodity and interest rate risk and their mitigants including the derivative position. The Company has a strong system of internal control which enables effective monitoring of adherence to Company’s policies. The internal control measures are effectively supplemented by regular internal audits.
The investment portfolio at the Company is independently reviewed by CRISIL Limited and Company portfolio has been rated as Tier I or “Very Good” meaning highest safety. The investments are made keeping in mind safety, liquidity and yield maximization.
The Company uses derivative instruments to manage the exposure in foreign currency exchange rates, interest rates and commodity prices. The Company does not acquire or issue derivative financial instruments for trading or speculative purposes. The Company does not enter into complex derivative transactions to manage the treasury and commodity risks. Both treasury and commodities derivative transactions are normally in the form of forward contracts, interest rate and currency swaps and these are in line with the Company’s policies.
Commodity price riskThe Company is exposed to the movement of base metal commodity prices on the London Metal Exchange. Any decline in the prices of the base metals that the Company produces and sells will have an immediate and direct impact on the profitability of the businesses. As a general policy, the Company aims to sell the products at prevailing market prices. The commodity price risk in import input commodity such as of Copper Concentrate & Alumina, for our copper and aluminium business respectively, is hedged on back-to back basis ensuring no price risk for the business. Hedging is used primarily as a risk management tool and, in some cases, to secure future cash flows in cases of high volatility by entering into forward contracts or similar instruments. The hedging activities are subject to strict limits set out by the Board and to a strictly defined internal control and monitoring mechanism. Decisions relating to hedging of commodities are taken at the Executive Committee level, basis clearly laid down guidelines.
Whilst the Company aims to achieve average LME prices for a month or a year, average realised prices may not necessarily reflect the LME price movements because of a variety of reasons such as uneven sales during the year and timing of shipments. The Company is also exposed to the movement of international crude oil price and the discount in the price of Rajasthan crude oil to Brent price.
Financial instruments with commodity price risk are entered into in relation to following activities:• economic hedging of prices realised on commodity contracts• cash flow hedging of revenues, forecasted highly probable transactions
AluminumThe requirement of the primary raw material, alumina, is partly met from own sources and the rest is purchased primarily on negotiated price terms. Sales prices are linked to the LME prices. At present the Company on selective basis hedges the aluminium content in outsourced alumina to protect its margins. The Company also enters into hedging arrangements for its aluminium sales to realise average month of sale LME prices.
CopperThe Company’s custom smelting copper operations at Tuticorin is benefited by a natural hedge except to the extent of a possible mismatch in quotational periods between the purchase of concentrate and the sale of finished copper. The Company’s policy on custom smelting is to generate margins from Treatment charges /Refining charges (TC/RC), improving operational efficiencies, minimising conversion cost, generating a premium over LME on sale of finished copper, sale of by-products and from achieving import parity on domestic sales. Hence, mismatches in quotational periods are managed to ensure that the gains or losses are minimised. The Company hedges this variability of LME prices through forward contracts and tries to make the LME price a pass-through cost between purchases of copper concentrate and sales of finished products, both of which are linked to the LME price.
TC/RCs are a major source of income for the Indian copper smelting operations. Fluctuations in TC/RCs are influenced by factors including demand and supply conditions prevailing in the market for mine output. The Company’s copper business has a strategy of securing a majority of its concentrate feed requirement under long-term contracts with mines.
Notes forming part of the Financial Statementsas at and for the year ended March 31, 2018
48 Financial instruments continued
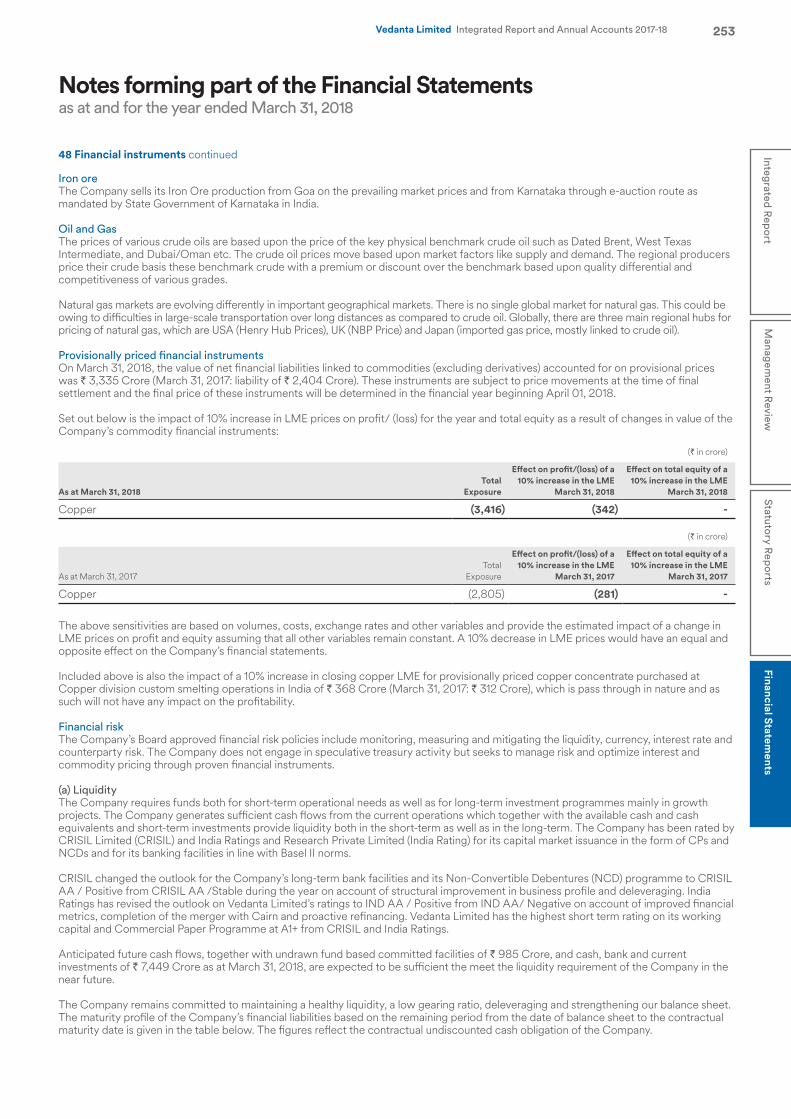
253Integrated R
eport
Managem
ent Review
Statutory R
eports
Financial Statements
Vedanta Limited Integrated Report and Annual Accounts 2017-18
Iron oreThe Company sells its Iron Ore production from Goa on the prevailing market prices and from Karnataka through e-auction route as mandated by State Government of Karnataka in India.
Oil and GasThe prices of various crude oils are based upon the price of the key physical benchmark crude oil such as Dated Brent, West Texas Intermediate, and Dubai/Oman etc. The crude oil prices move based upon market factors like supply and demand. The regional producers price their crude basis these benchmark crude with a premium or discount over the benchmark based upon quality differential and competitiveness of various grades.
Natural gas markets are evolving differently in important geographical markets. There is no single global market for natural gas. This could be owing to difficulties in large-scale transportation over long distances as compared to crude oil. Globally, there are three main regional hubs for pricing of natural gas, which are USA (Henry Hub Prices), UK (NBP Price) and Japan (imported gas price, mostly linked to crude oil).
Provisionally priced financial instrumentsOn March 31, 2018, the value of net financial liabilities linked to commodities (excluding derivatives) accounted for on provisional prices was ` 3,335 Crore (March 31, 2017: liability of ` 2,404 Crore). These instruments are subject to price movements at the time of final settlement and the final price of these instruments will be determined in the financial year beginning April 01, 2018.
Set out below is the impact of 10% increase in LME prices on profit/ (loss) for the year and total equity as a result of changes in value of the Company’s commodity financial instruments:
(` in crore)
As at March 31, 2018Total
Exposure
Effect on profit/(loss) of a 10% increase in the LME
March 31, 2018
Effect on total equity of a 10% increase in the LME
March 31, 2018
Copper (3,416) (342) -
(` in crore)
As at March 31, 2017Total
Exposure
Effect on profit/(loss) of a 10% increase in the LME
March 31, 2017
Effect on total equity of a 10% increase in the LME
March 31, 2017
Copper (2,805) (281) -
The above sensitivities are based on volumes, costs, exchange rates and other variables and provide the estimated impact of a change in LME prices on profit and equity assuming that all other variables remain constant. A 10% decrease in LME prices would have an equal and opposite effect on the Company’s financial statements.
Included above is also the impact of a 10% increase in closing copper LME for provisionally priced copper concentrate purchased at Copper division custom smelting operations in India of ` 368 Crore (March 31, 2017: ` 312 Crore), which is pass through in nature and as such will not have any impact on the profitability.
Financial riskThe Company’s Board approved financial risk policies include monitoring, measuring and mitigating the liquidity, currency, interest rate and counterparty risk. The Company does not engage in speculative treasury activity but seeks to manage risk and optimize interest and commodity pricing through proven financial instruments.
(a) LiquidityThe Company requires funds both for short-term operational needs as well as for long-term investment programmes mainly in growth projects. The Company generates sufficient cash flows from the current operations which together with the available cash and cash equivalents and short-term investments provide liquidity both in the short-term as well as in the long-term. The Company has been rated by CRISIL Limited (CRISIL) and India Ratings and Research Private Limited (India Rating) for its capital market issuance in the form of CPs and NCDs and for its banking facilities in line with Basel II norms.
CRISIL changed the outlook for the Company’s long-term bank facilities and its Non-Convertible Debentures (NCD) programme to CRISIL AA / Positive from CRISIL AA /Stable during the year on account of structural improvement in business profile and deleveraging. India Ratings has revised the outlook on Vedanta Limited’s ratings to IND AA / Positive from IND AA/ Negative on account of improved financial metrics, completion of the merger with Cairn and proactive refinancing. Vedanta Limited has the highest short term rating on its working capital and Commercial Paper Programme at A1+ from CRISIL and India Ratings.
Anticipated future cash flows, together with undrawn fund based committed facilities of ` 985 Crore, and cash, bank and current investments of ` 7,449 Crore as at March 31, 2018, are expected to be sufficient the meet the liquidity requirement of the Company in the near future.
The Company remains committed to maintaining a healthy liquidity, a low gearing ratio, deleveraging and strengthening our balance sheet. The maturity profile of the Company’s financial liabilities based on the remaining period from the date of balance sheet to the contractual maturity date is given in the table below. The figures reflect the contractual undiscounted cash obligation of the Company.
Notes forming part of the Financial Statementsas at and for the year ended March 31, 2018
48 Financial instruments continued
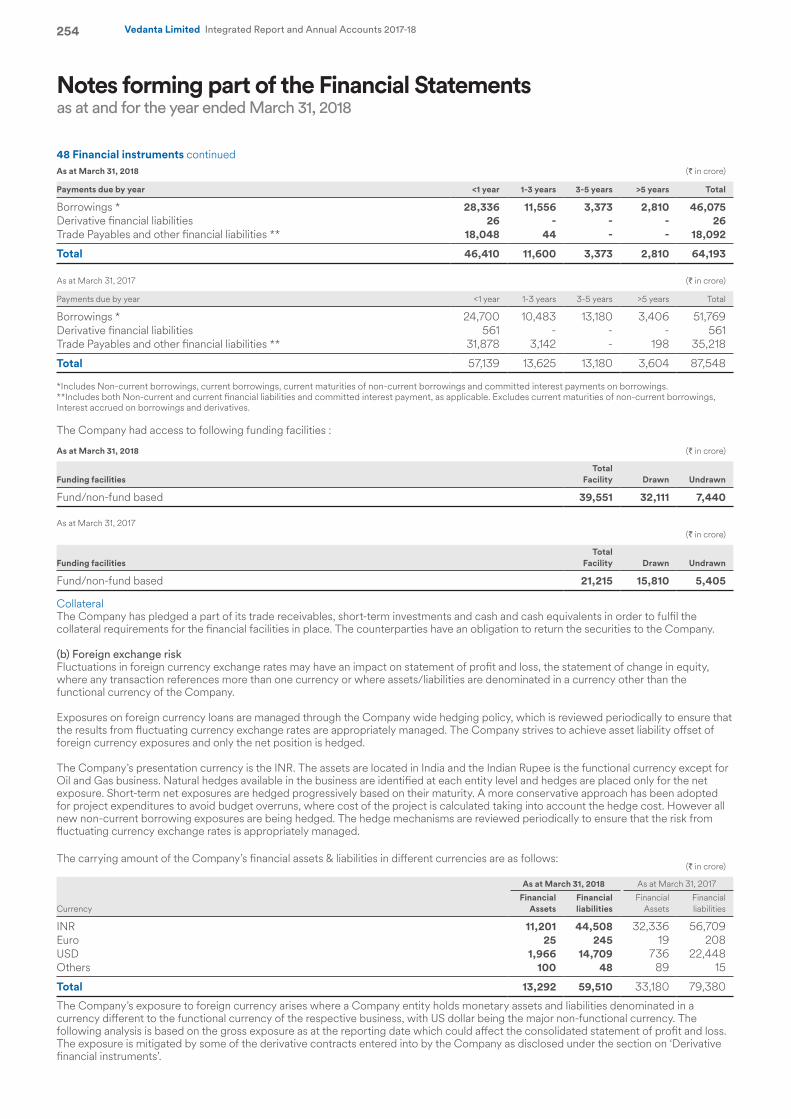
254 Vedanta Limited Integrated Report and Annual Accounts 2017-18
As at March 31, 2018 (` in crore)
Payments due by year <1 year 1-3 years 3-5 years >5 years Total
Borrowings * 28,336 11,556 3,373 2,810 46,075 Derivative financial liabilities 26 - - - 26 Trade Payables and other financial liabilities ** 18,048 44 - - 18,092
Total 46,410 11,600 3,373 2,810 64,193
As at March 31, 2017 (` in crore)
Payments due by year <1 year 1-3 years 3-5 years >5 years Total
Borrowings * 24,700 10,483 13,180 3,406 51,769 Derivative financial liabilities 561 - - - 561 Trade Payables and other financial liabilities ** 31,878 3,142 - 198 35,218
Total 57,139 13,625 13,180 3,604 87,548
*Includes Non-current borrowings, current borrowings, current maturities of non-current borrowings and committed interest payments on borrowings.**Includes both Non-current and current financial liabilities and committed interest payment, as applicable. Excludes current maturities of non-current borrowings, Interest accrued on borrowings and derivatives.
The Company had access to following funding facilities :
As at March 31, 2018 (` in crore)
Funding facilitiesTotal
Facility Drawn Undrawn
Fund/non-fund based 39,551 32,111 7,440
As at March 31, 2017(` in crore)
Funding facilitiesTotal
Facility Drawn Undrawn
Fund/non-fund based 21,215 15,810 5,405
CollateralThe Company has pledged a part of its trade receivables, short-term investments and cash and cash equivalents in order to fulfil the collateral requirements for the financial facilities in place. The counterparties have an obligation to return the securities to the Company.
(b) Foreign exchange riskFluctuations in foreign currency exchange rates may have an impact on statement of profit and loss, the statement of change in equity, where any transaction references more than one currency or where assets/liabilities are denominated in a currency other than the functional currency of the Company.
Exposures on foreign currency loans are managed through the Company wide hedging policy, which is reviewed periodically to ensure that the results from fluctuating currency exchange rates are appropriately managed. The Company strives to achieve asset liability offset of foreign currency exposures and only the net position is hedged.
The Company’s presentation currency is the INR. The assets are located in India and the Indian Rupee is the functional currency except for Oil and Gas business. Natural hedges available in the business are identified at each entity level and hedges are placed only for the net exposure. Short-term net exposures are hedged progressively based on their maturity. A more conservative approach has been adopted for project expenditures to avoid budget overruns, where cost of the project is calculated taking into account the hedge cost. However all new non-current borrowing exposures are being hedged. The hedge mechanisms are reviewed periodically to ensure that the risk from fluctuating currency exchange rates is appropriately managed.
The carrying amount of the Company’s financial assets & liabilities in different currencies are as follows:(` in crore)
Currency
As at March 31, 2018 As at March 31, 2017
Financial Assets
Financial liabilities
Financial Assets
Financial liabilities
INR 11,201 44,508 32,336 56,709 Euro 25 245 19 208 USD 1,966 14,709 736 22,448 Others 100 48 89 15
Total 13,292 59,510 33,180 79,380
The Company’s exposure to foreign currency arises where a Company entity holds monetary assets and liabilities denominated in a currency different to the functional currency of the respective business, with US dollar being the major non-functional currency. The following analysis is based on the gross exposure as at the reporting date which could affect the consolidated statement of profit and loss. The exposure is mitigated by some of the derivative contracts entered into by the Company as disclosed under the section on ‘Derivative financial instruments’.
Notes forming part of the Financial Statementsas at and for the year ended March 31, 2018
48 Financial instruments continued
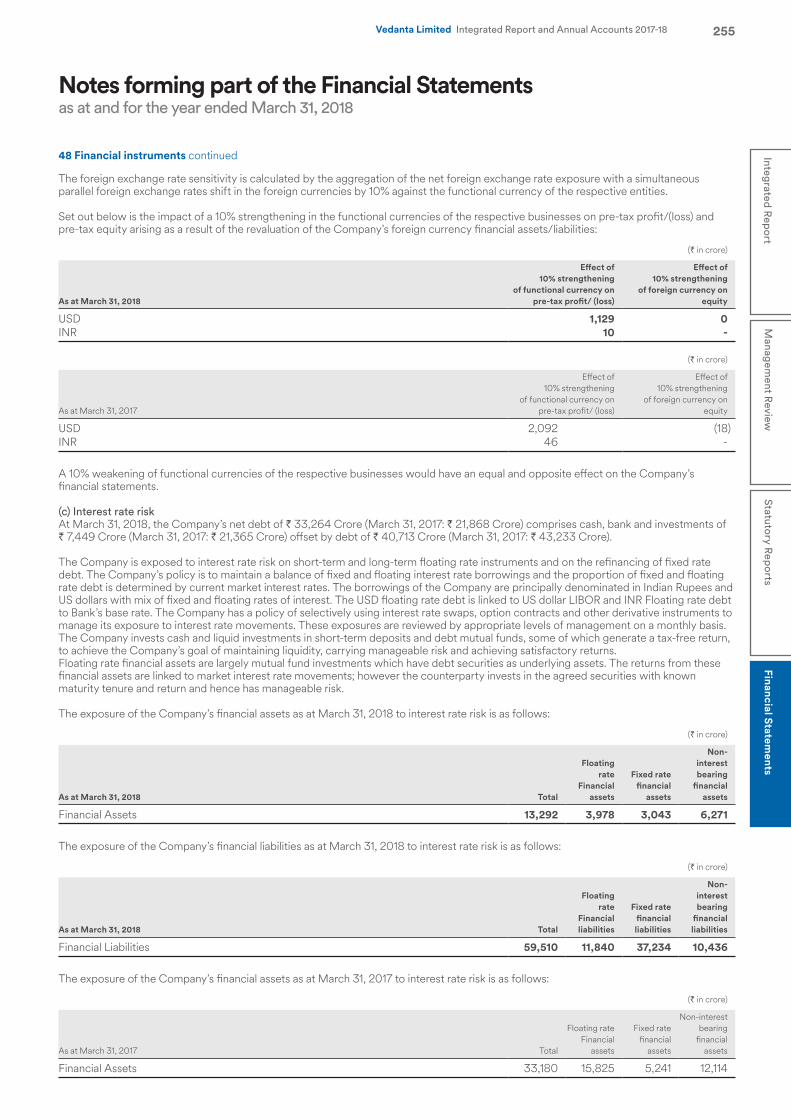
255Integrated R
eport
Managem
ent Review
Statutory R
eports
Financial Statements
Vedanta Limited Integrated Report and Annual Accounts 2017-18
The foreign exchange rate sensitivity is calculated by the aggregation of the net foreign exchange rate exposure with a simultaneous parallel foreign exchange rates shift in the foreign currencies by 10% against the functional currency of the respective entities.
Set out below is the impact of a 10% strengthening in the functional currencies of the respective businesses on pre-tax profit/(loss) and pre-tax equity arising as a result of the revaluation of the Company’s foreign currency financial assets/liabilities:
(` in crore)
As at March 31, 2018
Effect of 10% strengthening
of functional currency on pre-tax profit/ (loss)
Effect of 10% strengthening
of foreign currency on equity
USD 1,129 0INR 10 -
(` in crore)
As at March 31, 2017
Effect of 10% strengthening
of functional currency on pre-tax profit/ (loss)
Effect of 10% strengthening
of foreign currency on equity
USD 2,092 (18)INR 46 -
A 10% weakening of functional currencies of the respective businesses would have an equal and opposite effect on the Company’s financial statements.
(c) Interest rate riskAt March 31, 2018, the Company’s net debt of ` 33,264 Crore (March 31, 2017: ` 21,868 Crore) comprises cash, bank and investments of ` 7,449 Crore (March 31, 2017: ` 21,365 Crore) offset by debt of ` 40,713 Crore (March 31, 2017: ` 43,233 Crore).
The Company is exposed to interest rate risk on short-term and long-term floating rate instruments and on the refinancing of fixed rate debt. The Company’s policy is to maintain a balance of fixed and floating interest rate borrowings and the proportion of fixed and floating rate debt is determined by current market interest rates. The borrowings of the Company are principally denominated in Indian Rupees and US dollars with mix of fixed and floating rates of interest. The USD floating rate debt is linked to US dollar LIBOR and INR Floating rate debt to Bank’s base rate. The Company has a policy of selectively using interest rate swaps, option contracts and other derivative instruments to manage its exposure to interest rate movements. These exposures are reviewed by appropriate levels of management on a monthly basis. The Company invests cash and liquid investments in short-term deposits and debt mutual funds, some of which generate a tax-free return, to achieve the Company’s goal of maintaining liquidity, carrying manageable risk and achieving satisfactory returns.Floating rate financial assets are largely mutual fund investments which have debt securities as underlying assets. The returns from these financial assets are linked to market interest rate movements; however the counterparty invests in the agreed securities with known maturity tenure and return and hence has manageable risk.
The exposure of the Company’s financial assets as at March 31, 2018 to interest rate risk is as follows:
(` in crore)
As at March 31, 2018 Total
Floating rate
Financial assets
Fixed rate financial
assets
Non-interest bearing
financial assets
Financial Assets 13,292 3,978 3,043 6,271
The exposure of the Company’s financial liabilities as at March 31, 2018 to interest rate risk is as follows:
(` in crore)
As at March 31, 2018 Total
Floating rate
Financial liabilities
Fixed rate financial liabilities
Non-interest bearing
financial liabilities
Financial Liabilities 59,510 11,840 37,234 10,436
The exposure of the Company’s financial assets as at March 31, 2017 to interest rate risk is as follows:
(` in crore)
As at March 31, 2017 Total
Floating rate Financial
assets
Fixed rate financial
assets
Non-interest bearing
financial assets
Financial Assets 33,180 15,825 5,241 12,114
Notes forming part of the Financial Statementsas at and for the year ended March 31, 2018
48 Financial instruments continued
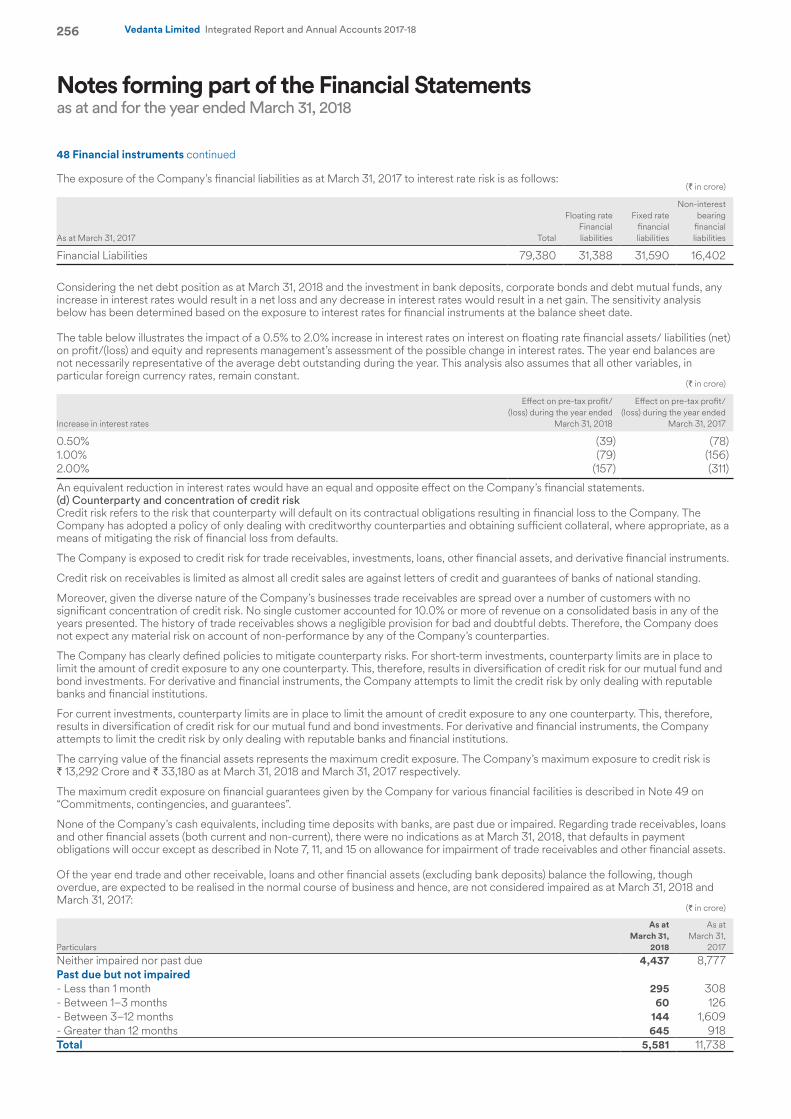
256 Vedanta Limited Integrated Report and Annual Accounts 2017-18
The exposure of the Company’s financial liabilities as at March 31, 2017 to interest rate risk is as follows:(` in crore)
As at March 31, 2017 Total
Floating rate Financial liabilities
Fixed rate financial liabilities
Non-interest bearing
financial liabilities
Financial Liabilities 79,380 31,388 31,590 16,402
Considering the net debt position as at March 31, 2018 and the investment in bank deposits, corporate bonds and debt mutual funds, any increase in interest rates would result in a net loss and any decrease in interest rates would result in a net gain. The sensitivity analysis below has been determined based on the exposure to interest rates for financial instruments at the balance sheet date.
The table below illustrates the impact of a 0.5% to 2.0% increase in interest rates on interest on floating rate financial assets/ liabilities (net) on profit/(loss) and equity and represents management’s assessment of the possible change in interest rates. The year end balances are not necessarily representative of the average debt outstanding during the year. This analysis also assumes that all other variables, in particular foreign currency rates, remain constant.
(` in crore)
Increase in interest rates
Effect on pre-tax profit/(loss) during the year ended
March 31, 2018
Effect on pre-tax profit/(loss) during the year ended
March 31, 2017
0.50% (39) (78)1.00% (79) (156)2.00% (157) (311)
An equivalent reduction in interest rates would have an equal and opposite effect on the Company’s financial statements.(d) Counterparty and concentration of credit riskCredit risk refers to the risk that counterparty will default on its contractual obligations resulting in financial loss to the Company. The Company has adopted a policy of only dealing with creditworthy counterparties and obtaining sufficient collateral, where appropriate, as a means of mitigating the risk of financial loss from defaults.
The Company is exposed to credit risk for trade receivables, investments, loans, other financial assets, and derivative financial instruments.
Credit risk on receivables is limited as almost all credit sales are against letters of credit and guarantees of banks of national standing.
Moreover, given the diverse nature of the Company’s businesses trade receivables are spread over a number of customers with no significant concentration of credit risk. No single customer accounted for 10.0% or more of revenue on a consolidated basis in any of the years presented. The history of trade receivables shows a negligible provision for bad and doubtful debts. Therefore, the Company does not expect any material risk on account of non-performance by any of the Company’s counterparties.
The Company has clearly defined policies to mitigate counterparty risks. For short-term investments, counterparty limits are in place to limit the amount of credit exposure to any one counterparty. This, therefore, results in diversification of credit risk for our mutual fund and bond investments. For derivative and financial instruments, the Company attempts to limit the credit risk by only dealing with reputable banks and financial institutions.
For current investments, counterparty limits are in place to limit the amount of credit exposure to any one counterparty. This, therefore, results in diversification of credit risk for our mutual fund and bond investments. For derivative and financial instruments, the Company attempts to limit the credit risk by only dealing with reputable banks and financial institutions.
The carrying value of the financial assets represents the maximum credit exposure. The Company’s maximum exposure to credit risk is ` 13,292 Crore and ` 33,180 as at March 31, 2018 and March 31, 2017 respectively.
The maximum credit exposure on financial guarantees given by the Company for various financial facilities is described in Note 49 on “Commitments, contingencies, and guarantees”.
None of the Company’s cash equivalents, including time deposits with banks, are past due or impaired. Regarding trade receivables, loans and other financial assets (both current and non-current), there were no indications as at March 31, 2018, that defaults in payment obligations will occur except as described in Note 7, 11, and 15 on allowance for impairment of trade receivables and other financial assets.
Of the year end trade and other receivable, loans and other financial assets (excluding bank deposits) balance the following, though overdue, are expected to be realised in the normal course of business and hence, are not considered impaired as at March 31, 2018 and March 31, 2017:
(` in crore)
Particulars
As at March 31,
2018
As at March 31,
2017
Neither impaired nor past due 4,437 8,777 Past due but not impaired- Less than 1 month 295 308 - Between 1–3 months 60 126 - Between 3–12 months 144 1,609 - Greater than 12 months 645 918 Total 5,581 11,738
Notes forming part of the Financial Statementsas at and for the year ended March 31, 2018
48 Financial instruments continued
257Integrated R
eport
Managem
ent Review
Statutory R
eports
Financial Statements
Vedanta Limited Integrated Report and Annual Accounts 2017-18
Receivables are deemed to be past due or impaired with reference to the Company’s normal terms and conditions of business. These terms and conditions are determined on a case to case basis with reference to the customer’s credit quality and prevailing market conditions. Receivables that are classified as ‘past due’ in the above tables are those that have not been settled within the terms and conditions that have been agreed with that customer. The Company based on past experience does not expect any material loss on its receivables and hence no provision is deemed necessary on account of ECL.
The credit quality of the Company’s customers is monitored on an ongoing basis and assessed for impairment where indicators of such impairment exist. The Company uses simplified approach for impairment of financial assets. If credit risk has not increased significantly, 12-month expected credit loss is used to provide for impairment loss. However, if credit risk has increased significantly, lifetime expected credit loss is used. The solvency of the debtor and their ability to repay the receivable is considered in assessing receivables for impairment. Where receivables have been impaired, the Company actively seeks to recover the amounts in question and enforce compliance with credit terms.
D. Derivative financial instrumentsThe Company uses derivative instruments as part of its management of exposure to fluctuations in foreign currency exchange rates, interest rates and commodity prices. The Company does not acquire or issue derivative financial instruments for trading or speculative purposes. The Company does not enter into complex derivative transactions to manage the treasury and commodity risks. Both treasury and commodities derivative transactions are normally in the form of forward contracts and these are subject to the Company guidelines and policies.
The fair values of all derivatives are separately recorded in the balance sheet within current and non-current assets and liabilities. Derivatives that are designated as hedges are classified as current or non-current depending on the maturity of the derivative.
The use of derivatives can give rise to credit and market risk. The Company tries to control credit risk as far as possible by only entering into contracts with reputable banks and financial institutions. The use of derivative instruments is subject to limits, authorities and regular monitoring by appropriate levels of management. The limits, authorities and monitoring systems are periodically reviewed by management and the Board. The market risk on derivatives is mitigated by changes in the valuation of the underlying assets, liabilities or transactions, as derivatives are used only for risk management purposes.
(i) Embedded derivativesDerivatives embedded other financial instruments or other contracts are treated as separate derivative contracts and marked-to-market when their risks and characteristics are not clearly and closely related to those of their host contracts and the host contracts are not fair valued.
(ii) Cash flow hedgesThe Company enters into forward exchange and commodity price contracts for hedging highly probable forecast transaction and account for them as cash flow hedges and states them at fair value. Subsequent changes in fair value are recognized in equity until the hedged transaction occurs, at which time, the respective gain or losses are reclassified to profit or loss. These hedges have been effective for the year ended March 31, 2018.
The Company uses foreign exchange contracts from time to time to optimize currency risk exposure on its foreign currency transactions. The Company hedged part of its foreign currency exposure on capital commitments during the year ended 2018. Fair value changes on such forward contracts are recognized in comprehensive income.
The majority of cash flow hedges taken out by the Company during the year comprise non-derivative hedging instruments for hedging the foreign exchange rate of highly probable forecast transactions and commodity price contracts for hedging the commodity price risk of highly probable forecast transactions.
The cash flows related to above are expected to occur during the year ended March 31, 2019 and consequently may impact profit or loss for that year depending upon the change in the commodity prices and foreign exchange rates movements. For cash flow hedges regarded as basis adjustments to initial carrying value of the property, plant and equipment, the depreciation on the basis adjustments made is expected to affect profit or loss over the expected useful life of the property, plant and equipment.
(iii) Fair value hedgeThe fair value hedges relate to forward covers taken to hedge currency exposure and commodity price risks.
The Company’s sales are on a quotational period basis, generally one month to three months after the date of delivery at a customer’s facility. The Company enters into forward contracts for the respective quotational period to hedge its commodity price risk based on average LME prices. Gains and losses on these hedge transactions are substantially offset by the amount of gains or losses on the underlying sales. Net gains and losses are recognized in the statement of profit and loss.The Company uses foreign exchange contracts from time to time to optimize currency risk exposure on its foreign currency transactions. Fair value changes on such forward contracts are recognized in the statement of profit and loss.
(iv) Non-qualifying/economic hedgeThe Company enters into derivative contracts which are not designated as hedges for accounting purposes, but provide an economic hedge of a particular transaction risk or a risk component of a transaction. Hedging instruments include copper, aluminium future contracts on the LME and certain other derivative instruments. Fair value changes on such derivative instruments are recognized in the statement of profit and loss.The fair value of the Company’s derivative positions recorded under derivative financial assets and derivative financial liabilities are as follows:
Notes forming part of the Financial Statementsas at and for the year ended March 31, 2018
48 Financial instruments continued
258 Vedanta Limited Integrated Report and Annual Accounts 2017-18
(` in crore)
Derivative Financial Instruments
As at March 31, 2018 As at March 31, 2017
Assets Liabilities Assets Liabilities
CurrentCash flow hedge*- Commodity contracts 81 - - 68 - Forward foreign currency contracts 1 0 - 14 Fair Value hedge**- Commodity contracts - 1 - 0 - Forward foreign currency contracts 11 9 0 346 Non - qualifying hedges- Commodity contracts - 14 7 23 - Forward foreign currency contracts 9 1 - 110 - Interest rate swap - - - - - Cross currency swap 0 1 - 1
Total 102 26 7 562
* Refer statement of profit and loss and statement of change in equity for the changes in the fair value of cash flow hedges. ** The change in fair value hedges is recognised in the statement of profit and loss.
E. Derivative contracts entered into by the Company and outstanding as at Balance Sheet date :(i) To hedge currency risks and interest related risks, the Company has entered into various derivatives contracts. The category wise break up of amount outstanding as on Balance Sheet date is given below :
(` in crore)
Particulars
As at March 31,
2018
As at March 31,
2017
Forex forward cover (buy) 9,983 13,164 Forex forward cover (sell) 223 5
(ii) For hedging commodity related risks :- Category wise break up is given below.
Particulars
As at March 31, 2018 As at March 31, 2017
Purchases Sales Purchases Sales
Forwards / FuturesCopper (MT) 61,850 53,825 30,350 17,400 Gold (Oz) 8,070 1,05,594 1,497 94,242 Silver (Oz) 30,219 5,65,393 9,411 8,17,565 Aluminium (MT) - 73,675 - 77,025
49 Contingencies and commitmentsI Contingent Liabilitiesa) Erstwhile Cairn India Limited: Income taxIn March 2014, Cairn India Limited (referred to as ‘Cairn India’) received a show cause notice from the Indian Tax Authorities (“Tax Authorities”) for not deducting withholding tax on the payments made to Cairn UK Holdings Limited (“CUHL”), for acquiring shares of Cairn India Holdings Limited (“CIHL”), as part of their internal reorganisation. Tax Authorities have stated in the notice that a short-term capital gain has accrued to CUHL on transfer of the shares of CIHL to Cairn India, in the financial year 2006-2007, on which tax should have been withheld by Cairn India. Pursuant to this various replies were filed with the tax authorities.
Cairn India also filed a writ petition before the Delhi High Court wherein it has raised several points for assailing the aforementioned Income tax Authority’s order. The matter is next listed for hearing on July 06, 2018 before the Honourable Delhi High Court.
After several hearings, the Income Tax Authority, in March 2015, issued an order holding Cairn India as ‘assessee in default’ and raised a demand totalling ` 20,495 Crore (including interest of ` 10,247 Crore). Cairn India had filed an appeal before the First Appellate Authority, Commissioner of Income Tax (Appeals) which vide order dated July 03, 2017 confirmed the tax demand against Cairn India. Cairn India has challenged the Commissioner of Income Tax (Appeals) order before Income Tax Appellate Tribunal (ITAT). Separately CUHL, on whom the primary liability of tax lies has received an Order from the ITAT holding that the transaction is taxable in view of the clarification made in the Act but also acknowledged that being a retrospective transaction, interest would not be levied. Hence affirming a demand of ` 10,248 Crore excluding the interest portion that had previously been claimed. The Department is appealing this order.
As a result of the above order from ITAT, the Company now considers the risk in respect of the interest portion of claim to be remote. Further, as per the recent attachment notice received from the Tax Recovery Officer appointed for CUHL, the tax officer has adjusted the dividend of ` 667 Crore which was due to CUHL and was recovered by the Tax department. The Company has further remitted additional dividend of ` 442 Crore further reducing the principal liability to ` 9,139 Crore. Accordingly, the Company has revised the contingent liability to ` 9,139 Crore.
Notes forming part of the Financial Statementsas at and for the year ended March 31, 2018
48 Financial instruments continued
259Integrated R
eport
Managem
ent Review
Statutory R
eports
Financial Statements
Vedanta Limited Integrated Report and Annual Accounts 2017-18
Additionally, the Tax department has initiated the process of selling the attached CUHL investment in equity and preference shares of Vedanta Limited valuing ` 5,861 Crore based on the quoted price as at March 31, 2018.
In the event, the case is finally decided against Cairn India, the potential liability including interest would be ` 20,495 Crore. Separately but in connection with this litigation, Vedanta Resources Plc has filed a Notice of Claim against the Government of India (‘GOI’) under the UK India Bilateral Investment Treaty (the “BIT”). The International arbitration Tribunal recently passed favourable order on jurisdiction and now the matter would be heard on merits – hearing scheduled in April-May 2019. The Government of India has challenged jurisdiction order of Arbitration Tribunal before the High court of Singapore.
b) Vedanta Limited: Contractor claimShenzhen Shandong Nuclear Power Construction Co. Limited (‘SSNP’) subsequent to terminating the EPC contract invoked arbitration as per the contract alleging non-payment of their dues towards construction of a 210 MW co-generation power plant for the 6 MTPA expansion project, and filed a claim of ` 1,642 Crore. SSNP also filed a petition under Section 9 of the Arbitration and Conciliation Act, 1996 before the Bombay High Court requesting for interim relief. The Bombay High Court initially dismissed their petition, but on a further appeal by SSNP, the Division Bench of the Bombay High Court directed Vedanta Limited to deposit a bank guarantee for an amount of ` 187 Crore as a security, being a prima facie representation of the claim, until arbitration proceedings are completed. Vedanta Limited has deposited a bank guarantee of an equivalent amount. Based on the assessment, the Company had booked the liability for ` 200 Crore in earlier years.
On November 09, 2017, the Arbitral Tribunal has pronounced the award in favor of SSNP for ` 221 Crore along with the interest and cost of ` 118 Crore (@ 9% p.a. from date of filing petition, i.e. April 18, 2012). The amount is payable subject to SSNP handing over all the drawings to the Company. Given the Company was already carrying a part provision it recognized additional liability of ` 139 Crore including interest and cost making the total liability towards SSNP as ` 339 Crore. The additional amount recognized in the income statement includes ` 113 Crore which has been presented under exceptional items.
The Company has challenged the award under section 34 of The Arbitration and Conciliation Act, 1996, which was dismissed. Subsequently, the Company has filed an appeal under section 37 of The Arbitration and Conciliation Act, 1996 with the Delhi High Court. The Court has granted a stay subject to deposit of the award amount, which has been complied by the Company. The hearing on the arguments in the matter have been completed and the matter has now been reserved for orders.
c) Ravva joint venture arbitration proceedings: ONGC CarryErstwhile Cairn India Limited (referred to as ‘Cairn India’) is involved in a dispute against the Government of India (GOI) relating to the recovery of contractual costs in terms of calculation of payments that the contractor party were required to make in connection with the Ravva field.
The Ravva Production Sharing Contract “PSC” obliges the contractor parties to pay a proportionate share of ONGC’s exploration, development, production and contract costs in consideration for ONGC’s payment of costs related to the construction and other activities it conducted in Ravva prior to the effective date of the Ravva PSC (the ‘‘ONGC Carry’’). The question as to how the ONGC Carry is to be recovered and calculated, along with other issues, was submitted to an international arbitration Tribunal in August 2002 which rendered a decision on the ONGC Carry in favour of the contractor parties whereas four other issues were decided in favour of GOI in October 2004 (“Partial Award”).
The GOI then proceeded to challenge the ONGC Carry decision before the Malaysian courts, as Kuala Lumpur was the seat of the arbitration. The Federal Court of Malaysia which adjudicated the matter on October 11, 2011, upheld the Partial Award. Per the decision of the Arbitral Tribunal, the contractor parties and GOI were required to arrive at a quantification of the sums relatable to each of the issues under the Partial Award.
Pursuant to the decision of the Federal Court, the contractor parties approached the Ministry of Petroleum and Natural Gas (“MoPNG”) to implement the Partial Award while reconciling the statement of accounts as outlined in the Partial Award.
However, MoPNG on July 10, 2014 proceeded to issue a Show Cause Notice alleging that since the partial award has not been enforced, the profit petroleum share of GOI has been short-paid. MoPNG threatened to recover the amount from the sale proceeds payable by the oil marketing companies to the contractor parties. The contractor party replied to the show cause notice taking various legal contentions.
As the Partial Award did not quantify the sums, therefore, contractor parties approached the same Arbitral Tribunal to pass a Final Award in the subject matter since it had retained the jurisdiction to do so. The Arbitral Tribunal was reconstituted and the Final Award was passed in October 2016 in Cairn India’s favour. GOI’s challenge of the Final Award was dismissed by the Malaysian High Court. GOI has challenged the decision before the Court of Appeal, the procedural hearing for which is scheduled on August 30, 2018. Further, Cairn India has also filed for the enforcement of the Partial Award and Final Award with Delhi High Court which is scheduled to be heard on September 04, 2018. While Cairn India does not believe the GOI will be successful in its challenge, if the Arbitral Award is reversed and such reversal is binding, Cairn India could be liable for approximately ` 416 Crore plus interest as at March 31, 2018 ( March 31, 2017: ` 416 Crore plus interest).d) Proceedings related to the imposition of entry taxThe Company challenged the constitutional validity of the local statutes and related notifications in the states of Odisha and Rajasthan pertaining to the levy of entry tax on the entry of goods brought into the respective states from outside.
Post some contradictory orders of High Courts across India adjudicating on similar challenges, the Supreme Court referred the matters to a nine judge bench. Post a detailed hearing, although the bench rejected the compensatory nature of tax as a ground of challenge, it maintained status quo with respect to all other issues which have been left open for adjudication by regular benches hearing the matters.
Following the order of the nine judge bench, the regular bench of the Supreme Court proceeded with hearing the matters. The regular bench remanded the entry tax matters relating to the issue of discrimination against domestic goods bought from other States to the
Notes forming part of the Financial Statementsas at and for the year ended March 31, 2018
49 Contingencies and commitments continued
260 Vedanta Limited Integrated Report and Annual Accounts 2017-18
respective High Courts for final determination but retained the issue of jurisdiction for levy on imported goods, for determination by regular bench of Supreme Court. Following the order of the Supreme Court, the Company filed writ petitions in respective High Courts.
On October 09, 2017, the Supreme Court has held that States have the jurisdiction to levy entry tax on imported goods. With this Supreme Court judgement, imported goods will rank parri-passu with domestic goods for the purpose of levy of Entry tax. The Company has amended its appeal (writ petitions) in Odisha to include imported goods as well. With respect to Rajasthan, the State Government has filed a counter petition in the Rajasthan High Court, whereby it has admitted that it does not intend to levy the entry tax on imported goods.
The issue pertaining to the levy of entry tax on the movement of goods into a Special Economic Zone (SEZ) remains pending before the Odisha High Court. The Company has challenged the levy of entry tax on any movement of goods into an SEZ based on the definition of ‘local area’ under the Odisha Entry Tax Act which is very clear and does not include an SEZ. In addition, the Government of Odisha further through its SEZ Policy 2015 and the operational guidelines for administration of this policy dated August 22, 2016, exempted the entry tax levy on SEZ operations.
The total claims against the Company are ` 1,020 Crore (March 31, 2017: ` 809 Crore) net of provisions made.
e) Miscellaneous disputes- Income taxThe Company is involved in various tax disputes amounting to ` 1,430 Crore (March 31, 2017: ` 1,439 Crore) relating to income tax. These mainly relate to the disallowance of tax holiday for 100% Export Oriented Undertaking under section 10B of the Income Tax Act, 1961, disallowance of tax holiday benefit on production of gas under section 80IB of the Income Tax Act, 1961, on account of depreciation disallowances, disallowance under section 14A of the Income Tax Act and interest thereon which are pending at various appellate levels.
The Company believes that these disallowances are not tenable and accordingly no provision is considered necessary.
f) Miscellaneous disputes- OthersThe Company is subject to various claims and exposures which arise in the ordinary course of conducting and financing its business from the excise, indirect tax authorities and others. These claims and exposures mostly relate to the assessable values of sales and purchases or to incomplete documentation supporting the companies’ returns or other claims.
The approximate value of claims (excluding the items as set out separately above) against the Company totals to ` 2,177 Crore (March 31, 2017: `1,933 Crore)
The Company considers that it can take steps such that the risks can be mitigated and that there are no significant unprovided liabilities arising.
Except as described above from (a) to (f), there are no pending litigations which the Company believes could reasonably be expected to have a material adverse effect on the results of operations, cash flow or the financial position of the Company.
II Commitments The Company has a number of continuing operational and financial commitments in the normal course of business including:• exploratory mining commitments;• oil & gas commitments;• mining commitments arising under production sharing agreements; and• completion of the construction of certain assets.
Estimated amount of contracts remaining to be executed on capital accounts and not provided for:
(` in crore)
Particulars
As at March 31,
2018
As at March 31,
2017
Oil & Gas sectorCairn India (now merged with the Company) 2,338 63 Aluminium sectorLanjigarh Refinery (Phase II) 5.0 mtpa 1,335 1,368 Jharsuguda 1.25mtpa smelter 491 791 Power sectorJharsuguda 600 MW Power Plant 98 213 Copper sectorTuticorin Smelter 400 ktpa 2,758 1,411 Others - 2
Total 7,020 3,848
Notes forming part of the Financial Statementsas at and for the year ended March 31, 2018
49 Contingencies and commitments continued
261Integrated R
eport
Managem
ent Review
Statutory R
eports
Financial Statements
Vedanta Limited Integrated Report and Annual Accounts 2017-18
III Other Commitments(` in crore)
Particulars
As at March 31,
2018
As at March 31,
2017
(i) The Company has given corporate guarantees to regulatory authorities on behalf of Volcan Investments Limited 115 115 (ii) The Company has given corporate guarantees to other group companies in respect of certain short-term and
long-term borrowings 12,761 13,737
(iii) Customs duty bond taken for Project Import/ Export 580 405 (iv) Company's share of oil and gas joint ventures minimum exploration commitments as per the production sharing
contracts 42 19
(v) Export obligations against the import licenses taken for import of capital goods under the Export Promotion Capital Goods Scheme and advance license. In the event of the Company’s inability to meet Export obligations, the Company’s liability, reduced in proportion to actual exports. In addition, applicable interest would be payable.
7,190 6,976
(vi) Power Division of the Company has signed a long term power purchase agreement (PPA) with Gridco Limited for supply of 25% of power generated from the power station with additional right to purchase power at (5%/ 7 %) at variable cost as per the conditions referred to in PPA . The PPA has a tenure of twenty five years.
50 Segment InformationA) Description of segment and principle activitiesThe Company is a diversified natural resource Company engaged in exploring, extracting and processing minerals and oil and gas. The Company produces copper, aluminium, iron ore, oil and gas and commercial power. The Company has five reportable segments: copper, aluminum, iron ore, commercial power and oil and gas. The management of the Company is organized by its main products: copper, aluminum, iron ore, oil and gas and power. Each of the reportable segments derives its revenues from these main products and hence these have been identified as reportable segments by the Company’s Chief Operating Decision Maker (“CODM”). Earnings before Interest, Tax and Depreciation & Amortisation (EBITDA) amounts are evaluated regularly by the Management, which has been identified as the CODM, in deciding how to allocate resources and in assessing performance.
CopperThe Company’s copper business is principally one of custom smelting and includes a copper smelter, a refinery, a phosphoric acid plant, a sulphuric acid plant, a copper rod plant and three captive power plants at Tuticorin in Southern India, and a refinery and two copper rod plants at Silvassa in Western India.
On April 09, 2018 the annual consent to operate (CTO) for Tuticorin plant under the Air and Water Acts for copper smelters in India was rejected by the State Pollution Control Board for want of further clarification and consequently the operations have presently been suspended. The matter is presently pending in Tribunal. (Refer note 3 (y) (1) (xi))
AluminumThe Company’s aluminium operations include a refinery and a captive power plant at Lanjigarh and a smelter, a thermal coal based captive power facility at Jharsuguda both situated in the State of Odisha in India. The pots are in the stage of commissioning in the 1.25 mtpa Jharsuguda-II Aluminium smelter with 879 pots having been commissioned by March 31, 2018.
Iron oreThe Company’s iron ore business consists of exploration, mining and processing of iron ore, pig iron and metallurgical coke. The mining operations are carried out at Codli group, Bicholim mine, Surla mine and the Sonshi group of mines in state of Goa and Narrian mine, situated at state of Karnataka in India, a Metallurgical Coke and Pig Iron plant in State of Goa in India and also has a power plant in State of Goa in India for captive use. Pursuant to an order passed by Hon’ble Supreme Court of India on Febuary 07, 2018 all mining was banned in state of Goa. The Company has recognised an impairement charge on its ironore assets for the year ended March 31, 2018 (Refer note 34 (d)).
PowerThe Company’s power business include 600 MW thermal coal-based commercial power facility at Jharsuguda in the State of Odisha in Eastern India. During the previous year, three units of 600 MW each at Jharsugda have been converted into captive power plant to commercial power plant to meet the inhouse energy demands. Hence w.e.f. April 01, 2016 the operations of the said units have been included in the aluminium business segment.
Oil and gasThe Company’s is engaged in business of exploration and development and production of oil and gas, having a diversified asset base of five blocks, one in state of Rajasthan in India, one on the west coast of India and three on the east coast of India.
Segment Revenue, Results, Assets and Liabilities include the respective amounts identifiable to each of the segments and amount allocated on a reasonable basis. Unallocated expenditure consist of common expenditure incurred for all the segments and expenses incurred at corporate level. The assets and liabilities that cannot be allocated between the segments are shown as unallocated assets and unallocated liabilities respectively.
The accounting policies of the reportable segments are the same as the Company’s accounting policies described in Note 3. The operating segments reported are the segments of the Company for which separate financial information is available. Earnings before interest, depreciation and amortisation and tax (EBITDA) are evaluated regularly by the CODM in deciding how to allocate resources and in assessing performance. The Company’s financing (including finance costs and finance income) and income taxes are reviewed on an overall basis and are not allocated to operating segments.
Notes forming part of the Financial Statementsas at and for the year ended March 31, 2018
49 Contingencies and commitments continued
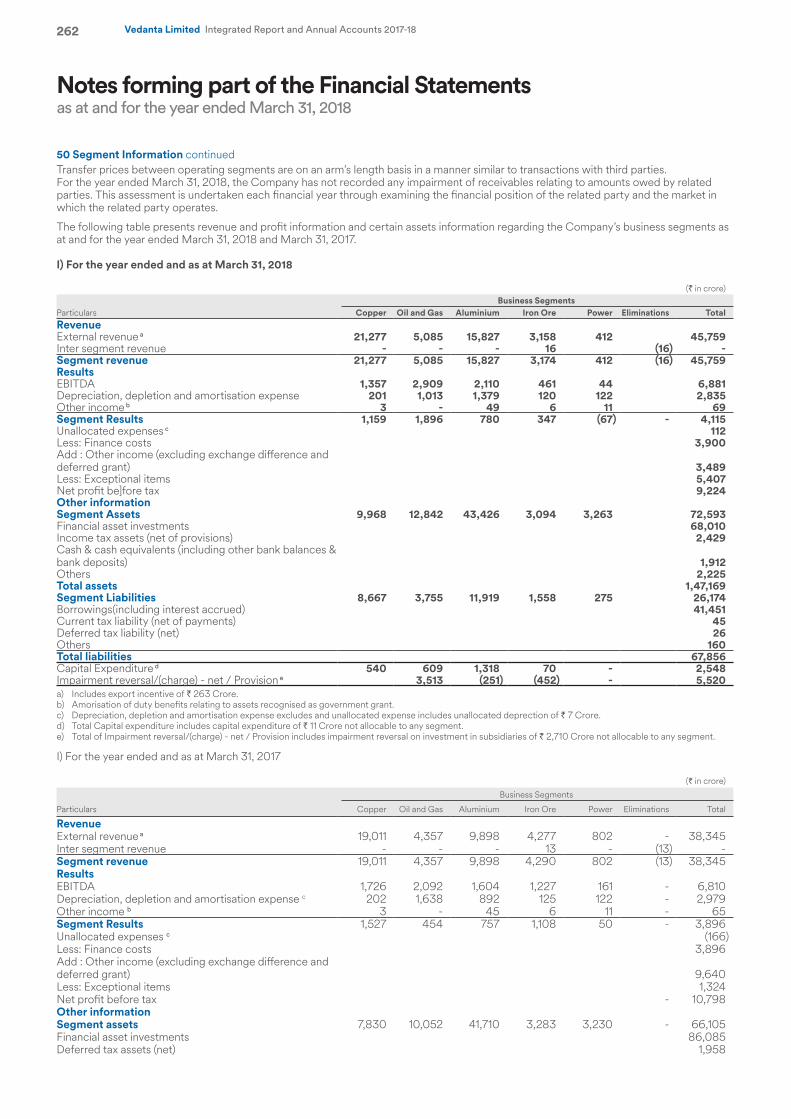
262 Vedanta Limited Integrated Report and Annual Accounts 2017-18
Transfer prices between operating segments are on an arm’s length basis in a manner similar to transactions with third parties.For the year ended March 31, 2018, the Company has not recorded any impairment of receivables relating to amounts owed by related parties. This assessment is undertaken each financial year through examining the financial position of the related party and the market in which the related party operates.
The following table presents revenue and profit information and certain assets information regarding the Company’s business segments as at and for the year ended March 31, 2018 and March 31, 2017.
I) For the year ended and as at March 31, 2018
(` in crore) Business Segments
Particulars Copper Oil and Gas Aluminium Iron Ore Power Eliminations TotalRevenueExternal revenue a 21,277 5,085 15,827 3,158 412 45,759 Inter segment revenue - - - 16 (16) - Segment revenue 21,277 5,085 15,827 3,174 412 (16) 45,759 ResultsEBITDA 1,357 2,909 2,110 461 44 6,881 Depreciation, depletion and amortisation expense 201 1,013 1,379 120 122 2,835 Other income b 3 - 49 6 11 69 Segment Results 1,159 1,896 780 347 (67) - 4,115 Unallocated expenses c 112 Less: Finance costs 3,900 Add : Other income (excluding exchange difference and deferred grant) 3,489 Less: Exceptional items 5,407Net profit be]fore tax 9,224 Other informationSegment Assets 9,968 12,842 43,426 3,094 3,263 72,593 Financial asset investments 68,010 Income tax assets (net of provisions) 2,429 Cash & cash equivalents (including other bank balances & bank deposits) 1,912 Others 2,225 Total assets 1,47,169 Segment Liabilities 8,667 3,755 11,919 1,558 275 26,174 Borrowings(including interest accrued) 41,451 Current tax liability (net of payments) 45 Deferred tax liability (net) 26 Others 160 Total liabilities 67,856 Capital Expenditure d 540 609 1,318 70 - 2,548Impairment reversal/(charge) - net / Provision e 3,513 (251) (452) - 5,520 a) Includes export incentive of ` 263 Crore.b) Amorisation of duty benefits relating to assets recognised as government grant.c) Depreciation, depletion and amortisation expense excludes and unallocated expense includes unallocated deprection of ` 7 Crore.d) Total Capital expenditure includes capital expenditure of ` 11 Crore not allocable to any segment.e) Total of Impairment reversal/(charge) - net / Provision includes impairment reversal on investment in subsidiaries of ` 2,710 Crore not allocable to any segment.
I) For the year ended and as at March 31, 2017
(` in crore)
Business Segments
Particulars Copper Oil and Gas Aluminium Iron Ore Power Eliminations Total
RevenueExternal revenue a 19,011 4,357 9,898 4,277 802 - 38,345 Inter segment revenue - - - 13 - (13) - Segment revenue 19,011 4,357 9,898 4,290 802 (13) 38,345 ResultsEBITDA 1,726 2,092 1,604 1,227 161 - 6,810 Depreciation, depletion and amortisation expense c 202 1,638 892 125 122 - 2,979 Other income b 3 - 45 6 11 - 65 Segment Results 1,527 454 757 1,108 50 - 3,896 Unallocated expenses c (166)Less: Finance costs 3,896 Add : Other income (excluding exchange difference and deferred grant) 9,640 Less: Exceptional items 1,324Net profit before tax - 10,798 Other informationSegment assets 7,830 10,052 41,710 3,283 3,230 - 66,105 Financial asset investments 86,085 Deferred tax assets (net) 1,958
Notes forming part of the Financial Statementsas at and for the year ended March 31, 2018
50 Segment Information continued
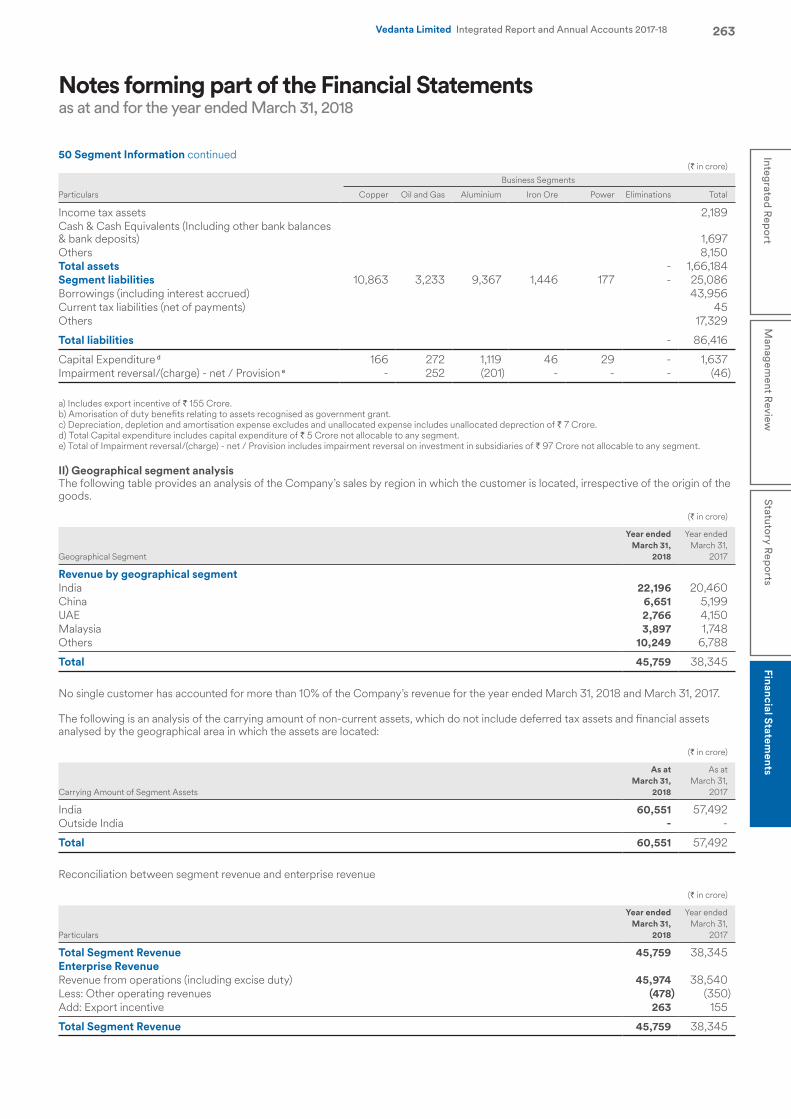
263Integrated R
eport
Managem
ent Review
Statutory R
eports
Financial Statements
Vedanta Limited Integrated Report and Annual Accounts 2017-18
(` in crore)
Business Segments
Particulars Copper Oil and Gas Aluminium Iron Ore Power Eliminations Total
Income tax assets 2,189 Cash & Cash Equivalents (Including other bank balances & bank deposits) 1,697 Others 8,150 Total assets - 1,66,184 Segment liabilities 10,863 3,233 9,367 1,446 177 - 25,086 Borrowings (including interest accrued) 43,956 Current tax liabilities (net of payments) 45 Others 17,329
Total liabilities - 86,416
Capital Expenditure d 166 272 1,119 46 29 - 1,637 Impairment reversal/(charge) - net / Provision e - 252 (201) - - - (46)
a) Includes export incentive of ` 155 Crore.b) Amorisation of duty benefits relating to assets recognised as government grant.c) Depreciation, depletion and amortisation expense excludes and unallocated expense includes unallocated deprection of ` 7 Crore.d) Total Capital expenditure includes capital expenditure of ` 5 Crore not allocable to any segment.e) Total of Impairment reversal/(charge) - net / Provision includes impairment reversal on investment in subsidiaries of ` 97 Crore not allocable to any segment.
II) Geographical segment analysisThe following table provides an analysis of the Company’s sales by region in which the customer is located, irrespective of the origin of the goods.
(` in crore)
Geographical Segment
Year ended March 31,
2018
Year ended March 31,
2017
Revenue by geographical segment India 22,196 20,460 China 6,651 5,199 UAE 2,766 4,150 Malaysia 3,897 1,748 Others 10,249 6,788
Total 45,759 38,345
No single customer has accounted for more than 10% of the Company’s revenue for the year ended March 31, 2018 and March 31, 2017.
The following is an analysis of the carrying amount of non-current assets, which do not include deferred tax assets and financial assets analysed by the geographical area in which the assets are located:
(` in crore)
Carrying Amount of Segment Assets
As at March 31,
2018
As at March 31,
2017
India 60,551 57,492 Outside India - -
Total 60,551 57,492
Reconciliation between segment revenue and enterprise revenue
(` in crore)
Particulars
Year ended March 31,
2018
Year ended March 31,
2017
Total Segment Revenue 45,759 38,345 Enterprise RevenueRevenue from operations (including excise duty) 45,974 38,540 Less: Other operating revenues (478) (350)Add: Export incentive 263 155
Total Segment Revenue 45,759 38,345
Notes forming part of the Financial Statementsas at and for the year ended March 31, 2018
50 Segment Information continued
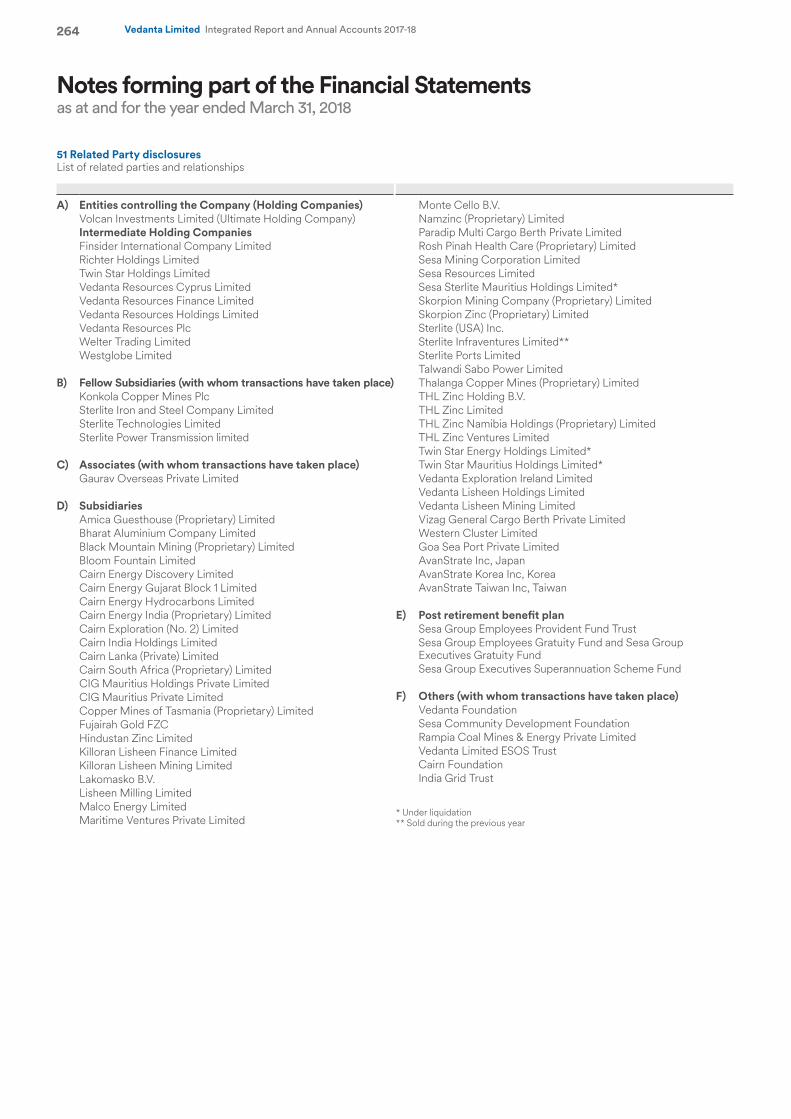
264 Vedanta Limited Integrated Report and Annual Accounts 2017-18
51 Related Party disclosuresList of related parties and relationships
A) Entities controlling the Company (Holding Companies) Volcan Investments Limited (Ultimate Holding Company)Intermediate Holding CompaniesFinsider International Company LimitedRichter Holdings LimitedTwin Star Holdings LimitedVedanta Resources Cyprus LimitedVedanta Resources Finance LimitedVedanta Resources Holdings LimitedVedanta Resources PlcWelter Trading LimitedWestglobe Limited
B) Fellow Subsidiaries (with whom transactions have taken place)Konkola Copper Mines PlcSterlite Iron and Steel Company LimitedSterlite Technologies LimitedSterlite Power Transmission limited
C) Associates (with whom transactions have taken place)Gaurav Overseas Private Limited
D) SubsidiariesAmica Guesthouse (Proprietary) Limited Bharat Aluminium Company Limited Black Mountain Mining (Proprietary) Limited Bloom Fountain LimitedCairn Energy Discovery LimitedCairn Energy Gujarat Block 1 LimitedCairn Energy Hydrocarbons LimitedCairn Energy India (Proprietary) LimitedCairn Exploration (No. 2) LimitedCairn India Holdings LimitedCairn Lanka (Private) LimitedCairn South Africa (Proprietary) LimitedCIG Mauritius Holdings Private LimitedCIG Mauritius Private LimitedCopper Mines of Tasmania (Proprietary) Limited Fujairah Gold FZC Hindustan Zinc Limited Killoran Lisheen Finance Limited Killoran Lisheen Mining Limited Lakomasko B.V. Lisheen Milling Limited Malco Energy LimitedMaritime Ventures Private Limited
Monte Cello B.V.Namzinc (Proprietary) Limited Paradip Multi Cargo Berth Private Limited Rosh Pinah Health Care (Proprietary) Limited Sesa Mining Corporation LimitedSesa Resources LimitedSesa Sterlite Mauritius Holdings Limited*Skorpion Mining Company (Proprietary) Limited Skorpion Zinc (Proprietary) Limited Sterlite (USA) Inc.Sterlite Infraventures Limited**Sterlite Ports Limited Talwandi Sabo Power LimitedThalanga Copper Mines (Proprietary) Limited THL Zinc Holding B.V. THL Zinc LimitedTHL Zinc Namibia Holdings (Proprietary) Limited THL Zinc Ventures LimitedTwin Star Energy Holdings Limited*Twin Star Mauritius Holdings Limited*Vedanta Exploration Ireland Limited Vedanta Lisheen Holdings LimitedVedanta Lisheen Mining Limited Vizag General Cargo Berth Private Limited Western Cluster LimitedGoa Sea Port Private LimitedAvanStrate Inc, JapanAvanStrate Korea Inc, KoreaAvanStrate Taiwan Inc, Taiwan
E) Post retirement benefit planSesa Group Employees Provident Fund TrustSesa Group Employees Gratuity Fund and Sesa Group Executives Gratuity FundSesa Group Executives Superannuation Scheme Fund
F) Others (with whom transactions have taken place)Vedanta FoundationSesa Community Development FoundationRampia Coal Mines & Energy Private LimitedVedanta Limited ESOS TrustCairn FoundationIndia Grid Trust
* Under liquidation** Sold during the previous year
Notes forming part of the Financial Statementsas at and for the year ended March 31, 2018
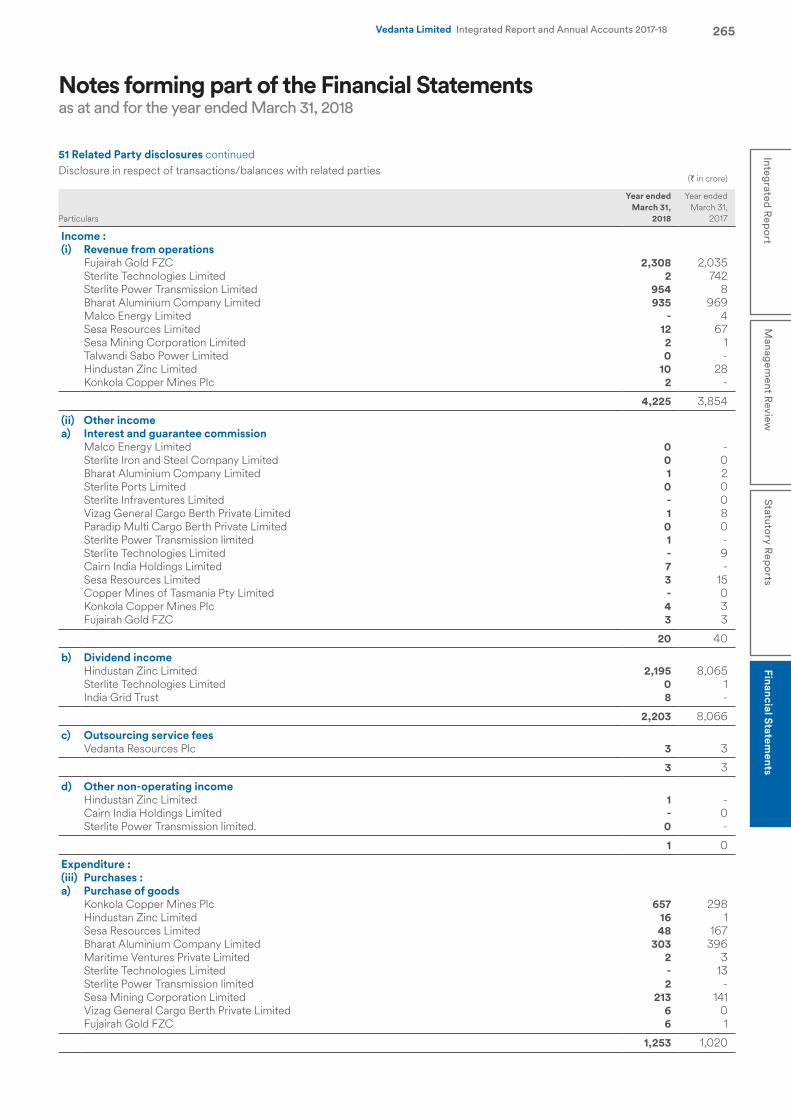
265Integrated R
eport
Managem
ent Review
Statutory R
eports
Financial Statements
Vedanta Limited Integrated Report and Annual Accounts 2017-18
Disclosure in respect of transactions/balances with related parties (` in crore)
Particulars
Year ended March 31,
2018
Year ended March 31,
2017
Income : (i) Revenue from operations
Fujairah Gold FZC 2,308 2,035 Sterlite Technologies Limited 2 742 Sterlite Power Transmission Limited 954 8 Bharat Aluminium Company Limited 935 969 Malco Energy Limited - 4 Sesa Resources Limited 12 67 Sesa Mining Corporation Limited 2 1 Talwandi Sabo Power Limited 0 - Hindustan Zinc Limited 10 28 Konkola Copper Mines Plc 2 -
4,225 3,854
(ii) Other income a) Interest and guarantee commission
Malco Energy Limited 0 - Sterlite Iron and Steel Company Limited 0 0 Bharat Aluminium Company Limited 1 2 Sterlite Ports Limited 0 0 Sterlite Infraventures Limited - 0 Vizag General Cargo Berth Private Limited 1 8 Paradip Multi Cargo Berth Private Limited 0 0 Sterlite Power Transmission limited 1 - Sterlite Technologies Limited - 9 Cairn India Holdings Limited 7 - Sesa Resources Limited 3 15 Copper Mines of Tasmania Pty Limited - 0 Konkola Copper Mines Plc 4 3 Fujairah Gold FZC 3 3
20 40
b) Dividend income Hindustan Zinc Limited 2,195 8,065 Sterlite Technologies Limited 0 1 India Grid Trust 8 -
2,203 8,066
c) Outsourcing service fees Vedanta Resources Plc 3 3
3 3
d) Other non-operating income Hindustan Zinc Limited 1 - Cairn India Holdings Limited - 0 Sterlite Power Transmission limited. 0 -
1 0
Expenditure : (iii) Purchases : a) Purchase of goods
Konkola Copper Mines Plc 657 298 Hindustan Zinc Limited 16 1 Sesa Resources Limited 48 167 Bharat Aluminium Company Limited 303 396 Maritime Ventures Private Limited 2 3 Sterlite Technologies Limited - 13 Sterlite Power Transmission limited 2 - Sesa Mining Corporation Limited 213 141 Vizag General Cargo Berth Private Limited 6 0 Fujairah Gold FZC 6 1
1,253 1,020
Notes forming part of the Financial Statementsas at and for the year ended March 31, 2018
51 Related Party disclosures continued
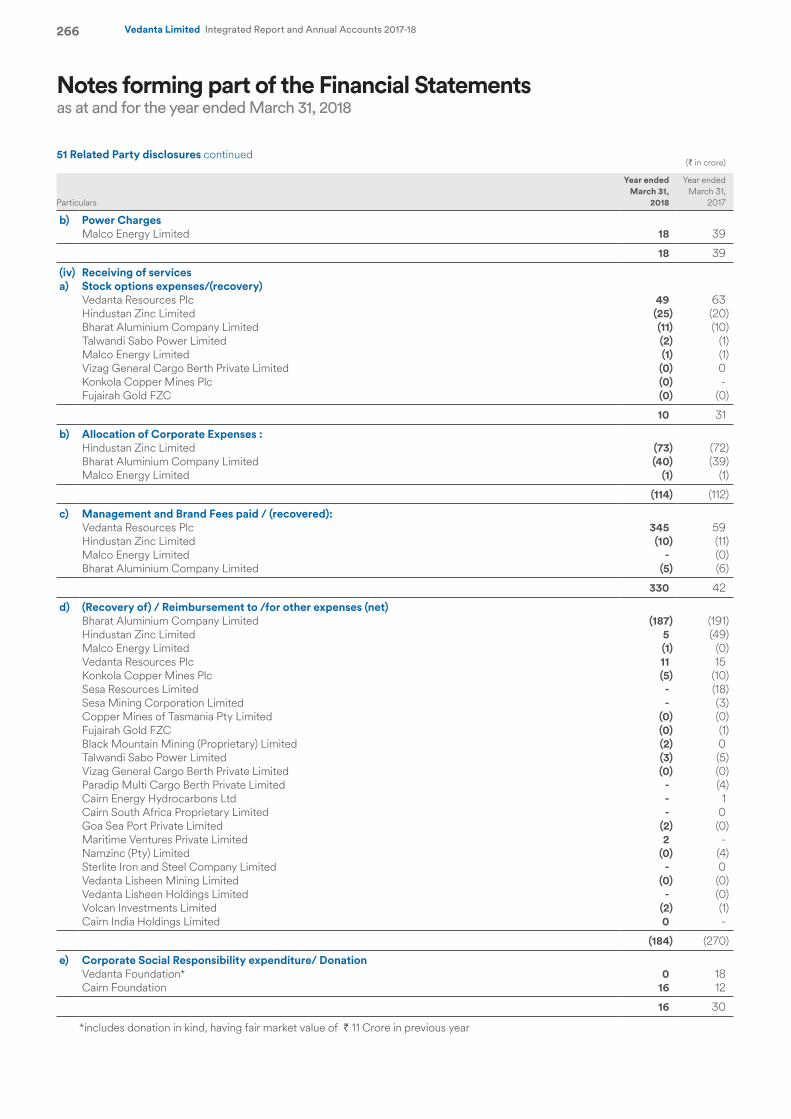
266 Vedanta Limited Integrated Report and Annual Accounts 2017-18
(` in crore)
Particulars
Year ended March 31,
2018
Year ended March 31,
2017
b) Power Charges Malco Energy Limited 18 39
18 39
(iv) Receiving of services a) Stock options expenses/(recovery)
Vedanta Resources Plc 49 63 Hindustan Zinc Limited (25) (20) Bharat Aluminium Company Limited (11) (10) Talwandi Sabo Power Limited (2) (1) Malco Energy Limited (1) (1) Vizag General Cargo Berth Private Limited (0) 0 Konkola Copper Mines Plc (0) - Fujairah Gold FZC (0) (0)
10 31
b) Allocation of Corporate Expenses : Hindustan Zinc Limited (73) (72) Bharat Aluminium Company Limited (40) (39) Malco Energy Limited (1) (1)
(114) (112)
c) Management and Brand Fees paid / (recovered): Vedanta Resources Plc 345 59 Hindustan Zinc Limited (10) (11) Malco Energy Limited - (0) Bharat Aluminium Company Limited (5) (6)
330 42
d) (Recovery of) / Reimbursement to /for other expenses (net) Bharat Aluminium Company Limited (187) (191) Hindustan Zinc Limited 5 (49) Malco Energy Limited (1) (0) Vedanta Resources Plc 11 15 Konkola Copper Mines Plc (5) (10) Sesa Resources Limited - (18) Sesa Mining Corporation Limited - (3) Copper Mines of Tasmania Pty Limited (0) (0) Fujairah Gold FZC (0) (1) Black Mountain Mining (Proprietary) Limited (2) 0 Talwandi Sabo Power Limited (3) (5) Vizag General Cargo Berth Private Limited (0) (0) Paradip Multi Cargo Berth Private Limited - (4) Cairn Energy Hydrocarbons Ltd - 1 Cairn South Africa Proprietary Limited - 0 Goa Sea Port Private Limited (2) (0) Maritime Ventures Private Limited 2 - Namzinc (Pty) Limited (0) (4) Sterlite Iron and Steel Company Limited - 0 Vedanta Lisheen Mining Limited (0) (0) Vedanta Lisheen Holdings Limited - (0) Volcan Investments Limited (2) (1) Cairn India Holdings Limited 0 -
(184) (270)
e) Corporate Social Responsibility expenditure/ Donation Vedanta Foundation* 0 18 Cairn Foundation 16 12
16 30
*includes donation in kind, having fair market value of ` 11 Crore in previous year
Notes forming part of the Financial Statementsas at and for the year ended March 31, 2018
51 Related Party disclosures continued
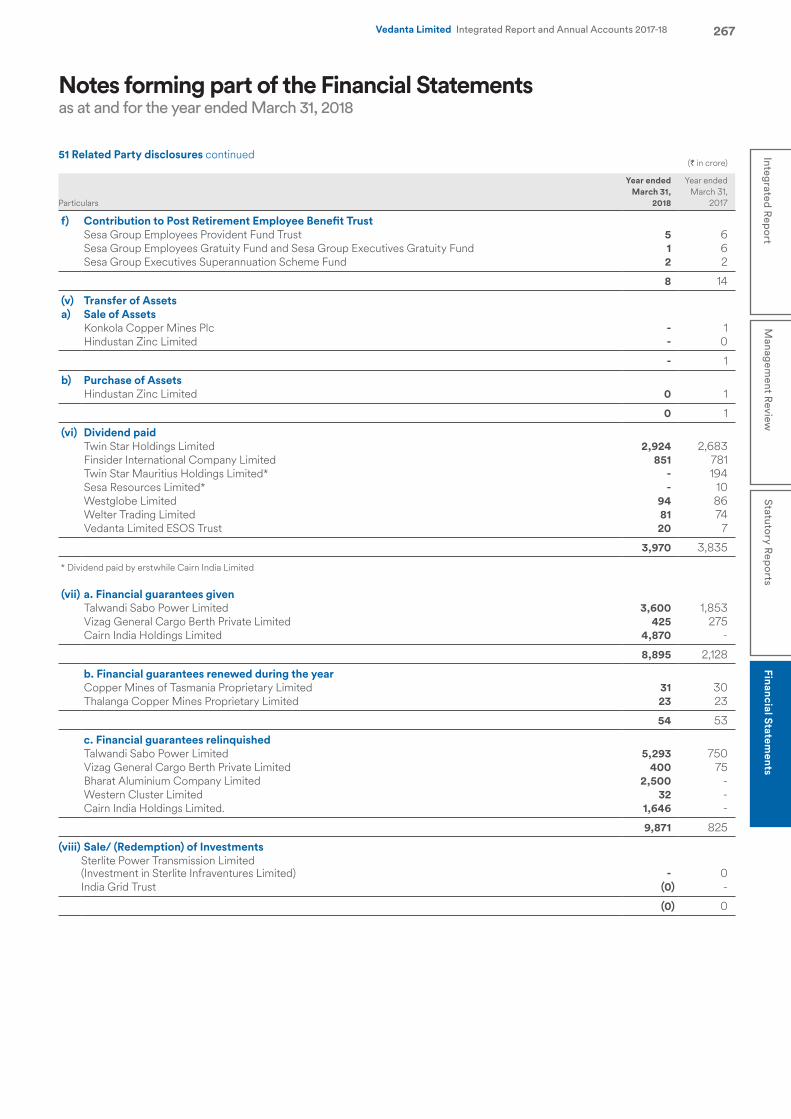
267Integrated R
eport
Managem
ent Review
Statutory R
eports
Financial Statements
Vedanta Limited Integrated Report and Annual Accounts 2017-18
(` in crore)
Particulars
Year ended March 31,
2018
Year ended March 31,
2017
f) Contribution to Post Retirement Employee Benefit Trust Sesa Group Employees Provident Fund Trust 5 6 Sesa Group Employees Gratuity Fund and Sesa Group Executives Gratuity Fund 1 6 Sesa Group Executives Superannuation Scheme Fund 2 2
8 14
(v) Transfer of Assets a) Sale of Assets
Konkola Copper Mines Plc - 1 Hindustan Zinc Limited - 0
- 1
b) Purchase of Assets Hindustan Zinc Limited 0 1
0 1
(vi) Dividend paid Twin Star Holdings Limited 2,924 2,683 Finsider International Company Limited 851 781 Twin Star Mauritius Holdings Limited* - 194 Sesa Resources Limited* - 10 Westglobe Limited 94 86 Welter Trading Limited 81 74 Vedanta Limited ESOS Trust 20 7
3,970 3,835
* Dividend paid by erstwhile Cairn India Limited
(vii) a. Financial guarantees given Talwandi Sabo Power Limited 3,600 1,853 Vizag General Cargo Berth Private Limited 425 275 Cairn India Holdings Limited 4,870 -
8,895 2,128
b. Financial guarantees renewed during the year Copper Mines of Tasmania Proprietary Limited 31 30 Thalanga Copper Mines Proprietary Limited 23 23
54 53
c. Financial guarantees relinquished Talwandi Sabo Power Limited 5,293 750 Vizag General Cargo Berth Private Limited 400 75 Bharat Aluminium Company Limited 2,500 - Western Cluster Limited 32 - Cairn India Holdings Limited. 1,646 -
9,871 825
(viii) Sale/ (Redemption) of Investments Sterlite Power Transmission Limited (Investment in Sterlite Infraventures Limited) - 0 India Grid Trust (0) -
(0) 0
Notes forming part of the Financial Statementsas at and for the year ended March 31, 2018
51 Related Party disclosures continued
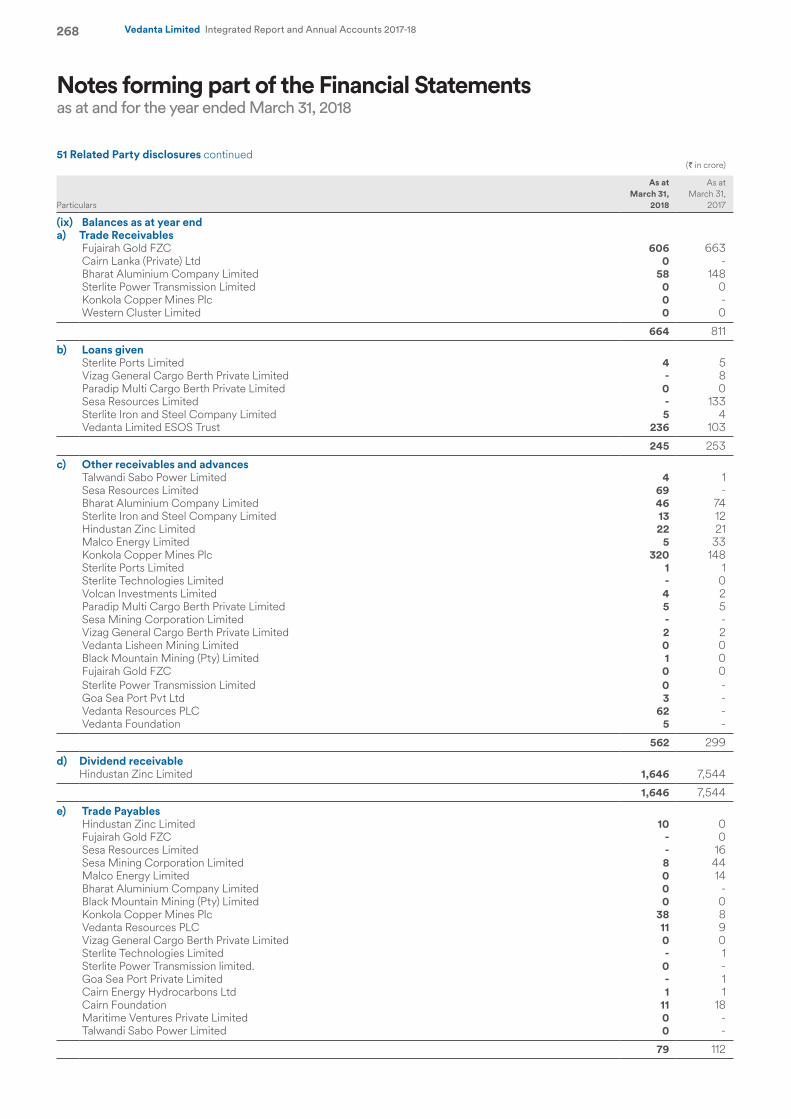
268 Vedanta Limited Integrated Report and Annual Accounts 2017-18
(` in crore)
Particulars
As at March 31,
2018
As at March 31,
2017
(ix) Balances as at year end a) Trade Receivables
Fujairah Gold FZC 606 663 Cairn Lanka (Private) Ltd 0 - Bharat Aluminium Company Limited 58 148 Sterlite Power Transmission Limited 0 0 Konkola Copper Mines Plc 0 - Western Cluster Limited 0 0
664 811
b) Loans given Sterlite Ports Limited 4 5 Vizag General Cargo Berth Private Limited - 8 Paradip Multi Cargo Berth Private Limited 0 0 Sesa Resources Limited - 133 Sterlite Iron and Steel Company Limited 5 4 Vedanta Limited ESOS Trust 236 103
245 253
c) Other receivables and advances Talwandi Sabo Power Limited 4 1 Sesa Resources Limited 69 - Bharat Aluminium Company Limited 46 74 Sterlite Iron and Steel Company Limited 13 12 Hindustan Zinc Limited 22 21 Malco Energy Limited 5 33 Konkola Copper Mines Plc 320 148 Sterlite Ports Limited 1 1 Sterlite Technologies Limited - 0 Volcan Investments Limited 4 2 Paradip Multi Cargo Berth Private Limited 5 5 Sesa Mining Corporation Limited - - Vizag General Cargo Berth Private Limited 2 2 Vedanta Lisheen Mining Limited 0 0 Black Mountain Mining (Pty) Limited 1 0 Fujairah Gold FZC 0 0 Sterlite Power Transmission Limited 0 - Goa Sea Port Pvt Ltd 3 - Vedanta Resources PLC 62 - Vedanta Foundation 5 -
562 299
d) Dividend receivableHindustan Zinc Limited 1,646 7,544
1,646 7,544
e) Trade Payables Hindustan Zinc Limited 10 0 Fujairah Gold FZC - 0 Sesa Resources Limited - 16 Sesa Mining Corporation Limited 8 44 Malco Energy Limited 0 14 Bharat Aluminium Company Limited 0 - Black Mountain Mining (Pty) Limited 0 0 Konkola Copper Mines Plc 38 8 Vedanta Resources PLC 11 9 Vizag General Cargo Berth Private Limited 0 0 Sterlite Technologies Limited - 1 Sterlite Power Transmission limited. 0 - Goa Sea Port Private Limited - 1 Cairn Energy Hydrocarbons Ltd 1 1 Cairn Foundation 11 18 Maritime Ventures Private Limited 0 - Talwandi Sabo Power Limited 0 -
79 112
Notes forming part of the Financial Statementsas at and for the year ended March 31, 2018
51 Related Party disclosures continued

269Integrated R
eport
Managem
ent Review
Statutory R
eports
Financial Statements
Vedanta Limited Integrated Report and Annual Accounts 2017-18
(` in crore)
Particulars
As at March 31,
2018
As at March 31,
2017
f) Other payables Malco Energy Limited - 0 Hindustan Zinc Limited - 0 Vedanta Resources Plc 2 12 Bharat Aluminium Company Limited 0 0 Talwandi Sabo Power Limited 0 - Konkola Copper Mines Plc - 0 Maritime Ventures Private Limited 1 - Fujairah Gold FZC 0 0 Vizag General Cargo Berth Private Limited 0 - Namzinc (Proprietary) Limited 0 - Sesa Group Employees Provident Fund Trust 2 2 Sesa Group Executives Superannuation Scheme 0 0
5 14
g) Other Current liabilities- Advance from Customers Sterlite Technologies Limited - 14
- 14
h) Dividend Payable Twin Star Holdings Limited - 2,441 Finsider International Company Limited - 711 Westglobe Limited - 78 Welter Trading Limited - 68 Vedanta Limited ESOS Trust - 7
- 3,305
i) Financial guarantee given Talwandi Sabo Power Limited 9,000 10,693 Vizag General Cargo Berth Private Limited 483 458 Bharat Aluminium Company Limited - 2,500 Copper Mines of Tasmania Pty Limited 31 30 Thalanga copper mines Pty Limited 23 23 Western Cluster Limited - 32 Volcan Investments Limited* 115 115 Cairn India Holdings Limited. 3,224 -
12,876 13,851
* Bank gaurantee given by Vedanta Limited on behalf of Volcan Investments Limited in favour of Income Tax department, India as collateral in respect of certain tax disputes of Volcan Investments Limited.
(` in crore)
Particulars
Year ended March 31,
2018
Year ended March 31,
2017
(x) Transactions during the year a) Loans Given during the year
Paradip Multi Cargo Berth Private Limited - 0 Malco Energy Limited 18 - Sterlite Ports Limited - 2 Sterlite Infraventures Limited - 0 Sesa Resources Limited 5 7 Vizag General Cargo Berth Private Limited - 79 Sterlite Iron and Steel Company Limited 0 0 Vedanta Limited ESOS Trust 202 108
225 196
Notes forming part of the Financial Statementsas at and for the year ended March 31, 2018
51 Related Party disclosures continued
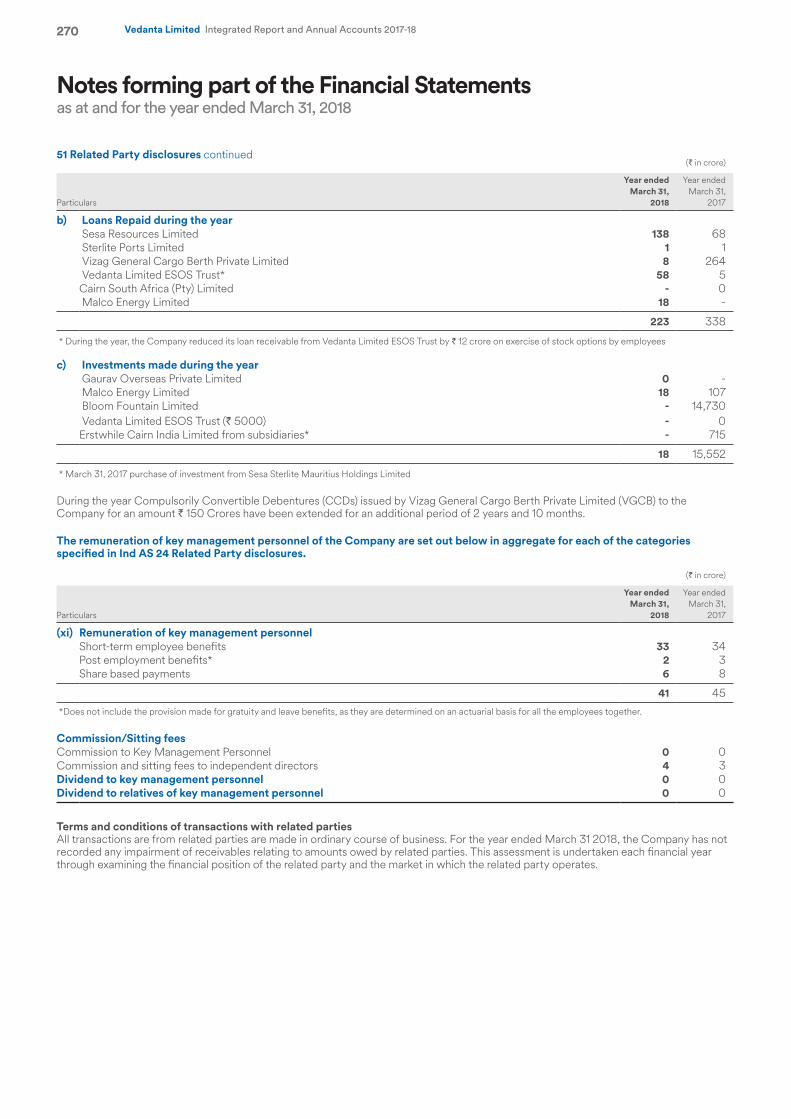
270 Vedanta Limited Integrated Report and Annual Accounts 2017-18
(` in crore)
Particulars
Year ended March 31,
2018
Year ended March 31,
2017
b) Loans Repaid during the year Sesa Resources Limited 138 68 Sterlite Ports Limited 1 1 Vizag General Cargo Berth Private Limited 8 264 Vedanta Limited ESOS Trust* 58 5 Cairn South Africa (Pty) Limited - 0 Malco Energy Limited 18 -
223 338
* During the year, the Company reduced its loan receivable from Vedanta Limited ESOS Trust by ` 12 crore on exercise of stock options by employees
c) Investments made during the year Gaurav Overseas Private Limited 0 - Malco Energy Limited 18 107 Bloom Fountain Limited - 14,730 Vedanta Limited ESOS Trust (` 5000) - 0 Erstwhile Cairn India Limited from subsidiaries* - 715
18 15,552
* March 31, 2017 purchase of investment from Sesa Sterlite Mauritius Holdings Limited
During the year Compulsorily Convertible Debentures (CCDs) issued by Vizag General Cargo Berth Private Limited (VGCB) to the Company for an amount ` 150 Crores have been extended for an additional period of 2 years and 10 months.
The remuneration of key management personnel of the Company are set out below in aggregate for each of the categories specified in Ind AS 24 Related Party disclosures.
(` in crore)
Particulars
Year ended March 31,
2018
Year ended March 31,
2017
(xi) Remuneration of key management personnel Short-term employee benefits 33 34Post employment benefits* 2 3Share based payments 6 8
41 45
*Does not include the provision made for gratuity and leave benefits, as they are determined on an actuarial basis for all the employees together.
Commission/Sitting fees Commission to Key Management Personnel 0 0 Commission and sitting fees to independent directors 4 3 Dividend to key management personnel 0 0 Dividend to relatives of key management personnel 0 0
Terms and conditions of transactions with related partiesAll transactions are from related parties are made in ordinary course of business. For the year ended March 31 2018, the Company has not recorded any impairment of receivables relating to amounts owed by related parties. This assessment is undertaken each financial year through examining the financial position of the related party and the market in which the related party operates.
Notes forming part of the Financial Statementsas at and for the year ended March 31, 2018
51 Related Party disclosures continued
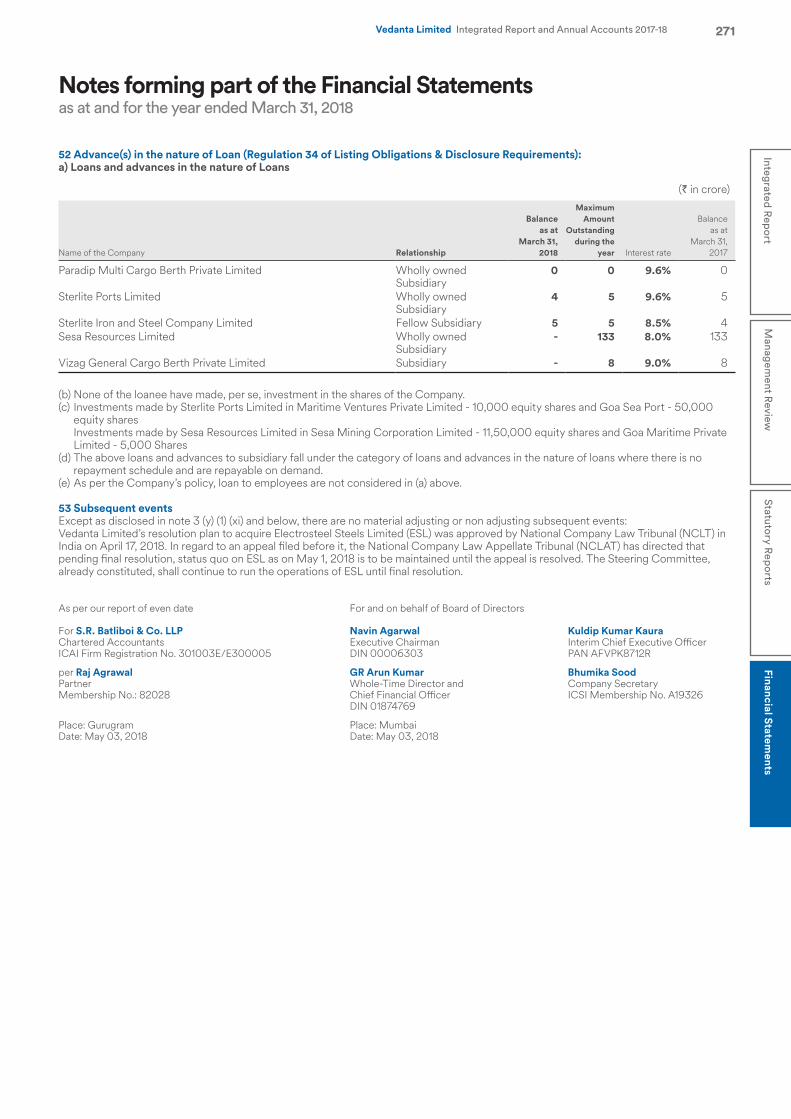
271Integrated R
eport
Managem
ent Review
Statutory R
eports
Financial Statements
Vedanta Limited Integrated Report and Annual Accounts 2017-18
52 Advance(s) in the nature of Loan (Regulation 34 of Listing Obligations & Disclosure Requirements):a) Loans and advances in the nature of Loans
(` in crore)
Name of the Company Relationship
Balance as at
March 31, 2018
Maximum Amount
Outstanding during the
year Interest rate
Balance as at
March 31, 2017
Paradip Multi Cargo Berth Private Limited Wholly owned Subsidiary
0 0 9.6% 0
Sterlite Ports Limited Wholly owned Subsidiary
4 5 9.6% 5
Sterlite Iron and Steel Company Limited Fellow Subsidiary 5 5 8.5% 4 Sesa Resources Limited Wholly owned
Subsidiary - 133 8.0% 133
Vizag General Cargo Berth Private Limited Subsidiary - 8 9.0% 8
(b) None of the loanee have made, per se, investment in the shares of the Company.(c) Investments made by Sterlite Ports Limited in Maritime Ventures Private Limited - 10,000 equity shares and Goa Sea Port - 50,000
equity shares Investments made by Sesa Resources Limited in Sesa Mining Corporation Limited - 11,50,000 equity shares and Goa Maritime Private Limited - 5,000 Shares
(d) The above loans and advances to subsidiary fall under the category of loans and advances in the nature of loans where there is no repayment schedule and are repayable on demand.
(e) As per the Company’s policy, loan to employees are not considered in (a) above.
53 Subsequent eventsExcept as disclosed in note 3 (y) (1) (xi) and below, there are no material adjusting or non adjusting subsequent events:Vedanta Limited’s resolution plan to acquire Electrosteel Steels Limited (ESL) was approved by National Company Law Tribunal (NCLT) in India on April 17, 2018. In regard to an appeal filed before it, the National Company Law Appellate Tribunal (NCLAT) has directed that pending final resolution, status quo on ESL as on May 1, 2018 is to be maintained until the appeal is resolved. The Steering Committee, already constituted, shall continue to run the operations of ESL until final resolution.
As per our report of even date For and on behalf of Board of Directors
For S.R. Batliboi & Co. LLP Navin Agarwal Kuldip Kumar KauraChartered Accountants Executive Chairman Interim Chief Executive OfficerICAI Firm Registration No. 301003E/E300005 DIN 00006303 PAN AFVPK8712R
per Raj Agrawal GR Arun Kumar Bhumika SoodPartner Whole-Time Director and Company SecretaryMembership No.: 82028 Chief Financial Officer ICSI Membership No. A19326 DIN 01874769
Place: Gurugram Place: MumbaiDate: May 03, 2018 Date: May 03, 2018
Notes forming part of the Financial Statementsas at and for the year ended March 31, 2018
272 Vedanta Limited Integrated Report and Annual Accounts 2017-18
ConsolidatedFinancial Statements
273Integrated R
eport
Managem
ent Review
Statutory R
eports
Financial Statements
Vedanta Limited Integrated Report and Annual Accounts 2017-18
Independent Auditor’s Report
To the Members of Vedanta Limited Report on the Consolidated Ind AS Financial StatementsWe have audited the accompanying consolidated Ind AS financial statements of Vedanta Limited (hereinafter referred to as “the Holding Company”), its subsidiaries (the Holding Company and its subsidiaries together referred to as “the Group”) its associates and jointly controlled entities, comprising of the consolidated Balance Sheet as at March 31, 2018, the consolidated Statement of Profit and Loss including Other Comprehensive Income, the consolidated Cash Flow Statement, the consolidated Statement of Changes in Equity for the year then ended, and a summary of significant accounting policies and other explanatory information (hereinafter referred to as “the consolidated Ind AS financial statements”).
Management’s Responsibility for the Consolidated Ind AS Financial StatementsThe Holding Company’s Board of Directors is responsible for the preparation of these consolidated Ind AS financial statements in terms of the requirement of the Companies Act, 2013 (“the Act”) that give a true and fair view of the consolidated financial position, consolidated financial performance including other comprehensive income, consolidated cash flows and consolidated statement of changes in equity of the Group including its associates and jointly controlled entities in accordance with accounting principles generally accepted in India, including the Accounting Standards specified under Section 133 of the Act, read with the Companies (Indian Accounting Standard) Rules, 2015, as amended. The respective Board of Directors of the companies included in the Group and of its associates and jointly controlled entities are responsible for maintenance of adequate accounting records in accordance with the provisions of the Act for safeguarding of the assets of the Group and of its associates and jointly controlled entities and for preventing and detecting frauds and other irregularities; the selection and application of appropriate accounting policies; making judgments and estimates that are reasonable and prudent; and the design, implementation and maintenance of adequate internal financial controls, that were operating effectively for ensuring the accuracy and completeness of the accounting records, relevant to the preparation and presentation of the financial statements that give a true and fair view and are free from material misstatement(s), whether due to fraud or error, which have been used for the purpose of preparation of the consolidated Ind AS financial statements by the Directors of the Holding Company, as aforesaid.
Auditor’s ResponsibilityOur responsibility is to express an opinion on these consolidated Ind AS financial statements based on our audit. While conducting the audit, we have taken into account the provisions of the Act, the accounting and auditing standards and matters which are required to be included in the audit report under the provisions of the Act and the Rules made thereunder. We conducted our audit in accordance with the Standards on Auditing, issued by the Institute of Chartered Accountants of India, as specified under Section 143(10) of the Act. Those Standards require that we comply with ethical requirements and plan and perform the audit to obtain reasonable assurance about whether the financial statements are free from material misstatement.
An audit involves performing procedures to obtain audit evidence about the amounts and disclosures in the consolidated financial statements. The procedures selected depend on the auditor’s judgment, including the assessment of the risks of material misstatement of the consolidated financial statements, whether due to fraud or error. In making those risk assessments, the auditor considers internal financial control relevant to the Holding Company’s preparation of the consolidated Ind AS financial statements that give a true and fair view in order to design audit procedures that are appropriate in the circumstances. An audit also includes evaluating the appropriateness of accounting policies used and the reasonableness of the accounting estimates made by the Holding Company’s Board of Directors, as well as evaluating the overall presentation of the consolidated financial statements. We believe that the audit evidence obtained by us and the audit evidence obtained by the other auditors in terms of their reports referred to in sub-paragraph (a) of the Other Matters paragraph below, is sufficient and appropriate to provide a basis for our audit opinion on the consolidated Ind AS financial statements.
OpinionIn our opinion and to the best of our information and according to the explanations given to us, and based on the consideration of reports of other auditors on separate financial statements and on the other financial information of the subsidiaries, associates and jointly controlled entities, the aforesaid consolidated Ind AS financial statements give the information required by the Act in the manner so required and give a true and fair view in conformity with the accounting principles generally accepted in India of the consolidated state of affairs of the Group, its associates and jointly controlled entities as at March 31, 2018, their consolidated profits including other comprehensive income, their consolidated cash flows and consolidated statement of changes in equity for the year ended on that date.
Other Matters
(a) We did not audit the financial statements and other financial information, in respect of 13 subsidiaries, whose Ind AS financial statements include total assets of ` 7,527 Crore and net assets of ` 4,532 Crore as at March 31, 2018, and total revenues of ` 3,479 Crore and net cash outflows of ` 257 Crore respectively for the year ended on that date. These financial statements and other financial information have been audited by other auditors, whose financial statements, other financial information and auditors’ reports have been furnished to us by the management. The consolidated Ind AS financial statements also include the Group’s share of net profit of ` Nil for the year ended March 31, 2018 as considered in the consolidated financial statements, in respect of 1 associate, whose financial statements, other financial information have been audited by other auditors and whose reports have been furnished to us by the Management. Our opinion on the consolidated Ind AS financial statements, in so far as it relates to the amounts and disclosures included in respect of these subsidiaries and associate, and our report in terms of sub-sections (3) of Section 143 of the Act, in so far as it relates to the aforesaid subsidiaries and associate, is based solely on the report(s) of such other auditors.
All of these subsidiaries and associates are located outside India whose financial statements and other financial information have been prepared in accordance with accounting principles generally accepted in their respective countries and which have been audited by other auditors under generally accepted auditing standards applicable in their respective countries. The Company’s management has converted the financial statements of such subsidiaries, associates and jointly controlled entities located outside India from accounting principles generally accepted in their respective countries to accounting principles generally accepted in India. We have audited these conversion adjustments made by the Company’s management. Our opinion in so far as it relates to the balances and affairs of such subsidiaries, associates and jointly controlled entities located outside India is based on the report of other auditors and the conversion adjustments prepared by the management of the Company and audited by us.
274 Vedanta Limited Integrated Report and Annual Accounts 2017-18
(b) The accompanying consolidated Ind AS financial statements include unaudited financial statements and other unaudited financial information in respect of 3 subsidiaries whose financial statements and other financial information reflect total assets of ` 2,790 Crore and net assets of ` 97 Crore as at March 31, 2018, and total revenues of ` 150 Crore and net cash inflows of ` 65 Crore for the year ended on that date. These unaudited financial statements and other unaudited financial information have been furnished to us by the management. The consolidated Ind AS financial statements also include the Group’s share of net profit of ` Nil Crore for the year ended March 31, 2018, as considered in the consolidated financial statements, in respect of 1 associate and 3 jointly controlled entities, whose financial statements, other financial information have not been audited and whose unaudited financial statements and other unaudited financial information have been furnished to us by the Management. Our opinion, in so far as it relates to amounts and disclosures included in respect of these subsidiaries, associates and jointly controlled entities, and our report in terms of sub-sections (3) of Section 143 of the Act in so far as it relates to the aforesaid subsidiaries, associates and jointly controlled entities, is based solely on such unaudited financial statement and other unaudited financial information. In our opinion and according to the information and explanations given to us by the Management, these financial statements and other financial information are not material to the Group.
Our opinion above on the consolidated Ind AS financial statements, and our report on Other Legal and Regulatory Requirements below, is not modified in respect of the above matters with respect to our reliance on the work done and the reports of the other auditors and the financial statements and other financial information certified by the Management.
Report on Other Legal and Regulatory RequirementsAs required by section 143 (3) of the Act, based on our audit and on the consideration of report of the other auditors on separate financial statements and the other financial information of subsidiaries, associates and jointly controlled entities, as noted in the ‘Other Matters’ paragraph, we report, to the extent applicable, that:
(a) We and the other auditors whose reports we have relied upon have sought and obtained all the information and explanations which to the best of our knowledge and belief were necessary for the purpose of our audit of the aforesaid consolidated Ind AS financial statements;
(b) In our opinion, proper books of account as required by law relating to preparation of the aforesaid consolidation of the financial statements have been kept so far as it appears from our examination of those books and reports of the other auditors;
(c) The consolidated Balance Sheet, consolidated Statement of Profit and Loss including the Statement of Other Comprehensive Income, the consolidated Cash Flow Statement and consolidated Statement of Changes in Equity dealt with by this Report are in agreement with the books of account maintained for the purpose of preparation of the consolidated Ind AS financial statements;
(d) In our opinion, the aforesaid consolidated Ind AS financial statements comply with the Accounting Standards specified under section 133 of the Act, read with Companies (Indian Accounting Standard) Rules, 2015, as amended;
(e) On the basis of the written representations received from the directors of the Holding Company as on March 31, 2018 and taken on record by the Board of Directors of the Holding Company and the reports of the statutory auditors who are appointed under Section 139 of the Act, of its subsidiaries, associates and jointly controlled entities incorporated in India, none of the directors of the Group’s companies incorporated in India is disqualified as on March 31, 2018 from being appointed as a director in terms of Section 164 (2) of the Act.
(f) With respect to the adequacy and the operating effectiveness of the internal financial controls over financial reporting of the Holding Company and its subsidiary companies, associate companies and jointly controlled entities incorporated in India, refer to our separate report in “Annexure 1” to this report;
(g) With respect to the other matters to be included in the Auditor’s Report in accordance with Rule 11 of the Companies (Audit and Auditors) Rules, 2014, in our opinion and to the best of our information and according to the explanations given to us and based on the consideration of the report of the other auditors on separate financial statements as also the other financial information of the subsidiaries, associates and jointly controlled entities, as noted in the ‘Other Matters’ paragraph:
i. The consolidated Ind AS financial statements disclose the impact of pending litigations on the consolidated financial position of the Group, its associates and jointly controlled entities – Refer Note 49 to the consolidated Ind AS financial statements;
ii. The Group, its associates and jointly controlled entities did not have any material foreseeable losses in long-term contracts including derivative contracts during the year ended March 31, 2018;
iii. There has been no delay in transferring amounts, required to be transferred, to the Investor Education and Protection Fund by the Holding Company, its subsidiaries, associates and jointly controlled entities incorporated in India during the year ended March 31, 2018.
For S.R. Batliboi & Co. LLPChartered Accountants
ICAI Firm Registration Number: 301003E/E300005
per Raj AgrawalPlace: Gurugram PartnerDate: May 03, 2018 Membership Number: 82028
275Integrated R
eport
Managem
ent Review
Statutory R
eports
Financial Statements
Vedanta Limited Integrated Report and Annual Accounts 2017-18
Annexure 1 referred to in para (f) under the heading “Report on Other Legal and Regulatory Requirements” to the independent auditor’s report of even date on the consolidated Ind AS Financial Statements of Vedanta Limited
Report on the Internal Financial Controls under Clause (i) of Sub-section 3 of Section 143 of the Companies Act, 2013 (“the Act”)
In conjunction with our audit of the consolidated financial statements of Vedanta Limited as of and for the year ended March 31, 2018, we have audited the internal financial controls over financial reporting of Vedanta Limited (hereinafter referred to as the “Holding Company”) and its subsidiary companies, its associates and jointly controlled entities, which are companies incorporated in India, as of that date.
Management’s Responsibility for Internal Financial Controls The respective Board of Directors of the Holding Company, its subsidiaries, associates and jointly controlled entities, which are companies incorporated in India, are responsible for establishing and maintaining internal financial controls based on the internal control over financial reporting criteria established under the Committee of Sponsoring Organizations of the Treadway Commission (2013 framework) (“COSO 2013 criteria”), which considers the essential components of internal control stated in the Guidance Note on Audit of Internal Financial Controls Over Financial Reporting issued by the Institute of Chartered Accountants of India. These responsibilities include the design, implementation and maintenance of adequate internal financial controls that were operating effectively for ensuring the orderly and efficient conduct of its business, including adherence to the respective company’s policies, the safeguarding of its assets, the prevention and detection of frauds and errors, the accuracy and completeness of the accounting records, and the timely preparation of reliable financial information, as required under the Act.
Auditor’s ResponsibilityOur responsibility is to express an opinion on the Holding Company’s, its subsidiaries, associates and jointly controlled entities, which are companies incorporated in India, internal financial controls over financial reporting based on our audit. We conducted our audit in accordance with the Guidance Note on Audit of Internal Financial Controls Over Financial Reporting (the “Guidance Note”) and the Standards on Auditing, both issued by Institute of Chartered Accountants of India, and deemed to be prescribed under section 143(10) of the Act, to the extent applicable to an audit of internal financial controls. Those Standards and the Guidance Note require that we comply with ethical requirements and plan and perform the audit to obtain reasonable assurance about whether adequate internal financial controls over financial reporting was established and maintained and if such controls operated effectively in all material respects.
Our audit involves performing procedures to obtain audit evidence about the adequacy of the internal financial controls system over financial reporting and their operating effectiveness. Our audit of internal financial controls over financial reporting included obtaining an understanding of internal financial controls over financial reporting, assessing the risk that a material weakness exists, and testing and evaluating the design and operating effectiveness of internal control based on the assessed risk. The procedures selected depend on the auditor’s judgement, including the assessment of the risks of material misstatement of the financial statements, whether due to fraud or error.
We believe that the audit evidence we have obtained and the audit evidence obtained by the other auditors in terms of their reports referred to in the “Other Matters” paragraph below, is sufficient and appropriate to provide a basis for our audit opinion on the internal financial controls system over financial reporting.
Meaning of Internal Financial Controls Over Financial Reporting A company’s internal financial control over financial reporting is a process designed to provide reasonable assurance regarding the reliability of financial reporting and the preparation of financial statements for external purposes in accordance with generally accepted accounting principles. A company’s internal financial control over financial reporting includes those policies and procedures that (1) pertain to the maintenance of records that, in reasonable detail, accurately and fairly reflect the transactions and dispositions of the assets of the company; (2) provide reasonable assurance that transactions are recorded as necessary to permit preparation of financial statements in accordance with generally accepted accounting principles, and that receipts and expenditures of the company are being made only in accordance with authorisations of management and directors of the company; and (3) provide reasonable assurance regarding prevention or timely detection of unauthorised acquisition, use, or disposition of the company’s assets that could have a material effect on the financial statements.
Inherent Limitations of Internal Financial Controls Over Financial ReportingBecause of the inherent limitations of internal financial controls over financial reporting, including the possibility of collusion or improper management override of controls, material misstatements due to error or fraud may occur and not be detected. Also, projections of any evaluation of the internal financial controls over financial reporting to future periods are subject to the risk that the internal financial control over financial reporting may become inadequate because of changes in conditions, or that the degree of compliance with the policies or procedures may deteriorate.
OpinionIn our opinion, the Holding Company, its subsidiaries, associates and jointly controlled entities, which are companies incorporated in India, have maintained in all material respects, an adequate internal financial controls system over financial reporting and such internal financial controls over financial reporting were operating effectively as at March 31, 2018, based on the internal control over financial reporting in COSO 2013 criteria, established by the Holding Company considering the essential components of internal control stated in the Guidance Note on Audit of Internal Financial Controls Over Financial Reporting issued by the Institute of Chartered Accountants of India.
Other MattersOur report under Section 143(3)(i) of the Act on the adequacy and operating effectiveness of the internal financial controls over financial reporting of the Holding Company, its subsidiaries, associates and jointly controlled entities, which are companies incorporated in India, insofar as it relates to 1 subsidiary, 1 associate and 1 jointly controlled entity, which are companies incorporated in India, is based on the corresponding reports of the auditors of such associates and jointly controlled entity incorporated in India.
For S.R. Batliboi & Co. LLPChartered Accountants
ICAI Firm Registration Number: 301003E/E300005
per Raj AgrawalPlace: Gurugram PartnerDate: May 03, 2018 Membership Number: 82028
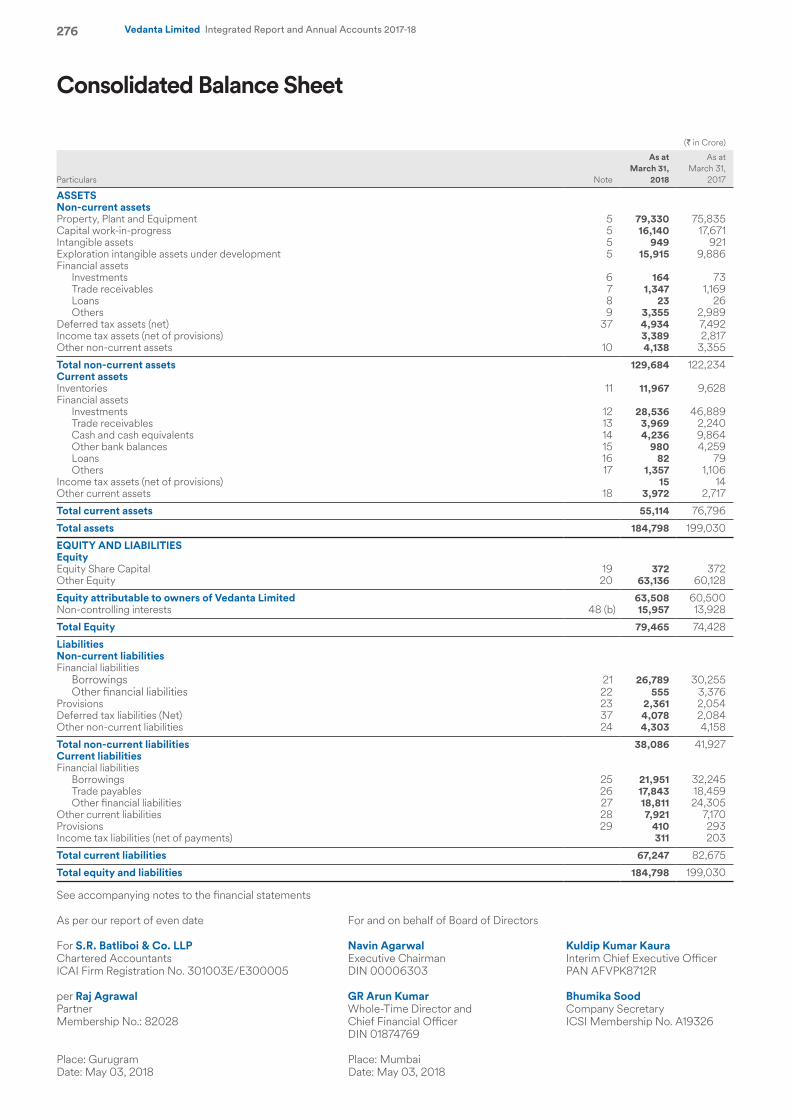
276 Vedanta Limited Integrated Report and Annual Accounts 2017-18
(` in Crore)
Particulars Note
As at March 31,
2018
As at March 31,
2017
ASSETS Non-current assets Property, Plant and Equipment 5 79,330 75,835Capital work-in-progress 5 16,140 17,671Intangible assets 5 949 921Exploration intangible assets under development 5 15,915 9,886Financial assets
Investments 6 164 73Trade receivables 7 1,347 1,169Loans 8 23 26Others 9 3,355 2,989
Deferred tax assets (net) 37 4,934 7,492Income tax assets (net of provisions) 3,389 2,817Other non-current assets 10 4,138 3,355
Total non-current assets 129,684 122,234Current assets Inventories 11 11,967 9,628Financial assets
Investments 12 28,536 46,889Trade receivables 13 3,969 2,240Cash and cash equivalents 14 4,236 9,864Other bank balances 15 980 4,259Loans 16 82 79Others 17 1,357 1,106
Income tax assets (net of provisions) 15 14Other current assets 18 3,972 2,717
Total current assets 55,114 76,796
Total assets 184,798 199,030
EQUITY AND LIABILITIES Equity Equity Share Capital 19 372 372Other Equity 20 63,136 60,128
Equity attributable to owners of Vedanta Limited 63,508 60,500Non-controlling interests 48 (b) 15,957 13,928
Total Equity 79,465 74,428
Liabilities Non-current liabilities Financial liabilities
Borrowings 21 26,789 30,255Other financial liabilities 22 555 3,376
Provisions 23 2,361 2,054Deferred tax liabilities (Net) 37 4,078 2,084Other non-current liabilities 24 4,303 4,158
Total non-current liabilities 38,086 41,927Current liabilities Financial liabilities
Borrowings 25 21,951 32,245Trade payables 26 17,843 18,459Other financial liabilities 27 18,811 24,305
Other current liabilities 28 7,921 7,170Provisions 29 410 293Income tax liabilities (net of payments) 311 203
Total current liabilities 67,247 82,675
Total equity and liabilities 184,798 199,030
See accompanying notes to the financial statements
As per our report of even date For and on behalf of Board of Directors
For S.R. Batliboi & Co. LLP Navin Agarwal Kuldip Kumar KauraChartered Accountants Executive Chairman Interim Chief Executive OfficerICAI Firm Registration No. 301003E/E300005 DIN 00006303 PAN AFVPK8712R
per Raj Agrawal GR Arun Kumar Bhumika SoodPartner Whole-Time Director and Company SecretaryMembership No.: 82028 Chief Financial Officer ICSI Membership No. A19326 DIN 01874769
Place: Gurugram Place: MumbaiDate: May 03, 2018 Date: May 03, 2018
Consolidated Balance Sheet
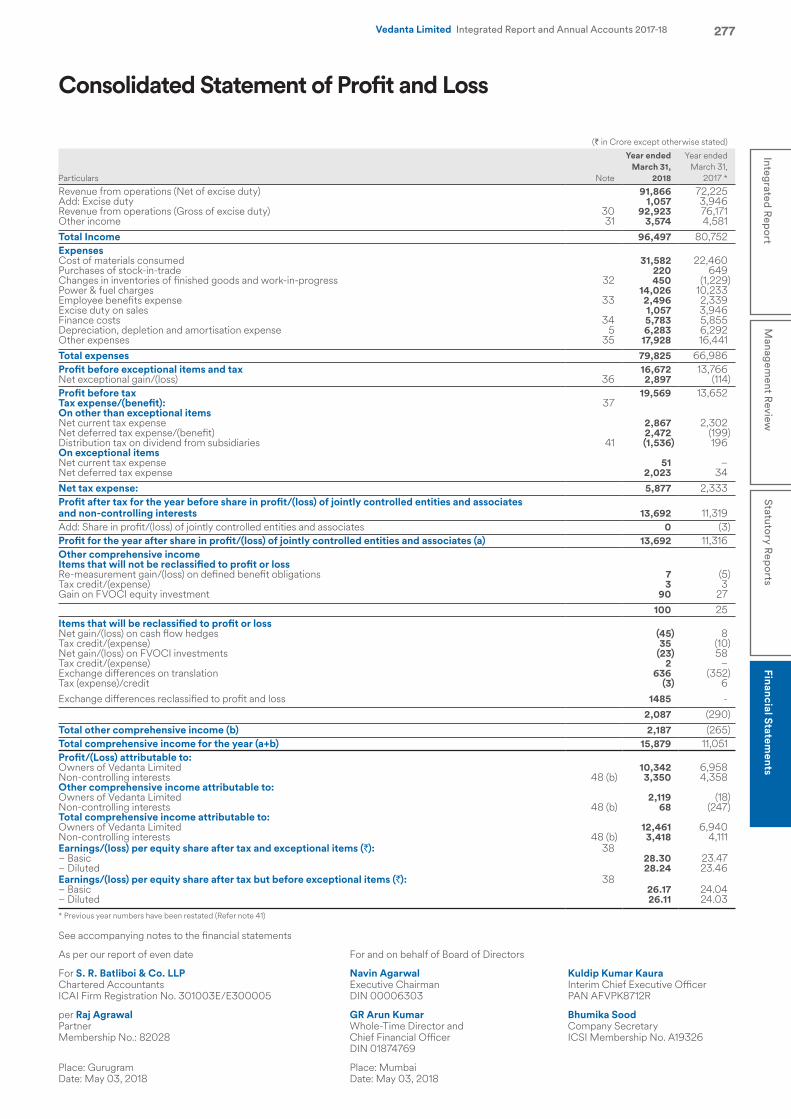
277Integrated R
eport
Managem
ent Review
Statutory R
eports
Financial Statements
Vedanta Limited Integrated Report and Annual Accounts 2017-18
Consolidated Statement of Profit and Loss
(` in Crore except otherwise stated)
Particulars Note
Year ended March 31,
2018
Year ended March 31,
2017 *
Revenue from operations (Net of excise duty) 91,866 72,225Add: Excise duty 1,057 3,946Revenue from operations (Gross of excise duty) 30 92,923 76,171Other income 31 3,574 4,581Total Income 96,497 80,752ExpensesCost of materials consumed 31,582 22,460Purchases of stock-in-trade 220 649Changes in inventories of finished goods and work-in-progress 32 450 (1,229)Power & fuel charges 14,026 10,233Employee benefits expense 33 2,496 2,339Excise duty on sales 1,057 3,946Finance costs 34 5,783 5,855Depreciation, depletion and amortisation expense 5 6,283 6,292Other expenses 35 17,928 16,441Total expenses 79,825 66,986Profit before exceptional items and tax 16,672 13,766Net exceptional gain/(loss) 36 2,897 (114)Profit before tax 19,569 13,652Tax expense/(benefit): 37On other than exceptional itemsNet current tax expense 2,867 2,302Net deferred tax expense/(benefit) 2,472 (199)Distribution tax on dividend from subsidiaries 41 (1,536) 196On exceptional itemsNet current tax expense 51 –Net deferred tax expense 2,023 34Net tax expense: 5,877 2,333Profit after tax for the year before share in profit/(loss) of jointly controlled entities and associates and non-controlling interests 13,692 11,319Add: Share in profit/(loss) of jointly controlled entities and associates 0 (3)Profit for the year after share in profit/(loss) of jointly controlled entities and associates (a) 13,692 11,316Other comprehensive incomeItems that will not be reclassified to profit or lossRe-measurement gain/(loss) on defined benefit obligations 7 (5)Tax credit/(expense) 3 3Gain on FVOCI equity investment 90 27
100 25Items that will be reclassified to profit or lossNet gain/(loss) on cash flow hedges (45) 8Tax credit/(expense) 35 (10)Net gain/(loss) on FVOCI investments (23) 58Tax credit/(expense) 2 –Exchange differences on translation 636 (352)Tax (expense)/credit (3) 6Exchange differences reclassified to profit and loss 1485 -
2,087 (290)Total other comprehensive income (b) 2,187 (265)Total comprehensive income for the year (a+b) 15,879 11,051Profit/(Loss) attributable to:Owners of Vedanta Limited 10,342 6,958Non-controlling interests 48 (b) 3,350 4,358Other comprehensive income attributable to:Owners of Vedanta Limited 2,119 (18)Non-controlling interests 48 (b) 68 (247)Total comprehensive income attributable to:Owners of Vedanta Limited 12,461 6,940Non-controlling interests 48 (b) 3,418 4,111Earnings/(loss) per equity share after tax and exceptional items (`): 38– Basic 28.30 23.47– Diluted 28.24 23.46Earnings/(loss) per equity share after tax but before exceptional items (`): 38– Basic 26.17 24.04– Diluted 26.11 24.03* Previous year numbers have been restated (Refer note 41)
See accompanying notes to the financial statements
As per our report of even date For and on behalf of Board of Directors
For S. R. Batliboi & Co. LLP Navin Agarwal Kuldip Kumar KauraChartered Accountants Executive Chairman Interim Chief Executive OfficerICAI Firm Registration No. 301003E/E300005 DIN 00006303 PAN AFVPK8712R
per Raj Agrawal GR Arun Kumar Bhumika SoodPartner Whole-Time Director and Company SecretaryMembership No.: 82028 Chief Financial Officer ICSI Membership No. A19326 DIN 01874769
Place: Gurugram Place: MumbaiDate: May 03, 2018 Date: May 03, 2018
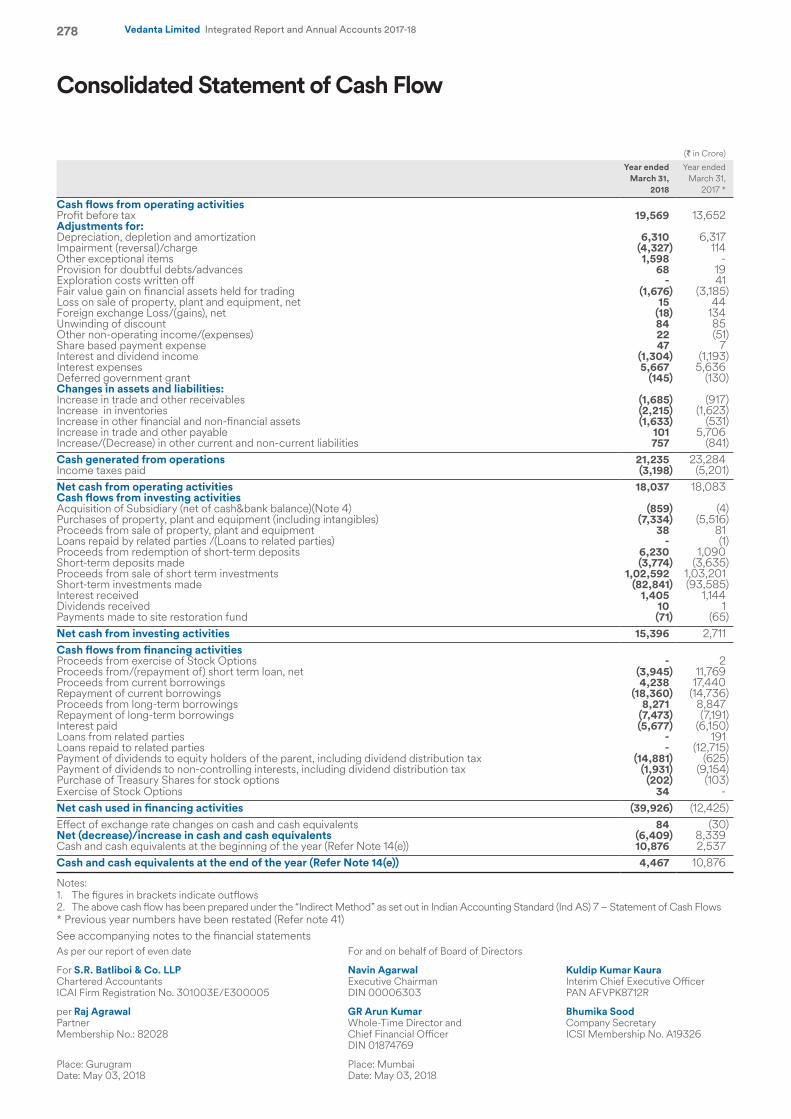
278 Vedanta Limited Integrated Report and Annual Accounts 2017-18
Consolidated Statement of Cash Flow
(` in Crore)
Year ended March 31,
2018
Year ended March 31,
2017 *
Cash flows from operating activities Profit before tax 19,569 13,652 Adjustments for:Depreciation, depletion and amortization 6,310 6,317 Impairment (reversal)/charge (4,327) 114 Other exceptional items 1,598 - Provision for doubtful debts/advances 68 19 Exploration costs written off - 41 Fair value gain on financial assets held for trading (1,676) (3,185)Loss on sale of property, plant and equipment, net 15 44 Foreign exchange Loss/(gains), net (18) 134 Unwinding of discount 84 85 Other non-operating income/(expenses) 22 (51)Share based payment expense 47 7 Interest and dividend income (1,304) (1,193)Interest expenses 5,667 5,636 Deferred government grant (145) (130)Changes in assets and liabilities:Increase in trade and other receivables (1,685) (917)Increase in inventories (2,215) (1,623)Increase in other financial and non-financial assets (1,633) (531)Increase in trade and other payable 101 5,706 Increase/(Decrease) in other current and non-current liabilities 757 (841)Cash generated from operations 21,235 23,284 Income taxes paid (3,198) (5,201)Net cash from operating activities 18,037 18,083 Cash flows from investing activitiesAcquisition of Subsidiary (net of cash&bank balance)(Note 4) (859) (4)Purchases of property, plant and equipment (including intangibles) (7,334) (5,516)Proceeds from sale of property, plant and equipment 38 81 Loans repaid by related parties /(Loans to related parties) - (1)Proceeds from redemption of short-term deposits 6,230 1,090 Short-term deposits made (3,774) (3,635)Proceeds from sale of short term investments 1,02,592 1,03,201 Short-term investments made (82,841) (93,585)Interest received 1,405 1,144 Dividends received 10 1 Payments made to site restoration fund (71) (65)Net cash from investing activities 15,396 2,711 Cash flows from financing activitiesProceeds from exercise of Stock Options - 2 Proceeds from/(repayment of) short term loan, net (3,945) 11,769 Proceeds from current borrowings 4,238 17,440 Repayment of current borrowings (18,360) (14,736)Proceeds from long-term borrowings 8,271 8,847 Repayment of long-term borrowings (7,473) (7,191)Interest paid (5,677) (6,150)Loans from related parties - 191 Loans repaid to related parties - (12,715)Payment of dividends to equity holders of the parent, including dividend distribution tax (14,881) (625)Payment of dividends to non-controlling interests, including dividend distribution tax (1,931) (9,154)Purchase of Treasury Shares for stock options (202) (103)Exercise of Stock Options 34 - Net cash used in financing activities (39,926) (12,425)Effect of exchange rate changes on cash and cash equivalents 84 (30)Net (decrease)/increase in cash and cash equivalents (6,409) 8,339 Cash and cash equivalents at the beginning of the year (Refer Note 14(e)) 10,876 2,537 Cash and cash equivalents at the end of the year (Refer Note 14(e)) 4,467 10,876
Notes:1. The figures in brackets indicate outflows2. The above cash flow has been prepared under the “Indirect Method” as set out in Indian Accounting Standard (Ind AS) 7 – Statement of Cash Flows* Previous year numbers have been restated (Refer note 41)See accompanying notes to the financial statementsAs per our report of even date For and on behalf of Board of Directors
For S.R. Batliboi & Co. LLP Navin Agarwal Kuldip Kumar KauraChartered Accountants Executive Chairman Interim Chief Executive OfficerICAI Firm Registration No. 301003E/E300005 DIN 00006303 PAN AFVPK8712R
per Raj Agrawal GR Arun Kumar Bhumika SoodPartner Whole-Time Director and Company SecretaryMembership No.: 82028 Chief Financial Officer ICSI Membership No. A19326 DIN 01874769
Place: Gurugram Place: MumbaiDate: May 03, 2018 Date: May 03, 2018
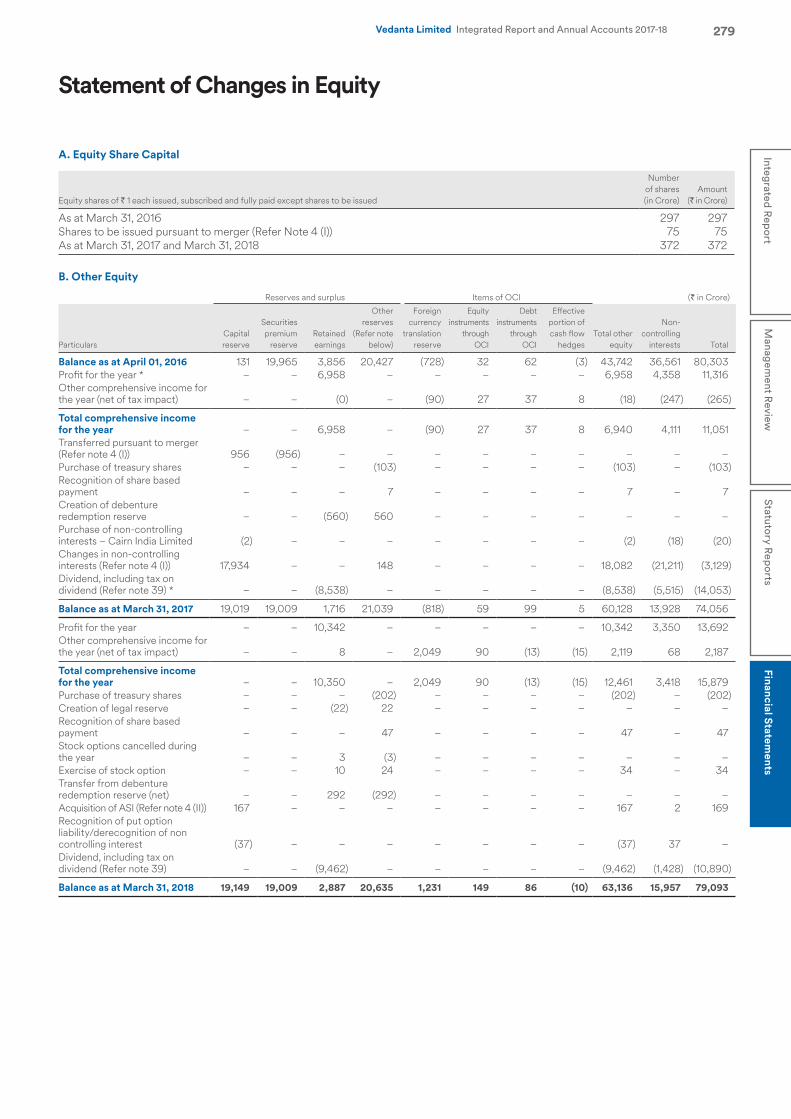
279Integrated R
eport
Managem
ent Review
Statutory R
eports
Financial Statements
Vedanta Limited Integrated Report and Annual Accounts 2017-18
A. Equity Share Capital
Equity shares of ` 1 each issued, subscribed and fully paid except shares to be issued
Number of shares (in Crore)
Amount (` in Crore)
As at March 31, 2016 297 297Shares to be issued pursuant to merger (Refer Note 4 (I)) 75 75As at March 31, 2017 and March 31, 2018 372 372
B. Other Equity
Reserves and surplus Items of OCI (` in Crore)
ParticularsCapital reserve
Securities premium
reserveRetained earnings
Other reserves
(Refer note below)
Foreign currency
translation reserve
Equity instruments
through OCI
Debt instruments
through OCI
Effective portion of cash flow
hedgesTotal other
equity
Non-controlling
interests Total
Balance as at April 01, 2016 131 19,965 3,856 20,427 (728) 32 62 (3) 43,742 36,561 80,303Profit for the year * – – 6,958 – – – – – 6,958 4,358 11,316Other comprehensive income for the year (net of tax impact) – – (0) – (90) 27 37 8 (18) (247) (265)
Total comprehensive income for the year – – 6,958 – (90) 27 37 8 6,940 4,111 11,051Transferred pursuant to merger (Refer note 4 (I)) 956 (956) – – – – – – – – –Purchase of treasury shares – – – (103) – – – – (103) – (103)Recognition of share based payment – – – 7 – – – – 7 – 7Creation of debenture redemption reserve – – (560) 560 – – – – – – –Purchase of non-controlling interests – Cairn India Limited (2) – – – – – – – (2) (18) (20)Changes in non-controlling interests (Refer note 4 (I)) 17,934 – – 148 – – – – 18,082 (21,211) (3,129)Dividend, including tax on dividend (Refer note 39) * – – (8,538) – – – – – (8,538) (5,515) (14,053)
Balance as at March 31, 2017 19,019 19,009 1,716 21,039 (818) 59 99 5 60,128 13,928 74,056
Profit for the year – – 10,342 – – – – – 10,342 3,350 13,692Other comprehensive income for the year (net of tax impact) – – 8 – 2,049 90 (13) (15) 2,119 68 2,187
Total comprehensive income for the year – – 10,350 – 2,049 90 (13) (15) 12,461 3,418 15,879Purchase of treasury shares – – – (202) – – – – (202) – (202)Creation of legal reserve – – (22) 22 – – – – – – –Recognition of share based payment – – – 47 – – – – 47 – 47Stock options cancelled during the year – – 3 (3) – – – – – – –Exercise of stock option – – 10 24 – – – – 34 – 34Transfer from debenture redemption reserve (net) – – 292 (292) – – – – – – –Acquisition of ASI (Refer note 4 (II)) 167 – – – – – – – 167 2 169Recognition of put option liability/derecognition of non controlling interest (37) – – – – – – – (37) 37 –Dividend, including tax on dividend (Refer note 39) – – (9,462) – – – – – (9,462) (1,428) (10,890)
Balance as at March 31, 2018 19,149 19,009 2,887 20,635 1,231 149 86 (10) 63,136 15,957 79,093
Statement of Changes in Equity
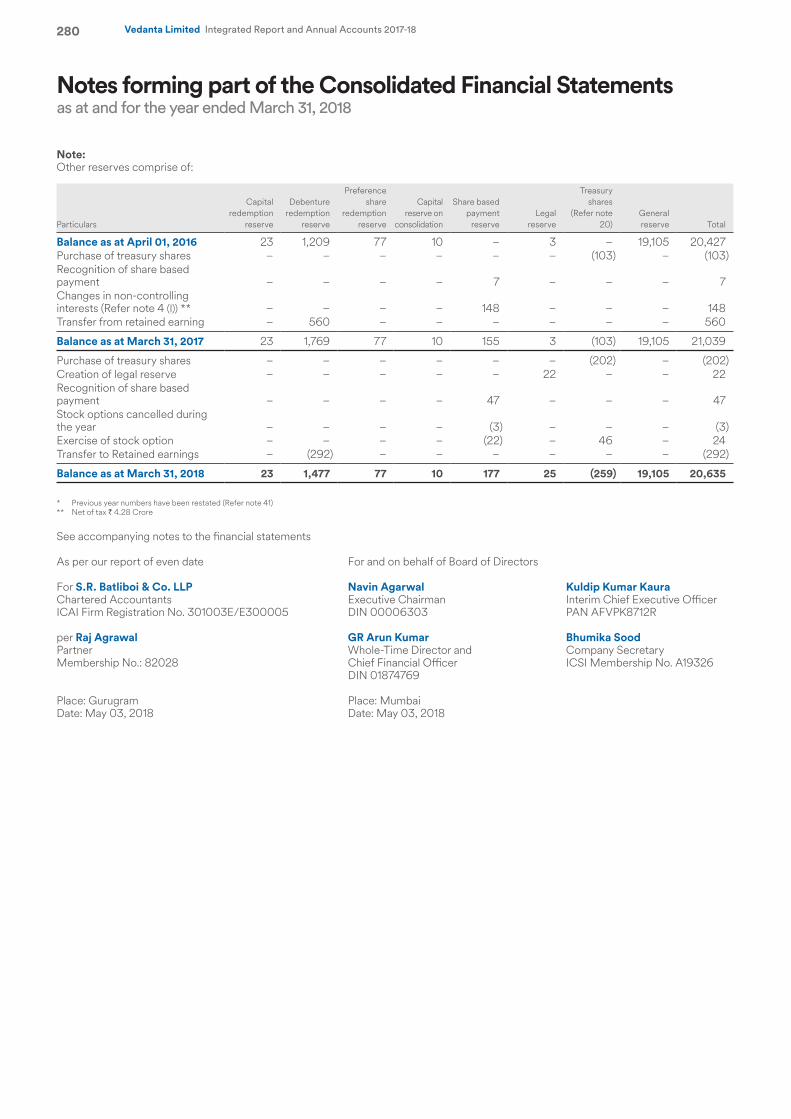
280 Vedanta Limited Integrated Report and Annual Accounts 2017-18
Notes forming part of the Consolidated Financial Statementsas at and for the year ended March 31, 2018
Note:Other reserves comprise of:
Particulars
Capital redemption
reserve
Debenture redemption
reserve
Preference share
redemption reserve
Capital reserve on
consolidation
Share based payment
reserveLegal
reserve
Treasury shares
(Refer note 20)
General reserve Total
Balance as at April 01, 2016 23 1,209 77 10 – 3 – 19,105 20,427Purchase of treasury shares – – – – – – (103) – (103)Recognition of share based payment – – – – 7 – – – 7Changes in non-controlling interests (Refer note 4 (I)) ** – – – – 148 – – – 148Transfer from retained earning – 560 – – – – – – 560
Balance as at March 31, 2017 23 1,769 77 10 155 3 (103) 19,105 21,039
Purchase of treasury shares – – – – – – (202) – (202)Creation of legal reserve – – – – – 22 – – 22Recognition of share based payment – – – – 47 – – – 47Stock options cancelled during the year – – – – (3) – – – (3)Exercise of stock option – – – – (22) – 46 – 24Transfer to Retained earnings – (292) – – – – – – (292)
Balance as at March 31, 2018 23 1,477 77 10 177 25 (259) 19,105 20,635
* Previous year numbers have been restated (Refer note 41)** Net of tax ` 4.28 Crore
See accompanying notes to the financial statements
As per our report of even date For and on behalf of Board of Directors
For S.R. Batliboi & Co. LLP Navin Agarwal Kuldip Kumar KauraChartered Accountants Executive Chairman Interim Chief Executive OfficerICAI Firm Registration No. 301003E/E300005 DIN 00006303 PAN AFVPK8712R
per Raj Agrawal GR Arun Kumar Bhumika SoodPartner Whole-Time Director and Company SecretaryMembership No.: 82028 Chief Financial Officer ICSI Membership No. A19326 DIN 01874769
Place: Gurugram Place: MumbaiDate: May 03, 2018 Date: May 03, 2018
Notes forming part of the Consolidated Financial Statementsas at and for the year ended March 31, 2018 continued
281Integrated R
eport
Managem
ent Review
Statutory R
eports
Financial Statements
Vedanta Limited Integrated Report and Annual Accounts 2017-18
1 Group overviewVedanta Limited (“Vedanta” or “the Company”) is a public limited company domiciled in India and has its registered office at 1st Floor, ‘C’ wing, Unit 103, Corporate Avenue, Atul Projects, Chakala, Andheri (East), Mumbai-400093, Maharashtra. Vedanta’s equity shares are listed on National Stock Exchange and Bombay Stock Exchange in India and its American Depository Shares (“ADS”) are listed on New York Stock Exchange in United States of America. Each ADS represents four equity shares. Vedanta is majority-owned and controlled subsidiary of Vedanta Resources Plc (holding company), the London listed diversified natural resource company.
The Company and its consolidated subsidiaries (collectively referred as “Group”) are principally engaged in the business of iron ore mining, non-ferrous metals (copper, aluminium and zinc), commercial power generation, oil and gas and manufacturing of glass substrate.
The Group’s oil and gas business was held by Cairn India Limited and its subsidiaries. Pursuant to the merger of Cairn India Limited with the Company in year ended March 31, 2017 (refer note 4 (I)), interests have been transferred to Vedanta and its subsidiaries.
The Group’s zinc India business is owned and operated by Hindustan Zinc Limited (“HZL”) in which it has a 64.92% interest as at March 31, 2018.
The Group’s zinc international business comprises Skorpion mine and refinery in Namibia operated through THL Zinc Namibia Holdings (Proprietary) Limited (“Skorpion”), Lisheen mine in Ireland operated through Vedanta Lisheen Holdings Limited (“Lisheen”) and Black Mountain Mining (Proprietary) Limited (“BMM”), whose assets include the Black Mountain mine and the Gamsberg mine project which is in exploration stage, located in South Africa.
The Group’s iron ore business is wholly owned by Vedanta, Sesa Resources Limited and Sesa Mining Corporation Limited and consists of exploration, mining and processing of iron ore, pig iron and metallurgical coke and generation of power. The Group’s iron ore business also comprises Western Cluster Limited (“WCL”) in Liberia which has iron assets and is wholly owned by the Group. WCL’s assets include development rights to Western Cluster and a network of iron ore deposits in West Africa.
The Group’s copper business is owned and operated by Vedanta, Copper Mines of Tasmania Pty Ltd (“CMT”), Tasmania Copper mines (“TCM”) and Fujairah Gold FZC and principally consists of customised smelting.
The Group’s Aluminium business is owned and operated by Vedanta and Bharat Aluminium Company Limited (“BALCO”) in which it has 51% interest as on March 31, 2018. Aluminium business consists of mining of bauxite, manufacture of alumina and various Aluminium products and generation of power.
The Group’s power business is owned and operated by Vedanta, Talwandi Sabo Power Limited (“TSPL”), 274 MW of wind power plants commissioned by HZL and 600 MW power plant at BALCO.
The Group’s other activities include mechanization of coal handling facilities and upgradation of general cargo berth for handling coal at the outer harbour of Visakhapatnam Port on the east coast of India and is handled by Vizag General Cargo Berth Private Limited (“VGCB”) and Maritime Ventures Private Limited (“MVPL”), in which the Group owns 100% interest. It also includes manufacturing of glass substrate owned and operated by AvanStrate Inc., in which it has 51.63% interest as on March 31, 2018.
2 Basis of preparation and basis of measurement of financial statementsa) Basis of preparationThese consolidated financial statements have been prepared in accordance with Indian Accounting Standards (Ind AS) notified under the Companies (Indian Accounting Standards) Rules, 2015 and other relevant provisions of the Companies Act, 2013 (the Act) (as amended from time to time).
These consolidated financial statements have been prepared in accordance with the accounting policies, set out below and were consistently applied to all periods presented unless otherwise stated.
Accounting policies are consistently applied except as stated in note 41 or where a newly issued accounting standard is initially adopted on a revision to an existing accounting standard requiring a change in the accounting policy hitherto in use as disclosed below.
These financial statements are approved for issue by the Board of Directors on May 03, 2018.
Certain comparative figures appearing in these consolidated financial statements have been regrouped and/or reclassified to better reflect the nature of those items.
Amounts less than ` 0.50 Crore have been presented as “0”.
b) Basis of measurementThe consolidated financial statements have been prepared on a going concern basis using historical cost convention and on an accrual method of accounting, except for certain financial assets and liabilities which are measured at fair value as explained in the accounting policies below.
c) Application of new and revised standardsThe Group has adopted with effect from April 1, 2017, the following new amendments and pronouncements.• Ind AS 7 Statement of Cash Flows: Narrow-scope amendments: The amendments introduce an additional disclosure that will enable
users of financial statements to evaluate changes in liabilities arising from financing activities. The required disclosure is given in note 21 (f).• Ind AS 102 Share-based Payment: Few amendments to clarify the classification and measurement of share-based payment transactions
have been issued. This does not have any significant impact on the amounts reported in the consolidated financial statements.• Guidance Note on Oil and Gas Accounting: The Institute of Chartered Accountants of India (“ICAI”), on December 6, 2016 issued the
revised Guidance Note on accounting for Oil and Gas producing activities (“Guidance Note”), applicable from April 01, 2017.
Notes forming part of the Consolidated Financial Statementsas at and for the year ended March 31, 2018 continued
282 Vedanta Limited Integrated Report and Annual Accounts 2017-18
2 Basis of preparation and basis of measurement of financial statements continuedTill March 31, 2017, proved and probable reserves (or 2P reserves) on entitlement interest basis were being considered for providing depletion on oil and gas assets. As per the Guidance Note, proved and developed reserves (or 1P reserves) on working interest basis are to be considered for computing depletion. The change has been applied prospectively and as a result, depreciation, depletion and amortization expense for the year is lower by ` 1,487 Crore and profit after tax is higher by ` 899 Crore.
3 Significant accounting policiesThe Group has applied the following accounting policies to all periods presented in these consolidated financial statements.
a) Basis of Consolidationi) Subsidiaries:The consolidated financial statements incorporate the results of Vedanta Limited and all its subsidiaries, being the entities that it controls. Control is evidenced where the Group has power over the investee or is exposed, or has rights, to variable returns from its involvement with the investee and has the ability to affect those returns through its power over the investee. Power is demonstrated through existing rights that give the ability to direct relevant activities, which significantly affect the entity returns.
The financial statements of subsidiaries are prepared for the same reporting year as the parent company. Where necessary, adjustments are made to the financial statements of subsidiaries to align the accounting policies in line with accounting policies of the Group.
For non-wholly owned subsidiaries, a share of the profit/(loss) for the financial year and net assets is attributed to the non-controlling interests as shown in the consolidated statement of profit and loss and consolidated balance sheet.
Liability for put option issued to non-controlling interests which do not grant present access to ownership interest to the Group is recognised at present value of the redemption amount, and is reclassified from equity. At the end of each reporting period, the non-controlling interests subject to put option is derecognised and the difference between the amount derecognised and present value of the redemption amount, which is recorded as a financial liability, is accounted for as an equity transaction.
For acquisitions of additional interests in subsidiaries, where there is no change in control, the Group recognises a reduction to the non-controlling interest of the respective subsidiary with the difference between this figure and the cash paid, inclusive of transaction fees, being recognised in equity. In addition, upon dilution of controlling interests the difference between the cash received from sale or listing of the subsidiary shares and the increase to non-controlling interest is also recognised in equity. The results of subsidiaries acquired or disposed off during the year are included in the consolidated statement of profit and loss from the effective date of acquisition or up to the effective date of disposal, as appropriate.
Intra-Group balances and transactions, and any unrealized profit arising from intra-Group transactions, are eliminated. Unrealized losses are eliminated unless costs cannot be recovered.
ii) Joint arrangementsA Joint arrangement is an arrangement of which two or more parties have joint control. Joint control is considered when there is contractually agreed sharing of control of an arrangement, which exists only when decisions about the relevant activities require the unanimous consent of the parties sharing control. Investments in joint arrangements are classified as either joint operations or joint venture. The classification depends on the contractual rights and obligations of each investor, rather than the legal structure of the joint arrangement. A joint operation is a joint arrangement whereby the parties that have joint control of the arrangement have rights to the assets, and obligations for the liabilities, relating to the arrangement. A joint venture is a joint arrangement whereby, the parties that have joint control of the arrangement have rights to the net assets of the arrangement.
The Group has both joint operations and joint ventures.
Joint operationsThe Group has joint operations within its Oil and gas segment and participates in several unincorporated joint operations which involve the joint control of assets used in oil and gas exploration and producing activities. The Group accounts for its share of assets, liabilities, income and expenditure of joint operations in which the Group holds an interest. Liabilities in unincorporated joint operations, where the Group is the Operator, is accounted for at gross values (including share of other partners) with a corresponding receivable from the venture partners. These have been included in the consolidated financial statements under the appropriate headings.
Details of joint operations are set out in note 48.
Joint ventureThe Group accounts for its interest in joint venture using the equity method (see (iv) below), after initially being recognised at cost in the consolidated balance sheet. Goodwill arising on the acquisition of joint venture is included in the carrying value of investments in joint venture.
iii) Investments in associatesInvestments in associates are accounted for using the equity method (see (iv) below). An associate is an entity over which the Group is in a position to exercise significant influence over operating and financial policies. Goodwill arising on the acquisition of associates is included in the carrying value of investments in associate.
iv) Equity method of accountingUnder the equity method of accounting applicable for investments in associates and joint ventures investments are initially recorded at the cost to the Group and then, in subsequent periods, the carrying value is adjusted to reflect the Group’s share of the post-acquisition profits or losses of the investee in profit and loss, and the Group’s share of other comprehensive income of the investee, other changes to the investee’s net assets and is further adjusted for impairment losses , if any. Dividend received or receivable from associates and joint-ventures are recognised as a reduction in carrying amount of the investment.
Notes forming part of the Consolidated Financial Statementsas at and for the year ended March 31, 2018 continued
283Integrated R
eport
Managem
ent Review
Statutory R
eports
Financial Statements
Vedanta Limited Integrated Report and Annual Accounts 2017-18
3 Significant accounting policies continuedThe consolidated statement of profit and loss include the Group’s share of investee’s results, except where the investee is generating losses, share of such losses in excess of the Group’s interest in that investee are not recognized. Losses recognised under the equity method in excess of the Group’s investment in ordinary shares are applied to the other components of the Group’s interest that forms part of Group’s net investment in the investee in the reverse order of their seniority (i.e. priority in liquidation).
If the Group’s share of losses in an associate or a joint venture equals or exceeds its interests in the associate or joint venture, the Group discontinues recognition of further losses. Additional losses are provided for, only to the extent that the Group has incurred legal or constructive obligations or made payments on behalf of the associate/joint venture.
Unrealised gains on transactions between the Group and its associates and joint ventures are eliminated against the investments to the extent of the Group’s interest in these entities. Unrealised losses are also eliminated unless the transaction provides evidence of an impairment of the assets transferred. Accounting policies of equity accounted investees have been changed where necessary to ensure consistency with the policies adopted by the Group.
The carrying amount of equity accounted investments are tested for impairment in accordance with the policy described in note below 3 (j).
b) Business combinationBusiness acquisitions are accounted for under the purchase method. The acquiree’s identifiable assets, liabilities and contingent liabilities that meet the conditions for recognition, are recognised at their fair value at the acquisition date, except certain assets and liabilities required to be measured as per the applicable standards.
Excess of fair value of purchase consideration and the acquisition date non-controlling interest over the acquisition date fair value of identifiable assets acquired and liabilities assumed is recognised as goodwill. Goodwill arising on acquisitions is reviewed for impairment annually. Where the fair values of the identifiable assets and liabilities exceed the cost of acquisition, the Group re-assesses whether it has correctly identified all of the assets acquired and all of the liabilities assumed and reviews the procedures used to measure the amounts to be recognized at the acquisition date. If the reassessment still results in an excess of the fair value of net assets acquired over the aggregate consideration transferred, then the gain is recognized in other comprehensive income and accumulated in equity as capital reserve. However, if there is no clear evidence of bargain purchase, the entity recognizes the gain directly in equity as capital reserve, without routing the same through other comprehensive income.
Where it is not possible to complete the determination of fair values by the date on which the first post-acquisition financial statements are approved, a provisional assessment of fair value is made and any adjustments required to those provisional fair values are finalised within 12 months of the acquisition date.
The Group makes adjustments to the provisional fair value amounts recognised at the date of acquisition to reflect new information obtained about facts and circumstances that existed as of the acquisition date that, if known, would have affected the measurement of the amounts recognised as of that date. The Group applies the measurement period adjustments retrospectively to the consolidated financial statements to reflect the measurement period adjustments as retrospectively recorded on the date of the acquisition as if measurement period adjustments had been recorded initially at the date of acquisition.
Any non-controlling interest in an acquiree is measured at fair value or as the non-controlling interest’s proportionate share of the acquiree’s net identifiable assets. This accounting choice is made on a transaction by transaction basis.
Acquisition expenses are charged to consolidated statement of profit and loss.
If the Group acquires a group of assets in a company that does not constitute a business combination in accordance with Ind AS 103 Business Combinations, the cost of the acquired group of assets is allocated to the individual identifiable assets acquired based on their relative fair value.
Common control transactionsA business combination involving entities or businesses under common control is a business combination in which all of the combining entities or businesses are ultimately controlled by the same party or parties both before and after the business combination and the control is not transitory. The transactions between entities under common control are specifically covered by Ind AS 103. Such transactions are accounted for using the pooling-of-interest method. The assets and liabilities of the acquired entity are recognised at their carrying amounts recorded in the parent entity’s consolidated financial statements with the exception of certain income tax and deferred tax assets. No adjustments are made to reflect fair values, or recognise any new assets or liabilities. The only adjustments that are made are to harmonise accounting policies. The components of equity of the acquired companies are added to the same components within Group equity. The difference, if any, between the amounts recorded as share capital issued plus any additional consideration in the form of cash or other assets and the amount of share capital of the transferor is transferred to capital reserve and is presented separately from other capital reserves. The company’s shares issued in consideration for the acquired companies are recognized from the moment the acquired companies are included in these financial statements and the financial statements of the commonly controlled entities would be combined, retrospectively, as if the transaction had occurred at the beginning of the earliest reporting period presented. However, the prior year comparative information is only adjusted for periods during which entities were under common control.
c) Revenue recognitionRevenues are measured at the fair value of the consideration received or receivable, net of discounts, volume rebates, outgoing sales taxes/goods and services tax and other indirect taxes excluding excise duty.
Excise duty is a liability of the manufacturer which forms part of the cost of production, irrespective of whether the goods are sold or not. Since the recovery of excise duty flows to the Group on its own account, revenue includes excise duty.
Notes forming part of the Consolidated Financial Statementsas at and for the year ended March 31, 2018 continued
284 Vedanta Limited Integrated Report and Annual Accounts 2017-18
3 Significant accounting policies continued• Sale of goods/rendering of services Revenues from sales of goods are recognised when all significant risks and rewards of ownership of the commodity sold are transferred
to the customer which usually is on delivery of the goods to the shipping agent. Revenues from sale of by-products are included in revenue.
Certain of the Group’s sales contracts provide for provisional pricing based on the price on The London Metal Exchange (“LME”), as specified in the contract, when shipped. Final settlement of the price is based on the applicable price for a specified future period. The Group’s provisionally priced sales are marked to market using the relevant forward prices for the future period specified in the contract and is adjusted in revenue.
Revenue from oil, gas and condensate sales represent the Group’s share of oil, gas and condensate production, recognised on a direct entitlement basis, when significant risks and rewards of ownership are transferred to the buyers. Direct entitlement basis represents entitlement to variable physical volumes of hydrocarbons, representing recovery of the costs incurred and a stipulated share of the production remaining after such cost recovery. The stipulated share of production is arrived after reducing government’s share of profit petroleum which is accounted for when the obligation (legal or constructive), in respect of the same arises.
Revenue from sale of power is recognised when delivered and measured based on rates as per bilateral contractual agreements with buyers and at rate arrived at based on the principles laid down under the relevant Tariff Regulations as notified by the regulatory bodies, as applicable.
Where the Group acts as a port operator, revenues and costs relating to each construction contract of service concession arrangements are recognised over the period of each arrangement only to the extent of costs incurred that are probable of recovery. Revenues and costs relating to operating phase of the port contract are measured at the fair value of the consideration received or receivable for the services provided.
Revenue from rendering of services is recognised on the basis of work performed.
• Interest income Interest income from debt instruments is recognised using the effective interest rate method. The effective interest rate is the rate that
exactly discounts estimated future cash receipts through the expected life of the financial asset to the gross carrying amount of a financial asset. When calculating the effective interest rate, the Group estimates the expected cash flows by considering all the contractual terms of the financial instrument (for example, prepayment, extension, call and similar options) but does not consider the expected credit losses.
• Dividends Dividend income is recognised in the consolidated statement of profit and loss only when the right to receive payment is established,
provided it is probable that the economic benefits associated with the dividend will flow to the Group, and the amount of the dividend can be measured reliably.
d) Property, Plant and Equipmenti) Mining properties and leasesThe costs of mining properties and leases, which include the costs of acquiring and developing mining properties and mineral rights, are capitalised as property, plant and equipment under the heading “mining property and leases” in the year in which they are incurred.
When a decision is taken that a mining property is viable for commercial production (i.e. when the Group determines that the mining property will provide sufficient and sustainable return relative to the risks and the Group decided to proceed with the mine development), all further pre-production primary development expenditure other than land, buildings, plant and equipment is capitalised as part of the cost of the mining property until the mining property is capable of commercial production.
The stripping cost incurred during the production phase of a surface mine is deferred to the extent the current period stripping cost exceeds the average period stripping cost over the life of mine and recognised as an asset if such cost provides a benefit in terms of improved access to ore in future periods and certain criteria are met. When the benefit from the stripping costs are realised in the current period, the stripping costs are accounted for as the cost of inventory. If the costs of inventory produced and the stripping activity asset are not separately identifiable, a relevant production measure is used to allocate the production stripping costs between the inventory produced and the stripping activity asset. The company uses the expected volume of waste compared with the actual volume of waste extracted for a given value of ore/mineral production for the purpose of determining the cost of the stripping activity asset.
Deferred stripping cost are included in mining properties within property, plant and equipment and disclosed as a part of mining properties. After initial recognition, the stripping activity asset is depreciated on a unit of production method over the expected useful life of the identified component of the ore body.
In circumstances where a mining property is abandoned, the cumulative capitalised costs relating to the property are written off in the period in which it occurs i.e. when the Group determines that the mining property will not provide sufficient and sustainable returns relative to the risks and the Group decides not to proceed with the mine development.
Commercial reserves are proved and probable reserves as defined by the ‘JORC’ Code, ‘MORC’ code or ‘SAMREC’ Code. Changes in the commercial reserves affecting unit of production calculations are dealt with prospectively over the revised remaining reserves.

Notes forming part of the Consolidated Financial Statementsas at and for the year ended March 31, 2018 continued
285Integrated R
eport
Managem
ent Review
Statutory R
eports
Financial Statements
Vedanta Limited Integrated Report and Annual Accounts 2017-18
3 Significant accounting policies continuedii) Oil and gas assets – (developing/producing assets)For oil and gas assets a successful efforts based accounting policy is followed.
All costs incurred after the technical feasibility and commercial viability of producing hydrocarbons has been demonstrated are capitalised within property, plant and equipment – development/producing assets on a field-by-field basis. Subsequent expenditure is capitalised only where it either enhances the economic benefits of the development/producing asset or replaces part of the existing development/producing asset. Any remaining costs associated with the part replaced are expensed.
Net proceeds from any disposal of development/producing assets are credited against the previously capitalised cost. A gain or loss on disposal of a development/producing asset is recognised in the consolidated statement of profit and loss to the extent that the net proceeds exceed or are less than the appropriate portion of the net capitalised costs of the asset.
iii) Other property, plant and equipmentThe initial cost of property, plant and equipment comprises its purchase price, including import duties and non-refundable purchase taxes, and any directly attributable costs of bringing an asset to working condition and location for its intended use. It also includes the initial estimate of the costs of dismantling and removing the item and restoring the site on which it is located.
Land acquired free of cost or at below market rate from the government is recognized at fair value with corresponding credit to deferred income.
If significant parts of an item of property, plant and equipment have different useful lives, then they are accounted for as separate items (major components) of property, plant and equipment. All other expenses on existing property, plant and equipment, including day-to-day repair and maintenance expenditure and cost of replacing parts, are charged to the consolidated statement of profit and loss for the period during which such expenses are incurred.
Gains and losses on disposal of an item of property, plant and equipment computed as the difference between the net disposal proceeds and the carrying amount of the asset is included in the consolidated statement of profit and loss when the asset is derecognised.
iv) Assets under constructionAssets under construction are capitalized in the assets under construction account. At the point when an asset is capable of operating in the manner intended by management, the cost of construction is transferred to the appropriate category of property, plant and equipment. Costs (net of income) associated with the commissioning of an asset and any obligations for decommissioning costs are capitalised until the period of commissioning has been completed and the asset is ready for its intended use.
v) Depreciation, depletion and amortisation expense
Mining properties and other assets in the course of development or construction and freehold land are not depreciated.
• Mining properties: The capitalised mining properties are amortised on a unit-of-production basis over the total estimated remaining commercial proved
and probable reserves of each property or group of properties and are subject to impairment review. Costs used in the unit of production calculation comprise the net book value of capitalised costs plus the estimated future capital expenditure required to access the commercial reserves. Changes in the estimates of commercial reserves or future capital expenditure are dealt with prospectively.
Leasehold land and buildings are depreciated on a straight-line basis over the period of the lease or, if shorter, their useful economic life.
• Oil and gas assets: [Refer note 2 (b)] All expenditures carried within each field are amortised from the commencement of production on a unit of production basis, which is
the ratio of oil and gas production in the period to the estimated quantities of depletable reserves at the end of the period plus the production in the period, generally on a field-by-field basis or group of fields which are reliant on common infrastructure.
Depletable reserves are proved reserves for acquisition costs and proved and developed reserves for successful exploratory wells, development wells, processing facilities, distribution assets, estimated future abandonment cost and all other related costs. These assets are depleted within each cost centre. Reserves for this purpose are considered on working interest basis which are reassessed atleast annually. Impact of changes to reserves are accounted for prospectively.
Till March 31, 2017 depletable reserves were proven and probable oil and gas reserves. Costs used in the unit of production calculation comprise the net book value of capitalised costs plus the estimated future field development costs required to access these reserves.
• Other assets: Depreciation on Property, plant and equipment is calculated using the straight-line method (SLM) to allocate their cost, net of their
residual values, over their estimated useful lives (determined by the management based on technical estimates) as given below. Management’s assessment of independent technical evaluation/advice takes into account, inter alia, the nature of the assets, the estimated usage of the assets, the operating conditions of the assets, past history of replacement and maintenance support.
Notes forming part of the Consolidated Financial Statementsas at and for the year ended March 31, 2018 continued
286 Vedanta Limited Integrated Report and Annual Accounts 2017-18
3 Significant accounting policies continuedEstimated useful life of assets are as follows:
AssetUseful life (in years)
Buildings (Residential; factory etc.) 3-60Plant and equipment 15-40Railway siding 15Roads(including buildings) 3-10Office equipment 3-6Furniture and fixture 8-10Vehicles 8-10Ships 25Aircraft 20River fleet 28
Major inspection and overhaul costs are depreciated over the estimated life of the economic benefit to be derived from such costs. The carrying amount of the remaining previous overhaul cost is charged to the consolidated statements of profit and loss if the next overhaul is undertaken earlier than the previously estimated life of the economic benefit.
The Group reviews the residual value and useful life of an asset at least at each financial year-end and, if expectations differ from previous estimates, the change is accounted for as a change in accounting estimate.
e) Intangible assetsIntangible assets acquired separately are measured on initial recognition at cost. Following initial recognition, intangible assets are carried at cost less accumulated amortisation and accumulated impairment losses, if any.
Intangible assets are amortised over their estimated useful life on a straight line basis. Software is amortised over the estimated useful life of software license of five years. Amounts paid for securing mining rights are amortised over the period of the mining lease ranging from 16-25 years. Technological know-how and acquired brand are amortised over the estimated useful life of ten years.
The amortization period and the amortization method are reviewed at least at each financial year end. If the expected useful life of the asset is different from previous estimates, the change is accounted for prospectively as a change in accounting estimate.
f) Port concession rights The Group recognises port concession rights as “Intangible Assets” arising from a service concession arrangement, in which the grantor controls or regulates the services provided and the prices charged, and also controls any significant residual interest in the infrastructure such as property, plant and equipment, irrespective whether the infrastructure is existing infrastructure of the grantor or the infrastructure is constructed or purchased by the Group as part of the service concession arrangement. Such an intangible asset is recognised by the Group initially at cost determined as the fair value of the consideration received or receivable for the construction service delivered and is capitalised when the project is complete in all respects. Port concession rights also include certain property, plant and equipment in accordance with Appendix A of Ind AS 11 ‘Service Concession Arrangements’.
Port concession rights are amortised on straight line basis over the balance of license period. The concession period is 30 years from the date of the award.
Any addition to the port concession rights are measured at fair value on recognition.
Gains or losses arising from de-recognition of port concession rights are measured as the difference between the net disposal proceeds and the carrying amount of the asset and are recognised in the consolidated statement of profit and loss when the asset is de-recognised.
g) Exploration and evaluation intangible assetsExploration and evaluation expenditure incurred prior to obtaining the mining right or the legal right to explore are expensed as incurred.
Exploration and evaluation expenditure incurred after obtaining the mining right or the legal right to explore are capitalised as exploration and evaluation assets (intangible assets) and stated at cost less impairment, if any. Exploration and evaluation intangible assets are transferred to property, plant and equipment when the technical feasibility and commercial viability has been determined. Exploration intangible assets under development are assessed for impairment and impairment loss, if any, is recognised prior to reclassification.
Exploration expenditure includes all direct and allocated indirect expenditure associated with finding specific mineral resources which includes depreciation and applicable operating costs of related support equipment and facilities and other costs of exploration activities:• Acquisition costs – costs associated with acquisition of licenses and rights to explore, including related professional fees.• General exploration costs – costs of surveys and studies, rights of access to properties to conduct those studies (e.g., costs incurred
for environment clearance, defence clearance, etc.), and salaries and other expenses of geologists, geophysical crews and other personnel conducting those studies.
• Costs of exploration drilling and equipping exploration and appraisal wells.
Exploration expenditure incurred in the process of determining oil and gas exploration targets is capitalised within “Exploration and evaluation assets” (intangible assets) and subsequently allocated to drilling activities. Exploration drilling costs are initially capitalised on a well-by-well basis until the success or otherwise of the well has been established. The success or failure of each exploration effort is judged on a well-by-well basis.
Notes forming part of the Consolidated Financial Statementsas at and for the year ended March 31, 2018 continued
287Integrated R
eport
Managem
ent Review
Statutory R
eports
Financial Statements
Vedanta Limited Integrated Report and Annual Accounts 2017-18
3 Significant accounting policies continuedFollowing appraisal of successful exploration wells, if commercial reserves are established and technical feasibility for extraction demonstrated, then the related capitalised exploration costs are transferred into a single field cost centre within property, plant and equipment – development/producing assets after testing for impairment. Where results of exploration drilling indicate the presence of hydrocarbons which are ultimately not considered commercially viable, all related costs are written off to the consolidated statement of profit and loss.
Expenditure incurred on the acquisition of a license interest is initially capitalised on a license-by-license basis. Costs are held, undepleted, within exploration and evaluation assets until such time as the exploration phase on the license area is complete or commercial reserves have been discovered.
Net proceeds from any disposal of an exploration asset are initially credited against the previously capitalised costs. Any surplus deficit is recognised in the consolidated statement of profit and loss.
h) Non-current assets held for saleNon-current assets and disposal groups are classified as held for sale if their carrying amount will be recovered through a sale transaction rather than through continuing use. This condition is regarded as met only when the sale is highly probable and the asset (or disposal group) is available for immediate sale in its present condition. Management must be committed to the sale which should be expected to qualify for recognition as a completed sale within one year from the date of classification.
Non-current assets and disposal groups classified as held for sale are not depreciated and are measured at the lower of carrying amount and fair value less costs to sell. Such assets and disposal groups are presented separately on the face of the consolidated balance sheet.
i) Impairment of non-financial assetsImpairment charges and reversals are assessed at the level of cash-generating units. A cash-generating unit (CGU) is the smallest identifiable group of assets that generate cash inflows that are largely independent of the cash inflows from other assets or group of assets.
The Group assesses at each reporting date, whether there is an indication that an asset may be impaired. The Group conducts an internal review of asset values annually, which is used as a source of information to assess for any indications of impairment or reversal of previously recognised impairment losses. External factors, such as changes in expected future prices, costs and other market factors are also monitored to assess for indications of impairment or reversal of previously recognised impairment losses.
If any such indication exists or in case of goodwill where annual testing of impairment is required ,then an impairment review is undertaken and the recoverable amount is calculated, as the higher of fair value less costs of disposal and the asset’s value in use.
Fair value less costs of disposal is the price that would be received to sell the asset in an orderly transaction between market participants and does not reflect the effects of factors that may be specific to the entity and not applicable to entities in general. Fair value for mineral and oil and gas assets is generally determined as the present value of the estimated future cash flows expected to arise from the continued use of the asset, including any expansion prospects, and its eventual disposal, using assumptions that an independent market participant may take into account. These cash flows are discounted at an appropriate post tax discount rate to arrive at the net present value.
Value in use is determined as the present value of the estimated future cash flows expected to arise from the continued use of the asset in its present form and its eventual disposal. The cash flows are discounted using a pre-tax discount rate that reflects current market assessments of the time value of money and the risks specific to the asset for which estimates of future cash flows have not been adjusted. Value in use is determined by applying assumptions specific to the Group’s continued use and cannot take into account future development. These assumptions are different to those used in calculating fair value and consequently the value in use calculation is likely to give a different result to a fair value calculation.
The carrying amount of the CGU is determined on a basis consistent with the way the recoverable amount of the CGU is determined.
If the recoverable amount of an asset or CGU is estimated to be less than its carrying amount, the carrying amount of the asset or CGU is reduced to its recoverable amount. An impairment loss is recognised in the consolidated statement of profit and loss.
Any reversal of the previously recognised impairment loss is limited to the extent that the asset’s carrying amount does not exceed the carrying amount that would have been determined if no impairment loss had previously been recognised.
Exploration and evaluation intangible assets:In assessing whether there is any indication that an exploration and evaluation asset may be impaired, the Group considers, as a minimum, the following indications:• the period for which the entity has the right to explore in the specific area has expired during the period or will expire in the near future,
and is not expected to be renewed;• substantive expenditure on further exploration for and evaluation of mineral resources in the specific area is neither budgeted nor planned;• exploration for and evaluation of mineral resources in the specific area have not led to the discovery of commercially viable quantities of
mineral resources and the entity has decided to discontinue such activities in the specific area;• sufficient data exist to indicate that, although a development in the specific area is likely to proceed, the carrying amount of the
exploration and evaluation asset is unlikely to be recovered in full from successful development or by sale; and• reserve information prepared annually by external experts.
When a potential impairment is identified, an assessment is performed for each area of interest in conjunction with the group of operating assets (representing a cash-generating unit) to which the exploration and evaluation assets is attributed. Exploration areas in which reserves have been discovered but require major capital expenditure before production can begin, are continually evaluated to ensure that commercial quantities of reserves exist or to ensure that additional exploration work is underway or planned. To the extent that capitalised expenditure is no longer expected to be recovered, it is charged to the consolidated statement of profit and loss.
Notes forming part of the Consolidated Financial Statementsas at and for the year ended March 31, 2018 continued
288 Vedanta Limited Integrated Report and Annual Accounts 2017-18
3 Significant accounting policies continuedj) Financial instrumentsA financial instrument is any contract that gives rise to a financial asset of one entity and a financial liability or equity instrument of another entity.
(i) Financial Assets – RecognitionAll financial assets are recognised initially at fair value plus, in the case of financial assets not recorded at fair value through profit and loss, transaction costs that are attributable to the acquisition of the financial asset. Purchases or sales of financial assets that require delivery of assets within a time frame established by regulation or convention in the market place (regular way trades) are recognised on the trade date, i.e., the date that the Group commits to purchase or sell the asset.
For purposes of subsequent measurement, financial assets are classified in four categories:
• Debt instruments at amortised cost A ‘debt instrument’ is measured at amortised cost if both the following conditions are met:
a) The asset is held within a business model whose objective is to hold assets for collecting contractual cash flows, and
b) Contractual terms of the asset give rise on specified dates to cash flows that are solely payments of principal and interest (SPPI) on the principal amount outstanding.
After initial measurement, such financial assets are subsequently measured at amortised cost using the Effective Interest Rate (EIR) method. Amortised cost is calculated by taking into account any discount or premium on acquisition and fees or costs that are an integral part of the EIR. The EIR amortisation is included in interest income in consolidated statement of profit and loss. The losses arising from impairment are recognised in consolidated statement of profit and loss.
• Debt instruments at fair value through other comprehensive income (FVOCI) A ‘debt instrument’ is classified as at the FVOCI if both of the following criteria are met:
a) The objective of the business model is achieved both by collecting contractual cash flows and selling the financial assets, and
b) The asset’s contractual cash flows represent SPPI.
Debt instruments included within the FVOCI category are measured initially as well as at each reporting date at fair value. Fair value movements are recognized in other comprehensive income (OCI). However, the Group recognizes interest income, impairment losses and reversals and foreign exchange gain or loss in the profit and loss. On derecognition of the asset, cumulative gain or loss previously recognised in other comprehensive income is reclassified from the equity to consolidated statement of profit and loss. Interest earned whilst holding fair value through other comprehensive income debt instrument is reported as interest income using the EIR method.
• Debt instruments at fair value through profit or loss (FVTPL) FVTPL is a residual category for debt instruments. Any debt instrument, which does not meet the criteria for categorization as at
amortized cost or as FVOCI, is classified as at FVTPL.
In addition, the Group may elect to designate a debt instrument, which otherwise meets amortized cost or FVOCI criteria, as at FVTPL. However, such election is allowed only if doing so reduces or eliminates a measurement or recognition inconsistency (referred to as ‘accounting mismatch’). The Group has not designated any debt instrument as at FVTPL.
Debt instruments included within the FVTPL category are measured at fair value with all changes being recognized in consolidated statement of Profit and loss.
• Equity instruments All equity investments in scope of Ind AS 109 are measured at fair value. Equity instruments which are held for trading and contingent
consideration recognised by an acquirer in a business combination to which Ind AS 103 applies are classified as at FVTPL. For all other equity instruments, the Company may make an irrevocable election to present in other comprehensive income subsequent changes in the fair value. The Group makes such election on an instrument-by-instrument basis. The classification is made on initial recognition and is irrevocable.
If the Group decides to classify an equity instrument as at FVOCI, then all fair value changes on the instrument, excluding dividends, are recognized in the OCI. There is no recycling of the amounts from OCI to profit and loss, even on sale of investment. However, the Group may transfer the cumulative gain or loss within equity.For equity instruments which are classified as FVTPL, all subsequent fair value changes are recognised in the consolidated statement of profit and loss.
(ii) Financial Assets – derecognitionThe Group derecognises a financial asset when the contractual rights to the cash flows from the asset expire, or it transfers the rights to receive the contractual cash flows on the financial asset in a transaction in which substantially all the risks and rewards of ownership of the financial asset are transferred.
(iii) Impairment of financial assetsIn accordance with Ind AS 109, the Group applies expected credit loss (“ECL”) model for measurement and recognition of impairment loss on the following financial assets:a) Financial assets that are debt instruments, and are measured at amortised cost e.g., loans, debt securities and depositsb) Financial assets that are debt instruments and are measured as at FVOCIc) Trade receivables or any contractual right to receive cash or another financial asset that result from transactions that are within the
scope of Ind AS 18.
Notes forming part of the Consolidated Financial Statementsas at and for the year ended March 31, 2018 continued
289Integrated R
eport
Managem
ent Review
Statutory R
eports
Financial Statements
Vedanta Limited Integrated Report and Annual Accounts 2017-18
3 Significant accounting policies continuedThe Group follows ‘simplified approach’ for recognition of impairment loss allowance on trade receivables.
The application of simplified approach does not require the Group to track changes in credit risk. Rather, it recognises impairment loss allowance based on lifetime ECLs at each reporting date, right from its initial recognition.
At each reporting date, for recognition of impairment loss on other financial assets and risk exposure, the Group determines whether there has been a significant increase in the credit risk since initial recognition. If credit risk has not increased significantly, 12-month ECL is used to provide for impairment loss. However, if credit risk has increased significantly, lifetime ECL is used. If, in a subsequent period, credit quality of the instrument improves such that there is no longer a significant increase in credit risk since initial recognition, then the Group reverts to recognising impairment loss allowance based on 12-month ECL.
Lifetime ECL are the expected credit losses resulting from all possible default events over the expected life of a financial instrument. The 12-month ECL is a portion of the lifetime ECL which results from default events that are possible within 12 months after the reporting date.
ECL is the difference between all contractual cash flows that are due to the Group in accordance with the contract and all the cash flows that the entity expects to receive, discounted at the original EIR.
ECL impairment loss allowance (or reversal) during the year is recognized as income/expense in profit or loss. The balance sheet presentation for various financial instruments is described below:a) Financial assets measured at amortised cost: ECL is presented as an allowance, i.e., as an integral part of the measurement of those
assets in the balance sheet. The Company does not reduce impairment allowance from the gross carrying amount.b) Debt instruments measured at FVOCI: Since financial assets are already reflected at fair value, impairment allowance is not further
reduced from its value. Rather, ECL amount is presented as ‘accumulated impairment amount’ in the OCI.
For assessing increase in credit risk and impairment loss, the Group combines financial instruments on the basis of shared credit risk characteristics with the objective of facilitating an analysis that is designed to enable significant increases in credit risk to be identified on a timely basis.
The Group does not have any purchased or originated credit-impaired (POCI) financial assets, i.e., financial assets which are credit impaired on purchase/origination.
(iv) Financial liabilities – Recognition & Subsequent measurementFinancial liabilities are classified, at initial recognition, as financial liabilities at fair value through profit or loss, or as loans and borrowings, payables, or as derivatives designated as hedging instruments in an effective hedge, as appropriate.
All financial liabilities are recognised initially at fair value, and in the case of loans, borrowings and payables, net of directly attributable transaction costs.
The Group’s financial liabilities include trade and other payables, loans and borrowings including bank overdrafts, financial guarantee contracts and derivative financial instruments.
The measurement of financial liabilities depends on their classification, as described below:
• Financial liabilities at fair value through profit or loss Financial liabilities at fair value through profit or loss include financial liabilities held for trading and financial liabilities designated upon
initial recognition as at fair value through profit or loss. Financial liabilities are classified as held for trading if they are incurred for the purpose of repurchasing in the near term. This category also includes derivative financial instruments entered into by the Group that are not designated as hedging instruments in hedge relationships as defined by Ind AS 109. Separated embedded derivatives are also classified as held for trading unless they are designated as effective hedging instruments.
Gains or losses on liabilities held for trading are recognised in the consolidated statement of profit and loss.
Financial liabilities designated upon initial recognition at fair value through profit or loss are designated as such at the initial date of recognition, and only if the criteria in Ind AS 109 are satisfied. For liabilities designated as FVTPL, fair value gains/losses attributable to changes in own credit risk are recognized in OCI. These gains/loss are not subsequently transferred to profit or loss. However, the Group may transfer the cumulative gain or loss within equity. All other changes in fair value of such liability are recognised in the consolidated statement of profit and loss. The Group has not designated any financial liability as at fair value through consolidated statement of profit and loss.
• Financial liabilities at amortised cost (Loans and Borrowings) After initial recognition, interest-bearing loans and borrowings are subsequently measured at amortised cost using the EIR method.
Gains and losses are recognised in profit or loss when the liabilities are derecognised as well as through the EIR amortisation process.
Amortised cost is calculated by taking into account any discount or premium on acquisition and fees or costs that are an integral part of the EIR. The EIR amortisation is included as finance costs in the statement of profit and loss.
• Financial liabilities – Derecognition A financial liability is derecognised when the obligation under the liability is discharged or cancelled or expires. When an existing
financial liability is replaced by another from the same lender on substantially different terms, or the terms of an existing liability are substantially modified, such an exchange or modification is treated as the derecognition of the original liability and the recognition of a new liability. The difference in the respective carrying amounts is recognised in the consolidated statement of profit and loss.
Notes forming part of the Consolidated Financial Statementsas at and for the year ended March 31, 2018 continued
290 Vedanta Limited Integrated Report and Annual Accounts 2017-18
3 Significant accounting policies continued(v) Embedded derivativesAn embedded derivative is a component of a hybrid (combined) instrument that also includes a non-derivative host contract – with the effect that some of the cash flows of the combined instrument vary in a way similar to a stand-alone derivative. An embedded derivative causes some or all of the cash flows that otherwise would be required by the contract to be modified according to a specified interest rate, financial instrument price, commodity price, foreign exchange rate, index of prices or rates, credit rating or credit index, or other variable, provided in the case of a non-financial variable that the variable is not specific to a party to the contract. Reassessment only occurs if there is either a change in the terms of the contract that significantly modifies the cash flows that would otherwise be required or a reclassification of a financial asset out of the fair value through consolidated statement of profit and loss.
If the hybrid contract contains a host that is a financial asset within the scope of Ind AS 109, the Group does not separate embedded derivatives. Rather, it applies the classification requirements contained in Ind AS 109 to the entire hybrid contract. Derivatives embedded in all other host contracts are accounted for as separate derivatives and recorded at fair value if their economic characteristics and risks are not closely related to those of the host contracts and the host contracts are not held for trading or designated at fair value though profit or loss. These embedded derivatives are measured at fair value with changes in fair value recognised in profit or loss, unless designated as effective hedging instruments.
(vi) Equity instrumentsAn equity instrument is any contract that evidences a residual interest in the assets of an entity after deducting all of its liabilities. Equity instruments issued by the Group are recognised at the proceeds received, net of direct issue costs.
(vii) Offsetting of financial instrumentsFinancial assets and financial liabilities are offset and the net amount is reported in the consolidated balance sheet if there is a currently enforceable legal right to offset the recognised amounts and there is an intention to settle on a net basis or to realise the asset and settle the liability simultaneously.
(viii) Derivative financial instruments and hedge accountingInitial recognition and subsequent measurementIn order to hedge its exposure to foreign exchange, interest rate, and commodity price risks, the Group enters into forward, option, swap contracts and other derivative financial instruments. The Group does not hold derivative financial instruments for speculative purposes.
Such derivative financial instruments are initially recognised at fair value on the date on which a derivative contract is entered into and are subsequently re-measured at fair value. Derivatives are carried as financial assets when the fair value is positive and as financial liabilities when the fair value is negative.
Any gains or losses arising from changes in the fair value of derivatives are taken directly to profit or loss, except for the effective portion of cash flow hedges, which is recognised in OCI and later reclassified to profit or loss when the hedge item affects profit or loss or treated as basis adjustment if a hedged forecast transaction subsequently results in the recognition of a non-financial asset or non-financial liability.
For the purpose of hedge accounting, hedges are classified as:• Fair value hedges when hedging the exposure to changes in the fair value of a recognised asset or liability or an unrecognised
firm commitment• Cash flow hedges when hedging the exposure to variability in cash flows that is either attributable to a particular risk associated with a
recognised asset or liability or a highly probable forecast transaction or the foreign currency risk in an unrecognised firm commitment• Hedges of a net investment in a foreign operation
At the inception of a hedge relationship, the Group formally designates and documents the hedge relationship to which the Group wishes to apply hedge accounting. The documentation includes the Group’s risk management objective and strategy for undertaking hedge, the hedging/economic relationship, the hedged item or transaction, the nature of the risk being hedged, hedge ratio and how the entity will assess the effectiveness of changes in the hedging instrument’s fair value in offsetting the exposure to changes in the hedged item’s fair value or cash flows attributable to the hedged risk. Such hedges are expected to be highly effective in achieving offsetting changes in fair value or cash flows and are assessed on an ongoing basis to determine that they actually have been highly effective throughout the financial reporting periods for which they were designated.
Hedges that meet the strict criteria for hedge accounting are accounted for, as described below:
(i) Fair value hedgesChanges in the fair value of derivatives that are designated and qualify as fair value hedges are recognised in profit or loss immediately, together with any changes in the fair value of the hedged asset or liability that are attributable to the hedged risk.
When an unrecognised firm commitment is designated as a hedged item, the subsequent cumulative change in the fair value of the firm commitment attributable to the hedged risk is recognised as an asset or liability with a corresponding gain or loss recognised in profit or loss. Hedge accounting is discontinued when company revokes the hedge relationship, the hedging instrument or hedged item expires or is sold, terminated, or exercised or no longer meets the criteria for hedge accounting.
(ii) Cash flow hedgesThe effective portion of the gain or loss on the hedging instrument is recognised in OCI in the cash flow hedge reserve, while any ineffective portion is recognised immediately in the statement of profit and loss.
Amounts recognised as OCI are transferred to profit or loss when the hedged transaction affects profit or loss, such as when the hedged financial income or financial expense is recognised or when a forecast sale occurs. When the hedged item is the cost of a non-financial asset or non-financial liability, the amounts recognised as OCI are transferred to the initial carrying amount of the non-financial asset or liability.
Notes forming part of the Consolidated Financial Statementsas at and for the year ended March 31, 2018 continued
291Integrated R
eport
Managem
ent Review
Statutory R
eports
Financial Statements
Vedanta Limited Integrated Report and Annual Accounts 2017-18
3 Significant accounting policies continuedIf the hedging instrument expires or is sold, terminated or exercised without replacement or rollover (as part of the hedging strategy), or if its designation as a hedge is revoked, or when the hedge no longer meets the criteria for hedge accounting, any cumulative gain or loss previously recognised in OCI remains separately in equity until the forecast transaction occurs or the foreign currency firm commitment is met.
(iii) Hedges of a net investmentHedges of a net investment in a foreign operation, including a hedge of a monetary item that is accounted for as part of the net investment, are accounted for in a way similar to cash flow hedges. Gains or losses on the hedging instrument relating to the effective portion of the hedge are recognised as OCI while any gains or losses relating to the ineffective portion are recognised in the consolidated statement of profit and loss. On disposal of the foreign operation, the cumulative value of any such gains or losses recorded in equity is reclassified to the consolidated statement of profit and loss (as a reclassification adjustment).
k) Financial guaranteesFinancial guarantees issued by the Group on behalf of related parties are designated as ‘Insurance Contracts’. The Group assesses at the end of each reporting period whether its recognised insurance liabilities (if any) are adequate, using current estimates of future cash flows under its insurance contracts. If that assessment shows that the carrying amount of its insurance liabilities is inadequate in the light of the estimated future cash flows, the entire deficiency is recognised in consolidated statement of profit and loss.
l) LeasesDetermining whether an arrangement contains leaseAt inception of an arrangement, the Group determines whether the arrangement is or contains a lease. The arrangement is, or contains, a lease if fulfilment of the arrangement is dependent on the use of a specific asset or assets and the arrangement conveys a right to use the asset or assets, even if that right is not explicitly specified in an arrangement.
At inception or on reassessment of an arrangement that contains lease, the Group separates payments and other consideration required by the arrangement into those for the lease and those for other elements on the basis of their relative fair values. If the Group concludes for a finance lease that it is impracticable to separate the payments reliably, then an asset and a liability are recognised at an amount equal to the fair value of the underlying asset; subsequently the liability is reduced as payments are made and an imputed finance cost on the liability is recognised using the Group’s incremental borrowing rate.
Group as a lesseeA lease is classified at the inception date as a finance lease or an operating lease. A lease that transfers substantially all the risks and rewards incidental to ownership to the Group is classified as a finance lease.
Finance leases are capitalised at the commencement of the lease at the inception date fair value of the leased property or, if lower, at the present value of the minimum lease payments. Lease payments are apportioned between finance charges and reduction of the lease liability so as to achieve a constant rate of interest on the remaining balance of the liability. Finance charges are recognised in finance costs in the statement of profit and loss, unless they are directly attributable to qualifying assets, in which case they are capitalized in accordance with the Group’s general policy on the borrowing costs. Contingent rentals are recognised as expenses in the periods in which they are incurred.
A leased asset is depreciated over the useful life of the asset. However, if there is no reasonable certainty that the Group will obtain ownership by the end of the lease term, the asset is depreciated over the shorter of the estimated useful life of the asset and the lease term.
Operating lease payments are recognised as an expense in the statement of profit and loss on a straight-line basis over the lease term unless the payments are structured to increase in line with general inflation to compensate for the lessor’s expected inflationary cost increase.
Group as a lessorLeases in which the group does not transfer substantially all the risks and rewards of ownership of an asset are classified as operating leases. Rental income from operating lease is recognised on a straight-line basis over the term of the relevant lease unless the payments are structured to increase in line with general inflation to compensate for the lessor’s expected inflating cost increase. Initial direct costs incurred in negotiating and arranging an operating lease are added to the carrying amount of the leased asset and recognised over the lease term on the same basis as rental income. Contingent rents are recognised as revenue in the period in which they are earned.
Leases are classified as finance leases when substantially all of the risks and rewards of ownership transfer from the Group to the lessee. Amounts due from lessees under finance leases are recorded as receivables at the Company’s net investment in the leases. Finance lease income is allocated to accounting periods so as to reflect a constant periodic rate of return on the net investment outstanding in respect of the lease.
m) InventoriesInventories including work-in-progress are stated at the lower of cost and net realisable value. Cost is determined on the following basis:• purchased copper concentrate is recorded at cost on a first-in, first-out (“FIFO”) basis; all other materials including stores and spares are
valued on weighted average basis except in Oil and Gas business where stores and spares are valued on a FIFO basis.• finished products are valued at raw material cost plus costs of conversion, comprising labour costs and an attributable proportion of
manufacturing overheads based on normal levels of activity and are moved out of inventory on a FIFO basis, however, cost of finished goods of oil and condensate is determined on a quarterly weighted average basis; and
• By-products and scrap are valued at net realisable value.
Net realisable value is determined based on estimated selling price, less further costs expected to be incurred to completion and disposal.
n) Government GrantGrants and subsidies from the government are recognised when there is reasonable assurance that (i) the Group will comply with the conditions attached to them, and (ii) the grant/subsidy will be received.
Notes forming part of the Consolidated Financial Statementsas at and for the year ended March 31, 2018 continued
292 Vedanta Limited Integrated Report and Annual Accounts 2017-18
3 Significant accounting policies continuedWhen the grant or subsidy relates to revenue, it is recognised as income on a systematic basis in the consolidated statement of profit and loss over the periods necessary to match them with the related costs, which they are intended to compensate.
Where the grant relates to an asset, it is recognised as deferred income and released to income in equal amounts over the expected useful life of the related asset and presented within other income.
When the Group receives grants of non-monetary assets, the asset and the grant are recorded at fair value amounts and released to profit or loss over the expected useful life in a pattern of consumption of the benefit of the underlying asset.
When loans or similar assistance are provided by governments or related institutions, with an interest rate below the current applicable market rate, the effect of this favourable interest is regarded as a government grant. The loan or assistance is initially recognised and measured at fair value and the government grant is measured as the difference between the initial carrying value of the loan and the proceeds received. The loan is subsequently measured as per the accounting policy applicable to financial liabilities.
o) TaxationTax expense represents the sum of current tax and deferred tax.
Current tax is provided at amounts expected to be paid (or recovered) using the tax rates and laws that have been enacted or substantively enacted by the reporting date and includes any adjustment to tax payable in respect of previous years.
Subject to exceptions below, deferred tax is provided, using the balance sheet method, on all temporary differences at the reporting date between the tax bases of assets and liabilities and their carrying amounts for financial reporting purposes and on carry forward of unused tax credits and unused tax losses:• tax payable on the future remittance of the past earnings of subsidiaries where the timing of the reversal of the temporary differences
can be controlled and it is probable that the temporary differences will not reverse in the foreseeable future;• deferred income tax is not recognised on initial recognition as well as on the impairment of goodwill which is not deductible for tax
purposes or on the initial recognition of an asset or liability in a transaction that is not a business combination and, at the time of the transaction, which effects neither the accounting profit nor taxable profit or loss; and
• deferred tax assets (including MAT credit entitlement) are recognised only to the extent that it is more likely than not that they will be recovered.
Deferred tax assets and liabilities are measured at the tax rates that are expected to apply to the year when the asset is realized or the liability is settled, based on tax rates (and tax laws) that have been enacted or substantively enacted at the reporting date. Tax relating to items recognized outside profit or loss is recognised outside profit or loss (either in other comprehensive income or equity).
The carrying amount of deferred tax assets (including MAT credit entitlement) is reviewed at each reporting date and is adjusted to the extent that it is no longer probable that sufficient taxable profit will be available to allow all or part of the asset to be recovered.
Deferred tax assets and deferred tax liabilities are offset, if a legally enforceable right exists to set off current income tax assets against current income tax liabilities and the deferred taxes relate to the same taxable entity and the same taxation authority.
Deferred tax is provided on temporary differences arising on acquisitions that are categorised as Business Combinations. Deferred tax is recognised at acquisition as part of the assessment of the fair value of assets and liabilities acquired. Subsequently deferred tax is charged or credited in the income statement/other comprehensive income as the underlying temporary difference is reversed.
p) Retirement benefits schemesThe Group operates or participates in a number of defined benefits and defined contribution schemes, the assets of which (where funded) are held in separately administered funds. For defined benefit schemes, the cost of providing benefits under the plans is determined by actuarial valuation each year separately for each plan using the projected unit credit method by third party qualified actuaries.
Remeasurement including, effects of asset ceiling and return on plan assets (excluding amounts included in interest on the net defined benefit liability) and actuarial gains and losses arising in the year are recognised in full in other comprehensive income and are not recycled to the consolidated statement of profit and loss.
Past service costs are recognised in profit or loss on the earlier of:• the date of the plan amendment or curtailment, and • the date that the Group recognises related restructuring costs
Net interest is calculated by applying a discount rate to the net defined benefit liability or asset at the beginning of the period. Defined benefit costs are split into current service cost, past service cost, net interest expense or income and remeasurement and gains and losses on curtailments and settlements. Current service cost and past service cost is recognised within cost of sales, administrative expenses and distribution expenses. Net interest expense or income is recognized within finance costs.
For defined contribution schemes, the amount charged to the consolidated statement of profit and loss in respect of pension costs and other post retirement benefits is the contributions payable in the year, recognised as and when the employee renders related services.

Notes forming part of the Consolidated Financial Statementsas at and for the year ended March 31, 2018 continued
293Integrated R
eport
Managem
ent Review
Statutory R
eports
Financial Statements
Vedanta Limited Integrated Report and Annual Accounts 2017-18
3 Significant accounting policies continuedq) Share-based paymentsCertain employees (including executive directors) of the Group receive part of their remuneration in the form of share-based payment transactions, whereby employees render services in exchange for shares or rights over shares (‘equity-settled transactions’).
The cost of equity-settled transactions with employees is measured at fair value of share awards at the date at which they are granted. The fair value of share awards is determined with the assistance of an external valuer and the fair value at the grant date is expensed on a proportionate basis over the vesting period based on the Group’s estimate of shares that will eventually vest. The estimate of the number of awards likely to vest is reviewed at each balance sheet date up to the vesting date at which point the estimate is adjusted to reflect the current expectations.
The resultant increase in equity is recorded in share based payment reserve.
In case of cash-settled transactions, a liability is recognised for the fair value of cash-settled transactions. The fair value is measured initially and at each reporting date up to and including the settlement date, with changes in fair value recognised in employee benefits expense. The fair value is expensed over the period until the vesting date with recognition of a corresponding liability. The fair value is determined with the assistance of an external valuer.
Additionally, VRPLC offers certain share based incentives under the Long-Term Incentive Plan (“LTIP”) to employees and directors of the Company and its subsidiaries. VRPLC recovers the proportionate cost (calculated based on the grant date fair value of the options granted) from the respective group companies, which is charged to the consolidated statement of profit and loss.
r) Provisions, contingent liabilities and contingent assetsProvisions represent liabilities for which the amount or timing is uncertain. Provisions are recognized when the Group has a present obligation (legal or constructive), as a result of past events, and it is probable that an outflow of resources, that can be reliably estimated, will be required to settle such an obligation.
If the effect of the time value of money is material, provisions are determined by discounting the expected future cash flows to net present value using an appropriate pre-tax discount rate that reflects current market assessments of the time value of money and, where appropriate, the risks specific to the liability. Unwinding of the discount is recognized in consolidated statements of profit and loss as a finance cost. Provisions are reviewed at each reporting date and are adjusted to reflect the current best estimate.
A contingent liability is a possible obligation that arises from past events whose existence will be confirmed by the occurrence or non-occurrence of one or more uncertain future events beyond the control of the Group or a present obligation that is not recognised because it is not probable that an outflow of resources will be required to settle the obligation. A contingent liability also arises in extremely rare cases where there is a liability that cannot be recognised because it cannot be measured reliably. The Group does not recognize a contingent liability but discloses its existence in the consolidated financial statements.
Contingent assets are not recognised but disclosed in the financial statements when an inflow of economic benefits is probable.
s) Restoration, rehabilitation and environmental costsAn obligation to incur restoration, rehabilitation and environmental costs arises when environmental disturbance is caused by the development or ongoing production of a mine or oil fields. Such costs, discounted to net present value, are provided for and a corresponding amount is capitalised at the start of each project, as soon as the obligation to incur such costs arises. These costs are charged to the consolidated statement of profit and loss over the life of the operation through the depreciation of the asset and the unwinding of the discount on the provision. The cost estimates are reviewed periodically and are adjusted to reflect known developments which may have an impact on the cost estimates or life of operations. The cost of the related asset is adjusted for changes in the provision due to factors such as updated cost estimates, changes to lives of operations, new disturbance and revisions to discount rates. The adjusted cost of the asset is depreciated prospectively over the lives of the assets to which they relate. The unwinding of the discount is shown as finance cost in the consolidated statement of profit and loss.
Costs for the restoration of subsequent site damage, which is caused on an ongoing basis during production, are provided for at their net present value and charged to the consolidated statements of profit and loss as extraction progresses. Where the costs of site restoration are not anticipated to be material, they are expensed as incurred.
t) Accounting for foreign currency transactions and translationsThe functional currency for each entity in the Group is determined as the currency of the primary economic environment in which it operates. For all principal operating subsidiaries, the functional currency is normally the local currency of the country in which it operates with the exception of oil and gas business which has a US dollar functional currency as that is the currency of the primary economic environment in which it operates. The financial statements are presented in Indian rupee (`). All financial information presented in Indian Rupees has been rounded to the nearest Crore.
In the financial statements of individual group companies, Transactions in currencies other than the functional currency are translated into the functional currency at the exchange rates ruling at the date of the transaction. Monetary assets and liabilities denominated in other currencies are translated into the functional currency at exchange rates prevailing on the reporting date. Non-monetary assets and liabilities denominated in other currencies and measured at historical cost or fair value are translated at the exchange rates prevailing on the dates on which such values were determined.
Notes forming part of the Consolidated Financial Statementsas at and for the year ended March 31, 2018 continued
294 Vedanta Limited Integrated Report and Annual Accounts 2017-18
3 Significant accounting policies continuedAll exchange differences are included in the consolidated statements of profit and loss except those where the monetary item is designated as an effective hedging instrument of the currency risk of designated forecasted sales or purchases, which are recognized in the other comprehensive income.
These include the exchange differences on foreign currency borrowings relating to asset under construction, and for future productive use which are included in the cost of those assets when they are regarded as an adjustment to interest costs on those foreign currency borrowings.
For the purposes of the consolidated financial statements, items in the consolidated statements of profit and loss of those businesses for which the Indian Rupees is not the functional currency are translated into Indian Rupees at the average rates of exchange during the year/exchange rates as on the date of transaction. The related consolidated balance sheet are translated into Indian rupees at the rates as at the reporting date. Exchange differences arising on translation are recognised in the other comprehensive income. On disposal of such entities the deferred cumulative exchange differences recognised in equity relating to that particular foreign operation are recognised in the consolidated statement of profit and loss.
The Group had applied paragraph 46A of AS 11 under Previous GAAP. Ind AS 101 gives an option, which has been exercised by the Group, whereby a first time adopter can continue its Indian GAAP policy for accounting for exchange differences arising from translation of long-term foreign currency monetary items recognised in the Indian GAAP financial statements for the period ending immediately before the beginning of the first Ind AS financial reporting period. Hence, foreign exchange gain/loss on long-term foreign currency monetary items recognized upto March 31, 2016 has been deferred/capitalized. Such exchange differences arising on translation/settlement of long-term foreign currency monetary items and pertaining to the acquisition of a depreciable asset are amortised over the remaining useful lives of the assets.
Exchange differences arising on translation/settlement of long-term foreign currency monetary items, acquired post April 01, 2016, pertaining to the acquisition of a depreciable asset are charged to the consolidated statement of profit and loss.
u) Earnings per shareThe Group presents basic and diluted earnings per share (“EPS”) data for its equity shares. Basic EPS is calculated by dividing the profit or loss attributable to equity shareholders of the Company by the weighted average number of equity shares outstanding during the period. Diluted EPS is determined by adjusting the profit or loss attributable to equity shareholders and the weighted average number of equity shares outstanding for the effects of all dilutive potential equity shares.
v) Buyers CreditThe Group enters into arrangements whereby financial institutions make direct payments to suppliers for raw materials and project materials. The financial institutions are subsequently repaid by the company at a later date providing working capital timing benefits. These are normally settled up to twelve months (for raw materials) and up to 36 months (for project materials). Where these arrangements are for raw materials with a maturity of up to twelve months, the economic substance of the transaction is determined to be operating in nature and these are recognised as operational buyers’ credit (under Trade and other payables). Where these arrangements are for project materials with a maturity up to thirty six months, the economic substance of the transaction is determined to be financing in nature, and these are classified as projects buyers’ credit within borrowings in the consolidated balance sheet.
w) Current and non-current classificationThe Group presents assets and liabilities in the consolidated balance sheet based on current/non-current classification.
An asset is classified as current when it satisfies any of the following criteria:• it is expected to be realized in, or is intended for sale or consumption in, the Group’s normal operating cycle.• it is held primarily for the purpose of being traded;• it is expected to be realized within 12 months after the reporting date; or• it is cash or cash equivalent unless it is restricted from being exchanged or used to settle a liability for at least 12 months after the
reporting date.
All other assets are classified as non-current.
A liability is classified as current when it satisfies any of the following criteria:• it is expected to be settled in the Group’s normal operating cycle;• it is held primarily for the purpose of being traded;• it is due to be settled within 12 months after the reporting date; or• the Group does not have an unconditional right to defer settlement of the liability for at least 12 months after the reporting date. Terms
of a liability that could, at the option of the counterparty, result in its settlement by the issue of equity instruments do not affect its classification.
All other liabilities are classified as non-current.
Deferred tax assets and liabilities are classified as non current only .
x) Borrowing costsBorrowing cost includes interest expense as per effective interest rate (EIR) and exchange differences arising from foreign currency borrowings to the extent they are regarded as an adjustment to the interest cost.
Notes forming part of the Consolidated Financial Statementsas at and for the year ended March 31, 2018 continued
295Integrated R
eport
Managem
ent Review
Statutory R
eports
Financial Statements
Vedanta Limited Integrated Report and Annual Accounts 2017-18
3 Significant accounting policies continuedBorrowing costs directly relating to the acquisition, construction or production of a qualifying capital project under construction are capitalised and added to the project cost during construction until such time that the assets are substantially ready for their intended use i.e. when they are capable of commercial production. Borrowing costs relating to the construction phase of a service concession arrangement is capitalised as part of the cost of the intangible asset. Where funds are borrowed specifically to finance a qualifying capital projects, the amount capitalised represents the actual borrowing costs incurred. Where surplus funds are available out of money borrowed specifically to finance a qualifying capital project, the income generated from such short-term investments is deducted from the total capitalized borrowing cost. Where the funds used to finance a project form part of general borrowings, the amount capitalised is calculated using a weighted average of rates applicable to relevant general borrowings of the company during the year.
All other borrowing costs are recognised in the consolidated statement of profit and loss in the year in which they are incurred.
Capitalisation of interest on borrowings related to construction or development projects is ceased when substantially all the activities that are necessary to make the assets ready for their intended use are complete or when delays occur outside of the normal course of business.
EIR is the rate that exactly discounts the estimated future cash payments or receipts over the expected life of the financial liability or a shorter period, where appropriate, to the amortised cost of a financial liability. When calculating the effective interest rate, the Group estimates the expected cash flows by considering all the contractual terms of the financial instrument (for example, prepayment, extension, call and similar options).
y) Treasury sharesThe Group has created an Employee Benefit Trust (EBT) for providing share-based payment to its employees. The Group uses EBT as a vehicle for distributing shares to employees under the employee remuneration schemes. The EBT buys shares of the company from the market, for giving shares to employees. The shares held by EBT are treated as treasury shares.
Own equity instruments that are reacquired (treasury shares) are recognised at cost and deducted from equity. No gain or loss is recognised in profit or loss on the purchase, sale, issue or cancellation of the Group’s own equity instruments. Any difference between the carrying amount and the consideration, if reissued, is recognised in capital reserve. Share options whenever exercised, would be satisfied with treasury shares.
z) Cash and cash equivalentsCash and cash equivalents comprise cash at bank and on hand and short-term money market deposits which have a maturity of three months or less that are readily convertible to known amounts of cash and which are subject to an insignificant risk of changes in value.
For the purpose of the consolidated statement of cash flows, cash and cash equivalents consist of cash and short-term deposits, as defined above and additionally includes unpaid dividend account
aa) Significant accounting estimates and judgementsThe preparation of consolidated financial statements in conformity with Ind AS requires management to make judgements, estimates and assumptions that affect the application of accounting policies and the reported amounts of assets, liabilities, income, expenses and disclosures of contingent assets and liabilities at the date of these financial statements and the reported amounts of revenues and expenses for the years presented. These judgments and estimates are based on management’s best knowledge of the relevant facts and circumstances, having regard to previous experience, but actual results may differ materially from the amounts included in the financial statements.
Estimates and underlying assumptions are reviewed on an ongoing basis. Revisions to accounting estimates are recognised in the period in which the estimate is revised and future periods affected.
The information about significant areas of estimation uncertainty and critical judgments in applying accounting policies that have the most significant effect on the amounts recognized in the financial statements are as given below:
1) Significant estimatesi) Oil and gas reserves.Significant technical and commercial judgements are required to determine the Group’s estimated oil and natural gas reserves. Reserves considered for computing depletion are proved reserves for acquisition costs and proved and developed reserves for successful exploratory wells, development wells, processing facilities, distribution assets, estimated future abandonment cost and all other related costs. Reserves for this purpose are considered on working interest basis which are reassessed atleast annually. Details of such reserves are given in note 52. Changes in reserves as a result of change in management assumptions could impact the depreciation rates and the carrying value of assets.
ii) Carrying value of exploration and evaluation assets:The recoverability of a project is assessed under Ind AS 106. Exploration assets are assessed by comparing the carrying value to higher of fair value less cost of disposal or value in use if impairment indicators exists. Change to the valuation of exploration assets is an area of judgement. Further details on the Group’s accounting policies on this are set out in accounting policy above. The amounts for exploration and evaluation assets represent active exploration projects. These amounts will be written off to the statement of profit and loss as exploration costs unless commercial reserves are established or the determination process is not completed and there are no indications of impairment. The outcome of ongoing exploration, and therefore whether the carrying value of exploration and evaluation assets will ultimately be recovered, is inherently uncertain.
Notes forming part of the Consolidated Financial Statementsas at and for the year ended March 31, 2018 continued
296 Vedanta Limited Integrated Report and Annual Accounts 2017-18
3 Significant accounting policies continuedDetails of impairment charge/reversal impact and the assumptions used are disclosed in note 36 and carrying values of exploration and evaluation assets are disclosed in note 5.
iii) Carrying value of developing / producing oil and gas assets:Management perform impairment tests on the Group’s developing/producing oil and gas assets where indicators of impairment or impairment reversal of previous recorded impairment are identified in accordance with Ind AS 36.
The impairment assessments are based on a range of estimates and assumptions, including:
Estimates/Assumptions Basis
Future production Proved and probable reserves, resource estimates and, in certain cases, expansion projects
Commodity prices Management’s best estimate benchmarked with external sources of information, to ensure they are within the range of available analyst forcast
Discount to price Management’s best estimate based on historical prevailing discount
Extension of PSC Assumed that PSC for Rajasthan block would be extended till 2030 on the expected commercial terms as per the announced government policy
Discount rates Cost of capital risk-adjusted for the risk specific to the asset/CGU
Any subsequent changes to cash flows due to changes in the above mentioned factors could impact the carrying value of the assets.
Details of carrying values and impairment charge/reversal and the assumptions and sensitivities used are disclosed in note 5 and 36 respectively .
iv) Mining properties and leasesThe carrying value of mining property and leases is arrived at by depreciating the assets over the life of the mine using the unit of production method based on proved and probable reserves. The estimate of reserves is subject to assumptions relating to life of the mine and may change when new information becomes available. Changes in reserves as a result of factors such as production cost, recovery rates, grade of reserves or commodity prices could thus impact the carrying values of mining properties and leases and environmental and restoration provisions.
In the current year the Group has reassessed the parameters for mine development depletion including cost to complete at HZL, which has resulted in additional depletion charge of ` 369 Crore for the current year.
Management performs impairment tests when there is an indication of impairment. The impairment assessments are based on a range of estimates and assumptions, including:
Estimates/assumptions Basis
Future Production Proved and probable reserves, resource estimates(with an appropriate conversion factor) considering the expected permitted mining volumes and, in certain cases, expansion projects.
Commodity Prices Management’s best estimate benchmarked with external sources of information, to ensure they are within the range of available analyst forcast
Exchange Rates Management best estimate benchmarked with external sources of information
Discount Rates Cost of capital risk-adjusted for the risk specific to the assest/CGU
Details of carrying values and impairment charge/reversal and the assumptions used are disclosed in note 5 and 36 respectively.
v) Assessment of impairment at Lanjigarh refinery:During financial year 2015-16, the Group has received the necessary approvals for expansion of the Lanjigarh refinery to 4 million tonnes per annum (MTPA). Accordingly, second stream operations were commenced in Alumina refinery from April 2016 and the refinery was debottlenecked to nameplate capacity of 2 MTPA in this year. We continue to explore the feasibility of expanding our alumina refinery capacity, from 2 to 4 million and then up to 6 million tonnes per annum, subject to bauxite availability and regulatory approvals.
The State of Odisha has abundant bauxite resources and given the initiatives by the Government of Odisha, management is confident that bauxite will be made available in the short to medium term. The Group has entered into agreements with various suppliers internationally and domestically to ensure the availability of bauxite to run its refinery.
Recoverability value assessment during the previous year ended March 31, 2017 including sensitivity analysis on the key assumptions indicated recoverable value exceeds the carrying value. No negative developments have occurred since the previous year and accordingly, it is not expected that the carrying amount would exceed the recoverable amount and hence the recoverable value for the year ended March 31, 2018 was not re-determined.
The carrying amounts of property plant and equipment related to alumina refinery operations at Lanjigarh and related mining assets as at March 31, 2018 is ` 8,326 Crore and March 31, 2017 is ` 8,803 Crore.
Notes forming part of the Consolidated Financial Statementsas at and for the year ended March 31, 2018 continued
297Integrated R
eport
Managem
ent Review
Statutory R
eports
Financial Statements
Vedanta Limited Integrated Report and Annual Accounts 2017-18
3 Significant accounting policies continuedvi) Assessment of Impairment of Goa iron ore mines:Pursuant to an order passed by the Hon’ble Supreme Court of India on February 07, 2018, the second renewal of the mining leases granted by the State of Goa in 2014-15 to all miners including Vedanta were cancelled. Consequentially all mining operations stopped with effect from March 16, 2018 until fresh mining leases (not fresh renewals or other renewals) and fresh environmental clearances are granted in accordance with the provisions of The Mines and Minerals (Development and Regulation) (MMDR) Act. Significant uncertainty exists over the resumption of mining at Goa under the current leases. The Group has assessed the recoverable value of all its assets and liabilities associated with existing mining leases which led to a non-cash impairment charge in March 2018.
Details of impairment charge and method of estimating recoverable value are disclosed in note 36.
(vii) Restoration, rehabilitation and environmental costs:Provision is made for costs associated with restoration and rehabilitation of mining sites as soon as the obligation to incur such costs arises. Such restoration and closure costs are typical of extractive industries and they are normally incurred at the end of the life of the mine or oil fields. The costs are estimated on the basis of mine closure plans and the estimated discounted costs of dismantling and removing these facilities and the costs of restoration are capitalised as soon as the obligation to incur such costs arises.
The provision for decommissioning oil and gas assets is based on the current estimates of the costs for removing and decommissioning production facilities, the forecast timing and currency of settlement of decommissioning liabilities and the appropriate discount rate.
A corresponding provision is created on the liability side. The capitalised asset is charged to the consolidated statement profit and loss over the life of the asset through depreciation over the life of the operation and the provision is increased each period via unwinding the discount on the provision. Management estimates are based on local legislation and/or other agreements.
The actual costs and cash outflows may differ from estimates because of changes in laws and regulations, changes in prices, analysis of site conditions and changes in restoration technology. Details of such provisions are set out in Note 23 and 29.
(viii) Provisions and liabilitiesProvisions and liabilities are recognised in the period when it becomes probable that there will be a future outflow of funds resulting from past operations or events that can be reasonably estimated. The timing of recognition requires the application of judgement to existing facts and circumstances which may be subject to change especially when taken in the context of the legal environment in India. The actual cash outflows may take place over many years in the future and hence the carrying amounts of provisions and liabilities are regularly reviewed and adjusted to take into account the changing circumstances and other factors that influence the provisions and liabilities. This is set out in note 23 and 29.
(ix) The HZL and BALCO call optionsThe Group had exercised its call option to acquire the remaining 49% interest in BALCO and 29.5% interest in HZL. The Government of India has however, contested the validity of the options and disputed their valuation performed in terms of the relevant agreements the details of which are set out in note 43. In view of the lack of resolution on the options, the non-response to the exercise and valuation request from the Government of India, the resultant uncertainty surrounding the potential transaction and the valuation of the consideration payable, the Group considers the strike price of the options to be at fair value. Accordingly, the value of the option would be nil, and hence, the call options have not been recognized in the financial statements.
(x) Recoverability of deferred tax and other income tax assetsThe Group has carry forward tax losses, unabsorbed depreciation and MAT credit that are available for offset against future taxable profit. Deferred tax assets are recognised only to the extent that it is probable that taxable profit will be available against which the unused tax losses or tax credits can be utilized. This involves an assessment of when those assets are likely to reverse, and a judgement as to whether or not there will be sufficient taxable profits available to offset the assets. This requires assumptions regarding future profitability, which is inherently uncertain. To the extent assumptions regarding future profitability change, there can be an increase or decrease in the amounts recognised in respect of deferred tax assets and consequential impact in the consolidated statement of profit and loss.
Additionally, the Group has tax receivables on account of refund arising on account of past amalgamation and relating to various tax disputes. The recoverability of these receivables involve application of judgement as to the ultimate outcome of the tax assessment and litigations. This pertains to the application of the legislation, which in certain cases is based upon management’s interpretation of country specific tax law, in particular India, and the likelihood of settlement. Management uses in-house and external legal professionals to make informed decision.
The details of MAT assets (recognized and unrecognized) are set out in note 37.
(xi) Copper operations IndiaThe renewal of consent to operate (CTO) under the Air and Water Acts for copper smelter in India was rejected by the State Pollution Control Board on April 09, 2018 for want of further clarifications and consequently, the operations have presently been suspended. The company has filed an appeal in the Tribunal. Even though there can be no assurance regarding the final outcome of the process, as per the company’s assessment, it is in compliance with the applicable regulations and expects the renewal of CTO in next few months.
The carrying value of assets as at March 31, 2018 is ` 2,131 Crore.
2) Significant judgementsi) Revenue recognition and receivable recovery in relation to the power divisionIn certain cases, the Group’s power customers are disputing various contractual provisions of Power Purchase Agreements (PPA). Significant judgement is required in both assessing the tariff to be charged under the PPA in accordance with IAS 18 and to assess the recoverability of withheld revenue currently accounted for as receivables.
Notes forming part of the Consolidated Financial Statementsas at and for the year ended March 31, 2018 continued
298 Vedanta Limited Integrated Report and Annual Accounts 2017-18
3 Significant accounting policies continuedIn assessing this critical judgment, management considered favourable external legal opinions the Group has obtained in relation to the claims and favourable court judgements in the related matter. In addition the fact that the contracts are with government owned companies implies the credit risk is low (refer note 13 (d))
ii) ContingenciesIn the normal course of business, contingent liabilities may arise from litigation, taxation and other claims against the Group. A tax provision is recognised when the Group has a present obligation as a result of a past event, it is probable that the Group will be required to settle that obligation.
Where it is management’s assessment that the outcome cannot be reliably quantified or is uncertain, the claims are disclosed as contingent liabilities unless the likelihood of an adverse outcome is remote. Such liabilities are disclosed in the notes but are not provided for in the financial statements.
When considering the classification of a legal or tax cases as probable, possible or remote, there is judgement involved. This pertains to the application of the legislation, which in certain cases is based upon management’s interpretation of country specific applicable law, in particular India, and the likelihood of settlement. Management uses in-house and external legal professionals to make informed decision.
Although there can be no assurance regarding the final outcome of the legal proceedings, the Group does not expect them to have a materially adverse impact on the Group’s financial position or profitability. These are set out in note 49.
iii) Determining whether an arrangement contains a lease :The Group has ascertained that the Power Purchase Agreement (PPA) entered into between one of the subsidiaries and a State grid qualifies to be an operating lease under Ind AS 17 “Leases”. Accordingly, the consideration receivable under the PPA relating to recovery of capacity charges towards capital cost have been recognised as operating lease rentals and in respect of variable cost that includes fuel costs, operations and maintenance etc. is considered as revenue from sale of products/services.
Significant judgement is required in segregating the capacity charges due from the State grid, between fixed and contingent payments. The Group has determined that since the capacity charges under the PPA are based on the number of units of electricity made available by its Subsidiary which would be subject to variation on account of various factors like availability of coal and water for the plant, there are no fixed minimum payments under the PPA, which requires it to be accounted for on a straight line basis.The contingent rents recognised are disclosed in Note 40.
iv) Exceptional ItemsExceptional items are those items that management considers, by virtue of their size or incidence (including but not limited to impairment charges and acquisition and restructuring related costs), should be disclosed separately to ensure that the financial information allows an understanding of the underlying performance of the business in the year, so as to facilitate comparison with prior periods. Also tax charges related to Special items and certain one-time tax effects are considered exceptional. Such items are material by nature or amount to the year’s result and require separate disclosure in accordance with Ind AS.
The determination as to which items should be disclosed separately requires a degree of judgement. The details of exceptional items are set out in note 36.
ab) Standards issued but not yet effectiveThe following standards/amendments to standards have been issued but are not yet effective up to the date of issuance of the Group’s Financial Statements. Except specifically disclosed below, the Group is evaluating the requirements of these standards, improvements and amendments and has not yet determined the impact on the financial statements.
• Ind AS 115 – Revenue from Contracts with Customers This standard outlines a single comprehensive model for entities to use in accounting for revenue arising from contracts with customers.
The standard replaces most of the current revenue recognition guidance. The core principle of the new standard is for companies to recognize revenue when the control of the goods and services is transferred to the customer as against the transfer of risk and rewards. The amount of revenue recognised should reflect the consideration to which the company expects to be entitled in exchange for those goods or services. The new standard also will result in enhanced disclosures about revenue, provide guidance for transactions that were not previously addressed comprehensively including service revenues and contract modifications and improved guidance for multiple element arrangements. The new Standard comes into effect for the annual reporting periods beginning on or after April 1, 2018.
In order to identify the potential impact of the standard on the Group’s consolidated financial statements, the Group has analyzed contracts of the relevant revenue streams of the Group. The work done is focused on evaluating the contractual arrangements across the Group’s principal revenue streams, particularly key terms and conditions which may impact the timing of revenue recognition and measurement of revenue.
Based on the work carried out, the areas of impact in implementing Ind AS 115, on the Group results is detailed below.
On the basis of the analysis conducted, the new standard would result in identification of freight and insurance services as a separate performance obligation implying segregation of revenue on account of sale of goods and sale of services. The revenue on account of these services is required to be deferred along with the associated costs and recognised over time as this obligation is fulfilled.
Notes forming part of the Consolidated Financial Statementsas at and for the year ended March 31, 2018 continued
299Integrated R
eport
Managem
ent Review
Statutory R
eports
Financial Statements
Vedanta Limited Integrated Report and Annual Accounts 2017-18
3 Significant accounting policies continued The Group has products which are provisionally priced at the date revenue is recognised. Revenue in respect of such contracts will
be recognised when control passes to the customer and will be measured at the amount the entity expects to be entitled – being the estimate of the price expected to be received at the end of the measurement period. Post transfer of control of goods, provisional pricing features will be accounted in accordance with Ind AS 109 “Financial Instruments” rather than Ind AS 115 and therefore the Ind AS 115 rules on variable consideration do not apply. These ‘provisional pricing’ adjustments i.e. the consideration received post transfer of control will continue to be included in consolidated revenue on the face of the consolidated statement of profit and loss and these would be disclosed by way of note to the financial statements.
The implementation of changes required as per Ind AS 115 as mentioned above is identified to be not materially effecting the current recognition and measurement of revenues, though there would be significant additional disclosure requirements for the Group to comply with.
The Group will adopt the modified transitional approach to implementation where any transitional adjustment is recognised in retained earnings at April 01, 2018 without adjustment of comparatives and the new standard will only be applied to contracts that remain in force at that date.
• Other recently issued accounting pronouncements and not effective for the year ended 31 March 2018:
Standards not yet effective for the financial statements for the year ended 31 March 2018Effective for annual periods beginning on or after
Amendments to Ind AS 12: Recognition of Deferred Tax Assets for Unrealised Losses April 01, 2018Amendment to Ind AS 21: Foreign Currency Transactions and Advance Consideration April 01, 2018Amendment to Ind AS 40: Investment Property April 01, 2018Amendment to Ind AS 28: Investments in Associates and Joint Ventures April 01, 2018Amendment to Ind AS 112: Disclosure of Interests in Other Entities April 01, 2018
4 Business acquisitions and mergersI Merger of Cairn India Limited with Vedanta LimitedVedanta Limited and Cairn India Limited, had initially announced a scheme of merger between the two companies on June 14, 2015, terms whereof were amended on July 22, 2016 (“Scheme”). As per the terms of the Scheme, Cairn India Limited was to merge into Vedanta Limited and upon the merger becoming effective:
a) Non-controlling shareholders of Cairn India Limited were to receive one equity share in Vedanta Limited of face value ` 1 each and four 7.5% Redeemable Preference Shares (redeemable after 18 months from issuance) in Vedanta Limited with a face value of ` 10 each for each equity share held in Cairn India Limited.
b) No shares were to be issued to Vedanta Limited or any of its subsidiaries for their shareholding in Cairn India Limited. This included shares held by Sesa Resources Limited in Cairn India Limited with a carrying value of ` 956 Crore, the effects of cancellation of which was to be recorded in securities premium account.
c) The employees of Cairn India Limited who were holding stock options in Cairn India Limited were to be compensated either in cash or through issuance of stock options of Vedanta Limited.
d) The authorised share capital of Cairn India Limited aggregating to ` 2,250 Crore was to be assumed by the Company, resulting in an increase in its authorised share capital from ` 5,162 Crore ( divided into 5,127 Crore equity shares of ` 1 each and 3.50 Crore preference shares of ` 10 each) to ` 7,412 Crore (divided into 4,402 Crore equity shares of ` 1 each and 301 Crore preference shares of ` 10 each).
All substantive approvals for effecting the merger of Cairn India Limited with Vedanta Limited were received by March 27, 2017 and therefore the same has been accounted for in the previous financial year ending March 31, 2017. The Board of Directors of both the companies made the merger operative on April 11, 2017, whereafter Cairn India Limited ceased to exist
Since non-controlling shareholders of Cairn India Limited become the shareholders of the Company, non-controlling interest of ` 21,211 Crore attributable to Cairn India Limited stands extinguished. Correspondingly, there is (a) an increase in equity share capital of ` 75 Crore (representing par value of 75 Crore equity shares), financial liabilities of ` 3,010 Crore (representing fair value of redeemable preference shares) and ` 43 Crore (representing cash compensation payable to stock option holders of Cairn India Limited), share based payment reserve of ` 148 Crore (representing employee stock options issued to stock option holders of Cairn India Limited) and capital reserve of ` 18,890 Crore and (b) a decrease in securities premium account by ` 956 Crore.
II Business CombinationOn December 28, 2017, the Group acquired 51.63% equity stake in AvanStrate Inc. (ASI) for a cash consideration of JPY 1 million (` 0.06 Crore) and acquired debts for JPY 17,058 million (` 964 Crore). Additionally, a loan of JPY 814.8 million (` 46 Crore) was extended to ASI. ASI is involved in manufaturing of glass substrate. The financial results of ASI from the date of acquisition to March 31, 2018 have been included in the consolidated financial statements of the Group.
As per the shareholding agreement (SHA) entered with the other majority shareholder holding 46.6% in ASI, the Group has call option, conversion option to convert part of its debt given to ASI into equity of ASI as well as it has issued put option to the other majority shareholder. These are exercisable as per the terms mentioned in the SHA.
The fair values and business combination has been accounted for on a provisional basis under Ind AS 103, as it relates to property, plant and equipment and other intangible assets, and the resultant bargain gain of ` 353 Crore as computed below has been recognised directly in capital reserve.
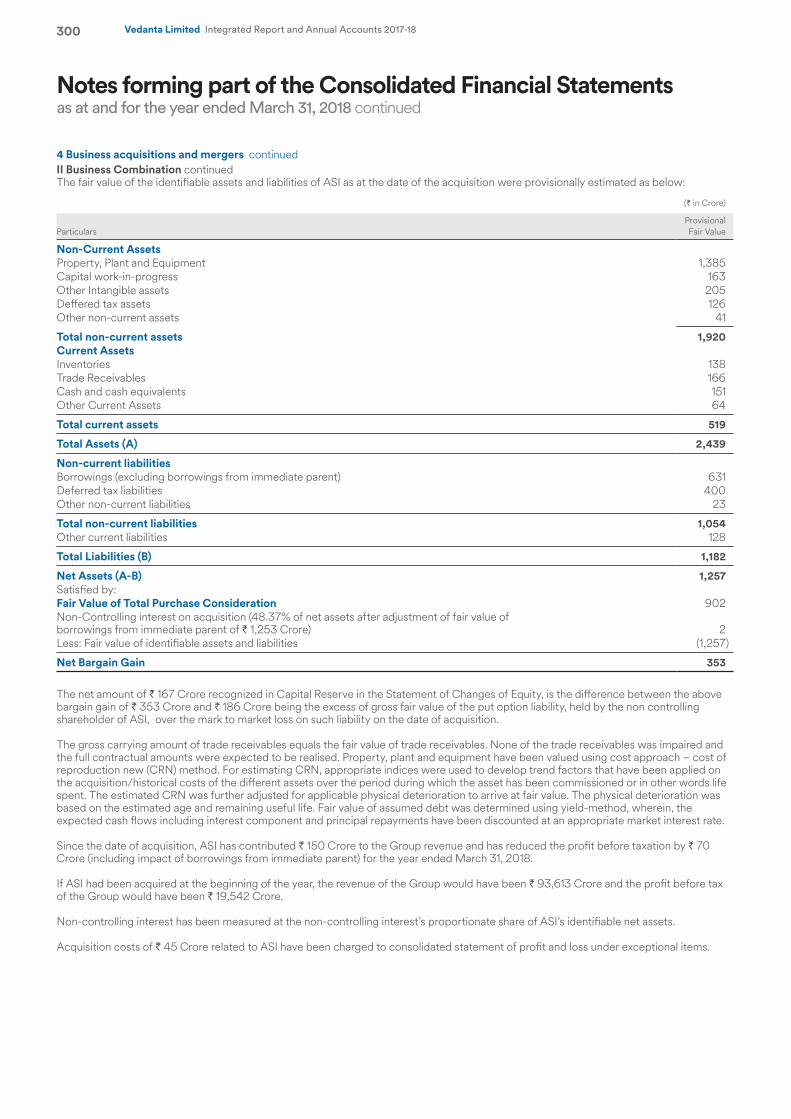
Notes forming part of the Consolidated Financial Statementsas at and for the year ended March 31, 2018 continued
300 Vedanta Limited Integrated Report and Annual Accounts 2017-18
II Business Combination continuedThe fair value of the identifiable assets and liabilities of ASI as at the date of the acquisition were provisionally estimated as below:
(` in Crore)
ParticularsProvisional Fair Value
Non-Current AssetsProperty, Plant and Equipment 1,385Capital work-in-progress 163Other Intangible assets 205Deffered tax assets 126Other non-current assets 41
Total non-current assets 1,920Current AssetsInventories 138Trade Receivables 166Cash and cash equivalents 151Other Current Assets 64
Total current assets 519
Total Assets (A) 2,439
Non-current liabilitiesBorrowings (excluding borrowings from immediate parent) 631Deferred tax liabilities 400Other non-current liabilities 23
Total non-current liabilities 1,054Other current liabilities 128
Total Liabilities (B) 1,182
Net Assets (A-B) 1,257Satisfied by:Fair Value of Total Purchase Consideration 902Non-Controlling interest on acquisition (48.37% of net assets after adjustment of fair value of borrowings from immediate parent of ` 1,253 Crore) 2Less: Fair value of identifiable assets and liabilities (1,257)
Net Bargain Gain 353
The net amount of ` 167 Crore recognized in Capital Reserve in the Statement of Changes of Equity, is the difference between the above bargain gain of ` 353 Crore and ` 186 Crore being the excess of gross fair value of the put option liability, held by the non controlling shareholder of ASI, over the mark to market loss on such liability on the date of acquisition.
The gross carrying amount of trade receivables equals the fair value of trade receivables. None of the trade receivables was impaired and the full contractual amounts were expected to be realised. Property, plant and equipment have been valued using cost approach – cost of reproduction new (CRN) method. For estimating CRN, appropriate indices were used to develop trend factors that have been applied on the acquisition/historical costs of the different assets over the period during which the asset has been commissioned or in other words life spent. The estimated CRN was further adjusted for applicable physical deterioration to arrive at fair value. The physical deterioration was based on the estimated age and remaining useful life. Fair value of assumed debt was determined using yield-method, wherein, the expected cash flows including interest component and principal repayments have been discounted at an appropriate market interest rate.
Since the date of acquisition, ASI has contributed ` 150 Crore to the Group revenue and has reduced the profit before taxation by ` 70 Crore (including impact of borrowings from immediate parent) for the year ended March 31, 2018.
If ASI had been acquired at the beginning of the year, the revenue of the Group would have been ` 93,613 Crore and the profit before tax of the Group would have been ` 19,542 Crore.
Non-controlling interest has been measured at the non-controlling interest’s proportionate share of ASI’s identifiable net assets.
Acquisition costs of ` 45 Crore related to ASI have been charged to consolidated statement of profit and loss under exceptional items.
4 Business acquisitions and mergers continued
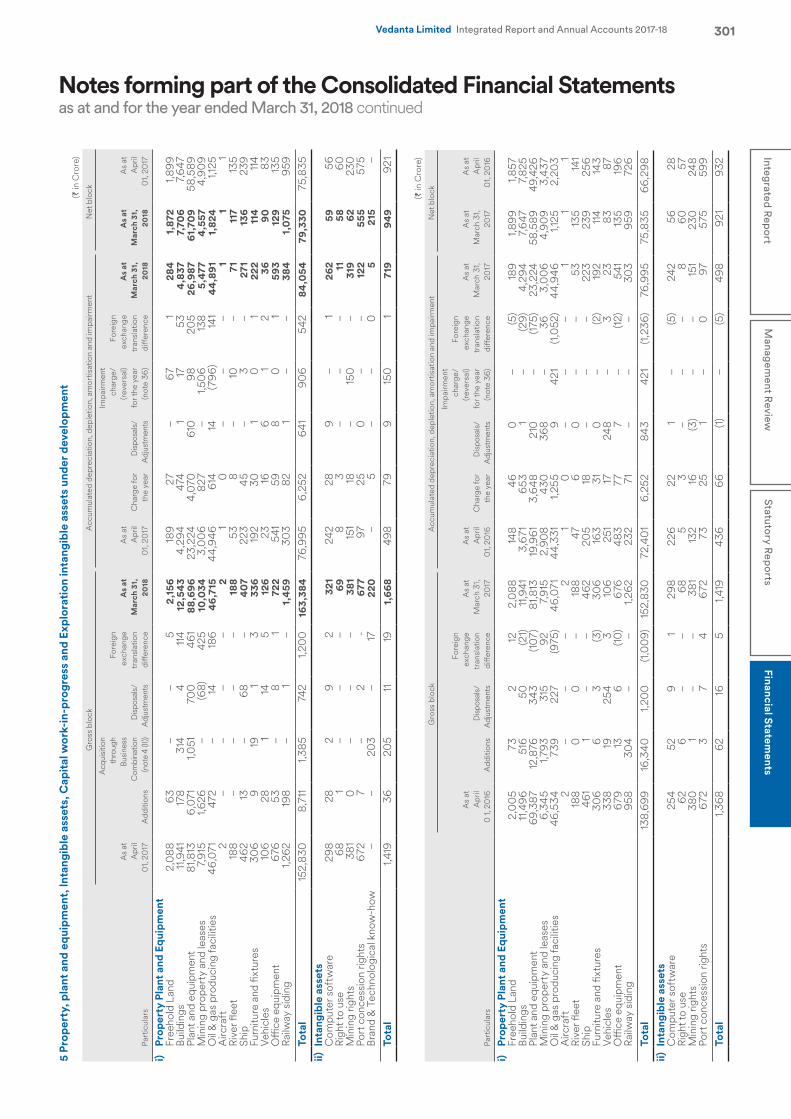
Notes forming part of the Consolidated Financial Statementsas at and for the year ended March 31, 2018 continued
301Integrated R
eport
Managem
ent Review
Statutory R
eports
Financial Statements
Vedanta Limited Integrated Report and Annual Accounts 2017-18
5 Pr
oper
ty, p
lant
and
equ
ipm
ent,
Inta
ngib
le a
sset
s, C
apit
al w
ork-
in-p
rogr
ess
and
Expl
orat
ion
inta
ngib
le a
sset
s un
der d
evel
opm
ent
(` in
Cro
re)
Gro
ss b
lock
Acc
umul
ated
dep
reci
atio
n, d
eple
tion,
am
ortis
atio
n an
d im
pairm
ent
Net
blo
ck
Part
icul
ars
As
at
Apr
il
01,
2017
Add
ition
s
Acq
uisi
tion
thro
ugh
Busin
ess
Com
bina
tion
(not
e 4
(II))
Disp
osal
s/
Adj
ustm
ents
Fore
ign
exch
ange
tr
ansl
atio
n di
ffere
nce
As
at
Mar
ch 3
1,
2018
As
at
Apr
il
01,
2017
Cha
rge
for
the
year
Disp
osal
s/
Adj
ustm
ents
Impa
irmen
t ch
arge
/ (re
vers
al)
for t
he y
ear
(not
e 36
)
Fore
ign
exch
ange
tr
ansl
atio
n di
ffere
nce
As
at
Mar
ch 3
1,
2018
As
at
Mar
ch 3
1,
2018
As
at
Apr
il
01,
2017
i)Pr
oper
ty P
lant
and
Equ
ipm
ent
Free
hold
Lan
d2,
088
63–
–5
2,15
618
927
–6
71
284
1,87
21,8
99Bu
ildin
gs11
,941
178
314
411
412
,543
4,29
447
41
1753
4,83
77,
706
7,6
47Pl
ant a
nd e
quip
men
t81
,813
6,07
11,0
5170
046
188
,696
23,2
244,
070
610
9820
526
,987
61,7
09
58,5
89M
inin
g pr
oper
ty a
nd le
ases
7,91
51,6
26–
(68)
425
10,0
343,
00
682
7–
1,50
613
85,
477
4,55
74,
90
9O
il &
gas
pro
duci
ng fa
cilit
ies
46,0
7147
2–
1418
646
,715
44,9
4661
414
(79
6)14
144
,891
1,82
41,1
25A
ircra
ft2
––
––
21
0–
––
11
1Ri
ver fl
eet
188
––
––
188
538
–10
–71
117
135
Ship
462
13–
68–
407
223
45–
3–
271
136
239
Furn
iture
and
fixt
ures
306
919
13
336
192
301
01
222
114
114
Vehi
cles
106
281
145
126
2316
61
236
9083
Offi
ce e
quip
men
t6
7653
–8
172
254
159
80
159
312
913
5Ra
ilway
sid
ing
1,262
198
–1
–1,
459
303
821
––
384
1,0
7595
9To
tal
152,
830
8,71
11,3
8574
21,2
00
163,
384
76,9
956,
252
641
90
654
284
,054
79,3
3075
,835
ii)In
tang
ible
ass
ets
Com
pute
r sof
twar
e29
828
29
232
124
228
9–
126
259
56Ri
ght t
o us
e 68
1–
––
698
3–
––
1158
60M
inin
g rig
hts
381
0–
––
381
151
18–
150
–31
962
230
Port
con
cess
ion
right
s6
727
–2
-67
797
250
––
122
555
575
Bran
d &
Tec
hnol
ogic
al k
now
-how
––
203
–17
220
–5
––
05
215
–To
tal
1,419
3620
511
191,
668
498
799
150
171
994
992
1
(` in
Cro
re)
Gro
ss b
lock
Acc
umul
ated
dep
reci
atio
n, d
eple
tion,
am
ortis
atio
n an
d im
pairm
ent
Net
blo
ck
Part
icul
ars
As
at
Apr
il
0 1,
20
16A
dditi
ons
Disp
osal
s/
Adj
ustm
ents
Fore
ign
exch
ange
tr
ansl
atio
n di
ffere
nce
As
at
Mar
ch 3
1, 20
17
As
at
Apr
il
01,
2016
Cha
rge
for
the
year
Disp
osal
s/
Adj
ustm
ents
Impa
irmen
t ch
arge
/ (re
vers
al)
for t
he y
ear
(not
e 36
)
Fore
ign
exch
ange
tr
ansl
atio
n di
ffere
nce
As
at
Mar
ch 3
1, 20
17
As
at
Mar
ch 3
1, 20
17
As
at
Apr
il
01,
2016
i)Pr
oper
ty P
lant
and
Equ
ipm
ent
Free
hold
Lan
d 2
,00
5 7
3 2
12
2
,088
14
8 4
6 0
–
(5
) 18
9 1,
899
1,85
7 Bu
ildin
gs 11
,49
6 5
16
50
(2
1) 11
,941
3
,671
6
53
1 –
(2
9) 4
,294
7
,647
7
,825
Pl
ant a
nd e
quip
men
t 6
9,38
7 12
,876
3
43
(107
) 8
1,813
19
,961
3
,648
2
10
–
(175
) 2
3,22
4 5
8,58
9 4
9,42
6 M
inin
g pr
oper
ty a
nd le
ases
6,3
45
1,79
3 3
15
92
7,9
15
2,9
08
430
3
68
–
36
3,0
06
4,9
09
3,4
37
Oil
& g
as p
rodu
cing
faci
litie
s 4
6,53
4 7
39
227
(9
75)
46,
071
44,
331
1,25
5 9
4
21
(1,0
52)
44,
946
1,12
5 2
,20
3 A
ircra
ft 2
–
–
–
2
1
0
–
–
–
1 1
1 Ri
ver fl
eet
188
0
0
–
188
47
6
0
–
–
53
135
141
Ship
461
1
–
–
462
2
05
18
–
–
–
223
2
39
256
Fu
rnitu
re a
nd fi
xtur
es 3
06
6
3
(3)
30
6 16
3 3
1 0
–
(2
) 19
2 11
4 14
3 Ve
hicl
es 3
38
19
254
3
10
6 2
51
17
248
–
3
2
3 8
3 8
7 O
ffice
equ
ipm
ent
679
13
6
(1
0) 6
76
483
7
7 7
–
(1
2) 5
41
135
196
Railw
ay s
idin
g 9
58
30
4 –
–
1,
262
232
7
1 –
–
–
3
03
959
726
To
tal
138,
699
16,3
40
1,20
0
(1,0
09)
152,
830
7
2,40
1 6
,252
8
43
421
(1
,236
) 7
6,99
5 7
5,83
5 6
6,29
8 ii)
Inta
ngib
le a
sset
sC
ompu
ter s
oftw
are
254
5
2 9
1
298
2
26
22
1 –
(5
) 2
42
56
28
Righ
t to
use
62
6
–
–
68
5
3
–
–
–
8
60
5
7 M
inin
g rig
hts
380
1
–
–
381
13
2 16
(3
) –
–
15
1 2
30
248
Port
con
cess
ion
right
s 6
72
3
7
4
672
7
3 2
5 1
–
0
97
575
5
99
Tota
l 1,
368
62
16
5
1,41
9 4
36
66
(1)
–
(5)
498
9
21
932
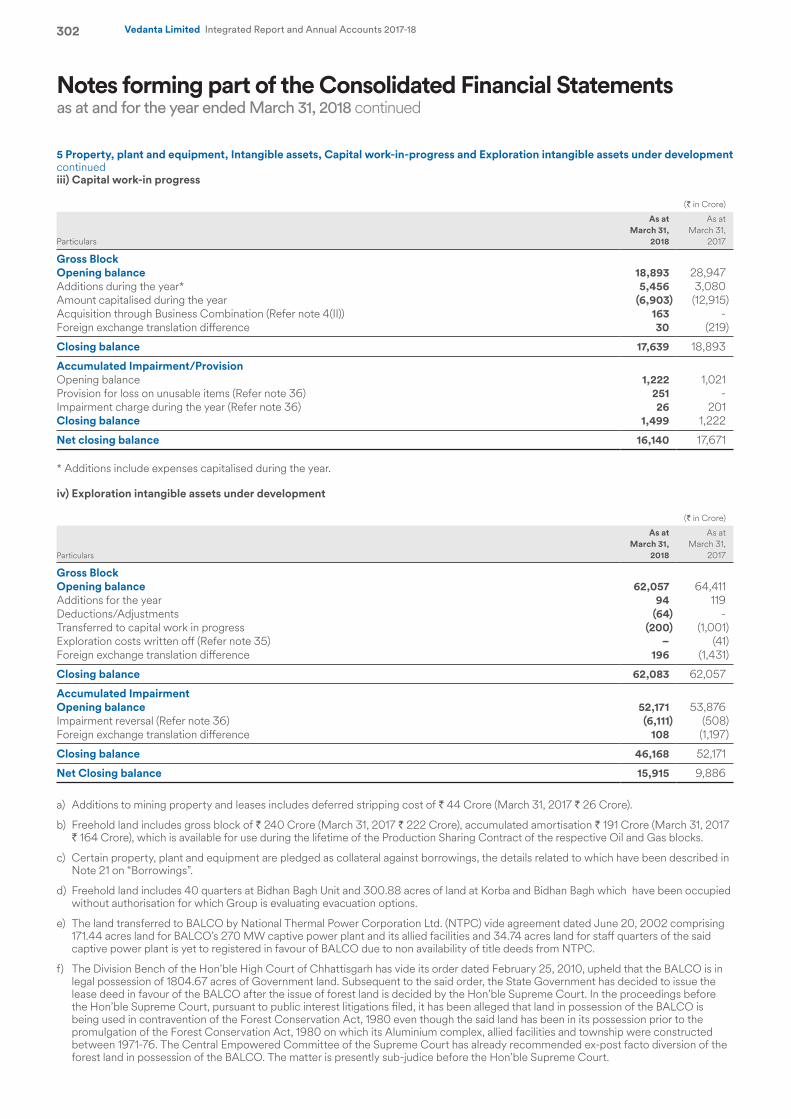
Notes forming part of the Consolidated Financial Statementsas at and for the year ended March 31, 2018 continued
302 Vedanta Limited Integrated Report and Annual Accounts 2017-18
5 Property, plant and equipment, Intangible assets, Capital work-in-progress and Exploration intangible assets under development continuediii) Capital work-in progress
(` in Crore)
Particulars
As at March 31,
2018
As at March 31,
2017
Gross Block Opening balance 18,893 28,947 Additions during the year* 5,456 3,080 Amount capitalised during the year (6,903) (12,915)Acquisition through Business Combination (Refer note 4(II)) 163 - Foreign exchange translation difference 30 (219)
Closing balance 17,639 18,893
Accumulated Impairment/Provision Opening balance 1,222 1,021 Provision for loss on unusable items (Refer note 36) 251 - Impairment charge during the year (Refer note 36) 26 201 Closing balance 1,499 1,222
Net closing balance 16,140 17,671
* Additions include expenses capitalised during the year.
iv) Exploration intangible assets under development
(` in Crore)
Particulars
As at March 31,
2018
As at March 31,
2017
Gross Block Opening balance 62,057 64,411 Additions for the year 94 119 Deductions/Adjustments (64) -Transferred to capital work in progress (200) (1,001)Exploration costs written off (Refer note 35) – (41)Foreign exchange translation difference 196 (1,431)
Closing balance 62,083 62,057
Accumulated Impairment Opening balance 52,171 53,876 Impairment reversal (Refer note 36) (6,111) (508)Foreign exchange translation difference 108 (1,197)
Closing balance 46,168 52,171
Net Closing balance 15,915 9,886
a) Additions to mining property and leases includes deferred stripping cost of ` 44 Crore (March 31, 2017 ` 26 Crore).
b) Freehold land includes gross block of ` 240 Crore (March 31, 2017 ` 222 Crore), accumulated amortisation ` 191 Crore (March 31, 2017 ` 164 Crore), which is available for use during the lifetime of the Production Sharing Contract of the respective Oil and Gas blocks.
c) Certain property, plant and equipment are pledged as collateral against borrowings, the details related to which have been described in Note 21 on “Borrowings”.
d) Freehold land includes 40 quarters at Bidhan Bagh Unit and 300.88 acres of land at Korba and Bidhan Bagh which have been occupied without authorisation for which Group is evaluating evacuation options.
e) The land transferred to BALCO by National Thermal Power Corporation Ltd. (NTPC) vide agreement dated June 20, 2002 comprising 171.44 acres land for BALCO’s 270 MW captive power plant and its allied facilities and 34.74 acres land for staff quarters of the said captive power plant is yet to registered in favour of BALCO due to non availability of title deeds from NTPC.
f) The Division Bench of the Hon’ble High Court of Chhattisgarh has vide its order dated February 25, 2010, upheld that the BALCO is in legal possession of 1804.67 acres of Government land. Subsequent to the said order, the State Government has decided to issue the lease deed in favour of the BALCO after the issue of forest land is decided by the Hon’ble Supreme Court. In the proceedings before the Hon’ble Supreme Court, pursuant to public interest litigations filed, it has been alleged that land in possession of the BALCO is being used in contravention of the Forest Conservation Act, 1980 even though the said land has been in its possession prior to the promulgation of the Forest Conservation Act, 1980 on which its Aluminium complex, allied facilities and township were constructed between 1971-76. The Central Empowered Committee of the Supreme Court has already recommended ex-post facto diversion of the forest land in possession of the BALCO. The matter is presently sub-judice before the Hon’ble Supreme Court.
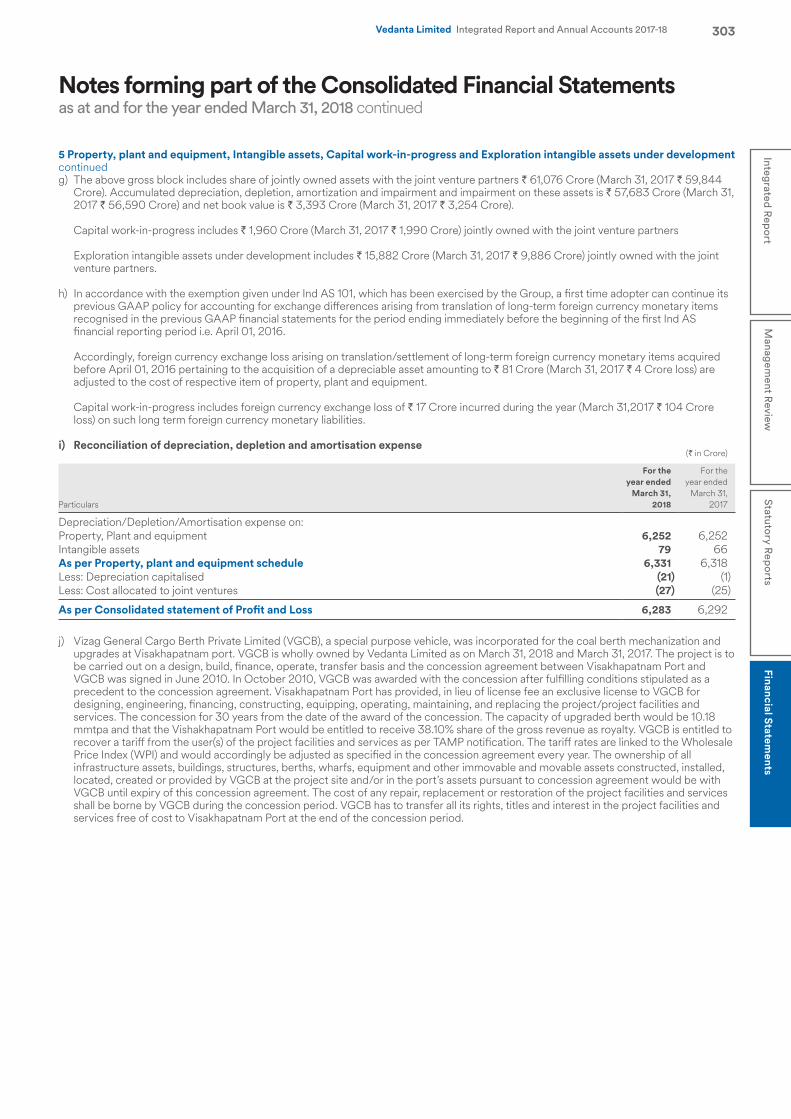
Notes forming part of the Consolidated Financial Statementsas at and for the year ended March 31, 2018 continued
303Integrated R
eport
Managem
ent Review
Statutory R
eports
Financial Statements
Vedanta Limited Integrated Report and Annual Accounts 2017-18
5 Property, plant and equipment, Intangible assets, Capital work-in-progress and Exploration intangible assets under development continuedg) The above gross block includes share of jointly owned assets with the joint venture partners ` 61,076 Crore (March 31, 2017 ` 59,844
Crore). Accumulated depreciation, depletion, amortization and impairment and impairment on these assets is ` 57,683 Crore (March 31, 2017 ` 56,590 Crore) and net book value is ` 3,393 Crore (March 31, 2017 ` 3,254 Crore).
Capital work-in-progress includes ` 1,960 Crore (March 31, 2017 ` 1,990 Crore) jointly owned with the joint venture partners Exploration intangible assets under development includes ` 15,882 Crore (March 31, 2017 ` 9,886 Crore) jointly owned with the joint
venture partners.
h) In accordance with the exemption given under Ind AS 101, which has been exercised by the Group, a first time adopter can continue its previous GAAP policy for accounting for exchange differences arising from translation of long-term foreign currency monetary items recognised in the previous GAAP financial statements for the period ending immediately before the beginning of the first Ind AS financial reporting period i.e. April 01, 2016.
Accordingly, foreign currency exchange loss arising on translation/settlement of long-term foreign currency monetary items acquired before April 01, 2016 pertaining to the acquisition of a depreciable asset amounting to ` 81 Crore (March 31, 2017 ` 4 Crore loss) are adjusted to the cost of respective item of property, plant and equipment.
Capital work-in-progress includes foreign currency exchange loss of ` 17 Crore incurred during the year (March 31,2017 ` 104 Crore loss) on such long term foreign currency monetary liabilities.
i) Reconciliation of depreciation, depletion and amortisation expense(` in Crore)
Particulars
For the year ended
March 31, 2018
For the year ended
March 31, 2017
Depreciation/Depletion/Amortisation expense on: Property, Plant and equipment 6,252 6,252 Intangible assets 79 66 As per Property, plant and equipment schedule 6,331 6,318 Less: Depreciation capitalised (21) (1) Less: Cost allocated to joint ventures (27) (25)
As per Consolidated statement of Profit and Loss 6,283 6,292
j) Vizag General Cargo Berth Private Limited (VGCB), a special purpose vehicle, was incorporated for the coal berth mechanization and upgrades at Visakhapatnam port. VGCB is wholly owned by Vedanta Limited as on March 31, 2018 and March 31, 2017. The project is to be carried out on a design, build, finance, operate, transfer basis and the concession agreement between Visakhapatnam Port and VGCB was signed in June 2010. In October 2010, VGCB was awarded with the concession after fulfilling conditions stipulated as a precedent to the concession agreement. Visakhapatnam Port has provided, in lieu of license fee an exclusive license to VGCB for designing, engineering, financing, constructing, equipping, operating, maintaining, and replacing the project/project facilities and services. The concession for 30 years from the date of the award of the concession. The capacity of upgraded berth would be 10.18 mmtpa and that the Vishakhapatnam Port would be entitled to receive 38.10% share of the gross revenue as royalty. VGCB is entitled to recover a tariff from the user(s) of the project facilities and services as per TAMP notification. The tariff rates are linked to the Wholesale Price Index (WPI) and would accordingly be adjusted as specified in the concession agreement every year. The ownership of all infrastructure assets, buildings, structures, berths, wharfs, equipment and other immovable and movable assets constructed, installed, located, created or provided by VGCB at the project site and/or in the port’s assets pursuant to concession agreement would be with VGCB until expiry of this concession agreement. The cost of any repair, replacement or restoration of the project facilities and services shall be borne by VGCB during the concession period. VGCB has to transfer all its rights, titles and interest in the project facilities and services free of cost to Visakhapatnam Port at the end of the concession period.
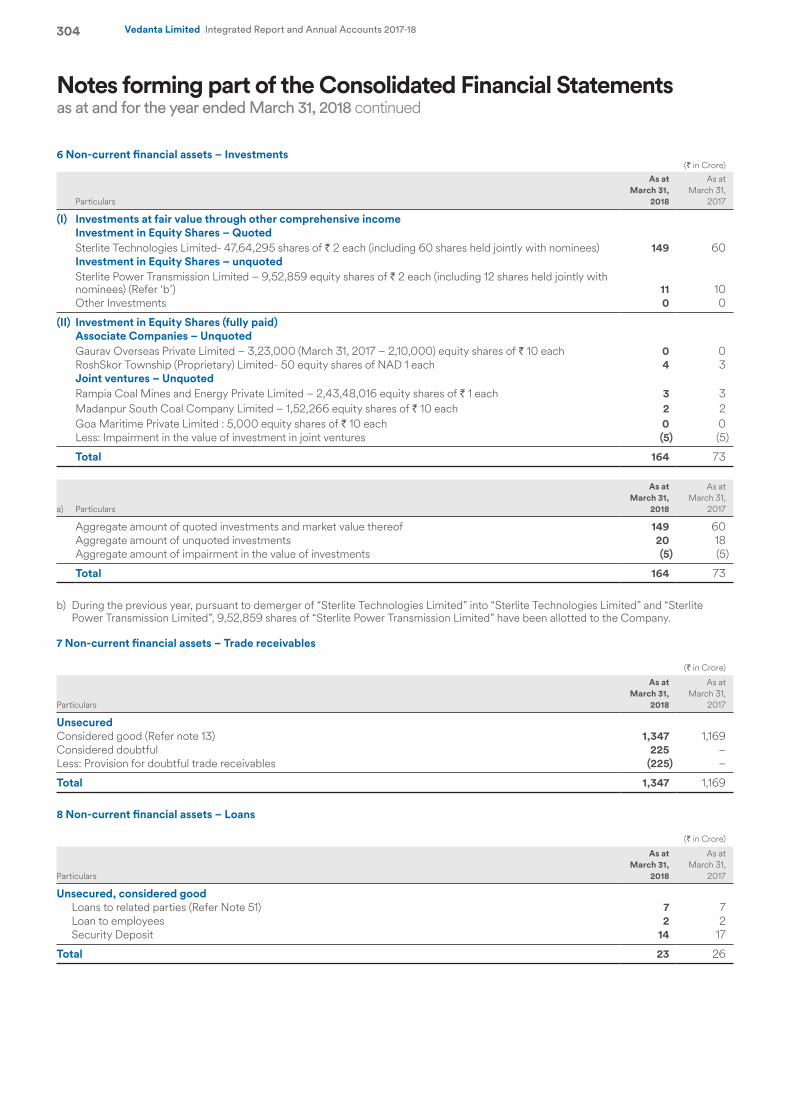
Notes forming part of the Consolidated Financial Statementsas at and for the year ended March 31, 2018 continued
304 Vedanta Limited Integrated Report and Annual Accounts 2017-18
6 Non-current financial assets – Investments(` in Crore)
Particulars
As at March 31,
2018
As at March 31,
2017
(I) Investments at fair value through other comprehensive incomeInvestment in Equity Shares – QuotedSterlite Technologies Limited- 47,64,295 shares of ` 2 each (including 60 shares held jointly with nominees) 149 60 Investment in Equity Shares – unquotedSterlite Power Transmission Limited – 9,52,859 equity shares of ` 2 each (including 12 shares held jointly with nominees) (Refer ‘b’) 11 10 Other Investments 0 0
(II) Investment in Equity Shares (fully paid)Associate Companies – UnquotedGaurav Overseas Private Limited – 3,23,000 (March 31, 2017 – 2,10,000) equity shares of ` 10 each 0 0 RoshSkor Township (Proprietary) Limited- 50 equity shares of NAD 1 each 4 3 Joint ventures – UnquotedRampia Coal Mines and Energy Private Limited – 2,43,48,016 equity shares of ` 1 each 3 3 Madanpur South Coal Company Limited – 1,52,266 equity shares of ` 10 each 2 2 Goa Maritime Private Limited : 5,000 equity shares of ` 10 each 0 0 Less: Impairment in the value of investment in joint ventures (5) (5)
Total 164 73
a) Particulars
As at March 31,
2018
As at March 31,
2017
Aggregate amount of quoted investments and market value thereof 149 60 Aggregate amount of unquoted investments 20 18 Aggregate amount of impairment in the value of investments (5) (5)
Total 164 73
b) During the previous year, pursuant to demerger of “Sterlite Technologies Limited” into “Sterlite Technologies Limited” and “Sterlite Power Transmission Limited”, 9,52,859 shares of “Sterlite Power Transmission Limited” have been allotted to the Company.
7 Non-current financial assets – Trade receivables
(` in Crore)
Particulars
As at March 31,
2018
As at March 31,
2017
Unsecured Considered good (Refer note 13) 1,347 1,169 Considered doubtful 225 – Less: Provision for doubtful trade receivables (225) –
Total 1,347 1,169
8 Non-current financial assets – Loans
(` in Crore)
Particulars
As at March 31,
2018
As at March 31,
2017
Unsecured, considered goodLoans to related parties (Refer Note 51) 7 7 Loan to employees 2 2 Security Deposit 14 17
Total 23 26
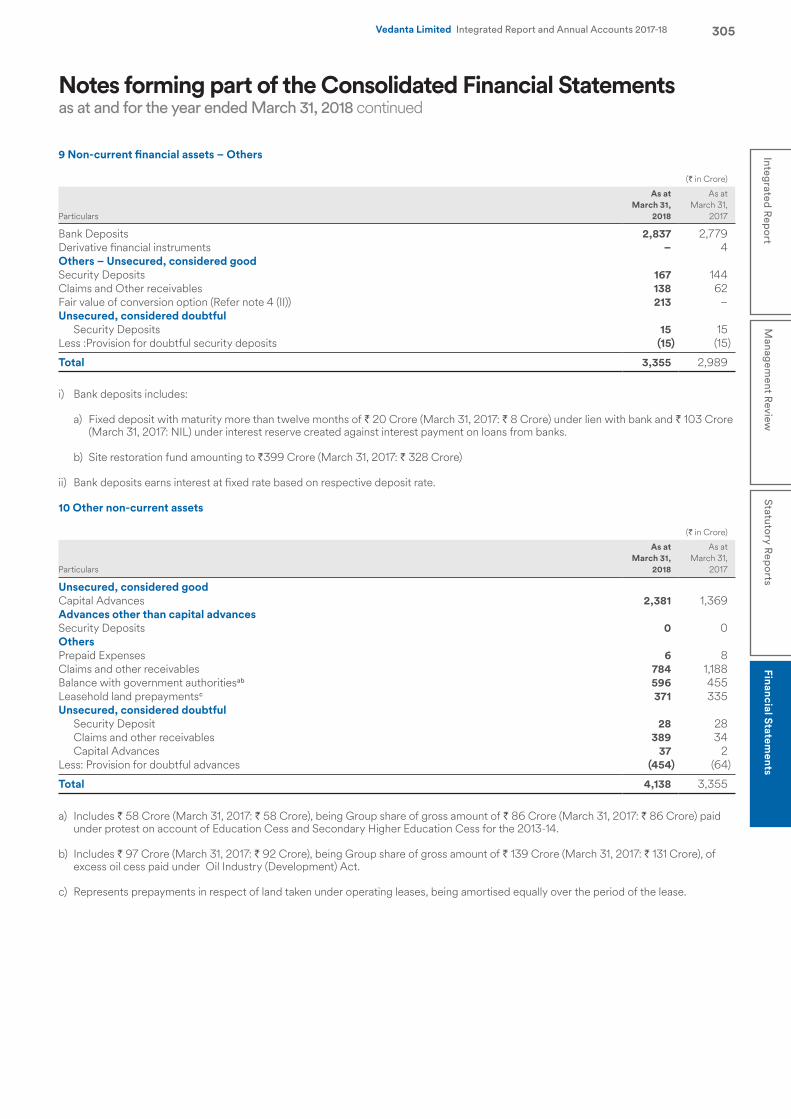
Notes forming part of the Consolidated Financial Statementsas at and for the year ended March 31, 2018 continued
305Integrated R
eport
Managem
ent Review
Statutory R
eports
Financial Statements
Vedanta Limited Integrated Report and Annual Accounts 2017-18
9 Non-current financial assets – Others
(` in Crore)
Particulars
As at March 31,
2018
As at March 31,
2017
Bank Deposits 2,837 2,779 Derivative financial instruments – 4 Others – Unsecured, considered goodSecurity Deposits 167 144 Claims and Other receivables 138 62 Fair value of conversion option (Refer note 4 (II)) 213 – Unsecured, considered doubtful
Security Deposits 15 15 Less :Provision for doubtful security deposits (15) (15)
Total 3,355 2,989
i) Bank deposits includes:
a) Fixed deposit with maturity more than twelve months of ` 20 Crore (March 31, 2017: ` 8 Crore) under lien with bank and ` 103 Crore (March 31, 2017: NIL) under interest reserve created against interest payment on loans from banks.
b) Site restoration fund amounting to `399 Crore (March 31, 2017: ` 328 Crore)
ii) Bank deposits earns interest at fixed rate based on respective deposit rate.
10 Other non-current assets
(` in Crore)
Particulars
As at March 31,
2018
As at March 31,
2017
Unsecured, considered goodCapital Advances 2,381 1,369 Advances other than capital advancesSecurity Deposits 0 0 OthersPrepaid Expenses 6 8 Claims and other receivables 784 1,188 Balance with government authoritiesab 596 455 Leasehold land prepaymentsc 371 335 Unsecured, considered doubtful
Security Deposit 28 28 Claims and other receivables 389 34 Capital Advances 37 2
Less: Provision for doubtful advances (454) (64)
Total 4,138 3,355
a) Includes ` 58 Crore (March 31, 2017: ` 58 Crore), being Group share of gross amount of ` 86 Crore (March 31, 2017: ` 86 Crore) paid under protest on account of Education Cess and Secondary Higher Education Cess for the 2013-14.
b) Includes ` 97 Crore (March 31, 2017: ` 92 Crore), being Group share of gross amount of ` 139 Crore (March 31, 2017: ` 131 Crore), of excess oil cess paid under Oil Industry (Development) Act.
c) Represents prepayments in respect of land taken under operating leases, being amortised equally over the period of the lease.
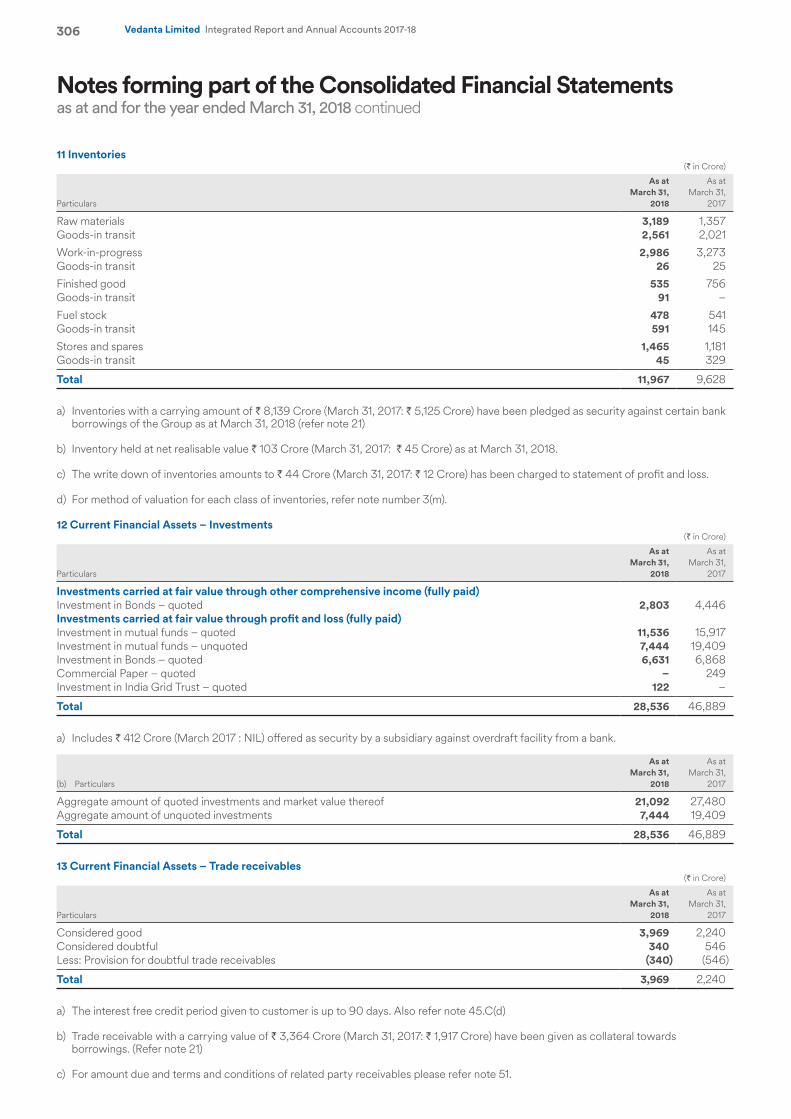
Notes forming part of the Consolidated Financial Statementsas at and for the year ended March 31, 2018 continued
306 Vedanta Limited Integrated Report and Annual Accounts 2017-18
11 Inventories(` in Crore)
Particulars
As at March 31,
2018
As at March 31,
2017
Raw materials 3,189 1,357 Goods-in transit 2,561 2,021 Work-in-progress 2,986 3,273 Goods-in transit 26 25 Finished good 535 756 Goods-in transit 91 – Fuel stock 478 541 Goods-in transit 591 145 Stores and spares 1,465 1,181 Goods-in transit 45 329
Total 11,967 9,628
a) Inventories with a carrying amount of ` 8,139 Crore (March 31, 2017: ` 5,125 Crore) have been pledged as security against certain bank borrowings of the Group as at March 31, 2018 (refer note 21)
b) Inventory held at net realisable value ` 103 Crore (March 31, 2017: ` 45 Crore) as at March 31, 2018.
c) The write down of inventories amounts to ` 44 Crore (March 31, 2017: ` 12 Crore) has been charged to statement of profit and loss.
d) For method of valuation for each class of inventories, refer note number 3(m).
12 Current Financial Assets – Investments(` in Crore)
Particulars
As at March 31,
2018
As at March 31,
2017
Investments carried at fair value through other comprehensive income (fully paid)Investment in Bonds – quoted 2,803 4,446 Investments carried at fair value through profit and loss (fully paid)Investment in mutual funds – quoted 11,536 15,917 Investment in mutual funds – unquoted 7,444 19,409 Investment in Bonds – quoted 6,631 6,868 Commercial Paper – quoted – 249 Investment in India Grid Trust – quoted 122 –
Total 28,536 46,889
a) Includes ` 412 Crore (March 2017 : NIL) offered as security by a subsidiary against overdraft facility from a bank.
(b) Particulars
As at March 31,
2018
As at March 31,
2017
Aggregate amount of quoted investments and market value thereof 21,092 27,480 Aggregate amount of unquoted investments 7,444 19,409
Total 28,536 46,889
13 Current Financial Assets – Trade receivables(` in Crore)
Particulars
As at March 31,
2018
As at March 31,
2017
Considered good 3,969 2,240 Considered doubtful 340 546 Less: Provision for doubtful trade receivables (340) (546)
Total 3,969 2,240
a) The interest free credit period given to customer is up to 90 days. Also refer note 45.C(d)
b) Trade receivable with a carrying value of ` 3,364 Crore (March 31, 2017: ` 1,917 Crore) have been given as collateral towards borrowings. (Refer note 21)
c) For amount due and terms and conditions of related party receivables please refer note 51.
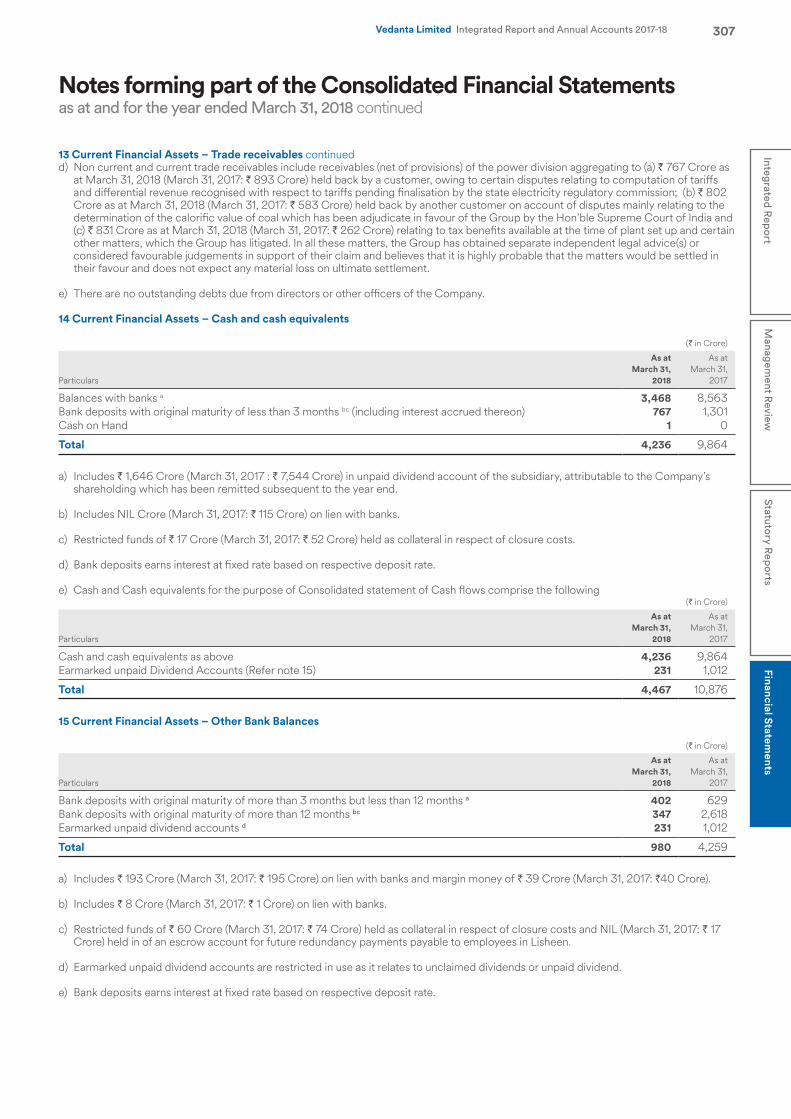
Notes forming part of the Consolidated Financial Statementsas at and for the year ended March 31, 2018 continued
307Integrated R
eport
Managem
ent Review
Statutory R
eports
Financial Statements
Vedanta Limited Integrated Report and Annual Accounts 2017-18
13 Current Financial Assets – Trade receivables continuedd) Non current and current trade receivables include receivables (net of provisions) of the power division aggregating to (a) ` 767 Crore as
at March 31, 2018 (March 31, 2017: ` 893 Crore) held back by a customer, owing to certain disputes relating to computation of tariffs and differential revenue recognised with respect to tariffs pending finalisation by the state electricity regulatory commission; (b) ` 802 Crore as at March 31, 2018 (March 31, 2017: ` 583 Crore) held back by another customer on account of disputes mainly relating to the determination of the calorific value of coal which has been adjudicate in favour of the Group by the Hon’ble Supreme Court of India and (c) ` 831 Crore as at March 31, 2018 (March 31, 2017: ` 262 Crore) relating to tax benefits available at the time of plant set up and certain other matters, which the Group has litigated. In all these matters, the Group has obtained separate independent legal advice(s) or considered favourable judgements in support of their claim and believes that it is highly probable that the matters would be settled in their favour and does not expect any material loss on ultimate settlement.
e) There are no outstanding debts due from directors or other officers of the Company.
14 Current Financial Assets – Cash and cash equivalents
(` in Crore)
Particulars
As at March 31,
2018
As at March 31,
2017
Balances with banks a 3,468 8,563 Bank deposits with original maturity of less than 3 months bc (including interest accrued thereon) 767 1,301 Cash on Hand 1 0
Total 4,236 9,864
a) Includes ` 1,646 Crore (March 31, 2017 : ` 7,544 Crore) in unpaid dividend account of the subsidiary, attributable to the Company’s shareholding which has been remitted subsequent to the year end.
b) Includes NIL Crore (March 31, 2017: ` 115 Crore) on lien with banks.
c) Restricted funds of ` 17 Crore (March 31, 2017: ` 52 Crore) held as collateral in respect of closure costs.
d) Bank deposits earns interest at fixed rate based on respective deposit rate.
e) Cash and Cash equivalents for the purpose of Consolidated statement of Cash flows comprise the following(` in Crore)
Particulars
As at March 31,
2018
As at March 31,
2017
Cash and cash equivalents as above 4,236 9,864 Earmarked unpaid Dividend Accounts (Refer note 15) 231 1,012
Total 4,467 10,876
15 Current Financial Assets – Other Bank Balances
(` in Crore)
Particulars
As at March 31,
2018
As at March 31,
2017
Bank deposits with original maturity of more than 3 months but less than 12 months a 402 629 Bank deposits with original maturity of more than 12 months bc 347 2,618 Earmarked unpaid dividend accounts d 231 1,012
Total 980 4,259
a) Includes ` 193 Crore (March 31, 2017: ` 195 Crore) on lien with banks and margin money of ` 39 Crore (March 31, 2017: `40 Crore).
b) Includes ` 8 Crore (March 31, 2017: ` 1 Crore) on lien with banks.
c) Restricted funds of ` 60 Crore (March 31, 2017: ` 74 Crore) held as collateral in respect of closure costs and NIL (March 31, 2017: ` 17 Crore) held in of an escrow account for future redundancy payments payable to employees in Lisheen.
d) Earmarked unpaid dividend accounts are restricted in use as it relates to unclaimed dividends or unpaid dividend.
e) Bank deposits earns interest at fixed rate based on respective deposit rate.
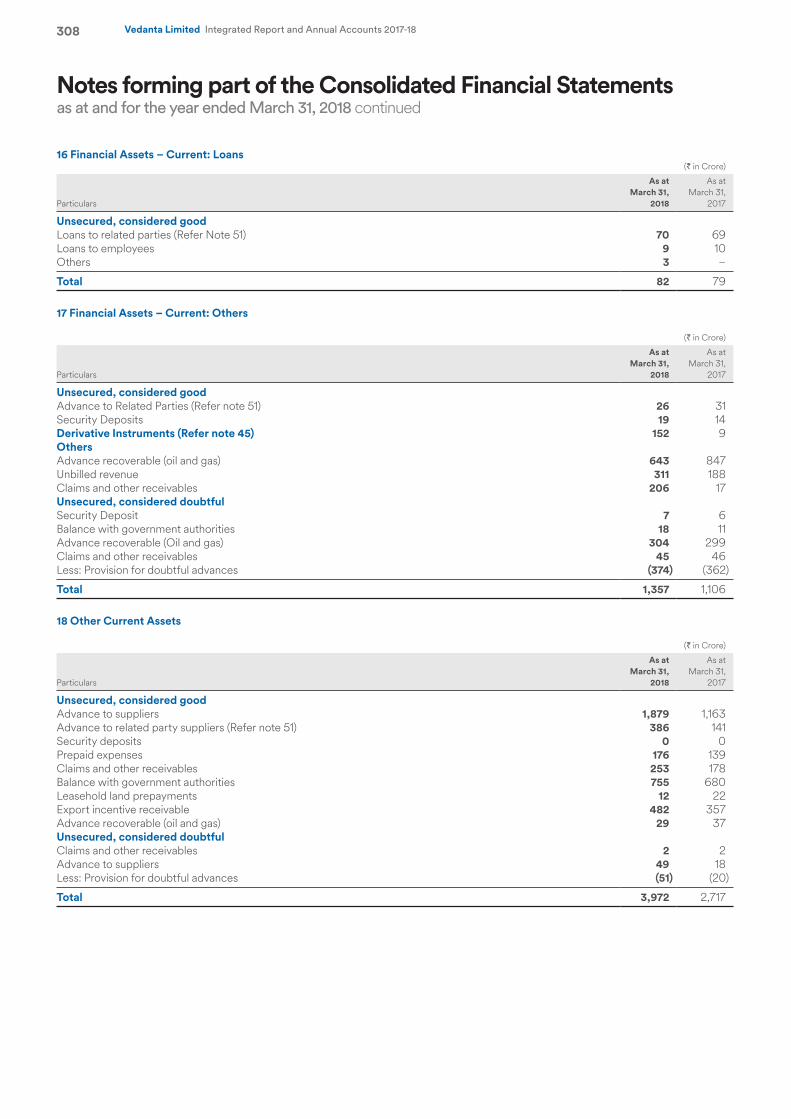
Notes forming part of the Consolidated Financial Statementsas at and for the year ended March 31, 2018 continued
308 Vedanta Limited Integrated Report and Annual Accounts 2017-18
16 Financial Assets – Current: Loans(` in Crore)
Particulars
As at March 31,
2018
As at March 31,
2017
Unsecured, considered goodLoans to related parties (Refer Note 51) 70 69 Loans to employees 9 10 Others 3 –
Total 82 79
17 Financial Assets – Current: Others
(` in Crore)
Particulars
As at March 31,
2018
As at March 31,
2017
Unsecured, considered goodAdvance to Related Parties (Refer note 51) 26 31 Security Deposits 19 14 Derivative Instruments (Refer note 45) 152 9 OthersAdvance recoverable (oil and gas) 643 847 Unbilled revenue 311 188 Claims and other receivables 206 17 Unsecured, considered doubtfulSecurity Deposit 7 6 Balance with government authorities 18 11 Advance recoverable (Oil and gas) 304 299 Claims and other receivables 45 46 Less: Provision for doubtful advances (374) (362)
Total 1,357 1,106
18 Other Current Assets
(` in Crore)
Particulars
As at March 31,
2018
As at March 31,
2017
Unsecured, considered goodAdvance to suppliers 1,879 1,163 Advance to related party suppliers (Refer note 51) 386 141 Security deposits 0 0Prepaid expenses 176 139 Claims and other receivables 253 178 Balance with government authorities 755 680 Leasehold land prepayments 12 22 Export incentive receivable 482 357 Advance recoverable (oil and gas) 29 37 Unsecured, considered doubtfulClaims and other receivables 2 2 Advance to suppliers 49 18 Less: Provision for doubtful advances (51) (20)
Total 3,972 2,717
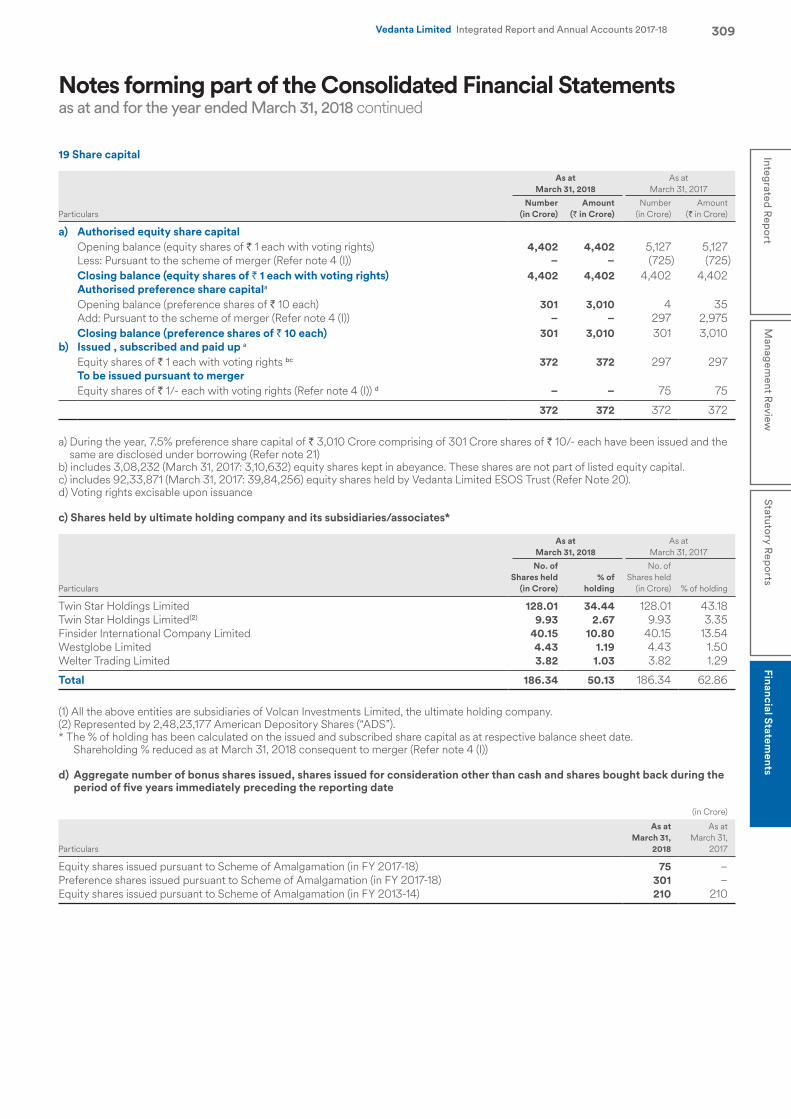
Notes forming part of the Consolidated Financial Statementsas at and for the year ended March 31, 2018 continued
309Integrated R
eport
Managem
ent Review
Statutory R
eports
Financial Statements
Vedanta Limited Integrated Report and Annual Accounts 2017-18
19 Share capital
As at March 31, 2018
As at March 31, 2017
ParticularsNumber
(in Crore)Amount
(` in Crore)Number
(in Crore)Amount
(` in Crore)
a) Authorised equity share capitalOpening balance (equity shares of ` 1 each with voting rights) 4,402 4,402 5,127 5,127 Less: Pursuant to the scheme of merger (Refer note 4 (I)) – – (725) (725)Closing balance (equity shares of ` 1 each with voting rights) 4,402 4,402 4,402 4,402 Authorised preference share capitala
Opening balance (preference shares of ` 10 each) 301 3,010 4 35 Add: Pursuant to the scheme of merger (Refer note 4 (I)) – – 297 2,975 Closing balance (preference shares of ` 10 each) 301 3,010 301 3,010
b) Issued , subscribed and paid up a
Equity shares of ` 1 each with voting rights bc 372 372 297 297 To be issued pursuant to merger Equity shares of ` 1/- each with voting rights (Refer note 4 (I)) d – – 75 75
372 372 372 372
a) During the year, 7.5% preference share capital of ` 3,010 Crore comprising of 301 Crore shares of ` 10/- each have been issued and the same are disclosed under borrowing (Refer note 21)
b) includes 3,08,232 (March 31, 2017: 3,10,632) equity shares kept in abeyance. These shares are not part of listed equity capital. c) includes 92,33,871 (March 31, 2017: 39,84,256) equity shares held by Vedanta Limited ESOS Trust (Refer Note 20).d) Voting rights excisable upon issuance
c) Shares held by ultimate holding company and its subsidiaries/associates*
As at March 31, 2018
As at March 31, 2017
Particulars
No. of Shares held
(in Crore)% of
holding
No. of Shares held
(in Crore) % of holding
Twin Star Holdings Limited 128.01 34.44 128.01 43.18 Twin Star Holdings Limited(2) 9.93 2.67 9.93 3.35 Finsider International Company Limited 40.15 10.80 40.15 13.54 Westglobe Limited 4.43 1.19 4.43 1.50 Welter Trading Limited 3.82 1.03 3.82 1.29
Total 186.34 50.13 186.34 62.86
(1) All the above entities are subsidiaries of Volcan Investments Limited, the ultimate holding company.(2) Represented by 2,48,23,177 American Depository Shares (“ADS”).* The % of holding has been calculated on the issued and subscribed share capital as at respective balance sheet date.
Shareholding % reduced as at March 31, 2018 consequent to merger (Refer note 4 (I))
d) Aggregate number of bonus shares issued, shares issued for consideration other than cash and shares bought back during the period of five years immediately preceding the reporting date
(in Crore)
Particulars
As at March 31,
2018
As at March 31,
2017
Equity shares issued pursuant to Scheme of Amalgamation (in FY 2017-18) 75 – Preference shares issued pursuant to Scheme of Amalgamation (in FY 2017-18) 301 – Equity shares issued pursuant to Scheme of Amalgamation (in FY 2013-14) 210 210
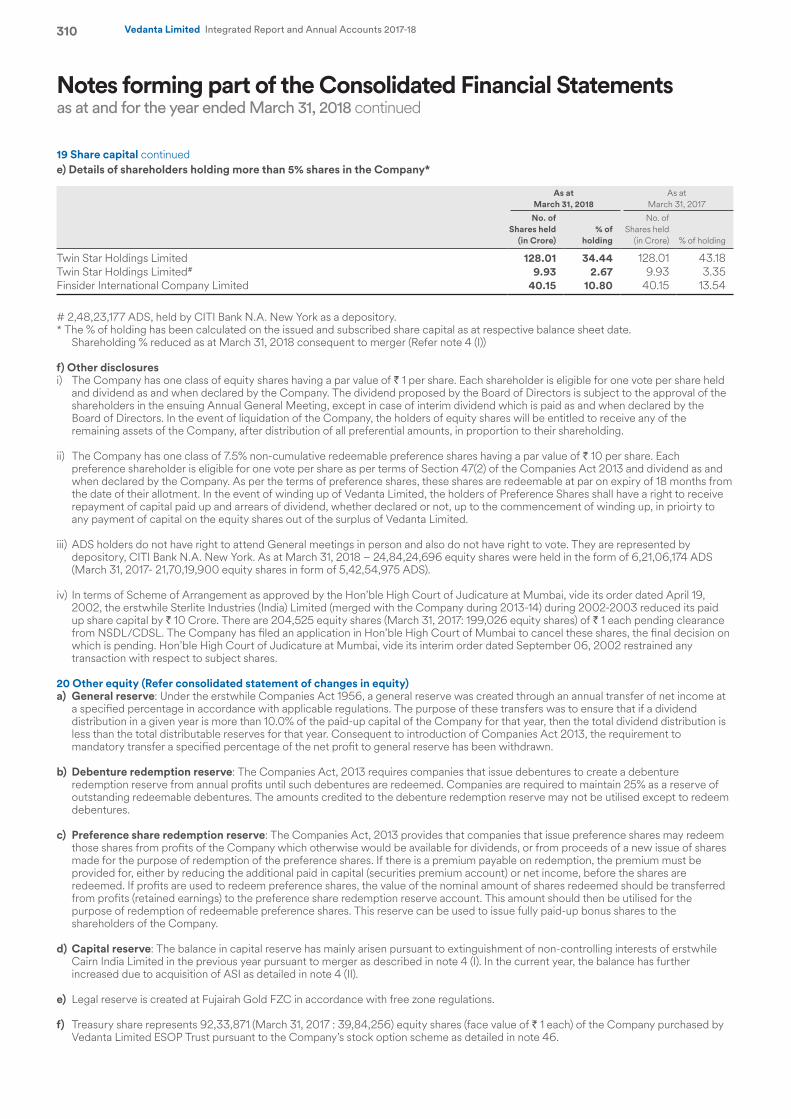
Notes forming part of the Consolidated Financial Statementsas at and for the year ended March 31, 2018 continued
310 Vedanta Limited Integrated Report and Annual Accounts 2017-18
e) Details of shareholders holding more than 5% shares in the Company*
As at March 31, 2018
As at March 31, 2017
No. of Shares held
(in Crore)% of
holding
No. of Shares held
(in Crore) % of holding
Twin Star Holdings Limited 128.01 34.44 128.01 43.18 Twin Star Holdings Limited# 9.93 2.67 9.93 3.35 Finsider International Company Limited 40.15 10.80 40.15 13.54
# 2,48,23,177 ADS, held by CITI Bank N.A. New York as a depository.* The % of holding has been calculated on the issued and subscribed share capital as at respective balance sheet date.
Shareholding % reduced as at March 31, 2018 consequent to merger (Refer note 4 (I))
f) Other disclosuresi) The Company has one class of equity shares having a par value of ` 1 per share. Each shareholder is eligible for one vote per share held
and dividend as and when declared by the Company. The dividend proposed by the Board of Directors is subject to the approval of the shareholders in the ensuing Annual General Meeting, except in case of interim dividend which is paid as and when declared by the Board of Directors. In the event of liquidation of the Company, the holders of equity shares will be entitled to receive any of the remaining assets of the Company, after distribution of all preferential amounts, in proportion to their shareholding.
ii) The Company has one class of 7.5% non-cumulative redeemable preference shares having a par value of ` 10 per share. Each preference shareholder is eligible for one vote per share as per terms of Section 47(2) of the Companies Act 2013 and dividend as and when declared by the Company. As per the terms of preference shares, these shares are redeemable at par on expiry of 18 months from the date of their allotment. In the event of winding up of Vedanta Limited, the holders of Preference Shares shall have a right to receive repayment of capital paid up and arrears of dividend, whether declared or not, up to the commencement of winding up, in prioirty to any payment of capital on the equity shares out of the surplus of Vedanta Limited.
iii) ADS holders do not have right to attend General meetings in person and also do not have right to vote. They are represented by depository, CITI Bank N.A. New York. As at March 31, 2018 – 24,84,24,696 equity shares were held in the form of 6,21,06,174 ADS (March 31, 2017- 21,70,19,900 equity shares in form of 5,42,54,975 ADS).
iv) In terms of Scheme of Arrangement as approved by the Hon’ble High Court of Judicature at Mumbai, vide its order dated April 19, 2002, the erstwhile Sterlite Industries (India) Limited (merged with the Company during 2013-14) during 2002-2003 reduced its paid up share capital by ` 10 Crore. There are 204,525 equity shares (March 31, 2017: 199,026 equity shares) of ` 1 each pending clearance from NSDL/CDSL. The Company has filed an application in Hon’ble High Court of Mumbai to cancel these shares, the final decision on which is pending. Hon’ble High Court of Judicature at Mumbai, vide its interim order dated September 06, 2002 restrained any transaction with respect to subject shares.
20 Other equity (Refer consolidated statement of changes in equity)a) General reserve: Under the erstwhile Companies Act 1956, a general reserve was created through an annual transfer of net income at
a specified percentage in accordance with applicable regulations. The purpose of these transfers was to ensure that if a dividend distribution in a given year is more than 10.0% of the paid-up capital of the Company for that year, then the total dividend distribution is less than the total distributable reserves for that year. Consequent to introduction of Companies Act 2013, the requirement to mandatory transfer a specified percentage of the net profit to general reserve has been withdrawn.
b) Debenture redemption reserve: The Companies Act, 2013 requires companies that issue debentures to create a debenture redemption reserve from annual profits until such debentures are redeemed. Companies are required to maintain 25% as a reserve of outstanding redeemable debentures. The amounts credited to the debenture redemption reserve may not be utilised except to redeem debentures.
c) Preference share redemption reserve: The Companies Act, 2013 provides that companies that issue preference shares may redeem those shares from profits of the Company which otherwise would be available for dividends, or from proceeds of a new issue of shares made for the purpose of redemption of the preference shares. If there is a premium payable on redemption, the premium must be provided for, either by reducing the additional paid in capital (securities premium account) or net income, before the shares are redeemed. If profits are used to redeem preference shares, the value of the nominal amount of shares redeemed should be transferred from profits (retained earnings) to the preference share redemption reserve account. This amount should then be utilised for the purpose of redemption of redeemable preference shares. This reserve can be used to issue fully paid-up bonus shares to the shareholders of the Company.
d) Capital reserve: The balance in capital reserve has mainly arisen pursuant to extinguishment of non-controlling interests of erstwhile Cairn India Limited in the previous year pursuant to merger as described in note 4 (I). In the current year, the balance has further increased due to acquisition of ASI as detailed in note 4 (II).
e) Legal reserve is created at Fujairah Gold FZC in accordance with free zone regulations.
f) Treasury share represents 92,33,871 (March 31, 2017 : 39,84,256) equity shares (face value of ` 1 each) of the Company purchased by Vedanta Limited ESOP Trust pursuant to the Company’s stock option scheme as detailed in note 46.
19 Share capital continued
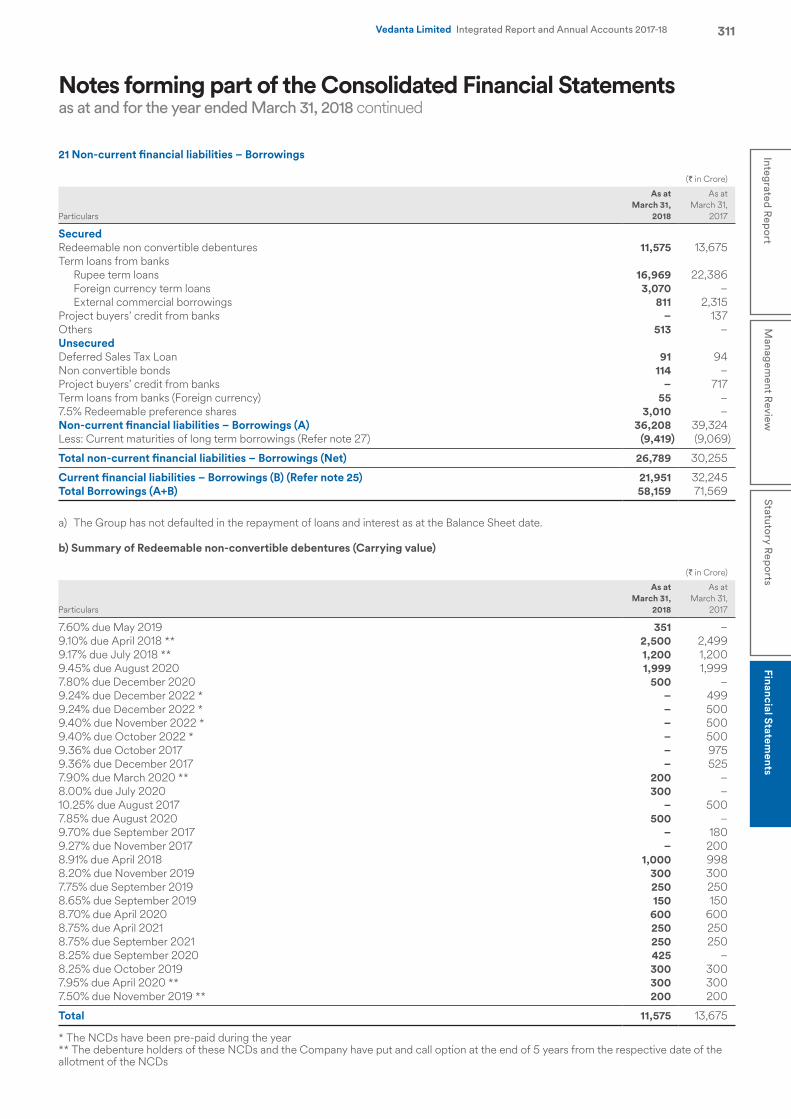
Notes forming part of the Consolidated Financial Statementsas at and for the year ended March 31, 2018 continued
311Integrated R
eport
Managem
ent Review
Statutory R
eports
Financial Statements
Vedanta Limited Integrated Report and Annual Accounts 2017-18
21 Non-current financial liabilities – Borrowings
(` in Crore)
Particulars
As at March 31,
2018
As at March 31,
2017
SecuredRedeemable non convertible debentures 11,575 13,675 Term loans from banks
Rupee term loans 16,969 22,386 Foreign currency term loans 3,070 – External commercial borrowings 811 2,315
Project buyers’ credit from banks – 137 Others 513 – UnsecuredDeferred Sales Tax Loan 91 94 Non convertible bonds 114 – Project buyers’ credit from banks – 717 Term loans from banks (Foreign currency) 55 – 7.5% Redeemable preference shares 3,010 – Non-current financial liabilities – Borrowings (A) 36,208 39,324 Less: Current maturities of long term borrowings (Refer note 27) (9,419) (9,069)
Total non-current financial liabilities – Borrowings (Net) 26,789 30,255
Current financial liabilities – Borrowings (B) (Refer note 25) 21,951 32,245 Total Borrowings (A+B) 58,159 71,569
a) The Group has not defaulted in the repayment of loans and interest as at the Balance Sheet date.
b) Summary of Redeemable non-convertible debentures (Carrying value)
(` in Crore)
Particulars
As at March 31,
2018
As at March 31,
2017
7.60% due May 2019 351 – 9.10% due April 2018 ** 2,500 2,499 9.17% due July 2018 ** 1,200 1,200 9.45% due August 2020 1,999 1,999 7.80% due December 2020 500 – 9.24% due December 2022 * – 499 9.24% due December 2022 * – 500 9.40% due November 2022 * – 500 9.40% due October 2022 * – 500 9.36% due October 2017 – 975 9.36% due December 2017 – 525 7.90% due March 2020 ** 200 – 8.00% due July 2020 300 – 10.25% due August 2017 – 500 7.85% due August 2020 500 – 9.70% due September 2017 – 180 9.27% due November 2017 – 200 8.91% due April 2018 1,000 998 8.20% due November 2019 300 300 7.75% due September 2019 250 250 8.65% due September 2019 150 150 8.70% due April 2020 600 600 8.75% due April 2021 250 250 8.75% due September 2021 250 250 8.25% due September 2020 425 – 8.25% due October 2019 300 300 7.95% due April 2020 ** 300 300 7.50% due November 2019 ** 200 200
Total 11,575 13,675
* The NCDs have been pre-paid during the year ** The debenture holders of these NCDs and the Company have put and call option at the end of 5 years from the respective date of the allotment of the NCDs
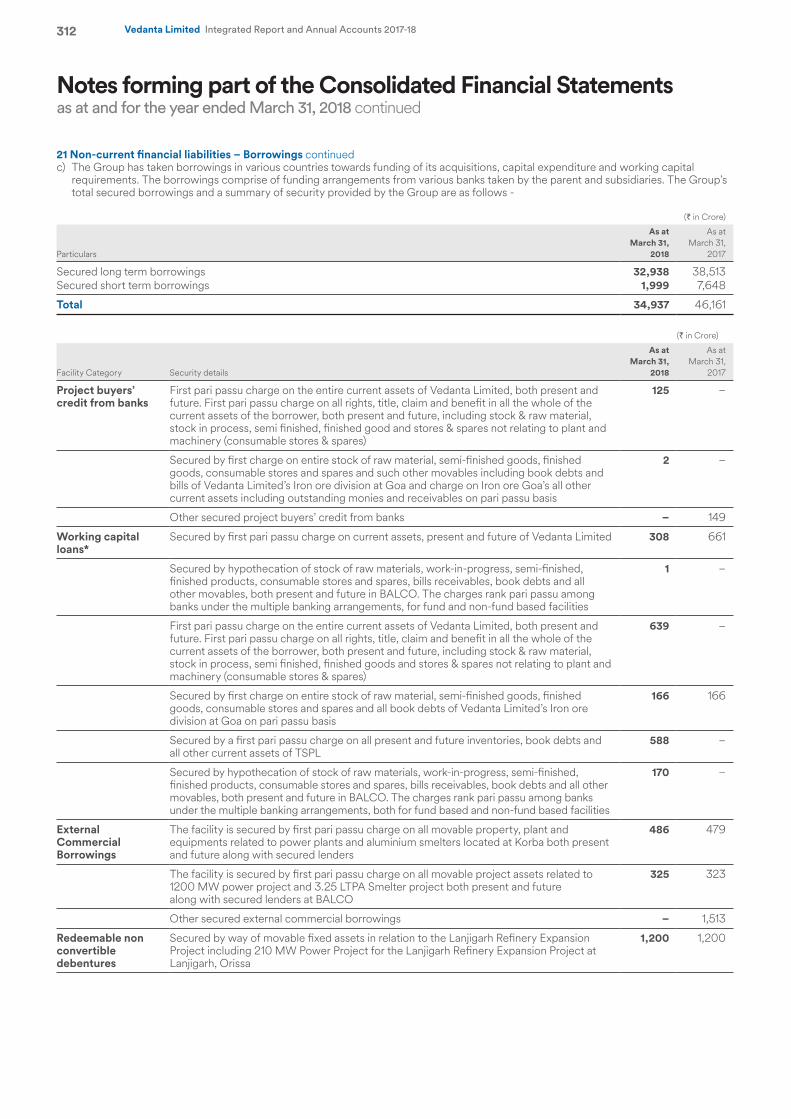
Notes forming part of the Consolidated Financial Statementsas at and for the year ended March 31, 2018 continued
312 Vedanta Limited Integrated Report and Annual Accounts 2017-18
21 Non-current financial liabilities – Borrowings continuedc) The Group has taken borrowings in various countries towards funding of its acquisitions, capital expenditure and working capital
requirements. The borrowings comprise of funding arrangements from various banks taken by the parent and subsidiaries. The Group’s total secured borrowings and a summary of security provided by the Group are as follows -
(` in Crore)
Particulars
As at March 31,
2018
As at March 31,
2017
Secured long term borrowings 32,938 38,513 Secured short term borrowings 1,999 7,648
Total 34,937 46,161
(` in Crore)
Facility Category Security details
As at March 31,
2018
As at March 31,
2017
Project buyers’ credit from banks
First pari passu charge on the entire current assets of Vedanta Limited, both present and future. First pari passu charge on all rights, title, claim and benefit in all the whole of the current assets of the borrower, both present and future, including stock & raw material, stock in process, semi finished, finished good and stores & spares not relating to plant and machinery (consumable stores & spares)
125 –
Secured by first charge on entire stock of raw material, semi-finished goods, finished goods, consumable stores and spares and such other movables including book debts and bills of Vedanta Limited’s Iron ore division at Goa and charge on Iron ore Goa’s all other current assets including outstanding monies and receivables on pari passu basis
2 –
Other secured project buyers’ credit from banks – 149
Working capital loans*
Secured by first pari passu charge on current assets, present and future of Vedanta Limited 308 661
Secured by hypothecation of stock of raw materials, work-in-progress, semi-finished, finished products, consumable stores and spares, bills receivables, book debts and all other movables, both present and future in BALCO. The charges rank pari passu among banks under the multiple banking arrangements, for fund and non-fund based facilities
1 –
First pari passu charge on the entire current assets of Vedanta Limited, both present and future. First pari passu charge on all rights, title, claim and benefit in all the whole of the current assets of the borrower, both present and future, including stock & raw material, stock in process, semi finished, finished goods and stores & spares not relating to plant and machinery (consumable stores & spares)
639 –
Secured by first charge on entire stock of raw material, semi-finished goods, finished goods, consumable stores and spares and all book debts of Vedanta Limited’s Iron ore division at Goa on pari passu basis
166 166
Secured by a first pari passu charge on all present and future inventories, book debts and all other current assets of TSPL
588 –
Secured by hypothecation of stock of raw materials, work-in-progress, semi-finished, finished products, consumable stores and spares, bills receivables, book debts and all other movables, both present and future in BALCO. The charges rank pari passu among banks under the multiple banking arrangements, both for fund based and non-fund based facilities
170 –
External Commercial Borrowings
The facility is secured by first pari passu charge on all movable property, plant and equipments related to power plants and aluminium smelters located at Korba both present and future along with secured lenders
486 479
The facility is secured by first pari passu charge on all movable project assets related to 1200 MW power project and 3.25 LTPA Smelter project both present and future along with secured lenders at BALCO
325 323
Other secured external commercial borrowings – 1,513
Redeemable non convertible debentures
Secured by way of movable fixed assets in relation to the Lanjigarh Refinery Expansion Project including 210 MW Power Project for the Lanjigarh Refinery Expansion Project at Lanjigarh, Orissa
1,200 1,200
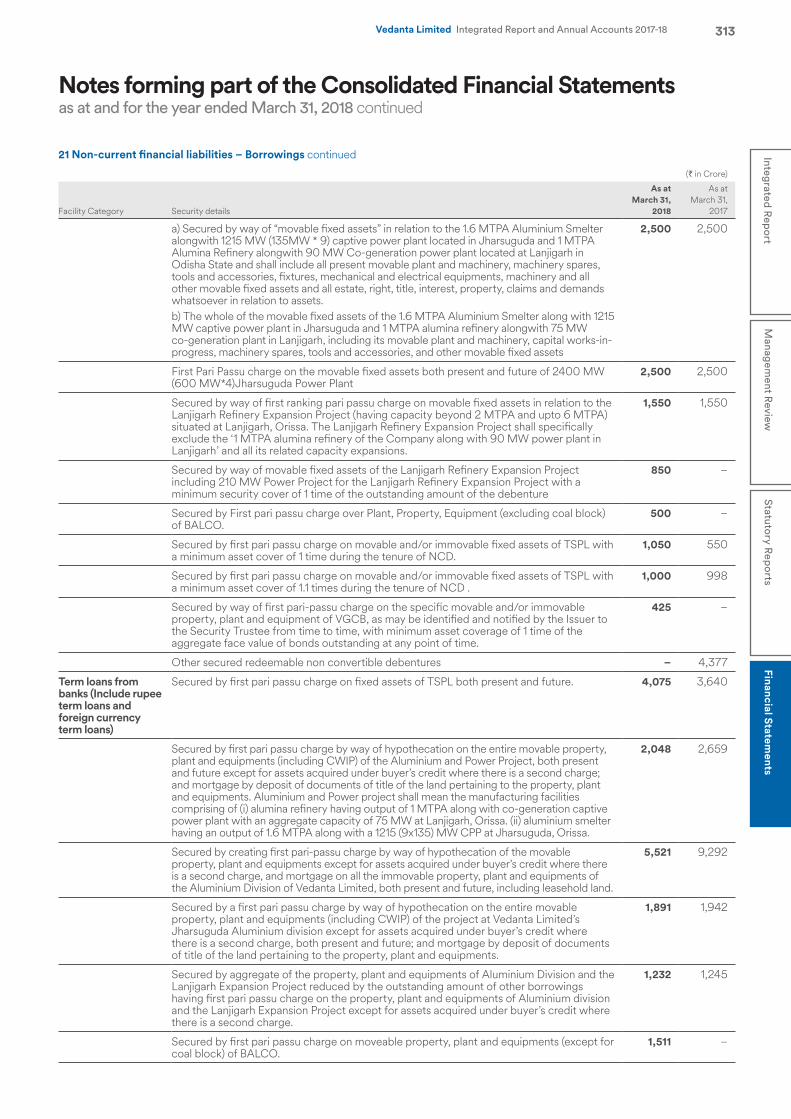
Notes forming part of the Consolidated Financial Statementsas at and for the year ended March 31, 2018 continued
313Integrated R
eport
Managem
ent Review
Statutory R
eports
Financial Statements
Vedanta Limited Integrated Report and Annual Accounts 2017-18
21 Non-current financial liabilities – Borrowings continued
(` in Crore)
Facility Category Security details
As at March 31,
2018
As at March 31,
2017
a) Secured by way of “movable fixed assets” in relation to the 1.6 MTPA Aluminium Smelter alongwith 1215 MW (135MW * 9) captive power plant located in Jharsuguda and 1 MTPA Alumina Refinery alongwith 90 MW Co-generation power plant located at Lanjigarh in Odisha State and shall include all present movable plant and machinery, machinery spares, tools and accessories, fixtures, mechanical and electrical equipments, machinery and all other movable fixed assets and all estate, right, title, interest, property, claims and demands whatsoever in relation to assets.b) The whole of the movable fixed assets of the 1.6 MTPA Aluminium Smelter along with 1215 MW captive power plant in Jharsuguda and 1 MTPA alumina refinery alongwith 75 MW co-generation plant in Lanjigarh, including its movable plant and machinery, capital works-in-progress, machinery spares, tools and accessories, and other movable fixed assets
2,500 2,500
First Pari Passu charge on the movable fixed assets both present and future of 2400 MW (600 MW*4)Jharsuguda Power Plant
2,500 2,500
Secured by way of first ranking pari passu charge on movable fixed assets in relation to the Lanjigarh Refinery Expansion Project (having capacity beyond 2 MTPA and upto 6 MTPA) situated at Lanjigarh, Orissa. The Lanjigarh Refinery Expansion Project shall specifically exclude the ‘1 MTPA alumina refinery of the Company along with 90 MW power plant in Lanjigarh’ and all its related capacity expansions.
1,550 1,550
Secured by way of movable fixed assets of the Lanjigarh Refinery Expansion Project including 210 MW Power Project for the Lanjigarh Refinery Expansion Project with a minimum security cover of 1 time of the outstanding amount of the debenture
850 –
Secured by First pari passu charge over Plant, Property, Equipment (excluding coal block) of BALCO.
500 –
Secured by first pari passu charge on movable and/or immovable fixed assets of TSPL with a minimum asset cover of 1 time during the tenure of NCD.
1,050 550
Secured by first pari passu charge on movable and/or immovable fixed assets of TSPL with a minimum asset cover of 1.1 times during the tenure of NCD .
1,000 998
Secured by way of first pari-passu charge on the specific movable and/or immovable property, plant and equipment of VGCB, as may be identified and notified by the Issuer to the Security Trustee from time to time, with minimum asset coverage of 1 time of the aggregate face value of bonds outstanding at any point of time.
425 –
Other secured redeemable non convertible debentures – 4,377
Term loans from banks (Include rupee term loans and foreign currency term loans)
Secured by first pari passu charge on fixed assets of TSPL both present and future. 4,075 3,640
Secured by first pari passu charge by way of hypothecation on the entire movable property, plant and equipments (including CWIP) of the Aluminium and Power Project, both present and future except for assets acquired under buyer’s credit where there is a second charge; and mortgage by deposit of documents of title of the land pertaining to the property, plant and equipments. Aluminium and Power project shall mean the manufacturing facilities comprising of (i) alumina refinery having output of 1 MTPA along with co-generation captive power plant with an aggregate capacity of 75 MW at Lanjigarh, Orissa. (ii) aluminium smelter having an output of 1.6 MTPA along with a 1215 (9x135) MW CPP at Jharsuguda, Orissa.
2,048 2,659
Secured by creating first pari-passu charge by way of hypothecation of the movable property, plant and equipments except for assets acquired under buyer’s credit where there is a second charge, and mortgage on all the immovable property, plant and equipments of the Aluminium Division of Vedanta Limited, both present and future, including leasehold land.
5,521 9,292
Secured by a first pari passu charge by way of hypothecation on the entire movable property, plant and equipments (including CWIP) of the project at Vedanta Limited’s Jharsuguda Aluminium division except for assets acquired under buyer’s credit where there is a second charge, both present and future; and mortgage by deposit of documents of title of the land pertaining to the property, plant and equipments.
1,891 1,942
Secured by aggregate of the property, plant and equipments of Aluminium Division and the Lanjigarh Expansion Project reduced by the outstanding amount of other borrowings having first pari passu charge on the property, plant and equipments of Aluminium division and the Lanjigarh Expansion Project except for assets acquired under buyer’s credit where there is a second charge.
1,232 1,245
Secured by first pari passu charge on moveable property, plant and equipments (except for coal block) of BALCO.
1,511 –
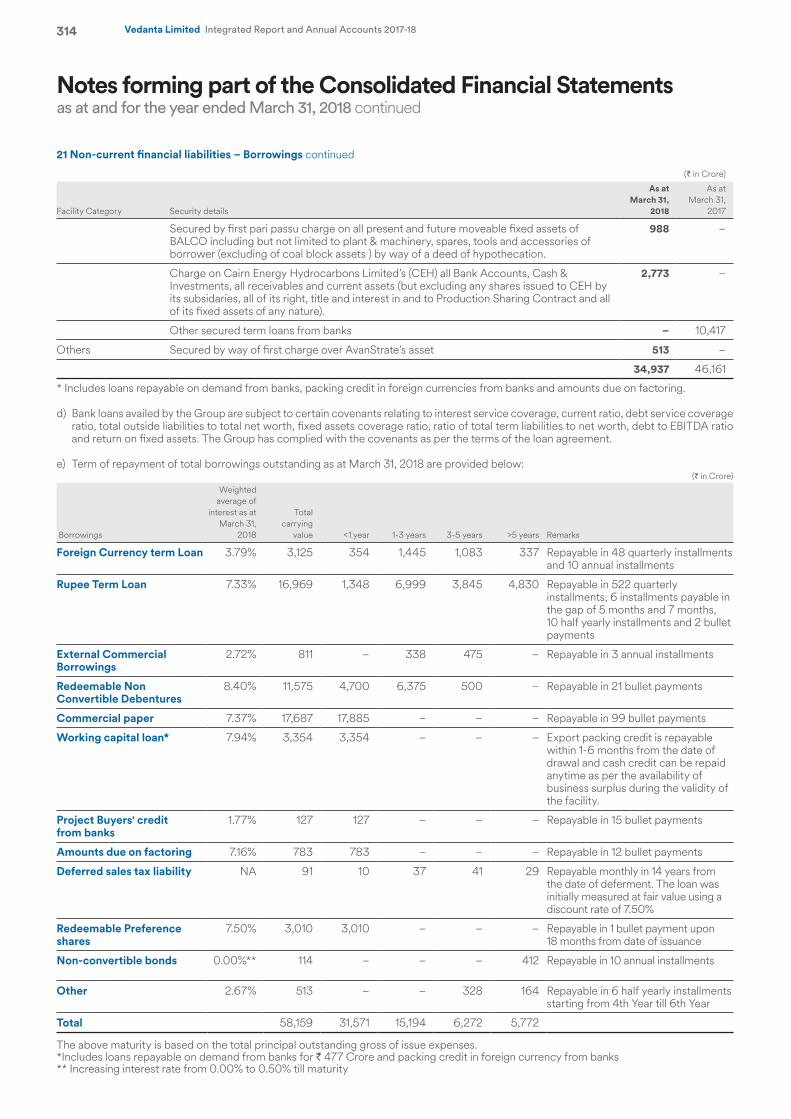
Notes forming part of the Consolidated Financial Statementsas at and for the year ended March 31, 2018 continued
314 Vedanta Limited Integrated Report and Annual Accounts 2017-18
21 Non-current financial liabilities – Borrowings continued
(` in Crore)
Facility Category Security details
As at March 31,
2018
As at March 31,
2017
Secured by first pari passu charge on all present and future moveable fixed assets of BALCO including but not limited to plant & machinery, spares, tools and accessories of borrower (excluding of coal block assets ) by way of a deed of hypothecation.
988 –
Charge on Cairn Energy Hydrocarbons Limited’s (CEH) all Bank Accounts, Cash & Investments, all receivables and current assets (but excluding any shares issued to CEH by its subsidaries, all of its right, title and interest in and to Production Sharing Contract and all of its fixed assets of any nature).
2,773 –
Other secured term loans from banks – 10,417
Others Secured by way of first charge over AvanStrate’s asset 513 –
34,937 46,161
* Includes loans repayable on demand from banks, packing credit in foreign currencies from banks and amounts due on factoring.
d) Bank loans availed by the Group are subject to certain covenants relating to interest service coverage, current ratio, debt service coverage ratio, total outside liabilities to total net worth, fixed assets coverage ratio, ratio of total term liabilities to net worth, debt to EBITDA ratio and return on fixed assets. The Group has complied with the covenants as per the terms of the loan agreement.
e) Term of repayment of total borrowings outstanding as at March 31, 2018 are provided below:(` in Crore)
Borrowings
Weighted average of
interest as at March 31,
2018
Total carrying
value <1 year 1-3 years 3-5 years >5 years Remarks
Foreign Currency term Loan 3.79% 3,125 354 1,445 1,083 337 Repayable in 48 quarterly installments and 10 annual installments
Rupee Term Loan 7.33% 16,969 1,348 6,999 3,845 4,830 Repayable in 522 quarterly installments, 6 installments payable in the gap of 5 months and 7 months, 10 half yearly installments and 2 bullet payments
External Commercial Borrowings
2.72% 811 – 338 475 – Repayable in 3 annual installments
Redeemable Non Convertible Debentures
8.40% 11,575 4,700 6,375 500 – Repayable in 21 bullet payments
Commercial paper 7.37% 17,687 17,885 – – – Repayable in 99 bullet payments
Working capital loan* 7.94% 3,354 3,354 – – – Export packing credit is repayable within 1-6 months from the date of drawal and cash credit can be repaid anytime as per the availability of business surplus during the validity of the facility.
Project Buyers' credit from banks
1.77% 127 127 – – – Repayable in 15 bullet payments
Amounts due on factoring 7.16% 783 783 – – – Repayable in 12 bullet payments
Deferred sales tax liability NA 91 10 37 41 29 Repayable monthly in 14 years from the date of deferment. The loan was initially measured at fair value using a discount rate of 7.50%
Redeemable Preference shares
7.50% 3,010 3,010 – – – Repayable in 1 bullet payment upon 18 months from date of issuance
Non-convertible bonds 0.00%** 114 – – – 412 Repayable in 10 annual installments
Other 2.67% 513 – – 328 164 Repayable in 6 half yearly installments starting from 4th Year till 6th Year
Total 58,159 31,571 15,194 6,272 5,772
The above maturity is based on the total principal outstanding gross of issue expenses.*Includes loans repayable on demand from banks for ` 477 Crore and packing credit in foreign currency from banks ** Increasing interest rate from 0.00% to 0.50% till maturity
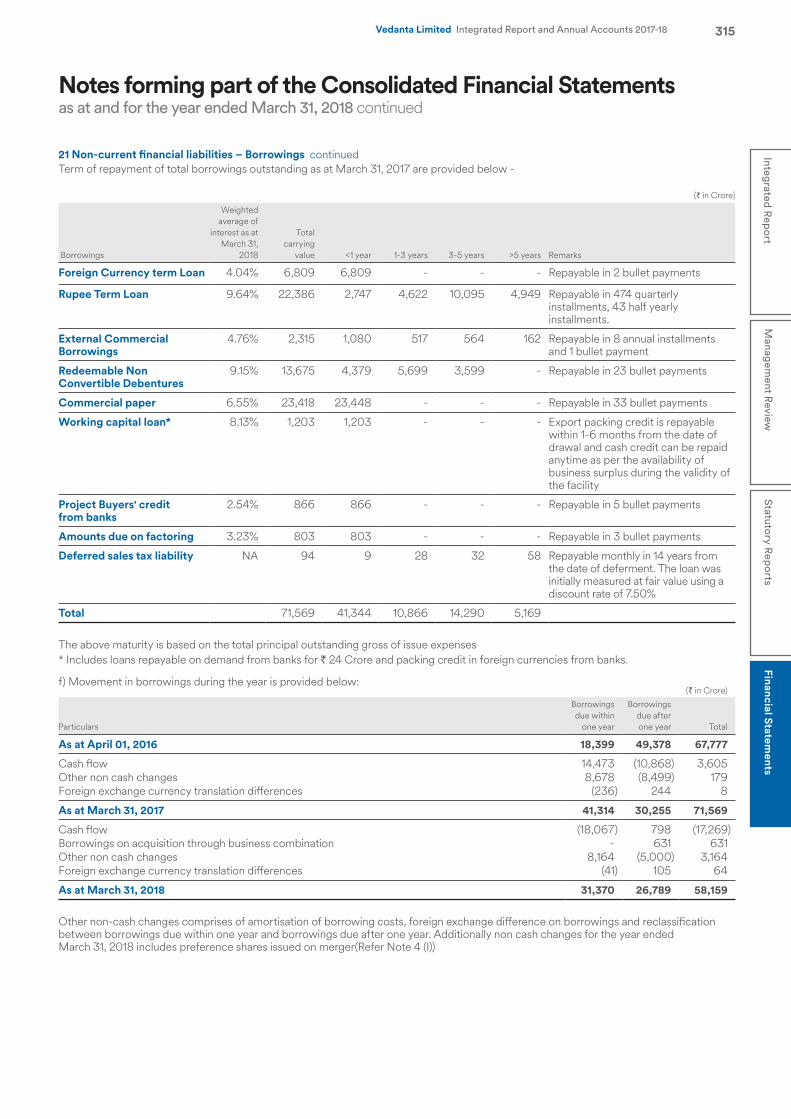
Notes forming part of the Consolidated Financial Statementsas at and for the year ended March 31, 2018 continued
315Integrated R
eport
Managem
ent Review
Statutory R
eports
Financial Statements
Vedanta Limited Integrated Report and Annual Accounts 2017-18
Term of repayment of total borrowings outstanding as at March 31, 2017 are provided below -
(` in Crore)
Borrowings
Weighted average of
interest as at March 31,
2018
Total carrying
value <1 year 1-3 years 3-5 years >5 years Remarks
Foreign Currency term Loan 4.04% 6,809 6,809 - - - Repayable in 2 bullet payments
Rupee Term Loan 9.64% 22,386 2,747 4,622 10,095 4,949 Repayable in 474 quarterly installments, 43 half yearly installments.
External Commercial Borrowings
4.76% 2,315 1,080 517 564 162 Repayable in 8 annual installments and 1 bullet payment
Redeemable Non Convertible Debentures
9.15% 13,675 4,379 5,699 3,599 - Repayable in 23 bullet payments
Commercial paper 6.55% 23,418 23,448 - - - Repayable in 33 bullet payments
Working capital loan* 8.13% 1,203 1,203 - - - Export packing credit is repayable within 1-6 months from the date of drawal and cash credit can be repaid anytime as per the availability of business surplus during the validity of the facility
Project Buyers' credit from banks
2.54% 866 866 - - - Repayable in 5 bullet payments
Amounts due on factoring 3.23% 803 803 - - - Repayable in 3 bullet payments
Deferred sales tax liability NA 94 9 28 32 58 Repayable monthly in 14 years from the date of deferment. The loan was initially measured at fair value using a discount rate of 7.50%
Total 71,569 41,344 10,866 14,290 5,169
The above maturity is based on the total principal outstanding gross of issue expenses* Includes loans repayable on demand from banks for ` 24 Crore and packing credit in foreign currencies from banks.
f) Movement in borrowings during the year is provided below:(` in Crore)
Particulars
Borrowings due within
one year
Borrowings due after one year Total
As at April 01, 2016 18,399 49,378 67,777
Cash flow 14,473 (10,868) 3,605 Other non cash changes 8,678 (8,499) 179 Foreign exchange currency translation differences (236) 244 8
As at March 31, 2017 41,314 30,255 71,569
Cash flow (18,067) 798 (17,269)Borrowings on acquisition through business combination - 631 631 Other non cash changes 8,164 (5,000) 3,164 Foreign exchange currency translation differences (41) 105 64
As at March 31, 2018 31,370 26,789 58,159
Other non-cash changes comprises of amortisation of borrowing costs, foreign exchange difference on borrowings and reclassification between borrowings due within one year and borrowings due after one year. Additionally non cash changes for the year ended March 31, 2018 includes preference shares issued on merger(Refer Note 4 (I))
21 Non-current financial liabilities – Borrowings continued
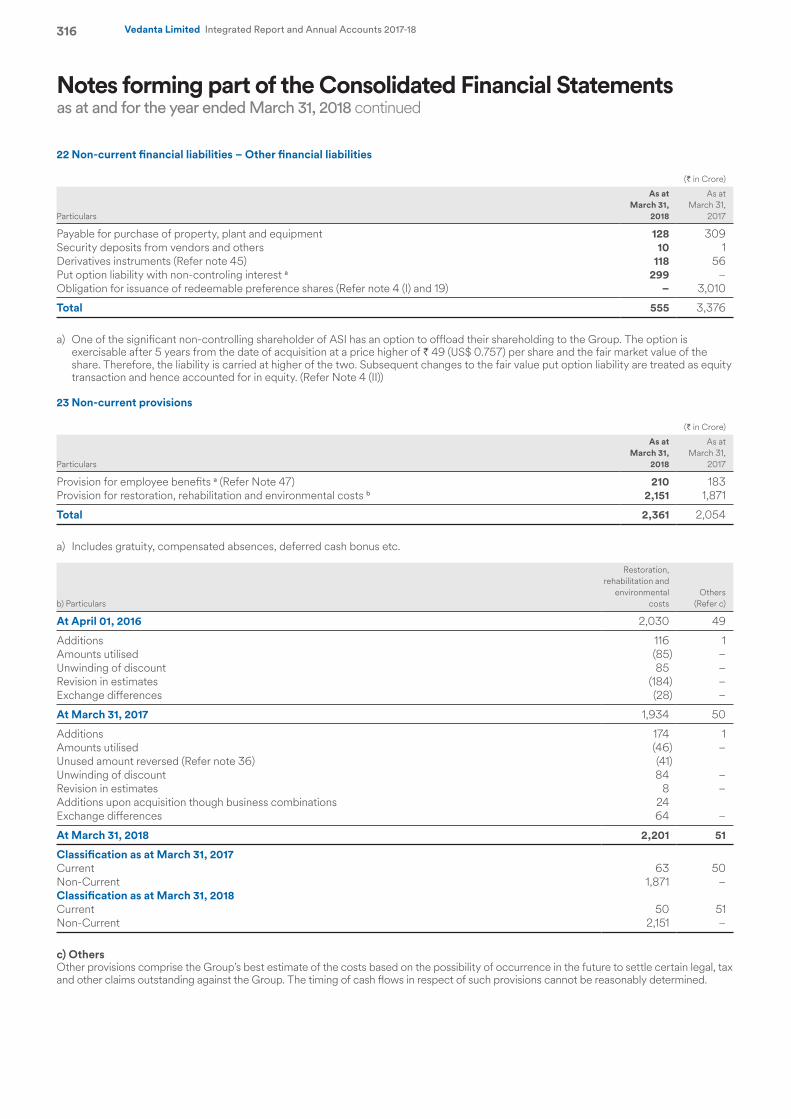
Notes forming part of the Consolidated Financial Statementsas at and for the year ended March 31, 2018 continued
316 Vedanta Limited Integrated Report and Annual Accounts 2017-18
22 Non-current financial liabilities – Other financial liabilities
(` in Crore)
Particulars
As at March 31,
2018
As at March 31,
2017
Payable for purchase of property, plant and equipment 128 309 Security deposits from vendors and others 10 1 Derivatives instruments (Refer note 45) 118 56 Put option liability with non-controling interest a 299 – Obligation for issuance of redeemable preference shares (Refer note 4 (I) and 19) – 3,010
Total 555 3,376
a) One of the significant non-controlling shareholder of ASI has an option to offload their shareholding to the Group. The option is exercisable after 5 years from the date of acquisition at a price higher of ` 49 (US$ 0.757) per share and the fair market value of the share. Therefore, the liability is carried at higher of the two. Subsequent changes to the fair value put option liability are treated as equity transaction and hence accounted for in equity. (Refer Note 4 (II))
23 Non-current provisions
(` in Crore)
Particulars
As at March 31,
2018
As at March 31,
2017
Provision for employee benefits a (Refer Note 47) 210 183 Provision for restoration, rehabilitation and environmental costs b 2,151 1,871
Total 2,361 2,054
a) Includes gratuity, compensated absences, deferred cash bonus etc.
b) Particulars
Restoration, rehabilitation and
environmental costs
Others (Refer c)
At April 01, 2016 2,030 49
Additions 116 1 Amounts utilised (85) – Unwinding of discount 85 –Revision in estimates (184) –Exchange differences (28) –
At March 31, 2017 1,934 50
Additions 174 1 Amounts utilised (46) – Unused amount reversed (Refer note 36) (41)Unwinding of discount 84 –Revision in estimates 8 –Additions upon acquisition though business combinations 24 Exchange differences 64 –
At March 31, 2018 2,201 51
Classification as at March 31, 2017Current 63 50 Non-Current 1,871 –Classification as at March 31, 2018Current 50 51 Non-Current 2,151 –
c) OthersOther provisions comprise the Group’s best estimate of the costs based on the possibility of occurrence in the future to settle certain legal, tax and other claims outstanding against the Group. The timing of cash flows in respect of such provisions cannot be reasonably determined.
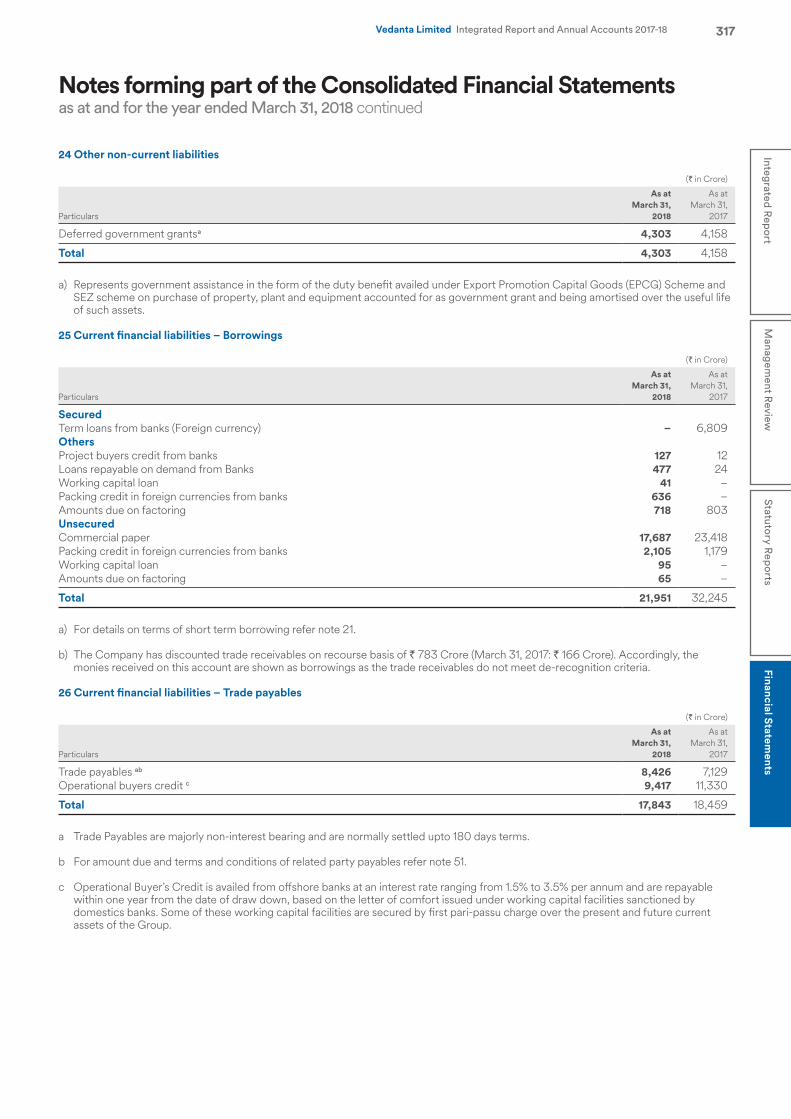
Notes forming part of the Consolidated Financial Statementsas at and for the year ended March 31, 2018 continued
317Integrated R
eport
Managem
ent Review
Statutory R
eports
Financial Statements
Vedanta Limited Integrated Report and Annual Accounts 2017-18
24 Other non-current liabilities
(` in Crore)
Particulars
As at March 31,
2018
As at March 31,
2017
Deferred government grantsa 4,303 4,158
Total 4,303 4,158
a) Represents government assistance in the form of the duty benefit availed under Export Promotion Capital Goods (EPCG) Scheme and SEZ scheme on purchase of property, plant and equipment accounted for as government grant and being amortised over the useful life of such assets.
25 Current financial liabilities – Borrowings
(` in Crore)
Particulars
As at March 31,
2018
As at March 31,
2017
SecuredTerm loans from banks (Foreign currency) – 6,809 OthersProject buyers credit from banks 127 12 Loans repayable on demand from Banks 477 24 Working capital loan 41 – Packing credit in foreign currencies from banks 636 – Amounts due on factoring 718 803 UnsecuredCommercial paper 17,687 23,418 Packing credit in foreign currencies from banks 2,105 1,179 Working capital loan 95 – Amounts due on factoring 65 –
Total 21,951 32,245
a) For details on terms of short term borrowing refer note 21.
b) The Company has discounted trade receivables on recourse basis of ` 783 Crore (March 31, 2017: ` 166 Crore). Accordingly, the monies received on this account are shown as borrowings as the trade receivables do not meet de-recognition criteria.
26 Current financial liabilities – Trade payables
(` in Crore)
Particulars
As at March 31,
2018
As at March 31,
2017
Trade payables ab 8,426 7,129 Operational buyers credit c 9,417 11,330
Total 17,843 18,459
a Trade Payables are majorly non-interest bearing and are normally settled upto 180 days terms.
b For amount due and terms and conditions of related party payables refer note 51.
c Operational Buyer’s Credit is availed from offshore banks at an interest rate ranging from 1.5% to 3.5% per annum and are repayable within one year from the date of draw down, based on the letter of comfort issued under working capital facilities sanctioned by domestics banks. Some of these working capital facilities are secured by first pari-passu charge over the present and future current assets of the Group.
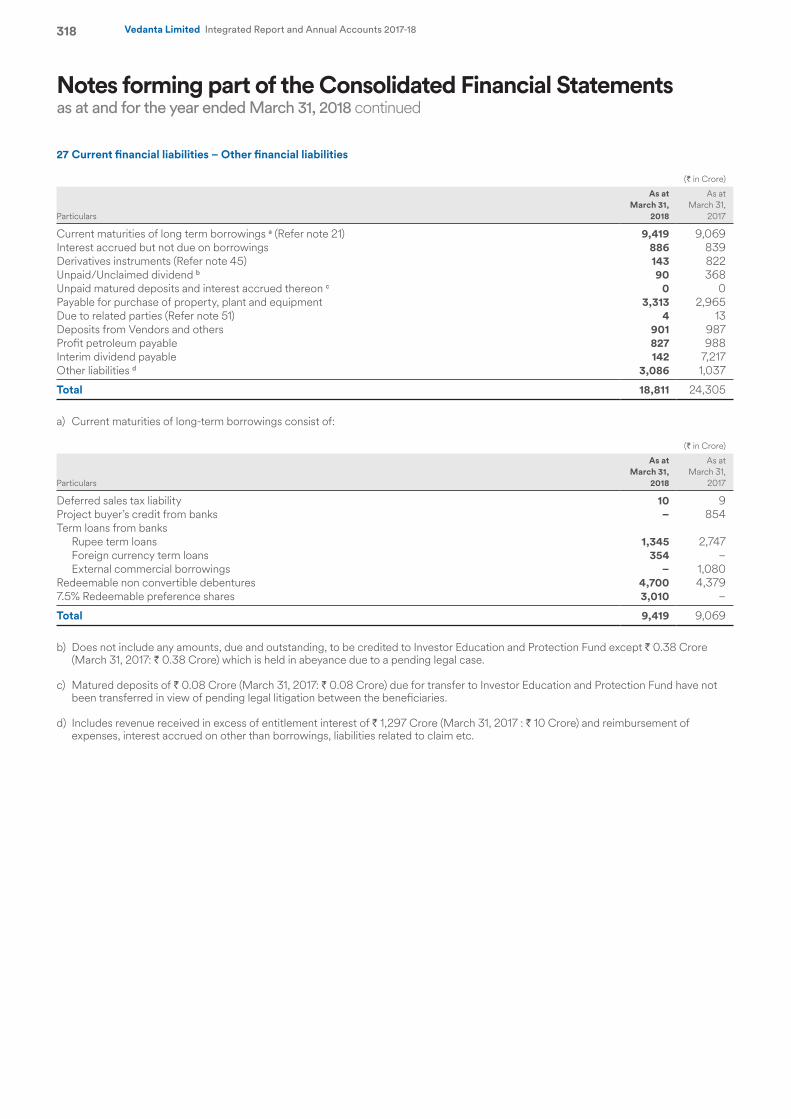
Notes forming part of the Consolidated Financial Statementsas at and for the year ended March 31, 2018 continued
318 Vedanta Limited Integrated Report and Annual Accounts 2017-18
27 Current financial liabilities – Other financial liabilities
(` in Crore)
Particulars
As at March 31,
2018
As at March 31,
2017
Current maturities of long term borrowings a (Refer note 21) 9,419 9,069 Interest accrued but not due on borrowings 886 839 Derivatives instruments (Refer note 45) 143 822 Unpaid/Unclaimed dividend b 90 368 Unpaid matured deposits and interest accrued thereon c 0 0 Payable for purchase of property, plant and equipment 3,313 2,965 Due to related parties (Refer note 51) 4 13 Deposits from Vendors and others 901 987 Profit petroleum payable 827 988 Interim dividend payable 142 7,217 Other liabilities d 3,086 1,037
Total 18,811 24,305
a) Current maturities of long-term borrowings consist of:
(` in Crore)
Particulars
As at March 31,
2018
As at March 31,
2017
Deferred sales tax liability 10 9 Project buyer’s credit from banks – 854 Term loans from banks
Rupee term loans 1,345 2,747 Foreign currency term loans 354 – External commercial borrowings – 1,080
Redeemable non convertible debentures 4,700 4,379 7.5% Redeemable preference shares 3,010 –
Total 9,419 9,069
b) Does not include any amounts, due and outstanding, to be credited to Investor Education and Protection Fund except ` 0.38 Crore (March 31, 2017: ` 0.38 Crore) which is held in abeyance due to a pending legal case.
c) Matured deposits of ` 0.08 Crore (March 31, 2017: ` 0.08 Crore) due for transfer to Investor Education and Protection Fund have not been transferred in view of pending legal litigation between the beneficiaries.
d) Includes revenue received in excess of entitlement interest of ` 1,297 Crore (March 31, 2017 : ` 10 Crore) and reimbursement of expenses, interest accrued on other than borrowings, liabilities related to claim etc.
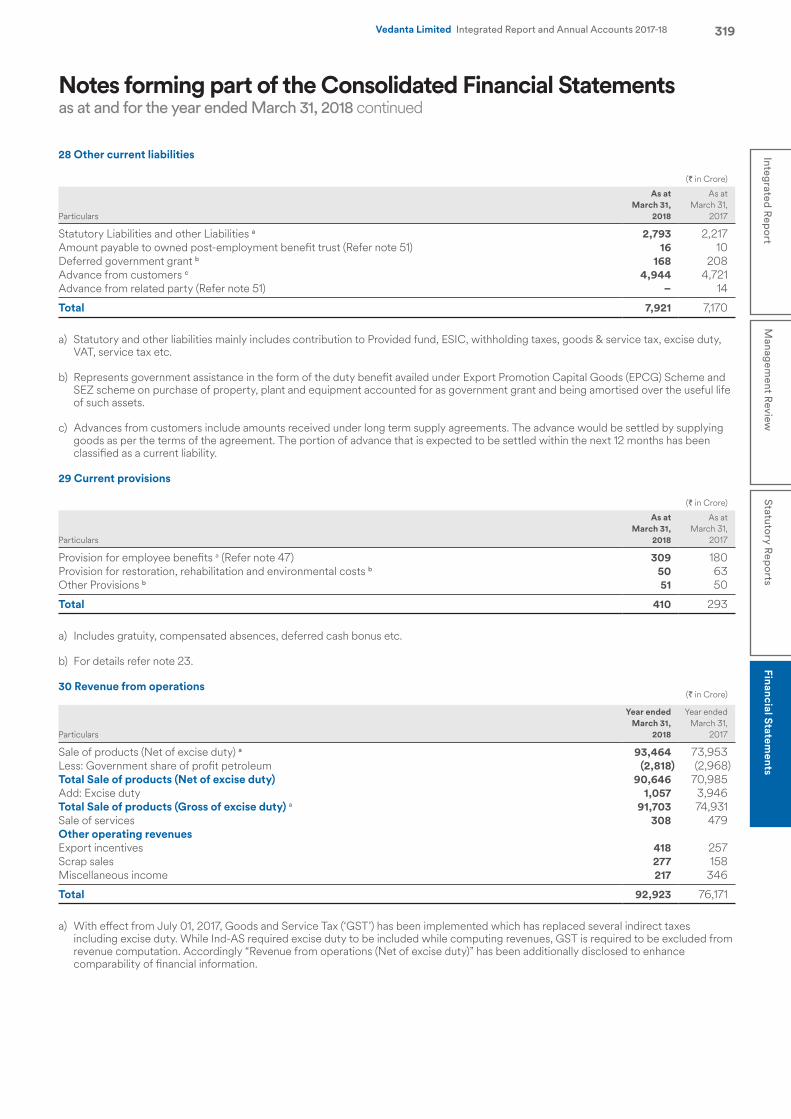
Notes forming part of the Consolidated Financial Statementsas at and for the year ended March 31, 2018 continued
319Integrated R
eport
Managem
ent Review
Statutory R
eports
Financial Statements
Vedanta Limited Integrated Report and Annual Accounts 2017-18
28 Other current liabilities
(` in Crore)
Particulars
As at March 31,
2018
As at March 31,
2017
Statutory Liabilities and other Liabilities a 2,793 2,217 Amount payable to owned post-employment benefit trust (Refer note 51) 16 10 Deferred government grant b 168 208 Advance from customers c 4,944 4,721 Advance from related party (Refer note 51) – 14
Total 7,921 7,170
a) Statutory and other liabilities mainly includes contribution to Provided fund, ESIC, withholding taxes, goods & service tax, excise duty, VAT, service tax etc.
b) Represents government assistance in the form of the duty benefit availed under Export Promotion Capital Goods (EPCG) Scheme and SEZ scheme on purchase of property, plant and equipment accounted for as government grant and being amortised over the useful life of such assets.
c) Advances from customers include amounts received under long term supply agreements. The advance would be settled by supplying goods as per the terms of the agreement. The portion of advance that is expected to be settled within the next 12 months has been classified as a current liability.
29 Current provisions
(` in Crore)
Particulars
As at March 31,
2018
As at March 31,
2017
Provision for employee benefits a (Refer note 47) 309 180 Provision for restoration, rehabilitation and environmental costs b 50 63 Other Provisions b 51 50
Total 410 293
a) Includes gratuity, compensated absences, deferred cash bonus etc.
b) For details refer note 23.
30 Revenue from operations(` in Crore)
Particulars
Year ended March 31,
2018
Year ended March 31,
2017
Sale of products (Net of excise duty) a 93,464 73,953 Less: Government share of profit petroleum (2,818) (2,968)Total Sale of products (Net of excise duty) 90,646 70,985 Add: Excise duty 1,057 3,946 Total Sale of products (Gross of excise duty) a 91,703 74,931 Sale of services 308 479 Other operating revenuesExport incentives 418 257 Scrap sales 277 158 Miscellaneous income 217 346
Total 92,923 76,171
a) With effect from July 01, 2017, Goods and Service Tax (‘GST’) has been implemented which has replaced several indirect taxes including excise duty. While Ind-AS required excise duty to be included while computing revenues, GST is required to be excluded from revenue computation. Accordingly “Revenue from operations (Net of excise duty)” has been additionally disclosed to enhance comparability of financial information.
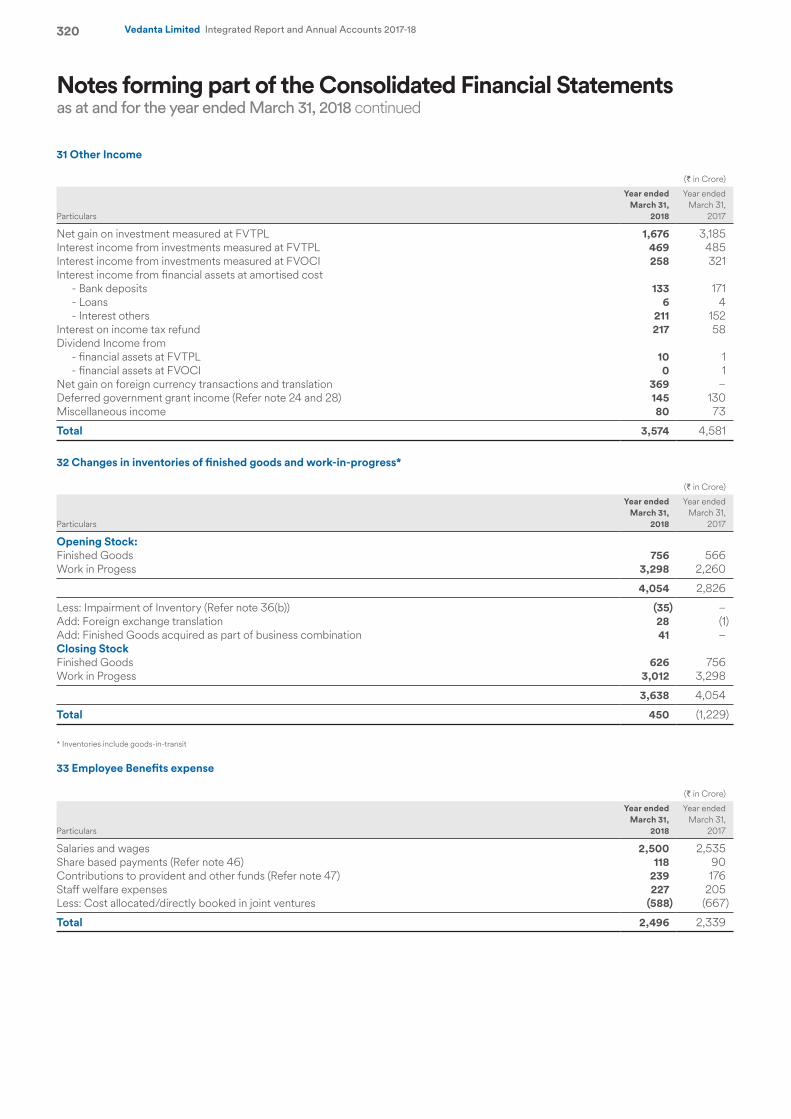
Notes forming part of the Consolidated Financial Statementsas at and for the year ended March 31, 2018 continued
320 Vedanta Limited Integrated Report and Annual Accounts 2017-18
31 Other Income
(` in Crore)
Particulars
Year ended March 31,
2018
Year ended March 31,
2017
Net gain on investment measured at FVTPL 1,676 3,185 Interest income from investments measured at FVTPL 469 485 Interest income from investments measured at FVOCI 258 321 Interest income from financial assets at amortised cost
- Bank deposits 133 171 - Loans 6 4 - Interest others 211 152
Interest on income tax refund 217 58 Dividend Income from
- financial assets at FVTPL 10 1 - financial assets at FVOCI 0 1
Net gain on foreign currency transactions and translation 369 – Deferred government grant income (Refer note 24 and 28) 145 130 Miscellaneous income 80 73
Total 3,574 4,581
32 Changes in inventories of finished goods and work-in-progress*
(` in Crore)
Particulars
Year ended March 31,
2018
Year ended March 31,
2017
Opening Stock:Finished Goods 756 566 Work in Progess 3,298 2,260
4,054 2,826
Less: Impairment of Inventory (Refer note 36(b)) (35) – Add: Foreign exchange translation 28 (1)Add: Finished Goods acquired as part of business combination 41 – Closing StockFinished Goods 626 756 Work in Progess 3,012 3,298
3,638 4,054
Total 450 (1,229)
* Inventories include goods-in-transit
33 Employee Benefits expense
(` in Crore)
Particulars
Year ended March 31,
2018
Year ended March 31,
2017
Salaries and wages 2,500 2,535 Share based payments (Refer note 46) 118 90 Contributions to provident and other funds (Refer note 47) 239 176Staff welfare expenses 227 205 Less: Cost allocated/directly booked in joint ventures (588) (667)
Total 2,496 2,339
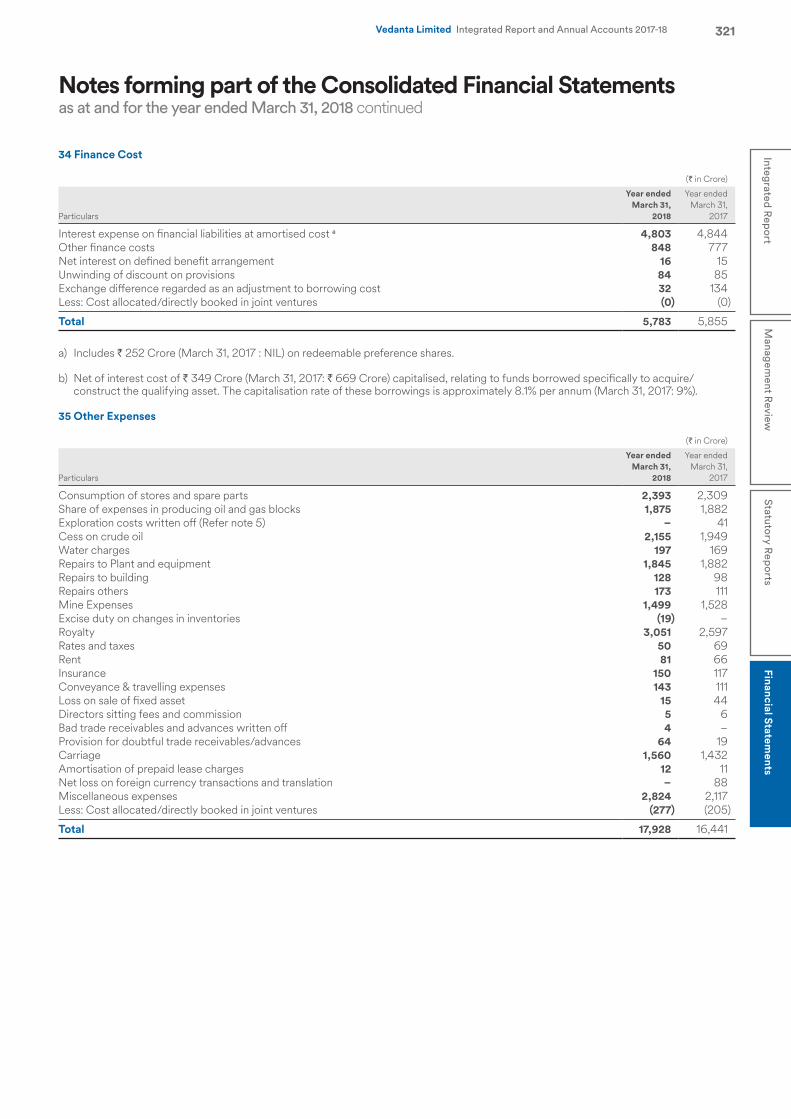
Notes forming part of the Consolidated Financial Statementsas at and for the year ended March 31, 2018 continued
321Integrated R
eport
Managem
ent Review
Statutory R
eports
Financial Statements
Vedanta Limited Integrated Report and Annual Accounts 2017-18
34 Finance Cost
(` in Crore)
Particulars
Year ended March 31,
2018
Year ended March 31,
2017
Interest expense on financial liabilities at amortised cost a 4,803 4,844 Other finance costs 848 777 Net interest on defined benefit arrangement 16 15 Unwinding of discount on provisions 84 85 Exchange difference regarded as an adjustment to borrowing cost 32 134 Less: Cost allocated/directly booked in joint ventures (0) (0)
Total 5,783 5,855
a) Includes ` 252 Crore (March 31, 2017 : NIL) on redeemable preference shares.
b) Net of interest cost of ` 349 Crore (March 31, 2017: ` 669 Crore) capitalised, relating to funds borrowed specifically to acquire/construct the qualifying asset. The capitalisation rate of these borrowings is approximately 8.1% per annum (March 31, 2017: 9%).
35 Other Expenses
(` in Crore)
Particulars
Year ended March 31,
2018
Year ended March 31,
2017
Consumption of stores and spare parts 2,393 2,309 Share of expenses in producing oil and gas blocks 1,875 1,882 Exploration costs written off (Refer note 5) – 41 Cess on crude oil 2,155 1,949 Water charges 197 169 Repairs to Plant and equipment 1,845 1,882 Repairs to building 128 98 Repairs others 173 111 Mine Expenses 1,499 1,528 Excise duty on changes in inventories (19) – Royalty 3,051 2,597 Rates and taxes 50 69 Rent 81 66 Insurance 150 117 Conveyance & travelling expenses 143 111 Loss on sale of fixed asset 15 44 Directors sitting fees and commission 5 6 Bad trade receivables and advances written off 4 – Provision for doubtful trade receivables/advances 64 19 Carriage 1,560 1,432 Amortisation of prepaid lease charges 12 11 Net loss on foreign currency transactions and translation – 88 Miscellaneous expenses 2,824 2,117 Less: Cost allocated/directly booked in joint ventures (277) (205)
Total 17,928 16,441
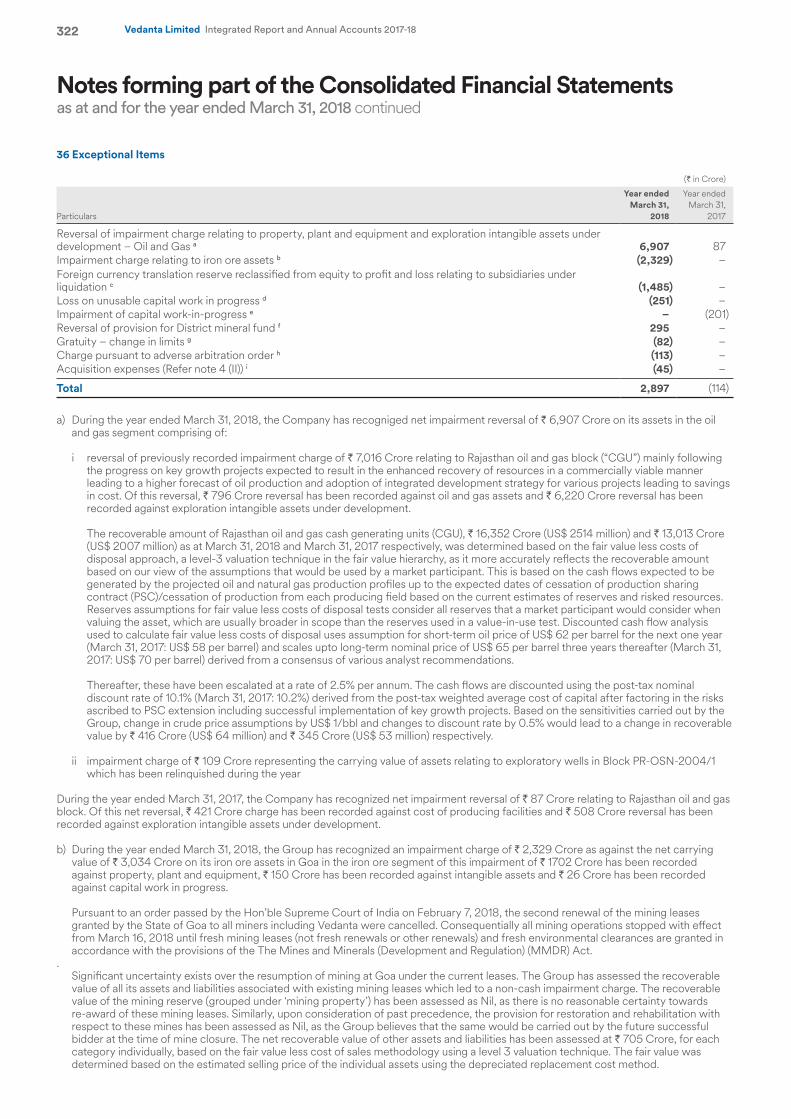
Notes forming part of the Consolidated Financial Statementsas at and for the year ended March 31, 2018 continued
322 Vedanta Limited Integrated Report and Annual Accounts 2017-18
36 Exceptional Items
(` in Crore)
Particulars
Year ended March 31,
2018
Year ended March 31,
2017
Reversal of impairment charge relating to property, plant and equipment and exploration intangible assets under development – Oil and Gas a 6,907 87 Impairment charge relating to iron ore assets b (2,329) – Foreign currency translation reserve reclassified from equity to profit and loss relating to subsidiaries under liquidation c (1,485) – Loss on unusable capital work in progress d (251) – Impairment of capital work-in-progress e – (201)Reversal of provision for District mineral fund f 295 – Gratuity – change in limits g (82) – Charge pursuant to adverse arbitration order h (113) – Acquisition expenses (Refer note 4 (II)) i (45) –
Total 2,897 (114)
a) During the year ended March 31, 2018, the Company has recogniged net impairment reversal of ` 6,907 Crore on its assets in the oil and gas segment comprising of:
i reversal of previously recorded impairment charge of ` 7,016 Crore relating to Rajasthan oil and gas block (“CGU”) mainly following the progress on key growth projects expected to result in the enhanced recovery of resources in a commercially viable manner leading to a higher forecast of oil production and adoption of integrated development strategy for various projects leading to savings in cost. Of this reversal, ` 796 Crore reversal has been recorded against oil and gas assets and ` 6,220 Crore reversal has been recorded against exploration intangible assets under development.
The recoverable amount of Rajasthan oil and gas cash generating units (CGU), ` 16,352 Crore (US$ 2514 million) and ` 13,013 Crore (US$ 2007 million) as at March 31, 2018 and March 31, 2017 respectively, was determined based on the fair value less costs of disposal approach, a level-3 valuation technique in the fair value hierarchy, as it more accurately reflects the recoverable amount based on our view of the assumptions that would be used by a market participant. This is based on the cash flows expected to be generated by the projected oil and natural gas production profiles up to the expected dates of cessation of production sharing contract (PSC)/cessation of production from each producing field based on the current estimates of reserves and risked resources. Reserves assumptions for fair value less costs of disposal tests consider all reserves that a market participant would consider when valuing the asset, which are usually broader in scope than the reserves used in a value-in-use test. Discounted cash flow analysis used to calculate fair value less costs of disposal uses assumption for short-term oil price of US$ 62 per barrel for the next one year (March 31, 2017: US$ 58 per barrel) and scales upto long-term nominal price of US$ 65 per barrel three years thereafter (March 31, 2017: US$ 70 per barrel) derived from a consensus of various analyst recommendations.
Thereafter, these have been escalated at a rate of 2.5% per annum. The cash flows are discounted using the post-tax nominal discount rate of 10.1% (March 31, 2017: 10.2%) derived from the post-tax weighted average cost of capital after factoring in the risks ascribed to PSC extension including successful implementation of key growth projects. Based on the sensitivities carried out by the Group, change in crude price assumptions by US$ 1/bbl and changes to discount rate by 0.5% would lead to a change in recoverable value by ` 416 Crore (US$ 64 million) and ` 345 Crore (US$ 53 million) respectively.
ii impairment charge of ` 109 Crore representing the carrying value of assets relating to exploratory wells in Block PR-OSN-2004/1 which has been relinquished during the year
During the year ended March 31, 2017, the Company has recognized net impairment reversal of ` 87 Crore relating to Rajasthan oil and gas block. Of this net reversal, ` 421 Crore charge has been recorded against cost of producing facilities and ` 508 Crore reversal has been recorded against exploration intangible assets under development.
b) During the year ended March 31, 2018, the Group has recognized an impairment charge of ` 2,329 Crore as against the net carrying
value of ` 3,034 Crore on its iron ore assets in Goa in the iron ore segment of this impairment of ` 1702 Crore has been recorded against property, plant and equipment, ` 150 Crore has been recorded against intangible assets and ` 26 Crore has been recorded against capital work in progress.
Pursuant to an order passed by the Hon’ble Supreme Court of India on February 7, 2018, the second renewal of the mining leases granted by the State of Goa to all miners including Vedanta were cancelled. Consequentially all mining operations stopped with effect from March 16, 2018 until fresh mining leases (not fresh renewals or other renewals) and fresh environmental clearances are granted in accordance with the provisions of the The Mines and Minerals (Development and Regulation) (MMDR) Act.
. Significant uncertainty exists over the resumption of mining at Goa under the current leases. The Group has assessed the recoverable
value of all its assets and liabilities associated with existing mining leases which led to a non-cash impairment charge. The recoverable value of the mining reserve (grouped under ‘mining property’) has been assessed as Nil, as there is no reasonable certainty towards re-award of these mining leases. Similarly, upon consideration of past precedence, the provision for restoration and rehabilitation with respect to these mines has been assessed as Nil, as the Group believes that the same would be carried out by the future successful bidder at the time of mine closure. The net recoverable value of other assets and liabilities has been assessed at ` 705 Crore, for each category individually, based on the fair value less cost of sales methodology using a level 3 valuation technique. The fair value was determined based on the estimated selling price of the individual assets using the depreciated replacement cost method.
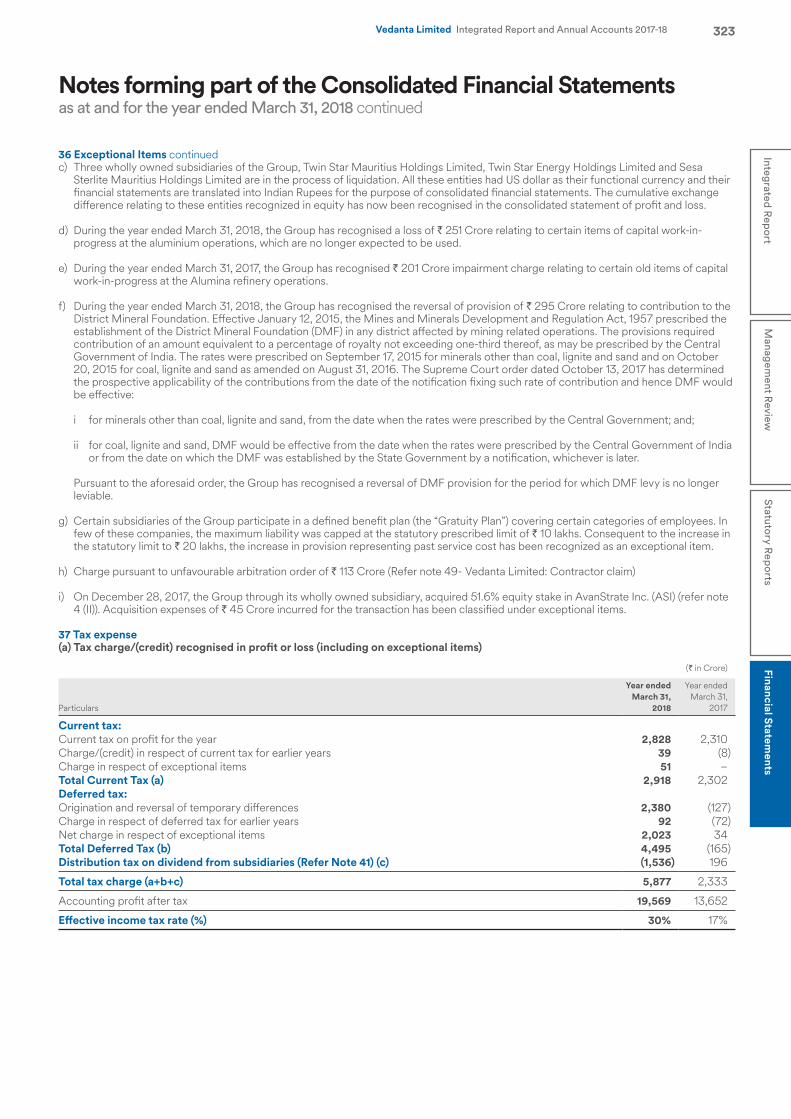
Notes forming part of the Consolidated Financial Statementsas at and for the year ended March 31, 2018 continued
323Integrated R
eport
Managem
ent Review
Statutory R
eports
Financial Statements
Vedanta Limited Integrated Report and Annual Accounts 2017-18
36 Exceptional Items continuedc) Three wholly owned subsidiaries of the Group, Twin Star Mauritius Holdings Limited, Twin Star Energy Holdings Limited and Sesa
Sterlite Mauritius Holdings Limited are in the process of liquidation. All these entities had US dollar as their functional currency and their financial statements are translated into Indian Rupees for the purpose of consolidated financial statements. The cumulative exchange difference relating to these entities recognized in equity has now been recognised in the consolidated statement of profit and loss.
d) During the year ended March 31, 2018, the Group has recognised a loss of ` 251 Crore relating to certain items of capital work-in-progress at the aluminium operations, which are no longer expected to be used.
e) During the year ended March 31, 2017, the Group has recognised ` 201 Crore impairment charge relating to certain old items of capital work-in-progress at the Alumina refinery operations.
f) During the year ended March 31, 2018, the Group has recognised the reversal of provision of ` 295 Crore relating to contribution to the District Mineral Foundation. Effective January 12, 2015, the Mines and Minerals Development and Regulation Act, 1957 prescribed the establishment of the District Mineral Foundation (DMF) in any district affected by mining related operations. The provisions required contribution of an amount equivalent to a percentage of royalty not exceeding one-third thereof, as may be prescribed by the Central Government of India. The rates were prescribed on September 17, 2015 for minerals other than coal, lignite and sand and on October 20, 2015 for coal, lignite and sand as amended on August 31, 2016. The Supreme Court order dated October 13, 2017 has determined the prospective applicability of the contributions from the date of the notification fixing such rate of contribution and hence DMF would be effective:
i for minerals other than coal, lignite and sand, from the date when the rates were prescribed by the Central Government; and;
ii for coal, lignite and sand, DMF would be effective from the date when the rates were prescribed by the Central Government of India or from the date on which the DMF was established by the State Government by a notification, whichever is later.
Pursuant to the aforesaid order, the Group has recognised a reversal of DMF provision for the period for which DMF levy is no longer leviable.
g) Certain subsidiaries of the Group participate in a defined benefit plan (the “Gratuity Plan”) covering certain categories of employees. In few of these companies, the maximum liability was capped at the statutory prescribed limit of ` 10 lakhs. Consequent to the increase in the statutory limit to ` 20 lakhs, the increase in provision representing past service cost has been recognized as an exceptional item.
h) Charge pursuant to unfavourable arbitration order of ` 113 Crore (Refer note 49- Vedanta Limited: Contractor claim)
i) On December 28, 2017, the Group through its wholly owned subsidiary, acquired 51.6% equity stake in AvanStrate Inc. (ASI) (refer note 4 (II)). Acquisition expenses of ` 45 Crore incurred for the transaction has been classified under exceptional items.
37 Tax expense(a) Tax charge/(credit) recognised in profit or loss (including on exceptional items)
(` in Crore)
Particulars
Year ended March 31,
2018
Year ended March 31,
2017
Current tax:Current tax on profit for the year 2,828 2,310 Charge/(credit) in respect of current tax for earlier years 39 (8)Charge in respect of exceptional items 51 – Total Current Tax (a) 2,918 2,302 Deferred tax:Origination and reversal of temporary differences 2,380 (127)Charge in respect of deferred tax for earlier years 92 (72)Net charge in respect of exceptional items 2,023 34 Total Deferred Tax (b) 4,495 (165)Distribution tax on dividend from subsidiaries (Refer Note 41) (c) (1,536) 196
Total tax charge (a+b+c) 5,877 2,333
Accounting profit after tax 19,569 13,652
Effective income tax rate (%) 30% 17%
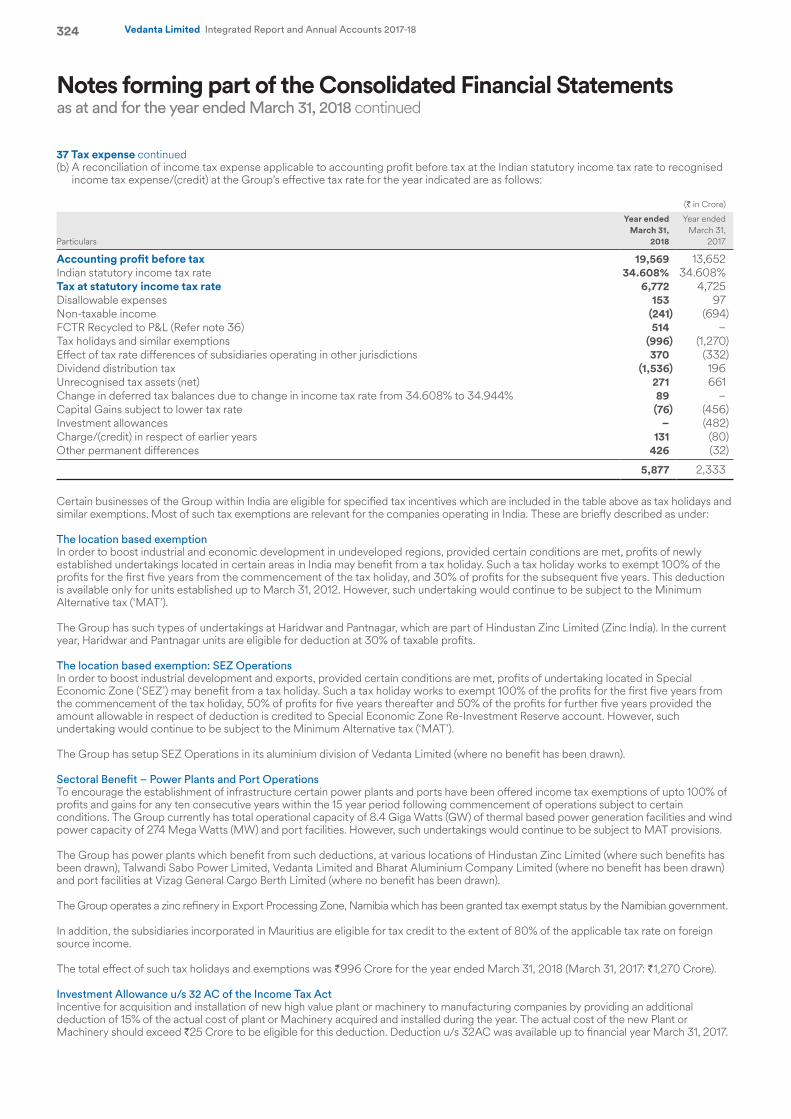
Notes forming part of the Consolidated Financial Statementsas at and for the year ended March 31, 2018 continued
324 Vedanta Limited Integrated Report and Annual Accounts 2017-18
37 Tax expense continued(b) A reconciliation of income tax expense applicable to accounting profit before tax at the Indian statutory income tax rate to recognised
income tax expense/(credit) at the Group’s effective tax rate for the year indicated are as follows:
(` in Crore)
Particulars
Year ended March 31,
2018
Year ended March 31,
2017
Accounting profit before tax 19,569 13,652 Indian statutory income tax rate 34.608% 34.608%Tax at statutory income tax rate 6,772 4,725 Disallowable expenses 153 97 Non-taxable income (241) (694)FCTR Recycled to P&L (Refer note 36) 514 – Tax holidays and similar exemptions (996) (1,270)Effect of tax rate differences of subsidiaries operating in other jurisdictions 370 (332)Dividend distribution tax (1,536) 196 Unrecognised tax assets (net) 271 661 Change in deferred tax balances due to change in income tax rate from 34.608% to 34.944% 89 – Capital Gains subject to lower tax rate (76) (456)Investment allowances – (482)Charge/(credit) in respect of earlier years 131 (80)Other permanent differences 426 (32)
5,877 2,333
Certain businesses of the Group within India are eligible for specified tax incentives which are included in the table above as tax holidays and similar exemptions. Most of such tax exemptions are relevant for the companies operating in India. These are briefly described as under:
The location based exemptionIn order to boost industrial and economic development in undeveloped regions, provided certain conditions are met, profits of newly established undertakings located in certain areas in India may benefit from a tax holiday. Such a tax holiday works to exempt 100% of the profits for the first five years from the commencement of the tax holiday, and 30% of profits for the subsequent five years. This deduction is available only for units established up to March 31, 2012. However, such undertaking would continue to be subject to the Minimum Alternative tax (‘MAT’).
The Group has such types of undertakings at Haridwar and Pantnagar, which are part of Hindustan Zinc Limited (Zinc India). In the current year, Haridwar and Pantnagar units are eligible for deduction at 30% of taxable profits.
The location based exemption: SEZ OperationsIn order to boost industrial development and exports, provided certain conditions are met, profits of undertaking located in Special Economic Zone (‘SEZ’) may benefit from a tax holiday. Such a tax holiday works to exempt 100% of the profits for the first five years from the commencement of the tax holiday, 50% of profits for five years thereafter and 50% of the profits for further five years provided the amount allowable in respect of deduction is credited to Special Economic Zone Re-Investment Reserve account. However, such undertaking would continue to be subject to the Minimum Alternative tax (‘MAT’).
The Group has setup SEZ Operations in its aluminium division of Vedanta Limited (where no benefit has been drawn).
Sectoral Benefit – Power Plants and Port OperationsTo encourage the establishment of infrastructure certain power plants and ports have been offered income tax exemptions of upto 100% of profits and gains for any ten consecutive years within the 15 year period following commencement of operations subject to certain conditions. The Group currently has total operational capacity of 8.4 Giga Watts (GW) of thermal based power generation facilities and wind power capacity of 274 Mega Watts (MW) and port facilities. However, such undertakings would continue to be subject to MAT provisions.
The Group has power plants which benefit from such deductions, at various locations of Hindustan Zinc Limited (where such benefits has been drawn), Talwandi Sabo Power Limited, Vedanta Limited and Bharat Aluminium Company Limited (where no benefit has been drawn) and port facilities at Vizag General Cargo Berth Limited (where no benefit has been drawn).
The Group operates a zinc refinery in Export Processing Zone, Namibia which has been granted tax exempt status by the Namibian government.
In addition, the subsidiaries incorporated in Mauritius are eligible for tax credit to the extent of 80% of the applicable tax rate on foreign source income.
The total effect of such tax holidays and exemptions was `996 Crore for the year ended March 31, 2018 (March 31, 2017: `1,270 Crore).
Investment Allowance u/s 32 AC of the Income Tax ActIncentive for acquisition and installation of new high value plant or machinery to manufacturing companies by providing an additional deduction of 15% of the actual cost of plant or Machinery acquired and installed during the year. The actual cost of the new Plant or Machinery should exceed `25 Crore to be eligible for this deduction. Deduction u/s 32AC was available up to financial year March 31, 2017.
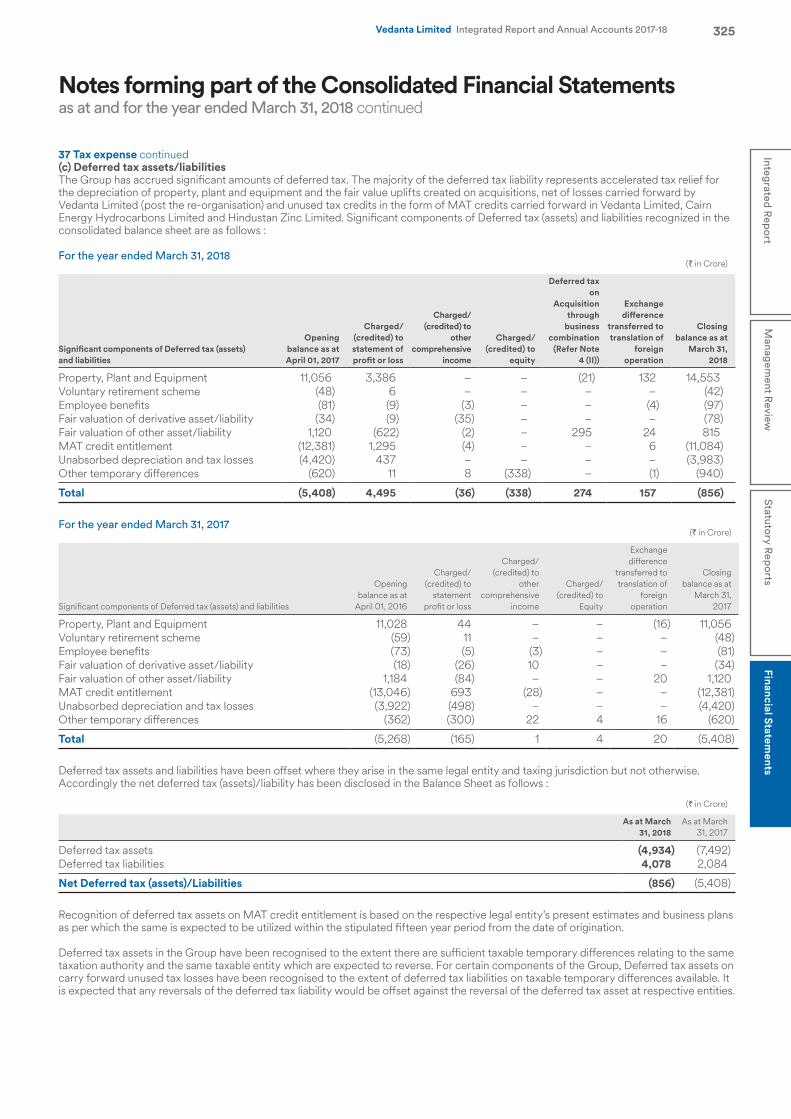
Notes forming part of the Consolidated Financial Statementsas at and for the year ended March 31, 2018 continued
325Integrated R
eport
Managem
ent Review
Statutory R
eports
Financial Statements
Vedanta Limited Integrated Report and Annual Accounts 2017-18
37 Tax expense continued(c) Deferred tax assets/liabilitiesThe Group has accrued significant amounts of deferred tax. The majority of the deferred tax liability represents accelerated tax relief for the depreciation of property, plant and equipment and the fair value uplifts created on acquisitions, net of losses carried forward by Vedanta Limited (post the re-organisation) and unused tax credits in the form of MAT credits carried forward in Vedanta Limited, Cairn Energy Hydrocarbons Limited and Hindustan Zinc Limited. Significant components of Deferred tax (assets) and liabilities recognized in the consolidated balance sheet are as follows :
For the year ended March 31, 2018(` in Crore)
Significant components of Deferred tax (assets) and liabilities
Opening balance as at April 01, 2017
Charged/(credited) to statement of profit or loss
Charged/(credited) to
other comprehensive
income
Charged/(credited) to
equity
Deferred tax on
Acquisition through
business combination
(Refer Note 4 (II))
Exchange difference
transferred to translation of
foreign operation
Closing balance as at
March 31, 2018
Property, Plant and Equipment 11,056 3,386 – – (21) 132 14,553 Voluntary retirement scheme (48) 6 – – – – (42)Employee benefits (81) (9) (3) – – (4) (97)Fair valuation of derivative asset/liability (34) (9) (35) – – – (78)Fair valuation of other asset/liability 1,120 (622) (2) – 295 24 815 MAT credit entitlement (12,381) 1,295 (4) – – 6 (11,084)Unabsorbed depreciation and tax losses (4,420) 437 – – – – (3,983)Other temporary differences (620) 11 8 (338) – (1) (940)
Total (5,408) 4,495 (36) (338) 274 157 (856)
For the year ended March 31, 2017 (` in Crore)
Significant components of Deferred tax (assets) and liabilities
Opening balance as at
April 01, 2016
Charged/(credited) to
statement profit or loss
Charged/(credited) to
other comprehensive
income
Charged/(credited) to
Equity
Exchange difference
transferred to translation of
foreign operation
Closing balance as at
March 31, 2017
Property, Plant and Equipment 11,028 44 – – (16) 11,056 Voluntary retirement scheme (59) 11 – – – (48)Employee benefits (73) (5) (3) – – (81)Fair valuation of derivative asset/liability (18) (26) 10 – – (34)Fair valuation of other asset/liability 1,184 (84) – – 20 1,120 MAT credit entitlement (13,046) 693 (28) – – (12,381)Unabsorbed depreciation and tax losses (3,922) (498) – – – (4,420)Other temporary differences (362) (300) 22 4 16 (620)
Total (5,268) (165) 1 4 20 (5,408)
Deferred tax assets and liabilities have been offset where they arise in the same legal entity and taxing jurisdiction but not otherwise. Accordingly the net deferred tax (assets)/liability has been disclosed in the Balance Sheet as follows :
(` in Crore)
As at March 31, 2018
As at March 31, 2017
Deferred tax assets (4,934) (7,492)Deferred tax liabilities 4,078 2,084
Net Deferred tax (assets)/Liabilities (856) (5,408)
Recognition of deferred tax assets on MAT credit entitlement is based on the respective legal entity’s present estimates and business plans as per which the same is expected to be utilized within the stipulated fifteen year period from the date of origination.
Deferred tax assets in the Group have been recognised to the extent there are sufficient taxable temporary differences relating to the same taxation authority and the same taxable entity which are expected to reverse. For certain components of the Group, Deferred tax assets on carry forward unused tax losses have been recognised to the extent of deferred tax liabilities on taxable temporary differences available. It is expected that any reversals of the deferred tax liability would be offset against the reversal of the deferred tax asset at respective entities.
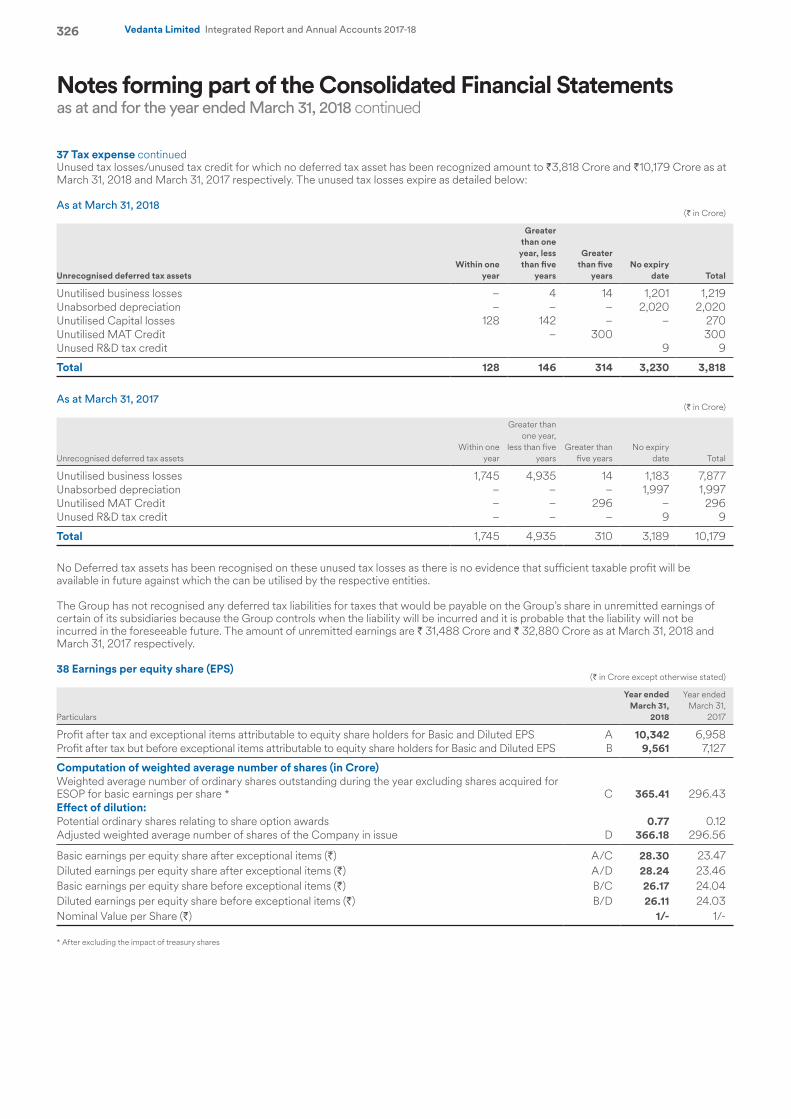
Notes forming part of the Consolidated Financial Statementsas at and for the year ended March 31, 2018 continued
326 Vedanta Limited Integrated Report and Annual Accounts 2017-18
37 Tax expense continuedUnused tax losses/unused tax credit for which no deferred tax asset has been recognized amount to `3,818 Crore and `10,179 Crore as at March 31, 2018 and March 31, 2017 respectively. The unused tax losses expire as detailed below:
As at March 31, 2018(` in Crore)
Unrecognised deferred tax assetsWithin one
year
Greater than one
year, less than five
years
Greater than five
yearsNo expiry
date Total
Unutilised business losses – 4 14 1,201 1,219 Unabsorbed depreciation – – – 2,020 2,020Unutilised Capital losses 128 142 – – 270 Unutilised MAT Credit – 300 300 Unused R&D tax credit 9 9
Total 128 146 314 3,230 3,818
As at March 31, 2017(` in Crore)
Unrecognised deferred tax assetsWithin one
year
Greater than one year,
less than five years
Greater than five years
No expiry date Total
Unutilised business losses 1,745 4,935 14 1,183 7,877 Unabsorbed depreciation – – – 1,997 1,997 Unutilised MAT Credit – – 296 – 296 Unused R&D tax credit – – – 9 9
Total 1,745 4,935 310 3,189 10,179
No Deferred tax assets has been recognised on these unused tax losses as there is no evidence that sufficient taxable profit will be available in future against which the can be utilised by the respective entities.
The Group has not recognised any deferred tax liabilities for taxes that would be payable on the Group’s share in unremitted earnings of certain of its subsidiaries because the Group controls when the liability will be incurred and it is probable that the liability will not be incurred in the foreseeable future. The amount of unremitted earnings are ` 31,488 Crore and ` 32,880 Crore as at March 31, 2018 and March 31, 2017 respectively.
38 Earnings per equity share (EPS)(` in Crore except otherwise stated)
Particulars
Year ended March 31,
2018
Year ended March 31,
2017
Profit after tax and exceptional items attributable to equity share holders for Basic and Diluted EPS A 10,342 6,958 Profit after tax but before exceptional items attributable to equity share holders for Basic and Diluted EPS B 9,561 7,127
Computation of weighted average number of shares (in Crore)Weighted average number of ordinary shares outstanding during the year excluding shares acquired for ESOP for basic earnings per share * C 365.41 296.43 Effect of dilution:Potential ordinary shares relating to share option awards 0.77 0.12Adjusted weighted average number of shares of the Company in issue D 366.18 296.56
Basic earnings per equity share after exceptional items (`) A/C 28.30 23.47 Diluted earnings per equity share after exceptional items (`) A/D 28.24 23.46 Basic earnings per equity share before exceptional items (`) B/C 26.17 24.04 Diluted earnings per equity share before exceptional items (`) B/D 26.11 24.03 Nominal Value per Share (`) 1/- 1/-
* After excluding the impact of treasury shares
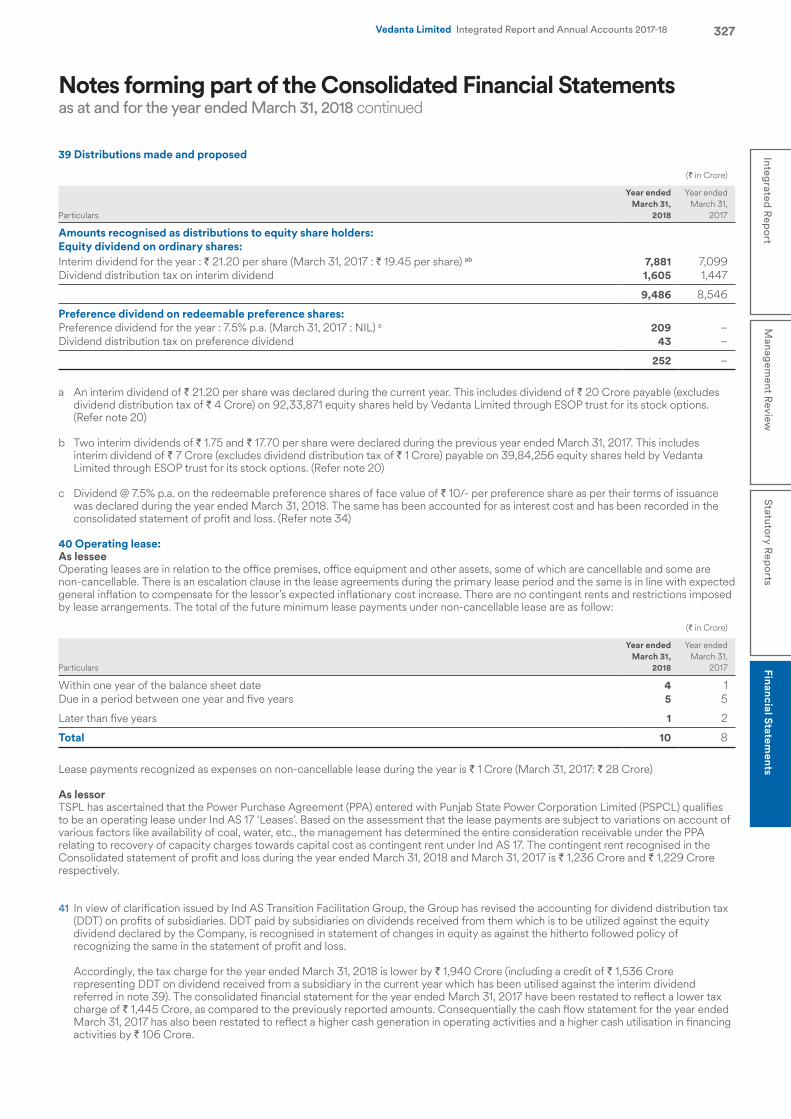
Notes forming part of the Consolidated Financial Statementsas at and for the year ended March 31, 2018 continued
327Integrated R
eport
Managem
ent Review
Statutory R
eports
Financial Statements
Vedanta Limited Integrated Report and Annual Accounts 2017-18
39 Distributions made and proposed
(` in Crore)
Particulars
Year ended March 31,
2018
Year ended March 31,
2017
Amounts recognised as distributions to equity share holders:Equity dividend on ordinary shares:Interim dividend for the year : ` 21.20 per share (March 31, 2017 : ` 19.45 per share) ab 7,881 7,099 Dividend distribution tax on interim dividend 1,605 1,447
9,486 8,546
Preference dividend on redeemable preference shares:Preference dividend for the year : 7.5% p.a. (March 31, 2017 : NIL) c 209 – Dividend distribution tax on preference dividend 43 –
252 –
a An interim dividend of ` 21.20 per share was declared during the current year. This includes dividend of ` 20 Crore payable (excludes dividend distribution tax of ` 4 Crore) on 92,33,871 equity shares held by Vedanta Limited through ESOP trust for its stock options. (Refer note 20)
b Two interim dividends of ` 1.75 and ` 17.70 per share were declared during the previous year ended March 31, 2017. This includes interim dividend of ` 7 Crore (excludes dividend distribution tax of ` 1 Crore) payable on 39,84,256 equity shares held by Vedanta Limited through ESOP trust for its stock options. (Refer note 20)
c Dividend @ 7.5% p.a. on the redeemable preference shares of face value of ` 10/- per preference share as per their terms of issuance was declared during the year ended March 31, 2018. The same has been accounted for as interest cost and has been recorded in the consolidated statement of profit and loss. (Refer note 34)
40 Operating lease: As lesseeOperating leases are in relation to the office premises, office equipment and other assets, some of which are cancellable and some are non-cancellable. There is an escalation clause in the lease agreements during the primary lease period and the same is in line with expected general inflation to compensate for the lessor’s expected inflationary cost increase. There are no contingent rents and restrictions imposed by lease arrangements. The total of the future minimum lease payments under non-cancellable lease are as follow:
(` in Crore)
Particulars
Year ended March 31,
2018
Year ended March 31,
2017
Within one year of the balance sheet date 4 1 Due in a period between one year and five years 5 5
Later than five years 1 2
Total 10 8
Lease payments recognized as expenses on non-cancellable lease during the year is ` 1 Crore (March 31, 2017: ` 28 Crore)
As lessorTSPL has ascertained that the Power Purchase Agreement (PPA) entered with Punjab State Power Corporation Limited (PSPCL) qualifies to be an operating lease under Ind AS 17 ‘Leases’. Based on the assessment that the lease payments are subject to variations on account of various factors like availability of coal, water, etc., the management has determined the entire consideration receivable under the PPA relating to recovery of capacity charges towards capital cost as contingent rent under Ind AS 17. The contingent rent recognised in the Consolidated statement of profit and loss during the year ended March 31, 2018 and March 31, 2017 is ` 1,236 Crore and ` 1,229 Crore respectively.
41 In view of clarification issued by Ind AS Transition Facilitation Group, the Group has revised the accounting for dividend distribution tax (DDT) on profits of subsidiaries. DDT paid by subsidiaries on dividends received from them which is to be utilized against the equity dividend declared by the Company, is recognised in statement of changes in equity as against the hitherto followed policy of recognizing the same in the statement of profit and loss. Accordingly, the tax charge for the year ended March 31, 2018 is lower by ` 1,940 Crore (including a credit of ` 1,536 Crore representing DDT on dividend received from a subsidiary in the current year which has been utilised against the interim dividend referred in note 39). The consolidated financial statement for the year ended March 31, 2017 have been restated to reflect a lower tax charge of ` 1,445 Crore, as compared to the previously reported amounts. Consequentially the cash flow statement for the year ended March 31, 2017 has also been restated to reflect a higher cash generation in operating activities and a higher cash utilisation in financing activities by ` 106 Crore.
Notes forming part of the Consolidated Financial Statementsas at and for the year ended March 31, 2018 continued
328 Vedanta Limited Integrated Report and Annual Accounts 2017-18
42 The Scheme of Amalgamation and Arrangement amongst Sterlite Energy Limited (‘SEL’), Sterlite Industries (India) Limited (‘Sterlite’), Vedanta Aluminium Limited (‘VAL’), Ekaterina Limited (‘Ekaterina’), Madras Aluminium Company Limited (‘Malco’) and the Company (the “Scheme”) had been sanctioned by the Honourable High Court of Madras and the Honourable High Court of Judicature of Bombay at Goa and was given effect to in the year ended March 31, 2014. Subsequently the above orders of the honourable High Court of Bombay and Madras have been challenged by Commissioner of Income Tax, Goa and Ministry of Corporate Affairs through a Special Leave Petition before the honourable Supreme Court and also by a creditor and a shareholder of the Company. The said petitions are pending for hearing and admission.
43 a) Pursuant to the Government of India’s policy of disinvestment, the Company in April 2002 acquired 26% equity interest in Hindustan Zinc Limited (HZL) from the Government of India. Under the terms of the Shareholder’s Agreement (‘SHA’),the Company had two call options to purchase all of the Government of India’s shares in HZL at fair market value. The Company exercised the first call option on August 29, 2003 and acquired an additional 18.9% of HZL’s issued share capital. The Company also acquired an additional 20% of the equity capital in HZL through an open offer, increasing its shareholding to 64.9%. The second call option provided the Company the right to acquire the Government of India’s remaining 29.5% share in HZL. This call option was subject to the right of the Government of India to sell 3.5% of HZL shares to HZL employees. The Company exercised the second call option on July 21, 2009. The Government of India disputed the validity of the call option and refused to act upon the second call option. Consequently the Company invoked arbitration which is in the early stages. The next date of hearing is scheduled for November 24, 2018.
b) Pursuant to the Government of India’s policy of divestment, the Company in March 2001 acquired 51% equity interest in BALCO from the Government of India. Under the terms of the SHA, the Company had a call option to purchase the Government of India’s remaining ownership interest in BALCO at any point from March 2, 2004. The Company exercised this option on March 19, 2004. However, the Government of India contested the valuation and validity of the option and contended that the clauses of the SHA violate the erstwhile Companies Act, 1956 by restricting the rights of the Government of India to transfer its shares and that as a result such provisions of the SHA were null and void. In the arbitration filed by the Company, the arbitral tribunal by a majority award rejected the claims of the Company on the ground that the clauses relating to the call option, the right of first refusal, the “tagalong” rights and the restriction on the transfer of shares violate the erstwhile Companies Act, 1956 and are not enforceable.
The Company has challenged the validity of the majority award before the Hon’ble High Court at Delhi and sought for setting aside the arbitration award to the extent that it holds these clauses ineffective and inoperative. The Government of India also filed an application before the High Court to partially set aside the arbitral award in respect of certain matters involving valuation. The matter is currently scheduled for hearing by the Delhi High Court on July 03, 2018.
On January 9, 2012, the Company offered to acquire the Government of India’s interests in HZL and BALCO for ` 15,492 Crore and ` 1,782 Crore respectively. This offer was separate from the contested exercise of the call options, and Company proposed to withdraw the ongoing litigations in relation to the contested exercise of the options should the offer be accepted. To date, the offer has not been accepted by the Government of India and therefore, there is no certainty that the acquisition will proceed.
In view of the lack of resolution on the options, the non-response to the exercise and valuation request from the Government of India, the resultant uncertainty surrounding the potential transaction and the valuation of the consideration payable, the Company considers the strike price of the options to be at the fair value, which is effectively nil, and hence the call options have not been recognised in the financial statements.
44 Capital managementThe Group’s objectives when managing capital is to safeguard continuity, maintain a strong credit rating and healthy capital ratios in order to support its business and provide adequate return to shareholders through continuing growth. The Group’s overall strategy remains unchanged from previous year.
The Group sets the amount of capital required on the basis of annual business and long-term operating plans which include capital and other strategic investments.
The funding requirements are met through a mixture of equity, internal fund generation, convertible debt securities, and other long term borrowings. The Group’s policy is to use short term and long-term borrowings to meet anticipated funding requirements.
The Group monitors capital on the basis of the net gearing ratio which is Net debt/Total Capital (equity + net debt) . The Group is not subject to any externally imposed capital requirements.
Net debt are non-current and current debt as reduced by cash and cash equivalents, other bank balances and current investments. Equity comprises all components including other comprehensive income.
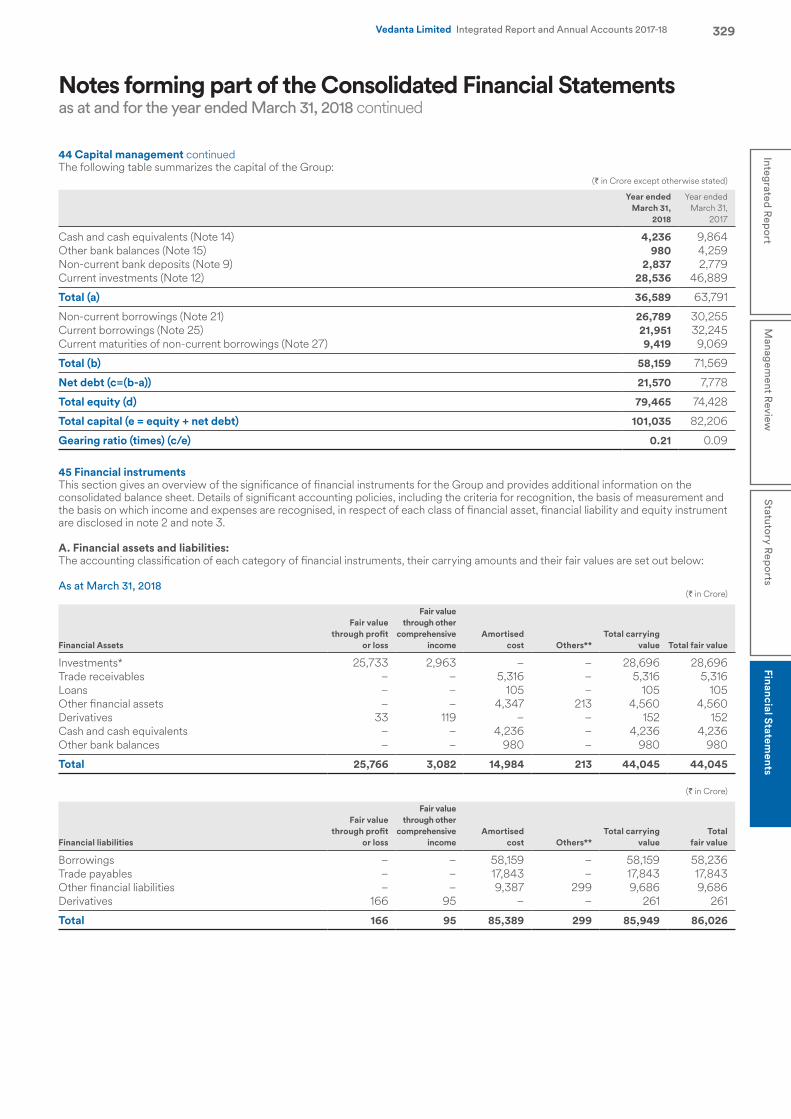
Notes forming part of the Consolidated Financial Statementsas at and for the year ended March 31, 2018 continued
329Integrated R
eport
Managem
ent Review
Statutory R
eports
Financial Statements
Vedanta Limited Integrated Report and Annual Accounts 2017-18
44 Capital management continuedThe following table summarizes the capital of the Group:
(` in Crore except otherwise stated)
Year ended March 31,
2018
Year ended March 31,
2017
Cash and cash equivalents (Note 14) 4,236 9,864 Other bank balances (Note 15) 980 4,259 Non-current bank deposits (Note 9) 2,837 2,779 Current investments (Note 12) 28,536 46,889
Total (a) 36,589 63,791
Non-current borrowings (Note 21) 26,789 30,255 Current borrowings (Note 25) 21,951 32,245 Current maturities of non-current borrowings (Note 27) 9,419 9,069
Total (b) 58,159 71,569
Net debt (c=(b-a)) 21,570 7,778
Total equity (d) 79,465 74,428
Total capital (e = equity + net debt) 101,035 82,206
Gearing ratio (times) (c/e) 0.21 0.09
45 Financial instrumentsThis section gives an overview of the significance of financial instruments for the Group and provides additional information on the consolidated balance sheet. Details of significant accounting policies, including the criteria for recognition, the basis of measurement and the basis on which income and expenses are recognised, in respect of each class of financial asset, financial liability and equity instrument are disclosed in note 2 and note 3.
A. Financial assets and liabilities:The accounting classification of each category of financial instruments, their carrying amounts and their fair values are set out below:
As at March 31, 2018(` in Crore)
Financial Assets
Fair value through profit
or loss
Fair value through other
comprehensive income
Amortised cost Others**
Total carrying value Total fair value
Investments* 25,733 2,963 – – 28,696 28,696 Trade receivables – – 5,316 – 5,316 5,316 Loans – – 105 – 105 105 Other financial assets – – 4,347 213 4,560 4,560 Derivatives 33 119 – – 152 152 Cash and cash equivalents – – 4,236 – 4,236 4,236 Other bank balances – – 980 – 980 980
Total 25,766 3,082 14,984 213 44,045 44,045
(` in Crore)
Financial liabilities
Fair value through profit
or loss
Fair value through other
comprehensive income
Amortised cost Others**
Total carrying value
Total fair value
Borrowings – – 58,159 – 58,159 58,236 Trade payables – – 17,843 – 17,843 17,843 Other financial liabilities – – 9,387 299 9,686 9,686 Derivatives 166 95 – – 261 261
Total 166 95 85,389 299 85,949 86,026
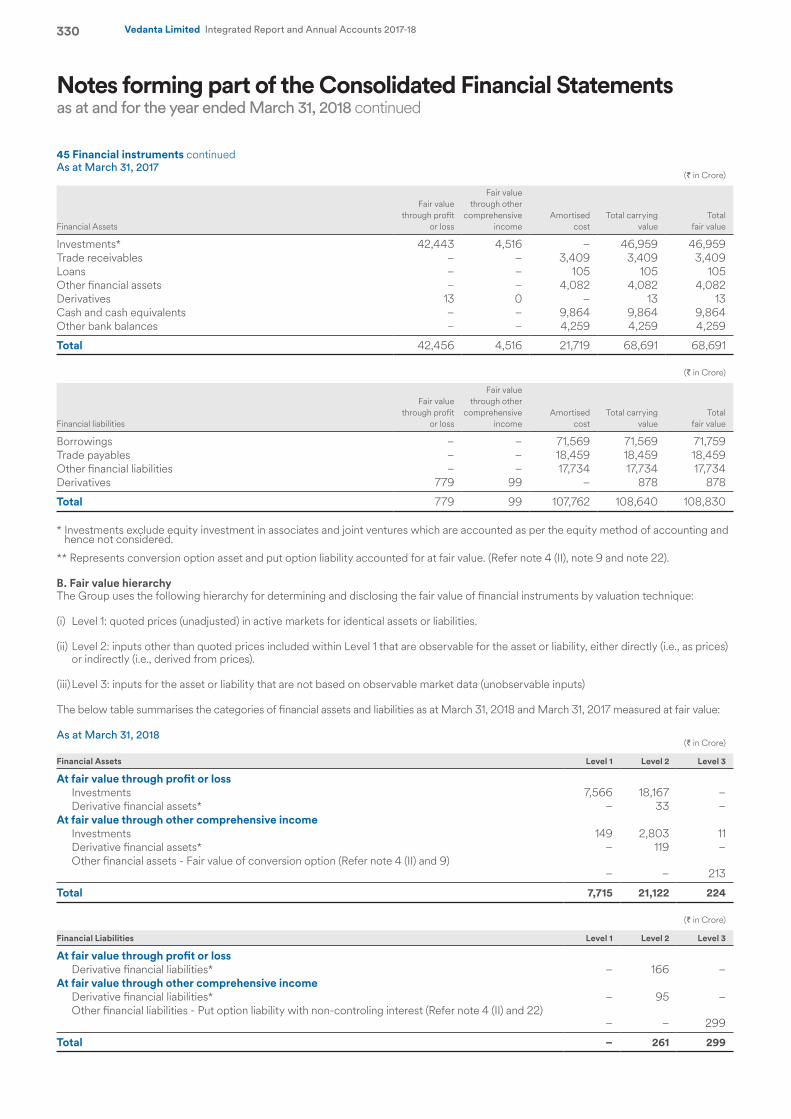
Notes forming part of the Consolidated Financial Statementsas at and for the year ended March 31, 2018 continued
330 Vedanta Limited Integrated Report and Annual Accounts 2017-18
45 Financial instruments continuedAs at March 31, 2017
(` in Crore)
Financial Assets
Fair value through profit
or loss
Fair value through other
comprehensive income
Amortised cost
Total carrying value
Total fair value
Investments* 42,443 4,516 – 46,959 46,959 Trade receivables – – 3,409 3,409 3,409 Loans – – 105 105 105 Other financial assets – – 4,082 4,082 4,082 Derivatives 13 0 – 13 13 Cash and cash equivalents – – 9,864 9,864 9,864 Other bank balances – – 4,259 4,259 4,259
Total 42,456 4,516 21,719 68,691 68,691
(` in Crore)
Financial liabilities
Fair value through profit
or loss
Fair value through other
comprehensive income
Amortised cost
Total carrying value
Total fair value
Borrowings – – 71,569 71,569 71,759 Trade payables – – 18,459 18,459 18,459 Other financial liabilities – – 17,734 17,734 17,734 Derivatives 779 99 – 878 878
Total 779 99 107,762 108,640 108,830
* Investments exclude equity investment in associates and joint ventures which are accounted as per the equity method of accounting and hence not considered.
** Represents conversion option asset and put option liability accounted for at fair value. (Refer note 4 (II), note 9 and note 22).
B. Fair value hierarchyThe Group uses the following hierarchy for determining and disclosing the fair value of financial instruments by valuation technique:
(i) Level 1: quoted prices (unadjusted) in active markets for identical assets or liabilities.
(ii) Level 2: inputs other than quoted prices included within Level 1 that are observable for the asset or liability, either directly (i.e., as prices) or indirectly (i.e., derived from prices).
(iii) Level 3: inputs for the asset or liability that are not based on observable market data (unobservable inputs)
The below table summarises the categories of financial assets and liabilities as at March 31, 2018 and March 31, 2017 measured at fair value:
As at March 31, 2018(` in Crore)
Financial Assets Level 1 Level 2 Level 3
At fair value through profit or lossInvestments 7,566 18,167 – Derivative financial assets* – 33 –
At fair value through other comprehensive incomeInvestments 149 2,803 11 Derivative financial assets* – 119 – Other financial assets - Fair value of conversion option (Refer note 4 (II) and 9)
– – 213
Total 7,715 21,122 224
(` in Crore)
Financial Liabilities Level 1 Level 2 Level 3
At fair value through profit or lossDerivative financial liabilities* – 166 –
At fair value through other comprehensive incomeDerivative financial liabilities* – 95 – Other financial liabilities - Put option liability with non-controling interest (Refer note 4 (II) and 22)
– – 299
Total – 261 299
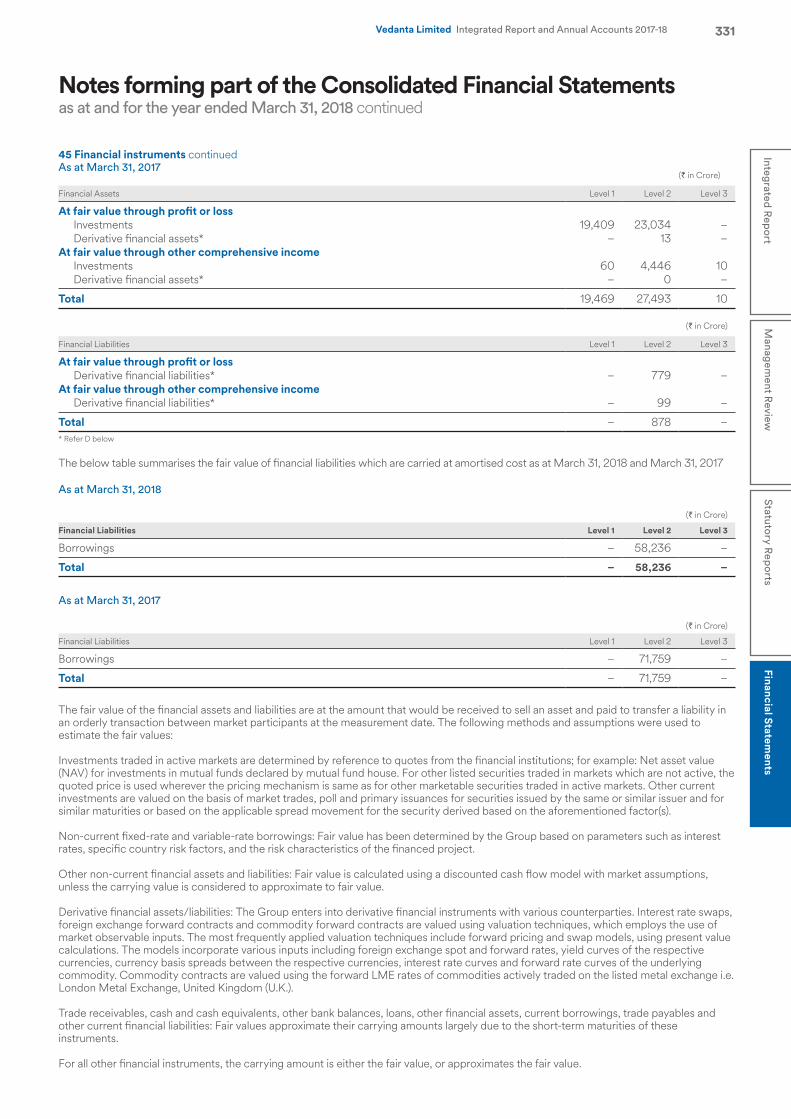
Notes forming part of the Consolidated Financial Statementsas at and for the year ended March 31, 2018 continued
331Integrated R
eport
Managem
ent Review
Statutory R
eports
Financial Statements
Vedanta Limited Integrated Report and Annual Accounts 2017-18
45 Financial instruments continuedAs at March 31, 2017
(` in Crore)
Financial Assets Level 1 Level 2 Level 3
At fair value through profit or lossInvestments 19,409 23,034 – Derivative financial assets* – 13 –
At fair value through other comprehensive incomeInvestments 60 4,446 10 Derivative financial assets* – 0 –
Total 19,469 27,493 10
(` in Crore)
Financial Liabilities Level 1 Level 2 Level 3
At fair value through profit or lossDerivative financial liabilities* – 779 –
At fair value through other comprehensive incomeDerivative financial liabilities* – 99 –
Total – 878 – * Refer D below
The below table summarises the fair value of financial liabilities which are carried at amortised cost as at March 31, 2018 and March 31, 2017
As at March 31, 2018
(` in Crore)
Financial Liabilities Level 1 Level 2 Level 3
Borrowings – 58,236 –
Total – 58,236 –
As at March 31, 2017
(` in Crore)
Financial Liabilities Level 1 Level 2 Level 3
Borrowings – 71,759 –
Total – 71,759 –
The fair value of the financial assets and liabilities are at the amount that would be received to sell an asset and paid to transfer a liability in an orderly transaction between market participants at the measurement date. The following methods and assumptions were used to estimate the fair values:
Investments traded in active markets are determined by reference to quotes from the financial institutions; for example: Net asset value (NAV) for investments in mutual funds declared by mutual fund house. For other listed securities traded in markets which are not active, the quoted price is used wherever the pricing mechanism is same as for other marketable securities traded in active markets. Other current investments are valued on the basis of market trades, poll and primary issuances for securities issued by the same or similar issuer and for similar maturities or based on the applicable spread movement for the security derived based on the aforementioned factor(s).
Non-current fixed-rate and variable-rate borrowings: Fair value has been determined by the Group based on parameters such as interest rates, specific country risk factors, and the risk characteristics of the financed project.
Other non-current financial assets and liabilities: Fair value is calculated using a discounted cash flow model with market assumptions, unless the carrying value is considered to approximate to fair value.
Derivative financial assets/liabilities: The Group enters into derivative financial instruments with various counterparties. Interest rate swaps, foreign exchange forward contracts and commodity forward contracts are valued using valuation techniques, which employs the use of market observable inputs. The most frequently applied valuation techniques include forward pricing and swap models, using present value calculations. The models incorporate various inputs including foreign exchange spot and forward rates, yield curves of the respective currencies, currency basis spreads between the respective currencies, interest rate curves and forward rate curves of the underlying commodity. Commodity contracts are valued using the forward LME rates of commodities actively traded on the listed metal exchange i.e. London Metal Exchange, United Kingdom (U.K.).
Trade receivables, cash and cash equivalents, other bank balances, loans, other financial assets, current borrowings, trade payables and other current financial liabilities: Fair values approximate their carrying amounts largely due to the short-term maturities of these instruments.
For all other financial instruments, the carrying amount is either the fair value, or approximates the fair value.
Notes forming part of the Consolidated Financial Statementsas at and for the year ended March 31, 2018 continued
332 Vedanta Limited Integrated Report and Annual Accounts 2017-18
45 Financial instruments continuedThe changes in counterparty credit risk had no material effect on the hedge effectiveness assessment for derivatives designated in hedge relationship and the value of other financial instruments recognised at fair value.
The estimated fair value amounts as at March 31, 2018 have been measured as at that date. As such, the fair values of these financial instruments subsequent to reporting date may be different than the amounts reported at each year-end.
There were no transfers between Level 1, Level 2 and Level 3 during the year.
C. Risk management frameworkThe Group’s businesses are subject to several risks and uncertainties including financial risks.
The Group’s documented risk management policies act as an effective tool in mitigating the various financial risks to which the businesses are exposed in the course of their daily operations. The risk management policies cover areas such as liquidity risk, commodity price risk, foreign exchange risk, interest rate risk, counterparty credit risk and capital management. Risks are identified at both the corporate and individual subsidiary level with active involvement of senior management. Each operating subsidiary in the Group has in place risk management processes which are in line with the Group’s policy. Each significant risk has a designated ‘owner’ within the Group at an appropriate senior level. The potential financial impact of the risk and its likelihood of a negative outcome are regularly updated.
The risk management process is coordinated by the Management Assurance function and is regularly reviewed by the Group’s Audit Committee. The Audit Committee is aided by the other Committees of the Board including the Risk Management Committee, which meets regularly to review risks as well as the progress against the planned actions. Key business decisions are discussed at the periodic meetings of the Executive Committee. The overall internal control environment and risk management programme including financial risk management is reviewed by the Audit Committee on behalf of the Board.
The risk management framework aims to:• improve financial risk awareness and risk transparency• identify, control and monitor key risks• identify risk accumulations• provide management with reliable information on the Group’s risk situation• improve financial returns
Treasury managementTreasury management focuses on liability management, capital protection, liquidity maintenance and yield maximisation. The treasury policies are approved by the Committee of the Board. Daily treasury operations of the subsidiary companies are managed by their respective finance teams within the framework of the overall Group treasury policies. Long-term fund raising including strategic treasury initiatives are managed jointly by the business treasury team and the central team at corporate treasury while short-term funding for routine working capital requirements is delegated to subsidiary companies. A monthly reporting system exists to inform senior management of the Group’s investments and debt position, exposure to currency, commodity and interest rate risk and their mitigants including the derivative position. The Group has a strong system of internal control which enables effective monitoring of adherence to Group’s policies. The internal control measures are effectively supplemented by regular internal audits.
The investment portfolio at the Group is independently reviewed by CRISIL Limited and Group portfolio has been rated as Tier I or “Very Good” meaning highest safety. The investments are made keeping in mind safety, liquidity and yield maximization.
The Group uses derivative instruments to manage the exposure in foreign currency exchange rates, interest rates and commodity prices. The Group does not acquire or issue derivative financial instruments for trading or speculative purposes. The Group does not enter into complex derivative transactions to manage the treasury and commodity risks. Both treasury and commodities derivative transactions are normally in the form of forward contracts, interest rate and currency swaps and these are in line with the Group’s policies.
Commodity price riskThe Group is exposed to the movement of base metal commodity prices on the London Metal Exchange. Any decline in the prices of the base metals that the Group produces and sells will have an immediate and direct impact on the profitability of the businesses. As a general policy, the Group aims to sell the products at prevailing market prices. The commodity price risk in import input commodity such as of Copper Concentrate & Alumina, for our copper and aluminium business respectively, is hedged on back-to back basis ensuring no price risk for the business. Hedging is used primarily as a risk management tool and, in some cases, to secure future cash flows in cases of high volatility by entering into forward contracts or similar instruments. The hedging activities are subject to strict limits set out by the Board and to a strictly defined internal control and monitoring mechanism. Decisions relating to hedging of commodities are taken at the Executive Committee level, basis clearly laid down guidelines.
Whilst the Group aims to achieve average LME prices for a month or a year, average realised prices may not necessarily reflect the LME price movements because of a variety of reasons such as uneven sales during the year and timing of shipments. The Group is also exposed to the movement of international crude oil price and the discount in the price of Rajasthan crude oil to Brent price.
Financial instruments with commodity price risk are entered into in relation to following activities:• economic hedging of prices realised on commodity contracts• cash flow hedging of revenues, forecasted highly probable transactions
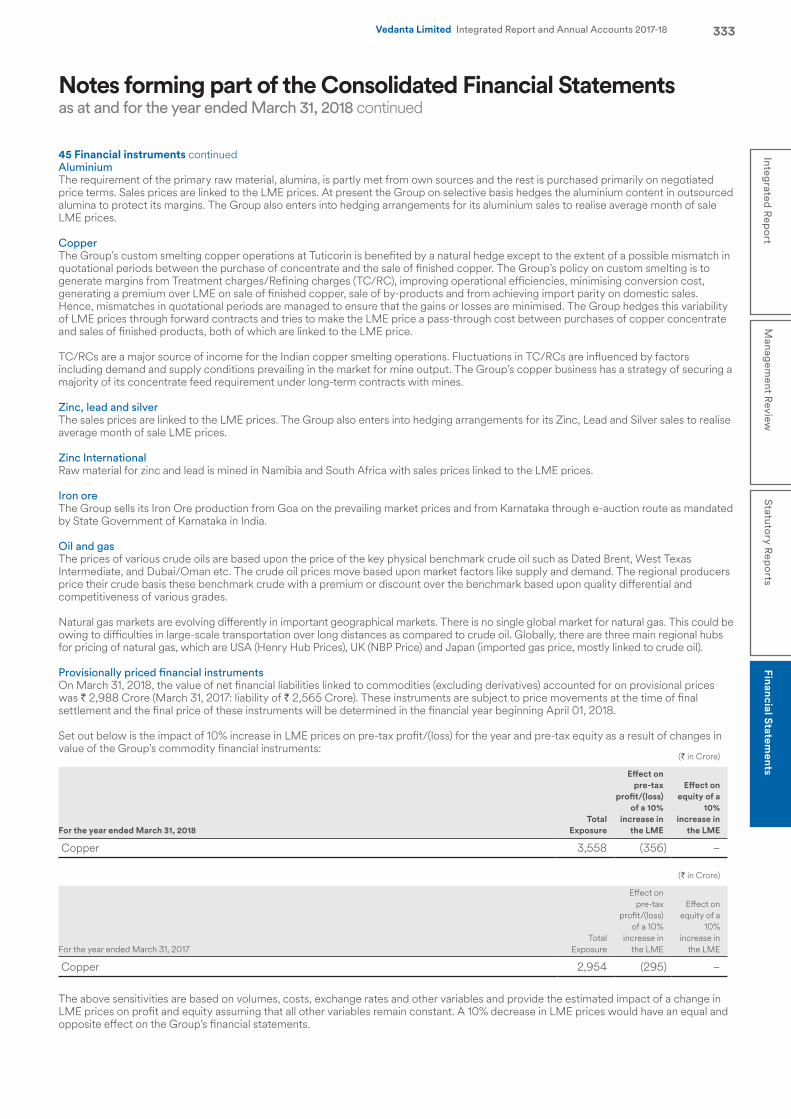
Notes forming part of the Consolidated Financial Statementsas at and for the year ended March 31, 2018 continued
333Integrated R
eport
Managem
ent Review
Statutory R
eports
Financial Statements
Vedanta Limited Integrated Report and Annual Accounts 2017-18
45 Financial instruments continuedAluminiumThe requirement of the primary raw material, alumina, is partly met from own sources and the rest is purchased primarily on negotiated price terms. Sales prices are linked to the LME prices. At present the Group on selective basis hedges the aluminium content in outsourced alumina to protect its margins. The Group also enters into hedging arrangements for its aluminium sales to realise average month of sale LME prices.
CopperThe Group’s custom smelting copper operations at Tuticorin is benefited by a natural hedge except to the extent of a possible mismatch in quotational periods between the purchase of concentrate and the sale of finished copper. The Group’s policy on custom smelting is to generate margins from Treatment charges/Refining charges (TC/RC), improving operational efficiencies, minimising conversion cost, generating a premium over LME on sale of finished copper, sale of by-products and from achieving import parity on domestic sales. Hence, mismatches in quotational periods are managed to ensure that the gains or losses are minimised. The Group hedges this variability of LME prices through forward contracts and tries to make the LME price a pass-through cost between purchases of copper concentrate and sales of finished products, both of which are linked to the LME price.
TC/RCs are a major source of income for the Indian copper smelting operations. Fluctuations in TC/RCs are influenced by factors including demand and supply conditions prevailing in the market for mine output. The Group’s copper business has a strategy of securing a majority of its concentrate feed requirement under long-term contracts with mines.
Zinc, lead and silverThe sales prices are linked to the LME prices. The Group also enters into hedging arrangements for its Zinc, Lead and Silver sales to realise average month of sale LME prices.
Zinc International Raw material for zinc and lead is mined in Namibia and South Africa with sales prices linked to the LME prices.
Iron oreThe Group sells its Iron Ore production from Goa on the prevailing market prices and from Karnataka through e-auction route as mandated by State Government of Karnataka in India.
Oil and gasThe prices of various crude oils are based upon the price of the key physical benchmark crude oil such as Dated Brent, West Texas Intermediate, and Dubai/Oman etc. The crude oil prices move based upon market factors like supply and demand. The regional producers price their crude basis these benchmark crude with a premium or discount over the benchmark based upon quality differential and competitiveness of various grades.
Natural gas markets are evolving differently in important geographical markets. There is no single global market for natural gas. This could be owing to difficulties in large-scale transportation over long distances as compared to crude oil. Globally, there are three main regional hubs for pricing of natural gas, which are USA (Henry Hub Prices), UK (NBP Price) and Japan (imported gas price, mostly linked to crude oil).
Provisionally priced financial instrumentsOn March 31, 2018, the value of net financial liabilities linked to commodities (excluding derivatives) accounted for on provisional prices was ` 2,988 Crore (March 31, 2017: liability of ` 2,565 Crore). These instruments are subject to price movements at the time of final settlement and the final price of these instruments will be determined in the financial year beginning April 01, 2018.
Set out below is the impact of 10% increase in LME prices on pre-tax profit/(loss) for the year and pre-tax equity as a result of changes in value of the Group’s commodity financial instruments:
(` in Crore)
For the year ended March 31, 2018Total
Exposure
Effect on pre-tax
profit/(loss) of a 10%
increase in the LME
Effect on equity of a
10% increase in
the LME
Copper 3,558 (356) –
(` in Crore)
For the year ended March 31, 2017 Total
Exposure
Effect on pre-tax
profit/(loss) of a 10%
increase in the LME
Effect on equity of a
10% increase in
the LME
Copper 2,954 (295) –
The above sensitivities are based on volumes, costs, exchange rates and other variables and provide the estimated impact of a change in LME prices on profit and equity assuming that all other variables remain constant. A 10% decrease in LME prices would have an equal and opposite effect on the Group’s financial statements.
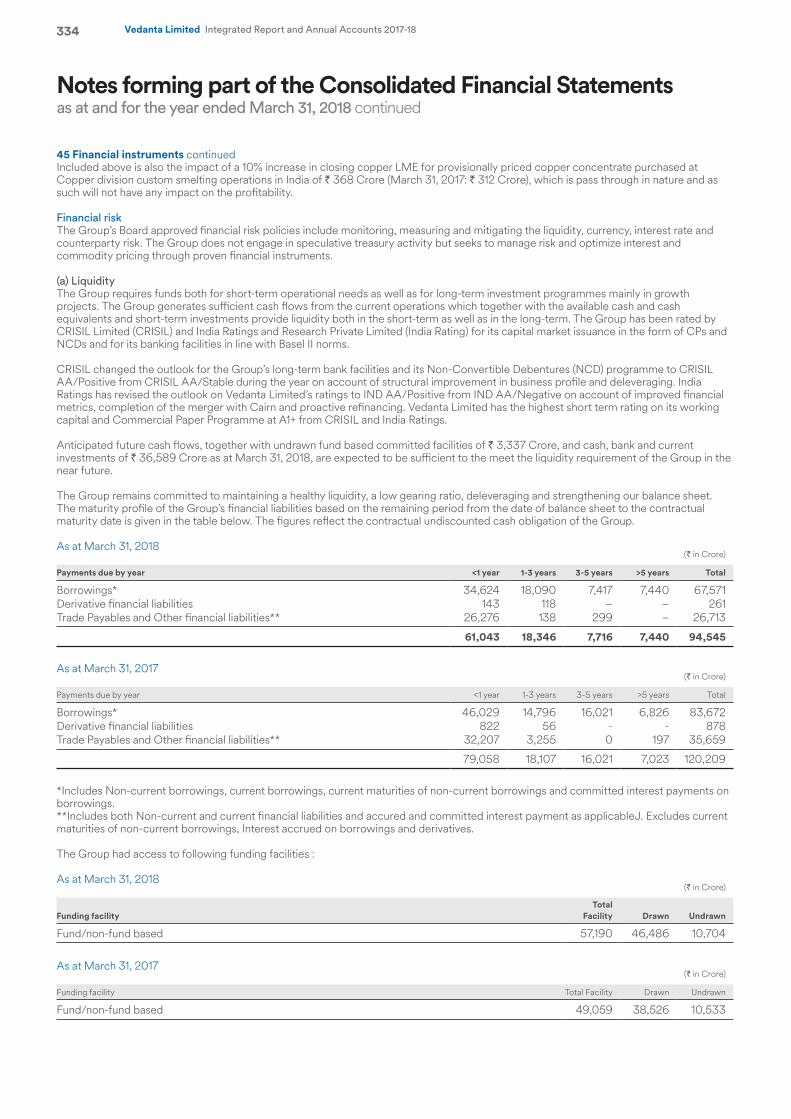
Notes forming part of the Consolidated Financial Statementsas at and for the year ended March 31, 2018 continued
334 Vedanta Limited Integrated Report and Annual Accounts 2017-18
45 Financial instruments continuedIncluded above is also the impact of a 10% increase in closing copper LME for provisionally priced copper concentrate purchased at Copper division custom smelting operations in India of ` 368 Crore (March 31, 2017: ` 312 Crore), which is pass through in nature and as such will not have any impact on the profitability.
Financial riskThe Group’s Board approved financial risk policies include monitoring, measuring and mitigating the liquidity, currency, interest rate and counterparty risk. The Group does not engage in speculative treasury activity but seeks to manage risk and optimize interest and commodity pricing through proven financial instruments.
(a) LiquidityThe Group requires funds both for short-term operational needs as well as for long-term investment programmes mainly in growth projects. The Group generates sufficient cash flows from the current operations which together with the available cash and cash equivalents and short-term investments provide liquidity both in the short-term as well as in the long-term. The Group has been rated by CRISIL Limited (CRISIL) and India Ratings and Research Private Limited (India Rating) for its capital market issuance in the form of CPs and NCDs and for its banking facilities in line with Basel II norms. CRISIL changed the outlook for the Group’s long-term bank facilities and its Non-Convertible Debentures (NCD) programme to CRISIL AA/Positive from CRISIL AA/Stable during the year on account of structural improvement in business profile and deleveraging. India Ratings has revised the outlook on Vedanta Limited’s ratings to IND AA/Positive from IND AA/Negative on account of improved financial metrics, completion of the merger with Cairn and proactive refinancing. Vedanta Limited has the highest short term rating on its working capital and Commercial Paper Programme at A1+ from CRISIL and India Ratings.
Anticipated future cash flows, together with undrawn fund based committed facilities of ` 3,337 Crore, and cash, bank and current investments of ` 36,589 Crore as at March 31, 2018, are expected to be sufficient to the meet the liquidity requirement of the Group in the near future.
The Group remains committed to maintaining a healthy liquidity, a low gearing ratio, deleveraging and strengthening our balance sheet. The maturity profile of the Group’s financial liabilities based on the remaining period from the date of balance sheet to the contractual maturity date is given in the table below. The figures reflect the contractual undiscounted cash obligation of the Group.
As at March 31, 2018(` in Crore)
Payments due by year <1 year 1-3 years 3-5 years >5 years Total
Borrowings* 34,624 18,090 7,417 7,440 67,571 Derivative financial liabilities 143 118 – – 261 Trade Payables and Other financial liabilities** 26,276 138 299 – 26,713
61,043 18,346 7,716 7,440 94,545
As at March 31, 2017(` in Crore)
Payments due by year <1 year 1-3 years 3-5 years >5 years Total
Borrowings* 46,029 14,796 16,021 6,826 83,672 Derivative financial liabilities 822 56 - - 878Trade Payables and Other financial liabilities** 32,207 3,255 0 197 35,659
79,058 18,107 16,021 7,023 120,209
*Includes Non-current borrowings, current borrowings, current maturities of non-current borrowings and committed interest payments on borrowings.**Includes both Non-current and current financial liabilities and accured and committed interest payment as applicableJ. Excludes current maturities of non-current borrowings, Interest accrued on borrowings and derivatives.
The Group had access to following funding facilities :
As at March 31, 2018(` in Crore)
Funding facilityTotal
Facility Drawn Undrawn
Fund/non-fund based 57,190 46,486 10,704
As at March 31, 2017(` in Crore)
Funding facility Total Facility Drawn Undrawn
Fund/non-fund based 49,059 38,526 10,533

Notes forming part of the Consolidated Financial Statementsas at and for the year ended March 31, 2018 continued
335Integrated R
eport
Managem
ent Review
Statutory R
eports
Financial Statements
Vedanta Limited Integrated Report and Annual Accounts 2017-18
45 Financial instruments continuedCollateralThe Group has pledged a part of its trade receivables, short-term investments and cash and cash equivalents in order to fulfil the collateral requirements for the financial facilities in place. The counterparties have an obligation to return the securities to the Group.
The details related to the fair value of collateral have been stated in note 7, note 12, note 13, note 14 and note 15.
(b) Foreign exchange riskFluctuations in foreign currency exchange rates may have an impact on the consolidated statement of profit and loss, the consolidated statement of change in equity, where any transaction references more than one currency or where assets/liabilities are denominated in a currency other than the functional currency of the respective consolidated entities.
Considering the countries and economic environment in which the Group operates, its operations are subject to risks arising from the fluctuations primarily in the US dollar, Australian dollar, Namibian dollar, AED, ZAR, GBP, JPY, INR and Euro against the functional currencies of Vedanta Limited and its subsidiaries.
Exposures on foreign currency loans are managed through the Group wide hedging policy, which is reviewed periodically to ensure that the results from fluctuating currency exchange rates are appropriately managed. The Group strives to achieve asset liability offset of foreign currency exposures and only the net position is hedged.
The Group’s presentation currency is the INR. The majority of the assets are located in India and the Indian Rupee is the functional currency for the Indian operating subsidiaries except for Oil and Gas business. Natural hedges available in the business are identified at each entity level and hedges are placed only for the net exposure. Short-term net exposures are hedged progressively based on their maturity. A more conservative approach has been adopted for project expenditures to avoid budget overruns, where cost of the project is calculated taking into account the hedge cost. However all new non-current borrowing exposures are being hedged. The hedge mechanisms are reviewed periodically to ensure that the risk from fluctuating currency exchange rates is appropriately managed.
The carrying amount of the Group’s financial assets and liabilities in different currencies are as follows :(` in Crore)
As at March 31, 2018 As at March 31, 2017
CurrencyFinancial
AssetFinancial liabilities
Financial Asset
Financial liabilities
INR 35,709 61,588 58,486 80,173 USD 7,189 22,289 9,650 27,874 EURO 41 444 181 268 Others 1,106 1,628 374 325
Total 44,045 85,949 68,691 108,640
The Group’s exposure to foreign currency arises where a Group entity holds monetary assets and liabilities denominated in a currency different to the functional currency of the respective business, with US dollar being the major non-functional currency. The following analysis is based on the gross exposure as at the reporting date which could affect the consolidated statement of profit and loss. The exposure is mitigated by some of the derivative contracts entered into by the Group as disclosed under the section on “Derivative financial instruments”.
The foreign exchange rate sensitivity is calculated by the aggregation of the net foreign exchange rate exposure with a simultaneous parallel foreign exchange rates shift in the foreign currencies by 10% against the functional currency of the respective entities.
Set out below is the impact of a 10% strengthening in the functional currencies of the respective businesses on pre-tax profit/(loss) and pre-tax equity arising as a result of the revaluation of the Group’s foreign currency financial assets/liabilities:
(` in Crore)
March 31, 2018
Effect of10%
strengthening of functional
currency onpre-tax profit/
(loss)
Effect of10%
strengthening of functional
currency onequity
USD 1,504 0 INR (64) –
(` in Crore)
March 31, 2017
Effect of10%
strengthening of functional currency on
pre-tax profit/ (loss)
Effect of10%
strengthening of functional currency on
equity
USD 1,894 (18) INR 104 –
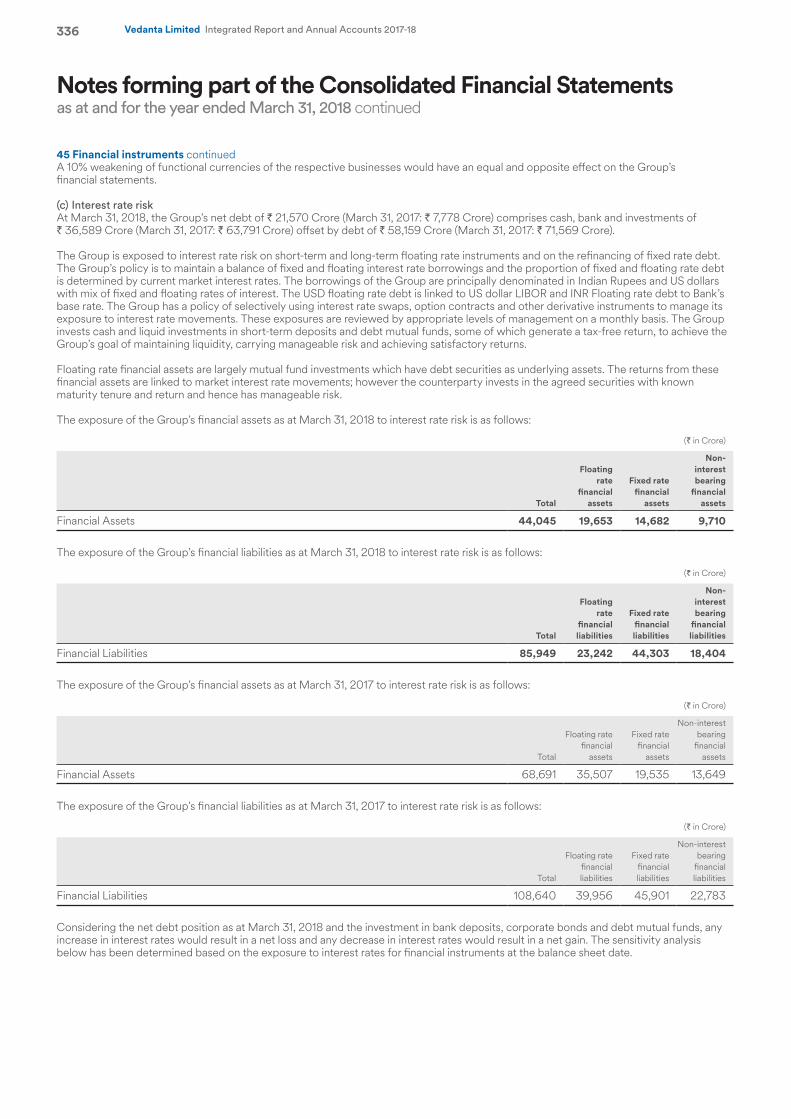
Notes forming part of the Consolidated Financial Statementsas at and for the year ended March 31, 2018 continued
336 Vedanta Limited Integrated Report and Annual Accounts 2017-18
45 Financial instruments continuedA 10% weakening of functional currencies of the respective businesses would have an equal and opposite effect on the Group’s financial statements.
(c) Interest rate riskAt March 31, 2018, the Group’s net debt of ` 21,570 Crore (March 31, 2017: ` 7,778 Crore) comprises cash, bank and investments of ` 36,589 Crore (March 31, 2017: ` 63,791 Crore) offset by debt of ` 58,159 Crore (March 31, 2017: ` 71,569 Crore).
The Group is exposed to interest rate risk on short-term and long-term floating rate instruments and on the refinancing of fixed rate debt. The Group’s policy is to maintain a balance of fixed and floating interest rate borrowings and the proportion of fixed and floating rate debt is determined by current market interest rates. The borrowings of the Group are principally denominated in Indian Rupees and US dollars with mix of fixed and floating rates of interest. The USD floating rate debt is linked to US dollar LIBOR and INR Floating rate debt to Bank’s base rate. The Group has a policy of selectively using interest rate swaps, option contracts and other derivative instruments to manage its exposure to interest rate movements. These exposures are reviewed by appropriate levels of management on a monthly basis. The Group invests cash and liquid investments in short-term deposits and debt mutual funds, some of which generate a tax-free return, to achieve the Group’s goal of maintaining liquidity, carrying manageable risk and achieving satisfactory returns.
Floating rate financial assets are largely mutual fund investments which have debt securities as underlying assets. The returns from these financial assets are linked to market interest rate movements; however the counterparty invests in the agreed securities with known maturity tenure and return and hence has manageable risk.
The exposure of the Group’s financial assets as at March 31, 2018 to interest rate risk is as follows:
(` in Crore)
Total
Floating rate
financial assets
Fixed rate financial
assets
Non-interest bearing
financial assets
Financial Assets 44,045 19,653 14,682 9,710
The exposure of the Group’s financial liabilities as at March 31, 2018 to interest rate risk is as follows:
(` in Crore)
Total
Floating rate
financial liabilities
Fixed rate financial liabilities
Non-interest bearing
financial liabilities
Financial Liabilities 85,949 23,242 44,303 18,404
The exposure of the Group’s financial assets as at March 31, 2017 to interest rate risk is as follows:
(` in Crore)
Total
Floating rate financial
assets
Fixed rate financial
assets
Non-interest bearing
financial assets
Financial Assets 68,691 35,507 19,535 13,649
The exposure of the Group’s financial liabilities as at March 31, 2017 to interest rate risk is as follows:
(` in Crore)
Total
Floating rate financial liabilities
Fixed rate financial liabilities
Non-interest bearing
financial liabilities
Financial Liabilities 108,640 39,956 45,901 22,783
Considering the net debt position as at March 31, 2018 and the investment in bank deposits, corporate bonds and debt mutual funds, any increase in interest rates would result in a net loss and any decrease in interest rates would result in a net gain. The sensitivity analysis below has been determined based on the exposure to interest rates for financial instruments at the balance sheet date.
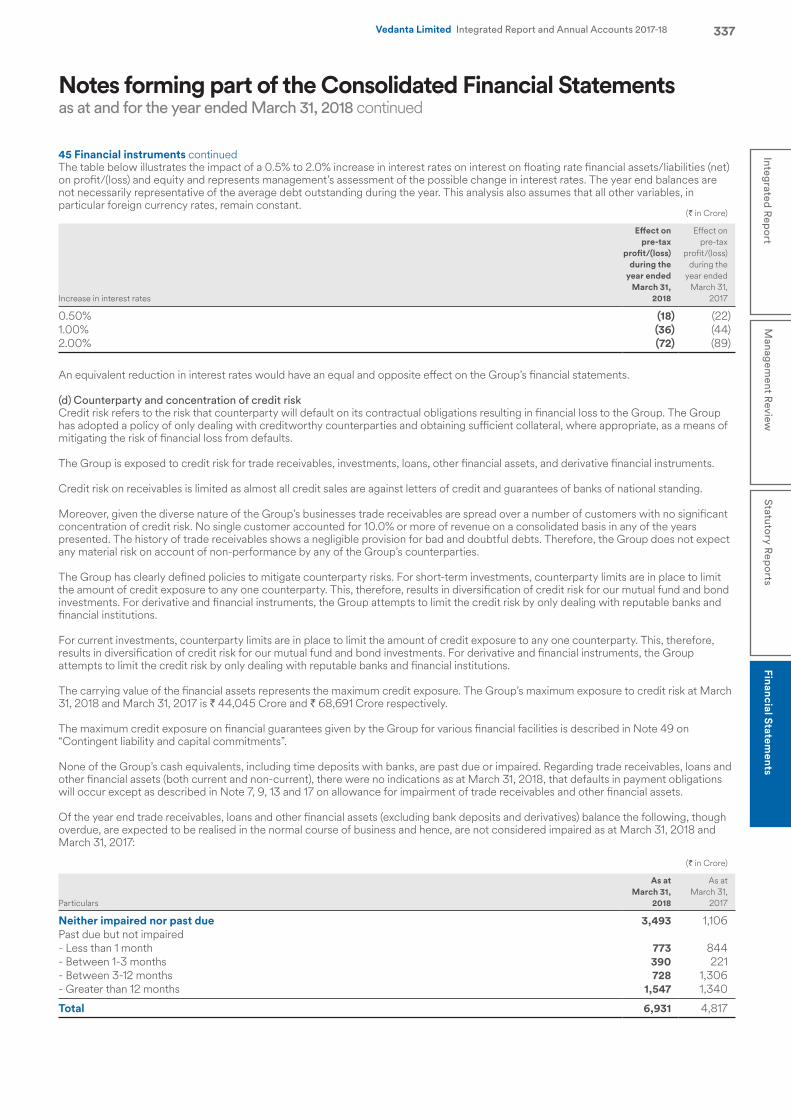
Notes forming part of the Consolidated Financial Statementsas at and for the year ended March 31, 2018 continued
337Integrated R
eport
Managem
ent Review
Statutory R
eports
Financial Statements
Vedanta Limited Integrated Report and Annual Accounts 2017-18
45 Financial instruments continuedThe table below illustrates the impact of a 0.5% to 2.0% increase in interest rates on interest on floating rate financial assets/liabilities (net) on profit/(loss) and equity and represents management’s assessment of the possible change in interest rates. The year end balances are not necessarily representative of the average debt outstanding during the year. This analysis also assumes that all other variables, in particular foreign currency rates, remain constant.
(` in Crore)
Increase in interest rates
Effect on pre-tax
profit/(loss) during the
year ended March 31,
2018
Effect on pre-tax
profit/(loss) during the
year ended March 31,
2017
0.50% (18) (22)1.00% (36) (44)2.00% (72) (89)
An equivalent reduction in interest rates would have an equal and opposite effect on the Group’s financial statements.
(d) Counterparty and concentration of credit riskCredit risk refers to the risk that counterparty will default on its contractual obligations resulting in financial loss to the Group. The Group has adopted a policy of only dealing with creditworthy counterparties and obtaining sufficient collateral, where appropriate, as a means of mitigating the risk of financial loss from defaults.
The Group is exposed to credit risk for trade receivables, investments, loans, other financial assets, and derivative financial instruments.
Credit risk on receivables is limited as almost all credit sales are against letters of credit and guarantees of banks of national standing.
Moreover, given the diverse nature of the Group’s businesses trade receivables are spread over a number of customers with no significant concentration of credit risk. No single customer accounted for 10.0% or more of revenue on a consolidated basis in any of the years presented. The history of trade receivables shows a negligible provision for bad and doubtful debts. Therefore, the Group does not expect any material risk on account of non-performance by any of the Group’s counterparties.
The Group has clearly defined policies to mitigate counterparty risks. For short-term investments, counterparty limits are in place to limit the amount of credit exposure to any one counterparty. This, therefore, results in diversification of credit risk for our mutual fund and bond investments. For derivative and financial instruments, the Group attempts to limit the credit risk by only dealing with reputable banks and financial institutions.
For current investments, counterparty limits are in place to limit the amount of credit exposure to any one counterparty. This, therefore, results in diversification of credit risk for our mutual fund and bond investments. For derivative and financial instruments, the Group attempts to limit the credit risk by only dealing with reputable banks and financial institutions.
The carrying value of the financial assets represents the maximum credit exposure. The Group’s maximum exposure to credit risk at March 31, 2018 and March 31, 2017 is ` 44,045 Crore and ` 68,691 Crore respectively.
The maximum credit exposure on financial guarantees given by the Group for various financial facilities is described in Note 49 on “Contingent liability and capital commitments”.
None of the Group’s cash equivalents, including time deposits with banks, are past due or impaired. Regarding trade receivables, loans and other financial assets (both current and non-current), there were no indications as at March 31, 2018, that defaults in payment obligations will occur except as described in Note 7, 9, 13 and 17 on allowance for impairment of trade receivables and other financial assets.
Of the year end trade receivables, loans and other financial assets (excluding bank deposits and derivatives) balance the following, though overdue, are expected to be realised in the normal course of business and hence, are not considered impaired as at March 31, 2018 and March 31, 2017:
(` in Crore)
Particulars
As at March 31,
2018
As at March 31,
2017
Neither impaired nor past due 3,493 1,106 Past due but not impaired- Less than 1 month 773 844 - Between 1-3 months 390 221 - Between 3-12 months 728 1,306 - Greater than 12 months 1,547 1,340
Total 6,931 4,817
Notes forming part of the Consolidated Financial Statementsas at and for the year ended March 31, 2018 continued
338 Vedanta Limited Integrated Report and Annual Accounts 2017-18
45 Financial instruments continuedReceivables are deemed to be past due or impaired with reference to the Group’s normal terms and conditions of business. These terms and conditions are determined on a case to case basis with reference to the customer’s credit quality and prevailing market conditions. Receivables that are classified as ‘past due’ in the above tables are those that have not been settled within the terms and conditions that have been agreed with that customer. The Company based on past experiences does not expect any material loss on its receivables and hence no provision is deemed necessary on account of ECL.
The credit quality of the Group’s customers is monitored on an ongoing basis and assessed for impairment where indicators of such impairment exist. The Group uses simplified approach for impairment of financial assets. If credit risk has not increased significantly, 12-month expected credit loss is used to provide for impairment loss. However, if credit risk has increased significantly, lifetime expected credit loss is used. The solvency of the debtor and their ability to repay the receivable is considered in assessing receivables for impairment. Where receivables have been impaired, the Group actively seeks to recover the amounts in question and enforce compliance with credit terms.
D. Derivative financial instrumentsThe Group uses derivative instruments as part of its management of exposure to fluctuations in foreign currency exchange rates, interest rates and commodity prices. The Group does not acquire or issue derivative financial instruments for trading or speculative purposes. The Group does not enter into complex derivative transactions to manage the treasury and commodity risks. Both treasury and commodities derivative transactions are normally in the form of forward contracts and these are subject to the Group guidelines and policies.
The fair values of all derivatives are separately recorded in the consolidated balance sheet within current and non-current assets and liabilities. Derivatives that are designated as hedges are classified as current or non-current depending on the maturity of the derivative.
The use of derivatives can give rise to credit and market risk. The Group tries to control credit risk as far as possible by only entering into contracts with reputable banks and financial institutions. The use of derivative instruments is subject to limits, authorities and regular monitoring by appropriate levels of management. The limits, authorities and monitoring systems are periodically reviewed by management and the Board. The market risk on derivatives is mitigated by changes in the valuation of the underlying assets, liabilities or transactions, as derivatives are used only for risk management purposes.
(i) Embedded derivativesDerivatives embedded other financial instruments or other contracts are treated as separate derivative contracts and marked-to-market when their risks and characteristics are not clearly and closely related to those of their host contracts and the host contracts are not fair valued.
(ii) Cash flow hedgesThe Group enters into forward exchange and commodity price contracts for hedging highly probable forecast transaction and account for them as cash flow hedges and states them at fair value. Subsequent changes in fair value are recognized in equity until the hedged transaction occurs, at which time, the respective gain or losses are reclassified to profit or loss. These hedges have been effective for the year ended March 31, 2018.
The Group uses foreign exchange contracts from time to time to optimize currency risk exposure on its foreign currency transactions. The Company hedged part of its foreign currency exposure on capital commitments during the year ended 2018. Fair value changes on such forward contracts are recognized in comprehensive income.
The majority of cash flow hedges taken out by the Group during the year comprise non-derivative hedging instruments for hedging the foreign exchange rate of highly probable forecast transactions and commodity price contracts for hedging the commodity price risk of highly probable forecast transactions.
The cash flows related to above are expected to occur during the year ended March 31, 2019 and consequently may impact profit or loss for that year depending upon the change in the commodity prices and foreign exchange rates movements. For cash flow hedges regarded as basis adjustments to initial carrying value of the property, plant and equipment, the depreciation on the basis adjustments made is expected to affect profit or loss over the expected useful life of the property, plant and equipment.
(iii) Fair value hedgeThe fair value hedges relate to forward covers taken to hedge currency exposure and commodity price risks.
The Group’s sales are on a quotational period basis, generally one month to three months after the date of delivery at a customer’s facility. The Group enters into forward contracts for the respective quotational period to hedge its commodity price risk based on average LME prices. Gains and losses on these hedge transactions are substantially offset by the amount of gains or losses on the underlying sales. Net gains and losses are recognized in the consolidated statement of profit and loss.
The Group uses foreign exchange contracts from time to time to optimize currency risk exposure on its foreign currency transactions. Fair value changes on such forward contracts are recognized in consolidated statement of profit and loss.
(iv) Non-qualifying/economic hedgeThe Company enters into derivative contracts which are not designated as hedges for accounting purposes, but provide an economic hedge of a particular transaction risk or a risk component of a transaction. Hedging instruments include copper, aluminium future contracts on the LME and certain other derivative instruments. Fair value changes on such derivative instruments are recognized in consolidated statement of profit and loss.
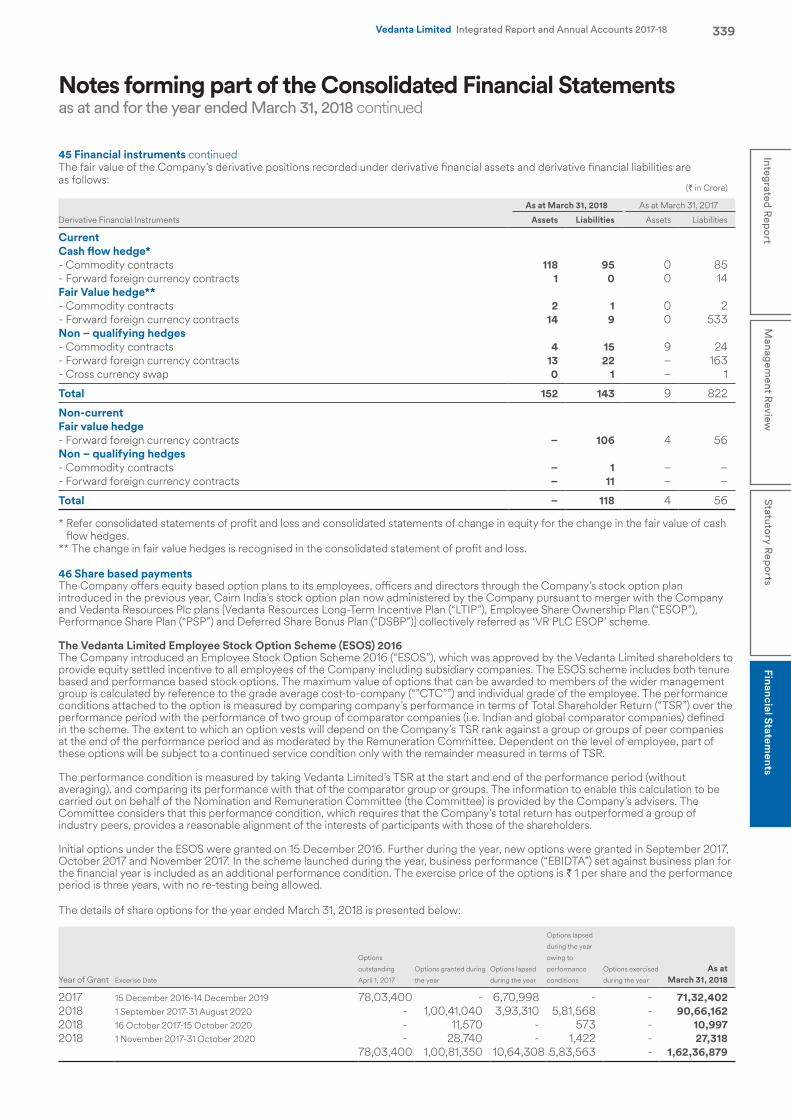
Notes forming part of the Consolidated Financial Statementsas at and for the year ended March 31, 2018 continued
339Integrated R
eport
Managem
ent Review
Statutory R
eports
Financial Statements
Vedanta Limited Integrated Report and Annual Accounts 2017-18
45 Financial instruments continuedThe fair value of the Company’s derivative positions recorded under derivative financial assets and derivative financial liabilities are as follows:
(` in Crore)
As at March 31, 2018 As at March 31, 2017
Derivative Financial Instruments Assets Liabilities Assets Liabilities
CurrentCash flow hedge*- Commodity contracts 118 95 0 85 - Forward foreign currency contracts 1 0 0 14 Fair Value hedge**- Commodity contracts 2 1 0 2 - Forward foreign currency contracts 14 9 0 533 Non – qualifying hedges- Commodity contracts 4 15 9 24 - Forward foreign currency contracts 13 22 – 163 - Cross currency swap 0 1 – 1
Total 152 143 9 822
Non-currentFair value hedge- Forward foreign currency contracts – 106 4 56 Non – qualifying hedges- Commodity contracts – 1 – –- Forward foreign currency contracts – 11 – –
Total – 118 4 56
* Refer consolidated statements of profit and loss and consolidated statements of change in equity for the change in the fair value of cash flow hedges.
** The change in fair value hedges is recognised in the consolidated statement of profit and loss.
46 Share based paymentsThe Company offers equity based option plans to its employees, officers and directors through the Company’s stock option plan introduced in the previous year, Cairn India’s stock option plan now administered by the Company pursuant to merger with the Company and Vedanta Resources Plc plans [Vedanta Resources Long-Term Incentive Plan (“LTIP”), Employee Share Ownership Plan (“ESOP”), Performance Share Plan (“PSP”) and Deferred Share Bonus Plan (“DSBP”)] collectively referred as ‘VR PLC ESOP’ scheme.
The Vedanta Limited Employee Stock Option Scheme (ESOS) 2016The Company introduced an Employee Stock Option Scheme 2016 (“ESOS”), which was approved by the Vedanta Limited shareholders to provide equity settled incentive to all employees of the Company including subsidiary companies. The ESOS scheme includes both tenure based and performance based stock options. The maximum value of options that can be awarded to members of the wider management group is calculated by reference to the grade average cost-to-company (“”CTC””) and individual grade of the employee. The performance conditions attached to the option is measured by comparing company’s performance in terms of Total Shareholder Return (“TSR”) over the performance period with the performance of two group of comparator companies (i.e. Indian and global comparator companies) defined in the scheme. The extent to which an option vests will depend on the Company’s TSR rank against a group or groups of peer companies at the end of the performance period and as moderated by the Remuneration Committee. Dependent on the level of employee, part of these options will be subject to a continued service condition only with the remainder measured in terms of TSR.
The performance condition is measured by taking Vedanta Limited’s TSR at the start and end of the performance period (without averaging), and comparing its performance with that of the comparator group or groups. The information to enable this calculation to be carried out on behalf of the Nomination and Remuneration Committee (the Committee) is provided by the Company’s advisers. The Committee considers that this performance condition, which requires that the Company’s total return has outperformed a group of industry peers, provides a reasonable alignment of the interests of participants with those of the shareholders.
Initial options under the ESOS were granted on 15 December 2016. Further during the year, new options were granted in September 2017, October 2017 and November 2017. In the scheme launched during the year, business performance (“EBIDTA”) set against business plan for the financial year is included as an additional performance condition. The exercise price of the options is ` 1 per share and the performance period is three years, with no re-testing being allowed.
The details of share options for the year ended March 31, 2018 is presented below:
Year of Grant Excerise Date
Options
outstanding
April 1, 2017
Options granted during
the year
Options lapsed
during the year
Options lapsed
during the year
owing to
performance
conditions
Options exercised
during the year
As at March 31, 2018
2017 15 December 2016-14 December 2019 78,03,400 - 6,70,998 - - 71,32,4022018 1 September 2017-31 August 2020 - 1,00,41,040 3,93,310 5,81,568 - 90,66,1622018 16 October 2017-15 October 2020 - 11,570 - 573 - 10,9972018 1 November 2017-31 October 2020 - 28,740 - 1,422 - 27,318
78,03,400 1,00,81,350 10,64,308 5,83,563 - 1,62,36,879
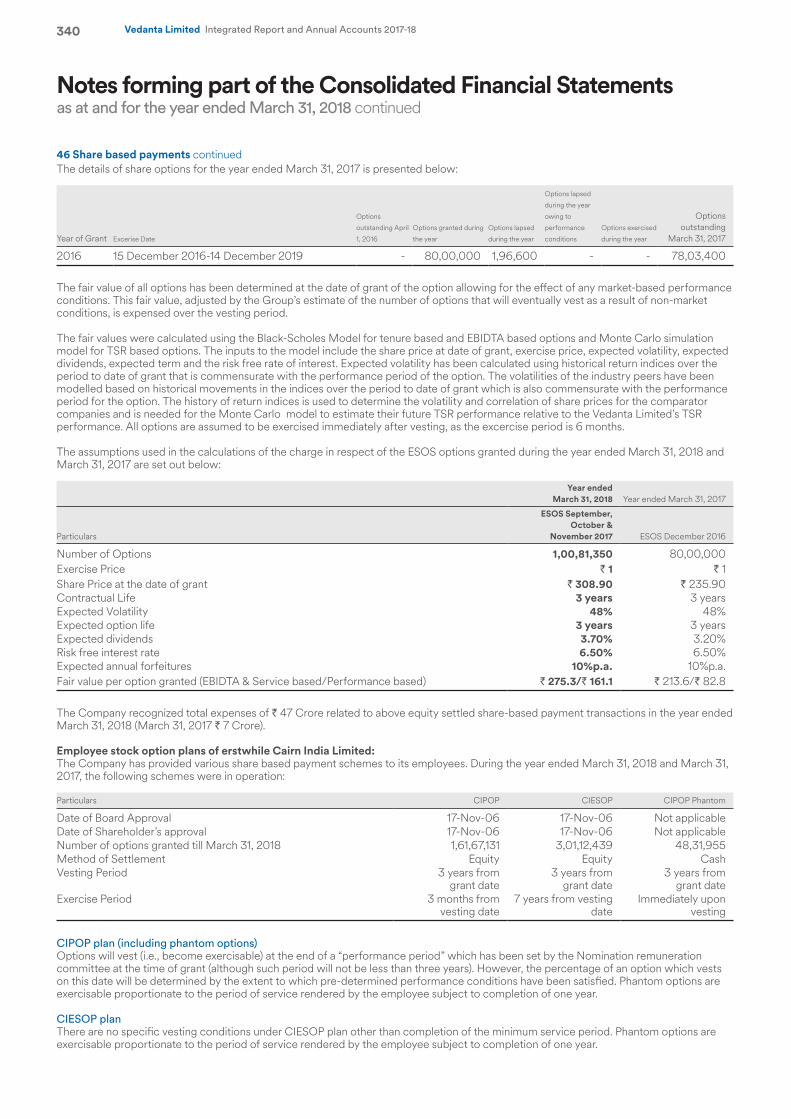
Notes forming part of the Consolidated Financial Statementsas at and for the year ended March 31, 2018 continued
340 Vedanta Limited Integrated Report and Annual Accounts 2017-18
The details of share options for the year ended March 31, 2017 is presented below:
Year of Grant Excerise Date
Options
outstanding April
1, 2016
Options granted during
the year
Options lapsed
during the year
Options lapsed
during the year
owing to
performance
conditions
Options exercised
during the year
Options outstanding
March 31, 2017
2016 15 December 2016-14 December 2019 - 80,00,000 1,96,600 - - 78,03,400
The fair value of all options has been determined at the date of grant of the option allowing for the effect of any market-based performance conditions. This fair value, adjusted by the Group’s estimate of the number of options that will eventually vest as a result of non-market conditions, is expensed over the vesting period.
The fair values were calculated using the Black-Scholes Model for tenure based and EBIDTA based options and Monte Carlo simulation model for TSR based options. The inputs to the model include the share price at date of grant, exercise price, expected volatility, expected dividends, expected term and the risk free rate of interest. Expected volatility has been calculated using historical return indices over the period to date of grant that is commensurate with the performance period of the option. The volatilities of the industry peers have been modelled based on historical movements in the indices over the period to date of grant which is also commensurate with the performance period for the option. The history of return indices is used to determine the volatility and correlation of share prices for the comparator companies and is needed for the Monte Carlo model to estimate their future TSR performance relative to the Vedanta Limited’s TSR performance. All options are assumed to be exercised immediately after vesting, as the excercise period is 6 months.
The assumptions used in the calculations of the charge in respect of the ESOS options granted during the year ended March 31, 2018 and March 31, 2017 are set out below:
Year ended March 31, 2018 Year ended March 31, 2017
Particulars
ESOS September, October &
November 2017 ESOS December 2016
Number of Options 1,00,81,350 80,00,000Exercise Price ` 1 ` 1 Share Price at the date of grant ` 308.90 ` 235.90 Contractual Life 3 years 3 yearsExpected Volatility 48% 48%Expected option life 3 years 3 yearsExpected dividends 3.70% 3.20%Risk free interest rate 6.50% 6.50%Expected annual forfeitures 10%p.a. 10%p.a.Fair value per option granted (EBIDTA & Service based/Performance based) ` 275.3/` 161.1 ` 213.6/` 82.8
The Company recognized total expenses of ` 47 Crore related to above equity settled share-based payment transactions in the year ended March 31, 2018 (March 31, 2017 ` 7 Crore).
Employee stock option plans of erstwhile Cairn India Limited: The Company has provided various share based payment schemes to its employees. During the year ended March 31, 2018 and March 31, 2017, the following schemes were in operation:
Particulars CIPOP CIESOP CIPOP Phantom
Date of Board Approval 17-Nov-06 17-Nov-06 Not applicableDate of Shareholder’s approval 17-Nov-06 17-Nov-06 Not applicableNumber of options granted till March 31, 2018 1,61,67,131 3,01,12,439 48,31,955Method of Settlement Equity Equity CashVesting Period 3 years from
grant date3 years from
grant date3 years from
grant dateExercise Period 3 months from
vesting date7 years from vesting
dateImmediately upon
vesting
CIPOP plan (including phantom options)Options will vest (i.e., become exercisable) at the end of a “performance period” which has been set by the Nomination remuneration committee at the time of grant (although such period will not be less than three years). However, the percentage of an option which vests on this date will be determined by the extent to which pre-determined performance conditions have been satisfied. Phantom options are exercisable proportionate to the period of service rendered by the employee subject to completion of one year.
CIESOP planThere are no specific vesting conditions under CIESOP plan other than completion of the minimum service period. Phantom options are exercisable proportionate to the period of service rendered by the employee subject to completion of one year.
46 Share based payments continued
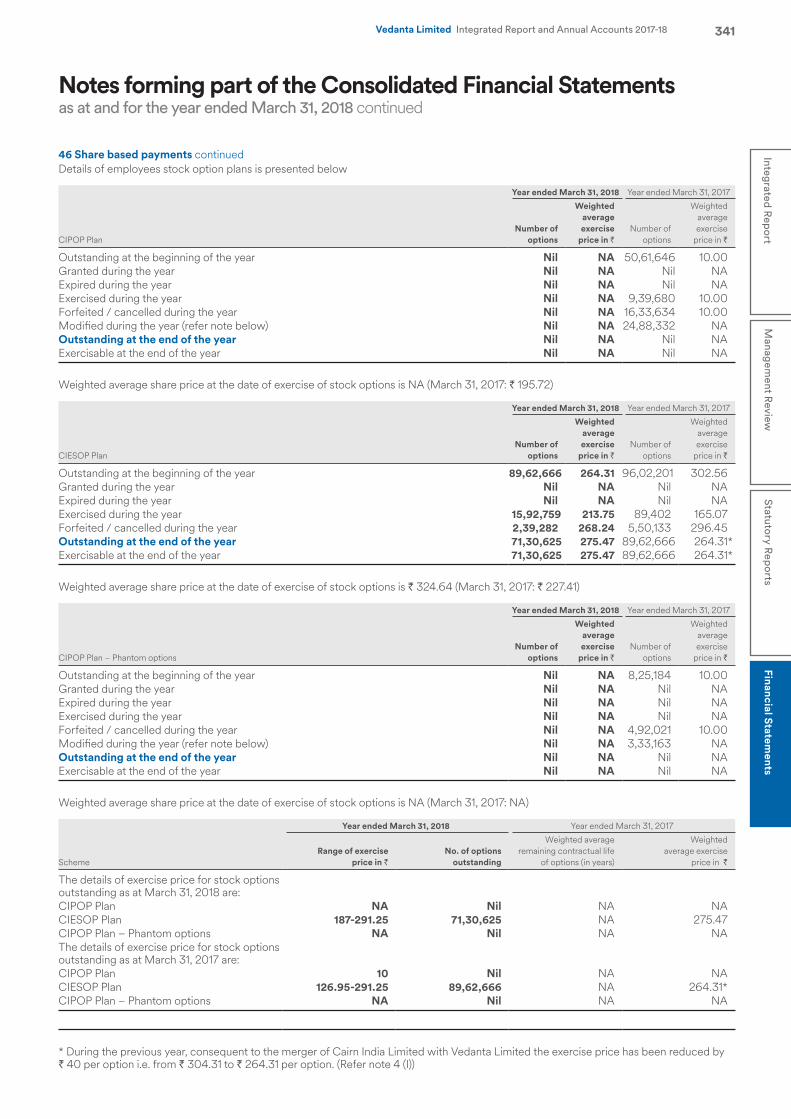
Notes forming part of the Consolidated Financial Statementsas at and for the year ended March 31, 2018 continued
341Integrated R
eport
Managem
ent Review
Statutory R
eports
Financial Statements
Vedanta Limited Integrated Report and Annual Accounts 2017-18
Details of employees stock option plans is presented below
CIPOP Plan
Year ended March 31, 2018 Year ended March 31, 2017
Number of options
Weighted average exercise
price in `Number of
options
Weighted average exercise
price in `
Outstanding at the beginning of the year Nil NA 50,61,646 10.00Granted during the year Nil NA Nil NAExpired during the year Nil NA Nil NAExercised during the year Nil NA 9,39,680 10.00Forfeited / cancelled during the year Nil NA 16,33,634 10.00Modified during the year (refer note below) Nil NA 24,88,332 NAOutstanding at the end of the year Nil NA Nil NAExercisable at the end of the year Nil NA Nil NA
Weighted average share price at the date of exercise of stock options is NA (March 31, 2017: ` 195.72)
CIESOP Plan
Year ended March 31, 2018 Year ended March 31, 2017
Number of options
Weighted average exercise
price in `Number of
options
Weighted average exercise
price in `
Outstanding at the beginning of the year 89,62,666 264.31 96,02,201 302.56Granted during the year Nil NA Nil NAExpired during the year Nil NA Nil NAExercised during the year 15,92,759 213.75 89,402 165.07Forfeited / cancelled during the year 2,39,282 268.24 5,50,133 296.45Outstanding at the end of the year 71,30,625 275.47 89,62,666 264.31*Exercisable at the end of the year 71,30,625 275.47 89,62,666 264.31*
Weighted average share price at the date of exercise of stock options is ` 324.64 (March 31, 2017: ` 227.41)
CIPOP Plan – Phantom options
Year ended March 31, 2018 Year ended March 31, 2017
Number of options
Weighted average exercise
price in `Number of
options
Weighted average exercise
price in `
Outstanding at the beginning of the year Nil NA 8,25,184 10.00Granted during the year Nil NA Nil NAExpired during the year Nil NA Nil NAExercised during the year Nil NA Nil NAForfeited / cancelled during the year Nil NA 4,92,021 10.00Modified during the year (refer note below) Nil NA 3,33,163 NAOutstanding at the end of the year Nil NA Nil NAExercisable at the end of the year Nil NA Nil NA
Weighted average share price at the date of exercise of stock options is NA (March 31, 2017: NA)
Scheme
Year ended March 31, 2018 Year ended March 31, 2017
Range of exercise price in `
No. of options outstanding
Weighted average remaining contractual life
of options (in years)
Weighted average exercise
price in `
The details of exercise price for stock options outstanding as at March 31, 2018 are:CIPOP Plan NA Nil NA NACIESOP Plan 187-291.25 71,30,625 NA 275.47 CIPOP Plan – Phantom options NA Nil NA NAThe details of exercise price for stock optionsoutstanding as at March 31, 2017 are:CIPOP Plan 10 Nil NA NACIESOP Plan 126.95-291.25 89,62,666 NA 264.31*CIPOP Plan – Phantom options NA Nil NA NA
* During the previous year, consequent to the merger of Cairn India Limited with Vedanta Limited the exercise price has been reduced by ` 40 per option i.e. from ` 304.31 to ` 264.31 per option. (Refer note 4 (I))
46 Share based payments continued
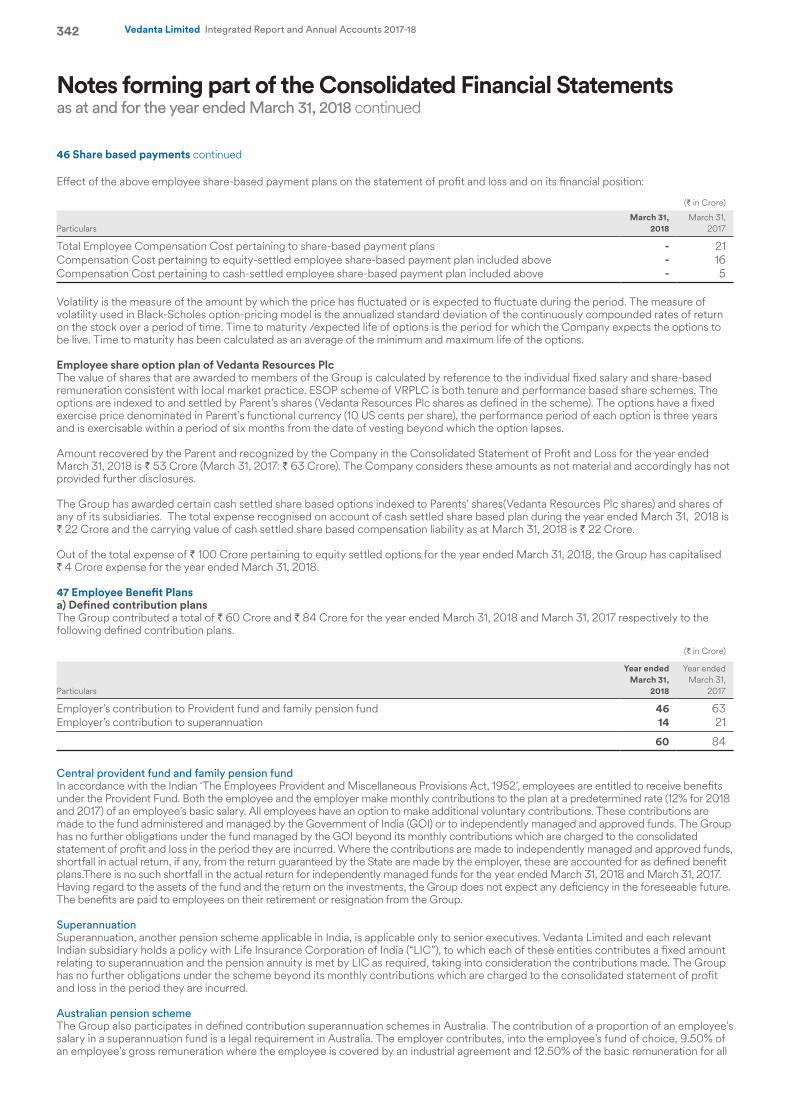
Notes forming part of the Consolidated Financial Statementsas at and for the year ended March 31, 2018 continued
342 Vedanta Limited Integrated Report and Annual Accounts 2017-18
Effect of the above employee share-based payment plans on the statement of profit and loss and on its financial position:
(` in Crore)
ParticularsMarch 31,
2018March 31,
2017
Total Employee Compensation Cost pertaining to share-based payment plans - 21 Compensation Cost pertaining to equity-settled employee share-based payment plan included above - 16 Compensation Cost pertaining to cash-settled employee share-based payment plan included above - 5
Volatility is the measure of the amount by which the price has fluctuated or is expected to fluctuate during the period. The measure of volatility used in Black-Scholes option-pricing model is the annualized standard deviation of the continuously compounded rates of return on the stock over a period of time. Time to maturity /expected life of options is the period for which the Company expects the options to be live. Time to maturity has been calculated as an average of the minimum and maximum life of the options.
Employee share option plan of Vedanta Resources PlcThe value of shares that are awarded to members of the Group is calculated by reference to the individual fixed salary and share-based remuneration consistent with local market practice. ESOP scheme of VRPLC is both tenure and performance based share schemes. The options are indexed to and settled by Parent’s shares (Vedanta Resources Plc shares as defined in the scheme). The options have a fixed exercise price denominated in Parent’s functional currency (10 US cents per share), the performance period of each option is three years and is exercisable within a period of six months from the date of vesting beyond which the option lapses.
Amount recovered by the Parent and recognized by the Company in the Consolidated Statement of Profit and Loss for the year ended March 31, 2018 is ` 53 Crore (March 31, 2017: ` 63 Crore). The Company considers these amounts as not material and accordingly has not provided further disclosures.
The Group has awarded certain cash settled share based options indexed to Parents’ shares(Vedanta Resources Plc shares) and shares of any of its subsidiaries. The total expense recognised on account of cash settled share based plan during the year ended March 31, 2018 is ` 22 Crore and the carrying value of cash settled share based compensation liability as at March 31, 2018 is ` 22 Crore.
Out of the total expense of ` 100 Crore pertaining to equity settled options for the year ended March 31, 2018, the Group has capitalised ` 4 Crore expense for the year ended March 31, 2018.
47 Employee Benefit Plansa) Defined contribution plansThe Group contributed a total of ` 60 Crore and ` 84 Crore for the year ended March 31, 2018 and March 31, 2017 respectively to the following defined contribution plans.
(` in Crore)
Particulars
Year ended March 31,
2018
Year ended March 31,
2017
Employer’s contribution to Provident fund and family pension fund 46 63 Employer’s contribution to superannuation 14 21
60 84
Central provident fund and family pension fundIn accordance with the Indian ‘The Employees Provident and Miscellaneous Provisions Act, 1952’, employees are entitled to receive benefits under the Provident Fund. Both the employee and the employer make monthly contributions to the plan at a predetermined rate (12% for 2018 and 2017) of an employee’s basic salary. All employees have an option to make additional voluntary contributions. These contributions are made to the fund administered and managed by the Government of India (GOI) or to independently managed and approved funds. The Group has no further obligations under the fund managed by the GOI beyond its monthly contributions which are charged to the consolidated statement of profit and loss in the period they are incurred. Where the contributions are made to independently managed and approved funds, shortfall in actual return, if any, from the return guaranteed by the State are made by the employer, these are accounted for as defined benefit plans.There is no such shortfall in the actual return for independently managed funds for the year ended March 31, 2018 and March 31, 2017. Having regard to the assets of the fund and the return on the investments, the Group does not expect any deficiency in the foreseeable future. The benefits are paid to employees on their retirement or resignation from the Group.
SuperannuationSuperannuation, another pension scheme applicable in India, is applicable only to senior executives. Vedanta Limited and each relevant Indian subsidiary holds a policy with Life Insurance Corporation of India (“LIC”), to which each of these entities contributes a fixed amount relating to superannuation and the pension annuity is met by LIC as required, taking into consideration the contributions made. The Group has no further obligations under the scheme beyond its monthly contributions which are charged to the consolidated statement of profit and loss in the period they are incurred.
Australian pension schemeThe Group also participates in defined contribution superannuation schemes in Australia. The contribution of a proportion of an employee’s salary in a superannuation fund is a legal requirement in Australia. The employer contributes, into the employee’s fund of choice, 9.50% of an employee’s gross remuneration where the employee is covered by an industrial agreement and 12.50% of the basic remuneration for all
46 Share based payments continued
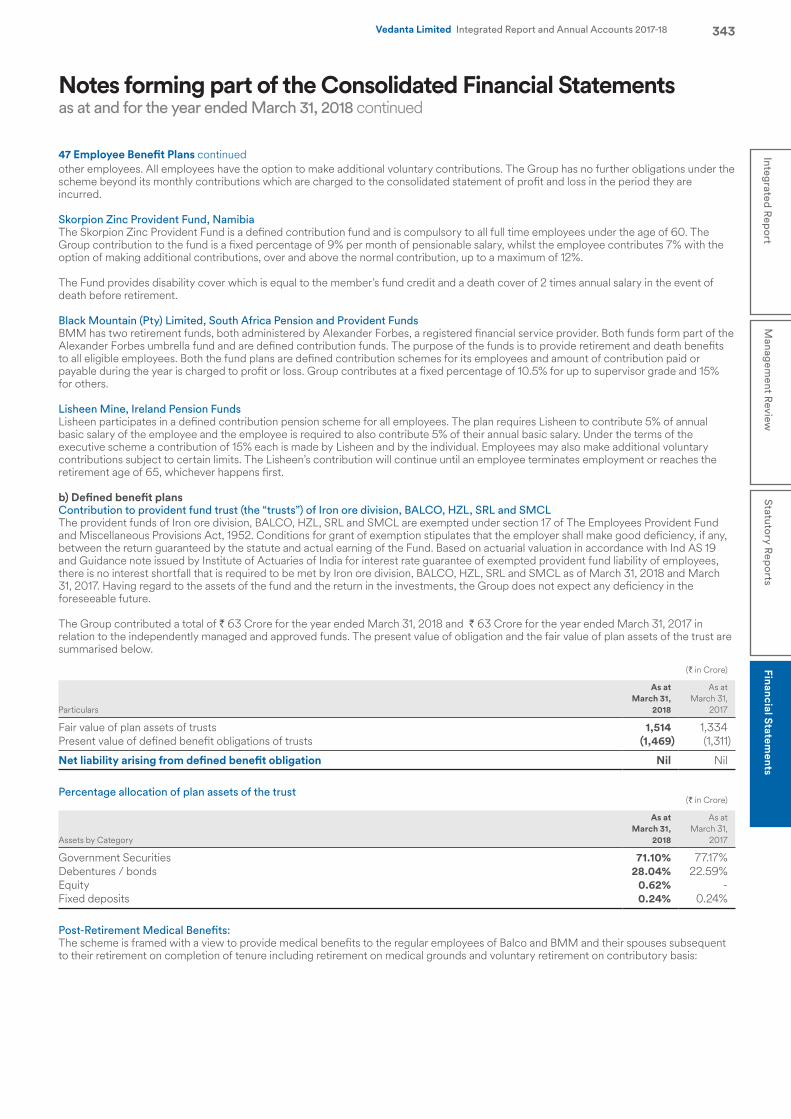
Notes forming part of the Consolidated Financial Statementsas at and for the year ended March 31, 2018 continued
343Integrated R
eport
Managem
ent Review
Statutory R
eports
Financial Statements
Vedanta Limited Integrated Report and Annual Accounts 2017-18
other employees. All employees have the option to make additional voluntary contributions. The Group has no further obligations under the scheme beyond its monthly contributions which are charged to the consolidated statement of profit and loss in the period they are incurred.
Skorpion Zinc Provident Fund, NamibiaThe Skorpion Zinc Provident Fund is a defined contribution fund and is compulsory to all full time employees under the age of 60. The Group contribution to the fund is a fixed percentage of 9% per month of pensionable salary, whilst the employee contributes 7% with the option of making additional contributions, over and above the normal contribution, up to a maximum of 12%.
The Fund provides disability cover which is equal to the member’s fund credit and a death cover of 2 times annual salary in the event of death before retirement.
Black Mountain (Pty) Limited, South Africa Pension and Provident FundsBMM has two retirement funds, both administered by Alexander Forbes, a registered financial service provider. Both funds form part of the Alexander Forbes umbrella fund and are defined contribution funds. The purpose of the funds is to provide retirement and death benefits to all eligible employees. Both the fund plans are defined contribution schemes for its employees and amount of contribution paid or payable during the year is charged to profit or loss. Group contributes at a fixed percentage of 10.5% for up to supervisor grade and 15% for others.
Lisheen Mine, Ireland Pension FundsLisheen participates in a defined contribution pension scheme for all employees. The plan requires Lisheen to contribute 5% of annual basic salary of the employee and the employee is required to also contribute 5% of their annual basic salary. Under the terms of the executive scheme a contribution of 15% each is made by Lisheen and by the individual. Employees may also make additional voluntary contributions subject to certain limits. The Lisheen’s contribution will continue until an employee terminates employment or reaches the retirement age of 65, whichever happens first.
b) Defined benefit plansContribution to provident fund trust (the “trusts”) of Iron ore division, BALCO, HZL, SRL and SMCLThe provident funds of Iron ore division, BALCO, HZL, SRL and SMCL are exempted under section 17 of The Employees Provident Fund and Miscellaneous Provisions Act, 1952. Conditions for grant of exemption stipulates that the employer shall make good deficiency, if any, between the return guaranteed by the statute and actual earning of the Fund. Based on actuarial valuation in accordance with Ind AS 19 and Guidance note issued by Institute of Actuaries of India for interest rate guarantee of exempted provident fund liability of employees, there is no interest shortfall that is required to be met by Iron ore division, BALCO, HZL, SRL and SMCL as of March 31, 2018 and March 31, 2017. Having regard to the assets of the fund and the return in the investments, the Group does not expect any deficiency in the foreseeable future.
The Group contributed a total of ` 63 Crore for the year ended March 31, 2018 and ` 63 Crore for the year ended March 31, 2017 in relation to the independently managed and approved funds. The present value of obligation and the fair value of plan assets of the trust are summarised below.
(` in Crore)
Particulars
As at March 31,
2018
As at March 31,
2017
Fair value of plan assets of trusts 1,514 1,334 Present value of defined benefit obligations of trusts (1,469) (1,311)
Net liability arising from defined benefit obligation Nil Nil
Percentage allocation of plan assets of the trust(` in Crore)
Assets by Category
As at March 31,
2018
As at March 31,
2017
Government Securities 71.10% 77.17%Debentures / bonds 28.04% 22.59%Equity 0.62% - Fixed deposits 0.24% 0.24%
Post-Retirement Medical Benefits:The scheme is framed with a view to provide medical benefits to the regular employees of Balco and BMM and their spouses subsequent to their retirement on completion of tenure including retirement on medical grounds and voluntary retirement on contributory basis:
47 Employee Benefit Plans continued
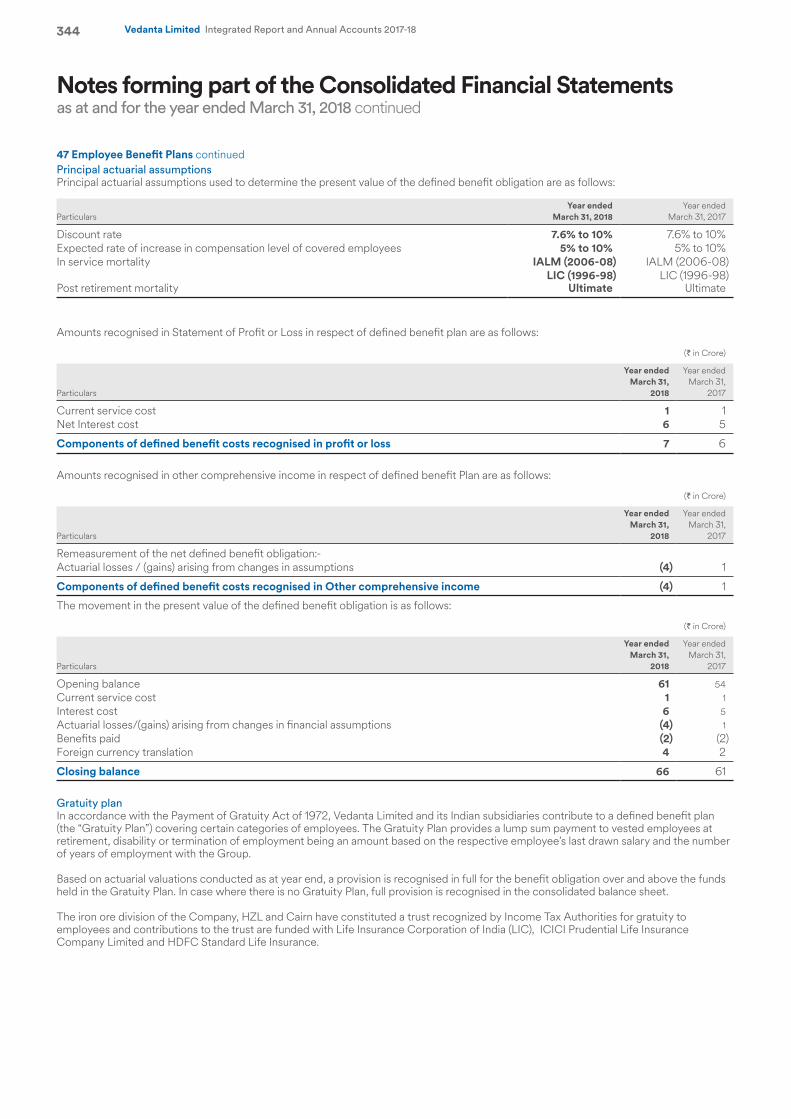
Notes forming part of the Consolidated Financial Statementsas at and for the year ended March 31, 2018 continued
344 Vedanta Limited Integrated Report and Annual Accounts 2017-18
Principal actuarial assumptionsPrincipal actuarial assumptions used to determine the present value of the defined benefit obligation are as follows:
ParticularsYear ended
March 31, 2018Year ended
March 31, 2017
Discount rate 7.6% to 10% 7.6% to 10%Expected rate of increase in compensation level of covered employees 5% to 10% 5% to 10%In service mortality IALM (2006-08) IALM (2006-08)
Post retirement mortalityLIC (1996-98)
UltimateLIC (1996-98)
Ultimate
Amounts recognised in Statement of Profit or Loss in respect of defined benefit plan are as follows:
(` in Crore)
Particulars
Year ended March 31,
2018
Year ended March 31,
2017
Current service cost 1 1 Net Interest cost 6 5
Components of defined benefit costs recognised in profit or loss 7 6
Amounts recognised in other comprehensive income in respect of defined benefit Plan are as follows:
(` in Crore)
Particulars
Year ended March 31,
2018
Year ended March 31,
2017
Remeasurement of the net defined benefit obligation:-Actuarial losses / (gains) arising from changes in assumptions (4) 1
Components of defined benefit costs recognised in Other comprehensive income (4) 1
The movement in the present value of the defined benefit obligation is as follows:
(` in Crore)
Particulars
Year ended March 31,
2018
Year ended March 31,
2017
Opening balance 61 54 Current service cost 1 1 Interest cost 6 5 Actuarial losses/(gains) arising from changes in financial assumptions (4) 1 Benefits paid (2) (2)Foreign currency translation 4 2
Closing balance 66 61
Gratuity planIn accordance with the Payment of Gratuity Act of 1972, Vedanta Limited and its Indian subsidiaries contribute to a defined benefit plan (the “Gratuity Plan”) covering certain categories of employees. The Gratuity Plan provides a lump sum payment to vested employees at retirement, disability or termination of employment being an amount based on the respective employee’s last drawn salary and the number of years of employment with the Group.
Based on actuarial valuations conducted as at year end, a provision is recognised in full for the benefit obligation over and above the funds held in the Gratuity Plan. In case where there is no Gratuity Plan, full provision is recognised in the consolidated balance sheet.
The iron ore division of the Company, HZL and Cairn have constituted a trust recognized by Income Tax Authorities for gratuity to employees and contributions to the trust are funded with Life Insurance Corporation of India (LIC), ICICI Prudential Life Insurance Company Limited and HDFC Standard Life Insurance.
47 Employee Benefit Plans continued
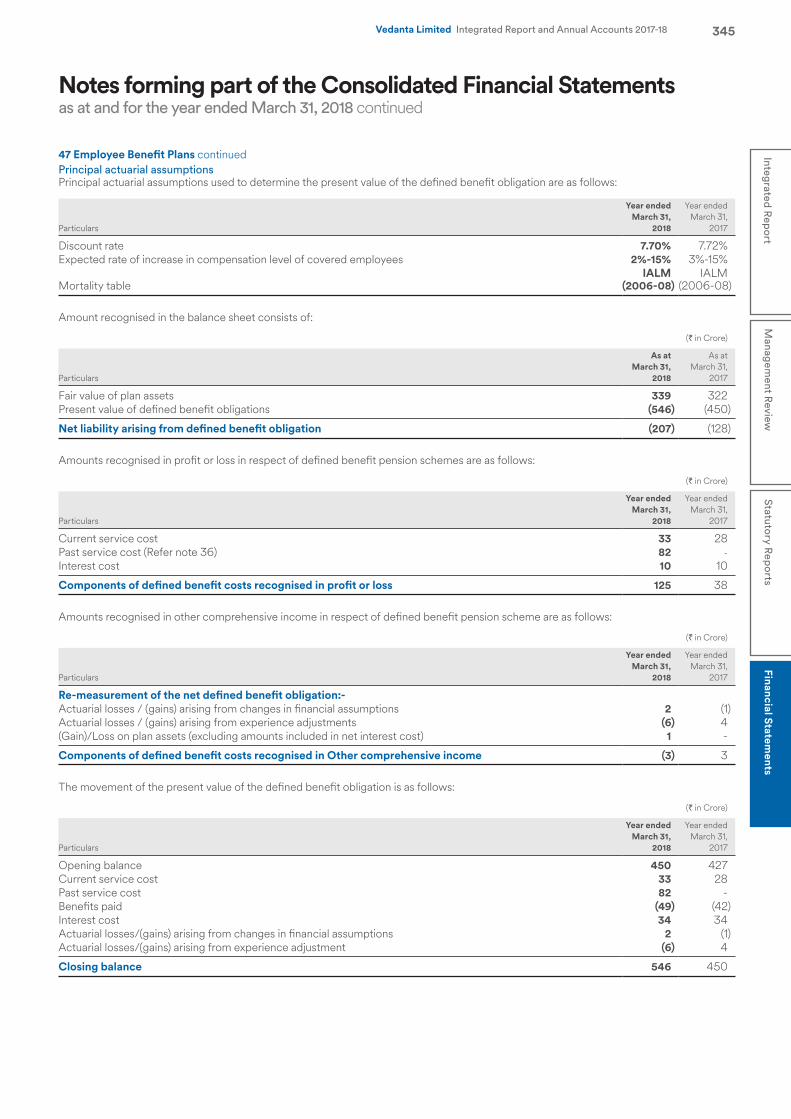
Notes forming part of the Consolidated Financial Statementsas at and for the year ended March 31, 2018 continued
345Integrated R
eport
Managem
ent Review
Statutory R
eports
Financial Statements
Vedanta Limited Integrated Report and Annual Accounts 2017-18
Principal actuarial assumptionsPrincipal actuarial assumptions used to determine the present value of the defined benefit obligation are as follows:
Particulars
Year ended March 31,
2018
Year ended March 31,
2017
Discount rate 7.70% 7.72%Expected rate of increase in compensation level of covered employees 2%-15% 3%-15%
Mortality tableIALM
(2006-08)IALM
(2006-08)
Amount recognised in the balance sheet consists of:
(` in Crore)
Particulars
As at March 31,
2018
As at March 31,
2017
Fair value of plan assets 339 322 Present value of defined benefit obligations (546) (450)
Net liability arising from defined benefit obligation (207) (128)
Amounts recognised in profit or loss in respect of defined benefit pension schemes are as follows:
(` in Crore)
Particulars
Year ended March 31,
2018
Year ended March 31,
2017
Current service cost 33 28 Past service cost (Refer note 36) 82 - Interest cost 10 10
Components of defined benefit costs recognised in profit or loss 125 38
Amounts recognised in other comprehensive income in respect of defined benefit pension scheme are as follows:
(` in Crore)
Particulars
Year ended March 31,
2018
Year ended March 31,
2017
Re-measurement of the net defined benefit obligation:-Actuarial losses / (gains) arising from changes in financial assumptions 2 (1)Actuarial losses / (gains) arising from experience adjustments (6) 4 (Gain)/Loss on plan assets (excluding amounts included in net interest cost) 1 -
Components of defined benefit costs recognised in Other comprehensive income (3) 3
The movement of the present value of the defined benefit obligation is as follows:
(` in Crore)
Particulars
Year ended March 31,
2018
Year ended March 31,
2017
Opening balance 450 427 Current service cost 33 28 Past service cost 82 - Benefits paid (49) (42)Interest cost 34 34 Actuarial losses/(gains) arising from changes in financial assumptions 2 (1)Actuarial losses/(gains) arising from experience adjustment (6) 4
Closing balance 546 450
47 Employee Benefit Plans continued
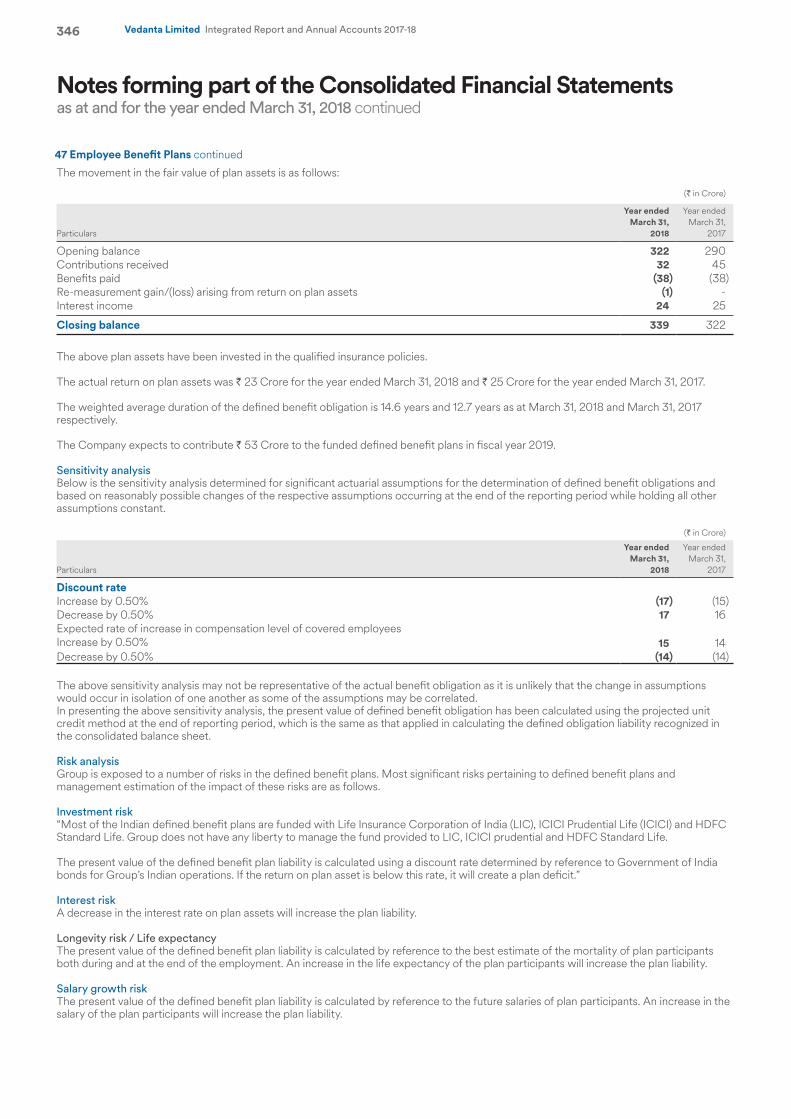
Notes forming part of the Consolidated Financial Statementsas at and for the year ended March 31, 2018 continued
346 Vedanta Limited Integrated Report and Annual Accounts 2017-18
The movement in the fair value of plan assets is as follows:
(` in Crore)
Particulars
Year ended March 31,
2018
Year ended March 31,
2017
Opening balance 322 290 Contributions received 32 45 Benefits paid (38) (38)Re-measurement gain/(loss) arising from return on plan assets (1) - Interest income 24 25
Closing balance 339 322
The above plan assets have been invested in the qualified insurance policies.
The actual return on plan assets was ` 23 Crore for the year ended March 31, 2018 and ` 25 Crore for the year ended March 31, 2017. The weighted average duration of the defined benefit obligation is 14.6 years and 12.7 years as at March 31, 2018 and March 31, 2017 respectively.
The Company expects to contribute ` 53 Crore to the funded defined benefit plans in fiscal year 2019.
Sensitivity analysis Below is the sensitivity analysis determined for significant actuarial assumptions for the determination of defined benefit obligations and based on reasonably possible changes of the respective assumptions occurring at the end of the reporting period while holding all other assumptions constant.
(` in Crore)
Particulars
Year ended March 31,
2018
Year ended March 31,
2017
Discount rateIncrease by 0.50% (17) (15)Decrease by 0.50% 17 16 Expected rate of increase in compensation level of covered employees Increase by 0.50% 15 14 Decrease by 0.50% (14) (14)
The above sensitivity analysis may not be representative of the actual benefit obligation as it is unlikely that the change in assumptions would occur in isolation of one another as some of the assumptions may be correlated.In presenting the above sensitivity analysis, the present value of defined benefit obligation has been calculated using the projected unit credit method at the end of reporting period, which is the same as that applied in calculating the defined obligation liability recognized in the consolidated balance sheet.
Risk analysisGroup is exposed to a number of risks in the defined benefit plans. Most significant risks pertaining to defined benefit plans and management estimation of the impact of these risks are as follows.
Investment risk“Most of the Indian defined benefit plans are funded with Life Insurance Corporation of India (LIC), ICICI Prudential Life (ICICI) and HDFC Standard Life. Group does not have any liberty to manage the fund provided to LIC, ICICI prudential and HDFC Standard Life. The present value of the defined benefit plan liability is calculated using a discount rate determined by reference to Government of India bonds for Group’s Indian operations. If the return on plan asset is below this rate, it will create a plan deficit.”
Interest riskA decrease in the interest rate on plan assets will increase the plan liability.
Longevity risk / Life expectancyThe present value of the defined benefit plan liability is calculated by reference to the best estimate of the mortality of plan participants both during and at the end of the employment. An increase in the life expectancy of the plan participants will increase the plan liability.
Salary growth riskThe present value of the defined benefit plan liability is calculated by reference to the future salaries of plan participants. An increase in the salary of the plan participants will increase the plan liability.
47 Employee Benefit Plans continued
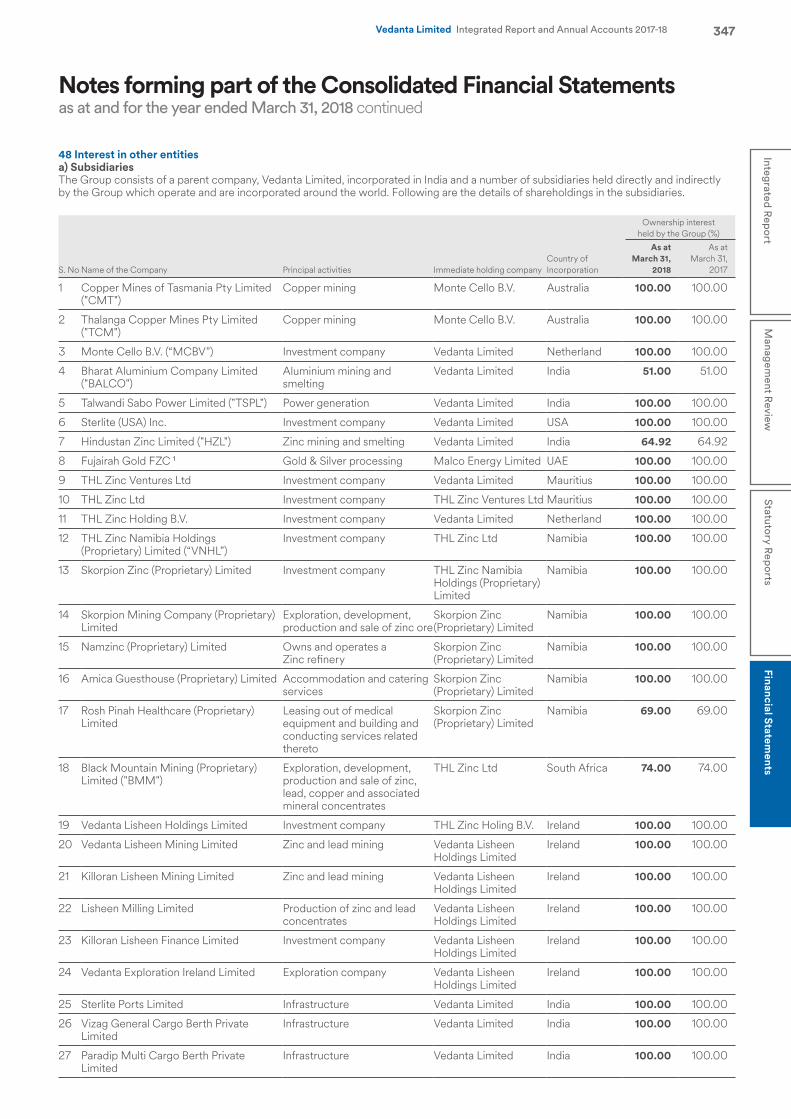
Notes forming part of the Consolidated Financial Statementsas at and for the year ended March 31, 2018 continued
347Integrated R
eport
Managem
ent Review
Statutory R
eports
Financial Statements
Vedanta Limited Integrated Report and Annual Accounts 2017-18
48 Interest in other entitiesa) SubsidiariesThe Group consists of a parent company, Vedanta Limited, incorporated in India and a number of subsidiaries held directly and indirectly by the Group which operate and are incorporated around the world. Following are the details of shareholdings in the subsidiaries.
Ownership interest held by the Group (%)
S. No Name of the Company Principal activities Immediate holding companyCountry of Incorporation
As at March 31,
2018
As at March 31,
2017
1 Copper Mines of Tasmania Pty Limited ("CMT")
Copper mining Monte Cello B.V. Australia 100.00 100.00
2 Thalanga Copper Mines Pty Limited ("TCM")
Copper mining Monte Cello B.V. Australia 100.00 100.00
3 Monte Cello B.V. (“MCBV”) Investment company Vedanta Limited Netherland 100.00 100.00
4 Bharat Aluminium Company Limited ("BALCO")
Aluminium mining and smelting
Vedanta Limited India 51.00 51.00
5 Talwandi Sabo Power Limited ("TSPL") Power generation Vedanta Limited India 100.00 100.00
6 Sterlite (USA) Inc. Investment company Vedanta Limited USA 100.00 100.00
7 Hindustan Zinc Limited ("HZL") Zinc mining and smelting Vedanta Limited India 64.92 64.92
8 Fujairah Gold FZC 1 Gold & Silver processing Malco Energy Limited UAE 100.00 100.00
9 THL Zinc Ventures Ltd Investment company Vedanta Limited Mauritius 100.00 100.00
10 THL Zinc Ltd Investment company THL Zinc Ventures Ltd Mauritius 100.00 100.00
11 THL Zinc Holding B.V. Investment company Vedanta Limited Netherland 100.00 100.00
12 THL Zinc Namibia Holdings (Proprietary) Limited (“VNHL”)
Investment company THL Zinc Ltd Namibia 100.00 100.00
13 Skorpion Zinc (Proprietary) Limited Investment company THL Zinc Namibia Holdings (Proprietary) Limited
Namibia 100.00 100.00
14 Skorpion Mining Company (Proprietary) Limited
Exploration, development, production and sale of zinc ore
Skorpion Zinc (Proprietary) Limited
Namibia 100.00 100.00
15 Namzinc (Proprietary) Limited Owns and operates aZinc refinery
Skorpion Zinc (Proprietary) Limited
Namibia 100.00 100.00
16 Amica Guesthouse (Proprietary) Limited Accommodation and catering services
Skorpion Zinc (Proprietary) Limited
Namibia 100.00 100.00
17 Rosh Pinah Healthcare (Proprietary) Limited
Leasing out of medical equipment and building and conducting services related thereto
Skorpion Zinc (Proprietary) Limited
Namibia 69.00 69.00
18 Black Mountain Mining (Proprietary) Limited ("BMM")
Exploration, development, production and sale of zinc, lead, copper and associated mineral concentrates
THL Zinc Ltd South Africa 74.00 74.00
19 Vedanta Lisheen Holdings Limited Investment company THL Zinc Holing B.V. Ireland 100.00 100.00
20 Vedanta Lisheen Mining Limited Zinc and lead mining Vedanta Lisheen Holdings Limited
Ireland 100.00 100.00
21 Killoran Lisheen Mining Limited Zinc and lead mining Vedanta Lisheen Holdings Limited
Ireland 100.00 100.00
22 Lisheen Milling Limited Production of zinc and lead concentrates
Vedanta Lisheen Holdings Limited
Ireland 100.00 100.00
23 Killoran Lisheen Finance Limited Investment company Vedanta Lisheen Holdings Limited
Ireland 100.00 100.00
24 Vedanta Exploration Ireland Limited Exploration company Vedanta Lisheen Holdings Limited
Ireland 100.00 100.00
25 Sterlite Ports Limited Infrastructure Vedanta Limited India 100.00 100.00
26 Vizag General Cargo Berth Private Limited
Infrastructure Vedanta Limited India 100.00 100.00
27 Paradip Multi Cargo Berth Private Limited
Infrastructure Vedanta Limited India 100.00 100.00
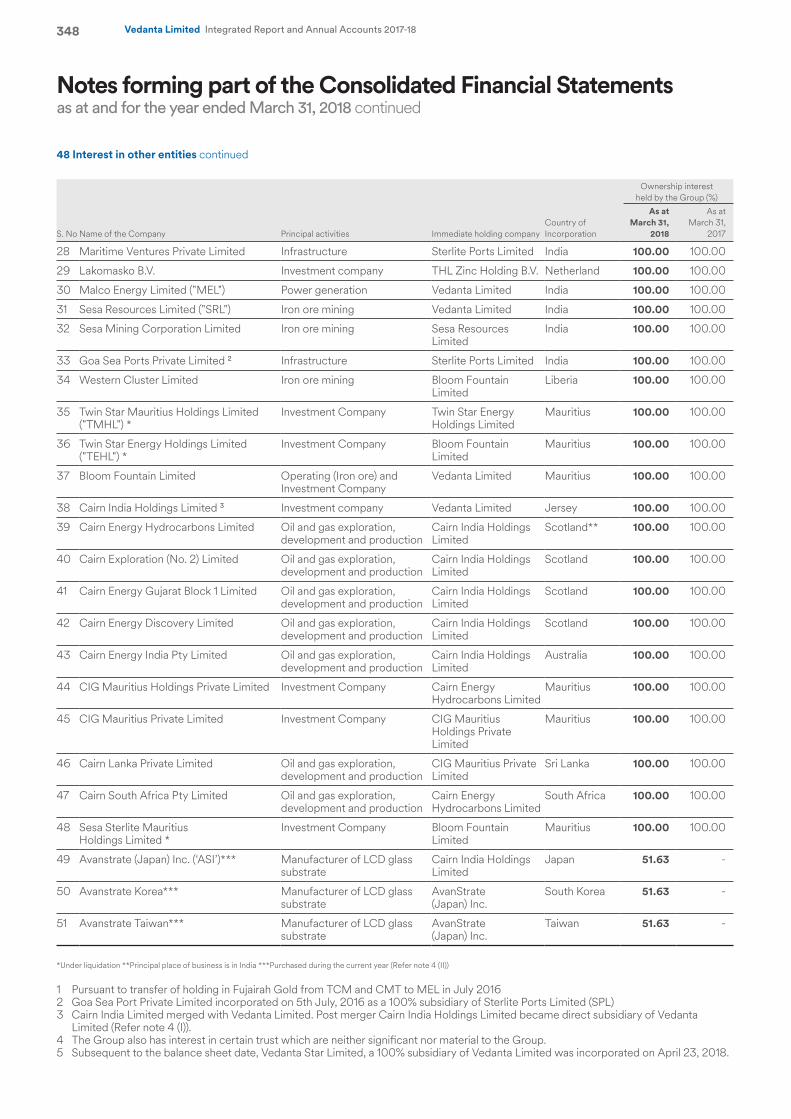
Notes forming part of the Consolidated Financial Statementsas at and for the year ended March 31, 2018 continued
348 Vedanta Limited Integrated Report and Annual Accounts 2017-18
Ownership interest held by the Group (%)
S. No Name of the Company Principal activities Immediate holding companyCountry of Incorporation
As at March 31,
2018
As at March 31,
2017
28 Maritime Ventures Private Limited Infrastructure Sterlite Ports Limited India 100.00 100.00
29 Lakomasko B.V. Investment company THL Zinc Holding B.V. Netherland 100.00 100.00
30 Malco Energy Limited ("MEL") Power generation Vedanta Limited India 100.00 100.00
31 Sesa Resources Limited ("SRL") Iron ore mining Vedanta Limited India 100.00 100.00
32 Sesa Mining Corporation Limited Iron ore mining Sesa Resources Limited
India 100.00 100.00
33 Goa Sea Ports Private Limited 2 Infrastructure Sterlite Ports Limited India 100.00 100.00
34 Western Cluster Limited Iron ore mining Bloom Fountain Limited
Liberia 100.00 100.00
35 Twin Star Mauritius Holdings Limited ("TMHL") *
Investment Company Twin Star Energy Holdings Limited
Mauritius 100.00 100.00
36 Twin Star Energy Holdings Limited ("TEHL") *
Investment Company Bloom Fountain Limited
Mauritius 100.00 100.00
37 Bloom Fountain Limited Operating (Iron ore) and Investment Company
Vedanta Limited Mauritius 100.00 100.00
38 Cairn India Holdings Limited 3 Investment company Vedanta Limited Jersey 100.00 100.00
39 Cairn Energy Hydrocarbons Limited Oil and gas exploration, development and production
Cairn India Holdings Limited
Scotland** 100.00 100.00
40 Cairn Exploration (No. 2) Limited Oil and gas exploration, development and production
Cairn India Holdings Limited
Scotland 100.00 100.00
41 Cairn Energy Gujarat Block 1 Limited Oil and gas exploration, development and production
Cairn India Holdings Limited
Scotland 100.00 100.00
42 Cairn Energy Discovery Limited Oil and gas exploration, development and production
Cairn India Holdings Limited
Scotland 100.00 100.00
43 Cairn Energy India Pty Limited Oil and gas exploration, development and production
Cairn India Holdings Limited
Australia 100.00 100.00
44 CIG Mauritius Holdings Private Limited Investment Company Cairn Energy Hydrocarbons Limited
Mauritius 100.00 100.00
45 CIG Mauritius Private Limited Investment Company CIG Mauritius Holdings Private Limited
Mauritius 100.00 100.00
46 Cairn Lanka Private Limited Oil and gas exploration, development and production
CIG Mauritius Private Limited
Sri Lanka 100.00 100.00
47 Cairn South Africa Pty Limited Oil and gas exploration, development and production
Cairn Energy Hydrocarbons Limited
South Africa 100.00 100.00
48 Sesa Sterlite Mauritius Holdings Limited *
Investment Company Bloom Fountain Limited
Mauritius 100.00 100.00
49 Avanstrate (Japan) Inc. (‘ASI’)*** Manufacturer of LCD glass substrate
Cairn India Holdings Limited
Japan 51.63 -
50 Avanstrate Korea*** Manufacturer of LCD glass substrate
AvanStrate (Japan) Inc.
South Korea 51.63 -
51 Avanstrate Taiwan*** Manufacturer of LCD glass substrate
AvanStrate (Japan) Inc.
Taiwan 51.63 -
*Under liquidation **Principal place of business is in India ***Purchased during the current year (Refer note 4 (II))
1 Pursuant to transfer of holding in Fujairah Gold from TCM and CMT to MEL in July 20162 Goa Sea Port Private Limited incorporated on 5th July, 2016 as a 100% subsidiary of Sterlite Ports Limited (SPL)3 Cairn India Limited merged with Vedanta Limited. Post merger Cairn India Holdings Limited became direct subsidiary of Vedanta
Limited (Refer note 4 (I)).4 The Group also has interest in certain trust which are neither significant nor material to the Group.5 Subsequent to the balance sheet date, Vedanta Star Limited, a 100% subsidiary of Vedanta Limited was incorporated on April 23, 2018.
48 Interest in other entities continued
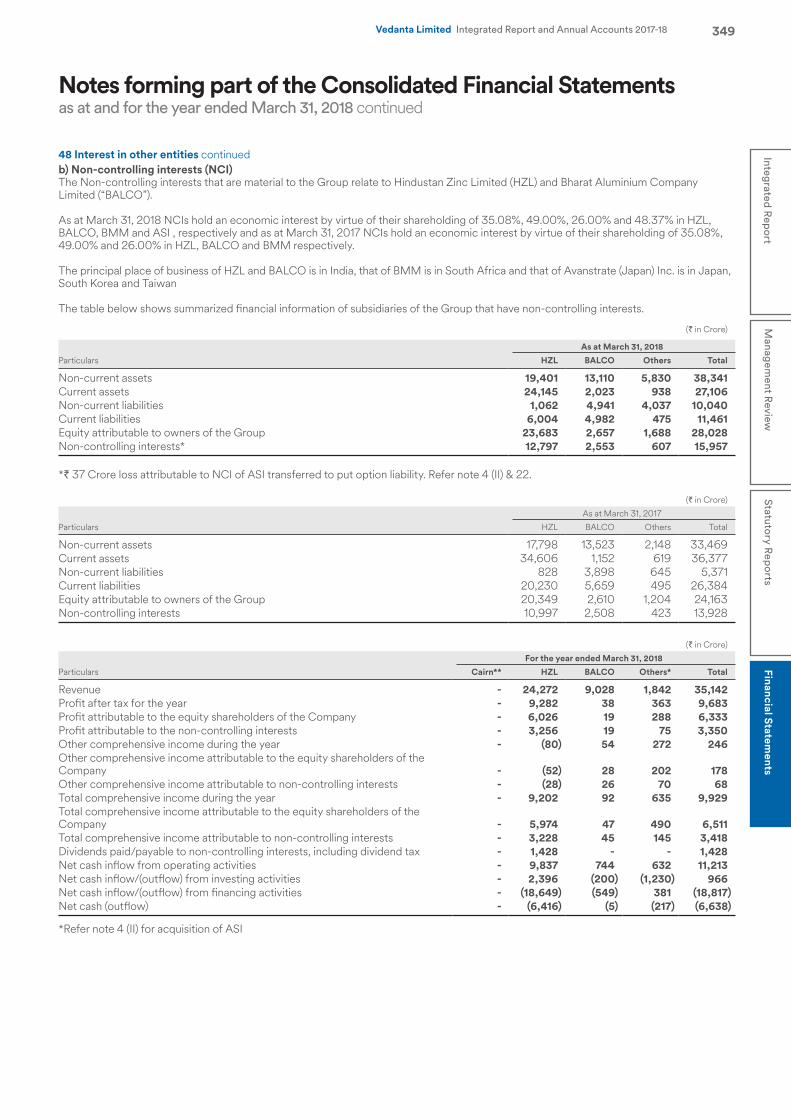
Notes forming part of the Consolidated Financial Statementsas at and for the year ended March 31, 2018 continued
349Integrated R
eport
Managem
ent Review
Statutory R
eports
Financial Statements
Vedanta Limited Integrated Report and Annual Accounts 2017-18
b) Non-controlling interests (NCI)The Non-controlling interests that are material to the Group relate to Hindustan Zinc Limited (HZL) and Bharat Aluminium Company Limited (“BALCO”).
As at March 31, 2018 NCIs hold an economic interest by virtue of their shareholding of 35.08%, 49.00%, 26.00% and 48.37% in HZL, BALCO, BMM and ASI , respectively and as at March 31, 2017 NCIs hold an economic interest by virtue of their shareholding of 35.08%, 49.00% and 26.00% in HZL, BALCO and BMM respectively.
The principal place of business of HZL and BALCO is in India, that of BMM is in South Africa and that of Avanstrate (Japan) Inc. is in Japan, South Korea and Taiwan
The table below shows summarized financial information of subsidiaries of the Group that have non-controlling interests.
(` in Crore)
Particulars
As at March 31, 2018
HZL BALCO Others Total
Non-current assets 19,401 13,110 5,830 38,341 Current assets 24,145 2,023 938 27,106 Non-current liabilities 1,062 4,941 4,037 10,040 Current liabilities 6,004 4,982 475 11,461 Equity attributable to owners of the Group 23,683 2,657 1,688 28,028 Non-controlling interests* 12,797 2,553 607 15,957
*` 37 Crore loss attributable to NCI of ASI transferred to put option liability. Refer note 4 (II) & 22.
(` in Crore)
Particulars
As at March 31, 2017
HZL BALCO Others Total
Non-current assets 17,798 13,523 2,148 33,469 Current assets 34,606 1,152 619 36,377 Non-current liabilities 828 3,898 645 5,371 Current liabilities 20,230 5,659 495 26,384 Equity attributable to owners of the Group 20,349 2,610 1,204 24,163 Non-controlling interests 10,997 2,508 423 13,928
(` in Crore)
Particulars
For the year ended March 31, 2018
Cairn** HZL BALCO Others* Total
Revenue - 24,272 9,028 1,842 35,142 Profit after tax for the year - 9,282 38 363 9,683 Profit attributable to the equity shareholders of the Company - 6,026 19 288 6,333 Profit attributable to the non-controlling interests - 3,256 19 75 3,350 Other comprehensive income during the year - (80) 54 272 246 Other comprehensive income attributable to the equity shareholders of the Company - (52) 28 202 178 Other comprehensive income attributable to non-controlling interests - (28) 26 70 68 Total comprehensive income during the year - 9,202 92 635 9,929 Total comprehensive income attributable to the equity shareholders of the Company - 5,974 47 490 6,511 Total comprehensive income attributable to non-controlling interests - 3,228 45 145 3,418 Dividends paid/payable to non-controlling interests, including dividend tax - 1,428 - - 1,428 Net cash inflow from operating activities - 9,837 744 632 11,213Net cash inflow/(outflow) from investing activities - 2,396 (200) (1,230) 966 Net cash inflow/(outflow) from financing activities - (18,649) (549) 381 (18,817)Net cash (outflow) - (6,416) (5) (217) (6,638)
*Refer note 4 (II) for acquisition of ASI
48 Interest in other entities continued
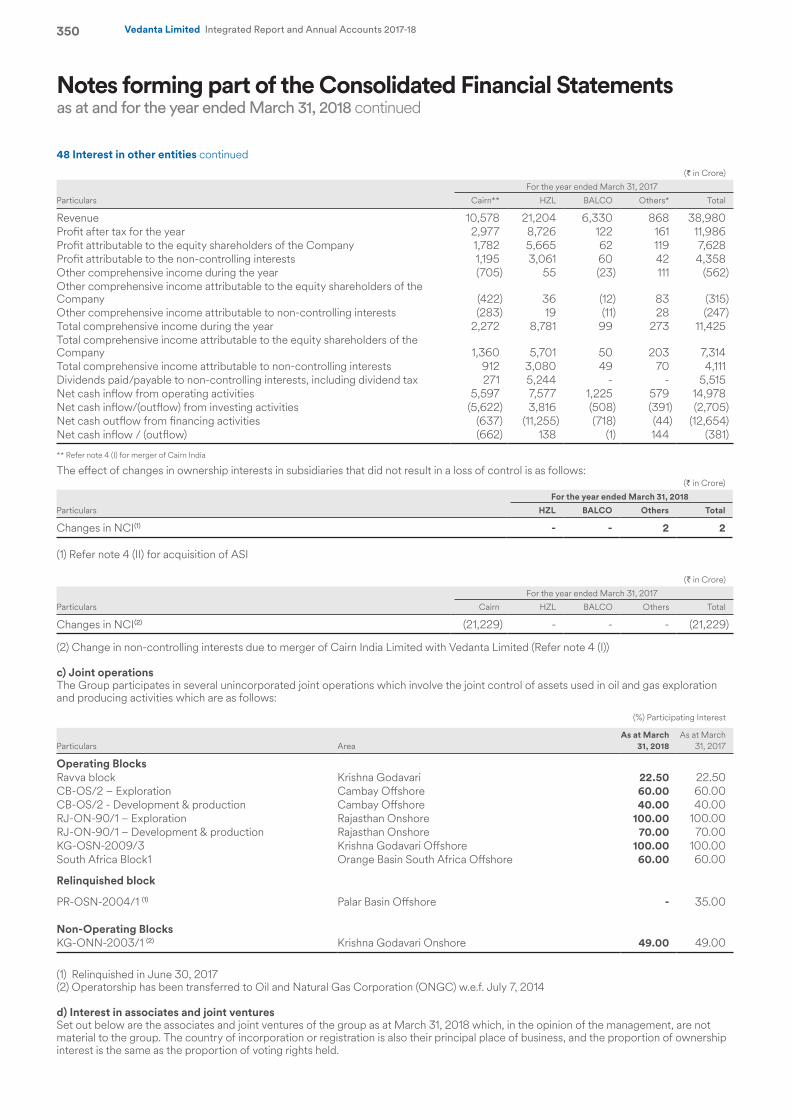
Notes forming part of the Consolidated Financial Statementsas at and for the year ended March 31, 2018 continued
350 Vedanta Limited Integrated Report and Annual Accounts 2017-18
(` in Crore)
Particulars
For the year ended March 31, 2017
Cairn** HZL BALCO Others* Total
Revenue 10,578 21,204 6,330 868 38,980 Profit after tax for the year 2,977 8,726 122 161 11,986 Profit attributable to the equity shareholders of the Company 1,782 5,665 62 119 7,628 Profit attributable to the non-controlling interests 1,195 3,061 60 42 4,358 Other comprehensive income during the year (705) 55 (23) 111 (562)Other comprehensive income attributable to the equity shareholders of the Company (422) 36 (12) 83 (315)Other comprehensive income attributable to non-controlling interests (283) 19 (11) 28 (247)Total comprehensive income during the year 2,272 8,781 99 273 11,425 Total comprehensive income attributable to the equity shareholders of the Company 1,360 5,701 50 203 7,314 Total comprehensive income attributable to non-controlling interests 912 3,080 49 70 4,111 Dividends paid/payable to non-controlling interests, including dividend tax 271 5,244 - - 5,515 Net cash inflow from operating activities 5,597 7,577 1,225 579 14,978 Net cash inflow/(outflow) from investing activities (5,622) 3,816 (508) (391) (2,705)Net cash outflow from financing activities (637) (11,255) (718) (44) (12,654)Net cash inflow / (outflow) (662) 138 (1) 144 (381)
** Refer note 4 (I) for merger of Cairn India
The effect of changes in ownership interests in subsidiaries that did not result in a loss of control is as follows:(` in Crore)
Particulars
For the year ended March 31, 2018
HZL BALCO Others Total
Changes in NCI(1) - - 2 2
(1) Refer note 4 (II) for acquisition of ASI
(` in Crore)
Particulars
For the year ended March 31, 2017
Cairn HZL BALCO Others Total
Changes in NCI(2) (21,229) - - - (21,229)
(2) Change in non-controlling interests due to merger of Cairn India Limited with Vedanta Limited (Refer note 4 (I))
c) Joint operationsThe Group participates in several unincorporated joint operations which involve the joint control of assets used in oil and gas exploration and producing activities which are as follows:
(%) Participating Interest
Particulars AreaAs at March
31, 2018As at March
31, 2017
Operating BlocksRavva block Krishna Godavari 22.50 22.50 CB-OS/2 – Exploration Cambay Offshore 60.00 60.00 CB-OS/2 - Development & production Cambay Offshore 40.00 40.00 RJ-ON-90/1 – Exploration Rajasthan Onshore 100.00 100.00 RJ-ON-90/1 – Development & production Rajasthan Onshore 70.00 70.00 KG-OSN-2009/3 Krishna Godavari Offshore 100.00 100.00 South Africa Block1 Orange Basin South Africa Offshore 60.00 60.00
Relinquished block
PR-OSN-2004/1 (1) Palar Basin Offshore - 35.00
Non-Operating Blocks KG-ONN-2003/1 (2) Krishna Godavari Onshore 49.00 49.00
(1) Relinquished in June 30, 2017(2) Operatorship has been transferred to Oil and Natural Gas Corporation (ONGC) w.e.f. July 7, 2014
d) Interest in associates and joint venturesSet out below are the associates and joint ventures of the group as at March 31, 2018 which, in the opinion of the management, are not material to the group. The country of incorporation or registration is also their principal place of business, and the proportion of ownership interest is the same as the proportion of voting rights held.
48 Interest in other entities continued
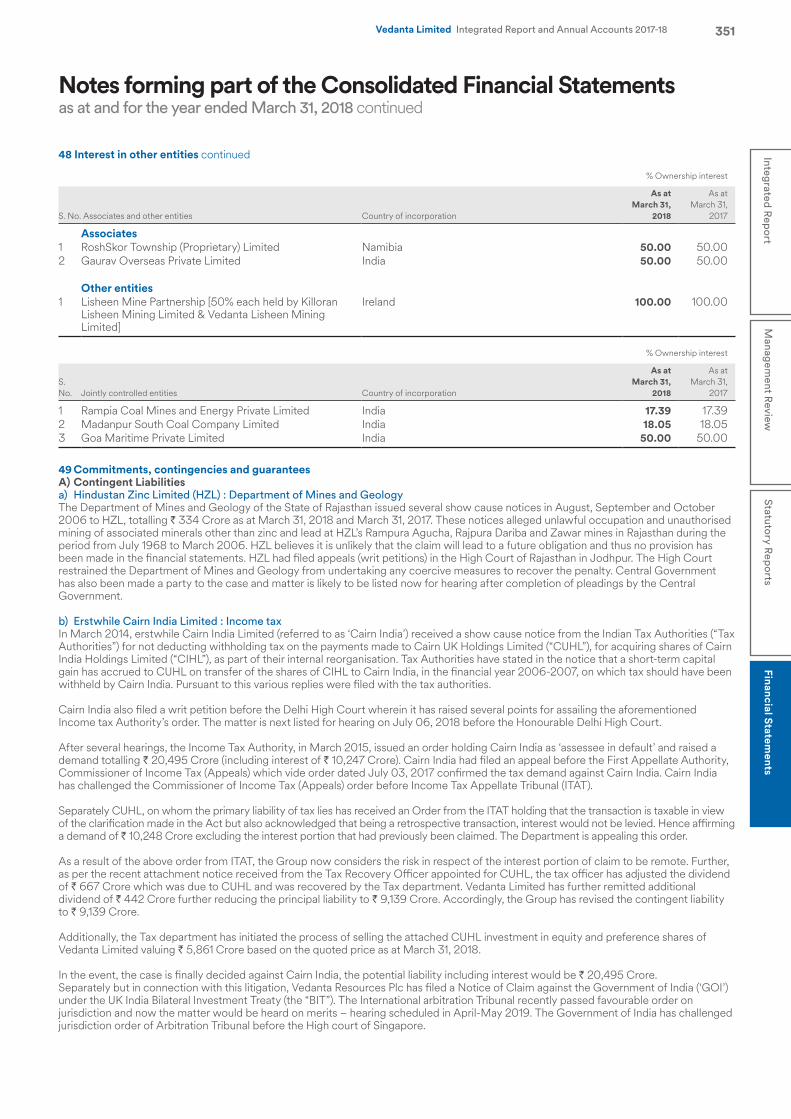
Notes forming part of the Consolidated Financial Statementsas at and for the year ended March 31, 2018 continued
351Integrated R
eport
Managem
ent Review
Statutory R
eports
Financial Statements
Vedanta Limited Integrated Report and Annual Accounts 2017-18
% Ownership interest
S. No. Associates and other entities Country of incorporation
As atMarch 31,
2018
As atMarch 31,
2017
Associates1 RoshSkor Township (Proprietary) Limited Namibia 50.00 50.00 2 Gaurav Overseas Private Limited India 50.00 50.00
Other entities1 Lisheen Mine Partnership [50% each held by Killoran
Lisheen Mining Limited & Vedanta Lisheen Mining Limited]
Ireland 100.00 100.00
% Ownership interest
S. No. Jointly controlled entities Country of incorporation
As at March 31,
2018
As at March 31,
2017
1 Rampia Coal Mines and Energy Private Limited India 17.39 17.39 2 Madanpur South Coal Company Limited India 18.05 18.05 3 Goa Maritime Private Limited India 50.00 50.00
49 Commitments, contingencies and guarantees A) Contingent Liabilities a) Hindustan Zinc Limited (HZL) : Department of Mines and GeologyThe Department of Mines and Geology of the State of Rajasthan issued several show cause notices in August, September and October 2006 to HZL, totalling ` 334 Crore as at March 31, 2018 and March 31, 2017. These notices alleged unlawful occupation and unauthorised mining of associated minerals other than zinc and lead at HZL’s Rampura Agucha, Rajpura Dariba and Zawar mines in Rajasthan during the period from July 1968 to March 2006. HZL believes it is unlikely that the claim will lead to a future obligation and thus no provision has been made in the financial statements. HZL had filed appeals (writ petitions) in the High Court of Rajasthan in Jodhpur. The High Court restrained the Department of Mines and Geology from undertaking any coercive measures to recover the penalty. Central Government has also been made a party to the case and matter is likely to be listed now for hearing after completion of pleadings by the Central Government.
b) Erstwhile Cairn India Limited : Income taxIn March 2014, erstwhile Cairn India Limited (referred to as ‘Cairn India’) received a show cause notice from the Indian Tax Authorities (“Tax Authorities”) for not deducting withholding tax on the payments made to Cairn UK Holdings Limited (“CUHL”), for acquiring shares of Cairn India Holdings Limited (“CIHL”), as part of their internal reorganisation. Tax Authorities have stated in the notice that a short-term capital gain has accrued to CUHL on transfer of the shares of CIHL to Cairn India, in the financial year 2006-2007, on which tax should have been withheld by Cairn India. Pursuant to this various replies were filed with the tax authorities.
Cairn India also filed a writ petition before the Delhi High Court wherein it has raised several points for assailing the aforementioned Income tax Authority’s order. The matter is next listed for hearing on July 06, 2018 before the Honourable Delhi High Court.
After several hearings, the Income Tax Authority, in March 2015, issued an order holding Cairn India as ‘assessee in default’ and raised a demand totalling ` 20,495 Crore (including interest of ` 10,247 Crore). Cairn India had filed an appeal before the First Appellate Authority, Commissioner of Income Tax (Appeals) which vide order dated July 03, 2017 confirmed the tax demand against Cairn India. Cairn India has challenged the Commissioner of Income Tax (Appeals) order before Income Tax Appellate Tribunal (ITAT).
Separately CUHL, on whom the primary liability of tax lies has received an Order from the ITAT holding that the transaction is taxable in view of the clarification made in the Act but also acknowledged that being a retrospective transaction, interest would not be levied. Hence affirming a demand of ` 10,248 Crore excluding the interest portion that had previously been claimed. The Department is appealing this order.
As a result of the above order from ITAT, the Group now considers the risk in respect of the interest portion of claim to be remote. Further, as per the recent attachment notice received from the Tax Recovery Officer appointed for CUHL, the tax officer has adjusted the dividend of ` 667 Crore which was due to CUHL and was recovered by the Tax department. Vedanta Limited has further remitted additional dividend of ` 442 Crore further reducing the principal liability to ` 9,139 Crore. Accordingly, the Group has revised the contingent liability to ` 9,139 Crore.
Additionally, the Tax department has initiated the process of selling the attached CUHL investment in equity and preference shares of Vedanta Limited valuing ` 5,861 Crore based on the quoted price as at March 31, 2018.
In the event, the case is finally decided against Cairn India, the potential liability including interest would be ` 20,495 Crore.Separately but in connection with this litigation, Vedanta Resources Plc has filed a Notice of Claim against the Government of India (‘GOI’) under the UK India Bilateral Investment Treaty (the “BIT”). The International arbitration Tribunal recently passed favourable order on jurisdiction and now the matter would be heard on merits – hearing scheduled in April-May 2019. The Government of India has challenged jurisdiction order of Arbitration Tribunal before the High court of Singapore.
48 Interest in other entities continued
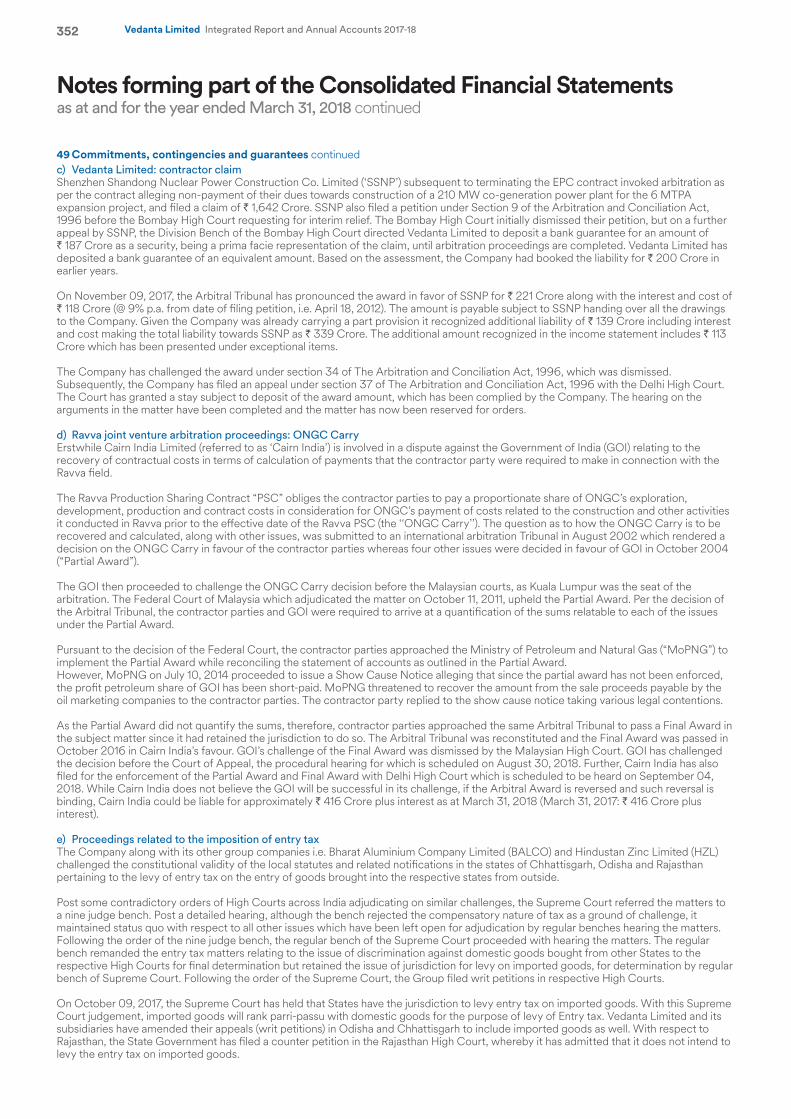
Notes forming part of the Consolidated Financial Statementsas at and for the year ended March 31, 2018 continued
352 Vedanta Limited Integrated Report and Annual Accounts 2017-18
c) Vedanta Limited: contractor claimShenzhen Shandong Nuclear Power Construction Co. Limited (‘SSNP’) subsequent to terminating the EPC contract invoked arbitration as per the contract alleging non-payment of their dues towards construction of a 210 MW co-generation power plant for the 6 MTPA expansion project, and filed a claim of ` 1,642 Crore. SSNP also filed a petition under Section 9 of the Arbitration and Conciliation Act, 1996 before the Bombay High Court requesting for interim relief. The Bombay High Court initially dismissed their petition, but on a further appeal by SSNP, the Division Bench of the Bombay High Court directed Vedanta Limited to deposit a bank guarantee for an amount of ` 187 Crore as a security, being a prima facie representation of the claim, until arbitration proceedings are completed. Vedanta Limited has deposited a bank guarantee of an equivalent amount. Based on the assessment, the Company had booked the liability for ` 200 Crore in earlier years.
On November 09, 2017, the Arbitral Tribunal has pronounced the award in favor of SSNP for ` 221 Crore along with the interest and cost of ` 118 Crore (@ 9% p.a. from date of filing petition, i.e. April 18, 2012). The amount is payable subject to SSNP handing over all the drawings to the Company. Given the Company was already carrying a part provision it recognized additional liability of ` 139 Crore including interest and cost making the total liability towards SSNP as ` 339 Crore. The additional amount recognized in the income statement includes ` 113 Crore which has been presented under exceptional items.
The Company has challenged the award under section 34 of The Arbitration and Conciliation Act, 1996, which was dismissed. Subsequently, the Company has filed an appeal under section 37 of The Arbitration and Conciliation Act, 1996 with the Delhi High Court. The Court has granted a stay subject to deposit of the award amount, which has been complied by the Company. The hearing on the arguments in the matter have been completed and the matter has now been reserved for orders.
d) Ravva joint venture arbitration proceedings: ONGC CarryErstwhile Cairn India Limited (referred to as ‘Cairn India’) is involved in a dispute against the Government of India (GOI) relating to the recovery of contractual costs in terms of calculation of payments that the contractor party were required to make in connection with the Ravva field.
The Ravva Production Sharing Contract “PSC” obliges the contractor parties to pay a proportionate share of ONGC’s exploration, development, production and contract costs in consideration for ONGC’s payment of costs related to the construction and other activities it conducted in Ravva prior to the effective date of the Ravva PSC (the ‘‘ONGC Carry’’). The question as to how the ONGC Carry is to be recovered and calculated, along with other issues, was submitted to an international arbitration Tribunal in August 2002 which rendered a decision on the ONGC Carry in favour of the contractor parties whereas four other issues were decided in favour of GOI in October 2004 (“Partial Award”).
The GOI then proceeded to challenge the ONGC Carry decision before the Malaysian courts, as Kuala Lumpur was the seat of the arbitration. The Federal Court of Malaysia which adjudicated the matter on October 11, 2011, upheld the Partial Award. Per the decision of the Arbitral Tribunal, the contractor parties and GOI were required to arrive at a quantification of the sums relatable to each of the issues under the Partial Award.
Pursuant to the decision of the Federal Court, the contractor parties approached the Ministry of Petroleum and Natural Gas (“MoPNG”) to implement the Partial Award while reconciling the statement of accounts as outlined in the Partial Award. However, MoPNG on July 10, 2014 proceeded to issue a Show Cause Notice alleging that since the partial award has not been enforced, the profit petroleum share of GOI has been short-paid. MoPNG threatened to recover the amount from the sale proceeds payable by the oil marketing companies to the contractor parties. The contractor party replied to the show cause notice taking various legal contentions.
As the Partial Award did not quantify the sums, therefore, contractor parties approached the same Arbitral Tribunal to pass a Final Award in the subject matter since it had retained the jurisdiction to do so. The Arbitral Tribunal was reconstituted and the Final Award was passed in October 2016 in Cairn India’s favour. GOI’s challenge of the Final Award was dismissed by the Malaysian High Court. GOI has challenged the decision before the Court of Appeal, the procedural hearing for which is scheduled on August 30, 2018. Further, Cairn India has also filed for the enforcement of the Partial Award and Final Award with Delhi High Court which is scheduled to be heard on September 04, 2018. While Cairn India does not believe the GOI will be successful in its challenge, if the Arbitral Award is reversed and such reversal is binding, Cairn India could be liable for approximately ` 416 Crore plus interest as at March 31, 2018 (March 31, 2017: ` 416 Crore plus interest).
e) Proceedings related to the imposition of entry taxThe Company along with its other group companies i.e. Bharat Aluminium Company Limited (BALCO) and Hindustan Zinc Limited (HZL) challenged the constitutional validity of the local statutes and related notifications in the states of Chhattisgarh, Odisha and Rajasthan pertaining to the levy of entry tax on the entry of goods brought into the respective states from outside.
Post some contradictory orders of High Courts across India adjudicating on similar challenges, the Supreme Court referred the matters to a nine judge bench. Post a detailed hearing, although the bench rejected the compensatory nature of tax as a ground of challenge, it maintained status quo with respect to all other issues which have been left open for adjudication by regular benches hearing the matters. Following the order of the nine judge bench, the regular bench of the Supreme Court proceeded with hearing the matters. The regular bench remanded the entry tax matters relating to the issue of discrimination against domestic goods bought from other States to the respective High Courts for final determination but retained the issue of jurisdiction for levy on imported goods, for determination by regular bench of Supreme Court. Following the order of the Supreme Court, the Group filed writ petitions in respective High Courts.
On October 09, 2017, the Supreme Court has held that States have the jurisdiction to levy entry tax on imported goods. With this Supreme Court judgement, imported goods will rank parri-passu with domestic goods for the purpose of levy of Entry tax. Vedanta Limited and its subsidiaries have amended their appeals (writ petitions) in Odisha and Chhattisgarh to include imported goods as well. With respect to Rajasthan, the State Government has filed a counter petition in the Rajasthan High Court, whereby it has admitted that it does not intend to levy the entry tax on imported goods.
49 Commitments, contingencies and guarantees continued
Notes forming part of the Consolidated Financial Statementsas at and for the year ended March 31, 2018 continued
353Integrated R
eport
Managem
ent Review
Statutory R
eports
Financial Statements
Vedanta Limited Integrated Report and Annual Accounts 2017-18
The issue pertaining to the levy of entry tax on the movement of goods into a Special Economic Zone (SEZ) remains pending before the Odisha High Court. The Group has challenged the levy of entry tax on any movement of goods into an SEZ based on the definition of ‘local area’ under the Odisha Entry Tax Act which is very clear and does not include an SEZ. In addition, the Government of Odisha further through its SEZ Policy 2015 and the operational guidelines for administration of this policy dated August 22, 2016, exempted the entry tax levy on SEZ operations.
The total claims against Vedanta Limited and its subsidiaries are ` 1,255 Crore (March 31, 2017: ` 1,127 Crore) net of provisions made.
f) Talwandi Sabo Power Limited (TSPL) : Proceedings related to claim for liquidated damagesTSPL entered into a long term PPA with PSPCL for the supply of power. Due to delays in the fulfilment of certain obligations by PSPCL as per the PPA and force majeure events, there was a delay in completion of the project as per the PPA timelines. TSPL has received notices of claims from PSPCL seeking payment of Liquidated damages (LD) for delay in commissioning of Unit I, II and III totalling to ` 952 Crore as at March 31, 2018 and March 31, 2017.
During the financial year 2014-15, PSPCL had invoked the Performance Bank Guarantee (PBG) of ` 150 Crore to recover the LD on account of delay in Commercial Operation Date (COD). Against the PBG invocation, stay was granted by PSERC and this was later upheld by APTEL as well. The matter was referred to Arbitration by a panel of three Arbitrators. The arbitration proceedings have concluded and the order has been passed on September 18, 2017 in TSPL’s favour. The said claim of ` 952 Crore was part of contingent liability as at March 31, 2017. However pursuant to the order passed, the claim has been considered to be resolved with no exposure remaining for the company. PSPCL has filed a Sec 34 Application challenging the award, which is to be listed on July 27, 2018.
g) BALCO: Challenge against imposition of Energy Development cessBALCO challenged the imposition of Energy Development Cess levied on generators and distributors of electrical energy @ 10 paise per unit on the electrical energy sold or supplied before the High Court on the grounds that the Cess is effectively on production and not on consumption or sale since the figures of consumption are not taken into account and the Cess is discriminatory since captive power plants are required to pay @ 10 paise while the State Electricity Board is required to pay @ 5 paise. The High Court of Chhattisgarh by order dated December 15, 2006 declared the provisions imposing ED Cess on CPPs as discriminatory and therefore ultra vires the Constitution. The Group has sought refund of ED Cess paid till March 2006 amounting to ` 35 Crore.
The State of Chhattisgarh moved an SLP in the Supreme Court and whilst issuing notice has stayed the refund of the Cess already deposited and Supreme Court has also directed the State of Chhattisgarh to raise the bills but no coercive action be taken for recovery for the same. Final argument in this matter started before Supreme Court. In case the Supreme Court overturns the decision of the High Court, Balco would be liable to pay an additional amount of ` 655 Crore (March 31, 2017: ` 576 Crore) and the Group may have to bear a charge of ` 690 Crore (March 31, 2017: ` 611 Crore).
h) South Africa Carry cost As part of the farm-in agreement for Block 1, the Group was required to carry its joint venture partner, Petro SA, up to a gross expenditure of US $ 100 million (approximately ` 650 Crore) as at March 31, 2018 and March 31, 2017 for a work program including 3D and 2D seismic studies and at least one exploration well. The Group has spent US $ 38 million (approximately ` 246 Crore) towards exploration expenditure and a minimum carry of US $ 63 million (approximately ` 404 Crore) (including drilling one well) was outstanding at the end of the initial exploration period. The Group had sought an extension for execution of deed for entry into the second renewal phase of the exploration period with a request to maintain status quo of the prior approvals due to uncertainty in the proposed changes in fiscal terms impacting the Group financial interest in the block. The same was granted by the South African authority subject to risk of exploration right getting expired on account of recent High Court judgements. After assessing past judicial precedents followed by independent legal advice, the Group has provided for the requisite damages as applicable under the South African Regulations and obligation for the aforesaid carry cost of US $ 63 million (approximately ` 404 Crore) as at March 31, 2018 and March 31, 2017 has been assessed as possible and thus not provided for.
i) Miscellaneous disputes- Income taxThe Group is involved in various tax disputes amounting to ` 6,561 Crore (March 31, 2017: ` 6,335 Crore) relating to income tax. These mainly relate to the disallowance of tax holiday for 100% Export Oriented Undertaking under section 10B of the Income Tax Act, 1961, disallowance of tax holiday benefit on production of gas under section 80IB of the Income Tax Act, 1961, tax holiday for undertakings located in certain notified areas under section 80IC of the Income Tax Act, 1961, disallowance of tax holiday benefit for power plants under section 80IA of the Income Tax Act, 1961, on account of depreciation disallowances, disallowance under section 14A of the Income Tax Act and interest thereon which are pending at various appellate levels.
The Group believes that these disallowances are not tenable and accordingly no provision is considered necessary.
j) Miscellaneous disputes- OthersThe Group is subject to various claims and exposures which arise in the ordinary course of conducting and financing its business from the excise, indirect tax authorities and others. These claims and exposures mostly relate to the assessable values of sales and purchases or to incomplete documentation supporting the companies’ returns or other claims.
The approximate value of claims (excluding the items as set out separately above) against the Group companies totals to ` 3,685 Crore (March 31, 2017: ` 3,091 Crore)
The Group considers that it can take steps such that the risks can be mitigated and that there are no significant unprovided liabilities arising.Except as described above from (a) to (j), there are no pending litigations which the Group believes could reasonably be expected to have a material adverse effect on the results of operations, cash flow or the financial position of the Group.
49 Commitments, contingencies and guarantees continued
Notes forming part of the Consolidated Financial Statementsas at and for the year ended March 31, 2018 continued
354 Vedanta Limited Integrated Report and Annual Accounts 2017-18
B Commitments The Group has a number of continuing operational and financial commitments in the normal course of business including:• exploratory mining commitments;• oil & gas commitments;• mining commitments arising under production sharing agreements; and• completion of the construction of certain assets.
Estimated amount of contracts remaining to be executed on capital accounts and not provided for:
Particulars
As at March 31,
2018
As at March 31,
2017
Oil & Gas sectorCairn India (now merged with the Company) and its subsidiaries 4,304 124 Aluminium sectorBALCO- Korba -II 325 KTPA Smelter and Korba 1200 MW power plant (4x300 MW) 221 326 Lanjigarh Refinery (Phase II) 5.0 MTPA 1,335 1,368 Jharsuguda 1.25MTPA smelter 491 791 Power sectorJharsuguda 2400 mw Power Plant 98 213 Talwandi 1,980MW IPP - 3 Zinc sectorZinc India (mines expansion) 1,984 1,554 Gamsberg mining & milling project 1,057 1,335 Copper sectorTuticorin Smelter 400 ktpa 2,758 1,411 Others 25 6
Total 12,273 7,131
Other Commitments
(` in Crore)
Particulars
As at March 31,
2018
As at March 31,
2017
(i) The Group has given corporate guarantees to regulatory authorities on behalf of Volcan Investments Limited 115 115 (ii) Customs duty bond taken for Project Import/ Export 698 439 (iii) The Group’s share of Joint Ventures' minimum exploration commitments as per the production sharing contracts 42 19 (iv) Export obligations against the import licenses taken for import of capital goods under the Export Promotion
Capital Goods Scheme and advance license. In the event of the Group’s inability to meet Export obligations, the Group’s liability, reduced in proportion to actual exports. In addition, applicable interest would be payable.
12,385 14,336
(v) Power Division of the Group has signed a long term power purchase agreement (PPA) with Gridco Limited for supply of 25% of power generated from the power station with additional right to purchase power at (5%/7%) at variable cost as per the conditions referred to in PPA . The PPA has a tenure of twenty five years.
(vi) TSPL has signed a long term power purchase agreement (PPA) with Punjab State Power Corporation Limited (PSPCL) [formerly known as Punjab State Electricity Board (PSEB)] for supply of power generated from the power plant. The PPA has tenure of twenty five years.
50 Segment InformationA) Description of segment and principal activitiesThe Group is a diversified natural resource group engaged in exploring, extracting and processing minerals and oil and gas. The Group produces zinc, lead, silver, copper, aluminium, iron ore, oil and gas and commercial power and has a presence across India, South Africa, Namibia, U.A.E, Ireland, Australia, Japan, South Korea, Taiwan and Liberia. The Group has seven reportable segments: copper, aluminium, iron ore, power, Zinc India (comprises of zinc and lead India), Zinc international, oil and gas and others. The management of the Group is organized by its main products: copper, Zinc (comprises of zinc and lead India, silver India and zinc international), aluminium, iron ore, oil and gas, power and others. Each of the reportable segments derives its revenues from these main products and hence these have been identified as reportable segments by the Group’s chief operating decision maker (“CODM”).
CopperThe Group’s copper business is owned and operated by Vedanta Limited, Copper Mines of Tasmania Pty Ltd (“CMT”) and Fujairah Gold FZC and is principally one of custom smelting. It includes a copper smelter, a refinery, a phosphoric acid plant, a sulphuric acid plant, a copper rod plant and three captive power plants at Tuticorin in Southern India, and a refinery and two copper rod plants at Silvassa in Western India. In addition, the Group owns and operates the Mt. Lyell copper mine in Tasmania, Australia through its subsidiary, CMT, which provides a small percentage of the copper concentrate requirements (presently under care and maintenance), and a precious metal refinery and copper rod plant in Fujairah through its subsidiary Fujairah Gold FZC in the UAE. On April 09, 2018 the annual consent to operate (CTO) for Tuticorin plant under the Air and Water Acts for copper smelters in India was rejected by the State Pollution Control Board for want of further clarification and consequently the operations have presently been suspended. The matter is presently pending in Tribunal. (Refer note 3 (aa)(1)(xi))
49 Commitments, contingencies and guarantees continued
Notes forming part of the Consolidated Financial Statementsas at and for the year ended March 31, 2018 continued
355Integrated R
eport
Managem
ent Review
Statutory R
eports
Financial Statements
Vedanta Limited Integrated Report and Annual Accounts 2017-18
AluminiumThe Group’s aluminium business is owned and operated by Vedanta Limited and Bharat Aluminium Company Limited (“BALCO”) in which it has a 51% interest as at March 31, 2018 and March 31, 2017. Vedanta Limited’s Aluminium operations include a refinery and a captive power plant at Lanjigarh and a smelter, a thermal coal based captive power facility at Jharsuguda both situated in the State of Odisha in India. The pots are in the stage of commissioning in the 1.25 mtpa Jharsuguda-II Aluminium smelter with 879 pots having been commissioned by March 31, 2018. BALCO’s partially integrated aluminium operations are comprised of two bauxite mines, captive power plants, smelting and fabrication facilities in central India.
Iron oreThe Group’s iron ore business is owned by Vedanta Limited and by two wholly owned subsidiaries, Sesa Resources Limited and Sesa Mining Corporation Limited and consists of exploration, mining and processing of iron ore, pig iron and metallurgical coke. The mining operations are carried out at Codli group, Bicholim mine, Surla mine and the Sonshi group of mines in state of Goa and Narrian mine, situated at state of Karnataka in India, a Metallurgical Coke and Pig Iron plant in state of Goa in India and also has a power plant in state of Goa in India for captive use. Group’s iron ore business also comprises Western Cluster Limited (“WCL”) in Liberia which has iron ore assets and is wholly owned subsidiary of the Group. WCL’s assets include development rights to western cluster and a network of iron ore deposits in West Africa. WCL’s assets were fully impaired in the year ended March 31, 2016. Pursuant to an order passed by Hon’ble Supreme Court of India on February 07, 2018 all mining was banned in state of Goa. The Group has recognised an impairment charge on its iron ore assets in year ended March 31, 2018. (Refer note 36 (b))
PowerThe Group’s power business is owned and operated by Vedanta Limited, BALCO and Talwandi Sabo Power Limited (“TSPL”), a wholly owned subsidiary of Vedanta Limited which are engaged in the power generation business in India. Vedanta Limited’s power operations include a thermal coal-based commercial power facility of 600 MW at Jharsuguda in the State of Odisha in Eastern India. BALCO power operations include 600 MW (2 units of 300MW each) thermal coal based power plant at Korba. Talwandi Sabo Power Limited (“TSPL”) had signed a power purchase agreement with the Punjab State Power Corporation Limited (“PSPCL”) for the establishment of 1,980 MW (three units of 660 MW each) thermal coal-based commercial power facilities. Power business also includes the wind power plants commissioned by HZL and a power plant at MALCO Energy Limited(‘MEL’) (under care and maintenance) situated at Mettur Dam in the State of Tamil Nadu in southern India.
Zinc - IndiaThe Group’s zinc India business is owned and operated by Hindustan Zinc Limited (“HZL”) in which it has a 64.92% interest as at March 31, 2018 and March 31, 2017. HZL’s operations include five lead-zinc mines, one rock phosphate mine, four hydrometallurgical zinc smelters, two lead smelters, one pyro metallurgical lead-zinc smelter, six sulphuric acid plants, a silver refinery and six captive power plants in State of Rajasthan in Northwest India and one zinc ingot processing and refining plant at Haridwar and one silver refinery, one zinc ingot processing and refining plant and one lead ingot processing and refining plant at Pantnagar in the State of Uttarakhand in North India.
Zinc - InternationalThe Group’s zinc international business comprises Skorpion mine and refinery in Namibia operated through THL Zinc Namibia Holdings (Proprietary) Limited (“Skorpion”), Lisheen mine in Ireland operated through Vedanta Lisheen Holdings Limited (“Lisheen”) and Black Mountain Mining (Proprietary) Limited (“BMM”), whose assets include the Black Mountain mine and the Gamsberg mine project which is in development stage, located in South Africa. The Group has 100% interest in Skorpion, 74.00% interest in BMM and 100% interest in Lisheen (which owns the Lisheen mine in Ireland which has ceased operations in December 2015).
Oil and gasThe Group’s oil and gas business is owned and operated by the Company and its stepdown subsidiary Cairn Energy Hydrocarbons Limited and engaged in business of exploration and development and production of oil and gas. The Group has a diversified asset base with six blocks, one in state of Rajasthan in India, one on the west coast of India, three on the east coast of India and one in South Africa.
OtherThe Group’s other activities include Vizag General Cargo Berth Private Limited (“VGCB”) and Maritime Ventures Private Limited (“”MVPL) in which the Group owns a 100% interest. Vizag port project includes mechanisation of coal handling facility at the outer harbour of Vishakhapatnam port on the east coast of India. MVPL is engaged in the business of rendering logistics and other allied services inter alia rendering stevedoring, and other allied services in Ports and other allied sectors. In December 2017, the Company through its wholly owned subsidiary, acquired 51.6% equity stake in AvanStrate (‘ASI’) which is also included in other segments. ASI is involved in manufacturing of glass substrate. (Refer note 4 (II))
Segment Revenue, Results, Assets and Liabilities include the respective amounts identifiable to each of the segments and amount allocated on a reasonable basis. Unallocated expenditure consist of common expenditure incurred for all the segments and expenses incurred at corporate level. The assets and liabilities that cannot be allocated between the segments are shown as unallocated assets and unallocated liabilities respectively.
The accounting policies of the reportable segments are the same as the Group’s accounting policies described in Note 3. The operating segments reported are the segments of the Group for which separate financial information is available. Earnings before interest, depreciation and amortisation and tax (EBITDA) are evaluated regularly by the CODM in deciding how to allocate resources and in assessing performance. The Group’s financing (including finance costs and finance income) and income taxes are reviewed on an overall basis and are not allocated to operating segments.
Transfer prices between operating segments are on an arm’s length basis in a manner similar to transactions with third parties except from power segment sales amounting to ` 133 Crore and ` 41 Crore which is at cost for the year ended March 31, 2018 and March 31, 2107 respectively.
The following table presents revenue and profit information and certain assets information regarding the Group’s business segments as at and for the year ended March 31, 2018 and March 31, 2107.
50 Segment Information continued
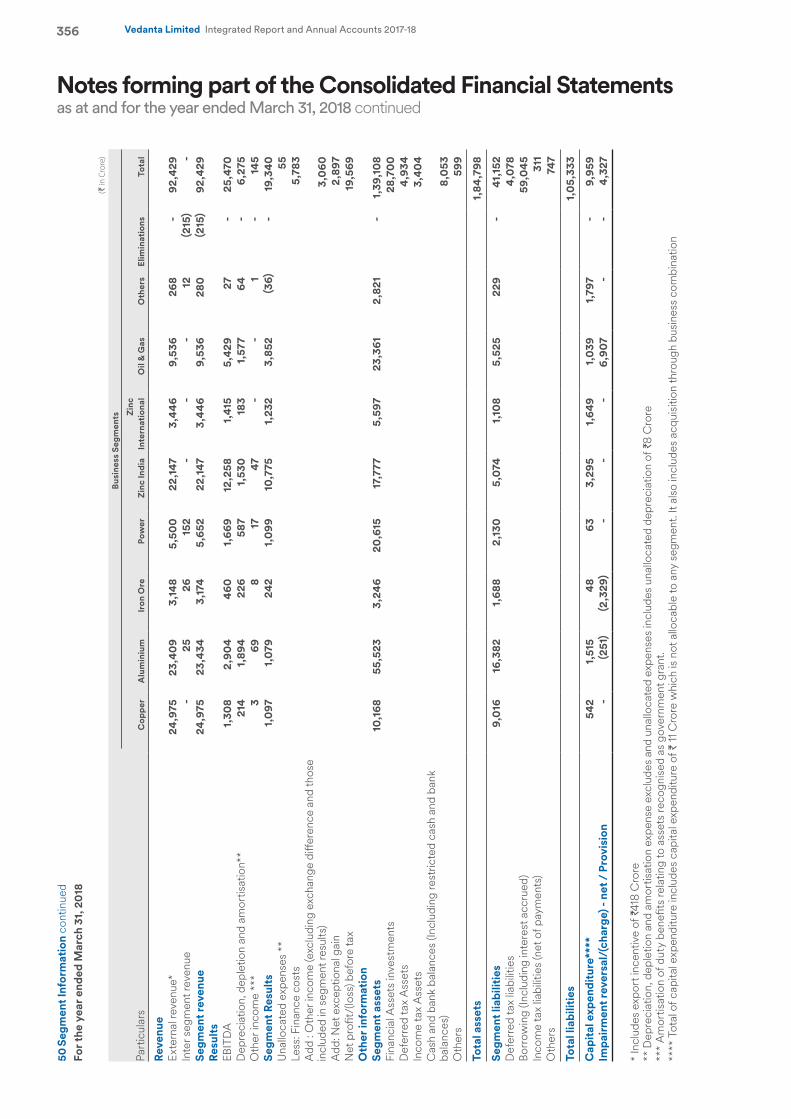
Notes forming part of the Consolidated Financial Statementsas at and for the year ended March 31, 2018 continued
356 Vedanta Limited Integrated Report and Annual Accounts 2017-18
50 S
egm
ent I
nfor
mat
ion
cont
inue
dFo
r the
yea
r end
ed M
arch
31,
20
18
(` in
Cro
re)
Part
icul
ars
Busi
ness
Seg
men
ts
Cop
per
Alu
min
ium
Iron
Ore
Pow
er Z
inc
Indi
a Z
inc
Inte
rnat
iona
lO
il &
Gas
Oth
ers
Elim
inat
ions
Tota
l
Reve
nue
Exte
rnal
reve
nue*
24,
975
23,
409
3,1
48
5,5
00
22,
147
3,4
46
9,5
36
268
-
9
2,42
9 In
ter s
egm
ent r
even
ue -
2
5 2
6 1
52
-
-
-
12
(215
) -
Se
gmen
t rev
enue
24,
975
23,
434
3,1
74
5,6
52
22,
147
3,4
46
9,5
36
280
(2
15)
92,
429
Resu
lts
EBIT
DA
1,3
08
2,9
04
460
1
,669
1
2,25
8 1
,415
5
,429
2
7 -
2
5,47
0 D
epre
ciat
ion,
dep
letio
n an
d am
ortis
atio
n**
214
1
,894
2
26
587
1
,530
1
83
1,5
77
64
-
6,2
75
Oth
er in
com
e **
* 3
6
9 8
1
7 4
7 -
-
1
-
1
45
Segm
ent R
esul
ts 1
,097
1
,079
2
42
1,0
99
10,
775
1,2
32
3,8
52
(36)
-
19,
340
Una
lloca
ted
expe
nses
**
55
Less
: Fin
ance
cos
ts 5
,783
A
dd :
Oth
er in
com
e (e
xclu
ding
exc
hang
e di
ffere
nce
and
thos
e in
clud
ed in
seg
men
t res
ults
) 3
,060
A
dd: N
et e
xcep
tiona
l gai
n 2
,897
N
et p
rofit
/(lo
ss) b
efor
e ta
x 1
9,56
9 O
ther
info
rmat
ion
Segm
ent a
sset
s 1
0,16
8 5
5,52
3 3
,246
2
0,61
5 1
7,77
7 5
,597
2
3,36
1 2
,821
-
1
,39,
108
Fina
ncia
l Ass
ets
inve
stm
ents
28,
700
Def
erre
d ta
x A
sset
s 4
,934
In
com
e ta
x A
sset
s 3
,40
4 C
ash
and
bank
bal
ance
s (In
clud
ing
rest
ricte
d ca
sh a
nd b
ank
bala
nces
) 8
,053
O
ther
s 5
99
Tota
l ass
ets
1,8
4,79
8
Segm
ent l
iabi
litie
s 9
,016
1
6,38
2 1
,688
2
,130
5
,074
1
,10
8 5
,525
2
29
-
41,
152
Def
erre
d ta
x lia
bilit
ies
4,0
78
Borr
owin
g (In
clud
ing
inte
rest
acc
rued
) 5
9,0
45
Inco
me
tax
liabi
litie
s (n
et o
f pay
men
ts)
311
O
ther
s 7
47
Tota
l lia
bilit
ies
1,0
5,33
3
Cap
ital
exp
endi
ture
****
5
42
1,5
15
48
63
3,2
95
1,6
49
1,0
39
1,7
97
-
9,95
9Im
pair
men
t rev
ersa
l/(c
harg
e) -
net /
Pro
visi
on -
(2
51)
(2,3
29)
-
-
-
6,9
07
-
-
4,3
27
* In
clud
es e
xpor
t inc
entiv
e of
4̀1
8 C
rore
** D
epre
ciat
ion,
dep
letio
n an
d am
ortis
atio
n ex
pens
e ex
clud
es a
nd u
nallo
cate
d ex
pens
es in
clud
es u
nallo
cate
d de
prec
iatio
n of
`8
Cro
re
**
* A
mor
tisat
ion
of d
uty
bene
fits
rela
ting
to a
sset
s re
cogn
ised
as
gove
rnm
ent g
rant
.
****
Tot
al o
f cap
ital e
xpen
ditu
re in
clud
es c
apita
l exp
endi
ture
of `
11 C
rore
whi
ch is
not
allo
cabl
e to
any
seg
men
t. It
also
incl
udes
acq
uisi
tion
thro
ugh
busi
ness
com
bina
tion
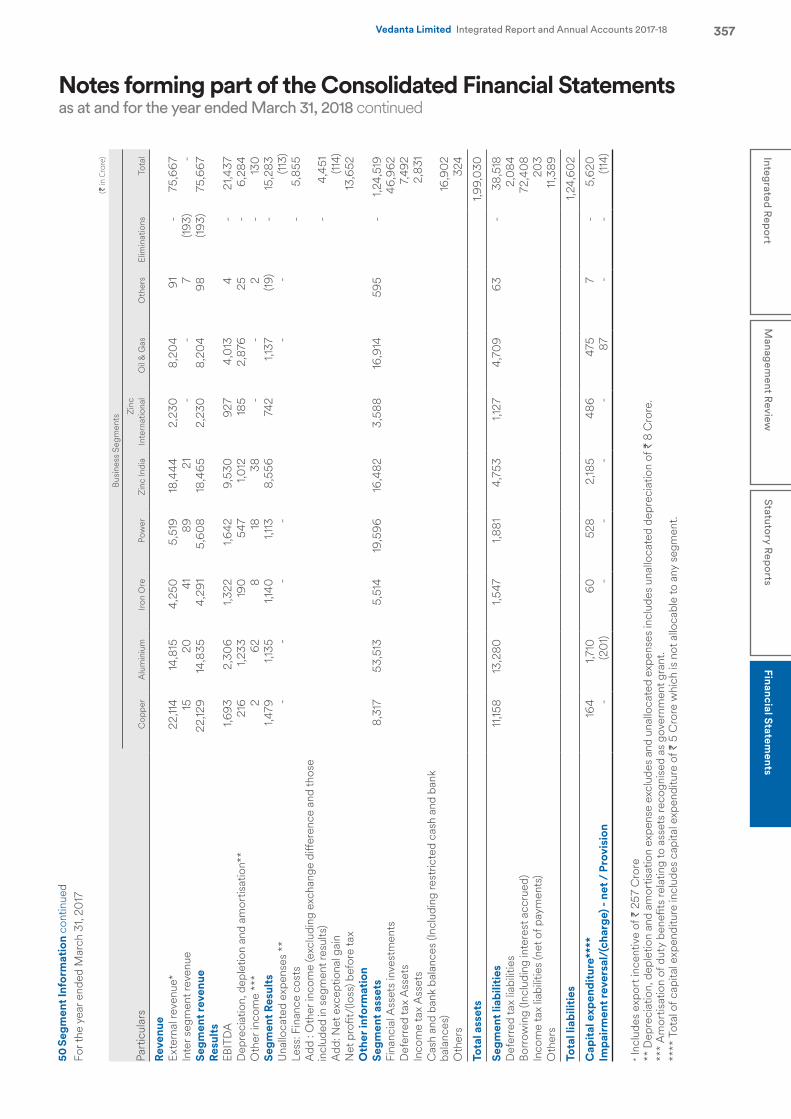
Notes forming part of the Consolidated Financial Statementsas at and for the year ended March 31, 2018 continued
357Integrated R
eport
Managem
ent Review
Statutory R
eports
Financial Statements
Vedanta Limited Integrated Report and Annual Accounts 2017-18
50 S
egm
ent I
nfor
mat
ion
cont
inue
dFo
r the
yea
r end
ed M
arch
31,
2017
(` in
Cro
re)
Part
icul
ars
Busi
ness
Seg
men
ts
Cop
per
Alu
min
ium
Iron
Ore
Pow
er Z
inc
Indi
a Z
inc
Inte
rnat
iona
lO
il &
Gas
Oth
ers
Elim
inat
ions
Tota
l
Reve
nue
Exte
rnal
reve
nue*
22,
114
14,8
15
4,2
50
5,5
19
18,4
44
2,2
30
8,2
04
91
-
75,
667
Inte
r seg
men
t rev
enue
15
20
4
1 8
9 2
1 -
-
7
(1
93)
-
Segm
ent r
even
ue 2
2,12
9 14
,835
4
,291
5
,60
8 18
,46
5 2
,230
8
,20
4 9
8 (1
93)
75,
667
Resu
lts
EBIT
DA
1,69
3 2
,30
6 1,
322
1,6
42
9,5
30
927
4
,013
4
-
2
1,437
D
epre
ciat
ion,
dep
letio
n an
d am
ortis
atio
n**
216
1,
233
190
5
47
1,0
12
185
2,8
76
25
-
6,2
84
Oth
er in
com
e **
* 2
6
2 8
18
3
8 -
-
2
-
13
0
Segm
ent R
esul
ts 1,
479
1,13
5 1,
140
1,
113
8,5
56
742
1,
137
(19)
-
15,2
83
Una
lloca
ted
expe
nses
**
-
-
-
-
-
-
(113
)Le
ss: F
inan
ce c
osts
-
5,8
55
Add
: O
ther
inco
me
(exc
ludi
ng e
xcha
nge
diffe
renc
e an
d th
ose
incl
uded
in s
egm
ent r
esul
ts)
-
4,4
51
Add
: Net
exc
eptio
nal g
ain
(114
)N
et p
rofit
/(lo
ss) b
efor
e ta
x 13
,652
O
ther
info
rmat
ion
Segm
ent a
sset
s 8
,317
5
3,51
3 5
,514
19
,596
16
,482
3
,588
16
,914
5
95
-
1,24
,519
Fi
nanc
ial A
sset
s in
vest
men
ts 4
6,96
2 D
efer
red
tax
Ass
ets
7,4
92
Inco
me
tax
Ass
ets
2,8
31
Cas
h an
d ba
nk b
alan
ces
(Incl
udin
g re
stric
ted
cash
and
ban
k ba
lanc
es)
16,9
02
Oth
ers
324
Tota
l ass
ets
1,99
,030
Segm
ent l
iabi
litie
s 11
,158
13,2
80
1,54
7 1,
881
4,7
53
1,12
7 4
,70
9 6
3 -
3
8,51
8 D
efer
red
tax
liabi
litie
s 2
,084
Bo
rrow
ing
(Incl
udin
g in
tere
st a
ccru
ed)
72,
408
Inco
me
tax
liabi
litie
s (n
et o
f pay
men
ts)
20
3 O
ther
s 11
,389
Tota
l lia
bilit
ies
1,24
,60
2
Cap
ital
exp
endi
ture
****
164
1,71
0
60
5
28
2,18
5 4
86
475
7
-
5
,620
Im
pair
men
t rev
ersa
l/(c
harg
e) -
net /
Pro
visi
on-
(20
1)-
--
- 8
7 -
- (1
14)
* Inc
lude
s ex
port
ince
ntiv
e of
` 2
57 C
rore
** D
epre
ciat
ion,
dep
letio
n an
d am
ortis
atio
n ex
pens
e ex
clud
es a
nd u
nallo
cate
d ex
pens
es in
clud
es u
nallo
cate
d de
prec
iatio
n of
` 8
Cro
re.
***
Am
ortis
atio
n of
dut
y be
nefit
s re
latin
g to
ass
ets
reco
gnis
ed a
s go
vern
men
t gra
nt.
**
** T
otal
of c
apita
l exp
endi
ture
incl
udes
cap
ital e
xpen
ditu
re o
f ` 5
Cro
re w
hich
is n
ot a
lloca
ble
to a
ny s
egm
ent.
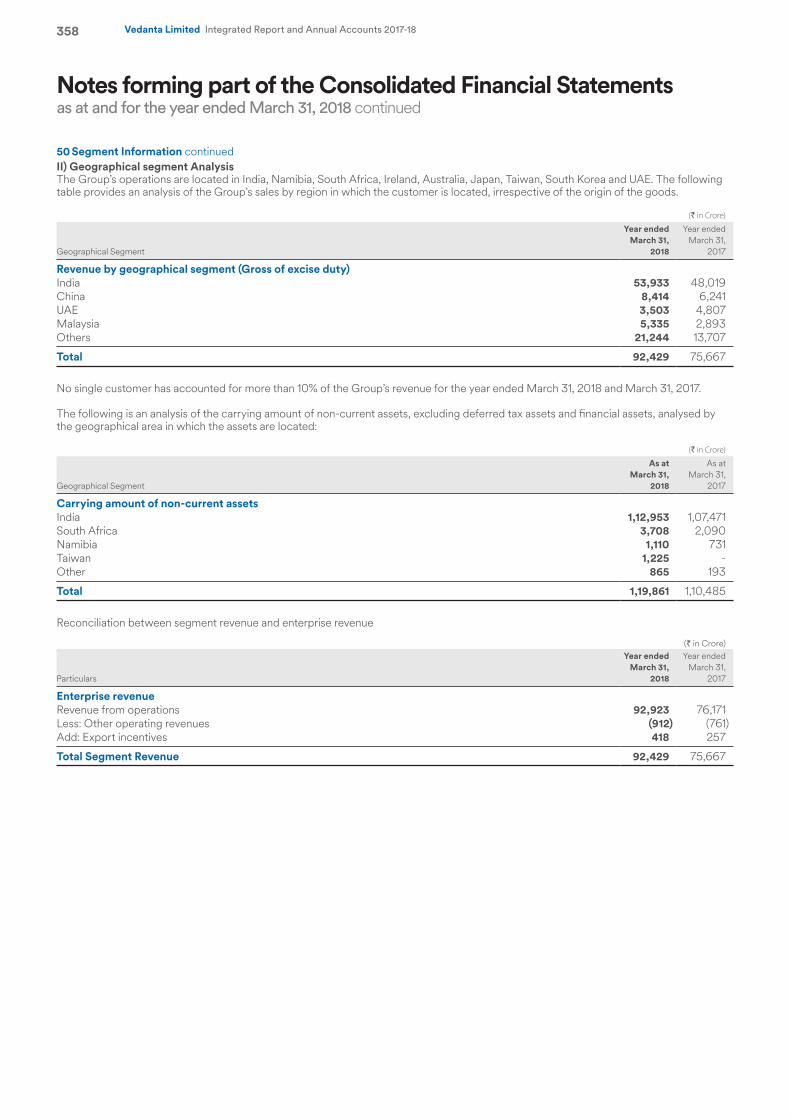
Notes forming part of the Consolidated Financial Statementsas at and for the year ended March 31, 2018 continued
358 Vedanta Limited Integrated Report and Annual Accounts 2017-18
II) Geographical segment Analysis The Group’s operations are located in India, Namibia, South Africa, Ireland, Australia, Japan, Taiwan, South Korea and UAE. The following table provides an analysis of the Group’s sales by region in which the customer is located, irrespective of the origin of the goods.
(` in Crore)
Geographical Segment
Year ended March 31,
2018
Year ended March 31,
2017
Revenue by geographical segment (Gross of excise duty)India 53,933 48,019 China 8,414 6,241 UAE 3,503 4,807 Malaysia 5,335 2,893 Others 21,244 13,707
Total 92,429 75,667
No single customer has accounted for more than 10% of the Group’s revenue for the year ended March 31, 2018 and March 31, 2017. The following is an analysis of the carrying amount of non-current assets, excluding deferred tax assets and financial assets, analysed by the geographical area in which the assets are located:
(` in Crore)
Geographical Segment
As at March 31,
2018
As at March 31,
2017
Carrying amount of non-current assetsIndia 1,12,953 1,07,471 South Africa 3,708 2,090 Namibia 1,110 731 Taiwan 1,225 - Other 865 193
Total 1,19,861 1,10,485
Reconciliation between segment revenue and enterprise revenue
(` in Crore)
Particulars
Year ended March 31,
2018
Year ended March 31,
2017
Enterprise revenueRevenue from operations 92,923 76,171 Less: Other operating revenues (912) (761)Add: Export incentives 418 257
Total Segment Revenue 92,429 75,667
50 Segment Information continued
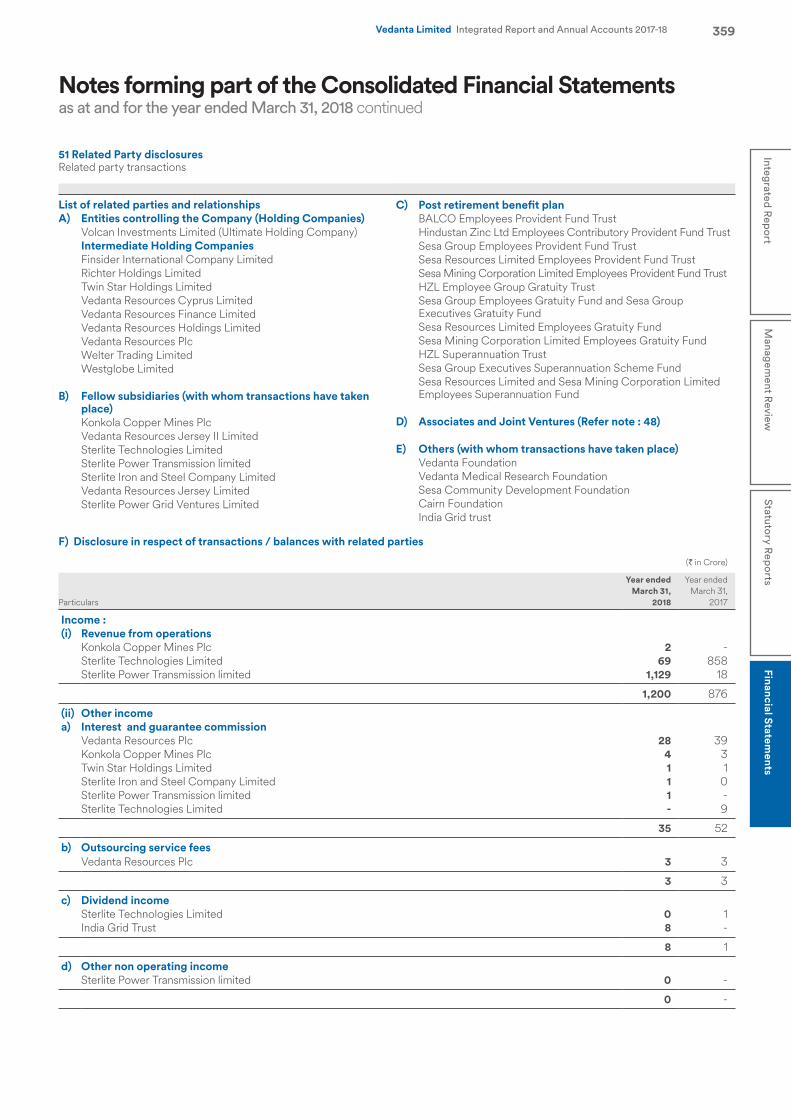
Notes forming part of the Consolidated Financial Statementsas at and for the year ended March 31, 2018 continued
359Integrated R
eport
Managem
ent Review
Statutory R
eports
Financial Statements
Vedanta Limited Integrated Report and Annual Accounts 2017-18
51 Related Party disclosuresRelated party transactions
List of related parties and relationshipsA) Entities controlling the Company (Holding Companies)
Volcan Investments Limited (Ultimate Holding Company)Intermediate Holding CompaniesFinsider International Company Limited Richter Holdings Limited Twin Star Holdings Limited Vedanta Resources Cyprus Limited Vedanta Resources Finance Limited Vedanta Resources Holdings Limited Vedanta Resources Plc Welter Trading Limited Westglobe Limited
B) Fellow subsidiaries (with whom transactions have taken place)Konkola Copper Mines PlcVedanta Resources Jersey II LimitedSterlite Technologies LimitedSterlite Power Transmission limitedSterlite Iron and Steel Company LimitedVedanta Resources Jersey LimitedSterlite Power Grid Ventures Limited
C) Post retirement benefit plan BALCO Employees Provident Fund TrustHindustan Zinc Ltd Employees Contributory Provident Fund TrustSesa Group Employees Provident Fund TrustSesa Resources Limited Employees Provident Fund TrustSesa Mining Corporation Limited Employees Provident Fund TrustHZL Employee Group Gratuity TrustSesa Group Employees Gratuity Fund and Sesa Group Executives Gratuity FundSesa Resources Limited Employees Gratuity FundSesa Mining Corporation Limited Employees Gratuity FundHZL Superannuation TrustSesa Group Executives Superannuation Scheme FundSesa Resources Limited and Sesa Mining Corporation Limited Employees Superannuation Fund
D) Associates and Joint Ventures (Refer note : 48)
E) Others (with whom transactions have taken place)Vedanta FoundationVedanta Medical Research FoundationSesa Community Development FoundationCairn FoundationIndia Grid trust
F) Disclosure in respect of transactions / balances with related parties
(` in Crore)
Particulars
Year ended March 31,
2018
Year ended March 31,
2017
Income : (i) Revenue from operations
Konkola Copper Mines Plc 2 - Sterlite Technologies Limited 69 858 Sterlite Power Transmission limited 1,129 18
1,200 876
(ii) Other income a) Interest and guarantee commission
Vedanta Resources Plc 28 39 Konkola Copper Mines Plc 4 3 Twin Star Holdings Limited 1 1 Sterlite Iron and Steel Company Limited 1 0 Sterlite Power Transmission limited 1 - Sterlite Technologies Limited - 9
35 52
b) Outsourcing service feesVedanta Resources Plc 3 3
3 3
c) Dividend incomeSterlite Technologies Limited 0 1 India Grid Trust 8 -
8 1
d) Other non operating incomeSterlite Power Transmission limited 0 -
0 -
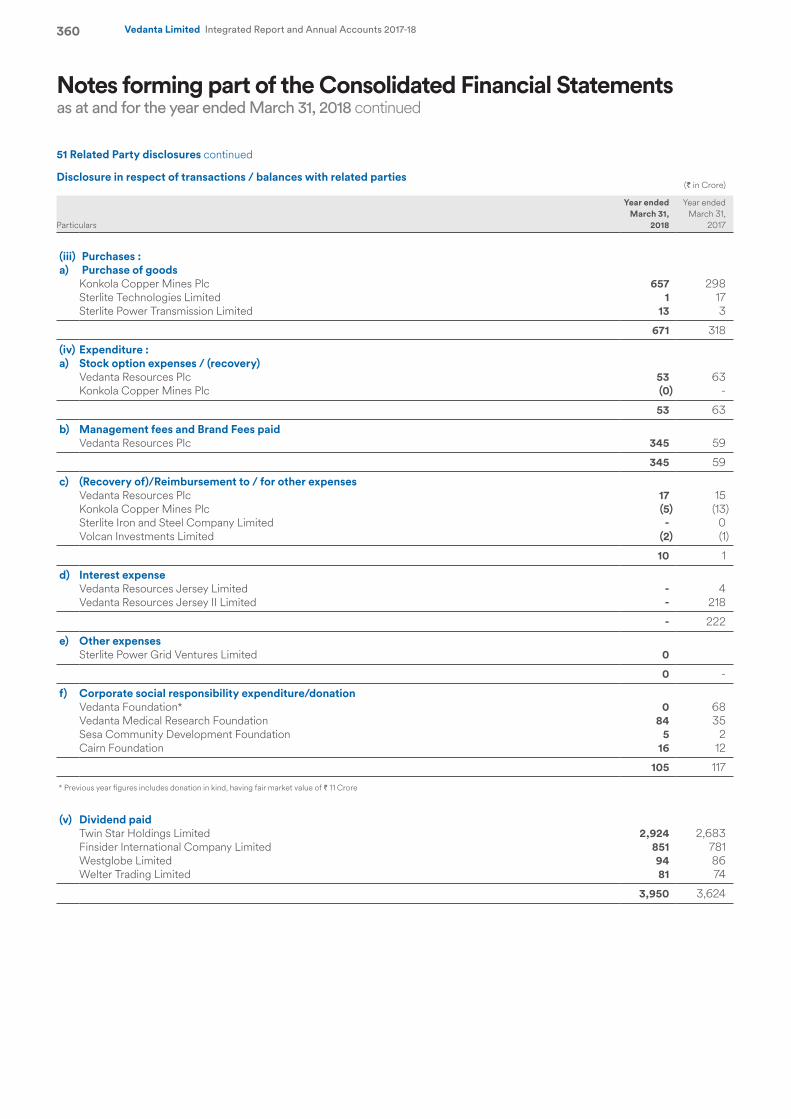
Notes forming part of the Consolidated Financial Statementsas at and for the year ended March 31, 2018 continued
360 Vedanta Limited Integrated Report and Annual Accounts 2017-18
Disclosure in respect of transactions / balances with related parties(` in Crore)
Particulars
Year ended March 31,
2018
Year ended March 31,
2017
(iii) Purchases : a) Purchase of goods
Konkola Copper Mines Plc 657 298 Sterlite Technologies Limited 1 17 Sterlite Power Transmission Limited 13 3
671 318
(iv) Expenditure : a) Stock option expenses / (recovery)
Vedanta Resources Plc 53 63 Konkola Copper Mines Plc (0) -
53 63
b) Management fees and Brand Fees paidVedanta Resources Plc 345 59
345 59
c) (Recovery of)/Reimbursement to / for other expensesVedanta Resources Plc 17 15 Konkola Copper Mines Plc (5) (13)Sterlite Iron and Steel Company Limited - 0 Volcan Investments Limited (2) (1)
10 1
d) Interest expenseVedanta Resources Jersey Limited - 4 Vedanta Resources Jersey II Limited - 218
- 222
e) Other expensesSterlite Power Grid Ventures Limited 0
0 -
f) Corporate social responsibility expenditure/donationVedanta Foundation* 0 68 Vedanta Medical Research Foundation 84 35 Sesa Community Development Foundation 5 2 Cairn Foundation 16 12
105 117
* Previous year figures includes donation in kind, having fair market value of ` 11 Crore
(v) Dividend paidTwin Star Holdings Limited 2,924 2,683 Finsider International Company Limited 851 781 Westglobe Limited 94 86 Welter Trading Limited 81 74
3,950 3,624
51 Related Party disclosures continued
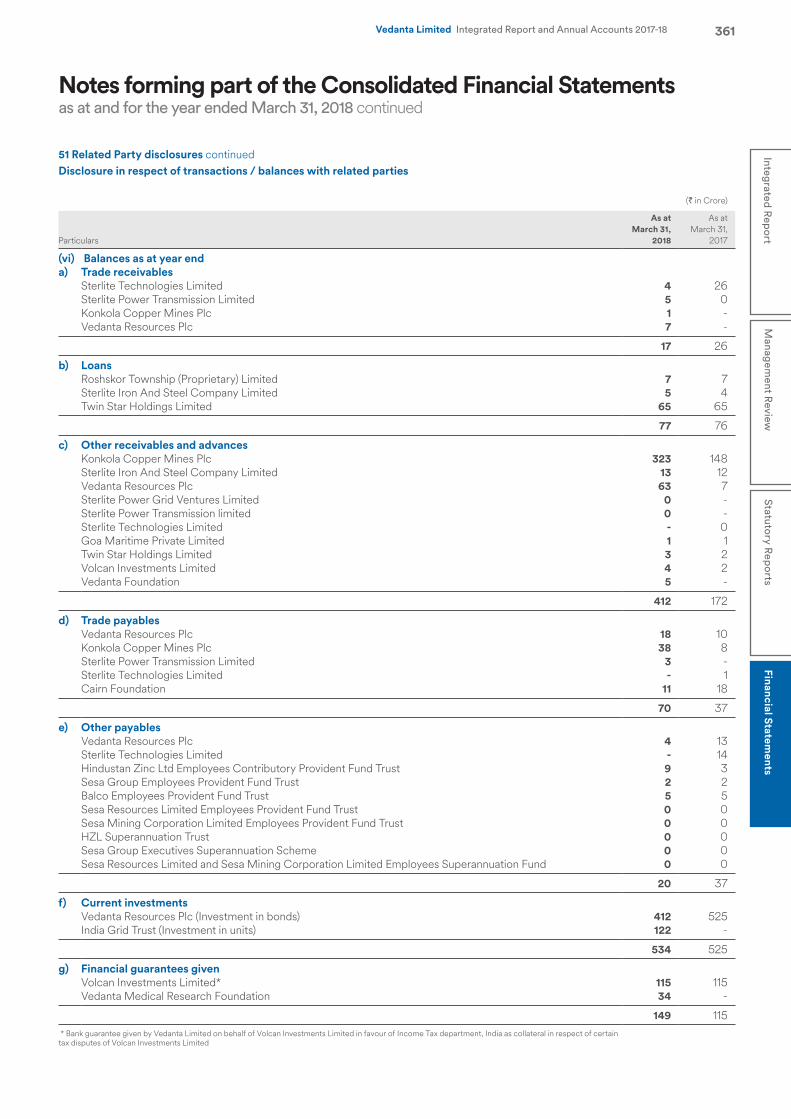
Notes forming part of the Consolidated Financial Statementsas at and for the year ended March 31, 2018 continued
361Integrated R
eport
Managem
ent Review
Statutory R
eports
Financial Statements
Vedanta Limited Integrated Report and Annual Accounts 2017-18
(` in Crore)
Particulars
As at March 31,
2018
As at March 31,
2017
(vi) Balances as at year end a) Trade receivables
Sterlite Technologies Limited 4 26 Sterlite Power Transmission Limited 5 0 Konkola Copper Mines Plc 1 - Vedanta Resources Plc 7 -
17 26
b) Loans Roshskor Township (Proprietary) Limited 7 7 Sterlite Iron And Steel Company Limited 5 4 Twin Star Holdings Limited 65 65
77 76
c) Other receivables and advancesKonkola Copper Mines Plc 323 148 Sterlite Iron And Steel Company Limited 13 12 Vedanta Resources Plc 63 7 Sterlite Power Grid Ventures Limited 0 - Sterlite Power Transmission limited 0 - Sterlite Technologies Limited - 0 Goa Maritime Private Limited 1 1 Twin Star Holdings Limited 3 2 Volcan Investments Limited 4 2 Vedanta Foundation 5 -
412 172
d) Trade payablesVedanta Resources Plc 18 10 Konkola Copper Mines Plc 38 8 Sterlite Power Transmission Limited 3 - Sterlite Technologies Limited - 1 Cairn Foundation 11 18
70 37
e) Other payablesVedanta Resources Plc 4 13 Sterlite Technologies Limited - 14 Hindustan Zinc Ltd Employees Contributory Provident Fund Trust 9 3 Sesa Group Employees Provident Fund Trust 2 2 Balco Employees Provident Fund Trust 5 5 Sesa Resources Limited Employees Provident Fund Trust 0 0 Sesa Mining Corporation Limited Employees Provident Fund Trust 0 0 HZL Superannuation Trust 0 0 Sesa Group Executives Superannuation Scheme 0 0 Sesa Resources Limited and Sesa Mining Corporation Limited Employees Superannuation Fund 0 0
20 37
f) Current investmentsVedanta Resources Plc (Investment in bonds) 412 525 India Grid Trust (Investment in units) 122 -
534 525
g) Financial guarantees givenVolcan Investments Limited* 115 115 Vedanta Medical Research Foundation 34 -
149 115 * Bank guarantee given by Vedanta Limited on behalf of Volcan Investments Limited in favour of Income Tax department, India as collateral in respect of certain tax disputes of Volcan Investments Limited
51 Related Party disclosures continuedDisclosure in respect of transactions / balances with related parties
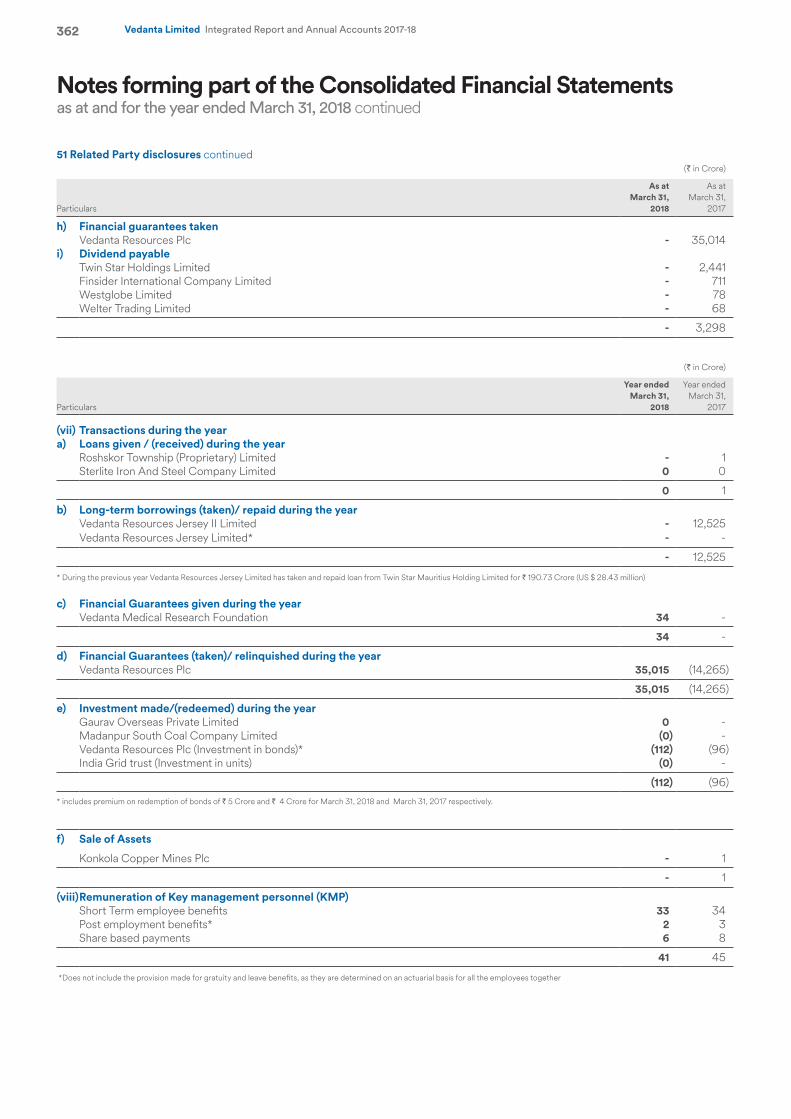
Notes forming part of the Consolidated Financial Statementsas at and for the year ended March 31, 2018 continued
362 Vedanta Limited Integrated Report and Annual Accounts 2017-18
(` in Crore)
Particulars
As at March 31,
2018
As at March 31,
2017
h) Financial guarantees takenVedanta Resources Plc - 35,014
i) Dividend payableTwin Star Holdings Limited - 2,441 Finsider International Company Limited - 711 Westglobe Limited - 78 Welter Trading Limited - 68
- 3,298
(` in Crore)
Particulars
Year ended March 31,
2018
Year ended March 31,
2017
(vii) Transactions during the year a) Loans given / (received) during the year
Roshskor Township (Proprietary) Limited - 1 Sterlite Iron And Steel Company Limited 0 0
0 1
b) Long-term borrowings (taken)/ repaid during the yearVedanta Resources Jersey II Limited - 12,525 Vedanta Resources Jersey Limited* - -
- 12,525
* During the previous year Vedanta Resources Jersey Limited has taken and repaid loan from Twin Star Mauritius Holding Limited for ` 190.73 Crore (US $ 28.43 million)
c) Financial Guarantees given during the yearVedanta Medical Research Foundation 34 -
34 -
d) Financial Guarantees (taken)/ relinquished during the yearVedanta Resources Plc 35,015 (14,265)
35,015 (14,265)
e) Investment made/(redeemed) during the yearGaurav Overseas Private Limited 0 - Madanpur South Coal Company Limited (0) - Vedanta Resources Plc (Investment in bonds)* (112) (96)India Grid trust (Investment in units) (0) -
(112) (96)
* includes premium on redemption of bonds of ` 5 Crore and ` 4 Crore for March 31, 2018 and March 31, 2017 respectively.
f) Sale of Assets
Konkola Copper Mines Plc - 1
- 1
(viii)Remuneration of Key management personnel (KMP)Short Term employee benefits 33 34 Post employment benefits* 2 3 Share based payments 6 8
41 45
*Does not include the provision made for gratuity and leave benefits, as they are determined on an actuarial basis for all the employees together
51 Related Party disclosures continued
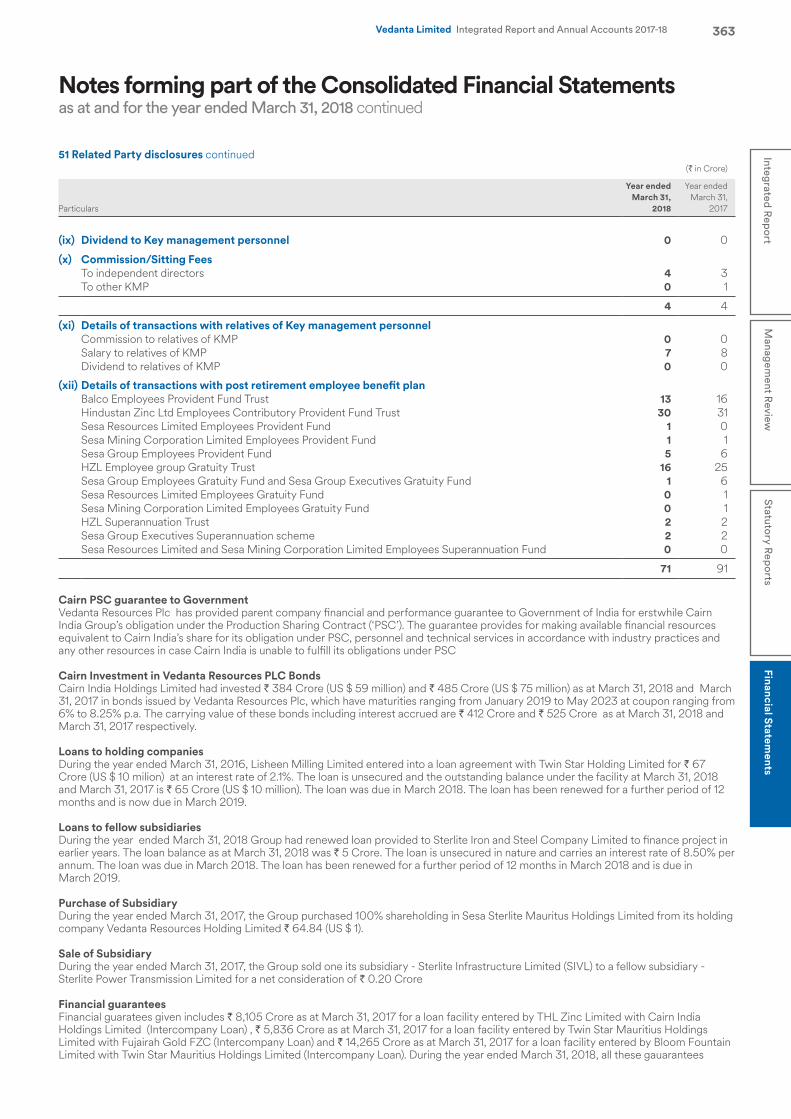
Notes forming part of the Consolidated Financial Statementsas at and for the year ended March 31, 2018 continued
363Integrated R
eport
Managem
ent Review
Statutory R
eports
Financial Statements
Vedanta Limited Integrated Report and Annual Accounts 2017-18
(` in Crore)
Particulars
Year ended March 31,
2018
Year ended March 31,
2017
(ix) Dividend to Key management personnel 0 0
(x) Commission/Sitting FeesTo independent directors 4 3 To other KMP 0 1
4 4
(xi) Details of transactions with relatives of Key management personnelCommission to relatives of KMP 0 0 Salary to relatives of KMP 7 8 Dividend to relatives of KMP 0 0
(xii) Details of transactions with post retirement employee benefit planBalco Employees Provident Fund Trust 13 16 Hindustan Zinc Ltd Employees Contributory Provident Fund Trust 30 31 Sesa Resources Limited Employees Provident Fund 1 0 Sesa Mining Corporation Limited Employees Provident Fund 1 1 Sesa Group Employees Provident Fund 5 6 HZL Employee group Gratuity Trust 16 25 Sesa Group Employees Gratuity Fund and Sesa Group Executives Gratuity Fund 1 6 Sesa Resources Limited Employees Gratuity Fund 0 1 Sesa Mining Corporation Limited Employees Gratuity Fund 0 1 HZL Superannuation Trust 2 2 Sesa Group Executives Superannuation scheme 2 2 Sesa Resources Limited and Sesa Mining Corporation Limited Employees Superannuation Fund 0 0
71 91
Cairn PSC guarantee to Government Vedanta Resources Plc has provided parent company financial and performance guarantee to Government of India for erstwhile Cairn India Group’s obligation under the Production Sharing Contract (‘PSC’). The guarantee provides for making available financial resources equivalent to Cairn India’s share for its obligation under PSC, personnel and technical services in accordance with industry practices and any other resources in case Cairn India is unable to fulfill its obligations under PSC
Cairn Investment in Vedanta Resources PLC Bonds Cairn India Holdings Limited had invested ` 384 Crore (US $ 59 million) and ` 485 Crore (US $ 75 million) as at March 31, 2018 and March 31, 2017 in bonds issued by Vedanta Resources Plc, which have maturities ranging from January 2019 to May 2023 at coupon ranging from 6% to 8.25% p.a. The carrying value of these bonds including interest accrued are ` 412 Crore and ` 525 Crore as at March 31, 2018 and March 31, 2017 respectively.
Loans to holding companies During the year ended March 31, 2016, Lisheen Milling Limited entered into a loan agreement with Twin Star Holding Limited for ` 67 Crore (US $ 10 milion) at an interest rate of 2.1%. The loan is unsecured and the outstanding balance under the facility at March 31, 2018 and March 31, 2017 is ` 65 Crore (US $ 10 million). The loan was due in March 2018. The loan has been renewed for a further period of 12 months and is now due in March 2019.
Loans to fellow subsidiaries During the year ended March 31, 2018 Group had renewed loan provided to Sterlite Iron and Steel Company Limited to finance project in earlier years. The loan balance as at March 31, 2018 was ` 5 Crore. The loan is unsecured in nature and carries an interest rate of 8.50% per annum. The loan was due in March 2018. The loan has been renewed for a further period of 12 months in March 2018 and is due in March 2019.
Purchase of SubsidiaryDuring the year ended March 31, 2017, the Group purchased 100% shareholding in Sesa Sterlite Mauritus Holdings Limited from its holding company Vedanta Resources Holding Limited ` 64.84 (US $ 1).
Sale of SubsidiaryDuring the year ended March 31, 2017, the Group sold one its subsidiary - Sterlite Infrastructure Limited (SIVL) to a fellow subsidiary - Sterlite Power Transmission Limited for a net consideration of ` 0.20 Crore
Financial guarantees Financial guaratees given includes ` 8,105 Crore as at March 31, 2017 for a loan facility entered by THL Zinc Limited with Cairn India Holdings Limited (Intercompany Loan) , ` 5,836 Crore as at March 31, 2017 for a loan facility entered by Twin Star Mauritius Holdings Limited with Fujairah Gold FZC (Intercompany Loan) and ` 14,265 Crore as at March 31, 2017 for a loan facility entered by Bloom Fountain Limited with Twin Star Mauritius Holdings Limited (Intercompany Loan). During the year ended March 31, 2018, all these gauarantees
51 Related Party disclosures continued
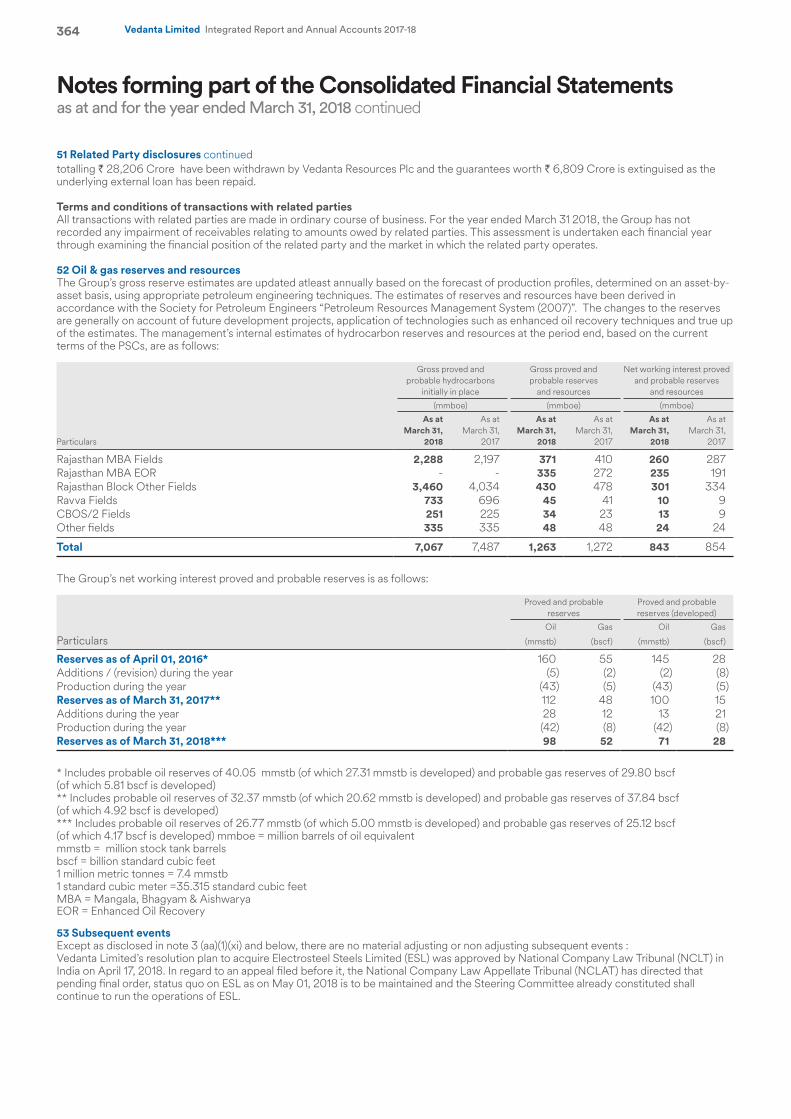
Notes forming part of the Consolidated Financial Statementsas at and for the year ended March 31, 2018 continued
364 Vedanta Limited Integrated Report and Annual Accounts 2017-18
totalling ` 28,206 Crore have been withdrawn by Vedanta Resources Plc and the guarantees worth ` 6,809 Crore is extinguised as the underlying external loan has been repaid.
Terms and conditions of transactions with related parties All transactions with related parties are made in ordinary course of business. For the year ended March 31 2018, the Group has not recorded any impairment of receivables relating to amounts owed by related parties. This assessment is undertaken each financial year through examining the financial position of the related party and the market in which the related party operates.
52 Oil & gas reserves and resources The Group’s gross reserve estimates are updated atleast annually based on the forecast of production profiles, determined on an asset-by-asset basis, using appropriate petroleum engineering techniques. The estimates of reserves and resources have been derived in accordance with the Society for Petroleum Engineers “Petroleum Resources Management System (2007)”. The changes to the reserves are generally on account of future development projects, application of technologies such as enhanced oil recovery techniques and true up of the estimates. The management’s internal estimates of hydrocarbon reserves and resources at the period end, based on the current terms of the PSCs, are as follows:
Particulars
Gross proved and probable hydrocarbons
initially in place
Gross proved and probable reserves
and resources
Net working interest proved and probable reserves
and resources
(mmboe) (mmboe) (mmboe)
As at March 31,
2018
As at March 31,
2017
As at March 31,
2018
As at March 31,
2017
As at March 31,
2018
As at March 31,
2017
Rajasthan MBA Fields 2,288 2,197 371 410 260 287 Rajasthan MBA EOR - - 335 272 235 191 Rajasthan Block Other Fields 3,460 4,034 430 478 301 334 Ravva Fields 733 696 45 41 10 9 CBOS/2 Fields 251 225 34 23 13 9 Other fields 335 335 48 48 24 24
Total 7,067 7,487 1,263 1,272 843 854
The Group’s net working interest proved and probable reserves is as follows:
Particulars
Proved and probable reserves
Proved and probable reserves (developed)
Oil Gas Oil Gas
(mmstb) (bscf) (mmstb) (bscf)
Reserves as of April 01, 2016* 160 55 145 28 Additions / (revision) during the year (5) (2) (2) (8)Production during the year (43) (5) (43) (5)Reserves as of March 31, 2017** 112 48 100 15 Additions during the year 28 12 13 21 Production during the year (42) (8) (42) (8)Reserves as of March 31, 2018*** 98 52 71 28
* Includes probable oil reserves of 40.05 mmstb (of which 27.31 mmstb is developed) and probable gas reserves of 29.80 bscf (of which 5.81 bscf is developed) ** Includes probable oil reserves of 32.37 mmstb (of which 20.62 mmstb is developed) and probable gas reserves of 37.84 bscf (of which 4.92 bscf is developed) *** Includes probable oil reserves of 26.77 mmstb (of which 5.00 mmstb is developed) and probable gas reserves of 25.12 bscf (of which 4.17 bscf is developed) mmboe = million barrels of oil equivalent mmstb = million stock tank barrels bscf = billion standard cubic feet 1 million metric tonnes = 7.4 mmstb 1 standard cubic meter =35.315 standard cubic feet MBA = Mangala, Bhagyam & Aishwarya EOR = Enhanced Oil Recovery
53 Subsequent events Except as disclosed in note 3 (aa)(1)(xi) and below, there are no material adjusting or non adjusting subsequent events : Vedanta Limited’s resolution plan to acquire Electrosteel Steels Limited (ESL) was approved by National Company Law Tribunal (NCLT) in India on April 17, 2018. In regard to an appeal filed before it, the National Company Law Appellate Tribunal (NCLAT) has directed that pending final order, status quo on ESL as on May 01, 2018 is to be maintained and the Steering Committee already constituted shall continue to run the operations of ESL.
51 Related Party disclosures continued
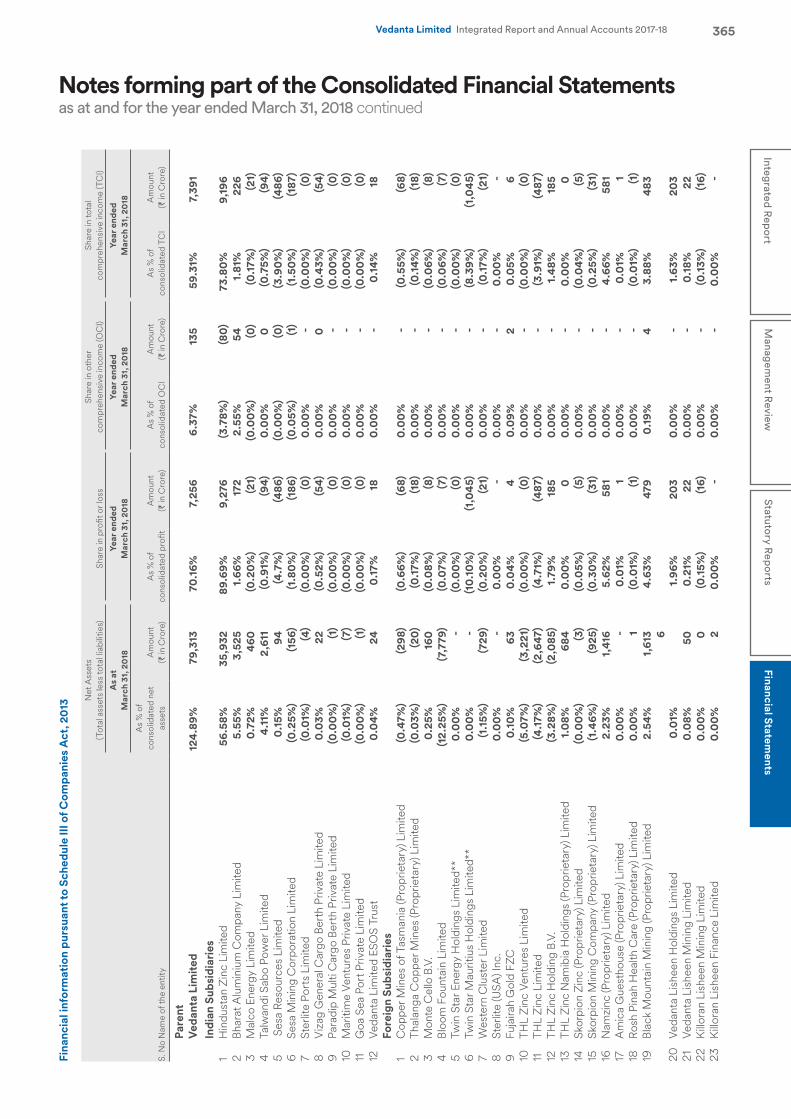
Notes forming part of the Consolidated Financial Statementsas at and for the year ended March 31, 2018 continued
365Integrated R
eport
Managem
ent Review
Statutory R
eports
Financial Statements
Vedanta Limited Integrated Report and Annual Accounts 2017-18
Fina
ncia
l inf
orm
atio
n pu
rsua
nt to
Sch
edul
e III
of C
ompa
nies
Act
, 20
13
S. N
oN
ame
of th
e en
tity
Net
Ass
ets
(T
otal
ass
ets
less
tota
l lia
bilit
ies)
Shar
e in
pro
fit o
r los
s
Shar
e in
oth
er
com
preh
ensi
ve in
com
e (O
CI)
Shar
e in
tota
l co
mpr
ehen
sive
inco
me
(TC
I)
As
at
Mar
ch 3
1, 2
018
Year
end
ed
Mar
ch 3
1, 2
018
Year
end
ed
Mar
ch 3
1, 2
018
Year
end
ed
Mar
ch 3
1, 2
018
As
% o
f co
nsol
idat
ed n
et
asse
tsA
mou
nt
(` in
Cro
re)
As
% o
f co
nsol
idat
ed p
rofit
Am
ount
(`
in C
rore
)A
s %
of
cons
olid
ated
OC
IA
mou
nt
(` in
Cro
re)
As
% o
f co
nsol
idat
ed T
CI
Am
ount
(`
in C
rore
)
Pare
nt
Ved
anta
Lim
ited
12
4.89
%
79,
313
70.1
6%
7,2
56
6.37
%
135
59
.31%
7
,391
In
dian
Sub
sidi
arie
s1
Hin
dust
an Z
inc
Lim
ited
56.5
8%
35,
932
89.6
9%
9,2
76
(3.7
8%)
(80)
73.8
0%
9,1
96
2Bh
arat
Alu
min
ium
Com
pany
Lim
ited
5.55
%
3,5
25
1.66
%
172
2.
55%
5
4 1.
81%
2
26
3M
alco
Ene
rgy
Lim
ited
0.72
%
460
(0
.20%
) (2
1)(0
.00%
) (0
)(0
.17%
) (2
1)4
Talw
andi
Sab
o Po
wer
Lim
ited
4.11
%
2,6
11
(0.9
1%)
(94)
0.0
0%
0
(0.7
5%)
(94)
5 S
esa
Reso
urce
s Li
mite
d 0.
15%
94(4
.7%
)(4
86)
(0.0
0%)
(0)
(3.9
0%)
(486
)6
Sesa
Min
ing
Cor
pora
tion
Lim
ited
(0.2
5%)
(156
)(1
.80%
) (1
86)
(0.0
5%)
(1)
(1.5
0%)
(187
)7
Ster
lite
Port
s Li
mite
d(0
.01%
) (4
)(0
.00%
) (0
)0.
00%
-
(0
.00%
) (0
)8
Viz
ag G
ener
al C
argo
Ber
th P
rivat
e Li
mite
d0.
03%
2
2 (0
.52%
) (5
4)0.
00%
0
(0
.43%
) (5
4)9
Para
dip
Mul
ti C
argo
Ber
th P
rivat
e Li
mite
d(0
.00%
) (1
)(0
.00%
) (0
)0.
00%
-
(0
.00%
) (0
)10
Mar
itim
e Ve
ntur
es P
rivat
e Li
mite
d(0
.01%
) (7
)(0
.00%
) (0
)0.
00%
-
(0
.00%
) (0
)11
Goa
Sea
Por
t Priv
ate
Lim
ited
(0.0
0%)
(1)
(0.0
0%)
(0)
0.0
0%
-
(0.0
0%)
(0)
12Ve
dant
a Li
mite
d ES
OS
Trus
t0.
04%
2
4 0.
17%
1
8 0.
00%
-
0.
14%
1
8 Fo
reig
n Su
bsid
iari
es1
Cop
per M
ines
of T
asm
ania
(Pro
prie
tary
) Lim
ited
(0.4
7%)
(298
)(0
.66%
) (6
8)0.
00%
-
(0
.55%
) (6
8)2
Thal
anga
Cop
per M
ines
(Pro
prie
tary
) Lim
ited
(0.0
3%)
(20)
(0.1
7%)
(18)
0.0
0%
-
(0.1
4%)
(18)
3M
onte
Cel
lo B
.V.
0.25
%
160
(0
.08%
) (8
)0.
00%
-
(0
.06%
) (8
)4
Bloo
m F
ount
ain
Lim
ited
(12.
25%
) (7
,779
)(0
.07%
) (7
)0.
00%
-
(0
.06%
) (7
)5
Twin
Sta
r Ene
rgy
Hol
ding
s Li
mite
d**
0.0
0%
-
(0.0
0%)
(0)
0.0
0%
-
(0.0
0%)
(0)
6Tw
in S
tar M
aurit
ius
Hol
ding
s Li
mite
d**
0.0
0%
-
(10.
10%
) (1
,045
)0.
00%
-
(8
.39%
) (1
,045
)7
Wes
tern
Clu
ster
Lim
ited
(1.1
5%)
(729
)(0
.20%
) (2
1)0.
00%
-
(0
.17%
) (2
1)8
Ster
lite
(USA
) Inc
. 0.
00%
-
0.
00%
-
0.
00%
-
0.
00%
-
9
Fuja
irah
Gol
d FZ
C0.
10%
6
3 0.
04%
4
0.
09%
2
0.
05%
6
10
THL
Zinc
Ven
ture
s Li
mite
d(5
.07%
) (3
,221
)(0
.00%
) (0
)0.
00%
-
(0
.00%
) (0
)11
THL
Zinc
Lim
ited
(4.1
7%)
(2,6
47)
(4.7
1%)
(487
)0.
00%
-
(3
.91%
) (4
87)
12TH
L Zi
nc H
oldi
ng B
.V.
(3.2
8%)
(2,0
85)
1.79
%
185
0.
00%
-
1.
48%
1
85
13TH
L Zi
nc N
amib
ia H
oldi
ngs
(Pro
prie
tary
) Lim
ited
1.0
8%
684
0.
00%
0
0.
00%
-
0.
00%
0
14
Skor
pion
Zin
c (P
ropr
ieta
ry) L
imite
d(0
.00%
) (3
)(0
.05%
) (5
)0.
00%
-
(0
.04%
) (5
)15
Skor
pion
Min
ing
Com
pany
(Pro
prie
tary
) Lim
ited
(1.4
6%)
(925
)(0
.30%
) (3
1)0.
00%
-
(0
.25%
) (3
1)16
Nam
zinc
(Pro
prie
tary
) Lim
ited
2.23
%
1,4
16
5.62
%
581
0.
00%
-
4.
66%
5
81
17A
mic
a G
uest
hous
e (P
ropr
ieta
ry) L
imite
d0.
00%
-
0.
01%
1
0.
00%
-
0.
01%
1
18
Rosh
Pin
ah H
ealth
Car
e (P
ropr
ieta
ry) L
imite
d0.
00%
1
(0
.01%
) (1
)0.
00%
-
(0
.01%
) (1
)19
Blac
k M
ount
ain
Min
ing
(Pro
prie
tary
) Lim
ited
2.54
%
1,6
13
4.63
%
479
0.
19%
4
3.
88%
4
83
20Ve
dant
a Li
shee
n H
oldi
ngs
Lim
ited
0.0
1%
6 1.
96%
2
03
0.0
0%
-
1.63
%
20
3 21
Veda
nta
Lish
een
Min
ing
Lim
ited
0.0
8%
50
0.21
%
22
0.0
0%
-
0.18
%
22
22K
illor
an L
ishe
en M
inin
g Li
mite
d0.
00%
0
(0
.15%
) (1
6)0.
00%
-
(0
.13%
) (1
6)23
Kill
oran
Lis
heen
Fin
ance
Lim
ited
0.0
0%
2
0.0
0%
-
0.0
0%
-
0.0
0%
-
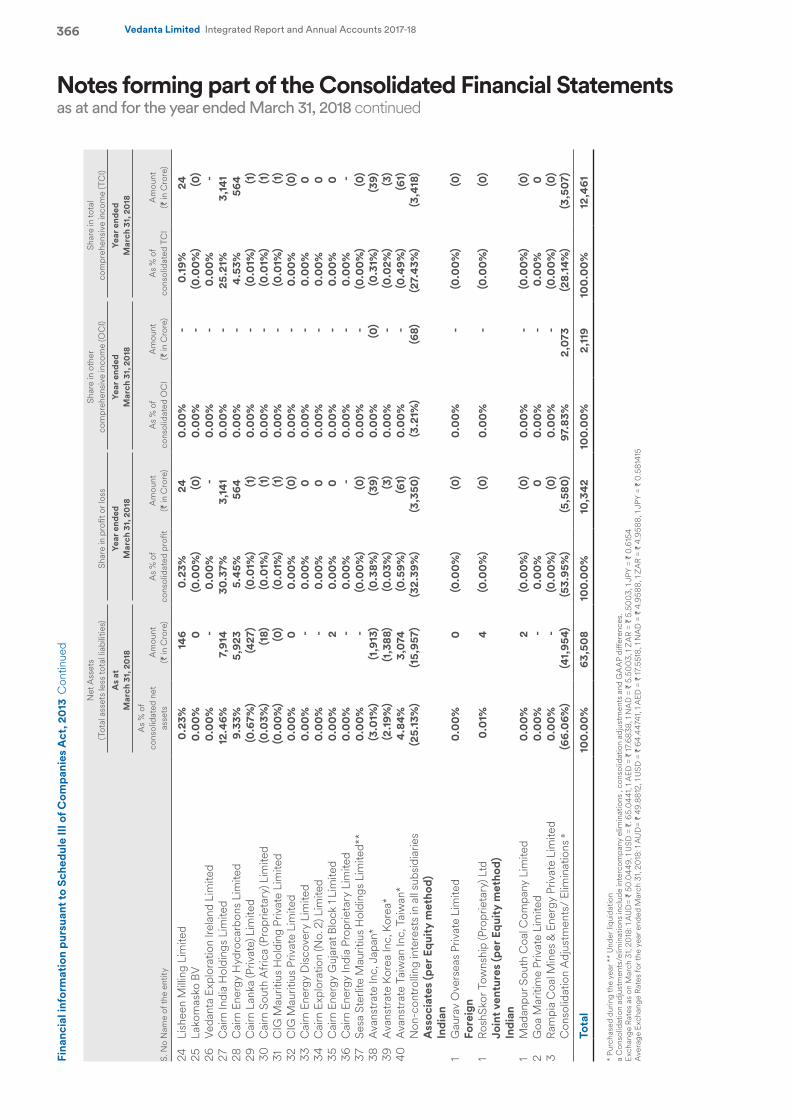
Notes forming part of the Consolidated Financial Statementsas at and for the year ended March 31, 2018 continued
366 Vedanta Limited Integrated Report and Annual Accounts 2017-18
S. N
oN
ame
of th
e en
tity
Net
Ass
ets
(T
otal
ass
ets
less
tota
l lia
bilit
ies)
Shar
e in
pro
fit o
r los
s
Shar
e in
oth
er
com
preh
ensi
ve in
com
e (O
CI)
Shar
e in
tota
l co
mpr
ehen
sive
inco
me
(TC
I)
As
at
Mar
ch 3
1, 2
018
Year
end
ed
Mar
ch 3
1, 2
018
Year
end
ed
Mar
ch 3
1, 2
018
Year
end
ed
Mar
ch 3
1, 2
018
As
% o
f co
nsol
idat
ed n
et
asse
tsA
mou
nt
(` in
Cro
re)
As
% o
f co
nsol
idat
ed p
rofit
Am
ount
(`
in C
rore
)A
s %
of
cons
olid
ated
OC
IA
mou
nt
(` in
Cro
re)
As
% o
f co
nsol
idat
ed T
CI
Am
ount
(`
in C
rore
)
24Li
shee
n M
illin
g Li
mite
d0.
23%
1
46
0.23
%
24
0.0
0%
-
0.19
%
24
25La
kom
asko
BV
0.0
0%
0
(0.0
0%)
(0)
0.0
0%
-
(0.0
0%)
(0)
26Ve
dant
a Ex
plor
atio
n Ire
land
Lim
ited
0.0
0%
-
0.0
0%
-
0.0
0%
-
0.0
0%
-
27C
airn
Indi
a H
oldi
ngs
Lim
ited
12.4
6%
7,91
430
.37%
3,14
10.
00%
-
25
.21%
3
,141
28C
airn
Ene
rgy
Hyd
roca
rbon
s Li
mite
d9.
33%
5
,923
5.
45%
5
64
0.0
0%
-
4.53
%
564
29
Cai
rn L
anka
(Priv
ate)
Lim
ited
(0.6
7%)
(427
)(0
.01%
) (1
)0.
00%
-
(0
.01%
) (1
)30
Cai
rn S
outh
Afr
ica
(Pro
prie
tary
) Lim
ited
(0.0
3%)
(18)
(0.0
1%)
(1)
0.0
0%
-
(0.0
1%)
(1)
31C
IG M
aurit
ius
Hol
ding
Priv
ate
Lim
ited
(0.0
0%)
(0)
(0
.01%
) (1
)0.
00%
-
(0
.01%
) (1
)32
CIG
Mau
ritiu
s Pr
ivat
e Li
mite
d0.
00%
0
0.0
0%
(0)
0.0
0%
-
0.0
0%
(0)
33C
airn
Ene
rgy
Dis
cove
ry L
imite
d0.
00%
-
0.
00%
0
0.
00%
-
0.
00%
0
34C
airn
Exp
lora
tion
(No.
2) L
imite
d0.
00%
-
0.
00%
0
0.
00%
-
0.
00%
0
35
Cai
rn E
nerg
y G
ujar
at B
lock
1 Li
mite
d0.
00%
2
0.
00%
0
0.
00%
-
0.
00%
0
36
Cai
rn E
nerg
y In
dia
Prop
rieta
ry L
imite
d0.
00%
-
0.
00%
-
0.
00%
-
0.
00%
-
37
Sesa
Ste
rlite
Mau
ritiu
s H
oldi
ngs
Lim
ited*
*0.
00%
-
(0
.00%
) (0
)0.
00%
-
(0
.00%
) (0
)38
Ava
nstr
ate
Inc,
Jap
an*
(3.0
1%)
(1,9
13)
(0.3
8%)
(39)
0.
00%
(0
)(0
.31%
) (3
9)
39A
vans
trat
e Ko
rea
Inc,
Kor
ea*
(2.1
9%)
(1,3
88)
(0.0
3%)
(3)
0.0
0%
-
(0.0
2%)
(3)
40A
vans
trat
e Ta
iwan
Inc,
Tai
wan
*4.
84%
3
,074
(0
.59%
) (6
1)0.
00%
-
(0
.49%
) (6
1)N
on-c
ontr
ollin
g in
tere
sts
in a
ll su
bsid
iarie
s(2
5.13
%)
(15,
957)
(32.
39%
) (3
,350
)(3
.21%
) (6
8)(2
7.43
%)
(3,4
18)
Ass
ocia
tes
(per
Equ
ity
met
hod)
Indi
an1
Gau
rav
Ove
rsea
s Pr
ivat
e Li
mite
d0.
00%
0
(0
.00%
) (0
)0.
00%
-
(0
.00%
) (0
)Fo
reig
n1
Rosh
Skor
Tow
nshi
p (P
ropr
ieta
ry) L
td0.
01%
4
(0
.00%
) (0
)0.
00%
-
(0
.00%
) (0
)Jo
int v
entu
res
(per
Equ
ity
met
hod)
Indi
an1
Mad
anpu
r Sou
th C
oal C
ompa
ny L
imite
d 0.
00%
2
(0
.00%
) (0
)0.
00%
-
(0
.00%
) (0
)2
Goa
Mar
itim
e Pr
ivat
e Li
mite
d0.
00%
-
0.
00%
0
0.
00%
-
0.
00%
0
3
Ram
pia
Coa
l Min
es &
Ene
rgy
Priv
ate
Lim
ited
0.0
0%
-
(0.0
0%)
(0)
0.0
0%
-
(0.0
0%)
(0)
Con
solid
atio
n A
djus
tmen
ts/
Elim
inat
ions
a(6
6.0
6%)
(41,
954)
(53.
95%
) (5
,580
)97
.83%
2
,073
(2
8.14
%)
(3,5
07)
Tota
l10
0.0
0% 6
3,50
8 10
0.0
0% 1
0,34
2 10
0.0
0% 2
,119
10
0.0
0% 1
2,46
1
* Pu
rcha
sed
durin
g th
e ye
ar *
* U
nder
liqu
idat
ion
a C
onso
lidat
ion
adju
stm
ents
/elim
inat
ions
incl
ude
inte
rcom
pany
elim
inat
ions
, co
nsol
idat
ion
adju
stm
ents
and
GA
AP
diffe
renc
es.
Exch
ange
Rat
es a
s on
Mar
ch 3
1, 20
18: 1
AU
D=
` 50
.04
49, 1
USD
= `
. 65.
04
41, 1
AED
= `
17.6
838,
1 N
AD
= `
5.5
00
3, 1
ZA
R =
` 5.
500
3, 1
JPY
= `
0.6
154
Ave
rage
Exc
hang
e Ra
tes
for t
he y
ear e
nded
Mar
ch 3
1, 20
18: 1
AU
D=
` 49
.881
2, 1
USD
= `
64.
447
41, 1
AED
= `
17.5
518,
1 N
AD
= `
4.9
588,
1 Z
AR
= `
4.9
588,
1 JP
Y =
` 0
.581
415
Fina
ncia
l inf
orm
atio
n pu
rsua
nt to
Sch
edul
e III
of C
ompa
nies
Act
, 20
13 C
ontin
ued
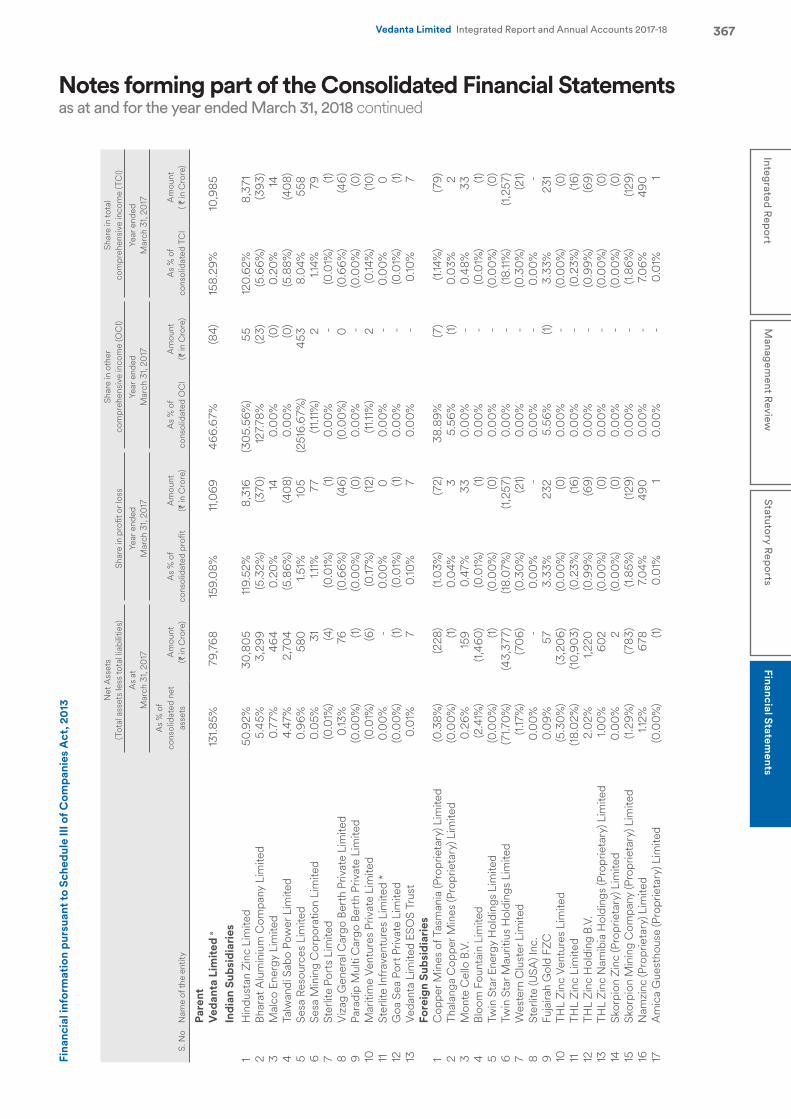
Notes forming part of the Consolidated Financial Statementsas at and for the year ended March 31, 2018 continued
367Integrated R
eport
Managem
ent Review
Statutory R
eports
Financial Statements
Vedanta Limited Integrated Report and Annual Accounts 2017-18
Fina
ncia
l inf
orm
atio
n pu
rsua
nt to
Sch
edul
e III
of C
ompa
nies
Act
, 20
13
S. N
oN
ame
of th
e en
tity
Net
Ass
ets
(Tot
al a
sset
s le
ss to
tal l
iabi
litie
s)Sh
are
in p
rofit
or l
oss
Sh
are
in o
ther
co
mpr
ehen
sive
inco
me
(OC
I)Sh
are
in to
tal
com
preh
ensi
ve in
com
e (T
CI)
As
at
Mar
ch 3
1, 20
17Ye
ar e
nded
M
arch
31,
2017
Year
end
ed
Mar
ch 3
1, 20
17Ye
ar e
nded
M
arch
31,
2017
As
% o
f co
nsol
idat
ed n
et
asse
tsA
mou
nt
(` in
Cro
re)
As
% o
f co
nsol
idat
ed p
rofit
Am
ount
(`
in C
rore
)A
s %
of
cons
olid
ated
OC
IA
mou
nt
(` in
Cro
re)
As
% o
f co
nsol
idat
ed T
CI
Am
ount
( `
in C
rore
)
Pare
nt
Ved
anta
Lim
ited
a13
1.85%
7
9,76
8 15
9.0
8%
11,0
69
466.
67%
(8
4)15
8.29
%
10,9
85
Indi
an S
ubsi
diar
ies
1H
indu
stan
Zin
c Li
mite
d50
.92%
3
0,8
05
119.
52%
8
,316
(3
05.
56%
) 5
5 12
0.6
2%
8,3
71
2Bh
arat
Alu
min
ium
Com
pany
Lim
ited
5.45
%
3,2
99
(5.3
2%)
(370
)12
7.78
%
(23)
(5.6
6%)
(393
)3
Mal
co E
nerg
y Li
mite
d0
.77%
4
64
0.2
0%
14
0
.00
%
(0)
0.2
0%
14
4
Talw
andi
Sab
o Po
wer
Lim
ited
4.47
%
2,7
04
(5.8
6%)
(40
8)0
.00
%
(0)
(5.8
8%)
(40
8)5
Sesa
Res
ourc
es L
imite
d0
.96%
5
80
1.51%
10
5 (2
516.
67%
) 4
53
8.0
4%
558
6
Sesa
Min
ing
Cor
pora
tion
Lim
ited
0.0
5%
31
1.11%
7
7 (11
.11%
) 2
1.1
4%
79
7St
erlit
e Po
rts
Lim
ited
(0.0
1%)
(4)
(0.0
1%)
(1)
0.0
0%
-
(0
.01%
) (1
)8
Viz
ag G
ener
al C
argo
Ber
th P
rivat
e Li
mite
d0
.13%
7
6 (0
.66%
) (4
6)(0
.00
%)
0
(0.6
6%)
(46)
9Pa
radi
p M
ulti
Car
go B
erth
Priv
ate
Lim
ited
(0.0
0%
) (1
)(0
.00
%)
(0)
0.0
0%
-
(0
.00
%)
(0)
10M
ariti
me
Vent
ures
Priv
ate
Lim
ited
(0.0
1%)
(6)
(0.17
%)
(12)
(11.11
%)
2
(0.14
%)
(10)
11St
erlit
e In
frav
entu
res
Lim
ited
*0
.00
%
-
0.0
0%
0
0
.00
%
-
0.0
0%
0
12
Goa
Sea
Por
t Priv
ate
Lim
ited
(0.0
0%
) (1
)(0
.01%
) (1
)0
.00
%
-
(0.0
1%)
(1)
13Ve
dant
a Li
mite
d ES
OS
Trus
t0
.01%
7
0
.10%
7
0
.00
%
-
0.10
%
7
Fore
ign
Subs
idia
ries
1C
oppe
r Min
es o
f Tas
man
ia (P
ropr
ieta
ry) L
imite
d(0
.38%
) (2
28)
(1.0
3%)
(72)
38.8
9%
(7)
(1.14
%)
(79)
2Th
alan
ga C
oppe
r Min
es (P
ropr
ieta
ry) L
imite
d(0
.00
%)
(1)
0.0
4%
3
5.56
%
(1)
0.0
3%
2
3M
onte
Cel
lo B
.V.
0.2
6%
159
0.4
7%
33
0.0
0%
-
0
.48%
3
3 4
Bloo
m F
ount
ain
Lim
ited
(2.4
1%)
(1,4
60)
(0.0
1%)
(1)
0.0
0%
-
(0
.01%
) (1
)5
Twin
Sta
r Ene
rgy
Hol
ding
s Li
mite
d(0
.00
%)
(1)
(0.0
0%
) (0
)0
.00
%
-
(0.0
0%
) (0
)6
Twin
Sta
r Mau
ritiu
s H
oldi
ngs
Lim
ited
(71.7
0%
) (4
3,37
7)(18
.07%
) (1
,257
)0
.00
%
-
(18.11
%)
(1,2
57)
7W
este
rn C
lust
er L
imite
d(1.
17%
) (7
06)
(0.3
0%
) (2
1)0
.00
%
-
(0.3
0%
) (2
1)8
Ster
lite
(USA
) Inc
. 0
.00
%
-
0.0
0%
-
0
.00
%
-
0.0
0%
-
9
Fuja
irah
Gol
d FZ
C0
.09%
5
7 3.
33%
2
32
5.56
%
(1)
3.33
%
231
10
THL
Zinc
Ven
ture
s Li
mite
d(5
.30
%)
(3,2
06)
(0.0
0%
) (0
)0
.00
%
-
(0.0
0%
) (0
)11
THL
Zinc
Lim
ited
(18.0
2%)
(10
,90
3)(0
.23%
) (1
6)0
.00
%
-
(0.2
3%)
(16)
12TH
L Zi
nc H
oldi
ng B
.V.
2.0
2%
1,22
0
(0.9
9%)
(69)
0.0
0%
-
(0
.99%
) (6
9)13
THL
Zinc
Nam
ibia
Hol
ding
s (P
ropr
ieta
ry) L
imite
d1.0
0%
6
02
(0.0
0%
) (0
)0
.00
%
-
(0.0
0%
) (0
)14
Skor
pion
Zin
c (P
ropr
ieta
ry) L
imite
d0
.00
%
2
(0.0
0%
) (0
)0
.00
%
-
(0.0
0%
) (0
)15
Skor
pion
Min
ing
Com
pany
(Pro
prie
tary
) Lim
ited
(1.29
%)
(783
)(1.
85%
) (1
29)
0.0
0%
-
(1.
86%
) (1
29)
16N
amzi
nc (P
ropr
ieta
ry) L
imite
d1.1
2%
678
7.
04%
4
90
0
.00
%
-
7.0
6%
49
0
17A
mic
a G
uest
hous
e (P
ropr
ieta
ry) L
imite
d(0
.00
%)
(1)
0.0
1%
1 0
.00
%
-
0.0
1%
1
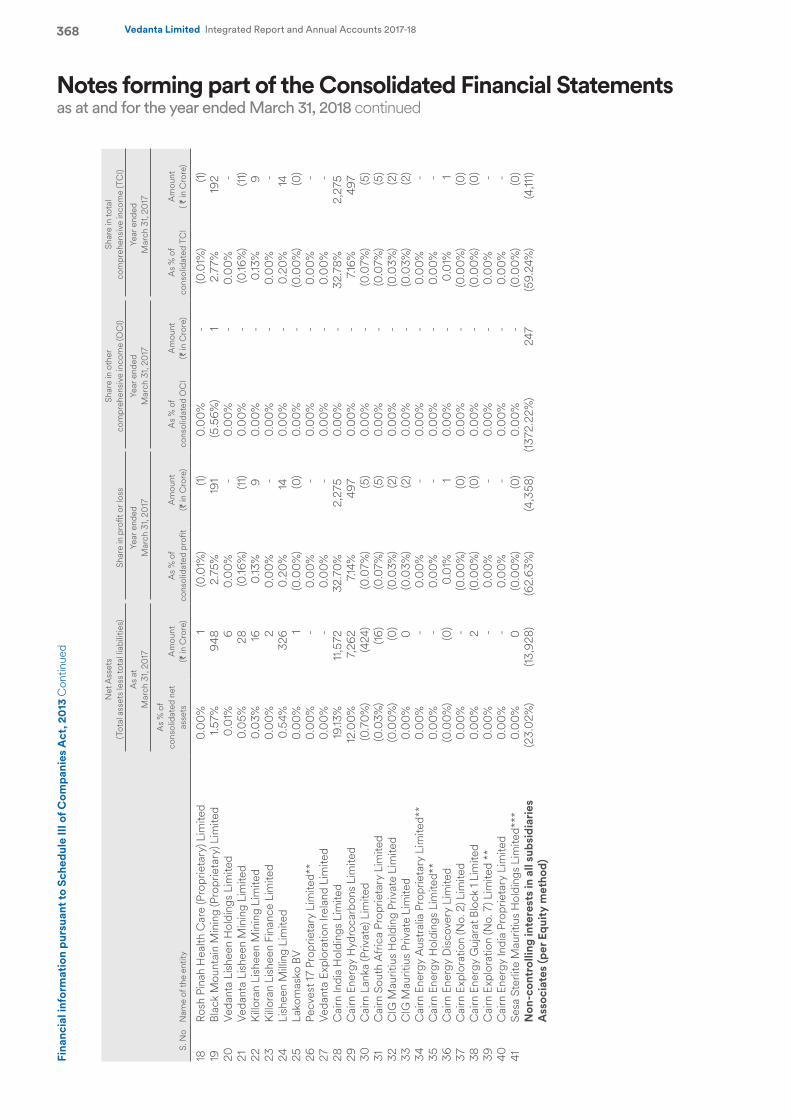
Notes forming part of the Consolidated Financial Statementsas at and for the year ended March 31, 2018 continued
368 Vedanta Limited Integrated Report and Annual Accounts 2017-18
S. N
oN
ame
of th
e en
tity
Net
Ass
ets
(Tot
al a
sset
s le
ss to
tal l
iabi
litie
s)Sh
are
in p
rofit
or l
oss
Sh
are
in o
ther
co
mpr
ehen
sive
inco
me
(OC
I)Sh
are
in to
tal
com
preh
ensi
ve in
com
e (T
CI)
As
at
Mar
ch 3
1, 20
17Ye
ar e
nded
M
arch
31,
2017
Year
end
ed
Mar
ch 3
1, 20
17Ye
ar e
nded
M
arch
31,
2017
As
% o
f co
nsol
idat
ed n
et
asse
tsA
mou
nt
(` in
Cro
re)
As
% o
f co
nsol
idat
ed p
rofit
Am
ount
(`
in C
rore
)A
s %
of
cons
olid
ated
OC
IA
mou
nt
(` in
Cro
re)
As
% o
f co
nsol
idat
ed T
CI
Am
ount
( `
in C
rore
)
18Ro
sh P
inah
Hea
lth C
are
(Pro
prie
tary
) Lim
ited
0.0
0%
1
(0.0
1%)
(1)
0.0
0%
-
(0
.01%
) (1
)19
Blac
k M
ount
ain
Min
ing
(Pro
prie
tary
) Lim
ited
1.57%
9
48
2.75
%
191
(5.5
6%)
1 2.
77%
19
2 20
Veda
nta
Lish
een
Hol
ding
s Li
mite
d0
.01%
6
0
.00
%
-
0.0
0%
-
0
.00
%
-
21Ve
dant
a Li
shee
n M
inin
g Li
mite
d0
.05%
2
8 (0
.16%
) (1
1)0
.00
%
-
(0.16
%)
(11)
22K
illor
an L
ishe
en M
inin
g Li
mite
d0
.03%
16
0
.13%
9
0
.00
%
-
0.13
%
9
23K
illor
an L
ishe
en F
inan
ce L
imite
d0
.00
%
2
0.0
0%
-
0
.00
%
-
0.0
0%
-
24
Lish
een
Mill
ing
Lim
ited
0.5
4%
326
0
.20
%
14
0.0
0%
-
0
.20
%
14
25La
kom
asko
BV
0.0
0%
1
(0.0
0%
) (0
)0
.00
%
-
(0.0
0%
) (0
)26
Pecv
est 1
7 Pr
oprie
tary
Lim
ited*
*0
.00
%
-
0.0
0%
-
0
.00
%
-
0.0
0%
-
27
Veda
nta
Expl
orat
ion
Irela
nd L
imite
d0
.00
%
-
0.0
0%
-
0
.00
%
-
0.0
0%
-
28
Cai
rn In
dia
Hol
ding
s Li
mite
d19
.13%
11
,572
32
.70
%
2,2
75
0.0
0%
-
32
.78%
2
,275
29
Cai
rn E
nerg
y H
ydro
carb
ons
Lim
ited
12.0
0%
7
,262
7.1
4%
497
0
.00
%
-
7.16%
4
97
30C
airn
Lan
ka (P
rivat
e) L
imite
d(0
.70
%)
(424
)(0
.07%
) (5
)0
.00
%
-
(0.0
7%)
(5)
31C
airn
Sou
th A
fric
a Pr
oprie
tary
Lim
ited
(0.0
3%)
(16)
(0.0
7%)
(5)
0.0
0%
-
(0
.07%
) (5
)32
CIG
Mau
ritiu
s H
oldi
ng P
rivat
e Li
mite
d (0
.00
%)
(0)
(0.0
3%)
(2)
0.0
0%
-
(0
.03%
) (2
)33
CIG
Mau
ritiu
s Pr
ivat
e Li
mite
d0
.00
%
0
(0.0
3%)
(2)
0.0
0%
-
(0
.03%
) (2
)34
Cai
rn E
nerg
y A
ustr
alia
Pro
prie
tary
Lim
ited*
*0
.00
%
-
0.0
0%
-
0
.00
%
-
0.0
0%
-
35
Cai
rn E
nerg
y H
oldi
ngs
Lim
ited*
*0
.00
%
-
0.0
0%
-
0
.00
%
-
0.0
0%
-
36
Cai
rn E
nerg
y D
isco
very
Lim
ited
(0.0
0%
) (0
)0
.01%
1
0.0
0%
-
0
.01%
1
37C
airn
Exp
lora
tion
(No.
2) L
imite
d0
.00
%
-
(0.0
0%
) (0
)0
.00
%
-
(0.0
0%
) (0
)38
Cai
rn E
nerg
y G
ujar
at B
lock
1 Li
mite
d0
.00
%
2
(0.0
0%
) (0
)0
.00
%
-
(0.0
0%
) (0
)39
Cai
rn E
xplo
ratio
n (N
o. 7
) Lim
ited
**0
.00
%
-
0.0
0%
-
0
.00
%
-
0.0
0%
-
40
Cai
rn E
nerg
y In
dia
Prop
rieta
ry L
imite
d0
.00
%
-
0.0
0%
-
0
.00
%
-
0.0
0%
-
41
Sesa
Ste
rlite
Mau
ritiu
s H
oldi
ngs
Lim
ited*
**0
.00
%
0
(0.0
0%
) (0
)0
.00
%
-
(0.0
0%
) (0
)N
on-c
ontr
ollin
g in
tere
sts
in a
ll su
bsid
iari
es(2
3.0
2%)
(13,
928)
(62.
63%
) (4
,358
)(13
72.2
2%)
247
(5
9.24
%)
(4,11
1)A
ssoc
iate
s (p
er E
quit
y m
etho
d)
Fina
ncia
l inf
orm
atio
n pu
rsua
nt to
Sch
edul
e III
of C
ompa
nies
Act
, 20
13 C
ontin
ued
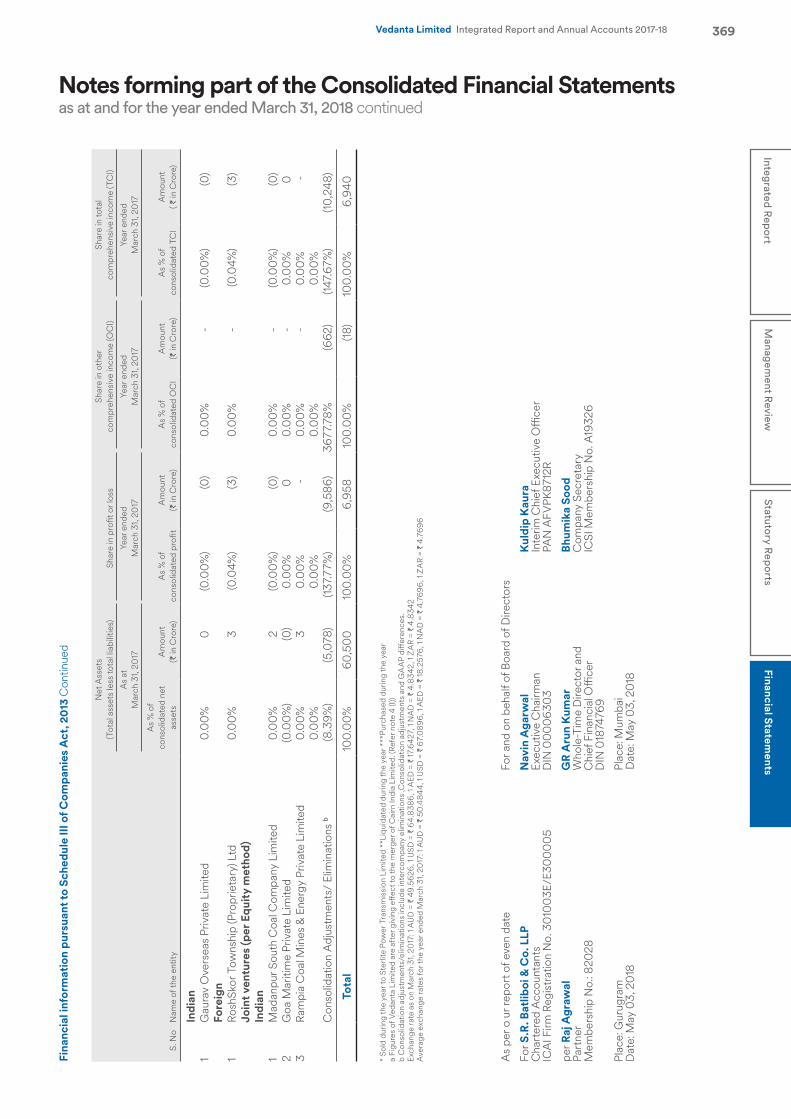
Notes forming part of the Consolidated Financial Statementsas at and for the year ended March 31, 2018 continued
369Integrated R
eport
Managem
ent Review
Statutory R
eports
Financial Statements
Vedanta Limited Integrated Report and Annual Accounts 2017-18
Fina
ncia
l inf
orm
atio
n pu
rsua
nt to
Sch
edul
e III
of C
ompa
nies
Act
, 20
13 C
ontin
ued
S. N
oN
ame
of th
e en
tity
Net
Ass
ets
(Tot
al a
sset
s le
ss to
tal l
iabi
litie
s)Sh
are
in p
rofit
or l
oss
Sh
are
in o
ther
co
mpr
ehen
sive
inco
me
(OC
I)Sh
are
in to
tal
com
preh
ensi
ve in
com
e (T
CI)
As
at
Mar
ch 3
1, 20
17Ye
ar e
nded
M
arch
31,
2017
Year
end
ed
Mar
ch 3
1, 20
17Ye
ar e
nded
M
arch
31,
2017
As
% o
f co
nsol
idat
ed n
et
asse
tsA
mou
nt
(` in
Cro
re)
As
% o
f co
nsol
idat
ed p
rofit
Am
ount
(`
in C
rore
)A
s %
of
cons
olid
ated
OC
IA
mou
nt
(` in
Cro
re)
As
% o
f co
nsol
idat
ed T
CI
Am
ount
( `
in C
rore
)
Indi
an1
Gau
rav
Ove
rsea
s Pr
ivat
e Li
mite
d0
.00
%
0
(0.0
0%
) (0
)0
.00
%
-
(0.0
0%
) (0
)Fo
reig
n1
Rosh
Skor
Tow
nshi
p (P
ropr
ieta
ry) L
td0
.00
%
3
(0.0
4%)
(3)
0.0
0%
-
(0
.04%
) (3
)Jo
int v
entu
res
(per
Equ
ity
met
hod)
Indi
an1
Mad
anpu
r Sou
th C
oal C
ompa
ny L
imite
d 0
.00
%
2
(0.0
0%
) (0
)0
.00
%
-
(0.0
0%
) (0
)2
Goa
Mar
itim
e Pr
ivat
e Li
mite
d(0
.00
%)
(0)
0.0
0%
0
0
.00
%
-
0.0
0%
0
3
Ram
pia
Coa
l Min
es &
Ene
rgy
Priv
ate
Lim
ited
0.0
0%
3
0
.00
%
-
0.0
0%
-
0
.00
%
-
0.0
0%
0
.00
%
0.0
0%
0
.00
%
Con
solid
atio
n A
djus
tmen
ts/
Elim
inat
ions
b(8
.39%
) (5
,078
)(13
7.77
%)
(9,5
86)
3677
.78%
(6
62)
(147.
67%
) (1
0,2
48)
Tota
l10
0.0
0%
60
,50
0
100
.00
% 6
,958
10
0.0
0%
(18)
100
.00
% 6
,940
* So
ld d
urin
g th
e ye
ar to
Ste
rlite
Pow
er T
rans
mis
sion
Lim
ited
**Li
quid
ated
dur
ing
the
year
***
Purc
hase
d du
ring
the
year
a
Figu
res
of V
edan
ta L
imite
d ar
e af
ter g
ivin
g eff
ect t
o th
e m
erge
r of C
airn
Indi
a Li
mite
d. (R
efer
not
e 4
(I))
b C
onso
lidat
ion
adju
stm
ents
/elim
inat
ions
incl
ude
inte
rcom
pany
elim
inat
ions
,Con
solid
atio
n ad
just
men
ts a
nd G
AA
P di
ffere
nces
.Ex
chan
ge ra
te a
s on
Mar
ch 3
1, 20
17: 1
AU
D =
` 4
9.56
26, 1
USD
= `
64.
8386
, 1 A
ED =
` 17
.642
7, 1
NA
D =
` 4
.834
2, 1
ZA
R =
` 4.
8342
Ave
rage
exc
hang
e ra
tes
for t
he y
ear e
nded
Mar
ch 3
1, 20
17: 1
AU
D =
` 5
0.4
844,
1 U
SD =
` 6
7.0
896
, 1 A
ED =
` 18
.257
6, 1
NA
D =
` 4
.769
6, 1
ZA
R =
` 4.
769
6
As
per o
ur r
epor
t of e
ven
date
Fo
r and
on
beha
lf of
Boa
rd o
f Dire
ctor
s
For S
.R. B
atlib
oi &
Co.
LLP
N
avin
Aga
rwal
K
uldi
p K
aura
Cha
rter
ed A
ccou
ntan
ts
Exec
utiv
e C
hairm
an
Inte
rim C
hief
Exe
cutiv
e O
ffice
rIC
AI F
irm R
egis
trat
ion
No.
30
100
3E/E
300
00
5 D
IN 0
00
063
03
PAN
AFV
PK87
12R
per R
aj A
graw
al
GR
Aru
n K
umar
Bh
umik
a So
odPa
rtne
r W
hole
-Tim
e D
irect
or a
nd
Com
pany
Sec
reta
ryM
embe
rshi
p N
o.: 8
2028
C
hief
Fin
anci
al O
ffice
r IC
SI M
embe
rshi
p N
o. A
1932
6
DIN
018
7476
9
Plac
e: G
urug
ram
Pl
ace:
Mum
bai
Dat
e: M
ay 0
3, 2
018
Dat
e: M
ay 0
3, 2
018
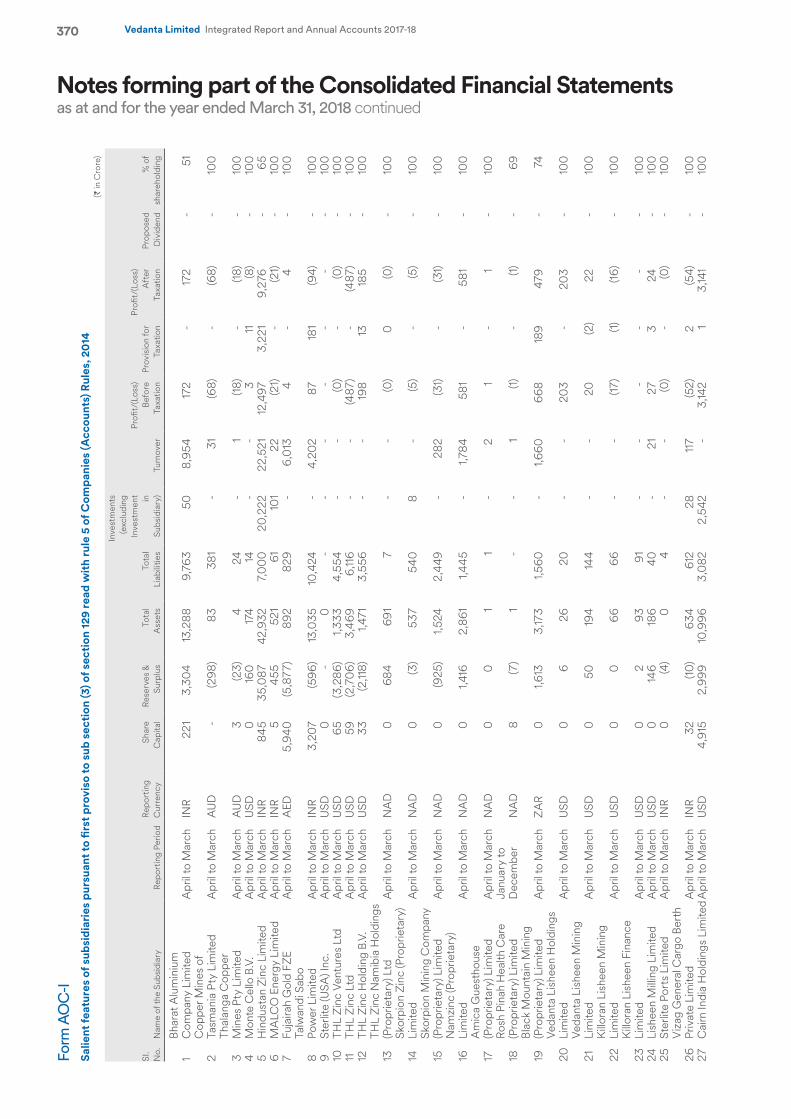
Notes forming part of the Consolidated Financial Statementsas at and for the year ended March 31, 2018 continued
370 Vedanta Limited Integrated Report and Annual Accounts 2017-18
Form
AO
C-I
Salie
nt fe
atur
es o
f sub
sidi
arie
s pu
rsua
nt to
firs
t pro
viso
to s
ub s
ecti
on (3
) of s
ecti
on 1
29 r
ead
wit
h ru
le 5
of C
ompa
nies
(Acc
ount
s) R
ules
, 20
14
(` in
Cro
re)
SI.
No.
Nam
e of
the
Subs
idia
ryRe
port
ing
Perio
dRe
port
ing
Cur
renc
ySh
are
Cap
ital
Rese
rves
&
Surp
lus
Tota
l A
sset
sTo
tal
Liab
ilitie
s
Inve
stm
ents
(e
xclu
ding
In
vest
men
t in
Subs
idia
ry)
Turn
over
Profi
t/(L
oss)
Be
fore
Ta
xatio
nPr
ovis
ion
for
Taxa
tion
Profi
t/(L
oss)
A
fter
Ta
xatio
nPr
opos
ed
Div
iden
d %
of
shar
ehol
ding
1Bh
arat
Alu
min
ium
C
ompa
ny L
imite
dA
pril
to M
arch
INR
221
3
,30
4 13
,288
9
,763
5
0
8,9
54
172
-
172
-
51
2C
oppe
r Min
es o
f Ta
sman
ia P
ty L
imite
dA
pril
to M
arch
AU
D -
(2
98)
83
381
-
3
1 (6
8) -
(6
8) -
10
0
3Th
alan
ga C
oppe
r M
ines
Pty
Lim
ited
Apr
il to
Mar
chA
UD
3
(23)
4
24
-
1 (1
8) -
(1
8) -
10
0
4M
onte
Cel
lo B
.V.
Apr
il to
Mar
chU
SD0
160
17
4 14
-
-
3
11
(8
) -
10
0
5H
indu
stan
Zin
c Li
mite
dA
pril
to M
arch
INR
845
3
5,0
87
42,
932
7,0
00
2
0,2
22
22,
521
12,4
97
3,2
21
9,2
76
-
65
6M
ALC
O E
nerg
y Li
mite
dA
pril
to M
arch
INR
5
455
5
21
61
101
22
(21)
-
(21)
-
100
7
Fuja
irah
Gol
d FZ
E A
pril
to M
arch
AED
5,9
40
(5,8
77)
892
8
29
-
6,0
13
4
-
4
-
100
8Ta
lwan
di S
abo
Po
wer
Lim
ited
Apr
il to
Mar
chIN
R 3
,207
(5
96)
13,0
35
10,4
24
-
4,2
02
87
181
(94)
-
100
9
Ster
lite
(USA
) Inc
. A
pril
to M
arch
USD
0
-
0 -
-
-
-
-
-
-
10
0
10TH
L Zi
nc V
entu
res
Ltd
Apr
il to
Mar
chU
SD 6
5 (3
,286
) 1,
333
4,5
54
-
-
(0)
-
(0)
-
100
11
THL
Zinc
Ltd
A
pril
to M
arch
USD
59
(2,7
06)
3,4
69
6,11
6 -
-
(4
87)
-
(487
) -
10
0
12TH
L Zi
nc H
oldi
ng B
.V.
Apr
il to
Mar
chU
SD 3
3 (2
,118)
1,47
1 3
,556
-
-
19
8 13
18
5 -
10
0
13TH
L Zi
nc N
amib
ia H
oldi
ngs
(Pro
prie
tary
) Ltd
Apr
il to
Mar
chN
AD
0 6
84
691
7
-
-
(0
) 0
(0
) -
10
0
14Sk
orpi
on Z
inc
(Pro
prie
tary
) Li
mite
dA
pril
to M
arch
NA
D 0
(3
) 5
37
540
8
-
(5
) -
(5
) -
10
0
15Sk
orpi
on M
inin
g C
ompa
ny
(Pro
prie
tary
) Lim
ited
Apr
il to
Mar
chN
AD
0 (9
25)
1,52
4 2
,449
-
2
82
(31)
-
(31)
-
100
16N
amzi
nc (P
ropr
ieta
ry)
Lim
ited
Apr
il to
Mar
chN
AD
0
1,41
6 2
,861
1,
445
-
1,78
4 5
81
-
581
-
10
0
17A
mic
a G
uest
hous
e (P
ropr
ieta
ry) L
imite
dA
pril
to M
arch
NA
D 0
0
1 1
-
2
1 -
1
-
100
18Ro
sh P
inah
Hea
lth C
are
(Pro
prie
tary
) Lim
ited
Janu
ary
to
Dec
embe
rN
AD
8
(7)
1 -
-
1
(1)
-
(1)
-
69
19Bl
ack
Mou
ntai
n M
inin
g (P
ropr
ieta
ry) L
imite
dA
pril
to M
arch
ZA
R0
1,61
3 3
,173
1,56
0
-
1,66
0
668
18
9 4
79
-
74
20Ve
dant
a Li
shee
n H
oldi
ngs
Lim
ited
Apr
il to
Mar
chU
SD0
6
26
20
-
-
2
03
-
20
3 -
10
0
21Ve
dant
a Li
shee
n M
inin
g Li
mite
dA
pril
to M
arch
USD
0 5
0
194
144
-
-
20
(2
) 2
2 -
10
0
22K
illor
an L
ishe
en M
inin
g Li
mite
dA
pril
to M
arch
USD
0 0
6
6 6
6 -
-
(1
7) (1
) (1
6) -
10
0
23K
illor
an L
ishe
en F
inan
ce
Lim
ited
Apr
il to
Mar
chU
SD0
2
93
91
-
-
-
-
-
-
100
24
Lish
een
Mill
ing
Lim
ited
Apr
il to
Mar
chU
SD0
146
186
40
-
2
1 2
7 3
2
4 -
10
0
25St
erlit
e Po
rts
Lim
ited
Apr
il to
Mar
chIN
R0
(4)
0
4
-
-
(0)
-
(0)
-
100
26V
izag
Gen
eral
Car
go B
erth
Pr
ivat
e Li
mite
dA
pril
to M
arch
INR
32
(10)
634
6
12
28
117
(52)
2
(54)
-
100
27
Cai
rn In
dia
Hol
ding
s Li
mite
d A
pril
to M
arch
USD
4,9
15
2,99
910
,996
3,0
822,
542
-
3,14
2 1
3,14
1 -
10
0
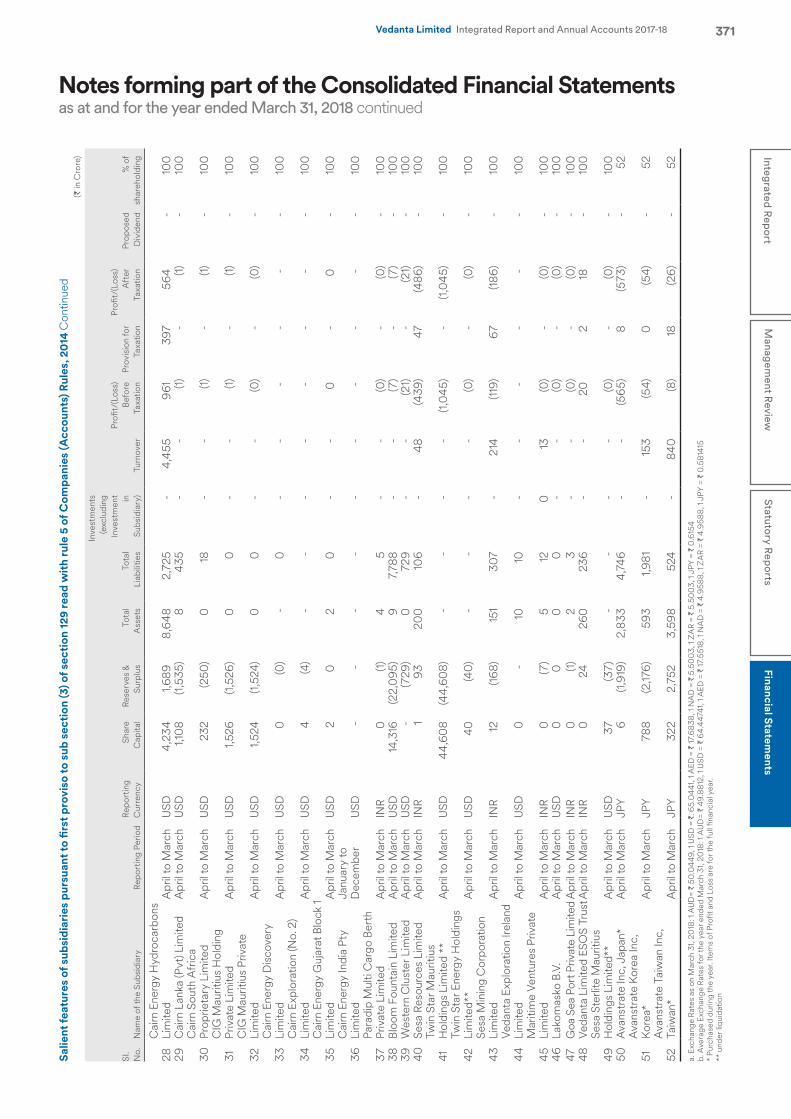
Notes forming part of the Consolidated Financial Statementsas at and for the year ended March 31, 2018 continued
371Integrated R
eport
Managem
ent Review
Statutory R
eports
Financial Statements
Vedanta Limited Integrated Report and Annual Accounts 2017-18
(` in
Cro
re)
SI.
No.
Nam
e of
the
Subs
idia
ryRe
port
ing
Perio
dRe
port
ing
Cur
renc
ySh
are
Cap
ital
Rese
rves
&
Surp
lus
Tota
l A
sset
sTo
tal
Liab
ilitie
s
Inve
stm
ents
(e
xclu
ding
In
vest
men
t in
Subs
idia
ry)
Turn
over
Profi
t/(L
oss)
Be
fore
Ta
xatio
nPr
ovis
ion
for
Taxa
tion
Profi
t/(L
oss)
A
fter
Ta
xatio
nPr
opos
ed
Div
iden
d %
of
shar
ehol
ding
28C
airn
Ene
rgy
Hyd
roca
rbon
s Li
mite
dA
pril
to M
arch
USD
4,2
34
1,68
9 8
,648
2
,725
-
4
,455
9
61
397
5
64
-
100
29
Cai
rn L
anka
(Pvt
) Lim
ited
Apr
il to
Mar
chU
SD 1,
108
(1,5
35)
8
435
-
-
(1
) -
(1
) -
10
0
30C
airn
Sou
th A
fric
a Pr
oprie
tary
Lim
ited
Apr
il to
Mar
chU
SD 2
32
(250
)0
18
-
-
(1) -
(1)
-
100
31C
IG M
aurit
ius
Hol
ding
Pr
ivat
e Li
mite
d A
pril
to M
arch
USD
1,52
6 (1
,526
)0
0 -
-
(1
) -
(1
) -
10
0
32C
IG M
aurit
ius
Priv
ate
Lim
ited
Apr
il to
Mar
chU
SD 1,
524
(1,5
24)
00
-
-
(0)
-
(0)
-
100
33C
airn
Ene
rgy
Dis
cove
ry
Lim
ited
Apr
il to
Mar
chU
SD0
(0)
-
0 -
-
-
-
-
-
10
0
34C
airn
Exp
lora
tion
(No.
2)
Lim
ited
Apr
il to
Mar
chU
SD 4
(4
) -
-
-
-
-
-
-
-
10
0
35C
airn
Ene
rgy
Guj
arat
Blo
ck 1
Lim
ited
Apr
il to
Mar
chU
SD 2
0
2
0-
-
0 -
0
-
100
36C
airn
Ene
rgy
Indi
a Pt
y Li
mite
dJa
nuar
y to
D
ecem
ber
USD
-
-
-
-
-
-
-
-
-
-
100
37Pa
radi
p M
ulti
Car
go B
erth
Pr
ivat
e Li
mite
dA
pril
to M
arch
INR
0 (1
) 4
5
-
-
(0
) -
(0
) -
10
0
38Bl
oom
Fou
ntai
n Li
mite
dA
pril
to M
arch
USD
14,3
16
(22,
095
) 9
7
,788
-
-
(7
) -
(7
) -
10
0
39W
este
rn C
lust
er L
imite
dA
pril
to M
arch
USD
-
(729
)0
729
-
-
(2
1) -
(2
1) -
10
0
40Se
sa R
esou
rces
Lim
ited
Apr
il to
Mar
chIN
R 1
93
20
0
106
-
48
(439
) 4
7 (4
86)
-
100
41Tw
in S
tar M
aurit
ius
Hol
ding
s Li
mite
d **
Apr
il to
Mar
chU
SD 4
4,60
8 (4
4,60
8) -
-
-
-
(1
,045
) -
(1
,045
) -
10
0
42Tw
in S
tar E
nerg
y H
oldi
ngs
Lim
ited*
*A
pril
to M
arch
USD
40
(4
0) -
-
-
-
(0
) -
(0
) -
10
0
43Se
sa M
inin
g C
orpo
ratio
n Li
mite
dA
pril
to M
arch
INR
12
(168
) 15
1 3
07
-
214
(1
19)
67
(186
) -
10
0
44Ve
dant
a Ex
plor
atio
n Ire
land
Li
mite
dA
pril
to M
arch
USD
0 -
10
10
-
-
-
-
-
-
10
0
45M
ariti
me
Vent
ures
Priv
ate
Lim
ited
Apr
il to
Mar
chIN
R0
(7)
5
12
0 13
(0
) -
(0
) -
10
0
46La
kom
asko
B.V
.A
pril
to M
arch
USD
00
0
0 -
-
(0
) -
(0
) -
10
0
47G
oa S
ea P
ort P
rivat
e Li
mite
dA
pril
to M
arch
INR
0 (1
) 2
3
-
-
(0
) -
(0
) -
10
0
48Ve
dant
a Li
mite
d ES
OS
Trus
tApr
il to
Mar
chIN
R 0
2
4 2
60
236
-
-
2
0
2
18
-
100
49Se
sa S
terli
te M
aurit
ius
Hol
ding
s Li
mite
d**
Apr
il to
Mar
chU
SD 3
7 (3
7) -
-
-
-
(0
) -
(0
) -
10
0
50A
vans
trat
e In
c, J
apan
*A
pril
to M
arch
JPY
6
(1,9
19)
2,83
34,
746
-
-
(56
5)8
(573
) -
5
2
51A
vans
trat
e Ko
rea
Inc,
Ko
rea*
Apr
il to
Mar
chJP
Y 7
88
(2,17
6) 5
93
1,98
1 -
15
3 (5
4)0
(54)
-
52
52A
vans
trat
e Ta
iwan
Inc,
Ta
iwan
*A
pril
to M
arch
JPY
322
2
,752
3
,598
52
4 -
8
40
(8)
18 (2
6) -
5
2
a. E
xcha
nge
Rate
s as
on
Mar
ch 3
1, 20
18: 1
AU
D=
` 50
.04
49, 1
USD
= `
. 65.
04
41, 1
AED
= `
17.6
838,
1 N
AD
= `
5.5
00
3, 1
ZA
R =
` 5.
500
3, 1
JPY
= `
0.6
154
b. A
vera
ge E
xcha
nge
Rate
s fo
r the
yea
r end
ed M
arch
31,
2018
: 1 A
UD
= `
49.8
812,
1 U
SD =
` 6
4.4
4741
, 1 A
ED =
` 17
.551
8, 1
NA
D =
` 4
.958
8, 1
ZA
R =
` 4.
958
8, 1
JPY
= `
0.5
8141
5
*
Purc
hase
d du
ring
the
year
. Ite
ms
of P
rofit
and
Los
s ar
e fo
r the
full
finan
cial
yea
r.**
und
er li
quid
atio
n
Salie
nt fe
atur
es o
f sub
sidi
arie
s pu
rsua
nt to
firs
t pro
viso
to s
ub s
ecti
on (3
) of s
ecti
on 1
29 r
ead
wit
h ru
le 5
of C
ompa
nies
(Acc
ount
s) R
ules
, 20
14 C
ontin
ued
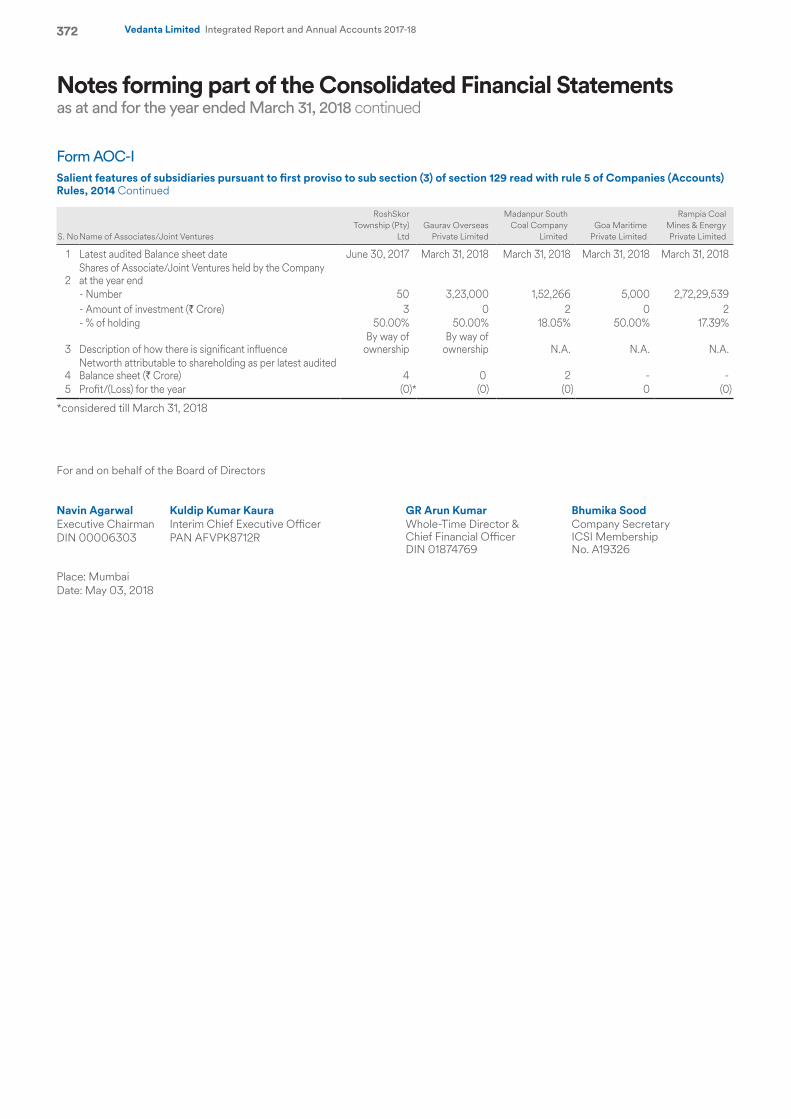
Notes forming part of the Consolidated Financial Statementsas at and for the year ended March 31, 2018 continued
372 Vedanta Limited Integrated Report and Annual Accounts 2017-18
Form AOC-I
Salient features of subsidiaries pursuant to first proviso to sub section (3) of section 129 read with rule 5 of Companies (Accounts) Rules, 2014 Continued
S. NoName of Associates/Joint Ventures
RoshSkor Township (Pty)
LtdGaurav Overseas
Private Limited
Madanpur South Coal Company
Limited Goa Maritime
Private Limited
Rampia Coal Mines & Energy Private Limited
1 Latest audited Balance sheet date June 30, 2017 March 31, 2018 March 31, 2018 March 31, 2018 March 31, 2018
2Shares of Associate/Joint Ventures held by the Company at the year end- Number 50 3,23,000 1,52,266 5,000 2,72,29,539 - Amount of investment (` Crore) 3 0 2 0 2 - % of holding 50.00% 50.00% 18.05% 50.00% 17.39%
3 Description of how there is significant influenceBy way of
ownershipBy way of
ownership N.A. N.A. N.A.
4Networth attributable to shareholding as per latest audited Balance sheet (` Crore) 4 0 2 - -
5 Profit/(Loss) for the year (0)* (0) (0) 0 (0)
*considered till March 31, 2018
For and on behalf of the Board of Directors
Navin Agarwal Kuldip Kumar Kaura GR Arun Kumar Bhumika SoodExecutive Chairman Interim Chief Executive Officer Whole-Time Director &
Chief Financial OfficerDIN 01874769
Company Secretary ICSI Membership No. A19326
DIN 00006303 PAN AFVPK8712R
Place: MumbaiDate: May 03, 2018

NOTES

NOTES

NOTES

NOTES
CRISIL Research certifies that the overall credit quality of Vedanta Ltd’s treasury portfolio of fixed incomeinvestments has been consistently evaluated as
‘Tier 1’ (highest safety from credit default on CRISIL’s 4 point scale^) for the financial year April 2017 to March 2018
Portfolio Credit Quality Analysis2017-2018
Jiju VidyadharanSenior Director, CRISIL Research
^ The credit quality of fixed income investments is classified into a 4 point scale of ‘Tier 1’, ‘Tier 2’, ‘Tier 3’ and ‘Tier 4’
Vedanta Ltd
Tier 1Portfolio
Credit Quality
Disclaimer:This portfolio credit quality analysis (“Analysis”) is done by CRISIL Limited (“CRISIL”) through its Research Division (also called “CRISIL Research”). This Analysis is based on the report (“Report”) prepared by CRISIL for Vedanta Ltd. CRISIL has takenreasonable care in preparing the Report and conducting this Analysis. This Analysis is based on the Report which is prepared based on information and material provided to CRISIL by the Client and/or obtained by CRISIL from sources considered reliable. CRISIL does notindependently verify such information. Accordingly, CRISIL does not warrant that the information or material on which the Report or the Analysis is based (or the report itself) is error-free, complete, adequate or that no other aspect other than those set out in the reportneed be considered. CRISIL disclaims all liability in respect of the Report and the Analysis including, without limitation, those arising from: (a) any errors or omissions in the information or material on which the Report or Analysis is based or the Report itself; (b) any use ofthe Report or the Analysis; (c) any decisions made or results obtained from the use of the Report / Analysis or reliance placed on the Report / Analysis. This Analysis is not a recommendation to invest / disinvest in any of the Client or any other entity covered in the Analysis /Report and no part of this Analysis / Report should be construed as an investment advice. CRISIL especially states that it has no financial liability whatsoever to the subscribers/ users/ transmitters/ distributors of this Analysis. CRISIL Research operates independently of,and does not have access to information obtained by CRISIL’s Ratings Division / CRISIL Risk and Infrastructure Solutions Limited (CRIS), which may, in their regular operations, obtain information of a confidential nature. The views expressed in this Report are that ofCRISIL Research and not of CRISIL’s Ratings Division / CRIS. No part of this Report may be published / reproduced in any form without CRISIL’s prior written approval.
u Vidyadharan
([email protected])Design and production of the Integrated Report at and(www.emperor.works)
VEDANTA LIMITEDZINC-LEAD-SILVER | OIL & GAS | ALUMINIUM & POWER | COPPER | IRON ORE
1st Floor, ‘C’ wing, Unit 103, Corporate Avenue, Atul Projects, Chakala, Andheri (East), Mumbai–400093, Maharashtra
CIN: L13209MH1965PLC291394 | www.vedantalimited.com
VED
AN
TA LIM
ITEDIntegrated R
eport and Annual A
ccounts 2017-18
Related Documents