DETECTION OF PESTICIDES IN FISH FROM TONLE SAP LAKE CAMBODIA Chanleakhena Phoeung , Aung Naing Myo, Stéphane Bayen, Boon Huan Tan, Nicolas Steenkeste, Khov Meas, Puy Lim, Monidarin Chou, Barry Kelly Symposium on Biodiversity & Health Symposium 17-18 th November 2014

Chanleakhena Phoeung, Aung Naing Myo, Stéphane Bayen, Boon Huan Tan, Nicolas Steenkeste, Khov Meas, Puy Lim, Monidarin Chou, Barry Kelly Symposium on Biodiversity.
Dec 16, 2015
Welcome message from author
This document is posted to help you gain knowledge. Please leave a comment to let me know what you think about it! Share it to your friends and learn new things together.
Transcript

DETECTION OF PESTICIDES IN FISH FROM TONLE SAP LAKE
CAMBODIAChanleakhena Phoeung, Aung Naing Myo, Stéphane Bayen, Boon Huan Tan, Nicolas
Steenkeste, Khov Meas, Puy Lim, Monidarin Chou, Barry Kelly
Symposium on Biodiversity & Health Symposium17-18th November 2014
Outline• Introduction
• Exposure to Pesticides
• Objective and Method of study
• Results of study
• Conclusion
• Recommendations

Source : Nile River Awareness Kit "Physical and Chemical Characteristics of Water Quality."
Introduction

Problems bioaccumulation and Biomagnification
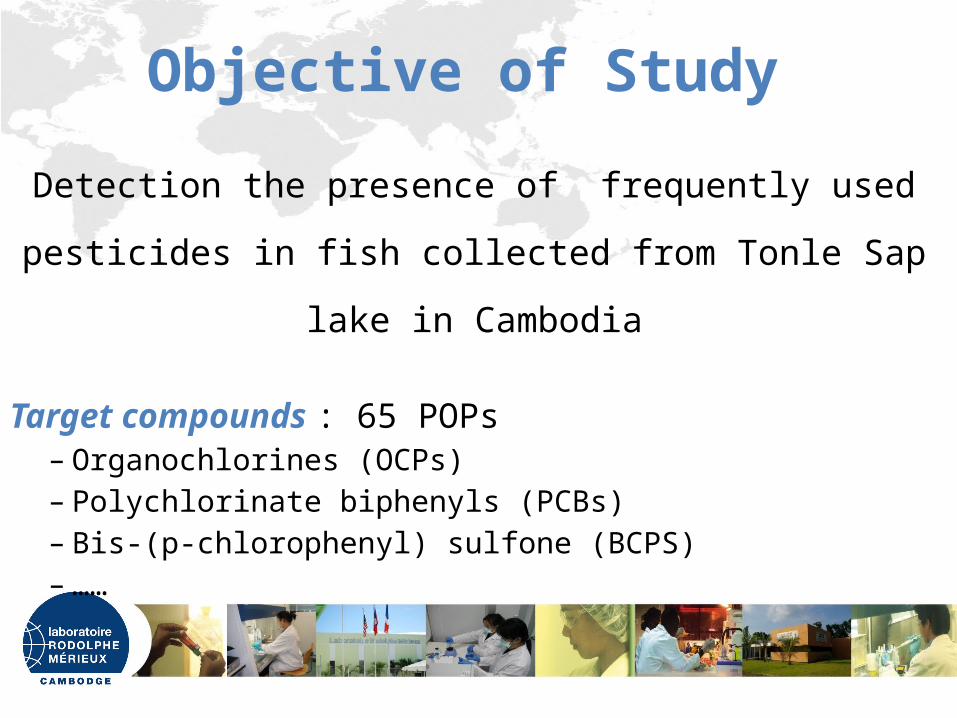
Detection the presence of frequently used pesticides in
fish collected from Tonle Sap lake in Cambodia
Target compounds : 65 POPs– Organochlorines (OCPs)– Polychlorinate biphenyls (PCBs)– Bis-(p-chlorophenyl) sulfone (BCPS)– ……
Objective of Study
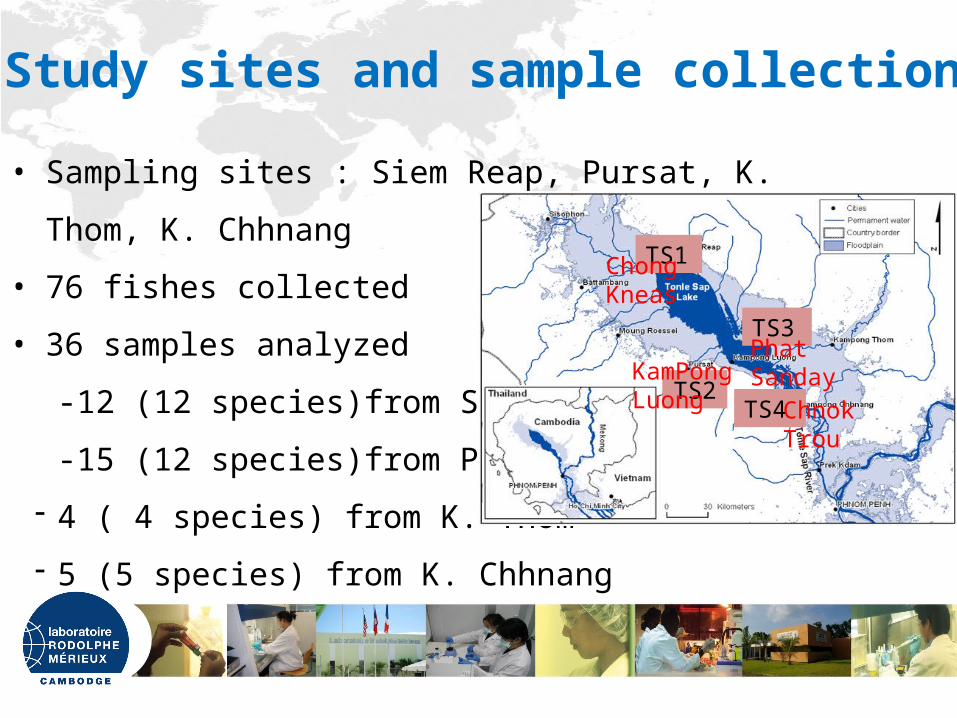
• Sampling sites : Siem Reap, Pursat, K. Thom, K. Chhnang
• 76 fishes collected
• 36 samples analyzed
-12 (12 species)from Siem Reap
-15 (12 species)from Pursat
- 4 ( 4 species) from K. Thom
- 5 (5 species) from K. Chhnang
Study sites and sample collection
TS1
TS2
TS3
TS4
Chong Kneas
Phat SandayKamPong Luong
Chnok Trou
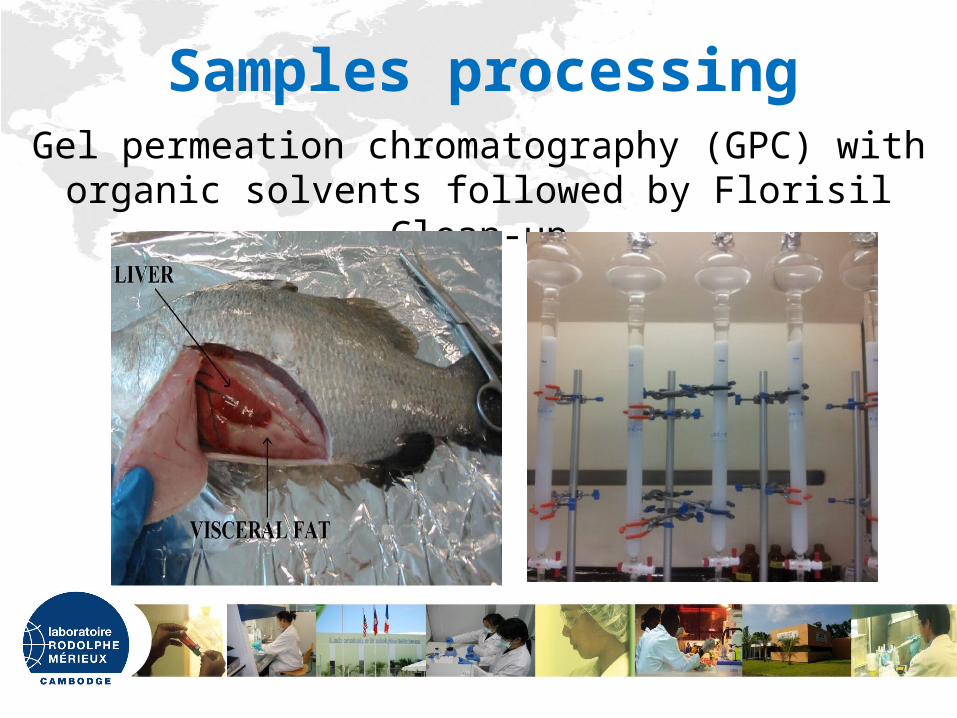
Gel permeation chromatography (GPC) with organic solvents followed by Florisil Clean-up
Samples processing

8
Injector : splitless mode
Gaz : He
Column : DB-5MS
60 m X 0.25 mm X 0,10 µm
T˚ column : 80˚C
Inj. Vol : 3 ml/min, T˚ inj : 250˚C
Flow rate : 1,2 ml/min
Presure : 155,7 kPa1min
80˚C
160˚C
20˚C/min
200 ˚C
4 ˚C/min
250 ˚C
2 ˚C/min
20 ˚C/min 10min
Gradient
300˚C
GAS CHROMATOGRAPHY-MASS SPECTROMETRY (GC-MS) : Condition
Samples Analysis

RESULTS
10
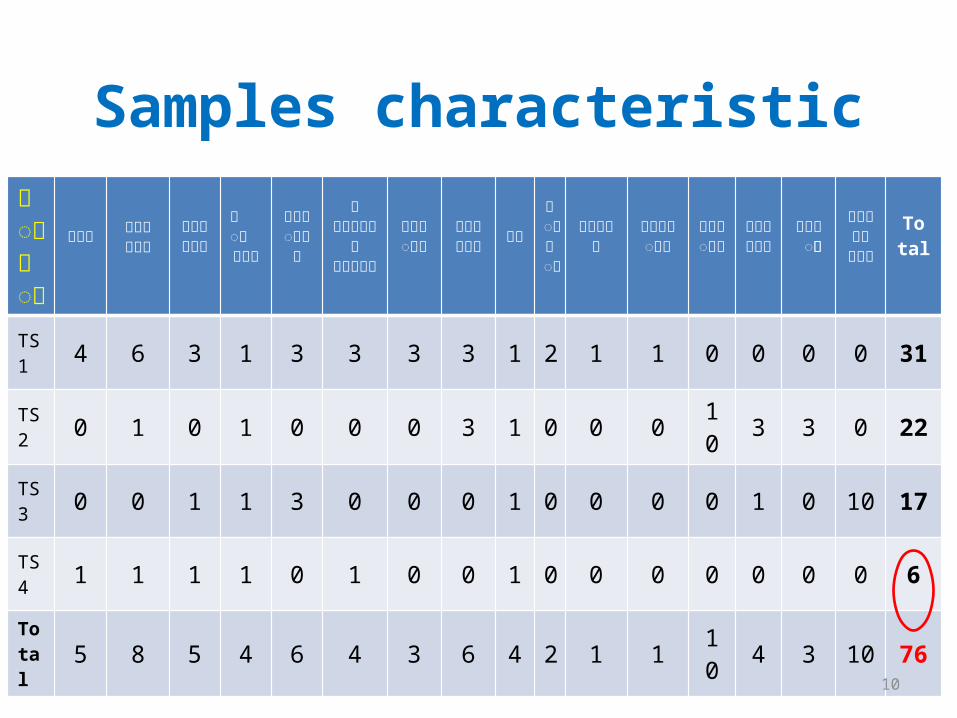
Samples characteristic
ត� កែ�ស ច�កែ�ង
ប�មា ��� ឆលា� ង�ន�ងប�ង ឆកោឆលា� � �ញចះ��� ឆកោ�
ឆ�មា�
��យ សនតា�យ �� ��ឡ
ង� សលា� តអាចម!���
Total
TS1 4 6 3 1 3 3 3 3 1 2 1 1 0 0 0 0 31
TS2 0 1 0 1 0 0 0 3 1 0 0 0 10 3 3 0 22
TS3 0 0 1 1 3 0 0 0 1 0 0 0 0 1 0 10 17
TS4 1 1 1 1 0 1 0 0 1 0 0 0 0 0 0 0 6
Total 5 8 5 4 6 4 3 6 4 2 1 1 10 4 3 10 76

Main POPs detectedCompound name Concentration Permissible limit
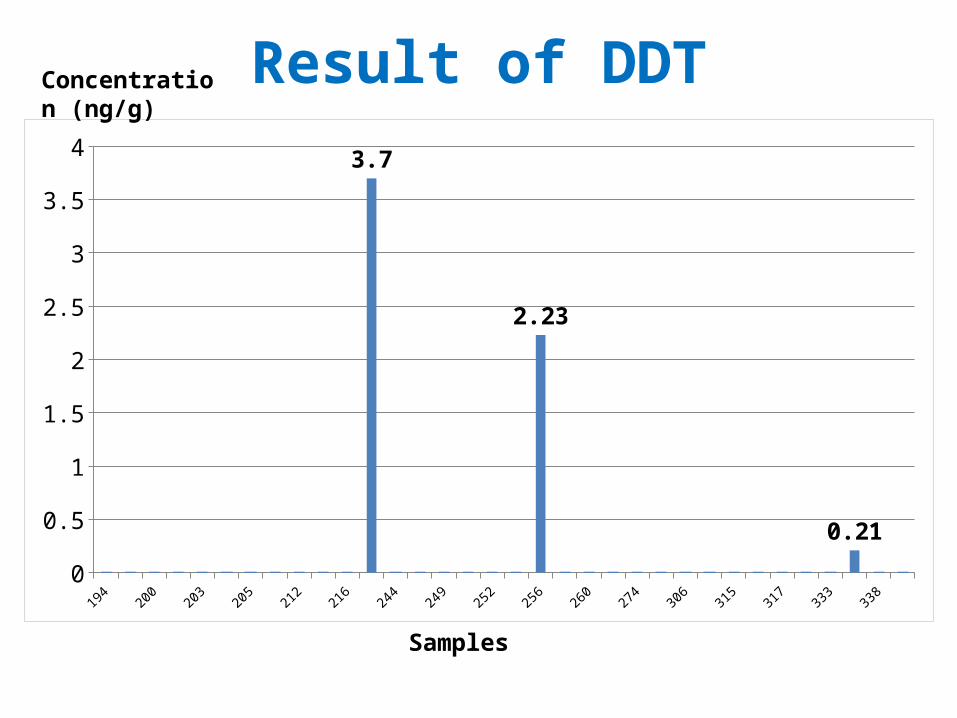
p,p’- DDT 0.00 to 3.70 ng/g 5ppm
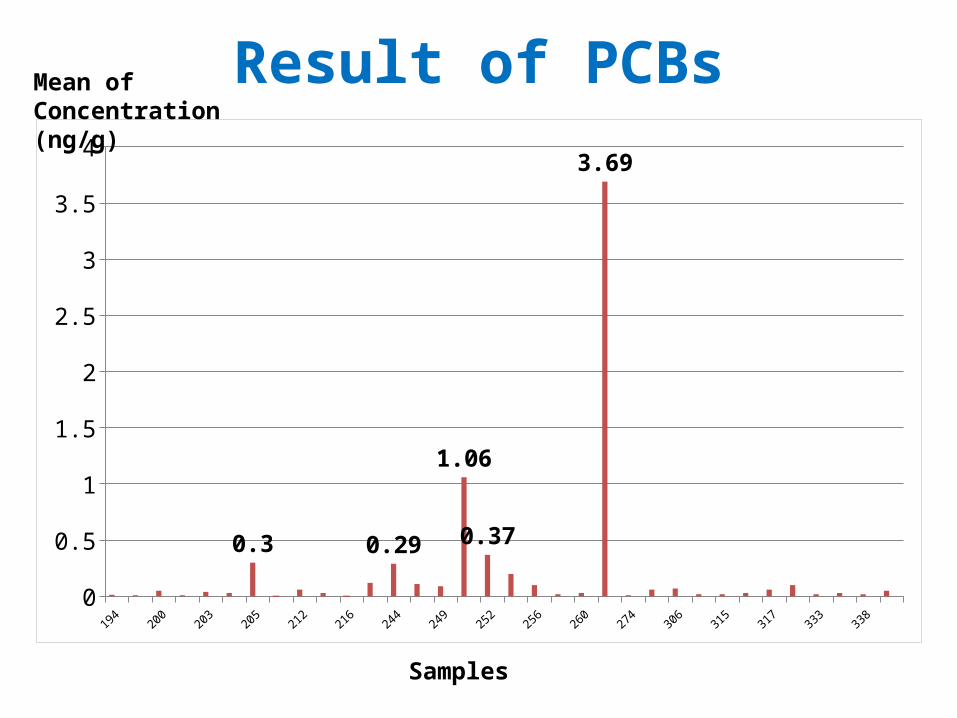
PCBs 0.00 to 9.99 ng/g 2ppm
BCPS 0.00 to 0.86 ng/g 10ppm
FAO J Toxicol Environ Health A. 1999 Jun 11;57(3):185-98.
194199
200202
203204
205209
212215
216217
244247
249251
252255
256257
260264
274303
306314
315316
317330
333336
338349
0
0.5
1
1.5
2
2.5
3
3.5
43.7
2.23
0.21
Result of DDT
Samples
Concentration (ng/g)
194199
200202
203204
205209
212215
216217
244247
249251
252255
256257
260264
274303
306314
315316
317330
333336
338349
0
0.5
1
1.5
2
2.5
3
3.5
4
0.3 0.29
1.06
0.37
3.69
Result of PCBs
Samples
Mean of Concentration(ng/g)

0
0.1
0.2
0.3
0.4
0.5
0.6
0.7
0.8
0.9
1
0.67
0.86
0.75
0.03
0.85
0.71
Result of BCPSConcentration(ng/g)
Samples

Siem Reap Pursat K. Thom K. Chhnang0
2
4
6
8
10
12
3.7
00.86
9.99Chart Title
p,p'- DDTPCBsBCPS
Max Con-centration
ng/g
POPs detected in different sites
Study sites

Conclusion• Trace of dangerous compounds are detected in Tonle Sap fish
• Predominant compounds are p,p’-DDT, PCBs and BCPS.
• Concentration of each compound is variable from one site to another
• These compounds are bioaccumulated and biomagnified it may affect
to the people.
• Limit use of dangerous pesticides by educating users about its hazard
• Monitor residue frequently of pesticides in ecology system

Acknowledgements

THANK YOU
Related Documents


![Aung Shain - Phoe Sate Phyu & Kyar Zan [Mahar Ga Naing]](https://static.cupdf.com/doc/110x72/55cf8e11550346703b8e3379/aung-shain-phoe-sate-phyu-kyar-zan-mahar-ga-naing.jpg)


