CHANGING PATTERN IN WORLD TEXTILE TRADE DR. AYUB MEHAR R-73, Block 7, Decent Town, Gulistan-e- Jauhar, Karachi 75290 (Pakistan) Ph. 92-021-8130550; 92-21-8130762 Email: [email protected] _________________________________________________ ABSTRACT The objective of this study is to forecast the future trade patterns and to identify the determinants of exports of textile and clothing. We included top 24 leading exporting countries from the textile and clothing sectors. Those countries cover more than 72 percent of global exports and 70 percent of imports in textile and clothing sectors. The countries cover 81 percent of the Gross World Product (GWP) also. To quantify the impacts of causal factors on imports and exports, we developed an econometric model and found that financial liquidity, endogenous production of cotton and the magnitude of imported raw material and intermediate goods are the root-causes of export of textile and clothing products. While, GDP and exports of textile and clothing products are proved as good predictors of import of textile and clothing products. The study gives surprising results and mentions that China, Hong Kong and Italy will be the net looser, while the United States and Canada will be the net gainers in future.

Welcome message from author
This document is posted to help you gain knowledge. Please leave a comment to let me know what you think about it! Share it to your friends and learn new things together.
Transcript
CHANGING PATTERN IN WORLD TEXTILE TRADE
DR. AYUB MEHAR R-73, Block 7, Decent Town, Gulistan-e- Jauhar, Karachi 75290 (Pakistan) Ph.
92-021-8130550; 92-21-8130762 Email: [email protected]
_________________________________________________
ABSTRACT
The objective of this study is to forecast the future trade patterns and to identify the determinants of exports of textile and clothing. We included top 24 leading exporting countries from the textile and clothing sectors. Those countries cover more than 72 percent of global exports and 70 percent of imports in textile and clothing sectors. The countries cover 81 percent of the Gross World Product (GWP) also. To quantify the impacts of causal factors on imports and exports, we developed an econometric model and found that financial liquidity, endogenous production of cotton and the magnitude of imported raw material and intermediate goods are the root-causes of export of textile and clothing products. While, GDP and exports of textile and clothing products are proved as good predictors of import of textile and clothing products. The study gives surprising results and mentions that China, Hong Kong and Italy will be the net looser, while the United States and Canada will be the net gainers in future.

I: INTRODUCTION AND BACKGROUND: Textile and clothing industries and trade have long been a catalyst of economic growth throughout the world. In 2001, it accounted for over US$450 billion of trade worldwide. In terms of share of population employed and of total exports, it is particularly important for developing countries (like Korea, India, Indonesia, and Mexico), especially for some of the least developing countries (like Bangladesh and Pakistan), which have a very high dependence on textile and clothing exports. The total export value in world clothing trade was US $206 billion in 1999, with 63 percent shared by the top 15 exporting countries. China was the world leader, with 16 percent of global export market share, followed by Hong Kong with 12 percent market share, and Italy, United States, Mexico, Germany, Turkey, France, Korea and India. In world textile trade, the total export value of textiles was US $ 164 billion in 1999, with the top 15 countries supplying 74 percent of the global export market share. The leader was China, followed by Hong Kong, Germany, Italy, Korea, Taiwan, and the United States. In 1999, the total export values of Textile and Clothing form China, Hong Kong and Italy were $43 billion, $35 billion and $25 billion respectively. On a compound basis, the total export from China increased by 7 percent annually in 1992-99 (WTO 2000). In the EU alone, the sector employees directly over 2.1 million people, with annual sales worth Euro 200 billion, and its exports represent Euro 45 billion the world’s second largest exporters after China. Pakistan economy depends on textile largely; where more than 65 percent exports earnings come through textile exports, while the share of textile in the country’s GDP and employment is 8 percent and 11 percent respectively. Those figures show the importance of textile and clothing sectors in the world economy. From 2005 all quotas currently applied by World Trade Organization (WTO) members on trade in textiles and clothing, will be abolished. Although, textile and clothing producers in places such as European Union (EU) and the United States will face increased competition, developing countries, which depend considerably on textile and clothing exports to earn foreign exchange, will also be in the front-line. Yet, quota elimination is not the end of the story. Efforts to liberalize the sector continue within the on-going WTO negotiations under the Doha Development Agenda, as many restrictions to trade remain – e.g. very high tariffs and a numbers of non-tariff barriers. Expected fears and changing created a nexus of regulatory frameworks in the front of economic and financial policies of textile and cloths exporting countries. According to the European Trade Commission, Trade in textile raises issues that go the core of the WTO’s Doha Development Agenda: development promotion, free and fair trade, and open market access conditions worldwide. The most important issue in relation with the free trade regime is the sharing of trade among the partners. What will be the expected shares in global markets and
how present ranking will be affected by the trade liberalization; it is an extremely important area and one of the burning issues. China has been a major player in the world clothing and textile trade in recent decades. So, its accession to WTO has been generated serious concerns that how the competitiveness of China’s textile and clothing industry will be influenced by WTO and trade globalization. The US and Caribbean textile producers have shown their fear for the competition from a flood of low-priced Chinese goods once the United States fully phases out import quotas in a little less than two years. According to the American Textile Manufacturers Institute (ATMI), the US textile companies were already facing “extreme price pressures” from China, whose exports to the United States have surged since joining the World Trade Organization two years ago. The US companies face some of their fiercest competition from government-owned Chinese companies that routinely lose money. According to the ATMI, in competing with China, they are not only competing with low wages, they are competing with companies that do not have to make a profit. While, other Asian countries have also cost advantages and they can capture the world’s markets. The US Trade Representative’s office is investigating how ending the quotas will affect the competitive position of US trading partners. In prepared testimony, the ATMI mentioned the US trade panel that it is expected that China to dominate the US import market after the quotas were eliminated. Vietnam, Mexico, Bangladesh and the countries that have preferential trade deals with the United States would make up a second tier group of suppliers. Some private consultants in the United States have also agreed on this assessment. According to the chief of US and Caribbean textile group, the phasing out of quotas in 2005 would deal a “devastating blow” to their industries, amid a flood of low-priced clothing and fabric imports from China. The American Textile Manufacturers’ Institute (ATMI) mentioned that scores of US textile firms and tens of thousands of jobs had already been lost said “extreme price pressures” from factories in China and other countries in Asia. ATMI predicted that China would dominate the US import market from 2005 with other countries that enjoys preferential trade deals with the US. Competition in the market is intense. Besides the remaining domestic producers who compete for business, no less than 125 foreign countries are major shippers of textiles and clothing to the US. When every country is free to export as much textile and clothing to US as it wants, will there still be 125 major suppliers? According to ATMI, US importers of such goods will be dominated by China, with Vietnam, India, Pakistan and some countries, which enjoy preferential access to the US, market “plying secondary roles”, and the rest nowhere. China’s particularly unlimited supply of cheap labor gives it a big advantage in a labor-intensive industry like clothing.
China furthermore is almost self-sufficient in the necessary raw material – cotton, manmade fibers, silk, flax and ramie, dyestuffs and textile chemicals – also in textile machinery. It only needs to import wool, which Australia and New Zealand are only too happy to supply. According to the ATMI, besides the above-mentioned advantages the government of China has created other benefits to ensure China’s dominance of world textile and apparel trade.
1. An undervalued currency, which gives China’s, exports a 30-40 percent price advantage in US market.
2. An attitude that quotas are meant to be circumvented to the tune of $4-5 billion annually.
3. A willingness to permit Chinese companies to steal textile designs and copyrights in violation of its own laws and international agreements.
4. Subsidization of its exports by manipulating the so-called “rebate” of its value-added tax on exports.
5. Predatory pricing or dumping whenever needed to capture market share.
While India and Pakistan have some of the natural and government-induced advantages that China enjoys. However, they do not (except for India’s population) enjoy them to the same degree, as does China. None of them has the population, raw materials, vertical organization or variety of products that China has, or even close to it. Only Vietnam, whose wages are even lower than China’s stands a chance of survival. They struggle to maintain a significant presence in world textile and apparel trade. Textile and apparel account for a significant share of their export earnings and cotton farming is a large part of their domestic economies and the social upheaval. So, they will do whatever it tackles to survive. If it requires more and larger subsidies they will subsidize. If it takes increased dumping, they will dump. If more currency manipulation is needed, they will manipulate their currencies. To protect itself from the fear of uneven competition, United States’ textile industry took an important decision. They are planning to enter into joint ventures with the textile producers in Asian countries. By this way, they will shift their manufacturing units to Asian countries to achieve the significant cost advantages. Heavy inflow of direct investment in the field of textile is being expected in the Asian economies. Now, global textile industry is passing through an interim phase of structural changes. Those changes are the consequence of expected changing in the global trade patterns under the open competition policy. ‘Free Trade System’ follows the classical economic thoughts that:
• If governments take no fiscal measures, the global economies will grow swiftly and end-users (consumers) will be net beneficiaries. Classical economists have been favoring the free trade system.

• Classical theories mention that if a country has absolute advantages in
the production of several commodities (like China has good symptoms of growth in spinning, garments and textile machinery), it will prefer to choose those commodities, where benefits are comparatively higher. By this policy, a country can maximize its overall growth. This choice depends on the way of best utilization of economic and financial resources.
II: OBJECTIVES AND HYPOTHESIS: The objective of this study is to forecast the future trade patterns and to identify the determinants of exports of textile and clothing. We have tested the correlations between several variables and found that there is no significant relation between the trade policies of importing countries and the export volume of exporting countries. Exporting countries strongly emphasize and demand for the friendly policies of importing countries. However, no significant relations between the trade restrictions by importing countries - quota ceiling, regulatory duties, or trade favoritism - and export value were observed. From analytical point of view, we classified the textile exporting countries in three classes:
1. Countries that have sufficient resources in term of endogenous raw material and can supply their products at the lower cost of production. Pakistan, India, China, Turkey and the United States are the members of this class.
2. Countries that have excess liquidity, so they can exploit the market through artificial arrangements. By means of efficient utilization of excess liquidity or savings, they can acquire better technology and then monopolize the trade and marketing and then achieve economies of scale through dumping and marketing strategies. They can provide monetary subsidies in terms of working capital loans and refinancing facilities at cheaper cost of debts. China, Japan, Germany, Italy, France and Canada are included in this category.
3. Countries in the third category are based on the strong economic powers. We included the countries in this class on the bases of their Gross Domestic Products (GDP). If a country has higher GDP, it is the indicator of its higher economic power. The countries who have sufficient economic powers can provide hidden and invisible subsidies like good sources of communication and information, free of cost availability of good infrastructure, insurance facilities at lower cost; cultural and social hegemony, availability of first hand technology and trained management etc. China, United States, Canada, Japan, France, Germany, and Italy are enjoying the status of those countries.
Indonesia, India, Pakistan, Mexico and Turkey are those countries that have not excess liquidity and economic strength. As a result, they have to depend on their endogenous production of raw material and imported raw material and intermediate products. They have lack of proper infrastructure, knowledge and technology. The countries that have strong economic powers, have been paying subsidies at the farm, production, trade facilitation and financing and shipment stages Although protectionism will be abolished since 2005, those tools have developed the export participations of industrialized countries in the global markets. It is quite possible that a country holds all the above three advantages, like China. We included the above-mentioned causes in determination of the patterns of export and import of textile and clothing. Model Specification: We hypothesized that export of textile and clothing depends on the availability of basic and intermediate textile products in the country. Those basic and intermediate products are classified in two categories: First, endogenously produced raw material, and second the imported raw material and intermediate goods. Domestic production of cotton is taken in the model as a proxy of the availability of endogenously produced raw material. While the value of imported textile and clothing products was included in the model as an input for the manufacturing of exportable finished products. The competitiveness of the Textile and Clothing industry in a country depends not only on the core competence of individual enterprises in the industry, but also on the integration of the whole supply chain and relevant supporting industries, as well as internal and external business environments (Li and Newton: 2003). To sustain leadership in their chosen areas, the company seeks to maximize the world-manufacturing share in a core product (Hamel: 1990). The theory of competitiveness of a nation highlights the effects of integration and dynamic interaction across the industry and relevant clusters. The levels of cross-industry integration determine sustainable competitiveness of an industry in a nation. Other than the above-mentioned factors, we hypothesized that financial facility is also an important ingredient in the export trade. It facilitates the export trading and works as a catalyst in the export enhancement. If a country has surplus savings (excess liquidity), it can provide the refinancing and lending facilities to the exporters. We included this variable in the model. According to our model, the last year’s surplus savings will determine the magnitude of exports in present year. In short, we hypothesized that export of clothing and textile products depend on the excess liquidity, availability of locally produced raw cotton and the import of textile and clothing products. While import of textile and clothing products also depends simultaneously on the export of textile and clothing products and the economic strength of the exporting countries. To simplify the model we applied

the last year’s Gross Domestic Product as a proxy of economic strength. This lagged value of economic strength explains the induced import of textile and clothing products. It is an indicator of the Marginal Propensity of Import (MPI). Textile and clothing are classified as basic commodities (less elastic). The trade in textile is directly related with the income of the people in an economy. At a macro-level study, we applied GDP as a proxy of income.
FIGURE: I
SIMULTANEITY IN THE MODEL III. DATA AND METHODOLOGY:
Data Analysis: We included top 15 leading exporting countries from textile and top 15 leading exporting countries from clothing sectors. Altogether there were 24 countries. The World Trade Organization (WTO) has selected those countries in its report in 2000. The selected 24 countries cover more than 72 percent of the world’s export and 70 percent of the imports of textile and clothing. They cover 81 percent of the Gross World Product (GWP). Production capacity in our analysis is defined on the bases of installed machinery. We assigned a value equal to one for the dummy variable of capacity (DUMCP), if a country has more than 5 million spindles or more than 15000 shuttle-less looms. We assigned a value equal to one for the dummy variable of cotton production (DUMCT), if a country produces at least 8 million bales of cotton per year. China, USA, India, Pakistan and Turkey are classified as cotton producers. Each country in this group produces more than 8 million cotton per annum on average basis. So, in this study they are the classified as resource-based countries. We observed in the study that China, Japan, Italy, France, and Netherlands have excess liquidity (LIQ). The levels of their annual savings are much higher than
Raw Material (Cotton Base)
Surplus Liquidity
(Savings – Investment)
Gross Domestic Product (GDP)
Import of Textile and
Clothing
Export of Textile and
Clothing
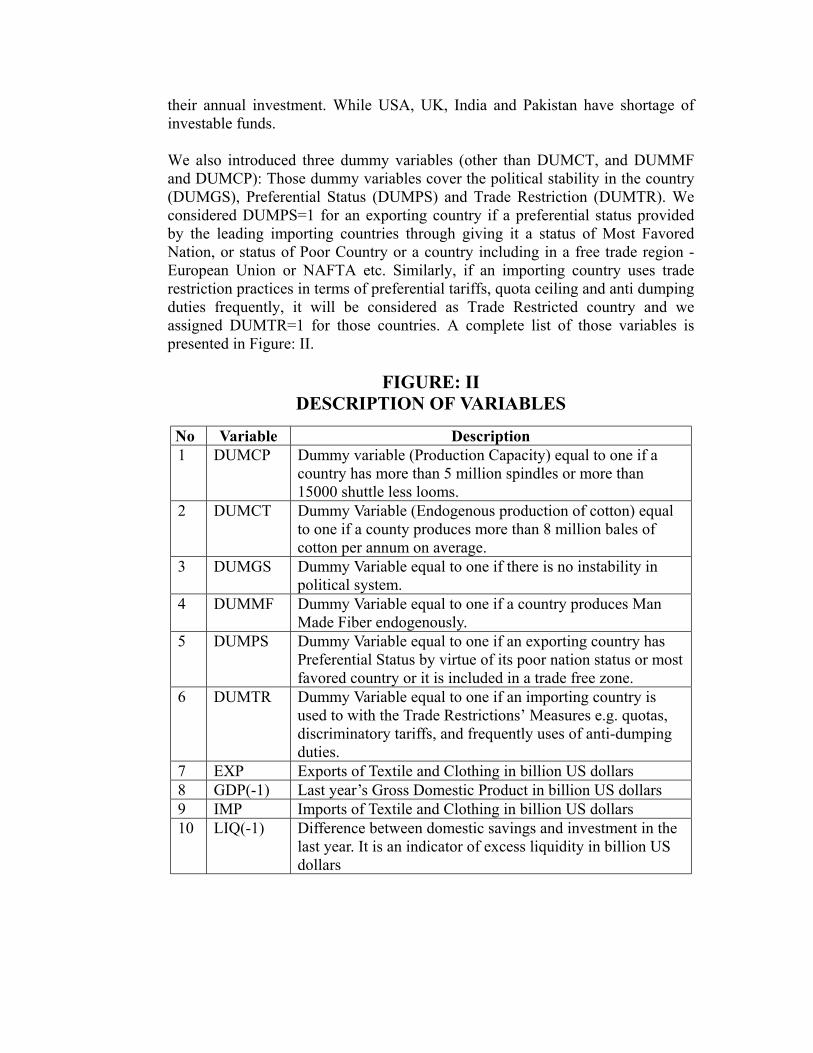
their annual investment. While USA, UK, India and Pakistan have shortage of investable funds. We also introduced three dummy variables (other than DUMCT, and DUMMF and DUMCP): Those dummy variables cover the political stability in the country (DUMGS), Preferential Status (DUMPS) and Trade Restriction (DUMTR). We considered DUMPS=1 for an exporting country if a preferential status provided by the leading importing countries through giving it a status of Most Favored Nation, or status of Poor Country or a country including in a free trade region - European Union or NAFTA etc. Similarly, if an importing country uses trade restriction practices in terms of preferential tariffs, quota ceiling and anti dumping duties frequently, it will be considered as Trade Restricted country and we assigned DUMTR=1 for those countries. A complete list of those variables is presented in Figure: II.
FIGURE: II DESCRIPTION OF VARIABLES
No Variable Description 1 DUMCP Dummy variable (Production Capacity) equal to one if a
country has more than 5 million spindles or more than 15000 shuttle less looms.
2 DUMCT Dummy Variable (Endogenous production of cotton) equal to one if a county produces more than 8 million bales of cotton per annum on average.
3 DUMGS Dummy Variable equal to one if there is no instability in political system.
4 DUMMF Dummy Variable equal to one if a country produces Man Made Fiber endogenously.
5 DUMPS Dummy Variable equal to one if an exporting country has Preferential Status by virtue of its poor nation status or most favored country or it is included in a trade free zone.
6 DUMTR Dummy Variable equal to one if an importing country is used to with the Trade Restrictions’ Measures e.g. quotas, discriminatory tariffs, and frequently uses of anti-dumping duties.
7 EXP Exports of Textile and Clothing in billion US dollars 8 GDP(-1) Last year’s Gross Domestic Product in billion US dollars 9 IMP Imports of Textile and Clothing in billion US dollars 10 LIQ(-1) Difference between domestic savings and investment in the
last year. It is an indicator of excess liquidity in billion US dollars

TABLE: 1 HISTORICAL DATA (Quantitative Variables)
No. Country
Total Export of
Textile and Clothing (Billion
US$)
Total Import of
Textile and Clothing (Billion
US$)
GDP (Billion
US$)
Excess Liquidity (Billion US $)
Availability of Cotton
(DUMCTN) 1 Austria 3 4 212 -2 0 2 Bangladesh 4 2 43 -3 0 3 Belgium 10 9 247 10 0 4 Canada 0 7 599 18 0 5 China 43 11 961 38 1 6 Denmark 2 2 174 7 0 7 France 13 19 1433 43 0 8 Germany 19 31 2142 21 0 9 Hong Kong 35 27 167 0 0 10 India 9 0 383 -19 1 11 Indonesia 7 1 96 0 0 12 Italy 25 12 1171 59 0 13 Japan 7 21 3783 38 0 14 Korea 16 4 298 -3 0 15 Mexico 10 8 393 -8 0 16 Netherlands 6 8 382 23 0 17 Pakistan 7 0 64 -3 1 18 Poland 3 3 149 -6 0 19 Spain 5 7 552 0 0 20 Switzerland 2 5 264 11 0 21 Thailand 5 1 154 2 0 22 Turkey 10 2 190 -11 1 23 UK 9 20 1357 -14 0 24 USA 18 73 8211 -164 1
Total (24) 268 276 23425 37 --- World Total 370 393 28854 289 --- As World % 72 70 81 13 ---
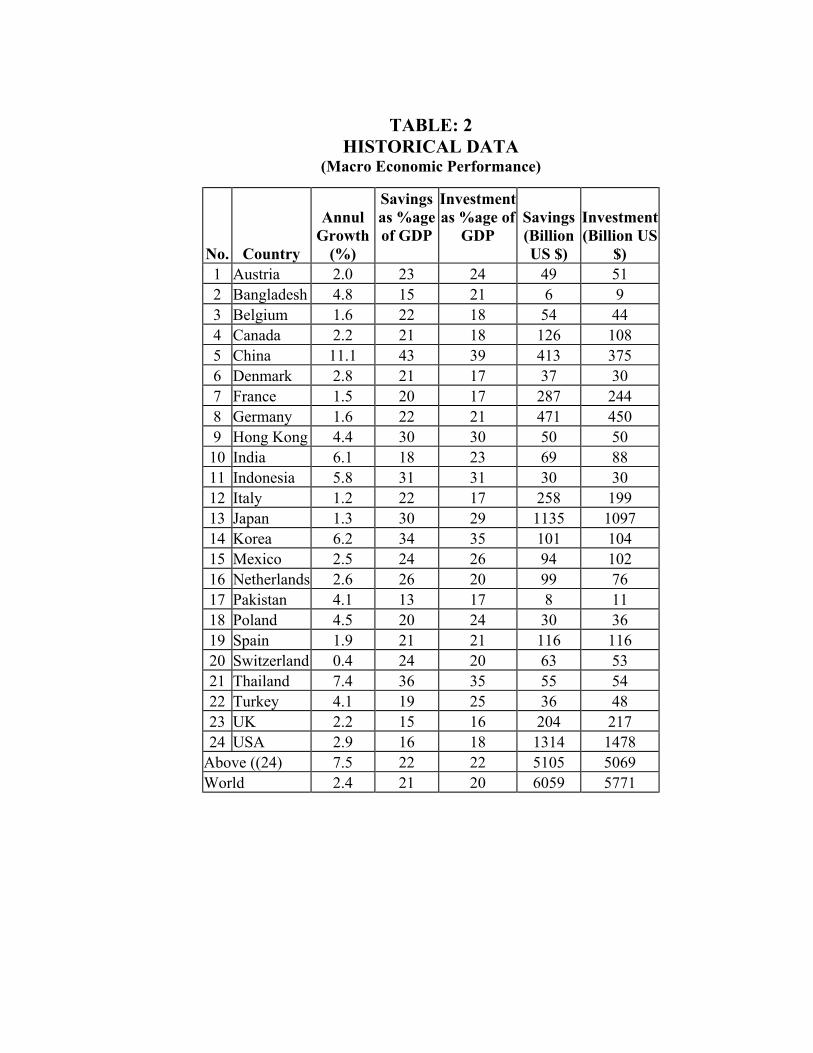
TABLE: 2
HISTORICAL DATA (Macro Economic Performance)
No. Country
Annul Growth
(%)
Savings as %age of GDP
Investment as %age of
GDP
Savings (Billion US $)
Investment (Billion US
$) 1 Austria 2.0 23 24 49 51 2 Bangladesh 4.8 15 21 6 9 3 Belgium 1.6 22 18 54 44 4 Canada 2.2 21 18 126 108 5 China 11.1 43 39 413 375 6 Denmark 2.8 21 17 37 30 7 France 1.5 20 17 287 244 8 Germany 1.6 22 21 471 450 9 Hong Kong 4.4 30 30 50 50 10 India 6.1 18 23 69 88 11 Indonesia 5.8 31 31 30 30 12 Italy 1.2 22 17 258 199 13 Japan 1.3 30 29 1135 1097 14 Korea 6.2 34 35 101 104 15 Mexico 2.5 24 26 94 102 16 Netherlands 2.6 26 20 99 76 17 Pakistan 4.1 13 17 8 11 18 Poland 4.5 20 24 30 36 19 Spain 1.9 21 21 116 116 20 Switzerland 0.4 24 20 63 53 21 Thailand 7.4 36 35 55 54 22 Turkey 4.1 19 25 36 48 23 UK 2.2 15 16 204 217 24 USA 2.9 16 18 1314 1478
Above ((24) 7.5 22 22 5105 5069 World 2.4 21 20 6059 5771

TABLE: 3 HISTORICAL DATA
(Qualitative Dummy Variables)
No. Country Availability
of MMF Production Capacity
Government Stability
Preferential Status
Trade Restrictions
1 Austria 0 0 1 1 0 2 Bangladesh 0 0 0 1 0 3 Belgium 0 0 1 1 0 4 Canada 1 0 1 1 1 5 China 1 1 1 0 0 6 Denmark 0 0 1 1 1 7 France 1 0 1 1 1 8 Germany 1 0 1 1 1 9 Hong Kong 0 0 1 0 0 10 India 1 1 0 0 0 11 Indonesia 1 1 0 0 0 12 Italy 1 0 1 1 1 13 Japan 1 1 1 0 0 14 Korea 1 1 0 0 0 15 Mexico 1 0 0 1 0 16 Netherlands 0 0 1 1 1 17 Pakistan 1 1 0 0 0 18 Poland 1 0 0 0 0 19 Spain 1 0 1 1 1 20 Switzerland 1 0 1 1 1 21 Thailand 1 1 0 0 0 22 Turkey 1 0 0 0 1 23 UK 1 0 1 0 0 24 USA 1 0 1 1 1

TABLE: 4
Descriptive Statistics
Correlations with:
Variable
Export of Textile and
Clothing
Import of Textile and
Clothing Mean Standard Deviation
Export of T & C 1.0000 0.3857 11.16 10.57 Import of T & C 0.3857 1.0000 11.51 15.71 GDP (-1) 0.1964 0.9118 976.04 1759.15 Excess Liquidity (-1) 0.0712 -0.6180 1.53 40.36 Availability of Cotton 0.3075 0.1903 -- -- Availability of MMF 0.0644 0.1070 -- -- Production Capacity 0.1424 -0.2543 -- -- Stable Government 0.2406 0.4630 -- -- Preferential Trade -0.2263 0.1981 -- -- Trade Restrictions -0.0965 0.2745 -- --
TABLE: 5 REGRESSION RESULTS
(SIMULTANEOUS EQUATIONS)
Dependent Variable: Import of Textile and Clothing
Independent Variable Coefficient
T-Statistics
Adjusted R-square
F-Statistics
Intercept 0.368 0.206 0.8640 74.04 GDP (-1) 0.008 11.087 Exports of T & C 0.320 2.741
Dependent Variable: Export of Textile and Clothing
Intercept 6.224 0.938 0.4191 6.53 Availability of Cotton 0.751 2.750 Excess Liquidity (-1) 0.004 3.384 Imports of T & C 0.335 3.717
Estimation Techniques: To test the hypotheses, we developed an econometric model. By this method an analyst can quantify the impacts of various policy measures and event and can view/ forecast the future. This technique gives more importance to the expected

happenings in the future rather than emphasizing on past trends. It is important that we are not in a position to test the model in constant elasticity (Logarithmic) form, due to negative values of liquidity for various countries. Pakistan, India, United States and many other countries have negative excess liquidity (or shortage of liquidity). The simultaneity in the model has been shown in figure: I. The model consists of two behavioral equations. The list of variables has been presented in figure: II. The historical data and ratios have been presented in table: 1 to table: 3. We have 24 observations for each variable. The numbers of observations are adequate for our analysis, because we estimated only five parameters. We simulated the data to predict the post quota period. Ex-anti simulations have been made for the year of 2005 and 2007. We have not fond any significant relations of ‘Trade Restrictions Policies (DUMTR)’, ‘Political Stability (DUMGS)’, ‘Trade Favoritism (DUMPS), ‘Production Capacity (DUMCP), and ‘Self-sufficiency in the production of Man Made Fiber (DUMMF)’ with the Import (IMP) and Export (EXP) of Textile and Clothing. In projections, and simulations we assumed that the share of top 24 companies in world trade on textile and clothing would remain constant. (72 percent of world’s total export and 70 percent of total import). It means there are no chances that countries other than the above mentioned countries would be entered in the textile and clothing trade with significant shares. However, ranking and shares of above 24 countries will remain change depending on the strength of their GDP, liquidity position and most important the interaction (openness) with other importing and exporting countries. The model is valid only for normal changes. It will not cover abnormalities like effects of political tensions, war and direct restrictions on trade activities. IV. THE RESULTS AND THEIR IMPLICATIONS The estimated parameters with their t-statistics have been shown in figure: V. Results show that parameters are significant and have correct signs. The magnitude of adjusted R-square confirms the validity of model. We concluded that Gross Domestic Product (GDP-1) and Excess Liquidity (LIQ-1) are two important determinants of the Exports of textile and clothing (EXP). With some qualifications, the results indicate that overall economic growth affect the value of export earnings. The results provide a logical explanation for cross-country variations in the exports of textile and clothing. To some extent, results contradict the common intuitive that trade restriction policies and preferential treatments have significant role in determination of the patterns of world trade. By and large, international trade does
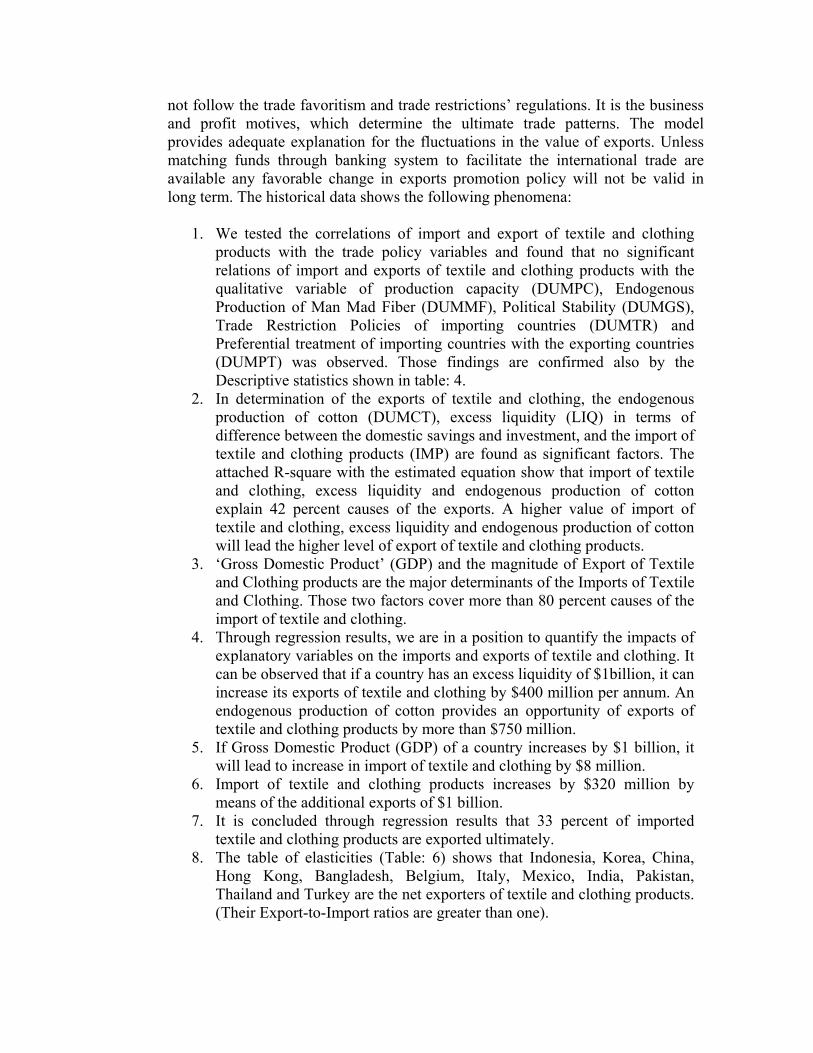
not follow the trade favoritism and trade restrictions’ regulations. It is the business and profit motives, which determine the ultimate trade patterns. The model provides adequate explanation for the fluctuations in the value of exports. Unless matching funds through banking system to facilitate the international trade are available any favorable change in exports promotion policy will not be valid in long term. The historical data shows the following phenomena:
1. We tested the correlations of import and export of textile and clothing products with the trade policy variables and found that no significant relations of import and exports of textile and clothing products with the qualitative variable of production capacity (DUMPC), Endogenous Production of Man Mad Fiber (DUMMF), Political Stability (DUMGS), Trade Restriction Policies of importing countries (DUMTR) and Preferential treatment of importing countries with the exporting countries (DUMPT) was observed. Those findings are confirmed also by the Descriptive statistics shown in table: 4.
2. In determination of the exports of textile and clothing, the endogenous production of cotton (DUMCT), excess liquidity (LIQ) in terms of difference between the domestic savings and investment, and the import of textile and clothing products (IMP) are found as significant factors. The attached R-square with the estimated equation show that import of textile and clothing, excess liquidity and endogenous production of cotton explain 42 percent causes of the exports. A higher value of import of textile and clothing, excess liquidity and endogenous production of cotton will lead the higher level of export of textile and clothing products.
3. ‘Gross Domestic Product’ (GDP) and the magnitude of Export of Textile and Clothing products are the major determinants of the Imports of Textile and Clothing. Those two factors cover more than 80 percent causes of the import of textile and clothing.
4. Through regression results, we are in a position to quantify the impacts of explanatory variables on the imports and exports of textile and clothing. It can be observed that if a country has an excess liquidity of $1billion, it can increase its exports of textile and clothing by $400 million per annum. An endogenous production of cotton provides an opportunity of exports of textile and clothing products by more than $750 million.
5. If Gross Domestic Product (GDP) of a country increases by $1 billion, it will lead to increase in import of textile and clothing by $8 million.
6. Import of textile and clothing products increases by $320 million by means of the additional exports of $1 billion.
7. It is concluded through regression results that 33 percent of imported textile and clothing products are exported ultimately.
8. The table of elasticities (Table: 6) shows that Indonesia, Korea, China, Hong Kong, Bangladesh, Belgium, Italy, Mexico, India, Pakistan, Thailand and Turkey are the net exporters of textile and clothing products. (Their Export-to-Import ratios are greater than one).

9. While, the United States, Japan and Switzerland have export elasticity with respect to import greater than one. So, they will be ultimate beneficiaries of the free trade. Because, the economic structures of those countries provide them the opportunity to re-export the imported products at higher value (with or without value addition). On the other hand, China, Thailand, Turkey, Indonesia and Korea have import elasticity with respect to exports greater than one. It indicates that trade openness will never provide much benefits to those economies.
The Simulation Analysis: The regression results have been applied for future simulations. We simulated the model with the assumptions that economic growth rates (growth in GDP) and the shares of investment and saving in GDP will remain constant for the countries included in this study. We simulated the model for 2005 and 2007 and observed some surprising outcomes:
1. The astonishing results are shown in table: 7. The ex-anti simulations show that China will be shifted at third position in the world from number one, with declining its share in world trade from 11 percent to 4 percent. While, Canada will reach at the 9th rank from the bottom after achieving its share in textile and clothing exports at 2.5 percent.
2. The world in 2007 will be more competitive as compared to the textile world in 1998. The distribution of shares in global exports will be more uniform and oligopolistic competition in the exports of textile and clothing will be weakening in 2007.
3. The simulation shows a surprising picture of the exports from Hong Kong. Its rank will be reached at bottom (20th) in the world from top of the ladder (2nd). Its share in the world exports will also be declined from 9 percent to 2 percent. The same situation will be faced by Italy, where share in world trade will be declined from 7 percent to 3 percent with a significant change in its rank, which will be shifted at 7th from 3rd position.
4. Japan, UK and USA are the net gainers with significant improvement in their market shares and ranking. The United States will achieve number one position in the world’s markets of textile and clothing in 2007. Its share in world trade will also be doubled (10 percent from 5 percent).
5. The United States will also remain the number one importer of Textile and Clothing products. While the rank and share of Hong Kong in the import of textile and clothing products will be declined significantly.
6. China’s lower magnitude of the exports elasticity with respect to imports is the major cause of expected deterioration in its future exports. The regression results show that the magnitude of imports has the strongest effect on exports. But, China’s limitation on import fronts reduces its export potential. China can maintain its position in the world markets, if it liberalizes its imports and re-export the clothing products after vertical integration. However, the magnitude of its export elasticity with respect to import indicates that it will have to face difficult situation. The elasticity parameter (0.09) indicates that its exports have been reached at a saturation point.

Exports of Textile and Clothing
0
50
100
150
200
250
300
China HongKong
Italy Germany USA Others
Country
Bill
ion
US
Dol
lars
1998 2005 2007
Imports of Textile and Clothing
0
50
100
150
200
250
300
350
USA Germany Hong Kong Japan UK Others
Country
Bill
ion
US
Dol
lars
1998 2005 2007

TABLE: 6
Exports and Imports Elasticity
Ratios Exports’
Elasticity for: Ratios Imports’
Elasticity for:
No. Country Liquidity to Export
Import to Export Liquidity Imports
GDP to Import
Export to Import GDP Exports
1 Austria -0.76 1.57 -0.003 0.525 48.29 0.64 0.386 0.204 2 Bangladesh -0.68 0.40 -0.003 0.133 28.67 2.53 0.229 0.809 3 Belgium 0.95 0.82 0.004 0.275 28.86 1.22 0.231 0.390 4 Canada --- --- --- --- 82.28 0.00 0.658 0.000 5 China 0.89 0.26 0.004 0.086 86.73 3.89 0.694 1.245 6 Denmark 3.66 1.29 0.015 0.434 70.73 0.77 0.566 0.247 7 France 3.38 1.45 0.014 0.487 77.46 0.69 0.620 0.220 8 Germany 1.11 1.59 0.004 0.531 69.86 0.63 0.559 0.202 9 Hong Kong 0.00 0.79 0.000 0.264 6.11 1.27 0.049 0.406 10 India -2.05 0.00 -0.008 0.000 --- --- --- --- 11 Indonesia 0.00 0.12 0.000 0.039 120.00 8.58 0.960 2.744 12 Italy 2.34 0.47 0.009 0.156 100.34 2.14 0.803 0.686 13 Japan 5.74 3.18 0.023 1.065 180.57 0.31 1.445 0.101 14 Korea -0.18 0.23 -0.001 0.077 78.42 4.34 0.627 1.389 15 Mexico -0.76 0.82 -0.003 0.276 46.34 1.22 0.371 0.389 16 Netherlands 3.55 1.20 0.014 0.401 49.35 0.83 0.395 0.267 17 Pakistan -0.39 0.00 -0.002 0.000 --- --- --- --- 18 Poland -2.06 1.07 -0.008 0.358 48.06 0.94 0.385 0.299 19 Spain 0.00 1.39 0.000 0.466 80.94 0.72 0.648 0.230 20 Switzerland 6.60 3.07 0.026 1.028 53.77 0.33 0.430 0.104 21 Thailand 0.29 0.25 0.001 0.083 118.46 4.04 0.948 1.292 22 Turkey -1.14 0.19 -0.005 0.063 100.00 5.28 0.800 1.690 23 UK -1.51 2.22 -0.006 0.745 68.05 0.45 0.544 0.144 24 USA -9.24 4.11 -0.037 1.377 112.33 0.24 0.899 0.078

TABLE: 7 PATTERN CHANGING IN WORLD EXPORTS
OF TEXTILE AND CLOTHING
Exports (Million US $)
Share (%) in World Trade
Rank Country
1998 2005 2007 1998 2005 2007 1998 2005 2007 Austria 3 8 8 0.8 2.2 2.1 21 19 19 Bangladesh 4 7 7 1.0 2.0 2.0 19 24 24 Belgium 10 8 8 2.8 2.2 2.2 8 16 16 Canada 0 9 9 0.0 2.6 2.5 24 9 9 China 43 14 16 11.6 4.0 4.3 1 4 3 Denmark 2 8 8 0.5 2.2 2.1 22 21 21 France 13 12 12 3.4 3.3 3.3 7 5 5 Germany 19 14 15 5.2 4.0 4.0 4 3 4 Hong Kong 35 8 8 9.3 2.2 2.1 2 20 20 India 9 10 10 2.5 2.6 2.6 11 8 8 Indonesia 7 8 8 1.8 2.1 2.1 13 23 23 Italy 25 11 11 6.7 3.1 3.1 3 7 7 Japan 7 20 20 1.8 5.5 5.4 14 2 2 Korea 16 8 9 4.4 2.3 2.3 6 14 13 Mexico 10 8 9 2.8 2.3 2.3 9 13 14 Netherlands 6 9 9 1.7 2.4 2.4 16 12 11 Pakistan 7 8 8 1.8 2.3 2.2 15 15 15 Poland 3 8 8 0.8 2.1 2.1 20 22 22 Spain 5 9 9 1.3 2.5 2.5 18 10 10 Switzerland 2 8 8 0.4 2.2 2.2 23 17 18 Thailand 5 8 8 1.4 2.2 2.2 17 18 17 Turkey 10 9 9 2.7 2.4 2.4 10 11 12 UK 9 12 12 2.4 3.3 3.2 12 6 6 USA 18 37 39 4.8 10.2 10.5 5 1 1 Total Above (24) 268 261 266 72.0 72.0 72.0 -- -- -- Total World 372 362 369 100 100 100 -- -- --
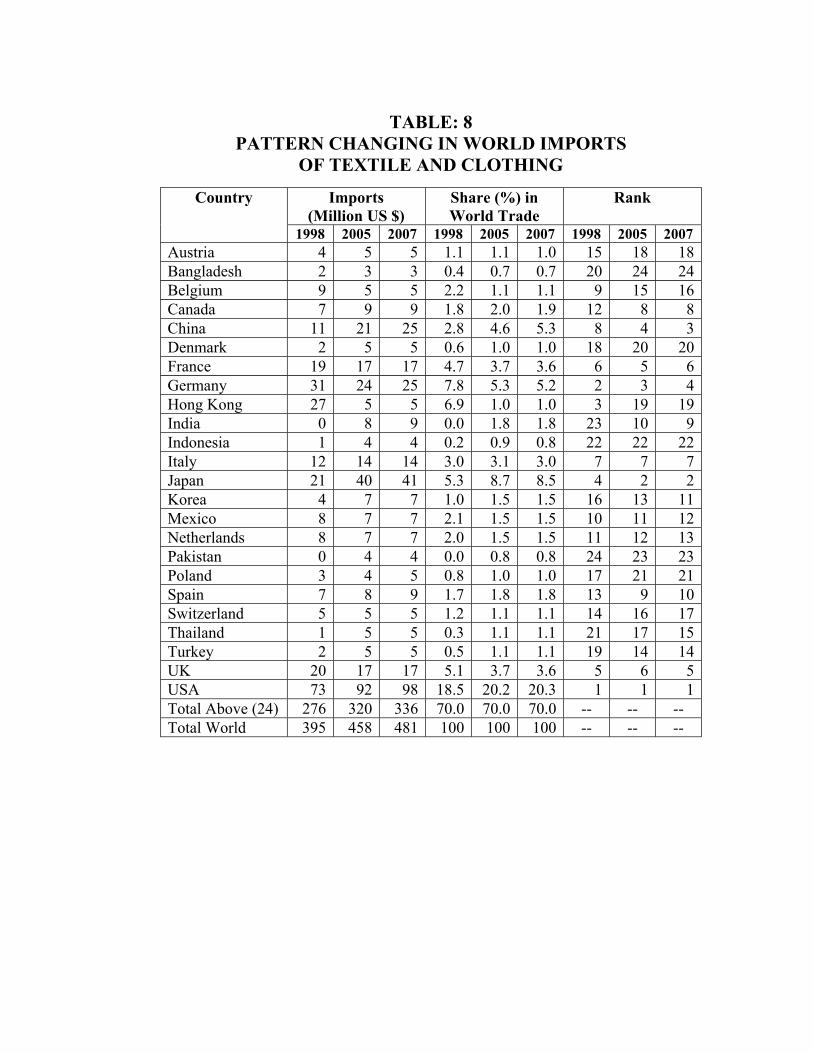
TABLE: 8
PATTERN CHANGING IN WORLD IMPORTS OF TEXTILE AND CLOTHING
Imports (Million US $)
Share (%) in World Trade
Rank Country
1998 2005 2007 1998 2005 2007 1998 2005 2007 Austria 4 5 5 1.1 1.1 1.0 15 18 18 Bangladesh 2 3 3 0.4 0.7 0.7 20 24 24 Belgium 9 5 5 2.2 1.1 1.1 9 15 16 Canada 7 9 9 1.8 2.0 1.9 12 8 8 China 11 21 25 2.8 4.6 5.3 8 4 3 Denmark 2 5 5 0.6 1.0 1.0 18 20 20 France 19 17 17 4.7 3.7 3.6 6 5 6 Germany 31 24 25 7.8 5.3 5.2 2 3 4 Hong Kong 27 5 5 6.9 1.0 1.0 3 19 19 India 0 8 9 0.0 1.8 1.8 23 10 9 Indonesia 1 4 4 0.2 0.9 0.8 22 22 22 Italy 12 14 14 3.0 3.1 3.0 7 7 7 Japan 21 40 41 5.3 8.7 8.5 4 2 2 Korea 4 7 7 1.0 1.5 1.5 16 13 11 Mexico 8 7 7 2.1 1.5 1.5 10 11 12 Netherlands 8 7 7 2.0 1.5 1.5 11 12 13 Pakistan 0 4 4 0.0 0.8 0.8 24 23 23 Poland 3 4 5 0.8 1.0 1.0 17 21 21 Spain 7 8 9 1.7 1.8 1.8 13 9 10 Switzerland 5 5 5 1.2 1.1 1.1 14 16 17 Thailand 1 5 5 0.3 1.1 1.1 21 17 15 Turkey 2 5 5 0.5 1.1 1.1 19 14 14 UK 20 17 17 5.1 3.7 3.6 5 6 5 USA 73 92 98 18.5 20.2 20.3 1 1 1 Total Above (24) 276 320 336 70.0 70.0 70.0 -- -- -- Total World 395 458 481 100 100 100 -- -- --

Changing in Ranks(Exports)
13
2
20
3
7
45
1
4
1998 2007China Hong Kong Italy Germany USA
Changing in Ranks (Imports)
1 12
43
19
2
5 54
1998 2007USA Germany Hong Kong Japan UK

Conclusion and Implications The simulation analysis concluded that China, Hong Kong and Italy will be net looser in this game and the United States, Canada, United Kingdom and Spain will be net gainers. It is noteworthy that the shifting in patterns of textile trade was based on the assumptions that GDP growth rates, saving to GDP ratio and Investment to GDP ratio will remain constant. The estimated parameters in regression analysis show that export enhancement depend largely on the imported raw material and intermediate products. Endogenous production of raw material will remain to play its favorable role, but it is a weaker factor. It is expected that concentration in the textile and clothing trade will be reduced and trade will be based on two-way transaction. A textile exporter country will have to import the textile products to complete a vertical chain of textile products. Because of regional diversity and interdependency, textile products will not be used as a geo-political and economic weapon like petroleum. An association between the textile and clothing exporting countries will not be comparable with the oil producing countries (OPEC). Lee and Newton (2003) have shown that the sustainable competitiveness of China’s textile and clothing industry will decrease without entry to WTO and will increase with entry to WTO. The impact of WTO on China textile and clothing industry depends on reduction of tariffs and elimination of quotas, as well as non-tariff barriers imposed on China. Our study shows that size of the economy, availability of financial resources, import and domestic production of basic and intermediate products are the determinant of exports of textile and clothing. We have not found any significant relation between the preferential treatment of importing countries and the trade volume of exporting countries. Similarly, there was no evidence of the significant relation between the restrictions imposed by the importing countries in terms of quota and tariff and the trade volume of exporting countries. It is against the common intuitive. The most important finding is the dependency of textile and cloth producing countries on each other. The volume of import is not independent from the volume of export. Usually, exporting countries in textile and clothing sector, import the intermediate products then convert those intermediate products into finished goods and re-export them. Similarly, the export targets also determine volume of imports. So, countries in textile and clothing trade do not have monopolistic type completion, they must coordinate and integrate with the other countries. One country’s exports are based on the imported goods from other country. Another interesting characteristic of the textile and cloth exporting countries is that they have not concentrated on regional basis. The top 24 countries are included the European, American and Asian continents. There is no single region of those countries. The Chinese Scenario: The diversification and shifting of resources to other sectors is a natural outcome of achieving a saturation point. Policy makers in planned economies always
consider the ‘comparative advantages’. If Chinese decision-makers feel that rapid increase in the demand for textile machinery can provide further opportunities, they must avail those opportunities. And if utilization of resources in machinery sector has significant greater profits as compared to the spinning and garments, they should focus on machinery manufacturing. It is quite natural. However, it does not mean that China’s spinning and garment sectors are in weak position. Shifting towards the machinery manufacturing does not necessarily mean that the weakness of an industry is a cause of shifting to the other industry. This hypothesis was based on the following observations:
• Several Chinese delegations have visited Pakistan over the last two in order to explore the possibility of under taking joint ventures. In a high level meeting with Pakistani authorities, a 10-members Chinese delegation has selected made-up garments, weaving and spinning as sectors where investment and joint ventures are possible. The leader of the delegation, Cao Xinyu, vice-chairman of the China Chamber of Commerce for Import and Export described that they are focusing on machinery manufacturing. He also mentioned that Chinese companies are willing to form strategic linkages with their Pakistani counter parts in spinning, weaving and garment sectors.
• The Chinese side has expressed its desire to further increase the import of grey cloth and polyester from Pakistan. China has relaxed its tariff, which could help Pakistan to increase its exports to China.
• A concern is growing among the Chinese policy makers that their young generation is not ready to work on sewing machines of garments. Possibility is very much there that China will be importing garments from Pakistan by 2007 as China is rapidly losing essential technical manpower for its garment industry.
• Over the past two years, China has become, for the first time a capital-exporting nation with $7 billion invested abroad. Chinese companies have surplus liquidity and are looking for investment destinations.
• Pakistan textile manufacturers have imported machinery worth 650 million dollars from China during the last two years. Now the Chinese government has offered a credit line of $25 million for import of Chinese textile machinery to Pakistan. Pakistani industrialists have decided to buy more machinery taking benefit of the Chinese technology in modernizing the textile industry.
If China decides to shift its marginal resources from the spinning and garments sectors to the manufacturing of textile machinery, it will create an interesting scenario, In this case, China will not be a competitor of its neighboring countries, in the field of textile and clothing products, it will compete with the Western Europe and the United States in the field of textile machinery.

V: REFERENCES
• All Pakistan Textile Mills Association (2000), APTMA’s Annual Report, Karachi
• All Pakistan Textile Mills Association (2002), APTMA’s Annual Report, Karachi
• Hamel (1990); Theory of Core Competence, Textile Asia, January 2003, Hong Kong
• International Textile Manufacturers Federation (ITMF), State of the Economies,
• Li Yi, Yoo Lei and Edward Newton, Competitiveness of China’s TC Industry, Textile Asia, February, 2003 Hong Kong
• Savita Gaur, (2003) Moving on Up, International Textile Monitor, January-February, 2003 Mumbai 2003
• Textile Asia, December 2002, Hong Kong • Textile Asia, March 2003, Hong Kong • Textile Commissioner Organization (TCO) Annual Report, 2000,
Karachi • World Bank, World Development Report, 1999 • World Bank, World Development Report, 2002 • World Trade Organization (WTO), Report and legal drafts 2000 • World Trade Organization (WTO), Report on ATC (2002)

APPENDIX: I
DERIVATION OF MODEL
EXP = α1 + β1CTN + β2LIQ + β3IMP (1)
IMP = α2 + β4GDP + β5EXP (2)
EXP = α1 + β1CTN + β2LIQ + β3(α2 + β4GDP + β5 EXP) EXP = α1 + β1CTN + β2LIQ + α2β3 + β3β4GDP + β3β5 EXP EXP - β3β5EXP = α1 + β1CTN + β2LIQ + α2β3 + β3β4GDP EXP (1 - β3β5) = α1 + β1 CTN + β2LIQ + α2β3 + β3β4GDP
EXP = 1 / (1 - β3β5) [α1 + α2β3 + β1 CTN + β2LIQ + β3β4GDP
EXP = 1 / {1 – (0.335)(0.320)}* [6.224 + (0.368)(0.335)
+ 0.751CTN + 0.004LIQ + (0.335)(0.008) GDP]
EXP = 1.120 [6.347 + 0.751CTN + 0.004LIQ + 0.003GDP]
EXP = 7.109 + 0.841CTN + 0.005LIQ + 0.003GDP (3)
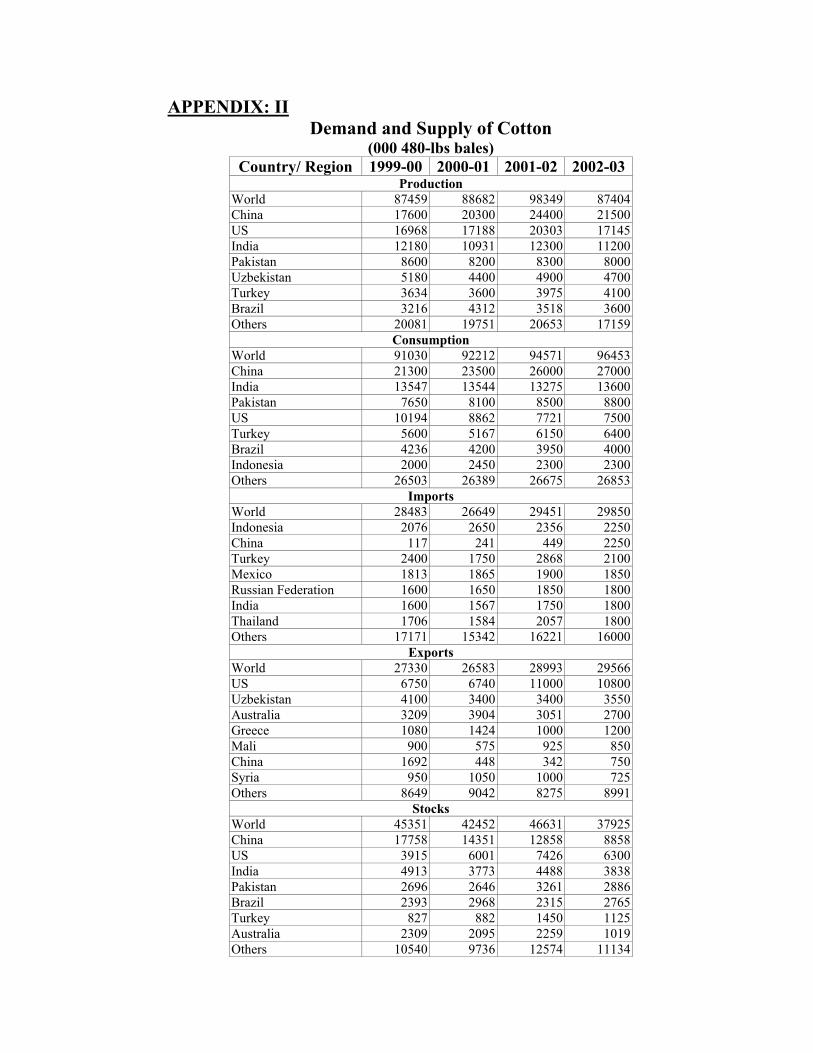
APPENDIX: II Demand and Supply of Cotton
(000 480-lbs bales) Country/ Region 1999-00 2000-01 2001-02 2002-03
Production World 87459 88682 98349 87404 China 17600 20300 24400 21500 US 16968 17188 20303 17145 India 12180 10931 12300 11200 Pakistan 8600 8200 8300 8000 Uzbekistan 5180 4400 4900 4700 Turkey 3634 3600 3975 4100 Brazil 3216 4312 3518 3600 Others 20081 19751 20653 17159
Consumption World 91030 92212 94571 96453 China 21300 23500 26000 27000 India 13547 13544 13275 13600 Pakistan 7650 8100 8500 8800 US 10194 8862 7721 7500 Turkey 5600 5167 6150 6400 Brazil 4236 4200 3950 4000 Indonesia 2000 2450 2300 2300 Others 26503 26389 26675 26853
Imports World 28483 26649 29451 29850 Indonesia 2076 2650 2356 2250 China 117 241 449 2250 Turkey 2400 1750 2868 2100 Mexico 1813 1865 1900 1850 Russian Federation 1600 1650 1850 1800 India 1600 1567 1750 1800 Thailand 1706 1584 2057 1800 Others 17171 15342 16221 16000
Exports World 27330 26583 28993 29566 US 6750 6740 11000 10800 Uzbekistan 4100 3400 3400 3550 Australia 3209 3904 3051 2700 Greece 1080 1424 1000 1200 Mali 900 575 925 850 China 1692 448 342 750 Syria 950 1050 1000 725 Others 8649 9042 8275 8991
Stocks World 45351 42452 46631 37925 China 17758 14351 12858 8858 US 3915 6001 7426 6300 India 4913 3773 4488 3838 Pakistan 2696 2646 3261 2886 Brazil 2393 2968 2315 2765 Turkey 827 882 1450 1125 Australia 2309 2095 2259 1019 Others 10540 9736 12574 11134

`
Related Documents