i Discussion Paper Changing Structure of Rural Economy of India Implications for Employment and Growth Ramesh Chand, S. K Srivastava and Jaspal Singh @ National Institution for Transforming India NITI Aayog NOVEMBER, 2017 @ Ramesh Chand is member, S. K. Srivastava is Agricultural Economist and Jaspal Singh is Consultant, NITI Aayog. The views expressed in the paper are of the authors and do not necessarily reflect the views of NITI Aayog or Government of India.

Welcome message from author
This document is posted to help you gain knowledge. Please leave a comment to let me know what you think about it! Share it to your friends and learn new things together.
Transcript

i
Discussion Paper
Changing Structure of Rural Economy of India
Implications for Employment and Growth
Ramesh Chand, S. K Srivastava and Jaspal Singh @
National Institution for Transforming India NITI Aayog
NOVEMBER, 2017
@ Ramesh Chand is member, S. K. Srivastava is Agricultural Economist and
Jaspal Singh is Consultant, NITI Aayog.
The views expressed in the paper are of the authors and do not necessarily reflect the
views of NITI Aayog or Government of India.
ii
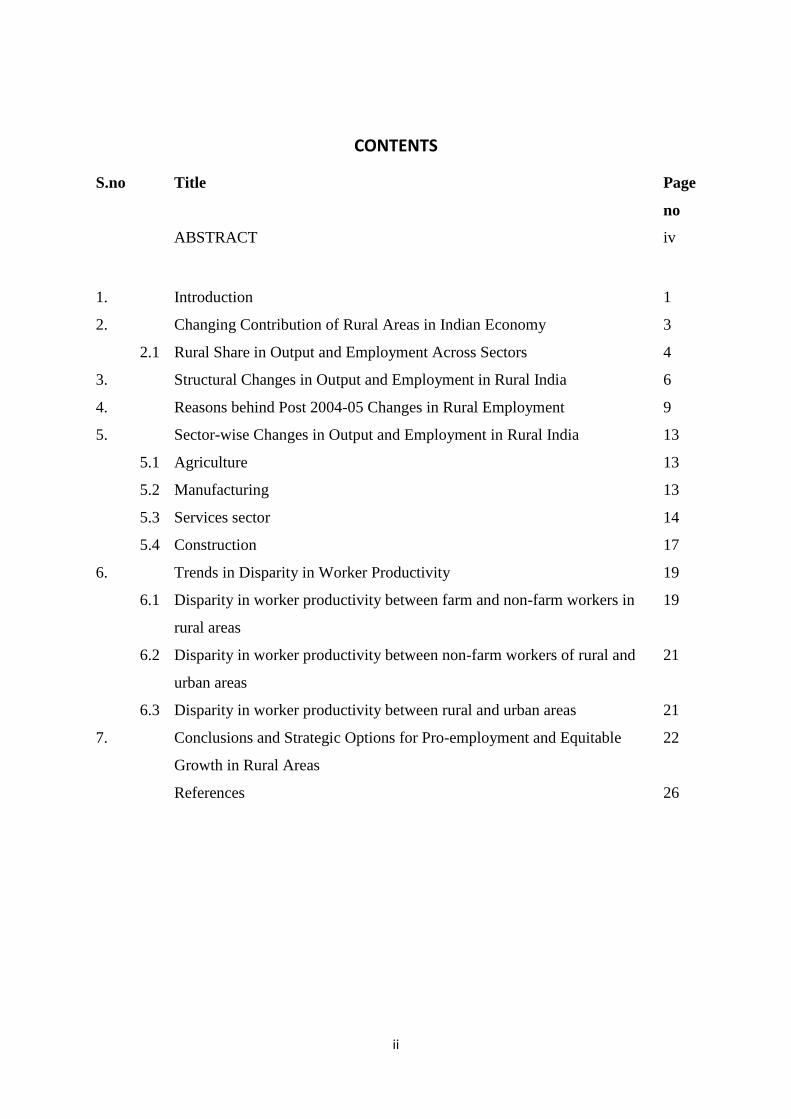
CONTENTS
S.no Title Page
no
ABSTRACT
iv
1. Introduction 1
2. Changing Contribution of Rural Areas in Indian Economy 3
2.1 Rural Share in Output and Employment Across Sectors 4
3. Structural Changes in Output and Employment in Rural India 6
4. Reasons behind Post 2004-05 Changes in Rural Employment 9
5. Sector-wise Changes in Output and Employment in Rural India 13
5.1 Agriculture 13
5.2 Manufacturing 13
5.3 Services sector 14
5.4 Construction 17
6. Trends in Disparity in Worker Productivity 19
6.1 Disparity in worker productivity between farm and non-farm workers in
rural areas
19
6.2 Disparity in worker productivity between non-farm workers of rural and
urban areas
21
6.3 Disparity in worker productivity between rural and urban areas 21
7. Conclusions and Strategic Options for Pro-employment and Equitable
Growth in Rural Areas
22
References 26
iii
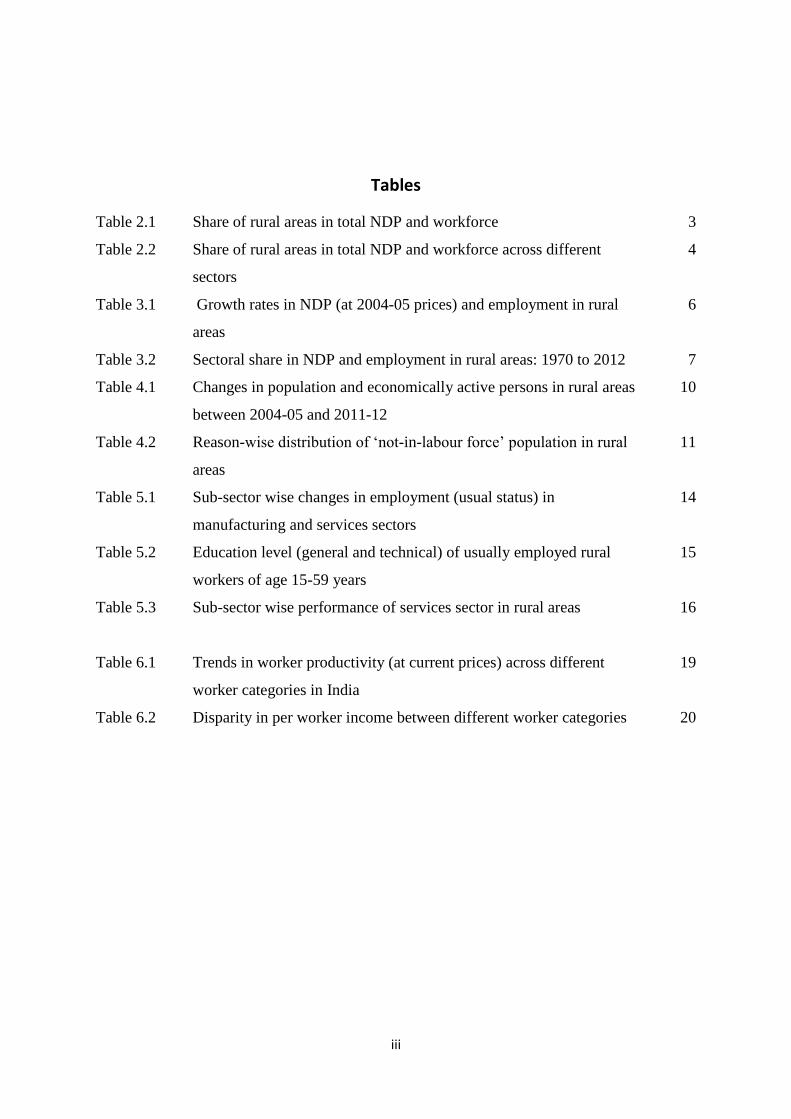
Tables
Table 2.1 Share of rural areas in total NDP and workforce 3
Table 2.2 Share of rural areas in total NDP and workforce across different
sectors
4
Table 3.1 Growth rates in NDP (at 2004-05 prices) and employment in rural
areas
6
Table 3.2 Sectoral share in NDP and employment in rural areas: 1970 to 2012 7
Table 4.1 Changes in population and economically active persons in rural areas
between 2004-05 and 2011-12
10
Table 4.2 Reason-wise distribution of „not-in-labour force‟ population in rural
areas
11
Table 5.1 Sub-sector wise changes in employment (usual status) in
manufacturing and services sectors
14
Table 5.2 Education level (general and technical) of usually employed rural
workers of age 15-59 years
15
Table 5.3 Sub-sector wise performance of services sector in rural areas
16
Table 6.1 Trends in worker productivity (at current prices) across different
worker categories in India
19
Table 6.2 Disparity in per worker income between different worker categories 20
iv
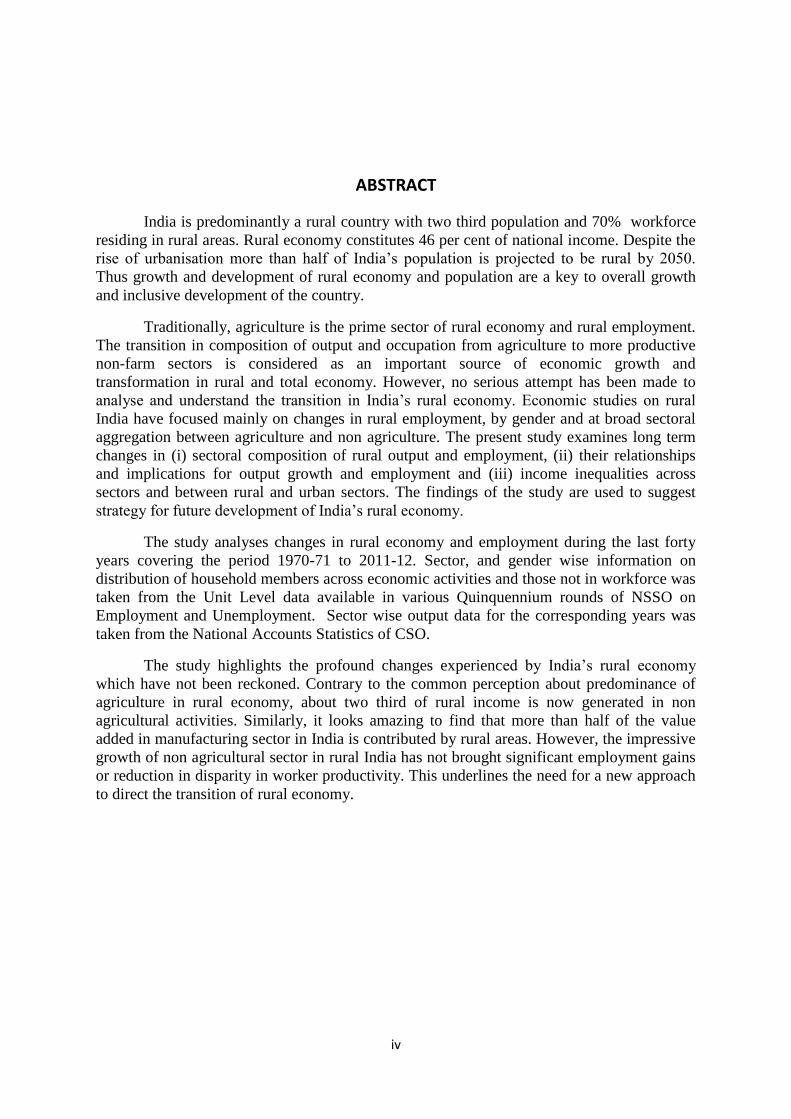
ABSTRACT
India is predominantly a rural country with two third population and 70% workforce
residing in rural areas. Rural economy constitutes 46 per cent of national income. Despite the
rise of urbanisation more than half of India‟s population is projected to be rural by 2050.
Thus growth and development of rural economy and population are a key to overall growth
and inclusive development of the country.
Traditionally, agriculture is the prime sector of rural economy and rural employment.
The transition in composition of output and occupation from agriculture to more productive
non-farm sectors is considered as an important source of economic growth and
transformation in rural and total economy. However, no serious attempt has been made to
analyse and understand the transition in India‟s rural economy. Economic studies on rural
India have focused mainly on changes in rural employment, by gender and at broad sectoral
aggregation between agriculture and non agriculture. The present study examines long term
changes in (i) sectoral composition of rural output and employment, (ii) their relationships
and implications for output growth and employment and (iii) income inequalities across
sectors and between rural and urban sectors. The findings of the study are used to suggest
strategy for future development of India‟s rural economy.
The study analyses changes in rural economy and employment during the last forty
years covering the period 1970-71 to 2011-12. Sector, and gender wise information on
distribution of household members across economic activities and those not in workforce was
taken from the Unit Level data available in various Quinquennium rounds of NSSO on
Employment and Unemployment. Sector wise output data for the corresponding years was
taken from the National Accounts Statistics of CSO.
The study highlights the profound changes experienced by India‟s rural economy
which have not been reckoned. Contrary to the common perception about predominance of
agriculture in rural economy, about two third of rural income is now generated in non
agricultural activities. Similarly, it looks amazing to find that more than half of the value
added in manufacturing sector in India is contributed by rural areas. However, the impressive
growth of non agricultural sector in rural India has not brought significant employment gains
or reduction in disparity in worker productivity. This underlines the need for a new approach
to direct the transition of rural economy.
1
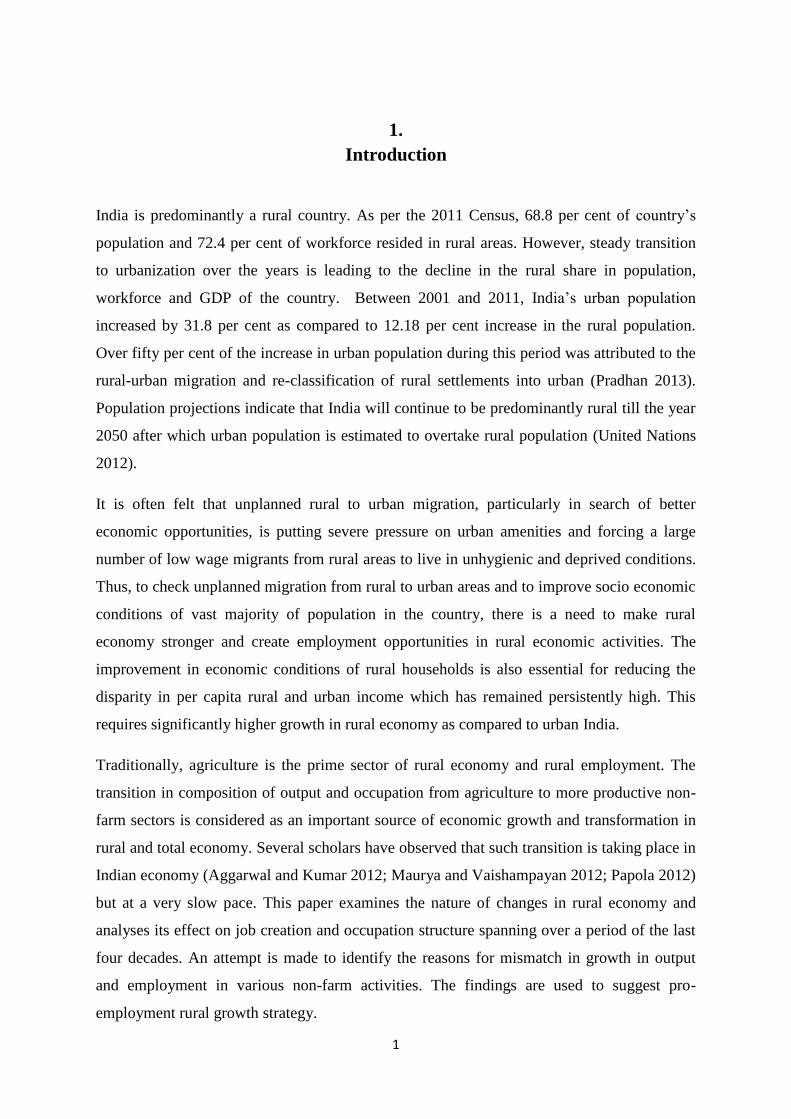
1.
Introduction
India is predominantly a rural country. As per the 2011 Census, 68.8 per cent of country‟s
population and 72.4 per cent of workforce resided in rural areas. However, steady transition
to urbanization over the years is leading to the decline in the rural share in population,
workforce and GDP of the country. Between 2001 and 2011, India‟s urban population
increased by 31.8 per cent as compared to 12.18 per cent increase in the rural population.
Over fifty per cent of the increase in urban population during this period was attributed to the
rural-urban migration and re-classification of rural settlements into urban (Pradhan 2013).
Population projections indicate that India will continue to be predominantly rural till the year
2050 after which urban population is estimated to overtake rural population (United Nations
2012).
It is often felt that unplanned rural to urban migration, particularly in search of better
economic opportunities, is putting severe pressure on urban amenities and forcing a large
number of low wage migrants from rural areas to live in unhygienic and deprived conditions.
Thus, to check unplanned migration from rural to urban areas and to improve socio economic
conditions of vast majority of population in the country, there is a need to make rural
economy stronger and create employment opportunities in rural economic activities. The
improvement in economic conditions of rural households is also essential for reducing the
disparity in per capita rural and urban income which has remained persistently high. This
requires significantly higher growth in rural economy as compared to urban India.
Traditionally, agriculture is the prime sector of rural economy and rural employment. The
transition in composition of output and occupation from agriculture to more productive non-
farm sectors is considered as an important source of economic growth and transformation in
rural and total economy. Several scholars have observed that such transition is taking place in
Indian economy (Aggarwal and Kumar 2012; Maurya and Vaishampayan 2012; Papola 2012)
but at a very slow pace. This paper examines the nature of changes in rural economy and
analyses its effect on job creation and occupation structure spanning over a period of the last
four decades. An attempt is made to identify the reasons for mismatch in growth in output
and employment in various non-farm activities. The findings are used to suggest pro-
employment rural growth strategy.
2
The paper is organised into seven sections. The second section discusses changing
contribution of rural areas in India‟s total output and employment since the year 1970-71. We
have also documented the changes in rural-urban distribution of output and employment in
various economic activities. The third section provides empirical evidences on the
performance and changing composition of rural output and employment during the past four
decades. After 2004-05, the rural areas have witnessed negative growth in employment in-
spite of high growth in output. The fourth section explores the reasons for growth in jobs not
keeping pace with the growth in output. The fifth section dissects the performance of
different sectors and explains the asymmetric changes between output and employment. The
sixth section examines the disparity in worker productivity between rural and urban areas,
between farm and non-farm sectors in rural areas, and between agricultural labours and
cultivators in agriculture sector. Conclusions and strategies for pro-employment growth are
presented in the last section.

3
2.
Contribution of Rural Areas in Indian Economy
The contribution of the rural areas in economy of India for the period 1970-71 to 2011-12 is
seen from its share in national output and employment1 (Table 2.1). The rural areas engaged
84.1 per cent of the total workforce and produced 62.4 per cent of the total net domestic
product (NDP) in 1970-71. Subsequently, rural share in the national income declined sharply
till 1999-00. Rural share in total employment also witnessed a decline but its pace did not
match with the changes in its share in national output or income. The declining contribution
of rural areas in national output without a commensurate reduction in its share in employment
implies that a major portion of the overall economic growth in the country came from the
capital-intensive sectors in urban areas without generating significant employment during the
period under consideration. Notwithstanding, the difference between the rural share in output
and employment increased from 22 percentage points in 1970-71 to 28 percentage points in
1999-00.
Table 2.1. Share of rural areas in total NDP and workforce
(per cent)
Year Economy Workforce
1970-71 62.4 84.1
1980-81 58.9 80.8
1993-94 54.3 77.8
1999-00 48.1 76.1
2004-05 48.1 74.6
2011-12 46.9 70.9
After 1999-00, growth rate of rural economy picked up the pace and reached at par with the
growth rate of urban economy. This led to stabilization in rural contribution in total NDP at
around 48 per cent. The rural share in national NDP dropped slightly during 2004-05 to 2011-
12 despite acceleration in growth rate. On the other hand, the rural share in total workforce
1 The data on rural and urban net domestic product (NDP) is available for the years 1970-71, 1980-81,
1993-94, 1999-00, 2004-05 and 2011-12 at current prices from Central Statistical Office. The
information on different aspects of employment in the country was extracted from the unit-level data
of quinquennial employment and unemployment surveys conducted by National Sample Survey
Office (NSS-EUS). The first quinquennial NSS-EUS was carried out during 1972-73 to assess the
volume and structure of employment and unemployment in the country. Thereafter these surveys were
repeated in the years 1983, 1993-94, 1999-00, 2004-05, 2009-10, and 2011-12.

4
declined steadily from 76.1 per cent in 1999-00 to 70.9 per cent in 2011-12. Due to faster
reduction in the rural share in total employment than in national NDP, difference between the
rural share in output and employment narrowed down to 24 per cent by the year 2011-12.
These evidences show that urban economy overtook rural economy in terms of output but
urban employment is less than half of the rural employment. This has serious implications
such as wide disparity in worker productivity between rural and urban areas.
2.1 Rural Share in Output and Employment Across Sectors
The sector-wise disaggregation shows significant changes in the contribution of rural areas in
the national economy. Besides producing almost all agricultural produce, rural areas
contributed around one third of non-farm output and 48.7 per cent of non-farm employment
in the country (Table 2.2). The contribution of rural areas in different sectors of non-farm
economy revealed large variation and interesting patterns.
Table 2.2. Share of rural areas in total NDP and workforce across different sectors
(per cent)
Year Agriculture Manufacturing Construction Services Non-agri.
NDP Emp. NDP Emp. NDP Emp. NDP Emp. NDP Emp. 1970-71 96.2 96.8 25.8 51.5 43.2 64.6 32.8 42.1 32.4 47.3
1980-81 94.9 95.9 31.8 48.1 45.6 58.8 34.0 41.7 35.0 44.9
1993-94 93.9 95.8 29.8 51.3 45.1 57.2 33.6 42.3 34.8 46.6
1999-00 93.2 96.6 41.6 51.5 43.3 57.6 27.1 40.7 31.8 45.8
2004-05 94.1 96.1 42.5 49.6 45.5 64.4 32.7 41.9 36.7 47.2
2011-12 95.1 95.9 51.3 47.4 48.7 74.6 25.9 39.6 35.3 48.7 Note: Emp.: Employment, Non-agri. Includes manufacturing, construction, services and other sectors
The most striking change in rural share was observed in the case of manufacturing sector.
Between 1970-71 and 2011-12, the share of rural areas in output of manufacturing sector
doubled and exceeded the manufacturing production in urban areas. Rural areas contributed
51.3 per cent of manufactured output in year 2011-12. However, this sharp increase in the
rural share in output did not fetch any increase in rural share in employment in manufacturing
sector. On the contrary, rural share in total manufacturing employment in the country
declined by 4.1 percentage points during the forty years ending with 2011-12. Clearly,
manufacturing sector was shifting to rural areas but without commensurate increase in the
employment.
In the same period, the share of rural areas in construction sector output increased by 5.5
percentage points, while employment share increased by 10.0 percentage points. In case of

5
services sector, rural areas lost to urban areas in a big way after 2004-05 and accounted for
25.9 per cent of services output in the country in the year 2011-12. These changes indicate
that rural employment has risen at a much faster rate in relatively low paid construction
activities. The underlying reasons and implications of these changes are discussed in the later
sections of the paper.
6
3.
Structural Changes in Output and Employment in Rural India
During the four decades from 1970-71 to 2011-12, India‟s rural economy expanded from Rs.
229 billion to Rs. 34167 billion at current prices and from Rs. 3199 billon to Rs. 21107
billion at 2004-05 prices. In the same period, employment expanded from 191 million to 336
million. Thus, despite almost seven times increase in output in rural India the employment
could not even double in a long period of four decades.
The growth rates in output and employment show large variations across sectors and over
different period, which is very useful in understanding the transition in rural economy in the
country. The sector-wise growth rate in NDP and employment during three sub periods viz.
1970-71 to 1993-94 (termed as pre-reform period), 1993-94 to 2004-05 (termed as post-
reform period) and 2004-05 to 2011-12 (termed as period of economic acceleration) are
presented in Table 3.1 and sectoral composition is presented in Table 3.2.
Table 3.1. Growth rates in rural NDP (at 2004-05 prices) and rural employment
(per cent)
Period Agriculture Manufacturing Construction Services Non-
agriculture
Total
Net Domestic Product (at constant prices)
1971-94 2.57 5.18 3.94 6.10 5.70 3.72
1994-05 1.87 8.38 7.92 8.55 7.93 5.06
2005-12 4.27 15.87 11.49 3.48 9.21 7.45
Employment (usual status)
1973-94 1.72 3.55 4.82 4.51 4.22 2.16
1994-05 0.74 2.79 8.32 3.25 3.70 1.45
2005-12 -2.04 0.67 12.09 1.35 3.65 -0.28
The period 1970-71 to 1993-94 witnessed 2.57 per cent annual growth in the NDP of
agriculture sector as compared to 5.70 per cent annual growth in non-farm sectors (Table
3.1). As a consequence, the share of agriculture in the rural NDP declined from 72.4 per cent
to 57 per cent by the year 1993-94 (Table 3.2). Among the non-farm sectors, manufacturing,
construction and services sectors experienced 5.18, 3.94 and 6.10 per cent annual growth, and
their share in rural NDP increased by 2, 2 and 10 percentage points during the pre-reforms
period, respectively.
7
During the post-reform period (1993-94 and 2004-05), growth in agricultural sector
decelerated to 1.87 per cent, whereas growth rate in non-farm economy accelerated to 7.93
per cent. The effect of slowdown in agriculture on rural economy was offset by significantly
higher growth in non-farm sectors, which accelerated growth rate in rural economy to above
5 per cent as compared to 3.72 during the pre-reforms period. These changes further reduced
the share of agriculture in rural economy from 57 per cent in 1993-94 to 39 per cent in 2004-
05. Thus, rural economy became more non-agricultural than agricultural by the year 2004-05.
Among the non-farm sectors, services, manufacturing and construction sectors constituted
37.3, 11.5 and 7.8 per cent share in rural output in 2004-05, respectively (Table 3.2).
Table 3.2. Sectoral share in NDP and employment in rural areas: 1970 to 2012
(per cent)
Year Agriculture Manufacturing Construction Services
Share in rural NDP (at current prices)
1970-71 72.4 5.9 3.5 17.1
1980-81 64.4 9.2 4.1 20.6
1993-94 57.0 8.2 4.6 26.8
1999-00 51.4 11.1 5.6 28.6
2004-05 38.9 11.5 7.8 37.3
2011-12 39.2 18.4 10.5 27.0
Share in rural employment
1972-73 85.5 5.3 1.4 7.3
1983 83.6 6.2 1.3 8.8
1993-94 78.4 7.0 2.4 11.4
1999-00 76.3 7.4 3.3 12.5
2004-05 72.6 8.1 4.9 13.9
2011-12 64.1 8.6 10.7 15.5
Note: Shares do not sum up to 100 due to exclusion of some minor sectors.
During the period 2004-05 to 2011-12, agriculture sector witnessed revival and registered
impressive annual growth rate of 4.27 per cent. Similarly, non-farm sectors growth
accelerated to 9.21 per cent. Based on acceleration in growth in agriculture as well as non-
farm sectors, this period is termed as the “period of economic acceleration”. Annual growth
in the overall rural economy during this period was 7.45 per cent. It is worth pointing that the
period 2004-05 to 2011-12 witnessed much higher increase in agricultural prices compared to
non-agricultural prices and growth rate in agriculture and non-farm sectors at current prices
was almost the same. Therefore, the share of agriculture in rural NDP at current prices did not
decline further and stood at marginally higher level of 39.2 per cent in 2011-12 over the year
2004-05.
8
Within non-farm sectors the growth in services sector output decelerated to 3.48 per cent
after 2004-05 as compared to 8.55 per cent growth during the preceding decade. On the other
hand, manufacturing and construction sectors witnessed impressive growth of 15.87 and
11.49 per cent, respectively between 2004-05 and 2011-12. Consequently, in these seven
years the share of services sector declined from 37.3 to 27.0 per cent whereas the share of
manufacturing in rural economy increased from 11.4 to 18.4 per cent and construction sector
share increased from 7.8 to 10.5 per cent.
Growth pattern in various sectors reveal sizable diversification of the rural economy towards
non-farm sectors. From economic development point of view, similar trend and pattern
should be reflected in the employment. This was examined from employment data in
successive NSS rounds corresponding to the years for which data on rural-urban distribution
of national income was available.2
A perusal of Table 3.1 shows that rural employment and output followed different growth
patterns. Rural employment showed 2.16 per cent annual growth rate during the pre-reform
period, which decelerated in the post-reform period to 1.45% and turned negative (-0.28%) in
the period of economic acceleration. The output growth rate in the same sub-periods
accelerated.3 Thus, employment increased at a much lower rate compared to output and it
even declined in the wake of high growth in output post 2004-05.
The main reason for sluggish growth followed by negative growth in rural employment is that
non-farm rural sectors could not absorb the labour-force leaving agriculture. The results
presented in Table 3.1 also imply that employment elasticity in rural areas declined over time
and has reached the negative range after 2004-05. The employment insensitive growth raises
serious concerns over the capacity of the rural economy to provide productive jobs to the
rising population and workforce moving out of agriculture. Among non-farm sectors,
deceleration in employment growth was experienced in manufacturing and services sector;
but construction sector witnessed sharp acceleration in employment expansion with the
passage of time.
2Except for the years 1972-73 and 1983 where output data corresponds to year 1970-71 and 1980-81,
respectively.
3During 1972-73 to 1993-94 rural employment increased only by 53 per cent (from 191 million to 293
million) as compared to 132 per cent increase in real rural NDP. Subsequently, during the post-reform
period the increase in rural employment was only 17 per cent (293 million in 1993-94 to 343 million
in 2004-05) as compared to 72 per cent increase in real rural NDP. The recent period of economic
acceleration witnessed a decline in rural workforce by 7 million (from 343 million in 2004-05 to 336
million in 2011-12) despite 65 per cent increase in real rural NDP.

9
4.
Reasons behind Post 2004-05 Changes in Rural Employment
After 2004-05, rural areas witnessed negative growth in employment despite 7.45 per cent
annual increase in output. It is pertinent to explore whether the decline in rural workforce
between 2004-05 and 2011-12 was on account of rising unemployment or due to change in
labour-force itself? It would also be interesting to know the status of the persons who left
workforce and the sectors where such changes took place. These aspects are analysed by
examining household-type and gender-wise changes in labour-force participation and
workforce distribution across sectors, and by tracking the activity status of „not-in-labour
force‟ population between 2004-05 and 2011-12.
During the period of high output growth and falling employment (2004-05 to 2011-12), rural
population increased by 62 million, distributed almost equally between male and female
(Table 4.1). As indicated by labour-force participation rate (LFPR), the proportion of male
population joining labour force remained almost unchanged (55%) and 16 million out of 31
million incremental male population joined labour-force between 2004-05 and 2011-12.
However, female labour-force participation declined significantly from 33 per cent in 2004-
05 to 25 per cent in 2011-12, resulting in decline in the female labour-force by 22 million.
This led to a net decline of about 7 million in rural labour-force (male + female) between
2004-05 and 2011-12. Interestingly, NSSO data did not show any change in unemployment
(based on usual status) during this period which implies that the workforce in rural areas
reduced by a similar magnitude as in the labour-force. Based on these evidences it is inferred
that the decline in labour-force and in its sub-set (workforce) was primarily due to the
withdrawal of females from labourforce/workforce during the period under consideration.
It is worth noting that female withdrawal from labour-force happened across all types of
households in the rural areas. This is clearly visible from the increase in „not-in-labour force‟
to population ratio4 for the female. This ratio for the female belonging to agricultural labour,
cultivator, and non-farm households, increased by 8.49, 6.05 and 4.63 percentage points
between 2004-05 and 2011-12, respectively (Table 4.2). Withdrawal of female from labour-
force was highest among agricultural labour households followed by cultivators and non-farm
4Indicates the proportion of population not offering themselves for any economic activity.

10
households both in percentage and absolute terms. In the case of male, withdrawal from
work-force was found only among the agricultural labour households.
Table 4.1. Changes in population and economically active persons in rural areas
between 2004-05 and 2011-12
(million)
Particulars Male Female Persons
2004-05 2011-12 2004-05 2011-12 2004-05 2011-12
1. Population 401 432 379 410 780 842
2. LFPR (%) 56 55 33 25 45 41
3. Labourforce 223 239 126 104 349 342
4.Workforce 219 235 124 102 343 336
4.1Agriculture 146 139 103 76 249 216
4.1.1Cultivators 93 92 67 49 160 141
4.1.2 Agril. labour 53 48 37 27 89 75
4.2 Non-farm 73 95 21 26 94 121
Some scholars have offered explanation for the withdrawal of female from the labour-force
(Mazumdar and Neetha 2011; Rangarajan et al 2011; Kannan and Raveendran 2012;
Abraham 2013; Rangarajan et al 2013; Chand and Srivastava 2014). One of the reasons for
the fall in female LFPR is reported to be their increased enrolment in education (Rangarajan
et al 2011) which is seen across all household-types between 2004-05 and 2011-12 (Table
4.2). Among the household-types, the increase in the share of education in total ‟not-in-
labour-force female‟ population was 3 percentage points for agricultural workers as
compared to 1.4 percentage points for non-farm households. Similarly, male not-in-labour-
force population going for education witnessed substantial increase across all household
types during the period under consideration.
Increasing enrolment for education is a desirable trend in terms of improvement in education
level and skills of the persons. But the real challenge will be to create employment
opportunities for those educated persons who join the labour-force after acquiring the
education in the near future. Most of the employment opportunities have to be created in non-
farm sector as the natural choice of the educated youth would be to join more productive non-
farm sectors instead of agriculture.
It is interesting to note that education accounted for one third of the entire reduction in female
labour-force, whereas the withdrawal of male counterparts from labour-force (from
agriculture) was same as the increase in education. A large number of female, withdrawn
from labour-force, confined themselves to household activities as shown by the increasing

11
share of not-in-labour-force female population in the category of domestic activities during
the period under consideration (Table 4.2). The highest increase in the proportion of female
withdrawing from farm work and staying back at home is reported in the case of agricultural
labour households. Further, increase in proportion of female in domestic activities is also
noticed in the case of non-farm rural households. This is a puzzle as to why women of labour
households, whose economic conditions are not very good,5 chose to withdraw from
workforce and stay back in households.
Table 4.2. Reason-wise distribution of ‘not-in-labour force’ population in rural areas
(per cent)
Household
type
Education Domestic
activities
Others* Not-in labour-
force (%)
2004-05 2011-12 2004-05 2011-12 2004-05 2011-12 2004-05 2011-12
Male Cultivator 62.9 71.3 0.8 0.8 36.3 27.9 44.3 44.1
Agril. labour 53.7 67.9 1.1 0.9 45.2 31.2 43.2 42.5
Agril. worker 59.5 70.2 0.9 0.9 39.6 29.0 43.9 43.5
Non-farm 58.9 63.4 0.9 1.0 40.2 35.6 48.1 47.8
Rural worker 59.3 67.1 0.9 0.9 39.8 32.0 45.4 45.3
Female Cultivator 29.1 31.5 48.3 52.2 22.7 16.3 74.9 80.9
Agril. labour 28.1 32.5 42.7 49.0 29.2 18.6 65.3 73.8
Agril. worker 28.8 31.8 46.3 51.1 25.0 17.0 71.2 78.5
Non-farm 27.9 29.3 48.1 51.9 24.0 18.8 81.7 86.3
Rural worker 28.4 30.7 47.0 51.5 24.6 17.8 75.1 81.9
Person
Cultivator 42.2 46.3 29.9 33.1 27.9 20.6 59.1 61.8
Agril. labour 38.5 45.5 25.9 31.2 35.7 23.2 54.1 58.0
Agril. worker 40.9 46.0 28.5 32.5 30.7 21.5 57.2 60.5
Non-farm 39.5 41.6 30.4 33.5 30.0 24.9 64.8 66.8
Rural worker 40.3 44.0 29.2 33.0 30.4 23.0 59.9 63.2 *others include children of age 0-4 years age, pensioners, disabled persons, beggars, prostitutes, etc
One argument is that high growth in agricultural output and terms of trade for agriculture
during 2004-05 to 2011-12 led to sharp rise in income of farmers as well as agricultural
labour6 in this period which induced withdrawal from farm work. This seems to be a part
explanation which can hold in case of some households who realized substantial increase in
their income. Some scholars argue that the female withdrawal from labour-force might be due
5 It is estimated that 38.3 per cent of agricultural labour households in rural areas were under poverty
in year 2011-12. 6According to Chand et al. (2015) income per cultivators and agricultural labour in this period
increased by 63.6 per cent and 75.86 per cent, respectively which are 2.6 - 3.3 times the rate of
increase during earlier period of 1993-94 to 2004-05.
12
to the reversal of an exceptional increase in female labour-force caused by agrarian distress
during the earlier period 1999-2000 to 2004-05 (Abraham, 2009; Thomas, 2012). However,
empirical evidences refute such arguments because the reduction in female LFPR was not
confined to only agricultural households but across all household types in rural areas. It is
also pertinent to mention that Annual Employment - Unemployment Surveys by the Labour
Bureau indicate further decline in female LFPR between 2011-12 and 2015-16.
Some other reasons for reduction in workforce seem to be:
(i) increase in reservation wage and non-availability of suitable work at that
wage rate,
(ii) manufacturing jobs away from the place of the habitation, discouraging
female to go for it,
(iii) lack of skill to get well paid non-farm job, and
(iv) rising tension between labour and employer in agriculture due to changing
social relationship between them (Chand and Srivastava 2014).
Apart from withdrawal of labour force/workforce, sizable occupational shifts in workforce
were also observed between 2004-05 and 2011-12. Out of 33 million workers who left
agriculture7 27 million (81%) were female and 6 million (19%) were male (Table 4.1).
Further, outgoing workforce from agriculture comprised both cultivators and agricultural
labours with their respective shares of 56 per cent and 44 per cent. It is worth mentioning that
out of 27 million female workers who left agriculture, only 5 million joined non-farm sectors
and rest withdrew from labour-force itself. On the other hand, entire 6 million male workers
who left agriculture as well as 16 million incremental male labour-force joined non-farm
sectors between 2004-05 and 2011-12. Based on these evidences it can be concluded that (a)
rural workforce witnessed de-feminization and (b) employment diversification towards non-
farm sectors was biased against female.
7 This large withdrawal of workers from agriculture is an important factor for increase in agricultural wage
rates which in turn is found to have adverse effect on farmers income in conventional crops (Srivastava et.al 2017).
13
5.
Sector-wise Changes in Output and Employment in Rural India
5.1 Agriculture
The results presented in the earlier sections show that contribution of agriculture in rural
output gradually declined. This is considered a desirable change for the progress in economic
development. However, over-dependence on agriculture for employment emerged as a major
challenge. Between 2004-05 and 2011-12, India first time witnessed reduction in workforce
in agriculture. The rate of decline was 2.04 per cent. Despite this, agriculture employed 64
per cent of the total rural workforce who produced only 39 per cent of the total rural output
during the year 2011-12. It is estimated that for bringing convergence between the share of
agriculture in total output and employment, 84 million agricultural workers were required to
be shifted to non-farm sectors in rural areas in the year 2011-12. This amounted to almost 70
per cent increase in non-farm employment, which looks quite challenging.
5.2. Manufacturing
Manufacturing output in rural areas registered annual growth rate of 5.18 per cent between
1970-71 and 1993-94. The post-reform period (1993-94 to 2004-05) witnessed higher growth
rate of 8.38 per cent, which further accelerated sharply to 15.87 per cent during 2004-05 to
2011-12 (Table 3.1). Significantly higher growth in manufacturing compared to other sectors
raised its share in rural NDP from 5.9 per cent in 1970-71 to 18.4 per cent in 2011-12 (Table
3.2) pointing to a clear trend towards industrialization in rural areas.
However, the signs of industrialization in rural areas were not visible through the changes in
employment structure. Between 1972-73 and 1993-94, manufacturing sector added 10.29
million jobs (29% of incremental non-farm jobs) and its share in total rural employment
increased from 5.3 per cent in 1972-73 to 7.0 per cent in 1993-94. During the next decade
(reforms period) the sector added 7 million jobs (23.4% of incremental non-farm jobs) and its
share in total rural employment increased only by 1 percentage point to 8.1 per cent in 2004-
05. During the recent period between 2004-05 and 2011-12, employment in the
manufacturing sector increased merely by 1.2 million jobs (4.9% share in incremental non-
farm jobs). Growth rate in manufacturing employment slowed down from 3.55 per cent in

14
first period to 2.79 per cent in the second period and to 0.65 per cent in the third period
(Table 3.1).
The results further reveal that rural areas contributed 58 per cent of the incremental
manufacturing sector output in the country as compared to only 25 per cent share in
incremental employment (5.3 million) between 2004-05 and 2011-12. This leads to the
inference that manufacturing sector in rural areas used more capital-intensive production
technology as compared to the urban areas after 2004-05. As the new industry in rural areas
relied much more on capital than labour, it failed to address the goal of employment
generation for rural labour-force.
Table 5.1. Sub-sector wise changes in employment (usual status) in manufacturing and
services sectors
Sub-sectors Employment:
usual status
(million)
Compound
growth
rate (%)
Share in total
employment (%)
2004-05 2011-12 2004-05 2011-12
Wearing apparel 3.4 4.2 2.9 12.3 14.5
Tobacco products 3.4 3.6 0.8 12.3 12.5
Textile 4.5 3.6 -3.2 16.0 12.3
Non-metallic mineral products 3.4 3.6 0.8 12.3 12.5
Food products and Beverages 3.4 3.4 0.0 12.3 11.8
Machinery, metal products and
transport equipment 2.1 3.0 5.7 7.4 10.4
Wood and wood products 4.1 2.8 -5.4 14.8 9.6
Furniture 1.7 1.5 -2.1 6.2 5.1
Chemical products 0.7 0.6 -2.6 2.5 2.0
Rubber and plastic products 0.3 0.4 1.1 1.2 1.3
Paper and printing, etc. 0.3 0.3 -0.3 1.2 1.2
Leather and related products 0.3 0.3 -1.8 1.2 1.0
Others 0.0 1.7 - 0.0 5.8
Manufacturing sector- Sub total 27.6 29.0 0.67 100 100
Wholesale and retail trade; repair
of motor vehicles 18.5 18.8 0.3 38.9 36.0
Transport, storage and
communication 8.6 10.0 2.3 18.0 19.2
Education 5.5 7.0 3.4 11.5 13.3
Hotel and restaurants 2.4 2.9 2.9 5.0 5.6
Public administration, defence and
compulsory social security 2.7 2.7 -0.5 5.8 5.1
Health and social work 1.4 1.6 2.0 2.9 3.0
Financial intermediation 0.7 1.1 7.1 1.4 2.1
Others 7.8 8.2 0.7 16.4 15.7
Services sector: Sub-total 47.6 52.3 1.4 100.0 100.0

15
Within the manufacturing sector, wearing apparel, tobacco products, textile, non-metallic
mineral products, and food products and beverages are the major employment generating
sub-sectors (Table 5.1). Most of these sub-sectors witnessed either stagnation or fall in
employment between 2004-05 and 2011-12.
The lack of skills and technical knowledge appear to be the main barrier for rural workers to
enter manufacturing sector. The NSS surveys show a depressing picture of the level of
education and technical skills possessed by the rural workers. More than three-fourth of the
total rural workforce of 15-59 years were not qualified even up to secondary level in year
2011-12 (Table 5.2). Further, only 1.3 per cent of the rural workforce of the age group 15-59
years possessed technical education8. Similarly, only 14.6 per cent of the rural workforce of
age group 15-59 years received vocational trainings9, which aim to develop competencies
(knowledge, skills and attitude) of skilled or semi-skilled workers in various trades. Gender-
wise disaggregation reveals that female workers possess relatively low level of education and
technical training as compared to male counterparts. These facts suggest that setting up of
industries and improvement in infrastructure are not sufficient conditions for increasing
employment in rural areas. Improvement in industrial infrastructure in rural areas must be
accompanied by the effective human resources development programmes to impart necessary
skills and training to rural youth to match the job requirement in manufacturing sector.
Table 5.2. Education level (general and technical) of usually employed rural workers of
age 15-59 years
(per cent)
Per cent of rural workers Male Female Persons
2004-05 2011-12 2004-05 2011-12 2004-05 2011-12
Secondary education &
above 19.7 27.1 6.8 11.8 14.9 22.3
With technical education 1.7 1.6 0.7 0.7 1.3 1.3
With vocational training 14.2 15.4 13.0 12.7 13.8 14.6 Source: Authors estimation based on unit-level NSS data on employment and unemployment survey
5.3. Services sector
Services sector was found to be the second largest contributor of output and employment in
rural areas (Table 3.2). The sector contributed about 27.0 per cent of the total rural output and
engaged 15.5 per cent of the rural workforce in the year 2011-12. According to NAS, services
8 Post-secondary courses of study and practical training aimed at preparation of technicians to work as
supervisory staff.
9 Lower level education and training for the population of skilled or semi-skilled workers in various trades and it
does not enhance their level with respect to general education.

16
sector registered 5.94 and 6.10 per cent annual growth in its real NDP during the pre-reform
period in urban and rural areas, respectively. The growth accelerated to 8.94 and 8.55 per
cent, respectively during the post-reform period. During the recent period between 2004-05
and 2011-12, urban areas maintained growth in services sector output at 8.42 per cent, but in
rural areas it dropped to 3.48 per cent.
Services sector has played a major role in structural transformation of Indian economy but its
achievements during the recent years were mainly concentrated towards urban areas.
Wholesale and retail trade and repair of motor vehicles constituted 27 per cent share in total
service sector NDP in 1993-94 which increased to 37 per cent in 2004-05 on account of
impressive annual growth of 11.7 per cent in this sub-sector (Table 5.3). This along with the
remarkable growth in other sub-sectors such as hotel and restaurants, transport, storage and
communication, and financial services, resulted in 8.5 per cent annual growth in overall
services sector in rural areas between 1993-94 and 2004-05.
During 2004-05 and 2011-12, NDP from trade, and hotel and restaurants activities declined
by 4.8 per cent and 2.5 per cent per year, respectively. Although the reduction in output of
these sectors was offset by the significant growth in financial services, transport, storage and
communication, and public administration and social security activities, the growth in overall
services sector output decelerated to 3.4 per cent per annum between 2004-05 and 2011-12.
Table 5.3. Sub-sector wise performance of services sector in rural areas
(per cent)
Subs-sector Share in services sector
output
Compound growth rate
in real NDP
1993-94 2004-05 2011-12 1993-94 to
2004-05
2004-05 to
2011-12
Wholesale and retail trade;
repair of motor vehicles 27 37 20 11.7 -4.8
Financial intermediation 23 23 38 8.2 11.4
Transport, storage and
communication 11 15 21 12.2 8.2
Public administration, defence
and compulsory social security 18 5 7 -3.5 9.0
Hotel and restaurants 1 3 2 17.8 -2.5
Others 20 17 11 7.2 -2.4
Services sector 100 (192932)
100 (475775)
100 (604439)
8.5 3.4
Figures within parentheses are real NDP (Rs crore at 2004-05 prices).
17
One of the reasons for the decline in output of some services in rural areas could be the shift
in the shopping behaviour of the rural households towards urban centres. Improved road
connectivity and transport and rise in ownership of private vehicles facilitated frequent visits
to nearby urban localities for shopping and other requirements. Although consumer gets
wider choices in urban localities, this adversely affected trade and other businesses in rural
areas.
The slow-down in output of services sector after 2004-05 caused deceleration in employment
growth. The employment in services sector increased only by 1.35 per cent per year between
2004-05 and 2011-12 as compared to growth rate of 3.25 per cent during the previous period
(Table 3.1). The services sectors, which offer relatively decent and comfortable jobs,
constituted merely 15 per cent share in 27 million new jobs created in non-farm sectors
between 2004-05 and 2011-12. As in the case of output, wholesale and retail trade including
repair services for motor vehicles was the largest sub-sector and constituted 36.0 per cent
share in employment in all services in 2011-12 (Table 5.1). But this sub-sector witnessed
stagnation in job creation between 2004-05 and 2011-12, resulting in deceleration in overall
services sector employment. Notwithstanding, other sub-sectors such as financial services,
hotels and restaurants, education, and transport, storage and communication services gained
momentum in creating employment in rural areas during the recent period. Two sub-sectors
namely education and transport, storage and communication constituted 62 per cent of the
about 5 million jobs created in services sector in the rural areas between 2004-05 and 2011-
12.
5.4. Construction
Rural areas are characterised by poor infrastructure and civic amenities. Similarly, a large per
cent of houses are in need of upgradation. These facts indicate considerable scope for growth
of construction sector in rural areas. The real NDP of construction sector increased at the
annual rate of 3.94 per cent between 1970-71 and 1993-94. During the successive periods,
1993-94 to 2004-05 and 2004-05 to 2011-12, growth rate in construction sector output
accelerated to 7.92 per cent and 11.49 per cent, respectively (Table 3.1). Consequently, the
share of construction sector in rural output increased from 3.5 per cent in 1970-71 to 10.5 per
cent in 2011-12 (Table 3.2).
Employment in construction sector increased 13 times during the past four decades, leading
to a significant increase in its share in total rural employment from 1.4 per cent in 1972-73 to

18
10.7 per cent in 2011-12. It is interesting to note that this sector absorbed 74 per cent of the
new jobs created in non-farm sectors in rural areas between 2004-05 and 2011-12.
These trends indicate that rural areas witnessed a construction boom after 2004-05, which is
desirable in terms of creation of necessary infrastructure for the economic development.
Further, growth in employment in construction sector was higher than output growth during
both the periods under consideration. One of the reasons for the much higher growth in rural
workers in construction over manufacturing or services sectors is fewer requirements of skills
and education in construction activities.

19
6.
Trends in Disparity in Worker Productivity
The reduction in economic disparity remains a major goal of development in an economy.
This section examines trends in disparity in income per worker (worker productivity) at
different levels: 1) between farm and non-farm workers in rural areas, 2) between non-farm
workers of rural and urban areas, and 3) between rural and urban areas.
6.1. Disparity in worker productivity between farm and non-farm workers in rural
areas
Estimates of income of worker in various categories and in rural and urban areas since 1970-
71 are presented in Table 6.1. In year 2011-12 per worker income varied from Rs. 33,937 for
agricultural labour to Rs.1,71,836 for rural non-farm workers. In the same year a cultivator
earned 2.27 times the income earned by a labourer from agriculture (Table 6.2). At the same
time, per capita income of non-farm workers was more than twice the income of cultivators.
These results show that among rural workers, agricultural labours are at the bottom in terms
of worker productivity. Rural non-farm sector offers 2.76 times productive employment than
the farm sector. The disparity in worker productivity10
between different categories of rural
workers remained consistently high during the past four decades. Nevertheless after 2004-05,
disparity among different categories of workers (except between non-farm workers of rural
and urban areas) witnessed declining trend.
Table 6.1. Trends in worker productivity (at current prices) across different worker
categories in India
(Rs/worker)
Year Agricultural
labour
Cultivator Farm
workers
Non-farm
rural
workers
All rural
workers
Urban
1970-71 821 1114 1018 2294 1203 3829
1980-81 1788 2425 2216 6248 2878 8456
1993-94 5040 12271 9410 25822 12947 38934
1999-00 9246 22807 17059 51789 25380 89180
2004-05 10480 25183 19933 82990 37273 120419
2011-12 33937 77144 62208 171836 101755 282515
10
Estimated as ratio of NDP per worker between two categories of the worker. For agricultural
labour, worker productivity was estimated by dividing wage bill with the number of agricultural
labours using the methodology of Chand, et al. (2015)
20
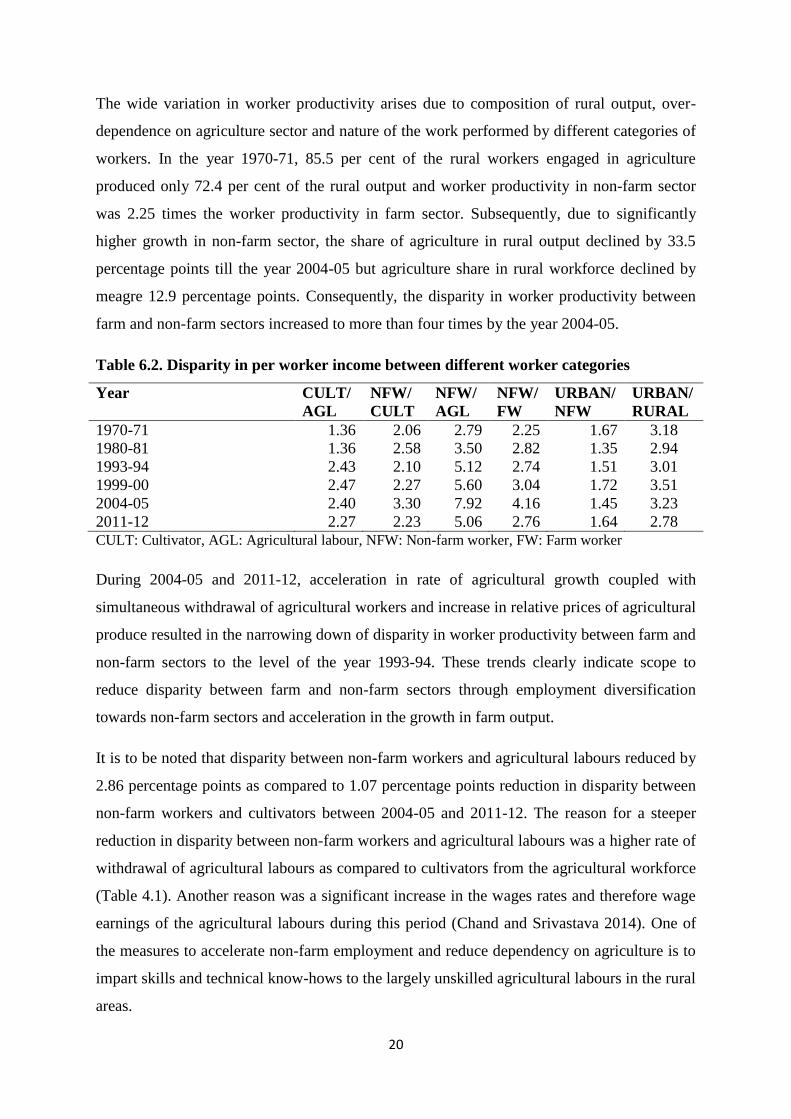
The wide variation in worker productivity arises due to composition of rural output, over-
dependence on agriculture sector and nature of the work performed by different categories of
workers. In the year 1970-71, 85.5 per cent of the rural workers engaged in agriculture
produced only 72.4 per cent of the rural output and worker productivity in non-farm sector
was 2.25 times the worker productivity in farm sector. Subsequently, due to significantly
higher growth in non-farm sector, the share of agriculture in rural output declined by 33.5
percentage points till the year 2004-05 but agriculture share in rural workforce declined by
meagre 12.9 percentage points. Consequently, the disparity in worker productivity between
farm and non-farm sectors increased to more than four times by the year 2004-05.
Table 6.2. Disparity in per worker income between different worker categories
Year CULT/
AGL
NFW/
CULT
NFW/
AGL
NFW/
FW
URBAN/
NFW
URBAN/
RURAL
1970-71 1.36 2.06 2.79 2.25 1.67 3.18
1980-81 1.36 2.58 3.50 2.82 1.35 2.94
1993-94 2.43 2.10 5.12 2.74 1.51 3.01
1999-00 2.47 2.27 5.60 3.04 1.72 3.51
2004-05 2.40 3.30 7.92 4.16 1.45 3.23
2011-12 2.27 2.23 5.06 2.76 1.64 2.78 CULT: Cultivator, AGL: Agricultural labour, NFW: Non-farm worker, FW: Farm worker
During 2004-05 and 2011-12, acceleration in rate of agricultural growth coupled with
simultaneous withdrawal of agricultural workers and increase in relative prices of agricultural
produce resulted in the narrowing down of disparity in worker productivity between farm and
non-farm sectors to the level of the year 1993-94. These trends clearly indicate scope to
reduce disparity between farm and non-farm sectors through employment diversification
towards non-farm sectors and acceleration in the growth in farm output.
It is to be noted that disparity between non-farm workers and agricultural labours reduced by
2.86 percentage points as compared to 1.07 percentage points reduction in disparity between
non-farm workers and cultivators between 2004-05 and 2011-12. The reason for a steeper
reduction in disparity between non-farm workers and agricultural labours was a higher rate of
withdrawal of agricultural labours as compared to cultivators from the agricultural workforce
(Table 4.1). Another reason was a significant increase in the wages rates and therefore wage
earnings of the agricultural labours during this period (Chand and Srivastava 2014). One of
the measures to accelerate non-farm employment and reduce dependency on agriculture is to
impart skills and technical know-hows to the largely unskilled agricultural labours in the rural
areas.
21
The rising labour wages also narrowed down the disparity between agricultural labour and
cultivators between 2004-05 and 2011-12
6.2. Disparity in worker productivity between non-farm workers of rural and urban
areas
Although non-farm sectors generate higher income to the workers over the farm sector in
rural areas, it is lower than the per worker income in the urban areas. During 2011-12, urban
workers earned 64 per cent higher income as compared to the non-farm workers of rural
areas. One of the major reasons of the disparity in productivity of non-farm workers
belonging to rural and urban areas is the difference in the composition of the non-farm jobs.
The evidences show that in urban areas, 69 per cent of the total non-farm output was
produced by services sectors (by engaging 62% of non-farm workers) in 2011-12. On the
other hand, the share of services sectors in non-farm output and workforce of rural areas was
44 per cent and 43 per cent, respectively. This implies that dominance of services sectors in
urban economy, which provides high paid jobs, is a major source of disparity among non-
farm workers of rural and urban areas.
It is to be noted that between 2004-05 ad 2011-12, most of the growth among rural non-farm
sectors was registered in construction sector, while the growth in services sector decelerated
both in output and employment (Table 3.1). On the other hand, services sector remained a
major growth driver of urban economy. Consequently, disparity between non-farm workers
of rural and urban areas increased during this period.
Improvement in education level and skills of the rural workers and creating infrastructure
facilities (such as transport connectivity, communication connectivity, basic amenities, etc.)
for services sectors in rural areas would go a long way to reduce such disparity.
6.3. Disparity in worker productivity between rural and urban areas
The over-dependence on agriculture and slow pace of low-paid construction sector led
employment diversification are reflected in the persistent disparity in per worker output in
rural and urban areas (Table 6.2). Although the disparity between rural and urban workers
narrowed down to its lowest level by the year 2011-12, urban workers still produces 2.78
times the output of the rural worker. As 64 per cent of the rural workforce is engaged in
agriculture, reducing disparity would require a much attention on the improvement of income
of farmers and agricultural labours.

22
7.
Conclusions and Strategic Options for Pro-employment Growth
The empirical evidences on the changes in rural economy during the past four decades lead to
following conclusions and strategic options to promote pro-employment and equitable growth
in the rural areas.
About half of the national income and more than two third of the total employment is
generated in rural areas. Apart from producing almost all agricultural output, rural areas
contributes about half of the manufacturing and construction sectors output and one
quarter of the services sectors output in the country. The rural areas are characterized
with the low level and wide disparity in worker productivity.
The declining rural share in national output without a commensurate decline in its share
in total employment during the past four decades implies that a much faster growth in
capital-intensive sectors in urban areas did not generate adequate employment to absorb
rural labour.
The higher dependency on rural areas for employment is a major reason for low level of
per worker income. Temporally, contribution of rural areas in total output and
employment registered striking changes across different sectors. The production base of
manufacturing sector shifted to rural areas significantly, but without a commensurate
increase in rural employment during the past forty years preceding 2011-12. The
services sector lost heavily to urban areas both in terms of output and employment. It
was only the construction sector where rural share in both output and employment
improved and employment grew at a faster rate as compared to output. Although
construction activities improve rural infrastructure and have a multiplier effect on the
economy, proportionately less output growth than the employment indicates a limited
productive employment generation capacity in this sector.
During the four decades from 1970-71 to 2011-12, rural output increased almost seven
times (at constant prices) and rural economy has now turned more non-agricultural with
the share of agriculture in rural income reduced to 39 per cent. However, the rural
employment during this period could not even double. In fact the employment growth
decelerated over time and reached a negative range after the year 2004-05. The decline
in rural employment between 2004-05 and 2011-12 was due to withdrawal of labour

23
force from the agriculture sector, majority of whom did not join the non-farm sectors.
The employment insensitive growth in rural areas warrants special attention towards the
non-farm sectors, particularly manufacturing and services sectors, to provide productive
employment to the rising population and labour force leaving agriculture.
Contrary to a common perception the evidences point out defeminisation of rural
workforce between 2004-05 and 2011-12 as female workers withdrew from agriculture
work in large numbers. About one third of the entire reduction in female labour force
got engaged in education activities, while rest of them confined themselves in
household activities. Increasing enrolment for education is a desirable trend in terms of
improvement in their education level and skills. Greater efforts will be required to
create productive employment opportunities in non-farm sectors for those educated
youth who will join the labour force after acquiring education in the near future.
It is puzzling to note that majority of the female workers who withdrew from farm
works and stayed back at home belong to the agricultural labour households, whose
economic conditions are not very good. Clearly, female of agricultural labour
households do not prefer to go for farm work. Some evidences indicate non-availability
of non-farm employment opportunities rather than lack of willingness for outside work
as the reason for de-feminisation of rural workforce. There is an evidence that female
labour participation rate further declined after 2011-12. It is necessary to formulate
attractive avenues for the female workers to bring them out of domestic boundaries and
engage in productive activities.
Withdrawal of workforce from agriculture witnessed between 2004-05 and 2011-12 has
reduced dependence on agriculture and brought convergence in the contribution of
agriculture in rural output and employment to some extent. However, to match
employment share with output share of agriculture another 84 million agricultural
workers are required to quit agriculture and join more productive non-farm sectors.
This amounts to about 70 per cent increase in the non-farm jobs in rural areas.
Workers moving out of agriculture and those entering rural labour-force are getting
largely absorbed in construction activity, as, employment growth in manufacturing and
service sector in rural areas decelerated sharply after 2004-05. Rural manufacturing
adopted more capital-intensive production as compared to the urban manufacturing and
it failed to address the goal of employment generation for rural labour-force. Most of
the labour-intensive manufacturing sub-sector such as wearing apparel, tobacco

24
products, textile, non-metallic mineral products, and food products and beverages
witnessed either stagnation or fall in employment between 2004-05 and 2011-12. As
conventional manufacturing has failed to generate rural jobs, despite very high growth
in output, India need to look for different type of manufacturing for rural areas. Labour
intensive medium, small and micro (MSME) enterprises seem to be an appropriate
alternative for rural employment generation.
The lack of required skills and technical knowledge are the main barrier for rural
workers to enter manufacturing sector. Setting up of industries and improvement in
infrastructure are the necessary but not sufficient conditions for increasing rural
employment which require effective human resources development programmes to
impart necessary skills and training to rural youth to match the job requirement in
manufacturing sector.
Services sector has played a major role in structural transformation of Indian economy
but its achievements during the recent years were mainly concentrated towards urban
areas. This sector in rural areas witnessed deceleration in output as well as employment
after 2004-05. An important reason for this is increased reliance of rural consumers on
service providers located in urban areas. Rural areas have comparative advantage in
services like post-harvest value addition, on farm storage, primary processing, grading
etc.
The absolute level of income per worker has increased at modest rate over time.
However, over the years, the disparity in worker productivity remained consistently
high among different categories of workers with agricultural labour being at the bottom.
Nevertheless the recent years have witnessed a declined trend in disparity in worker
productivity. The efforts to reduce disparity among different worker categories requires
acceleration in employment diversification towards non-farm sectors through creation
of conducive rural infrastructure and imparting skills and training to largely unskilled
rural workers, and improving growth in farm output.
Linking processing to production through efficient value chain, contract farming and
direct linkage between factory and farm offers considerable scope for rural employment
generation as well as raising farmers‟ income. Overall, transformation of rural economy
must include strong measures for employment generation and shifting workers out of
conventional agricultural activities.
25
In the wake of capital intensive production preferred by manufacturing sector and
anticipated threats to jobs posed by emerging technological innovations like new
automation, artificial intelligence, IOT, robotics etc. there is a need for a rethink on
pursuing traditional development approach of shifting workforce from agriculture to
manufacturing and services. India should explore possibilities of creating blue collar
jobs in and around agriculture. This also looks desirable as withdrawal of labour from
agriculture has already started affecting some farm activities and farmers income
adversely and there is serious shortage of skilled workers in agriculture needed for
specialised operations and adoption of modern technology. The reasons for workers
preferring to move from agriculture to non-agriculture are low wages, stress of manual
work and irregular employment. These three problems can be addressed by innovative
approaches in production and post-harvest activities. These can be harnessed by
developing and promoting new farm models based on knowledge and skill based
agriculture and post-harvest on farm value addition. PMKVY can play a major role in
this by promoting and imparting skills required in modern agriculture, value addition
and primary processing.
26
References
Abraham, V (2013): “Missing Labour or Consistent „De-feminisation‟?,” Economic &
Political Weekly, Vol 48, No 31, pp 99-108.
Aggarwal, A and N Kumar (2012): “Structural Change, Industrialization and Poverty
Reduction: The Case of India,” Development Papers 1206, Economic and Social
Commission for Asia and the Pacific (ESCAP), United Nations, South and South-West
Asia Office, New Delhi.
Chand, R and S K Srivastava (2014): “Changes in the rural labour market and their
Implication for Agriculture,” Economic & Political Weekly, Vol 49, No 10, pp 47-54.
Chand, R., R Saxena and S Rana (2015): “Estimates and Analysis of Farm Income in India,
1983-84 to 2011-12,” Economic & Political Weekly, Vol 50, No 22, pp 139-145.
Kannan, K P and G Raveendran (2012): “Counting and Profiling the Missing Labour Force,”
Economic & Political Weekly, Vol 47, No 6, pp 77-80.
Maurya, N K and J V Vaishampayan (2012): “Growth and Structural Changes in India‟s
Industrial Sector,” International Journal of Economics, Vol 6, No 2, pp 321-331.
Mazumdar, I and N Neetha (2011): “Gender Dimensions: Employment Trends in India,
1993-94 to 2009-10,” Economic & Political Weekly, Vol 46, No 43, pp 118-126.
Papola, T S (2012): “Structural Changes in the Indian Economy: Emerging Patterns and
Implications,” ISID Working Paper No 12, Institute for Studies in Industrial
Development, New Delhi.
Pradhan, K C (2013): “Unacknowledged Urbanization: New Census Towns of India,”
Economic & Political Weekly, Vol 48, No 36, pp 43-51.
Rangarajan, C, P I Kaul and Seema (2011): “Where is the Missing Labour Force?” Economic
& Political Weekly, Vol 46, No 39, pp 68-72.
Rangarajan, C, Seema and E M Vibeesh (2013): “Developments in the Workforce between
2009-10 and 2011-12,” Economic & Political Weekly, Vol 49, No 23, pp 117-121.
Srivastava, S.K., Chand, R., and Singh, J. (2017): “Changing Crop Production Cost in India:
Input Prices, Substitution and Technological Effects”, Agricultural Economics
Research Review, Conference Issue.
Thomas, J. J. (2012): “India‟s Labour Market during the 2000s: Surveying the Changes,”
Economic & Political Weekly, Vol 47, No 51, pp 39-51.
United Nations (2012): “World Urbanization Prospects: The 2011 Revision,”
ST/ESA/SER.A/322, Department of Economic and Social Affairs, Population Division,
New York.
Related Documents