Deep-Sea Research I 52 (2005) 1591–1615 Changing sedimentary environment during the Late Quaternary: Sedimentological and isotopic evidence from the distal Bengal Fan Pratima M. Kessarkar a , V. Purnachandra Rao a, , S.M. Ahmad b , S.K. Patil c , A. Anil Kumar a , G. Anil Babu b , Sukalyan Chakraborty a , R. Soundar Rajan b a National Institute of Oceanography, Dona Paula 403 004, Goa, India b National Geophysical Research Institute, Hyderabad 500 007, India c Indian Institute of Geo-magnetism, Alibagh 402 201, Maharashtra, India Received 20 April 2004; received in revised form 26 October 2004; accepted 27 January 2005 Available online 13 June 2005 Abstract The sediments recovered from two gravity cores of the lower and distal Bengal Fan were investigated for sedimentological properties and Sr–Nd isotopes. Each core exhibits two distinct units, the lower unit 2 and upper unit 1 sediments. The unit 2 sediments are predominantly olive black/grey in colour with abundant finer silt-size fractions, low organic carbon and CaCO 3 , quartz and mica in the coarse fraction, dominant illite and chlorite in the o2 mm fraction and uniform rock-magnetic properties. Biogenic constituents are extremely rare or restricted to the lower part of unit 2. The unit 1 sediments, on the other hand, are moderate brown/yellowish brown in colour with intermittent thin dark- coloured sediment layers. Higher clay, organic carbon, CaCO 3 , and biogenic constituents in the coarse fraction, and enriched smectite and kaolinite in the o2 mm fraction are typical. Magnetic susceptibility values are higher and correlate well with acid-insoluble residue content. Higher Rb, Sr, Sm and Nd concentrations, 87 Sr/ 86 Sr ratios and more radiogenic Nd values are characteristic for unit 2 sediments compared to unit 1 in both the cores. The unit 2 sediments represent Pleistocene hemiturbidites, older than 13 14 C kyr BP with their source from the northern Bay of Bengal (NBOB), derived from the Himalayas and transported by the Ganges–Brahmaputra (G–B) River system. Unit 1 sediments are calcareous pelagic sediments, which started depositing 12 14 C kyr BP, with its clastic sediments derived from the Himalayas and SE Indian/Sri Lankan margins. The change in lithofacies from unit 2 to unit 1 suggests that the sediment deposition by turbidity current activity ceased in the distal Bengal Fan at 12 14 C kyr BP, perhaps because of the rapid rise in sea-level during the melt water pulse 1A and Holocene. r 2005 Elsevier Ltd. All rights reserved. Keywords: Turbidites; Pelagic sediments; Provenance; Late Quaternary; Distal Bengal Fan ARTICLE IN PRESS www.elsevier.com/locate/dsr 0967-0637/$ - see front matter r 2005 Elsevier Ltd. All rights reserved. doi:10.1016/j.dsr.2005.01.009 Corresponding author. Fax: +91 832 2450609. E-mail address: [email protected] (V.P. Rao).

Welcome message from author
This document is posted to help you gain knowledge. Please leave a comment to let me know what you think about it! Share it to your friends and learn new things together.
Transcript
ARTICLE IN PRESS
0967-0637/$ - se
doi:10.1016/j.ds
�CorrespondiE-mail addre
Deep-Sea Research I 52 (2005) 1591–1615
www.elsevier.com/locate/dsr
Changing sedimentary environment during theLate Quaternary: Sedimentological and isotopic
evidence from the distal Bengal Fan
Pratima M. Kessarkara, V. Purnachandra Raoa,�, S.M. Ahmadb, S.K. Patilc,A. Anil Kumara, G. Anil Babub, Sukalyan Chakrabortya, R. Soundar Rajanb
aNational Institute of Oceanography, Dona Paula 403 004, Goa, IndiabNational Geophysical Research Institute, Hyderabad 500 007, India
cIndian Institute of Geo-magnetism, Alibagh 402 201, Maharashtra, India
Received 20 April 2004; received in revised form 26 October 2004; accepted 27 January 2005
Available online 13 June 2005
Abstract
The sediments recovered from two gravity cores of the lower and distal Bengal Fan were investigated for
sedimentological properties and Sr–Nd isotopes. Each core exhibits two distinct units, the lower unit 2 and upper unit 1
sediments. The unit 2 sediments are predominantly olive black/grey in colour with abundant finer silt-size fractions, low
organic carbon and CaCO3, quartz and mica in the coarse fraction, dominant illite and chlorite in the o2mm fraction
and uniform rock-magnetic properties. Biogenic constituents are extremely rare or restricted to the lower part of unit 2.
The unit 1 sediments, on the other hand, are moderate brown/yellowish brown in colour with intermittent thin dark-
coloured sediment layers. Higher clay, organic carbon, CaCO3, and biogenic constituents in the coarse fraction, and
enriched smectite and kaolinite in the o2 mm fraction are typical. Magnetic susceptibility values are higher and
correlate well with acid-insoluble residue content. Higher Rb, Sr, Sm and Nd concentrations, 87Sr/86Sr ratios and more
radiogenic �Nd values are characteristic for unit 2 sediments compared to unit 1 in both the cores. The unit 2 sediments
represent Pleistocene hemiturbidites, older than 13 14C kyr BP with their source from the northern Bay of Bengal
(NBOB), derived from the Himalayas and transported by the Ganges–Brahmaputra (G–B) River system. Unit 1
sediments are calcareous pelagic sediments, which started depositing �12 14C kyr BP, with its clastic sediments derived
from the Himalayas and SE Indian/Sri Lankan margins. The change in lithofacies from unit 2 to unit 1 suggests that the
sediment deposition by turbidity current activity ceased in the distal Bengal Fan at �12 14C kyr BP, perhaps because of
the rapid rise in sea-level during the melt water pulse 1A and Holocene.
r 2005 Elsevier Ltd. All rights reserved.
Keywords: Turbidites; Pelagic sediments; Provenance; Late Quaternary; Distal Bengal Fan
e front matter r 2005 Elsevier Ltd. All rights reserved.
r.2005.01.009
ng author. Fax: +91832 2450609.
ss: [email protected] (V.P. Rao).
ARTICLE IN PRESS
P.M. Kessarkar et al. / Deep-Sea Research I 52 (2005) 1591–16151592
1. Introduction
The Modern Bengal Fan came into existencewith the deposition of turbidite sediments since theOligocene/Early Miocene (Cochran, 1990; Stow et
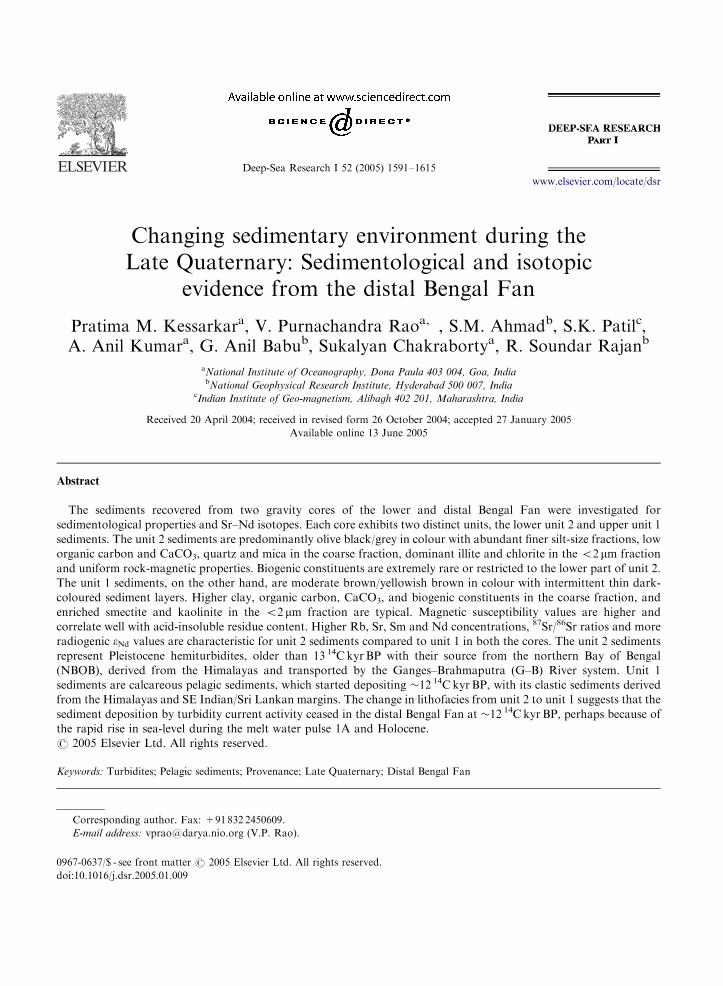
Fig. 1. (A) Locations of the sediment cores on the Bengal Fan. Bo
turbidity current channel—thick dashed line, other turbidity channels
(modified after Emmel and Curray, 1984). (B). Geology of Eastern Ind
geological formations and Ganges river discharge are also given. GC
1989; Galy et al., 1999; Dowling et al., 2003).
al., 1990). Recent investigations on the deep-seafan are directed largely to understand the (a)morphology and seismic stratigraphy of thesubmarine fan and growth and migration ofsubmarine channels connecting the fan system,
undaries of the Upper, Middle and Lower Fan regions, active
—thin dashed lines, DSDP and ODP core sites are also shown
ia and Sri Lanka (Anonymous, 1965), Sr and Nd isotopes of the
-granitic gneiss and CG-charnokite gneiss (after Peucat et al.,
ARTICLE IN PRESS
P.M. Kessarkar et al. / Deep-Sea Research I 52 (2005) 1591–1615 1593
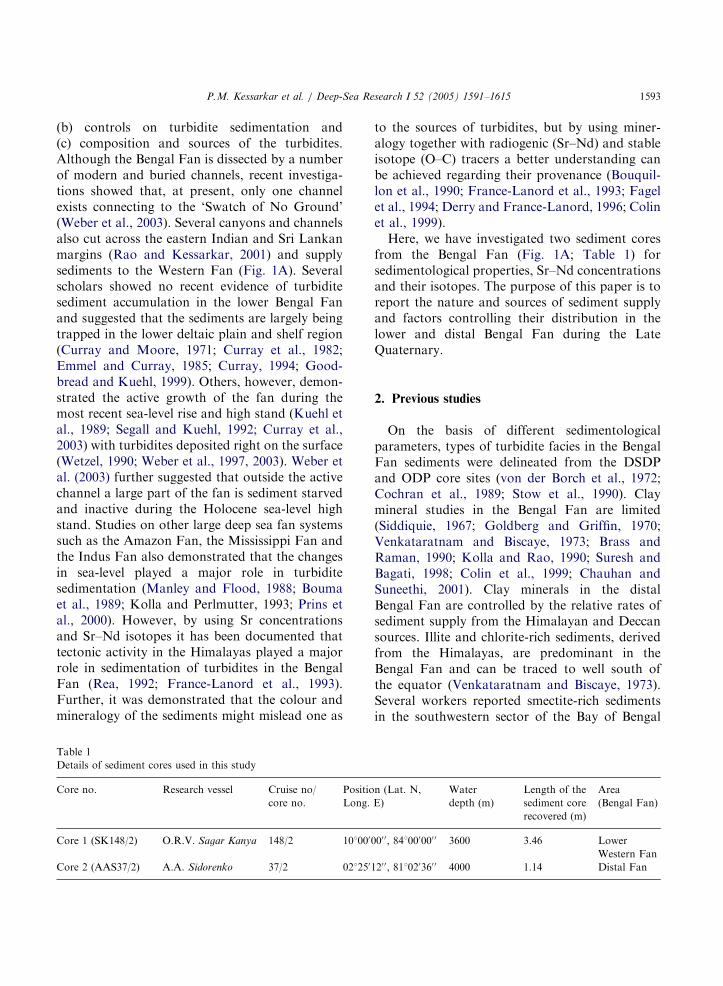
(b) controls on turbidite sedimentation and(c) composition and sources of the turbidites.Although the Bengal Fan is dissected by a numberof modern and buried channels, recent investiga-tions showed that, at present, only one channelexists connecting to the ‘Swatch of No Ground’(Weber et al., 2003). Several canyons and channelsalso cut across the eastern Indian and Sri Lankanmargins (Rao and Kessarkar, 2001) and supplysediments to the Western Fan (Fig. 1A). Severalscholars showed no recent evidence of turbiditesediment accumulation in the lower Bengal Fanand suggested that the sediments are largely beingtrapped in the lower deltaic plain and shelf region(Curray and Moore, 1971; Curray et al., 1982;Emmel and Curray, 1985; Curray, 1994; Good-bread and Kuehl, 1999). Others, however, demon-strated the active growth of the fan during themost recent sea-level rise and high stand (Kuehl etal., 1989; Segall and Kuehl, 1992; Curray et al.,2003) with turbidites deposited right on the surface(Wetzel, 1990; Weber et al., 1997, 2003). Weber etal. (2003) further suggested that outside the activechannel a large part of the fan is sediment starvedand inactive during the Holocene sea-level highstand. Studies on other large deep sea fan systemssuch as the Amazon Fan, the Mississippi Fan andthe Indus Fan also demonstrated that the changesin sea-level played a major role in turbiditesedimentation (Manley and Flood, 1988; Boumaet al., 1989; Kolla and Perlmutter, 1993; Prins etal., 2000). However, by using Sr concentrationsand Sr–Nd isotopes it has been documented thattectonic activity in the Himalayas played a majorrole in sedimentation of turbidites in the BengalFan (Rea, 1992; France-Lanord et al., 1993).Further, it was demonstrated that the colour andmineralogy of the sediments might mislead one as
Table 1
Details of sediment cores used in this study
Core no. Research vessel Cruise no/
core no.
Positio
Long.
Core 1 (SK148/2) O.R.V. Sagar Kanya 148/2 1010000
Core 2 (AAS37/2) A.A. Sidorenko 37/2 0212501
to the sources of turbidites, but by using miner-alogy together with radiogenic (Sr–Nd) and stableisotope (O–C) tracers a better understanding canbe achieved regarding their provenance (Bouquil-lon et al., 1990; France-Lanord et al., 1993; Fagelet al., 1994; Derry and France-Lanord, 1996; Colinet al., 1999).Here, we have investigated two sediment cores
from the Bengal Fan (Fig. 1A; Table 1) forsedimentological properties, Sr–Nd concentrationsand their isotopes. The purpose of this paper is toreport the nature and sources of sediment supplyand factors controlling their distribution in thelower and distal Bengal Fan during the LateQuaternary.
2. Previous studies
On the basis of different sedimentologicalparameters, types of turbidite facies in the BengalFan sediments were delineated from the DSDPand ODP core sites (von der Borch et al., 1972;Cochran et al., 1989; Stow et al., 1990). Claymineral studies in the Bengal Fan are limited(Siddiquie, 1967; Goldberg and Griffin, 1970;Venkataratnam and Biscaye, 1973; Brass andRaman, 1990; Kolla and Rao, 1990; Suresh andBagati, 1998; Colin et al., 1999; Chauhan andSuneethi, 2001). Clay minerals in the distalBengal Fan are controlled by the relative rates ofsediment supply from the Himalayan and Deccansources. Illite and chlorite-rich sediments, derivedfrom the Himalayas, are predominant in theBengal Fan and can be traced to well south ofthe equator (Venkataratnam and Biscaye, 1973).Several workers reported smectite-rich sedimentsin the southwestern sector of the Bay of Bengal
n (Lat. N,
E)
Water
depth (m)
Length of the
sediment core
recovered (m)
Area
(Bengal Fan)
00 0, 841000000 0 3600 3.46 Lower
Western Fan
20 0, 811020360 0 4000 1.14 Distal Fan
ARTICLE IN PRESS
P.M. Kessarkar et al. / Deep-Sea Research I 52 (2005) 1591–16151594
and kaolinite, illite and chlorite in the easternsector (Siddiquie, 1967; Goldberg and Griffin,1970; Venkataratnam and Biscaye, 1973). SomeDSDP and ODP cores (Stow et al., 1990) andShiva cores (Fagel et al., 1994, 1997) showedillite–chlorite (IC)-rich light grey sediments inter-layered with smectite–kaolinite (SK)-rich darkgrey sediments. Derry and France-Lanord (1996)subsequently demonstrated that the colour andmineralogy of the sediments might mislead as tothe provenance and suggested that the turbiditesrich in IC and SK clays were derived from thesame source rocks but had undergone differentalteration histories before reaching the BengalFan. Sediment traps also showed transport ofclays from the Indian peninsula to the fan region(Ramaswamy et al., 1997).The Sr–Nd isotopes of the turbidites revealed
precise sources of Fan sediment (McLennan et al.,1990; Bouquillon et al., 1990; Derry and France-Lanord, 1996). It has been suggested that thesource of the detrital sediment was essentiallyconstant since the Early Miocene and dominantlyHimalayan (Bouquillon et al., 1990; Derry andFrance-Lanord, 1996). Others proposed that asmall part of the particulate budget is from thenon-Himalayan component, such as the Indian orSri Lankan sub-continents. For example, Fagel etal. (1994, 1997) reported major Himalayansourced sediment with some contribution fromthe Chagos–Laccadive Ridge in the Central IndianBasin. Colin et al. (1999) suggested that thewestern part of the BOB sediments are essentiallyfrom the G–B River system, whereas the sedimentsin the eastern part are mixtures derived from theG–B River, the Irrawaddy River and the ArakanCoast. Pierson-Wickmann et al. (2001) showedgeographic dependence of Sr–Nd distribution,which reflects the source variations by sedimenttransport processes and location in the Bay ofBengal. The Sr isotopic ratios of the carbonatefraction from the Bay of Bengal sediments (Rea1992; Hohndorf et al., 2003) and Nd isotopes inthe sediments of the eastern Indian Ocean and itsrelation to the genesis of island arc volcanism (BenOthman et al., 1989) were also reported. TheSr–Nd of the particulate flux from the G–B Rivers(Sarin et al., 1989; Krishnaswamy et al., 1992;
Galy et al., 1999; Galy and France-Lanord, 2001),different Deccan Traps formations (Lightfoot etal., 1990), southern Indian (Peucat et al., 1989)and Sri Lankan formations (Milisenda et al., 1994)were reported.
3. Geological setting and oceanographic conditions
The G–B River system, draining the Himalayas,is the largest sediment source, discharging en-ormous quantities of suspended and bed load(�1.06 billion tons/yr; Milliman and Syvitski,1992) to the Bay of Bengal. It drains overPrecambrian formations in the upper reaches andRajmahal Traps and recent alluvium in the lowerreaches under cold climatic conditions (Fig. 1B).The peninsular rivers are full only during andimmediately after the SW monsoon (June toAugust) and bring largely the chemical weatheringproducts. The Mahanadi, Brahmani, Vamsadharaand Nagavali drain over khondalites, granulitesand charnockites of the Archean Eastern Ghatprovince (Fig. 1B). The Eastern Ghats are series ofdetached hills stretching intermittently from thenorthern border of Orissa through the coastalregions of the Andhra Pradesh and Tamil Nadu.Thick laterites and bauxites frequently cover thekhondalites in the Eastern Ghats. The Godavariand Krishna Rivers rise through the WesternGhats, drain Deccan Traps in the upper reachesand pass through the Eastern Ghats and Quatern-aries in the lower reaches (Krishnan, 1968). TheCauvery River also rises in the Western Ghats butdrains through unclassified crystallines and Qua-ternaries (Fig. 1B).The surface circulation in the Bay of Bengal is
controlled by seasonal variations in winds (Shetyeet al., 1993), where remotely forced coastallytrapped waves and Rossby waves crossing theinterior of the Bay are major contributors to theEast Indian Coastal Current (EICC) variability(McCreary et al., 1996). During the summer (SW)monsoon the EICC bifurcates and flows north-ward north of 101N and southwards off Sri Lanka(Eigenheer and Quadfasel, 2000). After the SWmonsoon, pockets of coastal upwelling occur incertain regions, and a plume of low-salinity waters
ARTICLE IN PRESS
P.M. Kessarkar et al. / Deep-Sea Research I 52 (2005) 1591–1615 1595
originating from the G–B River drift southward inthe offshore region (Shetye et al., 1991). Duringthe winter (NE) monsoon, the EICC begins to flowsouthwards along the east coast of India and SriLanka (Schott and McCreary, 2001) with a lowsalinity plume along the east coast (Shetye et al.,1996). The EICC also has southwestward flowingsubsurface flow along the Indian coast thatextends to depths greater than 1000m from Mayto July and later forms into a coastal undercurrent(McCreary et al., 1996).
4. Material and methods
Two sediment gravity cores (core 1 and 2)collected during the 148th cruise of O.R.V. Sagar
Kanya (SK148/2) and 37th cruise of A.A. Side-
renko (AAS37/2) at water depths 3600 and 4000m,respectively, from the western lower Bengal Fanand distal Bengal Fan (Fig. 1A; Table 1) were usedfor the present study. The sediments recovered areof 3.46m length in core 1 and 1.14m in core 2.Subsampling of sediment cores was done onboardat 2 cm intervals, and the colour of the sedimentwas noted. The CaCO3 content was determined byrapid gasometric technique, following Hulsemann(1966). Reproducibility of the measurements, aschecked by running replicates of samples, wasfound to be better than 75%. The acid-insolubleresidue (AIR) was calculated by subtracting thecarbonate percentage from the total. The organiccarbon (OC) and total nitrogen (TN) weredetermined on a CNS elemental analyser (NCS2500) (Tables 2A–B; Figs. 2A–B). The reproduci-bility of the OC measurements was found to bebetter than 71%. Coarse fraction constituentswere observed under binocular microscope (Tables2A–B). Bulk sediments (with and without carbo-nate) were also examined under a JEOL 5800 LVscanning electron microscope for biogenic consti-tuents. Grain size measurements were carried outon the carbonate- and organic-matter-free mudfraction (o63 mm size), with a Malvern laserparticle size analyzer (Master-Sizer 2000). Follow-ing Wentworth’s classification (Folk, 1968) themud fraction of the sediment was divided intodifferent size grades (Figs. 3A–B).
The o2 mm fraction of the sediment wasseparated by settling velocity principle and or-iented clay slides were prepared by pipetting 1mlclay solution onto glass slides and allowing themto dry in air. The remaining clay sample (o2 mmfraction) was dried, powdered and used for Sr–Ndisotope measurements. The air-dried and ethyleneglycol treated (at 100 1C for 1 h) clay slides werescanned from 21 to 221 2y at 11 2y/min on a PhilipsX-ray diffractometer using nickel-filtered Cu Karadiation. Slow scan X-ray diffraction from 241 to261 2y at 0.51 2y/min was also carried out foreach slide. Clay minerals were identified andquantified (Tables 2A–B; Figs. 4A–B), followingBiscaye (1965).Magnetic susceptibility (MS) was determined on
dried samples using a Bartington MS-2 magneticsusceptibility meter (with an AC magnetic fieldamplitude of 80A/m) linked to a MS2B dualfrequency sensor at the Indian Institute of Geo-magnetism (IIG), Alibagh, India. Low frequency,wlf , (0.47 kHz) and high frequency whf , (4.7 kHz)magnetic susceptibilities were measured on 0.1range for three times on each sample and theaverages of three measurements are presented asmass specific values in 10�8m3/kg SI units.Anhysteretic remanent magnetization (ARM)was imparted on the samples by superposing aDC biasing field of 0.05mT on a smoothlydecreasing alternating field with a peak of100mT. It is customary to express ARM as ananhysteretic susceptibility wARM (mass specificARM/strength of the biasing field). Isothermalremanent magnetization (IRM) acquisition wascarried out using a Molspin pulse magnetizer andremanences were measured by Molspin spinnermagnetometer. Saturation isothermal remanentmagnetization (SIRM) was imparted using amaximum field of 1 T. After acquisition of SIRM,the samples were subjected to reverse DC fields of0.3 T and the remanence was measured by usingthe Molspin magnetometer. The ratios of wARM/SIRM and wARM=wlf , S-ratio% and HIRM (hardIRM) were calculated by using the definitions ofRobinson (1986) and Bloemendal et al. (1992) (seeFigs. 5A–B).The carbonate-free sediments (eight samples
from each core) were treated with a mixture
ARTICLE IN PRESS
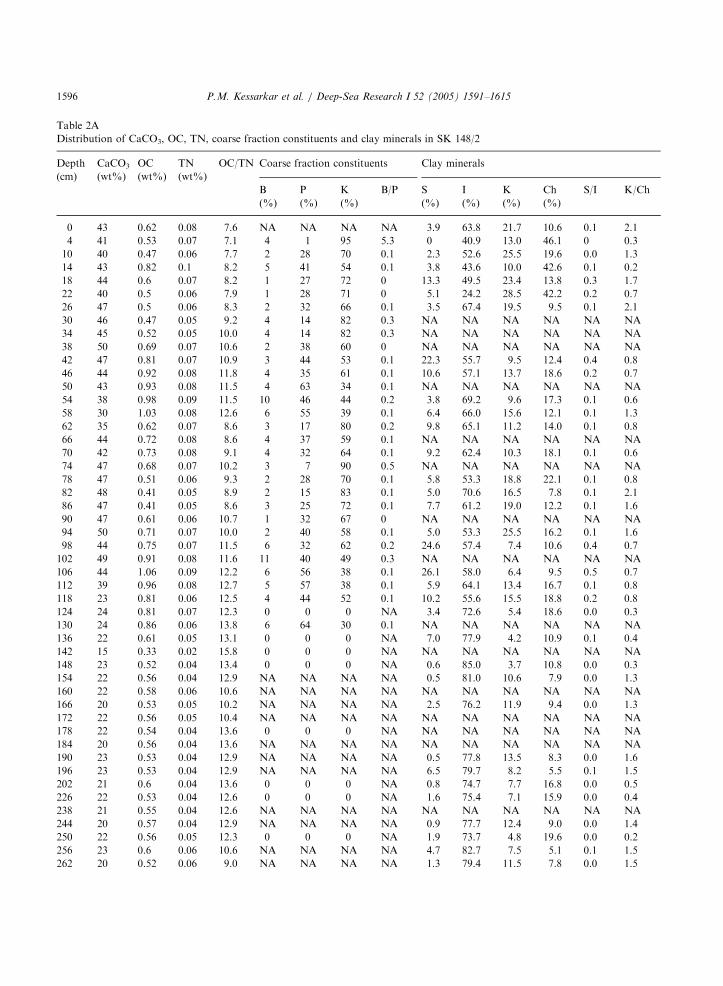
Table 2A
Distribution of CaCO3, OC, TN, coarse fraction constituents and clay minerals in SK 148/2
Depth
(cm)
CaCO3
(wt%)
OC
(wt%)
TN
(wt%)
OC/TN Coarse fraction constituents Clay minerals
B P K B/P S I K Ch S/I K/Ch
(%) (%) (%) (%) (%) (%) (%)
0 43 0.62 0.08 7.6 NA NA NA NA 3.9 63.8 21.7 10.6 0.1 2.1
4 41 0.53 0.07 7.1 4 1 95 5.3 0 40.9 13.0 46.1 0 0.3
10 40 0.47 0.06 7.7 2 28 70 0.1 2.3 52.6 25.5 19.6 0.0 1.3
14 43 0.82 0.1 8.2 5 41 54 0.1 3.8 43.6 10.0 42.6 0.1 0.2
18 44 0.6 0.07 8.2 1 27 72 0 13.3 49.5 23.4 13.8 0.3 1.7
22 40 0.5 0.06 7.9 1 28 71 0 5.1 24.2 28.5 42.2 0.2 0.7
26 47 0.5 0.06 8.3 2 32 66 0.1 3.5 67.4 19.5 9.5 0.1 2.1
30 46 0.47 0.05 9.2 4 14 82 0.3 NA NA NA NA NA NA
34 45 0.52 0.05 10.0 4 14 82 0.3 NA NA NA NA NA NA
38 50 0.69 0.07 10.6 2 38 60 0 NA NA NA NA NA NA
42 47 0.81 0.07 10.9 3 44 53 0.1 22.3 55.7 9.5 12.4 0.4 0.8
46 44 0.92 0.08 11.8 4 35 61 0.1 10.6 57.1 13.7 18.6 0.2 0.7
50 43 0.93 0.08 11.5 4 63 34 0.1 NA NA NA NA NA NA
54 38 0.98 0.09 11.5 10 46 44 0.2 3.8 69.2 9.6 17.3 0.1 0.6
58 30 1.03 0.08 12.6 6 55 39 0.1 6.4 66.0 15.6 12.1 0.1 1.3
62 35 0.62 0.07 8.6 3 17 80 0.2 9.8 65.1 11.2 14.0 0.1 0.8
66 44 0.72 0.08 8.6 4 37 59 0.1 NA NA NA NA NA NA
70 42 0.73 0.08 9.1 4 32 64 0.1 9.2 62.4 10.3 18.1 0.1 0.6
74 47 0.68 0.07 10.2 3 7 90 0.5 NA NA NA NA NA NA
78 47 0.51 0.06 9.3 2 28 70 0.1 5.8 53.3 18.8 22.1 0.1 0.8
82 48 0.41 0.05 8.9 2 15 83 0.1 5.0 70.6 16.5 7.8 0.1 2.1
86 47 0.41 0.05 8.6 3 25 72 0.1 7.7 61.2 19.0 12.2 0.1 1.6
90 47 0.61 0.06 10.7 1 32 67 0 NA NA NA NA NA NA
94 50 0.71 0.07 10.0 2 40 58 0.1 5.0 53.3 25.5 16.2 0.1 1.6
98 44 0.75 0.07 11.5 6 32 62 0.2 24.6 57.4 7.4 10.6 0.4 0.7
102 49 0.91 0.08 11.6 11 40 49 0.3 NA NA NA NA NA NA
106 44 1.06 0.09 12.2 6 56 38 0.1 26.1 58.0 6.4 9.5 0.5 0.7
112 39 0.96 0.08 12.7 5 57 38 0.1 5.9 64.1 13.4 16.7 0.1 0.8
118 23 0.81 0.06 12.5 4 44 52 0.1 10.2 55.6 15.5 18.8 0.2 0.8
124 24 0.81 0.07 12.3 0 0 0 NA 3.4 72.6 5.4 18.6 0.0 0.3
130 24 0.86 0.06 13.8 6 64 30 0.1 NA NA NA NA NA NA
136 22 0.61 0.05 13.1 0 0 0 NA 7.0 77.9 4.2 10.9 0.1 0.4
142 15 0.33 0.02 15.8 0 0 0 NA NA NA NA NA NA NA
148 23 0.52 0.04 13.4 0 0 0 NA 0.6 85.0 3.7 10.8 0.0 0.3
154 22 0.56 0.04 12.9 NA NA NA NA 0.5 81.0 10.6 7.9 0.0 1.3
160 22 0.58 0.06 10.6 NA NA NA NA NA NA NA NA NA NA
166 20 0.53 0.05 10.2 NA NA NA NA 2.5 76.2 11.9 9.4 0.0 1.3
172 22 0.56 0.05 10.4 NA NA NA NA NA NA NA NA NA NA
178 22 0.54 0.04 13.6 0 0 0 NA NA NA NA NA NA NA
184 20 0.56 0.04 13.6 NA NA NA NA NA NA NA NA NA NA
190 23 0.53 0.04 12.9 NA NA NA NA 0.5 77.8 13.5 8.3 0.0 1.6
196 23 0.53 0.04 12.9 NA NA NA NA 6.5 79.7 8.2 5.5 0.1 1.5
202 21 0.6 0.04 13.6 0 0 0 NA 0.8 74.7 7.7 16.8 0.0 0.5
226 22 0.53 0.04 12.6 0 0 0 NA 1.6 75.4 7.1 15.9 0.0 0.4
238 21 0.55 0.04 12.6 NA NA NA NA NA NA NA NA NA NA
244 20 0.57 0.04 12.9 NA NA NA NA 0.9 77.7 12.4 9.0 0.0 1.4
250 22 0.56 0.05 12.3 0 0 0 NA 1.9 73.7 4.8 19.6 0.0 0.2
256 23 0.6 0.06 10.6 NA NA NA NA 4.7 82.7 7.5 5.1 0.1 1.5
262 20 0.52 0.06 9.0 NA NA NA NA 1.3 79.4 11.5 7.8 0.0 1.5
P.M. Kessarkar et al. / Deep-Sea Research I 52 (2005) 1591–16151596
ARTICLE IN PRESS
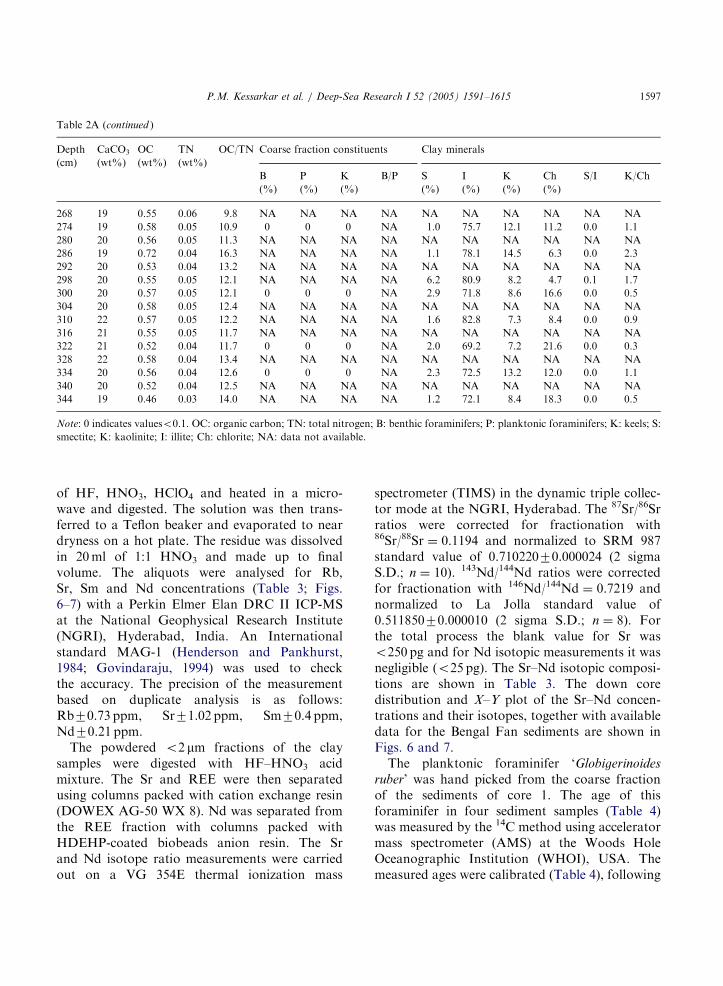
Table 2A (continued )
Depth
(cm)
CaCO3
(wt%)
OC
(wt%)
TN
(wt%)
OC/TN Coarse fraction constituents Clay minerals
B P K B/P S I K Ch S/I K/Ch
(%) (%) (%) (%) (%) (%) (%)
268 19 0.55 0.06 9.8 NA NA NA NA NA NA NA NA NA NA
274 19 0.58 0.05 10.9 0 0 0 NA 1.0 75.7 12.1 11.2 0.0 1.1
280 20 0.56 0.05 11.3 NA NA NA NA NA NA NA NA NA NA
286 19 0.72 0.04 16.3 NA NA NA NA 1.1 78.1 14.5 6.3 0.0 2.3
292 20 0.53 0.04 13.2 NA NA NA NA NA NA NA NA NA NA
298 20 0.55 0.05 12.1 NA NA NA NA 6.2 80.9 8.2 4.7 0.1 1.7
300 20 0.57 0.05 12.1 0 0 0 NA 2.9 71.8 8.6 16.6 0.0 0.5
304 20 0.58 0.05 12.4 NA NA NA NA NA NA NA NA NA NA
310 22 0.57 0.05 12.2 NA NA NA NA 1.6 82.8 7.3 8.4 0.0 0.9
316 21 0.55 0.05 11.7 NA NA NA NA NA NA NA NA NA NA
322 21 0.52 0.04 11.7 0 0 0 NA 2.0 69.2 7.2 21.6 0.0 0.3
328 22 0.58 0.04 13.4 NA NA NA NA NA NA NA NA NA NA
334 20 0.56 0.04 12.6 0 0 0 NA 2.3 72.5 13.2 12.0 0.0 1.1
340 20 0.52 0.04 12.5 NA NA NA NA NA NA NA NA NA NA
344 19 0.46 0.03 14.0 NA NA NA NA 1.2 72.1 8.4 18.3 0.0 0.5
Note: 0 indicates valueso0.1. OC: organic carbon; TN: total nitrogen; B: benthic foraminifers; P: planktonic foraminifers; K: keels; S:
smectite; K: kaolinite; I: illite; Ch: chlorite; NA: data not available.
P.M. Kessarkar et al. / Deep-Sea Research I 52 (2005) 1591–1615 1597
of HF, HNO3, HClO4 and heated in a micro-wave and digested. The solution was then trans-ferred to a Teflon beaker and evaporated to neardryness on a hot plate. The residue was dissolvedin 20ml of 1:1 HNO3 and made up to finalvolume. The aliquots were analysed for Rb,Sr, Sm and Nd concentrations (Table 3; Figs.6–7) with a Perkin Elmer Elan DRC II ICP-MSat the National Geophysical Research Institute(NGRI), Hyderabad, India. An Internationalstandard MAG-1 (Henderson and Pankhurst,1984; Govindaraju, 1994) was used to checkthe accuracy. The precision of the measurementbased on duplicate analysis is as follows:Rb70.73 ppm, Sr71.02 ppm, Sm70.4 ppm,Nd70.21 ppm.The powdered o2 mm fractions of the clay
samples were digested with HF–HNO3 acidmixture. The Sr and REE were then separatedusing columns packed with cation exchange resin(DOWEX AG-50 WX 8). Nd was separated fromthe REE fraction with columns packed withHDEHP-coated biobeads anion resin. The Srand Nd isotope ratio measurements were carriedout on a VG 354E thermal ionization mass
spectrometer (TIMS) in the dynamic triple collec-tor mode at the NGRI, Hyderabad. The 87Sr/86Srratios were corrected for fractionation with86Sr/88Sr ¼ 0.1194 and normalized to SRM 987standard value of 0.71022070.000024 (2 sigmaS.D.; n ¼ 10). 143Nd/144Nd ratios were correctedfor fractionation with 146Nd/144Nd ¼ 0.7219 andnormalized to La Jolla standard value of0.51185070.000010 (2 sigma S.D.; n ¼ 8). Forthe total process the blank value for Sr waso250 pg and for Nd isotopic measurements it wasnegligible (o25 pg). The Sr–Nd isotopic composi-tions are shown in Table 3. The down coredistribution and X–Y plot of the Sr–Nd concen-trations and their isotopes, together with availabledata for the Bengal Fan sediments are shown inFigs. 6 and 7.The planktonic foraminifer ‘Globigerinoides
ruber’ was hand picked from the coarse fractionof the sediments of core 1. The age of thisforaminifer in four sediment samples (Table 4)was measured by the 14C method using acceleratormass spectrometer (AMS) at the Woods HoleOceanographic Institution (WHOI), USA. Themeasured ages were calibrated (Table 4), following
ARTICLE IN PRESS
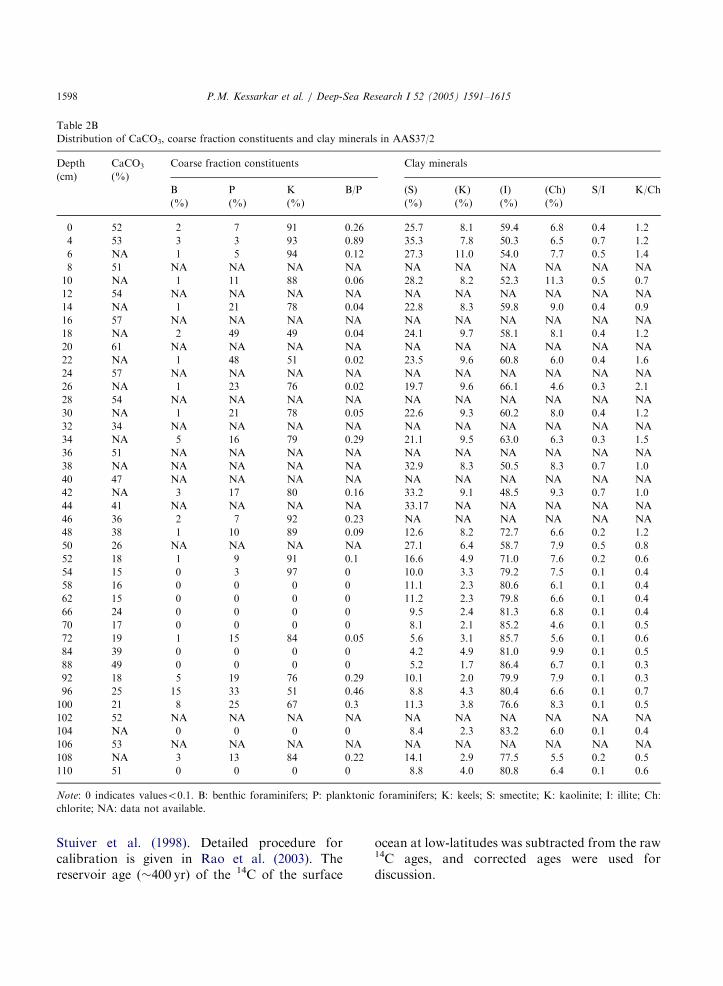
Table 2B
Distribution of CaCO3, coarse fraction constituents and clay minerals in AAS37/2
Depth
(cm)
CaCO3
(%)
Coarse fraction constituents Clay minerals
B P K B/P (S) (K) (I) (Ch) S/I K/Ch
(%) (%) (%) (%) (%) (%) (%)
0 52 2 7 91 0.26 25.7 8.1 59.4 6.8 0.4 1.2
4 53 3 3 93 0.89 35.3 7.8 50.3 6.5 0.7 1.2
6 NA 1 5 94 0.12 27.3 11.0 54.0 7.7 0.5 1.4
8 51 NA NA NA NA NA NA NA NA NA NA
10 NA 1 11 88 0.06 28.2 8.2 52.3 11.3 0.5 0.7
12 54 NA NA NA NA NA NA NA NA NA NA
14 NA 1 21 78 0.04 22.8 8.3 59.8 9.0 0.4 0.9
16 57 NA NA NA NA NA NA NA NA NA NA
18 NA 2 49 49 0.04 24.1 9.7 58.1 8.1 0.4 1.2
20 61 NA NA NA NA NA NA NA NA NA NA
22 NA 1 48 51 0.02 23.5 9.6 60.8 6.0 0.4 1.6
24 57 NA NA NA NA NA NA NA NA NA NA
26 NA 1 23 76 0.02 19.7 9.6 66.1 4.6 0.3 2.1
28 54 NA NA NA NA NA NA NA NA NA NA
30 NA 1 21 78 0.05 22.6 9.3 60.2 8.0 0.4 1.2
32 34 NA NA NA NA NA NA NA NA NA NA
34 NA 5 16 79 0.29 21.1 9.5 63.0 6.3 0.3 1.5
36 51 NA NA NA NA NA NA NA NA NA NA
38 NA NA NA NA NA 32.9 8.3 50.5 8.3 0.7 1.0
40 47 NA NA NA NA NA NA NA NA NA NA
42 NA 3 17 80 0.16 33.2 9.1 48.5 9.3 0.7 1.0
44 41 NA NA NA NA 33.17 NA NA NA NA NA
46 36 2 7 92 0.23 NA NA NA NA NA NA
48 38 1 10 89 0.09 12.6 8.2 72.7 6.6 0.2 1.2
50 26 NA NA NA NA 27.1 6.4 58.7 7.9 0.5 0.8
52 18 1 9 91 0.1 16.6 4.9 71.0 7.6 0.2 0.6
54 15 0 3 97 0 10.0 3.3 79.2 7.5 0.1 0.4
58 16 0 0 0 0 11.1 2.3 80.6 6.1 0.1 0.4
62 15 0 0 0 0 11.2 2.3 79.8 6.6 0.1 0.4
66 24 0 0 0 0 9.5 2.4 81.3 6.8 0.1 0.4
70 17 0 0 0 0 8.1 2.1 85.2 4.6 0.1 0.5
72 19 1 15 84 0.05 5.6 3.1 85.7 5.6 0.1 0.6
84 39 0 0 0 0 4.2 4.9 81.0 9.9 0.1 0.5
88 49 0 0 0 0 5.2 1.7 86.4 6.7 0.1 0.3
92 18 5 19 76 0.29 10.1 2.0 79.9 7.9 0.1 0.3
96 25 15 33 51 0.46 8.8 4.3 80.4 6.6 0.1 0.7
100 21 8 25 67 0.3 11.3 3.8 76.6 8.3 0.1 0.5
102 52 NA NA NA NA NA NA NA NA NA NA
104 NA 0 0 0 0 8.4 2.3 83.2 6.0 0.1 0.4
106 53 NA NA NA NA NA NA NA NA NA NA
108 NA 3 13 84 0.22 14.1 2.9 77.5 5.5 0.2 0.5
110 51 0 0 0 0 8.8 4.0 80.8 6.4 0.1 0.6
Note: 0 indicates valueso0.1. B: benthic foraminifers; P: planktonic foraminifers; K: keels; S: smectite; K: kaolinite; I: illite; Ch:
chlorite; NA: data not available.
P.M. Kessarkar et al. / Deep-Sea Research I 52 (2005) 1591–16151598
Stuiver et al. (1998). Detailed procedure forcalibration is given in Rao et al. (2003). Thereservoir age (�400 yr) of the 14C of the surface
ocean at low-latitudes was subtracted from the raw14C ages, and corrected ages were used fordiscussion.
ARTICLE IN PRESS
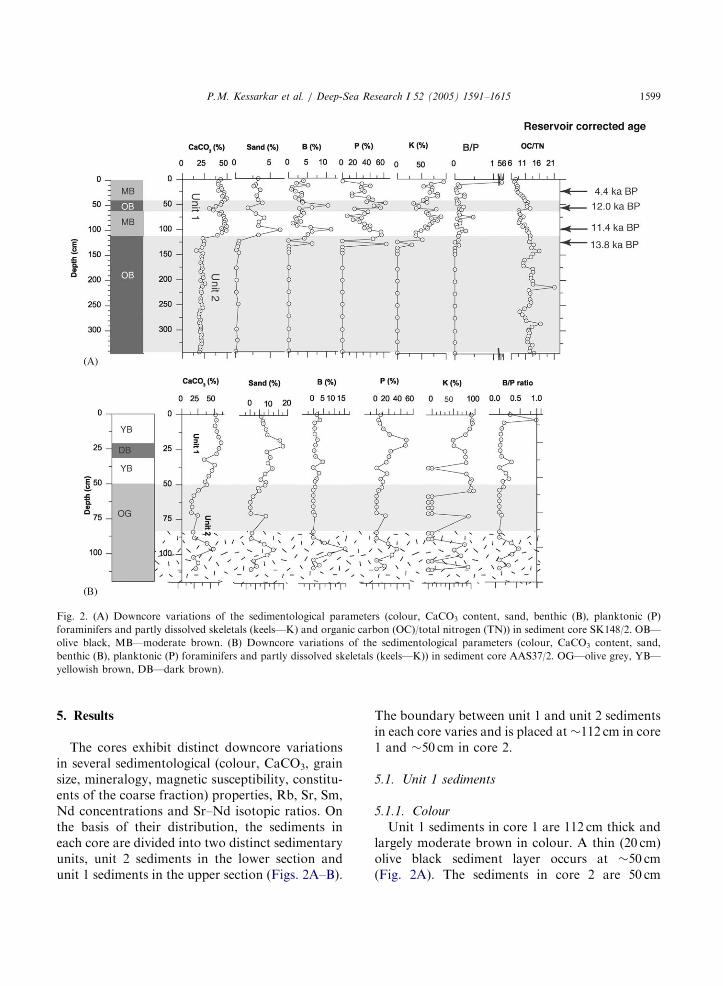
Fig. 2. (A) Downcore variations of the sedimentological parameters (colour, CaCO3 content, sand, benthic (B), planktonic (P)
foraminifers and partly dissolved skeletals (keels—K) and organic carbon (OC)/total nitrogen (TN)) in sediment core SK148/2. OB—
olive black, MB—moderate brown. (B) Downcore variations of the sedimentological parameters (colour, CaCO3 content, sand,
benthic (B), planktonic (P) foraminifers and partly dissolved skeletals (keels—K)) in sediment core AAS37/2. OG—olive grey, YB—
yellowish brown, DB—dark brown).
P.M. Kessarkar et al. / Deep-Sea Research I 52 (2005) 1591–1615 1599
5. Results
The cores exhibit distinct downcore variationsin several sedimentological (colour, CaCO3, grainsize, mineralogy, magnetic susceptibility, constitu-ents of the coarse fraction) properties, Rb, Sr, Sm,Nd concentrations and Sr–Nd isotopic ratios. Onthe basis of their distribution, the sediments ineach core are divided into two distinct sedimentaryunits, unit 2 sediments in the lower section andunit 1 sediments in the upper section (Figs. 2A–B).
The boundary between unit 1 and unit 2 sedimentsin each core varies and is placed at�112 cm in core1 and �50 cm in core 2.
5.1. Unit 1 sediments
5.1.1. Colour
Unit 1 sediments in core 1 are 112 cm thick andlargely moderate brown in colour. A thin (20 cm)olive black sediment layer occurs at �50 cm(Fig. 2A). The sediments in core 2 are 50 cm
ARTICLE IN PRESS
4.4 ka BP
12.0 ka BP
11.4 ka BP
13.8 ka BP
0.1 1 10 100 0
5
Vol
ume
(%)
0.1 1 10 100 0
2 4 6
Vol
ume
(%)
Particle Size (µm)
Particle Size (µm)
Aa
Ab
Reservoir corrected age
0.1 1 10 60 0
5
Vol
ume
(%)
0.1 1 10 60
Particle Size (µm)
0
5
Vol
ume
(%)
Particle Size (µm)
Ba
Bb
(A)
(B)
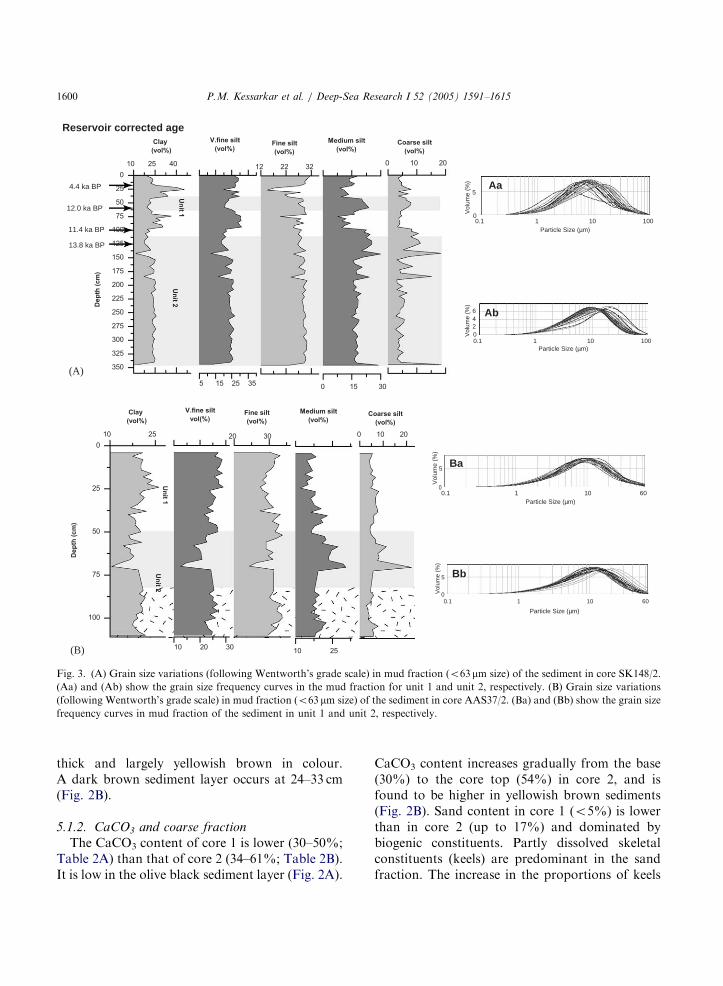
Fig. 3. (A) Grain size variations (following Wentworth’s grade scale) in mud fraction (o63 mm size) of the sediment in core SK148/2.
(Aa) and (Ab) show the grain size frequency curves in the mud fraction for unit 1 and unit 2, respectively. (B) Grain size variations
(following Wentworth’s grade scale) in mud fraction (o63 mm size) of the sediment in core AAS37/2. (Ba) and (Bb) show the grain size
frequency curves in mud fraction of the sediment in unit 1 and unit 2, respectively.
P.M. Kessarkar et al. / Deep-Sea Research I 52 (2005) 1591–16151600
thick and largely yellowish brown in colour.A dark brown sediment layer occurs at 24–33 cm(Fig. 2B).
5.1.2. CaCO3 and coarse fraction
The CaCO3 content of core 1 is lower (30–50%;Table 2A) than that of core 2 (34–61%; Table 2B).It is low in the olive black sediment layer (Fig. 2A).
CaCO3 content increases gradually from the base(30%) to the core top (54%) in core 2, and isfound to be higher in yellowish brown sediments(Fig. 2B). Sand content in core 1 (o5%) is lowerthan in core 2 (up to 17%) and dominated bybiogenic constituents. Partly dissolved skeletalconstituents (keels) are predominant in the sandfraction. The increase in the proportions of keels
ARTICLE IN PRESS
3°10°20°2θ
SI
K+ChI
154-156 cm
196-198 cm
250-252 cm
298-300 cm
18-20 cm
54-56 cm
42-44 cm
106-108 cm
(A)Aa
4.4 ka BP
12.0 ka BP
11.4 ka BP
13.8 ka BP
Reservoir corrected age
3°10°20°
3°10°20°
0-4cm
24-26 cm
42-48cm
62-64cm
88-90cm
108-110cm
S
S
I
I
I
IK+Ch
K+C
Ch
Ch
2θ
2θ
Ba(B)
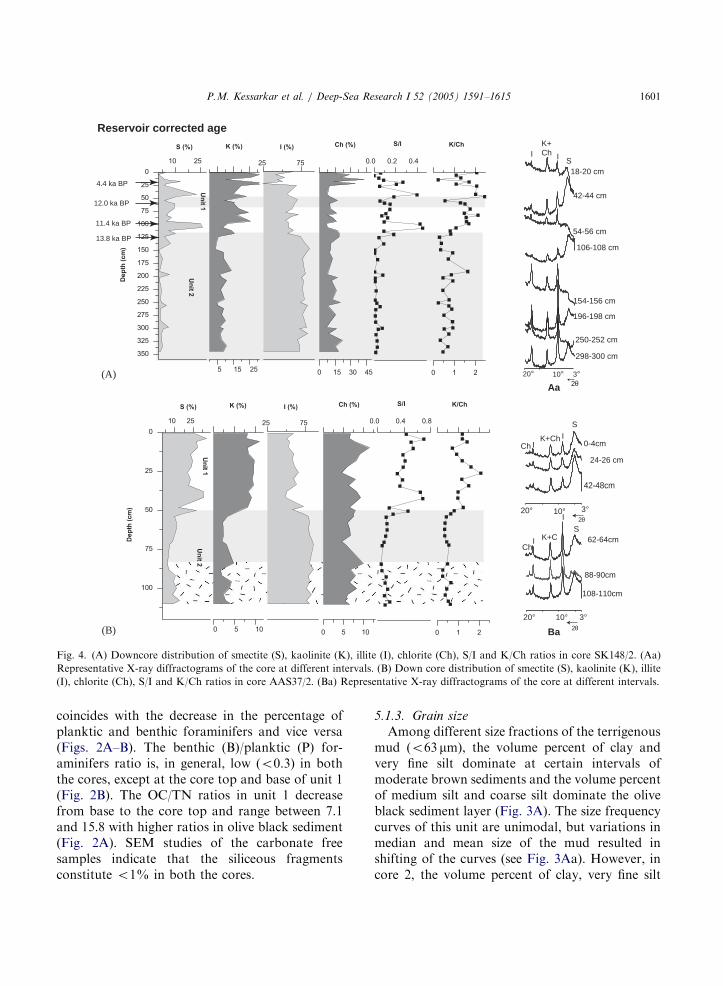
Fig. 4. (A) Downcore distribution of smectite (S), kaolinite (K), illite (I), chlorite (Ch), S/I and K/Ch ratios in core SK148/2. (Aa)
Representative X-ray diffractograms of the core at different intervals. (B) Down core distribution of smectite (S), kaolinite (K), illite
(I), chlorite (Ch), S/I and K/Ch ratios in core AAS37/2. (Ba) Representative X-ray diffractograms of the core at different intervals.
P.M. Kessarkar et al. / Deep-Sea Research I 52 (2005) 1591–1615 1601
coincides with the decrease in the percentage ofplanktic and benthic foraminifers and vice versa(Figs. 2A–B). The benthic (B)/planktic (P) for-aminifers ratio is, in general, low (o0.3) in boththe cores, except at the core top and base of unit 1(Fig. 2B). The OC/TN ratios in unit 1 decreasefrom base to the core top and range between 7.1and 15.8 with higher ratios in olive black sediment(Fig. 2A). SEM studies of the carbonate freesamples indicate that the siliceous fragmentsconstitute o1% in both the cores.
5.1.3. Grain size
Among different size fractions of the terrigenousmud (o63 mm), the volume percent of clay andvery fine silt dominate at certain intervals ofmoderate brown sediments and the volume percentof medium silt and coarse silt dominate the oliveblack sediment layer (Fig. 3A). The size frequencycurves of this unit are unimodal, but variations inmedian and mean size of the mud resulted inshifting of the curves (see Fig. 3Aa). However, incore 2, the volume percent of clay, very fine silt
ARTICLE IN PRESS
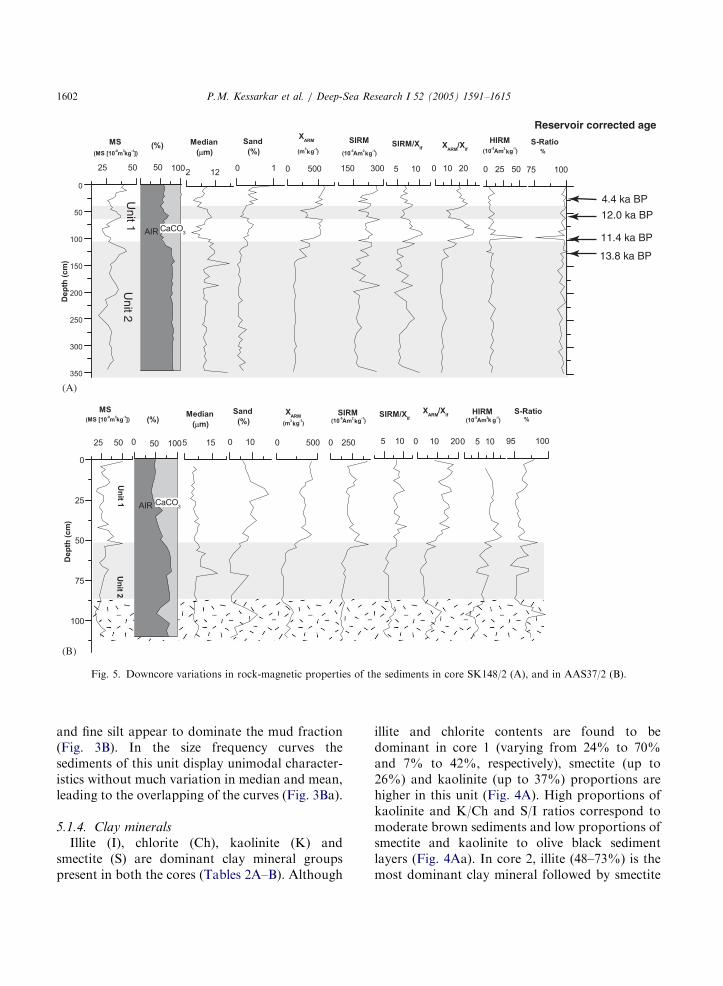
Fig. 5. Downcore variations in rock-magnetic properties of the sediments in core SK148/2 (A), and in AAS37/2 (B).
P.M. Kessarkar et al. / Deep-Sea Research I 52 (2005) 1591–16151602
and fine silt appear to dominate the mud fraction(Fig. 3B). In the size frequency curves thesediments of this unit display unimodal character-istics without much variation in median and mean,leading to the overlapping of the curves (Fig. 3Ba).
5.1.4. Clay minerals
Illite (I), chlorite (Ch), kaolinite (K) andsmectite (S) are dominant clay mineral groupspresent in both the cores (Tables 2A–B). Although
illite and chlorite contents are found to bedominant in core 1 (varying from 24% to 70%and 7% to 42%, respectively), smectite (up to26%) and kaolinite (up to 37%) proportions arehigher in this unit (Fig. 4A). High proportions ofkaolinite and K/Ch and S/I ratios correspond tomoderate brown sediments and low proportions ofsmectite and kaolinite to olive black sedimentlayers (Fig. 4Aa). In core 2, illite (48–73%) is themost dominant clay mineral followed by smectite
ARTICLE IN PRESS
Table 3
The Rb, Sr, Sm and Nd concentrations in bulk samples and Sr–Nd isotopes ofo2mm fraction of the sediment at different intervals of
cores 1 and 2
Depth (cm) Rb (ppm) Sr (ppm) Sm (ppm) Nd (ppm) 87Sr/86Sr 143Nd/144Nd �Nd
Core 1 (SK148/2)
Unit 1 10 NA NA NA NA 0.730072 NA NA
14 98.41 99.28 2.72 11.36 NA 0.511709 �18.12
18 NA NA NA NA 0.726283 NA NA
30 110.00 125.92 3.69 16.00 NA 0.511499 �22.2
54 NA NA NA NA 0.727143 NA NA
66 104.89 96.43 2.75 12.63 0.726985 0.511504 �22.12
106 113.10 117.77 3.41 14.58 NA 0.511614 �19.98
Unit 2 142 172.86 118.88 5.39 27.71 0.734977 0.511798 �16.39
202 195.74 112.27 5.41 29.20 0.734851 0.511875 �14.88
274 213.56 111.10 5.39 NA 0.735052 0.511756 �17.21
300 190.53 119.83 5.43 NA 0.734719 NA NA
Core 2 (AAS37/2)
Unit 1 2 129.89 114.52 3.78 16.68 0.722563 0.511827 �15.82
22 118.94 122.04 3.73 17.43 0.716956 0.511889 �14.61
34 119.66 130.15 3.75 16.05 0.717330 NA NA
50 151.22 100.75 4.00 19.71 0.722452 NA NA
Unit 2 62 174.86 103.36 4.81 26.11 0.734091 NA NA
72 174.91 111.01 5.17 NA 0.733363 0.511928 �13.85
84 176.81 111.19 5.05 26.14 0.725971 NA NA
100 179.26 109.71 4.52 NA 0.726036 0.511958 �13.26
NA: data not available.
P.M. Kessarkar et al. / Deep-Sea Research I 52 (2005) 1591–1615 1603
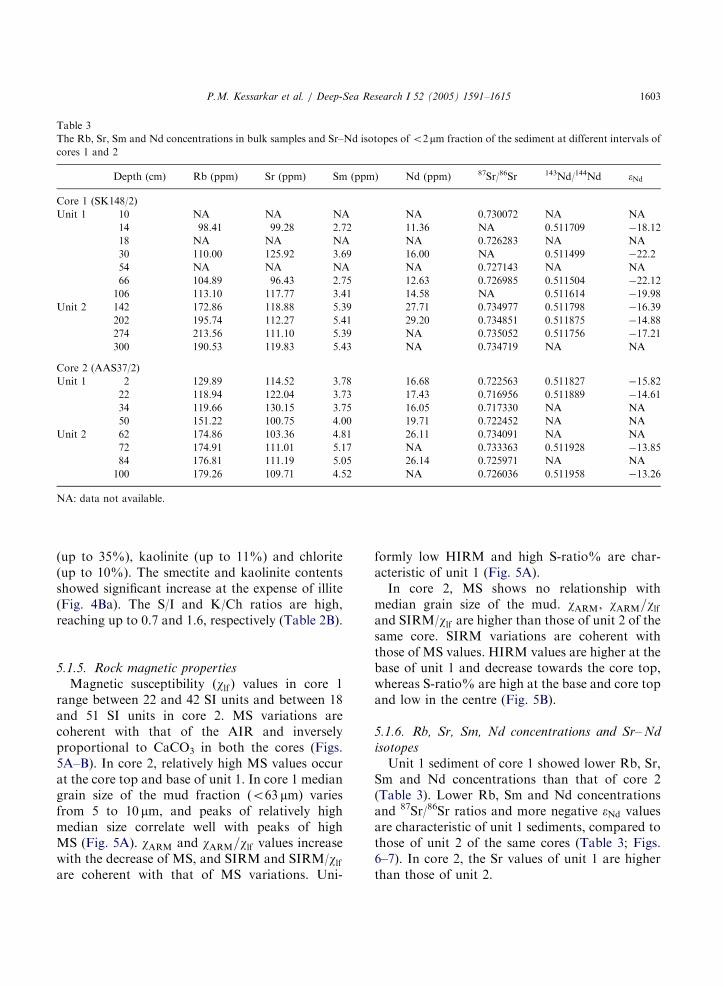
(up to 35%), kaolinite (up to 11%) and chlorite(up to 10%). The smectite and kaolinite contentsshowed significant increase at the expense of illite(Fig. 4Ba). The S/I and K/Ch ratios are high,reaching up to 0.7 and 1.6, respectively (Table 2B).
5.1.5. Rock magnetic properties
Magnetic susceptibility (wlf ) values in core 1range between 22 and 42 SI units and between 18and 51 SI units in core 2. MS variations arecoherent with that of the AIR and inverselyproportional to CaCO3 in both the cores (Figs.5A–B). In core 2, relatively high MS values occurat the core top and base of unit 1. In core 1 mediangrain size of the mud fraction (o63 mm) variesfrom 5 to 10 mm, and peaks of relatively highmedian size correlate well with peaks of highMS (Fig. 5A). wARM and wARM=wlf values increasewith the decrease of MS, and SIRM and SIRM/wlfare coherent with that of MS variations. Uni-
formly low HIRM and high S-ratio% are char-acteristic of unit 1 (Fig. 5A).In core 2, MS shows no relationship with
median grain size of the mud. wARM, wARM=wlfand SIRM/wlf are higher than those of unit 2 of thesame core. SIRM variations are coherent withthose of MS values. HIRM values are higher at thebase of unit 1 and decrease towards the core top,whereas S-ratio% are high at the base and core topand low in the centre (Fig. 5B).
5.1.6. Rb, Sr, Sm, Nd concentrations and Sr– Nd
isotopes
Unit 1 sediment of core 1 showed lower Rb, Sr,Sm and Nd concentrations than that of core 2(Table 3). Lower Rb, Sm and Nd concentrationsand 87Sr/86Sr ratios and more negative �Nd valuesare characteristic of unit 1 sediments, compared tothose of unit 2 of the same cores (Table 3; Figs.6–7). In core 2, the Sr values of unit 1 are higherthan those of unit 2.
ARTICLE IN PRESS
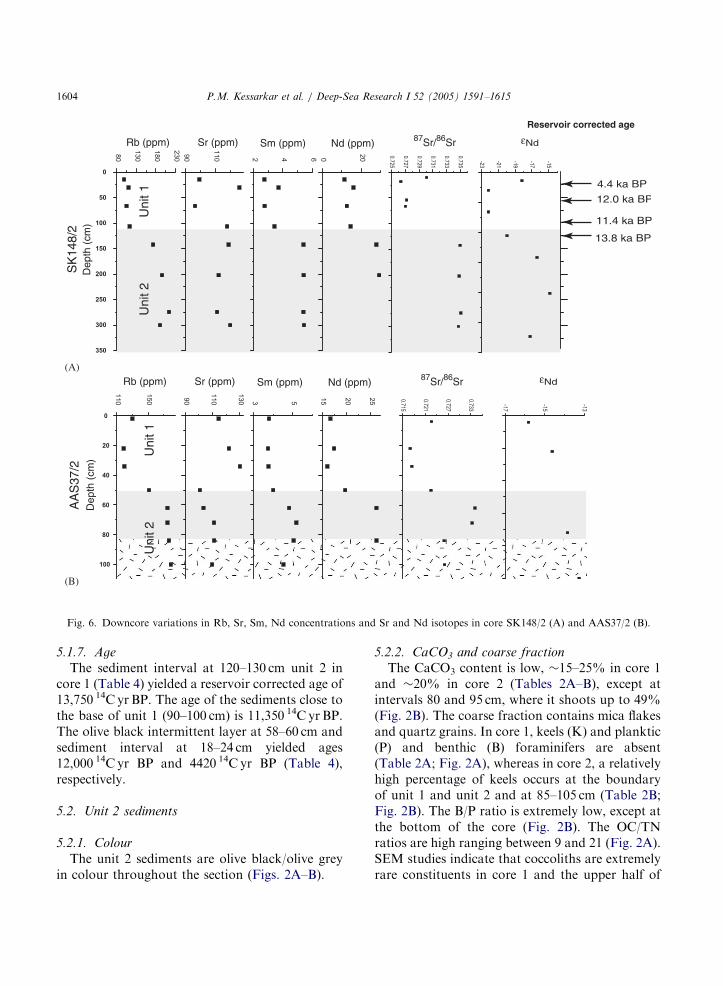
Fig. 6. Downcore variations in Rb, Sr, Sm, Nd concentrations and Sr and Nd isotopes in core SK148/2 (A) and AAS37/2 (B).
P.M. Kessarkar et al. / Deep-Sea Research I 52 (2005) 1591–16151604
5.1.7. Age
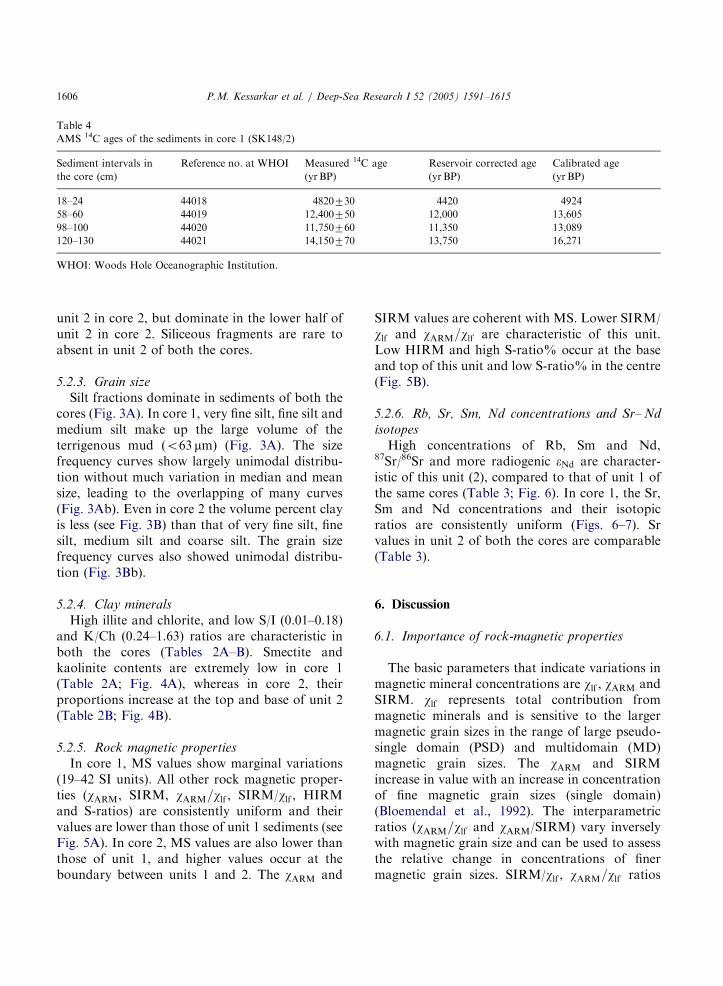
The sediment interval at 120–130 cm unit 2 incore 1 (Table 4) yielded a reservoir corrected age of13,750 14C yrBP. The age of the sediments close tothe base of unit 1 (90–100 cm) is 11,350 14C yrBP.The olive black intermittent layer at 58–60 cm andsediment interval at 18–24 cm yielded ages12,000 14C yr BP and 4420 14C yr BP (Table 4),respectively.
5.2. Unit 2 sediments
5.2.1. Colour
The unit 2 sediments are olive black/olive greyin colour throughout the section (Figs. 2A–B).
5.2.2. CaCO3 and coarse fraction
The CaCO3 content is low, �15–25% in core 1and �20% in core 2 (Tables 2A–B), except atintervals 80 and 95 cm, where it shoots up to 49%(Fig. 2B). The coarse fraction contains mica flakesand quartz grains. In core 1, keels (K) and planktic(P) and benthic (B) foraminifers are absent(Table 2A; Fig. 2A), whereas in core 2, a relativelyhigh percentage of keels occurs at the boundaryof unit 1 and unit 2 and at 85–105 cm (Table 2B;Fig. 2B). The B/P ratio is extremely low, except atthe bottom of the core (Fig. 2B). The OC/TNratios are high ranging between 9 and 21 (Fig. 2A).SEM studies indicate that coccoliths are extremelyrare constituents in core 1 and the upper half of
ARTICLE IN PRESS
P (6,7)
P (6)
ε Nd
Himalayan source H (4)
Himalayan source H (3)
P (3)
P (2)
P (1)
Mixed SourceHimalaya + India+ Srilanka H (2)
Mixed SourceHimalaya + IBR+ Irrawaddy H (3)
Upper & Middle Fan
ODP Cores
CIOBP (5)ODP Cores
Unit 1
Unit 1
Unit 1
ODP Cores
CIOB
West Fan
North Fan
North Fan
North Fan
East Fan
North Fan West Fan Mixed SourceHimalaya + India+ Srilanka (3,4)
Himalayan source
Mixed SourceHimalaya + India+ Srilanka (1, 2)
(3,4)
Holocene Sediments
Mixed SourceHimalaya + India+ Srilanka H (3,4)
Mixed Source Himalaya + India , Unit 1 H ( 1)
Bouquillon et al., 1990Fagel et al., 1994 and 1997
Core 1(SK148/2) Core 2 (AAS37/2)Colin et al., 1999Pierson-Wickmann et al., 2001
1P - PleistoceneH - HoloceneCIOB- Central Indian Ocean Basin
234567 ODP cores Leg 116 (France-Lanord et al., 1993 and Derry and France-Lanord, 1996)
-------
Unit 2
Unit 2
IBR - Indo Burman Ranges
Unit 2
Himalayan source
Himalayan source (6)
Himalayan source (5)
(3,4)
Himalayan source (1,2)
Pleistocene Sediments
(A) (B)
(C)
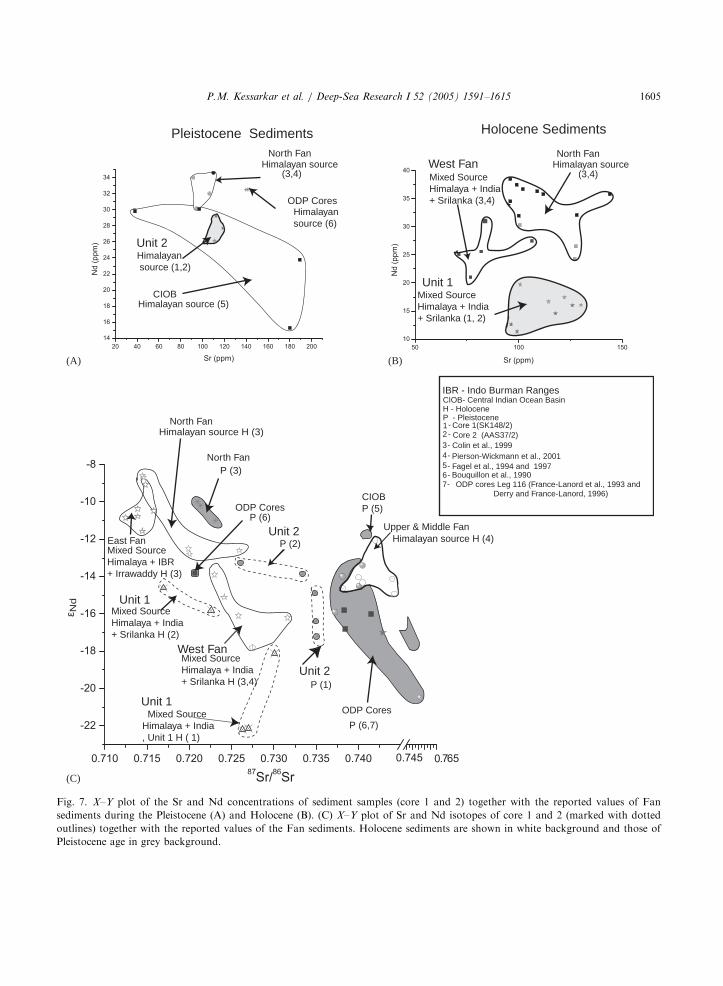
Fig. 7. X–Y plot of the Sr and Nd concentrations of sediment samples (core 1 and 2) together with the reported values of Fan
sediments during the Pleistocene (A) and Holocene (B). (C) X–Y plot of Sr and Nd isotopes of core 1 and 2 (marked with dotted
outlines) together with the reported values of the Fan sediments. Holocene sediments are shown in white background and those of
Pleistocene age in grey background.
P.M. Kessarkar et al. / Deep-Sea Research I 52 (2005) 1591–1615 1605
ARTICLE IN PRESS
Table 4
AMS 14C ages of the sediments in core 1 (SK148/2)
Sediment intervals in
the core (cm)
Reference no. at WHOI Measured 14C age
(yrBP)
Reservoir corrected age
(yr BP)
Calibrated age
(yr BP)
18–24 44018 4820730 4420 4924
58–60 44019 12,400750 12,000 13,605
98–100 44020 11,750760 11,350 13,089
120–130 44021 14,150770 13,750 16,271
WHOI: Woods Hole Oceanographic Institution.
P.M. Kessarkar et al. / Deep-Sea Research I 52 (2005) 1591–16151606
unit 2 in core 2, but dominate in the lower half ofunit 2 in core 2. Siliceous fragments are rare toabsent in unit 2 of both the cores.
5.2.3. Grain size
Silt fractions dominate in sediments of both thecores (Fig. 3A). In core 1, very fine silt, fine silt andmedium silt make up the large volume of theterrigenous mud (o63 mm) (Fig. 3A). The sizefrequency curves show largely unimodal distribu-tion without much variation in median and meansize, leading to the overlapping of many curves(Fig. 3Ab). Even in core 2 the volume percent clayis less (see Fig. 3B) than that of very fine silt, finesilt, medium silt and coarse silt. The grain sizefrequency curves also showed unimodal distribu-tion (Fig. 3Bb).
5.2.4. Clay minerals
High illite and chlorite, and low S/I (0.01–0.18)and K/Ch (0.24–1.63) ratios are characteristic inboth the cores (Tables 2A–B). Smectite andkaolinite contents are extremely low in core 1(Table 2A; Fig. 4A), whereas in core 2, theirproportions increase at the top and base of unit 2(Table 2B; Fig. 4B).
5.2.5. Rock magnetic properties
In core 1, MS values show marginal variations(19–42 SI units). All other rock magnetic proper-ties (wARM, SIRM, wARM=wlf , SIRM/wlf , HIRMand S-ratios) are consistently uniform and theirvalues are lower than those of unit 1 sediments (seeFig. 5A). In core 2, MS values are also lower thanthose of unit 1, and higher values occur at theboundary between units 1 and 2. The wARM and
SIRM values are coherent with MS. Lower SIRM/wlf and wARM=wlf are characteristic of this unit.Low HIRM and high S-ratio% occur at the baseand top of this unit and low S-ratio% in the centre(Fig. 5B).
5.2.6. Rb, Sr, Sm, Nd concentrations and Sr– Nd
isotopes
High concentrations of Rb, Sm and Nd,87Sr/86Sr and more radiogenic �Nd are character-istic of this unit (2), compared to that of unit 1 ofthe same cores (Table 3; Fig. 6). In core 1, the Sr,Sm and Nd concentrations and their isotopicratios are consistently uniform (Figs. 6–7). Srvalues in unit 2 of both the cores are comparable(Table 3).
6. Discussion
6.1. Importance of rock-magnetic properties
The basic parameters that indicate variations inmagnetic mineral concentrations are wlf , wARM andSIRM. wlf represents total contribution frommagnetic minerals and is sensitive to the largermagnetic grain sizes in the range of large pseudo-single domain (PSD) and multidomain (MD)magnetic grain sizes. The wARM and SIRMincrease in value with an increase in concentrationof fine magnetic grain sizes (single domain)(Bloemendal et al., 1992). The interparametricratios (wARM=wlf and wARM/SIRM) vary inverselywith magnetic grain size and can be used to assessthe relative change in concentrations of finermagnetic grain sizes. SIRM/wlf , wARM=wlf ratios
ARTICLE IN PRESS
P.M. Kessarkar et al. / Deep-Sea Research I 52 (2005) 1591–1615 1607
are low for multidomain (MD41 mm) and super-paramagnetic (SPo0.03 mm) grains and high forsingle domain (0.03–1 mm) grains (Maher andTaylor, 1988). The S-ratio% and HIRM reflectvariations in the magnetic mineral assemblage.Values of S ratio% �100 indicate a high propor-tion of magnetite, whereas lower values indicate anincreasing proportion of hematite and goethite,and the parameters vary with the concentration ofhigh coercivity minerals (Thompson and Oldfield,1986; Robinson, 1986).High S-ratio% and low HIRM in both units of
core 1 indicate that magnetite is the predominantmagnetic mineral. The coincidence of decrease inwlf and median grain size with the increase inSIRM/wlf , wARM=wlf ratios at certain intervals inboth unit 1 and 2 (Fig. 5A) suggests the presenceof finer magnetic grain sizes (single domain),probably due to the formation of authigenicbacterial magnetite. Flat magnetic properties inunit 2 reflect the fact that the sediments are derivedlargely from a single source. Variations in wlf ,wARM and SIRM in unit 1 sediments indicate thatthese parameters are influenced by grain size.Although the variations in wlf , wARM and SIRMare coherent with each other, HIRM valuesincrease at the transition zone between unit 1and unit 2 in core 2 (Fig. 5B). This impliesincreased hematite/goethite content and thus vari-able source sediments in this core.
6.2. Age of the sediments
The transition between unit 1 and 2 sediments incore 1 occurs at �112 cm (Fig. 2A). The age,13,750 14C yrBP at 120–130 cm (Table 4), impliesthat the unit 2 sediments are of Late Pleistoceneage, which continued to deposit even after the LastGlacial Maximum (LGM �18,000 14C yrBP) andin the initial phase of deglaciation and slow rise insea-level. Fairbanks (1989) reported that the rise ofsea-level in the first phase of deglaciation(17,100–12,500 yr BP) was only 20m.The age 11,350 14C yr BP at 90–100 cm (Table 4)
suggests that the age at 112 cm (base of unit 1)might at least be 12,000 14C yrBP, implyingthat the unit 1 sediments started depositing at�12 14C kyrBP. This age corresponds well with the
starting of the melt water pulse 1A, during whichrapid sea-level rise of 24m occurred in o1000 yr(Fairbanks, 1989). This also implies that unit 2sediments terminated most probably as a result ofthis sharp rise in sea-level.The corrected date of 12,000 yr BP at 58–60 cm
(Table 4) corresponds to the intermittent oliveblack sediment layer and is older and stratigra-phically inconsistent (Fig. 2A). The age at18–24 cm in unit 1 is 4420 14C yrBP, suggestingthat the top 20 cm of unit 1 deposited at a rate of�4 cm/ka. This agrees well with the earlierreported rates of sedimentation (2–4 cm/ka) in thisarea (Udintsev, 1975; Prell et al., 1980). If oneexcludes the olive black layer, the remaining 92 cmthick sediments of unit 1 were deposited in12,000 yr, suggesting that the average rate ofsedimentation was �7 cm/ka.Absolute ages were not determined for core 2
sediments. Unit 1 sediments of this core arethinner than those in core 1. Because of theirlocation in the Bay, one would expect higher ratesof sedimentation at core 1 and lower rates at core2. Since core 2 showed similar changes inlithofacies as that in core 1, we presume that theunit 2 sediments are of Late Pleistocene age andunit 1 sediments started depositing since 12 ka.
6.3. Unit 2 sediments
The unit 2 sediments are largely olive black/greyin colour, marked by low CaCO3, OC/TN, morequartz and mica in the coarse fraction, andabundant illite in o2 mm fraction. Very fine siltsand fine silts dominate the siliciclastic mud (Figs.3A–B). Grain size frequency curves (Figs. 3Ab,3Bb) exhibit unimodal distribution. These char-acteristics point to abundant terrigenous material,most probably derived from a single source. Flatrock magnetic properties (Fig. 5A) and consistentand uniform Rb, Sr, Sm, Nd concentrations andSr isotopic ratios (Table 3; Figs. 6, 7A) alsosuggest a single source.The mean size of the muds (o10 mm) in unit 2
sediments is within the size range (6.7–7.8 mm)reported for hemipelagic muds (Joseph et al.,1998). However, the coarse fraction is largelydevoid of biogenic components, except at the base
ARTICLE IN PRESS
P.M. Kessarkar et al. / Deep-Sea Research I 52 (2005) 1591–16151608
of unit 2 in core 2 (Fig. 2B). Only a few coccolithsare seen under SEM. The locations of the cores arealso away from the continental margins, implyingthat the unit 2 sediments are unlikely to behemipelagic muds.Distal turbidites are generally centimeter thick
beds and show graded bedding of silts and sand.The sediments are strongly skewed towards thecoarser end of the silt fractions (medium andcoarse silt), and their mean grain size rangesbetween 9 and 29.6 mm (Joseph et al., 1998). Unit 2sediments are dominated by fine silt and very finesilt and the median grain size is o10 mm. Nosedimentary structures were observed during sub-sampling of the sediment cores onboard. Neithergraded bedding nor sharp boundaries of theindividual layers were found. The term ‘turbidite’,therefore, may not strictly apply for these sedi-ments.The characteristics of unit 2 sediments, however,
correspond well with those of ‘hemiturbidites’described by Stow and Wetzel (1990) for the distalBengal Fan sediments. Hemiturbidites are biotur-bated (seen only under X-ray images), dark to lightgray muds (very fine silts: 7.5–7.9+ with symme-trical to slightly positively skewed distributions) ofabout 10–100 cm thick with indistinct bed bound-aries and few (rare to absent) calcareous micro-fossils. These are deposited slowly from anessentially stationary dilute suspension cloud thatis produced from the dying stages of a large low-concentration turbidity current. We thereforesuggest that unit 2 sediments represent hemiturbi-dites.The age of the hemiturbidites at 120–130 cm in
core 1 is 13,750 14C yrBP (Table 4). However, thehemiturbidites continued up the core to 113 cm(Fig. 2A). This implies that these muds must havebeen older than 13 14C kyrBP. It is likely that thesemuds started depositing after the fall of sea-levelduring the last glaciation. The rapid fall of eustaticsea-level, starting at �24 14C kyr, resulted in asignificant erosion of the continental marginsediments and enhanced turbidity current activity.Enhanced turbidite deposition during low standsof sea-level, sometimes continuing until12 14C kyr BP, was reported on the Amazon Fan,the Mississipi Fan and the Bengal Fan (Manley
and Flood, 1988; Kolla and Macurda, 1988;Bouma et al., 1989; Kolla and Perlmutter, 1993;Weber et al., 1997). Prins et al. (2000) reported asedimentary succession that consists of turbiditesdraped by a very homogenous hemipelagic mudunit, which in turn is overlain by a calcareous oozeunit in the Indus Fan. In other words, turbiditycurrents were much more active and turbiditesreached farther during the low stands of sea-levelthan during the high stands.
6.3.1. Provenance of unit 2 sediments
The clastic sediments of unit 2 are dominated byquartz and mica in the coarse fraction and by illiteand chlorite in the o2 mm fraction (Figs. 4A–B).These sediments may not have originated from thewestern margin of the Bay of Bengal. Because thehinterland geological formations (charnockitegneisses and schistose rocks and coastal Tertiaries;Fig. 1B) of SE India and Sri Lanka weather underhumid tropical conditions, kaolinite, smectite andillite, in order of abundance, are the major clayminerals (see Rao and Kessarkar, 2001). On theother hand, illite and chlorite are largely theproducts of physical weathering, and clay mineralsuites of the Ganges and its tributaries reflect aglacial derivative from the Himalayan MountainSystem (Naidu et al., 1985). High illite and chloritewith traces or absence of smectite and kaolinitewere reported in suspended and bed load of theHimalayan rivers, its tributaries and estuarine andshelf sediments off Ganges (Subramanian, 1980;Naidu et al., 1985; Rao, 1991). Illite and chlorite-rich clays in Pleistocene turbidites of the BengalFan undoubtedly are of Himalayan source (Co-chran et al., 1989; Stow et al., 1990; Bouquillon etal., 1990; France-Lanord et al., 1993; Derry andFrance-Lanord, 1996). The low S/I and K/Chratios in unit 2 of these two cores thus suggest thatthe clastic sediments are derived from the Hima-layan rocks and soils in the drainage basin of theHimalayan rivers and transported to the Bay ofBengal by the G–B River system.The average Sr–Nd concentrations of unit 2
sediments (hemiturbidites) in both the cores arecomparable and similar to those of the Himalayansourced sediments deposited in different regions ofthe Bengal Fan (see Table 5; Figs. 6–7). On the Sr
ARTICLE IN PRESS
P.M. Kessarkar et al. / Deep-Sea Research I 52 (2005) 1591–1615 1609
vs. Nd plot (Fig. 6A) these sediments fall withinthe area of sediments of Central Indian Basin(Fagel et al., 1994, 1997) and close to that of theNorthern Fan (Colin et al., 1999; Pierson-Wick-mann et al., 2001), which are of dominantHimalayan origin. Similarly, the 87Sr/86Sr ratiosof the sediments (0.73472–0.73505 in core 1;0.72597–0.73409 in core 2; Table 3) and �Nd ofcore 1 (�14.88 to �17.21) are within the range ofvalues reported for the particulate flux of theGanges River (0.72271–0.75238; �14.8 to �17.7;Galy et al., 1999; Dowling et al., 2003). The �Ndvalues of core 2 (�13.26 to �13.85) are slightlymore radiogenic than that of the Ganges. More-over, the Sr–Nd isotope values of unit 2 (Table 3)lie between the values of the Pleistocene sedimentsof the North Fan (0.7210–0.7231, �10 to �11;Colin et al., 1999) and Upper and Middle Fan(0.740–0.750, �15.5 to �14.6; Pierson-Wickmannet al., 2001). The Sr–Nd isotope values of thePleistocene sediments of the Central Indian Basin(0.7409; �11.75; Fagel et al., 1994) are alsodifferent.Despite the fact that the sediments at all these
locations originated from the NBOB (Colin et al.,1999; Pierson-Wickmann et al., 2001; Fagel et al.,1994), varied Sr–Nd isotope ratios occur (Table 5),may be for the following reasons. (a) Althoughtransported by turbidity currents, the hemiturbi-dites are more fine-grained than turbidite se-quences, and obviously some differences inisotope values are expected. (b) It may be due tothe analysis of a different fraction of the sediment.For example, we have analysed the carbonate- andorganic-matter-free o2 mm fraction of the sedi-ments, whereas others analysed carbonate-freebulk samples (Colin et al., 1999; Pierson-Wick-mann et al., 2001; Table 5). (c) It is well knownthat the Sr isotopes vary with grain size and arevery sensitive to the sedimentary cycle. Sr is anambiguous tracer (Biscaye and Dasch, 1971; Revelet al., 1996). On the other hand, Nd isotopiccomposition may be due to the mixing ofsediments derived from different sources (Groussetet al., 1988; Revel et al., 1996; Innocent et al.,2000; Kessarkar et al., 2003). It is likely thatsediment originating from different sources wasmixed with sediments of primarily Himalayan
origin, which diluted the Sr–Nd signals. On thebasis of Sr–Nd signals, Fagel et al. (1994)suggested that the sediments of the Central IndianBasin were dominantly from the Himalayan fluxwith some contribution from the Chaggos–Lac-cadive Ridge. Similarly, Colin et al. (1999)reported that the sediments of the eastern BengalFan and western Bengal Fan were dominantly ofHimalayan source with some contribution fromthe Irrawady River and Godavari–Krishna, re-spectively. On the 87Sr/86Sr vs. �Nd plot (Fig. 7C)unit 2 sediments fall between the West Fansediments and Pleistocene sediments (of the ODPcores) of the distal Bengal Fan, derived from theturbidity currents originating at the NBOB. Wetherefore suggest that the source for clasticsediments of unit 2 (in core 1 and upper half ofunit 2 in core 2) may be the Himalayas,transported to the NBOB by the G–B Riversystem and then to the distal Fan by turbiditycurrents. The Afanasiy–Nikitin Seamount is lo-cated close to core 2 (see Fig. 1A), and weatheredbasalts and carbonates were recovered at summitlevels (Banakar et al., 1997). Smectite-enrichedintervals (Fig. 4Ba), low Sr isotopic ratios (Fig.5B), more radiogenic Nd isotopes and biogenicconstituents at the lower half of unit 2 sediments incore 2 (Fig. 2B) suggest that the locally derivedsediment from the seamount may have beentransported to the core site and diluted thepredominant Himalayan flux (Table 3).
6.4. Unit 1 sediments
Unit 1 sediments are largely light coloured andshow higher OC/TN, CaCO3, planktic foramini-fers, keels, smectite and kaolinite contents, lower87Sr/86Sr and more negative �Nd than those of unit2 of the same core. Average median grain size ofthe sediment is also much lower. MS values,though varied, show strong coherence with AIR.The higher proportions of keels followed
by planktic and a few benthic foraminifers(Figs. 2A–B) indicate that unit 1 sediments arepelagic. The increased percentage of keels atcertain intervals may be because of the (a)influence of the lysocline or carbonate compensa-tion depth (CCD), (b) intrusion and corrosive
ARTIC
LEIN
PRES
S
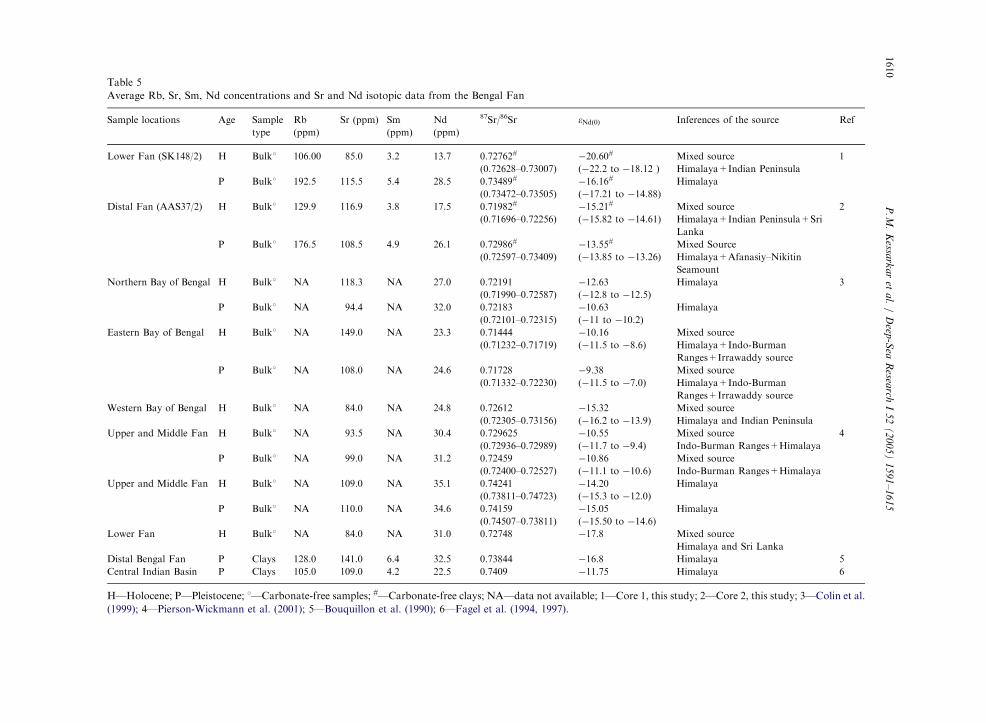
Table 5
Average Rb, Sr, Sm, Nd concentrations and Sr and Nd isotopic data from the Bengal Fan
Sample locations Age Sample
type
Rb
(ppm)
Sr (ppm) Sm
(ppm)
Nd
(ppm)
87Sr/86Sr �Ndð0Þ Inferences of the source Ref
Lower Fan (SK148/2) H Bulk1 106.00 85.0 3.2 13.7 0.72762# �20.60# Mixed source 1
(0.72628–0.73007) (�22.2 to �18.12 ) Himalaya+Indian Peninsula
P Bulk1 192.5 115.5 5.4 28.5 0.73489# �16.16# Himalaya
(0.73472–0.73505) (�17.21 to �14.88)
Distal Fan (AAS37/2) H Bulk1 129.9 116.9 3.8 17.5 0.71982# �15.21# Mixed source 2
(0.71696–0.72256) (�15.82 to �14.61) Himalaya+Indian Peninsula+Sri
Lanka
P Bulk1 176.5 108.5 4.9 26.1 0.72986# �13.55# Mixed Source
(0.72597–0.73409) (�13.85 to �13.26) Himalaya+Afanasiy–Nikitin
Seamount
Northern Bay of Bengal H Bulk1 NA 118.3 NA 27.0 0.72191 �12.63 Himalaya 3
(0.71990–0.72587) (�12.8 to �12.5)
P Bulk1 NA 94.4 NA 32.0 0.72183 �10.63 Himalaya
(0.72101–0.72315) (�11 to �10.2)
Eastern Bay of Bengal H Bulk1 NA 149.0 NA 23.3 0.71444 �10.16 Mixed source
(0.71232–0.71719) (�11.5 to �8.6) Himalaya+Indo-Burman
Ranges+Irrawaddy source
P Bulk1 NA 108.0 NA 24.6 0.71728 �9.38 Mixed source
(0.71332–0.72230) (�11.5 to �7.0) Himalaya+Indo-Burman
Ranges+Irrawaddy source
Western Bay of Bengal H Bulk1 NA 84.0 NA 24.8 0.72612 �15.32 Mixed source
(0.72305–0.73156) (�16.2 to �13.9) Himalaya and Indian Peninsula
Upper and Middle Fan H Bulk1 NA 93.5 NA 30.4 0.729625 �10.55 Mixed source 4
(0.72936–0.72989) (�11.7 to �9.4) Indo-Burman Ranges+Himalaya
P Bulk1 NA 99.0 NA 31.2 0.72459 �10.86 Mixed source
(0.72400–0.72527) (�11.1 to �10.6) Indo-Burman Ranges+Himalaya
Upper and Middle Fan H Bulk1 NA 109.0 NA 35.1 0.74241 �14.20 Himalaya
(0.73811–0.74723) (�15.3 to �12.0)
P Bulk1 NA 110.0 NA 34.6 0.74159 �15.05 Himalaya
(0.74507–0.73811) (�15.50 to �14.6)
Lower Fan H Bulk1 NA 84.0 NA 31.0 0.72748 �17.8 Mixed source
Himalaya and Sri Lanka
Distal Bengal Fan P Clays 128.0 141.0 6.4 32.5 0.73844 �16.8 Himalaya 5
Central Indian Basin P Clays 105.0 109.0 4.2 22.5 0.7409 �11.75 Himalaya 6
H—Holocene; P—Pleistocene; 1—Carbonate-free samples; #—Carbonate-free clays; NA—data not available; 1—Core 1, this study; 2—Core 2, this study; 3—Colin et al.
(1999); 4—Pierson-Wickmann et al. (2001); 5—Bouquillon et al. (1990); 6—Fagel et al. (1994, 1997).
P.M
.K
essark
ar
eta
l./
Deep
-Sea
Resea
rchI
52
(2
00
5)
15
91
–1
61
51610
ARTICLE IN PRESS
P.M. Kessarkar et al. / Deep-Sea Research I 52 (2005) 1591–1615 1611
effect of the Antarctic BottomWater (AABW) and(c) early diagenesis. The water depths at core 1(3600m) and core 2 (4000m) are close to thelysocline (�3700–3900m) and well above the CCD(�4500–4800m; see Kolla et al., 1976). The CCDhas not changed much in this area for the last2–3Myr (Stow et al., 1990). The AABW occursbelow 2000m and has been traced only up to 51S(Warren, 1982). The cores (core 1 at 101N and core2 at 21S latitude; Table 1) are located far north ofthe AABW. The intervals of low organic carboncoincide with a high percentage of keels and viceversa (Fig. 2A). These suggest that the highpercentage of keels may be due partly to theinfluence of the lysocline and early diagenesis.Segall and Kuehl (1992) and Weber et al. (2003)reported that the western side of the activechannel received only pelagic sediments duringthe Holocene.Hemiturbidites were produced from the dying
turbidity current activity and stationary mudsuspensions at the distal fan (Stow and Wetzel,1990). The change in lithofacies from hemiturbi-dites (unit 2) to calcareous-dominated pelagicsediments (unit 1) at �12 kyr BP implies that thelarge-scale turbidity current transport wasswitched off after 12 kyr BP, perhaps by the rapidrise in sea-level associated with melt water pulse1A (Fairbanks, 1989). The continued sea-level riseduring the Holocene may have resulted in theconfinement of turbidity–current activity to upperfan regions and prevalence of pelagic sedimenta-tion at the core sites. Stow et al. (1989) reported adrape of pelagic calcareous ooze of Holocene agein the distal Bengal Fan sediments.
6.4.1. Provenance of unit 1 sediments
Increased proportions of smectite and kaoliniteand high S/I and K/Ch ratios (Figs. 4A–B) reflectincreased chemical weathering products, which arewell reported in the sediments of the east coast ofIndia. Although illite is a weathering product ofthe gneissic and schistose rocks of the EasternGhats and Sri Lankan province, its proportionsare found to be lower than those of kaolinite (Rao,1991). Moreover, the sediments off the Krishnaand Godavari contain abundant smectite andminor kaolinite and chlorite. Higher illite followed
by smectite and kaolinite in unit 1 sediments ofthese cores most probably indicates that the claymineral suites derived from the hinterland forma-tions of SE India and Sri Lanka and transportedby a southerly current (prominent both during SWand NE monsoon in this region; Shetye et al.,1993) may have admixed with the clays brought tothe NBOB by the G–B River system andtransported to the core site by the southward-drifting plume (Shetye et al., 1991). This results inmixed mineral suites at the core sites. Colin et al.(1999) reported that the sediments of the West Fanare an admixture of sediments from the G–B Riversystem and western margins of the Bay of Bengal.Except Sr in core 2, the concentrations of Rb,
Sr, Sm and Nd in unit 1 sediments are lower thanthose of unit 2 (Table 3). The Sr–Nd concentra-tions of unit 1 sediments are close to those of theHolocene sediments of the Western Fan andLower Bengal Fan sediments (Table 5). The Rband Sm concentrations resemble those in the southIndian formations (Peucat et al., 1989). On the Srvs. Nd plot (Fig. 6B) unit 1 sediments fall belowthe mixed source and Himalayan source sedi-ments, suggesting that they are of mixed sourcesfrom the Himalayas and India and Sri Lanka.Reduced 87Sr/86Sr ratios and more negative �Ndvalues are characteristic of unit 1 (Table 3). TheSr–Nd isotopic ratios are influenced by severalfactors: (a) higher 87Sr/86Sr and more negative�Nd values are expected from chemical weatheringof the older geological formations. For example,the 87Sr/86Sr and �Nd of the tonalitic, granitic andcharnockite gneisses of the Archean rocks ofsouthern India range from 0.70232 to 0.72549and �23 to �44.9, respectively (Peucat et al.,1989). Similarly, varied 87Sr/86Sr ratios and �Ndvalues were reported for the Highland (0.71886–1.2387; �12 to �30.3), Vijayan (0.70587–0.92174;�4.2 to �10.1) and Wanni (0.71330–0.97792; �4.7to �19.8) complexes of the Sri Lankan formations(Milisenda et al., 1994). Revel et al. (1996),however, pointed out that the Sr–Nd isotopes ofa particular rock sample or geological unit are lessrepresentative of the potential source area thanestuarine samples or adjacent marine sediments.This is very much evident when one compares the87Sr/86Sr ratios and �Nd values of unit 1 sediments
ARTICLE IN PRESS
P.M. Kessarkar et al. / Deep-Sea Research I 52 (2005) 1591–16151612
of core 1 and 2 (Table 3) with those of thekaolinite-rich, smectite and illite sediments (rangefrom 0.7175 to 0.7229 and �18.45 to �20.29,respectively) derived from gneissic and schistoserocks and deposited on the SW continental marginof India (Kessarkar et al., 2003). These indicatethat unit 1 sediments are influenced by the oldercrust material, which has undergone chemicalweathering. (b) The 87Sr/86Sr ratios usually in-crease with the increase of clay content (Walter etal., 2000). Despite high proportions of clay andfine silt in unit 1, 87Sr/86Sr ratios are lower thanthose of unit 2. This probably implies mixedsources of sediments in unit 1 sediments. On the87Sr/86Sr vs. �Nd plot (Fig. 7C) the unit 1 sedimentsfall away from North Fan and East Fan but areclose to those of West Fan, indicating a mixedsource with sediment proportions from the G–BRiver system and SE India and Sri Lanka.The age of the olive black/dark brown sediment
layer in unit 1 is stratigraphically inconsistent (Fig.2A; Table 4). Although this sediment resembles theunit 2 sediments of the same cores, it has highplanktonic foraminifers and high organic carbonin core 1 (Fig. 2A) and high carbonate, sand andplanktonic foraminifers in core 2 (Fig. 2B). It islikely that this layer of sediment was reworked anddeposited at the core site from the adjacent floorduring slack periods of sea-level rise.
Acknowledgements
We thank the Directors of the National Instituteof Oceanography, Goa, National GeophysicalResearch Institute, Hyderabad, and Indian Insti-tute of Geo-magnetism, Alibag, for the facilitiesand encouragement. We appreciate and thank Dr.S.W.A. Naqvi and Dr. M. Dileep Kumar forproviding funds for AMS dating of 4 samples.PMK thanks the Council of Scientific andIndustrial Research (CSIR), New Delhi, for theaward of Senior Research Fellowship. We thankDr. V. Ramaswamy for his help with the laserparticle size analyser and Mr. Girish Prabhu forXRD work. We thank Drs. V. Balaram and T.G.Rao of NGRI for their help with ICP-MS analysis.This is NIO Contribution no. 3955.
References
Anonymous, 1965. Gazetteer of India Publications Division,
Ministry of Information and Broadcasting. Government of
India, 1652pp.
Banakar, V.K., Pattan, J.N., Mudholkar, A.V., 1997. Palaeo-
ceanographic conditions during the formation of a ferro-
manganese crust from the Afanasiy–Nikitin Seamount,
North Central Indian Ocean: geochemical evidence. Marine
Geology 136, 299–315.
Ben Othman, D., White, W.M., Patchett, J., 1989. The
isotopic and trace element composition of sediments:
constraints on the genesis of Island arc volcanics and
crust-mantle recycling. Earth and Planetary Science Letters
94, 1–21.
Biscaye, P.E., 1965. Mineralogy and sedimentation of deep
see clay in the Atlantic Ocean and adjacent sea and
oceans. Bulletin of Geological Society of America 76,
803–832.
Biscaye, P.E., Dasch, E.J., 1971. The rubidium and strontium
isotope system in deep-sea sediments: Argentine Basin.
Journal of Geophysical Research 76, 5087–5096.
Bloemendal, J., King, J.W., Hall, F.R., Doh, S.J., 1992. Rock
magnetism of the Late Neogene and Pleistocene deep-sea
sediments: relationship to sediment source, diagenetic
processes, and sediment lithology. Journal of Geophysical
Research 97, 4361–4375.
Bouma, A.H., Coleman, J.M., Stelting, C.E., Kohl, B., 1989.
Influence of relative sea level changes on the construction of
the Mississipi Fan. Geo-Marine Letters 9, 161–170.
Bouquillon, A., France-Lanord, C., Michard, A., Tiercelin, J.J.,
1990. Sedimentology and isotope chemistry of the Bengal
Fan sediments: the denudation of the Himalaya. In:
Cochran, J.R., Curray, J.R., Sager, W.W., Stow, D.A.V.
(Eds.), Proceedings of the Ocean Drilling Program Scientific
Results, vol. 116, pp. 43–58.
Brass, G.W., Raman, C.V., 1990. Clay mineralogy of sediments
from the Bengal Fan. Proceedings of the Ocean Drilling
Program Scientific Results, vol. 116, pp. 35–41.
Chauhan, O.S., Suneethi, J., 2001. 18KaBP records of climatic
changes, Bay of Bengal: isotopic and sedimentological
evidences. Current Science 81, 1231–1234.
Cochran, J.R., 1990. Himalayan uplift, sea level and the record
of Bengal Fan sedimentation at the ODP Leg 116 site. In:
Cochran, J.R., Curray, J.R., Sager, W.W., Stow, D.A.V.
(Eds.), Proceedings of the Ocean Drilling Program Scientific
Results, vol. 116, pp. 397–414.
Cochran, J.R., Stow, D.A.V., et al., 1989. Proceedings Ocean
Drilling Program Initial Reports, vol. 116. Ocean Drilling
Program, College Station, TX, pp. 388.
Colin, C., Turpin, L., Bertauz, J., Despraries, A., Kissel, C.,
1999. Erosional history of the Himalayas and Burman
ranges during the last two glacial–interglacial cycles. Earth
and Planetary Science Letters 171, 647–660.
Curray, J.R., 1994. Sediment volume and mass beneath the Bay
of Bengal. Earth and Planetary Science Letters 125,
371–383.
ARTICLE IN PRESS
P.M. Kessarkar et al. / Deep-Sea Research I 52 (2005) 1591–1615 1613
Curray, J.R., Moore, D.G., 1971. Growth of the Bengal Deep
Sea Fan and denudation in the Himalayas. Geological
Society of America Bulletin 82, 563–572.
Curray, J.R., Emmel, F.J., Moore, D.G., Raitt, R.W., 1982.
Structure, tectonics and geological history of the North-
eastern Indian Ocean. In: Nairn, A.E.M., Stechli, F.G.
(Eds.), The Ocean Basins and Margins, The Indian Ocean,
vol. 6. Plenum Press, New York, USA, pp. 399–450.
Curray, J.R., Emmel, F.J., Moore, D.G., 2003. The Bengal
Fan: morphology, geometry, stratigraphy, history and
processes. Marine and Petroleum Geology 19, 1191–1223.
Derry, L.A., France-Lanord, C., 1996. Neogene Himalayan
weathering history and river 87Sr/86Sr impact on the marine
Sr record. Earth and Planetary Science Letters 142, 59–74.
Dowling, C.B., Poreda, R.J., Basu, A.R., 2003. The ground-
water geochemistry of the Bengal Basin: weathering,
chemsorption and trace metal flux to the oceans. Geochi-
mica et Cosmochimica Acta 67, 2117–2136.
Eigenheer, A., Quadfasel, D., 2000. Seasonal variability of the
Bay of Bengal circulation inferred from TOPEX/POSEI-
DON altimetry. Journal of Geophysical Research 105,
3243–3252.
Emmel, F.J., Curray, J.R., 1984. The Bengal Submarine Fan,
Northeastern Indian Ocean. Geo-Marine Letters 3,
119–124.
Emmel, F.J., Curray, J.R., 1985. Bengal Fan, Indian Ocean. In:
Bouma, H., Normark, W.R., Barner, N.E. (Eds.), Sub-
marine Fans and Related Turbidite Systems. Springer, New
York, pp. 107–112.
Fagel, N., Debrabant, P., Andre, L., 1994. Clay supplies in the
Central Indian Basin since the Late Miocene, climatic or
tectonic control. Marine Geology 122, 151–172.
Fagel, N., Andre, L., Debrabant, P., 1997. Multiple seawater
derived geochemical signatures in Indian Ocean pelagic
clays. Geochimica et Cosmochimica Acta 61, 989–1008.
Fairbanks, R., 1989. A 17,000 year glacio-eustatic sea level
record: influence of glacial melting rates on the Younger
Dryas event and deep-ocean circulation. Nature 342,
637–642.
Folk, R.L., 1968. Petrology of the sedimentary rocks. Hemp-
hills, Drawer’s M., University Station, Austin, Texas 170pp.
France-Lanord, C., Derry, L.A., Michard, A., 1993. Evolution
of the Himalaya since Miocene time: isotopic and sedimen-
tological evidence from the Bengal Fan. In: Treloar, P.J.,
Searle, M. (Eds.), Journal of Geological Society of London
Special Publication, Himalayan Tectonics 74, 603–621.
Galy, A., France-Lanord, C., 2001. Higher erosion rates in the
Himalayan geochemical constraints on riverine fluxes.
Geology 29, 23–26.
Galy, A., France-Lanord, C., Derry, L.A., 1999. The strontium
isotopic budget of Himalayan rivers in Nepal and Bangla-
desh. Geochimica et Cosmochimica Acta 63, 1905–1925.
Goldberg, E.D., Griffin, J.J., 1970. The sediments of the
northern Indian Ocean. Deep-Sea Research Part I 17,
513–537.
Goodbread Jr., S.L., Kuehl, S.A., 1999. Holocene and modern
sediment budgets for the Ganges–Brahmaputra river
system: evidence for highstand dispersal to flood-plain,
shelf and deep-sea depocenters. Geology 27, 559–562.
Govindaraju, K., 1994. Compilation of working values and
sample description for 383 geostandards. Geostandards
Newsletter 18, 1–158.
Grousset, F.E., Biscaye, P.E., Zindler, A., Prospero, J., Chester,
R., 1988. Neodymium isotopes as tracers in marine
sediments and aerosols: North Atlantic. Earth and Plane-
tary Science Letters 87, 367–378.
Henderson, P., Pankhurst, R.J., 1984. In: Henderson, P. (Ed.),
Rare Earth Element Geochemistry. Elsevier, Amsterdam,
pp. 467–495.
Hohndorf, A., Kudrass, R., France-Lanord, C., 2003. Transfer
of the Sr isotopic signature of the Himalayas to the Bay of
Bengal. Deep-Sea Research Part II 50 (5), 951–960.
Hulsemann, J., 1966. On the routine analysis of carbonates in
unconsolidated sediments. Journal of Sedimentary Petrol-
ogy 36, 622–625.
Innocent, C., Fagel, N., Hillaire-Marcel, C., 2000. Sr–Nd
isotope systematics in deep sea sediments: clays-size versus
coarse fraction. Marine Geology 168, 79–87.
Joseph, L., Rea, D.K., van der Pluijm, B.A., 1998. Use of
grain size and magnetic fabric analyses to distinguish
among depositional environments. Paleoceanography 13,
491–501.
Kessarkar, P.M., Rao, V.P., Ahmad, S.M., Babu, G.A., 2003.
Clay minerals and Sr–Nd isotopes of the sediments along
the western margin of India and their implication for
sediment provenance. Marine Geology 202, 55–69.
Kolla, V., Macurda Jr., D.B., 1988. Sea-level changes and
timing of turbidity-current events in deep-sea fan systems.
In: Wilgus, C.K., Hastings, B.K., Posamentier, H., Van
Wagoner, J., Ross, C.A., Kendall, C.G.St.C. (Eds.), Sea-
Level Changes: An Integrated Approach. Society of
Economic Palaeontologists and Mineralogists, Special Pub-
lication No. 42, pp. 381–392.
Kolla, V., Perlmutter, M.A., 1993. Timing of turbidite
sedimentation on the Mississippi Fan. American Associa-
tion Petroleum Geologists Bulletin 77, 1129–1141.
Kolla, V., Rao, N.M., 1990. Sedimentary sources in the surface
and near-surface sediments of the Bay of Bengal. Geo-
Marine Letters 10, 129–136.
Kolla, V., Be, A.W.H., Biscaye, P.E., 1976. Calcium carbonate
distribution in the surface sediments of the Indian Ocean.
Journal of Geophysical Research 81, 2605–2616.
Krishnan, M.S., 1968. Geology of India and Burma. Higgin-
bothoms Ltd., Madras 536 pp.
Krishnaswamy, S., Trivedi, J.R., Sarin, M.M., Ramesh, R.,
Sharma, K.K., 1992. Strontium isotopes and rubidium in
the Ganga–Brahmaputra River system: weathering in the
Himalaya, fluxes to the Bay of Bengal and contribution to
the evolution of oceanic 87Sr/86Sr. Earth and Planetary
Science Letters 109, 243–253.
Kuehl, S.A., Hariu, T.M., Moore, W.S., 1989. Shelf sedimenta-
tion off the Ganges–Brahmaputra River system: evidence
for sediment bypassing to the Bengal Fan. Geology 17,
1132–1135.
ARTICLE IN PRESS
P.M. Kessarkar et al. / Deep-Sea Research I 52 (2005) 1591–16151614
Lightfoot, P.C., Hawkesworth, C.J., Devey, C.W., Rogers,
N.W., van Calsteren, P.W.C., 1990. Source and differentia-
tion of Deccan Trap lavas: implications of geochemical and
mineral chemical variations. Journal of Petrology 31,
1165–1200.
Maher, B.A., Taylor, R.M., 1988. Formation of ultrafine-
grained magnetite in soils. Nature 366, 368–370.
Manley, P.L., Flood, R.D., 1988. Cyclic sediment deposition
within Amazon deep-sea fan. American Association Petro-
leum Geologist Bulletin 72, 912–925.
McCreary, J.P., Han, W., Shankar, D., Shetye, S.R., 1996.
Dynamics of the East Indian Coastal Current 2. Numerical
solutions. Journal of Geophysical Research 101 (C6),
13,993–14,010.
McLennan, S.M., Tylor, S.R., McCulloch, M.T., Maynard,
J.B., 1990. Geochemical and Nd–Sr isotopic composition of
deep-sea turbidites: crustal evolution and plate tectonic
associations. Geochimica et Cosmochimica Acta 54,
2015–2050.
Milisenda, C.C., Liew, T.C., Hofmann, A.W., Kohler, H.,
1994. Nd isotopic mapping of the Sri Lanka basement:
update and additional constraints from Sr isotopes.
Precambrian Research 66, 95–110.
Milliman, J.D., Syvitski, J.P.M., 1992. Geomorphic/tectonic
control of sediment discharge to the ocean: the importance
of small mountain rivers. Journal of Geology 100, 525–544.
Naidu, A.S., Mowatt, T.C., Somayajulu, B.L.K., Sreerama-
chandra, Rao, K., 1985. Characteristics of clay minerals in
the bed loads of major rivers of India. In: Degens, E.T.,
Kempe, S., Herrear, R. (Eds.), Transport of Carbon and
Minerals in Major World Rivers, part 3, Mitteilungen aus
dem Geologischem paleontogischen Institut., University
of Hamburg, SCOPE/UNEP Sounderband Heft 58(5),
pp. 559–568.
Peucat, J.J., Vidal, P., Bernard-Griffiths, J., Condie, K.C.,
1989. Sr, Nd, and Pb isotopic systematics in the Archean
low to high-grade transition zone of southern India: syn-
accretion vs. post-accretion granulites. Journal of Geology
97, 537–550.
Pierson-Wickmann, A.-C., Reisberg, L., France-Lanord, C.,
Kudrass, H.R., 2001. Os–Sr–Nd results from sediments
in the Bay of Bengal: implications for sediment trans-
port and the marine Os record. Paleoceanography 16,
435–444.
Prell, W.L., Hutson, W.H., Williams, D.F., Be, A.W.H.,
Geitzenauer, K., Molfino, B., 1980. Surface circulation of
the Indian Ocean during the last glacial maximum,
approximately 18000 YBP. Quaternary Research 14,
309–336.
Prins, M.A., Postma, G., Cleveringa, J., Cramp, A., Kenyon,
N.H., 2000. Controls on terrigenous sediment supply to the
Arabian Sea during the Late Quaternary: the Indus Fan.
Marine Geology 169, 327–349.
Ramaswamy, V., Vijay Kumar, B., Parthiban, G., Ittekkot, V.,
Nair, R.R., 1997. Lithogenic fluxes in the Bay of Bengal
measured by sediment traps. Deep-Sea Research Part I 44,
793–810.
Rao, V.P., 1991. Clay mineral distribution in the continental
shelf sediments from Krishna to Ganges River mouth, east
coast of India. Indian Journal of Marine Sciences 20, 7–12.
Rao, V.P., Kessarkar, P.M., 2001. Geomorphology and
geology of the Bay of Bengal and the Andaman Sea. In:
Sen Gupta, R., Desa, E. (Eds.), The Indian Ocean: A
Perspective, vol. 2. Oxford & IBH, New Delhi, India,
pp. 817–868.
Rao, V.P., Rajagopalan, G., Vora, K.H., Almeida, F., 2003.
Late Quaternary sea level and environmental changes from
relic carbonate deposits of the western margin of India.
Proceedings of the Indian Academy of Sciences (Earth and
Planetary Sciences) 112, 1–25.
Rea, D.K., 1992. Delivery of Himalayan sediment to the
Northern Indian Ocean and its relation to global climate,
sea level, uplift and seawater strontium. In: Duncan, R.A.,
et .al. (Eds.), Synthesis of Results From Scientific Drilling in
the Indian Ocean: Geophysical Monograph, vol. 70.
pp. 387–402.
Revel, M., Cremer, M., Grousset, F.E., Labeyrie, L., 1996.
Grain-size and Sr–Nd isotopes as tracers of paleo-bottom
current strength, Northeast Atlantic Ocean. Marine Geol-
ogy 131, 233–249.
Robinson, S.G., 1986. The Late Pleistocene paleoclimatic
record of North Atlantic deep-sea sediments revealed by
mineral magnetic measurements. Physics of the Earth and
Planetary Interiors 42, 22–47.
Sarin, M.M., Krishnaswamy, S., Dilli, K., Somayajulu, B.L.K.,
Moore, W.S., 1989. Major ion chemistry of the Gang-
a–Brahmaputra River system: weathering processes and
fluxes to the Bay of Bengal. Geochimica et Cosmochimica
Acta 53, 997–1009.
Schott, F.A., McCreary, J.P., 2001. The monsoon circulation of
the Indian Ocean. Progress in Oceanography 51, 1–123.
Segall, M.P., Kuehl, S.A., 1992. Sedimentary processes on the
Bengal continental shelf as revealed by clay-size mineralogy.
Continental Shelf Research 12, 517–541.
Shetye, S.R., Shenoi, S.S.C., Gouveia, A.D., Michael, G.S.,
Sundar, D., Nampoothiri, G., 1991. Wind-driven coastal
upwelling along the western boundary of the Bay of Bengal
during the southwest monsoon. Continental Shelf Research
11, 1379–1408.
Shetye, S.R., Gouveia, A.D., Shenoi, S.S.C., Sundar, D.,
Michael, G.S., Nampoothiri, G., 1993. The western
boundary current of the seasonal subtropical gyre in the
Bay of Bengal. Journal of Geophysical Research 98 (C1),
945–954.
Shetye, S.R., Gouveia, A.D., Shenoi, S.S.C., Vinayachandran,
P.N., Sundar, D., Michael, G.S., Nampoothiri, G., 1996.
Hydrography and circulation in the western Bay of Bengal
during the northeast monsoon. Journal of Geophysical
Research 101, 14011–14025.
Siddiquie, H.N., 1967. Recent sediments of the Bay of Bengal.
Marine Geology 5, 249–291.
Stow, D.A.V., Cochran, J.R., ODP 116 Shipboard scientific
party, 1989. The Bengal Fan: some preliminary results from
ODP drilling. Geo-Marine Letters 9, 1–10.
ARTICLE IN PRESS
P.M. Kessarkar et al. / Deep-Sea Research I 52 (2005) 1591–1615 1615
Stow, D.A.V., Wetzel, A., 1990. Hemiturbidites: a new type of
deep-water sediment. In: Cochran, J.R., Curray, J.R.,
Sager, W.W., Stow, D.A.V. (Eds.), Proceedings of the
Ocean Drilling Program Scientific Results, vol. 116, pp.
25–34.
Stow, D.A.V., Amano, K., Balson, P.S., Brass, G.W., Corrigan,
J., Raman, C.V., Tiercelin, J.J., Townsend, M., Wijaya-
nanda, N.P., 1990. Sediment Facies and processes on the
distal Bengal Fan, Leg 116. In: Cochran, J.R., Curray, J.R.,
Sager, W.W., Stow, D.A.V. (Eds.), Proceedings of the
Ocean Drilling Program Scientific Results, vol. 116,
pp. 377–396.
Stuiver, M., Reimer, P.J., Bard, E., Beck, J.W., Burr, G.S.,
Hughen, K.A., Kromer, B., McCormac, F.G., vander
Plicht, J., Spurkm, M., 1998. INTCAL 98 radiocarbon
age calibration, 24000-0 cal BP. Radiocarbon 40,
1041–1083.
Subramanian, V., 1980. Mineralogical input of suspended
matter by Indian Rivers into the adjacent areas of the
Indian Ocean. Marine Geology 36, M29–M34.
Suresh, N., Bagati, T.N., 1998. Calcium carbonate distribution
in the Late Quaternary sediments of Bay of Bengal. Current
Science 74, 977–984.
Thompson, R., Oldfield, F., 1986. Environmental Magnetism.
Allen & Unwin Publishers Ltd., UK 227pp.
Udintsev, G.B., 1975. Geological Geophysical Atlas of the
Indian Ocean, IOC, UNESCO. Pergamon Press, New York
151pp.
Venkataratnam, K., Biscaye, P.E., 1973. Clay mineralogy and
sedimentation in the eastern Indian Ocean. Deep-Sea
Research 20, 727–738.
von der Borch, C.C., Sclater, J.C., Stefan Jr., G., Hekinion, R.,
Johnson, S.A., Mc. Gownan, N., Pimm, A.C., Thompson,
R.W., Veevers, J.J., 1972. Deep Sea Drilling Project, Leg 22.
Geotimes 17, 15–17.
Walter, H.J., Hegner, E., Diekmann, B., Kuhn, G., Rutgers van
der loeff, M.M., 2000. Provenance and transport of
terrigenous sediment in the south Atlantic Ocean and their
relations to glacial and interglacial cycles: Nd and Sr
isotopic evidence. Geochimica et Cosmochimica Acta 64,
3813–3827.
Warren, B.A., 1982. The deep water of the Central Indian
Basin. Journal of Marine Research 40 (Suppl.), 823–860.
Weber, M.E., Wiedick, M.H., Kudrass, H.R., Hubscher, C.,
Erlenkeuser, H., 1997. Active growth of the Bengal
Fan during sea level rise and highstand. Geology 25,
315–318.
Weber, M.E., Wiedicke-Hombach, M., Kudrass, H.R., Erlen-
keuser, H., 2003. Bengal Fan sediment transport activity
and response to climate forcing inferred from sediment
physical properties. Sedimentary Geology 155, 361–381.
Wetzel, A., 1990. Consolidation characteristics and permeabil-
ity of Bengal Fan sediments drilled during Leg 116. In:
Cochran, J.R., Curray, J.R., Sager, W.W., Stow, D.A.V.
(Eds.), Proceedings of the Ocean Drilling Program Scientific
Results, vol. 116, pp. 363–368.
Related Documents