Changing paradigm of a quiet ocean: New mixing regime emerges in the eastern Arctic Ocean NCC Letters: Main text <2000 words and 5 display items, up to 30 references, no section heads (will be removed later), 90 symbols for title. Referenced <200 word introductory paragraph (a part of Intro will be included here) 1 1 2 3 4 5 6 7 8 9 10 11 12 13 14 15 16 17 18 19 20 21 22 23 24 25 26 27 28 29 30 31 32 33 34 35 36 37

Welcome message from author
This document is posted to help you gain knowledge. Please leave a comment to let me know what you think about it! Share it to your friends and learn new things together.
Transcript

Changing paradigm of a quiet ocean: New mixing regime emerges in the eastern Arctic Ocean
NCC Letters: Main text <2000 words and 5 display items, up to 30 references, no section heads (will be removed later), 90 symbols for title.
Referenced <200 word introductory paragraph (a part of Intro will be included here)
Now text (lines 46-209) includes 2228 words (exceeding the limit by 228 words).
1
1234
56789
1011121314151617181920212223242526272829303132333435363738394041424344

1. IntroductionSeveral features make the Arctic Ocean unique and different from any other ocean on Earth, including its Southern Hemisphere ice-covered counterpart – the Southern Ocean. One of these features is unique Arctic Ocean stratification – vertical separation of water masses with highly distinct temperature and salinity (and, as a result, density) structure (Fig. 1). Strongly stratified halocline (50-150m) separates near-freezing fresh surface waters forming the Arctic surface mixed layer (SML) from warm (temperature >0oC) and salty waters of Atlantic origin (the so-called Atlantic Water, AW) which are transported at intermediate depths (~150-900 m) through the deep basins of the Arctic Ocean by topographically-steered pan-Arctic boundary currents (e.g. Aagaard 1989, Rudels et al. 1994, McLaughlin et al. 2009). The stratification of the halocline plays the key role in the Arctic system impeding vertical mixing and the upward transport of AW heat to the base of sea-ice cover (e.g. Rudels et al. 1996). However, Polyakov et al. 2017 showed that recent ice reductions and weakening of the halocline in the eastern Eurasian Basin (EB) have enhanced release of AW heat and reduced, substantially, rates of regional winter sea-ice formation. In the Canadian Basin, the lateral injection of relatively fresh Pacific-origin waters at intermediate (60-220 m) depths further strengthens stratification to inhibit heat exchange between the AW and the SML (McLaughlin et al. 2004, Steele et al 2004). Another characteristic feature of the Arctic Ocean’s potential temperature and salinity S profiles is the presence of layers of near-uniform and S separated by strong-gradient, relatively thin interfaces (Fig. 1b,c 1d is not discussed!). These "thermohaline staircases" arise through the effect of the different molecular diffusivities of heat and salt (Turner 1973), and are found over a large portion of the Arctic Ocean (e.g. Timmermans et al. 2008). The so-called diffusive instability, one form of double diffusion (DD), is found where cold and fresh water lies above warm and salty water, typically above the depth of maximum θ in the AW layer. Carmack et al. (2015) provided a summary of estimates of DD heat fluxes ranging from of 0.02-0.1 W/m2 above the AW core (320–430 m) in the Canada Basin to several W/m2 along the eastern EB boundary. Using newly acquired data, in this analysis we demonstrate that consequences of weakening of halocline stratification recently found in the eastern EB (Polyakov et al. 2017) are far reaching. Particularly, we provide evidence of emerging new regime of mixing dominated by turbulence and not by DD in this region of the Arctic Ocean – a shift of paradigm of weakly mixed polar basin? We also show…
2. Loss of halocline stratification in the eastern Eurasian Basin
Notable warming and salinification were found in the halocline (60-150m) in recent years compared to the climatologic mean from the 1970s, resulting in an increase of density and weakening of stratification (Polyakov et al. 2010, 2017). Loss of stratification below the SML continued in recent 10-15 years as evidenced by statistically significant decrease of Brunt-Väisälä frequency (N, a measure of the static stability of the water column) from the 2000s to the 2010s (Fig. 2a). According to Steele and Boyd (1998) and Polyakov et al. (2010), halocline in the eastern EB was progressively less stratified for at least several decades so that averaged over the 100–300m layer the N fell by 30% from the 1970s to the 1990s. In the early 2010s, the system passed a threshold beyond which the halocline in this part of the Arctic Ocean lost its fundamental property of being an effective barrier for the AW heat. As a result, weaker stratification and shoaling of the AW, together with net loss in ice volume, allow progressively deep winter
2
45464748495051525354555657585960616263646566676869707172737475
76
777879808182838485868788

ventilation in the eastern EB (Polyakov et al. 2017). And, despite overall cooler AW in the 2010s compared with the mid-to-late 2000s (e.g. Polyakov et al. 2012b, 2017), this ventilation has resulted in enhanced upward AW heat fluxes, key to establishing the diminished sea-ice cover in the eastern EB during recent years.
3. Amplification of currents and shear in the eastern Eurasian Basina. Overview
Surface circulation of the Arctic Ocean is closely linked to atmospheric forcing transmitted to ocean in ice covered waters via sea ice drift. Variability of sea ice drift from seasonal to interdecadal time scales is well established through satellite and buoy observations. For example, using buoy drifts provided by the International Arctic Buoy Programme, Rampal et al. (2009) found an increasing drift speed between 1978 and 2007 of 17 ± 4.5% per decade in winter and 8.5 ± 2.0% per decade in summer. Somewhat lower, 10.6 ± 0.9% per decade, satellite-derived basin-scale rates of intensification of sea-ice drift in winter were reported by Spreen et al. (2011) for 1992–2008. Using 33 years (1982-2009) of satellite observations, Kwok et al. (2013) found the largest trends in drift speeds between 2001 and 2009 in both winter (23.6% per decade) and summer (17.7% per decade). Much smaller trends in wind speed for the same period of time suggested that the observed enhanced mobility of sea ice was a response to changes in ice mechanics including reduced resistance to deformation, leading to an increased ocean surface stress (Martin et al. 2014). Satellite-derived estimates of Dynamic Ocean Topography were used by Armitage et al. (2017) to calculate monthly surface geostrophic circulation in the Arctic Ocean over 2003/14. They found an increase of geostrophic currents in the Arctic in the late 2000s, particularly in summertime. Armitage et al. estimates are overall consistent with mooring-based observations of Beaufort Gyre circulation intensified in autumn 2007 as a result of record low sea-ice extent, overall thinner pack ice (Giles et al. 2008) and strong and persistent winds (Petty et al. 2016) triggering wind-driven Ekman convergence and freshening in the Beaufort Sea and extreme sloping of sea-surface height (Proshutinsky et al., 2009, Giles et al., 2012, McPhee, 2013). Anomalously strong Beaufort Gyre persisted throughout 2007–2010, however regionally elevated circulation was observed up to 2014 (Armitage et al., 2017).
b. Intensification of total current speed in the EB
An intensification of the upper ocean circulation from 2004 through 2015 in a different region of the Arctic Ocean – the eastern EB – is evident from ADCP mooring records (Figs. 2-4 and Table 1). Mean current speed in the surface 60m layer in 2004/06 was 4.6 cm/s which is ~2 cm/s weaker compared with the current speed of 7.3 cm/s in 2013/15 (Table 1). This estimate is consistent with the positive linear trend of 0.16±0.01 cm/s year-1 computed using hourly ADCP observations available for 2004/15 so that over the 12-year period covered by mooring observations there was a substantial, almost 2 cm/s, and statistically significant increase of current speed. Vertical shear of horizontal currents in the upper 60m was also strongly amplified in recent years compared with the shear in the preceding decade (Table 1). Intensification of circulation in the eastern EB in recent years was not limited by the upper 50-60m; currents and their shear within the underlying halocline (110-140m) became stronger likewise (Figs. 2,3). For example, observations carried out by MMP profilers provide evidence of strong, 24-38%, increase of vertical shear of horizontal currents in the halocline from 2004 to 2015, with even stronger amplification of shear in summer ice-free seasons.
3
89909192
93
94
9596979899
100101102103104105106107108109110111112113114115116117
118
119120121122123124125126127128129130131132

c. Justification for the use of near-inertial part of the currents
Part of this increased mobility of the upper eastern EB is due to enhanced circulation within the so-called near-inertial band. Processes acting at time scales of hours to days are often the dominant components of Arctic ocean and ice velocity variability (e.g., Plueddemann, 1992; Kwok et al., 2003; Rainville and Woodgate, 2009; Gimbert et al., 2012). Tides and near-inertial motions dominate these highly variable in space and time processes. The inertial period, the period of an inertial oscillation, is 2π/f (~12 hours in the eastern EB), where f is the Coriolis parameter. Near-inertial oscillations are excited by variations in wind stress, and possibly also by ocean flow interactions with topography (e.g. McPhee 1978, Colony and Thorndike 1980, Price 1983, Gill 1984, D’Asaro et al. 1995, Kwok et al. 2003, Rainville and Woodgate 2009, Gimbert et al. 2012).
d. Intensification of near-inertial currents and their shear
Fig. 4 provides a convincing evidence for the intensified near-inertial currents and their shear from 2004 to 2015 showing that the maximum amplification of near-inertial currents and shear was in the top 15-25m layer during ice-free season, due to lack of damping effect of sea ice on wind-induced motions. This is consistent with findings of Rainville and Woodgate (2009) for the Pacific sector of the Arctic Ocean. At the same time, shear of the near-inertial currents in winter is almost as strong as in summer, with a seasonal pattern of the maximum shear following the development of the surface mixed layer. This pattern is evident in most mooring records available in 2013/15 from the eastern EB (Fig. S1). Table 1 presents a quantitative measure of this intensification showing a 4-6-fold increase of near-inertial currents (with stronger increase in winter) and 3.6 increase of their shear (with little seasonal difference) from 2004 to 2015. Rainville and Woodgate (2009) hypothesized that deepening (from summer to winter) of the maximum shear is caused by storms which generate internal waves during ice-free season deepening the surface mixed layer and enhancing mixing. The upward (from winter to summer) branch of near-inertial shear maximum cannot be explained by effect of wind, however. Due to similarity of the seasonal pattern of near-inertial shear and M2 semi-diurnal tidal currents computed using monthly running window (and therefore filtering out short-lived inertial motions, not shown), generation of baroclinic tidal and inertial waves in the layer of strong density gradients looks like a plausible hypothesis for the observed pattern.
4. Change of mixing regime in the eastern Eurasian Basin
The combination of weakening stratification and increasing shear in the upper eastern EB coincides with the switch in the mixing from a DD to turbulent mixing environment (Fig. 3). The three depth-time diagrams of potential temperature anomalies demonstrate very different coherence of the DD interfaces (tracked by blue-over-red ribbons) for 2004/05 and 2013/15 (Fig. 3a,c,e). The DD interfaces above the AW core were well expressed and coherent in the eastern EB in the early 2000s with consistently large values of vertical θ gradients (Fig. 3a, Polyakov et al. 2012a). In contrast, temporal coherence is lost in the early 2010s (Fig. 3c,e). We hypothesize that the loss of DD coherency and reduction of the number of DD steps with just a few small DD staircases found in MMP profiles in recent years (Fig. 3g) is caused by increased levels of mesoscale activity and turbulence. Similarly, Padman and Dillon (1991) and Rippeth et al. (2015) demonstrated that in the western Nansen Basin, east of 90oE, relatively strong turbulent mixing reduces coherence of DD staircases. The increased role of turbulent mixing is consistent with recent finding of transition of the eastern EB to conditions previously unique to the western
4
133
134135136137138139140141142143
144
145146147148149150151152153154155156157158159160161162
163
164165166167168169170171172173174175176

Nansen Basin called in (Polyakov et al. 2017) ‘atlantification,’ with attendant reductions in stratification and increased vertical mixing.
5. Discussion and conclusions Limited arctic observations suggest that, under compact ice, the wind-generated internal waves and associated mixing are weak (e.g. Rainville et al. 2011). However, changes in both stratification and flow described here could result in the development of supercritical flow, and consequently mixing, as reported for lower latitudes (Stephenson et al., 2015). Recent analysis of data, collected over sloping topography poleward of the critical latitude, complemented by high-resolution non-linear modeling study, demonstrated the key role of supercritical flow in the transfer of energy from the tide to turbulent mixing in high-latitude regions (Rippeth et al., 2017). In that, the Froude number, Fr, may be a useful diagnostic in the prediction of the location and evolution of mixing hot spots. A necessary condition for internal wave generation is that Fr should exceed the critical threshold value of 1. The temporal change of the Fr in recent years shown in Fig. 2c reveals a steady tendency for water flow in the upper eastern EB to become supercritical and so potentially susceptible to the generation of internal waves and additional mixing, even under very compact sea-ice cover. Moreover, summer flow at shallower moorings (e.g. M13, 1700m) has already become supercritical (not shown yet – will add fig to Supplement). [Do we need to show internal waves here? We lack history if we want to use temperature data for that and the only option would be hourly ADCP data.] An example of enhanced mixing in March–April of 2014 (Fig. S2) demonstrates that amplified velocity shear in the upper part of the relatively weakly stratified ocean results in efficient entrainment of waters from the halocline into the SML. We hypothesize that enhanced mixing below the base of the SML is associated with shear instabilities from downward-propagating near-inertial internal gravity waves caused by storms and baroclinic tides. Further studies on the thermodynamic coupling between oceanic layers and sea ice will provide insight into complex mixing processes occurring in the upper eastern EB of the Arctic Ocean.
Concluding statements:
New mixing regime – from DD to turbulent mixing.
Efficient mixing to great depths under compact ice.
Potential impacts on biogeochemical system.
Summarizing figure?
Methods summary (<3000 words) I will polish this part laterMooring ADCP measurements: Data provided by eight moorings deployed in the eastern EB in 2013-15 were used in this study. Six moorings (M11–M16) formed a cross-slope section spanning from 250m to 3400m; two single moorings M6b and M3e were deployed at 2700m and 1350m, respectively. Mooring locations are shown in Fig. 1. Shallow-water (250m) mooring M11 had an upward looking Acoustic Doppler Current Profiler (ADCP) 75-kHz measuring currents over the full depth range. All other moorings had upward looking ADCPs 300-kHz covering the upper 50-60m water column. In addition, moorings M3e and M6b had upward-looking ADCPs 75-kHz
5
177178
179180181182183184185186187188189190191192193194195196197198199200201202203
204
205
206
207
208
209
210211212213214215216217
covering 200-450m depth range. For the M14 mooring location, ADCP data for the upper 60m layer are available for 2004–07 and 2008-11. ADCPs provided current velocities, averaged over two- or five-meter (for the 300-kHz and 75-kHz instruments, respectively) vertical cells, with one-hour time resolution. The magnetic inclinations determined from the International Geomagnetic Reference Field for the mooring positions (see www.ngdc.noaa.gov/IAGA/vmod/) were added to the raw readings of the magnetic compass of each instrument. The manufacturer's estimates for 75- and 300-kHz ADCP accuracies are 0.5 % of measured speed and 2 ° for current direction. Mooring data used in this study are available on the web, at https://arcticdata.io/catalog/#view/arctic-data.7792.4 (Polyakov 2016).
MMP data: explain why three MMP-based mooring records are used for Fig. 3. Vertical resolution is 25cm. Daily profiles for 2004/05 and two-day sampling frequency for 2013/15 so that the total number of profiles used in this study is XX (M1b mooring, 2004/05), YY (M13 mooring, 2013/15) and ZZ (M15 mooring, 2013/15).
Following Pnyushkov and Polyakov (2012), tidal currents were computed according to the method described in Foreman (1978) using the MATLAB tide package (for details, see Pawlowicz et al. 2002). The standard properties of tidal currents (major and minor axes of tidal ellipses, Greenwich tidal phase, ellipse inclination, and corresponding 95% confidence intervals) were derived. The harmonic analysis for each depth level and for vertically averaged ADCP currents was conducted using a 30-day running window shifted by the sampling intervals (typically 1 hour, with several 15 or 30” records from the early years). Derived characteristics of tidal currents for each window were assigned for the center of the window. Estimating near-inertial currents: Firstly, we de-tided measured currents using barotropic tides. Then, we calculated band-passed de-tided currents between 10 and 14 hour periods and refer to the product of this procedure in the text as near-inertial currents.
Winds
Sea ice concentrations
Defining DD staircases: Following Polyakov et al. (2012a), locations of interfaces were highlighted by computing profiles of potential temperature anomaly θ’ = θ - θlp , where θlp is the low-passed profile of θ smoothed with a 17.5-m running window. For profiles characterized by thick homogeneous layers separated by thin, high-gradient interfaces, this analysis is not very sensitive to the choice of vertical filtering scale characterizing the background stratification. As a profile crosses a DD interface, θ’ switches rapidly from a large negative value above the interface to a large positive value below it, so that the interface depth can be accurately located and tracked. A feature is identified as DD staircase if potential temperature at two points above and two points below DD interface are not distinguishable beyond the accuracy of measurements (0.003oC).
Defining Froude (Fr) and Richardson (Ri) numbers: A Fr and Ri number analysis was carried out, using the stratification derived from MPP observations and velocity measurements provided by mooring ADCPs over September 1 through November 15 (period with the best data coverage) for 2004–2015. Stratification in the 100-120m layer was quantified using Brunt-Väisälä buoyancy frequency (N), N2=g/o/z, where is the density of seawater, o is the reference density (1030 kg m-3), and g is the acceleration due to gravity acceleration. Ri was estimated as
6
218219220221222223224225226227
228229230231
232233234235236237238239240241242
243
244
245246247248249250251252253254
255256257258259260

Ri = N/uz and Fr was computed as Fr = |u| /[N*H], where uz vertical shear of horizontal current u in the upper 60m and H is the thickness of the layer used for evaluation of N. Stratification is also available for the shallower (up to 60m) layers, but for fewer years; these estimates demonstrate stronger contract of stratification between recent and earlier years (not shown) so the estimates presented here may be viewed as more conservative. However, because of the use of estimates of stratification and dynamical properties from different parts of the water column, we view estimates of Fr and Ri as proxies.
References
Aagaard, K. A synthesis of Arctic Ocean circulation. Rapp. P.-v. Reun. Cons. Int. Explor. Mer. 188, 11-22 (1989).
Armitage, T. W. K., Bacon, S., Ridout, A. L., Petty, A. A., Wolbach, S. & Tsamados, M. Arctic Ocean surface geostrophic circulation 2003-2014. The Cryosphere. 11, 1767-1780, doi:10.5194/tc-2017-22 (2017).
Carmack E., Polyakov, I. V., Padman, L., Fer, I., Hunke, E., Hutchings, J., Jackson, J., Kelley, D., Kwok, R., Layton, C., Perovich, D., Persson, O., Ruddick, B., Timmermans, M.-L. Toole, J., Ross, T., Vavrus, S. & Winsor, P. Toward quantifying the increasing role of oceanic heat in sea ice loss in the new Arctic, BAMS, 96(12), 2079-2105. doi:10.1175/BAMS-D-13-00177.1 (2015).
Colony, R. & Thorndike, A. S. The horizontal coherency of the motion of summer Arctic sea ice. J. Phys. Oceanogr. 10, 1281–1289 (1980).
Crawford, G. B, Padman, L. & McPhee, M. G. Turbulent mixing in Barrow Strait. Cont. Shelf Res. 19, 205-245 (1999).
D’Asaro, E. A. & Morison, J. H. Internal waves and mixing in the Arctic-Ocean. Deep-Sea Res. Part I. 39(2A), S459-S484 (1992).
D'Asaro, E. A., Eriksen, C. C., Levine, M. D., Paulson, C. A., Niiler, P. & Meurs, P. V. Upper-Ocean Inertial Currents Forced by a Strong Storm. Part I: Data and Comparisons with Linear Theory. J. Phys. Oceanogr. 25, 2909–2936 (1995).
Fer, I. Near-inertial mixing in the central Arctic Ocean. J. Phys. Oceanogr. 44, 2031–2049 (2014).
Giles, K. A., Laxon, S. W. & Ridout, A. L. Circumpolar thinning of the Arctic sea ice following the 2007 record ice extent minimum. Geophys. Res. Lett. 35, L22502, https://doi.org/10.1029/2008GL035710 (2008).
Giles, K. A., Laxon, S. W., Ridout, A. L., Wingham, D. J. & Bacon, S. Western Arctic Ocean freshwater storage increased by wind-driven spin-up of the Beaufort Gyre. Nat. Geosci. 5, 194–197, doi10.1038/ngeo1379 (2012).
Gill, A. E. On the behavior of internal waves in the wakes of storms. J. Phys. Oceanogr. 14, 1129-1151 (1984).
Gimbert, F., Marsan, D., Weiss, J., Jourdain, N. C. & Barnier, B. Sea ice inertial oscillations in the Arctic Basin. The Cryosphere. 6, 1187-1201, doi:10.5194/tc-6-1187-2012 (2012).
Kwok, R., Cunningham, G. F. & Hibler III, W. D. Sub-daily sea ice motion and deformation from RADARSAT observations. Geophys. Res. Lett. 30(23), 2218, doi:10.1029/2003GL018723 (2003).
7
261262263264265266267
268
269
270271272273274275276277278279280281282283284285286287288289290291292293294295296297298299300301302303

Kwok, R., Spreen, G. & Pang, S. Arctic sea ice circulation and drift speed: Decadal trends and ocean currents.J. Geophys. Res.: Oceans, 118, doi:10.1002/jgrc.20191 (2013)
Martin, T., Steele, M. & Zhang, J. Seasonality and long-term trend of Arctic Ocean surface stress in a model. J. Geophys. Res.: Oceans. 119, doi:10.1002/2013JC009425 (2014).
McLaughlin, F. A., Carmack, E. C., Macdonald, R. W., Melling, H. & Swift, J. H. On the juxtaposition of Atlantic and Pacific–origin waters in the Canada Basin, 1997-1998. Deep-Sea Research. 51, 107-128 (2004).
McLaughlin, F. A., Carmack, E. C., Williams, W. J., Zimmermann, S., Shimada, K. & Itoh, M. Joint effects of boundary currents and thermohaline intrusions on the warming of Atlantic water in the Canada Basin, 1993–2007. J. Geophys. Res. 114, C00A12, doi:10.1029/2008JC005001 (2009).
McPhee, M. G. Simulation of inertial oscillation in drifting pack ice. Dyn. Atmos. Oceans, 2(2), 107–122 (1978).
McPhee, M. G. Intensification of geostrophic currents in the Canada basin, Arctic Ocean. J. Climate, 26, 3130–3138, https://doi.org/10.1175/JCLI-D-12-00289.1 (2013).
Padman, L. & Dillon, T. M. Turbulent mixing near the Yermak Plateau during the Coordinated Eastern Arctic Experiment. J. Geophys. Res. 96, 4769-4782 (1991).
Petty, A. A., Hutchings, J. K., Richter-Menge, J. A. & Tschudi, M. A. Sea ice circulation around the Beaufort Gyre: The changing role of wind forcing and the sea ice state. J. Geophys. Res.-Oceans. 121, 3278–3296, https://doi.org/10.1002/2015JC010903 (2016).
Plueddemann, A. J. Internal wave observations from the Arctic environmental drifting buoy. J. Geophys. Res., Oceans. 97(C8), 12619-12638 (1992).
Polyakov, I. V., Timokhov, L. A., Alexeev, V. A., Bacon, S., Dmitrenko, I. A., Fortier, L., Frolov, I. E., Gascard, J.-C., Hansen, E., Ivanov, V. V., Laxon, S., Mauritzen, C., Perovich, D., Shimada, K., Simmons, H. L., Sokolov, V. T., Steele, M. & Toole, J. Arctic Ocean warming reduces polar ice cap. J. Phys. Oceanogr. 40, 2743–2756DOI: 10.1175/2010JPO4339.1 (2010).
Polyakov, I. V., A. V. Pnyushkov, R. Rember, V. V. Ivanov, Y-D. Lenn, L. Padman and E. C. Carmack, Mooring-based observations of the double-diffusive staircases over the Laptev Sea slope, J. Phys. Oceanogr., 42, 95 –109, DOI: 10.1175/2011JPO4606.1 (2012a).
Polyakov, I. V., Pnyushkov, A. V. & Timokhov, L. A. Warming of the intermediate Atlantic Water of the Arctic Ocean in the 2000s. J. Climate. 25(23), 8362–8370, DOI 10.1175/JCLI-D-12-00266.1 (2012b).
Polyakov, I. V., Pnyushkov, A. V., Alkire, M., Ashik, I. M., Baumann, T., Carmack, E., Goszczko, I., Ivanov, V., Kanzow, T., Krieshfield, R., Kwok, R., Sundfjord, A., Morison, J., Rember, R. & Yulin, A. Greater role for Atlantic inflows on sea-ice loss in the Eurasian Basin of the Arctic Ocean. Science. 356(6335), 285-291, doi:10.1126/science.aai8204 (2017).
Price, J. F. Internal wave wake of a moving storm. Part I. Scales, energy budget and observations. J. Phys. Oceanogr. 13, 949–965 (1983).
Proshutinsky, A., Krishfield, R., Timmermans, M.-L., Toole, J., Carmack, E., McLaughlin, F., Williams, W. J., Zimmerman, S., Itoh, M., and Shimada, K. Beaufort Gyre freshwater reservoir: State and variability from observations. J. Geophys. Res.-Oceans. 114, C00A10, https://doi.org/10.1029/2008JC005104 (2009).
8
304305306307308309310311312313314315316317318319320321322323324325326327328329330331332333334335336337338339340341342343344345346347

Rainville, L. & Woodgate R. A. Observations of internal wave generation in the seasonally ice-free Arctic. Geophys. Res. Lett. 36, L23604, doi:10.1029/2009GL041291 (2009).
Rainville, L., Lee, C. M. & Woodgate, R. A. Wind-driven mixing in the Arctic Ocean. Oceanography, 24, 137–145 (2011).
Rampal, P., Weiss, J. & Marsan, D. Positive trend in the mean speed and deformation rate of Arctic sea ice, 1979–2007. J. Geophys. Res. 114, C05013, doi:10.1029/2008JC005066 (2009).
Rippeth, T. P., Lincoln, B. J., Lenn, Y. D., Green, J. M., Sundfjord, A. & Bacon, S. Tide-mediated warming of Arctic halocline by Atlantic heat fluxes over rough topography. Nature Geosci. 8, 191–194, doi:10.1038/ngeo2350 (2015).
Rippeth, T. P. Tidal conversion and mixing poleward of the critical latitude … (2017).Rudels, B., Jones, E. P., Anderson, L. G. & Kattner. G. On the intermediate depth waters of the
Arctic Ocean, In: Johannessen, O.M., R. D. Muench, and J. E. Overland (Eds.), The Polar Oceans and Their Role in Shaping the Global Environment: The Nansen Centennial Volume, Geophys. Monogr. Ser., vol. 85, pp. 33-46, AGU, Washington, D. C. (1994).
Rudels, B., Anderson, L. G. & Jones, E. P. Formation and evolution of the surface mixed layer and halocline of the Arctic Ocean. J. Geophys. Res. 101, 8807-8821 (1996).
Spreen, G., Kwok, R. & Menemenlis, D. Trends in Arctic sea ice drift and role of wind forcing: 1992-2009. Geophys. Res. Lett. 38, L19501, doi:10.1029/2011GL048970 (2011).
Steele, M., J. Morison, W. Ermold, I. Rigor, M. Ortmeyer, and K. Shimada, Circulation of summer Pacific halocline water in the Arctic Ocean. J. Geophys. Res. 109, C02027, doi:10.1029/2003JC002009 (2004).
Stephenson, G. R., Hopkins, J. E., M. Green, J. A., Inall, M. E. & Palmer, M. R. Wind mixing by storms modifies baroclinic energy flux on the Celtic Sea shelf. Geophys. Res. Letts. doi:10.1002/2014GL062627 (2015).
Timmermans, M.-L., Toole, J., Krishfield, R. & Winsor, P. Ice-Tethered Profiler observations of the double-diffusive staircase in the Canada Basin thermocline. J. Geophys. Res., 113, C00A02, doi:10.1029/2008JC004829 (2008).
Turner, J. S. Buoyancy effects in fluids, Cambridge University Press, New York, 368 pp. (1973).
Acknowledgments
The ship-based oceanographic observations in the eastern EB and Laptev Sea were conducted under the working frame of the NABOS project with support from NSF (grants AON-1203473 and AON-1338948). Analyses presented in this paper are supported by NSF grants 1249133, 1249182, and 1708427.
9
348349350351352353354355356357358359360361362363364365366367368369370371372373374375376
377
378379380381
382
383

Figure captions
Figures
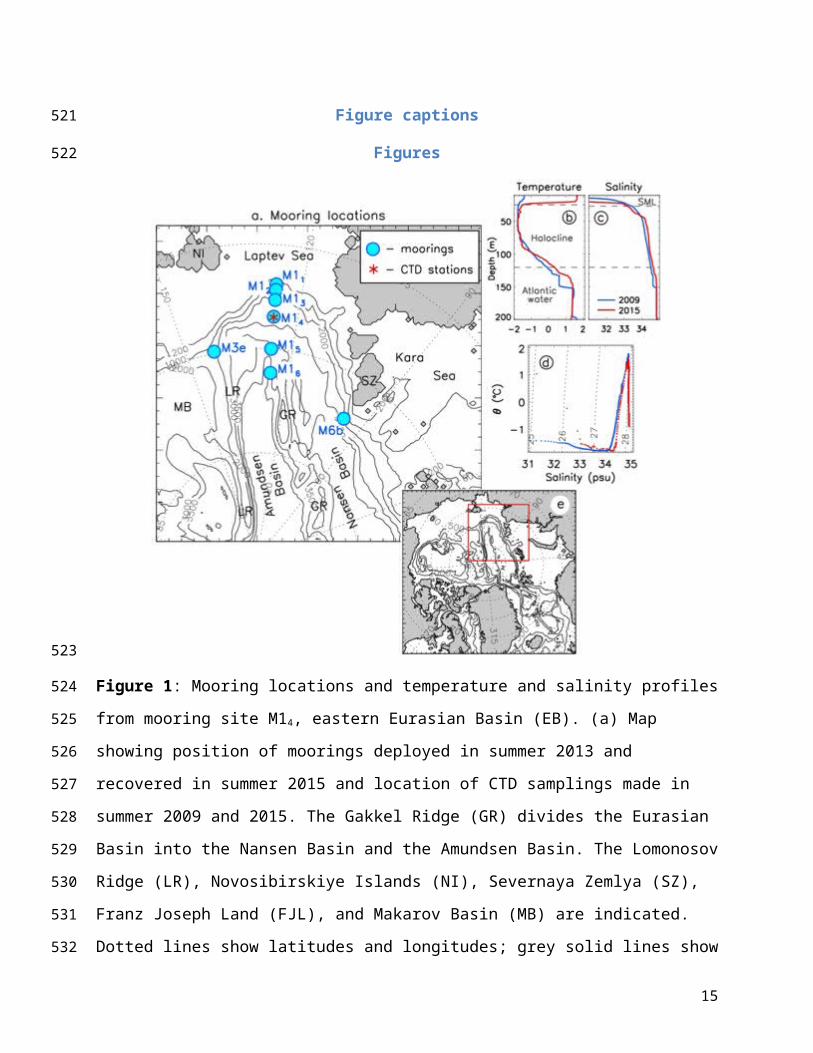
Figure 1: Mooring locations and temperature and salinity profiles from mooring site M14, eastern
Eurasian Basin (EB). (a) Map showing position of moorings deployed in summer 2013 and
recovered in summer 2015 and location of CTD samplings made in summer 2009 and 2015. The
Gakkel Ridge (GR) divides the Eurasian Basin into the Nansen Basin and the Amundsen Basin.
The Lomonosov Ridge (LR), Novosibirskiye Islands (NI), Severnaya Zemlya (SZ), Franz Joseph
Land (FJL), and Makarov Basin (MB) are indicated. Dotted lines show latitudes and longitudes;
grey solid lines show depth in meters. Vertical profiles of (b) potential water temperature and (c)
salinity showing shoaling of Atlantic water (AW), increase of salinity (and, as a result, loss of
water column stability), and loss of double-diffusive staircases in halocline and upper AW the
10
384
385
386
387
388
389
390
391
392
393
394
395

2010s compared with the 2000s. (d) Potential temperature () – salinity diagram. (e) Larger area
with the position of smaller segment from (a) as indicated by red box.
Figure 2: Estimates of annual mean (a) squared Brunt-Väisälä frequency N2, (b) current
magnitude |U| and vertical shear of horizontal currents Uz, and (c) Froude number Fr for 110-
140m depth range for the M14 mooring location (for 2013/15, estimates are obtained by spatial
averaging from nearby M13 and M15 mooring records; for details, see Method Summary).
Statistical significance is shown at 95% confidence level. Note a strong increase in time of the
currents and, particularly, their shear and decrease of stratification in halocline.
11
396
397
398
399
400
401
402
403
404
405

Figure 3: Indication of a switch from a double diffusive (DD) environment to a turbulently mixed environment in the eastern EB of the Arctic Ocean. (a-f) Depth (vertical) vs time (horizontal) sections of (a,c,e) potential temperature anomalies and (b,d,f) velocity shear from the 2003–04 (M1b mooring, a,b) and 2013-15 (M13 and M15 moorings, c,d and e,f) MMP records. anomalies are computed relative to vertical means defined within a 3-m running window. White segments identify missing data. (g) Estimates of PDFs for the potential temperature vertical gradients z over the DD interfaces. N in corresponding color indicates the number of DD interfaces identified in 100-160m depth range over all available profiles (roughly 365 for each mooring record).(h) and (i) Vertical profiles of the mean current velocity and vertical shear of horizontal velocity.
12
406
407408409410411412413414415416
Figure 4: Annual records of magnitude of the near-inertial currents |Unear-inertial| (left) and their
shear (right) in the upper ocean layer at M14 mooring location (see Fig. 1) as a function of time
and depth. White segments show missing data. Black-grey-white bar over each panel shows
daily sea-ice concentration from 0% (black) to 100% (white) with linear color scale in between.
13
417
418
419
420
421
422
Table 1: Annual and seasonal mean magnitude of near-inertial currents |Unear-inertial| and their shear
in the upper 60m layer at M14 mooring location.
14
|Unear-inertial|, cm/s Shear of Unear-inertial, 103 s-1
Annual Winter Summer Annual Winter Summer
2013 – 20152.5 ± 0.0 2.3 ± 0.0 3.1 ± 0.0 4.14 ± 0.01 3.87 ± 0.01 4.73 ± 0.02
2008 – 20091.2 ± 0.0 1.1 ± 0.0 1.2±0.0 3.13+0.01 3.02 ± 0.01 3.43 ± 0.02
2006 – 20070.5 ± 0.0 0.4 ± 0.0 1.0 ±0.0 1.22 ± 0.00 1.15 ± 0.00 1.71 ± 0.01
2005 – 20060.7 ± 0.0 0.8 ± 0.0 0.6 ± 0.0 1.96 ± 0.01 1.92 ± 0.01 2.08 ± 0.03
2004 – 20050.4 ± 0.0 0.3±0.0 0.7 ± 0.0 1.14 ± 0.00 1.09 ± 0.00 1.25 ± 0.01
423
424
425
426
427
428
429
430
431
432
433
Supplementary Materials
Figure Sa: 2013-2015 mean estimates of (top) squared Brunt-Väisälä frequency N2, and vertical shear of horizontal currents Uz for (middle) 20-60m and (bottom) 190-230m depth ranges where the mooring records from M13, M14, and M15 overlap. Statistical significance is shown at 95% confidence level.
15
434
435
436437438439

Figure Sb: Daily time series (blue lines) and estimates of annual means (horizontal red segments) of (from top to bottom) current speed |U|, vertical shear of horizontal currents Uz, squared Brunt-Väisälä frequency N2, and Froude number Fr. Statistical significance of estimates of means is shown in Fig. 2.
16
440
441442443444
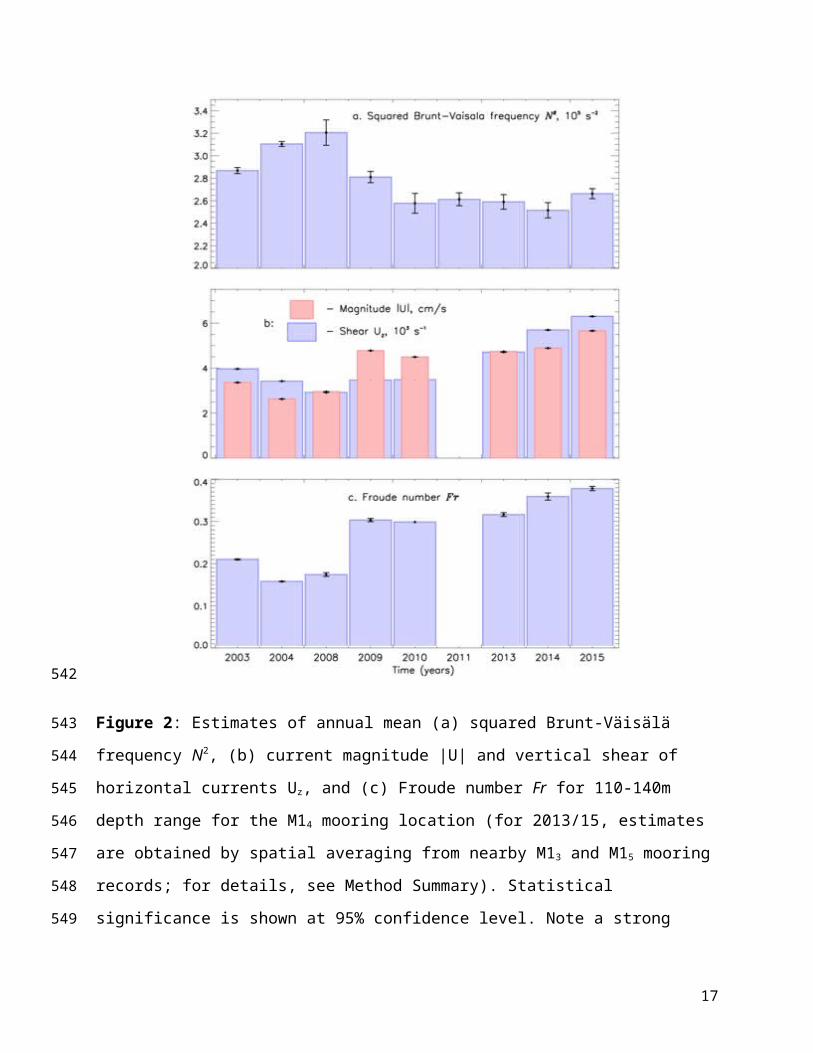
Figure S1: Magnitude of the near-inertial currents |Unear-inertial| (left) and their shear (right) in the
upper ocean layer derived from ADCP 300 kHz at seven mooring locations as a function of time
and depth. Black-grey-white bar over each panel shows daily sea-ice concentration from 0%
(black) to 100% (white) with linear color scale in between.
17
445
446
447
448
449
450

Figure S2: (From top to bottom): Time series of daily wind speed (blue) and near-inertial shear
at 10m; black-grey-white bar over the top panel shows daily sea-ice concentration from 0%
(black) to 100% (white) with linear color scale in between. Vertical shear of horizontal
velocities, potential temperature, salinity, potential density and squared Brunt-Väisälä frequency
at M16 mooring location as a function of time and depth in January - April 2014. Make a story
here.
18
451
452
453
454
455
456
457
Related Documents