Changes in Water Resources Systems: Methodologies to Maintain Water Security and Ensure Integrated Management (Proceedings of Symposium HS3006 at IUGG2007, Perugia, July 2007). IAHS Publ. 315, 2007. 9 Changes in water resources availability for crop systems: a case study in the region of Umbria FRANCESCA TODISCO, LORENZO VERGNI & ALESSANDRA VINCI Department of Civil and Environmental Engineering, University of Perugia, Borgo XX Giugno 74, I-06100 Perugia, Italy [email protected] Abstract Water resources management must find a solution for competition among multi-users in agriculture. In particular, water for irrigation purposes, which has traditionally been the main factor to be satisfied, now competes with other strategic uses. Added to these socio-political changes are the climatic changes which influence both the water supply and demand, particularly for agriculture, which is greatly influenced by meteorological conditions (evapotranspiration, soil–crop–atmosphere water exchange, crop phenology). The aim of the paper is to discuss the potential effect of climatic changes on agricultural water requirements and on agricultural drought risk in the Region of Umbria, Italy. An analysis aimed at detecting the presence of trends in a set of meteorological, agrometeorological and drought indices was carried out in five different areas. Time trends for all variables were analysed using both parametric and nonparametric approaches. The results show that over the past 54 years the trends are higher in southeastern Umbria. In particular, significant upward time trends for the thermometric regime and downward trends for the rainfall regime were found. The irrigation requirements and the drought index show high upward trends at some locations where expected irrigation demand increments were estimated. Key words agricultural drought index; climate change; crop water requirements INTRODUCTION Over the long-term, climate change, particularly global warming and precipitation dynamics, could affect agriculture in a number of ways (Olesen & Bindi, 2002), some of which would threaten crop water requirements. In the countries of the Mediterranean basin, irrigation is still today considered to be the activity with the greatest demand for water resources. Moreover, the signs observed of climate change lead one to suppose that water consumption for irrigation purposes is increasing because of the overall warming (Arnell, 1999). This thinking appears to be due to the meteorological approach adopted to analyse the problem. There are, in fact, relatively few studies on the effects of climatic trends on agricultural water consumption, and they are often based only on the analysis of long time series of climatic data (precipitation, temperature and their processing). Agricultural water use is instead highly influenced by the soil–plant–atmosphere water fluxes and consequently by the crop patterns too (Maracchi et al., 2005). In particular, the regulating function of the soil water zone and the specific plant’s ability to modify its phenology can cause a “lamination” of the water shortage peaks and therefore a mitigation of the potential irrigation water requirement trends. This hypothesis is also supported by Moonen et al. Copyright © 2007 IAHS Press

Welcome message from author
This document is posted to help you gain knowledge. Please leave a comment to let me know what you think about it! Share it to your friends and learn new things together.
Transcript

Changes in Water Resources Systems: Methodologies to Maintain Water Security and Ensure Integrated Management (Proceedings of Symposium HS3006 at IUGG2007, Perugia, July 2007). IAHS Publ. 315, 2007.
9
Changes in water resources availability for crop systems: a case study in the region of Umbria FRANCESCA TODISCO, LORENZO VERGNI & ALESSANDRA VINCI Department of Civil and Environmental Engineering, University of Perugia, Borgo XX Giugno 74, I-06100 Perugia, Italy [email protected] Abstract Water resources management must find a solution for competition among multi-users in agriculture. In particular, water for irrigation purposes, which has traditionally been the main factor to be satisfied, now competes with other strategic uses. Added to these socio-political changes are the climatic changes which influence both the water supply and demand, particularly for agriculture, which is greatly influenced by meteorological conditions (evapotranspiration, soil–crop–atmosphere water exchange, crop phenology). The aim of the paper is to discuss the potential effect of climatic changes on agricultural water requirements and on agricultural drought risk in the Region of Umbria, Italy. An analysis aimed at detecting the presence of trends in a set of meteorological, agrometeorological and drought indices was carried out in five different areas. Time trends for all variables were analysed using both parametric and nonparametric approaches. The results show that over the past 54 years the trends are higher in southeastern Umbria. In particular, significant upward time trends for the thermometric regime and downward trends for the rainfall regime were found. The irrigation requirements and the drought index show high upward trends at some locations where expected irrigation demand increments were estimated. Key words agricultural drought index; climate change; crop water requirements
INTRODUCTION Over the long-term, climate change, particularly global warming and precipitation dynamics, could affect agriculture in a number of ways (Olesen & Bindi, 2002), some of which would threaten crop water requirements. In the countries of the Mediterranean basin, irrigation is still today considered to be the activity with the greatest demand for water resources. Moreover, the signs observed of climate change lead one to suppose that water consumption for irrigation purposes is increasing because of the overall warming (Arnell, 1999). This thinking appears to be due to the meteorological approach adopted to analyse the problem. There are, in fact, relatively few studies on the effects of climatic trends on agricultural water consumption, and they are often based only on the analysis of long time series of climatic data (precipitation, temperature and their processing). Agricultural water use is instead highly influenced by the soil–plant–atmosphere water fluxes and consequently by the crop patterns too (Maracchi et al., 2005). In particular, the regulating function of the soil water zone and the specific plant’s ability to modify its phenology can cause a “lamination” of the water shortage peaks and therefore a mitigation of the potential irrigation water requirement trends. This hypothesis is also supported by Moonen et al.
Copyright © 2007 IAHS Press

Francesca Todisco et al.
10
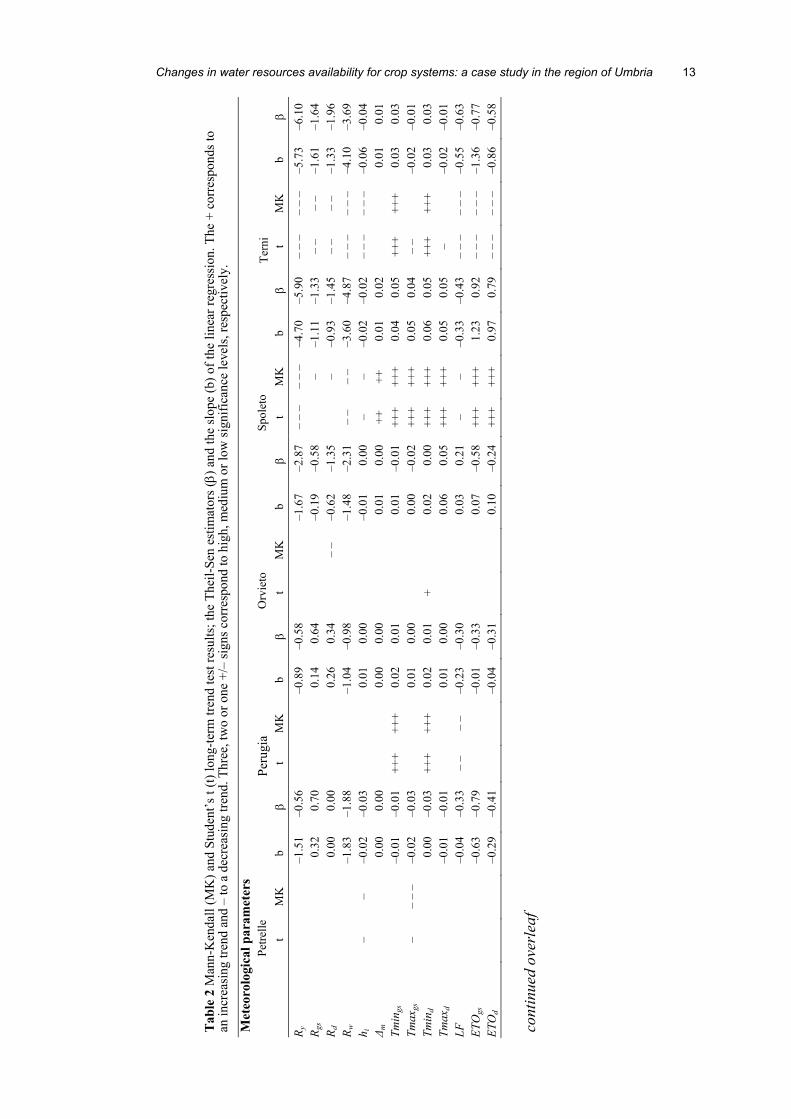
(2002) who concluded that despite a decrease in rainfall in Pisa (Tuscany, Italy), the number of soil moisture deficit days did not change in time and the drought risk does not increase. The above serves to emphasize that agricultural stress does not necessar-ily correspond to meteorological stresses, since the latter can affect uncultivated areas or can coincide with periods characterized by low crop water requirements. Moreover, the soil water content dynamics are also influenced by the characteristics of the specific crop. Thus the indices adopted for the quantification of the effects of climate change on agriculture might be calculated with reference to a single crop. These agrometeorological indices (Moonen et al., 2002) might be capable of indicating the consequences of climate change for crop water requirements and production, and must be derived from both the classic climate parameters and the specific soil–crop–climate unit characteristics. In this paper, meteorological and agrometeorological parameters computed at different sites in the Region of Umbria (Central Italy) for specific crops were used to evaluate the climate trends and the agricultural impacts and adaptation to climate change. MATERIALS AND METHODS The Student and the Mann-Kendall tests were applied for parametric and nonparametric trend detection, respectively. The slope of the trend was estimated by both the Theil-Sen estimator (β) and the slope (b) of the linear regression.
Meteorological and agrometeorological parameters The set of meteorological parameters used in this study is given in Table 1. The meteorological parameters were derived from the time series of classic climate parameters (temperature and rainfall recorded at various meteorological stations in the Region of Umbria) and they enable the evaluation of the climatic change. In this area the April–August period is the average growing season (for many spring–summer crops); June–August is the average dry period (when irrigation is required) and September–March is the average wet period. In the wet period the recharge of the surface and subsurface water body takes place, determining the water resources availability, while the precipitation that occurred in the dry period affects the crop water requirements dynamic. In order to account for the impact of climatic changes on agricultural water requirements, a set of agrometeorological parameters were derived by processing the meteorological and crop data. The comparison between the results of the trend analysis of the meteorological and agrometeorological parameters will make it possible to evaluate the impact of the climate change both on the water availability and the water demand for agriculture in the Region of Umbria. The agrometeorological parameters IR were estimated by the CropSyst model (Stockle & Nelson, 1996) using the recorded meteorological time series (daily maximum and minimum temperature and precipitation) and the soil and crop data as input. The daily reference evapotranspiration (ET0) values were estimated using the Hargreaves-Samani method. This method was validated for application in Umbria by a comparison with the Penman-Monteith equation. The crop growing seasons for the evaluation of the Rcgs, were computed yearly for each crop by CropSyst. On the basis of the runs theory applied to the daily soil water content simulated by the model,

Changes in water resources availability for crop systems: a case study in the region of Umbria
11
Table 1 Classification and abbreviations of the variables analysed for trend detection.
Meteorological parameters annual rainfall Ry (mm) rain falling in the average growing season Rgs (mm) rain falling in the average dry period Rd (mm)
rain falling in the average wet period Rw(mm) mean amount of a rain event hm (mm)
mean rain event interarrival time Δm (day) mean minimum temperature in the average growing season Tmings (°C) mean maximum temperature in the average growing season Tmaxgs (°C) mean minimum temperature in the average dry period Tmind (°C) mean maximum temperature in the average dry period Tmaxd (°C) date of last spring frost LF (day) Agrometeorological parameters sowing date SD (day) reference evapotranspiration in the average growing season ET0gs (mm) reference evapotranspiration in the average dry period ET0d (mm) rain falling during the single crop growing season Rcgs (mm)
annual irrigation water requirement (irrigated crops) IR (mm) annual drought severity index in 40cm soil depth (rainfed crops) SI (mm⋅day) the SI was calculated for rainfed sorghum and sunflower with a truncation level corresponding to the crop critical point (FAO) with reference to the average soil water content in 40 cm depth of soil.
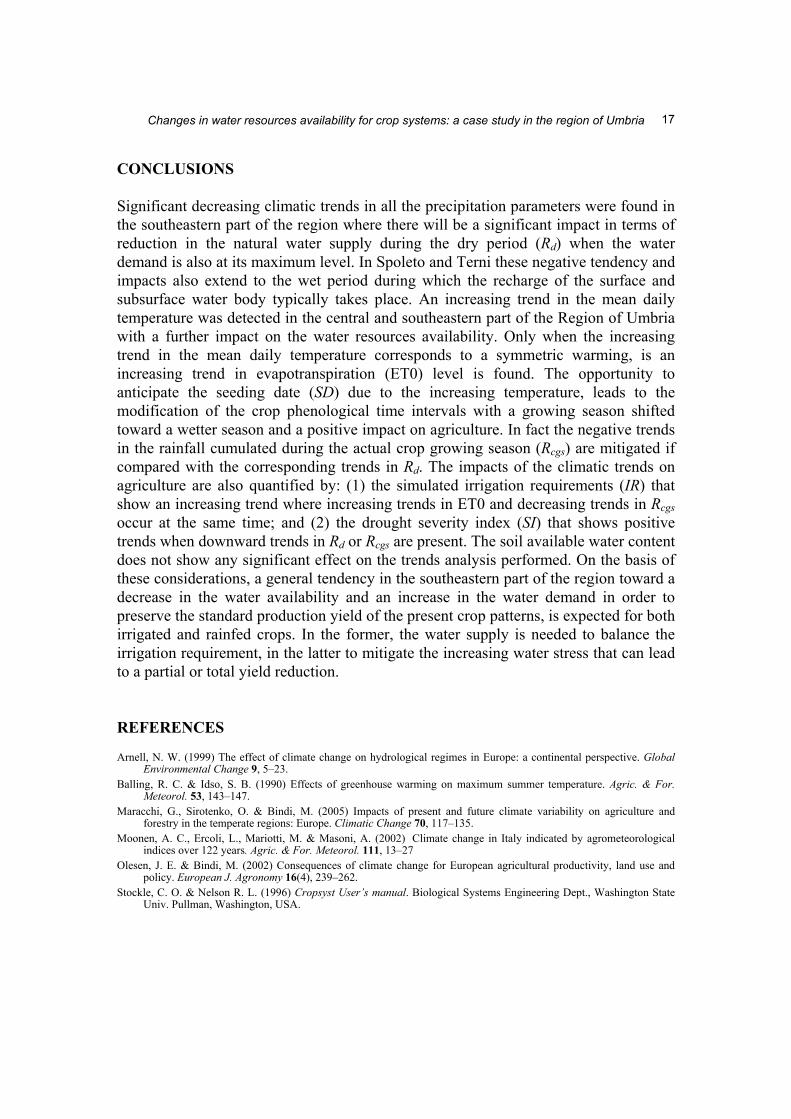
Cropsyst model simulation parameters For the nine irrigation districts of the Umbria region, the mean value of the soil classes in terms of available water content (AWC, uniform in the root zone) and the corresponding area percentage can be schematized as follows: class A, AWC = 8% (11% of the total area); class B, AWC = 10% (15% of the total area); class C, AWC = 12% (30% of the total area); class D, AWC = 14% (37% of the total area). The crops were selected according to the follow-ing criteria: (1) annual herbaceous crops (higher sensitivity to the seasonal climatic conditions than perennial crops) and in particular spring-summer crops; (2) two rainfed crops (sunflower, sorghum) and two irrigated crops (corn, tomato) in order to evaluate both the IR and the SI.
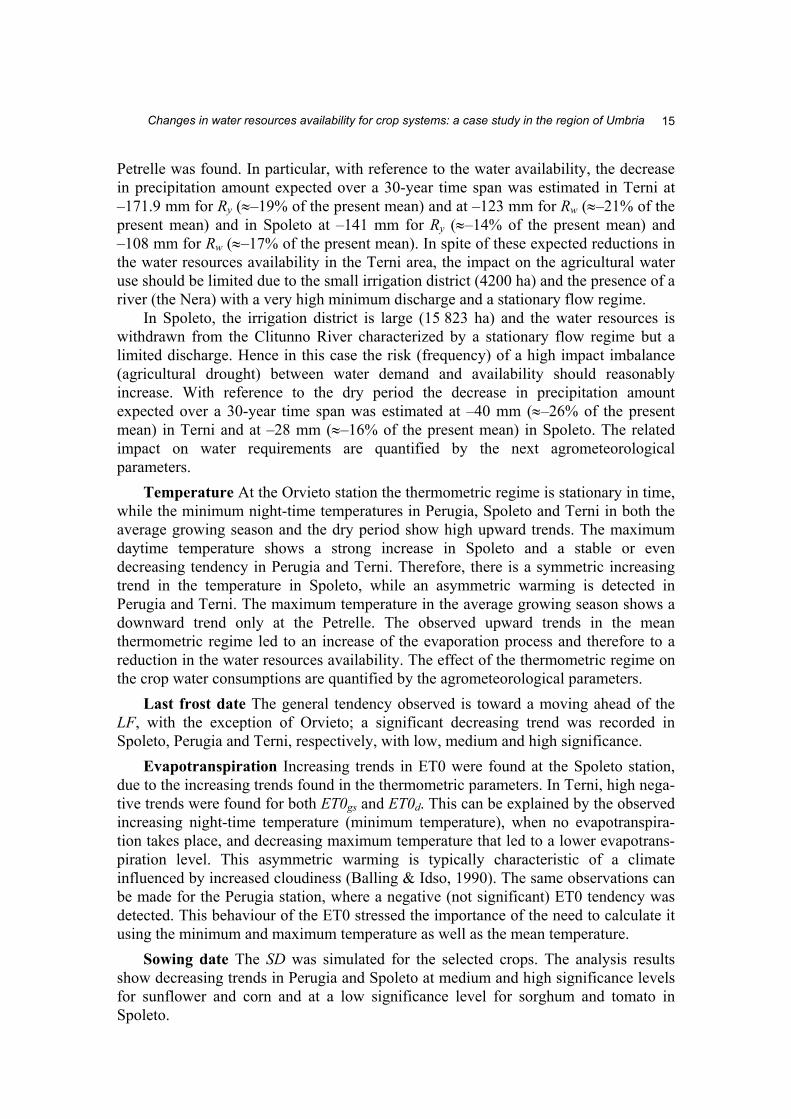
Meteorological stations The meteorological stations (Fig. 1) were preliminarily selected according to the following criteria: adequate length of the series; entirety and continuity of the series; optimal spatial distribution of the stations (Fig. 1) in order to allow a homogeneous coverage of the Umbria Region. TREND ANALYSIS: RESULTS AND DISCUSSION The results obtained by the Student’s t and Mann-Kendall tests are consistent, although in some cases the significance level differs. The results are given in Table 2, together with the slope estimators: Theil-Sen (β) and the slope (b) of the linear regression. High (1%), medium (5%) and low (10%) statistical significance levels were used in this paper.

Francesca Todisco et al.
12
TERNI
PERUGIA
SPOLETOORVIETO
PETRELLE
2280000 2300000 2320000 2340000 2360000 2380000
4690
000
4 720
000
4 750
000
4 780
000
4 810
000
4 840
000
Legend
Meteorological stationsIrrigation districtsThiessen polygons
0 10 20 30 405
Kilometers
Station Altitude Temperature Rainfall (m a.s.l.) period Entirety
(%) period Entirety
(%) Petrelle 293 1951–2004 88 1951–2004 92 Perugia 493 1916–2004 97 1924–2004 100 Spoleto 317 1951–2004 20 1951–2004 100 Orvieto 315 1951–2004 92 1951–2004 100 Terni 170 1951–2004 100 1951–2004 100
Fig. 1 Location of meteorological stations: temperature and rainfall series character-istics for the irrigation districts in Umbria.
Precipitation Significant decreasing trends in all the precipitation parameters were found in the southeastern part of the region (Terni and Spoleto). In Terni the significant decrease in the amount of rain falling within the time intervals considered can be explained by the high decreasing trend in the mean amount of a rain event, hi, while the interarrival time, Δm, is stationary. In Spoleto the highly significant decrease in the annual rainfall, Ry, and the low or medium decrease in the rain falling in the other periods can be explained by both the decreasing trend in the hi and the increasing interarrival time Δm. In Orvieto there is a downward trend only within the dry period. In the northwestern Umbria (Petrelle, Perugia), no changes were found in precipitation regimes. Only a low downward trend in the mean amount of a rain event (hi) in
Cha
nges
in w
ater
reso
urce
s av
aila
bilit
y fo
r cro
p sy
stem
s: a
cas
e st
udy
in th
e re
gion
of U
mbr
ia
Cop
yrig
ht ©
200
7 IA
HS
Pre
ss 1
Tab
le 2
Man
n-K
enda
ll (M
K) a
nd S
tude
nt’s
t (t)
long
-term
tren
d te
st re
sults
; the
The
il-Se
n es
timat
ors (
β) a
nd th
e sl
ope
(b) o
f the
line
ar re
gres
sion
. The
+ c
orre
spon
ds to
an
incr
easi
ng tr
end
and
– to
a d
ecre
asin
g tre
nd. T
hree
, tw
o or
one
+/–
sign
s cor
resp
ond
to h
igh,
med
ium
or l
ow si
gnifi
canc
e le
vels
, res
pect
ivel
y.
Met
eoro
logi
cal p
aram
eter
s
Petre
lle
Peru
gia
Orv
ieto
Sp
olet
o Te
rni
t
MK
b
β t
MK
b
β t
MK
b
β t
MK
b
β t
MK
b
β R y
–1.5
1 –0
.56
–0.8
9 –0
.58
–1.6
7 –2
.87
– –
– –
– –
–4.7
0 –5
.90
– –
– –
– –
–5.7
3 –6
.10
R gs
0.32
0.
70
0.14
0.
64
–0.1
9 –0
.58
–
–1.1
1 –1
.33
– –
– –
–1.6
1 –1
.64
R d
0.00
0.
00
0.26
0.
34
–
– –0
.62
–1.3
5
– –0
.93
–1.4
5 –
– –
– –1
.33
–1.9
6 R w
–1.8
3 –1
.88
–1.0
4 –0
.98
–1.4
8 –2
.31
– –
– –
–3.6
0 –4
.87
– –
– –
– –
–4.1
0 –3
.69
h i
– –
–0.0
2 –0
.03
0.01
0.
00
–0.0
1 0.
00
– –
–0.0
2 –0
.02
– –
– –
– –
–0.0
6 –0
.04
Δ m
0.00
0.
00
0.00
0.
00
0.01
0.
00
++
++
0.01
0.
02
0.01
0.
01
Tmin
gs
–0.0
1 –0
.01
+++
+++
0.02
0.
01
0.01
–0
.01
+++
+++
0.04
0.
05
+++
+++
0.03
0.
03
Tmax
gs–
– –
– –0
.02
–0.0
3
0.
01
0.00
0.
00
–0.0
2 ++
+ ++
+ 0.
05
0.04
–
–
–0.0
2 –0
.01
Tmin
d
0.
00
–0.0
3 ++
+ ++
+ 0.
02
0.01
+
0.
02
0.00
++
+ ++
+ 0.
06
0.05
++
+ ++
+ 0.
03
0.03
Tm
axd
–0.0
1 –0
.01
0.01
0.
00
0.06
0.
05
+++
+++
0.05
0.
05
–
–0.0
2 –0
.01
LF
–0.0
4 –0
.33
– –
– –
–0.2
3 –0
.30
0.03
0.
21
– –
–0.3
3 –0
.43
– –
– –
– –
–0.5
5 –0
.63
ETO
gs
–0
.63
–0.7
9
–0
.01
–0.3
3
0.
07
–0.5
8 ++
+ ++
+ 1.
23
0.92
–
– –
– –
– –1
.36
–0.7
7 ET
Od
–0.2
9 –0
.41
–0.0
4 –0
.31
0.10
–0
.24
+++
+++
0.97
0.
79
– –
– –
– –
–0.8
6 –0
.58
Changes in water resources availability for crop systems: a case study in the region of Umbria 13
cont
inue
d ov
erle
af

2 Tab
le 2
Con
tinue
d fr
om o
verl
eaf.
Agr
omet
eoro
logi
cal p
aram
eter
s
Petre
lle
Peru
gia
Orv
ieto
Sp
olet
o Te
rni
cr
op
soil
t M
K
b β
t M
K
b β
t M
K
b β
t M
K
b β
t M
K
b β
Sunf
low
er
0.
31
0.35
–
– –
– –0
.17
–0.1
3
0.
22
0.18
–
– –
–0.2
6 –0
.25
0.15
0.
16
Cor
n
0.15
0.
28
– –
––
– –
–0.2
9 –0
.22
–0.0
2 0.
22
– –
––
– –
–0.4
3 –0
.50
–0.1
2 –0
.05
Sorg
hum
0.14
0.
30
–0.0
8 –0
.03
+
0.15
0.
36
– –
–0.2
3 –0
.14
0.13
0.
17
SD
Tom
ato
0.
05
0.13
–0
.07
–0.0
6
0.
17
0.08
–
–0
.24
–0.1
6
0.
14
0.07
Su
nflo
wer
–0.6
5
–0.7
4
0.
14
0.16
–
–1
.64
–1.0
2
–1
.22
–1.2
5 –
– –
– –
––3
.73
–3.5
1 C
orn
0.
16
0.08
+ 0.
64
0.95
–0
.77
–0.4
1
–0
.65
–0.6
4
–1
.08
–0.9
3 So
rghu
m
–0
.49
0.12
0.
40
0.65
–
––
– –1
.30
–0.9
3
–0
.99
–0.6
3 –
– –
– –
–1.9
6 –2
.69
R gs
Tom
ato
0.
69
1.08
0.
19
0.36
– –
–0.7
7 –1
.35
– –
– –
–1.3
1 –1
.49
– –
––
– –
–1.8
0 –1
.87
A
0.33
–0
.13
–0.1
7 –0
.14
0.34
0.
06
++
+ 0.
85
0.49
0.
02
0.00
B
0.
30
–0.0
9
–0
.22
–0.1
8
0.
55
0.58
++
+
0.85
0.
44
–0.0
9 0.
14
C
0.40
–0
.04
–0.1
1 0.
00
0.58
0.
14
++
+ 0.
85
0.12
–0
.13
–0.0
5
Cor
n
D
0.38
0.
00
–0.1
6 0.
00
0.43
0.
00
++
0.
93
0.00
0.
03
0.00
A
0.
43
0.31
–0
.19
–0.2
4
0.
29
0.04
–0
.30
–0.0
1
–0
.34
–0.3
6 B
0.
58
0.37
–0
.22
–0.0
1
0.
57
0.26
0.
28
–0.2
5
–0
.19
–0.1
3 C
0.
61
0.35
–0
.24
–0.1
2
0.
54
0.04
0.
23
–0.2
3
–0
.18
–0.4
1
IR
Tom
ato
D
0.66
0.
75
–0.1
3 0.
00
0.60
0.
02
0.13
0.
12
–0.2
4 –0
.06
A
–0.2
3 0.
00
–1.0
4 –1
.37
+
3.02
2.
16
2.02
1.
45
+++
++
3.95
3.
56
B
0.28
–0
.73
–0.7
1 –1
.62
+
3.82
2.
67
2.65
1.
97
+++
+++
4.96
5.
84
C
0.60
0.
57
–1.0
0 –0
.81
+++
5.36
4.
00
3.60
4.
80
+++
+++
7.12
8.
52
Sunf
low
er
D
1.12
0.
68
–0.8
6 –0
.84
+++
5.92
3.
87
+
4.80
5.
56
+++
+++
7.76
10
.56
A
–0.8
0 –2
.56
–1.0
8 –1
.00
+
2.65
1.
68
1.34
3.
02
+ ++
2.
75
3.61
B
–0
.39
–2.4
8
–0
.92
0.00
+
3.
56
1.88
2.
06
4.44
++
++
3.
72
5.28
C
0.
38
–2.1
5
–0
.66
–0.5
8 ++
+ 4.
67
2.83
2.
10
3.81
++
+ ++
+ 5.
44
6.16
SI
Sorg
hum
D
–0.0
6 –3
.26
–0.6
2 –0
.34
+++
5.11
3.
60
2.42
5.
08
+++
+++
7.40
7.
00
14 Francesca Todisco et al.
Changes in water resources availability for crop systems: a case study in the region of Umbria
Copyright © 2007 IAHS Press
15
Petrelle was found. In particular, with reference to the water availability, the decrease in precipitation amount expected over a 30-year time span was estimated in Terni at –171.9 mm for Ry (≈–19% of the present mean) and at –123 mm for Rw (≈–21% of the present mean) and in Spoleto at –141 mm for Ry (≈–14% of the present mean) and –108 mm for Rw (≈–17% of the present mean). In spite of these expected reductions in the water resources availability in the Terni area, the impact on the agricultural water use should be limited due to the small irrigation district (4200 ha) and the presence of a river (the Nera) with a very high minimum discharge and a stationary flow regime. In Spoleto, the irrigation district is large (15 823 ha) and the water resources is withdrawn from the Clitunno River characterized by a stationary flow regime but a limited discharge. Hence in this case the risk (frequency) of a high impact imbalance (agricultural drought) between water demand and availability should reasonably increase. With reference to the dry period the decrease in precipitation amount expected over a 30-year time span was estimated at –40 mm (≈–26% of the present mean) in Terni and at –28 mm (≈–16% of the present mean) in Spoleto. The related impact on water requirements are quantified by the next agrometeorological parameters.
Temperature At the Orvieto station the thermometric regime is stationary in time, while the minimum night-time temperatures in Perugia, Spoleto and Terni in both the average growing season and the dry period show high upward trends. The maximum daytime temperature shows a strong increase in Spoleto and a stable or even decreasing tendency in Perugia and Terni. Therefore, there is a symmetric increasing trend in the temperature in Spoleto, while an asymmetric warming is detected in Perugia and Terni. The maximum temperature in the average growing season shows a downward trend only at the Petrelle. The observed upward trends in the mean thermometric regime led to an increase of the evaporation process and therefore to a reduction in the water resources availability. The effect of the thermometric regime on the crop water consumptions are quantified by the agrometeorological parameters.
Last frost date The general tendency observed is toward a moving ahead of the LF, with the exception of Orvieto; a significant decreasing trend was recorded in Spoleto, Perugia and Terni, respectively, with low, medium and high significance.
Evapotranspiration Increasing trends in ET0 were found at the Spoleto station, due to the increasing trends found in the thermometric parameters. In Terni, high nega-tive trends were found for both ET0gs and ET0d. This can be explained by the observed increasing night-time temperature (minimum temperature), when no evapotranspira-tion takes place, and decreasing maximum temperature that led to a lower evapotrans-piration level. This asymmetric warming is typically characteristic of a climate influenced by increased cloudiness (Balling & Idso, 1990). The same observations can be made for the Perugia station, where a negative (not significant) ET0 tendency was detected. This behaviour of the ET0 stressed the importance of the need to calculate it using the minimum and maximum temperature as well as the mean temperature.
Sowing date The SD was simulated for the selected crops. The analysis results show decreasing trends in Perugia and Spoleto at medium and high significance levels for sunflower and corn and at a low significance level for sorghum and tomato in Spoleto.

Francesca Todisco et al.
16
Rain falling within the crop growing season Negative significant trends were obtained at the Terni, Orvieto and Spoleto stations. The Rcgs shows a high/medium significance trend in Terni for all crops and a medium significance trend in Orvieto for sorghum and tomato. This result was expected, due to the negative (medium and high) precipitation trend at Terni in the entire time interval considered and to the negative (medium) precipitation trend in the dry period at Orvieto. Furthermore the negative trends found in Rcgs seems to be strictly correlated with the corresponding tendency in SD: when there are downward trends in SD (early sowing) no trends in Rcgs are detected and vice versa. This can be explained by the shifting of the growing season toward a wetter period. A medium negative trend in Rcgs in Spoleto for tomato was also found.
Irrigation requirement The simulated IR shows trends only at Spoleto for corn in all the soil classes. This result was expected due to the highly positive trends found in ET0 and to the negative trends in precipitation (also the Rcgs for corn, shows negative tendencies even though not significant at the levels considered). The analysis showed the tendency toward an increase in the water demand for irrigated crops when an increasing trend in ET0 and decreasing trend in precipitation occur at the same time (i.e. Spoleto). The only decreasing trend in the Rd seems not to be effective for the occurrence of increasing trends in the IR (i.e. Orvieto). Moreover, for the Terni station a compensation effect between decreasing precipitation and decreasing evapotranspira-tion leads to a stationary IR. The expected increment in corn IR was estimated in the Spoleto irrigation district (Fig. 1). The b coefficients found for corn in Spoleto (Table 2) for each soil class were applied to the present crop pattern, where 1800 ha are grown with corn, in order to estimate the increment in corn seasonal IR expected over a 30-year time span. The expected increment was estimated at +477 660 m3, which in terms of water requirements per ha corresponds to an increment of +265 m3 ha-1 (≈+9% of the present mean corn IR). This upward trend and the contemporary downward trend detected in the pluviometric regime leads to the conclusion that the agricultural drought risk in the area of Spoleto is increasing.
Drought Severity index The simulated SI shows high positive trends in Terni for all soil types and crops. This result can be explained by the negative trends in the rainfall regime. The same observation can be considered valid for Orvieto, where medium/low positive trends have been found for all soil types and crops. Spoleto also has a positive tendency. The tendency toward an increase in the SI is observed when a decreasing tendency in precipitation occurs (i.e. Orvieto, Spoleto and Terni). The expected increments in sorghum and sunflower SI were estimated in the Orvieto and Terni districts over a 30-year time span. The expected increment was estimated as the percent of the present mean SI at +13 ÷ 17% and +16 ÷ 19% for sorghum and sunflower in Terni and at +11 ÷ 12% and +10 ÷ 12% for sorghum and sunflower in Orvieto. An overview of the results obtained for the agrometeorological parameters show that the simulated severity index (SI) is more sensitive to the precipitation regime, while the irrigation requirement (IR) seems to be more sensitive to the reference evapotranspiration regime. This behaviour is probably due to the relative magnitude of the variables involved in the processes analysed: for the irrigated crops the actual evapotranspiration amount is close to the ET0, while the dry period rainfall (Rd) is usually negligible compared to the IR. As a consequence, the IR is more sensitive to the ET0 trends. For the rainfed crops, instead, the actual evapotranspiration amount is lower than the ET0 and close to the Rd; hence the SI is more sensitive to the Rd trends.
Changes in water resources availability for crop systems: a case study in the region of Umbria
17
CONCLUSIONS Significant decreasing climatic trends in all the precipitation parameters were found in the southeastern part of the region where there will be a significant impact in terms of reduction in the natural water supply during the dry period (Rd) when the water demand is also at its maximum level. In Spoleto and Terni these negative tendency and impacts also extend to the wet period during which the recharge of the surface and subsurface water body typically takes place. An increasing trend in the mean daily temperature was detected in the central and southeastern part of the Region of Umbria with a further impact on the water resources availability. Only when the increasing trend in the mean daily temperature corresponds to a symmetric warming, is an increasing trend in evapotranspiration (ET0) level is found. The opportunity to anticipate the seeding date (SD) due to the increasing temperature, leads to the modification of the crop phenological time intervals with a growing season shifted toward a wetter season and a positive impact on agriculture. In fact the negative trends in the rainfall cumulated during the actual crop growing season (Rcgs) are mitigated if compared with the corresponding trends in Rd. The impacts of the climatic trends on agriculture are also quantified by: (1) the simulated irrigation requirements (IR) that show an increasing trend where increasing trends in ET0 and decreasing trends in Rcgs occur at the same time; and (2) the drought severity index (SI) that shows positive trends when downward trends in Rd or Rcgs are present. The soil available water content does not show any significant effect on the trends analysis performed. On the basis of these considerations, a general tendency in the southeastern part of the region toward a decrease in the water availability and an increase in the water demand in order to preserve the standard production yield of the present crop patterns, is expected for both irrigated and rainfed crops. In the former, the water supply is needed to balance the irrigation requirement, in the latter to mitigate the increasing water stress that can lead to a partial or total yield reduction. REFERENCES Arnell, N. W. (1999) The effect of climate change on hydrological regimes in Europe: a continental perspective. Global
Environmental Change 9, 5–23. Balling, R. C. & Idso, S. B. (1990) Effects of greenhouse warming on maximum summer temperature. Agric. & For.
Meteorol. 53, 143–147. Maracchi, G., Sirotenko, O. & Bindi, M. (2005) Impacts of present and future climate variability on agriculture and
forestry in the temperate regions: Europe. Climatic Chang 70, 117–135. eMoonen, A. C., Ercoli, L., Mariotti, M. & Masoni, A. (2002) Climate change in Italy indicated by agrometeorological
indices over 122 years. Agric. & For. Meteorol. 111, 13–27 Olesen, J. E. & Bindi, M. (2002) Consequences of climate change for European agricultural productivity, land use and
policy. European J. Agronomy 16(4), 239–262. Stockle, C. O. & Nelson R. L. (1996) Cropsyst User’s manual. Biological Systems Engineering Dept., Washington State
Univ. Pullman, Washington, USA.
Related Documents


