Current Trends Changes in the Cigarette Brand Preferences of Adolescent Smokers — United States, 1989–1993 Adolescent Smokers — Continued Approximately three million U.S. adolescents are smokers, and they smoke nearly one billion packs of cigarettes each year (1 ). The average age at which smokers try their first cigarette is 14 1 ∕2 years, and approximately 70% of smokers become regular smokers by age 18 years (2 ). Evaluating the changes in the brand preferences of young smokers can help identify factors that influence adolescents’ brand choice and may suggest smoking-prevention strategies (3,4 ). This report examines changes in the brand preferences of teenaged smokers from 1989 to 1993 using data from CDC’s 1993 Teenage Attitudes and Practices Survey (TAPS-II) and comparing them with data from the 1989 TAPS. For TAPS, data on knowledge, attitudes, and practices regarding tobacco use were collected from a national household sample of adolescents (aged 12–18 years) by tele- phone interviews. For TAPS-II, interviews were conducted during February–May 1993. Of the 9135 respondents to the 1989 TAPS, 7960 (87.1%) participated in TAPS-II (re- spondents were aged 15–22 years when TAPS-II was conducted).* In addition, 4992 (89.3%) persons from a new probability sample (n=5590 persons aged 10– 15 years) participated in TAPS-II. Data for the 12–18-year-olds in each survey were analyzed (n=9135 for TAPS; n=7311 for TAPS-II). Because numbers for other racial groups were too small for meaningful analysis, data are presented for black, white, and Hispanic adolescents only. Data were weighted to provide national estimates, and confidence intervals (CIs) were calculated by using the standard errors estimated by SUDAAN (5 ). Adolescent current smokers † were asked if they usually bought their own cigarettes, and if so, which brand they usually bought. Of the 1031 current smokers aged 12–18 years interviewed in 1993, 724 (70%) re- ported that they usually bought their own cigarettes; the brand they usually bought was ascertained for 702 (97%). Marlboro, Camel, and Newport were the most fre- M O R B I D I T Y A N D M O R T A L I T Y W E E K L Y R E P O R T August 19, 1994 / Vol. 43 / No. 32 U.S. DEPARTMENT OF HEALTH AND HUMAN SERVICES / Public Health Service 577 Changes in the Cigarette Brand Preferences of Adolescent Smokers — United States, 1989–1993 581 Medical-Care Spending — United States 587 Occupational Injury Deaths of Postal Workers — United States, 1980–1989 595 Notices to Readers *TAPS respondents who completed the survey by mail questionnaire were not eligible for the TAPS-II survey. TAPS-II included household interviews of persons who did not respond by telephone. † Adolescents who reported smoking cigarettes on 1 or more of the 30 days preceding the survey.

Welcome message from author
This document is posted to help you gain knowledge. Please leave a comment to let me know what you think about it! Share it to your friends and learn new things together.
Transcript

Current Trends
Changes in the Cigarette Brand Preferencesof Adolescent Smokers — United States, 1989–1993
Adolescent Smokers — ContinuedApproximately three million U.S. adolescents are smokers, and they smoke nearlyone billion packs of cigarettes each year (1 ). The average age at which smokers trytheir first cigarette is 141⁄2 years, and approximately 70% of smokers become regularsmokers by age 18 years (2 ). Evaluating the changes in the brand preferences ofyoung smokers can help identify factors that influence adolescents’ brand choice andmay suggest smoking-prevention strategies (3,4 ). This report examines changes inthe brand preferences of teenaged smokers from 1989 to 1993 using data from CDC’s1993 Teenage Attitudes and Practices Survey (TAPS-II) and comparing them with datafrom the 1989 TAPS.
For TAPS, data on knowledge, attitudes, and practices regarding tobacco use werecollected from a national household sample of adolescents (aged 12–18 years) by tele-phone interviews. For TAPS-II, interviews were conducted during February–May 1993.Of the 9135 respondents to the 1989 TAPS, 7960 (87.1%) participated in TAPS-II (re-spondents were aged 15–22 years when TAPS-II was conducted).* In addition,4992 (89.3%) persons from a new probability sample (n=5590 persons aged 10–15 years) participated in TAPS-II. Data for the 12–18-year-olds in each survey wereanalyzed (n=9135 for TAPS; n=7311 for TAPS-II). Because numbers for other racialgroups were too small for meaningful analysis, data are presented for black, white,and Hispanic adolescents only. Data were weighted to provide national estimates, andconfidence intervals (CIs) were calculated by using the standard errors estimated bySUDAAN (5 ). Adolescent current smokers† were asked if they usually bought theirown cigarettes, and if so, which brand they usually bought.
Of the 1031 current smokers aged 12–18 years interviewed in 1993, 724 (70%) re-ported that they usually bought their own cigarettes; the brand they usually boughtwas ascertained for 702 (97%). Marlboro, Camel, and Newport were the most fre-
MORBIDITY AND MORTALITY WEEKLY REPORT
August 19, 1994 / Vol. 43 / No. 32
U.S. DEPARTMENT OF HEALTH AND HUMAN SERVICES / Public Health Service
577 Changes in the Cigarette BrandPreferences of AdolescentSmokers — United States,1989–1993
581 Medical-Care Spending — United States
587 Occupational Injury Deaths of Postal Workers — United States, 1980–1989
595 Notices to Readers
*TAPS respondents who completed the survey by mail questionnaire were not eligible for theTAPS-II survey. TAPS-II included household interviews of persons who did not respond bytelephone.
†Adolescents who reported smoking cigarettes on 1 or more of the 30 days preceding thesurvey.

Ado
lescent Sm
okers — C
ontinued
578M
MW
RA
ugust 19, 1994
TABLE 1. Percentage* distribution of cigarette brands usually bought by current smokers† aged 12–18 years who reported usuallybuying their own cigarettes, by demographic characteristic — United States, Teenage Attitudes and Practices Survey-II, 1993,and overall cigarette brand market shares,§ 1993
Percentage
Marlboro Camel Newport Winston Kool Salem Virginia Slims Benson & Hedges Other brands
Characteristic No. % % (95% CI) % (95% CI) % (95% CI) % (95% CI) % (95% CI) % (95% CI) % (95% CI) % (95% CI)
SexMale 370 59.2 (± 6.0) 16.1 (± 5.0) 10.7 (± 3.2) 1.6 (±1.5) 2.3 (± 2.0) 0.4 (±0.5) 0 0.6 (±0.8) 9.1 (±3.3)Female 332 60.7 (± 5.8) 10.3 (æ 3.0) 14.7 (æ 3.9) 0.7 (±1.0) 0 1.7 (±1.4) 2.0 (±1.9) 0 9.9 (±3.9)
Race**White 646 63.5 (± 4.3) 14.4 (± 3.1) 8.7 (± 2.4) 1.2 (±1.0) 0.5 (± 0.8) 1.0 (±0.8) 1.0 (±1.0) 0.2 (±0.4) 9.4 (±2.8)Black 45 8.5 (± 8.5) 0 70.4 (±14.1) 0 11.9 (±10.9) 1.4 (±2.7) 0.5 (±1.0) 1.7 (±3.3) 5.5 (±6.0)
Ethnicity††
Hispanic 50 45.4 (±14.9) 10.1 (± 7.7) 34.0 (±15.1) 6.0 (±8.1) 4.5 (± 8.6) 0 0 0 0Non-Hispanic 647 60.9 (± 4.3) 13.6 (± 3.1) 11.0 (± 2.5) 0.8 (±0.7) 0.9 (± 0.8) 1.1 (±0.8) 1.1 (±1.0) 0.3 (±0.4) 10.4 (±2.9)
Age (yrs)12–15 140 49.5 (± 9.2) 13.0 (± 7.1) 19.4 (± 6.9) 2.8 (±3.1) 3.7 (± 3.8) 0.4 (±0.7) 0.1 (±0.3) 0 11.1 (±5.3)16–18 562 63.1 (± 4.4) 13.4 (± 3.0) 10.6 (± 2.6) 0.7 (±0.7) 0.4 (± 0.6) 1.2 (±0.9) 1.2 (±1.2) 0.4 (±0.5) 9.0 (±2.9)
Region§§
Northeast 146 54.1 (±10.7) 5.1 (± 3.6) 30.1 (± 8.8) 0.6 (±1.2) 0 0.6 (±1.3) 1.8 (±2.5) 0 7.6 (±6.5)Midwest 223 61.6 (± 6.7) 15.0 (± 4.6) 11.6 (± 4.8) 0.9 (±1.3) 1.2 (± 1.6) 2.4 (±1.9) 0.8 (±1.1) 0.4 (±0.7) 6.1 (±4.1)South 217 67.1 (± 6.5) 9.5 (± 3.9) 8.0 (± 3.1) 0.9 (±1.3) 1.5 (± 1.8) 0.6 (±1.2) 1.0 (±2.0) 0.5 (±1.1) 10.7 (±4.4)West 116 50.3 (±10.6) 27.1 (±10.8) 3.2 (± 3.1) 2.6 (±3.6) 2.0 (± 3.8) 0 0.2 (±0.4) 0 14.7 (±7.4)
Total 702 60.0 (± 4.2) 13.3 (± 2.9) 12.7 (± 2.7) 1.2 (±0.9) 1.2 (± 1.0) 1.0 (±0.7) 1.0 (±0.9) 0.3 (±0.4) 9.5 (±2.6)
Overall marketshare, 1993§ 23.5 3.9 4.8 6.7 3.0 3.9 2.3 2.5 49.4
(95% CI¶)
*Percentages and confidence intervals are based on weighted data. † Adolescents who reported smoking cigarettes on 1 or more of the 30 days preceding the survey. § Source: reference 8 ; based on total estimated brand-specific cigarette sales in the United States. ¶ Confidence interval.**Excludes the category “other” (n=11); numbers for these racial groups were too small for meaningful analysis. ††Excludes five persons for whom ethnicity was unknown. §§Northeast=Connecticut, Maine, Massachusetts, New Hampshire, New Jersey, New York, Pennsylvania, Rhode Island, and Vermont; Midwest=Illinois, Indiana, Iowa, Kansas,
Michigan, Minnesota, Missouri, Nebraska, North Dakota, Ohio, South Dakota, and Wisconsin; South=Alabama, Arkansas, Delaware, District of Columbia, Florida, Georgia,Kentucky, Louisiana, Maryland, Mississippi, North Carolina, Oklahoma, South Carolina, Tennessee, Texas, Virginia, and West Virginia; and West=Alaska, Arizona, California,Colorado, Hawaii, Idaho, Montana, Nevada, New Mexico, Oregon, Utah, Washington, and Wyoming.
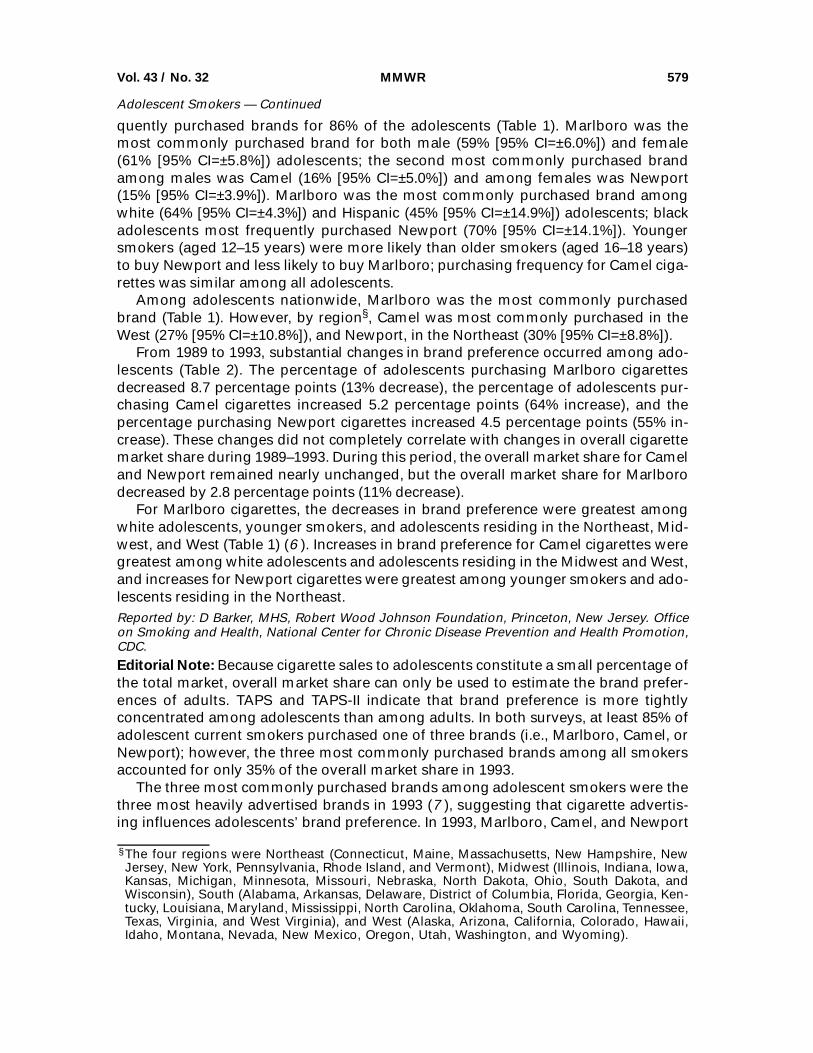
quently purchased brands for 86% of the adolescents (Table 1). Marlboro was themost commonly purchased brand for both male (59% [95% CI=±6.0%]) and female(61% [95% CI=±5.8%]) adolescents; the second most commonly purchased brandamong males was Camel (16% [95% CI=±5.0%]) and among females was Newport(15% [95% CI=±3.9%]). Marlboro was the most commonly purchased brand amongwhite (64% [95% CI=±4.3%]) and Hispanic (45% [95% CI=±14.9%]) adolescents; blackadolescents most frequently purchased Newport (70% [95% CI=±14.1%]). Youngersmokers (aged 12–15 years) were more likely than older smokers (aged 16–18 years)to buy Newport and less likely to buy Marlboro; purchasing frequency for Camel ciga-rettes was similar among all adolescents.
Among adolescents nationwide, Marlboro was the most commonly purchasedbrand (Table 1). However, by region§, Camel was most commonly purchased in theWest (27% [95% CI=±10.8%]), and Newport, in the Northeast (30% [95% CI=±8.8%]).
From 1989 to 1993, substantial changes in brand preference occurred among ado-lescents (Table 2). The percentage of adolescents purchasing Marlboro cigarettesdecreased 8.7 percentage points (13% decrease), the percentage of adolescents pur-chasing Camel cigarettes increased 5.2 percentage points (64% increase), and thepercentage purchasing Newport cigarettes increased 4.5 percentage points (55% in-crease). These changes did not completely correlate with changes in overall cigarettemarket share during 1989–1993. During this period, the overall market share for Cameland Newport remained nearly unchanged, but the overall market share for Marlborodecreased by 2.8 percentage points (11% decrease).
For Marlboro cigarettes, the decreases in brand preference were greatest amongwhite adolescents, younger smokers, and adolescents residing in the Northeast, Mid-west, and West (Table 1) (6 ). Increases in brand preference for Camel cigarettes weregreatest among white adolescents and adolescents residing in the Midwest and West,and increases for Newport cigarettes were greatest among younger smokers and ado-lescents residing in the Northeast.Reported by: D Barker, MHS, Robert Wood Johnson Foundation, Princeton, New Jersey. Officeon Smoking and Health, National Center for Chronic Disease Prevention and Health Promotion,CDC.Editorial Note: Because cigarette sales to adolescents constitute a small percentage ofthe total market, overall market share can only be used to estimate the brand prefer-ences of adults. TAPS and TAPS-II indicate that brand preference is more tightlyconcentrated among adolescents than among adults. In both surveys, at least 85% ofadolescent current smokers purchased one of three brands (i.e., Marlboro, Camel, orNewport); however, the three most commonly purchased brands among all smokersaccounted for only 35% of the overall market share in 1993.
The three most commonly purchased brands among adolescent smokers were thethree most heavily advertised brands in 1993 (7 ), suggesting that cigarette advertis-ing influences adolescents’ brand preference. In 1993, Marlboro, Camel, and Newport
§The four regions were Northeast (Connecticut, Maine, Massachusetts, New Hampshire, NewJersey, New York, Pennsylvania, Rhode Island, and Vermont), Midwest (Illinois, Indiana, Iowa,Kansas, Michigan, Minnesota, Missouri, Nebraska, North Dakota, Ohio, South Dakota, andWisconsin), South (Alabama, Arkansas, Delaware, District of Columbia, Florida, Georgia, Ken-tucky, Louisiana, Maryland, Mississippi, North Carolina, Oklahoma, South Carolina, Tennessee,Texas, Virginia, and West Virginia), and West (Alaska, Arizona, California, Colorado, Hawaii,Idaho, Montana, Nevada, New Mexico, Oregon, Utah, Washington, and Wyoming).
Vol. 43 / No. 32 MMWR 579
Adolescent Smokers — Continued

ranked first, second, and third (7 ), respectively, in advertising expenditures. However,Camel and Newport ranked seventh and fifth, respectively, in overall market share (8 ).
Similarly, the increases in adolescents’ brand preference for Camel cigarettes andthe decrease in preference for Marlboro cigarettes from 1989 to 1993 are not ex-plained by changes in overall market share for these brands. These changes reflectvariability in brand-specific advertising expenditures: from 1989 to 1993, Marlboro ad-vertising decreased from $102 million to $75 million (7,9 ), while Camel advertisingincreased from $27 million to $43 million (7,9 ). In contrast, the increased preferencefor Newport cigarettes does not reflect the decrease in Newport advertising expendi-tures from $49 million to $35 million from 1989 to 1993 (7,9 ). The regional differencesin brand preference of adolescents and changes in those preferences during 1989–1993 suggest that analysis of the relation between regional advertising expendituresand brand preferences may help to clarify the role of cigarette advertising in influenc-ing adolescents’ brand preference.
The findings that black adolescents most commonly purchased mentholatedbrands (i.e., Newport and Kool) and that Hispanic adolescents most commonly pur-chased Marlboro are consistent with a previous report (6 ). Racial/ethnic differences inbrand preferences of adolescents may be influenced by differences in socioeconomicstatus and by social and cultural phenomena that require further explanation.
The findings of TAPS-II are subject to at least two limitations. First, the potentialexists for nonresponse bias in the follow-up of TAPS respondents. For example, smok-ing prevalence estimates derived from TAPS-II are lower than those based on othernational surveys; TAPS respondents who were successfully followed up in TAPS-II
TABLE 2. Change in self-reported cigarette brand preference among adolescents aged12–18 years* and change in overall cigarette brand market share† from 1989 to 1993— United States, Teenage Attitudes and Practices Survey (TAPS), 1989 and 1993
Brand
Adolescent brandpreference,
1989 Rank
Adolescent brandpreference,
1993 Rank
Change inadolescent
brand preference,1989 to 1993
Marlboro 68.7 1 60.0 1 –8.7Camel 8.1 3 13.3 2 +5.2Newport 8.2 2 12.7 3 +4.5Winston 3.2 4 1.2 4 –2.0Kool 1.0 7 1.2 4 +0.2Salem 1.5 5 1.0 6 –0.5Benson & Hedges 1.4 6 0.3 7 –1.1
Brand
Overallmarket share,
1989 Rank§Overall market share,
1993 Rank§
Change in overallmarket share,1989 to 1993
Marlboro 26.3 1 23.5 1 –2.8Camel 3.9 6 3.9 7 0 Newport 4.7 5 4.8 5 +0.1Winston 9.1 2 6.7 2 –2.4Kool 5.9 4 3.0 9 –2.9Salem 6.2 3 3.9 7 –2.3Benson & Hedges 3.9 6 2.5 10 –1.4
*Data were weighted to provide national estimates. Unweighted sample size for 1989 was 865and for 1993 was 702.
†From reference 8. Based on total estimated brand-specific cigarette sales in the United States.§Rank for brands listed is based on the Maxwell Consumer Report (8 ). Only brands for whichdata on adolescent brand preference were available in 1989 and 1993 are listed in the table.Missing ranks are for generic brands.
580 MMWR August 19, 1994
Adolescent Smokers — Continued

were less likely to be smokers in 1989 than those who could not be reinterviewed(Office on Smoking and Health, unpublished data, 1994). Second, the small number ofblack and Hispanic adolescents in TAPS-II lessens the reliability of the brand prefer-ence estimates for these subgroups.
Because cigarette advertising may influence brand choice of adolescents (an im-portant component of smoking behavior), legislation may be needed to restrictcigarette advertising to which young persons are likely to be exposed (10 ). In addi-tion, antitobacco advertising may be an effective public health strategy to preventsmoking initiation and encourage smoking cessation among adolescents. Under-standing the influence of advertising on adolescent smoking behavior may assist inclarifying the potential role of antismoking advertisements. At least two states(California and Massachusetts) have allocated resources derived from state excisecigarette tax for paid antismoking advertising campaigns aimed at young persons.
References1. DiFranza FR, Tye JB. Who profits from tobacco sales to children? JAMA 1990;263:2784–7.2. US Department of Health and Human Services. Preventing tobacco use among young people:
a report of the Surgeon General. Atlanta: US Department of Health and Human Services,Public Health Service, CDC, National Center for Chronic Disease Prevention and Health Pro-motion, Office on Smoking and Health, 1994.
3. Pierce JP, Gilpin E, Burns DM, et al. Does tobacco advertising target young people to startsmoking?: evidence from California. JAMA 1991;266:3154–8.
4. Hunter SM, Croft JB, Burke GL, Parker FC, Webber LS, Berenson GS. Longitudinal patternsof cigarette smoking and smokeless tobacco use in youth: the Bogalusa Heart Study. AmJ Public Health 1986;76:193–5.
5. Shah BV. Software for Survey Data Analysis (SUDAAN) version 5.30 [Software documenta-tion]. Research Triangle Park, North Carolina: Research Triangle Institute, 1989.
6. CDC. Comparison of the cigarette brand preferences of adult and teenaged smokers—UnitedStates, 1989, and 10 U.S. communities, 1988 and 1990. MMWR 1992;41:169–73,179–81.
7. LNA/MediaWatch Multi-Media Service. Ad dollars summary, January–December 1993. NewYork: Competitive Media Reporting, 1994.
8. Maxwell JC Jr. The Maxwell consumer report: fourth-quarter and year-end 1993 sales esti-mates for the cigarette industry. Richmond, Virginia: Wheat First Securities/Butcher & Singer,February 10, 1994.
9. LNA/Arbitron Multi-Media Service. Product vs. media report. New York: Competitive MediaReporting, 1993.
10. Public Health Service. Healthy people 2000: national health promotion and disease preventionobjectives—full report, with commentary. Washington, DC: US Department of Health and Hu-man Services, Public Health Service, 1991:152; DHHS publication no. (PHS)91-50212.Adolescent Smokers — Continued
Effectiveness in Disease and Injury Prevention
Medical-Care Spending — United States
Medical-Care Spending — ContinuedOne aspect of health-care reform is the role of prevention in controlling costs. Toevaluate data on medical spending by disease category, the National Public ServicesResearch Institute examined data from the 1987 National Medical Expenditure Survey(NMES-2), with emphasis on the Medical Provider Survey supplement. This reportpresents the findings of that analysis.
The NMES-2 was a population-based longitudinal survey in which data were gath-ered for the civilian, noninstitutionalized U.S. population for January 1–December 31,
Vol. 43 / No. 32 MMWR 581
Adolescent Smokers — Continued

1987 (the most recent year for which complete data were available), about socio-demographic factors; use of medical care; and medical-care expenditures for hospitalinpatient, outpatient, and emergency department care; physician and allied healthprofessional services; prescribed medication; emergency transport; and medicalsupplies and equipment (1 ). The Medical Provider Survey supplement provided con-firmation of self-reported medical-care costs and information about costs that surveyrespondents were unable to report. The analysis presented in this report was re-stricted to the household survey sample of the NMES-2, a subset of the data thatincluded face-to-face interviews of approximately 35,000 persons in 14,000 house-holds regarding use of and expenses for health services during 1987. Not included inthis analysis were dental costs, mental health services without a medical component,and administrative costs and overhead for insurance claims. All medical expenditureestimates were adjusted to December 1993 dollars using medical-care spending percapita for all medical treatment as the inflator.
Cardiovascular disease accounted for $80 billion (14%) of the $572 billion (in 1993dollars) in medical spending for services other than nursing-home care, dental care,and insurance claims processing (Table 1). Injuries accounted for $69 billion (12%),including spending attributed to longer term musculoskeletal deterioration resultingfrom injury. Spending for each of these categories exceeded that for cancer and forgenitourinary disease (including kidney disease) ($49 billion each). Medical spendingfor well care, including preventive care, was 3% of the total costs ($17 billion).
Excluding live births, injury was the largest contributor to health-care expendituresfor persons aged 5–49 years (Figure 1). Injury was the second largest contributor tohealth-care costs among persons aged <5 years and >85 years; cardiovascular diseaseand cancer were the two largest contributors for those aged 50–85 years.
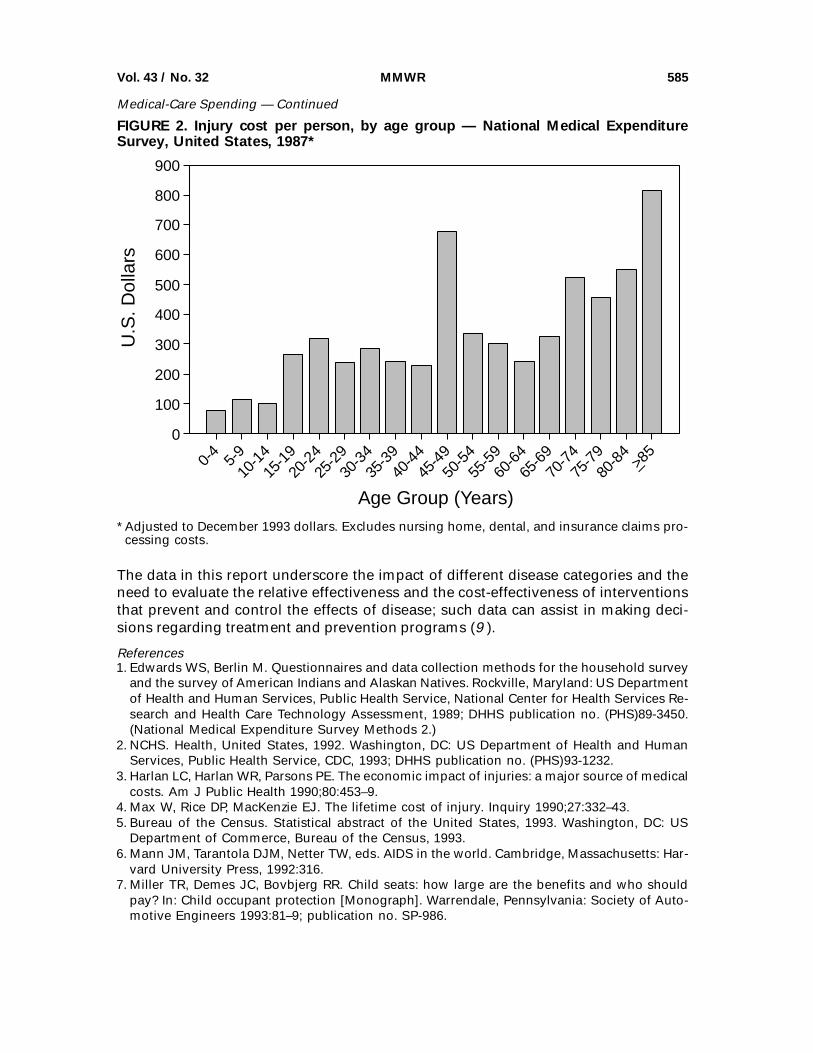
Medical spending on injury treatment averaged $284 per person. Injury costs in-creased for those aged >65 years, with the highest per capita spending for injury beingfor those aged ≥70 years (Figure 2). However, increases in spending for cardiovasculardisease and cancer for those age groups were higher than those for injury.
Inpatient hospital costs were the largest component of medical spending ($329 bil-lion [57%]), with ambulatory-care visits contributing $90 billion (16%) and hospitaloutpatient services, $66 billion (11%). Prescriptions were the fourth largest compo-nent ($38 billion [7%]). Home-health–care ($20 billion), emergency department($15 billion), and other medical ($15 billion) costs each contributed approximately 3%.
By type of care, cardiovascular disease accounted for 15% of the hospital costs;cancer, 11%; and injury, 10% (Table 2). Cardiovascular disease also contributed themost in prescription costs (27%) and home-health–care costs (27%) (Table 2). Injurycosts were the largest component of spending for emergency department visits (46%),hospital outpatient visits (16%), and ambulatory care (16%). Of the ambulatory-carevisit costs, 14% were for well care.Reported by: TR Miller, PhD, DC Lestina, MS Galbraith, Children’s Safety Network Economicsand Insurance Resource Center, National Public Svcs Research Institute, Landover, Maryland.DC Viano, PhD, Biomedical Science Dept, General Motors Research Laboratories, Warren, Michi-gan. Div of Unintentional Injury Prevention, National Center for Injury Prevention and Control,CDC.Editorial Note: The findings in this report indicate that the largest source of health-care spending in the U.S. population is cardiovascular disease. This reflects the high
582 MMWR August 19, 1994
Medical-Care Spending — Continued

prevalence of coronary or ischemic heart disease, which is the leading cause of deathin the United States. However, the influences and risk factors for cardiovascular dis-ease potentially can be modified through public policy and preventive practice (e.g.,smoking and diet).
Injury, the leading cause of death for persons in all age groups from 1 year through44 years (2 ), is also a large contributor to health-care costs. The data in this reportcorroborate the finding that medical-care payments for injury are the second leadingsource of direct medical costs in the noninstitutionalized U.S. population (3 ). In addi-tion, the cost burden for injuries is spread across all age groups (4 ). Because directmedical costs do not include the reduced or lost productivity in the working-age popu-
TABLE 1. Medical expenditures, by diagnostic category,* — United States, 1987†
Diagnostic category Medical expenditures§ % Total costs¶
Cardiovascular $ 79.6 13.9Injury and long-term
effects 69.1 12.1Neoplasm 49.6 8.7Genitourinary 49.3 8.7Pregnancy/Birth-related 39.7 6.9Respiratory 38.3 6.7Digestive 35.9 6.3Musculoskeletal** 27.7 4.8Other circulatory
diagnosis 20.2 3.5Mental health†† 19.3 3.4Well care 17.4 3.0Congenital anomalies 8.7 1.5Medical misadventure 6.9 1.2Miscellaneous§§ 110.6 19.3
Total 572.3 100.0
* International Classification of Diseases, Ninth Revision, Clinical Modification (ICD-9-CM)codes used to define diagnostic categories: Cardiovascular: 390–429, 451–459; Injury andlong-term effects: 800–994, 294.0, 304.6, 310.2, 344.0, 344.1, 366.2, 507.1, 508.0, 521.2, 525.1,719.0, 719.5, 722.0–722.2, 724.2, 724.3, 724.5, 724.6, 724.8, 780.0, 799.0, V71.3–V71.5; Neo-plasms: 140–239, V58.0, V58.1; Genitourinary: 580–629, 250.0, V56; Pregnancy and birth-related conditions, including live births and normal delivery: 630–674, V22.2; Respiratory:460–519, 786.0 (excluding codes used for the injury diagnostic category); Digestive: 520–579(excluding codes used for the injury diagnostic category); Musculoskeletal: 710–739(excluding codes used for the injury diagnostic category); Other circulatory: 430–450; Mentaldisease: 290–319 (excluding codes used for the injury diagnostic category); Well care:V40–V49, V70–V82 (excluding codes used for the injury diagnostic category); Congenitalanomalies: 740–779; Medical misadventure: 995–999; and Miscellaneous: all other ICD-9-CMcodes.
†Adjusted to December 1993 dollars. Excludes nursing home, dental, and insurance claimsprocessing costs.
§In billions.¶Costs of incidents without diagnoses were allocated in proportion to cost of knowndiagnoses.
**Musculoskeletal problems traceable to earlier injury were classified as injury.††Excludes mental health services without a medical component.§§Miscellaneous includes carpal tunnel syndrome, endocrine disorders other than diabetes,
anemia, conditions that were not clearly attributable to an underlying cause (e.g.,unconsciousness, headache, and fitting and adjustment of prostheses), cataracts, andglaucoma.
Vol. 43 / No. 32 MMWR 583
Medical-Care Spending — Continued

lation, this analysis does not adequately present the total economic burden attribut-able to injury.
This study is subject to at least four limitations. First, the data underestimate totaldirect medical costs because institutionalized persons, military members and theirfamilies, and homeless persons were excluded. Second, nursing home costs—approximately $60 billion annually across all disease categories (5 )—also were omit-ted from this analysis. Third, the unitary, systems-based categorization of each illnessor injury used in this analysis masks the potential importance of some categories,such as infectious diseases. Infectious diseases were subsumed under the injury orsystem category that they affect; for example, pulmonary infections tended to be clas-sified in the respiratory category, urinary tract infections in the genitourinary category,and human immunodeficiency virus (HIV) infection and acquired immunodeficiencysyndrome (AIDS) in the categories of affected systems or as miscellaneous. Similarly,spending for outpatient visits for complications of diabetes mellitus may appear ascardiovascular disease costs. Fourth, the direct costs related to infectious diseases areunderestimated because the incidence of HIV infection and AIDS resulted in substan-tially increased spending after 1987 (6 ).
Numerous prevention measures reduce direct medical costs while saving lives. Forexample, approximately $2 are saved in medical-care costs for every $1 spent onchild-safety seats (7 ); from 1982 through 1990, child-safety seats and safety beltssaved the lives of approximately 1300 infants and toddlers in the United States (8 ).
PercentPercent
353025201510
50
35302520151050
Injury
CardiovascularDisease
Cancer
GenitourinaryDisease
Age Group(Years)
0-45-9
10-1415-19
20-2425-29
30-3435-39
40-4445-49
50-5455-59
60-6465-69
70-7475-79
80-84>85_
FIGURE 1. Percentage of medical-care spending, by age group and selected causes— National Medical Expenditures Survey, United States, 1987*
*Excludes nursing home, dental, and insurance claims processing costs.
584 MMWR August 19, 1994
Medical-Care Spending — Continued
The data in this report underscore the impact of different disease categories and theneed to evaluate the relative effectiveness and the cost-effectiveness of interventionsthat prevent and control the effects of disease; such data can assist in making deci-sions regarding treatment and prevention programs (9 ).
References1. Edwards WS, Berlin M. Questionnaires and data collection methods for the household survey
and the survey of American Indians and Alaskan Natives. Rockville, Maryland: US Departmentof Health and Human Services, Public Health Service, National Center for Health Services Re-search and Health Care Technology Assessment, 1989; DHHS publication no. (PHS)89-3450.(National Medical Expenditure Survey Methods 2.)
2. NCHS. Health, United States, 1992. Washington, DC: US Department of Health and HumanServices, Public Health Service, CDC, 1993; DHHS publication no. (PHS)93-1232.
3. Harlan LC, Harlan WR, Parsons PE. The economic impact of injuries: a major source of medicalcosts. Am J Public Health 1990;80:453–9.
4. Max W, Rice DP, MacKenzie EJ. The lifetime cost of injury. Inquiry 1990;27:332–43.5. Bureau of the Census. Statistical abstract of the United States, 1993. Washington, DC: US
Department of Commerce, Bureau of the Census, 1993.6. Mann JM, Tarantola DJM, Netter TW, eds. AIDS in the world. Cambridge, Massachusetts: Har-
vard University Press, 1992:316.7. Miller TR, Demes JC, Bovbjerg RR. Child seats: how large are the benefits and who should
pay? In: Child occupant protection [Monograph]. Warrendale, Pennsylvania: Society of Auto-motive Engineers 1993:81–9; publication no. SP-986.
0
100
200
300
400
500
600
700
800
900
0-4
5-910
-1415
-1920
-2425
-2930
-3435
-3940
-4445
-4950
-5455
-5960
-6465
-6970
-7475
-7980
-84
>85
Age Group (Years)
U.S
. Dol
lars
_
FIGURE 2. Injury cost per person, by age group — National Medical ExpenditureSurvey, United States, 1987*
*Adjusted to December 1993 dollars. Excludes nursing home, dental, and insurance claims pro-cessing costs.
Vol. 43 / No. 32 MMWR 585
Medical-Care Spending — Continued

8. National Highway Traffic Safety Administration. Occupant protection facts. Washington, DC:US Department of Transportation, National Highway Traffic Safety Administration, 1990.
9. Public Health Service/Battelle. For a healthy nation: returns on investment in public health.Atlanta: US Department of Health and Human Services, Public Health Service, Office of DiseasePrevention and Health Promotion and CDC/Battelle, Center for Public Health Research andEvaluation, 1994.Medical-Care Spending — Continued
TABLE 2. Percentage of expenditures for different types of care, by diagnosticcategory* — United States, 1987†
Diagnostic category
Hospitalinpatient
careEmergencydepartment
Outpatientcare
Ambulatoryvisits
Homecare Prescriptions Other
Cardiovascular 15.1 4.6 9.6 7.3 27.3 27.1 3.5Injury and long-term
effects 10.1 45.9 16.1 16.4 7.3 3.4 7.7Neoplasm 10.7 10.2 11.3 4.4 7.7 3.0 1.8Genitourinary 8.8 5.7 12.6 6.4 10.4 7.5 4.9Pregnancy/
Birth-related 10.2 1.2 0.5 4.1 0.0 0.2 0.1Respiratory 6.2 10.7 6.2 7.7 3.0 10.5 5.0Digestive 8.4 4.4 4.2 2.8 1.0 4.9 0.8Musculoskeletal§ 3.3 2.7 7.8 6.4 11.9 7.3 3.5Other circulatory 5.1 0.9 1.2 1.0 3.4 1.6 0.9Mental health¶
3.2 1.2 2.6 5.5 3.1 3.8 0.1Well care 0.1 <0.1 1.5 13.6 1.8 1.4 1.0Congenital anomalies 2.1 0.2 1.0 0.5 0.3 1.2 0.4Medical misadventure 1.3 2.1 1.4 1.0 0.3 1.1 0.5Miscellaneous** 14.5 18.8 24.1 22.9 22.5 27.0 69.8
Total 100.0 100.0 100.0 100.0 100.0 100.0 100.0
* International Classification of Diseases, Ninth Revision, Clinical Modification (ICD-9-CM)codes used to define diagnostic categories: Cardiovascular: 390–429, 451–459; Injury andlong-term effects: 800–994, 294.0, 304.6, 310.2, 344.0, 344.1, 366.2, 507.1, 508.0, 521.2, 525.1,719.0, 719.5, 722.0–722.2, 724.2, 724.3, 724.5, 724.6, 724.8, 780.0, 799.0, V71.3–V71.5; Neo-plasms: 140–239, V58.0, V58.1; Genitourinary: 580–629, 250.0, V56; Pregnancy and birth-related conditions, including live births and normal delivery: 630–674, V22.2; Respiratory:460–519, 786.0 (excluding codes used for the injury diagnostic category); Digestive: 520–579(excluding codes used for the injury diagnostic category); Musculoskeletal: 710–739(excluding codes used for the injury diagnostic category); Other circulatory: 430–450; Mentaldisease: 290–319 (excluding codes used for the injury diagnostic category); Well care:V40–V49, V70–V82 (excluding codes used for the injury diagnostic category); Congenitalanomalies: 740–779; Medical misadventure: 995–999; and Miscellaneous: all other ICD-9-CMcodes.
†Adjusted to December 1993 dollars. Excludes nursing home, dental, and insurance claimsprocessing costs.
§Musculoskeletal problems traceable to earlier injury were classified as injury.¶Excludes mental health services without a medical component.
**Miscellaneous includes carpal tunnel syndrome, endocrine disorders other than diabetes,anemia, conditions that were not clearly attributable to an underlying cause (e.g.,unconsciousness, headache, and fitting and adjustment of prostheses), cataracts, andglaucoma.
586 MMWR August 19, 1994
Medical-Care Spending — Continued
Current Trends
Occupational Injury Deaths of Postal Workers —United States, 1980–1989
Occupational Injury Deaths — ContinuedExtensive media coverage of work-related homicides at U.S. Postal Service facili-ties raised the concern about whether postal workers are at increased risk forwork-related homicide, particularly from those committed by disgruntled coworkers.Based on national surveillance data, neither the Postal Service industry nor postal oc-cupations are among the groups at increased risk for work-related homicide (1,2 ). Tofurther assess this concern and to determine the relative magnitude of occupationalinjury deaths in the Postal Service, CDC’s National Institute for Occupational Safetyand Health (NIOSH) used data from its National Traumatic Occupational Fatalities(NTOF) surveillance system* to examine occupational injury deaths in the Postal Serv-ice and compare Postal Service fatality rates with overall rates for all U.S. industries.This report summarizes the results of that analysis.
NTOF data for 1980 through 1989 (the most recent year for which complete data areavailable) were analyzed. Employment data for the calculation of rates were derivedfrom the Current Population Survey (4 ). Rates were calculated only for 1983–1989because reporting of Postal Service employment data changed in 1983.
NTOF recorded 169 occupational injury deaths among U.S. Postal Service workersduring 1980–1989. During 1983–1989, the average annual rate of occupational injurydeath in the Postal Service was 2.1 per 100,000 workers, less than half the rate of5.4 per 100,000 workers for all industries combined. Men accounted for 130 (77%) ofthe occupational injury deaths in the Postal Service and had a higher rate of fatal in-jury than did women (2.3 per 100,000 workers, compared with 1.8). A total of 98 (58%)of the decedents were aged >45 years.
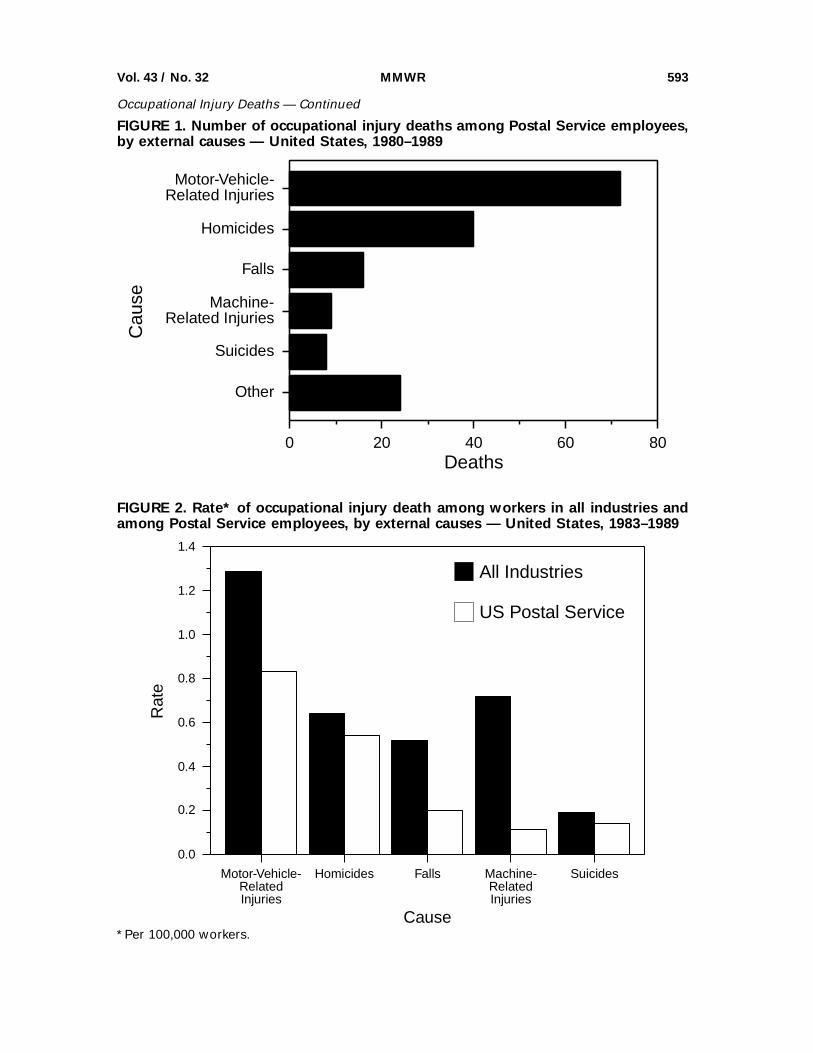
Motor-vehicle–related events (n=72) were the leading cause of fatal occupationalinjury, followed by homicide (n=40) (Figure 1, page 593). Cause-specific rates for Post-al Service employees were consistently lower than rates for all industries, with thelargest differential in the category of machine-related deaths (Figure 2, page 593).
Collisions between motor vehicles caused 43 (60%) of the motor-vehicle–relateddeaths among Postal Service workers. Three (4%) deaths occurred to pedestrians onthe job who were struck by motor vehicles. Fifty-one (71%) deaths occurred amongmail carriers and eight (11%) among drivers.
Among homicide victims, 26 (65%) were men. The homicide rate for men was0.5 per 100,000, compared to 0.6 for women. Firearms were used in 34 (85%) of thehomicides. Seventeen (43%) of the victims were mail carriers; nine (23%), postalclerks; five (13%), postmasters and mail superintendents; and three (8%), other speci-fied occupations. Occupation was unknown or not specified for six (15%) of thevictims.Reported by: Div of Safety Research, National Institute for Occupational Safety and Health, CDC.
(Continued on page 593)
*NTOF is based on death certificates compiled from all 52 vital statistics reporting units in theUnited States that meet three criteria: the decedent was ≥16 years of age, the cause of deathwas an injury or poisoning according to the International Classification of Diseases, NinthRevision, and the certifier responded positively to the “Injury at Work?” question (3 ).
Vol. 43 / No. 32 MMWR 587

FIGURE I. Notifiable disease reports, comparison of 4-week totals ending August 13,1994, with historical data — United States
*Ratio of current 4-week total to mean of 15 4-week totals (from previous, comparable, andsubsequent 4-week periods for the past 5 years). The point where the hatched area begins isbased on the mean and two standard deviations of these 4-week totals.
AIDS* 45,801 Measles: imported 154Anthrax - indigenous 634Botulism: Foodborne 41 Plague 10
Infant 42 Poliomyelitis, Paralytic§ 1Other 6 Psittacosis 23
Brucellosis 58 Rabies, human 1Cholera 9 Syphilis, primary & secondary 13,156Congenital rubella syndrome 2 Syphilis, congenital, age < 1 year¶ 532Diphtheria - Tetanus 21Encephalitis, post-infectious 71 Toxic shock syndrome 118Gonorrhea 229,379 Trichinosis 26Haemophilus influenzae (invasive disease)† 734 Tuberculosis 12,846Hansen Disease 68 Tularemia 50Leptospirosis 18 Typhoid fever 230Lyme Disease 5,195 Typhus fever, tickborne (RMSF) 217
Cum. 1994Cum. 1994
TABLE I. Summary — cases of specified notifiable diseases, United States,cumulative, week ending August 13, 1994 (32nd Week)
*Updated monthly to the Division of HIV/AIDS, National Center for Infectious Diseases; last update July 26, 1994.†Of 693 cases of known age, 196 (28%) were reported among children less than 5 years of age.§The remaining 5 suspected cases with onset in 1994 have not yet been confirmed. In 1993, 3 of 10 suspected cases wereconfirmed. Two of the confirmed cases of 1993 were vaccine-associated and one was classified as imported.
¶Total reported to the Division of Sexually Transmitted Diseases and HIV Prevention, National Center for Prevention Services,through first quarter 1994.
588 MMWR August 19, 1994
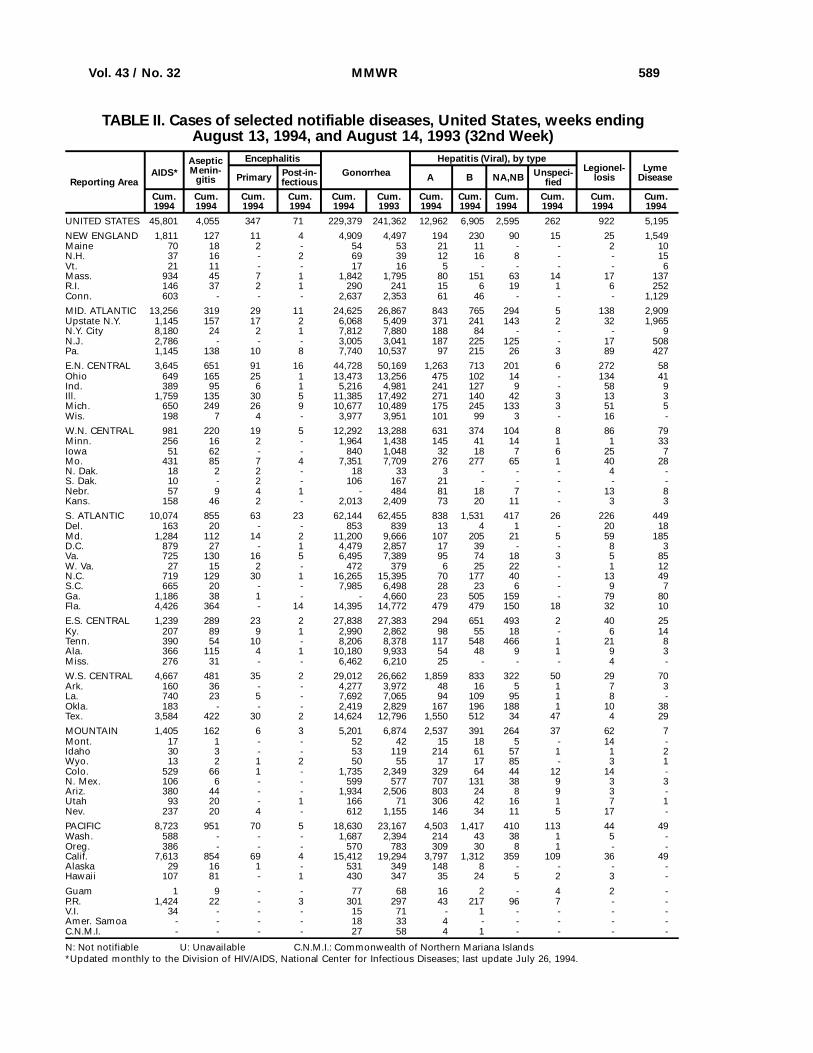
TABLE II. Cases of selected notifiable diseases, United States, weeks endingAugust 13, 1994, and August 14, 1993 (32nd Week)
UNITED STATES 45,801 4,055 347 71 229,379 241,362 12,962 6,905 2,595 262 922 5,195
NEW ENGLAND 1,811 127 11 4 4,909 4,497 194 230 90 15 25 1,549Maine 70 18 2 - 54 53 21 11 - - 2 10N.H. 37 16 - 2 69 39 12 16 8 - - 15Vt. 21 11 - - 17 16 5 - - - - 6Mass. 934 45 7 1 1,842 1,795 80 151 63 14 17 137R.I. 146 37 2 1 290 241 15 6 19 1 6 252Conn. 603 - - - 2,637 2,353 61 46 - - - 1,129
MID. ATLANTIC 13,256 319 29 11 24,625 26,867 843 765 294 5 138 2,909Upstate N.Y. 1,145 157 17 2 6,068 5,409 371 241 143 2 32 1,965N.Y. City 8,180 24 2 1 7,812 7,880 188 84 - - - 9N.J. 2,786 - - - 3,005 3,041 187 225 125 - 17 508Pa. 1,145 138 10 8 7,740 10,537 97 215 26 3 89 427
E.N. CENTRAL 3,645 651 91 16 44,728 50,169 1,263 713 201 6 272 58Ohio 649 165 25 1 13,473 13,256 475 102 14 - 134 41Ind. 389 95 6 1 5,216 4,981 241 127 9 - 58 9Ill. 1,759 135 30 5 11,385 17,492 271 140 42 3 13 3Mich. 650 249 26 9 10,677 10,489 175 245 133 3 51 5Wis. 198 7 4 - 3,977 3,951 101 99 3 - 16 -
W.N. CENTRAL 981 220 19 5 12,292 13,288 631 374 104 8 86 79Minn. 256 16 2 - 1,964 1,438 145 41 14 1 1 33Iowa 51 62 - - 840 1,048 32 18 7 6 25 7Mo. 431 85 7 4 7,351 7,709 276 277 65 1 40 28N. Dak. 18 2 2 - 18 33 3 - - - 4 -S. Dak. 10 - 2 - 106 167 21 - - - - -Nebr. 57 9 4 1 - 484 81 18 7 - 13 8Kans. 158 46 2 - 2,013 2,409 73 20 11 - 3 3
S. ATLANTIC 10,074 855 63 23 62,144 62,455 838 1,531 417 26 226 449Del. 163 20 - - 853 839 13 4 1 - 20 18Md. 1,284 112 14 2 11,200 9,666 107 205 21 5 59 185D.C. 879 27 - 1 4,479 2,857 17 39 - - 8 3Va. 725 130 16 5 6,495 7,389 95 74 18 3 5 85W. Va. 27 15 2 - 472 379 6 25 22 - 1 12N.C. 719 129 30 1 16,265 15,395 70 177 40 - 13 49S.C. 665 20 - - 7,985 6,498 28 23 6 - 9 7Ga. 1,186 38 1 - - 4,660 23 505 159 - 79 80Fla. 4,426 364 - 14 14,395 14,772 479 479 150 18 32 10
E.S. CENTRAL 1,239 289 23 2 27,838 27,383 294 651 493 2 40 25Ky. 207 89 9 1 2,990 2,862 98 55 18 - 6 14Tenn. 390 54 10 - 8,206 8,378 117 548 466 1 21 8Ala. 366 115 4 1 10,180 9,933 54 48 9 1 9 3Miss. 276 31 - - 6,462 6,210 25 - - - 4 -
W.S. CENTRAL 4,667 481 35 2 29,012 26,662 1,859 833 322 50 29 70Ark. 160 36 - - 4,277 3,972 48 16 5 1 7 3La. 740 23 5 - 7,692 7,065 94 109 95 1 8 -Okla. 183 - - - 2,419 2,829 167 196 188 1 10 38Tex. 3,584 422 30 2 14,624 12,796 1,550 512 34 47 4 29
MOUNTAIN 1,405 162 6 3 5,201 6,874 2,537 391 264 37 62 7Mont. 17 1 - - 52 42 15 18 5 - 14 -Idaho 30 3 - - 53 119 214 61 57 1 1 2Wyo. 13 2 1 2 50 55 17 17 85 - 3 1Colo. 529 66 1 - 1,735 2,349 329 64 44 12 14 -N. Mex. 106 6 - - 599 577 707 131 38 9 3 3Ariz. 380 44 - - 1,934 2,506 803 24 8 9 3 -Utah 93 20 - 1 166 71 306 42 16 1 7 1Nev. 237 20 4 - 612 1,155 146 34 11 5 17 -
PACIFIC 8,723 951 70 5 18,630 23,167 4,503 1,417 410 113 44 49Wash. 588 - - - 1,687 2,394 214 43 38 1 5 -Oreg. 386 - - - 570 783 309 30 8 1 - -Calif. 7,613 854 69 4 15,412 19,294 3,797 1,312 359 109 36 49Alaska 29 16 1 - 531 349 148 8 - - - -Hawaii 107 81 - 1 430 347 35 24 5 2 3 -
Guam 1 9 - - 77 68 16 2 - 4 2 -P.R. 1,424 22 - 3 301 297 43 217 96 7 - -V.I. 34 - - - 15 71 - 1 - - - -Amer. Samoa - - - - 18 33 4 - - - - -C.N.M.I. - - - - 27 58 4 1 - - - -
Reporting AreaCum.1994
Cum.1994
Cum.1993
Cum.1994
Cum.1994
Cum.1994
Cum.1994
Cum.1994
Cum.1994
Cum.1994
Cum.1994
Cum.1994
AsepticMenin-
gitisPost-in-fectious
AIDS* A
Encephalitis
Primary B NA,NB Unspeci-fied
Hepatitis (Viral), by typeLyme
DiseaseGonorrhea Legionel-losis
N: Not notifiable U: Unavailable C.N.M.I.: Commonwealth of Northern Mariana Islands*Updated monthly to the Division of HIV/AIDS, National Center for Infectious Diseases; last update July 26, 1994.
Vol. 43 / No. 32 MMWR 589
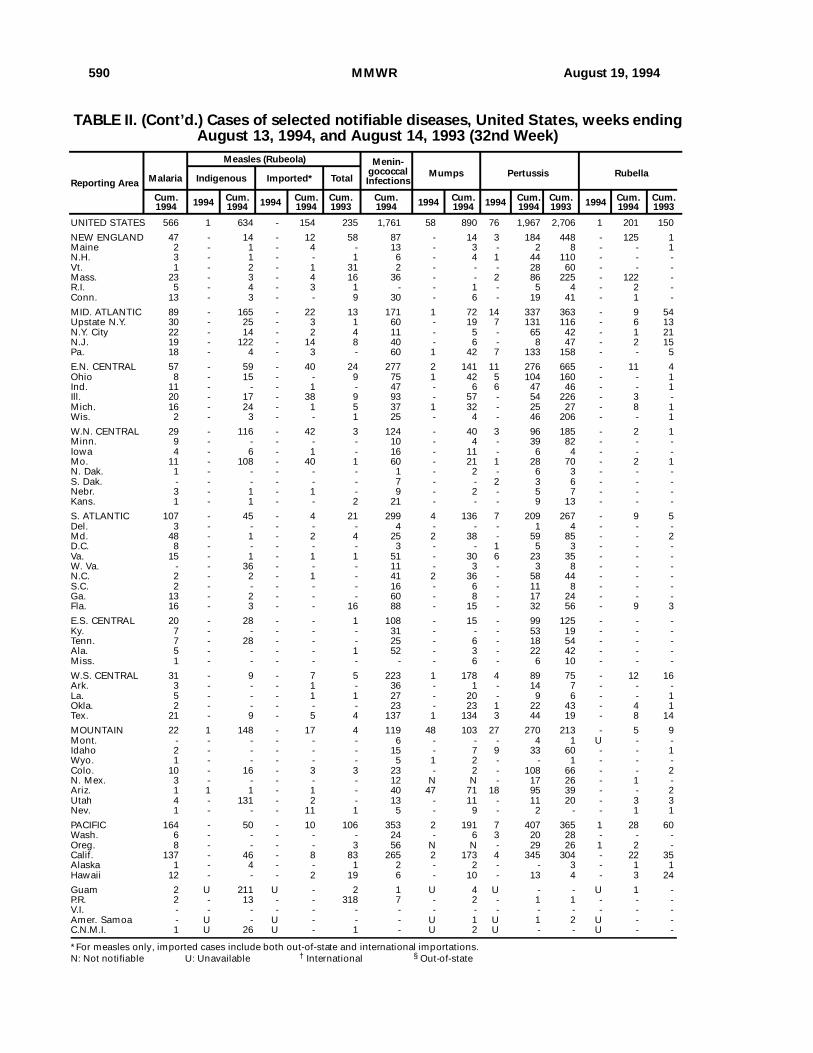
TABLE II. (Cont’d.) Cases of selected notifiable diseases, United States, weeks endingAugust 13, 1994, and August 14, 1993 (32nd Week)
UNITED STATES 566 1 634 - 154 235 1,761 58 890 76 1,967 2,706 1 201 150
NEW ENGLAND 47 - 14 - 12 58 87 - 14 3 184 448 - 125 1Maine 2 - 1 - 4 - 13 - 3 - 2 8 - - 1N.H. 3 - 1 - - 1 6 - 4 1 44 110 - - -Vt. 1 - 2 - 1 31 2 - - - 28 60 - - -Mass. 23 - 3 - 4 16 36 - - 2 86 225 - 122 -R.I. 5 - 4 - 3 1 - - 1 - 5 4 - 2 -Conn. 13 - 3 - - 9 30 - 6 - 19 41 - 1 -
MID. ATLANTIC 89 - 165 - 22 13 171 1 72 14 337 363 - 9 54Upstate N.Y. 30 - 25 - 3 1 60 - 19 7 131 116 - 6 13N.Y. City 22 - 14 - 2 4 11 - 5 - 65 42 - 1 21N.J. 19 - 122 - 14 8 40 - 6 - 8 47 - 2 15Pa. 18 - 4 - 3 - 60 1 42 7 133 158 - - 5
E.N. CENTRAL 57 - 59 - 40 24 277 2 141 11 276 665 - 11 4Ohio 8 - 15 - - 9 75 1 42 5 104 160 - - 1Ind. 11 - - - 1 - 47 - 6 6 47 46 - - 1Ill. 20 - 17 - 38 9 93 - 57 - 54 226 - 3 -Mich. 16 - 24 - 1 5 37 1 32 - 25 27 - 8 1Wis. 2 - 3 - - 1 25 - 4 - 46 206 - - 1
W.N. CENTRAL 29 - 116 - 42 3 124 - 40 3 96 185 - 2 1Minn. 9 - - - - - 10 - 4 - 39 82 - - -Iowa 4 - 6 - 1 - 16 - 11 - 6 4 - - -Mo. 11 - 108 - 40 1 60 - 21 1 28 70 - 2 1N. Dak. 1 - - - - - 1 - 2 - 6 3 - - -S. Dak. - - - - - - 7 - - 2 3 6 - - -Nebr. 3 - 1 - 1 - 9 - 2 - 5 7 - - -Kans. 1 - 1 - - 2 21 - - - 9 13 - - -
S. ATLANTIC 107 - 45 - 4 21 299 4 136 7 209 267 - 9 5Del. 3 - - - - - 4 - - - 1 4 - - -Md. 48 - 1 - 2 4 25 2 38 - 59 85 - - 2D.C. 8 - - - - - 3 - - 1 5 3 - - -Va. 15 - 1 - 1 1 51 - 30 6 23 35 - - -W. Va. - - 36 - - - 11 - 3 - 3 8 - - -N.C. 2 - 2 - 1 - 41 2 36 - 58 44 - - -S.C. 2 - - - - - 16 - 6 - 11 8 - - -Ga. 13 - 2 - - - 60 - 8 - 17 24 - - -Fla. 16 - 3 - - 16 88 - 15 - 32 56 - 9 3
E.S. CENTRAL 20 - 28 - - 1 108 - 15 - 99 125 - - -Ky. 7 - - - - - 31 - - - 53 19 - - -Tenn. 7 - 28 - - - 25 - 6 - 18 54 - - -Ala. 5 - - - - 1 52 - 3 - 22 42 - - -Miss. 1 - - - - - - - 6 - 6 10 - - -
W.S. CENTRAL 31 - 9 - 7 5 223 1 178 4 89 75 - 12 16Ark. 3 - - - 1 - 36 - 1 - 14 7 - - -La. 5 - - - 1 1 27 - 20 - 9 6 - - 1Okla. 2 - - - - - 23 - 23 1 22 43 - 4 1Tex. 21 - 9 - 5 4 137 1 134 3 44 19 - 8 14
MOUNTAIN 22 1 148 - 17 4 119 48 103 27 270 213 - 5 9Mont. - - - - - - 6 - - - 4 1 U - -Idaho 2 - - - - - 15 - 7 9 33 60 - - 1Wyo. 1 - - - - - 5 1 2 - - 1 - - -Colo. 10 - 16 - 3 3 23 - 2 - 108 66 - - 2N. Mex. 3 - - - - - 12 N N - 17 26 - 1 -Ariz. 1 1 1 - 1 - 40 47 71 18 95 39 - - 2Utah 4 - 131 - 2 - 13 - 11 - 11 20 - 3 3Nev. 1 - - - 11 1 5 - 9 - 2 - - 1 1
PACIFIC 164 - 50 - 10 106 353 2 191 7 407 365 1 28 60Wash. 6 - - - - - 24 - 6 3 20 28 - - -Oreg. 8 - - - - 3 56 N N - 29 26 1 2 -Calif. 137 - 46 - 8 83 265 2 173 4 345 304 - 22 35Alaska 1 - 4 - - 1 2 - 2 - - 3 - 1 1Hawaii 12 - - - 2 19 6 - 10 - 13 4 - 3 24
Guam 2 U 211 U - 2 1 U 4 U - - U 1 -P.R. 2 - 13 - - 318 7 - 2 - 1 1 - - -V.I. - - - - - - - - - - - - - - -Amer. Samoa - U - U - - - U 1 U 1 2 U - -C.N.M.I. 1 U 26 U - 1 - U 2 U - - U - -
Reporting AreaCum.1994
Cum.1994
Cum.19941994 Cum.
1994Cum.1994
Cum.1993 1994Cum.
1994Cum.19941994 Cum.
1993
Indigenous Imported*Malaria
Measles (Rubeola)RubellaMumps
Menin-gococcalInfections
1994
Total
Cum.1993 1994
Pertussis
*For measles only, imported cases include both out-of-state and international importations.N: Not notifiable U: Unavailable † International § Out-of-state
590 MMWR August 19, 1994

TABLE II. (Cont’d.) Cases of selected notifiable diseases, United States, weeks endingAugust 13, 1994, and August 14, 1993 (32nd Week)
UNITED STATES 13,156 16,302 118 12,846 13,584 50 230 217 3,708
NEW ENGLAND 143 219 3 282 291 - 18 9 1,128Maine 4 3 - - 12 - - - -N.H. 3 21 - 14 15 - - - 106Vt. - 1 1 3 3 - - - 97Mass. 59 94 2 145 152 - 14 7 429R.I. 12 9 - 32 36 - 1 - 5Conn. 65 91 - 88 73 - 3 2 491
MID. ATLANTIC 795 1,499 21 2,363 2,880 1 55 5 370Upstate N.Y. 94 133 11 112 435 1 7 1 79N.Y. City 346 781 - 1,580 1,714 - 33 - -N.J. 120 202 - 470 293 - 15 1 184Pa. 235 383 10 201 438 - - 3 107
E.N. CENTRAL 1,802 2,734 24 1,289 1,391 4 43 31 33Ohio 748 725 8 202 200 1 5 20 -Ind. 161 228 2 105 136 1 4 3 9Ill. 502 1,085 5 660 735 - 23 6 8Mich. 176 381 9 285 263 1 4 2 9Wis. 215 315 - 37 57 1 7 - 7
W.N. CENTRAL 735 1,050 19 324 294 20 1 22 133Minn. 29 43 1 72 37 1 - - 13Iowa 36 49 7 28 37 - - 1 55Mo. 636 849 5 149 151 13 1 9 11N. Dak. - 2 1 6 5 - - - 6S. Dak. - 2 - 17 11 1 - 10 22Nebr. - 10 2 10 16 1 - 1 -Kans. 34 95 3 42 37 4 - 1 26
S. ATLANTIC 3,776 4,276 6 2,359 2,737 1 34 101 1,265Del. 13 83 - - 30 - 1 - 29Md. 161 242 - 192 237 - 5 10 345D.C. 149 225 - 77 104 - 1 - 2Va. 420 399 1 206 267 - 5 9 237W. Va. 8 7 - 52 49 - - 2 51N.C. 1,072 1,205 1 278 320 - - 36 105S.C. 474 625 - 228 256 - - 9 117Ga. 956 728 - 539 462 1 2 32 249Fla. 523 762 4 787 1,012 - 20 3 130
E.S. CENTRAL 2,288 2,395 2 774 980 - 2 16 116Ky. 131 200 1 202 238 - 1 4 10Tenn. 603 688 1 207 294 - 1 9 34Ala. 408 524 - 254 298 - - 1 72Miss. 1,146 983 - 111 150 - - 2 -
W.S. CENTRAL 2,952 3,117 1 1,833 1,454 14 10 22 454Ark. 314 354 - 177 116 13 - 4 19La. 1,111 1,527 - 94 99 - 3 - 47Okla. 93 207 1 170 93 1 2 14 24Tex. 1,434 1,029 - 1,392 1,146 - 5 4 364
MOUNTAIN 172 151 6 303 331 9 9 11 70Mont. 3 1 - 9 13 3 - 4 -Idaho 1 - 1 11 9 - - - 2Wyo. - 6 - 5 2 - - 2 14Colo. 90 44 3 21 52 1 3 3 8N. Mex. 18 21 - 43 35 2 1 - 2Ariz. 31 64 - 141 134 - 1 1 31Utah 6 1 2 29 19 2 2 - 8Nev. 23 14 - 44 67 1 2 1 5
PACIFIC 493 861 36 3,319 3,226 1 58 - 139Wash. 36 35 - 174 149 - 3 - -Oreg. 21 32 - 90 - 1 2 - 6Calif. 430 785 33 2,854 2,871 - 51 - 104Alaska 4 6 - 34 40 - - - 29Hawaii 2 3 3 167 166 - 2 - -
Guam 4 2 - 58 39 - 1 - -P.R. 182 343 - 86 132 - - - 51V.I. 22 31 - - 2 - - - -Amer. Samoa 1 - - 3 3 - 1 - -C.N.M.I. 1 3 - 22 20 - 1 - -
Reporting AreaCum.1993
Cum.1994
Cum.1994
Cum.1994
Cum.1994
Cum.1994
Cum.1994
Cum.1994
Syphilis(Primary & Secondary)
Tula-remia
Rabies,AnimalTuberculosis
Typhus Fever(Tick-borne)
(RMSF)
Toxic-Shock
Syndrome
Cum.1993
TyphoidFever
U: Unavailable
Vol. 43 / No. 32 MMWR 591
NEW ENGLAND 512 358 92 44 5 12 42Boston, Mass. 137 85 29 16 1 5 21Bridgeport, Conn. 62 41 17 4 - - 5Cambridge, Mass. 16 12 3 1 - - 1Fall River, Mass. 34 30 4 - - - -Hartford, Conn. U U U U U U ULowell, Mass. 10 7 3 - - - -Lynn, Mass. 17 13 4 - - - -New Bedford, Mass. 18 15 - 3 - - -New Haven, Conn. 42 24 8 5 1 4 1Providence, R.I. 29 18 7 3 1 - 2Somerville, Mass. 6 5 - 1 - - -Springfield, Mass. 53 39 7 5 - 2 1Waterbury, Conn. 29 24 3 2 - - 2Worcester, Mass. 59 45 7 4 2 1 9
MID. ATLANTIC 2,401 1,533 472 278 68 50 107Albany, N.Y. 51 34 10 2 4 1 4Allentown, Pa. 24 18 3 2 1 - -Buffalo, N.Y. 100 65 25 3 5 2 -Camden, N.J. 34 21 7 3 - 3 3Elizabeth, N.J. 19 13 3 3 - - 1Erie, Pa.§ 46 36 6 2 1 1 1Jersey City, N.J. 38 24 7 4 - 3 -New York City, N.Y. 1,224 746 260 159 37 22 35Newark, N.J. 64 27 15 19 2 1 7Paterson, N.J. 28 12 7 8 - 1 -Philadelphia, Pa. 393 254 74 45 11 9 26Pittsburgh, Pa.§ 60 42 7 5 3 3 6Reading, Pa. 13 11 1 - - 1 1Rochester, N.Y. 108 83 12 11 2 - 7Schenectady, N.Y. 29 22 4 3 - - -Scranton, Pa.§ 27 21 5 - 1 - 1Syracuse, N.Y. 87 65 15 5 - 2 10Trenton, N.J. 36 24 6 4 1 1 5Utica, N.Y. 20 15 5 - - - -Yonkers, N.Y. U U U U U U U
E.N. CENTRAL 1,893 1,143 361 204 122 63 105Akron, Ohio 39 28 5 4 - 2 -Canton, Ohio 37 29 6 2 - - 1Chicago, Ill. 328 127 61 62 68 10 16Cincinnati, Ohio 121 78 28 6 2 7 15Cleveland, Ohio 161 94 33 17 9 8 2Columbus, Ohio 118 76 20 18 2 2 5Dayton, Ohio 123 90 26 4 1 2 11Detroit, Mich. 211 116 46 31 10 8 11Evansville, Ind. 55 41 8 3 2 1 1Fort Wayne, Ind. 51 33 9 5 4 - 5Gary, Ind. 19 9 8 2 - - 1Grand Rapids, Mich. 60 41 9 6 2 2 9Indianapolis, Ind. 198 127 35 20 9 7 4Madison, Wis. 51 36 10 1 1 3 4Milwaukee, Wis. 109 70 21 9 2 7 8Peoria, Ill. 39 26 8 3 1 1 -Rockford, Ill. 35 24 6 1 2 2 2South Bend, Ind. 43 31 9 3 - - 2Toledo, Ohio 95 67 13 7 7 1 8Youngstown, Ohio U U U U U U U
W.N. CENTRAL 751 524 113 73 22 18 32Des Moines, Iowa U U U U U U UDuluth, Minn. 30 27 2 1 - - -Kansas City, Kans. 59 41 10 7 1 - 4Kansas City, Mo. 90 56 21 7 3 3 4Lincoln, Nebr. 35 26 7 2 - - 1Minneapolis, Minn. 192 140 19 19 7 7 11Omaha, Nebr. 104 77 18 7 1 1 4St. Louis, Mo. 117 78 17 14 4 4 -St. Paul, Minn. 62 37 12 8 4 1 6Wichita, Kans. 62 42 7 8 2 2 2
S. ATLANTIC 1,219 711 257 166 50 35 56Atlanta, Ga. 166 96 33 27 6 4 3Baltimore, Md. 204 107 45 42 7 3 17Charlotte, N.C. 90 55 12 12 5 6 4Jacksonville, Fla. 98 58 28 9 3 - 9Miami, Fla. 143 87 26 20 6 4 -Norfolk, Va. 59 40 8 6 3 2 2Richmond, Va. U U U U U U USavannah, Ga. 29 19 6 4 - - -St. Petersburg, Fla. 55 40 8 3 1 3 3Tampa, Fla. 178 114 38 14 8 4 13Washington, D.C. 191 92 50 29 11 9 5Wilmington, Del. 6 3 3 - - - -
E.S. CENTRAL 856 556 166 77 33 23 62Birmingham, Ala. 136 78 33 16 7 2 3Chattanooga, Tenn. 78 54 13 6 4 1 2Knoxville, Tenn. 56 42 10 1 3 - 4Lexington, Ky. 94 66 18 7 2 1 14Memphis, Tenn. 246 153 43 27 10 13 23Mobile, Ala. 76 51 14 5 4 1 10Montgomery, Ala. 55 36 11 6 1 1 1Nashville, Tenn. 115 76 24 9 2 4 5
W.S. CENTRAL 1,213 726 259 150 47 28 84Austin, Tex. 82 50 13 15 1 3 8Baton Rouge, La. 19 10 6 2 - 1 -Corpus Christi, Tex. 41 33 6 2 - - 3Dallas, Tex. 181 100 46 26 5 4 3El Paso, Tex. 76 49 15 6 4 2 10Ft. Worth, Tex. 92 62 11 7 8 4 7Houston, Tex. 377 208 98 50 15 6 40Little Rock, Ark. 80 52 15 8 3 2 6New Orleans, La. 122 73 19 18 6 3 -San Antonio, Tex. U U U U U U UShreveport, La. 35 24 7 3 1 - 3Tulsa, Okla. 108 65 23 13 4 3 4
MOUNTAIN 814 535 147 74 37 21 47Albuquerque, N.M. 100 70 18 8 1 3 7Colo. Springs, Colo. 43 29 9 3 - 2 2Denver, Colo. 95 52 26 7 8 2 5Las Vegas, Nev. 179 110 37 20 10 2 8Ogden, Utah 21 13 1 6 1 - 2Phoenix, Ariz. 141 106 9 11 9 6 10Pueblo, Colo. 21 16 4 1 - - 1Salt Lake City, Utah 95 55 22 11 4 3 7Tucson, Ariz. 119 84 21 7 4 3 5
PACIFIC 1,828 1,131 358 236 64 36 94Berkeley, Calif. 19 12 5 2 - - -Fresno, Calif. 72 41 9 15 5 2 5Glendale, Calif. 35 26 8 1 - - -Honolulu, Hawaii 49 31 10 5 2 1 6Long Beach, Calif. 71 39 19 10 1 2 3Los Angeles, Calif. 610 370 120 90 24 3 14Pasadena, Calif. 21 10 7 3 - 1 1Portland, Oreg. 144 102 19 18 4 1 2Sacramento, Calif. U U U U U U USan Diego, Calif. 169 105 27 25 7 5 24San Francisco, Calif. 147 79 32 26 3 7 11San Jose, Calif. 166 103 40 13 5 5 19Santa Cruz, Calif. 31 17 7 5 2 - -Seattle, Wash. 147 94 25 18 4 6 3Spokane, Wash. 49 34 9 4 1 1 4Tacoma, Wash. 98 68 21 1 6 2 2
TOTAL 11,487¶ 7,217 2,225 1,302 448 286 629
Reporting Area>65 45-64 25-44 1-24 <1
P&I†TotalAll
Ages
All Causes, By Age (Years)
Reporting AreaP&I†TotalAll
Ages
All Causes, By Age (Years)
>65 45-64 25-44 1-24 <1
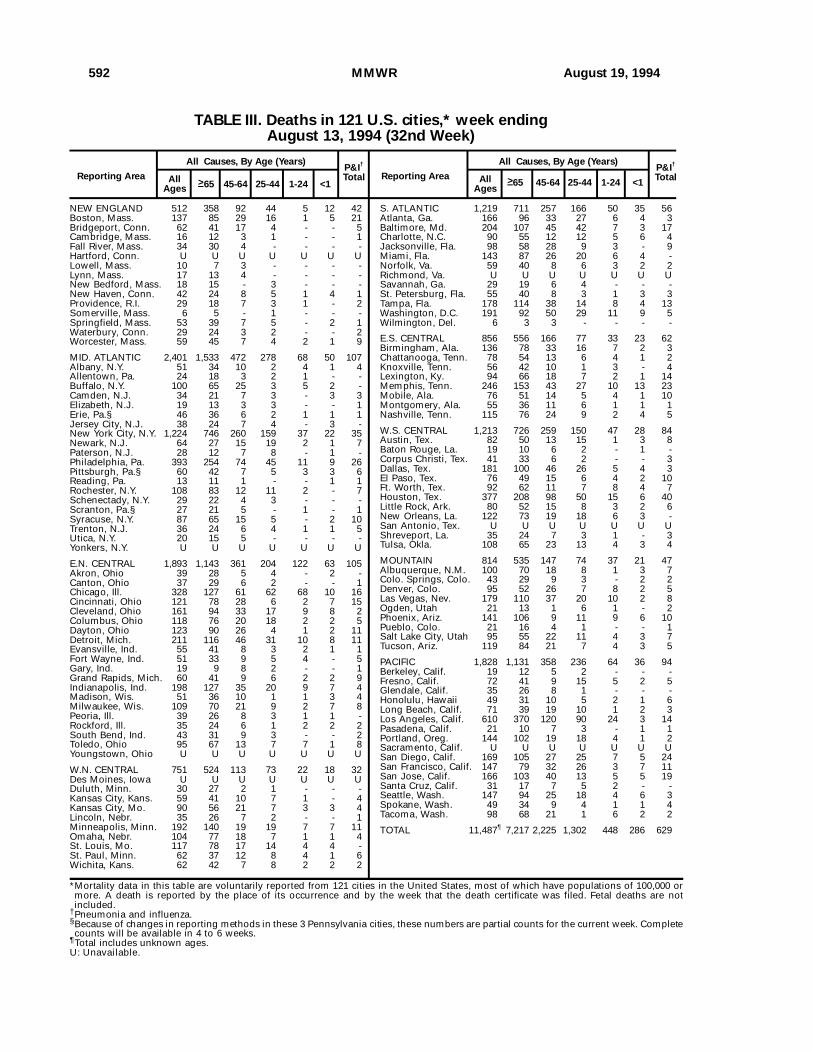
*Mortality data in this table are voluntarily reported from 121 cities in the United States, most of which have populations of 100,000 ormore. A death is reported by the place of its occurrence and by the week that the death certificate was filed. Fetal deaths are notincluded.
†Pneumonia and influenza.§Because of changes in reporting methods in these 3 Pennsylvania cities, these numbers are partial counts for the current week. Completecounts will be available in 4 to 6 weeks.
¶Total includes unknown ages.U: Unavailable.
TABLE III. Deaths in 121 U.S. cities,* week endingAugust 13, 1994 (32nd Week)
592 MMWR August 19, 1994
Motor-Vehicle-Related Injuries
Homicides
Falls
Machine-Related Injuries
Suicides
Other
0 20 40 60 80Deaths
Cau
seFIGURE 1. Number of occupational injury deaths among Postal Service employees,by external causes — United States, 1980–1989
Motor-Vehicle-RelatedInjuries
Homicides Falls Machine-RelatedInjuries
Suicides
0.0
0.2
0.4
0.6
0.8
1.0
1.2
1.4
Rat
e
All Industries
US Postal Service
Cause*Per 100,000 workers.
FIGURE 2. Rate* of occupational injury death among workers in all industries andamong Postal Service employees, by external causes — United States, 1983–1989
Vol. 43 / No. 32 MMWR 593
Occupational Injury Deaths — Continued

Editorial Note: The findings in this report indicate that the occupational fatality rate forU.S. Postal Service workers is approximately 2.5 times lower than that for all workerscombined. Motor-vehicle–related events and homicides combined accounted for66% of occupational injury deaths in the Postal Service. This analysis indicated an oc-cupational homicide rate among Postal Service workers that did not exceed the ratefor all U.S. workers.
Media attention to violence in Postal Service facilities resulted in press reports thatenumerated violent incidents over a defined period (1983 through 1993). By compar-ing a newspaper review of occupational violence in the Postal Service (5 ) with casesreported in NTOF, NIOSH identified five work-related homicides not included in theNTOF database. Incorporating these five cases into the calculation of a work-relatedhomicide rate for the Postal Service increased the rate to 0.63 per 100,000 workers,nearly equal to the average overall national rate (0.64) for the same period. However,it was not practical to similarly identify work-related homicides that were not includedin NTOF for other industries; such an enumeration of missed cases would probablyincrease the average annual all-industries rate.
Although the occupational homicide rate for the Postal Service industry is similarto the national rate for all industries, coworkers appear to be disproportionatelyresponsible for homicides that occur in the Postal Service. During 1992, 82% of work-related homicides were associated with robberies or miscellaneous crimes; only 4%were committed by coworkers or former coworkers (6 ). By comparison, the NTOFdata in this report, supplemented with information from the newspaper review (5 ),indicated that 57% (20/35) of work-related homicides of postal workers from 1983through 1989 were committed by coworkers or former coworkers. However, 14 of the20 coworker homicides occurred in a single incident. The remaining 15 postal workerhomicides were presumed to have been committed by persons who were not PostalService employees.
The findings in this report are subject to at least three limitations (3 ). First, becausethe NTOF surveillance system is based only on data from death certificates, occu-pational injury deaths are undercounted; on average, death certificate-based surveil-lance systems capture approximately 81% of occupational injury deaths (7 ). Second,previous studies have demonstrated 60%–76% agreement between industry and oc-cupation information listed on death certificates and actual employment status at thetime of death (3 ), which could be a source of misclassification. Third, death certifi-cates provide only limited data about the circumstances of traumatic fatalities.
Although postal workers do not appear to be at increased risk for occupationalhomicide, homicide was the third leading cause of occupational injury death in theUnited States from 1980 through 1989 (1,3 ). Developing strategies for the preventionof work-related homicide will require examination of the circumstances (e.g., locationand working conditions) in which violence has previously occurred. Factors that mayincrease the risk for homicide among mail carriers are working alone in a communitysetting, carrying currency and other valuables, and working in high-crime areas (1,2 ).Enhanced security measures and devices may be appropriate to reduce assaults oc-curring within Postal Service facilities. Determining the risk factors for coworkerviolence will require assessing individual incidents to determine whether there werepreceding indications of impending violence (e.g., threats) and evaluating work condi-tions and management practices that could reduce the risk for violence. As part of
594 MMWR August 19, 1994
Occupational Injury Deaths — Continued

such an effort, additional study is needed of behavioral factors that can lead to vio-lence between coworkers and improved surveillance of nonfatal occupational injuriesincurred through violence.
In addition to addressing occupational injury deaths resulting from violence, theNTOF data reported here highlight a need to continue to address the risk for motor-vehicle–related injuries. Postal Service employees drive approximately 1.5 billionmiles on the job each year (J. Jones, Office of Safety and Health, U.S. Postal Service,personal communication, 1994). Use of safety belts, maintaining mechanical integrityof the fleet (both Postal Service and personal vehicles used in the performance ofduties), and training should be evaluated to identify means by which the Postal Serv-ice can reduce the risk for motor-vehicle–related fatalities.
References1. NIOSH. NIOSH alert: request for assistance in preventing homicide in the workplace. Cincinnati:
US Department of Health and Human Service, Public Health Service, CDC, 1993; DHHS pub-lication no. (NIOSH)93-109.
2. Castillo DN, Jenkins EL. Industries and occupations at high risk for work-related homicide.J Occup Med 1994;36:125–32.
3. NIOSH. Fatal injuries to workers in the United States, 1980–1989: a decade of surveillance—national profile. Cincinnati: US Department of Health and Human Services, Public HealthService, CDC, 1993; DHHS publication no. (NIOSH)93-108.
4. US Department of Labor. Employment and earnings. Vols 31–37 (issue no. 1 for each year).Washington, DC: US Department of Labor, Bureau of Labor Statistics, 1984–1990.
5. Barringer F. Anger in the post office: killings raise questions. New York Times, 1993 May 7:1(col 3), 6(col 1).
6. Windau J, Toscano G. Workplace homicides in 1992. In: US Department of Labor, ed. Com-pensation and working conditions, 1994. Vol 46, issue 2. Washington, DC: US Department ofLabor, Bureau of Labor Statistics, 1994.
7. Stout NA, Bell C. Effectiveness of source documents for identifying fatal occupational injuries:a synthesis of studies. Am J Public Health 1991;81:725–8.Occupational Injury Deaths — Continued
Notice to Readers
Limited Supplies of Inactivated Poliovirus Vaccine —United States
Notices to Readers — ContinuedThere is a shortage of inactivated poliovirus vaccine (IPV) in the United States. TheFood and Drug Administration (FDA), the manufacturers (Pasteur Merieux Serums &Vaccines, S.A. [Lyon, France] [IPOL ]*, and Connaught Laboratories, Limited[Willowdale, Ontario, Canada] [POLIOVAX ]), and the distributor, Connaught Labora-tories, Inc. (Swiftwater, Pennsylvania), are working to resolve the shortage.
Until IPV becomes readily available, CDC recommends that its use be restricted to1) never-vaccinated persons aged >18 years who are at risk for exposure to wildpoliovirus (e.g., who will be traveling to areas in which poliomyelitis is endemic), and2) persons for whom oral polio vaccine (OPV) is contraindicated (i.e., persons diag-
*Use of trade names and commercial sources is for identification only and does not implyendorsement by the Public Health Service or the U.S. Department of Health and HumanServices.
Vol. 43 / No. 32 MMWR 595
Occupational Injury Deaths — Continued

nosed with or living in a household with a person with a congenital or acquired im-mune deficiency). Inadequately or fully vaccinated adults who have previouslyreceived IPV or OPV and need poliovirus vaccine can be given OPV (1,2 ). OPV contin-ues to be recommended routinely for all children, except as noted above.
If supplies are not available locally, poliovirus vaccination of persons for whomOPV is contraindicated should be delayed until IPV becomes available. Because nocase of polio resulting from indigenously transmitted wild poliovirus has been re-ported in the United States since 1979, postponing vaccination for these persons untilIPV is available is not likely to pose a risk to those persons. Unvaccinated adults whomay be exposed to wild poliovirus during travel to polio-endemic areas and cannotobtain IPV should consider vaccination with OPV but should be informed that the riskfor vaccine-associated paralytic polio is slightly higher in adults than in children (1,2 ).Otherwise, these persons should avoid activities or travel that might result in expo-sure to wild poliovirus.
Information about obtaining IPV for high-risk persons is available from the distribu-tor, Connaught Laboratories, Inc., telephone (800) 822-2463. MMWR will provideupdated information when the shortage is alleviated.Reported by: Center for Biologics Evaluation and Research, Food and Drug Administration.National Immunization Program, CDC.
References1. ACIP. Poliomyelitis prevention. MMWR 1982;31:22–6,31–4.2. ACIP. Poliomyelitis prevention: enhanced-potency inactivated poliomyelitis vaccine—supple-
mentary statement. MMWR 1987;36:795–8.
Notice to Readers
Quality Standards Compliance for Mammography Facilities
By October 1, 1994, all U.S. mammography facilities, except those managed by theDepartment of Veterans Affairs, must be certified by the Food and Drug Administra-tion (FDA) to legally continue to provide mammography services. The requirement isa result of the Mammography Quality Standards Act of 1992 (MQSA), which requiresnational, uniform quality standards for mammography facilities* and is intended toensure that all women have access to safe and effective mammography services forearly detection of breast cancer. The law requires that:
• To be certified, a facility must first be accredited by a federally approved privatenonprofit or state accrediting body. As of August 18, FDA had approved the Ameri-can College of Radiology (ACR) and the Bureau of Radiological Health, IowaDepartment of Public Health, as accrediting bodies.
• To be accredited, a facility must apply to an FDA-approved accrediting body;undergo periodic review of its clinical images; have an annual survey by a medicalphysicist; and meet quality standards for equipment, personnel qualifications,quality-assurance programs, and recordkeeping and reporting.
*Public Law 102-539
596 MMWR August 19, 1994
Notices to Readers — Continued

• To maintain its certification, the facility must be inspected annually by federal orstate personnel.
FDA was delegated the authority to implement MQSA in June 1993. On Decem-ber 21, 1993, FDA published interim standards in the Federal Register covering equip-ment, personnel, quality assurance, and recordkeeping and reporting (1 ). The interimstandards also set requirements that must be met by accrediting bodies. FDA is col-laborating with the National Mammography Quality Assurance Advisory Committeeto develop more comprehensive, final standards.
The accrediting bodies will provide FDA with the names and addresses of the facili-ties they have accredited. FDA will then issue certificates to all accredited facilities.FDA is also providing a series of training courses for federal and state inspectors, whomust pass three written and two practical proficiency examinations before conductinginspections. Facilities will be subject to MQSA inspections as of October 1.
The MQSA program combines the elements of the ACR’s voluntary MammographyAccreditation Program and the Medicare Screening Mammography Benefit programof the Health Care Financing Administration (HCFA). After October 1, HCFA will acceptFDA certification as the basis for Medicare reimbursement, and HCFA inspections willcease.
Additional information about the MQSA program and subscriptions for FDA’s quar-terly newsletter, Mammography Matters, is available by calling (301) 443-4190; fax(301) 594-3306.Reported by: Div of Mammography Quality and Radiation Programs, Office of Health andIndustry Programs, Center for Devices and Radiological Health, Food and Drug Administration.
Reference1. Food and Drug Administration. Mammography facilities: requirements for accrediting bodies
and quality standards and certification requirements—interim rules. Federal Register 1993;58:67558–72. (CFR 21, Part 900).Notices to Readers — Continued
Notice to Readers
Final 1993 Reports of Notifiable Diseases
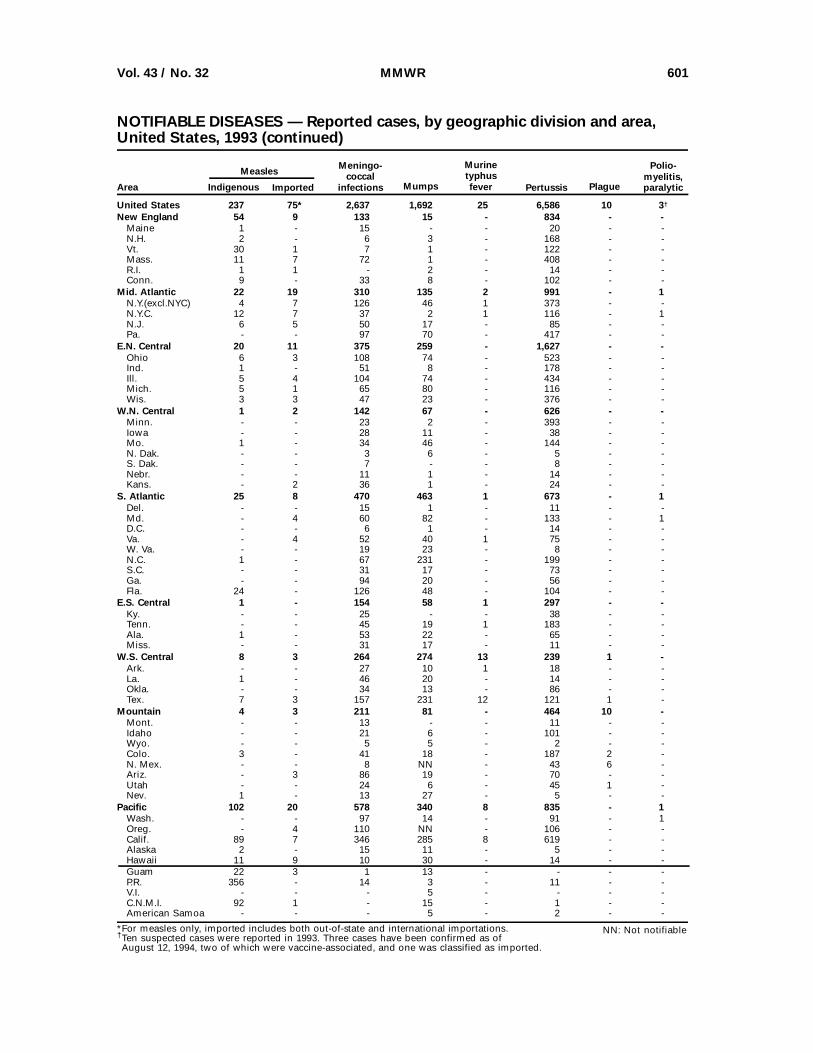
The notifiable diseases table on pages 598–603 summarizes final data for 1993.These data, final as of July 29, 1994, will be published in more detail in the MMWRSummary of Notifiable Diseases, 1993 (1 ).
Population estimates for the states are from the July 1, 1993, estimates by the U.S.Bureau of the Census, Population Division, Population Estimates Branch, Press Re-lease CB93-219. Population estimates for territories are from the 1990 Census, U.S.Bureau of the Census, Press Releases CB91-142, 242, 243, 263, and 276.
Reference1. CDC. Summary of notifiable diseases, United States, 1993. MMWR 1994;42(no. 53) (in press).
Vol. 43 / No. 32 MMWR 597
Notices to Readers — Continued
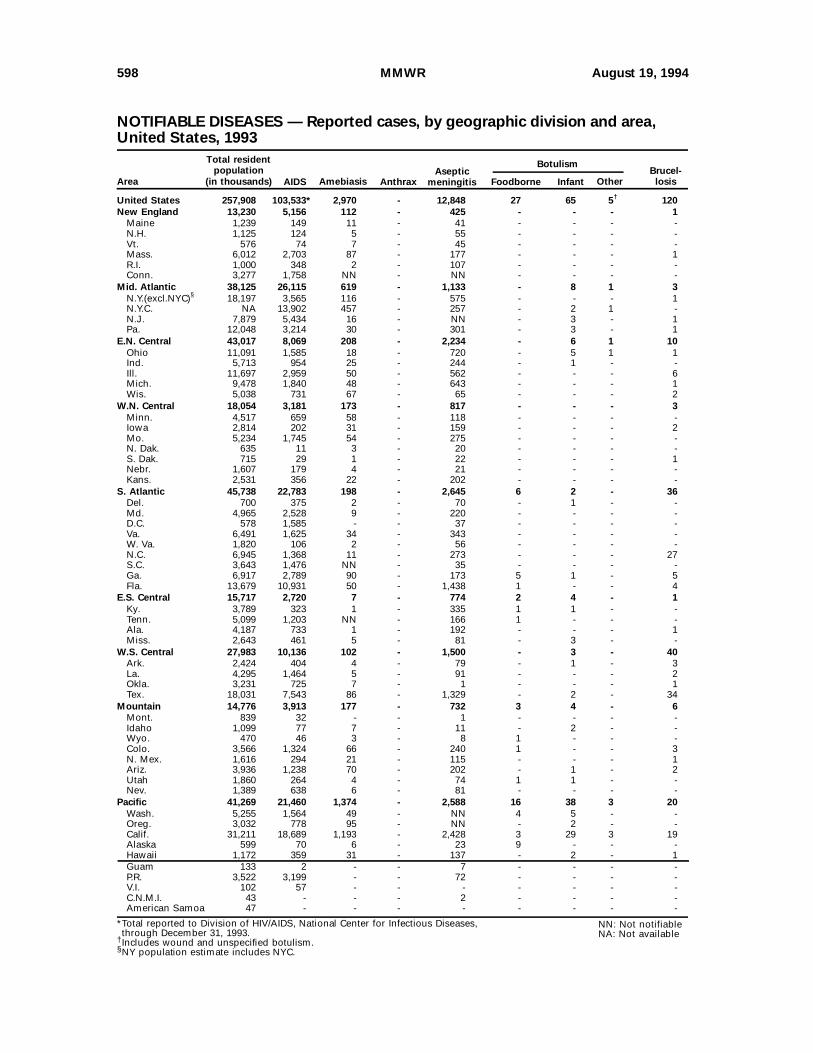
United States 257,908 103,533* 2,970 - 12,848 27 65 5† 120New England 13,230 5,156 112 - 425 - - - 1
Maine 1,239 149 11 - 41 - - - -N.H. 1,125 124 5 - 55 - - - -Vt. 576 74 7 - 45 - - - -Mass. 6,012 2,703 87 - 177 - - - 1R.I. 1,000 348 2 - 107 - - - -Conn. 3,277 1,758 NN - NN - - - -
Mid. Atlantic 38,125 26,115 619 - 1,133 - 8 1 3N.Y.(excl.NYC)§ 18,197 3,565 116 - 575 - - - 1N.Y.C. NA 13,902 457 - 257 - 2 1 -N.J. 7,879 5,434 16 - NN - 3 - 1Pa. 12,048 3,214 30 - 301 - 3 - 1
E.N. Central 43,017 8,069 208 - 2,234 - 6 1 10Ohio 11,091 1,585 18 - 720 - 5 1 1Ind. 5,713 954 25 - 244 - 1 - -Ill. 11,697 2,959 50 - 562 - - - 6Mich. 9,478 1,840 48 - 643 - - - 1Wis. 5,038 731 67 - 65 - - - 2
W.N. Central 18,054 3,181 173 - 817 - - - 3Minn. 4,517 659 58 - 118 - - - -Iowa 2,814 202 31 - 159 - - - 2Mo. 5,234 1,745 54 - 275 - - - -N. Dak. 635 11 3 - 20 - - - -S. Dak. 715 29 1 - 22 - - - 1Nebr. 1,607 179 4 - 21 - - - -Kans. 2,531 356 22 - 202 - - - -
S. Atlantic 45,738 22,783 198 - 2,645 6 2 - 36Del. 700 375 2 - 70 - 1 - -Md. 4,965 2,528 9 - 220 - - - -D.C. 578 1,585 - - 37 - - - -Va. 6,491 1,625 34 - 343 - - - -W. Va. 1,820 106 2 - 56 - - - -N.C. 6,945 1,368 11 - 273 - - - 27S.C. 3,643 1,476 NN - 35 - - - -Ga. 6,917 2,789 90 - 173 5 1 - 5Fla. 13,679 10,931 50 - 1,438 1 - - 4
E.S. Central 15,717 2,720 7 - 774 2 4 - 1Ky. 3,789 323 1 - 335 1 1 - -Tenn. 5,099 1,203 NN - 166 1 - - -Ala. 4,187 733 1 - 192 - - - 1Miss. 2,643 461 5 - 81 - 3 - -
W.S. Central 27,983 10,136 102 - 1,500 - 3 - 40Ark. 2,424 404 4 - 79 - 1 - 3La. 4,295 1,464 5 - 91 - - - 2Okla. 3,231 725 7 - 1 - - - 1Tex. 18,031 7,543 86 - 1,329 - 2 - 34
Mountain 14,776 3,913 177 - 732 3 4 - 6Mont. 839 32 - - 1 - - - -Idaho 1,099 77 7 - 11 - 2 - -Wyo. 470 46 3 - 8 1 - - -Colo. 3,566 1,324 66 - 240 1 - - 3N. Mex. 1,616 294 21 - 115 - - - 1Ariz. 3,936 1,238 70 - 202 - 1 - 2Utah 1,860 264 4 - 74 1 1 - -Nev. 1,389 638 6 - 81 - - - -
Pacific 41,269 21,460 1,374 - 2,588 16 38 3 20Wash. 5,255 1,564 49 - NN 4 5 - -Oreg. 3,032 778 95 - NN - 2 - -Calif. 31,211 18,689 1,193 - 2,428 3 29 3 19Alaska 599 70 6 - 23 9 - - -Hawaii 1,172 359 31 - 137 - 2 - 1Guam 133 2 - - 7 - - - -P.R. 3,522 3,199 - - 72 - - - -V.I. 102 57 - - - - - - -C.N.M.I. 43 - - - 2 - - - -American Samoa 47 - - - - - - - -
Area
Total residentpopulation
(in thousands) Amebiasis AnthraxAseptic
meningitis Foodborne Infant OtherBrucel-
losis
Botulism
AIDS
NN: Not notifiableNA: Not available
*Total reported to Division of HIV/AIDS, National Center for Infectious Diseases, through December 31, 1993.
†Includes wound and unspecified botulism.§NY population estimate includes NYC.
NOTIFIABLE DISEASES — Reported cases, by geographic division and area,United States, 1993
598 MMWR August 19, 1994

UNITED STATES 1,399* 18 - 919 170 439,673* 19* 1,419 187New England 5 2 - 26 8 8,391 - 59 7
Maine - - - 3 - 80 - 4 -N.H. 3 - - - 2 83 - 6 -Vt. - - - 6 - 25 - 3 -Mass. 2 - - 12 4 3,118 - 35 7R.I. - 1 - 5 2 427 - 2 -Conn. - 1 - - - 4,658 - 9 -
Mid. Atlantic 618 - - 63 11 54,796 - 135 18N.Y.(excl.NYC) 5 - - 45 6 10,887 - 43 1N.Y.C. 613 - - 3 - 19,240 - 34 14N.J. - - - - - 6,444 - 27 3Pa. - - - 15 5 18,225 - 31 -
E.N. Central 115 3 - 226 22 80,638 1 221 4Ohio 21 1 - 72 4 22,286 1 125 1Ind. 3 - - 20 5 8,656 - 12 -Ill. 91 2 - 62 3 28,412 - 57 2Mich. - - - 54 10 18,014 - 18 -Wis. - - - 18 - 3,270 - 9 1
W.N. Central 3 - - 56 17 22,415 1 180 1Minn. 1 - - 18 - 2,543 - 21 -Iowa - - - 7 2 1,915 1 8 -Mo. 1 - - 11 15 13,148 - 135 -N. Dak. - - - 5 - 54 - - -S. Dak. - - - 7 - 270 - 2 -Nebr. - - - 1 - 714 - 9 1Kans. 1 - - 7 - 3,771 - 5 -
S. Atlantic 86 2 - 231 78 124,475 13 244 13Del. 1 - - 3 - 1,586 - - -Md. - - - 25 - 13,548 - 52 1D.C. 1 - - - 1 6,162 - 1 -Va. 3 1 - 44 7 12,022 - 28 -W. Va. 1 - - 117 - 635 - 10 -N.C. 13 - - 31 - 24,187 1 23 1S.C. - - - - - 10,953 - 40 -Ga. 21 - - 2 - 31,483 12 71 -Fla. 46 1 - 9 70 23,899 - 19 11
E.S. Central 35 - - 37 7 45,173 - 56 2Ky. 4 - - 21 6 4,627 - 16 -Tenn. 8 - - 10 - 14,285 - 12 -Ala. 23 - - 3 - 15,793 - 18 2Miss. - - - 3 1 10,468 - 10 -
W.S. CENTRAL 517 2 - 80 2 55,795 1 109 33Ark. 170 - - 3 - 7,590 - 8 -La. 310 - - 10 - 13,323 1 4 -Okla. - - - 8 - 4,759 - 46 2Tex. 37 2 - 59 2 30,123 - 51 31
Mountain 8 3 - 21 5 11,549 1 125 6Mont. - - - - 1 81 - 5 -Idaho - - - - - 171 - 3 1Wyo. 1 - - - - 85 - 5 -Colo. - 1 - 14 - 3,803 - 24 -N. Mex. - - - 4 2 1,014 - 9 -Ariz. 3 - - - - 4,176 1 31 3Utah 4 2 - 1 1 350 - 12 1Nev. - - - 2 1 1,869 - 36 1
PACIFIC 12 6 - 179 20 36,441 2 290 103Wash. - - - 1 - 3,740 - 19 9Oreg. - - - - - 1,189 - 11 -Calif. 12 6 - 167 20 29,970 2 240 75Alaska - - - 10 - 678 - 6 1Hawaii - - - 1 - 864 - 14 18Guam - - - - - 83 - - 4P.R. 25 - - - - 527 1 3 -V.I. 5 - - - - 84 - - -C.N.M.I. - - - 1 - - - 24 2American Samoa - - - - - - - - -
Area Chancroid DiphtheriaPrimary
infectionsPost-
infectiousGonor-
rheaGranulomainguinale
Haemophilusinfluenzae
Hansendisease
(leprosy)
Encephalitis
Cholera
*Cases updated through Division of Sexually Transmitted Diseases and HIV Prevention, National Center for Prevention Services,as of February 28, 1994.
NOTIFIABLE DISEASES — Reported cases, by geographic division and area,United States, 1993 (continued)
Vol. 43 / No. 32 MMWR 599

United States 24,238 13,361 4,786 627 1,280 51 8,257 285* 1,411New England 448 356 106 13 66 - 1,815 8 97
Maine 14 11 2 - 6 - 18 - 7N.H. 18 27 8 - 2 - 15 1 4Vt. 9 10 6 - 3 - 12 - 3Mass. 213 214 77 13 32 - 148 7 46R.I. 77 19 13 - 23 - 272 - 7Conn. 117 75 - - NN - 1,350 - 30
Mid. Atlantic 1,665 1,574 398 7 253 3 4,689 184 325N.Y.(excl.NYC) 464 457 259 1 89 2 2,758 12 123N.Y.C. 722 353 3 - 3 - 60 172 126N.J. 295 407 98 - 33 1 786 - 51Pa. 184 357 38 6 128 - 1,085 - 25
E.N. Central 2,727 1,497 595 15 327 5 505 4 93Ohio 338 192 37 - 154 2 30 4 15Ind. 646 249 15 1 49 - 32 - 2Ill. 1,023 344 102 7 26 3 19 - 46Mich. 213 393 400 7 62 - 23 - 19Wis. 507 319 41 - 36 - 401 - 11
W.N. Central 2,372 802 79 27 95 8 319 2 45Minn. 497 96 14 4 3 - 141 - 21Iowa 60 36 9 4 19 3 8 - 5Mo. 1,443 585 25 19 33 3 108 1 9N. Dak. 80 1 3 - 2 - 2 - 1S. Dak. 18 - - - - - - 1 2Nebr. 195 19 11 - 30 2 6 - 4Kans. 79 65 17 - 8 - 54 - 3
S. Atlantic 1,329 2,408 723 95 219 2 639 60 338Del. 12 18 1 - 4 1 143 - 2Md. 159 265 42 3 56 - 180 2 48D.C. 11 43 3 - 15 - 2 8 11Va. 156 157 54 43 11 - 95 7 41W. Va. 29 44 43 - 4 - 50 - 2N.C. 94 315 80 - 27 1 86 16 145S.C. 18 51 5 1 19 - 9 - 7Ga. 145 670 451 1 36 - 44 22 20Fla. 705 845 44 47 47 - 30 5 62
E.S. Central 364 1,748 1,025 4 44 2 40 3 29Ky. 142 99 16 - 19 - 16 1 5Tenn. 104 1,152 994 3 17 1 20 1 12Ala. 58 107 5 1 2 1 4 1 7Miss. 60 390 10 - 6 - - - 5
W.S. Central 3,190 1,909 645 173 51 6 78 14 65Ark. 74 90 5 3 6 1 8 - 4La. 105 269 178 4 10 5 3 12 7Okla. 213 195 50 9 13 - 19 - 6Tex. 2,798 1,355 412 157 22 - 48 2 48
Mountain 4,164 686 366 79 81 - 20 1 40Mont. 77 28 3 - 7 - - - 2Idaho 298 89 - 3 1 - 2 - 1Wyo. 17 34 119 - 7 - 9 - -Colo. 877 81 62 44 9 - - - 25N. Mex. 400 215 107 3 6 - 2 - 5Ariz. 1,493 96 13 14 17 - - 1 1Utah 828 69 42 13 16 - 2 - 2Nev. 174 74 20 2 18 - 5 - 4
Pacific 7,979 2,381 849 214 144 25 152 9 379Wash. 926 247 219 11 12 - 9 4 41Oreg. 532 221 55 2 1 1 8† 1 14Calif. 5,677 1,876 560 198 121 - 134 4 314Alaska 775 15 12 - - - - - 3Hawaii 69 22 3 3 10 24 1 - 7Guam 3 6 - 11 - - - - 3P.R. 79 412 90 2 - 11 - 1 -V.I. 1 6 - - - - - - -C.N.M.I. - 2 - 1 - 1 - - 2American Samoa 20 1 - - - - - - -
Area Hepatitis A
Hepatitisnon-A,non-B
Hepatitisunsp.
Legionel-losis
Lepto-spirosis
Lymedisease
Lympho-granulomavenereum MalariaHepatitis B
NN: Not notifiable*Cases updated through Division of Sexually Transmitted Diseases and HIV Prevention, National Center for Prevention Services, as of February 28, 1994.
†Voluntarily reportable for this state.
NOTIFIABLE DISEASES — Reported cases, by geographic division and area,United States, 1993 (continued)
600 MMWR August 19, 1994
United States 237 75* 2,637 1,692 25 6,586 10 3New England 54 9 133 15 - 834 - -
Maine 1 - 15 - - 20 - -N.H. 2 - 6 3 - 168 - -Vt. 30 1 7 1 - 122 - -Mass. 11 7 72 1 - 408 - -R.I. 1 1 - 2 - 14 - -Conn. 9 - 33 8 - 102 - -
Mid. Atlantic 22 19 310 135 2 991 - 1N.Y.(excl.NYC) 4 7 126 46 1 373 - -N.Y.C. 12 7 37 2 1 116 - 1N.J. 6 5 50 17 - 85 - -Pa. - - 97 70 - 417 - -
E.N. Central 20 11 375 259 - 1,627 - -Ohio 6 3 108 74 - 523 - -Ind. 1 - 51 8 - 178 - -Ill. 5 4 104 74 - 434 - -Mich. 5 1 65 80 - 116 - -Wis. 3 3 47 23 - 376 - -
W.N. Central 1 2 142 67 - 626 - -Minn. - - 23 2 - 393 - -Iowa - - 28 11 - 38 - -Mo. 1 - 34 46 - 144 - -N. Dak. - - 3 6 - 5 - -S. Dak. - - 7 - - 8 - -Nebr. - - 11 1 - 14 - -Kans. - 2 36 1 - 24 - -
S. Atlantic 25 8 470 463 1 673 - 1Del. - - 15 1 - 11 - -Md. - 4 60 82 - 133 - 1D.C. - - 6 1 - 14 - -Va. - 4 52 40 1 75 - -W. Va. - - 19 23 - 8 - -N.C. 1 - 67 231 - 199 - -S.C. - - 31 17 - 73 - -Ga. - - 94 20 - 56 - -Fla. 24 - 126 48 - 104 - -
E.S. Central 1 - 154 58 1 297 - -Ky. - - 25 - - 38 - -Tenn. - - 45 19 1 183 - -Ala. 1 - 53 22 - 65 - -Miss. - - 31 17 - 11 - -
W.S. Central 8 3 264 274 13 239 1 -Ark. - - 27 10 1 18 - -La. 1 - 46 20 - 14 - -Okla. - - 34 13 - 86 - -Tex. 7 3 157 231 12 121 1 -
Mountain 4 3 211 81 - 464 10 -Mont. - - 13 - - 11 - -Idaho - - 21 6 - 101 - -Wyo. - - 5 5 - 2 - -Colo. 3 - 41 18 - 187 2 -N. Mex. - - 8 NN - 43 6 -Ariz. - 3 86 19 - 70 - -Utah - - 24 6 - 45 1 -Nev. 1 - 13 27 - 5 - -
Pacific 102 20 578 340 8 835 - 1Wash. - - 97 14 - 91 - 1Oreg. - 4 110 NN - 106 - -Calif. 89 7 346 285 8 619 - -Alaska 2 - 15 11 - 5 - -Hawaii 11 9 10 30 - 14 - -Guam 22 3 1 13 - - - -P.R. 356 - 14 3 - 11 - -V.I. - - - 5 - - - -C.N.M.I. 92 1 - 15 - 1 - -American Samoa - - - 5 - 2 - -
Area Indigenous
Meningo-coccal
infections Mumps
Murinetyphusfever Pertussis Plague
Polio-myelitis,paralyticImported
Measles
†
NN: Not notifiable*For measles only, imported includes both out-of-state and international importations.†Ten suspected cases were reported in 1993. Three cases have been confirmed as of August 12, 1994, two of which were vaccine-associated, and one was classified as imported.
NOTIFIABLE DISEASES — Reported cases, by geographic division and area,United States, 1993 (continued)
Vol. 43 / No. 32 MMWR 601

United States 60 9,377 3 112 456 192 5 41,641 32,198New England 2 1,695 - 2 4 10 - 3,882 605
Maine - - - 1 - 1 - 158 8N.H. - 148 - NN - - - 220 17Vt. 1 45 - - - - - 421 8Mass. 1 720 - - 4 9 - 2,041 285R.I. - 2 - - - - - 231 42Conn. - 780 - 1 - - - 811 245
Mid. Atlantic 16 3,585 1 - 28 59 2 7,005 2,218N.Y.(excl.NYC) 5 2,692 1 NN 7 17 1 2,390 790N.Y.C. - 53 - NN 1 22 - 1,601 554N.J. 2 458 - - 10 15 - 1,215 347Pa. 9 382 - NN 10 5 1 1,799 527
E.N. Central 8 110 - 33 18 8 - 5,810 5,111Ohio 4 6 - 5 8 1 - 1,214 1,411Ind. - 12 - - 4 3 - 543 811Ill. 1 23 - 2 4 1 - 2,232 1,722Mich. 1 18 - 21 2 2 - 815 829Wis. 2 51 - 5 - 1 - 1,006 338
W.N. Central 3 351 - 26 34 1 - 1,924 1,509Minn. - 45 - 7 1 - - 551 240Iowa 2 79 - 2 7 - - 241 69Mo. 1 35 - - 20 1 - 529 674N. Dak. - 57 - NN - - - 60 7S. Dak. - 49 - 14 3 - - 99 111Nebr. - 7 - NN 2 - - 145 200Kans. - 79 - 3 1 - - 299 208
S. Atlantic 8 2,165 - - 215 7 - 8,502 7,049Del. - 135 - NN - - - 185 178Md. 2 605 - NN 14 3 - 936 384D.C. - 18 - NN - - - 102 87Va. 1 387 - NN 14 - - 1,055 776W. Va. - 90 - - 6 - - 109 38N.C. 4 107 - NN 129 - - 1,121 2,305S.C. 1 165 - NN 11 - - 738 414Ga. - 471 - NN 37 - - 1,316 474Fla. - 187 - NN 4 4 - 2,940 2,393
E.S. Central 1 260 - - 63 1 - 1,879 1,849Ky. - 20 - NN 16 1 - 302 171Tenn. 1 124 - NN 32 - - 558 938Ala. - 116 - NN 4 - - 554 375Miss. - - - - 11 - - 465 365
W.S. Central 2 635 1 - 77 24 - 3,297 5,748Ark. - 42 - - 17 - - 402 201La. - 17 - NN 2 1 - 650 482Okla. 1 65 - NN 51 1 - 321 484Tex. 1 511 1 NN 7 22 - 1,924 4,581
Mountain 3 178 - 28 16 12 - 2,018 1,921Mont. - 24 - NN 2 - - 106 56Idaho 1 8 - NN - 2 - 173 46Wyo. - 25 - 1 10 - - 59 22Colo. - 29 - 5 4 3 - 550 611N. Mex. 1 9 - 3 - - - 326 411Ariz. - 60 - NN - 2 - 519 693Utah 1 8 - 19 - 4 - 154 42Nev. - 15 - NN - 1 - 131 40
Pacific 17 398 1 23 1 70 3 7,324 6,188Wash. 4 - - - - - - 832 797Oreg. 4 7 - NN 1 - - 349 169Calif. 9 363 1 20 - 41 3 5,739 5,093Alaska - 28 - 3 - 1 - 59 30Hawaii - - - NN - 28 - 345 99Guam - - - 2 - - - 119 35P.R. - 43 - - - - - 734 46V.I. - - - - - - - 5 1C.N.M.I. - - - 10 - - - 54 73American Samoa - - - 1 - - - 55 17
AreaPsitta-cosis Human
Rheumaticfever,acute RMSF* Rubella
Cong.syndrome
Salmonel-losis
Shigel-losisAnimal
RubellaRabies
NN: Not notifiable*Rocky Mountain spotted fever.
NOTIFIABLE DISEASES — Reported cases, by geographic division and area,United States, 1993 (continued)
602 MMWR August 19, 1994

United States 26,498* 3,211* 101,259* 48 212 16 25,313 132 440 134,722New England 330 17 1,713 2 13 - 649 - 31 12,655
Maine 7 - 19 - 3 - 27 - - 1,733N.H. 26 - 50 - 3 - 26 - 2 1,635Vt. 1 - 1 - 1 - 7 - - NNMass. 122 6 935 2 5 - 370 - 23 6,619R.I. 16 1 146 - 1 - 64 - - 2,668Conn. 158 10 562 - - - 155 - 6 NN
Mid. Atlantic 2,415 1,070 19,306 2 33 4 5,611 2 139 4,773N.Y.(excl.NYC) 258 94 1,980 - 17 4 718 2 20 NAN.Y.C. 1,132 654 10,513 - 1 - 3,235 - 95 4,773N.J. 328 161 2,556 - - - 912 - 18 NNPa. 697 161 4,257 2 15 - 746 - 6 NN
E.N. Central 4,070 527 11,789 7 48 2 2,385 5 40 64,380Ohio 1,180 70 2,889 2 12 - 315 - 7 5,472Ind. 362 1 1,019 1 1 - 248 1 2 NNIll. 1,489 368 4,881 1 11 2 1,242 3 23 26,447Mich. 543 84 1,952 3 24 - 480 1 7 32,461Wis. 496 4 1,048 - - - 100 - 1 NA
W.N. Central 1,631 111 3,271 10 15 - 582 39 2 16,814Minn. 66 9 261 6 3 - 141 - - NNIowa 64 1 175 1 7 - 59 - - 5,057Mo. 1,354 97 2,500 1 2 - 257 17 2 9,609N. Dak. 1 - 4 - - - 7 - - 37S. Dak. 2 - 3 - - - 16 17 - 420Nebr. 14 1 35 - - - 22 2 - 4Kans. 130 3 293 2 3 - 80 3 - 1,687
S. Atlantic 6,513 586 24,237 8 24 6 4,626 4 63 8,332Del. 94 3 274 - - - 66 - 1 3Md. 359 30 1,865 2 1 3 406 - 8 NND.C. 291 74 1,652 - - - 161 - - 4Va. 660 23 1,970 - 7 1 458 - 7 2,917W. Va. 8 6 195 - - - 75 - - 5,288N.C. 1,937 54 4,448 - 4 - 594 2 3 NNS.C. 921 82 2,339 1 - - 401 - - 120Ga. 1,052 79 4,077 - 2 - 810 - 3 NNFla. 1,191 235 7,417 5 10 2 1,655 2 41 NN
E.S. Central 4,117 158 10,494 3 11 - 1,727 4 7 3,981Ky. 331 9 651 - 3 - 405 1 2 1,429Tenn. 1,156 52 3,241 2 4 - 556 2 2 2,552Ala. 869 27 2,333 1 2 - 487 1 3 NNMiss. 1,761 70 4,269 - 2 - 279 - - NN
W.S. Central 5,969 409 19,079 9 2 - 3,181 58 19 14,292Ark. 559 8 1,600 1 - - 209 36 2 NNLa. 2,598 144 6,854 - - - 367 — 1 NNOkla. 282 11 721 1 2 - 209 17 1 -Tex. 2,530 246 9,904 7 - - 2,396 5 15 14,291
Mountain 256 27 1,251 1 16 1 592 12 11 7,192Mont. 1 - 4 - - - 22 5 - 84Idaho 2 - 15 - 2 - 12 - - NNWyo. 4 - 9 - - 1 7 3 - NNColo. 90 8 287 1 2 - 102 1 5 NNN. Mex. 34 - 172 - 1 - 74 - 2 NNAriz. 95 16 557 - 2 - 231 - 3 6,811Utah 10 - 68 - 7 - 46 2 1 297Nev. 20 3 139 - 2 - 98 1 - NN
Pacific 1,197 306 10,119 6 50 3 5,960 8 128 2,303Wash. 67 4 360 1 7 - 286 2 8 NNOreg. 39 4 179 - - - 154 3 4 NNCalif. 1,073 298 9,488 5 42 1 5,212 3 113 NNAlaska 11 - 51 - - - 57 - - NNHawaii 7 - 41 - 1 2 251 - 3 2,303Guam - - 5 - - - NA - 4 553P.R. 470 18 2,482 2 - - 253 - - 8,228V.I. 12 1 39 1 - - 4 - - 486C.N.M.I. - - - - - - NA - - 178American Samoa - - - - - - NA - 1 176
AreaPrimary &secondary
Allstages Tetanus
Toxic-shock
syndromeTrich-inosis
Tuber-culosis Tularemia
Varicella(chicken-
pox)Cong.
(<1 yr.)Typhoid
fever
Syphilis
NN: Not notifiableNA: Not available
*Cases updated through Division of Sexually Transmitted Diseases and HIV Prevention, National Center for Prevention Services, as of February 28, 1994.
NOTIFIABLE DISEASES — Reported cases, by geographic division and area,United States, 1993 (continued)
Vol. 43 / No. 32 MMWR 603

The Morbidity and Mortality Weekly Report (MMWR) Series is prepared by the Centers for Disease Controland Prevention (CDC) and is available on a paid subscription basis from the Superintendent of Documents,U.S. Government Printing Office, Washington, DC 20402; telephone (202) 783-3238.
The data in the weekly MMWR are provisional, based on weekly reports to CDC by state healthdepartments. The reporting week concludes at close of business on Friday; compiled data on a national basisare officially released to the public on the succeeding Friday. Inquiries about the MMWR Series, includingmaterial to be considered for publication, should be directed to: Editor, MMWR Series, Mailstop C-08, Centersfor Disease Control and Prevention, Atlanta, GA 30333; telephone (404) 332-4555.
All material in the MMWR Series is in the public domain and may be used and reprinted without specialpermission; citation as to source, however, is appreciated.
Director, Centers for Disease Control and PreventionDavid Satcher, M.D., Ph.D.
Deputy Director, Centers for Disease Controland PreventionClaire V. Broome, M.D.
Director, Epidemiology Program OfficeStephen B. Thacker, M.D., M.Sc.
Editor, MMWR SeriesRichard A. Goodman, M.D., M.P.H.
Acting Editor, MMWR (weekly)Arthur P. Liang, M.D., M.P.H.
Managing Editor, MMWR (weekly)Karen L. Foster, M.A.
Writers-Editors, MMWR (weekly)David C. JohnsonPatricia A. McGeeDarlene D. Rumph-PersonCaran R. Wilbanks
✩U.S. Government Printing Office: 1994-533-178/05023 Region IV
604 MMWR August 19, 1994
Related Documents