Changes in texture, cellular structure and cell wall composition in apple tissue as a result of freezing Sophie Chassagne-Berces a , Cécile Poirier b , Marie-Françoise Devaux b , Fernanda Fonseca a, * , Marc Lahaye b , Giuseppe Pigorini c , Christel Girault c , Michèle Marin a , Fabienne Guillon b a UMR 782 Génie et Microbiologie des Procédés Alimentaires, INRA, AgroParisTech, F-78850 Thiverval-Grignon, France b INRA-UR1268 Biopolymères Interactions Assemblages, F-44300 Nantes, Cedex 03, France c AIR LIQUIDE, Centre de Recherche Claude Delorme, 78354 Les Loges-en-Josas, France article info Article history: Received 26 September 2008 Accepted 3 March 2009 Keywords: Fruit Freezing rates Physical parameters Macrovision CLSM Cryo-SEM Structure Cell wall Image texture analysis Granulometry abstract Apple texture is one of the critical quality features for the consumer. Texture depends on several factors that are difficult to control and which change with freezing. To better understand the mechanisms involved in the texture degradation of apple tissues following freezing/thawing, our approach was to combine mechanical properties, cellular structure and cell wall composition measurements on fresh and thawed apples (Granny Smith) after three different freezing protocols (at À20 °C, À80 °C and À196 °C). This work highlighted the interest of applying macrovision and image texture analysis to quan- tify the freezing effects on cellular structure and ice crystal size. Freezing at À20 °C and after immersion into liquid nitrogen were the protocols affecting the most fruit texture leading to cell membrane break- age resulting in cell wall collapse and tissue breakage, respectively, which accounted for the mechanical behaviour of the samples. All freezing protocols induced vacuole burst showing that the turgor pressure preservation remains critical during the freezing process. Ó 2009 Elsevier Ltd. All rights reserved. 1. Introduction Freezing is used extensively to preserve food (fruit, vegetables, and meat). However, especially in the case of fruit, this preserva- tion technique may result in textural changes leading to food soft- ening (Brown, 1977). The quality of frozen/thawed fruit depends on a large number of factors including the type of fruit, the variety, raw quality and ripeness or time lapse between harvesting and processing (Marani, Agnelli, & Mascheroni, 2007; Phan & Mimault, 1980). Once the raw material and the harvesting conditions have been defined, the optimal freezing protocol for texture preserva- tion has to be determined. In general, it is accepted that fast freez- ing better preserves local structure. It induces the production of a large number of small ice crystals that cause less migration of water and less breakage of cell walls, and consequently less texture deterioration (Brown, 1977; Delgado & Rubiolo, 2005; Marti & Aguilera, 1991). However, the kinetics of too fast a freezing can provoke breakage at the product level due to ice density differ- ences with water which lead to texture modification. To improve stabilisation by freezing, a better understanding of the complex physical and chemical mechanisms taking place inside the fruit tis- sue during freezing/thawing is still needed. Texture of fruit is determined by different physical characteris- tics that arise from the structural organization at different levels: from molecular to tissue level. The cell is the elementary unit within the tissue and its integrity strongly impacts textural qual- ity. Among the many factors involved in fruit texture, the struc- tural integrity of the cell components (cell wall and middle lamella) and cell turgor pressure determined by water content in the vacuoles are the most important (Waldron, Smith, Parr, Ng, & Parker, 1997). Several instrumental techniques are required to investigate the changes of fruit textural properties after freezing/ thawing from different points of view: mechanical, microscopic and biochemical. Mechanical measurements, such as the Kramer–Shear test (Mastrocola, Pittia, & Lerici, 1996; Phan & Mimault, 1980), com- pression tests (Chiralt et al., 2001; Kim & Hung, 1994), puncture tests (Marani et al., 2007; Phan & Mimault, 1980; Zhang, Duan, Zhang, & Peng, 2004) or back extrusion (Robbers, Singh, & Cunha, 1997) are widely used to evaluate the firmness at the organ scale. Such testing makes it possible to measure the mechanical proper- ties of fruit tissue before and after freezing. 0963-9969/$ - see front matter Ó 2009 Elsevier Ltd. All rights reserved. doi:10.1016/j.foodres.2009.03.001 * Corresponding author. Tel.: +33 1 30 81 59 40; fax: +33 1 30 81 55 97. E-mail address: [email protected] (F. Fonseca). Food Research International 42 (2009) 788–797 Contents lists available at ScienceDirect Food Research International journal homepage: www.elsevier.com/locate/foodres

Welcome message from author
This document is posted to help you gain knowledge. Please leave a comment to let me know what you think about it! Share it to your friends and learn new things together.
Transcript
Food Research International 42 (2009) 788–797
Contents lists available at ScienceDirect
Food Research International
journal homepage: www.elsevier .com/ locate / foodres
Changes in texture, cellular structure and cell wall compositionin apple tissue as a result of freezing
Sophie Chassagne-Berces a, Cécile Poirier b, Marie-Françoise Devaux b, Fernanda Fonseca a,*,Marc Lahaye b, Giuseppe Pigorini c, Christel Girault c, Michèle Marin a, Fabienne Guillon b
a UMR 782 Génie et Microbiologie des Procédés Alimentaires, INRA, AgroParisTech, F-78850 Thiverval-Grignon, Franceb INRA-UR1268 Biopolymères Interactions Assemblages, F-44300 Nantes, Cedex 03, Francec AIR LIQUIDE, Centre de Recherche Claude Delorme, 78354 Les Loges-en-Josas, France
a r t i c l e i n f o a b s t r a c t
Article history:Received 26 September 2008Accepted 3 March 2009
Keywords:FruitFreezing ratesPhysical parametersMacrovisionCLSMCryo-SEMStructureCell wallImage texture analysisGranulometry
0963-9969/$ - see front matter � 2009 Elsevier Ltd. Adoi:10.1016/j.foodres.2009.03.001
* Corresponding author. Tel.: +33 1 30 81 59 40; faE-mail address: [email protected] (F. Fonsec
Apple texture is one of the critical quality features for the consumer. Texture depends on several factorsthat are difficult to control and which change with freezing. To better understand the mechanismsinvolved in the texture degradation of apple tissues following freezing/thawing, our approach was tocombine mechanical properties, cellular structure and cell wall composition measurements on freshand thawed apples (Granny Smith) after three different freezing protocols (at �20 �C, �80 �C and�196 �C). This work highlighted the interest of applying macrovision and image texture analysis to quan-tify the freezing effects on cellular structure and ice crystal size. Freezing at �20 �C and after immersioninto liquid nitrogen were the protocols affecting the most fruit texture leading to cell membrane break-age resulting in cell wall collapse and tissue breakage, respectively, which accounted for the mechanicalbehaviour of the samples. All freezing protocols induced vacuole burst showing that the turgor pressurepreservation remains critical during the freezing process.
� 2009 Elsevier Ltd. All rights reserved.
1. Introduction
Freezing is used extensively to preserve food (fruit, vegetables,and meat). However, especially in the case of fruit, this preserva-tion technique may result in textural changes leading to food soft-ening (Brown, 1977). The quality of frozen/thawed fruit dependson a large number of factors including the type of fruit, the variety,raw quality and ripeness or time lapse between harvesting andprocessing (Marani, Agnelli, & Mascheroni, 2007; Phan & Mimault,1980). Once the raw material and the harvesting conditions havebeen defined, the optimal freezing protocol for texture preserva-tion has to be determined. In general, it is accepted that fast freez-ing better preserves local structure. It induces the production of alarge number of small ice crystals that cause less migration ofwater and less breakage of cell walls, and consequently less texturedeterioration (Brown, 1977; Delgado & Rubiolo, 2005; Marti &Aguilera, 1991). However, the kinetics of too fast a freezing canprovoke breakage at the product level due to ice density differ-ences with water which lead to texture modification. To improvestabilisation by freezing, a better understanding of the complex
ll rights reserved.
x: +33 1 30 81 55 97.a).
physical and chemical mechanisms taking place inside the fruit tis-sue during freezing/thawing is still needed.
Texture of fruit is determined by different physical characteris-tics that arise from the structural organization at different levels:from molecular to tissue level. The cell is the elementary unitwithin the tissue and its integrity strongly impacts textural qual-ity. Among the many factors involved in fruit texture, the struc-tural integrity of the cell components (cell wall and middlelamella) and cell turgor pressure determined by water content inthe vacuoles are the most important (Waldron, Smith, Parr, Ng,& Parker, 1997). Several instrumental techniques are required toinvestigate the changes of fruit textural properties after freezing/thawing from different points of view: mechanical, microscopicand biochemical.
Mechanical measurements, such as the Kramer–Shear test(Mastrocola, Pittia, & Lerici, 1996; Phan & Mimault, 1980), com-pression tests (Chiralt et al., 2001; Kim & Hung, 1994), puncturetests (Marani et al., 2007; Phan & Mimault, 1980; Zhang, Duan,Zhang, & Peng, 2004) or back extrusion (Robbers, Singh, & Cunha,1997) are widely used to evaluate the firmness at the organ scale.Such testing makes it possible to measure the mechanical proper-ties of fruit tissue before and after freezing.
0
0.5
1
1.5
2
2.5
3
3.5
0 2 4 6 8 10
Distance (mm)
Forc
e (N
)
(F)
(8)
(2)
(LN2)
zone where flesh rupture mean force is calculated
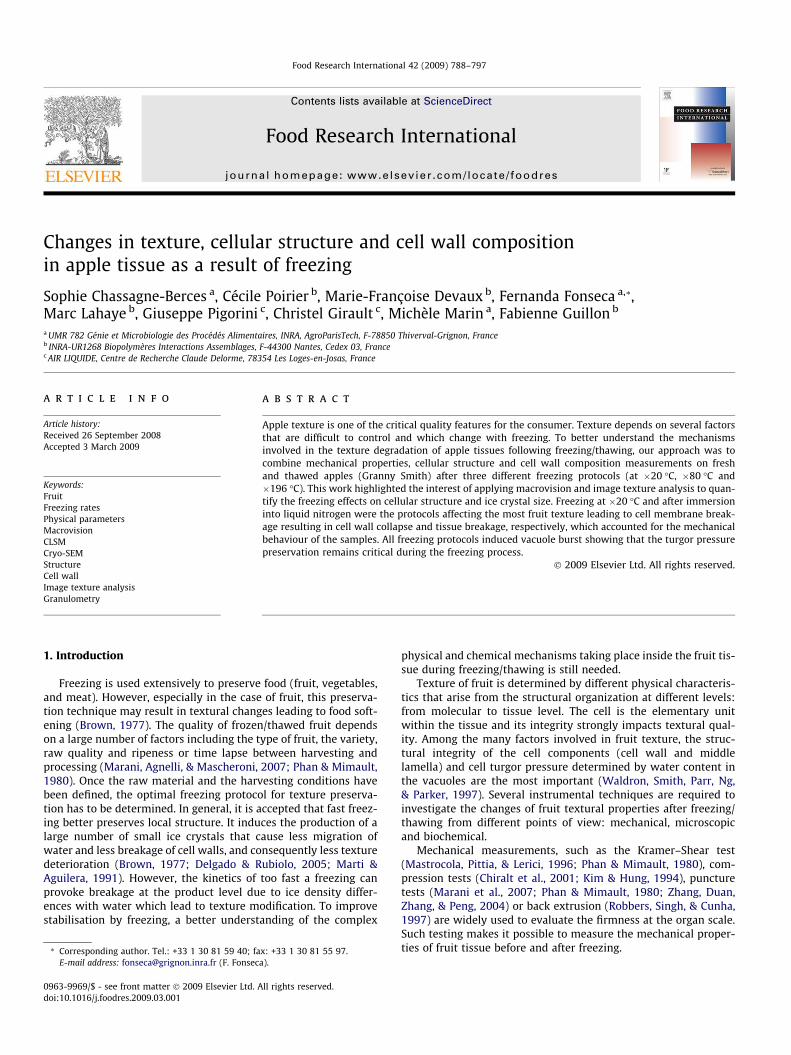
Fig. 1. Force–distance curves obtained during puncture test for fresh apples (F) andthawed apples after freezing: at �20 �C (2), at �80 �C (8) and immersion in liquidnitrogen (LN2).
S. Chassagne-Berces et al. / Food Research International 42 (2009) 788–797 789
Microscopy is a useful tool to visualize food structure at thetissular and cellular scales and to study the influence of freezing.Structural modifications associated with freezing/thawing havebeen studied in several plant tissues through light microscopy(Buggenhout et al., 2006a; Khan & Vincent, 1996; Otero, Martino,Zaritzky, Solas, & Sanz, 2000; Sterling, 1968) and scanning electronmicroscopy (SEM) without (Delgado & Rubiolo, 2005; Sousa, Canet,Alvarez, & Tortosa, 2006) or with cryo-system (Cryo-SEM) (Alonso,Tortosa, Canet, & Rodriguez, 2005; Bomben, King, & Hayes, 1983;Martinez-Monzo, Martinez-Navarrete, Chiralt, & Fito, 1998; Treg-unno & Goff, 1996). The impact of freezing on the microstructureof apples (Bomben et al., 1983), carrots (Buggenhout et al.,2006a), peaches (Otero et al., 2000), raspberries and blackberries(Sousa et al., 2006), blueberries and wild blackberries (Marti &Aguilera, 1991) and strawberries (Delgado & Rubiolo, 2005) have al-ready been studied. The main drawback of microscopic techniquesis sample preparation that is time consuming and the reduced fieldof view observed in a single image. Confocal laser-scanning micros-copy (CLSM) enables non destructive optical sectioning of samplesand make sample preparation easier and more rapid (Gray, Kolesik,Hoj, & Coombe, 1999; Kalab, Allan-Wojtas, & Miller, 1995). Theobservation of a representative number of cells requires theacquisition of a large number of images or several adjacent imagesand the reconstruction of the whole region as a mosaic image(Guillemin, Devaux, & Guillon, 2004). An alternative technique tomicroscopy is to use stereomicroscope or macrovision systemsmaking it possible to observe a field of view of about 1 cm2. Planttissue and cellular structures of tomato fruit can be characterisedin this way (Devaux, Bouchet, Legland, Guillon, & Lahaye, 2008).
The characterisation of samples by imaging techniques is com-pleted by applying image analysis to quantify the structure ob-served. Cell size and shape can be measured from microscopicimages after a segmentation of each individual cell. For macro-scopic images, techniques based on image texture analysis can beenvisioned to quantify information on object size. Image texturerefers to local variation of grey levels and several methods havebeen proposed to quantify these variations. Grey level granulome-try from mathematical morphology (Serra, 1982) has been success-fully applied to extract quantitative information related to cell sizein tomato tissues (Devaux et al., 2008).
Biochemical changes of the cell wall (Waldron et al., 1997) arealso related to texture changes. Fruit cell walls are composed ofcellulose and hemicellulose embedded in a matrix of pectins(Kunzek, Kabbert, & Gloyna, 1999; Muhlethaler, 1967). During fruitripening or storage, softening occurs as a result of enzymatic deg-radation of cell walls (Johnston, Hewett, & Hertog, 2002). Fewauthors (Alonso et al., 2005; Buggenhout et al., 2006b) have stud-ied biochemical changes following fruit freezing.
In this work, two hypotheses of fruit tissue degradation duringfreezing were kept. Freezing process influences ice crystal forma-tion resulting in (1) vacuole rupture causing loss of turgor pressureand (2) structural damage of cells and cell walls, and, hence, themodification of tissue architecture. The aim of this work is to inves-tigate the changes of textural properties during freezing/thawingat different levels of observation to better understand the mecha-nisms involved in the softening of apple tissue following freezingand thawing and to quantify the changes. Texture was measuredby mechanical techniques at the organ scale. The cellular structurewas investigated at the tissue scale using macrovision. The vacuo-lar integrity was observed at the cell scale using confocal micros-copy. Ice crystals were analysed by cryo-scanning electronmicroscopy. The global composition of the cell wall was studiedusing biochemical techniques. Three freezing protocols were ap-plied to study the different hypotheses of degradation. The applewas taken as a model of fruit due to its macroscopic fleshhomogeneity.
2. Materials and methods
2.1. Samples
The apple variety Granny Smith was selected due to its avail-ability and its good stability during storage conditions. The varietyexhibits a lower texture degradation than other apple varieties(personal communication). Fruits were purchased from an agricul-tural cooperative (Dorléane, Saint Hilaire Saint Mesmin – Loiret,France), where they were stored at 1 �C under a modified atmo-sphere. Apples were studied at commercial maturity. In the lab,they were stored in a cold chamber at 4 �C, for a maximum dura-tion of one month, until the moment of the experiment.
2.1.1. Sample preparationThe apples were placed overnight at ambient temperature
(21 ± 1 �C) before sampling. A 2 cm thick transverse cross sectionwas cut at the equatorial level of each apple. Cylinders (1.2 cm indiameter and 2 cm in height) were taken equidistant from the sur-face and the seed sacs in the parenchyma region using a circularpunch.
2.1.2. Freezing and thawingThree freezing protocols were applied: at �20 �C in a cold
chamber, at �80 �C in gas nitrogen convection (Silversas, Air Liqu-ide, Paris, France) and by immersion in liquid nitrogen (LN2, boil-ing point = �196 �C) until the core temperature reached theequilibrium value with the freezing temperature. The three proto-cols correspond to slow (0.9 �C/min), intermediate (8.1 �C/min) andvery fast (310 �C/min) freezing rate, respectively. Once frozen, thesamples were packed in polyethylene bags and thawed in a coldchamber at 4 �C overnight. They were finally placed at room tem-perature (21 ± 1 �C) until the sample cores reached roomtemperature.
Fresh samples were used as reference samples for each experi-mental technique. The three freezing protocols and fresh samplesare referred to as protocols in the following.
2.2. Mechanical properties
The texture of apple cylinders was measured with a TA.XT2itexture analyser (Stable Micro Systems Ltd, Godalming, UK). Allexperiments were conducted at 21 �C. The fruit cylinders werekept at the same orientation because of fibrous non-isotropic prop-erties of apple flesh (Khan & Vincent, 1993). For each protocol, twocylinders per fruit and ten fruit were analysed resulting in 20 mea-surements. Penetrometry tests were carried out as in Mehinagicet al., 2003 but with a 2 mm diameter cylindrical probe, penetrat-
790 S. Chassagne-Berces et al. / Food Research International 42 (2009) 788–797
ing 10 mm into samples at 0.5 mm/s. Force vs. deformation curveswere recorded and flesh rupture mean force between 7 and 9 mmpenetration was calculated and corresponded to firmness ex-pressed in Newton (Fig. 1.). Compression tests were performedwith a 21 mm compression plate (P/21) at 0.1 mm/s until a 15%strain was reached. Stress vs. strain curves were analysed andYoung’s modulus (E) was obtained from the slope of the loadingcurve at the point of its highest gradient.
2.3. Cell wall composition
2.3.1. Preparation of the alcohol insoluble materialThree fruit were analysed per protocol. Six cylinders for each
fruit were freeze-dried and ground using a Fast Prep-24 crusher(MP BIOmedicals; 10seconds at 6.5 m/s). Alcohol insoluble mate-rial was prepared under high pressure (100 bars) and high temper-ature (85 �C) with ASE 200 (Dionex) as follows. Ground materialswere washed with 70% ethanol and dehydrated by solvent ex-change (100% ethanol). The material was then dried with 100% eth-anol. A Dubois test (Dubois, Gilles, Hamilton, Rebers, & Smith,1956) was used to control the absence of free sugars in the lastalcohol extract during the preparation of alcohol insoluble material(absence of color).
2.3.2. Sugar analysisIdentification and quantification of neutral sugars were carried
out by gas–liquid chromatography (GC) after sulphuric acid degra-dation (Hoebler, Barry, David, & Delort-Laval, 1989). Alcohol insol-uble materials were dispersed in 13 M sulphuric acid for 30 min at25 �C and then hydrolyzed in 1 M sulphuric acid (4 mol/L, 2 h, and100 �C). Sugars were converted to alditol acetates (Blakeney,Harris, Henry, & Stone, 1983) and chromatographed on a BP 225capillary column (SGE France SARL; temperature: 198 �C, carriergas: H2). For calibration, a standard sugar solution (rhamnose,fucose, arabinose, xylose, mannose, galactose, and glucose) andinositol (the internal standard) were used. Uronic acids in acidhydrolyzates were quantified using the metahydroxydiphenylcolorimetric method (Thibault, 1979). Uronic acids were assumedto be composed solely of galacturonic acid.
The degree of pectin-esterification by methanol and acetic acidin alcohol insoluble materials was measured by HPLC after alkalinehydrolysis according to the method used by Levigne et al. (Levigne,Thomas, Ralet, Quemener, & Thibault, 2002). The degree of methyl-and acetyl-esterification corresponds to the mol amount of meth-anol and acetic acid, respectively, per 100 mol of galacturonic acidmeasured by colorimetry (Thibault, 1979).
2.4. Physical structure
The physical structure was studied at different scales. The cellu-lar structure was investigated at the tissue scale using macrovision.The vacuolar integrity was observed at the cell scale using confocalmicroscopy. Ice crystals were analysed by cryo-scanning electronmicroscopy. Image analysis was applied to quantify the cellularstructure and ice crystal size.
2.4.1. Imaging the cellular structure of fruit fleshThree apples and two cylinders per fruit were studied for each
treatment. Three 150 lm thick transverse sections were obtainedper cylinder using a vibrating blade microtome (HM 650 V, MicromInternational GmbH, Walldrof, Germany). Ultrasonic waves wereapplied on sections for 5 min to eliminate air bubbles.
Images were acquired using a macrovision system composed ofa CDD monochrome camera (Sony XC-8500CE) fitted with a 50 mmlens (AF Nikkor, 1:1.8) and a 36 mm extension tube. Sections werebacklighted using a fiber optic ring-light (SCHOTT DCRILL, Polytec,
France) that sent light at oblique angles. The camera and lens wereadjusted to observe a 5.50 mm � 7.25 mm area with image resolu-tion equal to 9.55 lm per pixel. Grey levels were coded between 0(black) and 255 (white). Image acquisition was performed on a PCStation equipped with a Matrox METEOR II board and driven by Vi-sion Stage software (Version 1.6fr Alliance Vision, France).
2.4.2. Imaging of the vacuole compartmentThree apples and two cylinders per fruit were studied. To be
able to observe the vacuole, cells must not be cut during sectionpreparation. As apple cell diameter ranges between 200 and300 lm (Khan & Vincent, 1990), the thickness of the transversesections was fixed to 500 lm. Two sections per cylinder were cutusing a vibrating blade microtome (HM 650 V, Microm Interna-tional GmbH, Walldrof, Germany). Ultrasonic waves were appliedon each section for 5 min. Sections were stained using neutralred (0.05% in 5 mM Hepes KOH buffer, pH 8–8.5) in order to makethe vacuoles fluorescent. The neutral red was prepared in sucrosesolution (20% w/w) corresponding to apple juice osmolarity(800 mOsm) to preserve the isotonic state of cells. The colored sec-tions were twice washed in the iso-osmolarity sucrose solution for5 min.
Images were acquired using a Confocal laser-scanning micro-scope (Zeiss, LSM 410). Regions were observed for each section.The �10 lens was used to observe together small and large cells.The excitation wavelength was 543 nm and the light emitted over570 nm was collected using a long pass filter. Eight scans wereaveraged for each image in order to reduce background noise. 3Dimages (about 18 images per x–y direction depending on the de-crease in fluorescence brought about by the depth of the opticalplane) were acquired for further 3D image processing.
2.4.3. Imaging ice crystals into cellsTwo apples and two cylinders per fruit were studied for each
freezing protocol. Frozen samples at �20 �C and at �80 �C wereimmediately stored in liquid nitrogen in order to fix the ice struc-ture formed during freezing. According to Bomben and King (1982)no changes in ice structure due to fixation were apparent. This stepwas not necessary for the last freezing protocol corresponding toimmersion in liquid nitrogen. Frozen apple cylinders were trans-ferred into the cold stage of a cryo-system (GATAN) for scanningelectron microscopy (PHILIPS 525) and then cut with a knife (at�150 �C). After etching at �80 �C to reveal cell outlines, cylinderswere cooled at �160 �C before being coated with gold, and the sur-face was examined at �160 �C under a low acceleration voltage(10 keV).
2.4.4. Image texture analysis using grey level morphologicalgranulometries
Cellular structure and ice crystal size were quantified using im-age texture analysis. Grey level granulometric methods from math-ematical morphology were applied, as described by Devaux et al.(2008). Mathematical morphology consists of the successive appli-cation of two basic transformations called ‘‘opening” and ‘‘closing”.Opening and Closing are based on the comparison of images to‘‘structuring elements” of given sizes and shapes. Only particleslarger than the structuring element remain after an opening or aclosing. Opening is applied to study the size of bright objects,whereas closing is applied to characterise dark objects. A size dis-tribution can be obtained by applying a sequence of either open-ings or closings with structuring elements of increasing size.After each opening or closing step, the sum of grey level is com-puted. Variations between each step depend on the amount ofbright or dark objects removed by opening or closing. They aredrawn according to the size of the structuring element resultingin a granulometric curve for the image.
S. Chassagne-Berces et al. / Food Research International 42 (2009) 788–797 791
The cellular structure was quantified from macrovision imagesby applying 35 successive opening and closing steps. Square struc-turing elements of size ranging from 28.65 lm to 678.05 lm byincrements of 19.1 lm were used. Ice crystal size was quantifiedfrom Cryo-Scanning Electron Microscopy images by applying 100successive opening and closing steps. Linear structuring elementswere used instead of square to reveal the length of ice crystals
0.0
0.5
1.0
1.5
2.0
2.5
3.0
3.5
Fresh LN2 (- 80 °C) (- 20 °C)
Firm
ness
(N)
(a)
(b)
0
0.05
0.1
1.5
2
2.5
Fresh
Youn
g's
mod
ulus
(MPa
)
LN2 (-80°C) (-20°C)
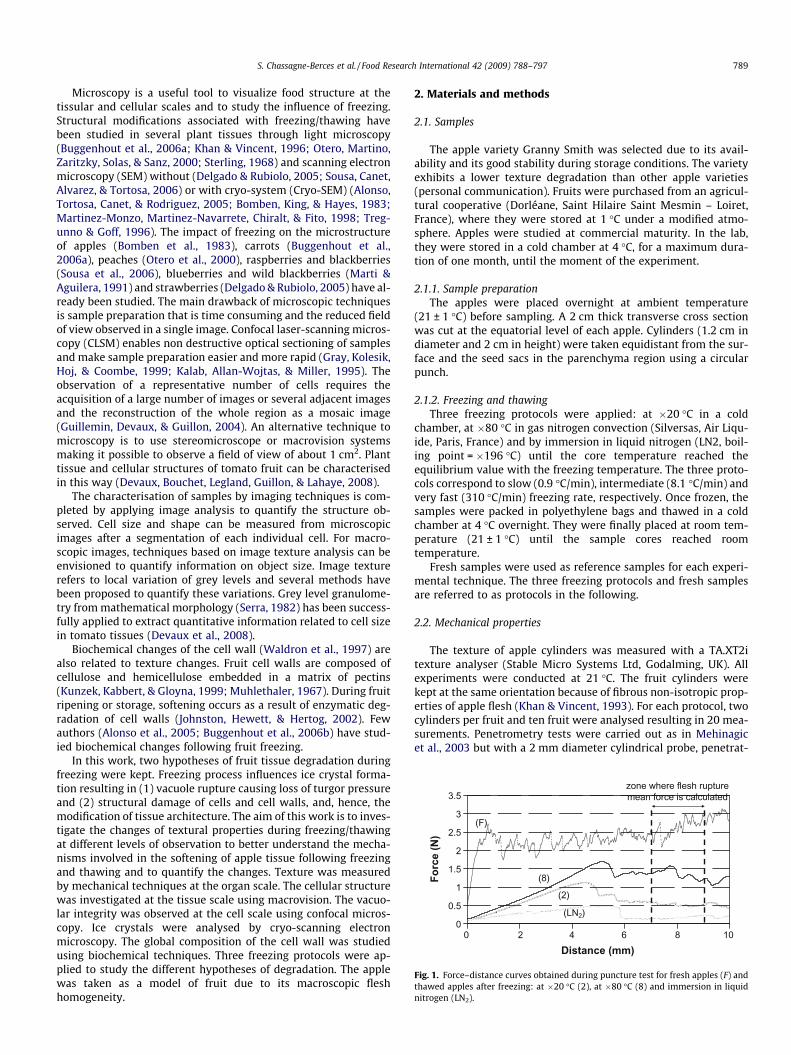
Fig. 2. Effect of freezing protocols at �20 �C, at �80 �C and immersion in liquidnitrogen LN2 on (a) apple firmness and (b) Young’s modulus. Fresh apples were usedas control. Means across repetitions are represented with a confidence interval.
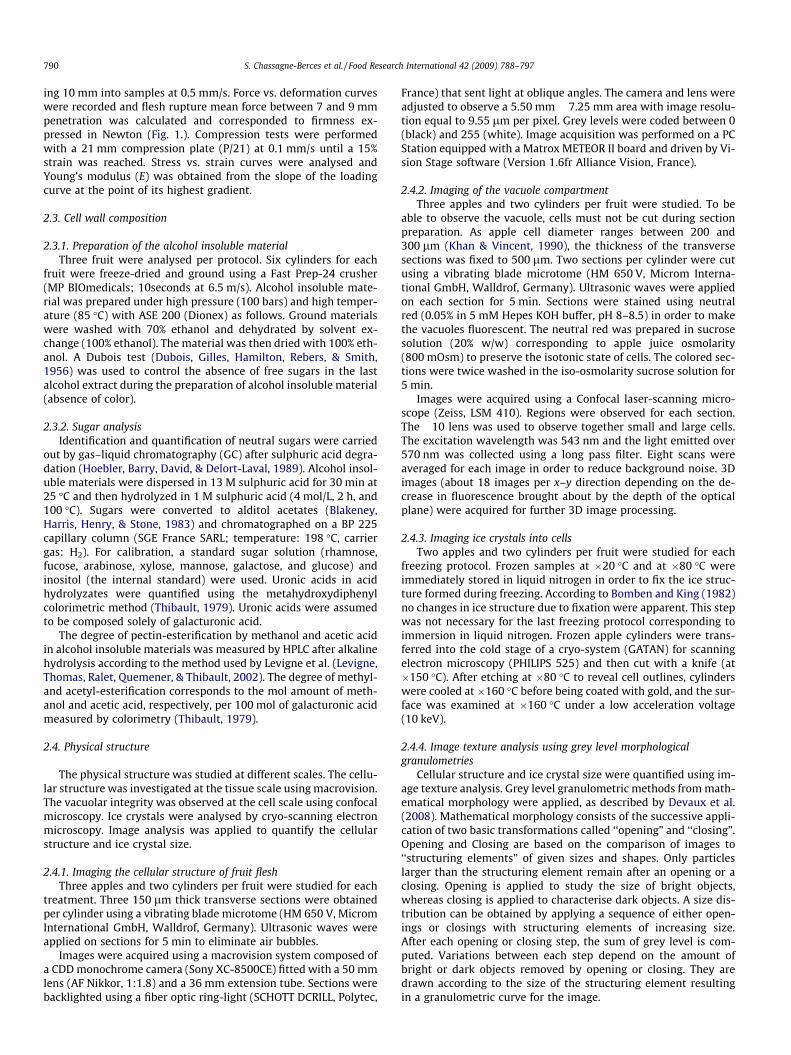
Fig. 3. Macroscopic images of apple parenchyma tissue sections before and after freezinfreezing at �80 �C (d) thawed apple after immersion in liquid nitrogen. A tissue crack is
rather than their average diameter. As the orientation of crystalswas random, four orientations were considered: 0, 45, 90 and135�. The length of structuring elements ranged from 0.62 lm to41.21 lm by increments of 0.41 lm. Image analysis procedureswere developed using Matlab2007a software (The MATHWORKS,USA).
2.5. Statistical analysis
2.5.1. Granulometric curve analysisPrincipal Component Analyses were applied to analyse the sets
of granulometric curves that quantified the cellular structure andice crystal size. Data tables were built from the curves by consider-ing the images as individuals and the opening and closing steps asvariables. Principal component analysis assesses synthetic uncor-related principal components as linear combinations of all the vari-ables, in the present case opening or closing steps (37). Similaritymaps of images can be drawn using the component scores. Inter-pretation of components is obtained by looking at the linear com-bination coefficients, called loadings (Robert, Devaux, & Bertrand,1996). Principal component analysis was applied within MATLABenvironment (The MATHWORKS, USA).
2.5.2. Variance analysisVariance analyses were applied to the different sets of data:
principal components extracted for cellular structure, principalcomponents extracted for ice crystals, mechanical firmness values,sugar proportions in cell walls. Variance analyses were performedusing statgraphics Plus 5.1 (Sigma-Plus, France).
3. Results
3.1. Mechanical properties
Fig. 2 represents the mean values of two texture parameters(firmness and Young’s modulus) for the four protocols. For thetwo freezing parameters, the effect of freezing rates was significant(P < 0.01), as expected from results in the literature (Brown, 1977;
g. (a) fresh apple, (b) thawed apple after freezing at �20 �C (c) thawed apple afterarrowed. The field of view was 5.5 � 7.25 mm.

Fig. 5. Cellular structure. (a) Principal component analysis of opening–closingcurves: similarity map of components 1 and 2. Convex hulls were drawn for freshapples (F) and thawed apple after freezing at �20 �C (2), at �80 �C (8) andimmersion in liquid nitrogen (A). (b and c). Loadings corresponding to components1 (b) and 2 (c).
792 S. Chassagne-Berces et al. / Food Research International 42 (2009) 788–797
Delgado & Rubiolo, 2005). Values for frozen/thawed apples differedsignificantly from those of fresh apples. Nevertheless, freezing at�80 �C provoked less degradation (54%) in firmness than freezingat �20 �C (79%) or immersion in liquid nitrogen (91%). Freezingat �80 �C and immersion in liquid nitrogen exhibited less Young’smodulus decrease (97%) than freezing at �20 �C (99%).
3.2. Cellular structure
Typical examples of images of fresh or frozen/thawed apple tis-sues acquired by Macrovision are presented in Fig. 3. Cells areclearly visible on the image of fresh apples. Some intercellularspaces could be seen. Large white spots correspond to vascularbundles. Freezing at �20 �C induced large changes of the cellularstructure: cell walls seemed to be collapsed. More and larger inter-cellular spaces were observed. The cellular structure for the freez-ing at �80 �C did not differ much from that of the fresh samples. Inthe case of liquid nitrogen freezing a long and thin tissue crack dif-ferentiated apple tissue following this freezing condition from thefresh samples.
Object size was quantified using greyscale mathematical mor-phology. Cells and intercellular spaces appeared as dark objectswhile cell walls appeared as bright objects. In order to characteriseboth bright and dark objects, opening and closing were applied.Opening also took into account vascular bundles. The relativeamount of vascular bundles was assumed to be identical for eachfreezing protocol as samples were taken from the same apple re-gions. Average granulometric curves were calculated for eachfreezing protocol and are shown in Fig. 4. The left part of the curvesrepresents the analysis of cells and intercellular spaces by closing.A maximum corresponding to the smallest dark objects, i.e. cells,was observed around 100 lm. Above 200 lm, the largest dark ob-jects represented the intercellular spaces. Less cells and moreintercellular spaces were found in apples frozen at �20 �C. The pro-portion of cells and intercellular spaces in thawed apples afterfreezing at �80 �C or after immersion in nitrogen liquid were sim-ilar to those in the fresh apples. The right part represents the anal-ysis of cell walls, collapsed cell walls and vascular bundles byopening. The first peak (50 lm) corresponds to the removing of cellwalls after the first opening. After freezing at �20 �C the thawedapples exhibited a higher amount of objects larger than 100 lmcorresponding to collapsed cell walls. On the basis of image analy-sis by opening and closing, it was apparent that tissues are similar
Fig. 4. Cellular structure. Image analysis. Average granulometric curves assessedfor fresh apple tissue (F) and thawed apple tissue after freezing: at �20 �C (2), at�80 �C (8) and immersion in liquid nitrogen (A).
with freezing at �80 �C, immersion in liquid nitrogen and freshtissues.
Principal component analysis was applied in order to comparethe whole set of granulometric curves. The first two principal com-ponents accounted for 67.26% and 15.60% of the total variancerespectively. The similarity map of the 72 granulometric curvesis plotted on Fig. 5a. A freezing effect was found for components1 and 2 by variance analysis. Freezing at �20 �C significantly dif-fered from other protocols. On component 1, samples after freezingat �80 �C and by immersion in liquid nitrogen differed from freshsamples. Interpretation of the components was obtained by look-ing at the corresponding loadings (Fig. 5b,c). Loading of component1 (Fig. 5b) mainly described size variations of bright objects. Posi-tive values were observed for large opening sizes corresponding tocollapsed cell walls and negative values for smaller opening sizescorresponding to cell walls. Images of thawed apples after freezingat �20 �C exhibited positive score values (Fig. 5a) associated withcell wall collapses. Fresh samples were found on the opposite side.Freezing at �80 �C and using liquid nitrogen were intermediate.Loading of component 2 (Fig. 5c) mainly described size variationsof dark objects. Positive values were observed for small closingsizes corresponding to cells, and negative values for larger closingsizes corresponding to intercellular spaces. Again, freezing at�20 �C differed from other freezing protocols because of the largeramount of intercellular spaces and therefore a lower amount ofintact cells.
3.3. Preservation of vacuoles
Confocal laser scanning microscopy was used to visualize cellvacuoles in fresh and frozen/thawed apple tissue. Fig. 6. showsexamples of 3D images. For the fresh state, vacuoles were clearlyvisible and filled up the total cell volume (Fig. 6a). After the

Fig. 6. 3D images of apple cells from fresh apples (a), thawed apples after freezing at �20 �C (b), at �80 �C (c) or immersion in liquid nitrogen (d).(colouring: neutral red;objective: �40; image size: 1280 � 1280 lm).
S. Chassagne-Berces et al. / Food Research International 42 (2009) 788–797 793
freezing/thawing protocol, no intact vacuole could be observed incells whatever the freezing protocols (Fig. 6b–d). This result indi-cates that the tonoplast which surrounds the vacuole was neverpreserved after application of the freezing/thawing processes, inaccordance with cell membrane damage following freezing/thaw-ing in carrot tissue (Greve et al., 1994).
3.4. Freezing effect on ice crystal size
Cold-stage scanning electron microscopy was used to observethe ice crystal size. Fig. 7 shows examples of images obtained forfrozen apple tissue with different freezing protocols. Thanks tothe quality of the images especially at 100 lm, it was possible tocarry out an interpretation based on descriptions reported by Bom-ben and King (Bomben & King, 1982). Bright regions (Fig. 7) corre-spond to the freeze concentrated matrix, the cytoplasmicmembrane, and the cell walls. Darker regions corresponded toghost of ice microcrystal that sublimed during etching. Differencesin intensity were due to differences in height between ice crystal,freeze concentrated material and insoluble structures of the tissue.As expected, after freezing using liquid nitrogen, cells containedmany small ice crystals which were evident as pits (Fig. 7c). Afterfreezing at �80 �C, ice crystals in the cell appeared slightly larger(Fig. 7b). After freezing at �20 �C, ice crystals were much bigger(Fig. 7a). Furthermore the shape of cell walls seemed to be less reg-ular for the freezing at �20 �C than for the other two freezingprotocols.
Grey level morphological granulometry was applied to quantifyice crystal size. Ice crystals exhibited elongated shapes and wereorientated in different directions. Image texture analysis wastherefore applied by using linear structuring elements oriented in
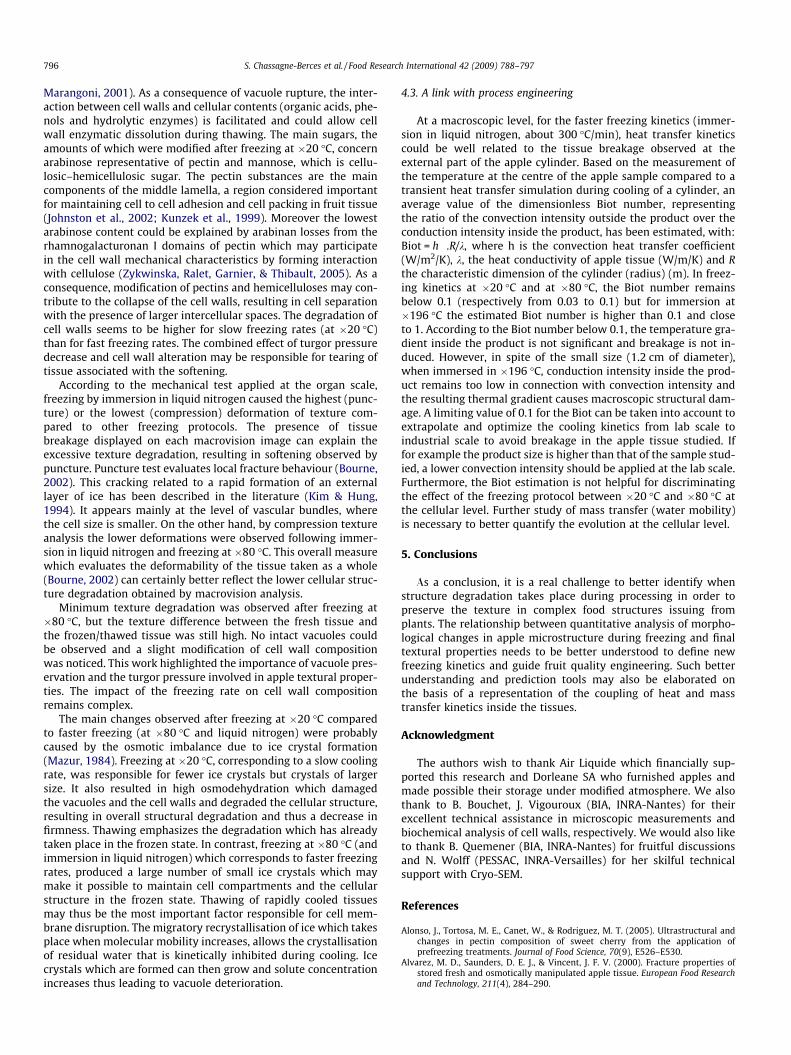
four directions in the image: 0, 45, 90 and 135�. The four resultinggranulometric curves were summed to obtain a final curve thatmeasure the length of crystal averaged for all directions. Closing-opening curves were assessed to characterise both ice crystalsand the freeze concentrated matrix. The three freezing protocolsmainly differed through comparison of the ice crystals (dark ob-jects), (Fig. 8). Thawed apples after freezing at �20 �C exhibited avery distinctive granulometric profile. Large ice crystals with aclosing size mainly between 10 and 30 lm represented almostthe total number of ice crystal. For the other two freezing proto-cols, small ice crystals were found with a closing size of less than5 lm. After freezing at�80 �C, the crystals were slightly larger(about 3 lm) than those observed after immersion using liquidnitrogen (about 2 lm). With regards to bright objects, i.e. freezeconcentrated matrix (between ice crystal area), after freezing at�20 �C some differences were observed. As a consequence of icecrystal size, the thickness of the freeze concentrated matrix waslarger than after freezing at �80 �C or using liquid nitrogen. Princi-pal component analysis was applied to the set of granulometriccurves computed for all macroscopic images (Fig. 9). The first prin-cipal component described the ice crystal size with the larger sizeon the left and the smaller size on the right, differentiating freezingat �20 �C from the freezing at �80 �C followed by immersion in li-quid nitrogen. Principal component 2 revealed the intermediatesize of ice crystals after freezing at �80 �C.
3.5. Chemical composition of cell wall
Changes in average sugar composition, degrees of methyl- andacetyl- esterification (DM, DA, respectively) of cell wall polysac-charides in the alcohol insoluble material obtained from fresh
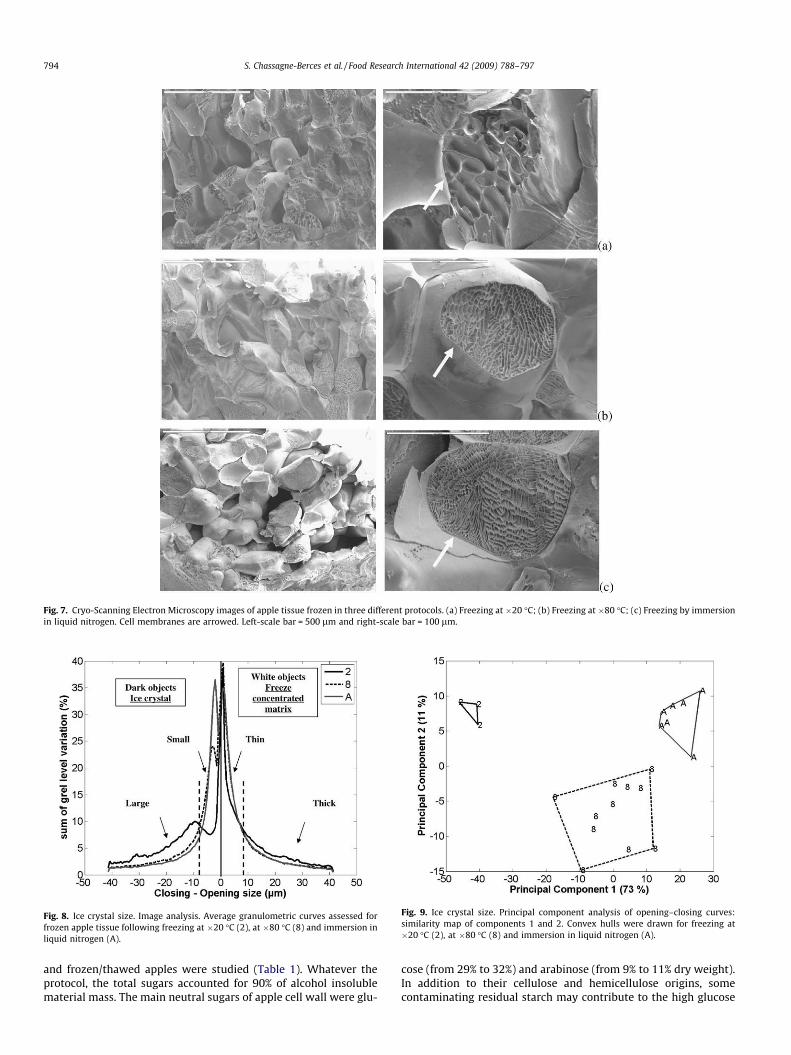
Fig. 8. Ice crystal size. Image analysis. Average granulometric curves assessed forfrozen apple tissue following freezing at �20 �C (2), at �80 �C (8) and immersion inliquid nitrogen (A).
Fig. 9. Ice crystal size. Principal component analysis of opening–closing curves:similarity map of components 1 and 2. Convex hulls were drawn for freezing at�20 �C (2), at �80 �C (8) and immersion in liquid nitrogen (A).
Fig. 7. Cryo-Scanning Electron Microscopy images of apple tissue frozen in three different protocols. (a) Freezing at �20 �C; (b) Freezing at �80 �C; (c) Freezing by immersionin liquid nitrogen. Cell membranes are arrowed. Left-scale bar = 500 lm and right-scale bar = 100 lm.
794 S. Chassagne-Berces et al. / Food Research International 42 (2009) 788–797
and frozen/thawed apples were studied (Table 1). Whatever theprotocol, the total sugars accounted for 90% of alcohol insolublematerial mass. The main neutral sugars of apple cell wall were glu-
cose (from 29% to 32%) and arabinose (from 9% to 11% dry weight).In addition to their cellulose and hemicellulose origins, somecontaminating residual starch may contribute to the high glucose
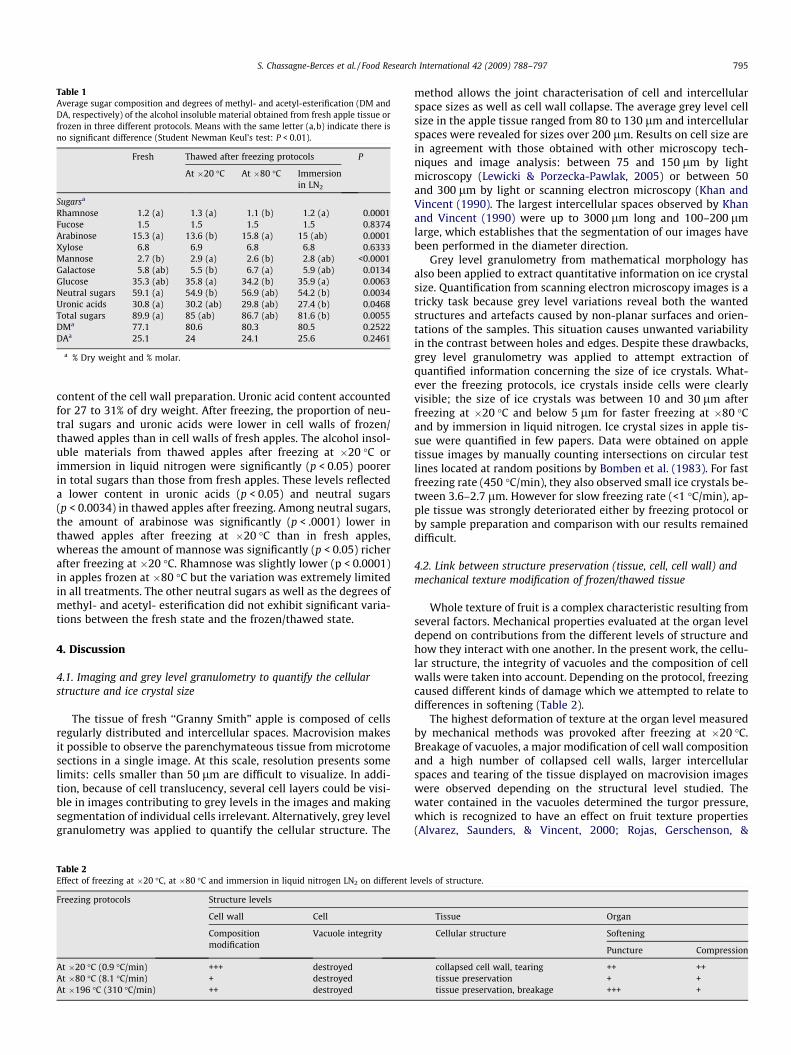
Table 1Average sugar composition and degrees of methyl- and acetyl-esterification (DM andDA, respectively) of the alcohol insoluble material obtained from fresh apple tissue orfrozen in three different protocols. Means with the same letter (a,b) indicate there isno significant difference (Student Newman Keul’s test: P < 0.01).
Fresh Thawed after freezing protocols P
At �20 �C At �80 �C Immersionin LN2
Sugarsa
Rhamnose 1.2 (a) 1.3 (a) 1.1 (b) 1.2 (a) 0.0001Fucose 1.5 1.5 1.5 1.5 0.8374Arabinose 15.3 (a) 13.6 (b) 15.8 (a) 15 (ab) 0.0001Xylose 6.8 6.9 6.8 6.8 0.6333Mannose 2.7 (b) 2.9 (a) 2.6 (b) 2.8 (ab) <0.0001Galactose 5.8 (ab) 5.5 (b) 6.7 (a) 5.9 (ab) 0.0134Glucose 35.3 (ab) 35.8 (a) 34.2 (b) 35.9 (a) 0.0063Neutral sugars 59.1 (a) 54.9 (b) 56.9 (ab) 54.2 (b) 0.0034Uronic acids 30.8 (a) 30.2 (ab) 29.8 (ab) 27.4 (b) 0.0468Total sugars 89.9 (a) 85 (ab) 86.7 (ab) 81.6 (b) 0.0055DMa 77.1 80.6 80.3 80.5 0.2522DAa 25.1 24 24.1 25.6 0.2461
a % Dry weight and % molar.
S. Chassagne-Berces et al. / Food Research International 42 (2009) 788–797 795
content of the cell wall preparation. Uronic acid content accountedfor 27 to 31% of dry weight. After freezing, the proportion of neu-tral sugars and uronic acids were lower in cell walls of frozen/thawed apples than in cell walls of fresh apples. The alcohol insol-uble materials from thawed apples after freezing at �20 �C orimmersion in liquid nitrogen were significantly (p < 0.05) poorerin total sugars than those from fresh apples. These levels reflecteda lower content in uronic acids (p < 0.05) and neutral sugars(p < 0.0034) in thawed apples after freezing. Among neutral sugars,the amount of arabinose was significantly (p < .0001) lower inthawed apples after freezing at �20 �C than in fresh apples,whereas the amount of mannose was significantly (p < 0.05) richerafter freezing at �20 �C. Rhamnose was slightly lower (p < 0.0001)in apples frozen at �80 �C but the variation was extremely limitedin all treatments. The other neutral sugars as well as the degrees ofmethyl- and acetyl- esterification did not exhibit significant varia-tions between the fresh state and the frozen/thawed state.
4. Discussion
4.1. Imaging and grey level granulometry to quantify the cellularstructure and ice crystal size
The tissue of fresh ‘‘Granny Smith” apple is composed of cellsregularly distributed and intercellular spaces. Macrovision makesit possible to observe the parenchymateous tissue from microtomesections in a single image. At this scale, resolution presents somelimits: cells smaller than 50 lm are difficult to visualize. In addi-tion, because of cell translucency, several cell layers could be visi-ble in images contributing to grey levels in the images and makingsegmentation of individual cells irrelevant. Alternatively, grey levelgranulometry was applied to quantify the cellular structure. The
Table 2Effect of freezing at �20 �C, at �80 �C and immersion in liquid nitrogen LN2 on different l
Freezing protocols Structure levels
Cell wall Cell
Compositionmodification
Vacuole integrity
At �20 �C (0.9 �C/min) +++ destroyedAt �80 �C (8.1 �C/min) + destroyedAt �196 �C (310 �C/min) ++ destroyed
method allows the joint characterisation of cell and intercellularspace sizes as well as cell wall collapse. The average grey level cellsize in the apple tissue ranged from 80 to 130 lm and intercellularspaces were revealed for sizes over 200 lm. Results on cell size arein agreement with those obtained with other microscopy tech-niques and image analysis: between 75 and 150 lm by lightmicroscopy (Lewicki & Porzecka-Pawlak, 2005) or between 50and 300 lm by light or scanning electron microscopy (Khan andVincent (1990). The largest intercellular spaces observed by Khanand Vincent (1990) were up to 3000 lm long and 100–200 lmlarge, which establishes that the segmentation of our images havebeen performed in the diameter direction.
Grey level granulometry from mathematical morphology hasalso been applied to extract quantitative information on ice crystalsize. Quantification from scanning electron microscopy images is atricky task because grey level variations reveal both the wantedstructures and artefacts caused by non-planar surfaces and orien-tations of the samples. This situation causes unwanted variabilityin the contrast between holes and edges. Despite these drawbacks,grey level granulometry was applied to attempt extraction ofquantified information concerning the size of ice crystals. What-ever the freezing protocols, ice crystals inside cells were clearlyvisible; the size of ice crystals was between 10 and 30 lm afterfreezing at �20 �C and below 5 lm for faster freezing at �80 �Cand by immersion in liquid nitrogen. Ice crystal sizes in apple tis-sue were quantified in few papers. Data were obtained on appletissue images by manually counting intersections on circular testlines located at random positions by Bomben et al. (1983). For fastfreezing rate (450 �C/min), they also observed small ice crystals be-tween 3.6–2.7 lm. However for slow freezing rate (<1 �C/min), ap-ple tissue was strongly deteriorated either by freezing protocol orby sample preparation and comparison with our results remaineddifficult.
4.2. Link between structure preservation (tissue, cell, cell wall) andmechanical texture modification of frozen/thawed tissue
Whole texture of fruit is a complex characteristic resulting fromseveral factors. Mechanical properties evaluated at the organ leveldepend on contributions from the different levels of structure andhow they interact with one another. In the present work, the cellu-lar structure, the integrity of vacuoles and the composition of cellwalls were taken into account. Depending on the protocol, freezingcaused different kinds of damage which we attempted to relate todifferences in softening (Table 2).
The highest deformation of texture at the organ level measuredby mechanical methods was provoked after freezing at �20 �C.Breakage of vacuoles, a major modification of cell wall compositionand a high number of collapsed cell walls, larger intercellularspaces and tearing of the tissue displayed on macrovision imageswere observed depending on the structural level studied. Thewater contained in the vacuoles determined the turgor pressure,which is recognized to have an effect on fruit texture properties(Alvarez, Saunders, & Vincent, 2000; Rojas, Gerschenson, &
evels of structure.
Tissue Organ
Cellular structure Softening
Puncture Compression
collapsed cell wall, tearing ++ ++tissue preservation + +tissue preservation, breakage +++ +
796 S. Chassagne-Berces et al. / Food Research International 42 (2009) 788–797
Marangoni, 2001). As a consequence of vacuole rupture, the inter-action between cell walls and cellular contents (organic acids, phe-nols and hydrolytic enzymes) is facilitated and could allow cellwall enzymatic dissolution during thawing. The main sugars, theamounts of which were modified after freezing at �20 �C, concernarabinose representative of pectin and mannose, which is cellu-losic–hemicellulosic sugar. The pectin substances are the maincomponents of the middle lamella, a region considered importantfor maintaining cell to cell adhesion and cell packing in fruit tissue(Johnston et al., 2002; Kunzek et al., 1999). Moreover the lowestarabinose content could be explained by arabinan losses from therhamnogalacturonan I domains of pectin which may participatein the cell wall mechanical characteristics by forming interactionwith cellulose (Zykwinska, Ralet, Garnier, & Thibault, 2005). As aconsequence, modification of pectins and hemicelluloses may con-tribute to the collapse of the cell walls, resulting in cell separationwith the presence of larger intercellular spaces. The degradation ofcell walls seems to be higher for slow freezing rates (at �20 �C)than for fast freezing rates. The combined effect of turgor pressuredecrease and cell wall alteration may be responsible for tearing oftissue associated with the softening.
According to the mechanical test applied at the organ scale,freezing by immersion in liquid nitrogen caused the highest (punc-ture) or the lowest (compression) deformation of texture com-pared to other freezing protocols. The presence of tissuebreakage displayed on each macrovision image can explain theexcessive texture degradation, resulting in softening observed bypuncture. Puncture test evaluates local fracture behaviour (Bourne,2002). This cracking related to a rapid formation of an externallayer of ice has been described in the literature (Kim & Hung,1994). It appears mainly at the level of vascular bundles, wherethe cell size is smaller. On the other hand, by compression textureanalysis the lower deformations were observed following immer-sion in liquid nitrogen and freezing at �80 �C. This overall measurewhich evaluates the deformability of the tissue taken as a whole(Bourne, 2002) can certainly better reflect the lower cellular struc-ture degradation obtained by macrovision analysis.
Minimum texture degradation was observed after freezing at�80 �C, but the texture difference between the fresh tissue andthe frozen/thawed tissue was still high. No intact vacuoles couldbe observed and a slight modification of cell wall compositionwas noticed. This work highlighted the importance of vacuole pres-ervation and the turgor pressure involved in apple textural proper-ties. The impact of the freezing rate on cell wall compositionremains complex.
The main changes observed after freezing at �20 �C comparedto faster freezing (at �80 �C and liquid nitrogen) were probablycaused by the osmotic imbalance due to ice crystal formation(Mazur, 1984). Freezing at �20 �C, corresponding to a slow coolingrate, was responsible for fewer ice crystals but crystals of largersize. It also resulted in high osmodehydration which damagedthe vacuoles and the cell walls and degraded the cellular structure,resulting in overall structural degradation and thus a decrease infirmness. Thawing emphasizes the degradation which has alreadytaken place in the frozen state. In contrast, freezing at �80 �C (andimmersion in liquid nitrogen) which corresponds to faster freezingrates, produced a large number of small ice crystals which maymake it possible to maintain cell compartments and the cellularstructure in the frozen state. Thawing of rapidly cooled tissuesmay thus be the most important factor responsible for cell mem-brane disruption. The migratory recrystallisation of ice which takesplace when molecular mobility increases, allows the crystallisationof residual water that is kinetically inhibited during cooling. Icecrystals which are formed can then grow and solute concentrationincreases thus leading to vacuole deterioration.
4.3. A link with process engineering
At a macroscopic level, for the faster freezing kinetics (immer-sion in liquid nitrogen, about 300 �C/min), heat transfer kineticscould be well related to the tissue breakage observed at theexternal part of the apple cylinder. Based on the measurement ofthe temperature at the centre of the apple sample compared to atransient heat transfer simulation during cooling of a cylinder, anaverage value of the dimensionless Biot number, representingthe ratio of the convection intensity outside the product over theconduction intensity inside the product, has been estimated, with:Biot = h .R/k, where h is the convection heat transfer coefficient(W/m2/K), k, the heat conductivity of apple tissue (W/m/K) and Rthe characteristic dimension of the cylinder (radius) (m). In freez-ing kinetics at �20 �C and at �80 �C, the Biot number remainsbelow 0.1 (respectively from 0.03 to 0.1) but for immersion at�196 �C the estimated Biot number is higher than 0.1 and closeto 1. According to the Biot number below 0.1, the temperature gra-dient inside the product is not significant and breakage is not in-duced. However, in spite of the small size (1.2 cm of diameter),when immersed in �196 �C, conduction intensity inside the prod-uct remains too low in connection with convection intensity andthe resulting thermal gradient causes macroscopic structural dam-age. A limiting value of 0.1 for the Biot can be taken into account toextrapolate and optimize the cooling kinetics from lab scale toindustrial scale to avoid breakage in the apple tissue studied. Iffor example the product size is higher than that of the sample stud-ied, a lower convection intensity should be applied at the lab scale.Furthermore, the Biot estimation is not helpful for discriminatingthe effect of the freezing protocol between �20 �C and �80 �C atthe cellular level. Further study of mass transfer (water mobility)is necessary to better quantify the evolution at the cellular level.
5. Conclusions
Fs a conclusion, it is a real challenge to better identify whenstructure degradation takes place during processing in order topreserve the texture in complex food structures issuing fromplants. The relationship between quantitative analysis of morpho-logical changes in apple microstructure during freezing and finaltextural properties needs to be better understood to define newfreezing kinetics and guide fruit quality engineering. Such betterunderstanding and prediction tools may also be elaborated onthe basis of a representation of the coupling of heat and masstransfer kinetics inside the tissues.
Acknowledgment
The authors wish to thank Air Liquide which financially sup-ported this research and Dorleane SA who furnished apples andmade possible their storage under modified atmosphere. We alsothank to B. Bouchet, J. Vigouroux (BIA, INRA-Nantes) for theirexcellent technical assistance in microscopic measurements andbiochemical analysis of cell walls, respectively. We would also liketo thank B. Quemener (BIA, INRA-Nantes) for fruitful discussionsand N. Wolff (PESSAC, INRA-Versailles) for her skilful technicalsupport with Cryo-SEM.
References
Alonso, J., Tortosa, M. E., Canet, W., & Rodriguez, M. T. (2005). Ultrastructural andchanges in pectin composition of sweet cherry from the application ofprefreezing treatments. Journal of Food Science, 70(9), E526–E530.
Alvarez, M. D., Saunders, D. E. J., & Vincent, J. F. V. (2000). Fracture properties ofstored fresh and osmotically manipulated apple tissue. European Food Researchand Technology, 211(4), 284–290.

S. Chassagne-Berces et al. / Food Research International 42 (2009) 788–797 797
Blakeney, A. B., Harris, P. J., Henry, R. J., & Stone, B. A. (1983). A simple and rapidpreparation of alditol acetates for monosaccharide analysis. CarbohydrateResearch, 113(2), 291–299.
Bomben, J. L., & King, C. J. (1982). Heat mass transport freezing apple tissue. Journalof Food Technology, 17(5), 615–632.
Bomben, J. L., King, C. J., & Hayes, T. L. (1983). Cold-stage scanning electronmicroscope measurement of ice morphology in apple tissue as a function offreezing rate. Cryobiology, 20(5), 574–586.
Bourne, M. C. (2002). Food texture and viscosity: Concept and measurement (2nd ed.).London: Academic Press. pp. 427.
Brown, M. S. (1977). Texture of frozen fruits and vegetables. Journal of TextureStudies, 7(4), 391–404.
Buggenhout, S. V., Lille, M., Messagie, I., Loey, A., Autio, K., & Hendrickx, M. (2006a).Impact of pretreatment and freezing conditions on the microstructure of frozencarrots: Quantification and relation to texture loss. European Food Research andTechnology, 222(5), 543–553.
Buggenhout, S. V., Messagie, I., Maes, V., Duvetter, T., Van Loey, A., & Hendrickx, M.(2006b). Minimizing texture loss of frozen strawberries: Effect of infusion withpectinmethylesterase and calcium combined with different freezing conditionsand effect of subsequent storage/thawing conditions. European Food Researchand Technology, 223(3), 395–404.
Chiralt, A., Martinez-Navarrete, N., Martinez-Monzo, J., Talens, P., Moraga, G.,Ayala, A., & Fito, P. (2001). Changes in mechanical properties throughoutosmotic processes: Cryoprotectant effect. Journal of Food Engineering, 49(2–3),129–135.
Delgado, A. E., & Rubiolo, A. C. (2005). Microstructural changes in strawberry afterfreezing and thawing processes. Lebensmittel-Wissenschaft und-Technologie,38(2), 135–142.
Devaux, M. F., Bouchet, B., Legland, D., Guillon, F., & Lahaye, M. (2008). Macro-visionand grey level granulometry for quantification of tomato pericarp structure.Postharvest Biology and Technology, 47(2), 199–209.
Dubois, M., Gilles, K. A., Hamilton, J. K., Rebers, P. A., & Smith, F. (1956). Colorimetricmethod for determination of sugars and related substances. AnalyticalChemistry(28), 350–356.
Gray, J. D., Kolesik, P., Hoj, P. B., & Coombe, B. G. (1999). Confocal measurement ofthe three-dimensional size and shape of plant parenchyma cells in a developingfruit tissue. The Plant Journal, 19(2), 229–236.
Greve, L. C., Shackel, K. A., Ahmadi, H., McArdle, R. N., Gohlke, J. R., & Labavitch, J. M.(1994). Impact of heating on carrot firmness – Contribution of cellular turgor.Journal of Agricultural and Food Chemistry, 42(12), 2896–2899.
Guillemin, F., Devaux, M. F., & Guillon, F. (2004). Evaluation of plant histology byautomatic clustering based on individual cell morphological features. ImageAnalytical Stereology, 23, 13–22.
Hoebler, C., Barry, J. L., David, A., & Delort-Laval, J. (1989). Rapid acid hydrolysis ofplant cell wall polysaccharides and simplified quantitative determination oftheir neutral monosaccharides by gas–liquid chromatography. Journal ofAgricultural and Food Chemistry, 37(2), 360–367.
Johnston, J. W., Hewett, E. W., & Hertog, M. L. A. T. M. (2002). Postharvest softeningof apple (Malus domestica) fruit: A review. New Zealand Journal of Crop andHorticultural Science, 30(3), 145–160.
Kalab, M., Allan-Wojtas, P., & Miller, S. S. (1995). Microscopy and other imagingtechniques in food structure analysis. Trends in Food Science and Technology,6(6), 177–186.
Khan, A. A., & Vincent, J. F. V. (1990). Anisotropy of apple parenchyma. Journal of theScience of Food and Agriculture, 48, 455–466.
Khan, A. A., & Vincent, J. F. V. (1993). Compressive stiffness and fracture propertiesof apple and potato parenchyma. Journal of Texture Studies, 24(4), 423–435.
Khan, A. A., & Vincent, J. F. V. (1996). Mechanical damage induced by controlledfreezing in apple and potato. Journal of Texture Studies, 27(2), 143–157.
Kim, N. K., & Hung, Y. C. (1994). Freeze-cracking in foods as affected by physicalproperties. Journal of Food Science, 59(3), 669–674.
Kunzek, H., Kabbert, R., & Gloyna, D. (1999). Aspects of material science in foodprocessing: Changes in plant cell walls of fruits and vegetables. Zeitschrift furLebensmittel-Untersuchung und -Forschung, 208(4), 233–250.
Levigne, S., Thomas, M., Ralet, M. C., Quemener, B., & Thibault, J. F. (2002).Determination of the degrees of methylation and acetylation of pectins using aC18 column and internal standards. Food Hydrocolloids, 16(6), 547–550.
Lewicki, P. P., & Porzecka-Pawlak, R. (2005). Effect of osmotic dewatering on appletissue structure. Journal of Food Engineering, 66(1), 43–50.
Marani, C. M., Agnelli, M. E., & Mascheroni, R. H. (2007). Osmo-frozen fruits: Masstransfer and quality evaluation. Journal of Food Engineering, 79(4), 1122–1130.
Marti, J., & Aguilera, J. M. (1991). Effects of freezing rate on the mechanicalcharacteristics and microstructure of blueberries and wild blackberries. RevistaDe Agroquimica Y Tecnologia De Alimentos, 31(4), 493–504.
Martinez-Monzo, J., Martinez-Navarrete, N., Chiralt, A., & Fito, P. (1998). Mechanicaland structural changes in apple (VarGranny Smith) due to vacuumimpregnation with cryoprotectants. Journal of Food Science, 63(3), 499–503.
Mastrocola, D., Pittia, P., & Lerici, C. R. (1996). Quality of apple slices processed bycombined techniques. Journal of Food Quality, 19(2), 133–146.
Mazur, P. (1984). Freezing of living cells: Mechanisms and implications. AmericanJournal of Physiology–Cell Physiology, 247(3), C125–142.
Mehinagic, E., Royer, G., Bertrand, D., Symoneaux, R., Laurens, F., & Jourjon, F. (2003).Relationship between sensory analysis, penetrometry and visible-NIRspectroscopy of apples belonging to different cultivars. Food Quality andPreference, 14(5–6), 473–484.
Muhlethaler, K. (1967). Ultrastructure and formation of plant cell walls. AnnualReview of Plant Physiology, 18(1), 1.
Otero, L., Martino, M., Zaritzky, N., Solas, M., & Sanz, P. D. (2000). Preservation ofmicrostructure in peach and mango during high-pressure-shift freezing. Journalof Food Science, 65(3), 466–470.
Phan, P. A., & Mimault, J. (1980). Effects of freezing and thawing on fruit. Evaluationof some texture parameters and exudate. Relation to fruit quality.. InternationalJournal of Refrigeration, 3(5), 255–260.
Robbers, M., Singh, R. P., & Cunha, L. M. (1997). Osmotic–convectivedehydrofreezing process for drying kiwifruit. Journal of Food Science, 62(5),1039–1042.
Robert, P., Devaux, M. F., & Bertrand, D. (1996). Beyond prediction: Extractingrelevant information from near infrared spectra. Journal of Near InfraredSpectroscopy, 4, 75–84.
Rojas, A. M., Gerschenson, L. N., & Marangoni, A. G. (2001). Contributions of cellularcomponents to the rheological behaviour of kiwifruit. Food ResearchInternational, 34(2–3), 189–195.
Serra, J. (1982). Image analysis and mathematical morphologies. London: AcademicPress.
Sousa, M., Canet, W., Alvarez, M., & Tortosa, M. (2006). Effect of processing on thetexture and structure of raspberry (cv. Heritage) and blackberry (cv. Thornfree).European Food Research and Technology, 223(4), 517–532.
Sterling, C. (1968). Effect of low temperature on structure and firmness of appletissue. Journal of Food Science, 33(6), 577–580.
Thibault, J. F. (1979). Automatisation du dosage des substances pectiques par laméthode au méta-hydroxydiphenyl. Lebensmittel-Wissenschaft und-Technologie,12, 247–251.
Tregunno, N. B., & Goff, H. D. (1996). Osmodehydrofreezing of apples: Structural andtextural effects. Food Research International, 29(5–6), 471–479.
Waldron, K. W., Smith, A. C., Parr, A. J., Ng, A., & Parker, M. L. (1997). Newapproaches to understanding and controlling cell separation in relation to fruitand vegetable texture. Trends in Food Science and Technology, 8(7), 213–221.
Zhang, M., Duan, Z.-H., Zhang, J.-F., & Peng, J. (2004). Effects of freezing conditionson quality of areca fruits. Journal of Food Engineering, 61(3), 393–397.
Zykwinska, A. W., Ralet, M. C. J., Garnier, C. D., & Thibault, J. F. J. (2005). Evidence forin vitro binding of pectin side chains to cellulose. Plant Physiology, 139(1),397–407.
Related Documents