DISSERTATION Titel der Dissertation Effekte des Klimawandels auf alpine Vegetation: Artenviel- falt, Alter der einzelnen Individuen, Methoden zur Datener- hebung und ein Transplantationsexperiment angestrebter akademischer Grad Doktorin der Naturwissenschaften (Dr. rer. nat.) Verfasserin / Verfasser: Barbara Friedmann geb. Holzinger Matrikel-Nummer: 0347977 Dissertationsgebiet (lt. Stu- dienblatt): Ökologie Betreuerin / Betreuer: o.Univ.-Prof. Mag. Dr. Georg Grabherr Wien, im Dezember 2009 Formular Nr.: A.04

Welcome message from author
This document is posted to help you gain knowledge. Please leave a comment to let me know what you think about it! Share it to your friends and learn new things together.
Transcript
DISSERTATION
Titel der Dissertation
Effekte des Klimawandels auf alpine Vegetation: Artenviel-falt, Alter der einzelnen Individuen, Methoden zur Datener-
hebung und ein Transplantationsexperiment
angestrebter akademischer Grad
Doktorin der Naturwissenschaften (Dr. rer. nat.) Verfasserin / Verfasser: Barbara Friedmann geb. Holzinger
Matrikel-Nummer: 0347977
Dissertationsgebiet (lt. Stu-dienblatt):
Ökologie
Betreuerin / Betreuer: o.Univ.-Prof. Mag. Dr. Georg Grabherr
Wien, im Dezember 2009
Formular Nr.: A.04

Effects of climate change on alpine vegetation: species richness, age of individual plants, transplantation experiment
and observation methods
Effekte des Klimawandels auf alpine Vegetation: Artenvielfalt, Alter der einzelnen Individuen, ein Transplantationsexperiment und
Methoden der Datenerhebung
Dissertation
To attain the degree of Doctor rerum naturalium at the faculty of Life Sciences at the University of Vienna
Zur Erlangung des akademischen Grades Doktor der Naturwissenschaften
an der Fakultät für Lebenswissenschaften der Universität Wien
von Barbara Friedmann geb. Holzinger
bei o.Univ.-Prof. Mag. Dr. Georg Grabherr
Wien, Dezember 2009

We do not inherit the Earth from our Ancestors,
we borrow it from our Children.
Native American Proverb

Table of contents
Abstract (English)......................................................................................................................1 Abstract (Deutsch).....................................................................................................................2 Summary (English)....................................................................................................................3 Zusammenfassung (Deutsch).....................................................................................................5 Introduction................................................................................................................................7
Climate change...............................................................................................................7 Public perception and oinion..........................................................................................7 Scientific community......................................................................................................9 Europe and the Alps........................................................................................................9 Focus of this thesis........................................................................................................10 Vegetation studies in alpine environments....................................................................10 Methodological aspects….............................................................................................11 References of introduction............................................................................................13
Paper 1- Changes in plant species richness over the last century in the eastern Swiss Alps: elevational gradient, bedrock effects and migration rates.........................................................16 Paper 2 - Comparison of growth parameters in different altitudes and methodological aspects of age measurements of three alpine herbaceous species.........................................................35 Paper 3 - What happens when alpine plants are exposed to a lowland climate?......................49 Paper 4 - Suitability of three methods for long-term monitoring of alpine vegetation.............64 Acknowledgements...................................................................................................................81 Curriculum Vitae (English).......................................................................................................82 Lebenslauf (German)................................................................................................................84

1
Abstract (English)
Different aspects of climate change effects on alpine vegetation are explored in four
detailed studies. First, species richness on ten out of twelve mountains in SE-Switzerland
has increased in the past century. Calculated migration rates of species on these mountains
suggest that most species have migrated upwards at an average rate of 14m per decade.
Second, three of those species that are considered as potential migrant species were
carefully studied by determining the age of individuals using herbchronology in
populations in high altitudes and comparing them to low altitude ones. No difference
between high and low altitude populations were found in terms of age, root growth rate and
root diameter. It was tested if herbchronology could be avoided in future studies as it is a
very destructive technique, by comparing age and root diameter. The fits were satisfactory,
so it was concluded that age could be predicted by measuring root diameter. In the third
study, a transplantation experiment was conducted, where blocks containing high alpine
species were grown in the gardens of the University of Vienna and observed over the
course of four years. Most individuals increased in size which led to an increased
competitive pressure. Changes in the size of individuals could not be attributed to certain
species. This points out the limitations of trying to predict the reaction of a particular
species in increasing temperatures. The fourth study focused on methods that are useful for
long-term observation of high altitude vegetation, especially for vegetation cover
determination. It was found that visual estimation is most suitable, effective and in that
superior to the point-quadrat method, but study question and aim always need to be kept in
mind.

2
Abstract (Deutsch)
Der Effekt des Klimawandels auf die alpine Vegetation wird in vier detaillierten Studien
erörtert. Zunächst wurde auf zehn von zwölf Bergen der Südost-Schweiz eine erhöhte
Artenanzahl im Vergleich mit dem letzten Jahrhundert gefunden. Eine Analyse von
Migrationsraten zeigte für den Großteil der dort erhobenen Arten ein Höhersteigen mit
einer Durchschnittsgeschwindigkeit von 14m pro Jahrzehnt. In der zweiten Studie wurde
mit Hilfe der Herbchronologie, die das Alter bei Kräutern anhand von Jahresringen in der
Wurzel feststellen kann, der Frage nachgegangen, ob potentielle Migrantenarten in höheren
Lagen bereits zu einer Verjüngung der Populationen beitragen im Vergleich zu niedrigeren
Lagen. Es wurden keine Unterschiede gefunden, weder im Alter noch im Wurzelwachstum
oder des Wurzeldurchmessers. Die Messung des Wurzelumfangs konnte als sinnvolle und
zielführende Alternative zur Herbchronologie für die Altersfeststellung von Kräutern
bestätigt werden. In der dritten Studie wurden einige Ziegel mit alpinen Arten nach Wien
transplantiert, um sie vier Jahre lang zu beobachten. Es wurden bei den meisten Arten
gesteigertes Wachstum beobachtet, was zu unterschiedlichen Konkurrenzsituationen
führte. Konkurrenzbedingte Zu- oder Abnahmen von Idividuengrößen konnte nicht
bestimmten Arten zugeordnet werden. Das Experiment zeigte, dass sich die Strukturen der
bestehenden Vegetation unter wärmeren Bedingungen oftmals überraschend ändern
können, und dass Vorraussagungen auf Basis des aktuellen Verhaltens womöglich
irreführend sind. In der vierten Studie wurden Methoden zur Vegetationserfassung, im
speziellen der Deckung, auf ihre Tauglichkeit für die Langzeitbeobachtung von
Hochgebirgsvegetation verglichen. Die visuelle Deckungsschätzung wurde für besser
befunden als die Punkt-Quadrat Methode, da sie bei hohen und besonders bei niedrigen
Deckungen einsetzbar ist, wobei Ziel und Aufgabe der jeweiligen Studie berücksichtigt
werden müssen.

3
Summary (English)
This work comprises four scientific papers, some of which have been published and others
submitted or in preparation to be submitted to the international community. Three of them
address different aspects of the phenomenon of climate change and its impacts in alpine
environments, and one addresses the methodological issue of vegetation sampling in those
habitats.
The first paper deals with a few available long-term studies comprising lists of plant
species and their elevations, dating back to 1885, in the Grisons of Switzerland. Summits
were revisited and complete lists of vascular plant species were collected on each of the 12
summits. On most mountains, species richness increased at an average rate of 11 % per
decade of historical species number. Two thirds of all species migrated uphill at rates up to
14 altitudinal meters per decade. Several detailed analyses showed that some families and
dispersal methods were more prone to migration than others. Summits with carbonate
bedrock had more migration than those free of carbonates. Contrary to the hypothesis, it
was not found that the alpine-nival ecotone has more species number increase than other
elevational zones.
Following up on this study, we tested three alpine species on their migration behaviour in
the last years. After testing herbchronology, a dating method for herbivorous species, on 24
alpine species, three species were found to be suitable, as they are very common and
potential migrators. The hypothesis we tested was that due to migratory behaviour,
individuals making up high altitude populations should be younger than those of low
altitude populations. The results, however, showed that the populations of Anthyllis
vulneraria subsp. vulneraria, Minuartia gerardii and Trifolium pallescens investigated in
both high and low altitudes did not differ in terms of age. Similarly, root growth rates and
root diameter were the same in high and low altitudes. Herbchronology is very destructive;
it involves rooting out the whole plant in order to cut the root. Therefore, the usefulness of
diameter (circumference) measurements for age determination purposes was investigated
and found to be suitable.
As a second follow-up of the first study in Switzerland, some ten blocks of alpine plants
including their soil were brought to the Vienna lowlands and observed for the changes that
take place after such a drastic change of environment and especially temperature. All
species increased in size and growth rate, some were found to even germinate outside the
blocks on soil, while others did not adapt as fast and decreased in cover or even
disappeared. The study showed very clearly that the reaction of species differ depending on

4
the competitors. It should be followed up by more detailed studies of the species under
question or of interest.
The forth paper compared three vegetation sampling methods for their suitability in high
alpine environments. Special attention was paid to their usefulness and effectiveness for
long-term monitoring projects with the special requirements of being cheap, quick and able
to produce quality data. It was found that visual estimation, although often criticised, is the
method that produces the required data better than the point-framing method, often
regarded as more objective and therefore better for long-term projects with changes of
observers over the years being inevitable.

5
Zusammenfassung (Deutsch)
Die vorliegende Dissertation besteht aus vier wissenschaftlichen Arbeiten, die entweder
bereits publiziert sind, bei internationalen Journalen zur Begutachtung und Publikation
eingereicht wurden oder dafür vorbereitet werden. Drei davon beschäftigten sich mit der
Auswirkung des Klimawandels auf alpine Vegetation im weitesten Sinne, während der
letzte Artikel auf Methoden zur Erfassung der Vegetation in alpinen Höhenlagen eingeht
und ihre Tauglichkeit für Langzeitstudien prüft.
In der ersten Arbeit wurden 12 Gipfel im schweizerischen Engadin auf Veränderungen in
den letzten 100 Jahren bezüglich Artenvielfalt untersucht. Artenzahlen stiegen um 11% pro
Dekade, und die Mehrheit der Arten wanderte bergauf mit einer Geschwindigkeit von bis
zu 1,4 m pro Jahr. Arten mit Windverbreitung sowie früh- und spätblühende zeigten mehr
Wanderlust als andere. Man konnte auch Unterschiede im Substrat feststellen, das heißt es
gab mehr Wanderer auf Kalkgestein als auf Silikat. Die Hypothese, dass der alpin-nivale
Ökoton mehr Artenzahlveränderungen aufweist als die umliegenden Höhenzonen, konnte
nicht bestätigt werden.
Die Erkenntnisse dieser Arbeit waren ausschlaggebend für zwei weitere Arbeiten, die im
Folgenden beschrieben werden.
Die Herbchronologie-arbeit stellte sich im Wesentlichen zwei Fragen: Angenommen die
meisten Arten wandern nach oben, dann sollten die höheren Populationen jünger sein als
die weiter unten: kann das bestätigt werden? Die Herbchonologie ist eine relativ neue, aber
auch sehr destruktive Methode der Altersbestimmung, da es mit dem Ausreißen der
gesamten Pflanze einhergeht: gibt es Alternativen für die Altersbestimmung von krautigen
Hochgebirgspflanzen? Die Ergebnisse der Studie zeigten, dass es keinen Unterschied im
Alter zwischen höheren und niedrigeren Populationen gab, somit wurde die
Ausgangshypothese nicht bestätigt. Ebenso sind die Wachstumsgeschwindigkeit und der
Wurzeldurchmesser gleich in hohen und tiefen Lagen. Die Bestimmung des Alters
aufgrund von Stammumfangmessungen erwies sich als relativ genau, wodurch weitere
Studien von Populationsstrukturen im alpinen Gelände vor allem in Bezug auf das Alter
der Individuen ermöglicht werden.
Die zweite Arbeit, die im direkten Zusammenhang mit der einleitenden Arbeit in der
Schweiz stand, war ein Transplantationsversuch, indem alpine Pflanzen über 4 Jahre im
Wiener Becken beobachtet wurden. Es wurden folgende Erkenntnisse gewonnen: Die
Mehrzahl der Arten zeigten gesteigertes Wachstum bis zum Doppelten ihrer Größe, ebenso
waren Konkurrenzeffekte offensichtlich. Zwei Arten siedelten sich außerhalb der
Versuchsziegel an. Bryophyten konnten vor allem in den Wintermonaten über die andere

6
Arten hinauswachsen. Dieses Experiment zeigte deutlich, dass sich die Strukturen der
bestehenden Vegetation unter wärmeren Bedingungen oftmals überraschend ändern
können, und dass Vorraussagungen auf Basis des aktuellen Verhaltens womöglich
irreführend sind.
Die vierte Arbeit beschäftigte sich mit der unterschiedlichen Tauglichkeit von drei
verschiedenen Methoden zur Datenaufnahme im alpinen und subnivalen Gelände für
Langzeitstudien. Punkt-Quadrat Methode, Visuelle Schätzung und Frequenzaufnahmen
wurden verglichen. Es wurde befunden, dass die Punkt-Quadrat Methode zwar objektiv
und bei höheren Deckungen auch relativ genau und vergleichbar ist, jedoch bei seltenen
Arten versagt. Im Vergleich dazu ist die visuelle Deckungsschätzung zwar oft kritisiert,
jedoch im Falle der wenig deckenden Vegetation im subalpinen Gelände, geeigneter.
Frequenzaufnahmen brauchen die meiste Zeit, jedoch sind sie am präzisesten für die
Aufnahme aller Arten. Eine Kombination aus visueller Schätzung und Frequenzaufnahmen
resultiert also in der besten Datenqualität.

7 Introduction
Introduction
Climate change
The increase of temperature as a consequence of human-induced, or at least -enhanced,
global warming and its implications have been subject to an enormous number of studies in
the past years (Grabherr et al., 1994; Walther et al., 2002; Parmesan and Yohe, 2003;
Alcamo et al., 2007). Temperature has been found to have increased by 0.6C in the past
100 years (Walther et al., 2002). Ecosystems of all major life zones from the Arctic to the
Tropics, and many different life forms, from butterflies (Roy and Sparks, 2000) to alpine
plants (Grabherr et al., 1994), have been under investigation in the attempt to predict
and/or observe possible impacts caused by a changing climate. To date, there are different
and to some extent controversial hypotheses on possible responses of aquatic and terrestrial
ecosystems and their animal and plant composition to changing temperature regimes. The
majority of observational studies, however, suggest an already ongoing impact caused by
climate warming in different biomes: Parmesan (2003) summarises a large number of
studies on different organisms and finds overwhelming evidence that the majority (80%) of
the studied organisms respond to climate change in the direction predicted, which means
earlier spring events, shift of range distribution upwards and northwards, new colonisation
events and decreasing range size of some arctic species. Earlier spring events at an average
rate of 2.3 days per decade were observed in over 173 species. This includes, for example,
the earlier arrival of migrant birds (Forchhammer et al., 1998) and earlier flowering of
plants (Post and Stenseth, 1999). Maximum range shifts from 200 km for butterflies
(Parmesan et al., 1999) to 1,000 km for marine copepods (Sagarin et al., 1999) over the
past 40 years have been observed. New colonisation events have been observed for
example in tree-line shifts (Payette et al., 1989; Moiseev and Shiyatov, 2003) and bird
distribution changes (Thomas and Lennon, 1999). Invasions of introduced plants spreading
from gardens to the countryside are another common example (Dukes and Mooney, 1999;
Walther, 2000). Arctic fox species have declined in their range size (Hersteinsson and
MacDonald, 1992). The combination of these abundance shifts with increases and
decreases in range result in rapid community reorganisations, because species composition
and the dynamics of ecosystems are also changing (Walther et al., 2002).
Public perception and opinion
The general public has been confronted with possible worst-case scenarios (including
newspaper articles or Hollywood movies such as “The Day After Tomorrow”) as well as
proposals for actions that can be taken by individuals to reduce the increase of

Introduction 8
temperatures (see ecological footprint inspired by Wackernagel and Rees, 1996, or offset
emissions for flight travels, etc.). Some parts of the world have already been struck by
various extreme weather events: hurricanes (Mexico Sept 2009), typhoons
(Philippines/Vietnam Sept 2009) and flooding (southern USA Sept 2009), all of which are
predicted to increase in their intensity and frequency. It is well known that the inhabitants
of the developing world are and will be suffering more in the short term due to the effects
of global warming, although it is the developed world which is mostly responsible (e.g.
CARE Österreich, 2009).
The Kyoto protocol of the UNFCCC (The United Nations Framework Convention on
Climate Change) of 1997 aimed at reducing and combating the human contributions to the
progress of global warming. It contained the binding commitment to decrease greenhouse
gas emissions as well as the possibility of emission trading and other measures aimed at
reducing human-induced climate change to a “level that would prevent dangerous
anthropogenic interference with the climate system” (UNFCCC, 1997). As the targets have
not been met by all countries (including Austria, which is far from reaching the target of
decreasing emissions by 13%, having instead increased them by 15%) and greenhouse
gases are continuing to rise, the Kyoto protocol will be replaced and succeeded by a
hopefully more powerful document and a synthesis of efforts by all major players in the
worldwide economy in Copenhagen in December 2009. With the change of attitude on the
part of the USA (which as the only industrialised country had not ratified the Kyoto
protocol) that came about through the new President and Nobel Peace Price Winner Barak
Obama - “I don't think I have to emphasise that climate change is one of the defining
challenges of our time. The science is clear and conclusive and the impacts can no longer
be ignored.” (BBC, 2009) – there is hope that even the USA will join the efforts to reduce
the damage.
How interested, however, is the general public in this matter? Surveys have shown that
climate change is indeed seen as a problem by a majority of Europeans (ECRA, 2009).
Scientific surveys found that the public both in the United States and in other regions,
“perceives substantial threat from global warming, but the threat levels tend to be
significantly less than those from other environmental and social problems” (Bord et al.,
1998; Poortinga and Pidgeon, 2003; quoted in Lowe et al., 2006). Also, the obligation to
actually take action is often seen as the politicians’ responsibility (Lorenzoni, 2003),
although effective measures can only and must be taken by the individual. However,
politicians need to set incentives and make appropriate action plans otherwise the
individual tends to blame others rather than take responsibility himself. The following

9 Introduction
quote puts it succinctly: “The South blames the North, cyclists blame drivers, activists
blame oil companies and almost everyone blames George Bush” (Marshall and Lynas,
2003). Lowe et al. (2006) report public reactions to the movie “The Day After Tomorrow”
and conclude that the lay audience is confused about the actual scientific basis, the causes,
and the action that can be taken by each individual; this is worrying. Other survey findings
are also disconcerting: public concern about global warming correlates negatively with
factors that should suggest high, not low, concern: wealth, responsibility (CO2 emissions),
and direct future threats (see Sandvik, 2008). Also, individual willingness to “pay” and
sacrifice is very low (Bord et al., 1998), although the only way to change or reduce the
risks is to incorporate the entire worldwide community.
Scientific community
It is the responsibility and moral obligation (Sandvik, 2008) of the scientific community to
be aware of the confusion and respond accordingly with more “down-to-earth” talks and
communication to the general public on the topic of climate change (see also Lowe et al.,
2006; Sandvik, 2008). Science has been aware of the phenomenon and has warned of many
possible consequences since long before the public has realised and been confronted with
some of the findings. In fact, the first mentions of global warming can already be found in
the 1970’s, including notions about sea-level rise and temperature increase (Benton, 1970;
Kopec, 1971). The overwhelming evidence and observations of global temperature
increase and its consequences have not stopped sceptics and critics presenting their view;
in fact, even popular science sometimes denies or at least questions the phenomenon (e.g.
Michael Crichton’s novel State of fear). Lowe 2006 explains that the media has tried to
provide a balanced view of both supporters and critics, although in reality supporters are a
far larger group, thus simulating to the general public a balanced debate that does not exist.
A recent poll in the US showed that the public views the disagreement among scientists as
larger than it actually is: 35% of people thought scientists do not agree the earth is getting
warmer due to human activity, while in fact 84% of scientists do believe that this is the
case (Pew Research Center, 2009).
This majority that agree with the theory of human influence on the world’s climate have
shown their agreement by contributing to the IPCC (International Panel of Climate
Change) and by approaching political leaders and sending out warnings (e.g. “world
scientists call for action” 1997, Union of Concerned Scientist).

Introduction 10
Europe and the Alps
In Europe, the IPCC (International Panel of Climate Change) predicts a decrease in annual
precipitation and more summer heat for the south, loss of coastal area due to sea-level rise,
an increase of climate-related hazards like flooding, an increase in precipitation and forests
in the North and difficulties for organisms to adapt in all areas (Alcamo et al., 2007). The
organisms studied range from marine organisms and butterflies (Thomas and Lennon,
1999; Thomas et al., 2001) to alpine animal (Hughes, 2000) and alpine plant species
(Grabherr et al., 1994). In plant populations, the IPCC reports the overall trend to be
towards “increased growing season, earlier phenology and shifts of species distributions
towards higher elevations (Grabherr et al., 1994; Kullman, 2002; Körner, 2003; Egli et al.,
2004; Sandvik, 2008).”
This thesis presents another piece of the puzzle, looking at impacts of climate change in
high-mountain environments of the Alps. Particular attention was paid to plant responses.
Why the alpine environment? The reason why alpine and polar regions are popular when it
comes to studying the effects of climatic change is that these ecosystems are adapted to
existence at low temperature conditions and short growing seasons (summers) and that
they are controlled mostly by temperatures and precipitation, i.e. the abiotic environment
(Sakai and Larcher, 1987; Kammer and Mohl, 2002; Körner, 2003). Therefore, changes in
these factors should bring about a sensitive and above all recordable reaction in those
environments. A high percentage of endemic and unique species can be found in alpine
regions, e.g. in Europe, where 20% of the continent’s species richness in native vascular
plants is found in areas above the timberline, which cover only 3% of Europe (Väre et al.,
2003). Also, most people’s fresh water supply originates in alpine areas, making them
critical for human survival. In fact, more than half of the world’s population depends on
water stored in mountain regions (University of Innsbruck, 2009). Mountain ecosystems all
over the world have experienced and are likely to experience more enhanced and rapid
warming than lowland areas in comparable latitudes (Theurillat and Guisan, 2001; Halloy
and Mark, 2003; Pickering and Armstrong, 2003). Another very important feature of alpine
environments is that most of the earth’s mountain regions are not permanently inhabited by
humans and only restrictively used. Therefore, they are relatively undisturbed, which in
turn means that the observed changes are very likely to be due to changes in physical
factors rather than changes in human land use activities.

11 Introduction
Focus of this thesis
Vegetation studies in alpine environments
Several studies have focused on the change of species ranges in alpine environments at
different elevation belts (Grabherr et al., 1994; Gottfried et al., 1999; Kullman, 2002 etc.;
for an overview see Grabherr et al., submitted). The transition zone between the closed
upper alpine grassland belt and the scarce and scattered vegetation of the nival belt (i.e. the
alpine-nival ecotone) is considered to be particularly sensitive to effects climate warming.
One of the attached studies (Paper 1, Changes in species number) attempted to answer
the questions of (1) whether the number of species has increased or decreased in this
alpine-nival ecotone and (2) the vertical magnitude of species migration per decade. The
species composition on twelve summits in the Alps was surveyed and compared to
historical findings, some of them over 100 years old. In the course of mapping the
vegetation on the summits, species were found to be different in their migration abilities.
Following up on the evidence of increasing species numbers on the resurveyed summits, a
further focus was taken on the age structure of selected migratory species. Age and
longevity of migratory alpine species may be of particular relevance for the interpretation
of warming-induced population dynamics. Non-woody plants, representing the majority of
alpine species, were used to test herbchronology techniques and root diameter
measurements for the suitability for age measurements. (Paper 2, Herbchronology). As
herbchronology is destructive and thus does not allow a continued observation of the same
individuals, we questioned if non-destructive simple root diameter measurements would
yield consistent results with herbchronology.
Plant species have also in other studies been divided into “winners” and “losers” according
to the observed changes that have taken place or are predicted to take place (see e.g.
Erschbamer, 2007; Schoeb et al., 2009). Migrating species (often also termed invader
species) that move upwards over the course of only a few decades and/or those that adapt
quickly in certain environments are the “winners.” Those species found to stick to their
habitats without expanding their ranges, instead being invaded and decreasing in their
range, are the “losers”. This simple catagorisation suggests that either group of species
reacts consistently and predictably. In order to examine whether this idea holds true, one
experiment subjected related plant assemblages to an extreme change of temperatures and
the reactions of the species were recorded. The outcome did not conform to previous ideas
of certain reactions being attributable to certain species (Paper 3, Transplantation
experiment).

Introduction 12
Methodological aspects
Alpine environments are harsh not only for plants, but also for researchers. As mentioned,
there are a few strong arguments that support the advantages of research in remote and
uninhabited high mountain areas, such as the influence of the abiotic environment in
shaping the communities or the aforementioned relatively small anthropogenic importance.
However, there are of course a few drawbacks, such as the harsh and often unpredictable
working conditions and, sometimes, a difficult access to the monitoring sites. A careful
methodological planning and time management are crucial, and additionally, an effective
quality control of recording methods, particularly for long-term monitoring studies. The
most suitable method, of course, will depend on the particular type of study aim and study
question. Planning of long-term field studies should question the available methods in
terms of data quality, time effort and equipment costs. How do the methods compare?
Vegetation observation often incorporates counts of species number in a particular area.
Species count alone does not yield results over short periods of time; therefore more
quantitative measurements such as species cover or abundance should also be considered.
Vegetation and species cover is recorded by means of various more or less criticised
methods. Paper 4 (Methods) of this thesis focuses on the usefulness of three different
methods for vegetation recording in scattered high alpine to nival vegetation.

13 Introduction
References of introduction
Alcamo, J., Moreno, J. M., Nováky, B., Bindi, M., Corobov, R., Devoy, R. J. N.,
Giannakopoulos, C., Martin, E., Olesen, J. E., and Shvidenko, A., 2007: Europe. In Parry, M. L., Canziani, O. F., Palutikof, J. P., van der Linden, P. J., and Hanson, C. E. (eds.), Climate Change 2007: Impacts, Adaptation and Vulnerability. Contribution of Working Group II to the Fourth Assessment Report of the Intergovernmental Panel on Climate Change. Cambridge, UK: Cambridge University Press, 541-580.
BBC, 2009: World powers accept warming limit. URL http://news.bbc.co.uk/2/hi/europe/8142825.stm
Benton, G. S., 1970: Carbon dioxide and its role in climate change. Proceedings of the National Academy of Sciences of the United States of America, 67: 898-.
Bord, R. J., Fischer, A., and O’Connor, R. E., 1998: Public Perceptions of Global Warming: United States and International Perspectives. Climate Research, 11: 75-84.
CARE Österreich, 2009: Klimawandel. URL http://www.care.at/de/projekte/klimawandel.html
Dukes, J. S. and Mooney, H. A., 1999: Does global change increase the success of biological invaders? Trends in Ecology & Evolution, 14: 135-139.
ECRA, 2009: Umfrage: Klimawandel für EU-Bürger großes Problem. URL http://www.ecra.at/service/news/3485958782/
Egli, M., Hitz, C., Fitze, P., and Mirabella, A., 2004: Experimental determination of climate change effects on above ground and below-ground organic matter in alpine grasslands by translocation of soil cores. J. Plant Nutr. Soil Sci., 167: 457-470.
Erschbamer, B., 2007: Winners and losers of climate change in a central alpine glacier foreland. Arctic Antarctic and Alpine Research, 39: 237-244.
Forchhammer, M. C., Post, E., and Stenseth, N. C., 1998: Breeding phenology and climate. Nature, 391: 29±30.
Gottfried, M., Pauli, H., Reiter, K., and Grabherr, G., 1999: A fine-scaled predictive model for changes in species distribution patterns of high mountain plants induced by climate warming. Diversity and Distributions, 5: 241-251.
Grabherr, G., Gottfried, M., and Pauli, H., 1994: Climate effects on mountain plants. Nature, 369: 448-448.
Grabherr, G., Gottfried, M., and Pauli, H., submitted: Climate change impacts in alpine environments. Geography Compass / Biogeography, submitted Sept. 24 2009.
Halloy, S. R. P. and Mark, A. F., 2003: Climate-change effects on alpine plant biodiversity: A New Zealand perspective on quantifying the threat. Arctic Antarctic and Alpine Research, 35: 248-254.
Hersteinsson, P. and MacDonald, D. W., 1992: Interspecific competition and the geographical distribution of Red and Arctic foxes Vulpes vulpes and Alopex lagopus. Oikos, 64: 505-515.
Hughes, L., 2000: Biological consequences of global warming: is the signal already apparent? Trends in Ecology & Evolution, 15: 56-61.
Kammer, P. A. and Mohl, A., 2002: Factors controlling species richness in alpine plant communities: an assessment of the importance of stress and disturbance. Arctic Antarct Alpine Res, 34: 398-407.
Kopec, R. J., 1971: Climate Change and the impact of a maximum sea level on coastal settlement. Global Journal of Geography, 70: 541-550.
Körner, C., 2003: Alpine plant life: functional plant ecology of high mountain ecosystems. 2nd ed. Berlin: Springer, 344 pp.

Introduction 14
Kullman, L., 2002: Rapid recent range-margin rise of tree and shrub species in the Swedish Scandes. Journal of Ecology, 90: 68-77.
Lorenzoni, I., 2003: Present Choices, Future Climates: A Cross-cultural Study of Perceptions in Italy and in the UK. Doctoral Thesis, School of Environmental Sciences, University of East Anglia, UK. Pages pp.
Lowe, T., Brown, K., Dessai, S., de França Doria, M., Haynes, K., and Vincent, K., 2006: Does tomorrow ever come? Disaster narrative and public perceptions of climate change. Public Understanding of Science, 15: 435ff.
Marshall, G. and Lynas, M., 2003: Why We Don’t Give a Damn, New Statesman. London, UK, 18-20.
Moiseev, P. A. and Shiyatov, S. G., 2003: Vegetation dynamics at the treeline ecotone in the Ural highlands, Russia. In Nagy, L., Grabherr, G., Körner, C., and Thompson, D. B. A. (eds.), Alpine biodiversity in Europe - A Europe-wide assessment of biological richness and change. Berlin: Springer, 423-435.
Parmesan, C., Ryrholm, N., Stefanescu, C., Hill, J. K., Thomas, C. D., Descimon, H., Huntley, B., Kaila, L., Kullberg, J., Tammaru, T., Tennent, W. J., Thomas, J. A., and Warren, M., 1999: Poleward shifts in geographical ranges of butterfly species associated with regional warming. Nature, 399: 579-583.
Parmesan, C. and Yohe, G., 2003: A globally coherent fingerprint of climate change impacts across natural systems. Nature, 421: 37-42.
Payette, S., Filion, L., Delwaide, A., and Bégin, C., 1989: Reconstruction of tree-line vegetation response to longterm climate change. Nature, 341: 429-432.
Pew Research Center, 2009: Public Praises Science; Scientists Fault Public, Media - Scientific Achievements Less Prominent Than a Decade Ago. URL http://people-press.org/report/528/
Pickering, C. M. and Armstrong, T., 2003: Potential impact of climate change on plant communities in the Kosciuszko alpine zone. Victorian Naturalist, 120: 263-272.
Poortinga, W. and Pidgeon, N., 2003: Public Perceptions of Risk, Science and Governance: Main Findings of a British Survey of Five Risk Cases. University of East Anglia and MORI, Norwich, UK.
Post, E. and Stenseth, N. C., 1999: Climatic variability, plant phenology, and northern ungulates. Ecology, 80: 1322±1339.
Roy, D. B. and Sparks, T. H., 2000: Phenology of British butterflies and climate change. Glob. Change Biol., 6: 407-416.
Sagarin, R., Barry, J. P., Gilman, S. E., and Baxter, C. H., 1999: Climate-related change in an intertidal community over short and long time scales. Ecological Monographs, 69: 465-490.
Sakai, A. and Larcher, W., 1987: Frost Survival of Plants. Berlin: Springer, 321 pp. Sandvik, H., 2008: Public concern over global warming correlates negatively with national
wealth. Climatic Change, 90: 333-341. Schoeb, C., Kammer, P. M., Choler, P., and Veit, H., 2009: Small-scale plant species
distribution in snowbeds and its sensitivity to climate change. Plant Ecology, 200: 91-104.
Theurillat, J.-P. and Guisan, A., 2001: Potential impact of climate change on vegetation in the European Alps: A review. Climatic Change, 50: 77-109.
Thomas, C. D. and Lennon, J. J., 1999: Birds extend their ranges northwards. Nature, 399: 213.
Thomas, C. D., Bodsworth, E. J., Wilson, R. J., Simmons, A. D., Davies, Z. G., Musche, M., and Conradt, L., 2001: Ecological and evolutionary processes at expanding range margins. Nature, 411: 577-581.
UNFCCC, 1997: The Kyoto Protocol. URL http://unfccc.int/essential_background/convention/background/items/1353.php

15 Introduction
University of Innsbruck, 2009: climate change. URL http://www.uibk.ac.at/ecology/forschung/klimawandel.html
Väre, H., Lampinen, R., Humphries, C., and Williams, P., 2003: Taxonomic diversity of vascular plants in the European alpine areas. In Nagy, L., Grabherr, G., Körner, C., and Thompson, D. B. A. (eds.), Alpine Biodiversity in Europe - A Europe-wide Assessment of Biological Richness and Change. Berlin: Springer, 133-148.
Wackernagel, M. and Rees, W., 1996: Our Ecological Footprint: Reducing Human Impact on the Earth. Gabriela Island, BC: New Society Publishers.
Walther, G.-R., 2000: Climatic forcing on the dispersal of exotic species. Phytocoenologia, 30: 409-430.
Walther, G. R., Post, E., Convey, P., Menzel, A., Parmesan, C., Beebee, T. J. C., Fromentin, J. M., Hoegh-Guldberg, O., and Bairlein, F., 2002: Ecological responses to recent climate change. Nature, 416: 389-395.

Paper 1
Changes in plant species richness over the last century in the eastern Swiss Alps: elevational gradient, bedrock effects and
migration rates
Barbara Holzinger, Karl Hülber, Martin Camenisch, Georg Grabherr
Manuscript published in Plant Ecology (2008) 195: 179-196 doi: 10.1007/s11258-007-9314-9
16

Changes in plant species richness over the last century in theeastern Swiss Alps: elevational gradient, bedrock effects andmigration rates
Barbara Holzinger Æ Karl Hulber ÆMartin Camenisch Æ Georg Grabherr
Received: 16 October 2006 / Accepted: 20 May 2007 / Published online: 24 June 2007
� Springer Science+Business Media B.V. 2007
Abstract Areas of 2,800–3,000 m a.s.l. represent
the alpine-nival ecotone in the Alps. This transition
zone connecting the closed swards of the alpine belt
and the scattered vegetation of the nival belt may
show particularly strong climate warming driven
fluctuations in plant species richness compared to
the nival belt. To test this hypothesis, 12 summits
within this range were investigated in the canton of
Grisons, Switzerland in 2004. Complete lists of
vascular plant species consisting of 5–70 species
were collected on each summit and the elevation of
the uppermost occurrence of each species was
recorded. These data were compared to historical
records over 120 years in age. Within this time,
vascular plant species richness increased by 11% per
decade on summits in the alpine-nival ecotone.
Despite this considerable change, a comparison with
nival summits did not support the hypothesis that
species richness increase at the alpine-nival ecotone
is higher than in the nival belt. A general trend of
upward migration in the range of several metres per
decade could be observed. Anemochorous species
were more often found to be migrating than
zoochorous or autochorous species and migration
was higher on calcareous than on siliceous bedrock.
A comparison between the summits with the adja-
cent slopes in our study revealed that changes in
species number could be used as an indicator for
climate-induced changes—if at all—only for the
narrow summit areas.
Keywords Alpine-nival ecotone � Climate change �Functional species groups � Migration rates � Species
richness change � Switzerland
Introduction
Climate-induced vegetation change has been docu-
mented in various mountain regions (Walther et al.
2001) and for high-alpine assemblages in particular
(Keller et al. 2000; Theurillat and Guisan 2001;
Korner 2003). Temperature increase is considered to
be linked to the increased species richness found in
high altitudes (Hofer 1985; Grabherr et al. 2001;
Walther et al. 2005).
Alpine areas offer good opportunities for study-
ing the influence of climatic change on plant
migration, as plant life at high elevation is mostly
B. Holzinger (&) � K. Hulber � G. Grabherr
Department of Conservation Biology, Vegetation and
Landscape Ecology, Faculty of Life Sciences, University
of Vienna, Althanstrasse 14, 1090 Vienna, Austria
e-mail: [email protected]
K. Hulber
V.I.N.C.A.—Vienna Institute for Nature Conservation
and Analyses, Giessergasse 6/7, 1090 Vienna, Austria
M. Camenisch
Camenisch & Zahner, Giacomettistrasse 119, 7000 Chur,
Switzerland
123
Plant Ecol (2008) 195:179–196
DOI 10.1007/s11258-007-9314-9
Paper 1 - Changes in species richness 17

governed by abiotic factors like temperature and
snow fall, which are directly influenced by global
warming (Sakai and Larcher 1987; Kammer and
Mohl 2002; Korner 2003). These habitats are
therefore considered very sensitive to climatic
change (Theurillat and Guisan 2001). Furthermore,
anthropogenic impact that potentially masks climate
change related effects is low compared to lowland
regions.
In the Alps, the lower boundary of the alpine-nival
ecotone lies at approximately 2,800 m a.s.l (Gottfried
et al. 1998). This is the transition zone between the
alpine belt, dominated by closed dwarf shrub heath
and grassland swards, and the nival belt, character-
ised by scarce and scattered vegetation on rocks and
scree. Some studies suggest that this transition zone
might be characterised by larger increases in species
richness than adjacent belts (Grabherr et al. 1994;
Camenisch 2002; Walther et al. 2004). However, no
direct comparisons of changes in species richness
between the alpine-nival ecotone and the nival belt
have been made.
Reliable historical records of species richness on
mountain summits and uppermost occurrence of
species in the European Alps reach over 120 years
in age (Heer1885; Schibler 1898; Rubel 1912;
Braun-Blanquet 1913; Braun-Blanquet 1958). Com-
parisons with recent findings enable us to investigate
both species richness changes and altitudinal shifts
of species i.e. migration rates. To identify traits that
facilitate migration, species can be grouped accord-
ing to functional or taxonomic criteria. The specific
reaction of a group to past changes could potentially
indicate future behaviour of that same group.
Diaspore morphology, dispersal mode and dispersal
time affect the direction and distance of migration
(van der Pijl 1972; Muller-Schneider 1986), whilst
bedrock has an a priori impact on vegetation
patterns (Ellenberg et al. 1991; Grabherr 1997)
and species richness of habitats (Virtanen et al.
2003) and might therefore affect subsequent migra-
tion processes.
In our study, we addressed the following ques-
tions: Are there changes in species richness on high
mountain summits during the last century? Do these
changes depend on altitude, and are they linked to the
bedrock type? At what rate are species migrating?
Which taxonomic or functional groups show
Particularly strong migration abilities?
Material and methods
Study area and historical records
A total of 12 mountains between 2,844 and 3,006 m
were chosen in Grisons, Switzerland (see Table 1).
The selection of summits was based on the availabil-
ity of reliable historical data of acknowledged
botanists. Such records were available from Heer
(1885), Schibler (1898), Rubel (1912) and Braun-
Blanquet (1913, 1958). Heer, Schibler and Rubel
worked exclusively on the summit areas, from here
on defined as the uppermost 15 m. Braun-Blanquet
additionally included records about the accessible
areas from the summit down to 2,800 m along the
ascension path. Calcareous, siliceous and mixed
bedrock was covered by the selected summits.
Data collection
To enable comparisons, we re-visited the study areas
of historical investigations. On summit areas (SA), a
complete inventory of vascular plant species was
made. Additionally, moving down from the SA to
2,800 m, we compiled complete lists of vascular plant
species and recorded the altitude of the uppermost
individual of each species with an accuracy of 10 m.
We followed the ascension path of historical inves-
tigators as accurately as possible.
Data analysis
Summit area
Recent and historical species numbers were com-
pared by calculating the change in species richness
per decade (SCSA) for the summit area of each
mountain:
SCSA ¼ ðnrSA � nhSAÞ=dh
where nrSA is the recent number of species on SA,
nhSA is the historical number of species on SA, and dh
represents the number of decades since historical
investigation.
Additionally, the relative change in species rich-
ness was calculated as percentage change in species
richness per decade of historical species number
(pSCSA):
180 Plant Ecol (2008) 195:179–196
123
18 Paper 1 - Changes in species richness

Ta
ble
1D
escr
ipti
on
so
fin
ves
tig
ated
mo
un
tain
s
Mo
un
tain
Alt
itu
de
Su
bst
rate
Su
mm
itd
escr
ipti
on
Yea
r(h
ist)
Inv
esti
gat
or
(his
t)C
oo
rdin
ates
NC
oo
rdin
ates
E
Wei
ssfl
uh
28
44
calc
areo
us
sto
ny
,sc
ree
18
93
Sch
ible
r4
685
10
984
80
Piz
Pad
ella
28
56
calc
areo
us
stee
p,
sto
ny
,N
face
inac
cess
ible
;S
and
NW
stee
p,
bu
tac
cess
ible
;
freq
uen
ted
pea
k
18
35
Hee
r4
683
20
985
00
Sas
sC
orv
igli
a2
86
2ca
lcar
eou
sF
lat,
mea
do
w1
83
5H
eer
4683
10
984
80
Piz
Tsc
hu
ffer
29
16
mix
edca
lcar
eou
san
dsi
lice
ou
sp
arts
ver
y
ob
vio
us
on
pea
k
19
12
Rub
el4
682
90
1080
00
Piz
Alv
29
75
calc
areo
us
sto
ny
,m
any
dif
fere
nt
mic
roh
abit
ats
18
89
Rub
el4
682
70
1080
00
Las
So
urs
29
78
calc
areo
us
scre
e,st
on
y1
90
6R
ub
el4
683
00
985
60
Piz
Ch
atsc
hed
ers
29
86
sili
ceo
us
elo
ng
ated
pea
k,
Sfa
cew
ith
stri
ps
of
clo
sed
veg
etat
ion
19
07
Rub
el4
682
90
1080
10
Alp
lih
orn
30
06
calc
areo
us
stee
p,
sto
ny
,sc
ree
18
93
Sch
ible
r4
684
30
985
00
Aro
ser
Alp
lih
orn
28
42
sili
ceo
us
hal
f-o
pen
veg
etat
ion
cov
er,
Esp
ecie
s
rich
,W
mo
no
ton
ou
s
19
10
Bra
un
-Bla
nq
uet
4684
50
983
70
Par
pan
erR
oth
orn
28
99
sili
ceo
us
Ean
dN
face
inac
cess
ible
(to
o
stee
p).
Ver
yfr
equ
ente
dp
eak
,S
face
wit
hst
rip
so
fcl
ose
dv
eget
atio
n
19
10
Bra
un
-Bla
nq
uet
4684
50
983
60
Piz
Dai
nt
29
68
calc
areo
us
Nan
dW
face
sin
acce
ssib
le,
var
ied
mic
roh
abit
ats
on
Ean
dS
face
s.
Fre
qu
ente
dp
eak
19
20
Bra
un
-Bla
nq
uet
4683
80
1081
80
Aro
ser
Ro
tho
rn2
98
0m
ixed
hal
f-o
pen
veg
etat
ion
cov
er,
no
tv
ery
sto
ny
,ca
lcar
eou
san
dsi
lice
ou
sp
arts
19
02
Bra
un
-Bla
nq
uet
4684
50
983
70
Mo
un
tain
sum
mit
area
28
00
mas
lu
pw
ard
spec
ies
nu
mb
er
his
t
spec
ies
nu
mb
er
20
04
SC
SA
pS
CS
Asp
ecie
sn
um
ber
his
t
spec
ies
nu
mb
er
20
04
pS
C2800
Wei
ssfl
uh
12
37
2.3
18
.8
Piz
Pad
ella
28
40
0.7
2.5
Sas
sC
orv
igli
a2
37
02
.81
2.1
Piz
Tsc
hu
ffer
82
82
.22
7.2
Piz
Alv
14
50
3.1
22
.4
Las
So
urs
30
43
1.3
4.4
Piz
Ch
atsc
hed
ers
31
56
2.6
8.3
Plant Ecol (2008) 195:179–196 181
123
Paper 1 - Changes in species richness 19

pSCSA ¼ ðSCSA=nhSAÞ � 100
Data of this study was combined with the data set
collected by Grabherr et al. (2001). That study
compared complete recent vascular plant species lists
for 30 summits in the nival belt in adjacent areas of
eastern Switzerland and western Austria to historical
data to examine changes in species richness. Thus,
not only a geographical but an altitudinal extension
could be achieved. The calculations mentioned above
were applied to the combined data set (42 summits).
The dependence SCSA and pSCSA on altitude was
examined using linear regressions. Differences of
pSCSA between calcareous and siliceous bedrock
were calculated using a two-sided t-test.
Species groups
For the following calculations, only data from the 12
summits investigated for the present study were used.
All species found above 2,800 m a.s.l. (including the
SA) in the recent investigation of a mountain, but
absent from the SA of the respective summit in
historical data were considered as the pool of
potentially migrating species (species pool). Species
already present on the summit area in historical
investigations were excluded, as their migration
potential could not be estimated, because further
upward migration is impossible. Species present in
the summit area today but not in historical data were
classed as migrators on that mountain.
To identify traits facilitating migration, species were
merged into species groups considering functional traits
potentially relevant to migration or the taxonomic
status. The following groups with the respective
categories were used: taxonomy (plant family), dis-
persal mode (anemochores, zoochores, autochores),
dispersal timing (month in which dispersal begins) and
diaspore length (larger than or equal to and smaller than
the median (1.6 mm) over all species used). The data
were compiled from Muller-Schneider (1986), Fischer
et al.(1994) and Rothmaler (2002).
If a trait used to distinguish the categories of a
species group has no impact on the migration abilities
of species, the species composition of migrators
should be a random selection out of the species pool:
e.g. if the dispersal mode does not influence migra-
tion, the proportion of anemochorous migrators will
not statistically differ from the proportion of anem-Ta
ble
1co
nti
nu
ed
Mo
un
tain
sum
mit
area
28
00
mas
lu
pw
ard
spec
ies
nu
mb
erh
ist
spec
ies
nu
mb
er2
00
4S
CS
Ap
SC
SA
spec
ies
nu
mb
erh
ist
spec
ies
nu
mb
er2
00
4p
SC
2800
Alp
lih
orn
10
5�
0.5
�4
.5
Aro
ser
Alp
lih
orn
33
60
2.9
8.7
78
73
�0
.7
Par
pan
erR
oth
orn
28
28
0.0
0.0
89
70
�1
.7
Piz
Dai
nt
02
02
.4a
15
44
23
.0
Aro
ser
Ro
tho
rn1
13
42
.32
0.5
71
72
0.1
Av
erag
e(m
ean
±
stan
dar
der
ror)
19
±3
.13
9.2
±5
.21
.8±
0.3
10
.9±
3.0
63
.2±
16
.56
4.7
±6
.95
.1±
5.9
Su
mm
itar
eaw
asd
efin
edas
the
up
per
mo
st1
5al
titu
din
alm
etre
s;S
CS
Are
pre
sen
tsth
ech
ang
ein
spec
ies
nu
mb
erp
erd
ecad
eo
nsu
mm
itar
ea,
pS
CSA
isth
ep
erce
nta
ge
chan
ge
in
spec
ies
nu
mb
erp
erd
ecad
eo
nsu
mm
itar
eaan
dp
SC
2,8
00
isth
ep
erce
nta
ge
chan
ge
insp
ecie
sn
um
ber
per
dec
ade
on
area
abo
ve
2,8
00
m.h
ist
mea
ns
his
tori
cal
inv
esti
gat
ion
.a
cou
ld
no
tb
eca
lcu
late
d,
bec
ause
no
spec
ies
wer
efo
un
din
the
his
tori
cal
inv
esti
gat
ion
182 Plant Ecol (2008) 195:179–196
123
20 Paper 1 - Changes in species richness

ochorous species in the species pool. Hence, for each
category we compared the proportion of species in
the species pool with that of migrators belonging to
the respective category using a two-sided paired
Wilcoxon Rank test.
Investigation area above 2,800 m—migration rates
The following calculations were done for the four
mountains of the recent investigation, where histor-
ical records down to 2,800 m were available (see
Table 1). Percentage change in species number for
the area above 2,800 m (pSC2,800) was calculated
using an equation analogous to that given for pSCSA.
Additionally, migration rates of species were calcu-
lated as altitudinal shift per decade (AS2,800) for each
species on each mountain:
AS2;800 ¼ ðOr � OhÞ=dh
where Or is the recent uppermost elevation for the
species and Oh is the historical uppermost elevation.
For species absent in one of the investigations, the
shortest possible migration distance was assumed in
order not to overestimate migration rates. This means
that we treated species with no occurrence in
historical records, but found today, as migrated from
2,800 m (i.e. the border of the investigation area) to
their recent occurrence. Species found in historical
records, but not today, were treated as having lost all
occurrences in the observed area (above 2,800 m). As
there is no information available if the respective
species has disappeared from that mountain or has
simply lost the uppermost occurrences, we treated
them as having migrated downward to 2,800 m.
AS2800 was averaged over mountains where the
respective species occurs.
All analyses were done using S-plus (MathSoft
1999). Nomenclature follows Lauber and Wagner
(1996).
Results
Summit area
We observed an increase in species number on 10 out
of the 12 mountains investigated (Table 1). Species
number remained unchanged on Parpaner Rothorn,
and decreased on Alplihorn. Change in species
richness, SCSA, averaged at 1.8 ± 0.3 (mean ± SE)
species per decade (n = 12). Percentage change in
species richness, pSCSA, varied highly with a mean of
10.9 ± 3.0% (n = 11).
For the combined data set of Grabherr et al. (2001)
and this study (n = 42), we found that in contrast to
SCSA, which decreased with increasing altitude, there
was no dependence on altitude of pSCSA (Fig. 1).
pSCSA differences on bedrock were significant
(Fig. 2, t = �2.39, P = 0.02, n = 39). In contrast, SCSA
did not differ with bedrock type (t = �0.66, P = 0.51,
n = 40). Mean percentage changes of species richness
were higher on calcareous (12.4 ± 2.9%, n = 11) than
on siliceous mountains (6.0 ± 1.1%, n = 28). The
highest pSCSA values were found on mixed bedrock
(23.8 ± 1.3%); however, the two mountains con-
cerned were not included in tests, because the sample
size was too small.
Altitude
2800
pSC
SA
-10%
-5%
0%
5%
10%
15%
20%
25%
30%
Altitude
2800
SC
SA
-1
0
1
2
3
this studyGrabherr et al. (2001)
3000 3200 3400 36003000 3200 3400
Fig. 1 Linear regression of
the altitude of 42 mountains
with the percentage change
in species richness per
decade, pSCSA (F = 0.46,
p = 0.50, df = 39), and
change in species richness
per decade, SCSA (F = 9.65,
p = 0.003, df = 40,
R2 = 0.19)
Plant Ecol (2008) 195:179–196 183
123
Paper 1 - Changes in species richness 21

Species groups
Dispersal mode was the only functional trait with
significantly different proportions between migrators
and the species pool. Migrators were more likely to
be anemochorous but less likely to be zoochorous or
autochorous (Fig. 3).
Investigation area above 2,800 m—pSC2,800 and
migration rates
Percentage change in species richness (pSC2,800) was
close to zero on two mountains, negative on the third
mountain, but very high on the forth mountain, where
the number of species tripled (Table 1).
We observed an AS2,800 upward migration with a
maximum of 19 m and a mean of 2.2 ± 0.3 per decade
on the four mountains. Of the 140 investigated
species, 97 (69%) migrated upwards (see Appendix
A). Highest AS2,800 were achieved by Asteraceae and
Brassicacae species (4.9 ± 2.4m and 4.3 ± 2.1m,
respectively).
Discussion
Summit areas and adjacent slopes
Our findings provide evidence for an increase in
species number of up to three species per decade
within the last 120 years on high alpine summits
(Table 1). This agrees well with other investigations
from the Alps, where similar changes have been
detected (Grabherr et al. 1994; Pauli et al. 2001;
Camenisch 2002; Walther 2003; Walther et al. 2005).
Taking into account further observations from the
past century (between the first and recent study) on
summits studied in this work (Braun-Blanquet 1958;
Hofer 1985), we can assume a continued increase in
species richness. In the same period, mean summer
temperature increased by at least 0.6 K (Bader and
Bantle 2004). A relation between these phenomena is
manifest, possibly making temperature the driving
force of the upward shift of vegetation (Grabherr
et al. 1994; Pauli et al. 1996; Theurillat and Guisan
2001; Klanderud and Birks 2003). In contrast to the
clear species richness increase on summits, however,
no general pattern in species richness change on the
adjacent areas down to 2,800 m (see Table 1) was
found. Possibly, the migration of species originating
from alpine swards may be balanced by the loss of
nival centred species due to competitive pressure
caused by the migrators in these areas. Tolerance
against the harsh abiotic conditions may be replaced
by competitive interactions as limiting factor for
further increases in species richness (Theodose and
Bowman 1997; Choler et al. 2001). We therefore
suggest that an increase in species richness can be
regarded as a potential indicator for climate change
only directly on the summits, but not on adjacent
slopes.
In the context of climate warming several studies
predict the extinction of a considerable number of
high-alpine species (Grabherr et al. 1994; Thuiller
et al. 2005). In our case, 13% of the historical species
occurrences on summits could not be re-confirmed
(see Appendix A), but no species showed a partic-
ularly high rate of loss. Hence, an outstanding threat
siliceous calcareous
pSC
SA
0%
2%
4%
6%
8%
10%
12%
14%
16%Fig. 2 Percentage change
of species richness per
decade for 39 mountains
(mean and standard error
are shown). pSCSA differed
significantly between
bedrock types (t = �2.39,
P = 0.02). Two mountains
with mixed bedrock are not
included
184 Plant Ecol (2008) 195:179–196
123
22 Paper 1 - Changes in species richness

for species to become out-competed ‘‘beyond the
summits’’ can neither be confirmed nor rejected with
our data.
Low and high altitude summits
Several studies predict the temperature driven
increase in species richness to be more pronounced
at the alpine-nival ecotone than in the nival belt
(Grabherr et al. 2001; Camenisch 2002; Walther et al.
2004). Due to the sensitivity of transition zones to
climate change, they are considered highly appropri-
ate to study its impacts (di Castri et al. 1988;
Gottfried et al. 1998; Peteet 2000). Our findings
confirm that summits at altitudes between 2,800 and
3,000 m experience a much more pronounced
increase in species number than summits above this
range (see Fig. 1). Not surprisingly, a larger species
pool is available at lower altitudes providing species
potentially migrating upwards once conditions permit
(Grabherr et al. 1995; Keller et al. 2000; Camenisch
2002; Walther et al. 2004) than at higher altitudes.
However, percentage species richness change was
independent of altitude within the investigated alti-
tudinal range. Hence, there was no indication for the
alpine-nival ecotone to be more dynamic in terms of
species richness changes than the nival belt.
Bedrock
We found mountains with calcareous bedrock to have
a higher percentage species richness increase than
those with siliceous bedrock (see Fig. 2 and Walther
et al. 2004). Calcareous bedrock is generally
dispersal mode
Anemochores Autochores Zoochores
seicepsfotnecrep
0%
20%
40%
60%
80%
100%
dispersal timing
May Jun Jul Aug Sep Oct
seicepsfotnecrep
0%
10%
20%
30%
40%
50%
families
Ast
erac
eae
Poac
eae
Bra
ssic
acea
eC
aryo
phyl
lace
aeSa
xifr
agac
eae
Scop
hulla
riace
aeC
yper
acea
eR
osac
eae
Faba
ceae
Cam
panu
lace
aeG
entia
nace
aeSa
licac
eae
Prim
ulac
eae
Junc
acea
eC
rass
ulac
eae
Poly
gona
ceae
5%
10%
15%
20%
25%
diaspore length
>= 1.6mm < 1.6mm
10%
20%
30%
40%
50%
60%
70%
Fig. 3 Mean and standard error of percentages of species
within the species pool (black bars) and amongst migrators
(white bars). The median of 1.6 mm was used as threshold for
the classification of diaspore length. Only dispersal modes
showed significant differences (anemochores: P = 0.002,
n = 12; autochores: P = 0.049, Z = 1.97; zoochores:
P = 0.016, n = 12)
Plant Ecol (2008) 195:179–196 185
123
Paper 1 - Changes in species richness 23

characterised by a higher number of microhabitats
(Gigon and Rorison 1972; Pauli et al. 1999; Korner
2003). Precipitation causes calcareous substrates to
locally dissolve, so that neutral or slightly acidic
microhabitats develop (Gigon and Rorison 1972). A
mosaic of different calcareous and additionally
slightly acidic microhabitats may increase the possi-
bility of plant species to migrate to the summits. The
notably high increase in species richness on the two
mountains with mixed bedrock supports this expla-
nation (see Table 1). The differences may become
even more pronounced under changing temperature
and precipitation regimes (Begert et al. 2005; IPCC
2007).
Migration rates
The upward migration rates found in this study were
within the range of several metres per decade, which
is in line with those reported by Grabherr et al.(1994)
for summits in the same region. Although highly
variable and based on data from only four mountains,
we regard these as valuable findings because only
little quantitative information is available about plant
species migration at high altitudes. Studies of tree-
line dynamics (Dubey et al. 2003; Dubey and Yadav
2006; Kullman 2006) also revealed highly variable
migration rates, but cannot be directly compared to
our findings.
Species groups
Except for dispersal mode, migration behaviour was
independent of the investigated functional traits and
taxonomic groups (Fig. 3), suggesting that pioneer
species of high altitudes are typically wind-dispersed
(Theurillat and Guisan 2001). Anemochory seems to
be a more effective dispersal mechanism in high
altitudes compared to zoo- and autochory. Apart from
strong air movements facilitating dispersal, the
transportation of snow, soil and seeds to the same
microsites potentially improves germination condi-
tions for seeds (Kullman 2002).
To conclude, we could confirm a general upward
migration of vascular plants, and hence a species
richness increase on high altitude summits, which
seems to be connected to the temperature increase of
the past century. However, there is no evidence that
the alpine-nival ecotone is more dynamic in terms of
species richness than the nival belt.
Acknowledgements We would like to thank Helfrid
Rossiter, Richard Brauer and Michael Hofmeier for their
assistance in the field. Data about diaspore length were kindly
provided by Siegrun Ertl. We thank Manuela Winkler, Siegrun
Ertl and Matthias Seeger for useful comments on the early
versions of this manuscript. The inputs and suggestions of the
two anonymous reviewers greatly helped to improve this
m a n u s c i p t . T h e w o r k w a s f u n d e d b y t h e
Forschungskommission des Schweizerischen Nationalparks.
186 Plant Ecol (2008) 195:179–196
123
24 Paper 1 - Changes in species richness
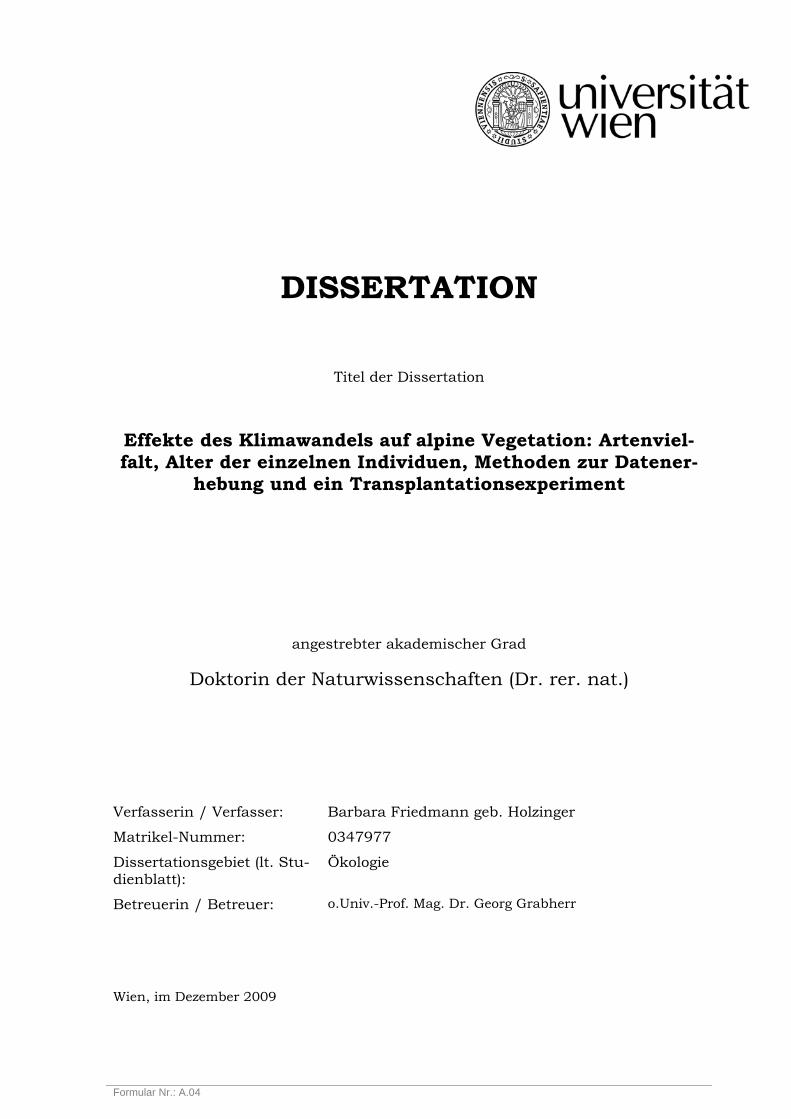
Ap
pen
dix
AS
pec
ies
occ
urr
ence
on
12
mo
un
tain
sin
Gri
son
s,S
wit
zerl
and
Sp
ecie
sP
izA
lv
29
75
Las
So
urs
29
78
Sas
s
Co
rvig
lia
28
62
Piz
Tsc
huff
er
29
16
Alp
lih
orn
30
06
Wei
ssfl
uh
28
44
Aro
ser
Ro
tho
rn
29
80
Aro
ser
Alp
lih
orn
28
42
Par
pan
er
Ro
tho
rn
28
99
Piz
Ch
a-
tsch
eder
s
29
86
Piz
Dai
nt
29
68
Piz
Pad
ella
28
56
mig
rati
on
rate
(m)
Ach
ille
aa
tra
tax
29
74
x2
85
0x
29
16
28
10
28
70
28
40
6.8
Ach
ille
aer
ba
-rot
tass
p.
mo
sch
ata
xx
x2
98
0
Ach
ille
an
an
a2
85
02
96
0x
x2
85
02
84
0x
28
30
28
60
x2
98
0�
0.5
±1
.6
Ad
eno
styl
esg
lab
rax
28
30
Ad
eno
styl
esle
uco
ph
ylla
x�
5.3
±4
.25
Ag
rost
isa
lpin
a2
89
0x
28
42
29
70
0.6
±3
.8
Ag
rost
isru
pes
tris
x2
97
8x
29
86
Alc
hem
illa
fiss
aa
gg.
x2
85
0
Alc
hem
illa
gla
uce
scen
sx
An
dro
sace
alp
ina
29
60
29
00
xx
29
80
x2
84
2x
x2
89
9x
x2
98
61
.3±
1.5
An
dro
sace
cha
ma
eja
sme
28
60
xx
28
30
�3
.1±
3.1
An
dro
sace
hel
veti
cax
28
62
x2
95
0x
28
10
x2
84
2x
x2
85
6�
2.1
±3
.9
An
dro
sace
ob
tusi
foli
a2
93
0�
0.4
±1
.6
An
ten
nar
iaca
rpa
tica
x2
86
22
86
02
85
0x
29
86
3.1
±4
.2
An
ten
nar
iad
ioic
ax
29
80
An
tho
xan
thu
ma
lpin
um
29
50
An
thyl
lis
vuln
era
ria
ssp
.a
lpes
tris
x2
86
22
83
02
83
0
Ara
bis
alp
ina
ssp
.alp
ina
xx
29
74
29
50
x2
86
2x
29
16
29
60
x2
84
4x
x2
98
0x
x2
84
2x
28
99
28
30
28
70
xx
28
56
4.2
±1
.8
Ara
bis
bel
lidi
foli
ax
29
74
x2
91
6x
x2
84
42
90
0x
29
68
28
40
8.9
±0
.8
Ara
bis
caer
ule
ax
29
74
x2
85
0x
29
16
29
20
x2
83
0x
29
70
28
30
x2
96
8x
28
50
9.9
±1
.8
Arc
tost
aphyl
os
uva
-urs
ix
28
62
Are
nar
iab
iflo
ra2
84
0x
29
80
0.1
±4
.0
Are
nar
iaci
lia
ta2
94
0x
x2
84
2x
x2
89
9x
29
68
3.5
±1
.6
Arn
ica
mo
nta
na
29
70
Art
emis
iag
enip
ix
29
74
x2
97
8x
28
62
x2
91
6x
28
30
29
50
xx
28
42
xx
28
99
x2
95
0x
28
56
1.7
±1
.5
Art
emis
iau
mb
elli
form
isx
Asp
len
ium
viri
de
x2
85
02
87
06
.8
Plant Ecol (2008) 195:179–196 187
123
Paper 1 - Changes in species richness 25

Ap
pen
dix
Aco
nti
nu
ed
Sp
ecie
sP
izA
lv
29
75
Las
So
urs
29
78
Sas
s
Co
rvig
lia
28
62
Piz
Tsc
hu
ffer
29
16
Alp
lih
orn
30
06
Wei
ssfl
uh
28
44
Aro
ser
Ro
tho
rn
29
80
Aro
ser
Alp
lih
orn
28
42
Par
pan
er
Ro
tho
rn
28
99
Piz
Ch
a-
tsch
eder
s
29
86
Piz
Dai
nt
29
68
Piz
Pad
ella
28
56
mig
rati
on
rate
(m)
Ast
era
lpin
us
x2
86
2x
29
50
�1
.0±
1.0
Ast
erb
elli
dia
stru
mx
29
74
x2
83
02
87
02
91
02
84
05
.7±
4.5
Ast
rag
alu
sa
lpin
us
28
30
Ast
rag
alu
sfr
igid
us
28
30
Ave
nel
laflex
uosa
28
30
3.2
Ba
rtsi
aa
lpin
ax
28
62
28
10
28
30
28
40
Bo
tryc
hiu
mlu
na
ria
28
30
28
30
28
10
28
40
Ca
mp
an
ula
ba
rba
ta2
95
0
Ca
mp
an
ula
ceni
sia
xx
30
06
28
10
x�
5.3
±3
.4
Ca
mp
an
ula
coch
lea
riif
oli
ax
29
74
x2
85
0x
29
16
28
60
x2
84
0x
29
80
29
00
x2
85
61
4.7
±2
.8
Cam
panul
asc
heu
chze
ri2
95
0x
x2
86
22
86
02
91
0x
28
42
28
10
29
50
x2
85
04
.3±
3.4
Ca
rda
min
ea
lpin
ax
Ca
rda
min
ere
sed
ifo
lia
x2
97
8x
x2
84
22
88
0x
x2
98
61
.9±
3.6
Ca
rdu
usd
eflo
ratu
sss
p.
defl
ora
tus
x2
96
02
84
02
86
02
83
0
Ca
rex
atr
ata
ssp
.a
tra
ta2
88
02
84
02
91
02
83
0�
0.9
Ca
rex
cap
illa
ris
�4
.2
Ca
rex
curv
ula
ssp
.cu
rvu
la2
83
0x
x2
97
82
84
0x
x2
84
2x
28
60
xx
29
86
x2
85
0�
5.2
±3
.8
Ca
rex
firm
a2
86
02
83
02
83
04
.7±
1.1
Ca
rex
nig
rax
Ca
rex
orn
ith
op
odi
oid
es2
90
02
82
0
Ca
rex
pa
rvifl
ora
28
30
x2
86
2x
x2
84
2�
2.0
±2
.2
Ca
rex
rup
estr
isx
28
30
x2
97
8x
x2
86
2x
29
16
x2
84
22
86
02
97
02
83
0x
28
56
4.8
±0
.8
Care
xse
mper
vire
ns
29
60
Ca
rex
sp.
x2
97
4
Cer
ast
ium
alp
inu
mss
p.
alp
inum
xx
Cer
ast
ium
cera
sto
ides
x2
98
0x
28
30
28
30
8.4
±5
.2
Cer
ast
ium
fon
tan
um
ssp
.fo
nta
num
29
50
188 Plant Ecol (2008) 195:179–196
123
26 Paper 1 - Changes in species richness

Ap
pen
dix
Aco
nti
nu
ed
Sp
ecie
sP
izA
lv
29
75
Las
So
urs
29
78
Sas
s
Co
rvig
lia
28
62
Piz
Tsc
hu
ffer
29
16
Alp
lih
orn
30
06
Wei
ssfl
uh
28
44
Aro
ser
Ro
tho
rn
29
80
Aro
ser
Alp
lih
orn
28
42
Par
pan
er
Ro
tho
rn
28
99
Piz
Ch
a-
tsch
eder
s
29
86
Piz
Dai
nt
29
68
Piz
Pad
ella
28
56
mig
rati
on
rate
(m)
Cer
ast
ium
lati
foli
umx
29
74
x2
97
8x
x2
86
2x
29
16
xx
30
06
x2
84
42
90
0x
29
68
xx
28
56
0.0
±2
.0
Cer
ast
ium
ped
unc
ula
tum
x2
84
02
91
04
.2
Cer
ast
ium
un
iflo
rum
28
30
x2
84
0x
x2
91
6x
x2
98
0x
28
42
x2
89
9x
x2
98
63
.0±
1.2
Cir
siu
msp
ino
siss
imu
m2
95
02
85
02
95
0x
28
44
x2
97
02
82
02
81
02
84
07
.6±
4.4
Cys
topte
ris
monta
na
28
30
Da
ph
ne
stri
ata
x
Do
ron
icu
mcl
usi
ix
x2
97
02
81
02
91
0x
28
42
28
60
x2
98
61
.1±
1.5
Do
ron
icu
mg
ran
difl
oru
mx
29
70
x2
85
02
84
0x
29
50
x2
83
02
90
0x
28
50
9.8
Dra
ba
aiz
oid
esx
29
74
x2
86
2x
29
16
x2
97
02
83
0x
16
.7
Dra
ba
du
bia
xx
29
78
x2
86
2x
28
30
x2
84
2x
x2
98
0x
28
56�
1.4
±4
.8
Dra
ba
fla
dn
izen
sis
x2
96
02
81
0x
x2
83
0x
x2
89
9x
29
80
x2
85
6�
5.6
±4
.8
Dra
ba
ho
pp
ean
ax
x2
97
42
93
0x
28
62
x2
98
02
96
0x
7.8
Dra
ba
sili
qu
osa
x2
84
2x
28
99
4.8
±2
.5
Dra
ba
tom
ento
sax
29
74
x2
86
2x
29
16
xx
x2
84
42
91
0x
29
68
28
10
10
.4±
9.5
Dry
as
oct
opet
ala
x2
97
42
83
0x
x2
85
03
.5
Ely
na
myo
suro
ides
28
30
x2
86
22
83
0x
28
44
xx
28
42
28
60
29
70
28
30
xx
28
56�
1.7
±2
.8
Ep
ilo
biu
ma
na
gall
idif
oli
um
28
20
Eri
ger
on
neg
lect
us
x2
97
4x
29
16
Eri
ger
on
un
iflo
rus
xx
29
74
xx
29
78
x2
86
2x
29
16
29
50
x2
84
4x
29
80
xx
28
42
xx
28
99
x2
98
6x
29
57
xx
28
56
5.9
±4
.3
Eri
tric
hu
mn
an
umx
x2
97
8x
28
62
28
20
28
10
xx
29
86
Eu
ph
rasi
asp
.2
85
0x
29
70
x2
86
22
92
0x
x2
84
2x
28
99
xx
29
86
1.8
±1
.2
Euphra
sia
sali
sburg
ensi
s2
84
0
Fes
tuca
alp
ina
xx
29
57
28
40
4.4
±1
4.2
Fes
tuca
ha
ller
ix
29
74
xx
29
78
x2
86
2x
29
16
x2
82
0x
28
44
x2
98
0x
x2
84
2x
28
99
x2
98
6x
28
56
1.6
±1
.4
Fes
tuca
inte
rced
ens
x2
90
0
Fes
tuca
qu
adr
iflo
rax
x2
83
0x
xx
29
57
x2
85
63
.7±
7.4
Fes
tuca
sp.
28
30
7.8
Fes
tuca
vio
lace
a2
82
02
.1
Ga
liu
ma
nis
op
hyl
lon
29
60
28
30
Gen
tia
na
aca
uli
s2
97
0
Plant Ecol (2008) 195:179–196 189
123
Paper 1 - Changes in species richness 27

Ap
pen
dix
Aco
nti
nu
ed
Sp
ecie
sP
izA
lv
29
75
Las
So
urs
29
78
Sas
s
Co
rvig
lia
28
62
Piz
Tsc
hu
ffer
29
16
Alp
lih
orn
30
06
Wei
ssfl
uh
28
44
Aro
ser
Ro
tho
rn
29
80
Aro
ser
Alp
lih
orn
28
42
Par
pan
er
Ro
tho
rn
28
99
Piz
Ch
a-
tsch
eder
s
29
86
Piz
Dai
nt
29
68
Piz
Pad
ella
28
56
mig
rati
on
rate
(m)
Gen
tia
na
ba
vari
cax
29
70
28
10
xx
29
80
xx
28
30
x2
88
0x
28
60
�1
.0±
0.5
Gen
tia
na
bra
chyp
hyl
lax
29
78
x2
86
22
86
0x
28
42
x2
87
0x
x2
98
6�
0.3
±2
.7
Gen
tia
na
niv
ali
sx
28
50
28
30
28
20
28
60
4.2
±2
.1
Gen
tia
na
orb
icu
lari
sx
28
62
28
10
28
60
Gen
tia
na
pu
nct
ata
28
30
x2
98
65
.3
Gen
tia
na
ten
ella
28
20
x2
84
22
88
02
.7±
1.7
Gen
tia
na
vern
ax
28
62
28
30
29
10
x2
84
22
88
02
86
0x
28
56
2.1
±1
.1
Geu
mm
on
tan
umx
x2
97
82
81
02
83
0x
29
86
3.1
±2
.1
Geu
mre
pta
ns
xx
29
74
xx
29
78
28
10
29
00
xx
30
06
x2
83
0x
29
80
xx
28
42
x2
85
0x
x2
98
0x
28
56�
0.3
±2
.4
Gn
ap
ha
liu
mh
op
pea
nu
mx
29
74
x2
83
02
90
09
.8
Gn
ap
ha
liu
msu
pin
um
28
30
28
10
28
20
x2
98
0x
28
42
28
70
x2
98
6x
29
60
28
40
9.3
±4
.2
Gyp
soph
ila
rep
ens
x
Hed
ysaru
mhed
ysaro
ides
28
30
x2
85
02
84
0
Hel
ian
them
um
alp
estr
e2
85
0x
x2
86
22
83
02
83
0x
3.5
Hel
icto
tric
hon
vers
icolo
rx
x2
97
82
82
0x
28
30
28
60
xx
29
86
�2
.8±
4.4
Hie
raci
um
alp
inum
x2
97
4x
29
78
x2
83
0x
29
70
29
50
19
.6
Hie
raci
um
pil
ifer
um
agg.
x2
98
0
Hie
raci
um
muro
rum
28
30
Hie
raci
um
pil
ose
lla
29
50
Hie
raci
um
sp.
28
40
x2
91
62
84
04
.8
Hie
raci
um
vill
osu
mx
29
86
Ho
mo
gyn
ea
lpin
ax
29
70
x2
85
02
84
0x
28
30
x2
84
22
83
0x
29
86
x2
85
00
.1±
2.2
Jun
cus
jacq
uin
iix
29
78
28
10
28
10
28
30
x2
98
61
.5±
1.5
Jun
cus
trifi
dus
29
70
0.0
Jun
iper
us
com
mu
nis
ssp
.n
an
a2
81
0x
29
78
x2
91
62
85
97
.0
Leo
nto
don
hel
veti
cus
28
20
28
60
x2
98
60
.5±
0.5
Leo
nto
do
nh
isp
idu
sss
p.
his
pid
us
x2
98
62
83
0
Leo
nto
do
nm
on
tan
usx
29
74
28
50
28
60
x2
84
4x
28
30
29
30
28
40
11
.1±
3.9
190 Plant Ecol (2008) 195:179–196
123
28 Paper 1 - Changes in species richness

Ap
pen
dix
Aco
nti
nu
ed
Sp
ecie
sP
izA
lv
29
75
Las
So
urs
29
78
Sas
s
Co
rvig
lia
28
62
Piz
Tsc
hu
ffer
29
16
Alp
lih
orn
30
06
Wei
ssfl
uh
28
44
Aro
ser
Ro
tho
rn
29
80
Aro
ser
Alp
lih
orn
28
42
Par
pan
er
Ro
tho
rn
28
99
Piz
Ch
a-
tsch
eder
s
29
86
Piz
Dai
nt
29
68
Piz
Pad
ella
28
56
mig
rati
on
rate
(m)
Leo
nto
po
diu
ma
lpin
um
x2
97
0x
28
62
x
Leu
can
them
op
sis
alp
ina
ssp
.a
lpin
a2
95
0x
x2
97
82
90
0x
x2
98
0x
x2
84
2x
x2
89
9x
x2
98
6�
0.0
±0
.1
Leu
can
them
um
ha
ller
i2
82
0
Lig
ust
icu
mm
ute
llin
a2
86
02
97
0
Lig
ust
icu
mm
ute
llin
oid
esx
28
62
28
20
x2
84
2x
28
80
28
40
0.6
±1
.7
Lin
ari
aa
lpin
ass
p.a
lpin
ax
29
60
x2
97
8x
28
62
29
00
x3
00
62
81
0x
29
80
28
20
x2
89
9x
x2
98
6x
29
57
x2
85
67
.9±
3.7
Llo
ydia
sero
tin
ax
29
78
x2
97
0x
x2
84
2x
28
99
29
60
x2
85
65
.2±
2.9
Lo
isel
euri
ap
rocu
mb
ens
x
Lo
tus
alp
inu
s2
95
0
Lu
zula
alp
ino
pil
osa
x2
84
2x
28
40
�4
.2±
4.7
Lu
zula
lute
ax
29
78
28
10
x2
81
02
83
0x
29
86
�5
.5±
3.3
Lu
zula
spic
ata
xx
29
78
29
00
x2
98
0x
x2
84
2x
x2
89
9x
x2
98
61
.0±
0.9
Lu
zula
sud
etic
a2
81
0
Min
ua
rtia
bifl
ora
x2
97
02
81
02
95
02
91
0x
13
.9±
0.8
Min
ua
rtia
recu
rva
28
20
Min
ua
rtia
sed
oid
esx
x2
97
82
86
0x
28
40
xx
29
80
xx
28
42
xx
28
99
xx
29
86
�0
.0±
0.1
Min
ua
rtia
vern
ax
29
60
x2
97
8x
28
62
xx
29
16
xx
28
44
29
20
x2
84
22
86
02
96
0x
29
68
x3
.0±
1.7
Mo
ehri
ngia
cili
ata
x2
97
4x
28
50
28
40
xx
28
30
29
00
x2
83
0x
29
68
x2
84
00
.0±
1.8
Myo
soti
sa
lpes
tris
x2
97
4x
28
50
28
50
28
20
29
70
x�
0.5
±1
.5
Ore
och
loa
dis
tich
ax
x2
97
8x
28
10
x2
98
0x
x2
84
2x
x2
89
9x
x2
98
61
.5±
1.2
Oxy
ria
dig
yna
29
30
�0
.2±
4.7
Oxy
tropis
cam
pes
tris
ssp.
cam
pes
tris
x2
97
0x
x2
86
22
86
0�
2.1
Oxy
tropis
jaqu
inii
x
Oxy
tropis
lapp
onic
a2
81
0
Pa
pa
ver
au
ran
thia
cum
29
50
xx
29
16
28
70
�9
.5
Pa
rna
ssia
pa
lust
ris
28
30
Ped
icula
ris
kern
eri
xx
29
78
28
20
x2
98
0�
3.1
Ph
yteu
ma
glo
bu
lari
ifo
liu
mss
p.
glo
bu
lari
ifo
l.
x2
97
8x
29
86
Plant Ecol (2008) 195:179–196 191
123
Paper 1 - Changes in species richness 29

Ap
pen
dix
Aco
nti
nu
ed
Sp
ecie
sP
izA
lv
29
75
Las
So
urs
29
78
Sas
s
Co
rvig
lia
28
62
Piz
Tsc
hu
ffer
29
16
Alp
lih
orn
30
06
Wei
ssfl
uh
28
44
Aro
ser
Ro
tho
rn
29
80
Aro
ser
Alp
lih
orn
28
42
Par
pan
er
Ro
tho
rn
28
99
Piz
Ch
a-
tsch
eder
s
29
86
Piz
Dai
nt
29
68
Piz
Pad
ella
28
56
mig
rati
on
rate
(m)
Ph
yteu
ma
glo
bu
lari
ifo
liu
mss
p.
ped
emo
nta
num
x2
86
0x
29
80
xx
28
42
xx
28
99
x2
95
01
.3±
1.2
Ph
yteu
ma
hem
isphaer
icum
28
10
Po
aa
lpin
ax
x2
97
4x
x2
97
8x
x2
86
22
87
0x
28
44
xx
29
80
xx
28
42
x2
89
9x
29
50
x2
85
61
.6±
1.3
Po
ala
xax
x2
97
8x
x2
86
22
90
0x
x2
98
0x
x2
84
2x
x2
89
9x
x2
98
6x
28
56
0.0
±0
.0
Po
am
ino
rx
x2
97
4x
28
62
xx
29
16
29
50
x2
84
42
88
02
81
0x
28
99
29
50
x2
96
80
.0±
2.0
Poly
gonu
mvi
viparu
m2
85
0x
29
30
x2
86
22
86
0x
28
44
29
10
x2
84
2x
28
80
xx
29
86
28
30
x2
85
61
.8±
1.3
Poly
stic
hum
lonch
itis
28
70
28
30
6.8
Po
ten
till
aa
ure
a2
81
02
83
02
86
03
.1±
3.1
Po
ten
till
ab
raun
ean
ax
x2
85
02
84
02
81
0x
Po
ten
till
acr
an
tzii
28
50
x2
86
22
83
0x
29
80
x2
85
0�
2.1
Po
ten
till
afr
igid
ax
29
78
29
00
xx
28
42
xx
28
99
xx
29
86
0.1
±0
.1
Pri
mula
glu
tinosa
x2
84
22
86
07
.0±
1.4
Pri
mula
hir
suta
xx
28
42
29
70
0.6
±0
.6
Pri
mula
inte
gri
foli
a2
83
0x
x�
5.8
±3
.7
Pri
mula
lati
foli
ax
x2
98
0
Pri
mula
sp.
29
10
6.7
Pri
tzel
ag
oa
lpin
ax
29
68
8.1
Pri
tzel
ag
oa
lpin
ass
p.
alp
ina
xx
28
44
x2
85
6
Pri
tzel
ag
oa
lpin
ass
p.
bre
vica
uli
sx
x2
97
4x
28
62
x2
91
62
95
01
4.7
Pu
lsa
till
ave
rna
lis
29
70
28
40
Ranuncu
lus
alp
estr
is2
89
0x
28
20
28
10
1.1
Ra
nu
ncu
lus
gla
cia
lis
xx
29
78
29
00
xx
29
80
x2
81
0x
x2
89
9x
x2
98
6�
1.1
±1
.0
Ra
nu
ncu
lus
mo
nta
nus
ssp
.m
on
tan
us
28
30
Rh
ina
nth
us
gla
cia
lis
28
40
Ru
mex
alp
inus
28
20
Ru
mex
niv
alis
x�
9.5
Sa
gin
asa
gin
oid
es2
81
02
87
0�
2.0
±4
.0
Sa
lix
her
bac
ea2
88
0x
xx
28
62
28
60
29
20
x2
83
0x
28
70
29
40
28
30
2.4
±2
.2
192 Plant Ecol (2008) 195:179–196
123
30 Paper 1 - Changes in species richness

Ap
pen
dix
Aco
nti
nu
ed
Sp
ecie
sP
izA
lv
29
75
Las
So
urs
29
78
Sas
s
Co
rvig
lia
28
62
Piz
Tsc
hu
ffer
29
16
Alp
lih
orn
30
06
Wei
ssfl
uh
28
44
Aro
ser
Ro
tho
rn
29
80
Aro
ser
Alp
lih
orn
28
42
Par
pan
er
Ro
tho
rn
28
99
Piz
Ch
a-
tsch
eder
s
29
86
Piz
Dai
nt
29
68
Piz
Pad
ella
28
56
mig
rati
on
rate
(m)
Sali
xre
ticu
lata
28
50
x2
85
0
Sa
lix
retu
sa2
90
0x
28
62
28
60
28
20
28
30
x2
85
01
.7±
1.7
Sa
lix
serp
ylli
foli
ax
29
74
x2
86
2x
29
16
28
20
28
70
x2
84
22
82
02
94
02
83
0x
28
50
1.4
±1
.5
Sa
uss
ure
aa
lpin
ass
p.
alp
ina
x2
97
02
86
02
95
0x
28
56�
2.1
Sa
xifr
aga
aiz
oid
esx
29
74
xx
28
50
28
50
29
50
28
70
6.8
Sa
xifr
aga
an
dro
sace
a2
95
0x
29
70
xx
28
62
28
40
28
10
28
70
1.3
±5
.5
Sa
xifr
aga
ap
hyl
lax
x2
97
4x
x2
91
6x
28
10
29
00
x2
96
0x
x2
85
62
.5±
4.5
Sa
xifr
aga
bifl
ora
ssp
.b
iflo
ra2
95
0
Sa
xifr
aga
bry
oid
esx
x2
97
82
90
0x
x2
98
0x
x2
84
2x
x2
89
9x
x2
98
60
.0±
0.0
Sa
xifr
aga
caes
iax
29
74
xx
28
62
28
60
28
40
5.3
±0
.5
Sa
xifr
aga
exa
rata
ssp
.ex
ara
tax
x2
97
4x
x2
97
8x
28
62
x2
91
6x
29
80
xx
28
42
xx
28
99
x2
98
6x
29
68
x2
85
69
.4±
5.4
Sa
xifr
aga
exa
rata
ssp
.m
osc
hat
a2
89
0x
28
60
�5
.8
Sa
xifr
aga
mu
sco
ides
29
30
xx
28
99
xx
28
56
0.4
±0
.4
Sa
xifr
aga
op
pos
itif
oli
ax
x2
97
4x
x2
97
8x
28
62
xx
29
16
xx
30
06
xx
28
44
xx
29
80
xx
28
42
xx
28
99
xx
29
86
x2
96
8x
x2
85
62
.2±
1.9
Sa
xifr
aga
pa
nic
ula
ta2
85
0x
29
78
x2
86
22
84
0x
29
50
xx
28
56�
5.7
±2
.0
Sa
xifr
aga
seg
uie
ri2
96
02
84
02
95
0x
28
44
x2
98
0x
28
42
28
80
x2
98
6x
29
68
7.6
±4
.1
Sa
xifr
aga
stel
lari
sx
28
20
2.1
Sed
um
alp
estr
e2
96
0x
29
80
xx
28
42
28
70
x2
98
61
.7±
1.1
Sed
um
atr
atu
mx
x2
97
4x
29
78
x2
86
22
86
0x
28
44
28
80
28
10
x2
84
0�
0.6
±0
.9
Sel
ag
inel
lase
lag
ino
ides
x2
86
2
Sem
per
vivu
mm
on
tan
um
xx
29
86
�1
.0±
1.0
Sen
ecio
doro
nic
umx
29
60
Sen
ecio
inca
nus
ssp.
carn
ioli
cus
x2
96
0x
x2
97
8x
29
80
28
20
28
30
xx
29
86
28
50
4.6
±3
.3
Ses
leri
aca
eru
lea
x2
97
4x
28
62
x2
91
62
86
02
85
0x
28
56
0.7
±2
.8
Sib
ba
ldia
pro
cum
ben
s2
83
02
84
02
84
0x
28
30
29
20
x2
84
22
86
0x
29
86
3.9
±4
.0
Sil
ene
aca
uli
sx
29
74
x2
86
2x
29
16
x2
84
4x
29
68
x2
85
0�
1.2
±5
.7
Sil
ene
exsc
apa
xx
29
78
x2
92
0x
x2
84
2x
28
99
xx
29
86
�0
.2±
1.4
Plant Ecol (2008) 195:179–196 193
123
Paper 1 - Changes in species richness 31

Ap
pen
dix
Aco
nti
nu
ed
Sp
ecie
sP
izA
lv
29
75
Las
So
urs
29
78
Sas
s
Co
rvig
lia
28
62
Piz
Tsc
hu
ffer
29
16
Alp
lih
orn
30
06
Wei
ssfl
uh
28
44
Aro
ser
Ro
tho
rn
29
80
Aro
ser
Alp
lih
orn
28
42
Par
pan
er
Ro
tho
rn
28
99
Piz
Ch
a-
tsch
eder
s
29
86
Piz
Dai
nt
29
68
Piz
Pad
ella
28
56
mig
rati
on
rate
(m)
So
lid
ag
ovi
rgau
rea
ssp
.vi
rga
ure
a2
83
0x
28
30
3.1
Tara
xacu
malp
estr
eagg.
x2
85
0
Ta
raxa
cum
alp
inu
ma
gg
.x
29
74
x2
97
8x
28
62
xx
29
16
x2
95
0x
28
44
x2
97
0x
28
42
28
80
x2
98
02
93
02
81
02
.7±
0.6
Ta
raxa
cum
offi
cin
ale
ag
g.2
81
0
Ta
raxa
cum
sp.
x2
83
0x
28
56
Th
ymu
ssp
.x
Tri
setu
md
isti
cho
ph
yllo
n0
.0
Tri
setu
msp
ica
tum
x2
97
42
81
0x
29
16
x2
84
0x
29
80
x2
84
2x
x2
89
9x
29
80
x2
96
8x
x2
85
67
.0±
4.4
Vacc
iniu
mvi
tis-
idaea
x2
97
4
Va
leri
ana
sp.
28
20
Va
leri
ana
sup
ina
29
50
Ver
on
ica
alp
ina
x2
97
42
96
0x
28
50
28
40
28
60
x2
84
4x
29
70
x2
84
22
87
02
95
02
83
06
.1±
2.9
Ver
on
ica
ap
hyl
lax
29
60
x2
85
02
83
02
87
02
81
02
81
0x
28
50�
0.5
±1
.2
Ver
on
ica
bel
lidi
oid
es2
96
02
81
02
84
02
84
0x
29
86
1.5
±2
.6
Ver
on
ica
frut
ica
ns
28
70
6.9
Vio
laca
lca
rata
x2
85
02
83
0�
3.1
±1
.0
Fo
rea
chm
ou
nta
in,
the
pre
sen
ceo
fa
spec
ies
on
the
sum
mit
(defi
ned
her
eas
the
up
per
mo
st1
5m
)in
the
his
tori
cal
and
rece
nt
ob
serv
atio
nis
ind
icat
edb
yan
x.
Ad
dit
ion
ally
,th
e
alti
tud
eo
fh
igh
est
occ
urr
ence
inre
cen
tin
ves
tig
atio
n(2
00
4)
isg
iven
.M
igra
tio
nra
tes
(mea
n±
stan
dar
der
ror)
are
list
edin
the
last
colu
mn
for
14
0sp
ecie
so
nfo
ur
mo
un
tain
s,
wh
ere
his
tori
cal
reco
rds
do
wn
to2
,80
0m
are
avai
lab
le.
No
men
clat
ure
foll
ow
sL
aub
eran
dW
agn
er(1
99
6)
exce
pt
for
Ta
raxa
cum
spp
.w
her
ew
efo
llo
wed
Fis
cher
etal
.(1
99
4)
194 Plant Ecol (2008) 195:179–196
123
32 Paper 1 - Changes in species richness

References
Bader S, Bantle H (2004) Das Schweizer Klima im Trend.
Temperatur- und Niederschlagsentwicklung 1864–2001.
Veroff MeteoSchweiz 68:45ff
Begert M, Schlegel T, Kirchhofer W (2005) Homogeneous
temperature and precipitation series of Switzerland from
1864 to 2000. Int J Climatol 25:65–80
Braun-Blanquet J (1913) Die Vegetationsverhaltnisse der
Schneestufe in den Ratisch-Lepontischen Alpen. Neue
Denkschr Schweiz nat forsch Ges 48:1–348
Braun-Blanquet J (1958) Uber die obersten Grenzen pflanzli-
chen Lebens im Gipfelbereich des schweizerischen Na-
tionalparks. Kommission Schweiz nat forsch Ges zur wiss
Erforsch des Nationalparks 6:119–142
Camenisch M (2002) Veranderungen der Gipfelflora im Ber-
eich des Schweizerischen Nationalparks: Ein Vergleich
uber die letzten 80 Jahre. Jahresber nat forsch Ges Gra-
ubunden 111:27–37
Choler P, Michalet R, Callaway RM (2001) Facilitation and
competition on gradients in alpine plant communities.
Ecology 82:3295–3308
di Castri F, Hansen AJ, Holland MM (1988) A new look at
ecotones: emerging international projects on landscape
boundaries. Biol Int 17:1–163
Dubey B, Yadav R (2006) Migration of plant species in re-
sponse to recent climate change in the western Himalaya,
India. In: Price MF (ed) Global change in mountain re-
gions. Sapiens, Duncow, UK
Dubey B, Yadav RR, Singh J, Chaturvedi R (2003) Upward
shift of Himalayan pine in western Himalaya, India. Curr
Sci 85:1135–1136
Ellenberg H, Weber HE, Dull R, Wirth V, Werner W, Pau-
lissen D (1991) Zeigerwerte von Pflanzen in Mitteleuropa.
Scr Geobot 18:1–248
Fischer M, Adler W, Oswald K (1994) Exkursionsflora von
Osterreich. Ulmer, Stuttgart
Gigon A, Rorison IH (1972) The response of some ecologically
distinct plant species to nitrate- and to ammonium-nitro-
gen. J Ecol 60:93–102
Gottfried M, Pauli H, Grabherr G (1998) Prediction of vege-
tation patterns at the limits of plant life: a new view of the
alpine-nival ecotone. Arctic Alpine Res 30:207–221
Grabherr G (1997) The high-mountain ecosystems of the
Alps. In: Wielgolaski FE (ed) Polar and alpine tundra
ecosystems of the world 3. Elsevier, Amsterdam, pp
97–121
Grabherr G, Gottfried M, Gruber A, Pauli H (1995) Patterns
and current changes in alpine plant diversity. In: Chapin
FSI, Korner C (eds) Arctic and alpine biodiversity: pat-
terns, causes and ecosystem consequences. Ecological
Studies 113. Springer, Heidelberg, pp 167–181
Grabherr G, Gottfried M, Pauli H (1994) Climate effects on
mountain plants. Nature 369:448
Grabherr G, Gottfried M, Pauli H (2001) Aspects of global
change in the Alps and in the high arctic region. Long-
term monitoring of mountain peaks in the Alps. In: Burga
CA, Kratochwil A (eds) Biomonitoring: General and ap-
plied aspects on regional and global scales. Kluwer Aca-
demic Publishers, Dordrecht, pp 153–177
Heer O (1885) Uber die nivale Flora der Schweiz. Neue
Denksch Allg Schweiz Ges Gesamt Nat wiss 29:1–114
Hofer HR (1985) Veranderungen in der Vegetation von 14
Gipfeln des Berninagebietes zwischen 1905 und 1985. Ber
Geobot Inst Eidgenoss Tech Hochsch Stift Rubel 58:39–
54
IPCC (2007) Climate change 2007: working Group 1, fourth
assessment Report. WMO, UNEP
Kammer PA, Mohl A (2002) Factors controlling species rich-
ness in alpine plant communities: an assessment of the
importance of stress and disturbance. Arctic Antarct Al-
pine Res 34:398–407
Keller F, Kienast F, Beniston M (2000) Evidence of response
of vegetation to environmental change on high-elevation
sites in the Swiss Alps. Reg Environ Change 1:70–77
Klanderud K, Birks HJB (2003) Recent increases in species
richness and shifts in altitudinal distributions of Norwe-
gian mountain plants. Holocene 13:1–6
Korner C (2003) Alpine plant life. Functional plant ecology of
high mountain ecosystems. Springer, Berlin
Kullman L (2002) Rapid recent range-margin rise of tree and
shrub species in the Swedish Scandes. J Ecol 90:68–77
Kullman L (2006) Increase in plant species richness on alpine
summits in the Swedish Scandes—impacts of recent cli-
mate change. In: Price MF (ed) Global change in moun-
tain regions. Sapiens, Duncow, UK
Lauber K, Wagner G (1996) Flora Helvetica. Paul Haupt, Bern
MathSoft (1999) S-Plus 2000 Math Soft, Data analysis prod-
ucts division. Seattle, Washington, USA
Muller-Schneider P (1986) Verbreitungsbiologie der Blutenp-
flanzen Graubundens. Veroff Geobot Inst Eidgenoss Tech
Hochsch Zurich 85:1–263
Pauli H, Gottfried M, Grabherr G (1996) Effects of climate
change on mountain ecosystems - upward shifting of al-
pine plants. World Resource Rev 8:382–390
Pauli H, Gottfried M, Grabherr G (1999) Vascular plant dis-
tribution patterns at the low-temperature limits of plant
life—the alpine-nival ecotone of Mount Schrankogel
(Tyrol, Austria). Phytocoenologia 29:297–325
Pauli H, Gottfried M, Grabherr G (2001) High summits of the
Alps in a changing climate. The oldest observation series
on high mountain plant diversity in Europe. In: Walther
G-R, Burga CA, Edwards PJ (eds) Fingerprints of climate
change—Adapted behaviour and shifting species ranges.
Kluwer Academic Publisher, New York, pp 139–149
Peteet D (2000) Sensitivity and rapidity of vegetational re-
sponse to abrupt climate change. PNAS 97:1359–1361
Rothmaler W (2002) Exkursionsflora von Deutschland. Spek-
trum, Heidelberg
Rubel E (1912) Pflanzengeographische Monographie des
Berninagebietes. Engelmann, Leipzig
Sakai A, Larcher W (1987) Frost survival in plants: responses
and adaptation to freeing stress. Ecological studies 62.
Springer, Berlin
Schibler W (1898) Uber die nivale Flora der Landschaft Davos
Jahrb Schweiz Alpenclubs 33
Theodose TA, Bowman WD (1997) The influence of inter-
specific competition on the distribution of an alpine
graminoid: evidence for the importance of plant compe-
tition in an extreme environment. Oikos 79:101–114
Plant Ecol (2008) 195:179–196 195
123
Paper 1 - Changes in species richness 33
Theurillat J-P, Guisan A (2001) Potential impact of climate
change on vegetation in the European Alps: a review.
Clim Change 50:77–109
Thuiller W, Lavorel S, Araujo MB, Sykes MT, Prentice IC
(2005) Climate change threats to plant diversity in Eur-
ope. PNAS 102:8245–8250
van der Pijl L (1972) Principles of dispersal in higher plants.
Springer, Berlin
Virtanen R, Dirnbock T, Dullinger S, Grabherr G, Pauli H,
Staudinger M, Villar L (2003) Plant diversity of European
mountains- –a regional synthesis. In: Nagy L, Grabherr G,
Korner C, Thompson DBA (eds) Alpine biodiversity in
Europe: a Europe-wide assessment of biological richness
and change Ecological Studies 167. Springer, Heidelberg,
pp 149–172
Walther GR (2003) Plants in a warmer world. Perspect Plant
Ecol Evol Systemat 6:169–185
Walther GR, Beissner S, Burga CA (2005) Trends in the up-
ward shift of alpine plants. J Veg Sci 16:541–548
Walther GR, Burga CA, Edwards PJ (eds) (2001) Fingerprints
of climate change—adapted behaviour and shifting spe-
cies ranges. Kluwer Academic Publishers, New York
Walther GR, Pott R, Beissner S (2004) Climate change and
high mountain vegetation. In: Keplin B, Broll G, Mattes H
(eds) Mountain and northern ecosystems: Arbeiten aus
dem Institut fur Landschaftsokologie. Westfalische Wil-
helms-Universitat. Munster
196 Plant Ecol (2008) 195:179–196
123
34 Paper 1 - Changes in species richness

Paper 2
Comparison of growth parameters in different altitudes and methodological aspects of age measurements of three alpine
herbaceous species
Manuscript in preparation
35

Paper 2 – Herbchronology 36
Manuscript in preparation
Comparison of growth parameters in different altitudes and methodological aspects
of age measurements of three alpine herbaceous species
Abstract
Increasing temperatures may cause populations of alpine plant species to extend their
distributional range towards higher altitudes. Accordingly, upwardly migrating species
should have younger populations at their high-elevation habitats than at their low-elevation
habitats. Using herbchronology, we investigated if growth parameters such as age, root
growth rate and root diameter differed between high alpine and lower alpine populations of
Anthyllis vulneraria subsp. vulneraria, Minuartia gerardii and Trifolium pallescens, all of
them potential migrators. The results showed that none of the three parameters differed
between high and low altitude populations in any of the three species of this dataset. We
explored the possibility of avoiding the destructive technique of herbchronology by using
root diameter measurements for age prediction in alpine environments. The correlation
between age and root diameter was good and different for each species investigated, the fit
was sufficient to predict age from diameter. This implies the possibility of a continued
observation in long-term monitoring studies and allows an increased number of individuals
to be studied, as the measurement procedure is more rapid.
Keywords: herbchronology, Alps, Anthyllis vulneraria subsp. vulneraria, Minuartia
gerardii, Trifolium pallescens
Introduction
Substantial evidence of increasing species numbers on high alpine summits (Hofer, 1985;
Gottfried et al., 1994; Grabherr et al., 1994, 2001; Walther et al., 2005; Dubey and Yadav,
2006; Kullman, 2006; Holzinger et al., 2008) suggests that these species have been
migrating upwards. Accordingly, high-altitude populations of invading or migrating
species should show a population structure biased towards younger individuals compared
to low-altitude populations. The age structure of alpine populations has rarely been
described because most studies on plant age focus on age states rather than age itself
expressed in years (Rabotnov, 1969; Gatsuk et al., 1980). These analyses concentrated on
the importance of reproduction dynamics, i.e. flowering versus non-flowering and fruiting
versus non-fruiting, where the investigation effort is much reduced, as age itself is not
directly measured. For describing the frequency distribution of population age structures or

37 Paper 2 - Herbchronology
for monitoring populations over longer periods of time, however, measuring age directly
would be more suitable.
Growth increments in herbaceous plants provide essentially the same information as in
woody plants, but suitable methods were developed only fairly recently (von Arx and
Dietz, 2005, 2006; von Arx et al., 2006). The technique used for both age determination
and growth increment analysis is herbchronology, which essentially counts annual rings of
the root (Dietz and Ullmann, 1997). The method involves destruction of the individual by
dissecting the root. This study is among few that apply this technique in an alpine setting
(for others see Kuen and Erschbamer, 2002; Erschbamer and Retter, 2004). As alpine
populations, however, are often vulnerable, protected, or part of long-term monitoring
studies, this study compares herbchronology to a non-destructive method of age
determination by measuring the root diameter.
Material and Methods
Study species
Out of a set of 39 common alpine species that were tested for suitability for
herbchronology (Table 2), the following three alpine species were investigated: Anthyllis
vulneraria subsp. alpestris L. (Fabaceae), Minuartia gerardii (Willd.) Hayek
(Caryophyllaceae) and Trifolium pallescens Schreber (Fabaceae). The selection of species
was based on two criteria: abundance in the study area and clarity of annual rings in the
root. Furthermore, they are considered as potential migrant species.
All three species occur over a broad altitudinal range (subalpine to high alpine) in
the Alps and form clear taproots that can be used for herbchronology. Anthyllis vulneraria
subsp. alpestris is found from the montane to the alpine belt (about 1700 to 2900 m a.s.l.)
on stony grasslands and calcareous scree, Minuartia gerardii from the subalpine to
subnival belt (about 2000 to 3150 m a.s.l.) on both calcareous and siliceous grasslands and
scree, and Trifolium pallescens from the subalpine to subnival belt (about 2000 to 3100 m
a.s.l.) on scree, grasslands and moraines on siliceous soil (Fischer et al., 2005).
Study area
Eight of the nine selected mountains were in the central part of the Austrian Alps
(Salzburg and Tyrol), and one in Switzerland (Grisons). Table 1 lists study location and
population sample sizes. Sampling locations of plant populations were not randomly
selected, as all populations found along the hiking trail above 2000 m on each mountain
were collected. See the data analysis section for description of how populations were used

Paper 2 – Herbchronology 38
for the analyses. If not distinct (scattered distribution across a wider vertical range), some
individuals of the lower and upper extreme ends were taken.
Data collection
For each species, we selected sample sites on each mountain that spanned the
altitudinal range of the species on that mountain (first/last population that was encountered
during ascent). Sample sites were located in treeless, mostly alpine grassland vegetation.
Before data collection, population size was roughly estimated by counting. Only
populations with more than five individuals were sampled because of the sensitivity of
alpine populations and the destructiveness of the method. Not more than 30% of the
individuals were selected randomly at each site. Two to 40 individuals of varying size were
collected in summer 2005. The study focused on flowering individuals only, as the rings in
very small and non-flowering individuals are not clearly visible and therefore unsuitable
for analysis of age and growth patterns with herbchronology (compare von Arx et al.,
2006). Each plant was rooted out and the plant material was stored in 60% ethanol for
further analysis in the laboratory.
Herbchronology
‘Herbchronology’ emerged from the well-established dendrochronology. It involves
analysing growth structures in the roots of herbaceous plants, which in many cases form
annual rings just as trees do. Herbchronology has recently been used in studies on age and
population structure and has been proven to be a useful method if species form clearly
demarcated annual rings (Dietz and Ullmann, 1997). Most studies have investigated weeds
or invasive populations (Dietz and Ullmann, 1998; Dietz et al., 1999; Dietz et al., 2004;
Perkins et al., 2006), and a database by Křivánek (2003) lists many lowland species,
classifying their usefulness in herbchronological studies. This method has recently also
been used for alpine species (Kuen and Erschbamer, 2002; Erschbamer and Retter, 2004;
von Arx et al., 2006).
In this study, sample slices (~ 10 µm) of the root were cut approximately 3 cm
underneath the original soil surface using a microtome (Reichert, Austria). We used the
same method as von Arx et al. (2006) regarding sample preparation and ring width
analysis. Root diameter as well as xylem diameter was measured to the nearest 0.1 mm
under a microscope (Leitz Laborlux D).

39 Paper 2 - Herbchronology
Data analysis
Root growth rate (RGR) was calculated using the xylem diameter measurements (Dx)
according to the following formula:
RGR=Dx/age
On each mountain where at least two populations of more than four individuals were
found, the highest and lowest populations were compared in terms of age, diameter and
RGR by applying a Wilcox test for each species (Fig. 1).
To show the relationship between root diameter and age for each species a general linear
model (GLM) with Poisson error distribution was used on all individuals found in the
study. Confidence intervals (95%) were calculated and shown (Fig. 2). The fit of the
models were shown by D2 values (Guisan and Zimmermann, 2000), an equivalent to the R2
in linear regression models. They were calculated in the following way:
D2 = (null deviance-residual deviance)/null deviance
The analyses were done using R (version 2.8.1).
Results
Herbchronology worked well on the three selected species. Annual rings were
smallest and most difficult to distinguish in Minuartia gerardii (MG), which also had the
smallest root diameter. Large differences between xylem diameter and root diameter were
found in Anthyllis vulneraria subsp. alpestris (AV) and Trifolium pallescens (TP), due to a
very thick bark.
Age, RGR and diameter versus altitude
There were no significant differences in age between high and low populations
(except for AV and TP on one mountain each). Similarly, there was no difference in RGR
between high- and low-altitude populations on the mountains except for AV on one
mountain. Root diameter differed significantly only for AV and TP on one mountain each.
(Fig. 1).
Diameter versus age
Age and root diameter were significantly correlated in all three species, so therefore
age can be predicted from diameter (see Table 3 and Fig. 2).

Paper 2 – Herbchronology 40
Discussion
Age versus altitude
Differences in age of individuals in high versus low altitude population could be of three
kinds: high populations are younger, older or there is no difference. Our hypothesis was
that the populations higher up experience rejuvenation due to migration caused by
temperature changes. One study that has tackled this question before is von Arx et al.
(2006). They found higher populations to have a higher proportion of older individuals and
argue that the reason is the stress-tolerant and ‘conservative’ life strategies of plants in high
elevations. Low temperatures, very short growing season and high solar radiation make
plant life harsh (Mooney and Billings, 1965; Körner, 2003) and call for special adaptations.
One argument is that a high level of carbohydrate storage is necessary as a reserve for
severe conditions (Stearns, 1976; Chapin III et al., 1990; Roff, 1992). As this happens at
the cost of growth and reproduction, longer life spans may be needed to complete the
essential cycles.
On most mountains in this dataset, however, the investigated species did not show a
significant difference between high and low altitude populations in terms of their age.
Reasons for this could be that either both of the two mentioned hypotheses are true, but
they counteract, so no effect is visible, or there simply is no difference between the
populations in high and low altitudes in terms of age structure. A limitation in all cases is
the number of populations and individuals tested in this dataset. A trend might be found if
more data could be gathered, however, this would involve destruction of more individuals
or the use of an alternative and less destructive method. See below for the discussion and
findings regarding herbchronology.
RGR and diameter versus altitude
Better growing conditions at lower altitudes should increase annual growth and
possibly root size. Most studies find temperature to be the limiting factor for growth in
high altitudes (Körner, 2003), although other factors may play a role. Dendrochronology
and studies of alpine tree lines reveal that same-aged individuals have thinner rings (i.e.
less growth) with increasing altitude. This reflects the limitations of lower temperatures as
altitudes increase (Woodward, 1987; Pyrke and Kirkpatrick, 1994; Körner, 1998; Grace et
al., 2002; Körner, 2003; Luo et al., 2004). Our data set, however, shows no such trend: the
annual growth is the same for all altitudes in all species. The reasons for this pattern are
unclear. At lower temperatures, the usage of photosynthetic products rather than
photosynthesis itself limits growth (Grace et al., 2002; Körner, 2003). This leads to

41 Paper 2 - Herbchronology
increased storage of carbohydrate products (Warren-Wilson, 1966; Sveinbjörnsson et al.,
1992; Skre, 1993) rather than growth, and explains the same biomass in same-aged
individuals at higher and lower elevations even though plant size and therefore root
diameter differs (Bernoulli and Körner, 1999). Although we did not investigate biomass,
the constant root growth rate at all altitudes allows the hypothesis that the limits of
utilisation of photosynthetic products have not been reached in the studied species. Root
growth should therefore be the same in all altitudes, as observed in this study. Similarly,
Ranunculus glacialis did not grow faster at higher temperatures (Totland and Alatalo,
2002). Alternatively, the limitations of this dataset might be the predominant reason for the
absence of significant differences and trends.
Herbchronology – diameter versus age
The results show that herbchronology can be used as a dating method for selected species
in an alpine setting (Kuen and Erschbamer, 2002; Erschbamer and Retter, 2004). It is,
however, a destructive method, which is not useful for long-term observations of
individual plants. An alternative could be simple measurements of the root diameter that
were found to be highly related to age for the three species investigated (compare Fig. 3).
Moreover, the time effort for age determination per individual would be much reduced
and, thus, a large number of samples per unit of time could be studied.
The relationship between diameter and age, however, differed for each species. Therefore,
more fundamental research on more species would be required for determining the species-
specific ratio of root diameter versus age. This would allow altitudinal gradient studies of
larger sets of species. Křivánek’s database on lowland species could serve as an example
(Křivánek, 2003).
References
Bernoulli, M. and Körner, C., 1999: Dry matter allocation in treeline trees. Phyton-Annales Rei Botanicae, 39: 7-11.
Chapin III, F. S., Schulze, E. D., and Mooney, H. A., 1990: The ecology and economics of storage in plants. Annual Review of Ecology and Systematics, 21: 423-447.
Dietz, H. and Ullmann, I., 1997: Age-determination of di-cotyledonous herbaceous perennials by means of annual rings: exception or rule? Annals of Botany, 80: 377-379.
Dietz, H. and Ullmann, I., 1998: Ecological application of ‘Herbchronology’: comparative stand age structure analy-ses of the invasive plant Bunias orientalis L. Annals of Botany, 82: 471-480.
Dietz, H., Fischer, M., and Schmid, B., 1999: Demographic and genetic invasion history of a 9-year-old roadside population of Bunias orientalis L. (Brassicaceae). Oecologia, 120: 225-234.

Paper 2 – Herbchronology 42
Dietz, H., von Arx, G., and Dietz, S., 2004: Growth patterns in two alpine forbs as preserved in annual rings of the roots: the influence of a snowbank gradient. Arctic, Antarctic, and Alpine Research, 36: 591-597.
Dubey, B. and Yadav, R., 2006: Migration of plant species in response to recent climate change in the western Himalaya, India. In Price, M. F. (ed.), Global Change in Mountain Regions. Duncow, UK: Sapiens.
Erschbamer, B. and Retter, V., 2004: How long can glacier forland species live? Flora, 199: 500-504.
Fischer, M., Adler, W., and Oswald, K., 2005: Exkursionsflora für Österreich, Liechtenstein und Südtirol. 2nd ed. Linz, Austria: Land Oberösterreich, Biologiezentrum der OÖ Landesmuseen.
Gatsuk, L. E., Smirnova, O. V., Vorontzova, L. I., Zaugolnova, L. B., and Zhukova, L. A., 1980: Age states of plants of various growth forms: a review. Journal of Ecology, 68: 675-696.
Gottfried, M., Pauli, H., and Grabherr, G., 1994: Die Alpen im "Treibhaus": Nachweise für das erwärmungsbedingte Höhersteigen der alpinen und nivalen Vegetation. Jahrbuch des Vereins zum Schutz der Bergwelt, München, 59: 13-27.
Grabherr, G., Gottfried, M., and Pauli, H., 1994: Climate effects on mountain plants. Nature, 369: 448.
Grabherr, G., Gottfried, M., and Pauli, H., 2001: Long-term monitoring of mountain peaks in the Alps. In Burga, C. A. and Kratochwil, A. (eds.), Biomonitoring: General and applied aspects on regional and global scales. Dordrecht: Tasks for Vegetation Science, Kluwer, 153-177.
Grace, J., Berninger, F., and Nagy, L., 2002: Impacts of climate change on the tree line. Annals of Botany, 90: 537-544.
Guisan, A. and Zimmermann, N. E., 2000: Predictive habitat distribution models in ecology. Ecological Modelling, 135: 147-186.
Hofer, H. R., 1985: Veränderungen in der Vegetation von 14 Gipfeln des Berninagebietes zwischen 1905 und 1985. Ber. Geobot. Inst. Eidgenöss. Tech. Hochsch. Stift. Rübel, 58: 39-54.
Holzinger, B., Hülber, K., Camenisch, M., and Grabherr, G., 2008: Changes in species richness over 100 years in the Alps: elevational gradient, bedrock effects, and migration rates. Plant Ecology, 195: 179-196.
Körner, C., 1998: A re-assessment of the high elevation treeline positions and their explanation. Oecologia, 115: 445-459.
Körner, C., 2003: Alpine plant life. Functional plant ecology of high mountain ecosystems. 2nd ed. Berlin: Springer.
Křivánek, M., 2003: Využití herbochronologie při studiu kritických fází životního cyklu vytrvalých druhů bylin [Application of herbchronology to analysis of critical phases in life cycles of perennial herbs], Dept. of Botany, Faculty of Sciences, Charles University, Prague. Pages pp.
Kuen, V. and Erschbamer, B., 2002: Comparative study between morphology and age of Trifolium pallescens in a glacier foreland of the Central Alps. Flora, 197: 379-384.
Kullman, L., 2006: Increase in plant species richness on alpine summits in the Swedish Scandes - impacts of recent climate change. In Price, M. F. (ed.), Global Change in Mountain Regions. Duncow, UK: Sapiens.
Luo, T. X., Pan, Y. D., Ouyang, H., Shi, P. L., Luo, J., Yu, Z. L., and Lu, Q., 2004: Leaf area index and net primary productivity along subtropical to alpine gradients in the Tibetan Plateau. Global Ecology and Biogeorgraphy, 13: 345-358.
Mooney, H. A. and Billings, W. D., 1965: Effects of altitude on carbohydrate content of mountain plants. Ecology, 46: 750-751.

43 Paper 2 - Herbchronology
Perkins, D. L., Parks, C. G., Dwire, K. A., Endress, B. A., and Johnson, K. L., 2006: Age structure and age-related performance of sulfur cinquefoil (Potentilla recta). Weed Science, 54: 87-93.
Pyrke, A. F. and Kirkpatrick, J. B., 1994: Growth-rate and basal area response curves of four Eucalyptus species on Mt. Wellington, Tasmania. Journal of Vegetation Science, 5: 13-24.
Rabotnov, T. A., 1969: On coenopopulations of perennial herbaceous plants in natural coenoses. Plant Ecology, 19: 87-95.
Roff, A. D., 1992: The evolution of life histories - theory and analysis. New York: Chapman and Hall.
Skre, O., 1993: Growth of mountain birch (Betula pubescens Ehrh) in response to changing temperature. In Alden, J., Mastrantonio, J. L., and Ödum, S. (eds.), Forest development in cold climates. New York: Plenum Press, 65-78.
Stearns, S. C., 1976: Life-history tactics: review of ideas. Quarterly Review of Biology, 51: 3-47.
Sveinbjörnsson, B., Nordell, O., and Hauhanen, H., 1992: Nutrient relations of mountain birch growth at and below the elevational tree line in Swedish Lapland. Functional Ecology, 6: 213-220.
Totland, O. and Alatalo, J. M., 2002: Effects of temperature and snowmelt on growth, reproduction, and flowering phenology in the arctic/alpine herb, Ranunculus glacialis. Oecologia, 133: 168-175.
von Arx, G. and Dietz, H., 2005: Automated image analysis of annual rings in the roots of perennial forbs. International Journal of Plant Sciences, 166: 723-732.
von Arx, G. and Dietz, H., 2006: Growth rings in the roots of temperate forbs are robust annual markers. Plant Biology, 8: 224-233.
von Arx, G., Edwards, P. J., and Dietz, H., 2006: Evidence for life history changes in high-altitude populations of three perennial forbs. Ecology, 87: 665-674.
Walther, G. R., Beissner, S., and Burga, C. A., 2005: Trends in the upward shift of alpine plants. J Veg Sci, 16: 541-548.
Warren-Wilson, J. W., 1966: An analysis of plant growth and its control in arctic environments. Annals of Botany, 30: 383-402.
Woodward, F. I., 1987: Climate and plant distribution. Cambridge, UK: Cambridge University Press.

Paper 2 – Herbchronology 44
Figure 1
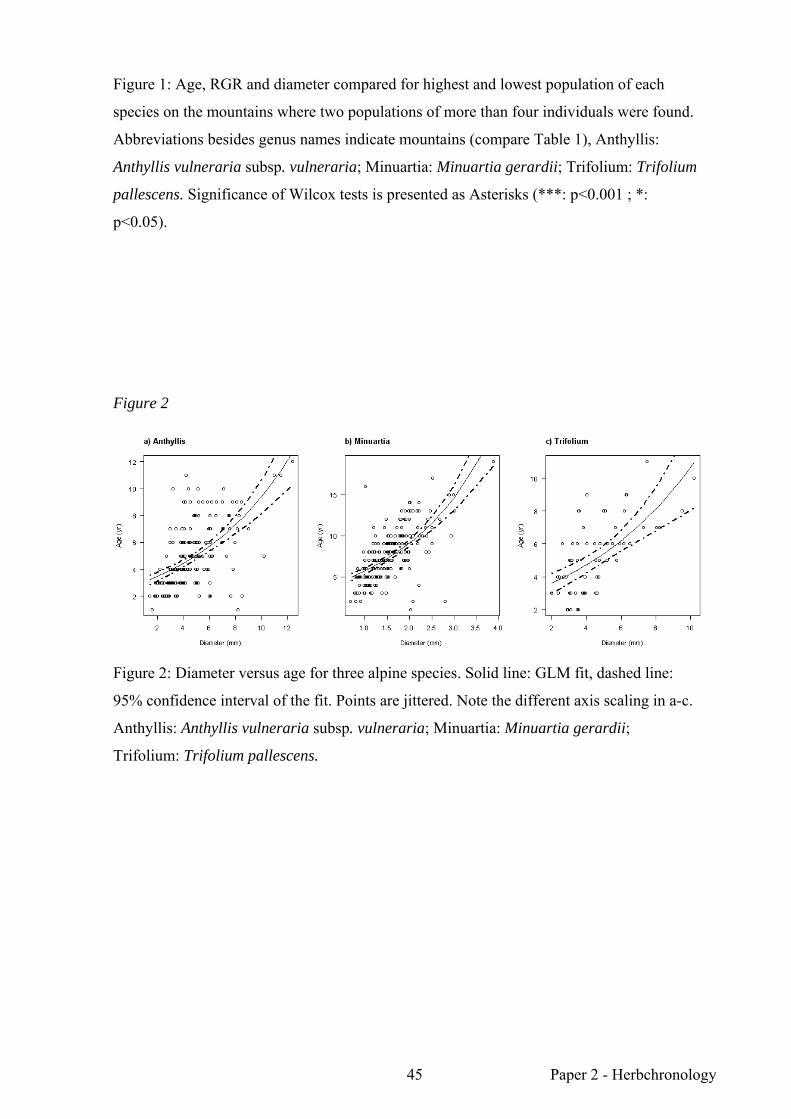
45 Paper 2 - Herbchronology
Figure 1: Age, RGR and diameter compared for highest and lowest population of each
species on the mountains where two populations of more than four individuals were found.
Abbreviations besides genus names indicate mountains (compare Table 1), Anthyllis:
Anthyllis vulneraria subsp. vulneraria; Minuartia: Minuartia gerardii; Trifolium: Trifolium
pallescens. Significance of Wilcox tests is presented as Asterisks (***: p<0.001 ; *:
p<0.05).
Figure 2
Figure 2: Diameter versus age for three alpine species. Solid line: GLM fit, dashed line:
95% confidence interval of the fit. Points are jittered. Note the different axis scaling in a-c.
Anthyllis: Anthyllis vulneraria subsp. vulneraria; Minuartia: Minuartia gerardii;
Trifolium: Trifolium pallescens.

Paper 2 – Herbchronology 46
Table 1
Table 1: Description of sampling sites, position and sample number. Populations are
numbered according to their altitude (lowest: 1, highest: 4). AV: Anthyllis vulneraria
subsp. vulneraria; MG: Minuartia gerardii; TP: Trifolium pallescens.
Mountain Abbrevi-
ation Max
altitude Longitude Latitude speciespopu-lation
site altitude
number of
samples
Hochkönig HK 2941 13° 03' 57"
E 47° 25' 22"
N MG 1 2080 10 MG 2 2320 13 MG 3 2530 11 MG 4 2720 11
Hoher Göll HG 2522 13° 04' 01"
E 47° 35' 40"
N MG 1 2300 9 MG 4 2500 13 Kleiner Tenn KT 3158
12° 45' 24" E
47° 11' 07" N AV 1 2200 28
AV 4 2700 39
Mosermandl MM 2680 13° 23' 44"
E 47° 12' 22"
N AV 1 2100 12 AV 2 2250 16 AV 4 2350 13 MG 1 2350 13
Piz Arina PA 2828 10° 38' 33"
E 46° 09' 00"
N AV 1 2100 26 AV 4 2300 18 MG 1 2800 33
Schrankogel SK 3479 11° 05' 57''
E 47° 02' 38''
N TP 1 2100 6 TP 4 2600 22
Silbereck SE 2804 13° 25' 52"
E 47° 05' 14"
N MG 0 2500 3 MG 1 2700 24 MG 4 2800 12 AV 1 2250 13
Weisseck WE 2711 13° 23' 39"
E 47° 09' 45''
N TP 1 2300 18 MG 1 2300 2 TP 4 2480 15 MG 2 2480 25 MG 4 2700 4 Mainzer Höhenweg
MH 3000 46° 57' 41" N
10° 54' 02" E
MG 1 2900 12
Rettenzink RZ 2510 47° 13' 26"
N 12° 45' 56"
E AV 1 2320 18

47 Paper 2 - Herbchronology
Table 2
Table 2: Suitability of a selection of alpine species for herbchronology
Family Species annual rings visible?
who tested this
Apiaceae Ligusticum muttellina no This study Apiaceae Peucedanum ostrutium no This study Asteraceae Achillea moschata yes This study Asteraceae Artemisia mutellina yes Erschbamer et al. 2004 Asteraceae Aster bellidiastrum no This study Asteraceae Cirsium spinosissimum yes Dietz et al. 2004 Asteraceae Homogyne alpina no This study Asteraceae Leontodon helveticus no This study Asteraceae Leucanthemopsis alpina no This study Asteraceae Solidago virgaurea yes This study Boraginaceae Myosotis alpestris not
clear This study
Brassicaceae Draba aizoides yes Dietz et al. 2002 Campanulaceae Campanula barbata no This study Campanulaceae Campanula scheuchzeri no This study Caryophyllaceae Minuartia gerardii yes This study Caryophyllaceae Silene acaulis yes Benedict 1989 Cistaceae Helianthemum grandiflorum yes Erschbamer 2004 Ericaceae Cassiope tetragona yes Havström et al. 1995 Ericaceae Rhododendron ferrugineum yes Pornon et al. 1995 Fabaceae Anthyllis vulneraria ssp
alpestris yes Erschbamer et al. 2004
Fabaceae Lotus corniculatus yes A.Münch, R. Schwarz, unpublished (in Erschbamer et al. 2004)
Fabaceae Trifolium badium not clear
This study
Fabaceae Trifolium pallescens yes Kuen et al. 2002 Fabaceae Trifolium pratense ssp. nivale yes Erschbamer et al. 2004 Gentianaceae Gentiana punctata no This study Lamiaceae Thymus sp. yes This study Polygonaceae Oxyria digyna yes Erschbamer et al. 2004, Humlum
1981 Primulaceae Androsace lactea no This study Primulaceae Primula sp. no This study Ranunculaceae Ranunculus sp. no This study Rosaceae Alchemilla alpina yes Dietz et al. 2002 Rosaceae Geum montanum no This study Rosaceae Potentilla aurea not
clear This study

Paper 2 – Herbchronology 48
Family Species annual rings visible?
who tested this
Rosaceae Potentilla crantzii yes This study Rosaceae Sibbaldia procumbens yes This study Saxifragaceae Saxifraga oppositifolia yes Erschbamer et al. 2004 Scrophulariaceae Bartsia alpina no This study Scrophulariaceae Pedicularis recutita yes Dietz et al. 2004 Scrophulariaceae Pedicularis tuberosa yes This study
Table 3
Table 3: Results of general linear models with Poisson error distribution between
age and diameter of individuals for the three species. AV: Anthyllis vulneraria subsp.
vulneraria, MG: Minuartia gerardii, TP: Trifolium pallescens
Species z-value p
value null
deviance residual deviance
residual degrees
of freedom D2
AV 8.376 <0.001 205.41 141.81 180 0.310MG 10.67 <0.001 264.5 160.06 193 0.395TP 4.95 <0.001 56.909 34.29 59 0.397

Paper 3
What happens when alpine plants are exposed to a lowland climate?
Barbara Friedmann, Georg Grabherr
Manuscript in print by
Verhandlungen der Zoologisch-Botanischen-Gesellschaft Österreichs
49

Paper 3 – Transplantation of alpine plants 50
What happens when alpine plants are exposed to a lowland climate?
Barbara Friedmann, Georg Grabherr
Abstract
To explore effects of climate change on alpine plant assemblages, in summer 2004, ten
blocks of high alpine vegetation were transplanted to the outdoor part of the greenhouse at
the University of Vienna, and observed for four years. Newly appearing weeds were
removed. Most plants, but not all, increased up to more than twice their original size and
competitive effects were detected in most of the blocks. Seeds of a few species germinated
from outside the blocks. Bryophytes appeared in high density during winter. Individualistic
growth response was responsible for enhanced competition whereas in most cases the
winner and losers were not expected. Climate change will certainly lead to new
configurations in alpine plant communities, however, we conclude that predictions of
winners and losers derived from current behaviour will be probably misleading.
Zusammenfassung
Um eine Vorstellung zu gewinnen, wie sich in den kommenden Jahrzehnten der
Klimaerwärmung auf die Hochgebirgsvegetation auswirken könnte, wurde ein
Transplantationsexperiment durchgeführt. Zu diesem Zwecke wurden zehn Ziegel alpiner
Pflanzengesellschaften in den Glashausgarten der Universität Wien transplantiert und vier
Jahre lang beobachtet. Die Pflanzen zeigten gesteigertes Wachstum bis zum Doppelten
ihrer Größe. Ebenso waren Konkurrenzeffekte offensichtlich. Einige Arten konnten sich
durch Samen auch außerhalb der Ziegel ansiedeln. Bryophyten füllten in den
Wintermonaten die Lücken zwischen den Gefäßpflanzen. Auch wenn das Experiment nur
eine grobe Annäherung darstellt, wurde doch klar, dass unter wärmeren Bedingungen
Konkurrenz zu neuen Strukturen und Konfigurationen innerhalb der bestehenden
Vegetation führt. Aufgrund der vielfach überraschenden winner-loser Effekte sind
Voraussagen auf Basis des aktuellen Verhaltens wahrscheinlich falsch.
Keywords
Transplantation, Vienna, temperature increase, alpine plants, competition
Introduction
Climate change effect on plants and temperature increase in particular, has been subject of
many research activities in the last decades as reviewed e.g. by THEURILLAT & GUISAN
(2001), PARMESAN & YOHE (2003) and WALTHER et al. (2005). Effects on particular plant

51 Paper 3 – Transplantation of alpine plants
species have been equally focused on as effects on the higher complexity of plant
assemblages and regional floras (BAKKENES et al. 2002; DIRNBÖCK et al. 2003; THUILLER
et al. 2005; AERTS et al. 2006; ERSCHBAMER 2007; KLANDERUD 2008). In-situ as well as
transplantation experiments with increased temperatures and/or increased CO2
concentration have been carried out (WOODWARD 1979; HOLLAND 1980; BENEDICT 1989;
LINK et al. 2003; MCKONE et al. 2004; BOWMAN et al. 2008). In-situ experiments, such as
those of the ITEX (International Tundra Experiment, http://www.geog.ubc.ca/itex/)
network, have found effects on species composition (FONTY et al. 2009; PRIETO et al.
2009), growth (ARFT et al. 1999; KUDERNATSCH et al. 2008), herbivory (HODKINSON &
BIRD 1998; WALTHER et al. 2005; O'CONNOR 2009), pollination (STENSTROM et al. 1997),
respiration (RYAN 1991), phenology (BORNER et al. 2008), dispersal (KLANDERUD 2008).
Evidently, climate change affects all aspects of the species - environment interaction.
Transplantation experiments have found for example that warmer and wetter conditions
reduce reproductive effort and cover (LINK et al. 2003), while others found that plants only
survived in conditions that were similar to those found in their natural habitat (BOWMAN et
al. 2008).
So how would alpine plants react if temperatures were to rise to extreme levels? The
different aspects of reaction, predicted and observed, are too numerous to be examined at
once. Studies are always limited to showing only one or two effects at a time. The present
study focused on temperature change, but attempted to observe all possible reactions, both
species specific and “community” reactions. Instead of choosing a temperature change of a
few degrees as predicted in various models, we selected an extreme temperature increase:
high alpine plants were transplanted to the Vienna lowlands, which is a change from about
-6°C to +10°C annual mean temperature. These temperatures are without doubt rather
fictitious; they will not be reached in the plant’s native habitats, not even in the most
extreme predictions. However, this gave the opportunity to observe relatively large
changes within a short time frame of a few years.
The main questions in this study were: what and how strong are the reactions of the various
plants to the sudden warming? Are there “winners” and “losers” and what species were
identified as such?
Materials and Method
In the summer of 2004, ten blocks of about 20x20cm size and 10cm depth were dug out on
three different mountains in Switzerland and Austria. The sampling sites were all about

Paper 3 – Transplantation of alpine plants 52
between 2400 and 2900 m in elevation. Both siliceous and calcareous bedrock sites were
chosen. See Table 1 for details.
Table 1: Locations of the origin of the blocks used in this transplantation experiment.
Tabelle 1: Herkunft der Ziegel, die in diesem Transplantationsexperiment verwendet
wurden.
block mountain altitude bedrock location
A1, B1,
C1, D1
Dachstein 2400 calcareous 47°28.51’N
13°36.365’E
B2, B3,
D2, D3
Leidbachhorn 2610 siliceous 46° 43' 17.1" N
9° 49' 20" E
C2, C3 Piz
Chatscheders
2700 siliceous 46° 28' 40.8" N
10° 0' 59.6" E
The blocks were transported to the greenhouse of the University of Vienna (for
arrangement see Figure 1).
Figure 1: Overview of the arrangement and numbering of blocks.
Abbildung 1: Anordnung und Nummerierung der Ziegel.
In the outdoor part of the greenhouse, the blocks were planted into buckets about 20cm
depth with sand and pebbles to ensure enough humidity was conserved in the soil. The

53 Paper 3 – Transplantation of alpine plants
buckets were dug into soil, to ensure that temperature is kept constant with the surrounding
earth (Figure 2).
Figure 2: Schematic depiction of alpine blocks being transplanted in the greenhouse area
of the University of Vienna.
Abbildung 2: Schematische Darstellung der Ziegel, die in den Glashausgarten der
Universität Wien transplantiert wurden.
Every day, the blocks were watered twice, once in the morning and once in the evening. A
net was put up covering the blocks in about 20 cm distance to protect against birds
especially in the spring, but the net-loops were large enough in order to not hinder potential
pollinators. Emerging weeds were removed. Besides these precautions, no other measures
were taken and the vegetation in the blocks was left to develop by itself.
Every week, photos were taken of each block and of the entire setup. Additionally, the top
cover of vegetation was estimated, both total vegetation and individual species. Naturally,
adding up the top cover of all species often results in more than the estimated total
vegetation cover, but this mostly is due to overlap. In fruiting and blooming season, fruits
and flowers were counted.
For compilation and analysis of development of the blocks in their new environment,
especially the photographs were used as they give the most apparent indication of change.
Earth
Pebbles, small stones,
Alpine soil
Soil

Paper 3 – Transplantation of alpine plants 54
Results
Descriptions of the selected blocks
In the following, selected blocks are described in some detail, a synthesis is provided at the
end.
Dachstein, Austria
Block A1:
Figure 3: block A1 Abbildung 3: block A1
Carex firma Host and Dryas octopetala L. dominated this block in the first year. Both
Persicaria vivipara L. and Helianthemum nummularium (L.) Mill. were also present, but
only covered a very small proportion of the block. Within the three years, cover of the two
dominant species increased, while P. vivipara L. disappeared. H. nummularium (L.) Mill.
only took some space on the edge in year 1 and 2 and then did not appear again. By year 3,
both D. octopetala L. and C. firma Host grew towards the edge of the block, D. octopetala
L. and its roots outgrew the block. No weed species appeared in this block during the three
years, which was possibly due to the high top cover of the dominant species.
Block B1:
Figure 4: block B1 Abbildung 4: block B1
In year 1, the most prominent species were Salix serpyllifolia Scop. and Silene acaulis (L.)
Jacq. mixed in with a few Arabis pumila Jacq. and Campanula cochleariifolia Lam.

55 Paper 3 – Transplantation of alpine plants
individuals. The first major change was observed in year 2, when C. cochleariifolia Lam.
bloomed over the entire block, which was repeated every year until the end of the
observation. A. pumila Jacq. leaves increased in size three times by the first year and
showed traces of bite. They were the only leaves not to be shed and remain green during
the winter months of year 2 to 3. A. pumila Jacq. bloomed in March before C.
cochleariifolia Lam. and also took up large space. A. pumila Jacq. individuals had their
first outside block occurrence in year 3, obviously dispersed there. This was the only
species to disperse out of the blocks by seed. Poa alpina L. from another block dispersed
viviparously. Silene acaulis (L.) Jacq., Moehringia ciliata (Scop.) Dalla Torre, Luzula
spicata (L.) DC. and Cardamine resedifolia L. disappeared under the dominance of A.
pumila Jacq. (fruiting plants visible as the brown “grasslike” structures in the right picture,
25.05.2008) and C. cochleariifolia Lam. and could not be seen by year 2 and 3. S.
serpyllifolia Scop. started to extend its aboveground roots towards the edges of the block at
the end of year 1 and reached the surrounding soil at the end of year 2. It remained
growing outside the block while being rooted in the block until the end of observation.
Block C1:
Figure 5: block C1 Abbildung 5: block C1
The most prominent species on this block were Carex firma Host and Saxifraga caesia L.,
both of which took about equal amount of space. By the end of year 3, C. firma Host
covered about three quarters of the block, while S. caesia L. kept to the top cover of the
beginning. Leaf sizes increased in both species. One more species on this block was
Persicaria vivipara L., which disappeared within the first two years of observation, even
though it bloomed in the first year.

Paper 3 – Transplantation of alpine plants 56
Block D1:
Figure 6: block D1 Abbildung 6: block D1
The three dominant species on this block were Galium noricum Ehrend., Helianthemum
nummularium (L.) Mill., and Carex firma Host. In the beginning, C. firma Host was
blooming and fruiting. In year 1, both G. noricum Ehrend. and H. nummularium (L.) Mill.
grew more quickly than C. firma Host and soon the entire block was covered by those two
species, but with C. firma Host still present. In summer of year 2, C. firma Host grew very
quickly, but by the end of summer, it was overtaken by especially H. nummularium (L.)
Mill. and G. noricum Ehrend., while after year 2 and especially in year 3, H. nummularium
(L.) Mill. outgrew both all species and the block itself.
Leidbachhorn, Switzerland
Block B2:
Figure 7: block B2 Abbildung 7: block B2
In the beginning, Poa alpina L. was dominant, but Saxifraga bryoides L. and Androsace
alpina (L.) Lam. and Erigeron uniflorus L. were also found. By year 2, Poa alpina L.
dominated the entire block, leaving no room for other species, only in the end of summer
E. uniflorus L. grew on one side. In summer of year 3, E. uniflorus L. took almost half the
space of the block, while P. alpina L. seemed to die off. Outside the block, where P. alpina

57 Paper 3 – Transplantation of alpine plants
L. inflorescences (viviparous) had touched the soil, individuals were found. By the
beginning of year 4, only E. uniflorus L. was left and P. alpina L. died off.
Block B3:
Figure 8: block B3 Abbildung 8: Block B3
In this block, the following species were dominant: Saxifraga bryoides L., Sibbaldia
procumbens L., Leucanthemopsis alpina (L.) Heywood, and Oreochloa disticha (Wulfen)
Link. A few Poa alpina L. and Gnaphalium supinum L. individuals were also present. In
year 1, Gentiana bavarica L. appeared, but disappeared again by the next year. Some
Euphrasia minima Jacq. ex DC. (annuals) individuals appeared until year 2, but then did
not appear again. By year 2, most S. bryoides L. was covered by either O. disticha
(Wulfen) Link or Agrostis alpina Scop. or Festuca sp.. Also S. procumbens L. increased in
size and cover. By the end of year 3, the number of grass tussocks had increased from three
to seven. Also, the species composition of those grasses changed from O. disticha
(Wulfen) Link and P. alpina L. to Festuca sp. and A. alpina Scop. S. procumbens L. and S.
bryoides L. were still present, but their cover decreased. L. alpina (L.) Heywood and G.
supinum L. disappeared from the block.
Block D2:
Figure 9: block D2 Abbildung 9: Block D2
There was one dominant species, which only slowly increased its cover: Minuartia
sedoides (L.) Hiern. It reached the edges of the block by year 3. However, growth was not
omnidirectional, there were some branches that increased more than the rest of the cushion,

Paper 3 – Transplantation of alpine plants 58
similar to Salix serpyllifolia Scop. in B1. There was a very short-lived increase of Veronica
alpina L. at the sides in year 3.
Block D3:
Figure 10: block D3 Abbildung 10: Block D3
This block was dominated by Leucanthemopsis alpina (L.) Heywood and Sibbaldia
procumbens L., as well as a cushion of Saxifraga bryoides L. By year 2, everything died
off besides an individual of S. procumbens L., as well as Agrostis sp. and Luzula spicata
(L.) DC. The latter both bloomed and fruited after one year. Cardamine resedifolia L.
appeared in greater numbers (it was also present before). Also, bryophytes had a high
cover. By the end of year 2, Agrostis sp. dominated, there were a few liverworts and also
C. resedifolia L. increased slowly in cover. S. procumbens L. increased again and Agrostis
sp. bloomed in the summer of year 3. At the end of the observation, Agrostis sp was the
most dominating together with S. procumbens L. and C. resedifolia L. It seemed that after
some adaption time, S. procumbens L. was able to deal with the temperatures better than
the rest of species of this block.
Piz Chatscheders, Switzerland Block C2:
Figure 11: block C2 Abbildung 11: Block C2
The prominent species on this block were Saxifraga paniculata Mill., Erigeron uniflorus
L. and Sempervivum montanum L., in about equal proportions. By May of year 2, E.
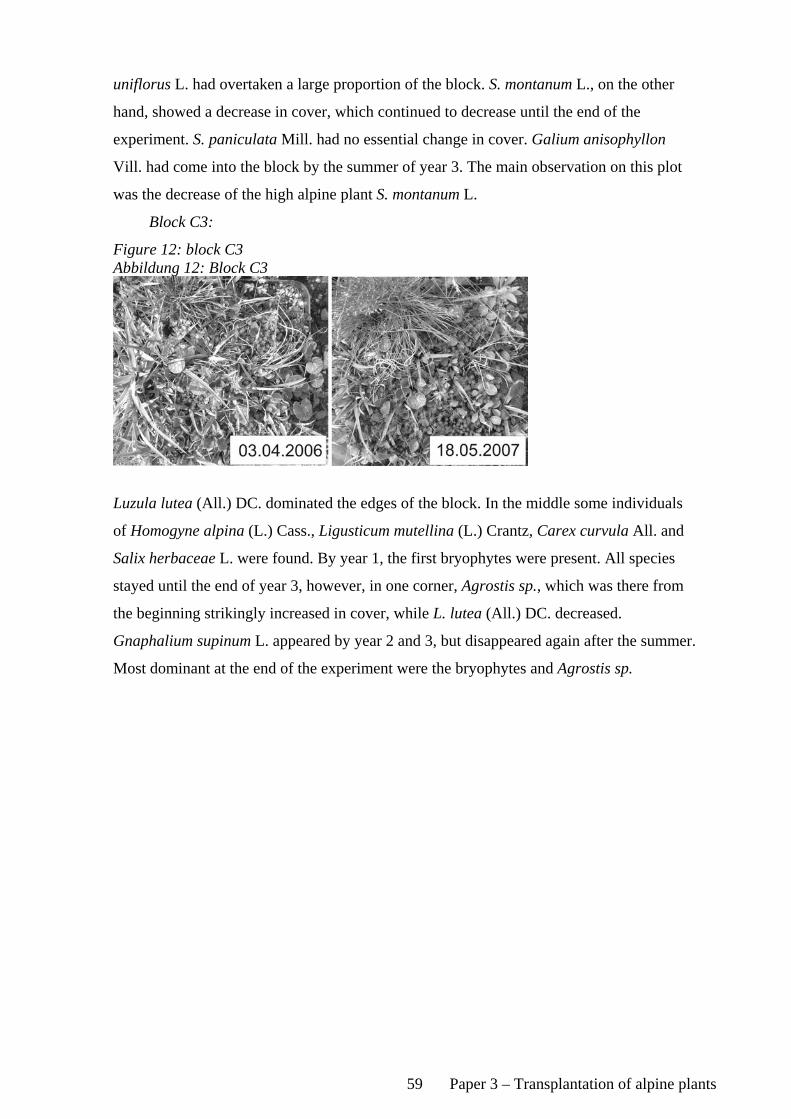
59 Paper 3 – Transplantation of alpine plants
uniflorus L. had overtaken a large proportion of the block. S. montanum L., on the other
hand, showed a decrease in cover, which continued to decrease until the end of the
experiment. S. paniculata Mill. had no essential change in cover. Galium anisophyllon
Vill. had come into the block by the summer of year 3. The main observation on this plot
was the decrease of the high alpine plant S. montanum L.
Block C3:
Figure 12: block C3 Abbildung 12: Block C3
Luzula lutea (All.) DC. dominated the edges of the block. In the middle some individuals
of Homogyne alpina (L.) Cass., Ligusticum mutellina (L.) Crantz, Carex curvula All. and
Salix herbaceae L. were found. By year 1, the first bryophytes were present. All species
stayed until the end of year 3, however, in one corner, Agrostis sp., which was there from
the beginning strikingly increased in cover, while L. lutea (All.) DC. decreased.
Gnaphalium supinum L. appeared by year 2 and 3, but disappeared again after the summer.
Most dominant at the end of the experiment were the bryophytes and Agrostis sp.

Paper 3 – Transplantation of alpine plants 60
Bryophyte growth
Bryophytes were observed to be much quicker in response to changing climatic conditions,
especially in winter months. By spring, bryophytes dominated many of the blocks, and
only in summer, when vascular plant growth resumed, bryophyte top cover decreased
again. These bryophytes were not species from the alpine environments but those from the
lowlands. It was impossible to limit their growth as was done for other weeds.
Figure 13: Bryophytes in blocks C2 (left) and D3 (right) Abbildung 13: Bryophyten in den Blöcken C2(links) und D3 (rechts)
Synthesis:
The observations of the plots revealed the following main results:
1. All species increased in size to a certain extent, with only some exceptions such as
those that were outcompeted and those bound to the strict leaf forms (e.g. Saxifraga
caesia L. in C1, Saxifraga paniculata Mill. in C2, Sempervivum montanum L. in C2).
• Species with “softer” and more flexible leaves and growth form seemed to adapt
more easily to the new growth situation, while for the species with more or less
invariable size (e.g. Crassulaceae species), less change was observed
• Some cushion plants, such as Minuartia sedoides (L.) Hiern (D2), slowly expanded
over the whole block and then extended their roots outside of the block. It seemed like
instead of remaining in the cushion form, it grew into a more prostrate form.
• Graminoids and the like adapted quickly to the changes (D3, C1, B2), but their
mostly tussock-like growth form seemed to hinder their occupation of a larger area
within a small time frame (see phalanx and guerilla strategies in LOVETT DOUST &
LOVETT DOUST 1982) compared to for example Helianthemum nummularium (L.) Mill.
(D1) or Campanula cochleariifolia Lam. species (B1).
2. Species reacted contrastingly in different plots, depending on their competitors: one
species dominant in one block was the inferior one in another block (e.g. Carex firma
Host in A1 and C1).

61 Paper 3 – Transplantation of alpine plants
3. Bryophyte species grew quickly and occupied considerable parts of the blocks,
especially in the winter and spring months, where temperatures rarely dropped below
freezing in Vienna. As bryophytes cease growth in lower temperature than vascular plant
species, they utilise the months when the vascular plants halt their growth.
4. Only a few species shed their seeds outside the blocks to the soil and grew there. Most
extended their roots (see e.g. Minartia sedoides (L.) Hiern in D2) towards the outside of
the blocks. The two species that were found outside were Arabis pumila Jacq. (from B1)
and Poa alpina L. (B2).
5. Some species were lost (Silene acaulis (L.) Jacq. in B1, Gentiana bavarica L. in B3,
Persicaria vivipara L. in C1 etc) either because they were outcompeted or they did not
tolerate the environmental conditions.
Discussion
Not surprisingly, the exposure of the alpine plants to a much warmer climate led to
increased growth and related competitive effects. We found, however, that the various
species reacted differently. There were “winners” and “losers”, some species increased in
size tremendously and some stayed more or less bound to their natural predefined form and
size. An individualistic response of plant species was also found at most ITEX sites using
open top chamber experiments (e.g. STENSTROM et al. 1997; FUJIMURA et al. 2008;
KLANDERUD 2008). Differences in morphological plasticity seem to be important when
interactions within whole communities are considered. They determine the competitive
power of the particular plants.
A clear advantage of this “shock-experiment” was certainly that the climate change effects
were clearly visible, the competitive ones in particular. This is in contrast to in situ
experiments simulating realistic scenarios. Most important and surprising were the many
discrepancies between what was expected and what then really happened. Probably no
alpine ecologists would have expected the “explosion” of Campanula cochleariifolia Lam.
or the competitive power of Arabis pumila Jacq. The main message we could take from our
experiment was that predictions about losers and winners in alpine environments derived
from current patterns are probably faulty.
Paper 3 – Transplantation of alpine plants 62
References
AERTS R., CORNELISSEN J. H. C. & DORREPAAL E., 2006: Plant Performance in a Warmer World: General Responses of Plants from Cold, Northern Biomes and the Importance of Winter and Spring Events. Plant Ecology. 182 (1-2), 65.
ARFT A. M., WALKER M. D., GUREVITCH J., ALATALO J. M., BRET-HARTE M. S., DALE M., DIEMER M., GUGERLI F., HENRY G. H. R., JONES M. H., HOLLISTER R. D., JONSDOTTIR I. S., LAINE K., LEVESQUE E., MARION G. M., MOLAU U., MOLGAARD P., NORDENHÄLL U., RASZHIVIN V., ROBINSON C. H., STARR G., STENSTRÖM A., STENSTRÖM M., TOTLAND O., TURNER P. L., WALKER L. J., WEBBER P. J., WELKER J. M. & WOOKEY P. A., 1999: Responses of tundra plants to experimental warming: Meta-analysis of the international tundra experiment. Ecological Monographs. 69 (4), 491-511.
BAKKENES M., ALKEMADE J. R. M., IHLE F., LEEMANS R. & LATOUR J. B., 2002: Assessing effects of forecasted climate change on the diversity and distribution of European higher plants for 2050. Global Change Biology. 8 (4), 390 - 407.
BENEDICT J. B., 1989: Use of Silene acaulis for dating: the relationship of cushion diameter to age. Arctic Alpine Research. 21 91-96.
BORNER A. P., KIELLAND K. & WALKER M. D., 2008: Effects of Simulated Climate Change on Plant Phenology and Nitrogen Mineralization in Arctic Tundra. Arctic, Antarctic, and Alpine Research. 40 (1), 27-38.
BOWMAN G., PERRET C., HOEHN S., GALEUCHET D. J. & FISCHER M., 2008: Habitat fragmentation and adaptation: a reciprocal replant-transplant experiment among 15 populations of Lychnis flos-cuculi. Journal of Ecology. 96 (5), 1056-1064.
DIRNBÖCK T., DULLINGER S. & GRABHERR G., 2003: A regional impact assessment of climate and land-use change on alpine vegetation. Journal of Biogeography. 30 401-417.
ERSCHBAMER B., 2007: Winners and losers of climate change in a central alpine glacier foreland. Arctic Antarctic and Alpine Research. 39 237-244.
FONTY E., SARTHOU C., LARPIN D. & PONGE J.-F., 2009: A 10-year decrease in plant species richness on a neotropical inselberg: detrimental effects of global warming? Global Change Biology. 15 (10), 2360-2374.
FUJIMURA K. E., EGGER K. N. & HENRY G. H. R., 2008: The effect of experimental warming on the root-associated fungal community of Salix arctica. ISME Journal. 2 105-114.
HODKINSON I. D. & BIRD J., 1998: Host-specific insect herbivores as sensors of climate change in Arctic and alpine environments. Arctic and Alpine Research. 30 (1), 78-83.
HOLLAND P. G., 1980: Transplant Experiments with Trout Lily at Mont St Hilaire, Quebec. Journal of Biogeography. 7 (3), 261-267.
KLANDERUD K., 2008: Species-specific responses of an alpine plant community under simulated environmental change. Journal of Vegetation Science. 19 (3), 363-372.

63 Paper 3 – Transplantation of alpine plants
KUDERNATSCH T., FISCHER A., BERNHARDT-RÖMERMANN M. & ABS C., 2008: Short-term effects of temperature enhancement on growth and reproduction of alpine grassland species. Basic and Applied Ecology. 9 (3), 263-274.
LINK S. O., SMITH J. L., HALVORSON J. J. & BOLTON H., 2003: A reciprocal transplant experiment within a climatic gradient in a semiarid shrub-steppe ecosystem: effects on bunchgrass growth and reproduction, soil carbon, and soil nitrogen. Global Change Biology. 9 (7), 1097 - 1105.
LOVETT DOUST L. & LOVETT DOUST J., 1982: The battle strategies of plants. New Scientist. 95 81-84.
MCKONE M. J., KELLY D. & LEE W. G., 2004: Effect of climate change on mast-seeding species: frequency of mass flowering and escape from specialist insect seed predators. Global Change Biology. 4 (6), 591-596.
O'CONNOR M. I., 2009: Warming strengthens an herbivore-plant interaction. Ecology. 90 (2), 388-398.
PARMESAN C. & YOHE G., 2003: A globally coherent fingerprint of climate change impacts across natural systems. Nature. 421 (6918), 37-42.
PRIETO P., PENUELAS J., LLORET F., LLORENS L. & ESTIARTE M., 2009: Experimental drought and warming decrease diversity and slow down post-fire succession in a Mediterranean shrubland. Ecography. 32 (4), 623-636.
RYAN M. G., 1991: Effects of Climate Change on Plant Respiration. Ecological Applications. 1 (2), 157-167.
STENSTROM M., GUGERLI F. & HENRY G. H. R., 1997: Response of Saxifraga oppositifolia L. to simulated climate change at three contrasting latitudes. Global Change Biology. 3 44-54.
THEURILLAT J.-P. & GUISAN A., 2001: Potential impact of climate change on vegetation in the European Alps: a review. Climatic change. 50 77-109.
THUILLER W., LAVOREL S., ARAUJO M. B., SYKES M. T. & PRENTICE I. C., 2005: Climate change threats to plant diversity in Europe. Proceedings of the National Academy of Sciences of the United States of America. 102 (23), 8245-8250.
WALTHER G. R., BEISSNER S. & BURGA C. A., 2005: Trends in the upward shift of alpine plants. Journal of Vegetation Science. 16 (5), 541-548.
WOODWARD F. I., 1979: The Differential Temperature Responses of the Growth of Certain Plant Species from Different Altitudes. I. Growth Analysis of Phleum alpinum L., P. bertolonii D.C., Sesleria albicans Kit. and Dactylis glomerata L. New Phytologist. 82 385-395.

Paper 4
Suitability of three methods for long-term monitoring of alpine vegetation
Barbara Friedmann, Harald Pauli, Michael Gottfried, Georg Grabherr
Manuscript submitted and under revision in
Journal of Arctic, Antarctic and Alpine Research
64

65
Suitability of three methods for long-term monitoring of alpine vegetation Barbara Friedmann1, Harald Pauli2, Michael Gottfried1, Georg Grabherr1
1 University of Vienna, Department of Conservation Biology, Vegetation and Landscape Ecology, Rennweg 14, A-1030 Vienna, Austria Tel: +43-1-4277-54378 Fax: +43-1-4277-9542 2 Institute of Mountain Research: Man and Environment, Austrian Academy of Sciences, Vienna, Austria E-mail (corresponding author): [email protected] Total word count: 3800 (without captions of tables/figures)
4300 (with captions of tables/figures) Running title: Methods for monitoring alpine vegetation

66 Paper 4 – Methods for monitoring in alpine vegetation
Abstract (130 words)
Three methods of vegetation recording – subplot frequency, point-framing and visual cover
estimation – were assessed in terms of their usefulness in high alpine environments, with a
focus on their suitability for long-term monitoring programmes. Two of the methods for
estimating cover (point-framing and visual estimation) were comparable only for covers
above 0.7% in 1 m². For detecting the exact species number, point-framing was unsuitable
and the other two methods yielded significantly different results. The time taken to
complete a quadrat varied for each method, with point-framing being the quickest and most
unaffected by species number or vegetation cover. We suggest that, despite its drawbacks,
visual estimation is the most suitable method, especially with proper training, cooperation
between field workers and possibly a precision control by point-framing in a subset of
quadrats.
Keywords: visual estimation, point-framing, subplot frequency, scattered vegetation
Introduction
Vegetation, species cover and composition differ in various environments and over time;
cover estimations are an essential tool in detecting these changes. They are used for
general biodiversity monitoring, for classifying vegetation samples, and as a basis for
gathering supporting evidence for the predicted climate change impacts. The collected
data, however, are rarely questioned or quantified for their reliability. It is crucial that
applied methodologies best serve the particular requirements and study aims (Brakenhielm
and Liu, 1995; Carlsson et al., 2005), rather than be preferentially applied based merely on
definition. Legg and Nagy (2006) discuss in detail the importance of adequately planning
long-term monitoring projects with regard to methods, study aims and vegetation. A
method suitable for densely populated grasslands might not be feasible for scattered low-
density vegetation in alpine and subnival environments. Moreover, cost-effectiveness of
methods is a fundamental consideration, especially in long-term monitoring.
The most frequently used methods in vegetation sampling are visual cover estimation,
point framing, and subplot frequency. Visual cover estimation is the most common of the
three. Species cover is visually estimated within a particular plot, either by using some sort
of scale, such as Braun Blanquet (1964) or Daumbenmire (1959), or by recording numbers
in relation to plot size. The drawbacks of this method have been discussed thoroughly
(Kennedy and Addison, 1987; Tonteri, 1990; Klimeš, 2003; Vittoz and Guisan, 2007), the
main one being the lack of objectivity, as each observer may estimate differently. Point-

Paper 4 – Methods for monitoring 67 in alpine vegetation
framing (Levy and Madden, 1933) is considered to be objective (Everson et al., 1990), but
a major disadvantage is the coarse estimation of species numbers (see Sorrells and Glenn,
1991; Brakenhielm and Liu, 1995; Vanha-Majamaa et al., 2000). Subplot frequency, which
does not estimate cover but is rather another method of vegetation recording, has been
compared to the others and found to deliver unrelated values (Brakenhielm and Liu, 1995).
Numerous comparative studies have been published, predominantly for lowland habitats
including sagebrush steppe (Floyd and Anderson, 1987; Seefeldt and Booth, 2006), forests
and bogs (Brakenhielm and Liu, 1995), shrubland (Cheal, 2008), grasslands (Klimeš, 2003;
Leis et al., 2003; Carlsson et al., 2005) as well as woodlands (Sykes, 1983). Recorded
species numbers and cover differed between the methods, as did the time needed to
complete fieldwork and therefore the effectiveness of each method. Few studies, however,
have focused on alpine environments (Vittoz and Guisan, 2007), and none has compared
more than one method for their suitability and efficiency in areas above the treeline. These
environments are temperature limited and therefore more sensitive to climatic changes than
lowland areas (Sakai and Larcher, 1987; Kammer and Mohl, 2002; Körner, 2003); hence,
they are considered a good experimental setting in which to study the impacts of ongoing
climate change.
This study was therefore designed to select the most suitable method for long-term
monitoring in alpine environments that would deliver reliable data efficiently. The methods
were analysed in respect to time required for field work, species capture capacity, and
precision in cover estimation both at high and low cover values.
Material and Methods
STUDY AREA
The study area was located at Mt Schrankogel (3497 m; 11°06’E and 47°02’N) in the
Stubaier Alpen, Tyrol, Austria. The sampling sites (transects of 1m² plots) were distributed
over the south-west, south and south-east sides of the mountain between 2910 and 3155 m,
where the closed siliceous grasslands of the alpine zone disintegrate into open and
scattered pioneer vegetation, also termed the nival zone (Gottfried et al., 1998; Pauli et al.,
1999; Nagy and Grabherr, 2009). The transects were established on Mt Schrankogel in
1994 and resurveyed in 2004 as part of the GLORIA (Global Observation Research
Initiative in Alpine Environments; www.gloria.ac.at) monitoring program (Pauli et al.,
1999; Pauli et al., 2007). In August 2004, twenty-five permanent quadrats of 1 m x1 m
were selected randomly in 14 of the transects.

68 Paper 4 – Methods for monitoring in alpine vegetation
SAMPLING METHODS
Vascular plant species presence/absence and cover were investigated in the quadrats using
three methods: visual cover estimation (VE), point framing (PF), and subplot frequency
(FREQ) (Kent and Coker, 1992; Elzinga et al., 1998). The recording procedures for VE
and PF followed the protocol described in the GLORIA manual (Pauli et al., 2004). Two
observers always worked in pairs when recording each of the 25 1m x 1m quadrats.
For VE, the cover value of each vascular plant species was visually determined (including
vegetative individuals) using a percentage scale relative to the total quadrat area of 1m².
Transparent plastic templates in various shapes (circle, ellipse, square, etc.) were used to
enhance precision (for details see the GLORIA manual Pauli et al., 2004).
A wooden frame of 1m x 1m, with strings dividing the quadrat into 100 subplots of 10cm x
10cm each, was used for PF and FREQ.
In the PF method, each mesh point of the grid was used to position a 2mm-diameter pin
that was then lowered into the vegetation perpendicular to the slope. A total of 121 points
were surveyed per 1m², as the points at the edges and corners were also used. Every plant
species that was touched by the pin was recorded. If no species were present, the surface
type was noted (e.g. rock, scree, bare soil). No spatially explicit record (noting the position
of each species hit) was produced, but all hits were added up and divided by the total
number of points to estimate percentage top cover. For FREQ, each species in a subplot
(10cm x 10cm) was recorded as present or absent. This procedure produced a spatially
explicit record of the species pattern on the quadrat rather than cover estimations.
The time required for sampling procedures was recorded for each quadrat.
DATA ANALYSIS
We analysed the number of species captured, species cover, and time requirement for the
three methods.
Species number: Paired t-tests (two sided) were used to compare the species numbers
captured in the quadrats by each method. Linear models showed the correlations of species
numbers for all three methods.
Cover: The cover values were log transformed (logarithm base 2) and tested for normal
distribution (Shapiro test). A linear model showed the relationship between PF and VE; the
correlation was tested using Kendall’s Tau. Paired t-tests were used to compare the cover
measured by VE and PF across a range of cover values. Additionally, to test for potential
differences between growth forms, the PF and VE covers were tested in paired t-tests
separately for each species with more than two PF occurrences (23 of 44 species). To

Paper 4 – Methods for monitoring 69 in alpine vegetation
predict the probability of detecting a species using PF on a certain cover level of VE, we
adopted a logistic model.
Time requirement: One-sided Wilcox-tests were used to compare the time requirement for
the quadrats among the three methods. We used linear regressions to evaluate if time
required for a quadrat depended on species number and total vegetation cover (estimated as
the sum of species cover assessed by VE). P-values given in the figures are the values for
the linear regression models.
R (version 2.8.1, R Development Core Team, 2008) was used for all statistical analyses.
Results
SPECIES NUMBER
The captured species number differed among the three methods: on average, 13.6 (VE), 8.4
(PF) and 14.3 (FREQ) species were found (Fig 1a). The values for each method summed
over all quadrats are given in Figure 1b. PF missed 131 species occurrences (39%)
compared to VE and 149 species occurrences (42%) compared to FREQ. One species was
found by PF and VE but not FREQ and one by PF and FREQ but not VE; these are not
depicted. Species numbers captured by PF and VE were correlated (R=0.50, p<0.001), but
their means differed significantly (p<0.001, Figure 1c). PF underestimated species richness
in all but one case, and differences in total species number in the quadrats varied from 0 to
11 species. Species number captured by VE and FREQ was also correlated (R=0.93,
p<0.001) but significantly different (p=0.005, Figure 1d). VE captured fewer species than
FREQ.
COVER ESTIMATION – PF VERSUS VE
For species jointly captured by PF and VE, the two cover estimation methods were highly
correlated (Tau=0.64, p<0.001) and, for cover values above 0.7% (according to VE), not
significantly different (see Table 1 for details). When each species was tested separately,
the cover values of PF and VE differed (paired t-tests, p<0.001) for all but one species
(data not shown). With decreasing cover, agreement between the two procedures decreased
(Figure 2a). As the PF cover estimation approaches its smallest possible value of one hit
(corresponding to a cover estimation of 0.8%) and zero hits, the VE values drift apart and
their ranges become large (see Figure 2b: PF=0.8%, range of VE values: 0.005% to 3%,
median: 0.4%; zero hits (PF), range of VE values: 0.001% to 2.5%, median: 0.1%). To
assess the possible usefulness of PF in alpine vegetation monitoring, we calculated the
probability of detecting a species using PF. Below 1% VE cover, the probability to detect a
70 Paper 4 – Methods for monitoring in alpine vegetation
species by PF drops below 80%. Below 0.25%, the probability is below 50%. Only with
covers of more than 2.5% does the probability to detect a species by PF exceed 90% (see
Figure 3 and Table 2).
TIME REQUIRED TO COMPLETE FIELD WORK
The three methods for recording species presence/absence and cover estimation showed
significant differences in the time required for field work (PF<VE<FREQ, all comparisons
p<0.01). PF was always the shortest (5 - 20 min), FREQ was the most time consuming (15
- 133 min), and VE was in between (12 - 63 min) (Figure 4a). Time consumption between
the three methods was not correlated, i.e. quadrats requiring more time using VE did not
require more time using PF or FREQ (data not shown).
With increasing species number, values increased significantly for VE and FREQ, but not
for PF (Figure 4b). Similarly, when compared to total vegetation cover, PF and FREQ
showed a significant increase of time required as total cover increased, while VE did not
(Figure 4c).
Discussion
Our results showed that the different methods have advantages and disadvantages when
comparing species capture capacity, precision of cover estimation, and time required for
fieldwork.
SPECIES NUMBER
PF does not capture all species present in the quadrat: it missed 40% of species
occurrences. This is the prevalent conclusion of other authors dealing with PF in a
comparable plot size to point number relationship, although the numbers vary (Sorrells and
Glenn, 1991; Dethier et al., 1993; Brakenhielm and Liu, 1995; Vanha-Majamaa et al.,
2000; Leis et al., 2003; Symstad et al., 2008). The reason is that FREQ and VE scan the
quadrat very carefully, the former even more carefully than the latter (see also Carlsson et
al., 2005), while PF does not consider any vegetation beyond the points. Increasing the
number of points in sagebrush steppe vegetation (Floyd and Anderson, (1987) showed that
little precision could be gained at increasing sample sizes within a reasonable increase of
time.
FREQ and VE were significantly different in terms of species capture efficiency (also
found by Carlsson et al., 2005), but agree on 91% of species occurrences. In principle, both
approaches should record every single species present. Departure from this is attributed to
observer error, which can be divided into the error of missing a present species and

Paper 4 – Methods for monitoring 71 in alpine vegetation
misidentification (for errors see also Hope-Simpson, 1940; Clymo, 1980; Floyd and
Anderson, 1987; Carlsson et al., 2005).
Thus, for species numbers in the quadrat, VE and FREQ are more efficient methods than
PF; when used in combination, they deliver a precise account of the species present.
RARE SPECIES – PF VERSUS VE
Compiling a simple list of the rare species not detected by PF seems to solve the problem
of recording all species in the quadrat. However, such a list gives no indication of the
abundance of each of these species. Especially rare species and their cover might be of
particular interest for comparing change over time in long-term monitoring. Cover
estimations of PF and VE are similar for high cover values, but differ greatly for low
covers (see Figure 2a). The ranges of VE cover values at PF = 0 or 1 are fairly large for
sensitive monitoring (Figure 2b). One reason for this range is the often-mentioned high
inter-observer variation in VE (Kennedy and Addison, 1987; Tonteri, 1990; Klimeš, 2003;
Cheal, 2008). Some authors even suggest that cover changes of up to +/- 20% should be
attributed to observer variability (Kennedy and Addison, 1987), while others propose that
calibration and training will leave the variability small (Brakenhielm and Liu, 1995). In
this study, templates were used to more reliably estimate the small covers, so therefore VE
was more useful than PF in those ranges. Nonetheless, proper observer training and
calibration are essential and, where possible, more than one observer should agree on the
cover value (see also Klimeš, 2003; Vittoz and Guisan, 2007).
Based on our numbers, a 90% chance of detecting a plant using PF requires a cover of
2.4%. Depending on the type of vegetation being studied, this might be a relatively
common cover value. In the case of low-density alpine and subnival plant assemblages
with a highly scattered species arrangement and when most species have covers below this
value, PF is not a suitable method.
COVER ESTIMATION OF HIGH COVER VALUES– PF VERSUS VE
Cover estimations between PF and VE were similar for large covers. At this level they
correlated well (see also Brakenhielm and Liu, 1995) and might be convertible. VE covers
above 0.7% were not significantly different than those recorded by PF (Table 1). Although
PF has been praised as “one of the most trustworthy and most nearly objective methods”
(Goodall, 1952) of vegetation cover sampling and recommended in many books (see e.g.
Mueller-Dombois and Ellenberg, 1974; Greig-Smith, 1983), our findings support the VE
method in alpine environments. A potential disadvantage of VE is that it is said to be
influenced by total cover (Klimeš, 2003). However, it is more robust when different leaf
shapes and life forms are present in one quadrat (see Brakenhielm and Liu, 1995 for

72 Paper 4 – Methods for monitoring in alpine vegetation
drawing), or when vegetation differs in the size and distribution of individuals (Mueller-
Dombois and Ellenberg, 1974; Floyd and Anderson, 1987). Dethier (1993) claims that VE
delivers more accurate estimates although PF seems more objective.
SUBPLOT FREQUENCY
Subplot frequency supplies a data set that cannot be converted to cover estimation.
However, it provides a spatially explicit account of the quadrat, useful for finding
supposedly lost species in re-surveys. Additionally, as shown here, it provides the most
complete record of species present in the quadrat (Figure 1c). Some argue that it is a more
objective method than visual estimation (Ringvall et al., 2005), but the amount of time
spent on it can be the limiting drawback (Figure 4).
TIME TAKEN
PF was the most rapid of the three methods tested, and FREQ took the longest time, with
VE somewhere in the middle. This was also found by Floyd (1987), although he used
cover classes instead of precise percentage estimations, and by Symstad (2008) and Leis
(2003), who compared VE and PF. Our results contradict those of Sorrells (1991),
Brakenhielm (1995), Dethier (1993), Vanha-Majamaa (2000), Seefeldt (2006), and Vittoz
(2007). Surprising, although the environments in which the studies were conducted vary
extremely, PF is considered the slowest method. This, however, depends very much on the
arrangement and number of points (Symstad et al., 2008). An alpine environment is often
dominated by bare ground and rocks rather than shrubs or meadows, so PF is much more
quickly completed.
With increasing vegetation cover, FREQ and PF increased in time taken for each quadrat
(Figure 4d), but the latter only slightly. FREQ and VE took longer with increasing species
richness. This was also reported by Symstad (2008). It was not unexpected because each
species is recorded and considered separately by the latter two methods. In the PF method,
on the other hand, the pin is lowered regardless of the cover, and whatever is present is
noted down.
CONCLUSION
For studies assessing higher covers and larger areas without focusing specifically on rare
species, PF is the most suitable method (Klimeš, 2003), especially because it is faster and
less dependent on total cover. However, for long-term monitoring in alpine environments
when focusing on the full array of species including rare ones, VE is far more useful, in
particular when improved by applying scale templates. Here, PF should only be considered
as an additional control method.

Paper 4 – Methods for monitoring 73 in alpine vegetation
Acknowledgements
This study was funded by the Austrian Academy of Sciences through the IGBP and MaB
Programmes, the MAVA foundation for Nature Conservation (Switzerland) and the
Austrian Federal Ministry of Science and Research. We are grateful to our ambitious
colleagues during field work. We thank Karl Hülber, Katharina Bardy, Ruth Töchterle,
Michael Stachowitsch and Stuart Weiss for helpful comments on this manuscript.
References Brakenhielm, S. and Liu, Q. H., 1995: Comparison of field methods in vegetation
monitoring. Water Air and Soil Pollution, 79: 75-87. Braun-Blanquet, J., 1964: Pflanzensoziologie. 3rd ed. Wien: Springer, 865 pp. Carlsson, A. L. M., Bergfur, J., and Milberg, P., 2005: Comparison of data from two
vegetation monitoring methods in semi-natural grasslands. Environmental Monitoring and Assessment, 100: 235-248.
Cheal, D., 2008: Repeatability of cover estimates? Ecological Management and Restoration, 9: 67-68.
Clymo, R. S., 1980: Preliminary survey of the peat-bog Knowe Moss using various numerical methods. Vegetatio, 42: 129-148.
Daubenmire, R. F., 1959: A canopy-coverage method of vegetational analysis. Northwest Science, 33: 43-64.
Dethier, M. N., Graham, E. S., Cohen, S., and Tear, L. M., 1993: Visual versus random-point percent cover estimations - objective is not always better. Marine Ecology-Progress Series, 96: 93-100.
Elzinga, C. L., Salzer, D. W., and Willoughby, J. W., 1998: Measuring and monitoring plant populations. Denver: Bureau of Land Management, 496 pp.
Everson, T. M., Clarke, G. P. Y., and Everson, C. S., 1990: Precision in monitoring plant species composition in montane grasslands. Vegetatio, 88: 135-141.
Floyd, D. A. and Anderson, J. E., 1987: A comparison of three methods for estimating plant cover. Journal of Ecology, 75: 221-228.
Goodall, D. W., 1952: Some considerations in the use of point quadrats for the analysis of vegetation. Australian Journal of Scientific Research, Series B 5: 41.
Gottfried, M., Pauli, H., and Grabherr, G., 1998: Prediction of vegetation patterns at the limits of plant life: a new view of the alpine-nival ecotone. Arctic and Alpine Research, 30: 207-221.
Greig-Smith, P., 1983: Quantitative plant ecology. 3rd. ed. ed. Oxford: Blackwell. Hope-Simpson, J. E., 1940: On the errors in the ordinary use of subjective frequency
estimations in grassland. Journal of Ecology, 28: 193-209. Kammer, P. A. and Mohl, A., 2002: Factors controlling species richness in alpine plant
communities: an assessment of the importance of stress and disturbance. Arctic Antarct Alpine Res, 34: 398-407.
Kennedy, K. A. and Addison, P. A., 1987: Some considerations for the use of visual estimates of plant cover in biomonitoring. Journal of Ecology, 75: 151-157.
Kent, M. and Coker, P., 1992: Vegetation description and analysis: a practical approach. Rexdale, Ontario, CA: John Wiley and Sons.
Klimeš, L., 2003: Scale-dependent variation in visual estimates of grassland plant cover. Journal of Vegetation Science, 14: 815-821.

74 Paper 4 – Methods for monitoring in alpine vegetation
Körner, C., 2003: Alpine plant life. Functional plant ecology of high mountain ecosystems. 2 ed. Berlin: Springer.
Legg, C. J. and Nagy, L., 2006: Why most conservation monitoring is, but need not be, a waste of time. Journal of Environmental Management, 78: 194-199.
Leis, S. A., Engle, D. M., Leslie, D. M. J., Fehmi, J. S., and Kretzer, J., 2003: Comparison of vegetation sampling procedures in a disturbed mixed-grass prairie. Proc. Okla. Acad. Sci., 83: 7-15.
Levy, E. B. and Madden, E. A., 1933: The point method of pasture analysis. New Zealand Journal of Agriculture, 46: 267-269.
Mueller-Dombois, D. and Ellenberg, H., 1974: Aims and methods of vegetation ecology. New York: Wiley.
Nagy, L. and Grabherr, G., 2009: The biology of alpine habitats: Oxford University Press. Pauli, H., Gottfried, M., and Grabherr, G., 1999: Vascular plant distribution patterns at the
low-temperature limits of plant life - the alpine-nival ecotone of Mount Schrankogel (Tyrol, Austria). Phytocoenologia, 29: 297-325.
Pauli, H., Gottfried, M., Hohenwallner, D., Reiter, K., Casale, R., and Grabherr, G., 2004: The GLORIA field manual - Multi-Summit approach. European Commission, Luxembourg: European Commission DG Research, EUR 21213, Office for Official Publications of the European Communities, 85 pp.
Pauli, H., Gottfried, M., Reiter, K., Klettner, C., and Grabherr, G., 2007: Signals of range expansions and contractions of vascular plants in the high Alps: observations (1994-2004) at the GLORIA*master site Schrankogel, Tyrol, Austria. Global Change Biology, 13: 147-156.
R Development Core Team, 2008: R: A language and environment for statistical computing. R Foundation for Statistical Computing, Vienna, Austria, ISBN 3-900051-07-0, URL http://www.R-project.org
Ringvall, A., Petersson, H., Stahl, G., and Lamas, T., 2005: Surveyor consistency in presence/absence sampling for monitoring vegetation in a boreal forest. Forest Ecology and Management, 212: 109-117.
Sakai, A. and Larcher, W., 1987: Frost survival of plants. Berlin: Springer, 321 pp. Seefeldt, S. S. and Booth, D. T., 2006: Measuring plant cover in sagebrush steppe
rangelands: A comparison of methods. Environmental Management, 37: 703-711. Sorrells, L. and Glenn, S., 1991: Review of sampling techniques used in studies of
grassland plant communities. Proceedings of the Oklahoma Academy of Science, 71: 43-45.
Sykes, J. M., Horrill, A.D. & Mountford, M.D., 1983: Use of visual cover assessments as quantitative estimators of some British woodlands. Journal of Ecology, 71: 437-450.
Symstad, A. J., Wienk, C. L., and Thorstenson, A. D., 2008: Precision, repeatability, and efficiency of two canopy-cover estimate methods in Northern Great Plains vegetation. Rangeland Ecology and Management, 61: 419–429.
Tonteri, T., 1990: Inter-observer variation in forest vegetation cover assessments. Silva Fennica, 24: 189-196.
Vanha-Majamaa, I., Salemaa, M., Tuominen, S., and Mikkola, K., 2000: Digitized photographs in vegetation analysis-a comparison of cover estimates. Applied Vegetation Science, 3: 89-94.
Vittoz, P. and Guisan, A., 2007: How reliable is the monitoring of permanent vegetation plots? A test with multiple observers. Journal of Vegetation Science, 18: 413-422.

Paper 4 – Methods for monitoring 75 in alpine vegetation
Figure 1
FIGURE 1: a: Species numbers captured by visual estimation (VE), point-framing (PF), subplot frequency (FREQ); b: agreement in species capture between the methods; c: comparison of species capture in VE versus PF; d: species capture in VE versus FREQ. Dashed line represents y=x, points are jittered.

76 Paper 4 – Methods for monitoring in alpine vegetation
Figure 2
FIGURE 2: a: Comparison of cover estimation of PF (point-framing) and VE (visual cover estimation). Dashed line represents y=x, points are jittered. b: range of VE cover values for rare species, left boxplot: cases where PF hits 1 of 121 points (equivalent to a cover of 0.8%) and right boxplot: cases where plants are not detected by PF.

Paper 4 – Methods for monitoring 77 in alpine vegetation
Figure 3
FIGURE 3: Probability of detecting a species with PF (point-framing) in relation to its visual cover estimation (VE), y-axis: species detected (1) or not detected (0) by PF; n=364 (some points hidden by others due to equal values on x-axis).

78 Paper 4 – Methods for monitoring in alpine vegetation
Figure 4
FIGURE 4: Time requirement compared for the three methods: point-framing (PF), visual estimation (VE), subplot frequency (FREQ) (a). Time requirement compared to species number found by each method (b) and cover sums of VE for each quadrat as a measure of total vegetation cover (c).
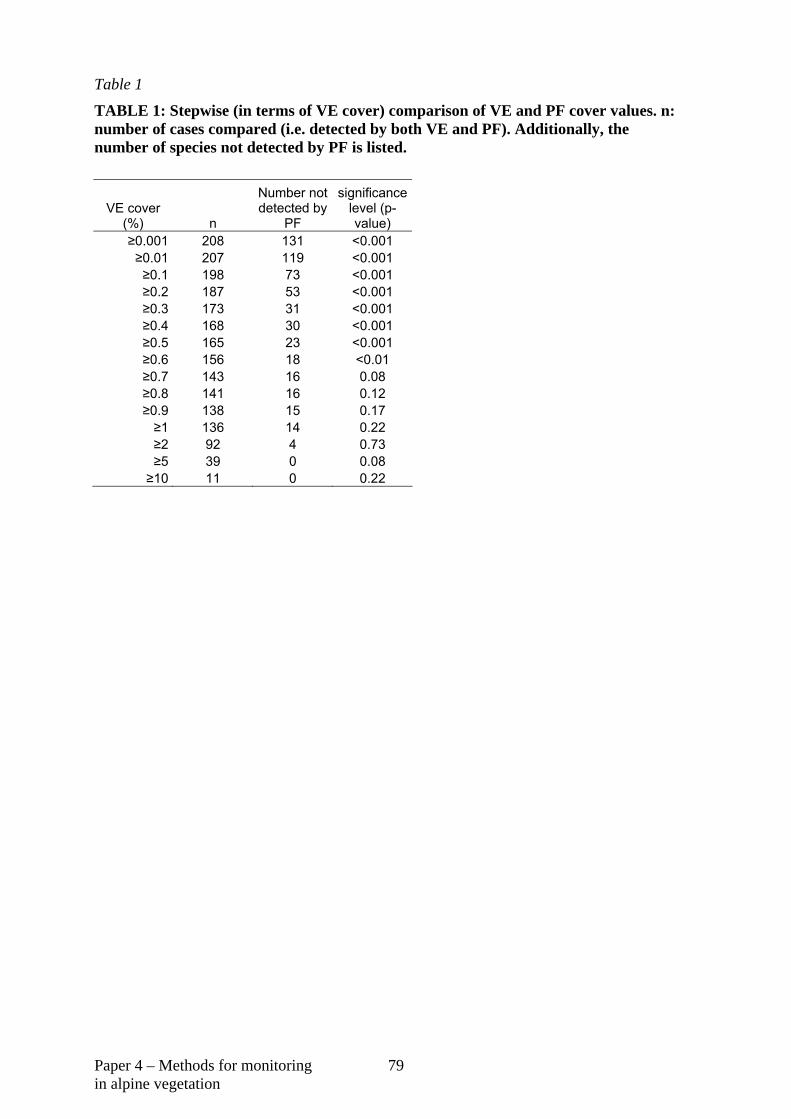
Paper 4 – Methods for monitoring 79 in alpine vegetation
Table 1
TABLE 1: Stepwise (in terms of VE cover) comparison of VE and PF cover values. n: number of cases compared (i.e. detected by both VE and PF). Additionally, the number of species not detected by PF is listed.
VE cover (%) n
Number not detected by
PF
significance level (p-value)
≥0.001 208 131 <0.001 ≥0.01 207 119 <0.001 ≥0.1 198 73 <0.001 ≥0.2 187 53 <0.001 ≥0.3 173 31 <0.001 ≥0.4 168 30 <0.001 ≥0.5 165 23 <0.001 ≥0.6 156 18 <0.01 ≥0.7 143 16 0.08 ≥0.8 141 16 0.12 ≥0.9 138 15 0.17 ≥1 136 14 0.22 ≥2 92 4 0.73 ≥5 39 0 0.08 ≥10 11 0 0.22

80 Paper 4 – Methods for monitoring in alpine vegetation
Table 2
TABLE 2: probability of detecting species using PF compared to using VE. n=339. % refers to the number of cases within the 25 quadrats that had a cover value lower than the number listed in column “VE cover”
VE cover (%)
probability of detection
by PF
% of cases with cover less than
VE cover 0.001 0.01 0.00 0.01 0.05 3.83 0.1 0.30 20.06 0.2 0.46 29.20 0.3 0.55 39.82 0.4 0.62 41.59 0.5 0.67 44.54 0.6 0.71 48.67 0.7 0.74 53.10 0.8 0.76 53.69 0.9 0.78 54.87 1 0.80 55.75 2 0.88 71.68 5 0.95 88.50
10 0.97 96.76

Acknowledgements
I would like to thank everybody who has contributed to this work. Anfangen möchte ich bei meinen Eltern Irene und Fritz Holzinger sowie meiner Schwester Uschy, die mich in jedem meiner Schritte und Lebensphasen begleitet haben und immer noch begleiten. Ohne Euch hätte ich es nicht soweit gebracht. Danke. Meiner wunderbaren jungen Familie möchte ich danken, allen voran meinem Mann Alex, meiner Tochter Katharina und dem ungeborenen jungen Mann in meinem Bauch, der mich mit seinen Tritten von Innen immer wieder aus Schreibblockaden herausgeholt und an die Zeitknappheit erinnert hat. Das alles wäre aber unmöglich gewesen, hätte nicht Katharinas Großmutter Waltraud so tatkräftig bei der Betreuung von Katharina geholfen. Dafür schulde ich dir ein ganz großes Dankeschön! Astrid Schauer möchte ich danken für all die vielen Telefonate und Ausflüge, für das miteinander Mutter werden und hineinwachsen in diesen wunderbaren neuen Lebensabschnitt, der einfach alles übertrifft. Danke! Helfrid, I want to thank you especially for being there and for going through very similar crises at times and totally different ones at others. Karl Hülber danke ich für die Geduld, für deine Ehrlichkeit, fürs Zuhören, für das Aufmerksammachen vieler Fehler. Ich bin sicher, dass ich ohne dich schon lang nicht mehr hier wäre. Bei meinem Doktorvater Georg Grabherr bedanke ich mich für das Durchhalten, für die Geduld und die Betreuung. An das gesamte Gloria co-ordination team, Sonya Laimer, Harald Pauli, Christian Klettner und Michael Gottfried, die mich durch diesen Endspurt gelotst haben, ein großes Dankeschön. Ruth Töchterle danke ich für die Gespräche, das kritische Lesen der Manuskripte und die aufbauende Persönlichkeit! Alle anderen, die durch diese lange Zeit Wegbegleiter waren, möchte ich für die gemeinsamen Stunden und Tage danken.
81

82
0BCurriculum Vitae (English)
BARBARA FRIEDMANN, NÉE HOLZINGER Date of birth: 22.05.1979 Place of birth: Vienna, Austria EDUCATION 2004-present Dissertation (PhD) with Prof. Grabherr in Vegetation
Ecology 2003-10/2004 Language study of Czech at the University of Vienna,
Austria 07/2001-07/2002 ERASMUS exchange year at Uppsala University, Sweden.
Language of instruction: Swedish 1999-2003 Studies of Biological Sciences with Honours in Plant Science
at the University of Edinburgh, Scotland; Honours Project: Taxonomy of Anemone, Supervisor: Dr. PM Smith
09/1998-07/1999 Chinese language studies at the People’s University of Beijing, and Sport University of Beijing, China; Qualification: Certificate in Chinese Language (HSK grade 6)
3/1999-7/1999 Beijing Tiyu Daxue (Sport University of Beijing), Study of WuShu, Chinese Martial Arts and Chinese Language
1995-1998 International School of Beijing, China. International Baccalaureate Diploma (IB), 37 (of 45) points, language of instruction: English
1986-1995 German School of Beijing, China, Primary and Secondary School until grade 10 in the German schooling system
1985-1986 Primary school Bischof-Faber Platz, 1180 Vienna, first grade WORK EXPERIENCE 10/2007-present Data analysis and public relations at GLORIA (Global
Observation Research Initiative in Alpine Environments, www.gloria.ac.at)
02/2008-10/2008 Maternity leave 2005-present Tutor in English, Maths, Latin for asylum seekers and
refugees 04/2004-present Caritas (NGO) migrant help, night and weekend shifts in a
home for asylum seeker Summer 2007 WF (valuable acreage) mapping for Carinthia (part of nature
conservation program of federal government ÖPUL) Summer 2007 Habitat mapping in Salzburg (Rauris) for E.C.O.
(Klagenfurt) Summer 2006 Habitat mapping in Salzburg (Felbertal) for E.C.O.
(Klagenfurt) Spring 2005 Data acquisition in Grisons, Switzerland (Chur) for the re-
dynamisation of the vineyard flora for Camenisch&Zahner (Switzerland)

83
Summer 2004/2005/2006 Vegetation studies in Grisons, Switzerland (Engadin), Salzburg and the Hochschwab massive, Data acquisition for dissertation
Summer 2003 Travel escort of a Chinese VIP delegation through Europe Summer 2002 Internship at Bayer Healthcare Company in Beijing:
Compiling and implementing a program for employee training about microbiology in the work environment
11/2001-03/2002 Assistance at the herbarium of the University of Uppsala. Database management
Summer 2000 Internship at Bayer Healthcare Company in Beijing: Water quality control of the headquarters and plant.
11/1999 Travel escort of a Chinese VIP delegation through Germany and Austria
Summer 1999 Internship at the catering company „Greenhouse“ in Beijing Summer 1995 Internship at Elin, Beijing, China LANGUAGES German mother tongue English fluent Swedish, Chinese, French good level Russian basic knowledge COMPUTER SKILLS MsOffice, S-Plus, ArcView, SPSS, R, Sigma Plot SIGNATURE

84
1BLebenslauf (German)
BARBARA FRIEDMANN GEB. HOLZINGER Geburtsdatum: 22.05.1979 Geburtsort: Wien, Österreich AUSBILDUNG Seit 2004 Dissertation bei Prof. Grabherr in Vegetationsökologie 2003-10/2004 Sprachkurse an der Universität Wien (Tschechisch) 07/2001-07/2002 Ein Jahr ERASMUS Austausch in Uppsala, Schweden.
Unterrichtssprache: Schwedisch 1999-2003 University of Edinburgh School of Life Sciences Abschluss
mit dem Bachelor of Science with Honors in Plant Sciences Juli 1999 Absolvierung des HSK Tests (Hanyu Shuiping Kaoshi).
Sprachlich Zulassungsgrad zum Individualstudium an einer Chinesischen Universität erreicht.
3/1999-7/1999 Beijing Tiyu Daxue (Sportuniversität Peking), Fortsetzung des Studiums der Chinesischen Sprache, zusätzlich Kurse zur Erlernung der Chinesischen Kampfsportart WuShu
9/1998-3/1999 Beijing Renmin Daxue (Volksuniversität Peking) Intensivkurs zur Erlernung der Chinesischen Sprache und Beijing
1995-1998 International School of Beijing, Beijing, China. Abschluss mit dem International Baccalaureate (IB) Unterrichtssprache: Englisch
1986-1995 Deutsche Schule Peking, China, 2. bis 10. Klasse nach dem Deutschen Schulsystem. Erfolgreicher Abschluss der Mittleren Reife.
1985-1986 Volksschule Bischof-Faber Platz, 1180 Wien, 1. Klasse (mit Unterbrechung durch Aufenthalt auf den Philippinen, dort Unterricht von Mutter)
ARBEITSERFAHRUNG Seit 10/2007 Datenanalyse und Public Relations bei GLORIA (Global
Observation Research Initiative in Alpine Environments, www.gloria.ac.at)
02/2008-10/2008 Mutterschutz und Karenz Seit 2005 Nachhilfeunterricht Englisch, Mathematik, Latein für
Asylwerber und Flüchtlinge Seit 04/2004 Caritas Migrantenhilfe, Nacht- und Wochenenddienst in
einem Flüchtlingswohnheim, 1070 Wien Sommer 2007 WF (wertvolle Flächen) Kartierung für das Land Kärnten
(ÖPUL Naturschutzmaßnahmen) Sommer 2007 Biotopkartierung in Salzburg (Rauris) für E.C.O.
(Klagenfurt) Sommer 2006 Biotopkartierung in Salzburg (Felbertal) für E.C.O.
(Klagenfurt)

85
Frühling 2005 Datenbeschaffung in Graubünden (Chur) im Bereich Redynamisierung der Weinbergflora für Camenisch&Zahner (Schweiz)
Sommer 2004/2005/2006 Vegetationsstudien in Graubünden (Engadin), Salzburg und auf dem Hochschwab, Datensammlung für Dissertation
Sommer 2003 Reisebegleitung einer Chinesischen VIP Delegation durch Europa
Sommer 2002 Praktikum bei Bayer Healthcare Company in Beijing: Zusammenstellung und Durchführung eines Moduls zur Weiterbildung der Mitarbeiter über Mikrobiologie im Arbeitsleben
11/2001-03/2002 Assistenztätigkeit im Herbarium an der Universität Uppsala. Updating und Katalogisierung der Datenbank.
Sommer 2000 Praktikum bei Bayer Healthcare Company in Beijing. Verantwortung für Wasserqualitätsprüfung innerhalb des Standorts.
11/1999 Reisebegleitung einer Chinesischen VIP Delegation durch Deutschland und Österreich
Sommer 1999 Praktikum bei der Catering Firma „Greenhouse“ in Beijing Sommer 1995 Praktikum bei Elin, Beijing, China SPRACHKENNTNISSE Deutsch Muttersprache Englisch fließend, verhandlungssicher Schwedisch gut Chinesisch gut Französisch gut Russisch Grundkenntnisse COMPUTERKENNTNISSE MsOffice, S-Plus, ArcView, SPSS, R, Sigma Plot UNTERSCHRIFT
Related Documents