UC Berkeley Working Paper Series Title Changes in Managerial Pay Structures 1986-1992 and Rising Returns to Skill Permalink https://escholarship.org/uc/item/3cm3820b Authors O'shaughnessy, Kevin C. Levine, David I. Cappelli, Peter Publication Date 1998-02-04 eScholarship.org Powered by the California Digital Library University of California

Welcome message from author
This document is posted to help you gain knowledge. Please leave a comment to let me know what you think about it! Share it to your friends and learn new things together.
Transcript

UC BerkeleyWorking Paper Series
TitleChanges in Managerial Pay Structures 1986-1992 and Rising Returns to Skill
Permalinkhttps://escholarship.org/uc/item/3cm3820b
AuthorsO'shaughnessy, Kevin C.Levine, David I.Cappelli, Peter
Publication Date1998-02-04
eScholarship.org Powered by the California Digital LibraryUniversity of California

CHANGES IN MANAGERIAL PAY STRUCTURES 1986-1992
AND
RISING RETURNS TO SKILL
by
K.C. O'Shaughnessy
David I. Levine
and
Peter Cappelli
Abstract: We examine the relationship between wages and skill requirements in a sample of over
50,000 managers in 39 companies between 1986 and 1992. The data include an unusually good
measure of job requirements and skills that can proxy for human capital. We find that wage
inequality increased both within and between firms from 1986 and 1992. Higher returns to our
measure of skill accounts for most of the increasing inequality within firms. At the same time,
our measure of skill does not explain much of the cross-sectional variance in average wages
between employers, and changes in returns to skill do not explain any of the time series increase in
between-firm variance over time. Finally, we find only weak evidence of any declines in the
rigidity of internal wage structures of large employers.
Acknowledgments: Helpful comments were received by Erica Groshen, Daniel Levine,
Georgina Moreno, and Jimmy Torrez.
Earnings inequality has increased considerably in the US economy during the past 20
years. Economists have examined a number of possible explanations for the change, with an

2
emphasis on demand-side changes that increased the returns to skills [Levy and Murnane, 1992].
We examine these important explanations for rising inequality by analyzing a data set with three
unique characteristics. First, the data include a quantitative measure of the actual requirements of
each job B the skills, responsibility, and accountability B that is constructed from a detailed
analysis of each job. This measure has much higher validity and reliability than most measures of
job-relevant skills because it captures actual job requirements. Most prior studies rely on proxies
for job requirements that focus on characteristics of workers, such as years of education, or broad
descriptions such as job titles. Second, the time series data report on multiple jobs (hundreds and
in many cases thousands of positions) across 39 companies, allowing us to analyze inequality both
within employers and between high- and low-wage employers. Finally, because these data are for
managerial jobs, they allow us to extend the prior research on inequality within and between
employers which focused on production workers [e.g., Davis and Haltiwanger 1991] and to
contribute to the growing literature on wage structures within enterprises [e.g., Baker, Gibbs, and
Holmstrom 1994, Lazear 1995].
We analyze these data to address a number of questions relating to firm-level wage
inequality. We begin by describing a number of important features of wage structures at large
employers. These include the magnitude and persistence of employer-specific wage levels,
employer-specific returns to our measure of skill, and the sorting of employees between
employers by skill. We then test explanations about inequality and firm-specific wage structures
that are based on human capital theory. Among the most important of these tests is the extent to
which differences in skill requirements explain apparent differences in employer wage levels. Our
conclusion that differences in job characteristics do not explain differences in wage levels is so
strong and surprising that we replicate the test with a second dataset, where the results were
similar. We also examine the popular claim in much of the business press that wage structures at
large employers have become less rigid and more responsive to markets and to individual
performance in recent years [e.g., Annable, 1997; Burack and Singh, 1995; Chasman and
Feldman, 1995; Manticade and Pennell, 1992]. In general we find little evidence of declining
rigidities between 1986 and 1992, although use of bonuses has increased.1
1. The literature on causes of widening inequality is vast. [Levy and Murname, 1992, and thearticles in Journal of Economic Perspectives, 1997, provide introductions.] A recent survey

3
The basic method of this paper is to decompose inequality into two pieces: wage
inequality between high- and low-wage employers (the employer wage effect), and inequality
within each employer. The inequality between employers is captured in our model by estimating a
separate intercept (firm effect) for each employer. We then examined each of these forms of
inequality in 1986 and changes in them between 1986 and 1992. Finally, we measure how each
form of inequality is related to our precise measure of skill and job requirements.
I. Human Capital Theory
The Appendix presents an illustrative model where wage differences are determined solely
by differences in skill requirements. In such a world where skill levels also differ among firms and
good (but imperfect) measures of skills exist, then:
indicated that the majority of economists believe that the major cause is technological change thatis driving higher demands for skills [Krueger 1997, p. 125]. Typical papers supporting the role oftechnical change include Mincer [1991]; Krueger [1993] and Autor, Katz and Krueger [1997, butnot Mishel and Bernstein, 1996]. Katz and Murphy is representative of the literature finding ashift toward higher demand for skills [1992, but not Mishel, et al., 1997]. As Levy and Murnane[1992] conclude, "the most striking evidence of change in the demand for skill is the increase inthe premium associated with formal education." Some, but not all, of the articles using proxiesfor skills find evidence supporting their importance in explaining increased wage inequality. Forexample, Taber finds that the skills measured on standardized tests play a large role in risinginequality [1996, but not Blackburn and Neumark, 1993], and Juhn, Murphy and Pierce find alarge role for skills unmeasured in standard data sets [1993, but not Chay and Lee 1996]. Thismixed evidence supports the need for new measures of skills, particularly measures closer to theactual demands of jobs than typical proxies such as "works with computers" or "years ofeducation."

4
H1: Differences in employers= mean wages are primarily due to differences in mean
measured skills. Empirically, the standard deviation of the coefficients on the firm
effects should be substantially smaller when controlling for skills than when not
controlling for skills.
Human capital theory also offers explanations about changes in wage levels and in
employer wage effects that are based on returns to skill. If firms differ in their initial complements
of skills and returns to skill have increased over time, then wage inequality should increase across
firms:
H2: If returns to skill have increased, then wage inequality between firms will also
increase at the same pace. (This result assumes that the sorting of skills across
firms is constant, which is roughly true in this dataset, as noted below.)
Other researchers have used the corollary of this argument to conclude that rising
inequality among employers is due to higher returns to skill. For example, Davis and Haltiwanger
estimate a rising effect of establishment size on wages within manufacturing between 1967 and
1983 [1991, pp. 156-7]. They interpret this result as consistent with a size-wage effect that
results from a relationship between unmeasured skills and size coupled with rising returns to skill.
These arguments also imply that most of this rise in between-firm inequality should be
eliminated empirically if one can control for skill requirements with an accurate measure of skills
(as shown in the appendix):
H3: The apparent increase in inequality between firms should be eliminated or at least
sharply reduced when controlling for differences in skill levels. Empirically, the
increase in the standard deviation of the coefficients on the firm effects should be
much smaller when controlling for skill than when not controlling for skill.
More complex models of wage determination suggest other reasons why between-firm
inequality may rise. For example, the standard deviation of firm effects will also rise if employers
make greater use of company-wide profitsharing and profit levels differ across firms. Less
obviously, changes in comparisons that compensation professionals use to establish pay systems
can also increase inequality among employers. Consider, for example, the extreme case where
employers had set pay in line with a wage survey based on other firms= pay levels. If this

5
institutional pay-setting arrangement breaks down, then inequality among employers may rise
[Levine, 1995]. Perhaps the best example of such a change has been the breakdown of pattern
bargaining in unionized settings where unions set their bargaining demands based on prior
settlements of other unions.
Other developments may reduce inequality among employers. If wage levels above the
market level were largely due to the ability of some employers to pay more (as in rentsharing,
bargaining, and some fairness theories), then increased competition from imports, deregulation,
and other product market shifts should reduce wage inequality among employers by driving down
the Arich@ employers= ability to pay above-market wages. This pressure is reinforced if the
increase in product market competition is greater for companies whose employees have the
highest bargaining power and would therefore be more able to secure higher wages (Bertrand
provides indirect support for this proposition [1997].) More generally, compensation practices
such as internally consistent wage structures (as described in prescriptive compensation textbooks
and Levine [1993]) will lead to some inequality among employers. If, as the business press
claims, these institutional forces have eroded, this should reduce inequality among employers.
A. Base Pay vs. Total Compensation.
The analyses described above can be calculated for base pay as well as the sum of base pay
and annual bonuses, and there are reasons to examine both. Base salary should be the aspect of
compensation most directly related to skill requirements as employers typically describe it as the
compensation for meeting the basic requirements of the job. Individual bonuses, in contrast,
typically reflect performance above and beyond those base requirements. Moreover, at some
employers bonuses may become an expected part of compensation and are paid even when
individual performance does not exceed expected performance levels, then they should be
included as part of the wage paid for stated job requirements.
To the extent that bonuses reflect pay for individual performance, inequality of total pay
which includes bonuses should be larger than inequality of base pay because it includes differences
attributable to variations in individual performance. To the extent that bonuses also reflect
company performance (for example, due to profitsharing), between-company inequality should be
6
higher with total pay than with base pay. Alternatively, the theory of compensating differentials
suggests that higher average bonus payments may offset lower base pay because employees are
ultimately interested in the risk-adjusted level of total compensation. If employers differ for some
reason in the size of the bonuses they pay, then competitive labor markets that work to equalize
total compensation would suggest that total pay should be more equal across firms than is base
pay.
II. Changes in Internal Labor Markets over Time.
Our data cover only a relatively short time period, from 1986 to 1992. Nevertheless, this
short panel permits us to test several claims about how pay structures within large employers have
evolved. Numerous newspapers and magazines report massive changes in Americans= careers
during this period.2 These discussions frequently start with a canonical "old" model of an internal
labor market, one filled with numerous rigidities.3 For example, in the old model, companies paid
similar nominal wages in different local labor markets. Large employers also had difficulty
implementing meaningful merit pay and ended up giving most employees in the same job title
about the same pay [see, e.g., Foulkes 1980]. The popular press indicates that many of these
practices have declined as companies have replaced rigid rules with greater responsiveness to the
external market, to individual performance, and to the employer=s financial and stock market
2. Typical examples include Kiechel [1987], Kissler [1994], Cashman, Kevin, and Feldman[1995]; Burack and Singh [1995], Cappelli et al. [1997], Kanter [1987], Manicatide and Pennell[1992], and Stiles, et al. [1997].
3. Doeringer and Piore [1971] describe the classic ILM. Cappelli et al. [1997] survey theliterature on rising flexibility in more detail, finding substantial evidence of increasing flexibility. The evidence in Groshen and Levine indicates smaller decline in rigidities and institutions [1998].

7
performance. The arguments below examine potential changes in wage setting practices
associated with internal labor market and their empirical implications.
A. Have Local Labor Markets Become More Important? In many classic internal labor
markets, wage policies and structures were common across different locations of a company=s
operations, paying similar wages to similar job titles even across very different labor markets. To
the extent that internal company wage structures have become less rigid, we should see local labor
market conditions such as wages and unemployment having a stronger effect on wages. Belman
and Levine [1998] find that wage levels and structures (e.g., returns to education) at large
employers have not become more similar to those in nearby small employers from 1979 to 1993,
but Bertrand [1997] finds that the sensitivity of wages to local unemployment rates has increased
in companies with increasingly competitive product markets.
H4A: Wages have become increasingly correlated with average regional wages and
increasingly negatively correlated with regional unemployment.
This effect should be more pronounced at jobs that have a closer connection to the local
labor market. For management jobs like those in our data, first-line supervisory positions are
more closely linked to the local labor market than are senior executive positions which operate
more in a national or international labor market.
H4B: This increase in correlation should be more pronounced for lower-level than top-
level positions.
B. Has Pay for Individual Merit Become More Important? The practitioner literature on
compensation advocates the use of individual-level rewards for performance and suggests that its
use has increased over time. Merit pay is the term used to describe increases in base
compensation attributable to individual performance. To the extent that merit pay has risen in
importance, we expect:
H5A: Inequality of base pay among employees in the same job title should have risen.
Some employers increase incentives for individual performance not by increasing merit pay
but by increasing their use of short-term bonus or incentive payments that do not enter base pay in
future years. If this trend is widespread we expect:
8
H5B: Inequality of total pay (that is, base + bonus) within a job title should have
increased faster than inequality of base pay, and
H5C: Inequality of total pay within a firm should have increased faster than inequality of
base pay.
C. Has Rentsharing Become More Important? We can also provide imperfect measures of the
extent to which companies are tying more pay to company-wide performance. These measures
are subject to many problems noted below; most importantly the dataset contains a limited
number of employers.
First, we can decompose bonuses into a portion that is handed out to individuals and a
portion that is shared company-wide. In the former, the company identifies good performers and
gives them bonuses that are proportional to pay, bonuses that act much like merit pay except that
they do not raise base wages. In the latter, the company distributes bonuses equally to individuals
across the company. We can regress [bonus / (base + bonus)] against control variables plus a set
of employer effects where the standard deviation of these estimated employer effects measures the
extent of company-wide bonus; the residual measures individual merit bonuses. If company-wide
gainsharing is increasingly important, we expect:
H6: The variability of firm-wide bonuses (compared to total pay) has increased.
Tests of this hypothesis are subject to a number of limitations, however. Any secular
trend may be obscured by the recession in the early 1990s which should have dampened the
profits that fund the bonus pool at many employers. Further, this simple decomposition cannot
distinguish bonuses that are shared by a division or team. Our procedure will allocate such
bonuses into individual or company-wide portions based on the size of the group sharing the
bonus.
A number of arguments have been made about the rising power and influence of
shareholders in corporate governance in recent decades. Much of the discussion has focused on
investors= increasing ability to advance management practices designed to further their interests
such as linking the pay of executives more closely to changes in shareholder value [see, e.g.,
Useem 1996]. We measure company performance directly using financial indicators of profits and
stock market returns and estimate whether base pay and/or bonus became more tightly tied to past

9
corporate performance over the period 1986 to 1992. (Our method follows Blanchflower,
Oswald and Sanfrey [1996]. They survey the many difficulties in using correlations between pay
and financial performance to measure the causal link between performance and pay. Most
problematic is reverse causality: an accounting identity assures us that the direct effect of a dollar
of excess wages is to lower profits by $1. Thus, even if higher product-market rents (for
example) raise wages, the wage, profit correlation may be low or negative.)4
4. Consider a case where workers capture all the rents of a firm. One firm pays wages of $10 andhas zero excess profits. High-rent firms pay $15 and, because employees capture all rents, alsohas zero excess profits. The corr(wage, profits)=0. The corr(wages, economic rents)=1. Thecoefficient of wages on profits is biased down because each $1 of above-market wages reducesprofits by $1.
H7: The correlation between recent past financial performance and pay has increased over
time.
D. Have Wage Structures Converged? Many press stories recount how competition and the
reduction of product market rents have induced large U.S. firms to move closer to market levels
of pay. The effect of this development on average compensation might well be obscured in
practice by other developments such as increased variation in skill levels across employers or
increased incentive compensation such as profitsharing that varies across employers and affects
pay levels. The trend toward equalization should nevertheless appear in returns to basic units of
skill. They should become more common across employers if competitive product and labor
markets are reducing the ability to pay above or below market rates for equivalent units of labor.
H8: The variation in returns to skill between-firm should decline over time.
III. Data
10
We analyze a proprietary data set collected by Hay Associates, the world=s largest
compensation consultant. The Hay system begins by identifying the skills that are needed to
perform particular jobs adequately using detailed and consistent measures of job requirements.
Job analyses based around detailed questionnaires are developed for each functional area such as
finance, personnel, or engineering, in order to establish exactly what an incumbent does in a job.
These include job duties, allocation of time, responsibility, critical tasks, customer contact, and
many other tasks. The questionnaires are completed for each job title, usually by a team of
managers, employees holding those jobs, and Hay consultants.
The measure of skill used by Hay measures the autonomy and complexity of jobs which
are issues central to the theories of wage determination described above. The Hay measures are
grouped into three categories: "Know How" measures the capabilities, knowledge, and
techniques needed to do the job ranked according to their complexity. The skills captured by this
measure include the kind of formal knowledge usually associated with years of education.
"Problem-Solving" measures how well-defined and predictable job tasks are (less defined and
predictable tasks make greater demands on employees). Finally, "Accountability" measures how
much autonomy or individual discretion employees have in decisionmaking. The three dimensions
are then combined into a single index known as AHay points@ that is designed to measure the
extent of job requirements that workers must perform.5 Hay=s intention is to make these scores
comparable across occupations, companies, and over time.
Hay maintains a data base on what its client companies in different industries pay for
occupations with a given number of Hay points. Individual clients choose a comparison set of
employers (e.g., by size, industry, and location) and decide how they would like their overall wage
structure to be positioned in comparison to those paid by the comparison set -- e.g., at the median
or at the 75th percentile. Clients also exercise discretion in deciding how to position the pay of
individual jobs in their organization compared to that reference set. They may decide to pay some
jobs more or less than the levels prevailing in the data set, for example, in order to establish wage
5. For ease of presentation, we divide the Hay point total by 100; this normalization has no effecton the results. We replicated all analyses described below with the three subscores enteredseparately to ensure the process of creating the index does not affect the results.
11
structures that facilitate internally consistent promotion pathways or job ladders consistent with
the unique set of jobs in their company.
A. Are the Hay Measures Valid? Data from Hay compensation surveys have been analyzed by
a number of researchers [e.g., Smith and Ehrenberg 1981; Cappelli 1993; and Gibbs and
Hendricks 1995]. But it is worth considering in some detail the merits and drawbacks of using
these data.
An important goal of the Hay systems is that the measure of skill created by its job
analysis be consistent both within and across organizations because one of the services they are
effectively selling is salary comparisons based on skill across firms. Hay asserts that
"compensation lines are directly comparable from one organization to another" (their emphasis
[Hay Group, p.8]. Reliability of the measures across jobs and firms is especially important for our
purposes.
The process of job analysis (defining the requirements of jobs) and attaching Hay points,
the measure of skill requirements, to jobs is conducted at an employer by a team of the company's
managers that is trained and led by a Hay consultant. The team begins the process with a set of
"benchmark jobs," such as nurses, secretaries, or accountants, that represent common occupations
easily identifiable in the labor market. The skill requirements for these benchmark jobs are
reasonably constant across employers and are largely general as opposed to firm-specific. After
the team has completed its analyses of the skill requirements of the benchmark jobs, the Hay
consultant does another, independent evaluation of these jobs. These results are compared to the
scores produced by the team in order to check for any biases in their work. After attempting to
correct biases in the team's judgements and then revising the scores, the consultant does yet
another comparison, this time with the average scores generated across client companies for the
same benchmark jobs. A correction factor is generated from that comparison and is applied to all
of the job analyses generated by the team, for benchmark and non-benchmark jobs. If, for
example, the scores produced by the team for its benchmark jobs are 5 percent higher than the
average across other companies, then the consultant calculates a "correlation factor" that will
reduce the scores produced by the team for all of the jobs in that company by 5 percent.

12
As a final check on the consistency of these skill measures, the company maintains an
internal Job Measurement Quality Assurance Group to check on the comparability of the scores
produced across client companies. The consultants in this group are senior practitioners known
as "correlators" who are certified by Hay in their ability to apply the Hay system consistently
across client companies. After a consultant and the client team complete their analysis of jobs and
pay, including any corrections described above, the correlators come out to the client company
and assess the results for consistency with Hay practice elsewhere. And every three years after a
compensation system has been introduced, a Hay consultant returns to the client to evaluation the
system and ensure its consistency.6
6. This description of the quality control process as Hay was provided by Ken Welde, Director ofInformation Services, at the Hay Group (personal communication, Philadelphia headquartersoffice, December 22, 1997).
In addition to these internal checks, external pressures also help ensure the reliability of
the Hay procedures. First, the fact that Hay Associates has been using essentially the same job
evaluation process for more than fifty years provides opportunities to identify and eliminate
obvious sources of error. Hay Associates=s success in the market over many decades implies that
many employers find their job evaluation and weighting scheme to be useful. The tens of
thousands of dollars that employers spend and the hundreds of hours that their managers spend
working on job analyses suggests that employers consider the services Hay provides as highly
valuable. Second, the fact that Hay Associates relies on repeat business from large corporations
provides important incentives to maintain reliable systems: A client would immediately recognize
and find it disturbing if the Hay job evaluation system generated different skill points in
subsequent years for jobs that the employer knew had not changed.
Further, the Hay measures have widespread influence on how jobs are structured and
evaluated in the economy as a whole and, in that sense, have good external validity. During the
1980's, for example, over 2 million employees were in jobs evaluated by Hay, and its system was
used by 40 percent of the Fortune 1000 [Labich 1992, pp. 116-117]. Moreover, comparisons by
non-Hay firms with these establishments extend the influence of the Hay system even further.
13
In addition to the issue of consistency or reliability, it is also important to consider
explicitly whether the Hay measures are valid: Specifically, whether they do a better job at
measuring the dimensions of skill than alternative measures that are available. The Hay points=
measure of skills and responsibility -- as with any such measure -- is subject to several constraints.
The process of writing job descriptions and determining which tasks and responsibilities should
be included in them is somewhat arbitrary, and difficulties in matching actual job duties with Hay
Associates= compensable factors can also introduce errors. How to weight different factors in
determining an overall measure of skill is also largely arbitrary. 7
7. Almost every large organization in the U.S. carries out the same basic processes of job analysis,creating metrics of job requirements, attaching wage rates to them, and adjusting wages to createa coherent pay structure as in the Hay system. Thus, criticism of the ad hoc aspects of thisprocess is muted by the fact that they cannot be avoided just by avoiding the Hay system of jobanalysis and market comparison.
A potentially important concern is the extent to which clients may have an incentive to
bias the decisions governing Hay points as a means of shaping pay decisions in one direction or
another, despite the consistency controls noted above. For example, a powerful job incumbent
involved in the job analysis process may want to justify his or her high current pay, creating
reverse causality between Hay points and compensation. While such incentives no doubt exist,
the clients and the individual employees in them do not need to bias the skill measures to shape
those wage decisions. The process of designing compensation systems gives the client firms
ample opportunity to shape wages as they wish without altering the measure of Hay points. As
noted above, clients choose the comparison set for compensation data, they decide where their
average compensation should be relative to the market, and they make such decisions differently
across jobs. Because the relationship between pay and points is not mechanical, clients do not
need to try to bias Hay points up in order to increase compensation for their positions [see Bellak
1984]. (As a further check, in many of the analyses below we control for the level of individual
jobs in the management hierarchy, a key factor that may influence the ability to influence the job

14
analysis -- top executives potentially have more power over the process than supervisors.
Including these controls rarely altered the results.)
Finally, it is helpful to contrast the Hay measures and the various procedures they use to
guard against biases with alternative measures of skills that are typically used in research. Job
titles and education levels are the most common alternative measures. Both education and job
title data are typically self-reported and come with all the associated biases -- everything from
ego-enhancing reporting to simple problems remembering. Education is typically measured in
years attended (sometimes years completed) with few efforts to adjust for the quality or type of
education received except in some cases where the type of degree completed is included. Job
titles often differ across organizations for similar positions, especially for managerial jobs. Efforts
to generate consistent job titles, such as those used by the Census Bureau, confront the same type
of matching analysis performed by Hay, btu with far fewer quality checks than Hay has.
IV. The Sample
Our data set examines over 50,000 managerial positions per year in 39 companies in 1986
and 1992 with the number of managers employed per company ranging between 129 and 5813.
The data captures the population of managerial-level jobs in each company and includes the
characteristics of the jobs rather than of the incumbents. For each job, we can identify its level in
the organization chart or hierarchy and the firm to which it belongs: CEO or division president;
other senior executives with company or division-wide responsibilities; middle management (that
is, managing other managers or supervisors); supervisors; and exempt, non-supervisors, generally
professional jobs such as accountants. We also know the functional area of each job, such as
marketing or finance, location (zip codes), base salary, total salary, mid-point on the salary scale
for each job class, and skill points (total, and broken out into the three subscores for know-how,
problem solving, and accountability skills).
The 39 companies are headquartered throughout the U.S., and the employees in each
company are often dispersed throughout the country. About 200 of the locations have at least 10
managerial employees. We analyze pay data for two years for each company -- 1986 and 1992.
In 1989, the midpoint in that period, the companies ranged in size from 584 to over 60,000
employees, with a mean of 16,604 and a median of roughly 9,500.
15
We first analyze the log of annual base wages because base wages are the component of
compensation that should be most closely linked to the Hay points measures of skills and
responsibility. We then present the analyses on total pay, defined as base pay plus annual
bonuses. We merge into our data set information on total company employment taken from
Compustat.
The dataset does not have information on stock options and other forms of long-term
incentive pay. Moreover, it lacks information on stock ownership, a form of implicit incentive
that can be very important for many top executives [Hall and Leibman, 1997]. Thus, our results
for the very highest levels of executives may not be representative, given that stock ownership is
an important part of their total compensation. We replicate all results on a sample without top
executives, however, creating a sample where stock ownership and long-term financial incentives
are much less important, to produce results that can be generalized to employees for whom base
and bonus payments constitute the bulk of their compensation.
V. Methods
We use an OLS regression to test the model developed above and to examine wage
inequality across and within firms. We regress the log of base wages against a set of firm
dummies and a composite indicator of Hay points. To control for unmeasured aspects of the jobs,
we include each job=s occupational level in the hierarchy (five levels) and 16 indicators of the
functional area within which each job is located -- finance, marketing, engineering, and so forth.
Several analyses examine inequality within a job title. We do not directly observe job
titles. To identify employees with the same job titles, we match on employer, function, level, and
Hay points. In 1986, for example, there were 11,641 distinct jobs in the sample.8
We used a bootstrap technique to compute the statistical significance of the changes by
running the regression models 200 times on random halves of each sample and retaining the
8. This matching process will create small number of false matches when two employees in thesame firm have different job titles but are nevertheless in the same function and level and haveidentical Hay points. These false matches will slightly overstate inequality within a job title. Because the number of job titles we identify and the range in Hay points are both relativelyconstant, however, this overstatement should not substantially bias results on changes over time. Because job evaluations and other changes in jobs occurred between 1986 and 1992, we cannotsay that we are examining precisely the jobs at the beginning and end of the period. What we areexamining are jobs that share firm, level, function, and Hay points in the two periods.

16
estimated returns to Hay points and/or the estimated standard deviation of the firm effects for
each regression. To test for differences in a coefficient over time or across specifications, we
tested whether the distributions of the 200 coefficients in each specification differed. We
performed a nonparametric Wilcoxon rank test on the two distributions of coefficients and/or
standard deviations. (Using a more powerful but parametric t-test produced the same results.)
Especially because many of the wage equations involve sample sizes with over 50,000
observations, even differences that are unimportant substantively can be statistically significant.
In the discussion below, therefore, we emphasize those results that are large and substantive. The
large sample size also implies that correcting for measurement error when, for example,
computing the standard deviation of employer wage effects does not meaningfully affect our
results [Haisken-DeNew and Schmidt, 1996]. As a result, we forego that extra set of
computations in the results reported here.
VI. Describing Wage Structures at Large U.S. Employers
We present summary statistics and checks for representativeness of the sample as well as
other descriptive decompositions of the data which may be of interest because so little few multi-
employer datasets are available with measures of both skills and wages.
A. Summary Statistics. Table I contains summary statistics about the changes in jobs in this
sample between 1986 and 1992. Both base and total wages were higher in real terms in 1992
than in 1986 with most of the increase in total wages being attributable to the rise in base wages.
Average skill points were slightly lower in 1992 than in 1986, a potentially interesting result given
the interest in whether skill requirements in the workforce are rising. The differences in wages
and in skill points are statistically significant. The standard deviation of both base and total wages
increased (for example, the standard deviation of the log of base wages rose from 31.6 percent in
1986 to 34.3 percent in 1992) while the standard deviation of skill points fell slightly during this
period. In results not shown, other measures of dispersion such as the Theil and Gini coefficients
also indicate a similar increase in wage inequality. (These measures capture different aspects of
the distribution than does the standard deviation. Amartya Sen discusses the strengths and
17
weaknesses of these measures [1973].) Tables IF and IG present the industry breakdown of
companies and the distribution of the positions by functional area.
Table I Here
B. Checks for representativeness. An important issue in datasets such as this one is the question
of sample self-selection. To test whether the firms in this sample were distinctive from employers
of similar size in their industry, we used Compustat data to match each firm in the Hay dataset to
the firm closest in 1986 sales within its 2-digit SIC industry. Using a Wilcoxon signed rank tests,
we found no statistically significant difference between the firms in the Hay dataset and the
matched firms in the level of sales, employment, or debt to equity ratios in 1992, or rate of change
in sales, employment, or debt to equity ratios from 1986 to 1992. We also found no statistically
significant difference in profitability (return on assets) in 1986 or 1992. Using the acquisitions
line on Compustat we found no significant difference between the mean size of acquisitions over
this time period and no difference in the number of acquisitions per year. In short, there is no
evidence that these employers are in any way non-representative of the population of large
industrial firms. (This population, of course, is not representative of all employers.)
C. Describing Wage Structures: The employers in the Hay dataset are relatively homogeneous
in terms of size and sector (they are all industrial). Because the employers in this data set pay tens
of thousands of dollars to Hay to find comparable employers and use data from those comparable
firms to set their own pay levels, we might expect between-employer pay variability to be much
lower in this dataset than in most others. Nevertheless, the employers appear to have distinctive
approaches to setting their wage structures. For example, wage levels do differ across employers
for similar jobs. Controlling for 5 job levels and 16 job functions, the standard deviation of
employer effects was 12 percent in 1986 (Table III, model 1). This is somewhat lower than the
standard deviation of employer effects estimated in other datasets, which range from 14 to 21
percent. (See, for example, the papers in U.S. Bureau of the Census, [1998].)
Employers also pay systematically different amounts for units of skill as measured by Hay
points. In results available on request, we estimated wage equations which permitted each
employer to have its own intercept and its own coefficient on Hay points. The standard deviation
18
across employers of the return to Hay points was 0.057 in 1986, which is a substantial fraction of
its mean of .239.9 Again, the fact that pay structures differ among employers accords qualitatively
with what other researchers have found (e.g., Groshen and Levine [1998]; Leonard and van
Audenrode, [1996]).
D. Persistence of wage structures. Also, as others have found (e.g., Levine [1991]; Groshen
[1991b], these employer wage effects persist over time. Controlling for level and function, the
correlation of firm effects in 1986 with those estimated in 1992 is .79. Firm-specific levels of the
Hay measures of skills are almost as persistent. The correlation between employer effects in 1986
and 1992 in an equation predicting skills (controlling for level and function) is .74.
9. In results not shown we correlated returns to skills with a number of employer characteristicssuch as the estimated employer wage effect, the average Hay points at the enterprise, severalmeasures of financial performance, and the debt:equity ratio. In general, the correlations were notstatistically significantly different from zero.
Finally, other aspects of the employer wage structures besides the average are correlated
over time. We permitted each employer to have its own coefficient on Hay points as well as its
own intercept. The correlation between firm-specific returns to Hay points estimated in 1986 and
1992 is .69. This is somewhat higher than the autocorrelation that Groshen and Levine [1998]
identify with their measure of firm-specific wage structure; they estimated 5-year autocorrelations
near .45 during that time period. (Their measure is for all aspects of the firm-specific wage
structure, which may include many transitory and person-specific features, while the single Hay
measure may capture more about company policy.)
E. Base Pay vs. Base Pay + Bonus. As expected, the total inequality of base+bonus is
somewhat higher than that of base pay alone. In Table IV, the RMSE of an equation with only
job level and function controls was 25.9% for base+bonus, somewhat larger than the 24.7 percent
for base pay in 1986 seen in Table III. We can also conclude that virtually none of the difference
in inequality between employers appears to be due to bonuses that are shared company-wide
19
among managers and professionals. Company-wide sharing of bonuses would lead the standard
deviation of firm effects to be larger for base+bonus than for base pay alone. But in fact, the
reverse was true: the standard deviation of firm effects for base pay was 12.0 percent in 1986 and
11.7. percent for base+bonus.
Perhaps surprisingly, base+bonus is more closely related to Hay points than base alone.
When regressing Hay points against base+bonus in 1986 the estimated coefficient was .220, on
base alone the coefficient was only .203. (The regressions included controls for level and
function.) This result is perhaps not surprising when comparing compensation between levels.
That is, top executives have on average both more bonus pay and a higher proportion bonus pay
than their vice presidents. What is somewhat more surprising is that the result still holds when we
include controls for job level, as in Table IV. It would be difficult to imagine that we could have
this result if bonus payments were largely dependent on individual worker performance as that
should vary considerably across individuals in jobs with the same Hay points. It would appear,
therefore, that bonuses have at least as much to do to with one=s position as does base pay.
F. Employer wage effects by level. It is also interesting to know how consistent wage policies
are within a firm. Dickens and Katz, for example, present evidence that high-wage industries pay
high wages to all occupations [1987]. In this data set, the firm-specific intercept estimated for
each level alone are correlated .89 and above with overall employer wage effect, controlling for
job function and Hay points. This suggests that these employers pursue consistent policies toward
wages across different jobs, setting wages for different positions at more or less the same point in
the distribution of wages for similar jobs across other employers.10
VII. Results
10. The correlation is lower between the pay of the highest executive at each employer andthe employers= firm effect: .58 in 1986 and .72 in 1992. Top executives= actual compensationmay even be less well correlated with employer wage effects than our measurements indicatebecause, as noted earlier, most of these executives= total compensation is stock and other long-term incentives not captured by base pay or base pay plus bonus.

20
Table III presents the main analyses. Wage inequality in this sample has increased, as
indicated in the first row of Table III: the standard deviation of log(wages) has risen from 31.6
percent to 34.3 percent, that is, by about 10 percent. (For ease of exposition we refer to 100
times logs as "percent.") Inequality is lower controlling for a job level and function (RMSE = 24.7
percent in 1986). The rise in inequality between 1986 and 1992 is again almost ten percent.
Controlling for job level and function ensures that the increase cannot be attributed to any
changes in the composition of jobs across that period. (The R2 of the regression with just the
controls is almost unchanged between 1986 and 1992.)
Table III Here
A. Are Differences in Mean Wages between Firms Primarily Due to Differences in Skill?
The first hypothesis asserted that differences in average wages across employers were attributable
to differences in average skill levels across employers. Model 1 in Table III examines base wages
using only firm effects and controls for job level and function, without Hay points. The increment
to the R2 due to adding firm effects is 7.9 percent, and the standard deviation of firm effects is
12.0 percent, reinforcing the descriptive observation earlier that wages differ substantially among
employers for employees with similar job titles and skills. The second model shows the results of
regressing log wages against the composite Hay points score. This single measure of skill and
responsibility is correlated .80 with base wages, corresponding to an R2 of 64 percent from this
single measure alone (regression not shown). By way of comparison, a standard wage equation
controlling for age, education, experience, tenure, gender, race, region and various nonlinear
combinations rarely achieves an R2 over 30 percent: A wage regression with three-digit
occupational classifications -- a typical proxy for job requirements and skill in other studies -- and
the above controls using the 1992 Current Population Survey produces an R2 of only 31 percent.
The impressive explanatory power of Hay points implies that it is a far more complete measure of
skill and job requirements than those used in the past to explain wage outcomes.11
11. The extremely high R2 of this regression may also imply that employers set pay based on Haypoints. Recall, however, that the employers have considerable discretion in setting pay levels andthat Hay points do not translate into any unique salary recommendations.

21
The third model includes both firm wage effects and the composite Hay points score. The
standard deviation of the firm effects declines to 11.2 percent when Hay points are included,
slightly less than its value of 12.0 percent when it is calculated without controlling for Hay points.
The incremental R2 of adding Hay points and controls to firm effects is 7.8 percentage points,
which is almost identical to the incremental R2 of adding firm effects and controls alone, without
Hay points ( 7.9 percentage points). The fact that the standard deviation of the firm effects and
the incremental R2 of adding firm effects to the equation are hardly diminished when controlling
for the very detailed measures of skill represented by Hay points suggests that relatively little of
between-firm inequality is due to differences in mean skill levels between firms, providing little
evidence in favor of hypothesis 1. Another implication of Model 3 is that Hay points are, in fact,
being used consistently across firms: If they were not, then the adding firm effects should produce
estimates that are substantially better than using Hay points alone. Yet the improvement is
relatively modest (last row in Table III).12
12. Thanks to a referee for this observation.
These results do not imply that mean wages at an employer and mean Hay points are
completely uncorrelated. When we regress the mean wage residual at each firm (that is, the firm
effects from Model 1 in Table III including the controls) and the mean Hay points residual at each
firm (that is, the firm effects from model 2 in Table III including the controls), the R2 is .12 in
1986 (regression not shown). This R2 is only one-fifth as large as that obtained when we perform
the regression at the individual level. Together, these results suggest that skill as measured by
Hay points is a powerful predictor of wages within enterprises but a weak predictor of which
employers pay high wages.
The inability of detailed skill measures to reduce the variances of employer wage effects
was surprising but not entirely without precedent. Similar results were found in 1982-83 surveys
that compared manufacturing establishments in the Indianapolis area in the U.S. to those in the
Kanagawa prefecture in Japan (an industrial district outside of Tokyo). These surveys provided
one of the few datasets in addition to our Hay data that contain both detailed measures of job
characteristics and sufficient observations per employer to estimate employer wage effects.
(James Lincoln and Arne Kalleberg [1990] discuss the data in detail.)
22
In addition to standard measures such as age, race, education, tenure, and experience, the
surveys included questions on 12 (in Japan) or 13 (in the U.S.) job characteristics such as training,
autonomy, complexity, and supervision that offered proxies for job and skill requirements. The
job characteristics were important predictors of wages. In both countries, increasing each
measure of OJT and complexity and lowering each measure of supervision by one point each (on
a four point scale) has about the same effect as raising education by four years. (Complete results
are in Levine [1991], tables 2 and 3.)
As with other datasets, employers paid very different wages to employees in the same
broad occupation with similar demographic characteristics and human capital.13 The standard
deviation of employer wage effects was 18.5 percent in the U.S. and 13.7 percent in Japan. These
employer effects are very large; in both countries, moving from the average plant to one paying
one standard deviation above average increases wages by as much as increasing education from
grade school to college.
13. Controls included age and its square, tenure and its square, race, gender by marital statusinteractions, and worker vs. supervisor vs. manager occupational controls interacted withproduction line vs. technical departments. Results were unchanged with interactions oftenure*training, or higher-order controls for tenure.
In spite of their importance in predicting wages, however, the adding the many job
characteristics to the wage equation with standard controls plus plant effects did not reduce the
dispersion of establishment wages. Specifically, the standard deviation of plant wage effects in the
U.S. actually rose slightly from 18.5 percent in the baseline equation to 19.0 percent when job
characteristics are added to the regression while the Japanese figure declined only slightly from
13.7 percent to 13.5 percent. The plant effects with and without job characteristics were
correlated at or above the 0.98 level in both countries.
These results are hardly definitive, but replication of this key and surprising result in the
Indiana and Japanese datasets as well as the very different Hay data set raises our confidence that
measures of skill and job characteristics do not, in fact, explain much of the differences in wages
among employers.
23
B. Changes over Time . Firm wage effects have grown over time in the Hay sample. The
standard deviation of the firm effects alone (model 1) grew from 12.0 percent in 1986 to 14.6
percent in 1992, and the incremental R2 of adding firm effects given the controls increased from
7.9 to 9.0 percentage points. These results support H:2, that wage inequality between employers
has risen. Davis and Haltiwanger [1991] and Groshen and Levine [1998] also find rising
inequality between employers during this time period. And the rise in inequality was not due to
increased sorting of skills among employers.14
The rise in inequality was greater between employers than within employers. Within-firm
inequality of log wages (measured by the root mean square error [RMSE] of an equation
including controls and firm effects) rose from 23.1 to 24.7 percentage points between 1986 and
1992, about 9 percent. In contrast, inequality between employers (the standard deviation of the
firm effects) rose from 12.0 to 14.6 percentage points over the same period, a 21 percent increase
that is about twice as fast as the growth of overall inequality (Table III, model 1). This result
contradicts hypothesis 2, which notes that if inequality within and between firms are both proxies
for human capital, then their returns should grow in tandem.
14. To test for changes in sorting, we regress Hay points on firm effects and a set of controlsfor job level and function (Table II, model 2). The results provide no evidence that employersdiffer more in their skill compositions over time. In fact, the standard deviation of the firm effectdeclines slightly from 13.7 percent to 12.7 percent. (With no controls, the standard deviationrises slightly, from 11.3 percent to 12.1 percent -- Model 1.) Kremer and Maskin [1996], incontrast, present indirect evidence of increased sorting across firms.

24
Within-firm inequality might have increased more rapidly between managers and lower-
level employees, however. For example, Davis and Haltiwanger [1991] calculate that wage
inequality between manufacturing plants measured in an establishment survey (the LEED) grew
more slowly than total wage inequality measured in a household survey (the CPS). Assuming the
two sets of inequality measures are comparable, they then estimate that 25-40 PERCENT of the
increase in wage inequality is within plants for nonproduction workers.15
C. Do Higher Returns to Skill Explain Most of the Rise in Wage Inequality? Model 2 in
Table III regresses the composite measure of Hay points and job-level controls against wages in
order to test H:3, that the increase in inequality between firms can be accounted for by changes in
returns to skill. Consistent with the assumption that returns to human capital have risen over this
period, the coefficient on Hay points rises about 15 percent (from 20.3 to 23.3) between 1986 and
1992.
Rising returns to this measure of skill explains only a portion of the rise in inequality
between firms, however. The incremental R2 from including Hay points (given the controls) rises
from 31.4 to 32.7 percent from 1986 to 1992 while the RMSE of the regression rises from 17.3 to
18.2 percent. (In regressions not shown, without the presence of the controls, the R2 of the
equation including only Hay points actually declines slightly, from .64 in 1986 to .60 in 1992.)
These increases in the inequality explained by Hay points are not significant, however, based on
the bootstrap test. In model 3 we add firm effects and Hay points to a model with the standard
15. Lawrence Katz [1991] points out that the CPS captures total inequality, which includes thesum of inequality within plants, between plants and corporate headquarters, and betweencompanies. The LEED measures only inequality between plants. Thus, the result that CPSinequality is growing faster than LEED inequality shows that within-company inequality isgrowing, although it conflates within-plant wage inequality and any widening gap betweenheadquarters and factory.
25
job controls. The standard deviation of the firm effects in fact rises 2.7 percentage points, about
20%, suggesting that rising inequality between employers cannot be due to rising returns to the
skills measured by Hay points and refuting H:3.
D. Robustness Checks. Robustness checks (available from the first author) found the results
essentially unchanged when we analyzed base pay plus bonus instead of base pay alone (Table
IV); omitted the detailed controls for functions and levels within the organization; replaced
average Hay points with the know-how, accountability, and problem solving subscores of Hay
points along with their squares; included those employers who dropped from the sample in 1992
to perform the cross-section tests on a larger sample; added measures for SMSA mean wages and
unemployment rates; corrected roughly for heteroskedasticity by weighting by 1/Hay points; ran
the regression separately for each job level and for the larger job functions; and dropped the 1%
of the sample with the highest and lowest Hay points and wages.
Table IV Here
VIII. Changes in Internal Labor Markets over Time
While the previous section tested results of a deductive model, this section provides
evidence for hypotheses derived from more descriptive and inductive theories about the decline of
internal labor markets.
A. Changes in Correlations with Local Labor Market Conditions. If the compensation
structures of firms over time resemble internal labor markets less and their wage setting
mechanisms are more closely tied to external labor market forces, we should expect to see a
stronger relationship between wages and local market characteristics over time. We test this
notion by examining the differential paid to incumbents in similar jobs (same job class and skill
points) across locations within the same firm in the two time periods. First we examine the
variance in wages across locations. In 1986 the mean standard deviation of base salary for similar
work at different locations was $3,302. This declined slightly to $3,230 in 1992 (change not

26
statistically significant), suggesting that the geography differential has remained relatively stable
over this time period.
We then calculated the percentage difference between the mean wage for each job at each
company location and the overall mean wage for that job across the company and regressed it on
local market wages and unemployment. In contrast to hypothesis 4A, local labor market
conditions were not significant predictors of wage differentials in either 1986 or 1992.
Hypothesis 4B suggests that while the overall relationship should have increased, that rise should
have become most pronounced for professionals and first-line supervisors, as opposed to top
managers. In fact, results were not significant for these groups, either, although the number of
limitations to our analysis suggests that the lack of significant results can only be considered
suggestive.16
Table V here
B. Has Merit Pay Become More Important? To the extent that individual-level rewards for
performance have become more important, we should see an increase in inequality for base pay
for employees in the same job title has risen as H:5A predicts. Consistent with that hypothesis,
the typical (median) standard deviation in total cash compensation within job titles for jobs with
four or more incumbents had a standard deviation of total pay of 7.0 percent in 1986 and 7.5
percent in 1992. All job levels experienced an increase in the standard deviation of total
compensation, but it was larger for first-line supervisors (7.3 to 8.0 percent) and smaller for
professionals (6.9 to 7.0 percent).17 The rise in inequality within a job title averaged about 8.0
16. For example, the nature of the large firms in our sample restricts the breadth of the jobsincluded in this analysis. For many of the corporate administrative jobs, for example, there is onlyone location. Thus, the jobs included in this analysis are skewed towards jobs that are morenaturally geographically dispersed such as sales jobs. Our measures of local wages andunemployment may also be reducing the predictive power of our model. We use Bureau of LaborStatistics Standard Metropolitan Area data for our measures of unemployment and wages, andthese data may be less representative of the managerial labor market that is relevant for theseanalyses.
17. The mean and median number of incumbents in each job title (that is, with identical function,employer and skill points) were similar in both years (approximately 10 and 4). The number ofAunique@ jobs was 4351 in 1986 and 3921 in 1992.

27
percent, slightly less than the 11 percent rise in total inequality in base wages in this sample. This
increase in pay inequality within jobs is consistent with the concept of Abroad banding@ in the
practice of compensation whereby the upper and lower bounds of acceptable pay levels for any
given job title are widened presumably to give more opportunity to differentiate pay according to
individual performance. (Groshen and Levine [1998] also find a small but statistically significant
increase in pay variation within a job title during the 1980s and 1990s.)
A second aspect of the rising importance of individualized incentives is the increased use
of bonuses. Thirty-two percent of employees in our sample received a positive bonus in 1992, up
from 19.6 percent in 1986, a calculation that no doubt understates the extent of bonuses because
not all who were eligible for bonuses necessarily received payment. If we instead estimate the
percentage of job titles (that is, positions sharing job level, job function, and Hay points) where
bonuses were received, the percentage rises from 27 to 47 percent over the same period. In 1986,
bonus variation within job titles was on average a small part of total pay. Considering jobs with
four or more incumbents in the same firm (eliminating by definition all top executives), we
calculated the variation in the percentage of bonus within job title: specifically, the standard
deviation of bonus/(base+bonus) for employees with the same employer, job level, function, and
Hay points. Over the entire sample, the mean standard deviations of this measure within a job cell
was 0.75% in 1986. That is, bonuses increased pay variation only modestly among people in the
same job title.
At the same time, we find some evidence for hypotheses 5B and 5C that inequality rose
faster for bonus than for base pay within job titles and within firms. These hypotheses are based
on arguments popular in the compensation literature that employers make greater use of bonuses
to reward individual performance than in the past. The proportion of pay at risk in our data set as
measured by the size of the bonus payments rose from .75 percent in 1986 to 1.03 percent in
1992. While the absolute level of these payments is low, the increase in level is particularly
impressive given that 1992 was a year of low corporate profits. Assuming that bonus pools are
related to corporate performance, the 1992 figures are an understatement of the true rise in the
importance of bonuses.18
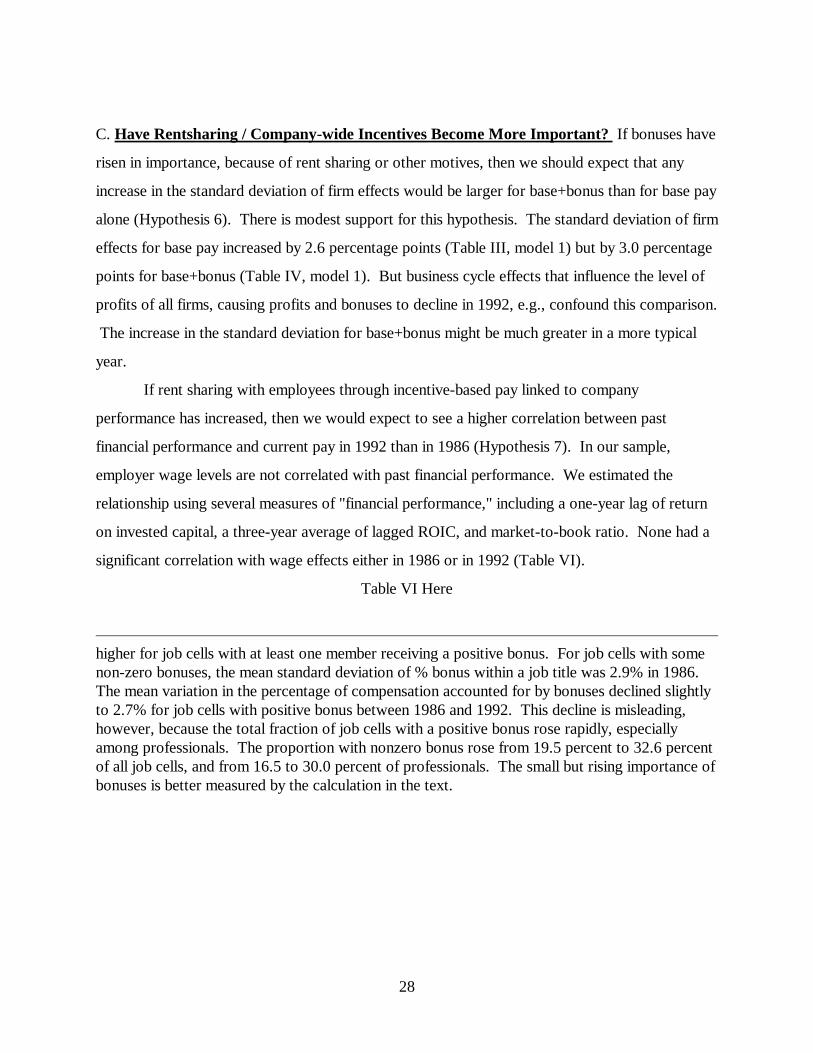
18. The mean variation in the percentage of pay attributable to bonuses within a job cell wasdriven down because many jobs offered no bonus. The disparity of bonuses is (by construction)
28
higher for job cells with at least one member receiving a positive bonus. For job cells with somenon-zero bonuses, the mean standard deviation of % bonus within a job title was 2.9% in 1986. The mean variation in the percentage of compensation accounted for by bonuses declined slightlyto 2.7% for job cells with positive bonus between 1986 and 1992. This decline is misleading,however, because the total fraction of job cells with a positive bonus rose rapidly, especiallyamong professionals. The proportion with nonzero bonus rose from 19.5 percent to 32.6 percentof all job cells, and from 16.5 to 30.0 percent of professionals. The small but rising importance ofbonuses is better measured by the calculation in the text.
C. Have Rentsharing / Company-wide Incentives Become More Important? If bonuses have
risen in importance, because of rent sharing or other motives, then we should expect that any
increase in the standard deviation of firm effects would be larger for base+bonus than for base pay
alone (Hypothesis 6). There is modest support for this hypothesis. The standard deviation of firm
effects for base pay increased by 2.6 percentage points (Table III, model 1) but by 3.0 percentage
points for base+bonus (Table IV, model 1). But business cycle effects that influence the level of
profits of all firms, causing profits and bonuses to decline in 1992, e.g., confound this comparison.
The increase in the standard deviation for base+bonus might be much greater in a more typical
year.
If rent sharing with employees through incentive-based pay linked to company
performance has increased, then we would expect to see a higher correlation between past
financial performance and current pay in 1992 than in 1986 (Hypothesis 7). In our sample,
employer wage levels are not correlated with past financial performance. We estimated the
relationship using several measures of "financial performance," including a one-year lag of return
on invested capital, a three-year average of lagged ROIC, and market-to-book ratio. None had a
significant correlation with wage effects either in 1986 or in 1992 (Table VI).
Table VI Here

29
D. Have Pay Structures Converged? Finally, if market forces have reduced an employers=
ability to execute distinctive approaches to compensation, then the returns to Hay points should
have become more similar over time (Hypothesis 8). The data do not support this hypothesis.
The estimated standard deviation across employers of the return to Hay points was 0.057 in 1986
and 0.066 in 1992. The average coefficients were .239 in 1986 and .257 in 1992, so the
coefficient of variation of the firms-specific returns to Hay points rose about 8 percent over this
time period.
VIII. Discussion
Some of the results presented here are consistent with traditional human capital theory
where higher skill requirements lead to higher wages. Most importantly, our single measure of
skills and responsibility explains 64 percent of wage variation in the base year of the sample. It is
interesting to see that even for management jobs, the elaborate compensation structures of large
corporations are based in large measure on human capital requirements as illustrated by the fact
that the correlation between wages and Hay points is even higher within firms than between
them.19
We find that wage inequality has risen quite substantially between 1986 and 1992. Even in
this short span, inequality of log(wages) rose by about 9 percent. Inequality between firms rose
faster than within firms, by 20 percent versus 8 percent. Almost all of the increase in inequality
within firms in our data can be attributed to rising returns to Hay points. Numerous authors have
found that some of the rise in inequality is due to higher returns to education, but a substantial
portion of the increased inequality typically remains unexplained. Our better measure of skill and
job requirements accounts for more of the rise of inequality than have other studies, consistent
with the claim that omitted human capital explains the rise in inequality among people at the same
employer with similar observable skills.
19. Hay points are not a pure measure of human capital requirements because they also measureaccountability and responsibility. These aspects of jobs do not require not skill per se, butmotivation and attention. The success of Hay points in explaining wages within firms in thatsense provides some evidence favoring efficiency wage theories, while the failure of Hay points toexplain between-firm wages is correspondingly inconsistent with those theories.

30
With respect to inequality across firms, we found first that companies pay workers in
similar jobs quite different wages, as have previous studies. Human capital theory does poorly in
explaining between-firm differences in wages. In 1986, for example, the standard deviation of
firm effects was almost the same with and without controlling for Hay points. That is, very little
of the differences in mean wages between high- and low-wage firms was due to differences in
mean levels of skills and responsibility. This result is both strong and surprising and is replicated in
similar data with information on employees, job characteristics, and employers in Indiana and
Japan.
A possible explanation for the lack of effect of Hay points in explaining between-plant
inequality is that high-wage employers may pay more in order to attract and retain more qualified
employees than the jobs require. That is, while Hay points measure the requirements of jobs,
some employers may systematically hire "over-qualified" employees to ensure above average
performance. Although this hypothesis cannot be examined with this dataset, it is worth noting
that in other research, traditional measures of human capital such as tenure and education have
little incremental ability to predict wages after controlling for firm and occupation-specific factors,
as we have done in this study.20 More generally, these results echo past studies where individual-
level job characteristics that might proxy human capital have had limited success in "knocking
out" what appear to be wage anomalies (e.g., Krueger and Summers [1988] on industry wage
effects; Groshen [1991b] on establishment wage effects; and Brown and Medoff [1989] and
Kruse [1992] on size-wage effects).
While rising returns to Hay points account for out most of the rise in within-firm
inequality, Hay points explain none of the rise in inequality between firms. Davis and Haltiwanger
[1991] infer that the increases over time in inequality for production wages they observe between
manufacturing plants, coupled with other evidence of increasing returns to measurable skills such
as education, "are consistent with explanations for the gap that stress sorting by worker ability."
They assert that the rise in inequality suggests that Athe sorting by worker ability across plants of
20. For example, Leonard [1990] analyzes a dataset on managerial compensation with lessdetailed information on job characteristics than the data used here and finds that controlling forjob characteristics and employer, age, firm tenure, job tenure, and schooling add only about 1% tothe incremental R2 of a wage regression.

31
different size probably increased over time." Our direct test of increased sorting does not support
their conclusion, at least with our sample of managerial employees. We find no consistent pattern
of increased sorting of skills between employers.
Proponents of human capital theory may not be swayed by the lack of evidence in our
analyses that skills are behind the rise in inequality between firms. Despite the fact that our skill
measure is correlated at .80 with wages, it is possible, for example, that some aspect of skill that
Hay does not measure may be increasing in importance over time and may not be evenly
distributed across firms. Nevertheless, these results should give pause to researchers who are
confident that differences in mean levels or increases in the differences in mean pay between
employers are due to unmeasured skills.
Our results suggest mixed evidence that the administrated wage structures that
characterize classic internal labor markets are giving way to arrangements where the labor market
has a greater role. We find no evidence that local labor markets have much effect on the wages of
these large employers, even for professional and first-line supervisory jobs which are closer to the
outside labor market, either in 1986 or 1992. We do observe a small increases in pay variation
within job titles, however, that would be consistent with the hypothesis that merit pay has become
more important as well as large increases in the use of bonuses. We also find that the dispersion
of employer-specific returns to Hay points rose slightly over this period, contradicting the
hypothesis that competitive pressures are equalizing wages across otherwise similar jobs.
In considering these results, it is important to recall the limitations of the dataset B most
notably, its modest number of employers and limited span of years. The sample is also fairly
homogeneous in that the employers are large and relatively old. Importantly, because the
employees are restricted to managers and professionals; inequality between these occupations and
hourly employees cannot be examined. The sample studied by Davis and Haltiwanger [1991]
examines a broader range of firm sizes and employee occupations, workers, and some of the
changes they observe may not be visible in the smaller slice of firms and employees in this sample.
More recent data might also reveal greater changes in internal labor markets given that other
studies are finding changes only in the mid-1990s (e.g., Neumark, Polsy, and Hansen [1998]).
Finally, these results raise new questions for future research. Perhaps the most obvious
question is why do skills provide a reasonably good explanation for rising wage inequality within

32
firms but not for the increase in inequality across firms? Perhaps individual employers are able to
adjust wages to skill requirements inside their operations but firm-level wage strategies, such as
efficiency wages, still differ across firms and override the tendency for wages to equalize for jobs
with similar skill requirements. Although few datasets will have better measures of skills and
responsibility, future research will want to examine larger samples of both employees and
employers coupled with more characteristics of each in order to address questions like these.

33
Bibliography
Annable, James, [Chief economist of First Chicago NBD], cited in Wall St. Journal, AInsecure
Executives Make the Economy Grow,@ April 28, 1997.
Autor, David H., Lawrence F. Katz, Alan B. Krueger., "Computing inequality : have computers
changed the labor market?" National Bureau of Economic Research working paper 5956,
Cambridge MA 1997.
Baker, George, Michael Gibbs and Bengt Holmstrom, "The Wage Policy of a Firm," Quarterly
Journal of Economics, CIX, 4, Nov. 1994, 921-55.
Bellak, Alvin O., "Specific Job Evaluation Systems: The Hay Guide Chart-Profile Method."
The Handbook of Wage and Salary Administration, ed. Milton Rock ( New York:
McGraw-Hill, 1984)
Belman, Dale and David I. Levine, AHave Internal Labor Market Wage Structures Declined in
Large Employers?@ mimeo, U.C. Berkeley, 1998.
Bertrand, Marianne, AFrom the Invisible Handshake to the Invisible Hand? How Product Market
Competition Changes the Employment Relationship.@ Cambridge, MA: Harvard
University Department of Economics manuscript, 1997.
Blackburn, McKinley and David Neumark., "Omitted-Ability Bias and the Increase in the Returns
to Schooling," Journal of Labor Economics, XI (1993) No. 3, 521-544.
Blanchflower, David G; Oswald, Andrew J; Sanfey, Peter, AWages, profits, and rent-sharing,@
Quarterly Journal of Economics, CXI (1996):227-251.

34
Brown, Charles and James Medoff, "The Employer Size-Wage Effect," Journal of Political
Economy, 97, (1989) No. 5: 1027-1059.
Bound, John, and George Johnson, "Changes in the Structure of Wages in the 1980=s: An
Evaluation of Alternative Explanations," American Economic Review, LXXII, n. 3 (June
1992), 371-392.
Burack, Elmer H; Singh, Robert P., "The new employment relations compact," Human Resource
Planning , XVIII, n. 1 (1995): 12-19.
Cappelli, Peter, "Are Skill Requirements Rising? Evidence for Production and Clerical Workers."
Industrial and Labor Relations Review, XLVI no. 3 (1993) 515-530.
Cappelli, Peter, and others, Change at Work, Oxford University, New York, 1997.
Cashman, Kevin; Feldman, Janet. "Reengineering the employment contract," Executive
Excellence, XII, n. 2 (Feb 1995)15-16.
Chay, Kenneth Y. and David S. Lee, "Changes in Relative Wages in the 1980s: Returns to
Observed and Unobserved Skills and Black-White Wage Differentials." Princeton
University Industrial Relations Section Working Paper #372, December (1996).
Davis, Steve J. and John Haltiwanger. "Wage Dispersion Between and Within US Manufacturing
Plants: 1963-86," Brookings Papers on Economic Activity (1991) 115-180.
Dickens, William, and Lawrence Katz, "Interindustry Wage Differences and Industry
Characteristics," in Kevin Lang and Jonathan Leonard, eds., Unemployment and the
Structure of Labor Markets, Basil-Blackwell, 1987.

35
Doeringer, Peter B. and Piore, Michael, Internal Labor Markets and Manpower Analysis
(Lexington MA: Heath, 1971).
Foulkes, Fred, Personnel Practices of Large Nonunion Companies (Englewood Cliffs NJ:
Prentice Hall, 1980).
Gibbs, Michael and Wallace Hendricks, "Are Administrative Pay Systems A Veil? Evidence from
Within-firm Data," mimeo, University of Chicago (1995).
Groshen, Erica L. "Five Reasons Why Wages Vary Among Employers," Industrial Relations, 30,
3 (Fall 1991a), 350-381.
Groshen, Erica L. "Sources of Intra-Industry Wage Dispersion: How Much Do Employers
Matter?" Quarterly Journal of Economics (August 1991b), 869-884.
Groshen, Erica, and David I. Levine, AThe Rise and Decline (?) of U.S. Internal Labor Markets,@
working paper, NY Federal Reserve, 1998.
Hall, Brian J., and Jeffrey B. Liebman, AAre CEOs really paid like bureaucrats?@ )Cambridge,
MA. : National Bureau of Economic Research working paper no. 6213, 1997).
HayGroup (no date). "The Hay Guide Chart-Profile Method of Position Evaluation."
Juhn, Chinhui, Kevin M. Murphy, and Brooks Pierce, "Wage Inequality and the Rise in the
Returns to Skill," Journal of Political Economy, CI, no.3 (1993), 410-442.
Kanter, Rosabeth Moss, AFrom Status to Contribution: Some Organizational Implications of the
Changing Basis for Pay,@ Personnel, LXIV (1987), 12-37.
36
Katz, Lawrence F., comment on "Wage Dispersion Between and Within US Manufacturing
Plants: 1963-86," Brookings Papers on Economic Activity (1991) 181-189.
Kiechel, Walter III, AYour New Employment Contract,@ Fortune, CXVI (1987), 109-110.
Kissler, Gary D., AThe New Employment Contract,@ Human Resource Management, XXXIII
(1994), 335-352.
Katz, Lawrence F. and Kevin M. Murphy, AChanges in Relative Wages, 1963-1987: Supply and
Demand Factors,@ Quarterly Journal of Economics. CIV, n1 (Feb 1992):35-78.
Kremer, Michael, and Eric Maskin, "Wage Inequality and Segregation by Skill," mimeo, Harvard,
Cambridge MA, 1996.
Krueger, Alan B., "How Computers Have Changed the Wage Structure: Evidence from Micro
Data, 1984-1989," Quarterly Journal of Economics, CVIII (1993). 33-60.
Krueger, Alan B., ALabor Market Developments, Trade, and Trade Agreements,@ in Incomes and
Productivity in North America (Commission for Labor Cooperation, Dallas TX: 1997).
Krueger, Alan B., and Lawrence Summers, "Efficiency Wages and the Inter-Industry Wage
Structure," Econometrica, 56, 2, March 1988: 259-293.
Kruse, Douglas, "Supervision and the Size-Wage Effect,@ Industrial Relations, XXXI (1992) No.
2: 229-249.
Labich, Kenneth, AThe New Pay Game . . . And How You Measure Up,@ Fortune, CXXVI, no. 8
(October 19, 1992), 116-119.

37
Leonard, Jonathan, AWage Structure and Dynamics in the Electronics Industry,@ Industrial
Relations, XXVIII (1989), 251-275.
Leonard, Jonathan, and Marc Van Audenrode AWorker=s Limited Liability, Turnover, and
Employment Contracts,@Annales d=Economie et de Statistique, 1996.
Levine, David I., "Job Characteristics and Wage Anomalies," W.P. OB/IR-56, Haas School of
Business, University of California, Berkeley, 1991.
Levine, David I. AFairness, Markets, and Ability to Pay: Evidence From Compensation
Executives.@ The American Economic Review, LXXXIII no. 5 (December, 1993), 1241-
1259.
Levine, David I, AThe US Labor Market: 'Institutions' � Rigid and 'Unregulated' �Market-Clearing," Proceedings of the Industrial Relations Research Association, 1994.
Levy, Frank and Richard J. Murnane, "U.S. Earnings Levels and Earnings Inequality: A Review
of Recent Trends and Proposed Explanations." Journal of Economic Literature, XXX,
no.3, September (1992), 1333-1381.
Lincoln, James and Arne Kalleberg, Culture, Control and Commitment, (New York: Cambridge
University Press, 1990).
Manicatide, Mircea; Pennell, Virginia. Key Developments in Compensation Management, HR
Focus, Oct 1992, LXIX (10):3-4.
Miller, A.D.J. Tremain, P.S. Cain, and P.A. Roos, Work, Jobs, and Occupations: A Critical
Review of the Dictionary of Occupational Titles (Washington, D.C.: National Academy
of Sciences Press, 1980).
Mincer, Jacob, "Human Capital, Technology, and the Wage Structure: What Do Time Series Data
Show?" National Bureau of Economic Research Working Paper No.3581 (1991).
38
Mishel, Lawrence and Jared Bernstein, "Did Technology=s Impact Accelerate in the 1980s?"
Paper presented at the Industrial Relations Research Association meetings, San Francisco
CA, January 1996.
Neumark, David, Daniel Polsky, and Daniel Hansen, AHas Job Stability Declined Yet? New
Evidence for the 1990s.@ Paper presented at the Russell Sage Foundation Conference on
Employment Stability and Security, February, New York, NY (1998).
Sen, Amartya K., On Economic Inequality (Oxford, England: Clarendon Press, 1973).
Smith, Robert and Ronald Ehrenberg, "Estimating wage/fringe tradeoffs: Some data problems,"
NBER working paper 827, Dec. 1981.
Stiles, Philip, Lynda Gratton, Catherine Truss, Veronica Hope-Hailey, and Patrick McGovern,
"Performance management and the psychological contract," Human Resource
Management Journal, VII (1) (1997) 57-66.
Taber, Christopher R. "The Rising College Premium in the Eighties: Returns to College or
Returns to Ability?" Northwestern University Department of Economics, April 1996.
Useem, Michael, Investor Capitalism: How Money Managers are Changing the Face of Corporate
America (New York: Basic Books, 1996).

39
Table I: Summary Statistics
Table IA: Overview
1986
Mean S.D.
1992
Mean S.D.
Base Pay ($s)41607 17649 43361 19593
Total Compensation ($s) 42837 21760 45277 25230
Hay points 206.6 119.9 201.4 112.4
Sample size 54,080 55,298
Table IB: Hay Skill Points
Mgt. Level 1986
n
1992
n
1986
Mean S.D.1992
Mean S.D.
Difference of
Means
T-Stat
M=0 39 39 1352 838 1340 950 1.12
M=1 496 479 661 307 580 450 4.36*
M=2 4762 4102 363 127 356 116 2.36*
M=3 22695 19297 198 71 204 72 7.07**
M=4 26088 31308 171 56 168 51 7.17**
All 54080 55225 206.6 119.9 201.4 112.4 7.3***

40
Table IC: Base Pay
1986
Mean S.D.
1992
Mean S.D.
Difference of Means
T-Stat
M=0 220000 141982 231150 158205 2.09*
M=1 119682 58175 116369 55062 0.89
M=2 62722 18026 67884 22493 11.49***
M=3 41610 10422 44531 13183 24.23***
M=4 35970 9379 38039 11105 23.34***
All 41607 17649 43361 19593 15.5***
Table ID: Total Compensation (Base Pay + Bonus)
1986
Mean S.D.
1992
Mean S.D.
Difference of Means
T-Stat
M=0 268235 194394 310526 256258 2.17*
M=1 141669 81657 141498 85027 0.03
M=2 67242 23450 74557 29925 12.3***
M=3 42315 11424 46107 14875 28.2***
M=4 36552 9720 38969 11418 26.72***

41
All 42837 21760 45277 25230 17.1***
Notes: All figures expressed in 1986 dollars.
M = 0 is CEO or Division president, 1 is other senior executives with company or division-wide
responsibilities, 2 is division managers (managing other managers or supervisors), 3 is supervisor,
and 4 is exempt, non-supervisory positions, generally professional jobs.

42
Table IE: Industry breakdown of respondents
SIC DESCRIPTION N SIC DESCRIPTION N
20 Food and Kindred Products 4 35 Industrial & Commercial Machinery &
Computer Equipment
4
26 Paper and Allied Products 3 36 Electronic & Other Electric 3
27 Printing, Publishing & Allied Inds 1 37 Transportation Equipment 1
28 Chemicals & Allied Inds 2 38 Measuring, Analysis & Controlling
Inst
1
29 Petroleum Refining & Related Inds 3 40 Railroad Transport 2
30 Rubber & Misc Plastics 1 49 Electric, Gas & Sanitary Services 6
32 Stone, Clay, Glass etc. 2 50 Durable Goods Trade 2
33 Primary Metals 2 51 Non-durable Goods Trade 1
34 Fabricated Metal Products 1

43
Table IF: Functional breakdown of respondents
Job Function
Number ofIncumbents
Mean Skill Points
Mean Base Salary
1986 1992 1986 1992 1986 1992
GeneralMgmt/Multifield
630 415 690.638 661.665 105370.5
112063.2
Strategic/CorporatePlanning
128 104 339.945 313.75 61921.54
65260.56
Finance/Acctg 3768 3954 211.476 207.482 41023.2 44167.9Info Sys/ DP 3259 4995 190.122 185.256 38803.7
439827.3
9HR 2185 2331 208.05 203.616 41523.2
844421.5
7Legal 504 426 305.821 303.857 55680.4
960438.9
4Marketing 8604 9638 214.176 204.039 39585.2
239808.2
5Public Relations 286 327 234.804 222.419 47261.3
148819.9
6Facility Services 1409 1554 177.51 155.693 38711.6
137431.8
1R&D 1756 1878 236.203 231.952 44202.2
150116.1
7Engineering 7691 8125 203.966 195.092 42156.8
445317.0
6Materials Mgmt 1979 2175 177.155 175.845 36024.7
638458.5
Purchasing/Contracting
906 938 207.422 192.788 41049.23
42737.76
Plant Engr 2015 1814 198.984 196.135 42775.41
46094.92
Mfg or Prod Engr 1314 1445 200.524 198.531 39373.31
44038.31
Quality Assurance 964 1000 194.01 191.762 39269.54
42441.18
Prod/MfgOperations
6222 4644 184.834 191.496 38986.15
42989.94
Rail TransportOperations
2942 2197 181.673 181.675 44526.31
39645.18
Power Generation 854 525 193.987 195.796 45438.89
47716.31
Power Transmission 630 555 179.438 180.975 42661.45
43458.86

44
Gas Transmission 200 152 172.25 172.316 45670.52
47869.42
Utility CustomerService
503 495 159.823 153.556 36356.89
36533.89
All Others 5331 5538 203.934 224.96 40479.98
42957.59
54080 55225

45
Table II: Are Skills Increasingly Sorted between Firms?Dependent variable is log(Hay points)
RMSE = Root means square error
1986 1992 Change(1992-1986)
s.d.(log(Haypoints))
0.398 0.394 -.004
Model 1: Onlyfirm effects.
s.d.(firmeffects) = .113RMSE= .388R2 = .053
s.d.(firmeffects) = .121RMSE = .384R2 = .049
.008-.004-.004
Model 2: Firmeffects andcontrols for joblevel andfunction.
s.d.(firmeffects) = .137RMSE = 0.288R2 = .477
s.d.(firmeffects) = .127RMSE = 0.302R2 = .409
-.010.014-.068
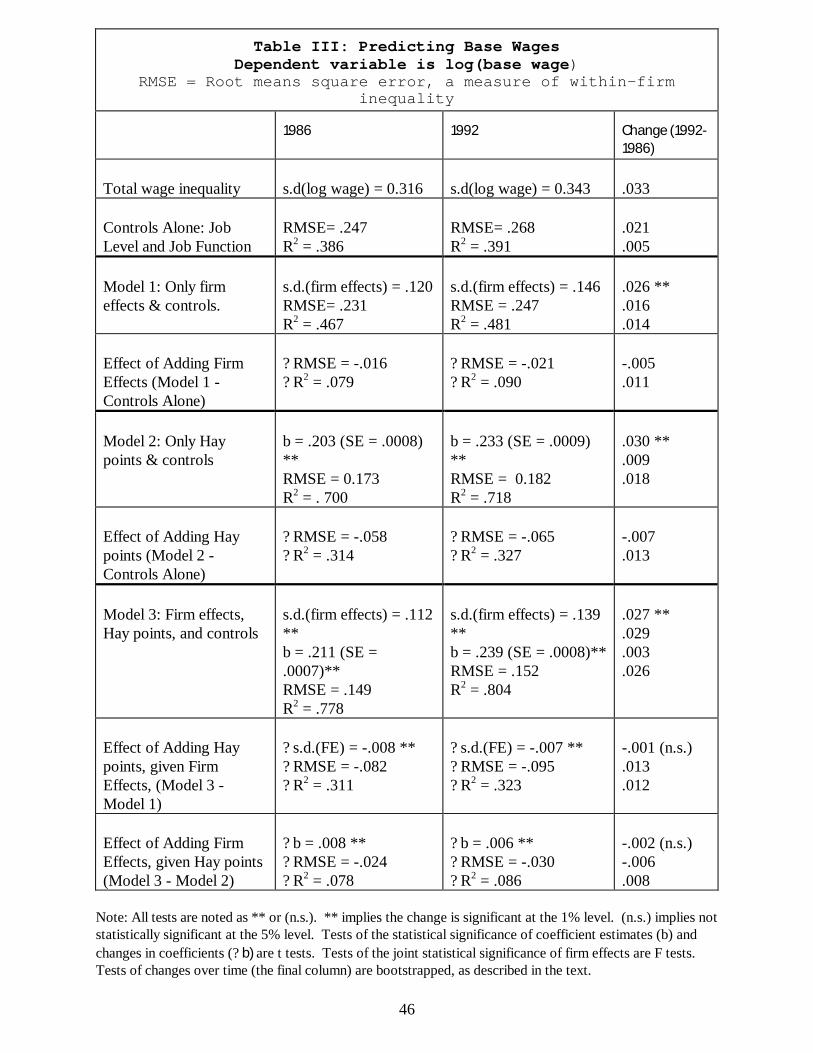
46
Table III: Predicting Base WagesDependent variable is log(base wage)
RMSE = Root means square error, a measure of within-firminequality
1986 1992 Change (1992-1986)
Total wage inequality s.d(log wage) = 0.316 s.d(log wage) = 0.343 .033
Controls Alone: JobLevel and Job Function
RMSE= .247R2 = .386
RMSE= .268R2 = .391
.021
.005
Model 1: Only firmeffects & controls.
s.d.(firm effects) = .120RMSE= .231R2 = .467
s.d.(firm effects) = .146RMSE = .247R2 = .481
.026 **
.016
.014
Effect of Adding FirmEffects (Model 1 -Controls Alone)
? RMSE = -.016? R2 = .079
? RMSE = -.021? R2 = .090
-.005.011
Model 2: Only Haypoints & controls
b = .203 (SE = .0008)**RMSE = 0.173R2 = . 700
b = .233 (SE = .0009)**RMSE = 0.182R2 = .718
.030 **
.009
.018
Effect of Adding Haypoints (Model 2 -Controls Alone)
? RMSE = -.058? R2 = .314
? RMSE = -.065? R2 = .327
-.007.013
Model 3: Firm effects,Hay points, and controls
s.d.(firm effects) = .112**b = .211 (SE =.0007)**RMSE = .149R2 = .778
s.d.(firm effects) = .139**b = .239 (SE = .0008)**RMSE = .152R2 = .804
.027 **
.029
.003
.026
Effect of Adding Haypoints, given FirmEffects, (Model 3 -Model 1)
? s.d.(FE) = -.008 **? RMSE = -.082? R2 = .311
? s.d.(FE) = -.007 **? RMSE = -.095? R2 = .323
-.001 (n.s.).013.012
Effect of Adding FirmEffects, given Hay points(Model 3 - Model 2)
? b = .008 **? RMSE = -.024? R2 = .078
? b = .006 **? RMSE = -.030? R2 = .086
-.002 (n.s.)-.006.008
Note: All tests are noted as ** or (n.s.). ** implies the change is significant at the 1% level. (n.s.) implies notstatistically significant at the 5% level. Tests of the statistical significance of coefficient estimates (b) andchanges in coefficients (? b) are t tests. Tests of the joint statistical significance of firm effects are F tests. Tests of changes over time (the final column) are bootstrapped, as described in the text.
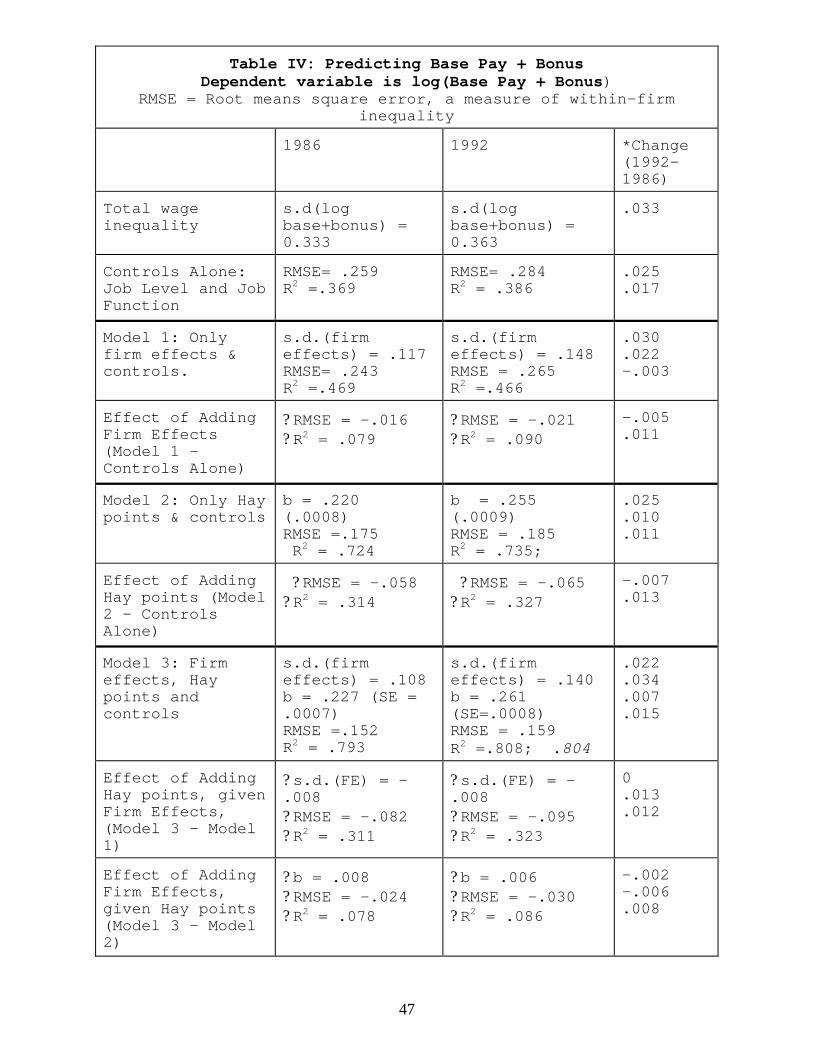
47
Table IV: Predicting Base Pay + BonusDependent variable is log(Base Pay + Bonus)
RMSE = Root means square error, a measure of within-firminequality
1986 1992 *Change(1992-1986)
Total wageinequality
s.d(logbase+bonus) =0.333
s.d(logbase+bonus) =0.363
.033
Controls Alone:Job Level and JobFunction
RMSE= .259R2 =.369
RMSE= .284R2 = .386
.025
.017
Model 1: Onlyfirm effects &controls.
s.d.(firmeffects) = .117RMSE= .243R2 =.469
s.d.(firmeffects) = .148RMSE = .265R2 =.466
.030
.022-.003
Effect of AddingFirm Effects(Model 1 -Controls Alone)
? RMSE = -.016? R2 = .079
? RMSE = -.021? R2 = .090
-.005.011
Model 2: Only Haypoints & controls
b = .220(.0008)RMSE =.175 R2 = .724
b = .255(.0009) RMSE = .185R2 = .735;
.025
.010
.011
Effect of AddingHay points (Model2 - ControlsAlone)
? RMSE = -.058? R2 = .314
? RMSE = -.065? R2 = .327
-.007.013
Model 3: Firmeffects, Haypoints andcontrols
s.d.(firmeffects) = .108b = .227 (SE =.0007)RMSE =.152R2 = .793
s.d.(firmeffects) = .140b = .261(SE=.0008)RMSE = .159R2 =.808; .804
.022
.034
.007
.015
Effect of AddingHay points, givenFirm Effects,(Model 3 - Model1)
? s.d.(FE) = -.008? RMSE = -.082? R2 = .311
? s.d.(FE) = -.008? RMSE = -.095? R2 = .323
0.013.012
Effect of AddingFirm Effects,given Hay points(Model 3 - Model2)
? b = .008? RMSE = -.024? R2 = .078
? b = .006? RMSE = -.030? R2 = .086
-.002-.006.008
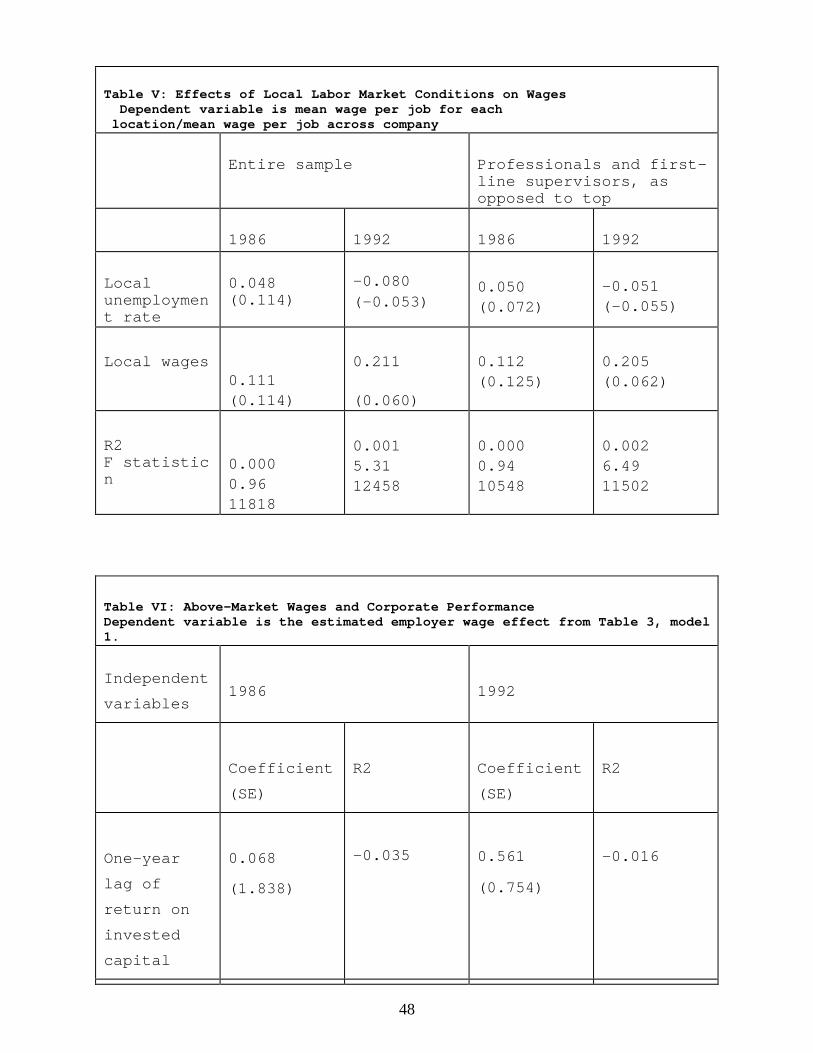
48
Table V: Effects of Local Labor Market Conditions on Wages Dependent variable is mean wage per job for each location/mean wage per job across company
Entire sample Professionals and first-line supervisors, asopposed to top
1986 1992 1986 1992
Localunemployment rate
0.048(0.114)
-0.080(-0.053)
0.050(0.072)
-0.051(-0.055)
Local wages0.111(0.114)
0.211
(0.060)
0.112(0.125)
0.205(0.062)
R2F statisticn
0.0000.9611818
0.0015.3112458
0.0000.9410548
0.0026.4911502
Table VI: Above-Market Wages and Corporate PerformanceDependent variable is the estimated employer wage effect from Table 3, model1.
Independentvariables
1986 1992
Coefficient(SE)
R2 Coefficient(SE)
R2
One-yearlag ofreturn oninvestedcapital
0.068
(1.838)
-0.035 0.561
(0.754)
-0.016
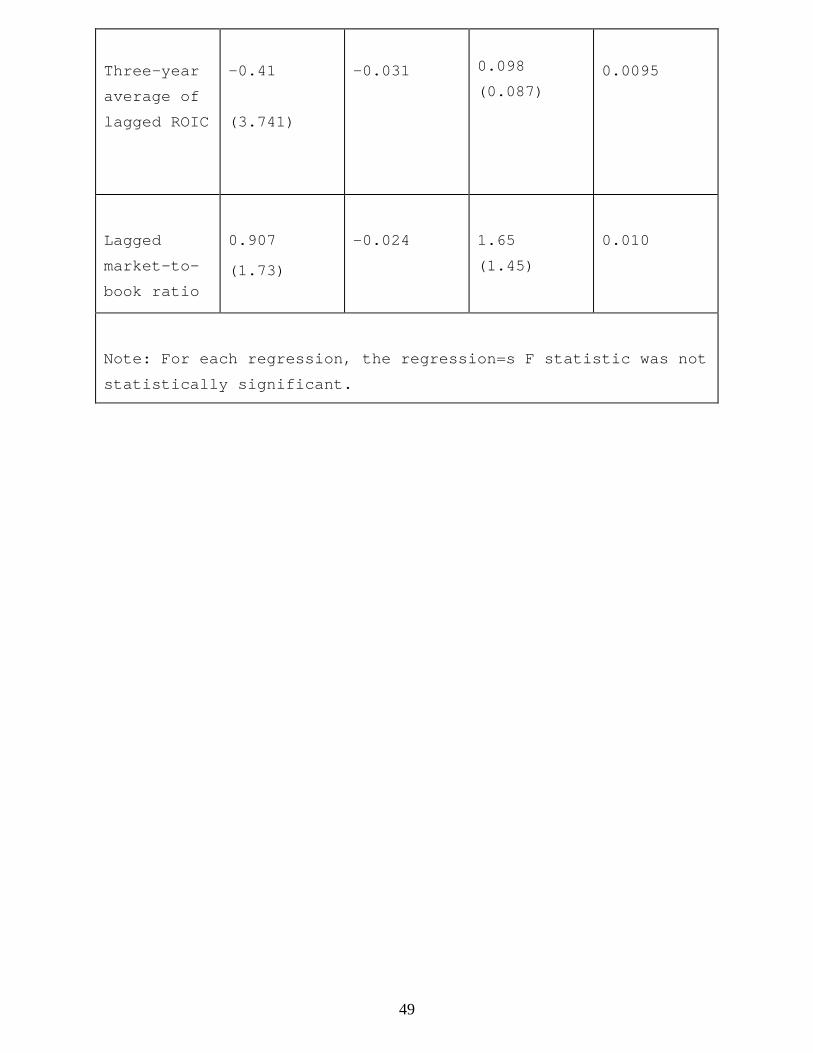
49
Three-yearaverage oflagged ROIC
-0.41
(3.741)
-0.031 0.098(0.087)
0.0095
Laggedmarket-to-book ratio
0.907
(1.73)
-0.024 1.65(1.45)
0.010
Note: For each regression, the regression=s F statistic was notstatistically significant.

50

51

52
Appendix 1: An Illustrative Model of Unmeasured Skills and FirmWage Effects
This section outlines a simple human capital model of wage
determination. Although we do not expect any such simple model
to be literally true, it provides a useful benchmark when we move
to the data. We have designated several propositions as testable
assumptions and several as testable implications from the model.
While we recognize that even the testable assumptions are
implications of underlying assumptions, they are sufficiently
close to each other to treat them as equivalent.
Assume the true model is completely neoclassical where
log(wages), w, are purely a reward for general skills (S) with a
rate of return B:
w = B ≅ S.
Assume further that some employers have higher average
returns to skills than do other employers. Thus, employers will
sort employees, leading employers to differ in their average
skill levels. If we regress wages against a vector of
firm-specific dummies, then the estimated coefficients on the
dummies will capture the amount of sorting by skills. (We will
refer to the coefficients on the dummies as the firm wage
effects, or as the between-firm variation in wages.) Combined
with the assumption that wages measure skills we have our first
testable assumption:
TA1: Mean wages differ by firm:
1) w = f1 ≅ firm effects + e1.
The standard deviation of the coefficients on the firm wage
effects (f1) indicate how much employers differ in their average

53
skill levels. The standard deviation of the estimated residual
e1 measures wage and skill variation within each firm.
Assume we now have an imperfect but fairly accurate measure
of skills,
s = S + u,
where u is a well-behaved error term uncorrelated with skill or
firm. In this case, we can decompose the variance of the skill
measure into a component due to the variance of skills, and a
component due to the error:
V(s) = V(S) + V(u).
We can now correlate our measure of skills with wages, yielding a
testable assumption:
TA2: The measure of skills is correlated with wages.
An important debate focuses on why we see employers paying
such different wages for apparently similar workers and jobs.
(Groshen, 1991a, reviews these theories and the evidence
concerning them.) We can address this debate by adding our
measure of skills to the regression in equation (1), yielding:
2) w = b2 * s + f2 * firm effects + e2
Now the standard deviation of the firm wage effects indicate
how much employers differ in their average skill levels for those
skills not measured by s. That is, the imperfect measures of
skills, s, picks up some of the sorting of skills that was
captured by the firm effects in equation (1). This yields
hypothesis 1:
H1: The standard deviation of the coefficients on the firm
effects (f2) will be smaller when controlling for skills in
equation (2) than in equation (1) with no such controls.

54
To the extent that the measure of skills s is highly
correlated with wages, we know the measurement error on skills
(u) must be low. We will now make two further testable
assumptions:
Consider the case with data from two time periods, "early"
and "late." Assume similar amounts of sorting of both measured
(s) and unmeasured (u) skills between employers both early and
late. We can test for similar sorting of measured skills by
noting that if we estimate how skills vary between employers,
s = f3 ≅ firm effects,
TA3: The estimate of V(f3) should be similar early and late.
Assume further that the returns to skill (B) has increased
over time. Together these imply that the variance of firm wage
effects with no controls for skills (as in equation (1)) has
increased proportional to the variance of log(wages).
H2: Thus, the standard deviation of the coefficients on the firm
effects in equation (1) should be proportionally larger in
the later periods, and the R2 should remain constant.
With constant measurement error of true skills, u, we have
TA5: The estimated coefficient b̂ from
3) w = b≅ s + e3
should have risen over time. The error term in this
regression, e3, measures the returns on unmeasured skills
times the amount of unmeasured skills, u.
Assume further that the measurement error in our imperfect
measure of skills is constant; that is, the ratio of true
variance V(S) to measured variance V(s) is constant.
(Alternatively, assume that the returns to both the measured and
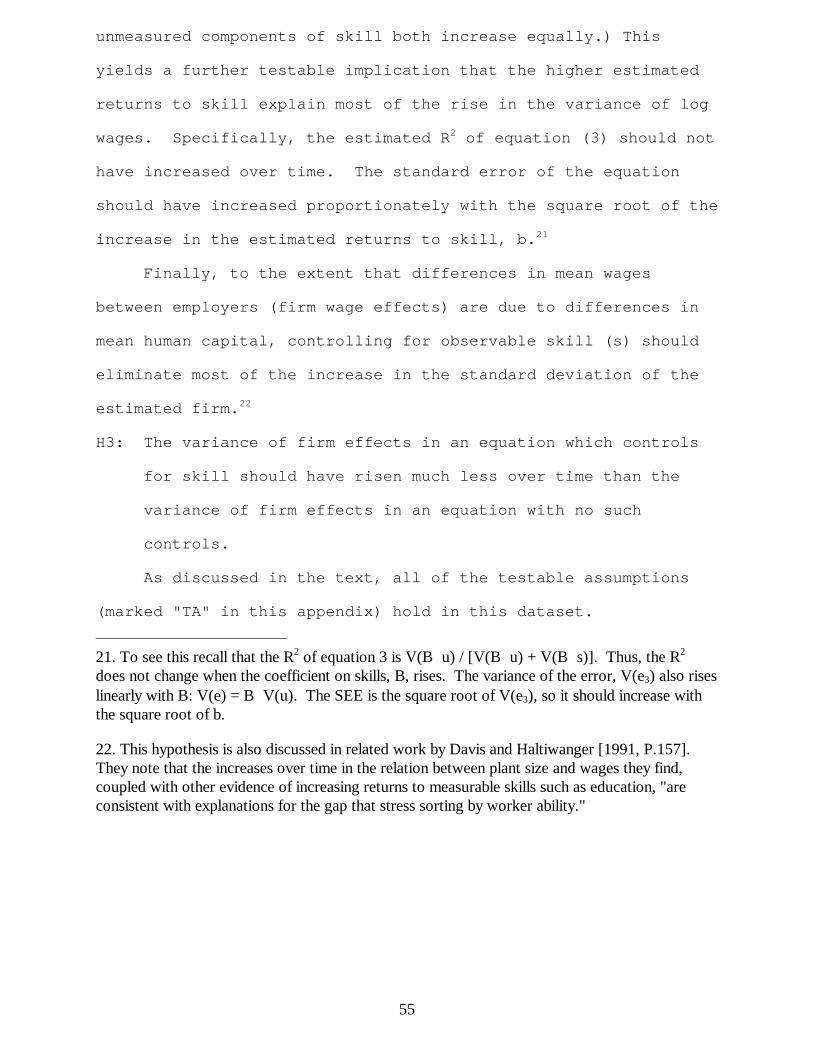
55
unmeasured components of skill both increase equally.) This
yields a further testable implication that the higher estimated
returns to skill explain most of the rise in the variance of log
wages. Specifically, the estimated R2 of equation (3) should not
have increased over time. The standard error of the equation
should have increased proportionately with the square root of the
increase in the estimated returns to skill, b.21
Finally, to the extent that differences in mean wages
between employers (firm wage effects) are due to differences in
mean human capital, controlling for observable skill (s) should
eliminate most of the increase in the standard deviation of the
estimated firm.22
21. To see this recall that the R2 of equation 3 is V(B≅u) / [V(B≅u) + V(B≅s)]. Thus, the R2
does not change when the coefficient on skills, B, rises. The variance of the error, V(e3) also riseslinearly with B: V(e) = B≅V(u). The SEE is the square root of V(e3), so it should increase withthe square root of b.
22. This hypothesis is also discussed in related work by Davis and Haltiwanger [1991, P.157]. They note that the increases over time in the relation between plant size and wages they find,coupled with other evidence of increasing returns to measurable skills such as education, "areconsistent with explanations for the gap that stress sorting by worker ability."
H3: The variance of firm effects in an equation which controls
for skill should have risen much less over time than the
variance of firm effects in an equation with no such
controls.
As discussed in the text, all of the testable assumptions
(marked "TA" in this appendix) hold in this dataset.
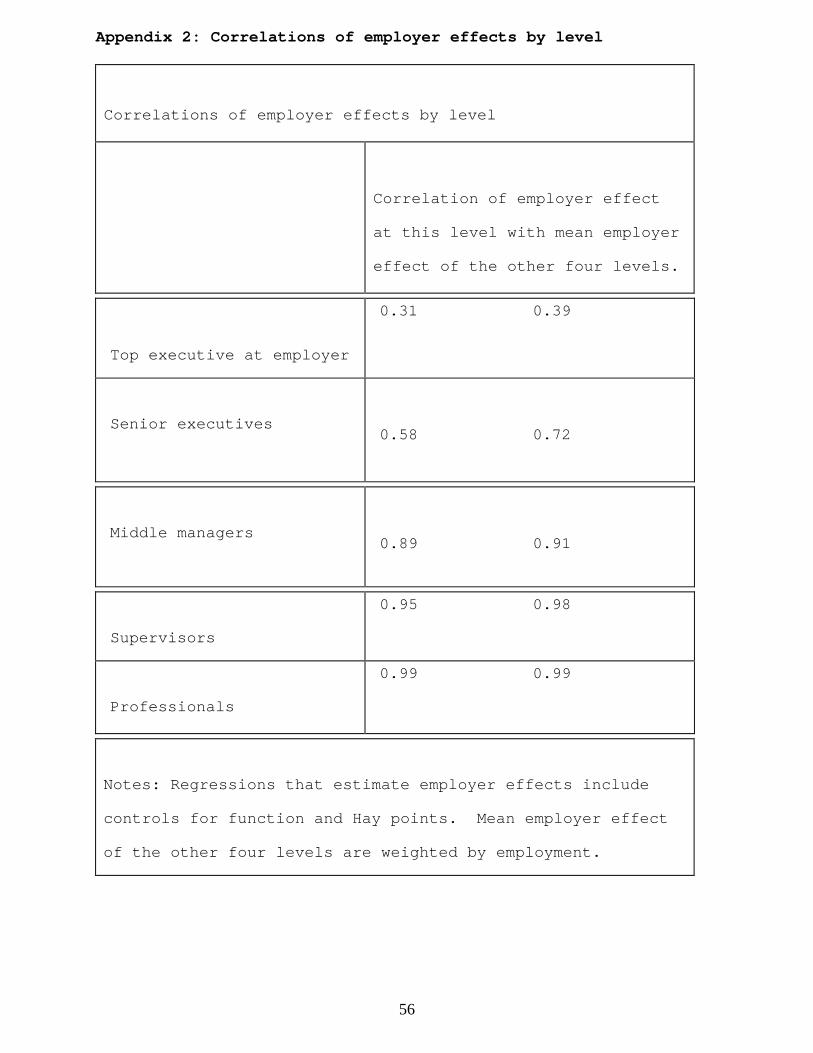
56
Appendix 2: Correlations of employer effects by level
Correlations of employer effects by level
Correlation of employer effect
at this level with mean employer
effect of the other four levels.
Top executive at employer
0.31 0.39
Senior executives 0.58 0.72
Middle managers0.89 0.91
Supervisors
0.95 0.98
Professionals
0.99 0.99
Notes: Regressions that estimate employer effects include
controls for function and Hay points. Mean employer effect
of the other four levels are weighted by employment.
57
Authors:
K.C. O=Shaughnessy
Hayworth College of Business
Western Michigan University
Grand Rapids, MI 49526
David I. Levine
Haas School of Business
University of California
Berkeley, CA 94720
Peter Cappelli
The Wharton School
University of Pennsylvania
Philadelphia, PA 19104
Related Documents