Changes in gene expression induced by polycyclic aromatic hydrocarbons in the human cell lines HepG2 and A549 Fabiola Castorena-Torres a , Mario Bermu ´dez de Leo ´n b,d , Bulmaro Cisneros b , Omar Zapata-Pe ´rez c , Juan E. Salinas e , Arnulfo Albores a, * a Seccio ´ n Externa de Toxicologı ´a, Centro de Investigacio ´ n y de Estudios Avanzados del IPN, Av. Instituto Polite ´cnico Nacional 2508, Col. San Pedro Zacatenco, Me ´xico, D.F. 07360, Mexico b Departamento de Gene ´tica y Biologı ´a Molecular, Centro de Investigacio ´ n y de Estudios Avanzados del IPN, Me ´xico, D.F. 07360, Mexico c Departamento de Recursos del Mar-Unidad Me ´rida, Centro de Investigacio ´ n y de Estudios Avanzados del IPN, Merida, Yucatan 97310, Mexico d Divisio ´ n de Farmacologı ´a y Toxicologı ´a, Centro de Investigacio ´ n Biome ´dica del Noreste, IMSS, Monterrey, Nuevo Leo ´ n 64720, Mexico e Hospital General de Zona ‘‘Unidad de Medicina Familiar No. 24”, IMSS, Nueva Rosita, Coahuila 26850, Mexico Received 5 July 2007; accepted 21 October 2007 Available online 3 December 2007 Abstract Polycyclic aromatic hydrocarbons (PAH) are the main components of emissions generated by coke oven factories and many of these chemicals are carcinogenic. The goal of this study was to examine changes in gene expression in two human cell lines, HepG2 and A549, induced by exposure to a soil extract containing PAH using microarry technology. Soil samples were obtained from the vicinity of a coke oven factory in northeastern Mexico. For comparison, the gene expression pattern induced by Benz[a]pyrene (BaP) was also analyzed. The number of altered genes by both treatments was 2-fold higher in hepatic than in pulmonary cells. Differentially-modulated genes in the two cell lines were identified and grouped by biological function using genomic databases. A group of nine genes up- and down-reg- ulated by either the PAH extract or BaP were selected for validation by real-time PCR. The cellular functions of these PAH-responsive genes included: xenobiotic metabolism (CYP1A1 and CYP1B1), DNA repair (ERCC5), oxidative stress response and cell proliferation (FTH1 and PRDX1), protein degradation (PSMD7), ion transport (FXYD3), steroid biosynthesis (FDFT1), and signaling pathways (PTGER3). The real-time PCR analysis confirmed most of the microarray data with significant correlation. Additional studies are required to determine the mechanisms involved in the PAH-mediated modulation of these genes and to associate these changes with human health. Ó 2007 Elsevier Ltd. All rights reserved. Keywords: PAH; Cytochrome P450; Microarrays; Coal pollution; Gene expression 1. Introduction Coal combustion and/or industrial transformation pro- duce emissions such as coal tars and smoke that are released into the environment. The heavy soot fractions of these emissions are ultimately deposited into the ground (Khodadoust et al., 2000). Polycyclic Aromatic Hydrocar- bons (PAH) are the most abundant chemicals released during coal processing (Blumer, 1976). PAH consist of more than 100 different compounds, including some that are considered carcinogens (Jongeneelen, 1992). In this respect, Benz[a]pyrene (BaP), an environmentally ubiqui- tous PAH, has been commonly used as an indicator of the carcinogenic potency of PAH mixtures (Bostrom et al., 2002). Environmental exposure to PAH result in a variety of molecular responses in the organism such as enzyme acti- vation, oxidation, and/or signal transduction. Many of these responses are mediated by the aryl hydrocarbon 0887-2333/$ - see front matter Ó 2007 Elsevier Ltd. All rights reserved. doi:10.1016/j.tiv.2007.10.009 * Corresponding author. Tel.: +52 (55) 5061 3308; fax: +52 (55) 5747 7111. E-mail address: [email protected] (A. Albores). www.elsevier.com/locate/toxinvit Available online at www.sciencedirect.com Toxicology in Vitro 22 (2008) 411–421

Welcome message from author
This document is posted to help you gain knowledge. Please leave a comment to let me know what you think about it! Share it to your friends and learn new things together.
Transcript
Available online at www.sciencedirect.com
www.elsevier.com/locate/toxinvit
Toxicology in Vitro 22 (2008) 411–421
Changes in gene expression induced by polycyclic aromatichydrocarbons in the human cell lines HepG2 and A549
Fabiola Castorena-Torres a, Mario Bermudez de Leon b,d, Bulmaro Cisneros b,Omar Zapata-Perez c, Juan E. Salinas e, Arnulfo Albores a,*
a Seccion Externa de Toxicologıa, Centro de Investigacion y de Estudios Avanzados del IPN, Av. Instituto Politecnico Nacional 2508,
Col. San Pedro Zacatenco, Mexico, D.F. 07360, Mexicob Departamento de Genetica y Biologıa Molecular, Centro de Investigacion y de Estudios Avanzados del IPN, Mexico, D.F. 07360, Mexico
c Departamento de Recursos del Mar-Unidad Merida, Centro de Investigacion y de Estudios Avanzados del IPN, Merida, Yucatan 97310, Mexicod Division de Farmacologıa y Toxicologıa, Centro de Investigacion Biomedica del Noreste, IMSS, Monterrey, Nuevo Leon 64720, Mexico
e Hospital General de Zona ‘‘Unidad de Medicina Familiar No. 24”, IMSS, Nueva Rosita, Coahuila 26850, Mexico
Received 5 July 2007; accepted 21 October 2007Available online 3 December 2007
Abstract
Polycyclic aromatic hydrocarbons (PAH) are the main components of emissions generated by coke oven factories and many of thesechemicals are carcinogenic. The goal of this study was to examine changes in gene expression in two human cell lines, HepG2 and A549,induced by exposure to a soil extract containing PAH using microarry technology. Soil samples were obtained from the vicinity of a cokeoven factory in northeastern Mexico. For comparison, the gene expression pattern induced by Benz[a]pyrene (BaP) was also analyzed.The number of altered genes by both treatments was 2-fold higher in hepatic than in pulmonary cells. Differentially-modulated genes inthe two cell lines were identified and grouped by biological function using genomic databases. A group of nine genes up- and down-reg-ulated by either the PAH extract or BaP were selected for validation by real-time PCR. The cellular functions of these PAH-responsivegenes included: xenobiotic metabolism (CYP1A1 and CYP1B1), DNA repair (ERCC5), oxidative stress response and cell proliferation(FTH1 and PRDX1), protein degradation (PSMD7), ion transport (FXYD3), steroid biosynthesis (FDFT1), and signaling pathways(PTGER3). The real-time PCR analysis confirmed most of the microarray data with significant correlation. Additional studies arerequired to determine the mechanisms involved in the PAH-mediated modulation of these genes and to associate these changes withhuman health.� 2007 Elsevier Ltd. All rights reserved.
Keywords: PAH; Cytochrome P450; Microarrays; Coal pollution; Gene expression
1. Introduction
Coal combustion and/or industrial transformation pro-duce emissions such as coal tars and smoke that arereleased into the environment. The heavy soot fractionsof these emissions are ultimately deposited into the ground(Khodadoust et al., 2000). Polycyclic Aromatic Hydrocar-
0887-2333/$ - see front matter � 2007 Elsevier Ltd. All rights reserved.
doi:10.1016/j.tiv.2007.10.009
* Corresponding author. Tel.: +52 (55) 5061 3308; fax: +52 (55) 57477111.
E-mail address: [email protected] (A. Albores).
bons (PAH) are the most abundant chemicals releasedduring coal processing (Blumer, 1976). PAH consist ofmore than 100 different compounds, including some thatare considered carcinogens (Jongeneelen, 1992). In thisrespect, Benz[a]pyrene (BaP), an environmentally ubiqui-tous PAH, has been commonly used as an indicator ofthe carcinogenic potency of PAH mixtures (Bostromet al., 2002).
Environmental exposure to PAH result in a variety ofmolecular responses in the organism such as enzyme acti-vation, oxidation, and/or signal transduction. Many ofthese responses are mediated by the aryl hydrocarbon
412 F. Castorena-Torres et al. / Toxicology in Vitro 22 (2008) 411–421
receptor (AhR)/aryl hydrocarbon nuclear translocator(ARNT) signaling pathway (Rowlands and Gustafsson,1997). This signaling cascade has been extensively studied,particularly with respect to the induction of genes involvedin activation and detoxification such as cytochrome P4501A1 (CYP1A1), UDP-glucoronosyltransferase, andNAD(P)H:quinone oxidoreductase (NQ01) (Mimura andFujii-Kuriyama, 2003; Nebert et al., 2004; Shimada,2006). Meanwhile the number of AhR/ARNT-responsivegenes known to be involved in other cellular processes(i.e. cell–cell contact, cell cycle) has increased (Cho et al.,2004; Andrysik et al., 2007).
Several genes that respond to specific single PAH com-pounds have been identified including CYP1A1, CYP1A2,and CYP1B1, which are up-regulated in response to BaP(Wen and Walle, 2005; Pushparajah et al., 2007). However,exposure to environmental PAH mixtures leads to amuch more complex cellular response, inducing multipleenzymatic activities involved in overlapping metabolicpathways, a fact that may contribute to the developmentof cancer (http://monographs.iarc.fr/ENG/Meetings/92-pahs.pdf). Studies of gene expression profiles aimed atidentifying the target genes of environmental PAH mix-tures remain to be approached. Therefore, the goal of thepresent study was to investigate the genomic response oftwo human cell lines (HepG2 and A549 cells) to a PAHmixture extracted from soil contaminated with coke ovenwaste using cDNA microarray technology. For compari-son, the expression profiles of HepG2 and A549 cell cul-tures exposed to BaP, as a single PAH component, wereassessed. A number of changes in gene expression wereidentified and a set of nine responsive genes whose expres-sion was clearly modified in cells exposed to BaP or to aPAH extract from soil were further selected for validationby real-time RT–PCR.
2. Materials and methods
2.1. Reagents and chemicals
Dimethylsulfoxide (DMSO) was purchased from Sigma(St. Louis, MO, USA), BaP was obtained from Chem Ser-vice (West Chester, CA, USA), and all reagents for real-time RT–PCR were obtained from Applied Biosystems(Foster City, CA, USA). RPMI 1640 medium, Ham’s F-12 medium, fetal bovine serum, penicillin, streptomycin,oligo dT, Superscript II reverse transcriptase, and TRIzolreagent were all purchased from Invitrogen (Carlsbad,CA, USA).
2.2. Extraction of PAH
Fourteen soil samples were collected from a surface soilnear a coke oven factory in the carboniferous regionlocated in northeastern Coahuila, Mexico. The sampleswere dried at room temperature in the presence of anhy-drous sodium sulfate (activated at 650 �C for 3 days).
Extraction, determination and quantification of PAH wereperformed as described by Wade et al. (1993). Approxi-mately 30 g of soil (dry weight) were extracted with hexaneand methylene chloride during 8 h each in a soxhlet appa-ratus (Nebert et al., 2004). The methylene chloride extractwas concentrated from approximately 300 ml to 20 ml in aflat-bottomed flask equipped with a three ball Snyder col-umn condenser and then it was mixed with the hexaneextract. The hexane fraction was also concentrated andthen transferred to a Kuderna–Danish tube to concentratethe extract to a final volume of 2 ml using a continuousstream of nitrogen. The soil extracts were fractionated byalumina:silica column chromatography. The alumina waspartially deactivated with 1% distilled water (w/w) andthe silica gel with 5% distilled water (w/w). The extract sol-vent was sequentially eluted from the column and PAHcompounds were obtained.
2.3. Quantification of PAH in soil extracts
The individual PAH in soil extracts were identified andquantified using a Hewlett Packard 5890 Series II gas chro-matograph equipped with a flame ionization detector(FID) in a splitless mode, a 30 m � 0.25 mm (0.33 pm filmthickness) HP-5 (5% phenyl-methyl silicone) capillary col-umn and using nitrogen as the auxiliary and carrier gas.The injector temperature was 280 �C and the initial temper-ature of the oven was 60 �C and the temperature pro-grammed at 6 �C/min to a final temperature of 290 �Cthat was held during 20 min.
The twenty two individual PAH used in this study, wereselected based upon their mutagenic and carcinogenicpotential as defined by the United States EnvironmentalProtection Agency (US EPA). The individual PAH thatwere identified and quantified using standards from UltraScientific are: naphthalene, fluoranthene, pyrene, 1,2,5-tri-ethylbenzene, 1,3,6-triethylbenzene, 2-methylnaphtalene,1-methylnaphtalene, biphenyles, 2,7-dimethylnaphtalene,2,4-dimethylnaphtalene, 1,6-dimethylnaphtalene, acenaph-thene, acenaphthylene, 2-methylphenantrene, anthracene,1-methylphenantrene, benz[a]anthracene, chrysene, ben-z[a]pyrene, benz[e]pyrene, pherylene, dibenz[a,h]anthra-cene. Quality assurance of the analytical procedureincluded the addition of internal standards and the analysisof a procedural blank for each set of samples.
2.4. Cell cultures and treatments
HepG2 cells (ATCC, HB-8065) were grown in Dul-becco’s Modified Eagle’s Medium supplemented with2 mM glutamine and 10% fetal bovine serum. A549 cells(ATCC, CCL-585) were cultured in Ham’s F-12 mediumsupplemented with 10% fetal bovine serum. All media con-tained penicillin (100 units/ml) and streptomycin (100 lg/ml). Cell cultures were maintained in an incubator at37 �C in a humidified atmosphere with 95% air and 5%CO2. When indicated, cells plated on 100-mm culture
F. Castorena-Torres et al. / Toxicology in Vitro 22 (2008) 411–421 413
plates (3 � 106 cells per plate) were treated for 24 h eitherwith 1.332 lg/ml of extracted PAH or 1 lM of BaP.DMSO was used as vehicle at concentrations that neverexceeded 0.15% in all treatments.
2.5. Toxicity testing
Cell toxicity resulting from treatment with extractedPAH (0.0016, 0.0032, 0.016, 0.032, 0.16, 0.32 and 1.6 lg/ml) or BaP (1, 5, 10, 50, 100, 500 and 1000 nM) wasassessed by the MTT (3-(4,5-dimethylthiazol-2-yl)-2,5-diphenyl tetrazolium bromide) assay (Mosmann, 1983).Briefly, MTT (5 mg/ml in PBS) was added to cells culturedon 96-well plates. After 4 h, 100 ll of 10% SDS in 0.01 NHCl was added to dissolve the formazan crystals and theoptical density was determined using an ELISA-platereader (Bio-Rad Laboratories, Hercules, CA, USA) at590 nm.
2.6. RNA isolation
Total RNA was extracted from cultured cells using theTRIzol� reagent according to the manufacturer’s instruc-tions. RNA concentration and purity were estimated byOD260/280 nm, and its integrity was assessed by electropho-resis on 1% agarose gels stained with ethidium bromide.Isolated RNA was stored at �70 �C until analysis.
2.7. Probe preparation and hybridization to arrays
A Homo sapiens 70-mer oligo library from QIAGENwas used to prepare the arrays. Four slides containing10,000 cDNAs spotted in duplicates were used for hybrid-ization. cDNA was synthesized using 10 lg of total RNAfrom either untreated or treated cells and the CyScribeFirst-Strand cDNA labeling kit (Amersham Biosciences,CA, USA). Incorporation of dUTP-Cy3 or dUTP-Cy5was measured by the absorbance at 555 nm for Cy3and at 655 nm for Cy5. Equal amounts of labeled cDNAwere hybridized to the microarray in HybIT2 solution(TeleChem International Inc., CA, USA) for 14 h at42 �C.
2.8. Data acquisition and analysis of array images
The acquisition and quantification of array imageswere performed using a ScanArray 4000 and the accom-panying software ScanArray 4000 from Packard Bio-Chips. All images were captured using 60% PMT gain,70 to 75% laser power, and 10 lm resolution at a 50%scan rate. For each spot the following mean values wereconsidered: density (D), background (B) and normalizedsignal (S), which is the result of D–B. The inertial diame-ter was calculated with the software ArrayPro Analyzerfrom Media Cybernetics. The S for each spot was normal-ized using the total mean signal value obtained from allspots of the array as 100%.
2.9. Data analysis
Results were expressed as a ratio of the S values of trea-ted and control samples. Gene populations with low signalintensities (below 1-fold change) were excluded from fur-ther analysis. Microarray data analysis was performed withfree software Genesure (Asyali et al., 2004) to evaluate thereliability of the assays. Gene selection criterion for valida-tion of real-time PCR was based on extreme value distribu-tions either in HepG2 and A549 cells treated with PAH orBaP, by their inclusion in Gene Ontology annotation (Ash-burner et al., 2000; Al-Shahrour et al., 2004) and KEGGdatabase (Ogata et al., 1999; Kanehisa et al., 2006), andby their relationship with PAH metabolism in theliterature.
2.10. Reverse transcription and real-time PCR assays
Reverse transcription and real-time PCR were per-formed to quantify the mRNA levels of a selected set ofnine genes whose expression was modified in HepG2 orA549 cells by treatment with extracted PAH or BaP, aspreviously determined by microarray analysis. Briefly,1 lg of DNase-treated total RNA was reversed transcribedin 20 ll of RT reaction buffer containing 50 mM Tris-HCl(pH 8.3), 75 mM KCl, 3 mM MgCl2, 200 mM DTT,10 mM of each deoxyribonucleotide triphosphate, 0.5 lgoligo dT, 200 U Superscript II reverse transcriptase, and40 U RNase OUT. Samples were incubated sequentiallyat 65 �C for 5 min, 42 �C for 50 min, and 70 �C for 15 min.
Real-time PCR reactions were carried out in a 96-wellreaction plate format on a 7000 Sequence Detector (Per-kin–Elmer/Applied Biosystems) using the TaqMan� Uni-versal PCR Master Mix (Perkin–Elmer, Foster City, CA,USA). The primers and fluorogenic probes were designedusing the Primer express software from Perkin–Elmer LifeSciences. The sequences for primers and probes are shownin Table 1. PCR reactions were performed in a total vol-ume of 25 ll containing 400 nM of each oligonucleotide,200 mM of the TaqMan� probe, and 3 ll of cDNA. Ther-mal cycling was initiated with an initial incubation at 50 �Cfor 2 min and 95 �C for 10 min. After that, 40 cycles ofPCR were performed, with each PCR cycle consisting ofa heating step at 95 �C for 15 s and an annealing/extensionstep at 60 �C for 1 min. As an endogenous control, theexpression of the GAPDH gene was measured in parallelusing a fluorogenic probe labeled with VICTM� dye-TAM-RATM� dye. Negative controls were included in the sameplate.
2.11. Statistical analysis
Results are shown as the mean values ±S.D. The Stu-dents t-test was used for statistical comparisons. The crite-rion for significance was set at p < 0.05 in all cases. Allanalyses were conducted using STATA version 8.0 (StataCorporation, College Station, TX, USA).

Table 1Primers and probes used for real-time PCR
GenBank Accession Nos.a Gene Forward and reverse primers TaqMan probe
NM_000499 CYP1A1 50-CACCATCCCCCACAGCAC-30 50-TCAGTACCTCAGCCACCTCCAAGAT-30
50-ACAAAGACACAACGCCCCTT-30
NM_000104 CYP1B1 50-CCGCGCTGCAGTGG-30 50-CCTCTTCACCAGGTATCC-30
50-GCACTCGAGTCTGCACATCA-30
NM_000123 ERCC5 50-GCCGTGGAACCAATGGAAATT-3 50-AAACTTCCATCAGATTCAC-30
50-TTCCTCATCACTAATCACACTTTGCA-30
NM_004462 FDFT1 50-GGCAAGCGGAAGGTGATG-30 50-ATGGACCAGGACTCGCT-30
50-CTGGTCTGATTGAGATACTTGTAGCAA-30
NM_002032 FTH1 50-TCAGAGGCCGCCATCAAC-30 50-ATCAACCTGGAGCTCTAC-30
50-GACATGGACAGGTAAACGTAGGA-30
NM_021910 FXYD3 50-GGACGCCAATGACCTAGAAGATAAA-30 50-CTGTGCCAGTCATAGTAGAA-30
50-GATGAGCCCGCCAACCT-30
NM_002574 PRDX1 50-GCTGTTATGCCAGATGGTCAGTTTA-30 50-CTGACTACAAAGGAAAATAT-30
50-CACAAAGGTGAAGTCAAGAGGGTAA-30
NM_002811 PSMD7 50-GCTGCTCAGTGTGGTGGAT-30 50-TTGCCGATTCGGTTGAAAT-30
50-CAACACGCTTCTGGTTTCCAA-30
NM_000957 PTGER3 50-CGAGACGGCCATTCAGCTTAT-30 50-CCGCTCCTGATAATGAT-30
50-TGCTCAACTGATGTCTGATTGAAGA-30
a At http://www.ncbi.nlm.nih.gov/sites/entrez?db=Nucleotide&itool=toolbar.
414 F. Castorena-Torres et al. / Toxicology in Vitro 22 (2008) 411–421
3. Results
3.1. PAH composition of soil extract
Different soil samples near a coke oven factory wereobtained and analyzed for PAH identification. Table 2shows a representative composition of PAH from a soilextract. Chrysene was present at the highest concentrationof 18.41 lg/g of soil, which corresponds to 65.7% of totalPAH extracted from the soil sample. Carcinogenic PAH,including BaP, benz[a]anthracene, and dibenz[a,h]anthra-cene were detected at 0.31, 0.18, and 0.09 lg/g of soil,respectively, for a total of 2% of the extracted PAH.Other minor compounds such as benz[e]pyrene (0.2 lg/gof soil) was also found in this extract (Table 2). For treat-ments with PAH, we chose this extract based on the near-est vicinity to the contamination source and to humansettlement.
Table 2Composition of PAH detected from contaminated soil
Compound lg/g of soil
Naphtalene 0.19Triethylbencene 0.012-Methylnaphtalene 1.331-Methylnaphtalene 0.59Acenaphthene 0.692-Methylphenantrene 0.111-Methylphenantrene 3.57Fluoranthene 1.01Pyrene 0.90Benz[a]anthracene 0.18Chrysene 18.41Benz[a]pyrene 0.31Benz[e]pyrene 0.20Pherylene 0.25Dibenz[a,h]anthracene 0.09
3.2. Viability tests
There was no effect on the viability of HepG2 or A549cells 24 h after treatment of PAH extract or BaP (datanot shown) using different concentrations, as indicated inMaterial and Methods.
3.3. Gene expression profile of HepG2 and A549 cells
exposed to BaP or an extract of PAH
To evaluate global changes in gene expression inducedby exposure to PAH extract, we used the microarray tech-nology. To compare the transcriptional response of twodifferent cell types, HepG2 and A549 cell lines, which arederived from hepatic and pulmonary tissues, respectively,were employed. These cell lines were selected because theyhave a functional xenobiotic metabolism (Jorgensen andAutrup, 1995; Jorgensen and Autrup, 1996; Dohr et al.,1997; Nebert et al., 2004; Shimada, 2006), and the resultscould be extrapolated to in vivo organs (i.e. liver and lung).
Since high CYP1A1 and CYP1B1 mRNA, protein, andenzyme activity levels are detected following exposure toPAH (MacDonald et al., 2001), induction of CYP1A1mRNA expression was used as indicator of the effect ofPAH. A time-course experiment of HepG2 cell exposureto the extracted PAH demonstrated that CYP1A1 mRNAcontinued to be induced 24 h after exposure (data notshown). Therefore, this exposure time was used for all fur-ther experiments in this study. In addition, BaP was used asa positive control due to its conspicuous presence in envi-ronmental PAH mixtures and its well known ability toinduce genes involved in PAH metabolism (Cherng et al.,2001).
After PAH extract or BaP treatments, numerous genesdisplayed altered expression in both cell lines (1-fold

HepG2 cells
PAH BaP
11311929 1952
A549 cells
PAH BaP
144657 784
PAH treatment
HepG2 A549
2311929 657
BaP treatment
HepG2 A549
2931952 784
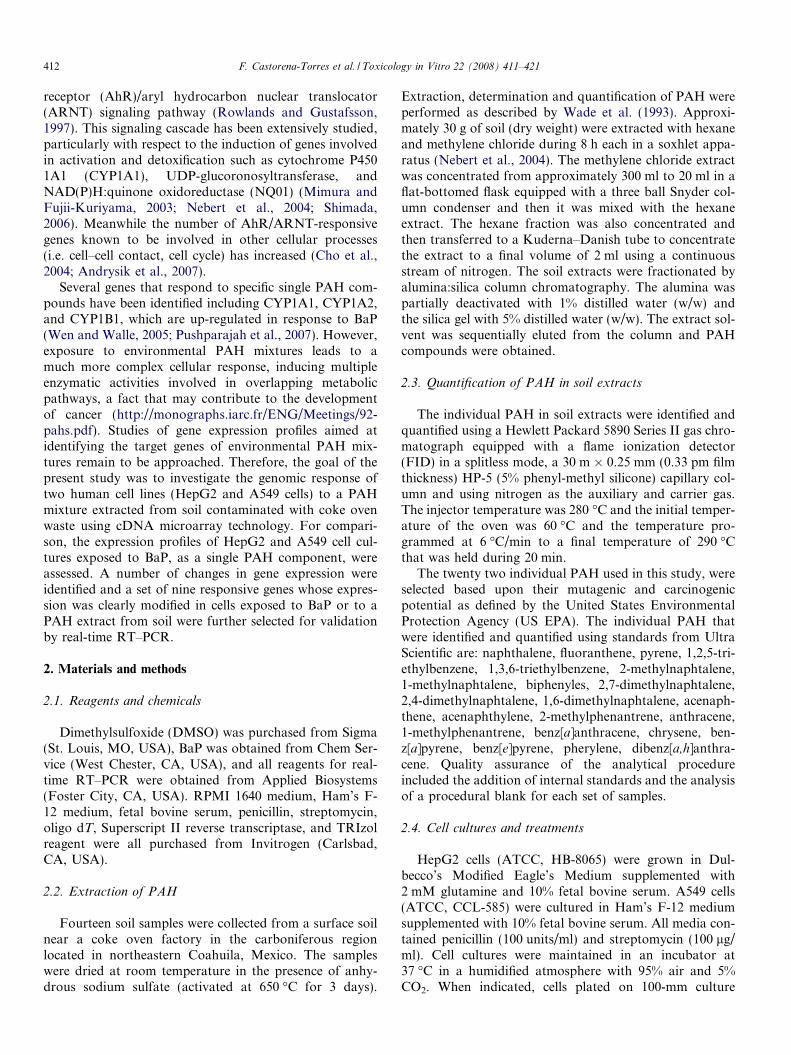
Fig. 1. Venn diagrams representing gene populations modified by PAH orBaP treatments in the cell lines assayed. (A) grouped by treatment and (B)grouped by cell line. The number in the intersection area represents genesshared by treatment or cell line.
F. Castorena-Torres et al. / Toxicology in Vitro 22 (2008) 411–421 415
change from the control cells expression). However, thenumber of genes responsive to either the extracted PAHor BaP was clearly higher in the HepG2 (1929 and 1952,respectively) than in the A549 cells (657 and 784, respec-tively) (Fig. 1), even after classified them into up- anddown-regulated genes (Table 3); as a result, the number
Table 3Number of genes modified by PAHs or BaP in HepG2 and A549 cells
Treatment Cells Genes Total (%)
Up-regulated(%)
Down-regulated(%)
PAHs HepG2 860 (44.6) 1069 (55.4) 1929 (100)A549 344 (52.4) 313 (47.6) 657 (100)
Bap HepG2 939 (48.1) 1013 (51.9) 1952 (100)A549 449 (57.3) 335 (42.7) 784 (100)
% of genes with GO annotati
11.965.866.25
31.648.41
18.988.95
60.7360.65
5.7141.05
2.623.015.86
10.34
20 40 60 8011.78
4.685.23
31.518.74
18.88.66
5.2340.
2.962.426.089.05
20 40
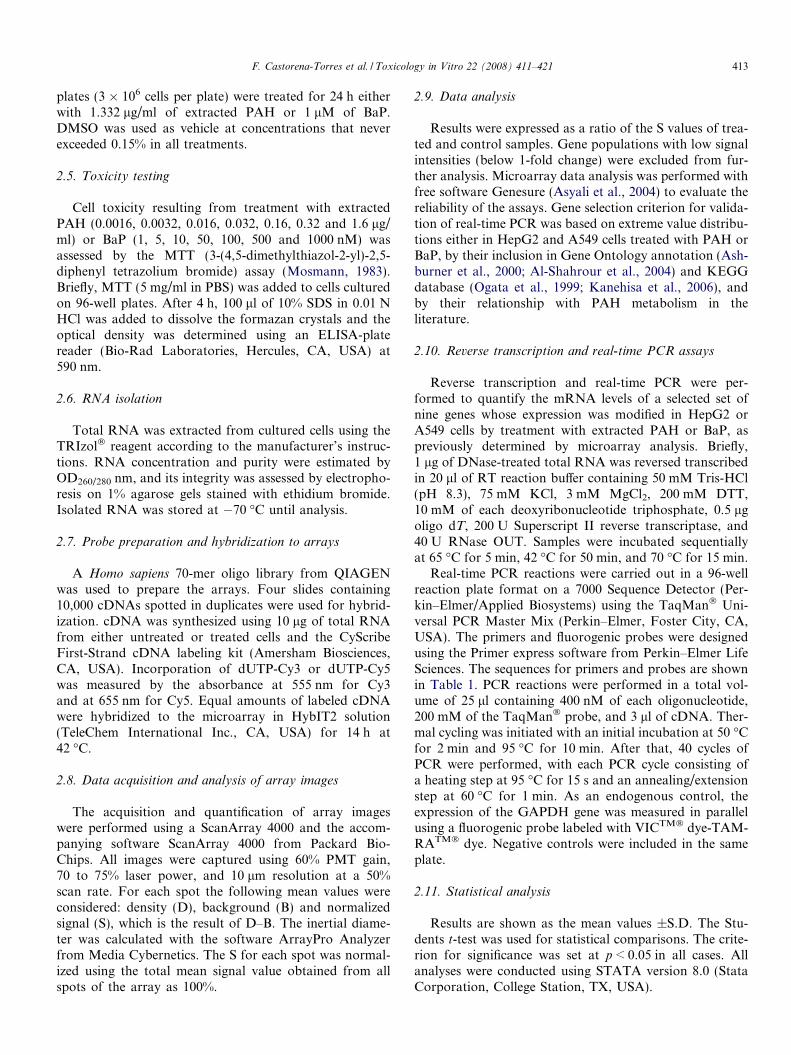
Response to stress Response to external stimulusResponse to endogenous stimulusResponse to biotic stimulusRegulation of biological processProtein LocalizationPrimary metabolic processCellular metabolic processCell proliferationCell organization and biogenesisCell cycleCell communicationCell adhesionCatabolic processBiosynthetic process
HepG2
PAH BaP
(n=1296) (n=1282)
Gene Ontology Term
Fig. 2. Classification of gene functions for their biological process in FATIGHepG2 and A549 cell lines were analyzed using Gene Ontology (GO) Terms. Rbelow graphs indicate the number of genes used in these analyzes, the rest of gGO annotation.
of affected genes shared by the two cell lines was low(Fig. 1A, see the intersection of the two areas). Likewise,although the number of differentially-expressed genes in asingle cell line was similar after treatment with theextracted PAH and BaP, the number of genes altered byboth treatments was notably higher in the HepG2 cells(�58%,) than in the A549 cells (�20%) (Fig. 1B, see theintersection of the two areas). Together, these results indi-cate that each cell line displays a specific gene expressionprofile in response to either the extracted PAH or BaP.A549 cells appear to differentially modulate their geneexpression in response to each treatment, while the tran-scriptional response of HepG2 cells was similar for thetwo treatments.
To obtain initial clues about the effect of treatments oncell physiology, the FATIGO database was employed toidentify genes related with biologic processes, including celladhesion, cell cycle and protein localization. We found1296 and 1282 genes in the PAH-exposed and BaP-exposedHepG2 cells, respectively. Regardless of the type of treat-ment, the majority of the genes (>60%) were found associ-ated with metabolism (Fig. 2). Although the number ofgenes associated with biologic processes was clearly lowerin the A549 cells treated with either PAH (417) or BaP(514), compared with HepG2, the highest percentage ofresponsive genes was also related with metabolism(>50%) (Fig. 2). To continue our analysis, the KEGG data-base was employed to related genes with cell pathways.This analysis revealed that 169 pathways were altered inboth cell lines (Fig. 3); however, the numbers of responsivegenes with KEGG annotation was notably higher in theHepG2 (479 for PAH and 448 for BaP) than in the A549cells (111 for PAH and 122 for BaP). Fig. 3 also shows thatalteration in the expression of genes related with the differ-ent pathways occurs in a cell type-specific manner; forinstance, the treatment of HepG2 cells with PAH showed
on associated to a biological process
61.3960.69
56
60 809.35
3.847.19
28.066.95
18.238.39
51.851.32
6.2436.21
3.122.645.768.39
20 40 60 8012.06
7.397
31.916.81
18.879.92
57.255.45
5.2534.63
3.112.926.23
10.12
20 40 60 80
A549
PAH BaP
(n=417) (n=514)
O database. The data of altered genes from exposure to PAH or BaP inepresentative biological processes are indicated in each group. The n valuesenes that are not included correspond to unknown genes or genes without

0 2 4 6 8 10 12
MAPK signaling pathwayNeuroactive ligand-receptor interactionCytokine-cytokine receptor interaction
Regulation of actin cytoskeletonFocal adhesion
RibosomeCell cycle
Jak-STAT signaling pathwayPurine metabolism
Leukocyte transendothelial migrationWnt signaling pathway
Calcium signaling pathwayTight junction
Axon guidanceInsulin signaling pathway
Cell adhesion molecules (CAMs)Colorectal cancer
Glycan structures -biosynthesis 1TGF-beta signaling pathway
Pyrimidine metabolismHematopoietic cell lineage
Natural killer cell mediated cytotoxicityComplement and coagulation cascades
Gap junctionToll-like receptor signaling pathway
GnRH signaling pathwayGlycerolipid metabolism
Apoptosis A549HepG2
0 2 4 6 8 10 12
MAPK signaling pathwayCytokine-cytokine receptor interaction
Neuroactive ligand-receptor interactionFocal adhesion
Wnt signaling pathwayRegulation of actin cytoskeleton
Axon guidanceRibosome
Toll-like receptor pathway Calcium signaling pathway
Cell cycleLeukocyte transendothelial migration
Insulin signaling pathwayPurine metabolism
Jak-STAT signaling pathwayTight junction
TGF-beta signaling pathwayApoptosis
Colorectal cancerCell adhesion molecules
Gap junctionTryptophan metabolismGlycerolipid metabolism
Cell CommunicationNatural killer cell cytotoxicity
Butanoate metabolismLysine degradation
T cell receptor signaling pathway VEGF signaling pathway A549
HepG2
PAH BaP
% of genes with KEGG annotation
% of genes with KEGG annotation
Fig. 3. Pathway analysis of altered genes by exposure to PAH or BaP in the cell lines assayed. Processed data from microarray results were analyzed withKEGG database. HepG2 and A549 displayed 169 pathways affected. Only representative pathways are shown. Left graph corresponds to PAHtreatments, and Right graph to BaP treatments.
416 F. Castorena-Torres et al. / Toxicology in Vitro 22 (2008) 411–421
2.71% of genes that belong to cell adhesion molecules ver-sus the 9.01% displayed by the PAH-treated A549 cells.Interestingly, the MAPK signaling pathway and the neuro-active ligand interactions were the pathways with the high-est value of altered genes.
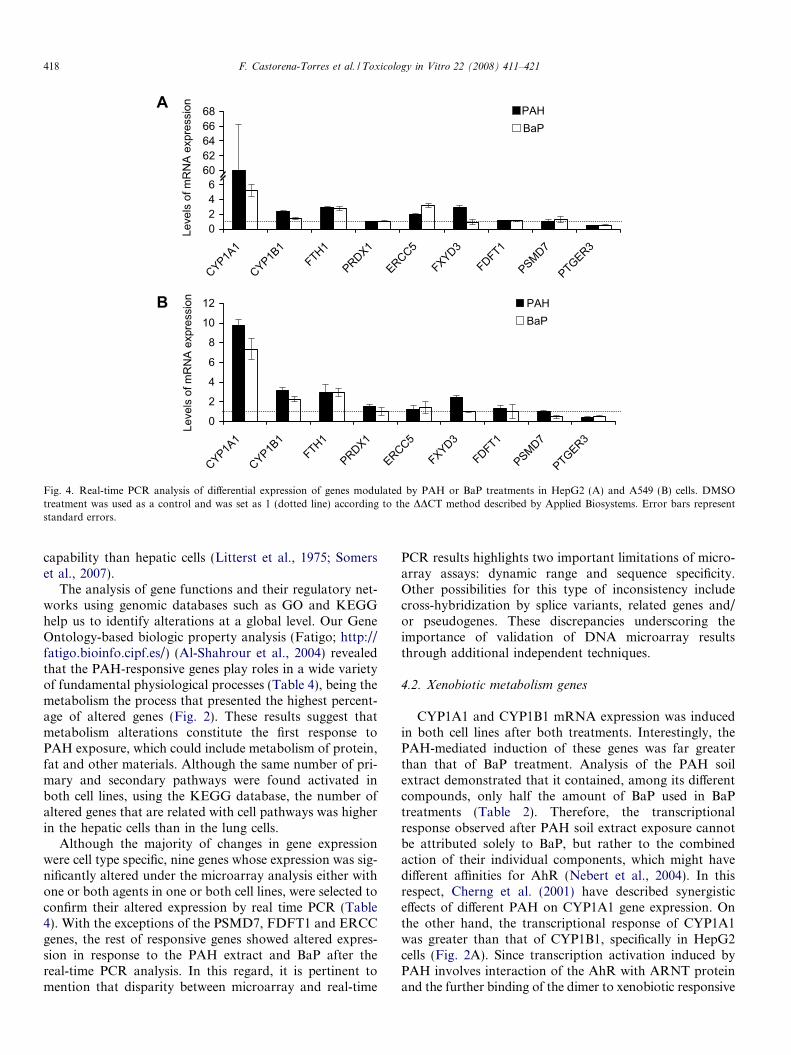
Taking into consideration the cell processes or pathwaysthat have been previously related with hydrocarbon metab-olism in the literature (Wu-Wang et al., 1996; Cherng et al.,2001; Ma, 2001; Iwanari et al., 2002; Gunning et al., 2003;Pietsch et al., 2003; Chaudhary et al., 2007; Li et al., 2007),a set of nine genes whose expression was modulated withone or both treatments in the two cell lines was selectedto validate the reliability of the microarrays. By using theGene Ontology analysis, functions for the selected PAH-responsive genes were identified (Table 4), which includeDNA repair (ERCC5), xenobiotic metabolism (CYP1A1and CYP1B1), oxidative stress response and cell prolifera-tion (FTH1 and PRDX1), protein degradation (PSMD7),ion transportation (FXYD3), steroid biosynthesis(FDFT1), and signaling pathways (PTGER3). The expres-sion of these genes was analyzed by real-time PCR and, inthe majority of cases, the results of the RT–PCR confirmedand correlated significantly with the microarray data(Table 4 and Fig. 4). The mRNA expression of five outof six overexpressed genes, as well as the down-regulatedgene, PTGER3, was altered in the same direction in oneor both cell lines exposed to either the extracted PAH orBaP. We observed an inconsistency with PSMD7 gene,
which was classified as overexpressed in the microarrayanalysis but was underexpressed in the real-time PCR anal-ysis of BaP-treated A549 cells. Another discrepancy foundwas in ERCC gene, where microarray analysis classified itas underexpressed in HepG2 cells exposed to PAH extractand in real-time PCR was up-regulated. FDFT1 gene alsoshowed disparity between microarray and real-time PCRresults (Table 4 and Fig. 4). On the other hand, theextracted PAH had a greater effect than BaP on CYP1A1gene expression in HepG2 cells. In contrast, the expressionof the PTGER3 gene was 50% to 70% lower after treatmentwith the extracted PAH or BaP than in DMSO-treated cellsin both cell lines (Fig. 4).
4. Discussion
4.1. Concentration of PAH in the soil near coke ovens
Coke ovens deposit several million tons of particulatematter on industrial sites and their surroundings. The maincoal producing region of Mexico is located in northeasternCoahuila, where mining and coke producing has consti-tuted the principal economic activity since the 19th century.This region has been the main coal supplier for the steelindustry and electricity power plants, producing 1.5 milliontons of coal per year (http://www.inegi.gob.mx/est/con-tenidos/espanol/tematicos/coyuntura/pubcoy/entidades/05/coque.asp?c=4738&e=05). The fly ash generated during the
Table 4Overview of the most relevant differentially-expressed genes by PAH or BaP treatment using microarray analyses
GenBank Accession Nos. Abbreviation Gene name Molecular functionand biologicalprocess*
Effect onexpression
Process
NM_000499 CYP1A1 Cytochrome P450, family 1,subfamily A, polypeptide 1
Oxidoreductaseactivity,ion and oxygenbinding
Up Metabolism ofxenobiotics bycytochrome P450
NM_000104 CYP1B1 Cytochrome P450, family 1,subfamily B, polypeptide 1
Oxidoreductaseactivity,ion and oxygenbinding
Up Metabolism ofxenobiotics bycytochrome P450
NM_002032 FTH1 Ferritin, heavy polypeptide 1 Oxidoreductaseactivity,ion and proteinbinding,oxidative stressresponse
Up in HepG2 Cell proliferation,iron ion homeostasis
NM_002574 PRDX1 Peroxiredoxin 1 Oxidoreductase andperoxiredoxinactivities,oxidative stress response
Up in HepG2and A549-BaP
Cell proliferation
NM_002811 PSMD7 Proteasome (prosome, macropain)26S subunit, non-ATPase, 7(Mov34 homolog)
Proteasome regulatoryparticle
Up in HepG2and A549-BaP
Proteindegradation
NM_004462 FDFT1 Farnesyl-diphosphatefarnesyltransferase 1
Transferaseactivity
Down in HepG2PAHs
Cholesterol andisoprenoidbiosyntheticprocesses
NM_000957 PTGER3 Prostaglandin E receptor 3(subtype EP3)
Receptor activity Down in all Calcium signalingpathway
NM_000123 ERCC5 Excision repair cross-complementingrodent repair deficiency, complementationgroup 5 (xeroderma pigmentosum,complementation group G (Cockaynesyndrome))
Nucleic acid bindingand hydrolaseactivity
Down HepG2PAHs
DNA repair,nucleotide-excisionrepair
NM_021910 FXYD3 FXYD domain containing ion transportregulator 3
Channel or pore classtransporter activity
Up in all Chloride transport
* Molecular function and biological process were assigned according Fatigo analysis.
F. Castorena-Torres et al. / Toxicology in Vitro 22 (2008) 411–421 417
coke oven process is deposited in populations located in twonearby towns: Nueva Rosita and Barroteran. These parti-cles are complex chemical mixtures containing significantamounts of PAH and other contaminating chemicals thatincrease the risk of cancer in exposed humans (Furimsky,2002).
The aim of this study was to evaluate the use of micro-array technology to elucidate the cellular response to PAHextracted from soils contaminated with coke oven emis-sions. HepG2 and A549 cell lines were used in this studybased on their wide use in toxicity and/or gene expressionstudies and because they are derived from organs with afunctional xenobiotic metabolism pathway (Dohr et al.,1997; Iwanari et al., 2002; Castell et al., 2005). For compar-ison, both cell lines were also treated with BaP. Combiningthe data from these different measures would help to deter-mine the biological effects of PAH on liver and lung cells.
Changes in gene expression profile were identified inboth cell lines in response to either PAH extract or BaPexposure (Table 3 and Fig. 1). However, the number ofgenes responsive to both agents was clearly higher in the
HepG2 than that in the A549 cells (>2-fold) and fewaltered genes overlapped in the two cell lines (Fig. 1).The number of genes responsive to both agents was clearlyhigher in the HepG2 than that in the A549 cells (>2-fold)and few altered genes overlapped in the two cell lines.The AhR mediates many of the toxic effects of certainPAH metabolically activated, and such deleterious effectsdepend upon the modulation of gene transcription effectedby the ligand bound to AhR (Kondraganti et al., 2003).Therefore, although both HepG2 and A549 cells expressthe AhR (Jorgensen and Autrup, 1995; Dohr et al.,1997), the former cell line likely induces the AhR signalingpathway more efficiently upon PAH exposure. In supportof this hypothesis, it has been reported that A549 cellsexpress low levels of AhR mRNA (Iwanari et al., 2002).An alternative explanation for the observed differentialexpression between HepG2 and A549 cells is properly theorigin of these cell lines. HepG2 cells are derived fromhuman liver, which is the main tissue for the process anddetoxification of exogenous substances, while the A549 cellline derived from lung cells, which have lesser metabolic
A
B
Leve
ls o
f mR
NA
expr
essi
onLe
vels
of m
RN
A ex
pres
sion
02468
10121416
CYP1A1
CYP1B1
FTH1
PRDX1
ERCC5
FXYD3
FDFT1
PSMD7
PTGER3
PAHBaP
0
2
4
6
8
10
12
CYP1A1
CYP1B1
FTH1
PRDX1
ERCC5
FXYD3
FDFT1
PSMD7
PTGER3
PAHBaP
606264
6866
Fig. 4. Real-time PCR analysis of differential expression of genes modulated by PAH or BaP treatments in HepG2 (A) and A549 (B) cells. DMSOtreatment was used as a control and was set as 1 (dotted line) according to the DDCT method described by Applied Biosystems. Error bars representstandard errors.
418 F. Castorena-Torres et al. / Toxicology in Vitro 22 (2008) 411–421
capability than hepatic cells (Litterst et al., 1975; Somerset al., 2007).
The analysis of gene functions and their regulatory net-works using genomic databases such as GO and KEGGhelp us to identify alterations at a global level. Our GeneOntology-based biologic property analysis (Fatigo; http://fatigo.bioinfo.cipf.es/) (Al-Shahrour et al., 2004) revealedthat the PAH-responsive genes play roles in a wide varietyof fundamental physiological processes (Table 4), being themetabolism the process that presented the highest percent-age of altered genes (Fig. 2). These results suggest thatmetabolism alterations constitute the first response toPAH exposure, which could include metabolism of protein,fat and other materials. Although the same number of pri-mary and secondary pathways were found activated inboth cell lines, using the KEGG database, the number ofaltered genes that are related with cell pathways was higherin the hepatic cells than in the lung cells.
Although the majority of changes in gene expressionwere cell type specific, nine genes whose expression was sig-nificantly altered under the microarray analysis either withone or both agents in one or both cell lines, were selected toconfirm their altered expression by real time PCR (Table4). With the exceptions of the PSMD7, FDFT1 and ERCCgenes, the rest of responsive genes showed altered expres-sion in response to the PAH extract and BaP after thereal-time PCR analysis. In this regard, it is pertinent tomention that disparity between microarray and real-time
PCR results highlights two important limitations of micro-array assays: dynamic range and sequence specificity.Other possibilities for this type of inconsistency includecross-hybridization by splice variants, related genes and/or pseudogenes. These discrepancies underscoring theimportance of validation of DNA microarray resultsthrough additional independent techniques.
4.2. Xenobiotic metabolism genes
CYP1A1 and CYP1B1 mRNA expression was inducedin both cell lines after both treatments. Interestingly, thePAH-mediated induction of these genes was far greaterthan that of BaP treatment. Analysis of the PAH soilextract demonstrated that it contained, among its differentcompounds, only half the amount of BaP used in BaPtreatments (Table 2). Therefore, the transcriptionalresponse observed after PAH soil extract exposure cannotbe attributed solely to BaP, but rather to the combinedaction of their individual components, which might havedifferent affinities for AhR (Nebert et al., 2004). In thisrespect, Cherng et al. (2001) have described synergisticeffects of different PAH on CYP1A1 gene expression. Onthe other hand, the transcriptional response of CYP1A1was greater than that of CYP1B1, specifically in HepG2cells (Fig. 2A). Since transcription activation induced byPAH involves interaction of the AhR with ARNT proteinand the further binding of the dimer to xenobiotic responsive
F. Castorena-Torres et al. / Toxicology in Vitro 22 (2008) 411–421 419
elements (XRE), the higher activation of CYP1A1 could beexplained on the basis that its promoter region contains atleast seven XRE elements (Fisher et al., 1990; Kubotaet al., 1991; Corchero et al., 2001) while that of CYP1B1has only three (Tsuchiya et al., 2003). Moreover, Walkeret al. (1998) found an higher level of CYP1A1 thanCYP1B1 expression in liver of TCDD-treated rats, whichsuggested that CYP1A1 is the most important enzyme inhydrocarbon metabolism. On the other hand, we observeda greater increase of CYP1B1 mRNA levels in the A549cells that in the HepG2 cells, which is accordance withCYP1B1 expression as cell- and tissue-specific (Iwanariet al., 2002). Also, a higher expression of the CYP1B1mRNA was found in lung than in liver slices after exposi-tion to BaP (Harrigan et al., 2006). This phenomenon wascorrelated with the presence of more DNA adducts in lungthan liver (Harrigan et al., 2004). However, it is necessaryto be cautious when direct correlation between in vitro
and in vivo data is undertaken.
4.3. Oxidative stress response genes
4.3.1. FTH1FTH1 mRNA levels increased significantly (�3-fold)
after 24 h of treatment with either PAH soil extract orBaP in both cell lines. FTH1 expression is induced bydifferent chemicals that cause oxidative stress, such ashydrogen peroxide (H2O2), b-naphthoflavone, and 3-meth-ylcholanthrene (Tsuji et al., 2000; Orino et al., 2001). In ourcell systems, oxidative stress could be caused by reactiveintermediates generated during PAH metabolism via theaction of cytochrome P450. For instance, BaP is oxidizedto 3-hydroxy- and 6-hydroxy-BaP; these intermediates arefurther oxidized to BaP-quinones, which undergo redoxcycling and generate reactive oxygen species (ROS) (Flow-ers et al., 1996). These events might ultimately induceFTH1 expression. Overexpression of FTH1 seems to havea cytoprotective action because it reduces oxidative stressby limiting the levels of free Fe (Santamaria et al., 2006).Furthermore, FTH1 has a potent ferroxidase activity thatcatalyses the oxidation of Fe2+, reducing the accumulationof ROS in response to oxidative change (Orino et al., 2001;Wilkinson et al., 2003). Although Pietsch et al. (2003)reported five potential XREs on the FTH1 promoter, theyconcluded that FTH1 transcriptional activation by beta-naphthoflavone, a polycyclic aromatic hydrocarbon, ismediated by its electrophile/antioxidant-responsive ele-ment (EpRE/ARE) instead of XREs.
4.3.2. PRDX1
PRDX1 gene was slightly up-regulated upon PAHextract exposure in A549 cells. PRDX1 belongs to the per-oxiredoxin family of proteins, which possess antioxidantproperties (Kinnula et al., 2002). PRDX1 is involved inmultiple functions such as cellular defense, proliferation,and death; it also participates as a redox balance regulatorplaying a fundamental role in lung cancer initiation and
progression (Lehtonen et al., 2004). Chaudhary et al.(2007) found an increase of PRDX1 in prostate cellsexposed to BaP, which may be a consequence of self-defense by cells against cancer progression. The inductionof cytoprotective enzymes such as FTH1 and PRDX1 incells exposed to PAH is an important defense mechanismagainst oxidative effects that helps to preserve cell homeo-stasis (Jaiswal, 1994).
4.4. Other genes
Treatment of HepG2 and A549 cells with PAH soilextract or BaP resulted in a significant inhibition ofPTGER3 gene expression. PTGER3 gene belongs to neu-roactive ligand interactions group identified as one of themost relevant pathways identified by KEGG analysis(Fig. 3). The PTGER receptor subtype EP3 plays animportant role in suppression of cell growth. Interestingly,there was a marked reduction of EP3 receptor in mice withcolon cancer (Shoji et al., 2005). The FXYD3 gene, whoseexpression was elevated in both cell lines upon PAH expo-sure, encodes the Mat8 protein, a transmembrane proteinthat acts as a chlorine channel. Mat8 is thought to playan important role in proliferative activity and cell growthin prostate and pancreatic cancer (Kayed et al., 2006);FXYD3 gene expression is up-regulated in prostate cancer(Grzmil et al., 2004).
In summary, the present work identified potential targetgenes of PAH. Further genetic and biochemical studies arenecessary to characterize the molecular mechanismsinvolved in PAH-induced modulation of these genes andto identify their effects on human health.
Acknowledgement
This work was supported by CONACyT Mexico(FOSEMARNAT-2004-01-293) to AA. FCT is a graduatestudent supported by CONACyT (138610). The authorsthank Pablo Gomez Islas and Victor Tapia Ramırez forcell culturing and Patricia Vazquez Vazquez for her excel-lent technical assistance. We acknowledge DNA micro-array unit from Instituto de Fisiologıa Celular – UNAMfor microarray processing.
References
Al-Shahrour, F., Diaz-Uriarte, R., Dopazo, J., 2004. FatiGO: a web toolfor finding significant associations of Gene Ontology terms withgroups of genes. Bioinformatics 20, 578–580.
Andrysik, Z., Vondracek, J., Machala, M., Krcmar, P., Svihalkova-Sindlerova, L., Kranz, A., Weiss, C., Faust, D., Kozubik, A., Dietrich,C., 2007. The aryl hydrocarbon receptor-dependent deregulation ofcell cycle control induced by polycyclic aromatic hydrocarbons in ratliver epithelial cells. Mutat. Res. 615, 87–97.
Ashburner, M., Ball, C.A., Blake, J.A., Botstein, D., Butler, H., Cherry,J.M., Davis, A.P., Dolinski, K., Dwight, S.S., Eppig, J.T., Harris,M.A., Hill, D.P., Issel-Tarver, L., Kasarskis, A., Lewis, S., Matese,J.C., Richardson, J.E., Ringwald, M., Rubin, G.M., Sherlock, G.,2000. Gene ontology: tool for the unification of biology. The GeneOntology Consortium. Nat. Genet. 25, 25–29.
420 F. Castorena-Torres et al. / Toxicology in Vitro 22 (2008) 411–421
Asyali, M.H., Shoukri, M.M., Demirkaya, O., Khabar, K.S., 2004.Assessment of reliability of microarray data and estimation of signalthresholds using mixture modeling. Nucleic Acids Res. 32, 2323–2335.
Blumer, M., 1976. Polycyclic aromatic compounds in nature. Sci. Am.234, 35–45.
Bostrom, C.E., Gerde, P., Hanberg, A., Jernstrom, B., Johansson, C.,Kyrklund, T., Rannug, A., Tornqvist, M., Victorin, K., Westerholm,R., 2002. Cancer risk assessment, indicators, and guidelines forpolycyclic aromatic hydrocarbons in the ambient air. Environ. HealthPerspect 110 (Suppl. 3), 451–488.
Castell, J.V., Donato, M.T., Gomez-Lechon, M.J., 2005. Metabolism andbioactivation of toxicants in the lung. The in vitro cellular approach.Exp. Toxicol. Pathol. 57 (Suppl. 1), 189–204.
Corchero, J., Pimprale, S., Kimura, S., Gonzalez, F.J., 2001. Organizationof the CYP1A cluster on human chromosome 15: implications for generegulation. Pharmacogenetics 11, 1–6.
Chaudhary, A., Pechan, T., Willett, K.L., 2007. Differential proteinexpression of peroxiredoxin I and II by benzo(a)pyrene and quercetintreatment in 22Rv1 and PrEC prostate cell lines. Toxicol. Appl.Pharmacol. 220, 197–210.
Cherng, S.H., Lin, P., Yang, J.L., Hsu, S.L., Lee, H., 2001. Benzo[g,h,i]-perylene synergistically transactivates benzo[a]pyrene-inducedCYP1A1 gene expression by aryl hydrocarbon receptor pathway.Toxicol. Appl. Pharmacol. 170, 63–68.
Cho, Y.C., Zheng, W., Jefcoate, C.R., 2004. Disruption of cell–cellcontact maximally but transiently activates AhR-mediated transcrip-tion in 10T1/2 fibroblasts. Toxicol. Appl. Pharmacol. 199, 220–238.
Dohr, O., Sinning, R., Vogel, C., Munzel, P., Abel, J., 1997. Effect oftransforming growth factor-beta1 on expression of aryl hydrocarbonreceptor and genes of Ah gene battery: clues for independent down-regulation in A549 cells. Mol. Pharmacol. 51, 703–710.
Fisher, J.M., Wu, L., Denison, M.S., Whitlock Jr., J.P., 1990. Organiza-tion and function of a dioxin-responsive enhancer. J. Biol. Chem. 265,9676–9681.
Flowers, L., Bleczinski, W.F., Burczynski, M.E., Harvey, R.G., Penning,T.M., 1996. Disposition and biological activity of benzo[a]pyrene-7,8-dione. A genotoxic metabolite generated by dihydrodiol dehydroge-nase. Biochemistry 35, 13664–13672.
Furimsky, E., 2002. Sydney tar ponds: some problems in quantifying toxicwaste. Environ. Manage. 30, 872–879.
Grzmil, M., Voigt, S., Thelen, P., Hemmerlein, B., Helmke, K., Burfeind,P., 2004. Up-regulated expression of the MAT-8 gene in prostatecancer and its siRNA-mediated inhibition of expression induces adecrease in proliferation of human prostate carcinoma cells. Int. J.Oncol. 24, 97–105.
Gunning, W.T., Kramer, P.M., Lubet, R.A., Steele, V.E., End, D.W.,Wouters, W., Pereira, M.A., 2003. Chemoprevention of benzo(a)pyr-ene-induced lung tumors in mice by the farnesyltransferase inhibitorR115777. Clin. Cancer Res. 9, 1927–1930.
Harrigan, J.A., McGarrigle, B.P., Sutter, T.R., Olson, J.R., 2006. Tissuespecific induction of cytochrome P450 (CYP) 1A1 and 1B1 in rat liverand lung following in vitro (tissue slice) and in vivo exposure tobenzo(a)pyrene. Toxicol. In Vitro 20, 426–438.
Harrigan, J.A., Vezina, C.M., McGarrigle, B.P., Ersing, N., Box, H.C.,Maccubbin, A.E., Olson, J.R., 2004. DNA adduct formation inprecision-cut rat liver and lung slices exposed to benzo[a]pyrene.Toxicol. Sci. 77, 307–314.
Iwanari, M., Nakajima, M., Kizu, R., Hayakawa, K., Yokoi, T., 2002.Induction of CYP1A1, CYP1A2, and CYP1B1 mRNAs by nitropoly-cyclic aromatic hydrocarbons in various human tissue-derived cells:chemical-, cytochrome P450 isoform-, and cell-specific differences.Arch. Toxicol. 76, 287–298.
Jaiswal, A.K., 1994. Antioxidant response element. Biochem. Pharmacol.48, 439–444.
Jongeneelen, F.J., 1992. Biological exposure limit for occupationalexposure to coal tar pitch volatiles at cokeovens. Int. Arch. Occup.Environ. Health 63, 511–516.
Jorgensen, E.C., Autrup, H., 1995. Effect of a negative regulatory element(NRE) on the human CYP1A1 gene expression in breast carcinomaMCF-7 and hepatoma HepG2 cells. FEBS Lett. 365, 101–107.
Jorgensen, E.C., Autrup, H., 1996. Autoregulation of human CYP1A1gene promotor activity in HepG2 and MCF-7 cells. Carcinogenesis 17,435–441.
Kanehisa, M., Goto, S., Hattori, M., Aoki-Kinoshita, K.F., Itoh, M.,Kawashima, S., Katayama, T., Araki, M., Hirakawa, M., 2006. Fromgenomics to chemical genomics: new developments in KEGG. NucleicAcids Res. 34, D354–D357.
Kayed, H., Kleeff, J., Kolb, A., Ketterer, K., Keleg, S., Felix, K., Giese,T., Penzel, R., Zentgraf, H., Buchler, M.W., Korc, M., Friess, H.,2006. FXYD3 is overexpressed in pancreatic ductal adenocarcinomaand influences pancreatic cancer cell growth. Int. J. Cancer 118, 43–54.
Khodadoust, A.P., Bagchi, R., Suidan, M.T., Brenner, R.C., Sellers,N.G., 2000. Removal of PAHs from highly contaminated soils foundat prior manufactured gas operations. J. Hazard Mater. 80, 159–174.
Kinnula, V.L., Lehtonen, S., Sormunen, R., Kaarteenaho-Wiik, R., Kang,S.W., Rhee, S.G., Soini, Y., 2002. Overexpression of peroxiredoxins I,II, III, V, and VI in malignant mesothelioma. J. Pathol. 196, 316–323.
Kondraganti, S.R., Fernandez-Salguero, P., Gonzalez, F.J., Ramos, K.S.,Jiang, W., Moorthy, B., 2003. Polycyclic aromatic hydrocarbon-inducible DNA adducts: evidence by 32P-postlabeling and use ofknockout mice for Ah receptor-independent mechanisms of metabolicactivation in vivo. Int. J. Cancer 103, 5–11.
Kubota, M., Sogawa, K., Kaizu, Y., Sawaya, T., Watanabe, J., Kawajiri,K., Gotoh, O., Fujii-Kuriyama, Y., 1991. Xenobiotic responsiveelement in the 50-upstream region of the human P-450c gene. J.Biochem. (Tokyo) 110, 232–236.
Lehtonen, S.T., Svensk, A.M., Soini, Y., Paakko, P., Hirvikoski, P.,Kang, S.W., Saily, M., Kinnula, V.L., 2004. Peroxiredoxins, a novelprotein family in lung cancer. Int. J. Cancer 111, 514–521.
Li, Z.D., Liu, L.Z., Shi, X., Fang, J., Jiang, B.H., 2007. Benzo[a]pyrene-3,6-dione inhibited VEGF expression through inducing HIF-1alphadegradation. Biochem. Biophys. Res. Commun. 357, 517–523.
Litterst, C.L., Mimnaugh, E.G., Reagan, R.L., Gram, T.E., 1975.Comparison of in vitro drug metabolism by lung, liver, and kidneyof several common laboratory species. Drug Metab. Dispos. 3, 259–265.
Ma, Q., 2001. Induction of CYP1A1. The AhR/DRE paradigm:transcription, receptor regulation, and expanding biological roles.Curr. Drug Metab. 2, 149–164.
MacDonald, C.J., Ciolino, H.P., Yeh, G.C., 2001. Dibenzoylmethanemodulates aryl hydrocarbon receptor function and expression ofcytochromes P50 1A1, 1A2, and 1B1. Cancer Res. 61, 3919–3924.
Mimura, J., Fujii-Kuriyama, Y., 2003. Functional role of AhR in theexpression of toxic effects by TCDD. Biochim. Biophys. Acta 1619,263–268.
Mosmann, T., 1983. Rapid colorimetric assay for cellular growth andsurvival: application to proliferation and cytotoxicity assays. J.Immunol. Methods 65, 55–63.
Nebert, D.W., Dalton, T.P., Okey, A.B., Gonzalez, F.J., 2004. Role ofaryl hydrocarbon receptor-mediated induction of the CYP1 enzymes inenvironmental toxicity and cancer. J. Biol. Chem. 279, 23847–23850.
Ogata, H., Goto, S., Sato, K., Fujibuchi, W., Bono, H., Kanehisa, M.,1999. KEGG: Kyoto Encyclopedia of Genes and Genomes. NucleicAcids Res. 27, 29–34.
Orino, K., Lehman, L., Tsuji, Y., Ayaki, H., Torti, S.V., Torti, F.M.,2001. Ferritin and the response to oxidative stress. Biochem. J. 357,241–247.
Pietsch, E.C., Chan, J.Y., Torti, F.M., Torti, S.V., 2003. Nrf2 mediates theinduction of ferritin H in response to xenobiotics and cancerchemopreventive dithiolethiones. J. Biol. Chem. 278, 2361–2369.
Pushparajah, D.S., Umachandran, M., Plant, K.E., Plant, N., Ioannides,C., 2007. Evaluation of the precision-cut liver and lung slice systemsfor the study of induction of CYP1, epoxide hydrolase and glutathioneS-transferase activities. Toxicology 231, 68–80.

F. Castorena-Torres et al. / Toxicology in Vitro 22 (2008) 411–421 421
Rowlands, J.C., Gustafsson, J.A., 1997. Aryl hydrocarbon receptor-mediated signal transduction. Crit. Rev. Toxicol. 27, 109–134.
Santamaria, R., Bevilacqua, M.A., Maffettone, C., Irace, C., Iovine, B.,Colonna, A., 2006. Induction of H-ferritin synthesis by oxalomalate isregulated at both the transcriptional and post-transcriptional levels.Biochim. Biophys. Acta 1763, 815–822.
Shimada, T., 2006. Xenobiotic-metabolizing enzymes involved in activa-tion and detoxification of carcinogenic polycyclic aromatic hydrocar-bons. Drug Metab. Pharmacokinet 21, 257–276.
Shoji, Y., Takahashi, M., Takasuka, N., Niho, N., Kitamura, T., Sato, H.,Maruyama, T., Sugimoto, Y., Narumiya, S., Sugimura, T., Wakabay-ashi, K., 2005. Prostaglandin E receptor EP3 deficiency modifies tumoroutcome in mouse two-stage skin carcinogenesis. Carcinogenesis 26,2116–2122.
Somers, G.I., Lindsay, N., Lowdon, B.M., Jones, A.E., Freathy, C., Ho, S.,Woodrooffe, A.J., Bayliss, M.K., Manchee, G.R., 2007. A comparisonof the expression and metabolizing activities of Phase I and II enzymes infreshly isolated human lung parenchymal cells and cryopreservedhuman hepatocytes. Drug Metab. Dispos. 35, 1797–1805.
Tsuchiya, Y., Nakajima, M., Yokoi, T., 2003. Critical enhancer region towhich AhR/ARNT and Sp1 bind in the human CYP1B1 gene. J.Biochem. (Tokyo) 133, 583–592.
Tsuji, Y., Ayaki, H., Whitman, S.P., Morrow, C.S., Torti, S.V., Torti,F.M., 2000. Coordinate transcriptional and translational regulation
of ferritin in response to oxidative stress. Mol. Cell. Biol. 20, 5818–5827.
Wade, T., Brooks, J., II, M.K., McDonald, T., Sericano, J., Jackson, T.,1993. GERG trace organic contaminant analytical techniques. In:Sampling and analytical methods of the National Status and TrendsProgram, National Benthic Surveillance and Mussel Watch projects1984–1992, pp. 121–139.
Walker, N.J., Crofts, F.G., Li, Y., Lax, S.F., Hayes, C.L., Strickland,P.T., Lucier, G.W., Sutter, T.R., 1998. Induction and localization ofcytochrome P450 1B1 (CYP1B1) protein in the livers of TCDD-treatedrats: detection using polyclonal antibodies raised to histidine-taggedfusion proteins produced and purified from bacteria. Carcinogenesis19, 395–402.
Wen, X., Walle, T., 2005. Preferential induction of CYP1B1 bybenzo[a]pyrene in human oral epithelial cells: impact on DNA adductformation and prevention by polyphenols. Carcinogenesis 26, 1774–1781.
Wilkinson, J.T., Pietsch, E.C., Torti, S.V., Torti, F.M., 2003. Ferritinregulation by oxidants and chemopreventive xenobiotics. Adv.Enzyme Regul. 43, 135–151.
Wu-Wang, C.Y., Xu, X.R., Wang, S.L., 1996. Benzo[a]pyrene andnicotine alter prostaglandin E2 receptor and its functions in hamsterbuccal mucosa. Toxicol. Lett. 84, 81–88.
Related Documents


![Polycyclic aromatic hydrocarbons (PAH) guidance · Polycyclic aromatic hydrocarbons (Benzo[a]pyrene) General Information Key Points Identity The term polycyclic aromatic hydrocarbons](https://static.cupdf.com/doc/110x72/5af498db7f8b9a8d1c8c6b2b/polycyclic-aromatic-hydrocarbons-pah-guidance-aromatic-hydrocarbons-benzoapyrene.jpg)
