Changes in Gender, Ethnic, and Racial Diversity in the U.S. Military Comparing Defense Manpower Data Center data on active duty Service members from 2008, 2013, and 2018 Women were more racially and ethnically diverse than men in 2018 Values show change in percentage points from 2008 to 2018 across the following categories for each Service: percentage of active duty personnel who were women, percentage of Hispanic women out of all women, and percentage of women who were racial minorities out of all women. percentage points increase in the number of women 2 percentage point increase in the number of women who were racial minorities out of all women 1 Changes in Gender, Ethnic, and Racial Diversity by Service Branch From 2008 to 2018 percentage points increase in the number of Hispanic women out of all women 7 Enlisted In 2018, the percentage of women who were racial minorities increased with rank across every Service except the Coast Guard Officers Across all years, the percentage of women who were racial minorities in the highest ranks (O7 and above) decreased compared with that in the lower ranks Women 5 1 5 5 5 2 5 1 5 2 Hispanic women 5 5 5 1 5 13 5 11 5 5 Women who were racial minorities 5 1 5 0.1 6 2 5 2 6 3 Army Navy Marine Corps Air Force Coast Guard Developed by Insight Policy Research for the Defense Advisory Committee on Women in the Services within the Department of Defense under contract number H9821017C0008, June 2019 Source Defense Manpower Data Center data on active duty Service members from 2008, 2013, and 2018 Notes Ethnicity is defined as Hispanic or non-Hispanic. Women who were racial minorities are defined as women who identified as Black, Asian, American Indian or Alaska Native, Native Hawaiian or Pacific Islander, or those who selected more than one race. Service members who selected an unknown race were excluded from analyses of racial diversity. Warrant officers (W1–W5) were not included in the presentation of findings. Increase in Diversity From 2008 to 2018 17 percent of all personnel were women in 2018 Racial diversity Ethnic diversity of women were Hispanic of women were racial minorities 18% 40% 17%

Welcome message from author
This document is posted to help you gain knowledge. Please leave a comment to let me know what you think about it! Share it to your friends and learn new things together.
Transcript
Changes in Gender, Ethnic, and Racial Diversity in the U.S. MilitaryComparing Defense Manpower Data Center data on active duty Service members from 2008, 2013, and 2018
Women were more racially and ethnically diverse than men in 2018
Values show change in percentage points from 2008 to 2018 across the following categories for each Service: percentage of active duty personnel who were women, percentage of Hispanic women out of all women, and percentage of women who were racial minorities out of all women.
percentage points increase in the number of women2
percentage point increase in the number of women who were racial minorities out of all women1
Changes in Gender, Ethnic, and Racial Diversity by Service Branch From 2008 to 2018
percentage points increase in the numberof Hispanic women out of all women7
Enlisted In 2018, the percentage of women who were racial minorities increased with rank across every Service except the Coast Guard
OfficersAcross all years, the percentage of women who were racial minorities in the highest ranks (O7 and above) decreased compared with that in the lower ranks
Women 5 1 5 5 5 2 5 1 5 2Hispanic women 5 5 5 1 5 13 5 11 5 5Women who were racial minorities 5 1 5 0.1 6 2 5 2 6 3
Army NavyMarineCorps Air Force
CoastGuard
Developed by Insight Policy Research for the Defense Advisory Committee on Women in the Services within the Department of Defense under contract number H9821017C0008, June 2019
SourceDefense Manpower Data Center data on active duty Service members from 2008, 2013, and 2018
NotesEthnicity is defined as Hispanic or non-Hispanic.Women who were racial minorities are defined as women who identified as Black, Asian, American Indian or Alaska Native, Native Hawaiian or Pacific Islander, or those who selected more than one race. Service members who selected an unknown race were excluded from analyses of racial diversity.Warrant officers (W1–W5) were not included in the presentation of findings.
Increase in Diversity From 2008 to 2018
17 percent of all personnel werewomen in 2018
Racial diversity Ethnic diversity
of womenwere Hispanic
of women were racial minorities
18%
40%
17%
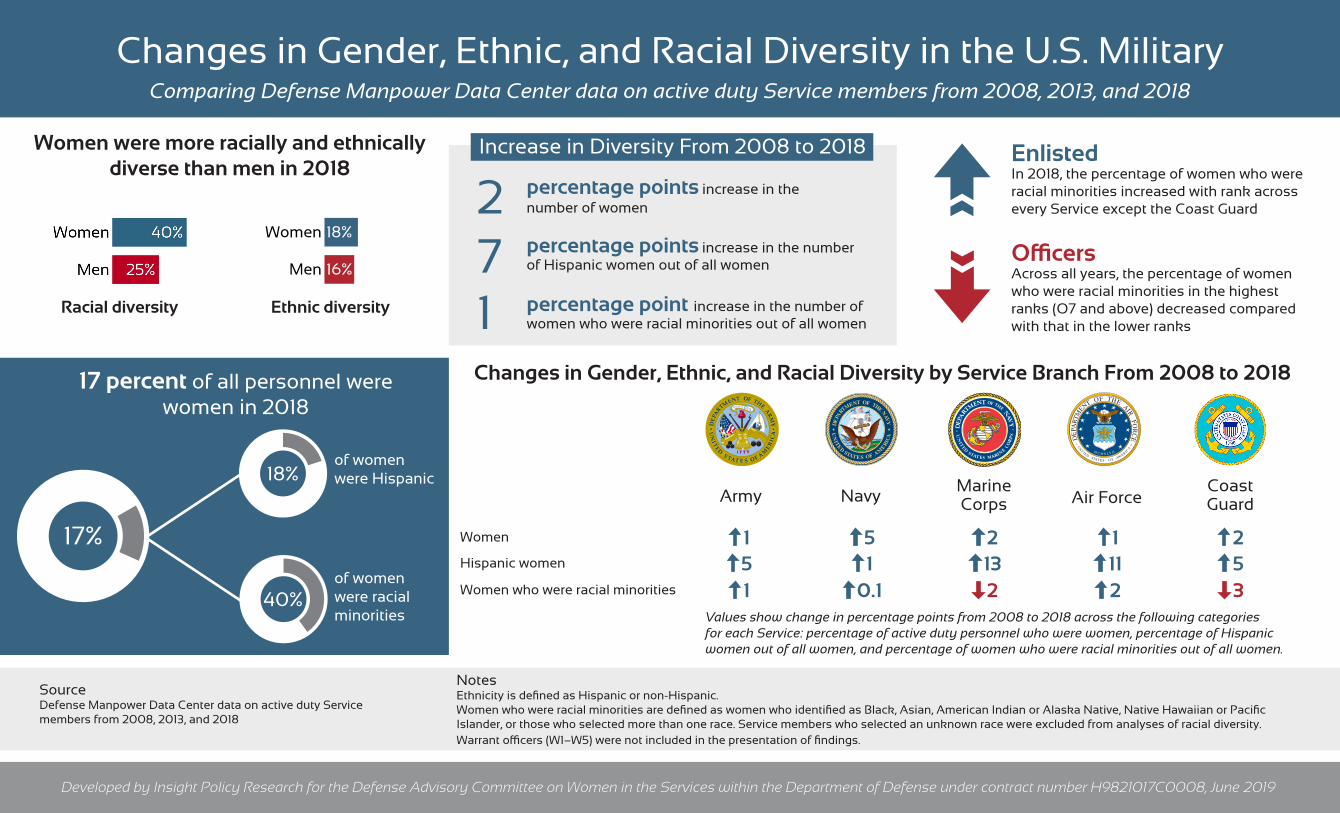
65%of enlisted women in the highest ranks (E7 and above) were racial
minorities in 2018
1 out of 2
enlisted women were racial minorities in 2018
69,387 15%
Army
Women in 2018
Changes in Gender, Ethnic, and Racial Diversity by Service Branch in the U.S. Military
Developed by Insight Policy Research for the Defense Advisory Committee on Women in the Services within the Department of Defense under contract number H9821017C0008, June 2019
SourceDefense Manpower Data Center data on active duty Service members from 2008, 2013, and 2018
NotesEthnicity is defined as Hispanic or non-Hispanic.Women who were racial minorities are defined as women who identified as Black, Asian, American Indian or Alaska Native, Native Hawaiian or Pacific Islander, or those who selected more than one race. Service members who selected an unknown race were excluded from analyses of racial diversity.Warrant officers (W1–W5) were not included in the presentation of findings.
Comparing Defense Manpower Data Center data on active duty Service members from 2008, 2013, and 2018
0Across all years analyzed, there
were zero Hispanic women or women who were racial
minorities among officers in the highest ranks (O7 and above)
Low(E3 and below)
Mid(E4–E6)
High(E7 and above)
2008 23% 22% 29%
2013 17% 19% 20%
2018 19% 19% 17%
17% or moreof enlisted women across all ranks were racial minorities since 2008
Percent of enlisted women who were racial minorities by rank and year
Coast Guard5,836 15%
Women in 2018
In 2013 and 2018, the Marine Corps had the greatest
percentage of enlisted women who were Hispanic across all
Services and ranks
0In 2013 and 2018, there were zero Hispanic women or women who
were racial minorities among officers in the highest ranks
(O7 and above)
enlisted women across all ranks were Hispanic in 2018
1 out of 3
Marine Corps15,871 9%
Women in 2018
Among officers, every metric of diversity (gender, ethnicity, and race) increased with each
year analyzed
65From 2013 to 2018, the
percentage of enlisted women who were racial minorities
declined by 5 percentage points
53%
48%2018
2013
Navy63,869 20%
Women in 2018
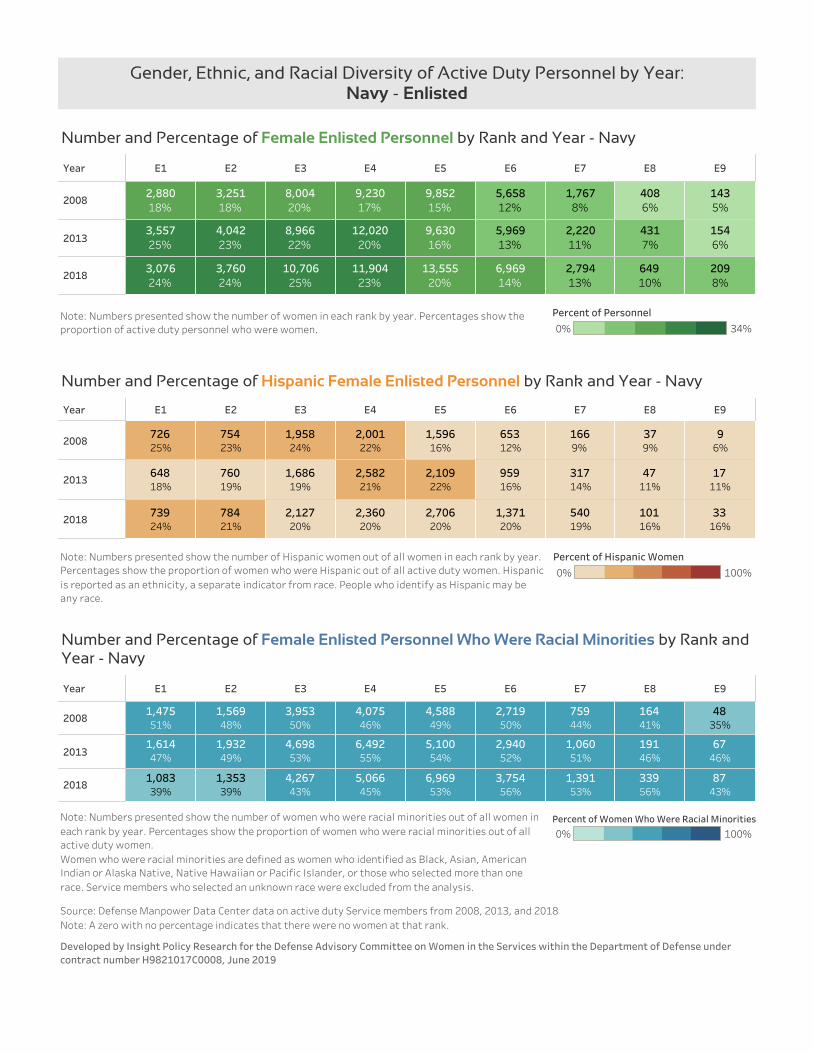
19%of all enlisted women were Hispanic
in 2018, up from 6 percent in 2013
The percentage of female officers who were racial minorities out of all female officers substantially
declined as rank increased in 2018
Low Mid High
Rank
25% 24%
4%
(03 and below)
(O4–O6) (07 and above)
Air Force65,076 20%Women in 2018
Percent of female officers who were racial minorities by rank in 2018
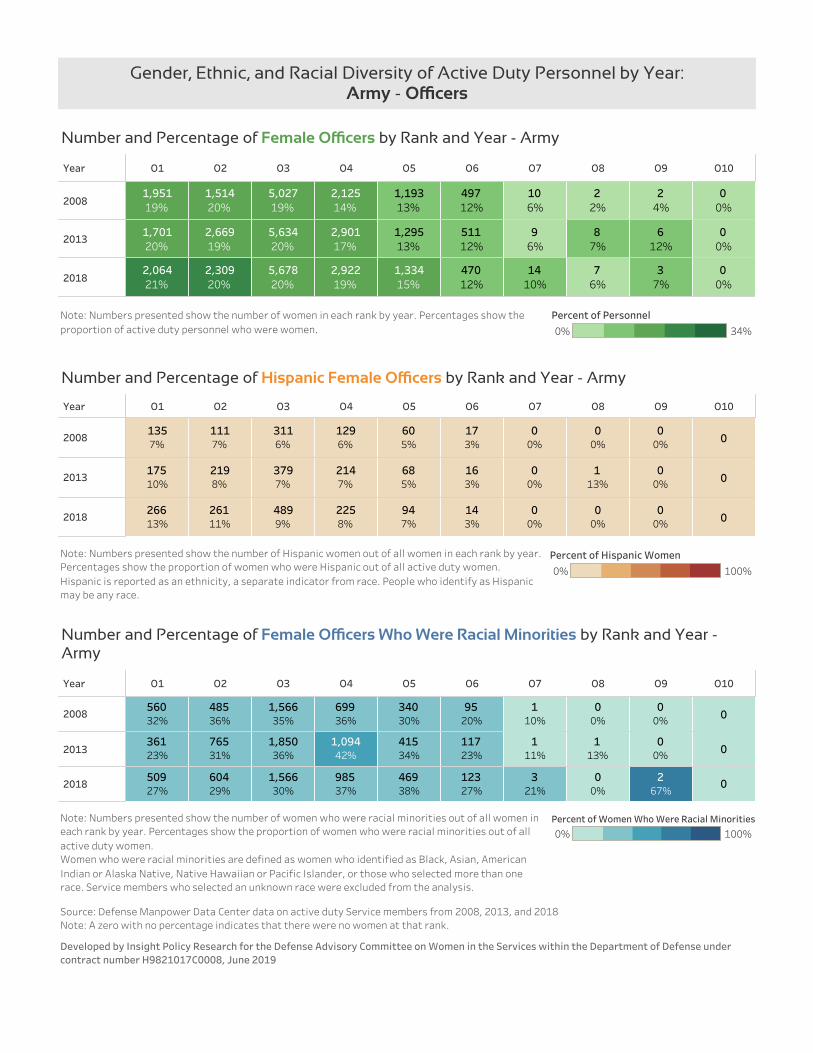
Across Services and years analyzed, the Army had the highest percentage of female officers who were racial minorities (at least 32%)
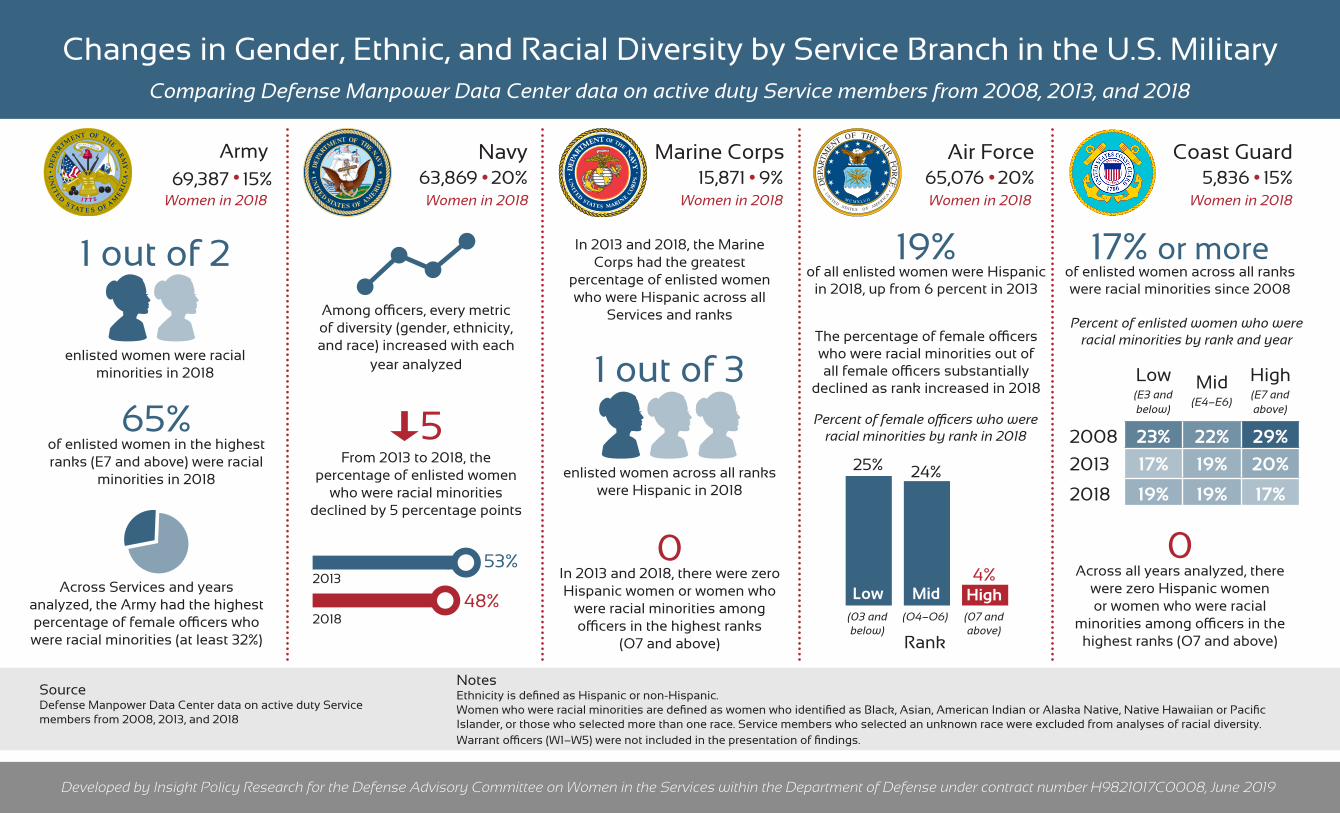
Year E1 E2 E3 E4 E5 E6 E7 E8 E9
2008
2013
2018
7937%
2,3598%
10,82211%
22,79213%
38,65715%
40,02215%
31,49316%
11,26313%
9,07814%
8188%
2,91310%
12,55313%
22,49413%
35,63115%
45,22216%
31,07315%
10,11314%
8,43715%
1,05810%
3,31512%
13,20914%
22,76814%
38,40817%
42,41917%
35,60018%
11,75116%
10,11017%
Number and Percentage of Female Enlisted Personnel by Rank and Year - All Services
Year E1 E2 E3 E4 E5 E6 E7 E8 E9
2008
2013
2018
446%
1587%
8838%
2,52111%
5,34614%
5,68314%
4,02313%
1,61314%
1,20813%
577%
30210%
1,49612%
3,24914%
5,11914%
6,34314%
4,00213%
1,81218%
1,31616%
12212%
52616%
2,25517%
4,07118%
7,66820%
8,71921%
7,89522%
2,78624%
2,44524%
Number and Percentage of Hispanic Female Enlisted Personnel by Rank and Year - All Services
Year E1 E2 E3 E4 E5 E6 E7 E8 E9
2008
2013
201843245%
37149%
34647%
1,48852%
1,38253%
1,18154%
6,01652%
5,74952%
5,21253%
10,50250%
10,01350%
10,13049%
16,79846%
15,39346%
15,95245%
17,37142%
19,46344%
14,82039%
13,09238%
12,35441%
11,66938%
4,09036%
4,10041%
4,04336%
3,37835%
3,30440%
3,35137%
Number and Percentage of Female Enlisted Personnel Who Were Racial Minorities by Rank andYear - All Services
Note: Numbers presented show the number of women in each rank by year. Percentages show theproportion of active duty personnel who were women.
Gender, Ethnic, and Racial Diversity of Active Duty Personnel by Year:All Services - Enlisted
0% 34%
Percent of Personnel
Note: Numbers presented show the number of Hispanic women out of all women in each rank by year.Percentages show the proportion of women who were Hispanic out of all active duty women. Hispanicis reported as an ethnicity, a separate indicator from race. People who identify as Hispanic may beany race.
0% 100%
Percent of Hispanic Women
0% 100%Percent of Women Who Were Racial MinoritiesNote: Numbers presented show the number of women who were racial minorities out of all women in
each rank by year. Percentages show the proportion of women who were racial minorities out of allactive duty women.Women who were racial minorities are defined as women who identified as Black, Asian, AmericanIndian or Alaska Native, Native Hawaiian or Pacific Islander, or those who selected more than onerace. Service members who selected an unknown race were excluded from the analysis.
Developed by Insight Policy Research for the Defense Advisory Committee on Women in the Services within the Department of Defense undercontract number H9821017C0008, June 2019
Source: Defense Manpower Data Center data on active duty Service members from 2008, 2013, and 2018Note: A zero with no percentage indicates that there were no women at that rank.
Year WO1 WO2 WO3 WO4 WO5
2008
2013
2018
203%
2026%
3827%
5688%
34510%
486%
2327%
4768%
8389%
21710%
628%
2347%
5309%
6829%
25210%
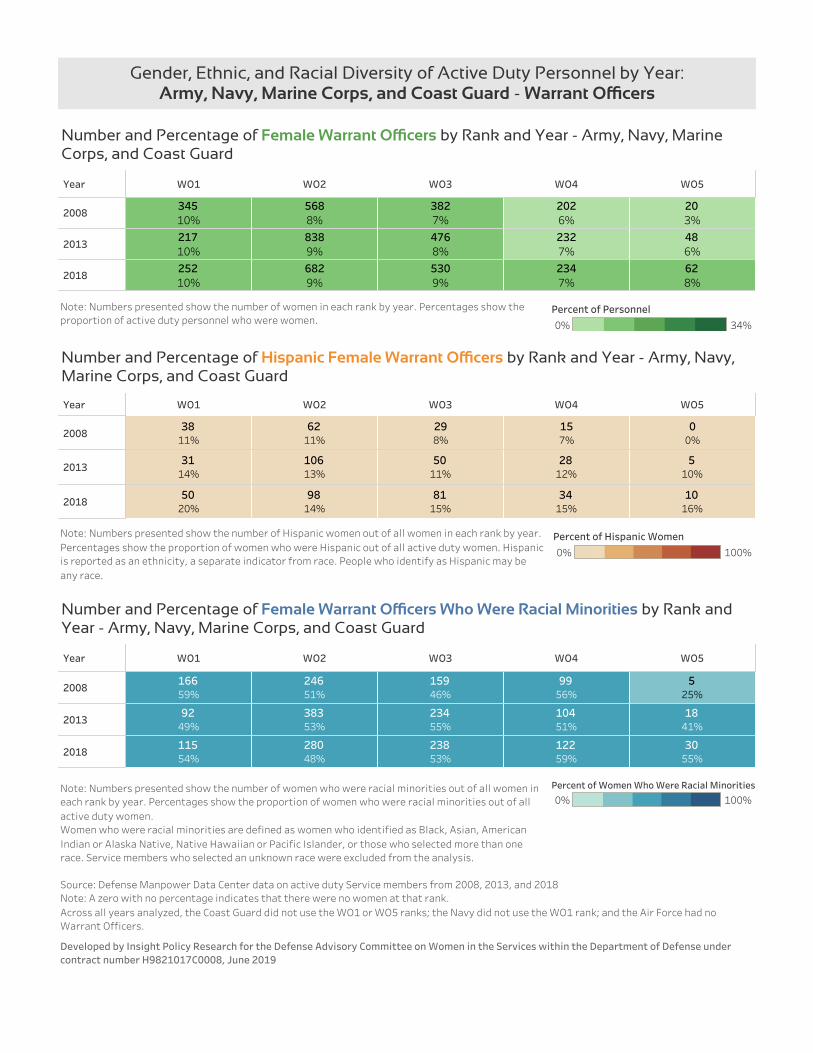
Number and Percentage of Female Warrant Ocers by Rank and Year - Army, Navy, MarineCorps, and Coast Guard
Year WO1 WO2 WO3 WO4 WO5
2008
2013
2018
00%
157%
298%
6211%
3811%
510%
2812%
5011%
10613%
3114%
1016%
3415%
8115%
9814%
5020%
Number and Percentage of Hispanic Female Warrant Ocers by Rank and Year - Army, Navy,Marine Corps, and Coast Guard
Year WO1 WO2 WO3 WO4 WO5
2008
2013
20183055%
1841%
525%
12259%
10451%
9956%
23853%
23455%
15946%
28048%
38353%
24651%
11554%
9249%
16659%
Number and Percentage of Female Warrant Ocers Who Were Racial Minorities by Rank andYear - Army, Navy, Marine Corps, and Coast Guard
Note: Numbers presented show the number of women in each rank by year. Percentages show theproportion of active duty personnel who were women.
Gender, Ethnic, and Racial Diversity of Active Duty Personnel by Year:Army, Navy, Marine Corps, and Coast Guard - Warrant Ocers
0% 34%
Percent of Personnel
Note: Numbers presented show the number of Hispanic women out of all women in each rank by year.Percentages show the proportion of women who were Hispanic out of all active duty women. Hispanicis reported as an ethnicity, a separate indicator from race. People who identify as Hispanic may beany race.
0% 100%
Percent of Hispanic Women
0% 100%Percent of Women Who Were Racial MinoritiesNote: Numbers presented show the number of women who were racial minorities out of all women in
each rank by year. Percentages show the proportion of women who were racial minorities out of allactive duty women.Women who were racial minorities are defined as women who identified as Black, Asian, AmericanIndian or Alaska Native, Native Hawaiian or Pacific Islander, or those who selected more than onerace. Service members who selected an unknown race were excluded from the analysis.
Developed by Insight Policy Research for the Defense Advisory Committee on Women in the Services within the Department of Defense undercontract number H9821017C0008, June 2019
Source: Defense Manpower Data Center data on active duty Service members from 2008, 2013, and 2018Note: A zero with no percentage indicates that there were no women at that rank.Across all years analyzed, the Coast Guard did not use the WO1 or WO5 ranks; the Navy did not use the WO1 rank; and the Air Force had noWarrant Officers.
Year O1 O2 O3 O4 O5 O6 O7 O8 O9 O10
2008
2013
2018
00%
75%
165%
418%
1,31511%
3,50612%
6,23314%
13,11118%
4,67119%
5,14219%
13%
159%
268%
347%
1,45012%
3,66912%
7,33715%
14,89519%
6,28520%
5,16521%
13%
149%
175%
4410%
1,34812%
4,01514%
8,08918%
15,73621%
6,12521%
6,01221%
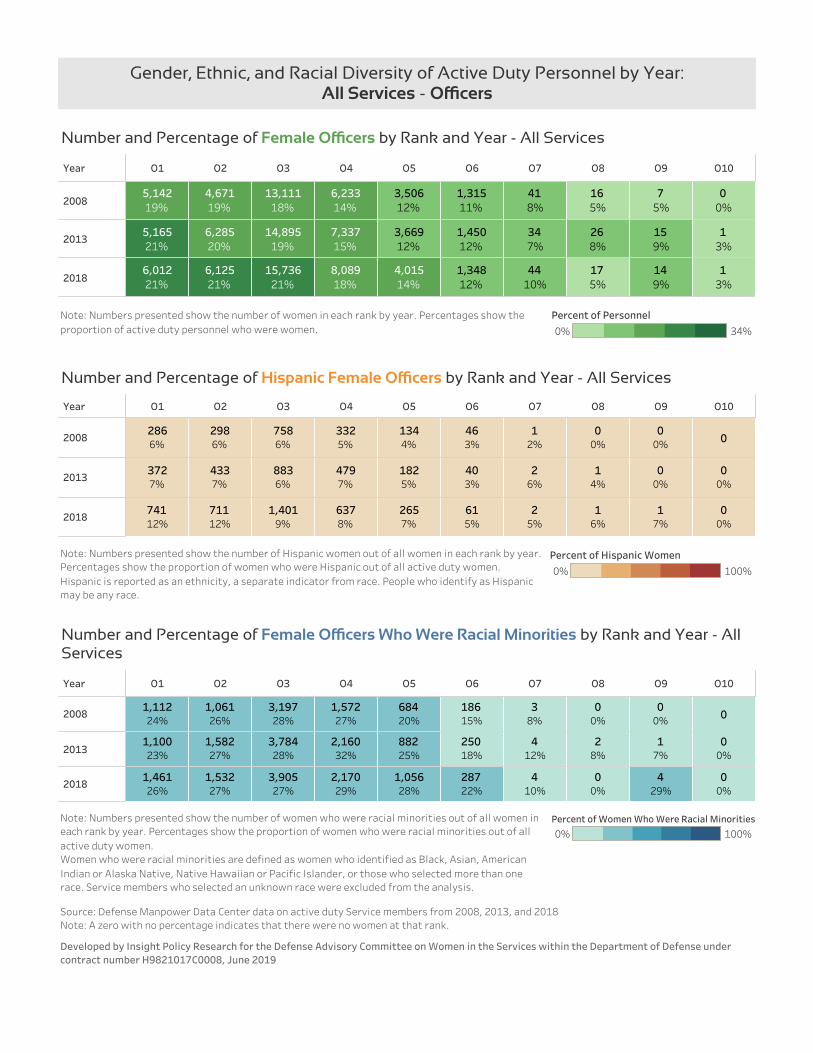
Number and Percentage of Female Ocers by Rank and Year - All Services
Year O1 O2 O3 O4 O5 O6 O7 O8 O9 O10
2008
2013
2018
000%
00%
12%
463%
1344%
3325%
7586%
2986%
2866%
00%
00%
14%
26%
403%
1825%
4797%
8836%
4337%
3727%
00%
17%
16%
25%
615%
2657%
6378%
1,4019%
71112%
74112%
Number and Percentage of Hispanic Female Ocers by Rank and Year - All Services
Year O1 O2 O3 O4 O5 O6 O7 O8 O9 O10
2008
2013
201800%
00%
0
429%
17%
00%
00%
28%
00%
410%
412%
38%
28722%
25018%
18615%
1,05628%
88225%
68420%
2,17029%
2,16032%
1,57227%
3,90527%
3,78428%
3,19728%
1,53227%
1,58227%
1,06126%
1,46126%
1,10023%
1,11224%
Number and Percentage of Female Ocers Who Were Racial Minorities by Rank and Year - AllServices
Note: Numbers presented show the number of women in each rank by year. Percentages show theproportion of active duty personnel who were women.
Gender, Ethnic, and Racial Diversity of Active Duty Personnel by Year:All Services - Ocers
0% 34%
Percent of Personnel
Note: Numbers presented show the number of Hispanic women out of all women in each rank by year.Percentages show the proportion of women who were Hispanic out of all active duty women.Hispanic is reported as an ethnicity, a separate indicator from race. People who identify as Hispanicmay be any race.
0% 100%
Percent of Hispanic Women
0% 100%Percent of Women Who Were Racial MinoritiesNote: Numbers presented show the number of women who were racial minorities out of all women in
each rank by year. Percentages show the proportion of women who were racial minorities out of allactive duty women.Women who were racial minorities are defined as women who identified as Black, Asian, AmericanIndian or Alaska Native, Native Hawaiian or Pacific Islander, or those who selected more than onerace. Service members who selected an unknown race were excluded from the analysis.
Developed by Insight Policy Research for the Defense Advisory Committee on Women in the Services within the Department of Defense undercontract number H9821017C0008, June 2019
Source: Defense Manpower Data Center data on active duty Service members from 2008, 2013, and 2018Note: A zero with no percentage indicates that there were no women at that rank.
Year E1 E2 E3 E4 E5 E6 E7 E8 E9
2008
2013
2018
3039%
1,0909%
4,69512%
7,61112%
11,08713%
17,11514%
9,51015%
5,02414%
3,26814%
2777%
1,30911%
4,61711%
6,64611%
9,93313%
18,76515%
7,89814%
3,58714%
2,64913%
3239%
1,35113%
4,33012%
6,65912%
9,86615%
16,09515%
8,04016%
4,25215%
3,67014%
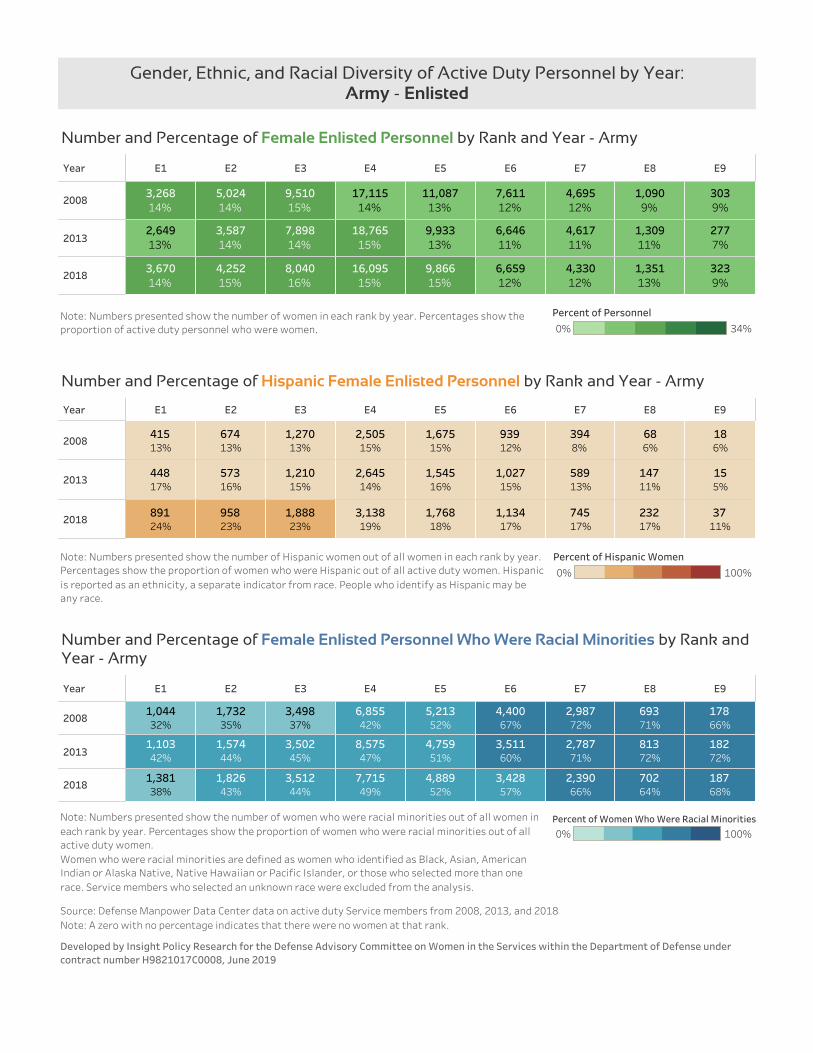
Number and Percentage of Female Enlisted Personnel by Rank and Year - Army
Year E1 E2 E3 E4 E5 E6 E7 E8 E9
2008
2013
2018
186%
686%
3948%
93912%
1,67515%
2,50515%
1,27013%
67413%
41513%
155%
14711%
58913%
1,02715%
1,54516%
2,64514%
1,21015%
57316%
44817%
3711%
23217%
74517%
1,13417%
1,76818%
3,13819%
1,88823%
95823%
89124%
Number and Percentage of Hispanic Female Enlisted Personnel by Rank and Year - Army
Year E1 E2 E3 E4 E5 E6 E7 E8 E9
2008
2013
2018
17866%
69371%
2,98772%
4,40067%
5,21352%
6,85542%
3,49837%
1,73235%
1,04432%
18272%
81372%
2,78771%
3,51160%
4,75951%
8,57547%
3,50245%
1,57444%
1,10342%
18768%
70264%
2,39066%
3,42857%
4,88952%
7,71549%
3,51244%
1,82643%
1,38138%
Number and Percentage of Female Enlisted Personnel Who Were Racial Minorities by Rank andYear - Army
Note: Numbers presented show the number of women in each rank by year. Percentages show theproportion of active duty personnel who were women.
Gender, Ethnic, and Racial Diversity of Active Duty Personnel by Year:Army - Enlisted
0% 34%
Percent of Personnel
Note: Numbers presented show the number of Hispanic women out of all women in each rank by year.Percentages show the proportion of women who were Hispanic out of all active duty women. Hispanicis reported as an ethnicity, a separate indicator from race. People who identify as Hispanic may beany race.
0% 100%
Percent of Hispanic Women
0% 100%Percent of Women Who Were Racial MinoritiesNote: Numbers presented show the number of women who were racial minorities out of all women in
each rank by year. Percentages show the proportion of women who were racial minorities out of allactive duty women.Women who were racial minorities are defined as women who identified as Black, Asian, AmericanIndian or Alaska Native, Native Hawaiian or Pacific Islander, or those who selected more than onerace. Service members who selected an unknown race were excluded from the analysis.
Developed by Insight Policy Research for the Defense Advisory Committee on Women in the Services within the Department of Defense undercontract number H9821017C0008, June 2019
Source: Defense Manpower Data Center data on active duty Service members from 2008, 2013, and 2018Note: A zero with no percentage indicates that there were no women at that rank.
Year WO1 WO2 WO3 WO4 WO5
2008
2013
2018
163%
1707%
2708%
4539%
33910%
386%
1767%
38410%
69410%
19810%
478%
1849%
40810%
4969%
23810%
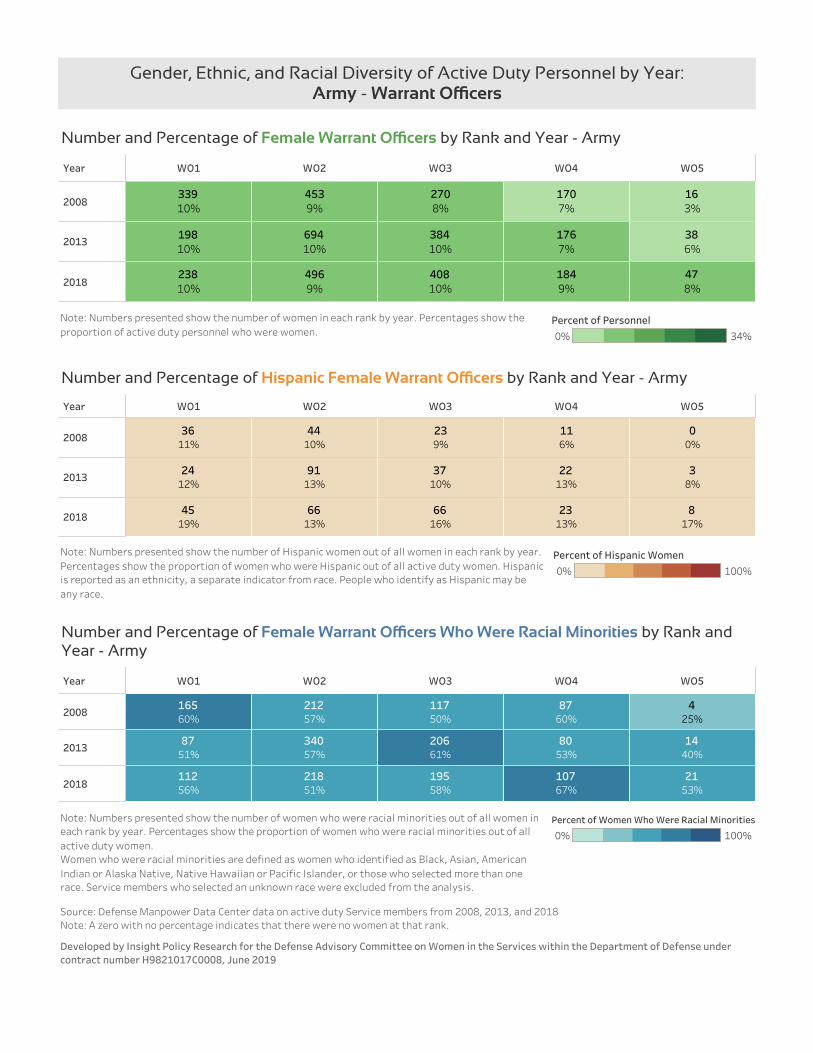
Number and Percentage of Female Warrant Ocers by Rank and Year - Army
Year WO1 WO2 WO3 WO4 WO5
2008
2013
2018
00%
116%
239%
4410%
3611%
38%
2213%
3710%
9113%
2412%
817%
2313%
6616%
6613%
4519%
Number and Percentage of Hispanic Female Warrant Ocers by Rank and Year - Army
Year WO1 WO2 WO3 WO4 WO5
2008
2013
2018
425%
8760%
11750%
21257%
16560%
1440%
8053%
20661%
34057%
8751%
2153%
10767%
19558%
21851%
11256%
Number and Percentage of Female Warrant Ocers Who Were Racial Minorities by Rank andYear - Army
Note: Numbers presented show the number of women in each rank by year. Percentages show theproportion of active duty personnel who were women.
Gender, Ethnic, and Racial Diversity of Active Duty Personnel by Year:Army - Warrant Ocers
0% 34%
Percent of Personnel
Note: Numbers presented show the number of Hispanic women out of all women in each rank by year.Percentages show the proportion of women who were Hispanic out of all active duty women. Hispanicis reported as an ethnicity, a separate indicator from race. People who identify as Hispanic may beany race.
0% 100%
Percent of Hispanic Women
0% 100%
Percent of Women Who Were Racial MinoritiesNote: Numbers presented show the number of women who were racial minorities out of all women ineach rank by year. Percentages show the proportion of women who were racial minorities out of allactive duty women.Women who were racial minorities are defined as women who identified as Black, Asian, AmericanIndian or Alaska Native, Native Hawaiian or Pacific Islander, or those who selected more than onerace. Service members who selected an unknown race were excluded from the analysis.
Developed by Insight Policy Research for the Defense Advisory Committee on Women in the Services within the Department of Defense undercontract number H9821017C0008, June 2019
Source: Defense Manpower Data Center data on active duty Service members from 2008, 2013, and 2018Note: A zero with no percentage indicates that there were no women at that rank.
Year O1 O2 O3 O4 O5 O6 O7 O8 O9 O10
2008
2013
2018
00%
24%
22%
106%
49712%
1,19313%
2,12514%
5,02719%
1,51420%
1,95119%
00%
612%
87%
96%
51112%
1,29513%
2,90117%
5,63420%
2,66919%
1,70120%
00%
37%
76%
1410%
47012%
1,33415%
2,92219%
5,67820%
2,30920%
2,06421%
Number and Percentage of Female Ocers by Rank and Year - Army
Year O1 O2 O3 O4 O5 O6 O7 O8 O9 O10
2008
2013
2018
000%
00%
00%
173%
605%
1296%
3116%
1117%
1357%
000%
113%
00%
163%
685%
2147%
3797%
2198%
17510%
000%
00%
00%
143%
947%
2258%
4899%
26111%
26613%
Number and Percentage of Hispanic Female Ocers by Rank and Year - Army
Year O1 O2 O3 O4 O5 O6 O7 O8 O9 O10
2008
2013
2018
000%
00%
110%
9520%
34030%
69936%
1,56635%
48536%
56032%
000%
113%
111%
11723%
41534%
1,09442%
1,85036%
76531%
36123%
0267%
00%
321%
12327%
46938%
98537%
1,56630%
60429%
50927%
Number and Percentage of Female Ocers Who Were Racial Minorities by Rank and Year -Army
Note: Numbers presented show the number of women in each rank by year. Percentages show theproportion of active duty personnel who were women.
Gender, Ethnic, and Racial Diversity of Active Duty Personnel by Year:Army - Ocers
0% 34%
Percent of Personnel
Note: Numbers presented show the number of Hispanic women out of all women in each rank by year.Percentages show the proportion of women who were Hispanic out of all active duty women.Hispanic is reported as an ethnicity, a separate indicator from race. People who identify as Hispanicmay be any race.
0% 100%
Percent of Hispanic Women
0% 100%Percent of Women Who Were Racial MinoritiesNote: Numbers presented show the number of women who were racial minorities out of all women in
each rank by year. Percentages show the proportion of women who were racial minorities out of allactive duty women.Women who were racial minorities are defined as women who identified as Black, Asian, AmericanIndian or Alaska Native, Native Hawaiian or Pacific Islander, or those who selected more than onerace. Service members who selected an unknown race were excluded from the analysis.
Developed by Insight Policy Research for the Defense Advisory Committee on Women in the Services within the Department of Defense undercontract number H9821017C0008, June 2019
Source: Defense Manpower Data Center data on active duty Service members from 2008, 2013, and 2018Note: A zero with no percentage indicates that there were no women at that rank.
Year E1 E2 E3 E4 E5 E6 E7 E8 E9
2008
2013
2018
1435%
4086%
1,7678%
5,65812%
9,85215%
9,23017%
8,00420%
3,25118%
2,88018%
1546%
4317%
2,22011%
5,96913%
9,63016%
12,02020%
8,96622%
4,04223%
3,55725%
2098%
64910%
2,79413%
6,96914%
13,55520%
11,90423%
10,70625%
3,76024%
3,07624%
Number and Percentage of Female Enlisted Personnel by Rank and Year - Navy
Year E1 E2 E3 E4 E5 E6 E7 E8 E9
2008
2013
2018
96%
379%
1669%
65312%
1,59616%
2,00122%
1,95824%
75423%
72625%
1711%
4711%
31714%
95916%
2,10922%
2,58221%
1,68619%
76019%
64818%
3316%
10116%
54019%
1,37120%
2,70620%
2,36020%
2,12720%
78421%
73924%
Number and Percentage of Hispanic Female Enlisted Personnel by Rank and Year - Navy
Year E1 E2 E3 E4 E5 E6 E7 E8 E9
2008
2013
2018
4835%
16441%
75944%
2,71950%
4,58849%
4,07546%
3,95350%
1,56948%
1,47551%
6746%
19146%
1,06051%
2,94052%
5,10054%
6,49255%
4,69853%
1,93249%
1,61447%
8743%
33956%
1,39153%
3,75456%
6,96953%
5,06645%
4,26743%
1,35339%
1,08339%
Number and Percentage of Female Enlisted Personnel Who Were Racial Minorities by Rank andYear - Navy
Note: Numbers presented show the number of women in each rank by year. Percentages show theproportion of active duty personnel who were women.
Gender, Ethnic, and Racial Diversity of Active Duty Personnel by Year:Navy - Enlisted
0% 34%
Percent of Personnel
Note: Numbers presented show the number of Hispanic women out of all women in each rank by year.Percentages show the proportion of women who were Hispanic out of all active duty women. Hispanicis reported as an ethnicity, a separate indicator from race. People who identify as Hispanic may beany race.
0% 100%
Percent of Hispanic Women
0% 100%Percent of Women Who Were Racial MinoritiesNote: Numbers presented show the number of women who were racial minorities out of all women in
each rank by year. Percentages show the proportion of women who were racial minorities out of allactive duty women.Women who were racial minorities are defined as women who identified as Black, Asian, AmericanIndian or Alaska Native, Native Hawaiian or Pacific Islander, or those who selected more than onerace. Service members who selected an unknown race were excluded from the analysis.
Developed by Insight Policy Research for the Defense Advisory Committee on Women in the Services within the Department of Defense undercontract number H9821017C0008, June 2019
Source: Defense Manpower Data Center data on active duty Service members from 2008, 2013, and 2018Note: A zero with no percentage indicates that there were no women at that rank.
Year WO2 WO3 WO4 WO5
2008
2013
2018
11%
103%
436%
275%
68%
236%
335%
316%
89%
164%
508%
569%
Number and Percentage of Female Warrant Ocers by Rank and Year - Navy
Year WO2 WO3 WO4 WO5
2008
2013
2018
00%
00%
12%
311%
117%
14%
26%
26%
113%
425%
36%
916%
Number and Percentage of Hispanic Female Warrant Ocers by Rank and Year - Navy
Year WO2 WO3 WO4 WO5
2008
2013
2018
1100%
440%
2353%
1452%
350%
1774%
1545%
1653%
675%
956%
2959%
2857%
Number and Percentage of Female Warrant Ocers Who Were Racial Minorities by Rank andYear - Navy
Note: Numbers presented show the number of women in each rank by year. Percentages show theproportion of active duty personnel who were women.
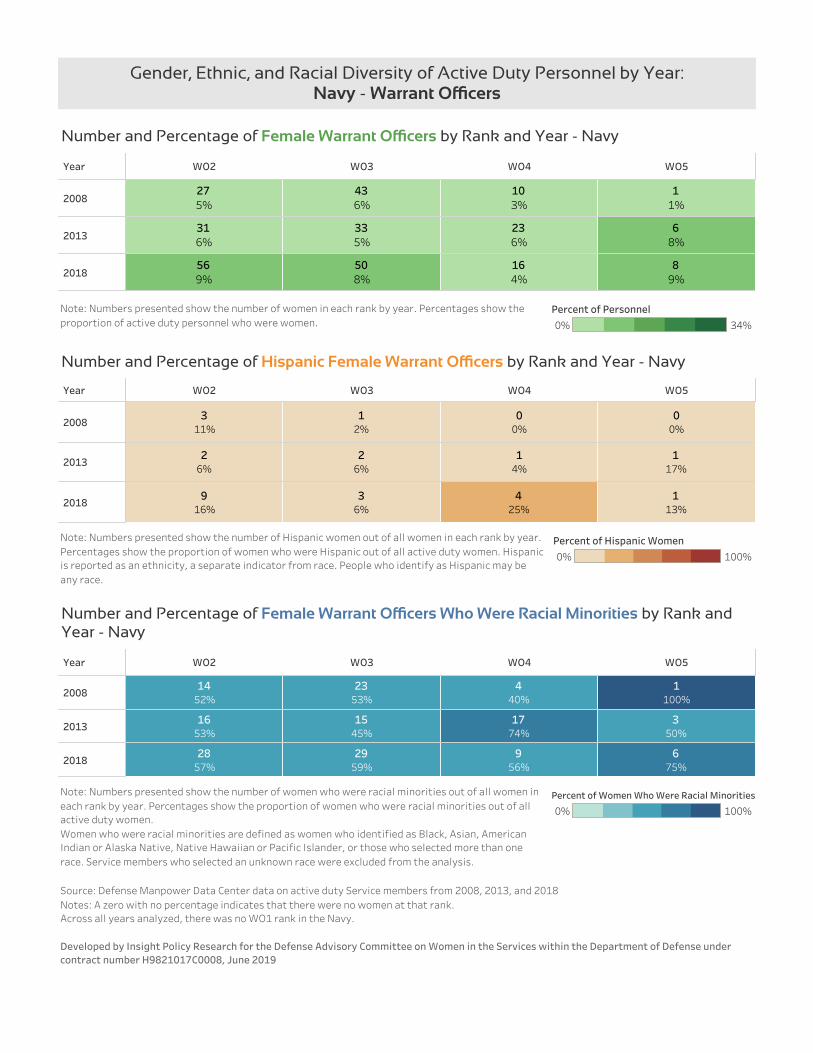
Gender, Ethnic, and Racial Diversity of Active Duty Personnel by Year:Navy - Warrant Ocers
0% 34%
Percent of Personnel
Note: Numbers presented show the number of Hispanic women out of all women in each rank by year.Percentages show the proportion of women who were Hispanic out of all active duty women. Hispanicis reported as an ethnicity, a separate indicator from race. People who identify as Hispanic may beany race.
0% 100%
Percent of Hispanic Women
0% 100%
Percent of Women Who Were Racial MinoritiesNote: Numbers presented show the number of women who were racial minorities out of all women ineach rank by year. Percentages show the proportion of women who were racial minorities out of allactive duty women.Women who were racial minorities are defined as women who identified as Black, Asian, AmericanIndian or Alaska Native, Native Hawaiian or Pacific Islander, or those who selected more than onerace. Service members who selected an unknown race were excluded from the analysis.
Developed by Insight Policy Research for the Defense Advisory Committee on Women in the Services within the Department of Defense undercontract number H9821017C0008, June 2019
Source: Defense Manpower Data Center data on active duty Service members from 2008, 2013, and 2018Notes: A zero with no percentage indicates that there were no women at that rank.Across all years analyzed, there was no WO1 rank in the Navy.
Year O1 O2 O3 O4 O5 O6 O7 O8 O9 O10
2008
2013
2018
00%
25%
69%
76%
37912%
88613%
1,36613%
2,74716%
1,03717%
1,22419%
00%
49%
57%
1311%
41613%
78312%
1,59215%
3,28518%
1,36121%
1,44322%
00%
411%
35%
109%
35511%
85913%
1,85818%
4,03022%
1,52123%
1,60723%
Number and Percentage of Female Ocers by Rank and Year - Navy
Year O1 O2 O3 O4 O5 O6 O7 O8 O9 O10
2008
2013
2018
000%
00%
00%
123%
435%
735%
1746%
828%
827%
000%
00%
18%
164%
456%
1147%
2397%
1249%
1269%
0125%
00%
110%
216%
587%
1397%
3689%
18112%
20113%
Number and Percentage of Hispanic Female Ocers by Rank and Year - Navy
Year O1 O2 O3 O4 O5 O6 O7 O8 O9 O10
2008
2013
2018
000%
00%
114%
4011%
14016%
32425%
64124%
20221%
24020%
0125%
00%
323%
5915%
16622%
41728%
74223%
32224%
34826%
0125%
00%
113%
6920%
20625%
43424%
1,01727%
42730%
44929%
Number and Percentage of Female Ocers Who Were Racial Minorities by Rank and Year -Navy
Note: Numbers presented show the number of women in each rank by year. Percentages show theproportion of active duty personnel who were women.
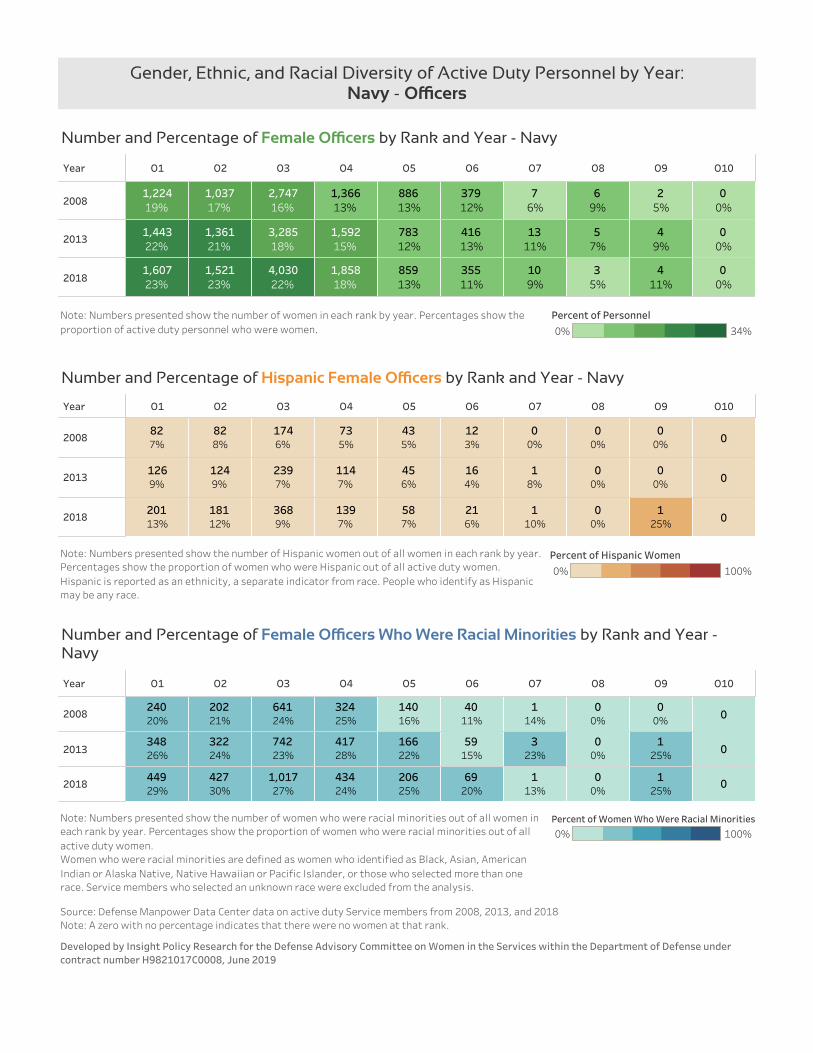
Gender, Ethnic, and Racial Diversity of Active Duty Personnel by Year:Navy - Ocers
0% 34%
Percent of Personnel
Note: Numbers presented show the number of Hispanic women out of all women in each rank by year.Percentages show the proportion of women who were Hispanic out of all active duty women.Hispanic is reported as an ethnicity, a separate indicator from race. People who identify as Hispanicmay be any race.
0% 100%
Percent of Hispanic Women
0% 100%Percent of Women Who Were Racial MinoritiesNote: Numbers presented show the number of women who were racial minorities out of all women in
each rank by year. Percentages show the proportion of women who were racial minorities out of allactive duty women.Women who were racial minorities are defined as women who identified as Black, Asian, AmericanIndian or Alaska Native, Native Hawaiian or Pacific Islander, or those who selected more than onerace. Service members who selected an unknown race were excluded from the analysis.
Developed by Insight Policy Research for the Defense Advisory Committee on Women in the Services within the Department of Defense undercontract number H9821017C0008, June 2019
Source: Defense Manpower Data Center data on active duty Service members from 2008, 2013, and 2018Note: A zero with no percentage indicates that there were no women at that rank.
Year E1 E2 E3 E4 E5 E6 E7 E8 E9
2008
2013
2018
624%
2085%
4505%
9006%
1,7776%
2,6957%
2,6736%
1,5156%
8335%
634%
2085%
5446%
9136%
2,0137%
2,9278%
3,5577%
1,7818%
8207%
644%
2055%
5316%
1,1008%
2,53010%
3,2499%
3,6539%
2,04610%
9659%
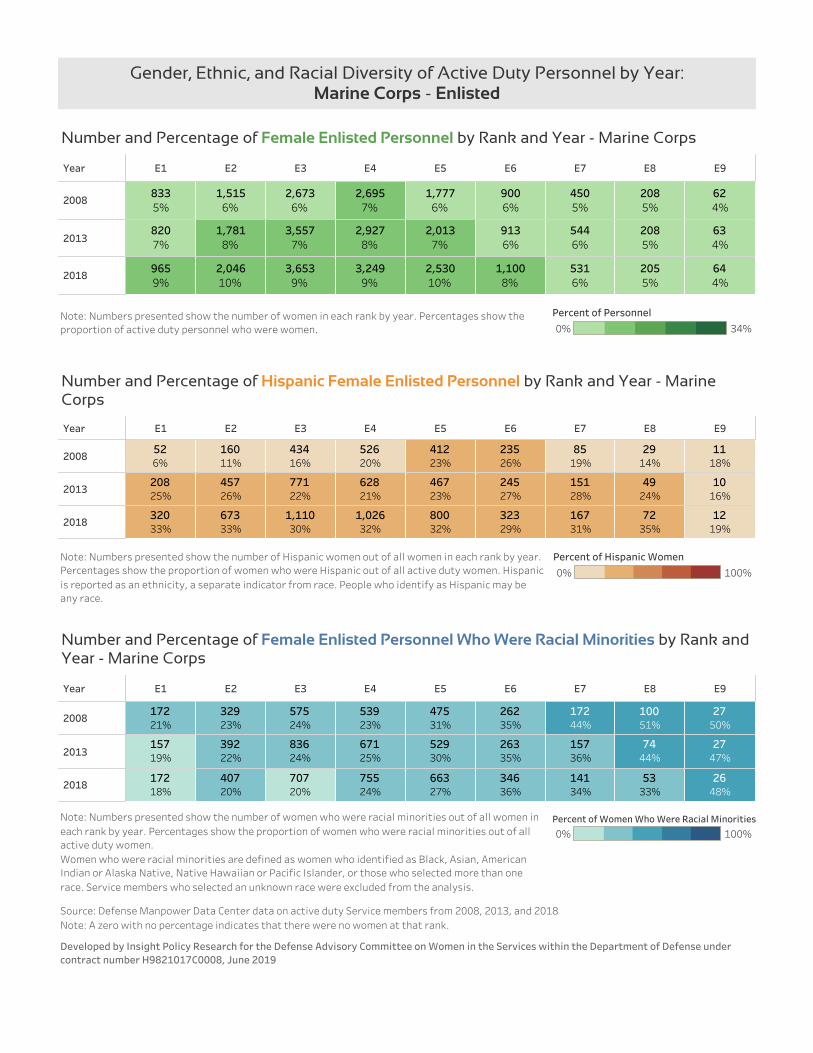
Number and Percentage of Female Enlisted Personnel by Rank and Year - Marine Corps
Year E1 E2 E3 E4 E5 E6 E7 E8 E9
2008
2013
2018
1118%
2914%
8519%
23526%
41223%
52620%
43416%
16011%
526%
1016%
4924%
15128%
24527%
46723%
62821%
77122%
45726%
20825%
1219%
7235%
16731%
32329%
80032%
1,02632%
1,11030%
67333%
32033%
Number and Percentage of Hispanic Female Enlisted Personnel by Rank and Year - MarineCorps
Year E1 E2 E3 E4 E5 E6 E7 E8 E9
2008
2013
2018
2750%
10051%
17244%
26235%
47531%
53923%
57524%
32923%
17221%
2747%
7444%
15736%
26335%
52930%
67125%
83624%
39222%
15719%
2648%
5333%
14134%
34636%
66327%
75524%
70720%
40720%
17218%
Number and Percentage of Female Enlisted Personnel Who Were Racial Minorities by Rank andYear - Marine Corps
Note: Numbers presented show the number of women in each rank by year. Percentages show theproportion of active duty personnel who were women.
Gender, Ethnic, and Racial Diversity of Active Duty Personnel by Year:Marine Corps - Enlisted
0% 34%
Percent of Personnel
Note: Numbers presented show the number of Hispanic women out of all women in each rank by year.Percentages show the proportion of women who were Hispanic out of all active duty women. Hispanicis reported as an ethnicity, a separate indicator from race. People who identify as Hispanic may beany race.
0% 100%
Percent of Hispanic Women
0% 100%Percent of Women Who Were Racial MinoritiesNote: Numbers presented show the number of women who were racial minorities out of all women in
each rank by year. Percentages show the proportion of women who were racial minorities out of allactive duty women.Women who were racial minorities are defined as women who identified as Black, Asian, AmericanIndian or Alaska Native, Native Hawaiian or Pacific Islander, or those who selected more than onerace. Service members who selected an unknown race were excluded from the analysis.
Developed by Insight Policy Research for the Defense Advisory Committee on Women in the Services within the Department of Defense undercontract number H9821017C0008, June 2019
Source: Defense Manpower Data Center data on active duty Service members from 2008, 2013, and 2018Note: A zero with no percentage indicates that there were no women at that rank.
Year WO1 WO2 WO3 WO4 WO5
2008
2013
2018
33%
124%
357%
496%
63%
44%
124%
325%
495%
1911%
77%
134%
386%
567%
145%
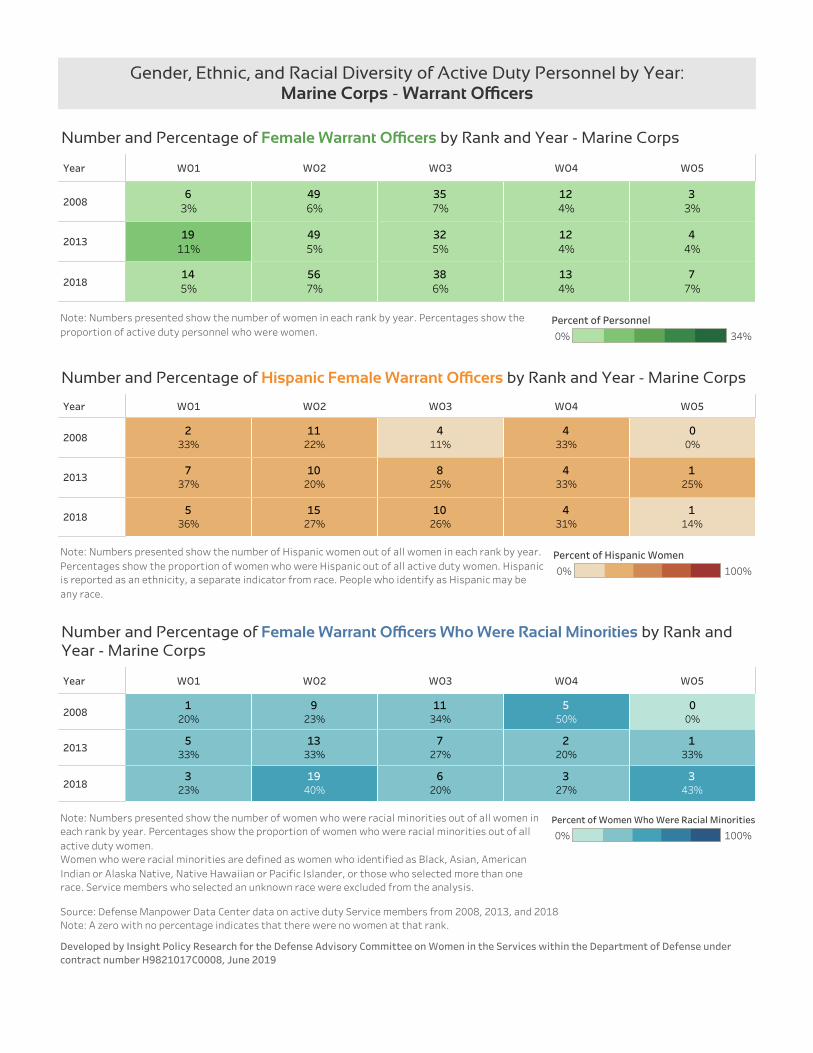
Number and Percentage of Female Warrant Ocers by Rank and Year - Marine Corps
Year WO1 WO2 WO3 WO4 WO5
2008
2013
2018
00%
433%
411%
1122%
233%
125%
433%
825%
1020%
737%
114%
431%
1026%
1527%
536%
Number and Percentage of Hispanic Female Warrant Ocers by Rank and Year - Marine Corps
Year WO1 WO2 WO3 WO4 WO5
2008
2013
2018
00%
550%
1134%
923%
120%
133%
220%
727%
1333%
533%
343%
327%
620%
1940%
323%
Number and Percentage of Female Warrant Ocers Who Were Racial Minorities by Rank andYear - Marine Corps
Note: Numbers presented show the number of women in each rank by year. Percentages show theproportion of active duty personnel who were women.
Gender, Ethnic, and Racial Diversity of Active Duty Personnel by Year:Marine Corps - Warrant Ocers
0% 34%
Percent of Personnel
Note: Numbers presented show the number of Hispanic women out of all women in each rank by year.Percentages show the proportion of women who were Hispanic out of all active duty women. Hispanicis reported as an ethnicity, a separate indicator from race. People who identify as Hispanic may beany race.
0% 100%
Percent of Hispanic Women
0% 100%
Percent of Women Who Were Racial MinoritiesNote: Numbers presented show the number of women who were racial minorities out of all women ineach rank by year. Percentages show the proportion of women who were racial minorities out of allactive duty women.Women who were racial minorities are defined as women who identified as Black, Asian, AmericanIndian or Alaska Native, Native Hawaiian or Pacific Islander, or those who selected more than onerace. Service members who selected an unknown race were excluded from the analysis.
Developed by Insight Policy Research for the Defense Advisory Committee on Women in the Services within the Department of Defense undercontract number H9821017C0008, June 2019
Source: Defense Manpower Data Center data on active duty Service members from 2008, 2013, and 2018Note: A zero with no percentage indicates that there were no women at that rank.
Year O1 O2 O3 O4 O5 O6 O7 O8 O9 O10
2008
2013
2018
00%
16%
14%
13%
203%
362%
1444%
3907%
2198%
2608%
00%
00%
00%
13%
183%
553%
2015%
4607%
2798%
24511%
00%
15%
00%
12%
183%
915%
2537%
4928%
34510%
32710%
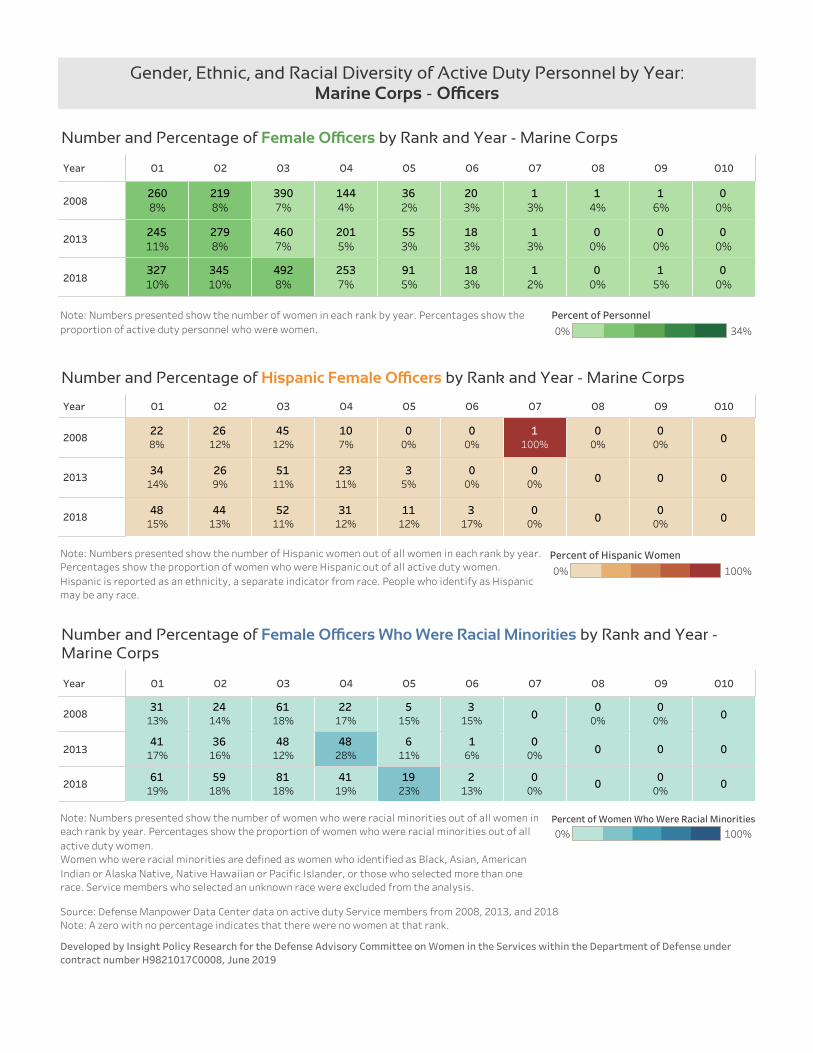
Number and Percentage of Female Ocers by Rank and Year - Marine Corps
Year O1 O2 O3 O4 O5 O6 O7 O8 O9 O10
2008
2013
2018
000%
00%
1100%
00%
00%
107%
4512%
2612%
228%
00000%
00%
35%
2311%
5111%
269%
3414%
000%0
00%
317%
1112%
3112%
5211%
4413%
4815%
Number and Percentage of Hispanic Female Ocers by Rank and Year - Marine Corps
Year O1 O2 O3 O4 O5 O6 O7 O8 O9 O10
2008
2013
2018
000%
00%0
315%
515%
2217%
6118%
2414%
3113%
00000%
16%
611%
4828%
4812%
3616%
4117%
000%
000%
213%
1923%
4119%
8118%
5918%
6119%
Number and Percentage of Female Ocers Who Were Racial Minorities by Rank and Year -Marine Corps
Note: Numbers presented show the number of women in each rank by year. Percentages show theproportion of active duty personnel who were women.
Gender, Ethnic, and Racial Diversity of Active Duty Personnel by Year:Marine Corps - Ocers
0% 34%
Percent of Personnel
Note: Numbers presented show the number of Hispanic women out of all women in each rank by year.Percentages show the proportion of women who were Hispanic out of all active duty women.Hispanic is reported as an ethnicity, a separate indicator from race. People who identify as Hispanicmay be any race.
0% 100%
Percent of Hispanic Women
0% 100%Percent of Women Who Were Racial MinoritiesNote: Numbers presented show the number of women who were racial minorities out of all women in
each rank by year. Percentages show the proportion of women who were racial minorities out of allactive duty women.Women who were racial minorities are defined as women who identified as Black, Asian, AmericanIndian or Alaska Native, Native Hawaiian or Pacific Islander, or those who selected more than onerace. Service members who selected an unknown race were excluded from the analysis.
Developed by Insight Policy Research for the Defense Advisory Committee on Women in the Services within the Department of Defense undercontract number H9821017C0008, June 2019
Source: Defense Manpower Data Center data on active duty Service members from 2008, 2013, and 2018Note: A zero with no percentage indicates that there were no women at that rank.
Year E1 E2 E3 E4 E5 E6 E7 E8 E9
2008
2013
2018
27110%
62212%
3,68014%
7,90419%
15,03822%
10,01321%
10,45122%
1,36421%
2,06020%
29511%
91818%
4,90818%
8,26120%
13,12819%
10,29218%
9,33818%
59617%
1,37517%
43516%
1,06021%
5,23121%
7,23918%
11,26218%
10,08820%
12,51223%
1,58422%
2,36923%
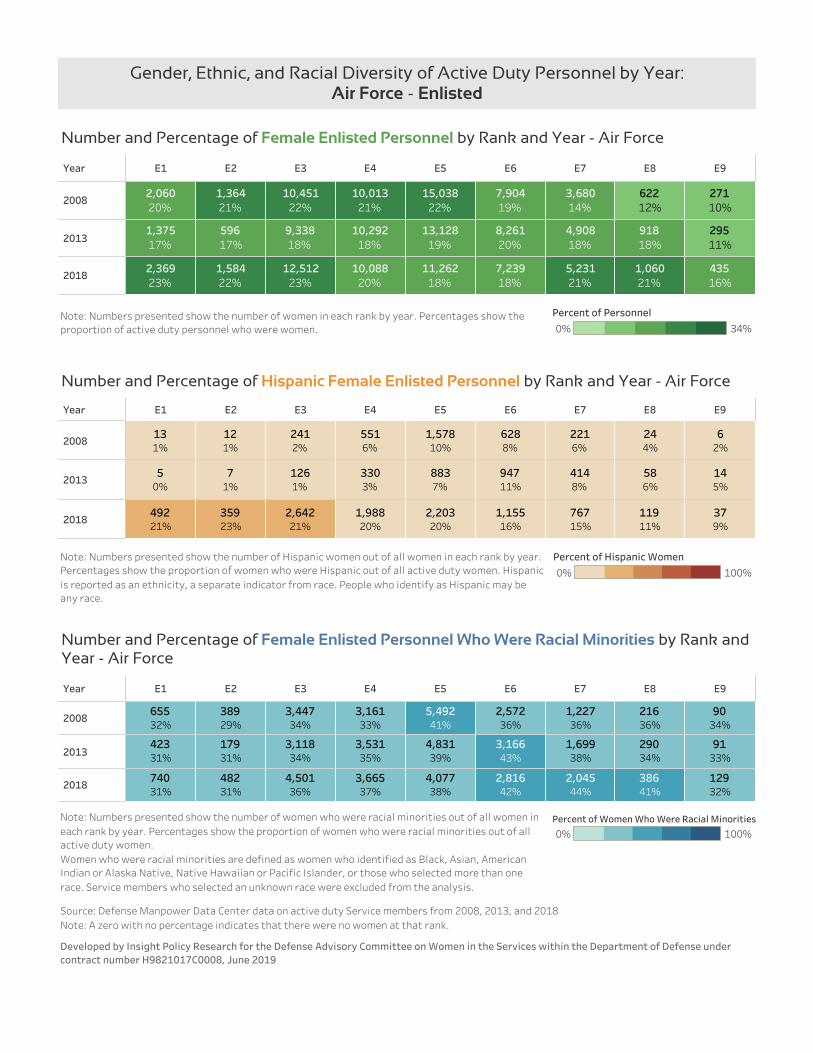
Number and Percentage of Female Enlisted Personnel by Rank and Year - Air Force
Year E1 E2 E3 E4 E5 E6 E7 E8 E9
2008
2013
2018
62%
244%
2216%
6288%
1,57810%
5516%
2412%
121%
131%
145%
586%
4148%
94711%
8837%
3303%
1261%
71%
50%
379%
11911%
76715%
1,15516%
2,20320%
1,98820%
2,64221%
35923%
49221%
Number and Percentage of Hispanic Female Enlisted Personnel by Rank and Year - Air Force
Year E1 E2 E3 E4 E5 E6 E7 E8 E9
2008
2013
2018
9034%
21636%
1,22736%
2,57236%
5,49241%
3,16133%
3,44734%
38929%
65532%
9133%
29034%
1,69938%
3,16643%
4,83139%
3,53135%
3,11834%
17931%
42331%
12932%
38641%
2,04544%
2,81642%
4,07738%
3,66537%
4,50136%
48231%
74031%
Number and Percentage of Female Enlisted Personnel Who Were Racial Minorities by Rank andYear - Air Force
Note: Numbers presented show the number of women in each rank by year. Percentages show theproportion of active duty personnel who were women.
Gender, Ethnic, and Racial Diversity of Active Duty Personnel by Year:Air Force - Enlisted
0% 34%
Percent of Personnel
Note: Numbers presented show the number of Hispanic women out of all women in each rank by year.Percentages show the proportion of women who were Hispanic out of all active duty women. Hispanicis reported as an ethnicity, a separate indicator from race. People who identify as Hispanic may beany race.
0% 100%
Percent of Hispanic Women
0% 100%Percent of Women Who Were Racial MinoritiesNote: Numbers presented show the number of women who were racial minorities out of all women in
each rank by year. Percentages show the proportion of women who were racial minorities out of allactive duty women.Women who were racial minorities are defined as women who identified as Black, Asian, AmericanIndian or Alaska Native, Native Hawaiian or Pacific Islander, or those who selected more than onerace. Service members who selected an unknown race were excluded from the analysis.
Developed by Insight Policy Research for the Defense Advisory Committee on Women in the Services within the Department of Defense undercontract number H9821017C0008, June 2019
Source: Defense Manpower Data Center data on active duty Service members from 2008, 2013, and 2018Note: A zero with no percentage indicates that there were no women at that rank.
Year O1 O2 O3 O4 O5 O6 O7 O8 O9 O10
2008
2013
2018
00%
13%
55%
2114%
39111%
1,31713%
2,40717%
4,54320%
1,67123%
1,51323%
18%
511%
1111%
107%
47313%
1,42614%
2,39517%
4,98022%
1,78325%
1,60823%
18%
511%
56%
1611%
45914%
1,56416%
2,76920%
4,99424%
1,69924%
1,78423%
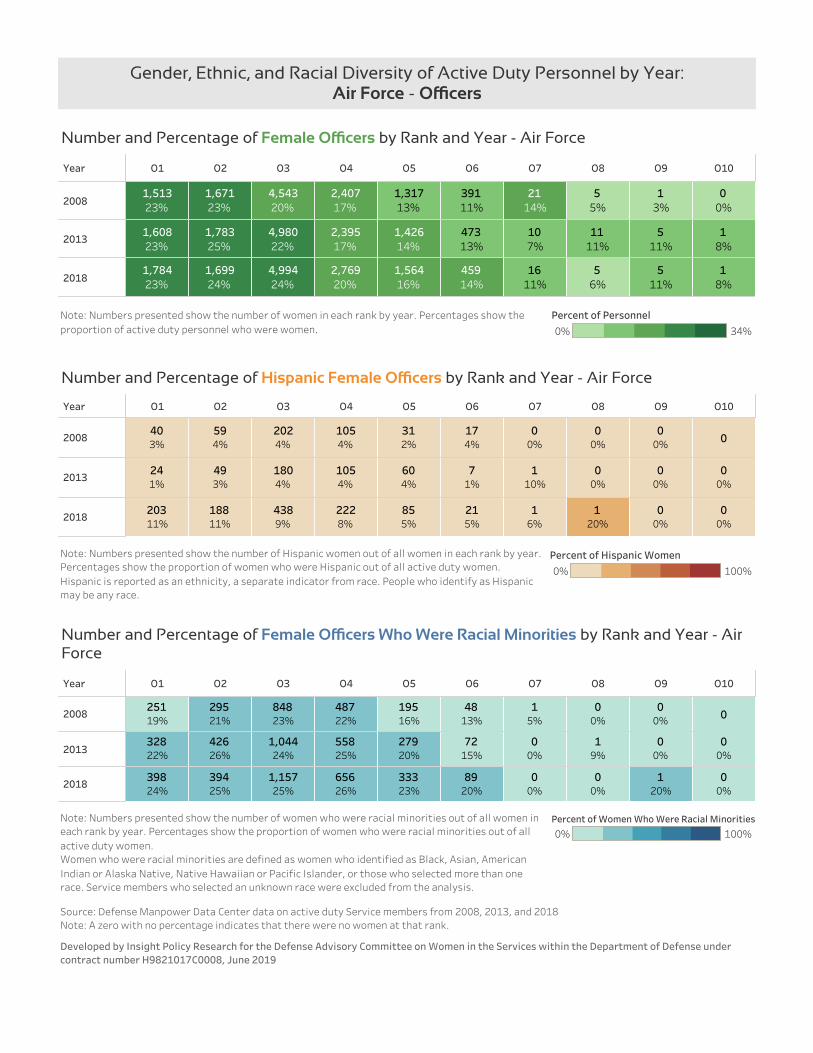
Number and Percentage of Female Ocers by Rank and Year - Air Force
Year O1 O2 O3 O4 O5 O6 O7 O8 O9 O10
2008
2013
2018
000%
00%
00%
174%
312%
1054%
2024%
594%
403%
00%
00%
00%
110%
71%
604%
1054%
1804%
493%
241%
00%
00%
120%
16%
215%
855%
2228%
4389%
18811%
20311%
Number and Percentage of Hispanic Female Ocers by Rank and Year - Air Force
Year O1 O2 O3 O4 O5 O6 O7 O8 O9 O10
2008
2013
2018
000%
00%
15%
4813%
19516%
48722%
84823%
29521%
25119%
00%
00%
19%
00%
7215%
27920%
55825%
1,04424%
42626%
32822%
00%
120%
00%
00%
8920%
33323%
65626%
1,15725%
39425%
39824%
Number and Percentage of Female Ocers Who Were Racial Minorities by Rank and Year - AirForce
Note: Numbers presented show the number of women in each rank by year. Percentages show theproportion of active duty personnel who were women.
Gender, Ethnic, and Racial Diversity of Active Duty Personnel by Year:Air Force - Ocers
0% 34%
Percent of Personnel
Note: Numbers presented show the number of Hispanic women out of all women in each rank by year.Percentages show the proportion of women who were Hispanic out of all active duty women.Hispanic is reported as an ethnicity, a separate indicator from race. People who identify as Hispanicmay be any race.
0% 100%
Percent of Hispanic Women
0% 100%Percent of Women Who Were Racial MinoritiesNote: Numbers presented show the number of women who were racial minorities out of all women in
each rank by year. Percentages show the proportion of women who were racial minorities out of allactive duty women.Women who were racial minorities are defined as women who identified as Black, Asian, AmericanIndian or Alaska Native, Native Hawaiian or Pacific Islander, or those who selected more than onerace. Service members who selected an unknown race were excluded from the analysis.
Developed by Insight Policy Research for the Defense Advisory Committee on Women in the Services within the Department of Defense undercontract number H9821017C0008, June 2019
Source: Defense Manpower Data Center data on active duty Service members from 2008, 2013, and 2018Note: A zero with no percentage indicates that there were no women at that rank.
Year E1 E2 E3 E4 E5 E6 E7 E8 E9
2008
2013
2018
144%
314%
2307%
71911%
90311%
96913%
85515%
10912%
3714%
298%
477%
2648%
70511%
92712%
1,21817%
1,31426%
10734%
3628%
278%
507%
3239%
80112%
1,19515%
1,08315%
68913%
10913%
309%
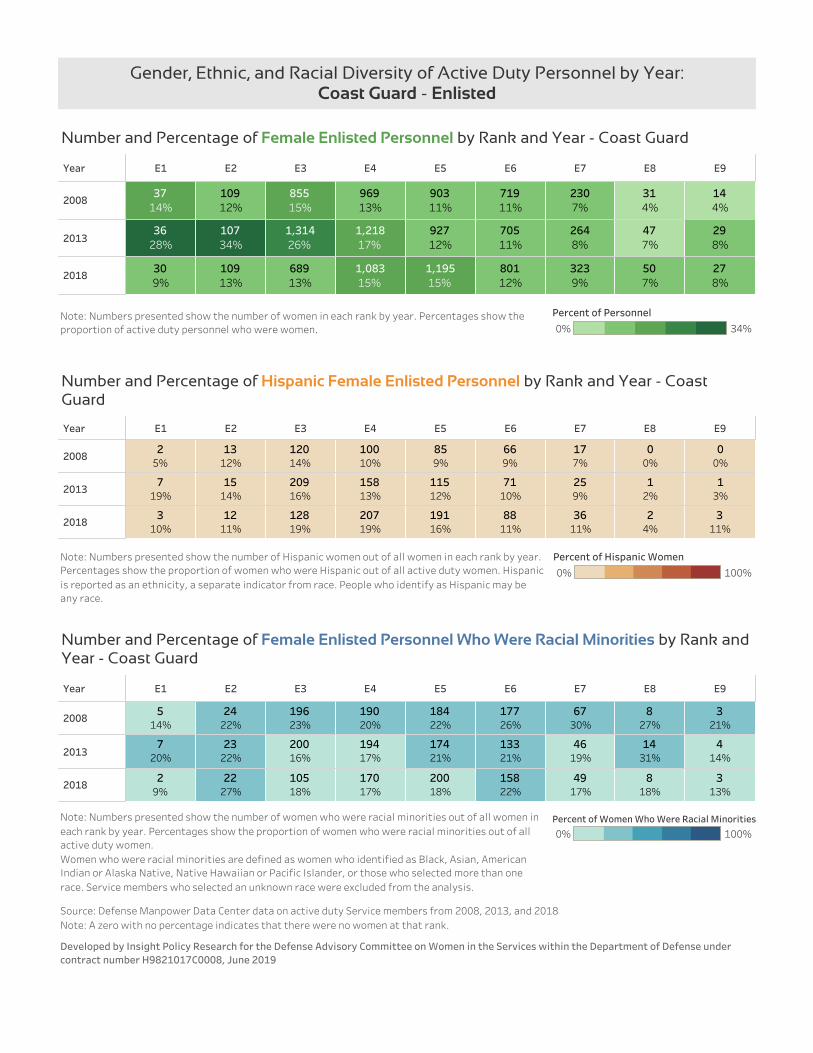
Number and Percentage of Female Enlisted Personnel by Rank and Year - Coast Guard
Year E1 E2 E3 E4 E5 E6 E7 E8 E9
2008
2013
2018
00%
00%
177%
669%
859%
10010%
12014%
1312%
25%
13%
12%
259%
7110%
11512%
15813%
20916%
1514%
719%
311%
24%
3611%
8811%
19116%
20719%
12819%
1211%
310%
Number and Percentage of Hispanic Female Enlisted Personnel by Rank and Year - CoastGuard
Year E1 E2 E3 E4 E5 E6 E7 E8 E9
2008
2013
2018
321%
827%
6730%
17726%
18422%
19020%
19623%
2422%
514%
414%
1431%
4619%
13321%
17421%
19417%
20016%
2322%
720%
313%
818%
4917%
15822%
20018%
17017%
10518%
2227%
29%
Number and Percentage of Female Enlisted Personnel Who Were Racial Minorities by Rank andYear - Coast Guard
Note: Numbers presented show the number of women in each rank by year. Percentages show theproportion of active duty personnel who were women.
Gender, Ethnic, and Racial Diversity of Active Duty Personnel by Year:Coast Guard - Enlisted
0% 34%
Percent of Personnel
Note: Numbers presented show the number of Hispanic women out of all women in each rank by year.Percentages show the proportion of women who were Hispanic out of all active duty women. Hispanicis reported as an ethnicity, a separate indicator from race. People who identify as Hispanic may beany race.
0% 100%
Percent of Hispanic Women
0% 100%Percent of Women Who Were Racial MinoritiesNote: Numbers presented show the number of women who were racial minorities out of all women in
each rank by year. Percentages show the proportion of women who were racial minorities out of allactive duty women.Women who were racial minorities are defined as women who identified as Black, Asian, AmericanIndian or Alaska Native, Native Hawaiian or Pacific Islander, or those who selected more than onerace. Service members who selected an unknown race were excluded from the analysis.
Developed by Insight Policy Research for the Defense Advisory Committee on Women in the Services within the Department of Defense undercontract number H9821017C0008, June 2019
Source: Defense Manpower Data Center data on active duty Service members from 2008, 2013, and 2018Note: A zero with no percentage indicates that there were no women at that rank.
Year WO2 WO3 WO4
2008
2013
2018
103%
347%
395%
216%
275%
649%
214%
347%
7410%
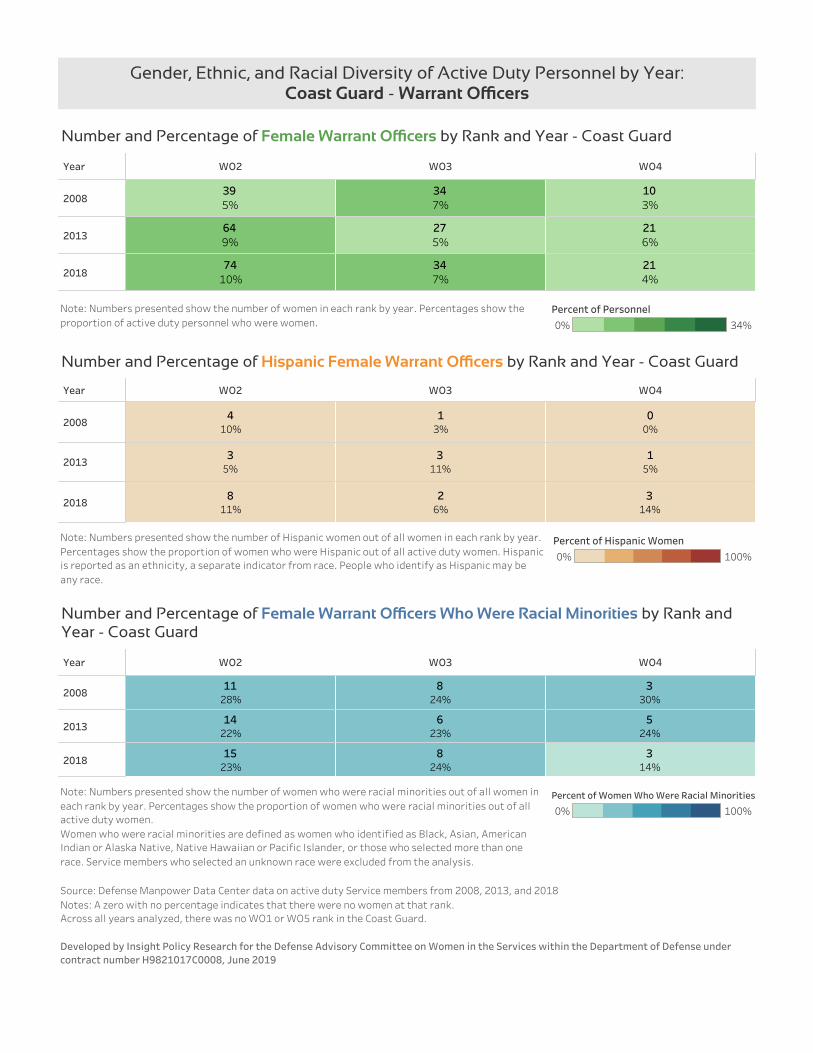
Number and Percentage of Female Warrant Ocers by Rank and Year - Coast Guard
Year WO2 WO3 WO4
2008
2013
2018
00%
13%
410%
15%
311%
35%
314%
26%
811%
Number and Percentage of Hispanic Female Warrant Ocers by Rank and Year - Coast Guard
Year WO2 WO3 WO4
2008
2013
2018
330%
824%
1128%
524%
623%
1422%
314%
824%
1523%
Number and Percentage of Female Warrant Ocers Who Were Racial Minorities by Rank andYear - Coast Guard
Note: Numbers presented show the number of women in each rank by year. Percentages show theproportion of active duty personnel who were women.
Gender, Ethnic, and Racial Diversity of Active Duty Personnel by Year:Coast Guard - Warrant Ocers
0% 34%
Percent of Personnel
Note: Numbers presented show the number of Hispanic women out of all women in each rank by year.Percentages show the proportion of women who were Hispanic out of all active duty women. Hispanicis reported as an ethnicity, a separate indicator from race. People who identify as Hispanic may beany race.
0% 100%
Percent of Hispanic Women
0% 100%
Percent of Women Who Were Racial MinoritiesNote: Numbers presented show the number of women who were racial minorities out of all women ineach rank by year. Percentages show the proportion of women who were racial minorities out of allactive duty women.Women who were racial minorities are defined as women who identified as Black, Asian, AmericanIndian or Alaska Native, Native Hawaiian or Pacific Islander, or those who selected more than onerace. Service members who selected an unknown race were excluded from the analysis.
Developed by Insight Policy Research for the Defense Advisory Committee on Women in the Services within the Department of Defense undercontract number H9821017C0008, June 2019
Source: Defense Manpower Data Center data on active duty Service members from 2008, 2013, and 2018Notes: A zero with no percentage indicates that there were no women at that rank.Across all years analyzed, there was no WO1 or WO5 rank in the Coast Guard.
Year O1 O2 O3 O4 O5 O6 O7 O8 O9 O10
2008
2013
2018
0125%
211%
211%
287%
749%
19114%
40418%
23023%
19428%
000%
211%
16%
328%
11013%
24817%
53621%
19325%
16827%
0117%
211%
317%
4612%
16719%
28720%
54224%
25128%
23032%
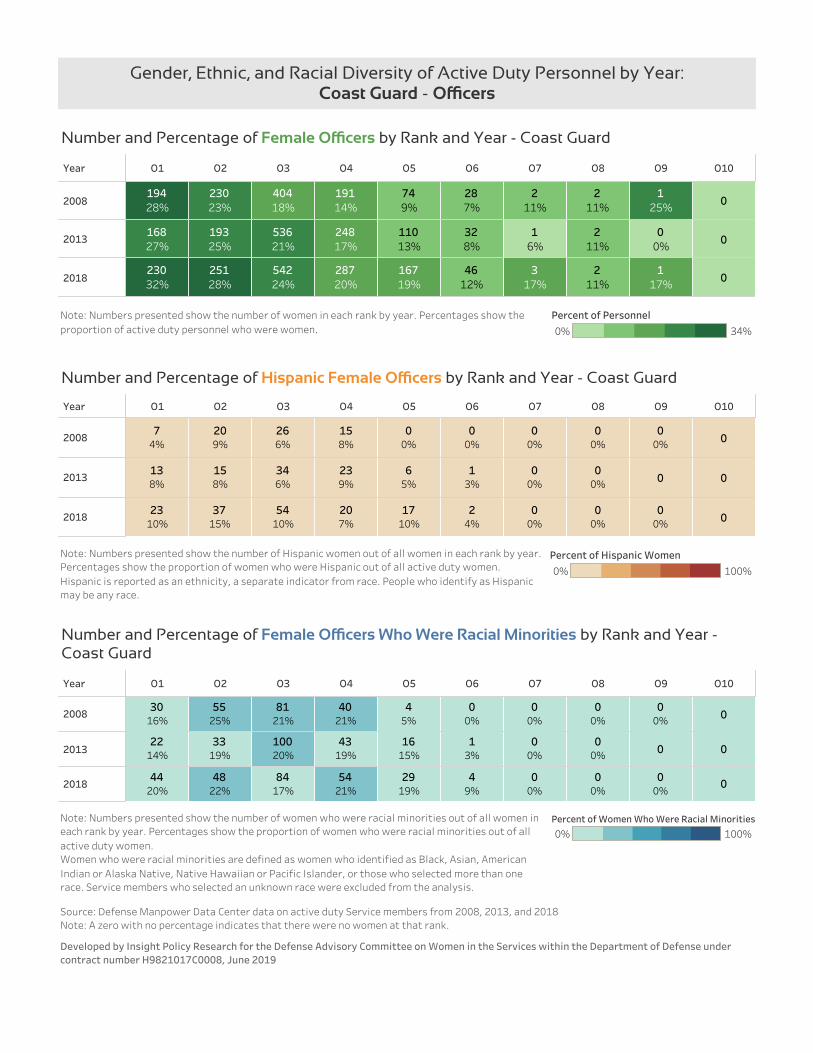
Number and Percentage of Female Ocers by Rank and Year - Coast Guard
Year O1 O2 O3 O4 O5 O6 O7 O8 O9 O10
2008
2013
2018
000%
00%
00%
00%
00%
158%
266%
209%
74%
0000%
00%
13%
65%
239%
346%
158%
138%
000%
00%
00%
24%
1710%
207%
5410%
3715%
2310%
Number and Percentage of Hispanic Female Ocers by Rank and Year - Coast Guard
Year O1 O2 O3 O4 O5 O6 O7 O8 O9 O10
2008
2013
2018
000%
00%
00%
00%
45%
4021%
8121%
5525%
3016%
0000%
00%
13%
1615%
4319%
10020%
3319%
2214%
000%
00%
00%
49%
2919%
5421%
8417%
4822%
4420%
Number and Percentage of Female Ocers Who Were Racial Minorities by Rank and Year -Coast Guard
Note: Numbers presented show the number of women in each rank by year. Percentages show theproportion of active duty personnel who were women.
Gender, Ethnic, and Racial Diversity of Active Duty Personnel by Year:Coast Guard - Ocers
0% 34%
Percent of Personnel
Note: Numbers presented show the number of Hispanic women out of all women in each rank by year.Percentages show the proportion of women who were Hispanic out of all active duty women.Hispanic is reported as an ethnicity, a separate indicator from race. People who identify as Hispanicmay be any race.
0% 100%
Percent of Hispanic Women
0% 100%Percent of Women Who Were Racial MinoritiesNote: Numbers presented show the number of women who were racial minorities out of all women in
each rank by year. Percentages show the proportion of women who were racial minorities out of allactive duty women.Women who were racial minorities are defined as women who identified as Black, Asian, AmericanIndian or Alaska Native, Native Hawaiian or Pacific Islander, or those who selected more than onerace. Service members who selected an unknown race were excluded from the analysis.
Developed by Insight Policy Research for the Defense Advisory Committee on Women in the Services within the Department of Defense undercontract number H9821017C0008, June 2019
Source: Defense Manpower Data Center data on active duty Service members from 2008, 2013, and 2018Note: A zero with no percentage indicates that there were no women at that rank.
Related Documents