ARTICLE Changes in coffee intake and subsequent risk of type 2 diabetes: three large cohorts of US men and women Shilpa N. Bhupathiraju & An Pan & JoAnn E. Manson & Walter C. Willett & Rob M. van Dam & Frank B. Hu Received: 22 October 2013 /Accepted: 21 March 2014 # Springer-Verlag Berlin Heidelberg 2014 Abstract Aims/hypothesis Coffee and tea consumption has been asso- ciated with a lower type 2 diabetes risk but little is known about how changes in coffee and tea consumption influence subsequent type 2 diabetes risk. We examined the associations between 4 year changes in coffee and tea consumption and risk of type 2 diabetes in the subsequent 4 years. Methods We prospectively followed 48,464 women in the Nurses’ Health Study (NHS; 1986–2006), 47,510 women in NHS II (1991–2007) and 27,759 men in the Health Professionals Follow-up Study (HPFS; 1986–2006). Diet was assessed every 4 years using a validated food-frequency questionnaire. Self-reported cases of incident type 2 diabetes were validated by supplementary questionnaires. Results During 1,663,319 person-years of follow-up, we doc- umented 7,269 cases of incident type 2 diabetes. Participants who increased their coffee consumption by more than 1 cup/ day (median change=1.69 cups/day) over a 4 year period had an 11% (95% CI 3%, 18%) lower risk of type 2 diabetes in the subsequent 4 years compared with those who made no chang- es in consumption. Participants who decreased their coffee intake by more than 1 cup/day (median change= −2 cups/day) had a 17% (95% CI 8%, 26%) higher risk for type 2 diabetes. Changes in tea consumption were not associated with type 2 diabetes risk. Conclusions/interpretation Our data provide novel evidence that increasing coffee consumption over a 4 year period is associated with a lower risk of type 2 diabetes, while decreasing coffee consumption is associated with a higher risk of type 2 diabetes in subsequent years. Keywords Caffeinated coffee . Change . Coffee . Decaffeinated coffee . Tea . Type 2 diabetes Abbreviations FFQ Food-frequency questionnaire HPFS Health Professionals Follow-Up Study NHS Nurses’ Health Study Introduction Consumption of coffee and tea has consistently been associated with a lower risk for type 2 diabetes [1–3]. In a Electronic supplementary material The online version of this article (doi:10.1007/s00125-014-3235-7) contains peer-reviewed but unedited supplementary material, which is available to authorised users. S. N. Bhupathiraju : W. C. Willett : F. B. Hu (*) Department of Nutrition, Harvard School of Public Health, 655 Huntington Ave, Boston, MA 02115, USA e-mail: [email protected] A. Pan : R. M. van Dam Saw Swee Hock School of Public Health and Yong Loo Lin School of Medicine, National University of Singapore and National University Health System, Singapore, Republic of Singapore J. E. Manson Division of Preventive Medicine, Brigham and Women’ s Hospital and Harvard Medical School, Boston, MA, USA J. E. Manson : W. C. Willett : F. B. Hu Department of Epidemiology, Harvard School of Public Health, Boston, MA, USA W. C. Willett : F. B. Hu Channing Division of Network Medicine, Brigham and Women’ s Hospital and Harvard Medical School, Boston, MA, USA Diabetologia DOI 10.1007/s00125-014-3235-7

Welcome message from author
This document is posted to help you gain knowledge. Please leave a comment to let me know what you think about it! Share it to your friends and learn new things together.
Transcript
ARTICLE
Changes in coffee intake and subsequent risk of type 2 diabetes:three large cohorts of US men and women
Shilpa N. Bhupathiraju & An Pan & JoAnn E. Manson &
Walter C. Willett & Rob M. van Dam & Frank B. Hu
Received: 22 October 2013 /Accepted: 21 March 2014# Springer-Verlag Berlin Heidelberg 2014
AbstractAims/hypothesis Coffee and tea consumption has been asso-ciated with a lower type 2 diabetes risk but little is knownabout how changes in coffee and tea consumption influencesubsequent type 2 diabetes risk. We examined the associationsbetween 4 year changes in coffee and tea consumption andrisk of type 2 diabetes in the subsequent 4 years.Methods We prospectively followed 48,464 women in theNurses’ Health Study (NHS; 1986–2006), 47,510 women inNHS II (1991–2007) and 27,759men in theHealth ProfessionalsFollow-up Study (HPFS; 1986–2006). Diet was assessed
every 4 years using a validated food-frequency questionnaire.Self-reported cases of incident type 2 diabetes were validatedby supplementary questionnaires.Results During 1,663,319 person-years of follow-up, we doc-umented 7,269 cases of incident type 2 diabetes. Participantswho increased their coffee consumption by more than 1 cup/day (median change=1.69 cups/day) over a 4 year period hadan 11% (95%CI 3%, 18%) lower risk of type 2 diabetes in thesubsequent 4 years compared with those who made no chang-es in consumption. Participants who decreased their coffeeintake by more than 1 cup/day (median change=−2 cups/day)had a 17% (95% CI 8%, 26%) higher risk for type 2 diabetes.Changes in tea consumption were not associated with type 2diabetes risk.Conclusions/interpretation Our data provide novel evidencethat increasing coffee consumption over a 4 year period isassociatedwith a lower risk of type 2 diabetes, while decreasingcoffee consumption is associated with a higher risk of type 2diabetes in subsequent years.
Keywords Caffeinated coffee . Change . Coffee .
Decaffeinated coffee . Tea . Type 2 diabetes
AbbreviationsFFQ Food-frequency questionnaireHPFS Health Professionals Follow-Up StudyNHS Nurses’ Health Study
Introduction
Consumption of coffee and tea has consistently beenassociated with a lower risk for type 2 diabetes [1–3]. In a
Electronic supplementary material The online version of this article(doi:10.1007/s00125-014-3235-7) contains peer-reviewed but uneditedsupplementary material, which is available to authorised users.
S. N. Bhupathiraju :W. C. Willett : F. B. Hu (*)Department of Nutrition, Harvard School of Public Health,655 Huntington Ave, Boston, MA 02115, USAe-mail: [email protected]
A. Pan :R. M. van DamSaw Swee Hock School of Public Health and Yong Loo Lin Schoolof Medicine, National University of Singapore and NationalUniversity Health System, Singapore, Republic of Singapore
J. E. MansonDivision of Preventive Medicine, Brigham and Women’s Hospitaland Harvard Medical School, Boston, MA, USA
J. E. Manson :W. C. Willett : F. B. HuDepartment of Epidemiology, Harvard School of Public Health,Boston, MA, USA
W. C. Willett : F. B. HuChanning Division of Network Medicine, Brigham and Women’sHospital and Harvard Medical School, Boston, MA, USA
DiabetologiaDOI 10.1007/s00125-014-3235-7

meta-analysis of 28 prospective studies, representing1,109,272 participants, every additional cup of caffeinatedand decaffeinated coffee consumed in a day was associatedwith a 9% (95%CI 6%, 11%) and 6% (95%CI 2%, 9%) lowerrisk of type 2 diabetes, respectively [3]. In another meta-analysis, participants who drank more than three to four cupsof tea per day had an 8% lower risk of type 2 diabetes [1].However, because individuals frequently make changes totheir diet, observational studies examining the association ofbaseline coffee consumption with type 2 diabetes risk cannotadequately capture these changes or account for secular trendsin intake. Examining how changes in coffee and tea consump-tion affect risk of type 2 diabetes can provide a more completeunderstanding of the relationships between coffee, tea andtype 2 diabetes. Further, evaluating the association of short-term changes in coffee and tea intake with the occurrence oftype 2 diabetes in subsequent years will help determine howquickly such dietary changes impact diabetes risk. To ourknowledge, no study has examined the association betweenchanges in coffee and tea consumption and risk of type 2diabetes.
We used observational data from three large prospectivestudies, the Nurses’ Health Study (NHS), the NHS II and theHealth Professionals Follow-up Study (HPFS), to examinechanges in coffee and tea intake in relation to risk of type 2diabetes. In all three cohorts, we collected detailed informa-tion on diet, lifestyle, medical conditions and other chronicdiseases every 2 to 4 years for over 20 years. The availabilityof these repeated measures and the long duration of follow-upallowed us to evaluate 4 year changes in coffee and tea intakein relation to risk of type 2 diabetes in the next 4 years. Wealso examinedwhether the association with diabetes incidencediffered between changes in caffeinated and decaffeinatedcoffee intake. Finally, we evaluated the long-term associationsof changes in coffee and tea intake by examining changesfrom baseline to the first 4 years of follow-up in relation to riskof type 2 diabetes in the subsequent 12 (in the NHS II) and16 years (in the NHS and HPFS) of follow-up.
Methods
Study population The NHS was initiated in 1976 as a pro-spective cohort study of 121,701 female registered nurses, 30–55 years of age, from 11 US states. The NHS II consists of116,681 younger female registered nurses, aged 25–42 yearsat baseline (1989). The HPFS is a prospective cohort study of51,529 male health professionals, 40–75 years of age, from all50 states, that began in 1986. Cohort members received val-idated questionnaires at baseline and every 2 years thereafterto update their information on medical history, lifestyle, po-tential risk factors and disease diagnosis [4–8].
For the current investigation, we used 1986 for the NHS(n=80,332) and HPFS (n=38,842), and 1991 for the NHS II(n=87,448), as our baseline when we first obtained detailedinformation on diet and lifestyle. Because our primary expo-sure was 4 year change in coffee and tea intake, we excludedparticipants with a history of diabetes (including type 1 dia-betes, type 2 diabetes and gestational diabetes), cardiovasculardisease or cancer 4 years after baseline (1990 for the NHS andHPFS and 1995 for the NHS II; n=28,739) because changesin diet after development of these conditions may confoundthe relationship between diet and disease [9]. We also exclud-ed women who were pregnant during follow-up (n=23,519).We excluded participants with ≥10 food items blank, thosewith implausible energy intakes at baseline (<3,347 or>17,573 kJ/day for men and <2,092 or >14,644 kJ/day forwomen) and those participants who died before the baseline(n=26,061). We also excluded participants with missing in-formation on dietary and lifestyle covariables and those whoreturned only the baseline questionnaire (n=4,570). The finalstudy population consisted of 48,464 women in the NHS,47,510 women in the NHS II and 27,759 men in the HPFSwith complete information. The study was approved by theinstitutional review boards of Brigham andWomen’s Hospitaland Harvard School of Public Health. All participants gaveinformed consent.
Ascertainment of diet In the NHS and HPFS, diet wasassessed in 1986 using an 126 item semi-quantitative food-frequency questionnaire (FFQ). In NHS II, diet was firstassessed in 1991 using a similar FFQ. In all three cohorts,subsequent FFQs were administered every 4 years to updateinformation on diet. In all FFQs, participants were asked howoften, on average (from ‘never’ to ‘≥6 times/day’) during theprevious year they had consumed caffeinated and decaffein-ated coffee (‘one cup’) and tea (‘one cup or glass’). Decaf-feinated tea consumption was first ascertained in 1998 in NHSand HPFS and in 1995 in NHS II and was therefore notincluded in our analyses. The validity and reproducibility ofthe FFQs have been described in detail elsewhere [10–12]. Ina validation study conducted among a subsample of the NHSparticipants, FFQ assessments of coffee and tea were highlycorrelated with diet record assessments (coffee, r=0.78; tea,r=0.93) [11]. Similar correlation coefficients were found in avalidation study conducted in a subsample of the HPFS par-ticipants [13].
Ascertainment of type 2 diabetes The primary endpoint forthis study was incident type 2 diabetes. Participants whoreported a diagnosis of type 2 diabetes on the biennial mainquestionnaire were sent a supplementary questionnaire re-garding symptoms, diagnostic tests and hypoglycaemic ther-apy. We used the National Diabetes Data Group criteria [14]for cases identified before 1998 and the American Diabetes
Diabetologia

Association criteria [15] for cases identified after 1998. Thevalidity of the supplementary questionnaire has beenestablished in two previous studies in the NHS and HPFSthrough medical record reviews. In both studies, diagnosis oftype 2 diabetes was confirmed in more than 98% of the cases[16, 17].
Ascertainment of covariates In the biennial follow-up ques-tionnaires, we updated information on a participant’s age,weight, smoking status, physical activity, menopausal statusand use of postmenopausal hormone therapy (for women),oral contraceptive use (for women) and personal history ofchronic diseases. Height was ascertained at baseline in eachcohort. The presence or absence of a family history of diabetes(in first-degree relatives) was assessed in: 1982 and 1988 inthe NHS; 1989, 1997, 2001 and 2005 in the NHS II; and 1987in the HPFS. Information on intake of alcohol and otherbeverages was updated every 4 years using the FFQ. We usedthe Alternate Healthy Eating Index 2010 as an overall measureof diet quality of study participants [18].
Statistical analysis We used changes in coffee and tea con-sumption that were updated every 4 years to predict risk oftype 2 diabetes in the subsequent 4 years. Participants weredivided into categories of: no change (±1 cup/week); small tomoderate increase or decrease (±1 cup/week to 1 cup/day);and moderate to large increase or decrease in consumption (>1cup/day). We calculated each individual’s person-time fromthe return of the baseline questionnaire to the date of diagnosisof type 2 diabetes, death, date of loss to follow-up or the cut-off date (30 June 2006 in the NHS, 30 June 2007 in the NHS IIand 1 January 2006 in the HPFS), whichever occurred first.
We used Cox proportional hazard models with time-varying covariates and age as the underlying time scale forall analyses. Our first multivariable model adjusted for severallifestyle factors, including race, family history of diabetes,menopausal status and postmenopausal hormone use (womenonly), oral contraceptive use (women only), history of hyper-tension and hypercholesterolaemia (updated every 2 years)and change in smoking status during the 4 year period (neverto never, never to current, past to current, current to past,current to current, missing indicator). For each 4 year timeperiod, we adjusted for baseline and 4 year changes in phys-ical activity (quintiles), intake of alcohol (quintiles) and otherbeverages (including sugar-sweetened beverages, artificiallysweetened beverages, punch; quantiles). Changes in coffeeand tea consumption were mutually adjusted. Because thosewith poor or worsening health are more likely to visit theirphysician, we additionally adjusted for a history of physicalexamination in the last cycle. Because changes in caffeineintake were previously associated with weight gain [19] and toassess if BMI and weight change are potential mediators orconfounders of the association between changes in coffee and
tea intake and type 2 diabetes, we further included baselineBMI (<21, 21–22.9, 23–24.9, 25–26.9, 27–29.9, 30–34.9, 35–39.9 and ≥40 kg/m2) and 4 year weight change (quintiles) inour multivariable-adjusted model.
We also examined the associations of 4 year changes incaffeinated and decaffeinated coffee, separately, on risk oftype 2 diabetes. Caffeinated and decaffeinated coffee intakeswere mutually adjusted. In sensitivity analyses, we examinedthe long-term effects of changes in coffee and tea intake onrisk of type 2 diabetes. Specifically, we calculated changes incoffee and tea intake from baseline to the first 4 years offollow-up (1986 to 1990 in the NHS and HPFS; 1991 to1995 in the NHS II) to predict risk of type 2 diabetes in thesubsequent years of follow-up (1990 to 2006 in the NHS andHPFS; 1995 to 2007 in the NHS II). Because participants whoare at risk for cardiovascular disease or cancer are more likelyto make changes to their coffee and tea intake, in sensitivityanalyses, we censored incident cases of cardiovascular diseaseand cancer during follow-up and then examined the associa-tion between 4 year changes in coffee and tea intake and riskof type 2 diabetes. We also tested for potential effect modifi-cation by current smoking status, presence of hypertensionand hypercholesterolaemia, baseline BMI and changes inweight.
Because of differences in sex, follow-up time and ques-tionnaires in the three cohorts, all analyses were performedseparately in each cohort to achieve better control of con-founding. For the primary analyses, to obtain overall estimatesfor both sexes and to increase statistical power, the HRs fromthe multivariable-adjusted models from the three cohorts werecombined with the use of an inverse variance-weighted meta-analysis by the random-effects model which accounts forheterogeneity between studies [20]. All statistical tests weretwo-sided and performed using SAS version 9.2 for UNIX(SAS Institute, Cary, NC, USA).
Results
During 1,663,319 person-years of follow-up, we documented7,269 incident cases of type 2 diabetes. Age-adjusted baselinecharacteristics according to categories of 4 year changes intotal coffee consumption are presented in electronic supple-mentary material (ESM) Table 1. In all three cohorts, com-pared with those who had relatively stable coffee consumptionpatterns, those who made the largest decreases in coffeeconsumption had higher initial intakes of total coffee andalcohol, were more likely to be older and had greater weightgain over a 4 year period. In the HPFS and NHS II, theseindividuals also had higher initial intakes of total coffee andalcohol. Age-adjusted baseline characteristics according tocategories of 4 year changes in total tea consumption are
Diabetologia

Table 1 HRs and 95% CIs for incident type 2 diabetes according to updated 4 year changes in coffee and tea intake
Intake/study Changes in frequency of consumption HR per 1 serving
Moderate tolarge decrease(>1 cup/day)
Small to moderatedecrease (1 cup/week–1 cup/day)
No change(±1 cup/week)a
Small to moderateincrease (1 cup/week–1 cup/day)
Moderate to largeincrease (>1 cup/day)
Coffee
HPFS
n 4,318 3,451 13,833 3,050 3,107
Cases/person-years 317/61,343 199/49,540 818/198,710 182/44,571 188/45,520
Multivariable adjusted 1b 1.22 (1.05, 1.43) 0.88 (0.75, 1.04) 1.00 0.92 (0.78, 1.09) 0.97 (0.82, 1.14) 0.94 (0.90, 0.99)
Multivariable adjusted 2c 1.22 (1.05, 1.42) 0.91 (0.77, 1.07) 1.00 0.92 (0.78, 1.10) 0.93 (0.79, 1.10) 0.94 (0.89, 0.98)
NHS
n 9,372 6,343 23,224 4,545 4,980
Cases/person-years 654/137,935 449/93,692 1,745/343,597 343/67,890 291/74,601
Multivariable adjusted 1b 1.17 (1.06, 1.30) 0.98 (0.88, 1.09) 1.00 1.04 (0.92, 1.16) 0.84 (0.74, 0.96) 0.94 (0.91, 0.97)
Multivariable adjusted 2c 1.17 (1.05, 1.29) 0.99 (0.89, 1.11) 1.00 1.05 (0.94, 1.18) 0.86 (0.76, 0.98) 0.95 (0.92, 0.98)
NHS II
n 7,132 5,214 25,536 4,786 4,841
Cases/person-years 278/80,074 236/59,562 1,201/293,809 195/55,872 173/56,604
Multivariable adjusted 1b 1.16 (0.99, 1.36) 0.96 (0.82, 1.13) 1.00 0.86 (0.73, 1.01) 0.86 (0.73, 1.02) 0.94 (0.90, 0.99)
Multivariable adjusted 2c 1.10 (0.94, 1.30) 0.94 (0.80, 1.11) 1.00 0.90 (0.76, 1.06) 0.90 (0.76, 1.07) 0.97 (0.92, 1.01)
Pooledd
Multivariable adjusted 1b 1.18 (1.10, 1.28) 0.95 (0.88, 1.03) 1.00 0.95 (0.84, 1.06) 0.88 (0.81, 0.96) 0.94 (0.92, 0.96)
Multivariable adjusted 2c 1.17 (1.08, 1.26) 0.96 (0.89, 1.04) 1.00 0.97 (0.87, 1.08) 0.89 (0.82, 0.97) 0.95 (0.93, 0.97)
Tea
HPFS
n 1,375 3,510 18,735 3,016 1,123
Cases/person-years 84/19,634 229/50,421 1,125/269,457 187/43,859 79/16,313
Multivariable adjusted 1b 1.00 (0.78, 1.30) 1.10 (0.91, 1.33) 1.00 1.03 (0.88, 1.21) 1.20 (0.94, 1.53) 1.02 (0.95, 1.10)
Multivariable adjusted 2c 0.94 (0.73, 1.22) 1.10 (0.91, 1.32) 1.00 1.03 (0.88, 1.21) 1.15 (0.90, 1.46) 1.02 (0.95, 1.10)
NHS
n 3,467 7,159 29,011 5,991 2,836
Cases/person-years 256/51,164 548/105,883 2,076/429,649 395/88,888 207/42,131
Multivariable adjusted 1b 1.06 (0.90, 1.25) 1.04 (0.92, 1.17) 1.00 0.90 (0.81, 1.01) 1.06 (0.91, 1.23) 0.98 (0.94, 1.02)
Multivariable adjusted 2c 1.02 (0.87, 1.20) 1.00 (0.89, 1.12) 1.00 0.90 (0.80, 1.00) 1.01 (0.87, 1.18) 0.98 (0.94, 1.02)
NHS II
n 4,530 8,953 23,211 7,440 3,376
Cases/person-years 223/51,672 432/102,393 957/266,493 325/86,328 146/39,034
Multivariable adjusted 1b 1.18 (0.96, 1.44) 1.19 (1.03, 1.37) 1.00 1.05 (0.92, 1.20) 0.95 (0.79, 1.15) 0.96 (0.91, 1.00)
Multivariable adjusted 2c 1.12 (0.92, 1.37) 1.18 (1.02, 1.36) 1.00 1.05 (0.92, 1.20) 0.94 (0.78, 1.13) 0.96 (0.92, 1.00)
Pooledd
Multivariable adjusted 1b 1.08 (0.97, 1.22) 1.10 (1.01, 1.19) 1.00 0.98 (0.89, 1.09) 1.05 (0.94, 1.17) 0.98 (0.95, 1.01)
Multivariable adjusted 2c 1.03 (0.92, 1.16) 1.08 (0.97, 1.20) 1.00 0.98 (0.88, 1.09) 1.01 (0.91, 1.12) 0.98 (0.95, 1.01)
a Reference categorybAdjusted for age, family history of diabetes (yes/no), race (white/non-white), postmenopausal hormone use (premenopausal, postmenopausal currentuser, postmenopausal never/past user, missing), physical examination in the previous cycle (yes/no), change in smoking status (never to never, never tocurrent, current to current, current to past, past to current, past to past), baseline alcohol intake (0, 0.1–4.9, 5–9.9, 10–14.9, ≥15 g/day), change in alcoholintake (quintiles), baseline physical activity (<3, 3–8.9, 9–17.9, 18–26.9, ≥27 metabolic equivalents of task (METS)/week), change in physical activity(quintiles), history of hypertension and hypercholesterolaemia (yes/no), baseline and 4 year changes in beverage intake (quantiles; beverages includesugar-sweetened beverages, artificially sweetened beverages, punch, milk, coffee/tea depending on the model), baseline Alternate Healthy Eating Indexscore, and change in Alternate Healthy Eating Index scorecMultivariablemodel 1 + baseline BMI (<21, 21–22.9, 23–24.9, 25–26.9, 27–29.9, 30–34.9, 35–39.9, ≥40 kg/m2 ) and change in bodyweight (quintiles)d The results across the three cohorts were pooled using an inverse variance-weighted random-effects meta-analysis
Diabetologia

shown in ESM Table 2. In all three cohorts, participants whochanged their tea consumption the most had higher baselinetea consumption. In the NHS and NHS II, these participantsalso had lower initial intakes of total coffee. The Pearsoncorrelation coefficient for total coffee intake between twoadjacent FFQ years was ~0.7 (p<0.0001) in all three cohorts.For total tea, the correlation was ~0.6 (p<0.0001) in the NHS,NHS II and HPFS.
The HRs and 95% CIs for type 2 diabetes associated with4 year changes in coffee and tea consumption are presented inTable 1. Compared with those who made no changes to theircoffee consumption, participants who had moderate to largeincreases in intake (>1 cup/day) over a 4 year period had a12% lower risk (95% CI 4%, 19%) for type 2 diabetes in thenext 4 years. Further adjustment for baseline BMI and con-current weight change only slightly attenuated these results(11% lower risk; 95% CI 3%, 18%). In pooled analyses, forthose with moderate to large decreases in coffee consumption(>1 cup/day) there was a 17% higher risk (95% CI 8%, 26%)for type 2 diabetes. There was no association between updated4 year changes in tea intake and subsequent risk for type 2diabetes (Table 1).
Table 2 shows the HR for type 2 diabetes by change indifferent type of coffee consumption. Participants whohad moderate to large increases in caffeinated coffee con-sumption (>1 cup/day) had a 13% lower risk (95% CI 5%,21%) for type 2 diabetes compared with those who hadrelatively stable caffeinated coffee consumption over a4 year period. Furthermore, those who had moderate tolarge decreases in their caffeinated coffee consumptionhad a 20% higher risk (95% CI 10%, 30%) for type 2diabetes in the subsequent 4 years. Changes in decaffein-ated coffee consumption were not associated with risk fortype 2 diabetes (Table 2).
The HRs for type 2 diabetes by initial and 4 yearcoffee consumption categories are presented in Fig. 1.Compared with those who were stable low consumers(<1 cup/day at baseline and 4 years later, referencegroup), those who were low consumers but increasedtheir coffee consumption to more than 3 cups per dayhad a non-significantly lower risk for type 2 diabetes(HR 0.77; 95% CI 0.55, 1.08). The high-stable con-sumers had the lowest risk, a 37% lower risk (95% CI−44%, −28%) compared with the low-stable consumers.No significant associations were observed for tea con-sumption categories and risk of type 2 diabetes. Wefound no statistically significant effect modification bycurrent smoking status, presence of hypertension andhypercholesterolaemia, baseline BMI, and changes inweight (p for interaction>0.05).
To examine the long-term associations of changes in coffeeand tea intake on type 2 diabetes risk, we used changes incoffee and tea consumption from baseline to the first 4 years of
follow-up to predict risk for type 2 diabetes in the subsequent12 years (in the NHS II) and 16 years (in the NHS and HPFS)of follow-up (ESMTable 3). In pooled multivariable analyses,participants who had moderate to large increases in totalcoffee consumption had a 13% lower risk (95% CI 5%,21%) for type 2 diabetes compared with those who hadrelatively stable intakes. Conversely, decreasing coffee con-sumption by more than 1 cup per day was not associated withan increased risk for type 2 diabetes (HR 1.09; 95% CI 0.92,1.30).
In the sensitivity analysis, we censored participants diag-nosed with cardiovascular disease or cancer during follow-up(ESM Table 4). Participants with moderate to large increasesin coffee consumption had an 11% lower risk (95% CI 3%,19%) for type 2 diabetes compared with stable drinkers.Furthermore, those who had moderate to large decreases inintake had an 18% higher risk (95% CI 9%, 28%). Similar toour primary analysis, there were no significant associationswith changes in tea intake.
Discussion
In these three large prospective cohorts with more than 1.6million person-years of follow-up, we observed that increas-ing intake of coffee, but not tea, over a 4 year period wasassociated with a lower type 2 diabetes risk in the next 4 years.Decreasing coffee intake was associated with a higher risk oftype 2 diabetes. These changes in risk were observed forcaffeinated, but not decaffeinated, coffee and were indepen-dent of initial coffee consumption and 4 year changes in otherdietary and lifestyle factors.
A previous meta-analysis of prospective cohort studieshas confirmed a clear inverse relation between coffeeconsumption and risk of type 2 diabetes; a 7% risk reduc-tion was seen for every additional cup of coffee consumedper day [1]. In addition, our most recent findings from theNHS and HPFS also support a protective role of bothcaffeinated and decaffeinated coffee against the develop-ment of type 2 diabetes [21]. The findings of the currentstudy not only confirm these previous reports but alsodemonstrate that change in coffee consumption is associ-ated with both immediate and long-term diabetes risk.While randomised controlled trials are ideal to addressthe true causal relationship between changes in coffeeand risk of type 2 diabetes, such studies are difficult toconduct given the long follow-up time needed for thedevelopment of type 2 diabetes, high costs, uncertaintyregarding the ideal intervention period and the possibilityof large attrition in adherence to the assigned beverage.Our study design can, to some extent, address these meth-odological difficulties by taking advantage of the large
Diabetologia

Table 2 HRs and 95% CIs for incident type 2 diabetes according to updated 4 year changes in caffeinated and decaffeinated coffee intake
Intake/study Changes in frequency of coffee consumption
Moderate tolarge decrease(>1 cup/day)
Small to moderatedecrease (1 cup/week–1 cup/day)
No change(±1 cup/week)a
Small to moderateincrease (1 cup/week–1 cup/day)
Moderate to largeincrease (>1 cup/day)
Caffeinated coffee
HPFS
n 3,515 2,141 17,118 2,191 2,794
Cases/person-years 260/50,252 141/30,340 1,005/246,171 138/31,963 160/40,959
Multivariable adjusted 1b 1.29 (1.09, 1.54) 1.05 (0.85, 1.30) 1.00 1.05 (0.86, 1.26) 0.97 (0.81, 1.16) 0.93 (0.89, 0.98)
Multivariable adjusted 2c 1.28 (1.08, 1.53) 1.01 (0.82, 1.26) 1.00 1.02 (0.84, 1.23) 0.91 (0.76, 1.10) 0.92 (0.88, 0.97)
NHS
n 7,600 3,394 28,872 2,901 4,596
Cases/person-years 512/112,119 276/49,568 2,190/443,893 261/43,205 243/68,931
Multivariable adjusted 1b 1.18 (1.05, 1.33) 1.02 (0.88, 1.18) 1.00 1.17 (1.02, 1.34) 0.81 (0.70, 0.93) 0.94 (0.91, 0.98)
Multivariable adjusted 2c 1.18 (1.04, 1.33) 0.99 (0.85, 1.14) 1.00 1.14 (1.00, 1.31) 0.81 (0.70, 0.93) 0.95 (0.91, 0.98)
NHS II
n 6,421 3,196 29,873 3,425 4,595
Cases/person-years 243/72,453 180/35,709 1,342/344,074 155/39,889 163/53,795
Multivariable adjusted 1b 1.21 (1.02, 1.44) 1.02 (0.84, 1.23) 1.00 1.01 (0.85, 1.21) 0.91 (0.76, 1.09) 0.95 (0.91, 1.00)
Multivariable adjusted 2c 1.15 (0.97, 1.38) 0.97 (0.80, 1.18) 1.00 1.01 (0.84, 1.20) 0.93 (0.78, 1.11) 0.97 (0.92, 1.02)
Pooledd
Multivariable adjusted 1b 1.21 (1.11, 1.32) 1.02 (0.92, 1.14) 1.00 1.09 (0.99, 1.20) 0.88 (0.79, 0.98) 0.94 (0.92, 0.97)
Multivariable adjusted 2c 1.20 (1.10, 1.30) 0.99 (0.89, 1.09) 1.00 1.07 (0.97, 1.18) 0.87 (0.79, 0.95) 0.95 (0.92, 0.97)
Decaffeinated coffee
HPFS
n 1,925 2,794 19,307 2,282 1,451
Cases/person-years 129/27,687 150/40,236 1,193/277,172 138/33,328 94/21,261
Multivariable adjusted 1b 1.16 (0.93, 1.45) 0.99 (0.80, 1.22) 1.00 0.91 (0.76, 1.09) 0.97 (0.78, 1.21) 0.96 (0.90, 1.03)
Multivariable adjusted 2c 1.12 (0.90, 1.40) 1.01 (0.82, 1.25) 1.00 0.95 (0.79, 1.15) 0.96 (0.77, 1.21) 0.96 (0.90, 1.03)
NHS
n 4,360 5,020 32,313 3,730 3,042
Cases/person-years 272/64,830 345/74,308 2,420/477,442 254/55,573 191/45,563
Multivariable adjusted 1b 0.98 (0.84, 1.13) 1.04 (0.91, 1.19) 1.00 0.90 (0.79, 1.03) 0.93 (0.80, 1.09) 0.95 (0.91, 0.99)
Multivariable adjusted 2c 0.96 (0.82, 1.11) 1.02 (0.90, 1.17) 1.00 0.94 (0.82, 1.07) 0.95 (0.82, 1.11) 0.97 (0.92, 1.01)
NHS II
n 2,134 4,721 35,296 3,642 1,717
Cases/person-years 63/24,596 180/54,079 1,666/404,713 121/42,485 53/20,048
Multivariable adjusted 1b 1.25 (0.85, 1.85) 0.93 (0.79, 1.10) 1.00 0.71 (0.59, 0.86) 0.75 (0.56, 0.99) 0.89 (0.81, 0.97)
Multivariable adjusted 2c 1.19 (0.81, 1.76) 0.98 (0.82, 1.15) 1.00 0.78 (0.65, 0.95) 0.88 (0.67, 1.17) 0.94 (0.86, 1.03)
Pooledd
Multivariable adjusted 1b 1.07 (0.92, 1.23) 0.99 (0.91, 1.09) 1.00 0.84 (0.72, 0.98) 0.90 (0.80, 1.02) 0.94 (0.91, 0.98)
Multivariable adjusted 2c 1.02 (0.91, 1.15) 1.01 (0.92, 1.10) 1.00 0.90 (0.80, 1.00) 0.94 (0.84, 1.06) 0.96 (0.93, 1.00)
a Reference categorybAdjusted for age, family history of diabetes (yes/no), race (white/non-white), postmenopausal hormone use (premenopausal, postmenopausal currentuser, postmenopausal never/past user, missing), physical examination in the previous cycle (yes/no), change in smoking status (never to never, never tocurrent, current to current, current to past, past to current, past to past) baseline alcohol intake (0, 0.1–4.9, 5–9.9, 10–14.9, ≥15 g/day), change in alcoholintake (quintiles), baseline physical activity (<3, 3–8.9, 9–17.9, 18–26.9, ≥27 metabolic equivalents of task (METS)/week), change in physical activity(quintiles), history of hypertension and hypercholesterolaemia (yes/no), baseline and 4 year changes in beverage intake (quintiles or tertiles; beveragesinclude sugar-sweetened beverages, artificially sweetened beverages, punch, milk, tea, caffeinated coffee/decaffeinated coffee depending on the model),baseline Alternate Healthy Eating Index score, and change in Alternate Healthy Eating Index scorecMultivariablemodel 1 + baseline BMI (<21, 21–22.9, 23–24.9, 25–26.9, 27–29.9, 30–34.9, 35–39.9, ≥40 kg/m2 ) and change in bodyweight (quintiles)d The results across the three cohorts were pooled using an inverse variance-weighted random-effects meta-analysis
Diabetologia

follow-up period and the availability of repeated measuresof diet in our cohorts.
The higher risk of type 2 diabetes associated with decreas-ing coffee intake may represent a true change in risk or maypotentially reflect reverse causation, whereby those with med-ical conditions associated with risk for type 2 diabetes (e.g.hypertension, elevated cholesterol, cardiovascular disease,cancer) may reduce their coffee consumption after diagnosis.However, when we censored participants who developedcardiovascular disease or cancer during follow-up, our resultsremained largely unchanged. Further, adjustment for hyper-tension and high cholesterol in our statistical models did notattenuate the association. When we examined the changes inthe different types of coffee in relation to type 2 diabetes risk,only changes in caffeinated coffee consumption were associ-ated with a reduced type 2 diabetes risk. Given the lowconsumption of decaffeinated coffee and the small proportionof participants who made substantial changes to their decaf-feinated coffee consumption habits, the power to detect asso-ciations with changes in decaffeinated coffee could be limited.However, similar to our previous findings [21], we observed
that initial decaffeinated coffee was independently associatedwith a reduced risk for type 2 diabetes (data not shown).
Our study showed that the association between increasingcoffee consumption and a lower risk of type 2 diabetes in theshort term (4 years) persists in the long term. When we usedbaseline 4 year changes in coffee intake to predict risk for type2 diabetes in the entire follow-up, the risk reduction in type 2diabetes associated with increasing coffee consumption (HR,0.87; 95% CI 0.79, 0.95) was similar to that in our primaryanalysis (HR 0.89; 95% CI 0.82, 0.97). However, unlike inour primary analysis, we did not document a higher risk oftype 2 diabetes incidence with decreases in coffee intake,possibly because the analysis using baseline changes is lessprone to reverse causation. Further, because this analysis doesnot take into account changes in coffee intake during the 4 yearfollow-up intervals, it is possible that those who increasedtheir coffee consumption during the first 4 years had stablehigher intakes in the subsequent years. On the other hand, itmay be that decreases in coffee consumption in the first 4 yearswere more temporary and the associations were attenuated bysubsequent increases in intake during follow-up. Our jointanalysis of initial and coffee consumption 4 years later dem-onstrates that regardless of initial coffee consumption, increas-ing intake over 4 years is associated with a lower risk for type2 diabetes. As expected, those who maintained high intakes atboth baseline and 4 years later had the lowest risk for type 2diabetes. For participants who changed from high to moderatelevels, the protective association was maintained but wassomewhat lower compared with those who had consistentlyhigh intakes.
Our data are largely consistent with findings from a16 week randomised trial in which both caffeinated and de-caffeinated coffee consumption was associated with modestdecreases in post-load glucose levels [22]. In an 8 week inter-vention study, coffee consumption increased levels ofadiponectin, an insulin-sensitising adipokine, but did notchange measures of glycaemia or insulin sensitivity [23].Our findings confirm results from a recent meta-analysis ofprospective studies that documented 9% and 6% risk reduc-tions for each additional cup of caffeinated and decaffeinatedcoffee, respectively [3]. In our change analysis, each addition-al cup of coffee was associated with a 5% lower risk of type 2diabetes. Although the meta-analysis by Huxley et al [1]reported an inverse association between tea and type 2 diabe-tes risk, we found no evidence of an association between4 year increase in tea consumption and subsequent risk oftype 2 diabetes. This finding may have been due to therelatively low number of participants who made significantchanges to their tea consumption over a 4 year period, therebylimiting the statistical power to detect true associations. Theoverall low levels of tea consumption in this group may alsobe responsible for these findings. Our inability to differentiatebetween the various types of tea (green, black, other types)
0
0.2
0.4
0.6
0.8
1
1.2
1.4
Low Medium High
Low Medium High0
0.2
0.4
0.6
0.8
1
1.2
1.4
1.6
HR
Baseline coffee intake
aH
R
Baseline tea intake
b
Fig. 1 HRs (and 95% CIs) for type 2 diabetes according to updated4 year changes in intake of (a) coffee and (b) tea. Low intake was definedas <1 cup per day; medium intake, 1–3 cups per day; and high intake, >3cups per day. The vertical bars represent coffee or tea consumption 4 yearslater; black bars, low intake; white bars, medium intake; and grey bars,high intake (>3 cups per day). The reference group (HR 1.00) was the lowintake level at both baseline and the 4 year follow-up visits. The resultsacross the three cohorts were pooled using an inverse variance-weightedrandom-effects meta-analysis
Diabetologia

which have differential associations with type 2 diabetes risk[24] may have caused non-differential misclassification, bias-ing our results toward the null. Alternatively, it may be thatchanges in tea consumption are not associated with type 2diabetes risk.
Our study has several strengths. The large sample size, thelong follow-up period and presence of repeated dietary andcovariable data are unique strengths in our study. Given theavailability of repeated dietary information, we were able toassess the associations of dynamic changes in coffee and teaintake, independent of initial intake, with type 2 diabetes risk.However, our results need to be interpreted in the context of afew limitations. First, the participants in our study may bedissimilar to those in the general population because our studypopulations consisted of health professionals of primarilyEuropean ancestry. However, the high educational status ofour study participants can be advantageous because reliableand valid dietary and questionnaire data can be captured [25].Moreover, biological effects of coffee consumption on thedevelopment of type 2 diabetes are likely to be similar acrosssocioeconomic groups and the results of our coffee-changeanalysis are consistent with results for initial coffee consump-tion and diabetes risk in a meta-analysis of cohorts including awide variety of populations. Second, although we were able tocarefully adjust for known dietary and lifestyle risk factors,residual confounding is of concern. For example, althoughsleep and depression are confounders of the association be-tween changes in beverage intake and type 2 diabetes, thesefactors were not measured at all cycles. Further, while weadjusted for hypertension, other unmeasured potential ill-nesses that can change beverage consumption can confoundthe association between changes in coffee and tea intake andsubsequent risk of type 2 diabetes. Third, dietary informationwas self-reported and assessed by FFQs. Therefore, somemeasurement error and misclassification is inevitable. How-ever, the FFQs used in these studies were validated againstmultiple diet records [10, 13]. Further, any measurement erroris likely to be non-differential and therefore will attenuateassociations toward the null. Fourth, because diet wasassessed only every 4 years, we do not know when duringthe 4 year period participants made changes to their coffee andtea intake.
In conclusion, in this large study of US men and women,we found that increasing coffee consumption was associatedwith a lower type 2 diabetes risk. On the other hand, decreas-ing coffee consumption by the same amount was associatedwith higher diabetes risk in subsequent years. Changes incoffee consumption habit appear to affect diabetes risk in arelatively short amount of time. Our findings confirm those ofprospective studies that higher coffee consumption is associ-ated with a lower type 2 diabetes risk, and provide novelevidence that changes in coffee consumption habit is relatedto diabetes risk.
Acknowledgements We are indebted to the participants in the NHS,NHS II and HPFS for their continuing outstanding support and colleaguesworking in these studies for their valuable help.
Funding This study was funded by research grants P01 CA87969, P01CA055075, R01 HL034594 and HL60712 from the National Institutes ofHealth. The work of SNB was supported by a postdoctoral fellowshipgrant from the American Heart Association (grant number13POST14370012).
Duality of interest RMvD received grant funding from Nestec for arandomised trial of the effects of coffee consumption on insulin sensitiv-ity. Nestec is a broad food company that also sells coffee. This is grantfunding specific for that project with a contractual agreement that ensuresthat the company cannot influence the design of the study or decision topublish the results. This funding does not in any way affect the currentstudy. Other authors declare that there is no duality of interest associatedwith this manuscript.
Contribution statement SNB analysed the data and drafted the paper.AP, WCW, JEM, RMvD and FBH contributed to the conception anddesign of the study and acquisition of the data. All authors contributed tothe interpretation of data and critical revision of the manuscript andapproved the final version. SNB and FBH share primary responsibilityfor the final content.
References
1. Huxley R, Lee CM, Barzi F et al (2009) Coffee, decaffeinatedcoffee, and tea consumption in relation to incident type 2 diabetesmellitus: a systematic review with meta-analysis. Arch Intern Med169:2053–2063
2. van Dam RM, Hu FB (2005) Coffee consumption and risk of type 2diabetes: a systematic review. JAMA 294:97–104
3. Ding M, Bhupathiraju SN, Chen M, van Dam RM, Hu FB (2014)Caffeinated and decaffeinated coffee consumption and risk of type 2diabetes: a systematic review and a dose-response meta-analysis.Diabetes Care 37:569–586
4. Belanger C, Speizer FE, Hennekens CH, Rosner B,Willett W, Bain C(1980) The nurses’ health study: current findings. Am JNurs 80:1333
5. Belanger CF, Hennekens CH, Rosner B, Speizer FE (1978) TheNurses’ Health Study. Am J Nurs 78:1039–1040
6. Colditz GA, Manson JE, Hankinson SE (1997) The Nurses’ HealthStudy: 20-year contribution to the understanding of health amongwomen. J Women's Health 6:49–62
7. Mozaffarian D, Hao T, Rimm EB, Willett WC, Hu FB (2011)Changes in diet and lifestyle and long-term weight gain in womenand men. N Engl J Med 364:2392–2404
8. Rimm EB, Giovannucci EL, Willett WC et al (1991) Prospectivestudy of alcohol consumption and risk of coronary disease in men.Lancet 338:464–468
9. Hu FB, Stampfer MJ, Rimm E et al (1999) Dietary fat and coronaryheart disease: a comparison of approaches for adjusting for totalenergy intake and modeling repeated dietary measurements.Am J Epidemiol 149:531–540
10. Rimm EB, Giovannucci EL, Stampfer MJ, Colditz GA, Litin LB,Willett WC (1992) Reproducibility and validity of an expanded self-administered semiquantitative food frequency questionnaire amongmale health professionals. Am J Epidemiol 135:1114–1126, discus-sion 1127-1136
11. Salvini S, Hunter DJ, Sampson L et al (1989) Food-based validationof a dietary questionnaire: the effects of week-to-week variation infood consumption. Int J Epidemiol 18:858–867
Diabetologia

12. Willett WC, Sampson L, Stampfer MJ et al (1985) Reproducibilityand validity of a semiquantitative food frequency questionnaire.Am J Epidemiol 122:51–65
13. Feskanich D, Rimm EB, Giovannucci EL et al (1993)Reproducibility and validity of food intake measurements from asemiquantitative food frequency questionnaire. J Am Diet Assoc 93:790–796
14. National Diabetes Data Group (1979) Classification and diagnosis ofdiabetes mellitus and other categories of glucose intolerance.Diabetes 28:1039–1057
15. The Expert Committee on the Diagnosis and Classification ofDiabetes Mellitus (1997) Report of the Expert Committee on theDiagnosis and Classification of Diabetes Mellitus. Diabetes Care 20:1183–1197
16. Hu FB, LeitzmannMF, StampferMJ, Colditz GA,Willett WC, RimmEB (2001) Physical activity and television watching in relation to riskfor type 2 diabetes mellitus in men. Arch Intern Med 161:1542–1548
17. Manson JE, Rimm EB, Stampfer MJ et al (1991) Physical activityand incidence of non-insulin-dependent diabetes mellitus in women.Lancet 338:774–778
18. Chiuve SE, Fung TT, Rimm EB et al (2012) Alternative dietaryindices both strongly predict risk of chronic disease. J Nutr 142:1009–1018
19. Lopez-Garcia E, van Dam RM, Rajpathak S, Willett WC,Manson JE, Hu FB (2006) Changes in caffeine intake andlong-term weight change in men and women. Am J Clin Nutr83:674–680
20. DerSimonian R, Laird N (1986) Meta-analysis in clinical trials.Control Clin Trials 7:177–188
21. Bhupathiraju SN, Pan A, Malik VS et al (2013) Caffeinated andcaffeine-free beverages and risk of type 2 diabetes. Am J Clin Nutr97:155–166
22. Ohnaka K, Ikeda M, Maki T et al (2012) Effects of 16-week con-sumption of caffeinated and decaffeinated instant coffee on glucosemetabolism in a randomized controlled trial. J Nutr Metab 2012:207426
23. Wedick NM, Brennan AM, Sun Q, Hu FB, Mantzoros CS, van DamRM (2011) Effects of caffeinated and decaffeinated coffee on biolog-ical risk factors for type 2 diabetes: a randomized controlled trial.Nutr J 10:93
24. Yang WS, Wang WY, Fan WY, Deng Q, Wang X (2013) Teaconsumption and risk of type 2 diabetes: a dose-response meta-analysis of cohort studies. Br J Nutr 111(8):1329–1339
25. Lioret S, Touvier M, Balin M et al (2011) Characteristics of energyunder-reporting in children and adolescents. Br J Nutr 105:1671–1680
Diabetologia

ESM Table 1: Age-adjusted baseline characteristics according to 4-year changes in coffee consumption
Changes in frequency of total coffee consumption
Variable
Moderate to
large decrease
(>1 cup/day)
Small to moderate
decrease (1
cup/week-1
cup/day)
No change (±1
cup/week)
Small to
moderate
increase (1
cup/week-1
cup/day)
Moderate to
large increase
(>1 cup/day)
HPFS (1986)
Number of participants (n) 4189 3537 12483 3752 3798
Initial total coffee intake (cups/day) 4.0±1.6 2.0±1.5 1.4±1.6 1.4±1.4 1.7±1.4
Age (years) 56.9±9.0 57.3±9.5 55.7±9.2 56.2±9.3 56.0±9.0
Initial BMI (kg/m2) 25.6±3.0 25.2±2.9 25.1±3.1 25.2±3.1 25.4±3.1
Weight change (kg) 0.8±4.2 0.5±3.6 0.6±3.7 0.6±3.6 0.6±4.4
Initial physical activity (MET-h/week) 20.7±26.9 22.4±33.8 21.1±30.0 22.5±28.7 21.7±29.6
Change in physical activity (MET-h/week) 1.2±5.1 1.2±4.4 1.5±4.3 1.3±4.7 1.3±5.7
Initial alcohol intake (g/day) 13.5±16.1 11.5±14.4 10.5±15.1 10.9±13.9 12.5±15.3
Change in alcohol intake (g/day) -2.1±11.0 -1.4±9.3 -1.1±8.7 -1.0±9.0 -1.2±11.3
Race, white (%) 96 96 96 96 96
Current smoker (%) 9 6 7 6 10
Hypertension (%) 23 25 22 23 24
High cholesterol (%) 30 30 26 29 28
Family history of diabetes (%) 22 22 20 22 21
Total energy intake (kJ/day) 8378±2349 8206±2303 8231±2300 8076±2257 8173±2361
Change in energy intake (kJ/day) -574±2010 -473±1951 -289±1980 -96±1980 -25±2098
Initial caffeinated coffee intake (cups/day) 2.7±1.9 1.2±1.3 1.1±1.5 0.9±1.3 1.2±1.2
Change in caffeinated coffee intake
(cups/day)
-1.4±1.3 -0.2±0.9 0.0±0.5 0.2±0.9 1.4±1.3
Initial decaffeinated coffee intake (cups/day) 1.3±1.7 0.9±1.0 0.3±0.8 0.5±0.9 0.6±0.9
Change in decaffeinated coffee intake
(cups/day)
-0.7±1.3 -0.3±0.9 0.0±0.5 0.3±0.9 0.7±1.3

Initial tea intake (cups/day) 0.4±0.9 0.4±0.8 0.5±0.9 0.4±0.8 0.4±0.9
Change in tea intake (cups/day) 0.0±0.8 0.0±0.7 0.0±0.7 0.0±0.7 0.0±0.8
Initial SSB intake (servings/day) 0.2±0.4 0.3±0.5 0.3±0.6 0.2±0.4 0.2±0.5
Change in SSB intake (servings/day) 0.0±0.4 0.0±0.4 0.0±0.4 0.0±0.4 0.0±0.4
Initial ASB intake (servings/day) 0.4±0.9 0.4±0.7 0.3±0.8 0.3±0.7 0.3±0.7
Change in ASB intake (servings/day) 0.2±0.8 0.2±0.7 0.1±0.6 0.2±0.6 0.2±0.7
Initial punch intake (servings/day) 0.1±0.2 0.1±0.2 0.1±0.3 0.1±0.3 0.1±0.2
Change in punch intake (servings/day) 0.0±0.2 0.0±0.2 0.0±0.2 0.0±0.2 0.0±0.2
AHEI score 49.3 ±10.2 50.3 ±10.0 48.6 ±10.4 50.5±10.2 49.6±10.2
Change in AHEI score 0.5±8.5 0.1±8.3 0.2±8.2 0.2±8.3 0.1±8.4
NHS (1986)
Number of participants (n) 9856 6804 20246 5104 6454
Initial total coffee intake (cups/day) 4.0±1.6 2.3±1.5 2.0±1.7 1.9±1.5 2.0±1.4
Age (years) 56.2±6.9 56.1±7.0 55.9±7.1 55.5±7.1 55.5±7.1
Initial body mass index (kg/m2) 24.9±4.4 24.9±4.5 25.0±4.6 25.0±4.5 24.9±4.6
Weight change (kg) 1.3±4.8 1.2±4.6 1.1±4.6 1.0±4.7 1.0±4.9
Initial physical activity (MET-h/week) 14.1±22.1 15.0±19.2 14.1±20.0 15.0±22.6 14.1±20.4
Changes in physical activity (MET-h/week) 1.9±16.1 1.1±15.7 1.2±15.3 1.3±15.9 1.4±16.0
Initial alcohol intake (g/day) 6.8±11.2 6.0±9.9 6.3±11.0 6.0±9.9 6.4±10.4
Changes in alcohol intake (g/day) -1.3±7.3 -1.1±6.7 -1.1±6.8 -1.0±6.7 -1.2±7.2
Race, white (%) 98 98 98 98 98
Current smoker (%) 18 12 17 12 19
Hypertension (%) 27 28 27 26 26
High cholesterol (%) 36 38 35 37 34
Family history of diabetes (%) 29 28 28 28 29
Menopausal status and postmenopausal
hormone use
Premenopausal (%) 30.5 32.2 33.4 34.5 34.7
Postmenopausal + never users (%) 27.9 25.7 27.7 26.0 27.4
Postmenopausal + past users (%) 14.5 14.3 13.6 13.5 13.4

Postmenopausal + current users (%) 27.2 27.9 25.3 26.1 24.6
Total energy intake (kJ/day) 7494±2173 7473±2144 7377±2148 7365±2148 7319±2194
Change in energy intake (kJ/day) -255±1922 -138±1842 -80±1859 84±1880 159±1897
Initial caffeinated coffee intake (cups/day) 2.4±2.0 1.3±1.3 1.6±1.7 1.3±1.4 1.4±1.3
Change in caffeinated coffee intake
(cups/day)
-1.2±1.4 -0.2±1.0 0.0±0.7 0.2±1.1 1.3±1.3
Initial decaffeinated coffee intake (cups/day) 1.5±1.7 1.0±1.0 0.4±1.0 0.6±1.0 0.6±0.9
Change in decaffeinated coffee intake
(cups/day)
-0.9±1.5 -0.4±1.0 0.0±0.7 0.4±1.1 0.7±1.3
Initial tea intake (cups/day) 0.4±0.8 0.5±0.9 0.7±1.1 0.6±1.0 0.6±1.0
Change in tea intake (cups/day) 0.3±1.1 0.1±0.9 0.0±0.9 0.1±0.9 0.0±0.9
Initial SSB intake (servings/day) 0.1±0.4 0.1±0.3 0.2±0.5 0.1±0.3 0.1±0.4
Change in SSB intake (servings/day) 0.0±0.3 0.0±0.3 0.0±0.3 0.0±0.3 0.0±0.3
Initial ASB intake (servings/day) 0.5±0.8 0.5±0.8 0.5±0.9 0.5±0.8 0.5±0.8
Change in ASB intake (servings/day) 0.1±0.8 0.1±0.7 0.1±0.7 0.2±0.7 0.1±0.7
Initial punch intake (servings/day) 0.1±0.2 0.1±0.3 0.1±0.3 0.1±0.2 0.1±0.3
Change in punch intake (servings/day) 0.0±0.3 0.0±0.3 0.0±0.3 0.0 ±0.3 0.0±0.3
AHEI score 48.2±9.9 48.7±10.0 46.8±10.0 48.5±9.6 48.1±10.0
Change in AHEI score 0.3±8.6 -0.2±8.4 0.4±8.3 0.1±8.4 0.3±8.6
NHS II (1991)
Number of participants (n) 6353 5093 24348 5645 6071
Initial total coffee intake (cups/day) 3.9±1.5 2.0±1.5 1.2±1.6 1.3±1.4 1.7±1.3
Age (years) 42.6±3.8 42.2±4.0 41.7±4.1 41.6±4.1 41.7±4.0
Initial body mass index (kg/m2) 25.0±5.1 24.9±5.4 24.9±5.6 24.4±5.1 24.3±4.9
Weight change (kg) 3.8±6.7 3.6±6.1 3.5±6.2 3.1±5.8 3.0±6.3
Initial physical activity (MET-h/week) 21.0±30.0 19.7±25.5 20.0±25.9 20.5±26.2 21.3±28.1
Changes in physical activity (MET-h/week) -3.9±29.1 -2.3±24.9 -2.7±25.6 -2.7±24.6 -3.3±27.6
Initial alcohol intake (g/day) 4.3±7.8 3.2±6.2 2.8±6.0 3.1±5.8 3.8±6.5
Changes in alcohol intake (g/day) 0.3±5.8 0.3±4.6 0.3±4.4 0.3±4.5 0.6±5.5
Race, white (%) 97 97 97 96 98

Current smoker (%) 16 10 10 9 16
Hypertension (%) 12 11 11 10 9
High cholesterol (%) 24 23 23 23 21
Family history of diabetes (%) 37 37 37 36 35
Menopausal status and postmenopausal
hormone use
Premenopausal (%) 85.1 87.5 88.2 88.9 89.0
Postmenopausal + never users (%) 0.7 0.6 0.6 0.6 0.6
Postmenopausal + past users (%) 1.2 1.0 0.9 0.8 1.2
Postmenopausal + current users (%) 9.8 8.4 7.6 7.3 6.5
Missing information (%) 3.2 2.5 2.6 2.4 2.7
Oral contraceptive use
Never user (%) 12.7 14.7 15.3 14.2 13.5
Past user (%) 81.0 78.1 77.6 78.3 80.7
Current user (%) 6.4 7.2 7.1 7.5 5.8
Total energy intake (kJ/day) 7423±2240 74530±2206 7335±2202 7277±2173 7222±2206
Change in energy intake (kJ/day) -100±2064 -39±2014 122±2001 183±2026 348±2060
Initial caffeinated coffee intake (cups/day) 3.0±1.7 1.3±1.3 1.0±1.5 0.9±1.3 1.3±1.2
Change in caffeinated coffee intake
(cups/day)
-1.6±1.2 -0.2±0.8 0.0±0.4 0.3±0.8 1.6±1.0
Initial decaffeinated coffee intake (cups/day) 0.9±1.4 0.7 ±0.8 0.1±0.5 0.4±0.7 0.4±0.7
Change in decaffeinated coffee intake
(cups/day)
-0.5 ±1.1 -0.3±0.8 0.0±0.4 0.2±0.8 0.4±0.9
Initial tea intake (cups/day) 0.6±1.0 0.7±1.1 0.8±1.2 0.7±1.1 0.7±1.1
Change in tea intake (cups/day) -0.1±1.0 -0.1±0.9 -0.1±1.0 -0.2±1.0 -0.2±1.0
Initial SSB intake (servings/day) 0.2±0.5 0.2±0.5 0.3±0.7 0.2±0.6 0.2±0.6
Change in SSB intake (servings/day) 0.0±0.4 0.0±0.5 0.0±0.5 0.0±0.4 0.0±0.5
Initial ASB intake (servings/day) 1.1±1.4 1.0±1.3 1.1±1.5 0.9±1.3 1.0±1.3
Change in ASB intake (servings/day) -0.2±1.1 -0.1±1.0 -0.1±1.0 -0.1±0.9 -0.1±1.1

Initial punch intake (servings/day) 0.1±0.4 0.2±0.4 0.2±0.4 0.2±0.4 0.1±0.3
Change in punch intake (servings/day) 0.0±0.4 0.0±0.4 0.0±0.4 0.0±0.4 0.0±0.4
AHEI score 45.7±9.4 45.4±9.4 43.4±9.5 45.0±9.2 45.4±9.3
Change in AHEI score 0.3±8.3 0.1±7.9 0.2±7.8 0.4±7.8 0.3±8.2
Abbreviations: HPFS, Health Professionals Follow-Up Study; NHS, Nurses’ Health Study NHS II, Nurses’ Health Study II; BMI,
Body Mass Index; MET, Metabolic Equivalent of Task; SSB, Sugar-Sweetened Beverages; ASB, Artificially Sweetened Beverages;
AHEI, Alternate Healthy Eating Index
Data are expressed as means±SD unless otherwise noted.

ESM Table 2: Age-adjusted baseline characteristics according to 4-year changes in tea consumption
Changes in frequency of total tea consumption
Variable
Moderate to
large decrease
(>1 cup/day)
Small to
moderate
decrease (1
cup/week-1
cup/day)
No change (±1
cup/week)
Small to
moderate
increase (1
cup/week-1
cup/day)
Moderate to
large
increase (>1
cup/day)
HPFS (1986)
Number of participants (n) 1208 3152 18416 3626 1357
Initial tea intake (cups/day) 3.1±1.1 0.7±0.3 0.2±0.7 0.2±0.2 0.9±0.9
Age (years) 55.8±9.1 56.7±9.3 56.1±9.2 56.2±9.4 56.3±9.0
Initial BMI (kg/m2) 25.4±3.2 25.2±2.8 25.3±3.0 25.3±2.9 25.5±3.6
Weight change (kg) 0.5±3.9 0.6±3.9 0.6±3.9 0.7±3.7 0.6±4.0
Initial physical activity (MET-h/week) 19.1±24.6 21.9±30.6 21.6±29.3 21.8±29.3 21.9±42.2
Change in physical activity (MET-h/week) 1.3±54.0 1.5±43.0 1.4±47.0 1.3±49.0 1.7±42.0
Initial alcohol intake (g/day) 10.7±15.4 10.8±13.9 11.8±15.5 10.7±13.9 9.9±13.7
Change in alcohol intake (g/day) -1.2±10.0 -1.3±9.3 -1.3±9.7 -1.4±9.5 -1.2±8.9
Race (white (%) 96 96 96 95 95
Current smoker (%) 8 6 8 5 7
Hypertension (%) 24 22 23 23 24
High cholesterol (%) 28 27 28 29 28
Family history of diabetes (%) 22 21 21 20 21
Total energy intake (kJ/day) 8612±2315 8407±2357 8173±2303 8177±2315 1958±537
Change in energy intake (kJ/day) -549±2127 -469±2043 -297±1993 -176±1964 84±2029
Initial total coffee intake (cups/day) 1.8±1.8 1.9±1.6 2.0±1.9 1.8±1.6 1.6±1.7
Change in total coffee intake (cups/day) 0.0±1.4 0.0±1.3 0.0±1.2 -0.1±1.2 -0.1±1.4
Initial caffeinated coffee intake (cups/day) 1.3±1.6 1.4±1.5 1.4±1.6 1.2±1.4 1.0±1.5
Change in caffeinated coffee intake
(cups/day)
0.0±1.2 0.0±1.2 0.0±1.2 -0.1±1.1 -0.1±1.2

Initial decaffeinated coffee intake
(cups/day)
0.6±1.1 0.6±1.0 0.6±1.1 0.6±1.0 0.6±1.1
Change in decaffeinated coffee intake
(cups/day)
0.0±1.1 0.0±1.0 0.0±1.0 0.0±0.9 0.0±1.1
Initial SSB intake (servings/day) 0.3±0.5 0.3±0.4 0.3±0.5 0.3±0.5 0.3±0.5
Change in SSB intake (servings/day) 0.0±0.4 0.0±0.4 0.0±0.4 0.0±0.4 0.0±0.4
Initial ASB intake (servings/day) 0.3±0.7 0.4±0.8 0.4±0.8 0.4±0.7 0.4±0.8
Change in ASB intake (servings/day) 0.2±0.7 0.1±0.7 0.2±0.7 0.1±0.6 0.1±0.7
Initial punch intake (servings/day) 0.1±0.3 0.1±0.2 0.1±0.3 0.1±0.2 0.1±0.3
Change in punch intake (servings/day) 0.0±0.2 0.0±0.2 0.0±0.2 0.0±0.2 0.0±0.2
AHEI score 48.9±10.1 50.1±9.8 49.1±10.4 50.0±10.0 49.0±10.2
Change in AHEI score 0.1±8.6 0.0±8.2 0.2±8.3 0.4±8.2 0.7±8.4
NHS (1986)
Number of participants (n) 2645 5586 29172 7094 3967
Initial tea intake (serving/day) 3.1± 1.1 0.8± 0.3 0.4± 0.9 0.2±0.2 0.9±1.0
Age (years) 55.2±7.1 56.0±7.0 55.9±7.1 56.0±7.1 55.5±7.3
Initial body mass index (kg/m2) 25.1±4.7 25.1±4.6 24.8±4.5 25.1±4.5 25.1±4.7
Weight change (kg) 1.0±4.9 1.0±4.9 1.2±4.7 1.2±4.6 1.1±4.6
Initial physical activity (MET-h/week) 13.7±18.2 14.5±19.2 14.3±20.9 14.6±19.7 14.3±24.3
Changes in physical activity(MET-h/week) 1.3±15.5 1.2±15.5 1.4±15.7 1.5±16.0 1.1±15.4
Initial alcohol intake (g/day) 6.0±11.1 6.5±10.3 6.7±11.1 5.8±9.6 5.2±9.5
Changes in alcohol intake (g/day) -1.3±7.1 -1.2±6.6 -1.1±7.1 -1.1±6.5 -1.2±6.8
Race, white (%) 99 98 98 98 98
Current smoker (%) 16 14 17 13 14
Hypertension (%) 27 26 26 28 27
High cholesterol (%) 37 35 35 37 36
Family history of diabetes (%) 29 28 28 29 29
Menopausal status and postmenopausal
hormone use

Premenopausal (%) 35.4 32.2 32.7 32.1 35.7
Postmenopausal + never users (%) 26.4 28.1 27.5 26.6 25.4
Postmenopausal + past users (%) 12.5 14.2 13.7 14.1 14.4
Postmenopausal + current users (%) 25.8 25.4 26.1 27.2 24.5
Total energy intake (kJ/day) 7450±2278 7624±2181 7293±2144 7457±2131 7561±2134
Change in energy intake (kJ/day) -318±1959 -214±1909 -63±1863 -17±1872 100±1900
Initial total coffee intake (cups/day) 1.9±1.8 2.4±1.6 2.5±1.8 2.4±1.7 2.2±1.8
Change in total coffee intake (cups/day) 0.0±1.4 -0.1±1.3 -0.1±1.3 -0.3±1.3 -0.6±1.5
Initial caffeinated coffee intake (cups/day) 1.5±1.6 1.8±1.6 1.8±1.7 1.5±1.6 1.1±1.4
Change in caffeinated coffee intake
(cups/day)
0.0±1.3 -0.1±1.3 -0.1±1.3 -0.1±1.2 -0.1±1.1
Initial decaffeinated coffee intake
(cups/day)
0.5±1.0 0.6±1.0 0.7±1.2 0.9±1.3 1.1±1.5
Change in decaffeinated coffee intake
(cups/day)
0.0±1.1 0.0±1.1 0.0±1.1 -0.2±1.2 -0.5±1.4
Initial SSB intake (servings/day) 0.1±0.4 0.1±0.3 0.1±0.4 0.1±0.4 0.1±0.3
Change in SSB intake (servings/day) 0.0±0.3 0.0±0.3 0.0±0.3 0.0±0.3 0.0±0.3
Initial ASB intake (servings/day) 0.5±0.9 0.5±0.8 0.5±0.9 0.5±0.8 0.5±0.8
Change in ASB intake (servings/day) 0.2±0.8 0.1±0.7 0.1±0.7 0.1±0.7 0.1±0.7
Initial punch intake (servings/day) 0.1±0.3 0.1±0.3 0.1±0.3 0.1±0.3 0.1±0.3
Change in punch intake (servings/day) 0.0±0.3 0.0±0.3 0.0±0.3 0.0±0.3 0.0±0.3
AHEI score 47.3±9.8 48.0±9.7 47.5±10.1 48.1±9.7 48.0±9.9
Change in AHEI score 0.4±8.5 0.3±8.6 0.3±8.4 0.1±8.3 0.0±8.4
NHS II (1991)
Number of participants (n) 4614 8735 24989 6458 2714
Initial tea intake (cups/day) 3.2±1.2 0.7±0.3 0.4±1.0 0.2±0.2 0.9±1.0
Age (years) 41.9±4.0 41.7±4.1 41.9±4.0 41.7±4.1 41.7±4.0
Initial body mass index (kg/m2) 25.2±5.7 24.7±5.4 24.6±5.3 24.9±5.5 25.4±5.7
Weight change (kg) 3.4±6.4 3.3±6.1 3.4±6.1 3.6±6.4 3.8±6.6

Initial physical activity (MET-h/week) 19.5±25.2 20.4±27.0 20.4±26.6 20.4±26.5 20.4±28.4
Changes in physical activity(MET-h/week) -2.7±25.0 -2.9±25.3 -2.7±26.3 -3.3±27.9 -3.5±25.5
Initial alcohol intake (g/day) 2.7±6.1 3.2±6.2 3.3±6.4 3.5±6.8 2.7±5.8
Changes in alcohol intake (g/day) 0.3±4.8 0.4±4.7 0.3±4.8 0.2±5.0 0.3±4.2
Race, white (%) 98 97 97 97 98
Current smoker (%) 11 10 12 12 13
Hypertension (%) 13 11 10 11 11
High cholesterol (%) 25 23 22 24 23
Family history of diabetes (%) 38 36 36 36 38
Menopausal status and postmenopausal
hormone use
Premenopausal (%) 86.2 88.1 88.2 87.9 87.7
Postmenopausal + never users (%) 0.6 0.6 0.7 0.7 0.6
Postmenopausal + past users (%) 1.3 0.8 1.0 1.0 1.2
Postmenopausal + current users (%) 9.1 7.9 7.5 7.8 8.5
Missing information (%) 2.9 2.6 2.7 2.6 2.1
Oral contraceptive use
Never user (%) 14.2 14.1 14.9 14.3 13.6
Past user (%) 79.0 78.6 78.4 78.2 79.8
Current user (%) 6.9 7.3 6.7 7.5 6.6
Total energy intake (kJ/day) 7645±2278 7440±2206 7239±2181 7293±2173 7464±2280
Change in energy intake (kJ/day) -54±2089 -42±2035 126±1997 299±2031 331±2067
Initial total coffee intake (cups/day) 1.3±1.6 1.7±1.7 1.7±1.8 1.9±1.7 1.5±1.8
Change in total coffee intake (cups/day) 0.1±1.2 0.0±1.2 0.0±1.1 -0.1±1.2 -0.2±1.2
Initial caffeinated coffee intake (cups/day) 1.0±1.5 1.3±1.5 1.4±1.6 1.6±1.6 1.3±1.6
Change in caffeinated coffee intake
(cups/day)
0.1±1.1 0.0±1.2 0.0±1.1 0.0±1.2 -0.1±1.2
Initial decaffeinated coffee intake
(cups/day)
0.3±0.8 0.4±0.9 0.3±0.8 0.4±0.8 0.3±0.8

ESM Table 3: HRs and 95% CIs for incident type 2 diabetes, during 12 (NHS II) and 16 years (NHS and HPFS) of follow-up,
according to initial 4-year changes in coffee and tea intake
Changes in frequency of consumption
Intake/study Moderate to
large decrease
(>1 cup/day)
Small to
moderate
decrease (1
cup/week-1
cup/day)
No change
(±1
cup/week)a
Small to
moderate
increase (1
cup/week-1
cup/day)
Moderate to
large increase
(>1 cup/day)
HR per 1 serving
Coffee
HPFS
n 4158 3521 12502 3779 3799
Cases/Person-years 271/59731 227/50603 747/180134 224/54550 235/54665
Multivariable adjusted 1b 0.94 (0.80, 1.10) 0.98 (0.83, 1.15) 1.00 0.93 (0.79, 1.09) 0.95 (0.82, 1.11) 0.97 (0.93, 1.02)
Multivariable adjusted 2c 0.93 (0.79, 1.09) 1.01 (0.86, 1.18) 1.00 0.95 (0.81, 1.11) 0.93 (0.79, 1.08) 0.97 (0.93, 1.01)
NHS
n 9827 6803 20235 5123 6476
Cases/Person-years 715/145440 493/100769 1551/299679 378/76028 406/96062
Multivariable adjusted 1b 1.05 (0.95, 1.16) 0.94 (0.84, 1.04) 1.00 0.94 (0.84, 1.05) 0.78 (0.70, 0.87) 0.94 (0.91, 0.97)
Multivariable adjusted 2c 1.07 (0.97, 1.18) 0.95 (0.85, 1.06) 1.00 0.96 (0.86, 1.08) 0.81 (0.73, 0.91) 0.94 (0.91, 0.97)
NHS II
n 6339 5084 24330 5662 6095
Cases/Person-years 311/72772 250/58343 1150/279645 222/65122 207/70132
Multivariable adjusted 1b 1.38 (1.19, 1.62) 1.21 (1.03, 1.42) 1.00 0.90 (0.77, 1.05) 0.86 (0.73, 1.01) 0.87 (0.83, 0.91)
Multivariable adjusted 2c 1.31 (1.12, 1.53) 1.17 (0.99, 1.38) 1.00 0.94 (0.80, 1.10) 0.91 (0.77, 1.07) 0.90 (0.87, 0.94)
Pooledd
Multivariable adjusted 1b 1.11 (0.90, 1.35) 1.03 (0.88, 1.19) 1.00 0.92 (0.85, 1.00) 0.85 (0.75, 0.96) 0.93 (0.88, 0.98)
Multivariable adjusted 2c 1.09 (0.92, 1.30) 1.03 (0.91, 1.16) 1.00 0.95 (0.88, 1.03) 0.87 (0.79, 0.95) 0.94 (0.90, 0.97)
Tea
HPFS
n 1206 3141 18436 3627 1350
Cases/Person-years 77/17344 220/45123 1086/265548 217/52260 104/19410
Multivariable adjusted 1b 1.02 (0.78, 1.34) 1.17 (0.97, 1.42) 1.00 1.03(0.88, 1.20) 1.26 (1.01, 1.56) 1.04 (0.97, 1.12)
Multivariable adjusted 2c 0.97 (0.74, 1.27) 1.15 (0.95, 1.39) 1.00 1.03 (0.89, 1.20) 1.15 (0.93, 1.43) 1.02 (0.96, 1.10)
NHS
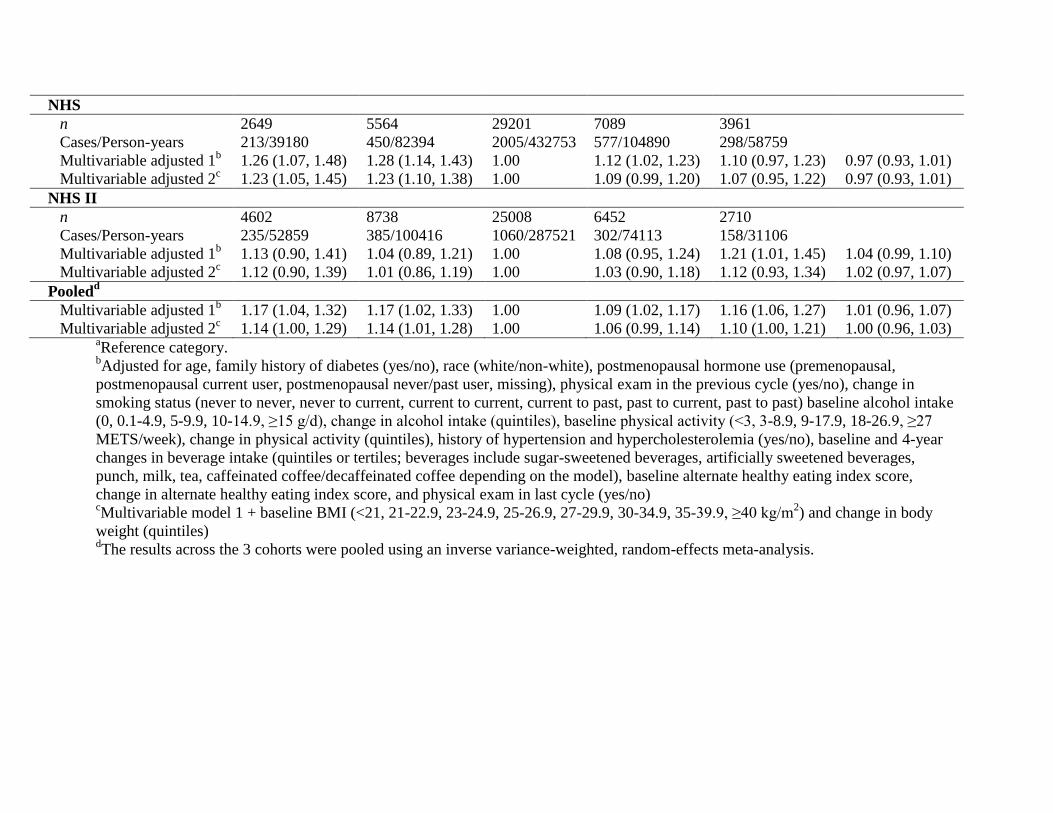
n 2649 5564 29201 7089 3961
Cases/Person-years 213/39180 450/82394 2005/432753 577/104890 298/58759
Multivariable adjusted 1b 1.26 (1.07, 1.48) 1.28 (1.14, 1.43) 1.00 1.12 (1.02, 1.23) 1.10 (0.97, 1.23) 0.97 (0.93, 1.01)
Multivariable adjusted 2c 1.23 (1.05, 1.45) 1.23 (1.10, 1.38) 1.00 1.09 (0.99, 1.20) 1.07 (0.95, 1.22) 0.97 (0.93, 1.01)
NHS II
n 4602 8738 25008 6452 2710
Cases/Person-years 235/52859 385/100416 1060/287521 302/74113 158/31106
Multivariable adjusted 1b 1.13 (0.90, 1.41) 1.04 (0.89, 1.21) 1.00 1.08 (0.95, 1.24) 1.21 (1.01, 1.45) 1.04 (0.99, 1.10)
Multivariable adjusted 2c 1.12 (0.90, 1.39) 1.01 (0.86, 1.19) 1.00 1.03 (0.90, 1.18) 1.12 (0.93, 1.34) 1.02 (0.97, 1.07)
Pooledd
Multivariable adjusted 1b 1.17 (1.04, 1.32) 1.17 (1.02, 1.33) 1.00 1.09 (1.02, 1.17) 1.16 (1.06, 1.27) 1.01 (0.96, 1.07)
Multivariable adjusted 2c 1.14 (1.00, 1.29) 1.14 (1.01, 1.28) 1.00 1.06 (0.99, 1.14) 1.10 (1.00, 1.21) 1.00 (0.96, 1.03)
aReference category.
bAdjusted for age, family history of diabetes (yes/no), race (white/non-white), postmenopausal hormone use (premenopausal,
postmenopausal current user, postmenopausal never/past user, missing), physical exam in the previous cycle (yes/no), change in
smoking status (never to never, never to current, current to current, current to past, past to current, past to past) baseline alcohol intake
(0, 0.1-4.9, 5-9.9, 10-14.9, ≥15 g/d), change in alcohol intake (quintiles), baseline physical activity (<3, 3-8.9, 9-17.9, 18-26.9, ≥27
METS/week), change in physical activity (quintiles), history of hypertension and hypercholesterolemia (yes/no), baseline and 4-year
changes in beverage intake (quintiles or tertiles; beverages include sugar-sweetened beverages, artificially sweetened beverages,
punch, milk, tea, caffeinated coffee/decaffeinated coffee depending on the model), baseline alternate healthy eating index score,
change in alternate healthy eating index score, and physical exam in last cycle (yes/no) cMultivariable model 1 + baseline BMI (<21, 21-22.9, 23-24.9, 25-26.9, 27-29.9, 30-34.9, 35-39.9, ≥40 kg/m
2) and change in body
weight (quintiles) dThe results across the 3 cohorts were pooled using an inverse variance-weighted, random-effects meta-analysis.

ESM Table 4: HRs and 95% CIs for incident type 2 diabetes according to updated 4-year changes in coffee and tea intake and
excluding cases of cardiovascular disease and cancer during follow-up
Changes in frequency of coffee and tea consumption
COFFEE
Intake/study Moderate to
large decrease
(>1 cup/day)
Small to moderate
decrease (1
cup/week-1
cup/day)
No change
(±1
cup/week)a
Small to
moderate
increase (1
cup/week-1
cup/day)
Moderate to
large increase
(>1 cup/day)
HR per 1 serving
Coffee
HPFS
n 4238 3410 13868 3081 3162
Cases/Person-Years 279/55130 167/44803 724/181884 161/41049 168/42199
Multivariable adjusted 1b 1.27 (1.08, 1.50) 0.85 (0.71, 1.01) 1.00 0.92 (0.76, 1.10) 0.96 (0.80, 1.15) 0.93 (0.89, 0.98)
Multivariable adjusted 2c 1.26 (1.08, 1.49) 0.87 (0.72, 1.04) 1.00 0.92 (0.77, 1.10) 0.92 (0.77, 1.10) 0.93 (0.88, 0.97)
NHS
n 9344 6317 23185 4569 5049
Cases/Person, Years 593/129517 394/87789 1592/322369 318/64056 270/70978
Multivariable adjusted 1b 1.19 (1.07, 1.33) 0.96 (0.85, 1.07) 1.00 1.05 (0.93, 1.19) 0.85 (0.75, 0.98) 0.94 (0.91, 0.98)
Multivariable adjusted 2c 1.18 (1.06, 1.32) 0.97 (0.86, 1.09) 1.00 1.07 (0.95, 1.21) 0.88 (0.77, 1.00) 0.95 (0.92, 0.98)
NHS II
n 7089 5197 25553 4802 4868
Cases/Person, Years 260/76790 221/57207 1139/283183 185/53991 160/54804
Multivariable adjusted 1b 1.17(0.99, 1.37) 0.97 (0.82, 1.14) 1.00 0.85 (0.72, 1.01) 0.84 (0.70, 1.00) 0.93 (0.89, 0.98)
Multivariable adjusted 2c 1.11(0.94, 1.31) 0.94 (0.80, 1.11) 1.00 0.89 (0.75, 1.05) 0.87 (0.73, 1.05) 0.96 (0.91, 1.00)
Pooledd
Multivariable adjusted 1b 1.20 (1.11, 1.30) 0.93 (0.86, 1.02) 1.00 0.95 (0.83, 1.08) 0.88 (0.80, 0.96) 0.94 (0.91, 0.96)
Multivariable adjusted 2c 1.18 (1.09, 1.28) 0.94 (0.86, 1.02) 1.00 0.97 (0.86, 1.10) 0.89 (0.81, 0.97) 0.94 (0.92, 0.97)
Tea
HPFS
n 1355 3468 18786 3020 1130
Cases/Person-years 71/17720 205/45582 984/246699 165/40100 74/14965

Multivariable adjusted 1b 0.97 (0.74, 1.28) 1.14 (0.93, 1.39) 1.00 1.04 (0.88, 1.23) 1.27 (0.99, 1.64) 1.04 (0.97, 1.13)
Multivariable adjusted 2c 0.92 (0.70, 1.21) 1.14 (0.94, 1.39) 1.00 1.05 (0.88, 1.24) 1.22 (0.95, 1.57) 1.04 (0.96, 1.12)
NHS
n 3420 7091 29115 5989 2848
Cases/Person-years 235/47512 493/98598 1898/405306 353/83517 188/39777
Multivariable adjusted 1b 1.07 (0.90, 1.26) 1.04 (0.92, 1.18) 1.00 0.90 (0.80, 1.01) 1.05 (0.90, 1.23) 0.98 (0.93, 1.02)
Multivariable adjusted 2c 1.02 (0.86, 1.21) 1.00 (0.88, 1.13) 1.00 0.90 (0.80, 1.01) 1.01 (0.86, 1.18) 0.98 (0.93, 1.02)
NHS II
n 4541 8957 23266 7402 3345
Cases/Person-years 215/49907 409/98719 897/257366 304/82728 140/37255
Multivariable adjusted 1b 1.21 (0.98, 1.49) 1.22 (1.05, 1.41) 1.00 1.07 (0.93, 1.23) 0.99 (0.82, 1.20) 0.96 (0.91, 1.01)
Multivariable adjusted 2c 1.16 (0.94, 1.42) 1.21 (1.04, 1.40) 1.00 1.06 (0.93, 1.22) 0.98 (0.81, 1.18) 0.96 (0.92, 1.01)
Pooledd
Multivariable adjusted 1b 1.09 (0.97, 1.23) 1.12 (1.01, 1.24) 1.00 0.99 (0.88, 1.11) 1.07 (0.95, 1.21) 0.98 (0.94, 1.02)
Multivariable adjusted 2c 1.04 (0.93, 1.18) 1.10 (0.97, 1.25) 1.00 0.99 (0.88, 1.11) 1.03 (0.92, 1.16) 0.98 (0.95, 1.02)
aReference category
bAdjusted for age, family history of diabetes (yes/no), race (white/non-white), postmenopausal hormone use (premenopausal,
postmenopausal current user, postmenopausal never/past user, missing), physical exam in the previous cycle (yes/no), change in
smoking status (never to never, never to current, current to current, current to past, past to current, past to past) baseline alcohol intake
(0, 0.1-4.9, 5-9.9, 10-14.9, ≥15 g/d), change in alcohol intake (quintiles), baseline physical activity (<3, 3-8.9, 9-17.9, 18-26.9, ≥27
METS/week), change in physical activity (quintiles), history of hypertension and hypercholesterolemia (yes/no), baseline and 4-year
changes in beverage intake (quintiles or tertiles; beverages include sugar-sweetened beverages, artificially sweetened beverages,
punch, milk, tea, caffeinated coffee/decaffeinated coffee depending on the model), baseline alternate healthy eating index score,
change in alternate healthy eating index score, and physical exam in last cycle (yes/no) cMultivariable model 1 + baseline BMI (<21, 21-22.9, 23-24.9, 25-26.9, 27-29.9, 30-34.9, 35-39.9, ≥40 kg/m
2) and change in body
weight (quintiles) dThe results across the 3 cohorts were pooled using an inverse variance-weighted, random-effects meta-analysis.

Change in decaffeinated coffee intake
(cups/day)
0.0±0.7 0.0±0.8 0.0±0.7 -0.1±0.7 -0.1±0.6
Initial SSB intake (servings/day) 0.3±0.6 0.3±0.6 0.3±0.7 0.3±0.6 0.3±0.8
Change in SSB intake (servings/day) 0.0±0.5 0.0±0.5 0.0±0.5 0.0±0.5 0.0±0.5
Initial ASB intake (servings/day) 1.0±1.3 1.0±1.3 1.1±1.4 1.1±1.5 1.1±1.4
Change in ASB intake (servings/day) 0.0±1.1 -0.1±1.0 -0.1±1.0 -0.1±1.0 -0.1±1.1
Initial punch intake (servings/day) 0.1±0.4 0.2±0.4 0.2±0.4 0.2±0.4 0.2±0.5
Change in punch intake (servings/day) 0.0±0.5 0.0±0.4 0.0±0.4 0.0±0.4 0.0±0.5
AHEI score 44.1±9.2 44.6±9.2 44.3±9.6 44.6±9.4 44.0±9.4
Change in AHEI score 0.2±7.8 0.2±7.9 0.2±7.9 0.3±8.0 0.3±8.2
Abbreviations: HPFS, Health Professionals Follow-Up Study; NHS, Nurses’ Health Study NHS II, Nurses’ Health Study II; BMI,
Body Mass Index; MET, Metabolic Equivalent of Task ; SSB, Sugar-Sweetened Beverages; ASB, Artificially Sweetened Beverages;
AHEI, Alternate Healthy Eating Index
Data are expressed as means±SD unless otherwise noted.
Related Documents