Changes in buccal cytome biomarkers in relation to ageing and Alzheimer’s disease. A thesis submitted to the University of Adelaide for the degree of Doctor of Philosophy Philip Thomas B.Sc. (Hons) University of Adelaide, School of Molecular Biomedical Science, Discipline of Physiology And CSIRO Human Nutrition, Adelaide September 2007

Welcome message from author
This document is posted to help you gain knowledge. Please leave a comment to let me know what you think about it! Share it to your friends and learn new things together.
Transcript

Changes in buccal cytome biomarkers in relation to ageing and Alzheimer’s disease.
A thesis submitted to the University of Adelaide for the degree of Doctor of Philosophy
Philip Thomas
B.Sc. (Hons)
University of Adelaide, School of Molecular Biomedi cal Science, Discipline of Physiology
And CSIRO Human Nutrition, Adelaide
September 2007

TABLE OF CONTENTS
DECLARATION........................................ .................................................................. i
ACKNOWLEDGEMENTS................................... ....................................................... ii
ABSTRACT ........................................... ................................................................... iii
PUBLICATIONS ARISING FROM THESIS................... ........................................... vi
ABBREVIATIONS ...................................... ............................................................. vii
CHAPTER 1. Genome mutation and Alzheimer’s disease. ................................... 1
1.1 Abstract........................................................................................................ 2
1.2 Introduction .................................................................................................. 2
1.3 Clinical diagnosis ......................................................................................... 5
1.4 Tau and Neurofibrillary Tangles................................................................... 8
1.5 β amyloid and neuritic plaques .................................................................. 10
1.6 Amyloid Cascade Hypothesis: Plaques or tangles?................................... 14
1.7 Genetics of Alzheimer’s Disease ............................................................... 19
1.8 Genomic Instability Events......................................................................... 24
1.8.1 Aneuploidy ............................................................................................... 24
1.8.2 Telomere shortening, oxidative stress, breakage fusion bridge cycles and
gene amplification. ............................................................................................ 27
1.9 Dietary and Nutrigenetic factors that affect Alzheimer disease risk ........... 35
1.9.1 B Vitamins................................................................................................ 35
1.9.2 Mutations in Folate, Methionine metabolism genes ................................. 37
1.10 Methylation ................................................................................................ 39
1.11 Antioxidants ............................................................................................... 41
1.12 Copper, Iron, Zinc, Selenium and Aluminium............................................. 44
1.13 Conclusion ................................................................................................. 46

Chapter 2: The buccal cytome and micronucleus frequ ency is substantially
altered in Down’s syndrome and normal ageing compar ed to young healthy
controls........................................... ........................................................................ 47
2.1 Abstract...................................................................................................... 48
2.2 Introduction ................................................................................................ 49
2.3 Methods ..................................................................................................... 51
2.3.1 Cell sampling and preparation ................................................................. 52
2.3.2 Feulgen staining and slide scoring........................................................... 54
2.3.3 Scoring criteria for buccal cytome assay.................................................. 55
2.3.4 Scoring method........................................................................................ 61
2.4 Statistical Analyses.................................................................................... 61
2.5 Results....................................................................................................... 62
2.6 Discussion ................................................................................................. 69
Chapter 3: Buccal cytome biomarkers may be associat ed with Alzheimer’s
disease............................................ ........................................................................ 74
3.1 Abstract...................................................................................................... 75
3.2 Introduction ................................................................................................ 75
3.3 Methods ..................................................................................................... 77
3.3.1 Recruitment and characteristics of participants........................................ 77
3.3.2 Cell sampling and preparation ................................................................. 79
3.3.3 Feulgen staining....................................................................................... 81
3.3.4 Scoring criteria for buccal cytome assay.................................................. 82
3.4 Statistical analysis...................................................................................... 87
3.5 Results....................................................................................................... 88
3.5.1 Sensitivity and Specificity......................................................................... 92

3.6 Discussion ................................................................................................. 94
Chapter 4: Telomere length in white blood cells, bu ccal cells and brain tissue
and it’s variation with ageing and Alzheimer’s dise ase.................................... 104
4.1 Abstract.................................................................................................... 105
4.2 Introduction .............................................................................................. 106
4.3 Methods ................................................................................................... 108
4.3.1 Recruitment and characteristics of participants...................................... 108
4.3.2 Cell sampling and preparation ............................................................... 111
4.3.3 DNA isolation ......................................................................................... 112
4.3.4 Quantitative real time PCR..................................................................... 114
4.4 Statistical analysis.................................................................................... 117
4.5 Results..................................................................................................... 118
4.5.1 WBCs .................................................................................................... 118
4.5.2 Buccal cells ........................................................................................... 119
4.5.3 Brain hippocampus ................................................................................ 122
4.5.4 Correlations............................................................................................ 124
4.5.5 Sensitivity and specificity ....................................................................... 124
4.6 Discussion .............................................................................................. 124
Chapter 5: Chromosome 17 and 21 aneuploidy in bucca l cells is increased with
ageing and in Alzheimer’s disease.................. ................................................... 129
5.1 Abstract.................................................................................................... 130
5.2 Introduction .............................................................................................. 130
5.3 Methods ................................................................................................... 133
5.3.1 Recruitment and characteristics of participants...................................... 133

5.3.2 Buccal cell collection and slide preparation............................................ 136
5.3.3 Brain tissue collection and slide preparation .......................................... 137
5.3.4 Preparation of chromosome 17 DNA probe ........................................... 139
5.3.5 Human metaphase preparation.............................................................. 139
5.3.6 Hybridisation and detection for chromosome 17 .................................... 141
5.3.7 Hybridisation and detection for chromosome 21 .................................... 142
5.3.8 Scoring Method...................................................................................... 144
5.4 Statistical Analyses.................................................................................. 144
5.5 Results..................................................................................................... 147
5.5.1 Normal ageing-Aneuploidy in buccal cells.............................................. 147
5.5.2 Down’s syndrome-Aneuploidy in buccal cells ........................................ 147
5.5.3 Alzheimer’s disease-Aneuploidy in buccal cells ..................................... 148
5.5.4 Alzheimer’s disease- Aneuploidy in Brain hippocampus........................ 148
5.6 Discussion ............................................................................................... 154
Chapter 6: Folate metabolism and Alzheimer’s diseas e .................................. 159
6.1 Abstract.................................................................................................... 160
6.2 Introduction .............................................................................................. 160
6.3 Methods ................................................................................................... 163
6.3.1 Recruitment and characteristics of participants...................................... 163
6.3.2 Cell sampling and preparation ............................................................... 166
6.3.3 Quantification of plasma folate............................................................... 167
6.3.4 Quantification of Vitamin B12 in plasma................................................. 169
6.3.5 Quantification of plasma total L-homocysteine....................................... 170
6.3.6 DNA isolation for genotyping.................................................................. 171
6.3.7 Genotyping............................................................................................. 173

6.3.8 Allelic discrimination primers for genotype detection.............................. 175
6.3.9 PCR conditions and reagents ................................................................ 175
6.4 Statistics .................................................................................................. 176
6.5 Results..................................................................................................... 176
6.5.1 Folate, B12 and homocysteine............................................................... 176
6.5.2 Polymorphisms ...................................................................................... 181
6.5.3 Correlations............................................................................................ 183
6.6 Discussion ............................................................................................... 187
Chapter 7: Ageing and polyphenols in a transgenic m ouse model for
Alzheimer’s disease 192
7.1 Abstract.................................................................................................... 193
7.2 Introduction .............................................................................................. 194
7.3 Materials and methods............................................................................. 196
7.3.1 Mouse model ......................................................................................... 196
7.3.2 Genotyping............................................................................................. 198
7.3.2.1 Tg(PSEN1) protocol ........................................................................ 198
7.3.2.2 Tg(APPswe) protocol....................................................................... 199
7.4 Study design ............................................................................................ 200
7.5 Diets......................................................................................................... 202
7.6 Animal welfare ......................................................................................... 203
7.7 Buccal cell collection................................................................................ 203
7.7.1 Scoring criteria for murine buccal micronucleus assay .......................... 204
7.7.2 Scoring method...................................................................................... 206
7.8 Blood collection for micronucleated erythrocyte assay ............................ 208
7.8.1 Acridine orange staining......................................................................... 208

7.9 DNA isolation for telomere length determination...................................... 209
7.9.1 DNA isolation of buccal cells.................................................................. 210
7.9.2 DNA isolation of Brain tissue.................................................................. 210
7.10 Real time PCR for absolute quantitation for telomere length ................... 211
7.11 Statistical analysis.................................................................................... 212
7.12 Results..................................................................................................... 213
7.12.1 Food consumption................................................................................ 213
7.12.2 Bodyweight .......................................................................................... 213
7.12.3 Buccal micronucleus cytome assay ..................................................... 216
7.12.3.1 Basal cells ..................................................................................... 216
7.12.3.2 Differentiated cells ......................................................................... 217
7.12.3.3 Micronucleated cells (combined basal and differentiated
micronucleated cells)................................................................................... 219
7.12.3.4 Early Karyolytic cells...................................................................... 221
7.12.3.5 Mid Karyolysis ............................................................................... 223
7.12.3.6 Late Karyolysis .............................................................................. 225
7.12.4 Whole blood micronucleus erythrocyte assay ...................................... 227
7.12.4.1 Micronucleated PCE...................................................................... 227
7.12.4.2 Micronucleated Non polychromatic erythrocytes ........................... 227
7.12.4.3 Polychromatic erythrocyte percentage .......................................... 228
7.12.5 Correlation between micronuclei in buccal cells and polychromatic
erythrocytes .................................................................................................... 230
7.12.6 Telomere length at 9 months ............................................................... 231
7.12.6.1 Olfactory lobe brain tissue ............................................................. 231
7.12.6.2 Buccal cell absolute telomere length ............................................. 232

7.12.7 Correlation between buccal cell and olfactory lobe telomere length .... 233
7.13 Discussion ............................................................................................... 233
7.14 Appendix 1: Clinical morbidity assessment for AD Mice performed weekly
241
Chapter 8: Conclusions and future directions ....... ........................................... 244
References......................................... ................................................................... 251
Appendix: Paper Reprints ........................... ........................................................ 302

i
DECLARATION
This thesis contains no material which has been accepted for the award of any other
degree or diploma in any university or tertiary institution, and to the best of my
knowledge and belief, contains no material previously published or written by another
person, except where due reference has been made in the text.
I give my consent to this thesis, when deposited in the University library, being
available for photocopy or loan.
Philip Thomas

ii
ACKNOWLEDGEMENTS Firstly, I would like to thank my supervisors Dr Michael Fenech and Associate
Professor Michael Roberts for all their wisdom, guidance and support throughout my
post graduate journey. Thank you for the belief and confidence that made this PhD
project a reality. Dr Jane Hecker and Dr Jeff Faunt deserve special mention for
clinically diagnosing the Alzheimer’s patients and agreeing to collaborate with us on
the project, and for arranging with Sue Moore at College Grove to help me in the
collection of both blood and buccal cells from Alzheimer’s patients. Furthermore, I
should like to thank all the staff at the CSIRO clinic for helping me organise potential
participants for the control cohorts. A special thank you is extended to all of the
participants who consented to take part in this study making the whole project
possible. Special thanks to Dr John Power and Robyn Flook for all their efforts in
providing me with hippocampal brain tissue from both Alzheimer’s and control brains.
I would also like to thank my good friend Shusuke Toden for his motivation and
inspiration, and the countless memorable conversations about boxing and music of
yesteryear, whilst drinking coffee overlooking the banks of the river Torrens. I thank
Dr Nathan O’Callaghan for all his support, advice and technical expertise during the
telomere assessment study.
Finally, I should like to thank my family and friends especially Eileen, Steve and
Elaine for all their continued support and encouragement. Thanks to Dylan Thomas
who during difficult times made the vision of Wales all the more clear-Diolch yn fawr,
Dylan.

iii
ABSTRACT The aim of this thesis was to investigate the possibility of using buccal cells derived
from a multi layered epithelial tissue from the oral mucosa as a model to identify
potential biomarkers of genomic instability in relation to normal ageing and premature
ageing syndromes such as AD and DS. A buccal micronucleus cytome assay was
developed and used to investigate biomarkers for DNA damage, cell proliferation and
cell death in healthy young, healthy old and young Down’s syndrome cohorts. Cells
with micronuclei, karyorrhectic cells, condensed chromatin cells and basal cells
increased significantly with normal ageing (P<0.0001). Cells with micronuclei and
binucleated cells increased (P<0.0001) and condensed chromatin, karyorrhectic,
karyolytic and pyknotic cells decreased (P<0.002) significantly in Down’s syndrome
relative to young controls.
The buccal micronucleus cytome assay was used to measure ratios of buccal cell
populations and micronuclei in clinically diagnosed Alzheimer’s patients compared to
age and gender matched controls. Frequencies of basal cells (P<0.0001), condensed
chromatin cells (P<0.0001) and karyorrhectic cells (P<0.0001) were found to be
significantly lower in Alzheimer’s patients, possibly reflecting changes in the cellular
kinetics or structural profile of the buccal mucosa.
Changes in telomere length were investigated using a quantitative RTm-PCR method
to measure absolute telomere length (in Kb per diploid genome) and show age-
related changes in white blood cells and buccal cell telomere length (in kb per diploid
genome) in normal healthy individuals and Alzheimer’s patients. We observed a

iv
significantly lower telomere length in white blood cells (P<0.0001) and buccal cells
(P<0.01) in Alzheimer’s patients relative to healthy age-matched controls (31.4% and
32.3% respectively). However, there was a significantly greater telomere length in
hippocampus cells of Alzheimer’s brains (P=0.01) compared to control samples (49.0
Buccal cells were also used to investigate chromosome 17 and 21 aneuploidy. A 1.5
fold increase in trisomy 21 (P<0.001) and a 1.2 fold increase in trisomy 17 (P<0.001)
was observed in buccal cells of Alzheimer’s patients compared to age and gender
matched controls. Chromosome 17 and chromosome 21 monosomy and trisomy
increase significantly with age (P<0.001). Down’s syndrome, which exhibits similar
neuropathological features to those observed in Alzheimer’s disease also showed a
strong increase in chromosome 17 monosomy and trisomy compared to matched
controls (P<0.001). However, aneuploidy rate for chromosome 17 and 21 in the
nuclei of hippocampus cells of brains from Alzheimer’s patients and controls were not
significantly different.
Observations that AD individuals have altered plasma folate, B12 and Hcy levels
compared to age-matched controls who have not been clinically diagnosed with AD
were investigated. Genotyping studies were undertaken to determine whether
polymorphisms within particular genes of the folate methionine pathway contributed
to AD pathogenesis. Correlations between folate, B12 and Hcy status with previously
determined buccal micronucleus assay cytome biomarkers for DNA damage, cell
proliferation and cell death markers was investigated.
Lastly, the potential protective effects of phytonutrient polyphenols on genomic
instability events in a transgenic mouse model for AD were investigated. We

v
determined the effects of curcumin and GSE polyphenols on DNA damage by testing
the mice over a 9 month period utilizing a buccal micronucleus cytome assay, an
erythrocyte micronucleus assay and measuring telomere length in both buccal cells
and olfactory lobe brain tissue.

vi
PUBLICATIONS ARISING FROM THESIS 1. Chapter 1 : Philip Thomas and Michael Fenech A review of genome mutation and Alzheimer’s disease. Mutagenesis vol. 22 no. 1 pp. 15–33, 2007. 2. Chapter 2 : Philip Thomas, Sarah Harvey, Tini Gruner and Michael Fenech
The buccal cytome and micronucleus frequency is substantially altered in Down’s syndrome and normal ageing compared to young healthy controls Mutation Research Fundamental and Molecular Mechanisms of Mutagenesis 2007; doi:10.1016/j.mrfmmm.2007.08.012MUT10526 (In press)
3. Chapter 3 : Philip Thomas, Jane Hecker, Jeffrey Faunt and Michael Fenech
Buccal cytome biomarkers may be associated with Alzheimer’s disease Mutagenesis 2007; doi: 10.1093/mutage/gem029Mutagenesis (In press)
4. Chapter 4 : Philip Thomas, Nathan O’Callaghan and Michael Fenech
Telomere length in white blood cells, buccal cells and brain tissue and it’s variation with ageing and Alzheimer’s disease Mechanisms of ageing and development (In press)
5. Chapter 5 : Philip Thomas and Michael Fenech
Chromosome 17 and 21 aneuploidy in buccal cells is increased with ageing and in Alzheimer’s disease. Mutagenesis (In press)

vii
ABBREVIATIONS ACT Alpha-1-antichymotrypsin
ALT Alternative lengthening of telomere
AD Alzheimer’s disease
ANOVA Analysis of variance
APOE Apolipoprotein E
APOE4 Apolipoprotein E allele 4
APP Amyloid precursor protein
β amyloid 42 42 amino acid β amyloid peptide
BACE Beta site APP cleaving enzyme
BFB Breakage fusion bridge
BC Buccal cell
BSA Bovine serum albumin
CAT Catalase
CBS Cystathionine β synthase
CSIRO Commonwealth Scientific and Industrial Research organisation
CT Cycle threshold
Cu2+ Copper
DABCO 1, 4-diazabicyclo-(222) octane
DAPI 4, 6 diamidino-2-phenylindole
dATP 2’-deoxyadenosine 5’-triphosphate
dCTP 2’-deoxycytidine 5’-triphosphate
dGTP 2’-deoxyguanosine 5’-triphosphate
dNTP Deoxyribonucleotide triphosphate
DNA Deoxyribo nucleic acid

viii
DS Down’s syndrome
dTMP Deoxythymidine monophosphate
DTT Dithiothreitol
dTTP 2’-deoxythymidine 5’-triphosphate
dUMP Deoxyuracil monophosphate
EDTA Ethylenediamine tetraacetic acid
EGCG Epigallocatechin-3-gallate
FAD Familial Alzheimer’s disease
Fe2+ Iron
FBP Folate binding protein
FISH Fluorescence in situ hydridisation
FITC Fluorescein isothiocyanate
GPx Glutathione peroxidase
GSE Grape Seed extract
HCL Hydrochloric acid
Hcy Homocysteine
HO-1 Heme oxygenase-1
8-OHdG 8 hydroxy-2-deoxyguanosine
Kb kilobase
KOH Potassium hydroxide
MCI Mild cognitive impairment
MDS Mothers of Down’s syndrome
MgCL2 Magnesium chloride
MGSE Microencapsulated Grape Seed Extract
MPO Myeloperoxidase

ix
MMSE Mini Mental State Exam
MN Micronuclei
MN-NCE Micronucleated non polychromatic erythrocyte
MN-PCE Micronucleated polychromatic erythrocyte
Mo/HuAPP695 transgenic mouse secreting 695 amino acid APP peptide
MRI Magnetic Resonance Imaging
MTHFR Methylenetetrahydrofolate reductase
MTR Methionine synthase
MTRR Methionine synthase reductase
NAD Nicotinamide adenine dinucleotide
NINCDS-AD&DA National Institute of Neurological and Communicative Disorders
and Stroke-Alzheimer’s disease and related disorders association
PBS Phosphate buffered saline
PCE Polychromatic erythrocyte
PSEN1 Presenilin 1
PSEN1-dE9 Deletion in exon 9 of presenilin gene
PSEN2 Presenilin 2
ROS Reactive oxygen species
RLU Relative light units
RTm-PCR Real time polymerase chain reaction
SAH S-Adenosylhomocysteine
SAM S-Adenosyl Methionine
SNP Single nucleotide polymorphism
SOD Superoxide Dismutase
SSC Standard saline citrate

x
TERT Telomerase
WBC White blood cells
Zn2+ Zinc

Chapter 1: General Introduction
1
1 CHAPTER 1. Genome mutation and Alzheimer’s disease

Chapter 1: General Introduction
2
1.1 Abstract
Alzheimer’s disease (AD) is a complex progressive neurodegenerative disorder of the
brain and is the commonest form of dementia. The prevalence of this disease is
predicted to increase threefold over the next thirty years and to date no reliable and
conclusive diagnostic test exists that will identify individuals presymptomatically of
susceptibility risk. This review examines the molecular, genetic, dietary and
environmental evidence underlying the known pathology of AD and proposes a
biologically plausible chromosome instability model to explain some of the features of
the disease. Genome damage biomarkers such as aneuploidy of chromosome 17 and
21, oxidative damage to DNA and telomere shortening together with abnormal
expression of APP, β amyloid and tau proteins are discussed in terms of their potential
value as risk biomarkers. These biomarkers could then be used in diagnosis and the
evaluation of potentially effective preventative measures.
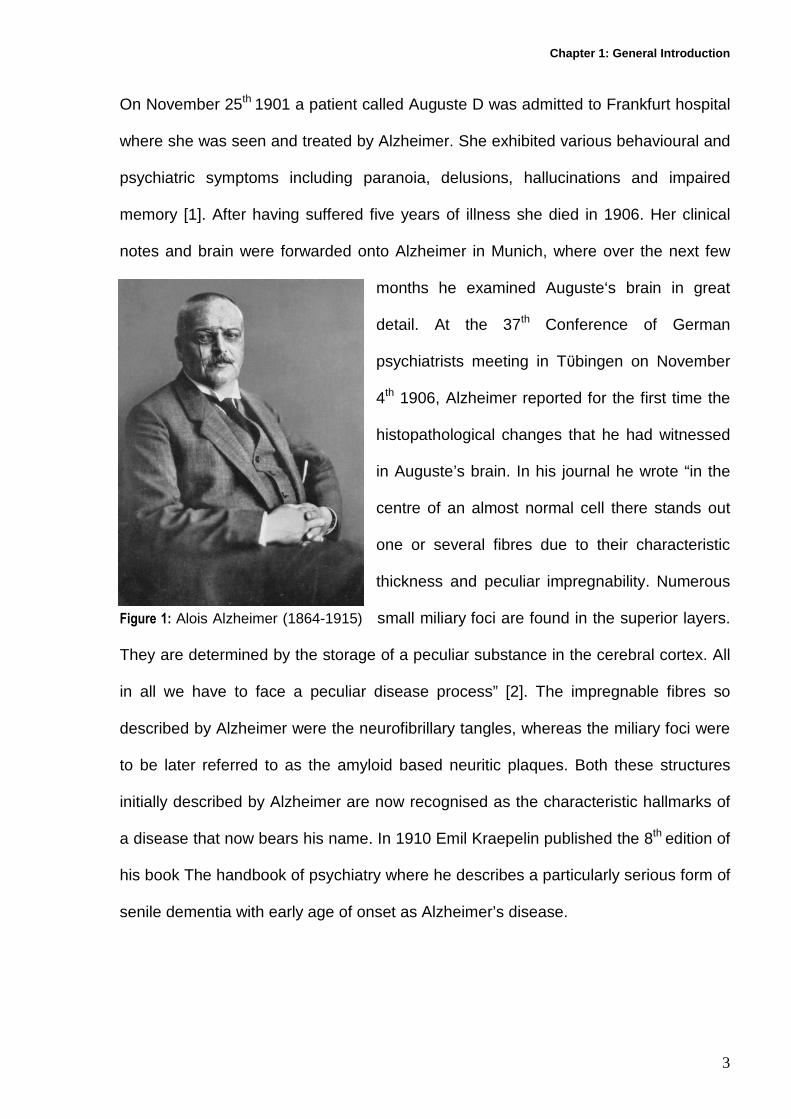
1.2 Introduction Alois Alzheimer (Figure 1) was born in Marktbriet, Germany on June 14th 1864. He
studied medicine at the Universities of Berlin, Tϋbingen, and Wϋrzberg where he
completed his doctoral thesis under the supervision of Albert Kölliker on ceruminal
glands in 1887. From 1888-1903 Alzheimer worked as a medical resident and then
later as a senior physician at the municipal mental asylum in Frankfurt. It was here
that he forged his friendship with Franz Nissl, who developed histopathological stains
that allowed the histology of nervous tissue from various neurodegenerative disorders
to be studied.
Chapter 1: General Introduction
3
On November 25th 1901 a patient called Auguste D was admitted to Frankfurt hospital
where she was seen and treated by Alzheimer. She exhibited various behavioural and
psychiatric symptoms including paranoia, delusions, hallucinations and impaired
memory [1]. After having suffered five years of illness she died in 1906. Her clinical
notes and brain were forwarded onto Alzheimer in Munich, where over the next few
months he examined Auguste‘s brain in great
detail. At the 37th Conference of German
psychiatrists meeting in Tϋbingen on November
4th 1906, Alzheimer reported for the first time the
histopathological changes that he had witnessed
in Auguste’s brain. In his journal he wrote “in the
centre of an almost normal cell there stands out
one or several fibres due to their characteristic
thickness and peculiar impregnability. Numerous
Figure 1: Alois Alzheimer (1864-1915) small miliary foci are found in the superior layers.
They are determined by the storage of a peculiar substance in the cerebral cortex. All
in all we have to face a peculiar disease process” [2]. The impregnable fibres so
described by Alzheimer were the neurofibrillary tangles, whereas the miliary foci were
to be later referred to as the amyloid based neuritic plaques. Both these structures
initially described by Alzheimer are now recognised as the characteristic hallmarks of
a disease that now bears his name. In 1910 Emil Kraepelin published the 8th edition of
his book The handbook of psychiatry where he describes a particularly serious form of
senile dementia with early age of onset as Alzheimer’s disease.

Chapter 1: General Introduction
4
Having worked with Kraepelin in Munich from 1903-1912, Alzheimer was appointed to
the position of professor of Psychiatry in Breslau, Poland. However with the arrival of
the First World War conditions became increasingly more difficult. He found himself
under increasing stress until finally his health started to fail. Alois Alzheimer died in a
uraemic coma as a result of rheumatic endocarditis on December 19th 1915 at the age
of 51. Alzheimer’s many years of dedicated research provided the foundation for
today’s extensive research programmes, into trying to understand a disease that is
predicted to make a huge social and financial impact on the 21st Century. AD has been
classified as a progressive degenerative disorder of the brain and is the most common
form of dementia, with between 50 and 70% of all clinically presented cases being
histopathologically confirmed as AD at post mortem [3]. Worldwide a new case of
dementia is diagnosed every seven seconds. The global incidence of dementia is
estimated to be 24.3 million, with approximately 4.6 million new cases being
diagnosed annually [4,5]. Currently between 165,000 and 180,000 Australians suffer
from this disease, with an annual cost in 2004 to the Australian government of $3.6
billion dollars in lost productivity and medical care [6,7]. These numbers are set to
increase threefold over the next thirty years as a greater proportion of an already
ageing population reaches retirement age. Advancing age is the major contributing
factor for increased risk of developing Alzheimer’s. After the age of 65 a doubling of
risk occurs every five years affecting roughly 30% of individuals aged 80 years and
over [3],[8,9]. It is estimated that by 2025 at least 34 million people worldwide will
suffer from AD [10].

Chapter 1: General Introduction
5
1.3 Clinical diagnosis
At present, based upon criteria of cognitive impairment and behavioural changes
patients can be clinically diagnosed with between 60-70% accuracy of having AD [11].
The most commonly used criteria are those outlined by the National Institute of
Neurological and Communicative Disorders and Stroke-Alzheimer’s disease and
related disorders association (NINCDS-AD&DA), published in 1984 [12]. According to
this document, criteria for probable diagnosis for Alzheimer’s includes dementia as
determined by the mini mental state examination (MMSE) [13], which allows a brief
quantitative measure of cognition status to be determined. It can be used as a
measure of cognitive decline, to document cognitive changes with the passage of time
in relation to treatment, and as an effective tool in screening for elements of cognitive
impairment. Dementia is diagnosed when two of the following parameters are
impaired: amnesia (progressive worsening of memory), aphasia (impairment of
speech), apraxia (the inability to perform motor tasks) and agnosia (the inability to
identify and recognise individuals or objects, despite having knowledge of the
characteristics of those individuals and objects). Individual assessment includes
various psychiatric and behavioural changes such as depression, misidentifications,
delusions, and hallucinations that invariably lead to an individual’s inability to perform
everyday tasks, resulting in some form of full time care being required [8].
The age of onset for AD is usually after the age of 65yrs but can be earlier if
influenced by genetic mutations in familial Alzheimer’s genes. Other forms of systemic
disorders, which could also account for the progressive decline in both memory and
cognition function invariably need to be ruled out. Laboratory testing can aid in the
identification of conditions that need to be diagnostically eliminated in order to achieve

Chapter 1: General Introduction
6
a more accurate diagnosis when a dementia profile is being evaluated. A complete
blood cell count and urinalysis profile is necessary to exclude signs of anaemia and
infection; metabolic disorders can be evaluated through analysis of serum metabolites
(such as glucose, calcium, urea, and creatinine) as well as performing various liver
function tests to eliminate other certain metabolic disorders such as Wilson’s
syndrome or Laennec’s cirrhosis. Additionally, neurosyphilis as well as micronutrient
deficiencies in folate and B12 need to be excluded as they can simulate symptoms of
dementia, thereby making an accurate diagnosis more difficult to achieve [14].
Until recently there was no diagnostic test available that could reliably and
conclusively identify those individuals for increased presymptomatic risk of AD.
Consequently it was impossible to develop and implement effective preventative
measures to curb the progress of the disease. However, recently a simple non-
invasive skin test that measures dilation of blood vessels has been developed, that
reflects a decline in function in specific blood vessel cell types affected by the disease.
It is claimed that different dementias can be differentiated and that detection can be
made up to two years before conventional clinical diagnosis [15,16]. A further
technique has been developed that involves the use of an intravenous amyloidophilic
compound labelled with 19F. This compound when administered to Amyloid precursor
protein (APP) transgenic mice, specifically labelled amyloid plaques that could be
visualised in living subjects by magnetic resonance imaging (MRI). This technique
would allow the identification of the disease at an earlier stage in presymptomatic
individuals, and to determine disease progression in response to various preventative
measures and selected treatments [17].

Chapter 1: General Introduction
7
Although the pathogenesis of the disease is still not completely understood, it has
been shown that at post mortem there are two histopathological changes that occur
within the brain. These changes involve the abnormal clustering of proteins which
characterise individuals with AD. This abnormal clustering occurs in two forms: a)
those that occur within the neurons, i.e. the neurofibrillary tangles and b) those that
cluster extracellularly outside of the neuronal body, i.e. the amyloid based neuritic
plaques (Figure 2). Early changes occur within the entorhinal cortex projecting into the
hippocampus which leads to disruption of learning and short term memory processes.
Further protein deposits have been found within the temporal, frontal and inferior
parietal lobes mapping the spread of the disease throughout the brain. Later
developments in the pathology of AD include neuronal cell death resulting in loss of
tissue leading to overall shrinkage of brain size [10].
a) Tau based neurofibrillary tangle b) Amyloid based Neuritic plaque
Figure 2: Histopathological hallmarks of Alzheimer’s disease. a) Microscopic image of typical
neurofibrillary tangle. b) Microscopic image of a plaque showing a central β amyloid core
surrounded by black tau filaments.

Chapter 1: General Introduction
8
1.4 Tau and Neurofibrillary Tangles
Neurofibrillary tangles are composed of the microtubule associated protein tau, the
gene of which is located at chromosome 17q21.1 [18]. The TAU gene comprises of 15
exons, with 11 of the exons coding for all of the major tau isoforms. Splicing of exons
2, 3 and 10 result in the six different forms of the tau protein. These forms differ from
each other by the presence or absence of two N-terminal exons and a single C-
terminal exon which results in variation of their amino acid length which ranges from
352-441 [19].
Tau proteins are important as they associate with tubulin in the formation of
microtubules. Microtubules impart shape and structure to cells and generate cellular
transport networks that allow movement of micronutrients, neurotransmitters and
organelles that are essential for normal cellular function [20]. The tau protein of
neurofibrillary tangles consists of paired helical threads that are hyperphosphorylated.
This hyperphosphorylation leads to a dissociation between tau and tubulin resulting in
a breakdown in the brain transport network eventually leading to resistance to protein
degradation [20] , loss of biological activity and cell death [18,20].
The level of tau phosphorylation is probably determined by the regulation of protein
kinases that modify tau through phosphorylation, and phosphatases that
dephosphorylate the modified tau. Tau kinases such as GSK3, cdk5 and p38 are
known as proline kinases and regulate proline modified serine and threonine motifs.
Both Cyclic-AMP and Ca2+/cadmodulin dependent kinases together with protein
kinase C are known as non-proline kinases that modify non-proline serine and
threonine motifs. Sequences involved in binding tau to tubulin are coded for within the

Chapter 1: General Introduction
9
C-terminal exon and are positioned adjacent to the sequences for the tubulin binding
repeats [21] (Figure 3).
Tau phosphorylation is linked to microtubule stabilisation by regulating the binding of
tau to the microtubules. In AD under conditions following phosphorylation, decreased
binding occurs leading to a breakdown in microtubule stability resulting in tau
aggregation within the neurons [22]. Hyperphosphorylation may also lead to
microtubule spindle defects, resulting in aneuploidy for a number of chromosomes
including chromosome 17 that may lead to abnormal expression of Alzheimer’s related
genes such as TAU.
In the neurodegenerative disorder fronto-temporal dementia, the density of the
neurofibrillary tangles is directly correlated with the severity of exhibited dementia
[10,23]. This disorder is the result of point mutations within exon 10 of the TAU gene
such as Leu266Val and Glu342Val. The disorder is not associated with any amyloid
peptide formation or plaque deposition [24,25]. This is important as it suggests that
dementia can arise directly from abnormal processing and accumulation of tau [26,27]
that arises independently of any influence of abnormal amyloid metabolism.

Chapter 1: General Introduction
10
Arrows showing phosphorylation sites for Cyclic-AMP, Ca2+/calmodulin, protein kinase c(Non-proline dependent protein kinases)
GSK3,cdk5, p38
352 amino acid isoform with 3 Binding repeats
1 352
Arrows showing Phosphorylation sites for
(Proline directed protein kinases)
Amino acid
Figure 3: Tau molecule showing kinase phosphorylation sites. Modified from Gomez-Ramos[21]
1.5 β amyloid and neuritic plaques The amyloid based neuritic plaque occurs extracellularly to the neuron body having
originated within the neuron and been secreted as a soluble peptide. It is thought to be
the first histopathological change to occur in AD [10]. The plaque consists primarily of
the 42 amino acid β amyloid peptide (β amyloid 42) originating from the abnormal
processing of amyloid precursor protein (APP), the gene of which is located on
chromosome 21q21. APP is a cell surface protein of between 695 to 770 amino acids
long, and plays a functional role in neurite outgrowth, cell adhesion, synaptic functions
and the induction of apoptosis [28].
The protein runs through the membrane leaving a short intracellular terminal and a
longer terminal extracellularly (Figure 4) .The β amyloid peptide is normally snipped

Chapter 1: General Introduction
11
out of the APP protein that is adjacent to the cell membrane. APP proteolysis is
mediated by a series of secretase enzymes α, β, and γ [29,30]. Under normal
conditions, a harmless P3 fragment is formed by cleavage by α and γ secretases
resulting in a 40 amino acid β peptide [28,31].
Plasma Membrane
β Amyloid production
Extracellular
Intracellular
α secretaseβ secretase
γ secretase
APP protein
sAPPβsAPPα
83 amino acid APP fragment
Aβ40/Aβ42
99 amino acid carboxy APP fragment
695-770 amino acids
Harmless P3 fragment following α and γsecretase cleavage
Amyloid plaques
Figure 4: β amyloid production. APP is a membrane protein producing a number of isoforms
which range in size from 695-770 amino acids. Proteolysis of the APP protein involves α, β
and γ secretases. APP cleavage by α secretase releases sAPPα from the membrane leaving
an 83 amino acid APP fragment. Cleavage of the APP protein by β secretase releases sAPPβ
from the membrane and leaves behind a 99 amino acid fragment which can be further cleaved
by γ secretase to produce Aβ40/42 fragments extracellularly.
The α secretase is thought to be made up of metalloproteases of the tumour necrosis
factor α-converting enzyme and a disintegrin matrix [32]. Beta sectretase has been
identified as the enzyme BACE (beta site APP cleaving enzyme) the gene of which is
located on chromosome 11. The γ secretase is a complex multi protein comprising of
four components, Presenilin, nicastrin, Aph-1 and Pen2 all of which are required for
effective proteolytic activity [33].

Chapter 1: General Introduction
12
In the Alzheimer’s brain, aberrant proteolysis occurs involving β secretase which
produces a series of products, that after having been cleaved by gamma secretase,
gives rise to the β amyloid 42 [29]. Aberrant proteolysis results in an abnormal
accumulation of soluble β amyloid 42 which aggregates into oligomers. When
fibrillised and subjected to an astrocyte induced inflammatory response, it matures into
an insoluble neuritic plaque measuring between 10 -120µm. [28,31,34].
Intraneuronal β amyloid 42 is generated initially within the endoplasmic reticulum,
golgi body and endosomes of the neuron where it accumulates, eventually transferring
to the extracellular space of the neuron as a soluble peptide [35-38]. It has also been
shown to accumulate in those vulnerable areas of the brain that are sensitive to
Alzheimer’s related pathological changes such as the perikaryon of the pyramidal
neurons of the hippocampus and entorhinal cortex [39] (Figure 6). Intraneuronal β
amyloid 42 could be considered to be an early pathological biomarker of the disease
and has been shown to be a contributory factor to neuronal dysfunction.
Billings et al have shown in a transgenic mouse model that animals manifested
symptoms of cognitive impairment that correlated with intraneuronal β amyloid 42
accumulation within the hippocampus and amygdala [40]. The mice were free from
both tangle and plaque pathology suggesting these structures contribute to further
cognitive decline during the later stages of the disease. It may also be that they are
incidental endpoint structures that are not directly responsible for the causative factors
leading to the pathology of the disease. By clearing the Intraneuronal β amyloid 42
using immunotherapy, the observed cognitive deficits were attenuated when memory

Chapter 1: General Introduction
13
was assessed after measuring tasks that involve the hippocampus. This implies that
the intraneuronal β amyloid 42 has a role in the initiation of early stage cognitive
impairment and neuronal dysfunction in AD [40].
It has been shown that application of β amyloid 42 to cultured neurons is neurotoxic
and can directly initiate apoptosis [41,42]. The presence of β amyloid elevates
apoptotic vulnerability when cells are under conditions of increased oxidative stress,
which occurs naturally in the ageing brain. β amyloid induced oxidative stress results
in the generation of reactive oxygen species that can damage various cellular
components such as cell membrane proteins, mitochondrial DNA, lipids and
cytoplasmic proteins. In the brains of Alzheimer’s patients these components have
been shown to exhibit elevated levels of oxidative damage [43,44]. β amyloid causes
neurons to undergo apoptosis by sensitising their membranes following lipid
peroxidation. The normal ATPases associated with the membrane are impaired
leading to membrane depolarisation, and a disruption in glucose and glutamate
transportation and ATP energy depletion. β amyloid also modifies calcium flow across
the membrane [45]. Calcium is involved in mechanisms associated with memory and
learning as well as neuronal survival. The β amyloid peptide disrupts calcium
regulatory pumps within the membrane and elevates calcium influx through voltage
dependent channels, possibly as a result of induced oxidative stress leading in turn to
neuronal cell death [46].
Further signs of apoptosis in Alzheimer’s brains include elevated DNA fragmentation
and β amyloid induced caspase activation. Caspases are a family of cysteine
proteases and are the principal effectors of apoptosis. In Alzheimer’s brains caspase 3

Chapter 1: General Introduction
14
has been shown to use APP as a substrate, producing a potent apoptotic promoting
peptide called C31 [47]. Other caspases such as caspase 8, 9 and 12 have been
shown to contribute to neurodegeneration [48,49]. Nakagara et al has shown that
caspase 12 located in the endoplasmic reticulum (which regulates cellular responses
to stresses such as high calcium and free radicals) induces apoptosis as a result of β
amyloid toxicity [49]. It has been suggested that caspase activation occurs initially at
the nerve synapses [50], leading to an overall loss of cerebral nerve terminals and
interneuronal communication within the neuronal network. This gradual degeneration
of terminals may correlate with the individual’s level of cognitive impairment. As nerve
cells slowly undergo further terminal loss with the passage of time, the dysfunctional
neurons eventually die in those areas of the brain that are initially susceptible to β
amyloid toxicity.
1.6 Amyloid Cascade Hypothesis: Plaques or tangles? One of the topics that has generated a great deal of interest within Alzheimer’s
research is the question of which of the histopathological landmarks, the neurofibrillary
tangle or the neuritic plaque, appears first? Does one influence the development of the
other or do they in fact develop independently via two separate pathways? The
amyloid cascade theory was proposed to explain the etiology and progression of the
disease [51-53] and indeed still forms the backbone of explanation for Alzheimer’s
development. However in recent years, it has been found that certain observations
cannot be explained by the hypothesis in its current form [54,55]. The cascade theory
currently states that elevated deposits of the β amyloid 42 occur as a result of
missense mutations or a failure of clearance mechanisms that invariably lead to the
production of neuritic plaques. These plaques precede intracellular accumulation of

Chapter 1: General Introduction
15
tau and eventually result in neuronal cell death [52,53]. The hypothesis also suggests
that the plaques produce hyperphosphorylated tangles through the abnormal
regulation of kinases and phosphatases as the disease progresses [56].
Various lines of evidence have come to light in support of the hypothesis. Firstly,
mutations both within the APP and presenilin genes (genes implicated in early onset
AD) result in elevated production and accumulation of the β amyloid 42 [51,57,58].
The β amyloid 42 is more sensitive to fibrillization and therefore also more sensitive to
neuritic plaque formation [51]. Over-expression of the APP gene leads to elevated β
amyloid production resulting in the development of amyloid plaques. Down’s
syndrome patients possess three copies of chromosome 21 which codes for the APP
gene and are therefore susceptible to excessive expression of APP and possibly
generation of an excess of Aβ42. An identical brain histopathology to Alzheimer’s
patients is apparent in Down’s syndrome patients between the ages of 30-40 yrs [59-
61] with large numbers of tangles appearing between the third and fifth decades of life.
Secondly, mutations within exon 10 of the TAU gene give rise to frontotemporal
dementia characterised by cognitive impairment but occurring in the absence of
plaque formation [10,24,25]. This implies that severe tau production and accumulation
is sufficient to produce symptoms of dementia independently of amyloid plaques and
has little influence on the initiation of amyloid plaque formation. Thus Alzheimer
tangles would appear to be produced after changes in the amyloid production rather
than before [51]. Transgenic mouse models have been useful in yielding etiological
clues to both the progression and underlying mechanisms associated with disease.
JNPL3 transgenic mice expressing altered tau when crossed with Tg2576 transgenic
mice expressing altered APP showed no change in the number, age of development
Chapter 1: General Introduction
16
and morphology of the neuritic plaques produced. However an increase in tau positive
tangles was more substantial within the limbic system indicating a role for APP or β
amyloid 42 in the formation of neurofibrillary tangles [62]. This suggests that changes
in the processing of the APP gene occur prior to tau alteration. Additional experiments
involving crossing APP transgenic mice with apolipoprotein allele 4 (APOE4) deficient
mice resulted in offspring with a decrease in the deposition of beta amyloid, indicating
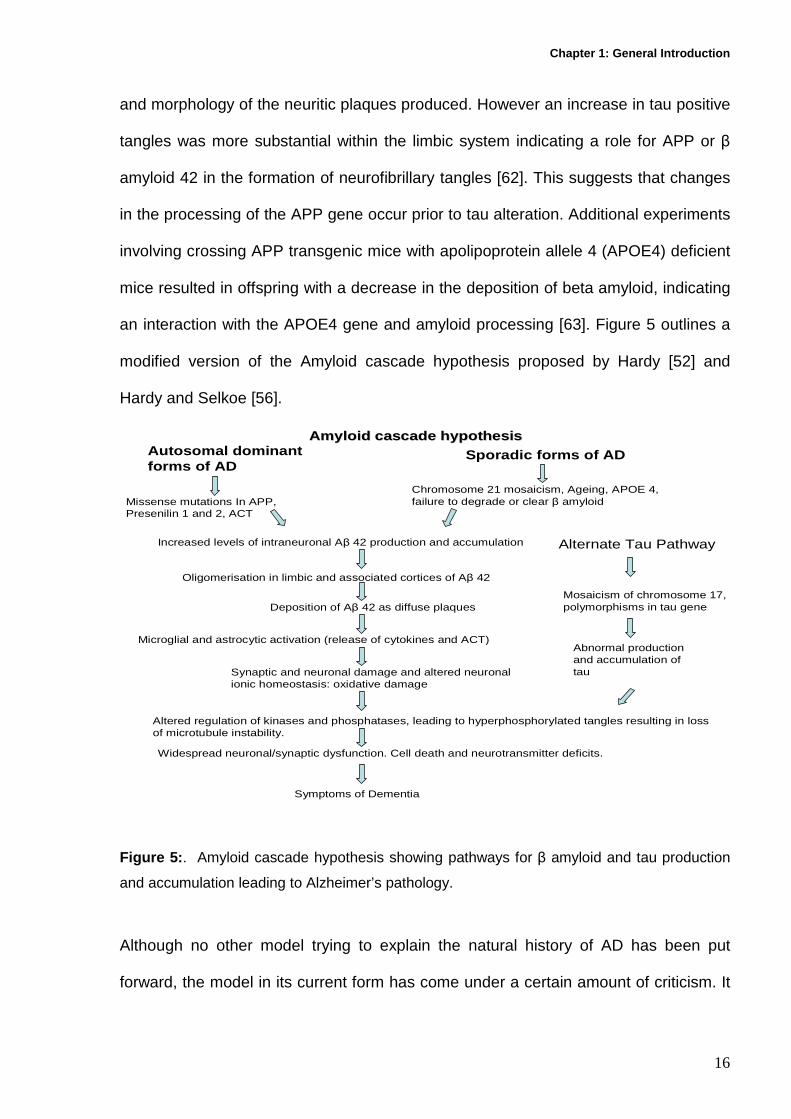
an interaction with the APOE4 gene and amyloid processing [63]. Figure 5 outlines a
modified version of the Amyloid cascade hypothesis proposed by Hardy [52] and
Hardy and Selkoe [56].
Amyloid cascade hypothesisAmyloid cascade hypothesisAutosomal dominant forms of AD
Sporadic forms of AD
Missense mutations In APP, Presenilin 1 and 2, ACT
Chromosome 21 mosaicism, Ageing, APOE 4, failure to degrade or clear β amyloid
Increased levels of intraneuronal Aβ 42 production and accumulation
Oligomerisation in limbic and associated cortices of Aβ 42
Deposition of Aβ 42 as diffuse plaques
Microglial and astrocytic activation (release of cytokines and ACT)
Synaptic and neuronal damage and altered neuronal ionic homeostasis: oxidative damage
Altered regulation of kinases and phosphatases, leading to hyperphosphorylated tangles resulting in loss of microtubule instability.
Widespread neuronal/synaptic dysfunction. Cell death and neurotransmitter deficits.
Symptoms of Dementia
Mosaicism of chromosome 17, polymorphisms in tau gene
Alternate Tau Pathway
Abnormal production and accumulation of tau
Figure 5: . Amyloid cascade hypothesis showing pathways for β amyloid and tau production
and accumulation leading to Alzheimer’s pathology.
Although no other model trying to explain the natural history of AD has been put
forward, the model in its current form has come under a certain amount of criticism. It

Chapter 1: General Introduction
17
has not been able to account for a number of observations that are important in the
pathology of AD. One of the main criticisms is that there is only a weak correlation
between plaque density and the degree of severity of dementia [64]. Additionally,
transgenic mice over-expressing the APP gene have been shown to exhibit little or no
neurodegeneration [65]. Further a small number of cases have been reported
involving exon 9 mutations within the Presenilin 1 gene involving Alzheimer’s patients
with spastic parapesis [66,67]. This condition is unusual in that few amyloid plaques
appear within the brains of affected individuals. Further evidence has indicated that
the neurofibrillary tangles appear at least a decade prior to the formation of neuritic
plaques [68,69]. Various studies have shown that tangles were present in areas of the
hippocampus and entorhinal cortex in all non-demented patients over sixty years of
age, whereas cases up to 90yrs old were found without plaques [70,71]. In their
monumental study investigating 2661 cases Braak and Braak [69] found neurofibrillary
tangles were evident in the entorhinal cortex in up to 98% of brains examined,
whereas only 70% had any evidence of neuritic plaque deposition [69]. Further
analysis showed that the initial phase of tangle development preceded plaques
deposition by up to two decades [72].

Chapter 1: General Introduction
18
Frontal lobe : Responsible for voluntary movements, intellect, speech and memory.
Temporal lobe : Involved in understanding sounds, emotion and memory.
Parietal lobe : Determines sensations of touch, temperature and shape awareness.
Occipital lobe : Responsible for understanding visual images and written word.
Hippocampus : Internal to the temporal lobe. Comprises of entorhinal cortex, subiculum, dendate gyrus and CA1. Involved in memory and spatial orientation
Figure 6 : Showing areas of brain affected by Alzheimer’s disease. The problem is therefore how to explain the substantial evidence supporting the
amyloid peptide as a causative agent of Alzheimer’s on the one hand, with the equally
strong evidence implying that tangle formation precedes plaque deposition and
therefore does not fit into the current cascade hypothesis model. It has been proposed
that neurofibrillary tangles are an independent feature accumulating slowly with age
within the medial temporal lobes. However under the influence of altered amyloid
metabolism, which leads to plaque formation during the initial stages of Alzheimer’s,
there is an acceleration of tangle formation that spreads further to include the
neocortex [70]. It appears that tangles form normally with age independently of plaque
formation. The density of tangles increases with age in an exponential fashion and
without any amyloid influence appears to remain confined to the medial lobe [73]. As
tangle physiology involves synaptic and neuronal loss there would be a stronger

Chapter 1: General Introduction
19
correlation between tangle density and degree of severity of dementia. This would be
facilitated as soon as tangle acceleration occurs as a result of plaque influence [70]. It
would appear that since its initial conception the cascade hypothesis has been
supported through a whole body of work that has emerged from laboratories from
around the world. Alternative models have not been proposed to explain deficiencies
within the cascade hypothesis with the same degree of experimental support that is
available for the current model. With the passage of time and with the emergence of
new experimental data, the current hypothesis will be either reshaped to explain the
pathogenesis of the disease or be replaced with an alternative model, which will have
to explain all facets of aetiology and progression of the disease.
1.7 Genetics of Alzheimer’s Disease Inheritance of known genes that predispose to AD accounts for only 5-10% of all
clinically presented cases [10,74]. Familial Alzheimer’s disease (FAD) can be
classified as either early onset or late onset. The genes implicated in early onset forms
of the disease which occur below 65yrs of age are the APP gene located on
chromosome 21q21; Presenilin 1 (PSEN1) located on chromosome 14q24.3 and
Presenilin 2 (PSEN2) on chromosome 1q31-q42 [23,74,75]. Mutations within the APP
occur around the processing sites of the APP molecule resulting in increased
production of the beta amyloid peptide [76]. Most cases containing APP mutations
have an age of onset between mid 40’s-50’s but can be modified by the presence of
the Apolipoprotein E (APOE) genotype [57]. Mutations within the APP gene appear to
be family specific and do not occur within the majority of sporadic Alzheimer’s cases.
Missense mutations within the PSEN 1 gene account for 18-50% of the early onset
autosomal dominant forms of AD [77]. Mutations within the PSEN1 lead to a

Chapter 1: General Introduction
20
particularly aggressive form of the disease having an age of onset between 30 and
50yrs, which is not influenced by the APOE genotype. However a polymorphism found
within intron 8 of the PSEN1 gene was found to be associated with the development of
the late onset form of the disease [77,78]. To date over 75 mutations have been found
within the PSEN1 gene in families worldwide that are associated with the early onset
form of the disease [31]. All mutations within PSEN1 increase production of the β
amyloid 42 [57,58]. Mutations within PSEN2 have a variable age of onset (40-80yr),
appear not to be influenced by APOE and result in increased β amyloid peptide
production [57].
The gene for APOE is located on chromosome 19q13.2 and certain polymorphisms
are associated with the late onset form of AD (>65yrs) [23,79]. The E3 allele is
considered normal and occurs in ~74% of the population; the E2 and E4 allele are
less common, occurring in 10% and 16% of the population respectively [10,79]. The
APOE gene does not cause Alzheimer’s but acts as a marker altering individual risk
based on possession of allelic combinations of the APOE4 allele [80]. The highest risk
is associated with the E4/E4 genotype. It has been proposed by Corder et al [80], that
each copy of the APOE4 allele reduces the age of onset by 7-9yrs. An average age of
onset of 85yrs is given for individuals with no E4 alleles, 75yr for one allele and 68yrs
for individuals with two copies of the E4 allele [23,80].

Chapter 1: General Introduction
21
PSEN 2 PSEN 1
APOEAPP
TAU
Figure 7: Chromosomes showing positions of the main Alzheimer’s related genes
Whereas genetic alterations in the previously mentioned four genes (Figure 7) are
generally accepted as being implicated in causing FAD, other studies highlighting the
potential role of other genes have come to light.
Alpha 2 macroglobulin functions as a protease inhibitor and has been found in neuritic
plaques. The gene is on chromosome 12p13.3 and variants of the gene are
associated with the late onset form of the disease [81,82].
Genetic linkage analysis has identified a potential AD gene at or near the Insulin
degrading enzyme gene found on chromosome 10q23-25 which is involved in the
cellular processing of insulin. At the current time further genetic analysis is being
undertaken to determine a thorough assessment of this potential locus [83,84].

Chapter 1: General Introduction
22
The monoamine oxidase A gene serves to regulate the metabolism of neuroactive and
vasoactive amines within the central nervous system. polymorphisms within this gene
have also been implicated in the pathology of AD [85].
Myeloperoxidase (MPO) is an enzyme present in circulating monocytes and
neutrophils and is part of the host’s polymorphonuclear leukocyte defence system.
MPO catalyses the production of the oxidant hypochlorous acid and is thought to
contribute to Alzheimer’s pathology through oxidation of either β amyloid or APOE
[86]. These events could result in direct neuronal damage or promote insoluble
amyloid complexes. It is interesting to note that the E4 isoform of APOE is the most
readily oxidised and neurotoxic, conferring upon it a contributory role to increased risk
for the disease [87]. Microglia in normal brain tissue do not express MPO but it has
been found to be expressed in the microglia of the senile plaques and neurons of the
hippocampus and superior frontal gyrus within Alzheimer’s brains [88]. The gene for
MPO resides on chromosome 17q23.1 and recently a polymorphism (G463A) has
been associated with a 1.57 fold increased risk for AD in individuals carrying the MPO
GG genotype [87]. Novel polymorphisms found within the TAU gene have been
associated with an increased risk for AD. A case control study looking at the TAU
IVSII+90G→A polymorphism showed a significant association between early age of
onset in males and the possession of the A allele. This suggests that the risk factor for
developing the disease may be modified as a result of both age and gender [89]. A
further case control study examining the IVSII+34 G→A polymorphism showed a five
fold increased risk in individuals who carried both the APOE4 allele and were either
heterozygous /homozygous for the G allele (GA, GG). This would suggest that the
combined effect of both these alleles may have a significant outcome on Alzheimer’s

Chapter 1: General Introduction
23
pathology [90]. Hyperdiploidy of chromosome 17 would also result in over expression
of both the MPO and TAU gene and may be expected to contribute to the etiology of
the disease.
Mutations within genes such as APOE, CYP46A1 and ABCA1 which play a role in
cholesterol and phospholipid metabolism have been investigated and shown to have
associations with AD. Recently a strong association between early onset Alzheimer’s
and polymorphisms within the ABCA2 gene have been shown adding support for the
role of these genes in Alzheimer’s pathology [91].
Alpha-1-antichymotrypsin (ACT) is a protease inhibitor and is associated with
astrocyte activity and the deposition of amyloid plaques. The G646T polymorphism
within the promoter region of ACT has been shown to be associated with a higher risk
for early onset AD. This higher risk factor occurs independently of the APOE 4
genotype; however the rate of cognitive decline is elevated in those individuals
homozygous for the ACT polymorphism and who also possess the APOE 4 genotype
[92].
It has recently been suggested through the results of linkage analysis that the
Ubiquilin 1 gene located at 9q22 could be a possible susceptibility gene for increased
risk for AD [93]. It plays an intriguing role in the degradation of proteins and has been
shown to interact with both PSEN1 and PSEN2, promoting the accumulation of
presenilin in vitro in cells over expressing both Ubiquilin 1 and presenilin 2 [94].
Further investigations will need to be undertaken to further assess the role of Ubiquilin
as a potential candidate risk gene for AD.

Chapter 1: General Introduction
24
It is apparent that numerous families exist that possess the Alzheimer’s phenotype but
do not conform to the current pattern of known Alzheimer’s genetics. This would
indicate that there are as yet other loci waiting to be discovered that can act as genetic
determinants for FAD.
Although much emphasis has been placed on the role of APOE as a risk factor, this is
because of the current body of evidence that firmly establishes it in its role as a
susceptibility gene relative to other known or unknown genetic risk factors. Other
genes that have been reviewed are currently potential susceptibility genes but their
status as definite risk factors can only be confirmed or refuted as additional evidence
comes to light resulting from further investigation e.g. mutations within the progranulin
gene on chromosome 17 have recently been found to play a role in dementia and may
eventually be classified as a definite risk factor once these initial observations have
been replicated [95].
1.8 Genomic Instability Events
1.8.1 Aneuploidy Damage to the genome could lead to altered gene dosage and gene expression as
well as contribute to the risk of accelerated cell death in neuronal tissues. DNA
damage events such as micronuclei formation, which are biomarkers of chromosome
malsegregation and fragility were found to be elevated in lymphocytes from individuals
suffering from AD [96]. Micronuclei from Alzheimer’s patients tended to be centromere
positive relative to normal controls when examined with a centromeric probe,
indicating whole chromosome loss rather than breakage, suggesting individual

Chapter 1: General Introduction
25
susceptibility to aneuploidy events possibly due to microtubule dysfunction [96,97].
Fluorescent probes for chromosome 13 and 21 were hybridised to lymphocyte
preparations from Alzheimer’s patients and showed an elevation in aneuploidy for both
chromosomes, but in particular for chromosome 21 [97],[98]. Further studies
investigating fibroblasts from both spontaneous and familial Alzheimer’s subjects
carrying mutations in the genes PSEN1, PSEN2, and APP were found to have a two
fold increase in the incidence of aneuploidy involving both chromosome 18 and 21
when compared to controls [99]. It is possible that chromosome aneuploidy,
particularly for chromosome 21, could be one of the mechanisms underlying both AD
and the dementia that occurs in Down’s syndrome patients [100].
Down’s syndrome (DS) is diagnosed cytogenetically as being aneuploid for
chromosome 21; individuals develop dementia that is histopathologically
indistinguishable from AD during the third or fourth decade of life [101]. Cells
containing trisomy 21 are found in both DS and Alzheimer’s patients. Over-expression
of the APP gene could lead to overproduction of the β amyloid 42 following cleavage
by the secretase enzymes, which is causally related to plaque formation in both DS
and Alzheimer’s brains [102]. APP processing is also altered in terms of the ratio of β
amyloid 42 over the normal 40 amino acid β amyloid peptide (Aβ40), resulting in the
increased production of the more amyloidogenic and neurotoxic form β amyloid 42
[102]. It has been proposed that individuals who are susceptible to AD may harbour
significant numbers of trisomy 21 neural stem cells that with the passage of time, can
result in brain segments having a DS phenotype which may contribute to the aetiology
of the disease [100]. It is possible that like DS this low level mosaicism may have
originated in utero as a result of age related parental non-disjunction, or under dietary

Chapter 1: General Introduction
26
conditions such as low folate status that has been shown to increase the rate of
chromosome 17 and 21 aneuploidy [103]. Alternatively, mosaicism may arise in those
individuals who have a predisposition to aneuploidy events, which involve unequal
mitotic segregation in aneuploid susceptible tissues within areas of the brain
undergoing post-maturation neurogenesis. Such areas that may be affected include
the dendate gyrus of the hippocampus that is involved in short term memory and
learning and is readily affected in the initial stages of Alzheimer’s. These individuals
are predisposed to develop the disease but over a longer period of time, due to the
smaller population of mosaic cells that over express genes that contribute to the
symptoms of the disease such as APP and TAU. These hypotheses are biologically
plausible however further evidence needs to be acquired to determine conclusively the
potential roles of these mechanisms in Alzheimer pathology. Mutated presenilin genes
that contribute to early onset FAD [104-106], produce proteins that have been found to
be localised within the nuclear membrane, centrosomes and interphase kinetochores
indicating a role in chromosome segregation and organisation [99,106]. Mutations
within these genes that predispose to early onset FAD [104-106], may alter the ability
of the resultant proteins to lock on and release chromosomes to the nuclear
membrane at the appropriate time during mitosis, hence leading to errors in
chromosome segregation [106].
Aneuploid cells may be susceptible to programmed cell death directly leading to neuro
degeneration by over expressing presenilins and APP that increase the cells
sensitivity to apoptotic stimuli [107]. These cells having succumbed to apoptosis may
then give rise to areas of inflammation, induced by the cerebral phagocytes microglia,
that surround the neuritic plaques. Microglia induce astrocytes by expressing
Chapter 1: General Introduction
27
Interleukin-1. The astrocytes in turn express α-chymotrypsin which promotes further
neurotoxic amyloid plaque formation [108,109].
Hyperphosphorylation of tau leads to a breakdown of the microtubule system which
may give rise to aneuploidy by causing defects in the mitotic spindle. Potentially an
elevation in chromosome 17 aneuploidy could lead to an over expression of the TAU
gene resulting in abnormal production and accumulation of the protein initiating further
neurofibrillary tangle formation. Additional chromosome 17 aneuploidy may occur as a
result of elevated levels of oxidative stress that are also associated with AD [110].
1.8.2 Telomere shortening, oxidative stress, breaka ge fusion bridge cycles and gene amplification.
Telomeres are hexanucleotide repeats that are located at the end of eukaryotic
chromosomes and their dysfunction has been implicated in AD. They play an
important role in maintaining genomic stability and preventing chromosomes from
becoming tangled and protect the chromosomal ends from being recognised as a site
of DNA damage [111,112]. During DNA replication somatic cells lose telomeric
repeats after every cell division undertaken, and therefore telomere length may serve
as a marker of a cells replicative history. Telomerase and associated proteins prevent
telomeres shortening in extreme proliferative cell types such as cancer cell lines and
stem cells. Telomerase is also present in other cells such as lymphocytes but at levels
that cannot prevent shortening of the telomeres leading to replicative senescence
[111,113].

Chapter 1: General Introduction
28
It has been shown that telomere shortening is associated with an elevated incidence
of certain cancers (head, neck, lungs, epithelial cancers such as prostate) and is
exacerbated by other risk factors such as ageing and smoking [114]. Other studies
have shown that individuals exhibiting accelerated telomere shortening die 4-5yrs
earlier and have higher incidences of heart disease compared to age and gender
matched controls [115]. Telomere shortening results in a decrease in lymphocyte
proliferation activity and has been shown to impair the immune system in AD.
Telomere shortening is also associated with T cell clonal expansion involving immune
responses to auto antigens in Alzheimer’s patients. Panossian et al [112] found
significant telomere shortening in peripheral blood mononuclear cells from Alzheimer’s
patients compared to controls. T cell telomere length correlated with deficits in
cognitive function, as assessed by the mini mental state examination which
determines cognitive decline [112]. Telomeres have also been found to be significantly
shorter in leukocytes of individuals suffering from vascular dementia compared to age
and gender matched controls [116]. Genomic instability resulting from telomere loss
may lead to gene over expression as a result of gene amplification, through the
repeated breakage and fusion of chromosomes that occur through the
breakage/fusion/bridge (BFB) cycle [117-119].
The cycle can be initiated by telomere end fusions with short telomeres, which fuse to
form a dicentric chromosome. If the fusion occurs between homologous chromosomes
the dicentric chromosome will contain two copies of a gene positioned between two
centromeres. These centromeres are drawn to opposite poles during anaphase and
break unevenly as cytokinesis occurs. This results in a chromosome containing two
copies of a gene and a fragment that has lost its initial gene copy. These multiple
Chapter 1: General Introduction
29
gene containing chromatids may further fuse during interphase to form another
dicentric chromosome increasing its gene complement which is then replicated during
nuclear division resulting in further amplification following the next BFB cycle [120,121]
(Figure 8).
It has been shown that smaller chromosomes such as chromosome 17 and 21 have
shorter telomeres than their larger genomic counterparts [122]. It may be possible that
these smaller chromosomes may be more susceptible to undergo BFB cycles [123],
resulting in over expression of Alzheimer’s related genes such as TAU and APP. This
hypothesis has biological plausibility but further evidence is required in order to
determine conclusively its role in Alzheimer’s pathology.

Chapter 1: General Introduction
30
Breakage fusion bridge cycle
(A)
(B) (C)
(D)
(E)
(F)
(G)
Short telomeres
Figure 8: Breakage fusion bridge cycle resulting from telomere end fusions.
A) Chromosomes with shortened telomeres form a dicentric chromosome resulting from
telomere end fusion forming a dicentric chromosome. B) The dicentric chromosome is
replicated during S phase (C) and centromeres are pulled at opposite ends of the poles at
anaphase (D). Uneven breakage of the dicentric chromosome results in altered gene dosage
producing daughter cells containing extra gene copies (amplification) (F) whilst the remaining
daughter cell (E) has a deleted gene copy number. The multiple copy number chromosomes
may fuse again to form a dicentric chromosome housing increased gene copy number (G).
The dicentric is further replicated at (C) and the cycle is repeated.
Differences in the telomere length of human chromosomes may be a contributory
factor relating to a higher incidence of specific chromosome aneuploidy [124].
Telomeres are implicated in the positioning of chromosomes by forming a point of
attachment to the nuclear membrane within the interphase nucleus and in chromatid
segregation during mitosis. Smaller chromosomes with shorter telomeres such as

Chapter 1: General Introduction
31
chromosomes 17 and 21 may be more susceptible to aneuploidy events as a result of
mitotic non-disjunction events or faulty interphase chromosomal positioning. It is also
possible that BFB cycle events involving dicentric chromosomes containing
homologous chromosomes may result in aneuploidy through the formation of
chromosomal end to end fusions resulting in subsequent gene amplification [122,125].
It has also been shown that telomere shortening is accelerated under conditions of
oxidative stress [116,126]. Some of the measurable genome instability events are seen
in Figure 9.
Figure 9: Genomic instability events. a) Lymphocyte showing micronuclei which are
biomarkers of chromosome loss or breakage. b) Lymphocyte showing fluorescent probes for
chromosome 17 and 21 to determine aneuploidy. c) Lymphocyte nucleus showing telomere
signals from a PNA fluorescent probe.
Oxidative stress is now accepted as playing a key role in the pathology of AD [127-
129], and is the result of an imbalance between elevated free radical production and a
decrease in either free radical scavenging or the mechanisms used to repair oxidised
macromolecules. This leads invariably to cellular dysfunction and eventual cell death.
a) Lymphocyte showing
micronuclei
b) Lymphocyte showing centromere specific fluorescent probes for Chromosome 17 (red) and 21(green).
c) PNA probes labelled With Cy5 hybridising to telomere sequence

Chapter 1: General Introduction
32
Free radicals such as the hydroxyl ion, hydrogen peroxide and peroxynitrite have been
shown to induce cytotoxicity by interacting with and damaging major components of
the cell through oxidation of lipids and nucleic acids including the nucleus, membrane
and cytoplasmic proteins, mitochondrial DNA as well as being involved with neurotoxic
metal complexes, thereby compromising their cellular function. Neurons appear to be
particularly vulnerable to the damaging effects of free radicals, they are known to have
low levels of natural antioxidants such as glutathione which would aid in protecting the
neuron [43], as well as requiring an increased oxygen demand to maintain brain
metabolism [130]. The elevated oxygen environment is ideal as it can be used as a
substrate in reactions with compounds that are primary producers of free radicals e.g.
β amyloid.
APOE may be beneficial by reducing neuronal death caused by β amyloid and
hydrogen peroxide by acting as an antioxidant [131]. Of the three allelic states the E2
isoform is the most effective antioxidant with the E4 allele (associated with late onset
AD) being the least effective in its protective capacity [132]. However it has also been
shown that the APOE4 isoform is the most sensitive to free radical attack compared to
the more resilient E2 isoform and that peroxidation levels in the brains of AD patients
that possessed the E4 allele are elevated compared to those individuals possessing
either the E2 or E3 allele [133].
It has recently been shown using a modified version of the comet assay that there is a
twofold increase in levels of DNA damage and oxidised DNA bases (pyrimidines and
purines) in leukocytes of individuals with mild cognitive impairment (MCI) and AD
when compared to matched controls [134]. MCI individuals display the initial signs of

Chapter 1: General Introduction
33
cognitive decline (memory loss) but not to the extent that they cannot pursue or
participate in everyday activities. This suggests that oxidative damage occurs at the
early stages of AD, as MCI patient’s progress to Alzheimer’s with an estimated
probability of 50% within four years or approximately 12% per year [134,135],
suggesting that MCI represents the early stages of the disease and that oxidative
stress directly contributes to disease pathology.
A further marker of oxidative stress 8-Hydroxy-2-deoxyguanosine (8-OHdG) is
elevated in both peripheral tissues of MCI and AD [129,134,136]. It has also been
shown that oxidative stress is clear within the post mortem Alzheimer’s brain where an
increase in mitochondrial and nuclear oxidative damage is evident [44,135].
Interestingly it appears that an increase in both 8-OHdG and 3- Nitrotyrosine within the
Alzheimer’s brain occur prior to the development of both tangles and plaques
indicating that oxidative stress may be one of the initiating factors leading to further
genomic instability [44,136,137].
The genome instability model of AD outlined in Figure 10 allows for the possibility that
certain disease states may have already been pre-determined in utero. Aneuploidy
prone individuals (either as a result of individual genome or micronutrient deficiency
e.g. folate) can give rise to low levels of mosaicism for individual chromosomes such
as chromosome 17 and 21. Gene amplification may occur as a result of telomere end
fusions (Figure 8). Aneuploidy may result in additional copies of both APP and TAU
leading to the altered homeostasis of both these proteins. The Alzheimer’s phenotype
becomes apparent in stem cells which differentiate into neural stem cells with
abnormal APP and tau levels, which with the passage of time influence the initial

Chapter 1: General Introduction
34
stages of neurodegeneration. These stem cells could also differentiate into non-neural
somatic cells (e.g. buccal or fibroblast which having an elevated tau and APP level)
and could be used to study genomic instability events such as elevated micronuclei
and aneuploidy.
Genome instability model of Alzheimer’s disease
Telomere shortening
a) Oxidative stress b) Micronutrient deficiency
Breakage fusion bridge cycle
Increased gene amplificationIncreased aneuploidy 17 and 21in stem cells
Defects in APP and Tau expression and processing.
Inherited genetic defects
Increased neuronal cell death
Neurodegenerative disease
In Utero
Alzheimer phenotype in stem cell subsets.
Abnormal APP and Tau in non neural somatic cells
Elevated MN, aneuploidy excess APP, βamyloid and Tau in somatic tissues
Figure 10 . Genome instability model of Alzheimer’s disease.

Chapter 1: General Introduction
35
1.9 Dietary and Nutrigenetic factors that affect Al zheimer disease risk
1.9.1 B Vitamins
Many case control studies have shown that Alzheimer’s patients have been found to
be deficient in certain micronutrients such as folate, vitamin B12 but have elevated
levels of the sulphur based amino acid homocysteine [138,139]. These factors are
associated with increased micronucleus formation and the alteration of methylation
patterns that could modify gene expression [120,140,141]. Folate and vitamin B12
play an important role in DNA metabolism. Folate is the methyl donor for the
conversion of dTMP from dUMP which is required for DNA synthesis and repair.
Under conditions of low folate, dUMP accumulates producing DNA strand breaks and
micronucleus formation as a result of uracil misincorporation into DNA in place of
thymine [120,142]. Both folate and Vitamin B12 are required in the synthesis of
methionine through the remethylation of homocysteine, and in the synthesis of S-
adenosyl methionine (SAM) which is involved in maintaining genomic methylation
patterns that determine gene expression [143]. Folate deficiency reduces SAM
resulting in the depletion of cytosine methylation in DNA, and thereby elevating
homocysteine levels. Additionally folate deficiency has been shown to increase
trisomy of chromosome 17 and 21 which code for the TAU and APP genes
respectively [103].
Hyperhomocysteinemia has been shown to be a strong independent risk factor for AD
in a number of epidemiological studies [144-148]. It appears that nervous tissue may
be extremely sensitive to excessive homocysteine as it promotes excitotoxicity and
damages neuronal DNA giving rise to apoptosis [149]. Studies have also shown a

Chapter 1: General Introduction
36
strong correlation between a reduction in hippocampal width, which is associated with
short term memory loss and concentrations of plasma homocysteine [150]. Recently
MRI measurements have shown that an inverse relationship exists between plasma
homocysteine and cortical and hippocampal volume [151]. The above findings have
been interpreted as involving neuronal damage within the hippocampal regions
leading to memory loss, which is characteristic of AD. Elevated homocysteine has also
been implicated as playing a role in an iron dysregulation/oxidative stress cycle that is
thought to be central to the pathogenesis of the disease [152]. Homocysteine levels
are usually maintained within physiologically correct limits by remethylation to
methionine in a reaction involving folate and vitamin B12 (Figure 11). Homocysteine
can also be converted to cystathionine by the involvement of the enzyme
cystathionine β-synthase, resulting in increased levels of glutathione which is a natural
anti oxidant [153].
Studies have shown that supplementation with B group vitamins such as folate, B12
and B6 reduce the levels of homocysteine in patients suffering from AD [138,154]. It
has also been shown that low levels of B12 are associated with reduced memory
recall in those individuals who are APOE4 carriers who are at greater risk of
developing dementia. These individuals may derive benefits in memory recall by
enhancing supplementation of both folate and B12 [155]. Niacin (Vitamin B3) has a
role in DNA synthesis and repair as well as in neural cell signalling. Recently it has
been implicated in reducing cognitive decline and protecting against the onset of AD.
Individuals consuming niacin in excess of 22.4mg/day were estimated to be 80% less
likely to suffer cognitive decline when compared to groups consuming lesser amounts
[156]. Niacin is also essential as a precursor for Nicotinamide adenine dinucleotide

Chapter 1: General Introduction
37
(NAD) an essential cofactor for poly ADP ribose polymerase which has been shown to
play an essential role in memory function of the mollusc Aplysia [157]. NAD dependent
sirtuins such as SIRT1 have been implicated as one of the key regulatory factors
influencing extended lifespan under conditions of calorific restriction. It has also
recently been shown that SIRT1 promotion may influence Alzheimer neuropathology
by activating kinases that regulate the processing of APP [158]. Although these initial
results are promising, further studies need to be performed to verify conclusively the
role of niacin as an effective therapy in the protection against AD.
1.9.2 Mutations in Folate, Methionine metabolism ge nes As AD is related to low folate, B12 and elevated homocysteine levels, investigators
have looked towards genetic polymorphisms within the folate methionine pathway
(Figure 11) to explain these micronutrient differences. Polymorphisms within these
genes may alter folate metabolism as a result of reduced enzyme activity. A
polymorphism resulting in altered folate metabolism and increased homocysteine
occurs within the methylenetetrahydofolatereductase gene (MTHFR). MTHFR
converts 5, 10 methylenetetrahydrofolate to 5- methyltetrahydrofolate which donates a
methyl group for remethylation of homocysteine to methionine. A common
polymorphism involves the C to T transition at position 677 resulting in an alanine to
valine substitution and reduced enzyme activity. Enzyme activity of the heterozygote
C/T and the homozygote TT is reduced by 35% and 70% respectively when compared
to the normal C/C genotype [159]. Homozygosity for the T allele occurs in ~9% of
Caucasian populations and is associated with reduced enzyme activity resulting in
mild to moderately elevated homocysteine levels [160]. Other polymorphisms within

Chapter 1: General Introduction
38
the MTHFR gene include A1298C and G1793A which may have regulatory roles in the
activity of the enzyme [161]. In determining the risk factor of C677T in relation to AD
no association between C677T and increased susceptibility to Alzheimer’s risk was
found [162]. However if combinations of polymorphisms within a gene are considered
together then sometimes effects become apparent that are not always evident if those
same polymorphisms are considered in isolation. Wakutani et al [163] found that the
MTHFR 677C-1298C-1793G haplotype to be protective in Japanese populations
against late onset AD [163]. Methionine synthase (MTR) catalyses the remethylation
of homocysteine to methionine. The A2756G polymorphism within the MTR gene has
been shown to be associated with hyperhomocysteinemia, and to be an APOE4
independent risk factor for AD [164]. This implies that alterations within the genes for
enzymes of the homocysteine metabolic pathway are involved in Alzheimer’s
pathogenesis [165].

Chapter 1: General Introduction
39
MTHFR
dUMP
DIET
CH3
dTMP
Polyglutamates
DNA synthesisand repair
DNAmethylation
Gene expression andgenome stability
Tran sulphuration pathway (cysteine
synthesis)
DHF
THF
5,10-MethyleneTHF
Homocysteine
Methionine
SAM
SAH5-Methyl THF
B12
Monoglutamates SerineGlycine
SHMT/B6
CBS/B6Serine
ThymidylateSynthase
METHIONINESYNTHASE
Folate and Methionine Pathway
NeurotransmitterSynthesis
Figure 11 . Metabolism of Folic Acid. Adapted from Wagner C., Biochemical Role of Folate in
Cellular Metabolism. Folate in Health and Disease. Bailey L.B.(Ed), p 26, 1995. SAM: S-
Adenosyl Methionine, SAH: S-Adenosyl Homocysteine, CBS: Cystathione b Synthase, THF:
Tetrahyrdofolate, DHF: Dihydrofolate, MTHFR: Methylene Terahydrofolate Reductase, SHMT:
Serine hydroxy-methyltransferase,
1.10 Methylation
Changes in methylation patterns of ageing cells involve global hypomethylation and
CpG island hyper-methylation. Folate deficiency decreases S-adenosyl methionine
(SAM) levels which act as a methyl donor for gene regulation, thereby potentially
impairing methylation pathways. Individuals with AD were found to have reduced
levels of SAM both in the brain and cerebrospinal fluid [166]. SAM also activates the
enzyme Cystathionine β-synthase (CBS) which is highly expressed in the

Chapter 1: General Introduction
40
hippocampus and cerebellum [167]. CBS reduces homocysteine to cystathionine and
L-cysteine producing hydrogen sulphide which acts as a neural modulator by
facilitating hippocampal long term potentiation and therefore may have a role in
learning [167,168]. Hydrogen sulphide has also been shown to protect neurons
indirectly from oxidative stress by promoting the production of the potent antioxidant
glutathione [169]. CBS activity is reduced in AD patients, resulting in a decrease in
hydrogen sulphide and an elevation in homocysteine, which may play a role in the
cognitive decline associated with the disease [168,170].
It has been shown that low satellite DNA methylation leads to aneuploidy and
breakage of chromosome 1 which codes for PSEN2 [141,171], whereas low genome
promoter methylation leads to increased expression of PSEN1 and BACE (β
secretase) resulting in elevated Aβ production [140,172]. It has also been shown that
a reduced DNA methylation status in the APP gene results in increased production of
the β amyloid 42, which leads to further elevated plaque deposition [173]. Moreover,
when methylation status is increased by the addition of SAM a normalisation of the
PSEN1 and BACE expression occurs in vitro thus restoring normal gene expression
leading to a reduction in Aβ levels [140]. Alzheimer’s related genes may also be
amplified via breakage-fusion-bridge cycles caused by folate deficiency [120] although
direct evidence for this possibility has yet to be published. Therefore promoter
hypomethylation, aneuploidy and gene amplification resulting from deficiencies in
folate and B12 and elevated homocysteine, may contribute to abnormally increased
expression of genes relating to AD.

Chapter 1: General Introduction
41
1.11 Antioxidants
Oxidative stress and inflammation have been implicated as some of the main
contributing factors in the pathogenesis of AD. Recently a number of studies have
come to light that show the positive effects of dietary antioxidants as an aid in
reducing potential neuronal damage by free radicals [43,174,175].
The Cache County study has shown that combined supplementation with antioxidant
Vitamins C and E may reduce the prevalence of AD [176]. It has recently been shown
that hippocampal gene expression in mice can be influenced by a deficiency in
Vitamin E. Important genes regulated by vitamin E were associated with the clearance
of beta amyloid, programmed cell death and neurotransmission, suggesting a
protective role on Alzheimer’s progression [177].
Curcumin is the yellow phenolic pigment in the Indian curry spice turmeric. It has been
shown to possess both antioxidant and anti-inflammatory properties as well as the
ability to reduce beta amyloid 42 toxicity by preventing the formation of beta 42
oligomers leading to amyloid plaques [178,179]. In animal models curcumin was
shown to inhibit amyloid plaque formation by blocking the aggregation of the beta
fibrils that make up the structure of the amyloid plaque [179,180]. Curcumin may also
prevent the formation of plaques by behaving as a chelator, binding metals such as
copper and iron that have been shown to form complexes with beta amyloid 42
resulting in oxidative stress and free radical formation [181].
Out of 60 fruit and vegetables analysed for their antioxidant capability, blueberries
rated highest in their ability to mop up free radicals [182]. Blueberries contain high

Chapter 1: General Introduction
42
levels of the antioxidant anthocyanins; these prevent damage to the collagen matrix of
cells by forming complexes with collagen fibres, to form a more stable structure that is
more resistant to the damaging effects of free radicals [183]. In animal models it
appears that blueberries not only protect against oxidative damage, but also play a
vital role in preventing cognitive decline in mice genetically engineered to develop the
amyloid plaques typical of AD [183,184].
Proanthocyanins, a group of polyphenol compounds that occur within grape seed
extract (GSE), have been found to be up to 20 times more effective in scavenging free
radicals than vitamin E, and up to 50 times more effective than vitamin C [185]. In
experiments involving brain cells from rats, it was shown that cells treated with GSE
and then exposed to beta amyloid were protected against free radical accumulation
and neuronal damage, compared to GSE untreated brain cells that subsequently died
as a result of free radical accumulation [186]. It has also been shown that GSE used
as a dietary supplement affects certain proteins within the healthy brain that may
serve to protect against brain ageing and future age related dementia [187].
Green tea has been shown to contain antioxidant flavonoids that can protect against
neuronal damage caused by free radicals. One of the mechanisms by which green tea
offers protection, is by its action as a chelating agent, binding excess iron levels which
serve to reduce the amount of oxidative stress caused from free radical production
[188].
Animal studies involving Alzheimer’s transgenic mice show that a green tea flavonoid
epigallocatechin-3-gallate (EGCG) has the ability to reduce levels of beta amyloid and

Chapter 1: General Introduction
43
neuronal plaques within the brain [189]. This suggests that dietary supplementation
with EGCG may be effective in preventing plaque formation that is characteristic of the
disease.
Acetylcholine is a neurotransmitter that is reduced in AD. Green tea has been shown
to inhibit the activity of certain brain enzymes associated with reduced cognitive
function and the development of AD [190]. Green tea drinkers were found to have
lower activity in both acetylcholinesterase which breaks down acetylcholine and
butylcholinesterase which has been found in brain deposits of Alzheimer’s patients. β
secretase an enzyme that plays an integral role in the aberrant proteolysis of APP
resulting in plaque formation was also found to have lower enzyme activity in
individuals exposed to green tea flavonoids [190]. A study investigating cognitive
function and green tea consumption revealed that individuals who drank more than 2
cups of green tea a day had a 50% lower chance of developing memory disorders
compared to individuals who drank less than 3 cups a week. Cognitive function was
determined by the use of the mini mental state examination, a method that is widely
used to assess changes in the cognitive status of individuals [191].
Continued studies into the chemo-preventative components of foodstuffs are
important, in order to quantify their role as protective therapies for AD.

Chapter 1: General Introduction
44
1.12 Copper, Iron, Zinc, Selenium and Aluminium
Recently, associations between metals such as copper (Cu2+), iron (Fe2+) and zinc
(Zn2+) and amyloid plaques have been proposed as a potential mechanism to explain
the aetiology of AD. Metals play a major catalytic role in the generation of free radicals
which are known to be toxic and induce cellular damage at both DNA and protein
levels. High concentrations of Cu2+, Zn2+ and Fe2+ are found in the cerebral neocortex
[192]. These ions are released during neurotransmission resulting in increased ion
concentration within the synaptic region [193]. It has been shown that the
concentration of these ions is elevated within the extracellular beta amyloid plaques
[194-196]. Both copper and iron initiate the aggregation of beta amyloid peptides
under slightly acidic conditions [197]. The precipitation and redox potential of β
amyloid can be modified through reduction reactions utilising oxygen as a substrate to
produce hydrogen peroxide [194,197,198]. Hydrogen peroxide is highly permeable
and diffusible, whereupon it can induce apoptosis and necrosis and produce highly
reactive hydroxyl ions bringing about further cellular damage [199]. The resultant
hydrogen peroxide offered a possible mechanism to explain neurotoxicity and cell
death mediated by the beta amyloid–metal complexes [198].
Zinc2+, unlike copper and iron, is redox inert, but is still found in elevated levels within
the amyloid plaques [194-196,200]. It appears that zinc, like copper and iron, can
initiate amyloid precipitation, however it has an inhibitory effect on hydrogen peroxide
production by competing with other metals for active sites on the β amyloid [197,201].
It is thought that zinc leads to beta amyloid aggregation at the physiological pH of
about 7.4 and this results in an inability of the plaques to be cleared or broken down.
Zinc has been shown to have some antioxidant activity in relation to minimising the
Chapter 1: General Introduction
45
neurotoxic effect of the β amyloid 42; however it is not completely effective in
alleviating peroxide production and apoptosis. It would appear as if zinc could
potentially play a dual role depending on the concentration of the ion present. At lower
levels it appears to render β amyloid less toxic whereas at elevated levels it
contributes to plaque formation.
Further support for the involvement of zinc in the histopathology of AD was
demonstrated by Lee et. al. who showed a reduction in beta amyloid production in the
brains of mice that were deficient for zinc transporters which are required for transport
of zinc into synaptic vesicles [202]. It has been proposed that release of excessive
synaptic zinc during neurotransmission, could contribute to plaque formation which is
dominant to the histopathology of AD [202]. The selenium present in Brazil nuts, tuna
and some meats has been shown to be inversely associated with levels of
homocysteine. It was found that serum selenium had a greater regulatory capacity to
minimise homocysteine levels in elderly persons, even when compared to folate
regulatory levels [203]. Selenium is also indirectly responsible for maintaining levels of
antioxidants such as vitamin C and E intact via the enzyme glutathione peroxidase.
The metalobiology of aluminium and its role as a risk factor in AD has been a
controversial issue. The purported relationship between aluminium and AD was based
on studies reporting the detection of aluminium in the neurofibrillary tangles [204,205]
and neuritic plaques [35,206]. However later studies found no evidence of aluminium
in the plaques of Alzheimer patients [207]. Similar patterns emerge from
epidemiological studies investigating environmental levels of aluminium in drinking
water. Some studies showed a positive association whereas others reported no such

Chapter 1: General Introduction
46
relationship [208,209]. To date the evidence is considered circumstantial
demonstrating no definite causal relationship between aluminium, and AD.
Government regulatory agencies together with the medical research community
review the current evidence at regular intervals, but to date no public health
recommendations have been put forward regarding aluminium and AD risk.
1.13 Conclusion
AD was once described as like being slowly immersed into a dissipating fog, that
surrounds everything that is familiar and everything that characterises the make up of
an individual [210]. As the fog descends and thickens so everything loses its form and
function. As we stare into the 21st. century we are faced with a disease that is
predicted to make a pronounced impact on our lives both socially and economically.
The prospect of an early and conclusive diagnostic test based on abnormal
expression of APP, tau and genome instability markers is essential in order to identify
individuals presymptomatically who are at an increased risk for developing AD. Once
this has been achieved this may allow us to develop and implement effective
preventative measures against AD, as well as other degenerative diseases caused by
an excessive genome damage rate.

Chapter 2: Buccal cytome in ageing and Down’s syndr ome
47
2 Chapter 2: The buccal cytome and micronucleus
frequency is substantially altered in Down’s syndro me
and normal ageing compared to young healthy control s

Chapter 2: Buccal cytome in ageing and Down’s syndr ome
48
2.1 Abstract The buccal micronucleus cytome assay was used to investigate biomarkers for DNA
damage, cell death and basal cell frequency in buccal cells of healthy young, healthy
old and young Down’s syndrome cohorts. With normal ageing a significant increase in
cells with micronuclei (P<0.05, average increase +366%), karyorrhectic cells
(P<0.001, average increase +439%), condensed chromatin cells (P<0.01, average
increase +45.8%) and basal cells (P<0.001, average increase +233%) is reported
relative to young controls. In Down’s syndrome we report a significant increase in cells
with micronuclei (P<0.001, average increase +733%) and binucleated cells (P<0.001,
average increase +84.5%) and a significant decrease in condensed chromatin cells
(P<0.01, average decrease -52%), karyolytic cells (P<0.001, average decrease -
51.8%) and pyknotic cells (P<0.001, average decrease -75.0%) relative to young
controls. These changes show distinct differences between the cytome profile of
normal ageing relative to that for a premature ageing syndrome, and highlights the
diagnostic value of the cytome approach for measuring the profile of cells with DNA
damage, cell death and proportion of cells with proliferative potential (i.e. basal cells).
Significant correlations amongst cell death biomarkers observed in this study were
used to propose a new model of the inter-relationship of cell types scored within the
buccal micronucleus cytome assay. This study validates the use of a cytome approach
to investigate DNA damage, cell death and cell proliferation in buccal cells with
ageing.

Chapter 2: Buccal cytome in ageing and Down’s syndr ome
49
2.2 Introduction Ageing is an inevitable consequence of the life cycle of any organism. It is
characterised by a general reduction in physiological efficiency and function resulting
in homeostatic imbalance, leading to both morbidity and eventual mortality [211,212].
Ageing appears to be the result of genetically predetermined events resulting in
phenotypic changes to both cellular and nuclear structure. Such events may be
caused by genetic defects, micronutrient deficiency [142,213] or external influences
such as environmental toxins [214]. Ageing inevitably results in an elevation in
genomic instability events that are associated with a decreased capacity for repair of
cellular or DNA damage [215,216]. It has been shown that genomic instability
biomarkers such as micronuclei are elevated with advancing age in accessible
somatic tissues such as peripheral lymphocytes and fibroblasts [217-219]. However,
cell types that repair DNA damage efficiently are likely to show lower levels of residual
damage than cells less proficient in DNA repair [220,221]. Buccal cells have been
shown to have limited DNA repair capacity relative to peripheral blood lymphocytes,
and therefore may more accurately reflect age related genomic instability events in
epithelial tissues [222].
A thorough understanding of the effects of ageing on micronucleus formation and
other nuclear anomalies is essential, before the buccal cell system can be properly
used to assess the impact of dietary and environmental factors on DNA damage and
cytotoxicity in this important epithelial tissue. Therefore, a buccal micronucleus cytome
assay was used to investigate biomarkers for genomic instability and cell death, as
well as frequency of basal cells in healthy young, healthy old and a Down’s syndrome
(DS) cohort as a model of premature ageing, in an attempt to identify unique changes

Chapter 2: Buccal cytome in ageing and Down’s syndr ome
50
in the profile of the buccal mucosa between these three groups [223]. Figure 1a
illustrates diagrammatically the various cell types and nuclear anomalies observed
and scored in the buccal micronucleus cytome assay. Figure 1b illustrates a possible
model of the spatial relationships of these various cell types.
Normal Basal Cell
CELL DEATH CELLS DNA DAMAGE CELLS
Condensed chromatin cell
Karyorrhectic cell
Pyknotic cell
Karyolytic cell
Normal differentiated cell
Micronucleated differentiated cell
Nuclear bud cell
Binucleated cell
Micronucleated basal cell
NORMAL CELLS
Figure 1a : Diagrammatic representation of the various cell types observed in the
buccal cytome assay based on the scheme proposed by Tolbert et al [224]

Chapter 2: Buccal cytome in ageing and Down’s syndr ome
51
Cross section of normal healthy buccal mucosa
RETE PEGSBasal Cells
ORAL CAVITY
Stratum Corneum
Stratum Granulosum
Stratum Spinosum
Key: Condensed chromatin
Karyorrhectic
Keratinised
KaryolyticBasal
Micronucleateddifferentiated Pyknotic
Figure 1b : Shows a cross section of normal buccal mucosa of healthy individuals
illustrating the different cell layers and possible spatial relationships of the various cell
types.
2.3 Methods
Approval for this study was obtained from CSIRO Human Nutrition, Adelaide
University and Southern Cross University human experimentation ethics Committee’s.
30 younger controls (age 18-26yrs), 31 older controls (age 64-75yrs) and 21 DS
individuals (age 5-20yrs) not receiving anti-folate therapy or cancer treatment, were
recruited for the study. Volunteers did not receive any remuneration for their
participation. There were no gender ratio differences between the control and DS
cohorts (P>0.05). Demographic characteristics of the cohorts are shown in Table 1.

Chapter 2: Buccal cytome in ageing and Down’s syndr ome
52
Table 1 Age and gender ratio of cohorts studied Young controls Down’s
Syndrome Older controls
Age (years) Group size 30 21 31 Mean±S.D 22.47±2.177 10.43±5.582 67.1±2.57 Range 18-26 5-20 64-75 Gender Group size 30 21 31 Male 15 11 12 Female 15 10 19
2.3.1 Cell sampling and preparation
Buccal cells originate from a multilayered epithelium that lines the oral cavity. Buccal
cells were collected from consented volunteers using an established procedure based
on a modified version of the method used by Beliën et al [225]. Prior to buccal cell
collection the mouth was rinsed thoroughly with water to remove any unwanted debris.
Small headed toothbrushes (Supply SA, code 85300012) were used to collect buccal
cells by rotating the brush 20 times in a circular motion against the inside of the cheek,
starting from a central point and gradually increasing in circumference to produce an
outward spiral effect. Both cheeks were sampled using separate brushes. The heads
of the brushes were individually placed into separate 30ml yellow top containers
(Sarstedt code 60.9922.918) containing buccal cell (BC) buffer (0.01M Tris-HCL
(Sigma T-3253), 0.1M EDTA tetra Sodium salt (Sigma E5391), 0.02M Sodium chloride
(Sigma S5886)) at pH 7.0 and agitated to dislodge the cells. Cells from both right and
left cheeks were transfered into separate TV-10 centrifuge tubes (Sarstedt, code
60.9921.829) and spun for 10 mins at 1500rpm (MSE Mistral 2000). Supernatant was

Chapter 2: Buccal cytome in ageing and Down’s syndr ome
53
removed and replaced with 10mls of fresh BC buffer. The BC buffer helps to inactivate
endogenous DNAases and aids in removing bacteria that may complicate scoring.
Cells were spun and washed twice more, with a final volume of 5mls of BC buffer
being added to the cells. Buccal cells occur as an epithelial cell layer. Therefore, in
order to improve slide preparation and analysis each sample was treated to produce a
single cell suspension. The cell suspension was vortexed for 10 seconds and then
thoroughly dispersed for 2 mins in a hand homogeniser (Wheaton scientific 0.1-0.15
mm gauge) to increase the number of single cells in suspension. Left and right cheek
cell populations were pooled into a 30ml yellow top container and drawn into a syringe
with a 21G gauge needle and expelled to induce further cellular separation. Cells were
then passed into a TV-10 tube through a 100µm nylon filter (Millipore,code
MILNYH02500) held in a swinex filter (millipore, code MILSX0002500) to remove large
aggregates of unseparated cells that hinder scoring of various cell types. Cells were
further spun at 1500rpm for 10mins and the supernatant removed. Cells were
resuspended in 1ml of BC buffer and the cell concentration determined by a Coulter
counter (Beckman Coulter Model ZB1, Settings Attenuation:1, Threshold:8,
Aperture:1/4, Manometer:0.5). Cell suspensions were prepared containing 80,000
cells/ml after initial readings from a 1:50 dilution (300µl/15mls isoton). 50 µl/ml of
Dimethyl Sulphoxide (Sigma 2650) was added to further improve cell separation. 120
µl of cell suspension was added to cytospin cups and spun at 600 rpm for 5 mins in a
cytocentrifuge (Shandon cytospin 3). Slides containing two spots of cells were air
dried for 10 mins and then fixed in ethanol:acetic acid (3:1) for 10 mins. Slides were
air dried for 10 mins proir to staining.

Chapter 2: Buccal cytome in ageing and Down’s syndr ome
54
2.3.2 Feulgen staining and slide scoring
Fixed slides were treated sequentially for 1 min each in 50% and 20% ethanol and
then washed for 2 mins in deionised water generated from a Milli-Q water purification
system (Adelab Scientific, South Australia). Slides were treated in 5M hydrochloric
acid for 30 mins and then washed in running tap water for 3 mins. Slides were drained
but not allowed to dry out before being treated in room temperature Schiff’s reagent
(Sigma 3259016) in the dark for 60 mins. Slides were washed in running tap water for
5 mins and rinsed well in deionised water for 1 min. Slides were stained for 30 secs in
0.2% light green (Sigma L-1886) and rinsed well in deionised water for 2 mins. Slides
were allowed to air dry, covered with No 1 coverslips (Crown Scientific, South
Australia) and mounted in DePeX (BDH 361254D). Using transmitted light
microscopy, nuclei and micronuclei appear magenta in colour, whilst the cytoplasm
appears green. Slides were scored using a Nikon E600 microscope equipped with a
triple band filter (Dapi, FITC and Rhodamine) at 1000X magnification. Cells containing
micronuclei on bright field can be confirmed as being positive by examining the cell
under fluorescence. This minimises the incidence of false positives, as DNA material
such as nuclei and micronuclei fluoresce when viewed under fluorescence with a far
red filter (Figure 2).

Chapter 2: Buccal cytome in ageing and Down’s syndr ome
55
NormalDifferentiated cell
MN
Differentiated cellWith Micronucleus
Differentiated cell with nuclear bud
Karyorrhectic cell
Figure 2. Image of same cells under both Feulgen and fluorescence. The use of
fluorescence microscopy helps to clarify the presence and morphology of nuclear
material thereby reducing the possibility of recording false positives and/or false
negative results.
2.3.3 Scoring criteria for buccal cytome assay
The various distinct cell types and nuclear anomalies scored in the buccal
micronucleus cytome assay were determined based on criteria described by Tolbert et
al [226]. These criteria are intended to classify buccal cells into categories that
distinguish between “normal” cells and cells that are considered “abnormal”, based on
their aberrant nuclear morphology. These abnormal nuclear morphologies are thought
Chapter 2: Buccal cytome in ageing and Down’s syndr ome
56
to be indicative of DNA damage and/or various stages of morphogenetic or toxicity-
induced cell death. Photographic images showing distinct cell populations as scored in
the buccal cytome assay are outlined in Figure 3. Detailed descriptions of the various
cell types are given below.
Basal Cells (Figure 3a):
These are the cells from the basal layer. The nuclear to cytoplasm ratio is larger than
that in differentiated buccal cells which are derived from basal cells. Basal cells have a
uniformly stained nucleus and they are smaller in size when compared to
differentiated buccal cells. Basal cells can contain micronuclei and were scored in the
assay
Normal “differentiated” Cells (Figure 3b):
These cells have a uniformly stained nucleus which is usually oval or round in shape.
They are distinguished from basal cells by their larger size and by a smaller nuclear to
cytoplasmic ratio. No other DNA containing structures apart from the nucleus are
observed in these cells. These cells are considered to be terminally differentiated
relative to basal cells because no mitotic cells are observed in this population.

Chapter 2: Buccal cytome in ageing and Down’s syndr ome
57
Cells with micronuclei (Figure 3a and 3c):
These cells are characterised by the presence of both a main nucleus and one or
more smaller nuclei called micronuclei. The micronuclei are usually round or oval in
shape and their diameter may range between 1/3 to 1/16 the diameter of the main
nucleus. Cells with micronuclei usually contain only one micronucleus. It is possible
but rare to find cells with more than 6 micronuclei. The nuclei in micronucleated cells
may have the morphology of normal cells or that of dying cells (i.e. condensed
chromatin cells). The micronuclei must be located within the cytoplasm of the cells.
The presence of micronuclei is indicative of chromosome loss or fragmentation
occurring during previous nuclear division [217]. Micronuclei were scored only in basal
and differentiated cells with uniformly stained nuclei. Cells with condensed chromatin
or karyorrhectic cells were not scored for micronuclei.
Cells with Nuclear Buds (Figure 3d):
These cells have nuclei with an apparent sharp constriction at one end of the nucleus
suggestive of a budding process, ie elimination of nuclear material by budding. The
nuclear bud and the nucleus are usually in very close proximity and are apparently
attached to each other. The nuclear bud has the same morphology and staining
properties as the nucleus, however its diameter may range from a half to quarter of
that of the main nucleus. The mechanism leading to this morphology is not known but
it may be due to elimination of amplified DNA or DNA repair complexes [120,227,228].

Chapter 2: Buccal cytome in ageing and Down’s syndr ome
58
Binucleated cells (Figure 3e):
These cells have two nuclei instead of one. The nuclei are usually very close to each
other and may be touching. The nuclei usually have the same morphology as that
observed in normal cells. The significance of these cells is unknown but they may be
indicative of failed cytokinesis following the last nuclear division.
Condensed chromatin cells (Figure 3f):
These cells have nuclei with regions of condensed or aggregated chromatin exhibiting
a speckled or striated nuclear pattern. In these cells it is apparent that chromatin is
aggregating in some regions of the nucleus while being lost in other areas. When
chromatin aggregation is extensive the nucleus may appear to be fragmenting. These
cells maybe undergoing early stages of apoptosis although this has not been
conclusively proven. These cells may appear to contain micronuclei but should not be
scored for micronuclei in the assay.
Karyorrhectic cells (Figure 3g)
These cells are characterised by the more extensive appearance of nuclear chromatin
aggregation (relative to condensed chromatin cells) leading to fragmentation and
eventual disintegration of the nucleus. These cells may be undergoing a late stage of
apoptosis but this has not been conclusively proven. These cells should not be scored
for micronuclei in the assay.

Chapter 2: Buccal cytome in ageing and Down’s syndr ome
59
Pyknotic cells (Figure 3h):
These cells are characterised by a small shrunken nucleus, with a high density of
nuclear material that is uniformly but intensely stained. The nuclear diameter is usually
one to two-thirds of a nucleus in normal differentiated cells. The precise biological
significance of pyknotic cells is unknown but it is thought that these cells may be
undergoing a form of cell death; however the precise mechanism remains unknown.
Karyolytic cells (Figure 3i):
In these cells the nucleus is completely depleted of DNA and apparent as a ghost-like
image that has no Feulgen staining. These cells thus appear to have no nucleus. It is
probable that they represent a very late stage in the cell death process but this has not
been conclusively proven. These cells should not be scored for micronuclei in the
assay.
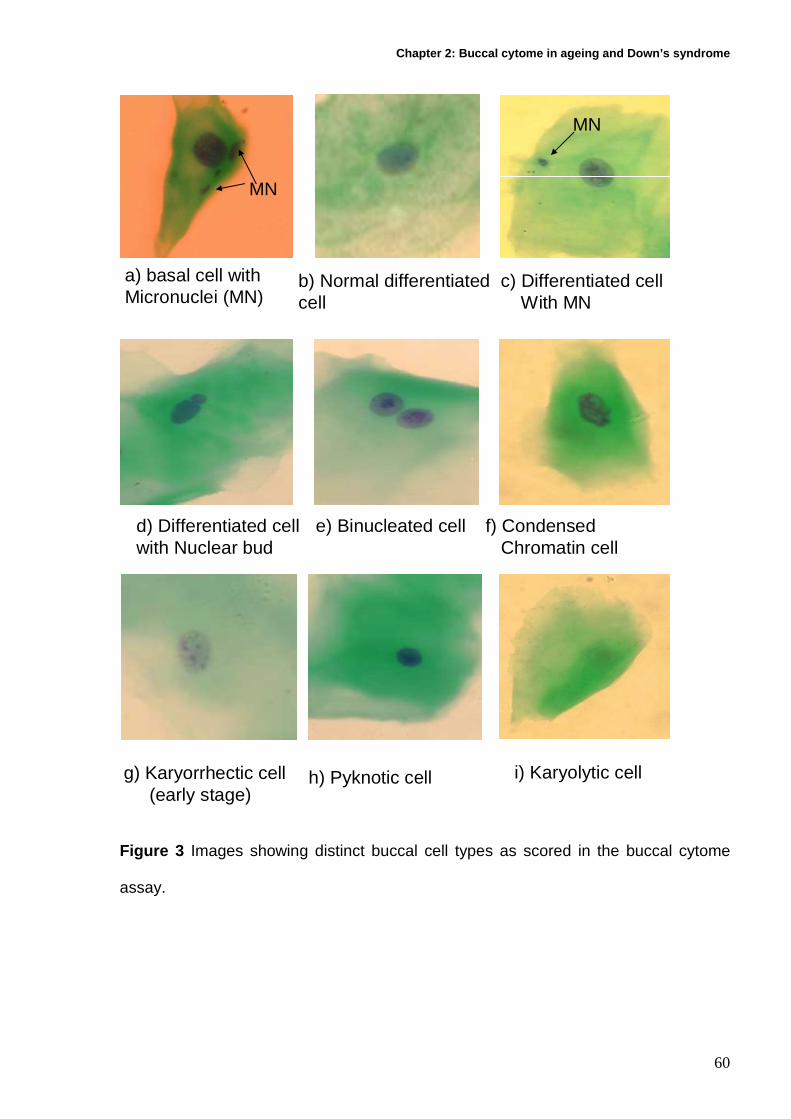
Chapter 2: Buccal cytome in ageing and Down’s syndr ome
60
i) Karyolytic cell
f) Condensed Chromatin cell
g) Karyorrhectic cell (early stage)
h) Pyknotic cell
d) Differentiated cell with Nuclear bud
e) Binucleated cell
MN
MN
a) basal cell with Micronuclei (MN)
b) Normal differentiated cell
c) Differentiated cellWith MN
Figure 3 Images showing distinct buccal cell types as scored in the buccal cytome
assay.

Chapter 2: Buccal cytome in ageing and Down’s syndr ome
61
2.3.4 Scoring method
1000 cells were scored per subject to determine the frequency of the various cell
types outlined in the buccal cytome assay. These consisted of basal cells, cells
containing micronuclei, nuclear buds, binucleated cells and cells with condensed
chromatin, karyorrhexis, pyknotic nuclei and karyolytic cells. A total of 1000
differentiated and basal cells were scored in order to determine the frequency of
micronuclei in a total of 1000 cells. Only basal and normal differentiated cells were
scored for micronuclei and their scores were combined to give the overall incidence.
Cells were scored using both bright field and fluorescence. Cells containing
micronuclei on bright field were confirmed as being positive by examining the cell
under fluorescence. The incidence of false positives can be minimised as DNA
material such as nuclei and micronuclei fluoresce when viewed under fluorescence
with a far red filter.
2.4 Statistical Analyses
One way ANOVA analysis was used to determine the significance of the cellular
parameters measured, whereas pair wise comparison of significance was determined
using Tukey’s test. Gender ratios were tested using the Chi square test. ANOVA
analysis values were calculated using Graphpad PRISM (graphpad inc., San Diego,
CA). Cross correlation analysis of biomarkers was performed using SPSS 14.0,
(SPSS Inc, Chicago). Significance was accepted at P<0.05.

Chapter 2: Buccal cytome in ageing and Down’s syndr ome
62
2.5 Results
The results for the buccal micronucleus cytome assay are summarised and illustrated
in Figures 4-6 and Table 2.
A significant increase in micronuclei was found in the older cohort (366%) relative to
the young cohort (P<0.05). The DS cohort was found to have significantly elevated
frequency of micronuclei when compared to both the older (78.5%) and younger
groups (733%) (P<0.0001). Nuclear buds were slightly elevated in the Down’s cohort
when compared to the healthy young and older groups although this difference did not
achieve significance (P=0.0686).
Basal cells were significantly reduced in both the young (70.1%) and Down’s cohorts
(82.9%) when compared to older controls (P<0.0001). Binucleated cells were
significantly increased in the Down’s cohort when compared to both young (87.9%)
and old control groups (37.9%) (P<0.0001).
A significant reduction in cells containing karyorrhectic (P<0.0001) and condensed
chromatin cells (P<0.0001) was apparent in both the young and Down’s syndrome
cohorts when compared to the older control group. Pyknotic cell frequency was
significantly reduced in the DS cohort (-75.0%) (P=0.0002) when compared to
younger controls but there was no difference when compared to the older controls.
Karyolytic cells were significantly reduced in the Down’s (51.8%) and the older cohort
(37.7%) when compared to the young controls (P<0.0001).

Chapter 2: Buccal cytome in ageing and Down’s syndr ome
63
Cells with micronuclei
Young
Con
trol s
Down 's
synd
rom
e
Older c
ontro
ls0.0
0.5
1.0
1.5
2.0
2.5
3.0
3.5
P<0.0001
a
b
c
A
Freq
uenc
y in
100
0 ce
lls
Cells with nuclear buds
Youn g C
ontro
ls
Down'
s syn
dro
me
Older
contro
ls
0.0
0.5
1.0
1.5
2.0
2.5
P=0.0686
a
a
a
B
Freq
uenc
y in
100
0 ce
lls
Figure 4. DNA damage markers in buccal cells of young controls (N=30), Down’s
syndrome (N=21) and older controls (N=31). (A) Frequency of cells containing
micronuclei in 1000 buccal cells with normal nuclear morphology. (B) Frequency of
nuclear buds in 1000 buccal cells. Groups not showing the same letter are significantly
different from each other.

Chapter 2: Buccal cytome in ageing and Down’s syndr ome
64
Basal cells
Young
Con
trols
Down's
synd
rom
e
Older c
ontr o
ls0
25
50
75
100
P<0.0001
a
a
c
A
Fre
quen
cy in
100
0 ce
lls
Binucleated cells
Young
Cont
rols
Down's sy
ndro
me
Older c
ontro
ls
0
5
10
15
20
25
P<0.0001
a
b
a
B
Freq
uenc
y in
100
0 ce
lls
Figure 5. Frequency of (A) basal cells and (B) binucleated cells scored in a total of
1000 buccal cells in young controls (N=30), Down’s syndrome (N=21) and older
controls (N=31). Groups not showing the same letter are significantly different from
each other

Chapter 2: Buccal cytome in ageing and Down’s syndr ome
65
Condensed chromatin cells
Young C
ontro
ls
Down's
s ynd ro
me
Older c
ontro
ls
0
25
50
75
P<0.0001
a
b
c
A
Fre
quen
cy in
100
0 ce
lls
Karyorrhectic cells
Young
Con
t rols
Down's
synd
rome
Older c
ont ro
ls0
10
20
30
40
50
60
P<0.0001
a
a
b
B
Fre
quen
cy in
100
0 ce
lls
Pyknotic cells
Young
Con
trols
Down's sy
ndro
me
Older c
ontro
ls
0
1
2
3
4
P=0.0002
a
bc
ac
C
Freq
uenc
y in
100
0 ce
lls
Karyolytic cells
Young
Co nt
rols
Down's
synd
rome
Older c
ontro
ls
0255075
100125
150175200
225
P<0.0001
a
b
D
b
Freq
uenc
y in
100
0 ce
lls
Figure 6 Cell death rates in buccal cells of young controls (N=30), Down’s syndrome
(N=21) and older controls (N=31). Frequency of (A) cells containing nuclei with
condensed chromatin morphology, (B) cells containing karyorrhectic nuclei, (C) cells
with pyknotic nuclei, (D) karyolytic cells per 1000 total cells scored. Groups not
showing the same letter are significantly different from each other.
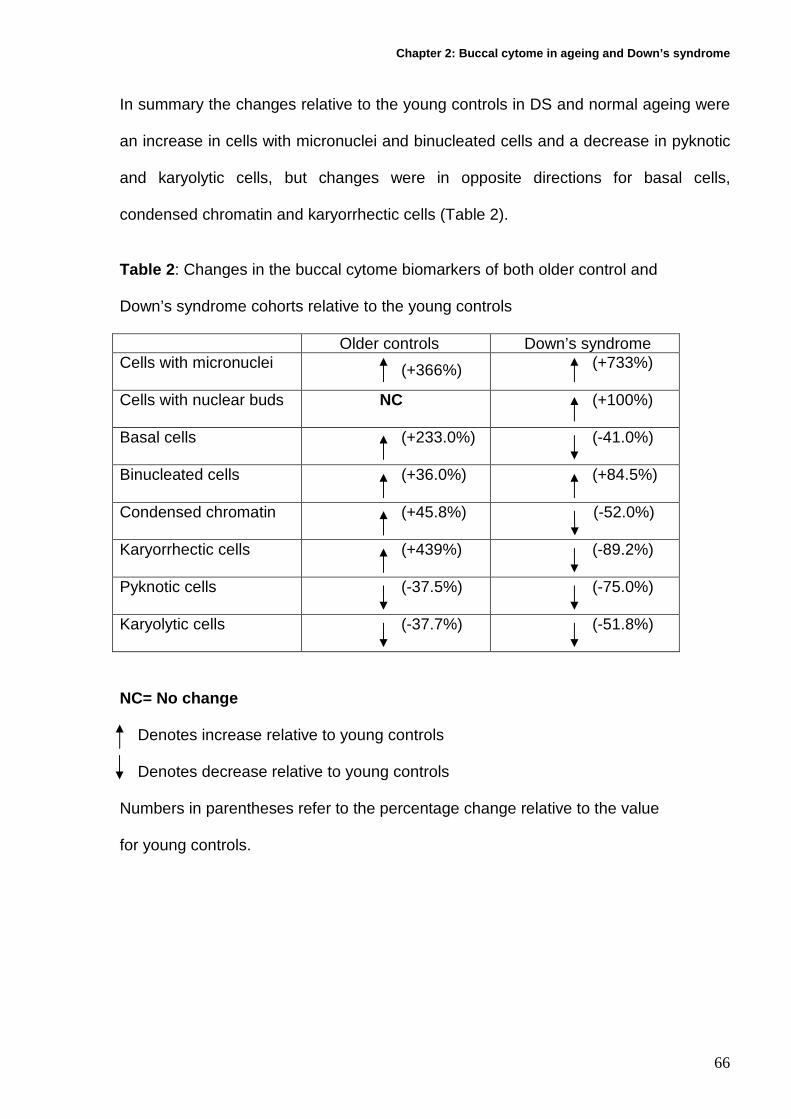
Chapter 2: Buccal cytome in ageing and Down’s syndr ome
66
In summary the changes relative to the young controls in DS and normal ageing were
an increase in cells with micronuclei and binucleated cells and a decrease in pyknotic
and karyolytic cells, but changes were in opposite directions for basal cells,
condensed chromatin and karyorrhectic cells (Table 2).
Table 2 : Changes in the buccal cytome biomarkers of both older control and Down’s syndrome cohorts relative to the young controls Older controls Down’s syndrome Cells with micronuclei
(+366%) (+733%)
Cells with nuclear buds
NC (+100%)
Basal cells
(+233.0%) (-41.0%)
Binucleated cells
(+36.0%)
(+84.5%)
Condensed chromatin
(+45.8%) (-52.0%)
Karyorrhectic cells
(+439%) (-89.2%)
Pyknotic cells
(-37.5%) (-75.0%)
Karyolytic cells
(-37.7%) (-51.8%)
NC= No change
Denotes increase relative to young controls Denotes decrease relative to young controls
Numbers in parentheses refer to the percentage change relative to the value for young controls.

Chapter 2: Buccal cytome in ageing and Down’s syndr ome
67
Cross correlation analysis between the biomarkers of the buccal cytome assay for the
combined cohorts (Table 3) showed a positive correlation between karyorrectic cells
and condensed chromatin (r=0.406, P<0.0001) and basal cells (r=0.659, P<0.0001).
Pyknotic cells showed a negative correlation with binucleated cells (r=-0.240,
P=0.030) and a positive correlation with karyolytic (r=0.412, P<0.0001) and
condensed chromatin cells (r=0.305, P=0.005). Condensed chromatin cells showed a
positive correlation with basal cells (r=0.470, P<0.0001).

Chapter 2: Buccal cytome in ageing and Down’s syndr ome
68
Table 3: Cross correlation results between biomarkers of the buccal micronucleus cytome assay for combined cohorts (N=82).
Cells with
micronuclei karyorrhexis pyknosis binucleates karyolysis Nuclear buds Condensed chromatin
karyorrhexis Pearson
Correlation NS
Sig. (2-tailed) pyknosis Pearson
Correlation NS .243(*)
Sig. (2-tailed) .030 binucleates Pearson
Correlation NS NS NS
Sig. (2-tailed) karyolysis Pearson
Correlation NS NS NS NS
Sig. (2-tailed) Nuclear buds Pearson
Correlation NS NS NS NS NS
Sig. (2-tailed) condensed Pearson
Correlation NS .500(**) .297(**) NS .375(**) NS
chromatin Sig. (2-tailed) .000 .007 .001 basal Pearson
Correlation NS .620(**) NS NS NS NS .478(**)
Sig. (2-tailed) .000 .000
* Correlation is significant at the 0.05 level (2-tailed). ** Correlation is significant at the 0.01 level (2-tailed). NS-Not significant

Chapter 2: Buccal cytome in ageing and Down’s syndr ome
69
2.6 Discussion
The aim of the study was to validate the use of the buccal micronucleus cytome assay
to investigate age-related changes within the buccal mucosa by examining samples
from young, old and DS cohorts. Changes in the ratios of distinct buccal cell
populations were evident in the older control group when compared to a younger
cohort, and significant changes were also evident specific to the premature ageing DS
group. These changes suggest normal age-related and premature ageing-related
biomarkers that may reflect differences in the cellular kinetics and/or structural profile
of the buccal mucosa.
The buccal mucosa is a stratified squamous epithelium consisting of four distinct
layers (Figure 1b) [229,230]. The stratum corneum or keratinised layer lines the oral
cavity comprising cells that are constantly being lost as a result of everyday activities
such as mastication. Below this layer lies the stratum granulosum or granular cell layer
and the stratum spinosum or prickle cell layer containing populations of both
differentiated, apoptotic and necrotic cells. Beneath these layers are the rete pegs or
stratum germinativum, containing actively dividing basal cells which produce cells that
differentiate and maintain the profile, structure and integrity of the buccal mucosa. By
comparing the results of the buccal cytome assay between the older and younger
cohorts, significant differences in markers for genome damage, cellular proliferation
and cell death are apparent that reflect ‘normal’ age related changes in the structural
profile of the buccal mucosa.

Chapter 2: Buccal cytome in ageing and Down’s syndr ome
70
A clear association is shown between ageing and a significant increase in the
biomarkers scored for DNA damage. Micronuclei, which are biomarkers for whole
chromosome loss and chromosome breakage, have been shown to be increased with
advancing age in both peripheral lymphocytes and fibroblasts [211,213,231,232]. In
this study we observed a significant age-related increase in micronuclei within buccal
cells in individuals whose age ranged from 22-67yrs (P<0.0001). These observations
confirm earlier results from biomonitoring studies that also found an age-related
increase in micronucleus frequency [233-235]. The frequencies of micronuclei as
scored in the assay were found not to be significantly different between basal cells
(0.33%) and differentiated cells (0.22%). Nuclear buds, which are thought to reflect
gene amplification events, were non-significantly elevated by 20.96% in the older
cohort and to the best of our knowledge this is the first time that such an effect has
been reported.
It has been shown that ageing results in a decrease in the thickness of the epidermis
and the underlying cell layers [236]. The rete pegs become less prominent and less
convoluted, possibly because of a reduction in basal cells, resulting in a more
flattened appearance [237,238]. The paradoxical significant increase in the frequency
of basal cells sampled in the older cohort may reflect the reduced thickness of the
buccal mucosa. The observed increase in cell death (condensed chromatin and
karyorrhexis) and the reduction in karyolytic cells may determine the thickness of the
outer layer. This effectively would bring the basal cell layer closer to the surface,
making it more likely that basal cells would be sampled compared to healthy mucosa
in which only the peaks of rete pegs are likely to be accessible points for basal cell
collection. With a lower age-related cellular proliferation rate and a thinning of the

Chapter 2: Buccal cytome in ageing and Down’s syndr ome
71
buccal mucosa, older individuals may exhibit modifications in order to maintain the
integrity of the buccal mucosa. The significant increase in the condensed chromatin
and karyorrhectic cells and the corresponding decrease in pyknotic cells and karyolytic
cells maybe the result of insufficient time for the former cell types to undergo pyknosis
and karyolysis prior to reaching the mucosal surface, resulting in a higher proportion of
the found cell types becoming apparent.
DS is characterised by the cellular presence of an extra copy of chromosome 21 and
is an example of a premature ageing disorder [223,239,240]. The buccal cytome
assay identified age-related biomarkers that were specific to this cohort when
compared to both the young and older control groups (Table 2). Micronuclei were
significantly elevated in the Down’s cohort and were found to be roughly 10 fold higher
than in the young control group and almost double those found in the older controls,
confirming the observation of elevated genome damage in this syndrome [241,242].
Nuclear buds were also found to be elevated in the Down’s group also reflecting a
more pronounced genomic instability. Basal cell frequency was found to be non-
significantly lower by 41.97% in the Down’s cohort compared to the younger controls,
possibly reflecting either an excessive reduction of basal cells and/or a thickening of
the buccal mucosal layers. The number of binucleates was found to be significantly
elevated when compared to both the young and older control groups which may reflect
a possible impairment during cytokinesis. It has been shown that non-disjunction
occurs with a higher frequency in binucleated cells that fail to complete cytokinesis
rather than in cells that have completed cytokinesis [243]. This recently identified
mechanism, thought to be a cytokinesis checkpoint for aneuploid binucleated cells,
can result in ultimate formation of tetraploid cells and subsequent aneuploid cells once

Chapter 2: Buccal cytome in ageing and Down’s syndr ome
72
the tetraploid cell eventually divides [243]. DS is known to have higher rates of
aneuploidy 21 and the binucleate cell ratio may therefore prove to be an important
biomarker for identifying individuals with cytokinesis defects, which could lead to
higher than normal rates of aneuploidy. The four cell death parameters (condensed
chromatin, karyorrhexis, pyknosis and karyolysis) were found to be reduced in the
Down’s cohort compared to the younger controls and may reflect important changes
within the profile of the buccal mucosa within this group. With a reduction in the
number of basal cells, fewer cells would be available to maintain the thickness and
integrity of the buccal mucosa. In order to compensate for a reduced regenerative
layer, a potential adaptation may be to reduce the amount of cells undergoing
programmed cell death and a permissive cell cycle check point to reduce cell cycle
time. This would lead to the production of enough cells to maintain the thickness of the
buccal mucosa from a reduced and flattened rete peg layer. No evidence currently
exists that clarify or refute these proposed models, only further investigation using
histological sections and biopsies will allow models to be formulated that best reflect
the structural profile and cellular kinetics within the buccal mucosa for both ageing and
premature ageing syndromes.
The results of the cross-correlation study suggest a significant positive relationship
between basal cells, condensed chromatin cells, pyknotic cells and karyolytic cells.
The strong positive correlation between basal cells and karyorrhectic cells and the
positive correlation between condensed chromatin and karyorrhectic cells, suggests
that the latter are either derived directly from basal cells, or may originate secondarily
from condensed chromatin cells. The positive correlation between condensed
chromatin cells and pyknotic and karyolytic cells and the positive correlation between

Chapter 2: Buccal cytome in ageing and Down’s syndr ome
73
pyknotic and karyolytic cells suggests that karyolytic cells are derived directly from
condensed chromatin cells or indirectly via pyknotic cells. Figure 7 illustrates a
possible model of the inter-relationships between buccal cytome cell types that are
significantly correlated with each other, assuming that the correlations are indicative of
the biological association between the cell types and their likely sequential
development. However, we realise that because association does not necessarily
imply causation, further evidence (e.g. real time recordings of different cell type
changes) would be required to verify the accuracy of the model.
In conclusion, the buccal micronucleus cytome assay has been successfully used to
identify important changes in DNA damage and different cell types that reflect
advancing age within the normal population and within a premature ageing syndrome.
Normal genome
Normal differentiated cell
Micronucleated cell
Nuclear bud cell
Binucleated cellKaryolytic cellPyknotic cell
CondensedChromatin
cell
Karyorrhecticcell
Chromosome breakage or loss
Gene amplification
Cytokinesisdefect
Cell Death
Basal Cell
2007 REVISED BUCCAL CYTOME MODEL SHOWING CELLULAR RELATIONSHIPS
R=0.65
R=0.47
R=0.31R=0.41
R=0.41
R=0.38
Figure 7 : Diagram illustrating revised model for inter-relationships between the
various cell types observed and scored in the buccal micronucleus cytome assay.

Chapter 3: Buccal cytome and Alzheimer’s disease
74
3 Chapter 3: Buccal cytome biomarkers may be associat ed
with Alzheimer’s disease

Chapter 3: Buccal cytome and Alzheimer’s disease
75
3.1 Abstract
Alzheimer’s disease is a progressive degenerative disorder of the brain and is the
commonest form of dementia. To date there is no reliable and conclusive non-invasive
diagnostic test that can identify individuals for susceptibility risk to Alzheimer’s
disease. A buccal cytome assay was used to measure ratios of buccal cell populations
and micronuclei in clinically diagnosed Alzheimer’s patients compared to age and
gender matched controls. Frequencies of basal cells (P<0.0001), condensed
chromatin cells (P<0.0001) and karyorrhectic cells (P<0.0001) were found to be
significantly lower in Alzheimer’s patients. These changes may reflect alterations in
the cellular kinetics or structural profile of the buccal mucosa, and may be useful as
potential biomarkers in identifying individuals with a high risk of developing
Alzheimer’s disease. The odd’s ratio of being diagnosed with Alzheimer’s disease for
those individuals with a basal cell plus karyorrhectic cell frequency <41 per 1000 cells
is 140, with a specificity of 97% and sensitivity of 82%.
3.2 Introduction
Alzheimer’s disease (AD) is a neurodegenerative disorder that is characterised
clinically by cognitive decline, memory loss, visuo-spatial and language impairment
and is the commonest form of dementia [3,8,10,46]. Regions of the brain that are
involved in short term memory and learning such as the temporal and frontal lobes are
impaired as a result of neuronal loss and the breakdown of the neuronal synaptic
connections [50]. The disease is histopathologically confirmed at post mortem within
the brain by the presence of neurofibrillary tangles and amyloid plaques [244,245].

Chapter 3: Buccal cytome and Alzheimer’s disease
76
The greatest risk factor for contracting the disease is advancing age and that risk is
significantly increased beyond the age of 70 yrs [3,4,9]. To date the global prevalence
is estimated to be 24.3 million with that number expected to triple within the next thirty
years. At least 4.9 million new cases are reported annually with a predicted
prevalence worldwide of 80 million people suffering from the disease by 2040 [4,5].
Currently clinical diagnosis of AD is based upon criteria of cognitive impairment and
behavioural changes [11]. One such diagnostic tool is the mini mental state
examination (MMSE) which allows a quantitative measurement of cognition to be
determined [12,13]. However the diagnosis for having AD is only between 60-70%
accurate when using these criteria and can only be conclusively confirmed after
histopathological investigation [11].
Biomarkers that may identify individuals who are at an early stage of AD would be
useful as this would allow timely preventative intervention. There is an increasing
interest in the evaluation of chromosome damage markers within the somatic cells of
neurodegeneration patients [96-98]. Genome damage could lead to altered gene
dosage and gene expression as well as contribute to the risk of accelerated cell death
in neuronal tissue [246]. Genomic instability markers such as micronuclei (MN), have
been shown to be elevated within the peripheral blood lymphocytes and fibroblasts of
Alzheimer’s patients [96,97,247].
The aim of this study was to assess whether MN and other parameters of genome
damage and cell death in the buccal mucosa could be used as a non-invasive method
of identifying those at risk of developing AD. In effect we adopted a cytome approach
in which all the various cell types and their ratios were quantified to identify which

Chapter 3: Buccal cytome and Alzheimer’s disease
77
parameters if any, were most strongly associated with AD. A flow diagram illustrating
plausible cellular relationships of the buccal cytome assay is shown in Figure 1.
Normal genome
Normal
Micronucleated
Nuclear bud
BinucleatedKaryolysisPyknosis
Condensedchromatin
Karyorrehxis
Chromosome breakage or loss
Gene amplification
CytokinesisDefect orproliferativeindex
Apoptotic Cell Death(morphogeneticor induced by
genome damage)
NecroticCell death ?
Basal Cell
BUCCAL CYTOME MODEL SHOWING CELLULAR RELATIONSHIPS
Figure 1 : Diagram illustrating the most plausible relationships between the various cell
types observed and scored in the buccal micronucleus cytome assay.
3.3 Methods
3.3.1 Recruitment and characteristics of participan ts
Approval for this study was obtained from CSIRO Human Nutrition, Adelaide
University and Ramsay Healthcare Ethics Committee’s. 26 older controls (age 66-
75yrs), and 54 clinically diagnosed Alzheimer’s patients (Age 58-93yrs) not receiving
anti-folate therapy or cancer treatment or having any family history of AD, were

Chapter 3: Buccal cytome and Alzheimer’s disease
78
recruited for the study. Alzheimer’s patients were recruited at the College Grove
Private Hospital, Walkerville, Adelaide, South Australia following their initial diagnosis
and prior to commencement of therapy. Diagnosis of AD was made by clinicians
according to the criteria outlined by the National Institute of Neurological and
Communicative Disorders and Stroke-Alzheimer’s Disease and related Disorders
Association (NINCDS-AD&DA) [12], which are the well recognised standards used in
all clinical trials.
Volunteers did not receive any remuneration for their participation. Alzheimer’s
patients were separated into two distinct groups. One group was age matched to the
control, whilst the second group was classified as an older Alzheimer’s cohort. Age,
gender and MMSE scores of the cohorts are shown in Table 1. Gender ratio
differences between the groups were not significant (Chi square P>0.05). MMSE
scores between the two AD groups were not significantly different P>0.05. The age of
the control group compared to the younger AD group was not significantly different but
the latter group had a significantly lower age relative to the older AD group P<0.0001.
MMSE scores were not available for the controls. The controls were “normal”
functioning healthy individuals, who self volunteered and consented to the study and
did not report a history of cognitive impairment.

Chapter 3: Buccal cytome and Alzheimer’s disease
79
Table 1: Age, gender ratio and MMSE scores in study groups
Controls* Younger AD Older AD Age (years) Group size 26 23 31 Mean±S.D 68.7±2.6 70.7±4.1 83.13±4.5 Range 66-75 58-75 78-93 Gender Group size 26 23 31 Male 11 8 8 Female 15 15 23 MMSE (0-30) NA Group size 23 31 Mean±S.D 22.52±3.013 22.13±3.6.76 Range 15-27 12-29
* Age and gender matched to younger AD group NA-Not available
3.3.2 Cell sampling and preparation
Buccal cells were collected from consented volunteers. Cells were collected using a
modified version of the method used by Beliën et al [225]. Prior to buccal cell
collection the mouth was rinsed thoroughly with water to remove any unwanted debris.
Small headed toothbrushes (Supply SA, code 85300012) were rotated 20 times in a
circular motion against the inside of the cheek, starting from a central point and
gradually increasing in circumference to produce an outward spiral effect. Both cheeks
were sampled using separate brushes. The heads of the brushes were individually
placed into separate 30ml yellow top containers (Sarstedt code 60.9922.918)
containing buccal cell (BC) buffer (0.01M Tris-HCL (Sigma T-3253), 0.1M EDTA tetra
sodium salt (Sigma E5391), 0.02M sodium chloride (Sigma S5886)) at pH 7.0 and
agitated to dislodge the cells. Cells from both right and left cheeks were transfered into

Chapter 3: Buccal cytome and Alzheimer’s disease
80
separate TV-10 centrifuge tubes (Sarstedt, code 60.9921.829) and spun for 10 mins at
1500rpm (MSE Mistral 2000). Supernatant was removed and replaced with 10mls of
fresh BC buffer. The BC buffer helps to inactivate endogenous DNAases and aids in
removing bacteria that may complicate scoring. Cells were spun and washed twice
more, with a final volume of 5mls of BC buffer being added to the cells. The cell
suspension was vortexed and then homogenised for 2 mins in a hand homogeniser
(Wheaton scientific 0.1-0.15 mm gauge) to increase the number of single cells in
suspension. Left and right cell populations were pooled into a 30ml yellow top
container and drawn into a syringe with a 21G gauge needle and expelled to
encourage cellular separation. Cells were passed into a TV-10 tube through a 100µm
nylon filter (Millipore,code MILNYH02500) held in a swinex filter (millipore, code
MILSX0002500) to remove large aggregates of unseparated cells that hinder slide
preparation and cell analysis. Cells were further spun at 1500rpm for 10mins and the
supernatant removed. Cells were resuspended in 1ml of BC buffer and the cell
concentration determined by a Coulter counter (Beckman Coulter Model ZB1, Settings
Attenuation:1, Threshold:8, Aperture:1/4, Manometer:0.5). Cell suspensions were
prepared containing 80,000 cells/ml after initial readings from a 1:50 dilution
(300µl/15mls isoton). 50 µl/ml of dimethyl sulphoxide (Sigma 2650) was added to help
clarify cellular boundaries by further separating the cells. 120 µl of cell suspension
was added to cytospin cups and spun at 600 rpm for 5 mins in a cytocentrifuge
(Shandon cytospin 3). Slides containing two spots of cells were air dried for 10 mins
and then fixed in ethanol:acetic acid (3:1) for 10 mins. Slides were air dried for 10
mins prior to staining.

Chapter 3: Buccal cytome and Alzheimer’s disease
81
3.3.3 Feulgen staining
Fixed slides were treated for 1 min each in 50% and 20% ethanol and then washed for
2 mins in deionised water generated from a Milli-q water purification system (Millipore
Australia Pty Ltd, New South Wales, Australia). Slides were treated in 5M hydrochloric
acid for 30 mins and then washed in running tap water for 3 mins. Slides were drained
but not allowed to dry out before being treated in room temperature Schiff’s reagent
(Sigma 3259016) in the dark for 60 mins. Slides were washed in running tap water for
5 mins and rinsed well in deionised water for 1 min. Slides were stained for 30 secs in
0.2% light green (Sigma L-1886) and rinsed well in deionised water for 2 mins. Slides
were allowed to air dry, covered with No 1 coverslips (Crown Scientific, South
Australia) and mounted in DePeX (BDH 361254D). Nuclei and micronuclei are
stained magenta, whilst the cytoplasm appears green. Slides were scored using a
Nikon E600 microscope equipped with a triple band filter (Dapi, FITC and Rhodamine)
at 1000X magnification. Cells containing micronuclei on bright field can be confirmed
as being positive by examining the cell under fluorescence. The incidence of false
positives can be minimised as DNA material such as nuclei and micronuclei fluoresce
when viewed under fluorescence with a far red filter (Figure 2).
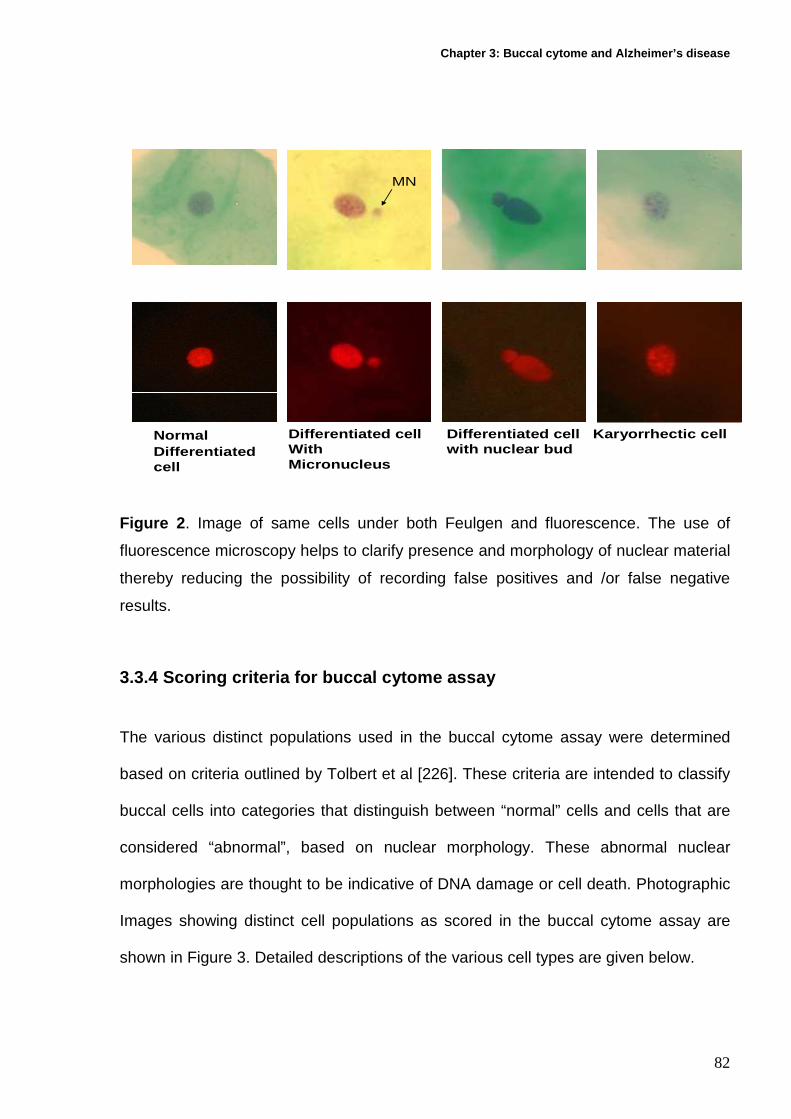
Chapter 3: Buccal cytome and Alzheimer’s disease
82
NormalDifferentiated cell
MN
Differentiated cellWith Micronucleus
Differentiated cell with nuclear bud
Karyorrhectic cell
Figure 2 . Image of same cells under both Feulgen and fluorescence. The use of
fluorescence microscopy helps to clarify presence and morphology of nuclear material
thereby reducing the possibility of recording false positives and /or false negative
results.
3.3.4 Scoring criteria for buccal cytome assay
The various distinct populations used in the buccal cytome assay were determined
based on criteria outlined by Tolbert et al [226]. These criteria are intended to classify
buccal cells into categories that distinguish between “normal” cells and cells that are
considered “abnormal”, based on nuclear morphology. These abnormal nuclear
morphologies are thought to be indicative of DNA damage or cell death. Photographic
Images showing distinct cell populations as scored in the buccal cytome assay are
shown in Figure 3. Detailed descriptions of the various cell types are given below.

Chapter 3: Buccal cytome and Alzheimer’s disease
83
i) Karyolytic cell
f) Condensed Chromatin cell
g) Karyorrhectic cell (early stage)
h) Pyknotic cell
d) Differentiated cell with Nuclear bud
e) Binucleated cell
MN
MN
a) basal cell with Micronuclei (MN)
b) Normal differentiated cell
c) Differentiated cellWith MN
Figure 3: Images showing distinct buccal cell types as scored in the buccal cytome
assay
Chapter 3: Buccal cytome and Alzheimer’s disease
84
Basal Cells (Figure 3a):
These are the cells from the basal layer. The nuclear to cytoplasm ratio is larger than
that in differentiated buccal cells which are derived from basal cells. Basal cells have a
uniformly stained nucleus and they are smaller in size when compared to
differentiated buccal cells. Basal cells can contain micronuclei and were scored in the
assay.
Normal differentiated Cells (Figure 3b):
These cells have a uniformly stained nucleus which is usually oval or round in shape.
They are distinguished from basal cells by their larger size and by a smaller nuclear to
cytoplasmic ratio. No other DNA containing structures apart from the nucleus are
observed in these cells. These cells are considered to be terminally differentiated
relative to basal cells because no mitotic cells are observed in this population.
Cells with micronuclei (Figure 3a and 3c):
These cells are characterised by the presence of both a main nucleus and one or
more smaller nuclei called micronuclei. The micronuclei are usually round or oval in
shape and their diameter may range between 1/3 to 1/16 the diameter of the main
nucleus. Cells with micronuclei usually contain only one micronucleus. It is possible
but rare to find cells with more than 6 micronuclei. The nuclei in micronucleated cells
may have the morphology of normal cells or that of dying cells (i.e. condensed
chromatin cells). The micronuclei must be located within the cytoplasm of the cells.
The presence of micronuclei is indicative of chromosome loss or fragmentation
occurring during previous nuclear division [217]. Micronuclei were scored only in basal

Chapter 3: Buccal cytome and Alzheimer’s disease
85
and differentiated cells with uniformly stained nuclei. Cells with condensed chromatin
or karyorrhectic cells were not scored for micronuclei.
Cells with Nuclear Buds (Figure 3d):
These cells have nuclei with an apparent sharp constriction at one end of the nucleus
suggestive of a budding process, ie elimination of nuclear material by budding. The
nuclear bud and the nucleus are usually in very close proximity and are apparently
attached to each other. The nuclear bud has the same morphology and staining
properties as the nucleus, however its diameter may range from a half to quarter of
that of the main nucleus. The mechanism leading to this morphology is not known but
it may be due to elimination of amplified DNA or DNA repair complexes.
[120,227,228].
Binucleated differentiated cells (Figure 3e):
These cells have two nuclei instead of one. The nuclei are usually very close to each
other and may be touching. The nuclei usually have the same morphology as that
observed in normal cells. The significance of these cells is unknown but they may be
indicative of failed cytokinesis following the last nuclear division.
Condensed chromatin cells (Figure 3f):
These cells have nuclei with regions of condensed or aggregated chromatin exhibiting
a speckled or striated nuclear pattern. In these cells it is apparent that chromatin is
aggregating in some regions of the nucleus while being lost in other areas. When
chromatin aggregation is extensive the nucleus may appear to be fragmenting. These
Chapter 3: Buccal cytome and Alzheimer’s disease
86
cells maybe undergoing early stages of apoptosis although this has not been
conclusively proven. These cells may appear to contain micronuclei but should not be
scored for micronuclei in the assay.
Karyorrhectic cells (Figure 3g)
These cells are characterised by the more extensive appearance of nuclear chromatin
aggregation (relative to condensed chromatin cells) leading to fragmentation and
eventual disintegration of the nucleus. These cells may be undergoing a late stage of
apoptosis but this has not been conclusively proven. These cells should not be scored
for micronuclei in the assay.
Pyknotic cells (Figure 3h):
These cells are characterised by a small shrunken nucleus, with a high density of
nuclear material that is uniformly but intensely stained. The nuclear diameter is usually
one to two-thirds of a nucleus in normal differentiated cells. The precise biological
significance of pyknotic cells is unknown but it is thought that these cells may be
undergoing a form of cell death however the precise mechanism is unknown. These
cells should not be scored for micronuclei in the assay.
Karyolytic cells (Figure 3i):
In these cells the nucleus is completely depleted of DNA and apparent as a ghost-like
image that has no Feulgen staining. These cells thus appear to have no nucleus. It is
probable that they represent a very late stage in the cell death process but this has not
Chapter 3: Buccal cytome and Alzheimer’s disease
87
been conclusively proven. These cells should not be scored for micronuclei in the
assay.
Scoring method
1000 cells were scored (500 per cytospin spot) per subject for all the various cell types
outlined in the buccal cytome assay. These consisted of cells containing micronuclei,
nuclear buds, basal cells, binucleates and the cell death parameters condensed
chromatin, karyorrhectic, pyknotic and karyolytic cells. A total of 1000 differentiated
and basal cells were scored in order to determine the frequency of micronuclei in a
total of 1000 cells. Only basal and normal differentiated cells were scored for
micronuclei and their scores were combined to give the overall incidence. Cells were
scored using both bright field and fluorescence. Cells containing micronuclei on bright
field were confirmed as being positive by examining the cell under fluorescence. The
incidence of false positives can be minimised as DNA material such as nuclei and
micronuclei fluoresce when viewed under fluorescence with a far red filter.
3.4 Statistical analysis
One way ANOVA analysis was used to determine the significance of the cellular
parameters measured between the old control, younger AD and older AD cohorts. Pair
wise comparison of significance between these groups was determined using Tukey’s
test. ANOVA analysis values, positive predictive values, negative predictive values,
sensitivity, specificity, likelihood ratios and odds ratio were calculated using Graphpad
PRISM (Graphpad inc., San Diego, CA). Cross correlation analyses were performed
using SPSS 14.0, SPSS inc, Chicago. Significance was accepted at P<0.05.

Chapter 3: Buccal cytome and Alzheimer’s disease
88
3.5 Results
The results for DNA damage markers (cells with micronuclei or nuclear buds), cell
proliferation markers (basal cells, binucleated cells) and cell death parameters
(karyorrhectic cells, condensed chromatin cells, karyolytic cells and pyknotic cells) are
summarised and illustrated in Figures 4-6. Cells with micronuclei or nuclear buds were
slightly elevated in the younger AD group when compared to age-matched controls
although this difference did not achieve significance (P=0.12, P=0.62 respectively).
88% of all micronucleated cells were in differentiated cells whilst the remaining 12%
were found in the basal cells. Basal cells were found to be lower by 81% in the
younger AD and by 79% in the older AD cohorts when compared to the control group
(P<0.0001). Binucleate cell frequency showed no significant differences between the
AD and control groups (P=0.99). The frequency of cells with condensed chromatin
was found to be reduced by 37.2% in the younger AD and by 56.6% in the older AD
cohorts when compared to the control group (P<0.0001). The frequency of
karyorrhectic cells was found to be reduced by 82.9% in the younger AD and by
77.7% in the older AD cohorts when compared to the control group (P<0.0001).
Pyknotic and karyolytic cells were slightly lower in both the dementia groups but did
not achieve significance when compared to the control (P=0.47, P=0.84 respectively).
There were no gender ratio differences between the control and the AD groups. There
were no gender differences in biomarkers occurring within each cohort except for a
significant increase in nuclear buds in males compared to females within the younger
AD group (P<0.01). Cross correlation analysis between MMSE scores and the
biomarkers of the buccal cytome assay showed no positive correlation.

Chapter 3: Buccal cytome and Alzheimer’s disease
89
Cells With micronuclei
Contro ls
Young
er A
D
Older A
D
0
1
2
P=0.1148
a
a
a
A
Fre
quen
cy in
100
0 ce
lls
Cells with nuclear buds
Controls
Younge
r AD
Older A
D
0
1
2
P=0.6150
a
a
a
B
Fre
quen
cy in
100
0 ce
lls
Figure 4: DNA damage markers in buccal cells of controls (N=26), younger AD
(N=23) and older AD (N=31). (A). Frequency of cells containing micronuclei in 1000
buccal cells with normal nuclear morphology. (B). Frequency of cells with nuclear
buds. Groups not showing the same letter are significantly different from each other

Chapter 3: Buccal cytome and Alzheimer’s disease
90
Basal cells
Contro
ls
Young
er A
D
Older A
D
0
25
50
75
100
125
P<0.0001
a
b b
A
Fre
quen
cy in
100
0 ce
lls
Binucleated cells
Contro
ls
Youn ger
AD
Older
AD
0
10
20
P=0.9934
a a a
B
Fre
quen
cy in
100
0 ce
lls
Figure 5: Frequency of (A) basal cells and (B) binucleated cells amongst 1000 total
cells scored in controls (N=26), younger AD (n=23) and older AD (N=31). Groups not
showing the same letter are significantly different from each other.

Chapter 3: Buccal cytome and Alzheimer’s disease
91
Condensed chromatin cells
Contro ls
Young
er A
D
Older A
D
0
25
50
75
P<0.0001
a
b
b
A
Freq
uenc
y in
100
0 ce
lls
Karyorrhectic cells
Contro
ls
Younge
r AD
Older A
D
0
10
20
30
40
50
60
P<0.0001
a
b b
B
Fre
quen
cy in
100
0 ce
lls
Pyknotic cells
Contro
ls
Young
er A
D
Older
AD
0.0
0.5
1.0
1.5
2.0
2.5
P=0.4681
aa
a
C
Fre
quen
cy in
100
0 ce
lls
Karyolytic cells
Contro
ls
Younger A
D
Older
AD
0
25
50
75
100
125
P=0.8441
a a a
D
Freq
uenc
y in
100
0 ce
lls
Figure 6: Cell death rates in buccal cells of controls (N=26), younger AD (n=23) and
older AD (N=31). Frequency of (A) cells containing nuclei with condensed chromatin
morphology, (B) cells containing karyorrhectic nuclei, (C) cells with pyknotic nuclei, (D)
karyolytic cells per 1000 total cells scored. Groups not showing the same letter are
significantly different from each other.
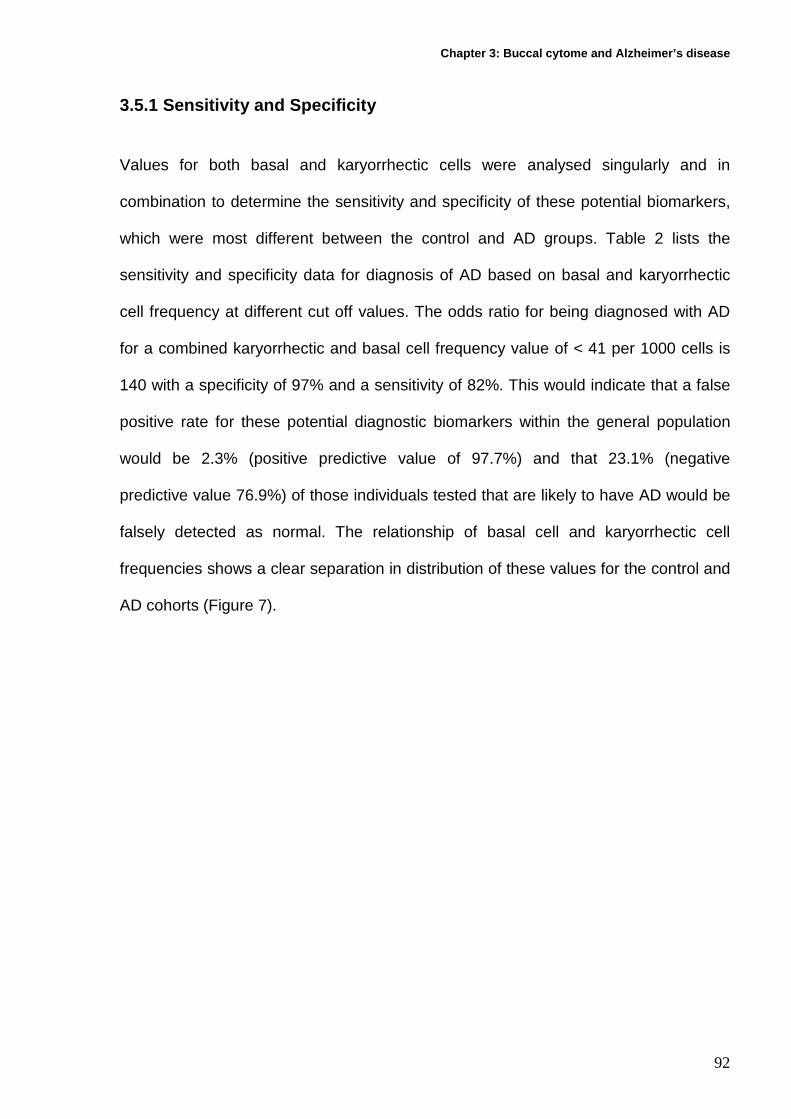
Chapter 3: Buccal cytome and Alzheimer’s disease
92
3.5.1 Sensitivity and Specificity
Values for both basal and karyorrhectic cells were analysed singularly and in
combination to determine the sensitivity and specificity of these potential biomarkers,
which were most different between the control and AD groups. Table 2 lists the
sensitivity and specificity data for diagnosis of AD based on basal and karyorrhectic
cell frequency at different cut off values. The odds ratio for being diagnosed with AD
for a combined karyorrhectic and basal cell frequency value of < 41 per 1000 cells is
140 with a specificity of 97% and a sensitivity of 82%. This would indicate that a false
positive rate for these potential diagnostic biomarkers within the general population
would be 2.3% (positive predictive value of 97.7%) and that 23.1% (negative
predictive value 76.9%) of those individuals tested that are likely to have AD would be
falsely detected as normal. The relationship of basal cell and karyorrhectic cell
frequencies shows a clear separation in distribution of these values for the control and
AD cohorts (Figure 7).

Chapter 3: Buccal cytome and Alzheimer’s disease
93
Table 2: Positive predictive value (PPV), negative predictive value (NPV), sensitivity, specificity, likelihood ratio (LR), odds ratio (OR) and P values for karyorrhectic and basal cell frequency PPV NPV Sensitivity Specificity LR OR (95% CI) P
Value Karyorrhectic cell
frequency <30* 85.5% 85.2% 92.1% 74.2% 3.6 33.8(9.2-124) 0.0001 Basal cell frequency <27* 93.5% 77.8% 84.3% 90.3% 8.7 50.1(12.3-205) 0.0001 Basal cell plus karyorrhectic cell frequency <41* 97.7% 76.9% 82.4% 96.8% 25.5 140 (16.8-1165) 0.0001
*denotes number of cells in 1000 buccal cells scored
0 50 100 150 2000
50
100
150ADCONTROLS
Basal cell frequency per 1000 cells
Kar
yorr
hect
ic c
ell f
requ
ency
per
1000
cel
ls
Figure 7: Shows a scatter plot for basal and karyorrhectic cell frequency biomarkers
as expressed in Controls and AD cohorts
Chapter 3: Buccal cytome and Alzheimer’s disease
94
3.6 Discussion
This study is the first to use the buccal micronucleus cytome assay, which is based on
cellular and nuclear morphology, to identify potential biomarkers that are associated
with individuals that have just been clinically diagnosed with AD. Results showed a
significant decrease in the number of basal cells (P<0.0001), karyorrhectic cells
(P<0.0001) and condensed chromatin cells (P<0.0001) in the AD patients, suggesting
potential changes in the cellular kinetics or structural profile of the buccal mucosa. The
combination of basal and karyorrhectic cells as potential biomarkers within the buccal
mucosa may be useful as a potential future diagnostic to identify individuals with a
high risk of developing or having AD.
The buccal mucosa is a stratified squamous epithelium consisting of four distinct
layers (Figure 8a). The stratum corneum or keratinised layer lines the oral cavity
comprising cells that are constantly being lost as a result of everyday abrasive
activities such as mastication. Below this layer lie the Stratum granulosum or granular
cell layer and the stratum spinosum or prickle cell layer containing populations of both
differentiated and apoptotic cells. Integrated within these layers are convoluted
structures known as rete pegs, containing the actively dividing basal cells known as
the stratum germinativum which produce cells that differentiate and maintain the
profile and integrity of the buccal mucosa.

Chapter 3: Buccal cytome and Alzheimer’s disease
95
a) Cross section of Normal buccal mucosa
RETE PEGSBasal Cells
ORAL CAVITY
Stratum Corneum
Stratum Granulosum
Stratum Spinosum
Key: Condensed chromatin
Karyorrhectic
Keratinised
Karyolytic
Basal
Micronucleateddifferentiated Pyknotic
Figure 8a: Shows a cross section of normal buccal mucosa illustrating the different
cell layers.
With increasing age the cell renewal process becomes less efficient and cellular
regeneration decreases [248,249]. Ageing results in a decrease in the thickness of the
epidermis and the underlying cell layers [236]. Studies have shown that there is a
decline in epidermal thickness with advancing age in both sexes with values occurring
in the range from 11.4 to 22.6 microns [250]. The number of cells within the stratum
corneum does not diminish and therefore does not compromise its function as an
essential protective layer [251]. The rete pegs become less prominent and less
convoluted resulting in a more flattened appearance [237,238]. This flattening of the
dermal–epidermal junction makes the skin more susceptible to mild mechanical
trauma.
Chapter 3: Buccal cytome and Alzheimer’s disease
96
The results from the buccal cytome assay suggest significant changes within the
buccal cell profile of AD patients when compared to the control cohort. Two models
were considered to explain the observed changes of buccal cell populations within this
group of individuals (Figures 8b and 8c). Both proposed models make the assumption
that there is an excessive structural flattening of the rete pegs beyond normal ageing,
resulting in a reduced basal cell population. Within both the AD cohorts the number of
mitotically active basal cells was significantly reduced. A reduction in the number of
basal cells would result in reduced cellular proliferation per unit volume and
consequently fewer cells would be made available to maintain the thickness and
integrity of the buccal mucosa. In model 1 ( Figure 8b) in order to compensate for a
reduced proliferation rate, a potential adaptation may be to reduce the amount of cells
undergoing morphogenetic programmed cell death, possibly as a result of an
increased cell cycle time. This would lead to the production of just enough cells to
maintain the required thickness of an adequately functional buccal mucosa (Figure
8b). The study showed a significant reduction in the populations of cells with
condensed chromatin and in the number of karyorrhectic cells collected which is
indicative of a reduced apoptotic rate.

Chapter 3: Buccal cytome and Alzheimer’s disease
97
b) Alzheimer Buccal cell Model 1
ORAL CAVITY
Flattened rete pegs and lower basal frequency
Stratum Corneum
Stratum Granulosum
Stratum Spinosum
Key: Condensed chromatin
Karyorhexic
Keratinised
Karyolytic
Basal
Micronucleated
differentiated Pyknotic
Figure 8b) Model 1 shows a proposed cross section of buccal mucosa that may occur
in AD individuals, with flattening of rete pegs, lower basal cell frequency and reduced
frequency of cells undergoing apoptosis with an increased average distance between
basal layer and surface of the mucosa.
An alternative model illustrated in model 2 (Figure 8c) proposes that cell death rate
does not change and is comparable to the same rate of cell death as seen in normal
controls. With fewer mitotically dividing cells being produced within the basal cell layer
and a normal apoptotic rate, less differentiated cells would be made available to
maintain the thickness and integrity of the buccal mucosa. Consequently, the
thickness of the dermal-epidermal layer would be severely compromised resulting in a
general thinning of the buccal mucosa. No evidence currently exists that clarify or
refute these proposed models, only further investigation with sectional biopsies will
verify whether these models truly reflect the cellular kinetics within the buccal mucosa

Chapter 3: Buccal cytome and Alzheimer’s disease
98
of AD patients. Model 1 appears to be the better model given that both basal and
apoptotic cells (karyorrhectic and condensed chromatin cells) are reduced in this
study, and that the flattening of the basal cell layer would in itself increase the distance
from the surface, making it less likely that these cells would be collected during
sampling.
C) Alzheimer Buccal cell Model 2
ORAL CAVITY
Stratum Corneum
Stratum Spinosum
Flattened rete pegs and lower basalfrequency
Key: Condensed chromatin
Karyorhexic
Keratinised
Karyolytic
Basal
Micronucleated
differentiated Pyknotic
Figure 8c ) Model 2 shows flattening of rete pegs with a lower basal cell proliferation
and frequency whilst maintaining a normal apoptotic rate resulting in thinning of the
buccal mucosa, and a shorter average distance between the basal cell layer and
mucosal surface.
It is plausible that the changes within the ratios of the cell populations of the buccal
mucosa of AD patients may reflect some of the physiological changes that contribute
to the etiology of the disease. AD is histopathologically confirmed by the presence
within the brain of neurofibrillary tangles consisting of the microtubule associated
protein tau and amyloid plaques which contain the 42 amino acid β amyloid (Aβ42)

Chapter 3: Buccal cytome and Alzheimer’s disease
99
resulting from the aberrant proteolysis of the amyloid precursor protein (APP). The
gene for APP is found on chromosome 21 at 21q21 [252]. Both of these AD
associated proteins are present within vertebrate buccal mucosa [253,254]. It has
been shown that the level of tau in Alzheimer’s oral epithelium had a significant
positive correlation with tau levels in the cerebrospinal fluid [253]. This indicates that
buccal cells potentially may reflect some of the patho-physiological changes that occur
within the AD brain. Individuals suffering from AD had significantly higher levels of oral
epithelial tau when compared to controls who were clinically diagnosed as not
suffering from AD [253]. It has also been shown that Aβ42 has been detected within
the buccal mucosa of a genetically accelerated senescence mouse model [254] and
that APP has been detected in the basal cell layer of human skin epidermis [255]. APP
at low levels (1nM-10nM) has been shown to have a positive effect on the rate of
proliferation of basal cells. However at higher concentrations >10nM the rate of
proliferation is significantly impaired. Whether increased tau, Aβ42 or APP expression
alters proliferation rate of the basal cells and cell ratios of the buccal mucosa remains
unclear. Only future studies combining these multiple parameters may answer this
question.
Micronutrient deficiency such as zinc has also been shown to have a number of
effects on the structural profile of the buccal mucosa [256,257]. Rats fed on a zinc
deficient diet exhibited hyperplastic changes within the buccal mucosa. After 9 days
the keratin layer showed parakeratosis and significant thickening [257]. After 18 days
all cells within the keratin layer showed further thickening and a complete
parakeratotic transformation with a doubling of the mitotic rate within the basal cell
layer. These changes were readily reversible once the rats returned to a normal

Chapter 3: Buccal cytome and Alzheimer’s disease
100
control diet containing the normal amount of zinc [258]. It is plausible that AD patients,
if suffering from a micronutrient deficiency such as zinc, or if zinc is not bioavailable
because it is aggregated by β amyloid [259] may exhibit similar changes within the
buccal mucosa. If such thickening were apparent, then the number of basal cells
sampled would be significantly reduced as the keratinised layer thickened. Future
studies need to be performed to investigate the effects of micronutrient zinc deficiency
or availability of free zinc on changes in both cellular kinetics and structure of the AD
buccal mucosa.
An alternative explanation for the reduced proportion of basal and apoptotic cells
could be differences in cell sampling between AD and control groups. However, we
think that this is unlikely because collections were done by one person following a
standard protocol. Nevertheless, studies were performed involving repeated sampling
on the same day which showed that basal cells are increased as deeper layers are
sampled (Table 3). The proportion of karyorrhectic and condensed chromatin cells
were found not to be significantly changed with repeated sampling (Table 3). Although
a trend for an increase of karyorrhectic cells with repeated sampling was evident (P
trend=0.049), the increase in both basal cells and karyorrhectic cells at the fifth
sample was 195% and 69% greater than the first sample. This is much less than the
427% increase in basal cells and 486% increase in karyorrhectic cells of the normal
older controls relative to AD subjects. This argues against the possibility that observed
differences between controls and AD, may be explained by less vigorous sampling in
AD compared to the controls. In addition condensed chromatin cells were reduced in
AD but remained unchanged with repeated sampling. More attention maybe needed to

Chapter 3: Buccal cytome and Alzheimer’s disease
101
standardise the sampling protocol in order to obtain reproducible results especially
when multiple samplers are involved.
Previous studies by Migliore and colleagues showed that micronucleus frequency is
increased in lymphocytes and skin fibroblasts of AD patients [96,97,247]. However,
our results in buccal mucosa do not show a marked difference between AD and
controls for MN frequency or nuclear buds. As expression of MN requires nuclear
division, MN frequency in buccal mucosa is also dependent on the proportion of once
divided cells. It is possible that the reduced number of basal cells and perhaps a
reduced proportion of dividing basal cells in AD may inhibit MN and nuclear bud
expression (the latter being S-phase dependent) [227].
Future developments of the buccal cytome assay may involve automation either
through image analysis or flow cytometry in order to evaluate a larger number of cells
and provide a more accurate measure of buccal cell division kinetics, differentiation
and cell death.
Changes in the ratios of buccal cell populations may form the basis of a non invasive
test that could identify potential biomarkers that are specific to individuals suffering
from AD. Through further investigation it may be possible to further refine the buccal
cytome assay to include other DNA damage markers such as telomere shortening
[112], aneuploidy [97,99] and oxidative stress [134,137] which have been shown to
contribute to the etiology of the disease. If combined with quantitative measures of tau
and β amyloid, a more comprehensive assay with even greater diagnostic value could

Chapter 3: Buccal cytome and Alzheimer’s disease
102
potentially be developed and used to non-invasively identify individuals
presymptomatically of increased risk of AD.

Chapter 3: Buccal cytome and Alzheimer’s disease
103
Table 3 : Shows the changes in the ratios of buccal cells (mean, standard deviation and P values) following sequential buccal cell sampling. Buccal cells were collected from volunteers (N=4, 2 male, 2 female, age range 40-50yrs) over five different time points 0 mins, 90 mins, 270 mins, 360 mins and 450 mins. Buccal cells were collected as outlined in the cell sampling and preparation part of this manuscript. (Page 6) Slides were stained as outlined in the Feulgen staining part of this manuscript (Page 8). Slides were classified and scored as outlined under the scoring criteria part of this manuscript (Page 9-14). Statistical analysis for mean, standard deviation and one way ANOVA and linear P trends were calculated using Graphpad PRISM (Graphpad inc., San Diego, CA). Significance was accepted at P<0.05. Groups not showing the same letter are significantly different from each other. Sequential samples
Micronuclei per 1000 cells
Nuclear buds Per 1000 cells
Basal cells per 1000 cells
Binucleated cells per 1000 cells
Condensed chromatin cells per 1000 cells
Karyorrhectic cells per 1000 cells
Pyknotic cells per 1000 cells
Karyolytic cells per 1000 cells
Sample1 (0 mins)
0.50±0.57a 0.50±0.57
a 28.75±12.79
a 9.25±4.78
a 25.75±15.59
a 20.3±13.1
a 0.50±0.57
a 156.5±118.4
a
Sample 2 (90 mins)
0.50±0.57a 0.25±0.50
a 51.5±7.9
bf 12.0±4.16
a 22.5±11.47
a 29.0±16.79
a 0.7±1.5
a 111.8±49.17
a
Sample 3 (270 mins)
0.0±0.0a 0.25±0.50
a 59.5±6.75
cf 9.75±3.78
a 30.0±5.1
a 31.0±18.31
a 0.0±0.0
a 135.5±49.17
a
Sample 4 (360 mins)
0.50±0.57a 0.25±0.50
a 65.5±5.19
df 11.5±5.82
a 21.25±2.06
a 29.3±19.21
a 0.0±0.0
a 102.0±32.30
a
Sample 5 (450mins)
0.25±0.5a 0.0±0.0
a 84.75±6.0
e 9.0±1.83
a 31.0±13.29
a 34.3±23.16
a 0.0±0.0
a 129.3±25.25
a
ANOVA P values
0.6272 0.6363 <0.001 0.7968 0.6749 0.2320 0.5032 0.6696
P Value for Linear trend
0.5744 0.1742 <0.001 0.8841 0.6146 0.0489 0.1672 0.4729

Chapter 4: Telomere length
104
4 Chapter 4: Telomere length in white blood cells, bu ccal
cells and brain tissue and it’s variation with agei ng and
Alzheimer’s disease

Chapter 4: Telomere length
105
4.1 Abstract Changes in telomere length have been associated with ageing and with certain age
related degenerative diseases. This study involves using a quantitative RTm-PCR
method to measure absolute telomere length (in Kb per diploid genome) and show
the age-related changes in white blood cells and buccal cell telomere length (in kb
per diploid genome) in normal healthy individuals and Alzheimer’s patients. A
significantly lower telomere length was observed in white blood cells (P<0.0001) and
buccal cells (P<0.01) in Alzheimer’s patients relative to healthy age-matched controls
(31.4% and 32.3% respectively). However, there was a significantly greater telomere
length in hippocampus cells of Alzheimer’s brains (P=0.01) compared to control
samples (49.0%). It was also observed that telomere length in buccal cells was
52.2%-74.2% shorter than in white blood cells (P<0.0001). The odd’s ratio of being
diagnosed with Alzheimer’s disease was 10.8 (95% CI 1.19-97.85) if white blood cell
telomere length was less than 115kb per diploid genome with a specificity of 46%
and sensitivity of 92.9%. The odds ratio for AD diagnosis was 4.6 (95% CI 1.22-
17.16) if buccal cell telomere length was less than 40kb per diploid genome with a
sensitivity of 72.7% and a specificity of 63.1%. These results suggest important
differences in telomere maintenance in Alzheimer’s cases compared to healthy
controls depending on sampled tissue.

Chapter 4: Telomere length
106
4.2 Introduction The ends of eukaryotic chromosomes, which consist of highly conserved
hexanucleotide repeats (TTAGGG) are known as telomeres. Telomeres play an
essential role in the maintenance of genomic stability because they act to protect the
ends of chromosomes from DNA damage and prevent chromosomal end to end
fusions [111,112,260,261]. Due to the nature of the DNA replication mechanism
copying of the 3’ DNA strand ends is incomplete. Consequently, somatic cells lose
between 50-150bp of the telomere repeats every time a cell replicates its DNA and
divides. Therefore, telomere content may serve as an effective biomarker of a cell’s
replicative history [262].
Telomere size is maintained by a unique ribonucleoprotein enzyme called telomerase
(TERT) that mediates the synthesis of telomere repeats in a wide range of tissues
[263]. TERT activity is increased in germ line, malignant cells and stem cells
[115,264]. Thereby, it has been postulated that this increased activity is essential in
establishing a status of “immortality” and uncontrolled cell proliferation which is
characteristic of cancer [265]. Although normal somatic cells may have a limited
capacity to restore telomere length, this does not appear to be sufficient to overcome
telomere shortening caused by the telomere end replication problem or by other
mechanisms induced by oxidative stress [113,266,267].
Thus ageing, involves progressive telomere shortening which is caused by the
inevitable increase in DNA replication with time, and possibly as a result of other
factors such as breaks and deletions in the telomere sequence, deficiencies in
telomere repair and reduced TERT activity. Telomere shortening leads to

Chapter 4: Telomere length
107
chromosomal end to end fusions resulting in chromosomal instability due to the
initiation of breakage fusion bridge (BFB) cycles, cellular senescence, apoptosis and
potential neoplastic changes [261,268]. It has been shown that telomere shortening
is associated with an elevated risk of degenerative disease states such as cancers of
the head, neck, lungs, prostate and bladder and increased risk of cardiovascular
disease [114,115,269,270].
Alzheimer’s disease (AD) is a progressive neurodegenerative disorder that is
characterised clinically by cognitive impairment, memory loss, visuo-spatial and
language impairment and is the most common form of dementia [3,8,10,46].
Currently the global prevalence of AD is 24.3 million with 4.6 million new cases being
diagnosed annually [4,5]. To date no reliable biomarker exists that will identify
individuals with an increased risk for AD.
AD is an example of a premature ageing syndrome and has been associated with
elevated frequencies of genomic instability biomarkers. Genomic instability
biomarkers found to be elevated within AD include micronuclei,
( biomarkers of whole chromosome loss and breakage ) [96,242], aneuploidy of
chromosome 21 in lymphocytes and fibroblasts [97-99] and telomere shortening in
both lymphocytes and fibroblasts [112,271,272]. These results indicate that genomic
instability may play a key role in the etiology of this disease.
The primary aim of the study was to investigate age-related changes in telomere
length in white blood cells (WBC) and buccal cells and to determine whether
excessive shortening of telomere length was a common feature of WBCs, buccal

Chapter 4: Telomere length
108
cells and brain tissue from clinically diagnosed or histopathologically confirmed AD
patients, compared to age and gender matched healthy controls. A secondary aim of
the study was to compare telomere length in WBCs and buccal cells because the
extent to which telomere length differs in these tissues remains unknown. In this
study the quantitative RTm-PCR method of Cawthon [273] was adapted to obtain an
absolute measure of telomere length and report for the first time results with this new
method.
4.3 . Methods
4.3.1 Recruitment and characteristics of participan ts
Approval for this study was obtained from the Human Experimentation Ethics
Committee’s of CSIRO Human Nutrition, Adelaide University, and College Grove
Hospital. Participants in this study consisted of three distinct groups: 30 young
controls (age 18-26yrs), 26 old controls (age 64-75yrs), and 54 clinically diagnosed
Alzheimer’s patients (age 58-93yrs). None of the participants recruited to the study
were receiving anti-folate therapy or cancer treatment. Age, gender and MMSE
scores of the cohorts are shown in Table 1. Gender ratio differences between the
groups were not significant (Chi square P>0.05). Young and old controls were
recruited through the clinic of CSIRO Human Nutrition. Alzheimer’s patients were
recruited at the College Grove Private Hospital, Walkerville, Adelaide, South
Australia following their initial diagnosis and prior to commencement of therapy.
Diagnosis of AD was made by two experienced clinicians according to the criteria
outlined by the National Institute of Neurological and Communicative Disorders and
Stroke-Alzheimer’s Disease and related Disorders Association (NINCDS-AD&DA)

Chapter 4: Telomere length
109
[12]. These are well recognised standards used in all clinical trials. Mini Mental State
Examination scores (MMSE) which are a recognised measure of cognitive
impairment were only available for the Alzheimer’s cohorts’. Participants did not
receive any remuneration for their participation. Alzheimer’s patients were separated
into two distinct groups. The younger AD group was age-matched to the old control
group, whilst the second older AD group was classified as an older Alzheimer’s
cohort. MMSE scores between the two AD groups were not significantly different
(P>0.05). The age of the old control group compared to the younger AD group was
not significantly different, but the younger AD group had a significantly lower age
relative to the older AD group (P<0.0001). The young and old controls were “normal”
functioning healthy individuals, who self volunteered, consented to the study and did
not report a history of cognitive impairment.

Chapter 4: Telomere length
110
Table 1 Age, gender ratio and MMSE scores in study groups
Young
Controls
Old Controls* Younger AD Older AD Alzheimer Brain Tissue Group
Control Brain Tissue Group
N=30 N=26 N=23 N=31 N=13 N=9 Age (Mean±S.D)
22.47±2.177 68.7±2.6 70.7±4.1 83.13±4.5 75.75±7.8 74.10±10.95
Age (Range) 18-26 66-75 58-75 78-93 59-88 60-98 Gender Ratio (Male/Female)
15/15 11/15 8/15 8/23 5/8 6/3
MMSE (Mean±S.D)
NA NA 22.52±3.013 22.13±3.6.76 NA NA
MMSE (Range)
15-27 12-29
* Age and gender matched to younger AD group
NA= Not available

Chapter 4: Telomere length
111
4.3.2 Cell sampling and preparation
Blood was collected from consented young and old controls by trained nursing staff
at the CSIRO Human Nutrition clinic. Buccal cells were also collected from these
cohorts. Blood was collected from consented clinically diagnosed Alzheimer’s
patients prior to medical treatment by trained nursing staff at College Grove Private
Hospital, Walkerville, Adelaide. Buccal cells were also collected from these cohorts.
A single 8ml EDTA tube was collected by venapuncture from all consented
individuals, placed on ice and then transported to the laboratory at CSIRO Human
Nutrition. Prior to buccal cell collection the mouth was rinsed thoroughly with water to
remove any unwanted debris. Small headed toothbrushes (Supply SA, code
85300012) were rotated 20 times in a circular motion against the inside of the cheek,
starting from a central point and gradually increasing in circumference to produce an
outward spiral effect. Both cheeks were sampled using separate brushes. The heads
of the brushes were individually placed into separate 30ml yellow top containers
(Sarstedt code 60.9922.918) containing buccal cell (BC) buffer (0.01M Tris-HCL
(Sigma T-3253), 0.1M EDTA tetra sodium salt (Sigma E5391), 0.02M sodium
chloride (Sigma S5886)) at pH 7.0 and agitated to dislodge the cells. Cells from both
right and left cheeks were transfered into separate TV-10 centrifuge tubes (Sarstedt,
code 60.9921.829) and spun for 10 mins at 1500rpm (MSE Mistral 2000).
Supernatant was removed and replaced with 10mls of fresh BC buffer. The BC buffer
helps to inactivate endogenous DNAases and aids in removing bacteria.

Chapter 4: Telomere length
112
Frozen non-fixed hippocampal brain tissue from histopathologically confirmed
Alzheimer’s patients (positive for the presence of amyloid plaques and neurofibrillary
tangles) was provided by the Brain Bank of South Australia, Centre of Neuroscience,
Flinders University. Control hippocampal brain tissue from histopathologically normal
individuals was provided by both the New South Wales tissue resource centre,
Department of Pathology, University of Sydney and the Brain Bank of South
Australia. Tissue provided from the hippocampus was taken from slices. Cores were
taken using a special drill bit and battery powered drill with the slices being kept on a
bed of ice during retrieval. The removed cores were placed in a small test tube and
stored at -70oC until transported.
4.3.3 DNA isolation
The isolation of DNA from whole blood, buccal cells and brain tissue was performed
under conditions that minimise in vitro oxidation. It has been shown that under
conditions of commonly used DNA isolation protocols, oxidative adducts can
spontaneously form thereby affecting the integrity of the acquired DNA [274,275] . A
modified version of the protocol outlined by Lu was used [276]. DNA was isolated
using the silica-gel membrane based DNeasy blood and tissue kit (Qiagen Cat no
69506), following the manufacturers instructions. Prior to isolation all buffers were
purged for five minutes in nitrogen and supplemented with 50µM phenyl-tert-butyl
nitrone (Sigma B7263) which acts as a free radical trap and scavenger, the use of
phenol and high temperatures (>56 oC) were avoided.

Chapter 4: Telomere length
113
DNA from WBCs was isolated as follows:
100µl of whole blood was added to a microtube containing 20µl of proteinase K and
adjusted to 220µl with phosphate buffered saline (PBS). 200µl of nitrogen purged
DNeasy (Qiagen) AL buffer was added and incubated at 37 oC for 2hrs. 200µl of
ethanol was added and vortexed for 10 seconds. The mixture was pipetted into
another microtube housed in a collection tube and spun for 1 min at 8000rpm
(Eppendorf, Centrifuge 5415R). The spin column was placed inside another
collection tube and 500µl nitrogen purged DNeasy (Qiagen) AW1 buffer was added
and spun for 1 minute at 8000 rpm. The spin column was placed inside another
collection tube and 500µl nitrogen purged DNeasy (Qiagen) AW2 buffer was added
and centrifuged for 3 minutes at 14,000 rpm to dry the DNeasy membrane. DNA
was eluted by placing the spin column in a 2ml collection tube and adding 200µl of
nitrogen purged DNeasy (Qiagen) AE buffer and spun at 8000rpm for 1 minute.
DNA from buccal cells was isolated using a modified version of the protocol used to
isolate DNA from WBCs. Buccal cell pellets were resuspended in 0.5ml of BC buffer
and 100µl was used for the DNA isolation according to the above protocol. Buccal
cells were incubated with proteinase K over night prior to the final steps of DNA
elution.
For isolation of DNA from brain tissue we used a modified version of the protocol
used to isolate DNA from WBCs. 25 mg of brain tissue was cut into small pieces and
placed into a microcentrifuge containing 180µl of nitrogen purged DNeasy (Qiagen)
ATL buffer. After the addition of proteinase K the samples were incubated at 37 oC for
4hr until completely lysed. DNA elution occurred as above.

Chapter 4: Telomere length
114
All samples were quantified using a nanodrop ND-1000 spectrophotometer
(Nanodrop Technologies, Wilmington, U.S.A)
4.3.4 Quantitative real time PCR The quantitative Real-Time amplification of the telomere sequence was performed as
described by Cawthon (2002) with the following modifications. A standard curve was
established by dilution of known quantities of a synthesised 84mer oligonucleotide
containing 14 TTAGGG repeats. The number of repeats in each standard was
calculated using standard techniques, as follows: the oligomer is TTAGGG repeated
14 times, 84bp in length (MW= 26667.2). The highest concentration standard
(standard 1) contained 1.9 x10¹⁰ telomere hexamer repeats units in 60pg which is
equivalent to 1.18 x10⁸ kb of telomere sequence. Assays on serial dilutions were
performed to determine a standard curve for measuring kb of telomeric sequence
(Figure 1). Plasmid DNA (pBR3222) was added to each standard to maintain a
constant 20ng of total DNA per reaction tube.

Chapter 4: Telomere length
115
Telomere standard curve
2 3 4 5 6 714
16
18
20
22
24
26
LOG [Telomere length (kb)]
Ct
Figure 1. Standard curve used to calculate absolute telomere length. CT (cycle
threshold) is the number of PCR cycles which enough SYBR-I green fluorescence is
detected above background. X-axis represents amount of telomere sequence in kb.
Correlation coefficient is 0.979. The graph shown here represents the linear range of
the PCR – DNA amount was optimised so that experimental samples are detected
within the linear range. The value generated from the experimental samples utilising
this standard curve is equal to kb of telomere sequence per sample. Standard curve
was generated using an ABI 7300 Sequence Detection System with the SDS Ver. 1.9
software (Applied Biosystems, Foster City, CA).
All samples were run on an ABI 7300 Sequence Detection System with the SDS Ver.
1.9 software (Applied Biosystems, Foster City, CA). After the reaction is completed
the AB system produces a value that is equivalent to telomere sequence length (kb)

Chapter 4: Telomere length
116
per 20ng of total genomic DNA which is equivalent to telomere sequence length (kb)
per 2983 diploid genomes. The telomere sequence length (kb) per diploid genome
can then be derived from this value by dividing by 2983. A standard curve was
generated in each assay run. Each sample was analysed in duplicate. 36B4
amplification for every sample was also performed to verify accurate quantification of
the amount of template in each well. If the results for duplicate samples differed by
more than one CT value, the results were discarded and the assay repeated. Each
20µl reaction was performed as follows: 20ng DNA, 1xSYBR Green master mix,
100nM telo1 forward (CGGTTTGTTTGGGTTTGGGTTTGGGTTTGGG TTTGGGTT),
100nM telo2 reverse (GGCTTGCCTTACCCTTACCCTTACCC TTACCCTTACCCT)
[273,277]. Cycling conditions (for both telomere and 36B4 amplicons) were: 10min at
95oC, followed by 40 cycles of 95oC for 15sec, 60oC for 1min. DNA from the 1301
lymphoblastoid cell line was used as a control in each plate run. Using the 1301 data
we estimated that the inter-experimental variability was ≤ 7 % (n=34) and the intra-
experimental variability ±1.1 % (n=17). The quantitative RT-PCR technique was
correlated against the established relative RTm-PCR which has been validated
against the southern blot technique (r=0.73, P<0.0001) (Figure 2).

Chapter 4: Telomere length
117
0 50 100 150 200 250 3000.0
0.5
1.0
1.5
2.0
2.5
Absolute vs relative
r=0.73,P<0.0001
Absolute telomere length
Rel
ativ
e te
lom
ere
leng
th
Figure 2 : Graph showing correlation between absolute RT-PCR technique and
established relative RTm-PCR method.
4.4 Statistical analysis
One way ANOVA analysis was used to determine the significance of differences
between groups for the measurement of telomere length, whereas pair wise
comparison of significance was determined using Tukey’s test. Comparisons
between two groups were performed using student’s t-test. ANOVA analysis and t-
test values, positive predictive values, negative predictive values, sensitivity,
specificity, likelihood ratios and odds ratio were calculated using Graphpad PRISM
(Graphpad inc., San Diego, CA). P values <0.05 were considered to be significant.

Chapter 4: Telomere length
118
4.5 Results
The results for the differences in telomere length in WBCs, buccal cells and brain
hippocampus for the cohorts investigated are shown in Table 2 and Figures 3-6.
4.5.1 WBCs (Figure 3) There was a significant difference in WBC telomere length between the young and
old controls (P=0.01). The mean value was lower in the old group by 21.0%.
Telomere length in the young and old controls was greater than that in AD patients
(P<0.0001). Telomere length of the younger AD cohort were significantly shorter than
that of their age-matched old controls (P=0.007). The older AD cohort was also
significantly shorter than the old controls (P=0.001). There were no significant
differences in telomere length between the younger AD and older AD cohorts
(P=0.512) (Figure 3). A correlation analysis was performed of age against telomere
length for all the cohorts for WBC values. An inverse relationship was obtained
between these two parameters with an r value of -0.5098 and a 2 tailed P<0.0001.

Chapter 4: Telomere length
119
WBC telomere length
Young
contr
o ls
Old co
ntrols
Younger
AD
Older
AD
0
25
50
75
100
125
150
175 a
b
P<0.0001
c c
Abs
olut
e te
lom
ere
leng
th(K
b pe
r di
ploi
d ge
nom
e)
Figure 3 . Absolute telomere length in WBC DNA of young controls (N=30), old
controls (N=26), younger AD (N=14) and older AD cohorts (N=18). Groups not
sharing a letter are significantly different from each other. Error bars represent SE of
the mean.
4.5.2 Buccal cells (Figure 4) There were no significant differences in telomere length in buccal cells between the
young and the old control cohort (P>0.05). The Younger AD group tended to have a
lower telomere length when compared to the older control group but this difference

Chapter 4: Telomere length
120
did not achieve significance (P>0.05). The Older AD group had a significantly lower
telomere length compared to the older controls (P=0.01) (Figure 4). Results from
these studies showed that telomere length in buccal cells were consistently lower by
52.2% to 74.2% than the corresponding value for WBCs (Figure 5).
Buccal telomere length
Young
cont
rols
Old co
ntro
ls
Young
er A
D
Older A
D
0
10
20
30
40
50
P=0.01
aa
ab
b
Abs
olut
e te
lom
ere
leng
th(K
b pe
r di
ploi
d ge
nom
e)
Figure 4 . Absolute telomere length in DNA from buccal cells of young controls
(N=30), old controls (N=26), younger AD (N=23) and older AD cohorts (N=30).
Groups not sharing a letter are significantly different from each other. Error bars
represent SE of the mean.

Chapter 4: Telomere length
121
you ng
contr
ols
youn
g cont
rols
old c
ontro
ls
old c on
trols
you ng
er A
D
youn
ger A
D
older
AD
olde r A
D
0
25
50
75
100
125
150
175
P<0.0001
WBCs v Buccal cells
P<0.001
P<0.001
P<0.05P<0.001
Buccal cells
WBCs
Abs
olut
e te
lom
ere
leng
th(K
b pe
r di
ploi
d ge
nom
e)
Figure 5. Comparison of absolute telomere length in whole blood and buccal cell
DNA from the same cohorts. Young controls (N=30), old controls (N=26), younger
AD (N=23) and older AD cohorts (N=30). Error bars represent SE of the mean.

Chapter 4: Telomere length
122
4.5.3 Brain hippocampus There was a significant increase in telomere length in the hippocampus of
Alzheimer’s brain tissue compared to control hippocampus tissue (P=0.01) (Figure
6).
There were no significant gender effects for telomere length within any of the cohorts
for any of the tissues investigated.
AD Brain tissue Control Brain tissue
0
50
100
150
200
P=0.01
Brain hippocampus telomere length
Abs
olut
e te
lom
ere
leng
th(K
b pe
r di
ploi
d ge
nom
e)
Figure 6 . Absolute telomere length in DNA from hippocampal brain tissue of a
histopathologically confirmed Alzheimer’s cohort (N=13) and a normal control cohort
(N=9). Error bars represent SE of the mean.

Chapter 4: Telomere length
123
Table 2: Mean and standard deviation values for cohort absolute telomere lengths Young
Controls (Mean±SD)
Old controls (Mean±SD)
Young AD (Mean±SD)
Old AD (Mean±SD)
AD Brain (Mean±SD)
Control Brain (Mean±SD)
WBC 144.7±58.44a 110.3±28.24 72.04±33.45b 79.36±29.59 NA NA Buccal 41.98±32.66 40.57±19.28 34.41±34.05 20.51±18 .04* NA NA Brain NA NA NA NA 176.9±44.44** 118.7±49.57 NA: Not available a P<0.05 comparing blood telomere length between young and old controls b P<0.05 comparing blood telomere length between Young AD and older controls * P<0.05 comparing buccal telomere length between older AD and old controls **P=0.01 comparing telomere length between AD brain hippocampus and control hippocampus brain tissue
Chapter 4: Telomere length
124
4.5.4 Correlations Combined data for all cohorts showed no significant correlation between buccal cell
and WBC telomere length. Correlation for MMSE scores and WBC telomere length
(r=0.45, -0.02) or buccal telomere length (r=-0.03, 0.04) in the younger AD cohort or
older AD cohort (respectively) were not significant.
4.5.5 Sensitivity and specificity
Values for telomere length for both WBCs and buccal cells in the younger AD group
and the age and gender-matched older control group were analysed to determine the
sensitivity and specificity and thus the usefulness of changes in telomere length as a
potential biomarker for AD. For WBC telomere length <115 Kb per diploid genome
the odds ratio of being diagnosed with AD is 10.8 (95% CI 1.19-97.85) with a
specificity of 46% and sensitivity of 92.9%.
For buccal cell telomere length <40kb per diploid genome the odds ratio of being
identified with AD is 4.6 (95% CI 1.22-1716) with a specificity of 63% and sensitivity
of 72.7%.
4.6 . Discussion
The aim of the study was to investigate age-related changes in telomere length in
WBCs and buccal cells and compare results for these two cell types which are
commonly used in population and biomonitoring studies. It was also determined

Chapter 4: Telomere length
125
whether there were alterations in telomere length in WBCs, buccal cells and brain
tissue within clinically diagnosed or histopathologically confirmed Alzheimer’s
patients compared to control cohorts.
A significantly lower telomere length was found in WBCs in the younger AD
(P=0.007) and the older AD (P=0.001) cohorts compared to the old control group
(Figure 3). There were no significant differences in telomere length between the
younger AD and older AD cohorts (P=0.512). Whole blood contains diverse
populations of WBCs some, or all of which, may demonstrate telomere shortening in
relation to ageing, as well as a result of certain genetic or environmental factors
[266,278]. It has been shown that telomeres from T and B lymphocytes, and
monocytes are shorter in AD patients compared to controls [112]. These results are
consistent with these previous observations. A significantly lower telomere length
was observed between the old controls and the young cohort (P=0.01). Taken
together these results suggest that any observed effects of telomere shortening with
ageing, may be influenced by effects in sub-groups susceptible to developing AD.
The buccal cell telomere length tended to be shorter in the AD groups compared to
the old controls (Figure 4). This is the first time that an association between buccal
cell telomere length and AD has been reported. Unlike WBCs, there was no
significant age-related telomere shortening trend occurring between the young and
old control cohorts. When buccal cell telomere length was compared to the
measurements in WBCs made from the same cohort it is evident that the buccal cell
telomere length is consistently significantly shorter across all groups. Buccal and
WBC telomere length were not found to be significantly correlated. This supports

Chapter 4: Telomere length
126
observations in other studies that telomere length in one tissue does not predict
telomere maintenance in other parts of the body [279,280].
Shorter telomeres in buccal cells may be due to a higher rate of cell division in
epithelial tissues relative to WBC tissue, given a high turn over rate in buccal
exfoliate cells of 21 days relative to a half life of 6 months or greater in lymphocytes.
However, neutrophils which represent the majority of white blood cells, have a life
span of no more than 10 hrs in the blood [281-284]. Despite the differences in half-
life, telomere length in neutrophils is only 5% shorter than in lymphocytes, suggesting
that the effect of replicative history of the different cell types on telomere length may
not be a strong one [285]. An alternative explanation for the shorter telomeres in
buccal cells could be the heterogeneous population sampled which contains
karyorrhectic, karyolytic, pyknotic and cells with condensed chromatin that are in the
process of cellular senescence [225]. This may have affected telomere length
measurements in buccal cells if telomeres are degraded during cell senescence or
cell death. It is possible that buccal cell samples may over-represent dying/dead cells
and under-represent viable cells such as basal and normal differentiated cells. This
highlights the need for methods resulting in more selective sorting of cells that could
potentially lead to a more precise and sensitive assay. It is also not currently evident
whether telomerase activity occurs in any of these buccal cell populations.
Alternatively, the microenvironment of the buccal mucosa which is highly oxygenated
may have an effect on telomere content as a result of oxidative stress, which has
been shown to shorten telomeres [267].

Chapter 4: Telomere length
127
Telomere length within the brain hippocampal tissue was found to be significantly
longer in the Alzheimer’s brain compared to normal control tissue (P=0.01), which is
opposite to the trends observed in WBCs and buccal cells (Figure 6). It has recently
been shown that cells within the dendate gyrus of the hippocampus continue to
divide throughout adult life and may succumb to factors that may influence the
mechanisms underlying cell proliferation [286,287]. Assuming telomere length
reflects proliferation history, then one can conclude that the longer hippocampal
telomeres in the AD group are due to a weaker proliferative capacity relative to
healthy controls. An alternative explanation for the longer telomeres in the AD brain
may be due to initial telomere shortening followed by telomere to telomere end
fusions and amplification of telomere sequences due to breakage /fusion /bridge
cycles [120,121]. It has also recently been shown that DNA methylation is an
important repressor of telomeric DNA recombination [288].
Reduced methylation in subtelomeric sequences possibly as a result of folate, B12
and choline deficiency may result in telomeric elongation either through increased
telomeric recombination events or as a result of increased telomerase activity [288].
Decreases in methylation of subtelomeric regions results in a more “open” chromatin
structure in telomeres, allowing greater accessibility for telomerase and proteins
involved in the alternative lengthening of telomeres mechanism (ALT) [289]. It is
possible that certain somatic tissues susceptible to folate deficiency and in particular
those of the brain, may be more sensitive to such mechanisms regulating telomere
length. There is no evidence to confirm or refute these hypotheses. Only further
experimentation will shed light on hippocampal telomere kinetics. Further studies are
needed in order to determine brain telomere status and functionality.

Chapter 4: Telomere length
128
One of the limitations of the study is that it is not evident which populations of cells
contribute to the changes in telomere content, and whether there is uniform
chromosomal shortening, or shortening of only a specific subset of chromosomes.
Homogeneous cell populations could be made available through fluorescently
labelled cell surface markers and separated by flow cytometry, thereby reducing the
influence of non-viable cells and cell type mixtures on overall telomere content. From
these results it would appear that WBC DNA is potentially a more sensitive measure
of differences in telomere length between AD cases and controls compared to buccal
cells. However, individual cell types may need to be identified to further improve
sensitivity and specificity and more accurately evaluate telomere length as a viable
biomarker for accelerated ageing syndromes.

Chapter 5: Aneuploidy
129
5 Chapter 5: Chromosome 17 and 21 aneuploidy in bucca l
cells is increased with ageing and in Alzheimer’s
disease

Chapter 5: Aneuploidy
130
5.1 Abstract
Alzheimer’s disease is a premature ageing syndrome characterised by cognitive
impairment arising from neuropathological changes occurring within specific areas of
the brain. This study found a 1.5 fold increase in trisomy 21 (P<0.001) and a 1.2 fold
increase in trisomy 17 (P<0.001) in buccal cells of Alzheimer’s patients compared to
age and gender matched controls. Chromosome 17 and chromosome 21 monosomy
and trisomy increase significantly with age (P<0.001). Down’s syndrome, which
exhibits similar neuropathological features to those observed in Alzheimer’s disease
also showed a strong increase in chromosome 17 monosomy and trisomy compared
to matched controls (P<0.001). These results suggest that an increased incidence of
aneusomy for both chromosomes 17 and 21, which may lead to altered gene dosage
and expression of both the Tau and APP genes, may contribute to the etiology of
Alzheimer’s disease. However, aneuploidy rate for chromosome 17 and 21 in the
nuclei of hippocampus cells of brains from Alzheimer’s patients and controls were not
significantly different.
5.2 Introduction Alzheimer’s disease (AD) is a complex progressive neurodegenerative disorder of
the brain, and is the commonest form of dementia [3]. Neurodegenerative changes
appear firstly within the entorhinal cortex and then progress to the hippocampus
eventually disrupting learning and short term memory [290,291]. The disease is
clinically defined by progressive memory loss, visuo-spatial and language impairment
and various psychiatric and behavioural changes [3,8,10,46]. The two
histopathological structures present within the brain that positively identify AD

Chapter 5: Aneuploidy
131
conclusively at post mortem are the neurofibrillary tangles and the amyloid based
neuritic plaques [10,46].
Neurofibrillary tangles are composed of the microtubule associated protein tau, the
gene of which is located on chromosome 17q21.1 [18]. Tau is important as it
associates with tubulin in the formation of microtubules. Microtubules impart shape
and structure to cells, and also form the basis of a cellular transport network allowing
the movement of neurotransmitters, micronutrients and organelles that are essential
for normal cellular function [20]. Microtubules also provide points of attachment for
chromosomes during cell division, which if disrupted may result in an increased
incidence of chromosome malsegregation [292]. The neurofibrillary tangles contain
structures known as paired helical threads comprised of tau which are
hyperphosphorylated. This hyperphosphorylation leads to a dissociation between
tubulin and tau resulting in a breakdown of the brain transport system leading to loss
of biological activity, cell death and potential microtubule dysfunction leading to
chromosome malsegregation [18,20]. The second histopathological feature in the
brain of AD patients is the amyloid based neuritic plaques. These consist of the 42
amino acid β amyloid peptide 42 (Aβ42), which originates from the aberrant
proteolysis of the amyloid precursor protein (App), the gene (APP) of which is located
on chromosome 21q21 [28].
Down’s syndrome (DS) like AD is a premature ageing syndrome characterised by
various degrees of chromosome 21 trisomy and an elevated incidence of genome
instability [241,293]. DS individuals develop dementia and manifest brain changes
that are histopathologically indistinguishable from AD, usually during the third or

Chapter 5: Aneuploidy
132
fourth decade of life [101,294]. For this reason it has been suggested that both AD
and DS share underlying mechanisms involving susceptibility to chromosome
malsegregation events, particularly those involving chromosome 21. Alteration in
gene dosage and expression for the TAU and APP gene resulting from aneuploidy
may be an important contributor to the etiology of AD. It has not yet been determined
whether aneuploidy of chromosome 17 has a higher incidence in AD and DS and
whether gene dosage and altered gene expression of the TAU gene may play a
potential contributory role in AD and DS pathology.
There is much evidence from previous studies to show that both AD and DS share an
increased susceptibility to genomic instability events. Micronuclei are elevated in AD
lymphocytes and were shown to be centromere positive indicating whole
chromosome loss [96]. Migliore et al also showed a significant increase in
micronuclei in the lymphocytes of young Down’s syndrome mothers (MDS) and
showed they were more prone to non-disjunction events for chromosome 13 and 21
[295]. A similar predisposition to increased aneuploidy events for chromosome 13
and 21 has been shown in lymphocytes of AD patients [97,98]. Fibroblast cultures
from sporadic and familial AD patient’s that carry mutations within the presenilin 1,
presenilin 2 and the amyloid precursor protein were found to have an approximately
2 fold increase in the number of trisomy 21 cells compared to cultures from normal
individuals [99]. These findings suggest that aneuploidy may have a contributing role
to early changes in disease development.
The aim of this study was to use fluorescent in situ hybridisation (FISH) and
fluorescently labelled DNA probes, to determine the incidence of aneuploidy of

Chapter 5: Aneuploidy
133
chromosome 17 and 21 in the buccal mucosa and hippocampal brain tissue of
Alzheimer’s patients compared to age and gender matched controls. It was also our
intention to investigate any age-related effects on aneuploidy involving these two
chromosomes between a young and old cohort, and whether aneuploidy for
chromosome 17 in the buccal mucosa of DS was significantly different from controls.
Buccal cells were selected for this study because they can be collected non-
invasively and originate from the neuroectoderm from which brain tissue is derived
[296]. Buccal cells may therefore exhibit genetic defects common to brain tissue
acquired during the early stages of development.
5.3 Methods
5.3.1 Recruitment and characteristics of participan ts
Approval for this study was obtained from CSIRO Human Nutrition, Adelaide
University, Ramsay Health Care and Southern Cross University Human
Experimentation Ethics Committee’s. Participants in this study consisted of four
distinct groups: 30 younger controls (age 18-26yrs), 31 older controls (age 64-75yrs),
21 DS individuals (age 5-20yrs) and 54 clinically diagnosed Alzheimer’s patients (age
58-93yrs). None of the participants recruited to the study were receiving anti-folate
therapy or cancer treatment. Alzheimer’s patients were recruited at the College
Grove Private Hospital, Walkerville, Adelaide, South Australia following their initial
diagnosis and prior to commencement of therapy. Diagnosis of AD was made by
experienced clinicians according to the criteria outlined by the National Institute of
Neurological and Communicative Disorders and Stroke-Alzheimer’s Disease and

Chapter 5: Aneuploidy
134
related Disorders Association (NINCDS-AD&DA) [12]. These are recognised
standards used in all clinical trials. Mini Mental State Examination scores (MMSE)
which are a recognised measure of cognitive impairment were only available for the
Alzheimer’s cohorts. Participants did not receive any remuneration for their
participation.
Alzheimer’s patients were separated into two distinct groups. One group (younger AD
group) was age matched to the older control, whilst the second group was classified
as the older AD group. Gender ratio differences between the groups were not
significant (P>0.05). MMSE scores between the two AD groups were not significantly
different (P>0.05). The age of the older control group compared to the younger AD
group was not significantly different but the younger AD group had a significantly
lower age relative to the older AD group (P<0.0001). The younger and older controls
were “normal” functioning healthy individuals, who self volunteered and consented to
the study and did not report a history of cognitive impairment. Demographic
characteristics of the cohorts are shown in Table 1. Consent from AD and DS
volunteers’ was provided by either partners or guardians.

Chapter 5: Aneuploidy
135
Table 1 Age, gender ratio and MMSE scores in study groups Young
controls
Down’s
syndrome
Old Controls* Younger AD Older AD Alzheimer’s Brain Tissue Group
Control Brain Tissue Group
N=30 N=21 N=26 N=23 N=31 N=13 N=9
Age (Mean±S.D)
22.47±2.177 10.43±5.582 68.7±2.6 70.7±4.1 83.13±4.5 75.75±7.8 74. 10±10.95
Age (Range) 18-26 5-20 66-75 58-75 78-93 59-88 60-98
Gender Ratio (Male/Female)
15/15 11/10 11/15 8/15 8/23 5/8 6/3
MMSE (Mean±S.D)
NA NA NA 22.52±3.013 22.13±3.6.76 NA NA
MMSE (Range)
15-27 12-29
* Age and gender matched to younger AD group NA= Not available

Chapter 5: Aneuploidy
136
5.3.2 Buccal cell collection and slide preparation
Buccal cells were collected using a modified version of the method used by Beliën et
al [225]. Prior to buccal cell collection the mouth was rinsed thoroughly with water to
remove any unwanted debris. Small headed toothbrushes (Supply SA, code
85300012) were rotated 20 times in a circular motion against the inside of the cheek,
starting from a central point and gradually increasing in circumference to produce an
outward spiral effect. Both cheeks were sampled using separate brushes. The heads
of the brushes were individually placed into separate 30ml yellow top containers
(Sarstedt ,code 60.9922.918) containing buccal cell (BC) buffer (0.01M Tris-HCL
(Sigma T-3253), 0.1M EDTA tetra sodium salt (Sigma E5391), 0.02M sodium
chloride (Sigma S5886)) at pH 7.0 and agitated to dislodge the cells. Cells from both
right and left cheeks were transfered into separate TV-10 centrifuge tubes (Sarstedt,
code 60.9921.829) and spun for 10 mins at 1500rpm (MSE Mistral 2000).
Supernatant was removed and replaced with 10mls of fresh BC buffer. The BC buffer
helps to inactivate endogenous DNAases and aids in removing bacteria that may
complicate scoring. Cells were spun and washed twice more, with a final volume of
5mls of BC buffer being added to the cells. The cell suspension was vortexed and
then homogenised for 2 mins in a hand homogeniser (Wheaton scientific 0.1-0.15
mm gauge) to increase the number of single cells in suspension. Left and right cell
populations were pooled into a 30ml yellow top container and drawn into a syringe
with a 21G gauge needle and expelled to encourage cellular separation. Cells were
passed into a TV-10 tube through a 100µm nylon filter (Millipore,code
MILNYH02500) held in a swinex filter (Millipore, code MILSX0002500) to remove
large aggregates of unseparated cells that hinder slide preparation and cell analysis.

Chapter 5: Aneuploidy
137
Cells were further spun at 1500rpm for 10 mins and the supernatant removed. Cells
were resuspended in 1ml of BC buffer and the cell concentration determined by a
Coulter counter (Beckman Coulter Model ZB1, Settings Attenuation:1, Threshold:8,
Aperture:1/4, Manometer:0.5). Cell suspensions were prepared containing 80,000
cells/ml after initial readings from a 1:50 dilution (300µl/15mls isoton). 50 µl/ml of
dimethyl sulphoxide (Sigma 2650) was added to help clarify cellular boundaries by
further separating the cells. 120 µl of cell suspension was added to cytospin cups
and spun at 600 rpm for 5 mins in a cytospin (Shandon cytospin 3). Slides containing
two spots of cells were air dried for 10 mins and then fixed in ethanol:acetic acid (3:1)
for 10 mins. Slides for FISH were air dried for 10 mins prior to being stored at -70°C
in a sealed dessicated slide box.
5.3.3 Brain tissue collection and slide preparation
Frozen non-fixed hippocampal brain tissue from histopathologically confirmed
Alzheimer’s patients (positive for the presence of amyloid plaques and neurofibrillary
tangles) was provided by the Brain Bank of South Australia, Centre of Neuroscience,
Flinders University. Control hippocampal tissue from histopathological normal
individuals was provided by both the New South Wales tissue resource centre,
Department of Pathology, University of Sydney and the Brain Bank of South
Australia. Tissue provided from the hippocampus was taken from slices. Cores were
taken using a special drill bit and battery powered drill with the slices being kept on a
bed of ice during retrieval. The removed cores were placed in a small test tube and
stored at -70oC until transported.

Chapter 5: Aneuploidy
138
200mg of brain tissue was weighed (Sartorius Scales type 1475) inside a biological
safety cabinet (Gelman Sciences, BH series) and placed on a slide inside a petri dish
and moistened with a few drops of phosphate buffered saline (PBS),(120 mM sodium
chloride, 2.7 mM pottasium chloride, 10 mM potassium phosphate monobasic,10 mM
sodium phosphate dibasic, pH 7.4) . Tissue was minced and chopped thoroughly
using a scalpel blade (Blade No 11,Swann-Morton Ltd, Sheffield, England) and
transferred to TV-10 tube. 2ml PBS washings were taken of the slide within the
inclined petri dish and transfered to the TV-10 tube. Three washings per slide were
made. A glass pipette was used to draw up and release the cell suspension to
encourage the separation of single cells. Care was taken to avoid the production of
aerosols whilst pipetting. The tube was balanced and centrifuged at 2500 rpm for 10
mins. The supernatant was removed and replaced with 6mls of PBS. The cell pellet
was drawn up and released several times using a glass pipette to further encourage
the production of single cells. Cells were drawn up into a 10ml syringe and filtered
into a TV-10 tube through a 100µm nylon filter (Millipore, code MILNYH02500) held
in a swinex filter (Millipore, code MILSX0002500) to remove large aggregates of
unseparated cells that hinder slide preparation and cell analysis. 1ml of Carnoys fix,
ethanol: glacial acetic acid (3:1) was added and the suspension mixed. Tubes were
spun for 2500rpm for 10 mins. Supernatant was aspirated and fresh fix added to a
volume of 6mls and centrifuged at 2500rpm for 10 mins. Fixation was repeated and
cells resuspended in 4mls of fix to produce a cloudy suspension. Cells were dropped
onto clean slides, air dried for 10 mins and placed in a slide box at -20°C with
desiccant ready for FISH analysis.

Chapter 5: Aneuploidy
139
5.3.4 Preparation of chromosome 17 DNA probe Centromeric chromosome 17 specific DNA probe was generated by PCR labelling
with centromere specific primers for the chromosome (α17A1: 5' AAT TCG TTG
GAA ACG GGA TAA TTT CAG CTG 3'; α17B2: 5' CTT CTG AGG ATG CTT CTG
TCT AGA TGG C 3' (Geneworks, Thebarton, Adelaide) [297,298] . The length of the
amplification product is 227bp (26). Briefly, PCR was carried out with 0.2 µM of each
primer, 60 µM Digoxingenin-11-dUTP (Roche No: 1093088), 140 µM dTTP, 200 µM
dATP, dCTP and dGTP (Roche No: 1969064). The PCR was started with pre-
denaturation at 94°C for 2 min, followed by 25 cycles of 92°C for 1 min, 61°C for 2
min, 72°C for 2min, and terminal extension at 72°C for 10min. Chromosome 17
centromeric probe was validated by hybridising to human metaphases to determine
exact position and ensure no cross hybridising had occurred.
5.3.5 Human metaphase preparation 5mls of whole blood was collected in a lithium heparin tube. 500µl of whole blood
was added to 10ml of RPMI-1640 media (Trace lot DO8183-100) containing 20%
fetal calf serum (Trace LotAO6168-100),100IU/ml penicillin/streptomycin (Trace Lot
DO5335-100), 0.7mmol L-glutamine (Sigma G7513) and 90µg/ml
Phytohaemagglutinin (Ref No:HA15, Remel Europe Ltd, U.K). Duplicate cultures
were incubated at 37oC for 48hrs.100µl of Thymidine (30mg/ml in distilled water
Sigma T-9250) was added to each 10ml culture and incubated for 18hrs at 37oC. 100
µl of 2-deoxycytidine (Sigma cat no: D-3897) was added to each culture at a final
concentration of 2.4µg/ml and further incubated at 37oC.for 5 hours. 100µl of
colchicine (Sigma, C-9754) was added at a final concentration of 0.1µg/ml and

Chapter 5: Aneuploidy
140
incubated for 20 minutes after being transferred to conical based centrifuge tubes
(Sarstedt, cat No: 60.9921.829). All tubes were spun at 1500rpm for 10 minutes, after
which the supernatant was removed and replaced drop wise with 1ml of 0.022M
potassium chloride (Sigma P-8041) which acts as a hypotonic. A further 7mls of
hypotonic was added and incubated at 37oC for 20 mins. 1ml of ice cold 3:1 (ethanol:
acetic acid) fixative was added drop wise to the cultures and left for 5mins. Tubes
were inverted to allow even distribution of the fix and then spun down at 1500rpm for
10 mins. The supernatant was removed leaving ~ 1 ml of cell pellet and a further
7mls of fix was added. The tubes were inverted and subsequently spun down; fixing
was performed a total of three times producing a white cell pellet.
Slides were cleaned in ethanol prior to being placed in a freezer to chill down before
metaphase preparation. Cold cell suspension was dropped onto the slides from a
height of ~ 12 inches and Newtons rings allowed to expand and dry on the bench.
Slides were checked under phase contrast to determine chromosome length, mitotic
index and degree to which metaphases had spread out. Slides were then used to
validate the specificity of prepared chromosome 17 labelled DNA probes (Figure 1).
Chromosome 17 was identified by chromosomal length and centromeric position in
relation to other group E chromosomes. Group E chromosomes are the short,
submetacentric human chromosomes, comprising of chromosome pairs 16, 17, and
18.

Chapter 5: Aneuploidy
141
Chromosome 17Chromosome 17
Figure 1 : Metaphase showing hybridised DNA labelled probe specific to
chromosome 17 centromere.
5.3.6 Hybridisation and detection for chromosome 17
Prior to hybridization and detection the buccal slides were pre-treated with pepsin
(Sigma P-7012) (300µg/ml in 0.01N HCL (BDH Lab supplies)) for 10 mins whilst
lymphoblastoid control slides were treated with (5µg/ml pepsin in 0.01N HCL) at 37
°C for 10 min and then washed twice in phosphate-buffered saline (PBS, pH 7.0) for
5 min at room temperature. Afterwards, the slides were dehydrated in a cold ethanol
series (70%, 70%, 80%, 90%, and 100%) for 2 mins each and air dried.
Hybridizations were performed according to a modified technique of Pinkel et al
[299,300]. Slides were denatured at 79°C for 5 min in pre-warmed 70% formamide
(Sigma Aldrich No:295876)/2XStandard Saline Citrate (SSC), (0.15M sodium
chloride, 0.015M sodium citrate) and then dehydrated through an ethanol series
(70%, 70%, 80%, 90%, 100%,for 2 min each) at 4°C. 2 µl of the digoxigenin -11-

Chapter 5: Aneuploidy
142
dUTP labelled PCR product, 1 µl of 2mg/ml herring sperm DNA (Sigma D7290) were
mixed with 6 µl hybridization buffer (55% formamide, 10% dextran (Sigma D 6001) in
1x SSC), 1 µl of water and denatured at 79°C for 5 min. The probe mixture was then
added to the slides (5 µl/cytospin spot), a coverslip was applied and sealed with
rubber cement. Hybridization was carried out overnight (18-20hrs) in a humidified
chamber at 37°C. Cover slips wee removed with forceps and post-hybridization
washing at 45°C occurred in coplin jars as follows, twice in 2 X SSC for 5 min, twice
in 50% formamide (2x SSC, pH 7.0) for 5 min and twice in 0.1XSSC for 5min
followed by a 30 minute incubation in block buffer (3% Bovine serum albumin (BSA)
(Sigma No: B 4287)/ 4 X SSC) at 37°C. The signal was detected using anti-
digoxigenin rhodamine (1:300) (Roche Diagnostics No:1207750) at 37°C for 30 min
followed by 3 washes in 4xSSC/ 0.03% Tween 20 (Sigma P1379) at 45°C for 5 min
each. The nuclei were counterstained with 4, 6-diamidino-2-phenylindole (DAPI,
Sigma No: D9542) (0.1µg/ml in 4XSSC with 0.06% Tween 20) for 5 min at room
temperature and cover-slipped in anti-fade solution [0.2333g of 1, 4-diazabicyclo-
(2.2.2)-octane (DABCO, Sigma D 2522) in 800µl purified water, 200µl 1M Tris-HCL
(Sigma T 3252), 9ml glycerol (Sigma G 5516)]. The coverslips were sealed with nail
varnish and kept at –20°C in dark.
5.3.7 Hybridisation and detection for chromosome 21
Chromosome 21 aneuploidy was investigated using a directly labelled commercially
bought fluorescent probe (Vysis-LSI 21 probe labelled with spectrum orange, No: 32-
190002). LSI 21 is approximately 200 kb and contains unique DNA sequences
complementary to the loci D21S259, D21S341, and D21S342 (21q22.13-q22.2). It

Chapter 5: Aneuploidy
143
was intended to probe the slides simultaneously, but due to delays in acquiring a
suitably labelled chromosome 21 probe and specific filter blocks, slides were probed
independently for both chromosomes.
Hybridisation and detection of the probe was performed according to the
manufacturer’s instructions following a pre-treatment. Prior to in situ hybridization the
buccal slides were pre-treated with pepsin (Sigma) (300µg/ml in 0.01N HCL) for 10
mins whilst lymphoblastoid control slides were treated with (5µg/ml pepsin in 0.01N
HCL) at 37 °C for 10 min and then washed twice in phosphate-buffered saline (PBS,
pH7.0) for 5 min at room temperature. Afterwards, the slides were dehydrated in a
cold ethanol series (70%, 70%, 80%, 90%, and 100%, for 2 min each) and air dried.
Slides were denatured at 79°C for 5 min in pre-warmed 70% formamide/2XSSC and
then dehydrated through an ethanol series (70%, 70%, 80%, 90%, 100%, 2 min
each) at 4°C and then placed in a 37°C oven to reach hybridization temperature. 10µl
of probe mixture per slide (1µl LSi 21 probe, 2 µl distilled water, 6µl LSi/WCP
hybridisation buffer) was prepared and denatured in a 79°C water bath for 5mins. 5 µl
of the probe mixture was added to each buccal cytospin spot, cover slipped and
sealed with rubber cement before incubating at 37°C over night (~16hr) in a
humidified box.
Coverslips were removed with forceps before slides were washed in three coplin jars
of 50% formamide/2xSSC at 45°C for 10 mins. Slides were further washed in coplin
jars of 2xSSC and 2XSSC/0.1% Nonidet P40 (Roche No: 1754599) at 45°C for
10mins. The nuclei were counterstained with 4, 6-diamidino-2-phenylindole (DAPI)
(0.05µg/ml in 4XSSC with 0.06% Tween 20) for 1min 20 secs at room temperature

Chapter 5: Aneuploidy
144
and cover-slipped in anti-fade solution the coverslips were sealed with nail varnish
and kept at –20°C in dark.
5.3.8 Scoring Method
A minimum of 1000 buccal cells or hippocampal brain tissue cells were scored for
the presence of one, two or three signals (Figures 2 and 3). Only nuclei with at least
one FISH signal were scored. In the cases of nuclei with more than one signal only
those nuclei in which the signals were of similar size and intensities, and were
separated by a distance of more than half the diameter of one FISH signal were
scored [301]. A Nikon E600 fluorescence microscope was used with a triple band
filter (for DAPI, FITC and Rhodamine) allowing simultaneous visualization of the
signals from both the fluorochrome and the nuclear counterstain.
5.4 Statistical Analyses
One way ANOVA analysis was used to determine the significance of difference
between groups for aneuploidy incidence, whereas pair wise comparison of
significance was determined using Tukey’s test. Gender ratios were tested using the
Chi square test. ANOVA analysis values and cross correlation analysis was
calculated using Graphpad PRISM (Graphpad inc., San Diego, CA). Significance was
accepted at P<0.05.

Chapter 5: Aneuploidy
145
a) b) c)
d) e) f)
Figure 2 : FISH results showing non disjunction events in buccal cells. a) Chromosome 17 monosomy, b) Chromosome 17 disomy,
c) Chromosome 17 trisomy, d) Chromosome 21 monosomy, e) Chromosome 21 disomy, f) Chromosome 21 trisomy
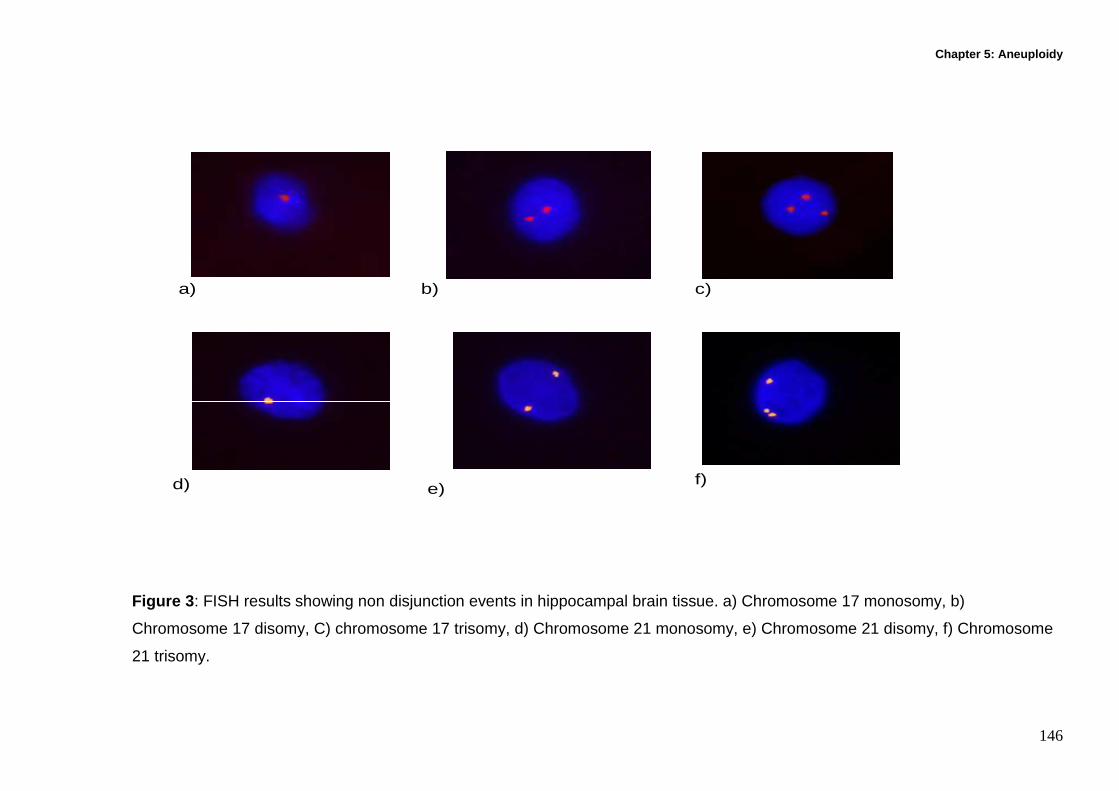
Chapter 5: Aneuploidy
146
a) b) c)
d) e)f)
Figure 3 : FISH results showing non disjunction events in hippocampal brain tissue. a) Chromosome 17 monosomy, b)
Chromosome 17 disomy, C) chromosome 17 trisomy, d) Chromosome 21 monosomy, e) Chromosome 21 disomy, f) Chromosome
21 trisomy.

Chapter 5: Aneuploidy
147
5.5 Results
The results for the incidence of aneuploidy (monosomy and trisomy) for chromosome
17 and 21 in buccal cells for all groups are shown in Figures 4 and 5. The results
showing the incidence of aneuploidy (monosomy and trisomy) for chromosomes 17
and 21 in hippocampal brain tissue from Alzheimer’s and control groups are shown in
Figures 6 and 7. Percentages of aneuploid cells scored in both buccal cells and brain
tissue are outlined in Table 2.
5.5.1 Normal ageing-Aneuploidy in buccal cells Monosomy of chromosome 17 and 21 is increased by 222.2 % (P<0.001), and
91.4% (P<0.001) and trisomy of chromosome 17 and 21 is increased by 89.0%
(P<0.001) and 97.4% (P<0.001) respectively in the old controls relative to the young
controls. The total aneuploidy rate was 13.8% for chromosome 17 and 9.6% for
chromosome 21 in old controls compared to 5.0% and 5.0% respectively in young
controls.
5.5.2 Down’s syndrome-Aneuploidy in buccal cells Monosomy and trisomy of chromosome 17 is increased by 292.7 % (P<0.001) and
79.7% (P<0.001) respectively in DS relative to young controls and were at a level
similar to that observed in old controls. Total aneuploidy rate for chromosome 17 in
DS was 16.0% compared to 5.0% in young controls and 13.8% in old controls.
Results for chromosome 21 aneuploidy could not be meaningfully compared given
that DS is caused by trisomy of chromosome 21. The total aneuploidy rate for

Chapter 5: Aneuploidy
148
chromosome 21 was 92.1% in DS compared to 5.0% in young controls and 9.6% in
old controls. Most DS individuals are cytogenetically determined as having full
trisomy 21. Incomplete hybridisation of the LSI 21 probe to buccal cells may be
responsible for a lower rate of trisomy 21 with cells appearing disomic and therefore
being scored as false negatives. However, It has been shown that DS individuals
tend to exhibit increased disomy 21 with ageing, resulting in various frequencies of
mosaicism for aneuploidy of chromosome 21, which may reflect our findings
[272,302].
5.5.3 Alzheimer’s disease-Aneuploidy in buccal cell s Both chromosome 17 monosomy and trisomy were increased in the younger AD
group by 19.4% (P<0.05) and 16.1% (P<0.001) respectively relative to the old control
group, but there were no differences between the younger and older AD groups. The
total chromosome 17 aneuploidy rate in younger and older AD groups was 15.7%
and 16.4% compared to 13.8% in the old control group. Chromosome 21 trisomy was
increased by 183.3% (P<0.001) in the AD groups relative to the old controls, but
there was no difference in chromosome 21 monosomy. MMSE scores were not
significantly correlated with chromosome 17 or chromosome 21 aneuploidy.
5.5.4 Alzheimer’s disease- Aneuploidy in Brain hipp ocampus Chromosome 17 or chromosome 21 aneuploidy did not differ significantly in
hippocampus tissue of Alzheimer’s cases and controls. Chromosome 17 and 21
aneuploidy rate in hippocampus was 18-18.2% and 11.8-12.8% compared to 13.8-

Chapter 5: Aneuploidy
149
16.4% and 9.6-11.6% in buccal cells of old controls and AD patients respectively,
suggesting a slightly higher aneuploidy rate in brain tissue relative to buccal mucosa.
youn
g co
ntro
ls
Down'
s sy
ndro
me
old
contro
ls
youn
ger A
D
olde r A
D
0102030405060708090
100110120130
P<0.0001
Chromosome 17 monosomy
a
b
cd
bbd
a)
Freq
uenc
y in
100
0 bu
ccal
cel
ls
youn
g cont
rols
Down's
synd
rom
e
old c
ontro
ls
youn
ger
AD
older
AD
05
101520253035404550556065
P<0.0001
Chromosome 21 monosomy
aa
bb b
b)
Fre
quen
cy in
100
0 bu
ccal
cel
ls
Figure 4 : Frequency of a) Chromosome 17 monosomy and b) Chromosome 21
monosomy following FISH in 1000 buccal cells of young controls (N=30), Down’s
syndrome (N=21), old controls (N=26), younger AD (N=23) and older AD (N=31).
Groups sharing the same letters are not significant. Error bars indicate SE of the
mean.

Chapter 5: Aneuploidy
150
Chromosome 17 trisomy
you ng C
ont rols
Down 's s ynd rom
e
old cont rols
young er A
D
old er AD
0
10
20
30
40
50
P<0.0001
a
bb
c c
a)
Chr
omos
ome
17 t
riso
my
freq
uenc
y (%
)
young Contro
ls
Down's synd ro
me
old contro
ls
younger A
D
o lder AD
0102030405060
P<0.0001
a
b
c
d d800900
b)
Chromosome 21 trisomy
Chr
omos
ome
21 t
riso
my
freq
uenc
y
Figure 5: Frequency of a) Chromosome 17 trisomy and b) Chromosome 21 trisomy
following FISH in 1000 buccal cells of young controls (N=30), Down’s syndrome
(N=21), old controls (N=26), younger AD (N=23) and older AD (N=31). Groups
sharing the same letters are not significant. Error bars indicate SE of the mean.

Chapter 5: Aneuploidy
151
Alzheimer's Controls0
25
50
75
100
125
150
175a a
P=0.8392
Chromosome 17 monosomy
a)
Fre
quen
cy in
100
0 br
ain
cells
Chromosome 21 monosomy
Alzheimer's Controls0
102030405060708090
100110
P=0.1781
aa
b)
Fre
quen
cy in
100
0 br
ain
cells
Figure 6 : Frequency of a) Chromosome 17 monosomy and b) Chromosome 21
monosomy from 1000 hippocampal brain tissue cells of Alzheimer’s patients (N=13)
and control hippocampal brain tissue (N=9). Groups sharing the same letters are not
significant. Error bars indicate SE of the mean.

Chapter 5: Aneuploidy
152
Alzheimer's Controls0
10
20
30
40
P=0.7343
Chromosome 17 trisomy
a a
a)
Frq
uenc
y in
100
0 br
ain
cells
Chromosome 21 trisomy
Alzheimer's Controls05
1015202530354045
P=0.753
a a
b)
Frqu
ency
in 1
000
brai
n ce
lls
Figure 7 : Frequency of a) Chromosome 17 trisomy and b) Chromosome 21 trisomy
from 1000 hippocampal brain tissue cells of Alzheimer’s patients (N=13) and control
hippocampal brain tissue (N=9). Groups sharing the same letters are not significant.
Error bars indicate SE of the mean (N=9).
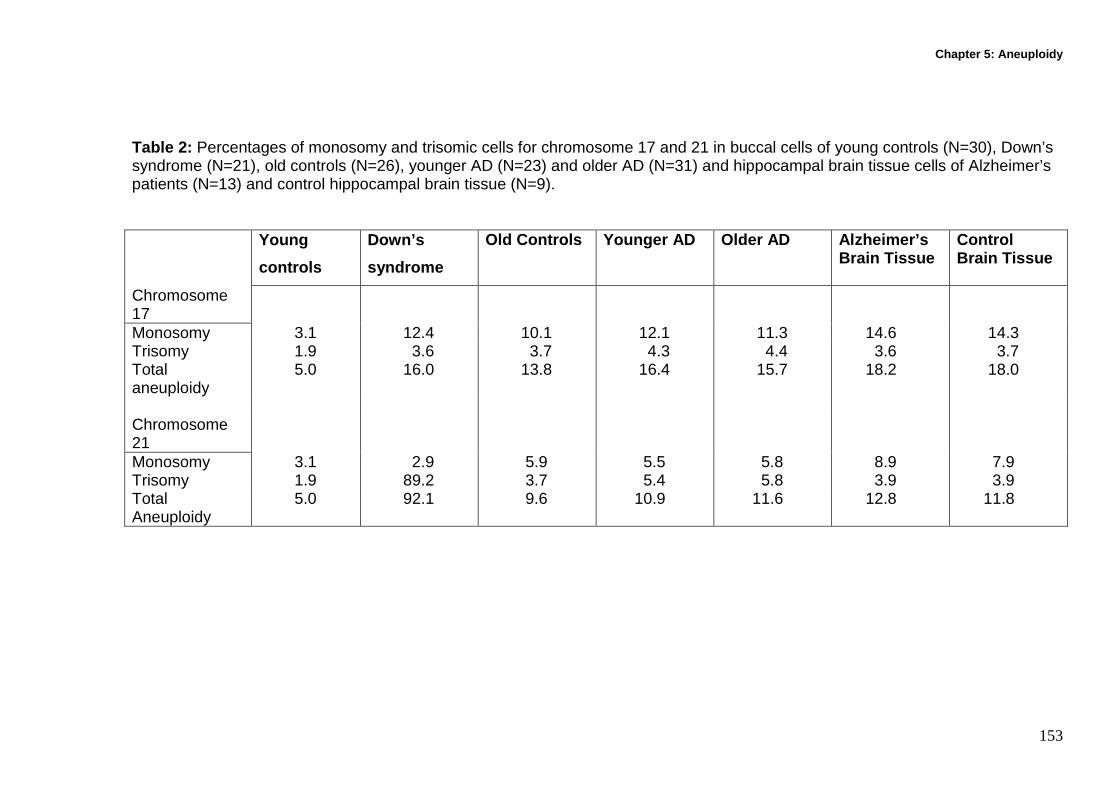
Chapter 5: Aneuploidy
153
Table 2: Percentages of monosomy and trisomic cells for chromosome 17 and 21 in buccal cells of young controls (N=30), Down’s syndrome (N=21), old controls (N=26), younger AD (N=23) and older AD (N=31) and hippocampal brain tissue cells of Alzheimer’s patients (N=13) and control hippocampal brain tissue (N=9). Young
controls
Down’s
syndrome
Old Controls Younger AD Older AD Alzheimer’s Brain Tissue
Control Brain Tissue
Chromosome 17
Monosomy 3.1 12.4 10.1 12.1 11.3 14.6 14.3 Trisomy 1.9 3.6 3.7 4.3 4.4 3.6 3.7 Total aneuploidy
5.0 16.0 13.8 16.4 15.7 18.2 18.0
Chromosome 21
Monosomy 3.1 2.9 5.9 5.5 5.8 8.9 7.9 Trisomy 1.9 89.2 3.7 5.4 5.8 3.9 3.9 Total Aneuploidy
5.0 92.1 9.6 10.9 11.6 12.8 11.8

Chapter 5: Aneuploidy
154
5.6 Discussion
The aim of the study was to test the hypotheses that aneuploidy of chromosomes 17
and 21 in buccal cells a) is a risk factor for neurodegenerative diseases such as AD
and DS and b) increases with ageing.
A significant 1.2 fold increase in aneuploidy for chromosome 17 and a 1.5 fold
increase in aneuploidy 21 was found within the buccal mucosa of AD patients
compared to age and gender matched controls. A 1.8 fold increase in the incidence
of chromosome 17 in DS buccal cells was found compared to the young control
group (P<0.001). The DS values were not significantly different from the old control,
even though the old control group is 50 yrs senior to the DS group. DS aneuploidy
rates are beyond those expected for normal ageing confirming its status as a
premature ageing syndrome. Although a significant increase in aneuploidy rate for
chromosome 17 (P<0.001) and chromosome 21 (P<0.001) occurred in buccal cells
with normal ageing, the data showed that the incidence of chromosome
malsegregation in both the AD and DS groups was significantly increased and
beyond the levels expected for healthy subjects in corresponding age groups. Given
the strong association of trisomy 21 with premature ageing in DS, it is plausible that
elevated trisomy 21 observed in AD may contribute to accelerated ageing in this
condition.
Increased aneuploidy for chromosome 17 and 21, which could lead to altered gene
dosage and expression for tau and App, may be an important contributing factor
leading to the early stages of the development of AD, if critical regions of the brain

Chapter 5: Aneuploidy
155
are enriched in aneuploid cells during early development due to mosaicism. The APP
gene present on chromosome 21 may be over expressed in the small population of
cells that are trisomic and could result in aberrant proteolysis and the accumulation of
the 42 beta amyloid peptide (Aβ42) which is the core component of the senile
plaques found in the brains of both DS and AD patients [52,56,102,246]. This
amyloidogenic pathway has traditionally held the view that the neurotoxic effects of
these peptides contribute to the etiology of the disease. Recently this view has been
challenged suggesting that APP itself may play an important neuronal role leading to
cognitive impairment [252,303,304]. The precise role of these peptides and proteins
and their interaction and potential relationship to the development of AD will need to
be conclusively determined through future studies. App processing is also altered in
terms of the ratio of (Aβ42) compared to the normal 40 amino acid β amyloid peptide
(Aβ40), resulting in an increase of the more neurotoxic and amyloidogenic Aβ42.
Similarly, an individual who is mosaic for trisomy 17 cells could potentially over-
express the microtubule associated protein tau which may lead to an increased
aggregation of the protein; this could in turn result in increased paired helical
filaments known to make up the neurofibrillary tangles. Abnormal accumulation or
deficiency of tau could lead to a breakdown of the microtubule system, causing
chromosomal malsegregation as a result of microtubule disruption. Similarly a
breakdown in the neuronal transport system due to microtubule dysfunction may
result in an apparent micronutrient deficiency affecting certain susceptible areas of
the brain known to be affected in AD.
It is plausible that trisomy 21 mosaicism in brain tissue, particularly within the
hippocampus, may have originated from chromosome malsegregation events early in

Chapter 5: Aneuploidy
156
fetal development and may be a possible explanation for some sporadic forms of AD
[99,100]. Low level In utero mosaicism may be the result of non-disjunction caused
by folate deficiency, which has been shown to increase the rate of chromosome 17
and 21 aneuploidy in lymphocytes [103]. Recent studies have shown an increased
predisposition to chromosome malsegregation in the young mothers of Down’s
syndrome individuals (MDS) [305]. Schumpf et al showed a five fold increase in the
risk of AD within this cohort of young mothers and suggested that these individuals
are biologically prematurely aged increasing their susceptibility to aneuploidy events
[305]. Chromosome 21 aneuploidy could predispose these individuals to DS
pregnancies and potentially contribute to an increased risk for developing AD later in
life [305].
The risk of aneuploidy due to chromosome malsegregation is likely to be increased in
cerebral tissues undergoing post-maturation neurogenesis, such as the dentate
gyrus of the hippocampus involved in short term memory and learning and the glial
cells [306]. Both populations of cells have been shown to continue cell division in the
adult brain and so could be potential candidates to accumulate aneuploid cells
throughout an individual’s lifetime [287]. The data shows that mosaicism for
chromosome 17 and 21 occurred within the hippocampus of histopathologically
confirmed Alzheimer’s patients. However, the aneuploidy rate for these two
chromosomes was not significantly different from control hippocampal tissue. This
result suggests that elevated chromosome 17 and 21 aneuploidy is unlikely to be a
causative factor of AD on its own, unless higher rates of aneuploidy of these
chromosomes were present much earlier in the life of AD cases and rates of mitosis
in neural tissue was reduced relative to controls. An alternative possibility is that
Chapter 5: Aneuploidy
157
abnormal expression of tau and App occurs to a greater extent in chromosome 17
and 21 aneuploid cells in AD relative to controls. Studies investigating the
relationship between tau and App expression and chromosome 17 and 21
aneuploidy are needed to address this question.
Polymorphisms of Presenilins and APOE genes that are known risk factors for both
AD and DS are likely to play a pivotal role in chromosome malsegregation. Mutated
Presenilin genes that contribute to early onset familial AD, have been shown to
produce proteins localised within the nuclear membrane, centrosomes and
kinetochores indicating a role in chromosome segregation and organisation [106]. An
association has also been shown between polymorphisms within intron 8 of the
Presenilin 1 gene and errors within maternal meiosis II that led to trisomy 21 [307].
This same polymorphism has also been identified as conferring an increased risk for
late onset AD [78,99,308]. It has been shown that certain alleles of APOE influence
the age of onset of dementia in both AD and DS. The APOE4 allele has been shown
to influence the development of sporadic AD and DS. DS individuals with two copies
of this allele develop more severe forms of AD neuropathology compared to DS
individuals lacking the e4 allele [98,309,310]. The APOE4 allele has also been shown
to be significantly more common among young mothers of Down’s syndrome
children, suggesting that this allele may predispose these individuals to chromosome
21 non-disjunction and a potential influential role for this allele on chromosome
malsegregation [311].
Micronutrient deficiency may also have an influence upon chromosome
malsegregation in both AD and DS. It has been shown that AD patients tend to be

Chapter 5: Aneuploidy
158
deficient in vitamins such as folate and B12 [138,154]. Folate and B12 play an
important role in DNA metabolism and the maintenance of methylation patterns that
could modify gene expression [140,141]. There is evidence to show that abnormal
folate metabolism, possibly as a result of polymorphisms within genes of the
folate/methionine pathway, may result in a state of DNA hypomethylation in the
centromeric regions of chromosomes leading to abnormal chromosome segregation
[159,312,313]. In addition folate deficiency has been show to increase aneuploidy of
chromosome 17 and 21 [103].
In conclusion the results of this study show that a) aneuploidy of chromosomes 17
and 21 increases with ageing in buccal cells, b) AD patients exhibit an abnormally
high rate of chromosome 17 and 21 aneuploidy in buccal cells compared to controls;
c) DS is associated with increased aneuploidy of chromosome 17 in buccal cells and
d) despite these differences in buccal cell’s, aneuploidy of chromosome 17 and 21 in
hippocampus tissue did not differ between AD cases and controls. These results
suggest that aneuploidy of chromosome 17 and 21 may be caused by genetic factors
that predispose to AD but are unlikely to be a primary cause of brain pathology in AD.

Chapter 6: Folate metabolism and Alzheimer’s diseas e
159
6 Chapter 6: Folate metabolism and Alzheimer’s diseas e

Chapter 6: Folate metabolism and Alzheimer’s diseas e
160
6.1 Abstract The primary aim of this study was to confirm earlier observations that AD individuals
have altered plasma folate, B12 and Hcy levels compared to age matched controls
who have not been clinically diagnosed with AD. Secondly, genotyping studies were
undertaken to determine whether polymorphisms within the genes of the folate
methionine pathway contributed to AD pathogenesis. Lastly, any correlation between
folate, B12 and Hcy status with previously determined buccal micronucleus cytome
assay biomarkers for DNA damage, cell proliferation and cell death markers was
investigated.
6.2 Introduction Folate (vitamin B9) is an essential B vitamin that is crucial to the prevention of
genomic instability and hypomethylation of DNA [314,315]. Folate is required for the
synthesis of deoxythymidine monophosphate (dTMP) from deoxyuridine
monophosphate (dUMP) which is essential for DNA synthesis and repair (Figure 1).
Under conditions of folate deficiency dUMP accumulates resulting in excessive uracil
corporation into DNA leading to single and double strand DNA breaks, chromosome
breakage and ultimately micronucleus formation [142,316,317]. Folate and vitamin
B12 are required in the synthesis of methionine through the remethylation of
homocysteine (Hcy) and in the synthesis of S-adenosylmethionine (SAM). SAM plays
an important role as a methyl donor required for the maintenance of genomic
methylation patterns that determine gene expression, DNA conformation and is
required for the synthesis of myelin, neurotransmitters and membrane phospholipids
[143,318]. Folate deficiency reduces SAM levels resulting in lower DNA cytosine
methylation and elevated levels of Hcy. Additionally, folate deficiency may lead to
Chapter 6: Folate metabolism and Alzheimer’s diseas e
161
demethylation of centromeric DNA repeat sequences and centromere dysfunction
leading to abnormal chromosome distribution during nuclear division, resulting in
elevated rates of aneuploidy and altered gene dosage. Folate deficiency has been
shown to increase trisomy for chromosome 17 and 21 leading to the possible over
expression of Alzheimer’s disease (AD) related genes, Tau, MPO and APP
[103,319].
AD is a chronic progressive neurological disorder accounting for more than 50% of all
clinically diagnosed dementia cases. Studies have shown that AD is associated with
lower levels of folate and B12 and elevated levels of plasma Hcy compared to age-
matched non-Alzheimer’s controls [138,139,154]. Hyperhomocysteinemia has been
shown to be a strong independent risk factor for AD [146,320]. Hcy not only promotes
excitotoxicity giving rise to neuronal DNA damage and apoptosis, but enhances β
amyloid production through its interaction with presenilins resulting in the induction of
stress proteins such as Herp [149,321,322]. These findings suggest that Hcy-induced
neuronal damage occurring in areas of the brain, such as the hippocampus which is
involved in short term memory and learning, may result in the cognitive impairment
that is characteristic of AD patients. However, the actual concentration of
homocysteine within the hippocampus of AD patients has yet to be determined.
It is possible that polymorphisms within the folate metabolic pathway may alter the
efficiency of folate metabolism as a result of reduced enzyme activity leading to the
elevated Hcy levels observed in AD patients. Methylenetetrahydrofolate reductase
(MTHFR) converts 5, 10 methylene tetrahydrofolate to 5, methyltetrahydrofolate
which provides a methyl group used in the conversion of Hcy to methionine. A

Chapter 6: Folate metabolism and Alzheimer’s diseas e
162
common C to T polymorphism at position 677 of MTHFR, results in reduced enzyme
activity of the heterozygote CT by 35% and by 70% in the TT homozygote compared
to the CC genotype, possibly leading to elevated Hcy levels [159]. A second
polymorphism in the MTHFR gene involves an A to C transition at position 1298 and
is thought to play a regulatory role in the activity of the MTHFR enzyme, which when
altered may lead to abnormal folate metabolism [161]. Methionine synthase (MTR)
catalyses the transfer of a methyl group from 5 methyltetrafolate to Hcy utilising
vitamin B12 as a cofactor to produce methionine. Deficiency in vitamin B12 or
reduced MTR enzyme activity as a result of common polymorphisms such as the A to
G transition at the 2756 position in MTR may result in elevated levels of Hcy [164].
Methionine synthase reductase (MTRR) is responsible for maintaining adequate
levels of reduced methyl cob(I)alamin the activated cofactor for methionine synthase.
A common polymorphism involving an A to G transition at position 66 has been
shown to have an association with circulating Hcy concentrations in the blood, with
AA homozygotes having elevated Hcy levels compared to AG heterozygotes and GG
homozygotes [323].
The primary aim of this study was to confirm earlier observations that AD individuals
have altered plasma folate, B12 and Hcy levels compared to age matched controls.
Genotyping studies were undertaken to determine whether polymorphisms within the
genes of the folate methionine pathway are associated with AD pathogenesis. Lastly,
correlations between folate, B12 and Hcy status with previously determined buccal
micronucleus assay cytome biomarkers for DNA damage, cell proliferation and cell
death markers were investigated, to determine the possibility that the buccal cytome
may be influenced by B vitamin status

Chapter 6: Folate metabolism and Alzheimer’s diseas e
163
DNA synthesis
and repair
B6
MTHFR
Cystathione
Homocysteine
B6
MTRR
5-Methyl THF
dTMP
B12
B12
B12
Folic Acid
SAM
Dietary Folate
CH
DNAmethylation
3
Cob (I)
Cob (II)
Cob (III)
Gene expression
Cell proliferation and protein synthesis
THF
5,10-MethylTHF
DHF
5,10-Methylene THF
dUMP
MTR
Methionine
Figure 1 . A simplified scheme of one carbon metabolism showing the effects of key
enzymes and co factors on DNA methylation, synthesis and repair. DHF,
Dihydrofolate; THF, Tetrahydrofolate; MTHFR, Methylenetetrahydrofolate; MTR,
Methionine Synthase; MTRR, Methionine Synthase Reductase; B12,
Cyanocobalamin (in various oxidative forms). SAM, S-Adenosylmethionine; dUMP,
deoxyuridine monophosphate; dTMP, deoxythymidine monophosphate.
6.3 Methods
6.3.1 Recruitment and characteristics of participan ts Approval for this study was obtained from CSIRO Human Nutrition, Adelaide
University, and Ramsey Health Care Human Experimentation Ethics Committees.
Participants in this study consisted of three distinct groups: 30 young controls (age
18-26yrs), 26 old controls (age 64-75yrs), and 54 clinically diagnosed Alzheimer’s
patients (age 58-93yrs). None of the participants recruited to the study were receiving

Chapter 6: Folate metabolism and Alzheimer’s diseas e
164
anti-folate therapy or cancer treatment. Age, gender and MMSE scores of the cohorts
are shown in Table 1. Gender ratio differences between the groups were not
significant (chi square P>0.05). Young and old controls were recruited through the
clinic of CSIRO Human Nutrition. Alzheimer’s patients were recruited at the College
Grove Private Hospital, Walkerville, Adelaide, South Australia following their initial
diagnosis and prior to commencement of therapy. Diagnosis of AD was made by two
experienced clinicians according to the criteria outlined by the National Institute of
Neurological and Communicative Disorders and Stroke-Alzheimer’s Disease and
related Disorders Association (NINCDS-AD&DA) [12]. These are well recognised
standards used in all clinical trials. Mini Mental State Examination scores (MMSE)
which are a recognised measure of cognitive impairment were only available for the
Alzheimer’s cohorts. Participants did not receive any remuneration for their
participation. Alzheimer’s patients were separated into two distinct groups. The
younger AD group was age-matched to the old control group, whilst the second older
AD group was classified as an older Alzheimer’s cohort. MMSE scores between the
two AD groups were not significantly different (P>0.05). The age of the old control
group compared to the younger AD group was not significantly different, but the
younger AD group had a significantly lower age relative to the older AD group
(P<0.0001). MMSE scores were not available for the control groups. The young and
old controls were “normal” functioning healthy individuals, who self volunteered,
consented to the study and did not report a family history of cognitive impairment.
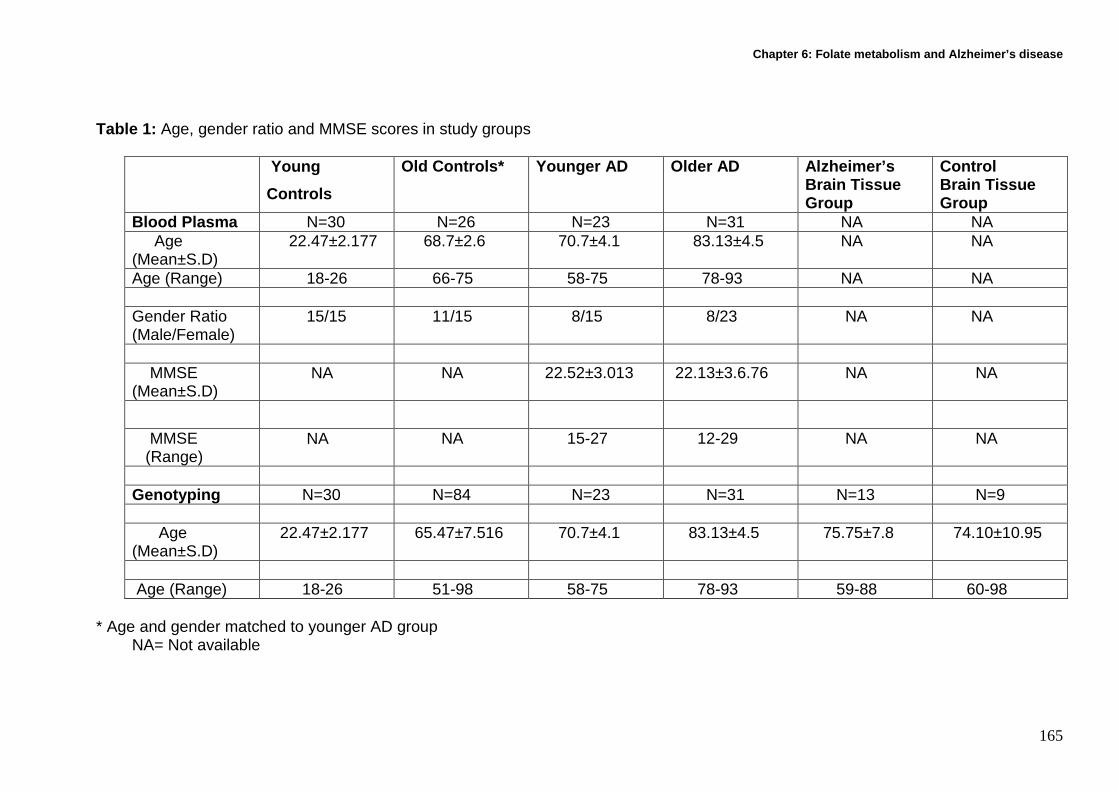
Chapter 6: Folate metabolism and Alzheimer’s diseas e
165
Table 1: Age, gender ratio and MMSE scores in study groups Young
Controls
Old Controls* Younger AD Older AD Alzheimer’s Brain Tissue Group
Control Brain Tissue Group
Blood Plasma N=30 N=26 N=23 N=31 NA NA Age (Mean±S.D)
22.47±2.177 68.7±2.6 70.7±4.1 83.13±4.5 NA NA
Age (Range) 18-26 66-75 58-75 78-93 NA NA Gender Ratio (Male/Female)
15/15 11/15 8/15 8/23 NA NA
MMSE (Mean±S.D)
NA NA 22.52±3.013 22.13±3.6.76 NA NA
MMSE (Range)
NA NA 15-27 12-29 NA NA
Genotyping N=30 N=84 N=23 N=31 N=13 N=9 Age (Mean±S.D)
22.47±2.177 65.47±7.516 70.7±4.1 83.13±4.5 75.75±7.8 74.10±10.95
Age (Range) 18-26 51-98 58-75 78-93 59-88 60-98
* Age and gender matched to younger AD group NA= Not available

Chapter 6: Folate metabolism and Alzheimer’s diseas e
166
6.3.2 Cell sampling and preparation
Blood was collected from consented young and old controls by trained nursing staff
at the CSIRO Human Nutrition clinic. Buccal cells were also collected from these
cohorts. Blood was collected from consented clinically diagnosed Alzheimer’s
patients prior to medical treatment by trained nursing staff at College Grove Private
Hospital, Walkerville, Adelaide. Buccal cells were also collected from these cohorts.
Buccal samples were more readily available from the AD cohorts as visits to the clinic
were infrequent and obtaining a fasted blood sample required a second visit within
the study time frame. This was not logistically practical as many individuals lived
outside of the city limits and relied on relatives/friends for transportation to the clinic.
Consequently, this resulted in more buccal cell samples being made available for
analysis compared to the lower numbers for blood samples.
A single fasted 8ml EDTA tube was collected by venapuncture from all consented
individuals, placed on ice and then transported to the laboratory at CSIRO Human
Nutrition. Blood samples were spun for 20 mins at 3000rpm (MSE Mistral 2000). 1ml
of plasma was separated for folate and vitamin B12 evaluation and 0.5ml of plasma
for Hcy determination. All samples were snap frozen in liquid nitrogen and then
stored at -80ºC until analysis could be performed. Prior to buccal cell collection the
mouth was rinsed thoroughly with water to remove any unwanted debris. Small
headed toothbrushes (Supply SA, code 85300012) were rotated 20 times in a circular
motion against the inside of the cheek, starting from a central point and gradually
increasing in circumference to produce an outward spiral effect. Both cheeks were
sampled using separate brushes. The heads of the brushes were individually placed
Chapter 6: Folate metabolism and Alzheimer’s diseas e
167
into separate 30ml yellow top containers (Sarstedt code 60.9922.918) containing
buccal cell (BC) buffer (0.01M Tris-HCL (Sigma T-3253), 0.1M EDTA tetra sodium
salt (Sigma E5391), 0.02M sodium chloride (Sigma S5886)) at pH 7.0 and then
transported to the laboratory at CSIRO Human Nutrition.
Frozen non-fixed hippocampal brain tissue from histopathologically confirmed
Alzheimer’s patients (positive for the presence of amyloid plaques and neurofibrillary
tangles) was provided by the Brain Bank of South Australia, Centre of Neuroscience,
Flinders University. Control hippocampal brain tissue from histopathologically normal
individuals was provided by both the New South Wales tissue resource centre,
Department of Pathology, University of Sydney and the Brain Bank of South
Australia. Tissue provided from the hippocampus was taken from slices. Cores were
taken using a special drill bit and battery powered drill with the slices being kept on a
bed of ice during retrieval. The removed cores were placed in a small test tube and
stored at -70oC until transported.
6.3.3 Quantification of plasma folate
Plasma folate was quantified using the ARCHITECT® folate assay (Abbott
Laboratories, Abbott Park, IL, USA), a chemiluminescent microparticular folate
binding protein assay, on the ARCHITECT® i System. The ARCHITECT® folate assay
exhibits total imprecision of < 10% within the calibration range (0.0 – 20.0 ng/mL).
The analytical sensitivity of the assay is ≤ 0.8 ng/mL. Prior to quantification of the
plasma samples, a calibration curve was generated for the ARCHITECT® folate
assay. Subsequently, every 24 hours, a single sample of all control levels was tested

Chapter 6: Folate metabolism and Alzheimer’s diseas e
168
to ensure the control values were within the concentration range as specified by the
manufacturer. The assay was recalibrated when control samples were out of range
or when a new reagent kit with a new lot number was used.
To convert plasma folate to measurable folate a manual pre-treatment is performed.
Two pre-treatment steps mediate the release of folate from endogenous folate
binding protein. First, plasma and a pre-treatment reagent (dithiothreitol in acetic acid
buffer with EDTA) were aspirated and dispensed into a reaction vessel. Second, an
aliquot of the pre-treatment solution and potassium hydroxide were aspirated and
dispensed into a second reaction vessel. An aliquot of the second pre-treatment
solution was mixed with a TRIS buffer with protein stabilisers (human albumin)
containing monoclonal mouse anti-folate binding protein coupled to microparticles
affinity bound with bovine folate binding protein (FBP). Folate present in the plasma
binds to the FBP coated microparticles. After washing with phosphate buffered saline
(PBS) solution, pteroic acid–acridinium labelled conjugate (in MES buffer with
porcine protein stabiliser) was added, which binds to unoccupied sites on the FBP
coated microparticles. Pre-trigger (1.32% w/v hydrogen peroxide) and trigger (0.35 N
sodium hydroxide) solutions were then added, resulting in a chemiluminescent
reaction that can be measured in relative light units (RLUs). An inverse relationship
exists between the amount of folate in the plasma and the RLUs detected by the
ARCHITECT® i optical system. The concentration of folate in plasma was expressed
as nmol/L. Quantification of folate was performed by Division of Clinical Biochemistry,
Institute of Medical and Veterinary Science, Adelaide.

Chapter 6: Folate metabolism and Alzheimer’s diseas e
169
6.3.4 Quantification of Vitamin B12 in plasma
Vitamin B12 in plasma was quantified using the ARCHITECT® B12 assay (Abbott
Laboratories, Abbott Park, IL, USA), a chemiluminescent microparticular intrinsic
factor assay, on the ARCHITECT® i System. The ARCHITECT® B12 assay exhibits
total imprecision of < 10% within the calibration range (0.0 – 1476 pmol/L). The
analytical sensitivity of the assay is ≤ 44.27 pmol/L. Prior to quantification of plasma
samples, the ARCHITECT® vitamin B12 assay was calibrated using the test
calibrators supplied by the manufacturer and a calibration curve was generated. A
single sample of all control levels was tested every 24 hours to ensure the control
values were within the manufacturers specified concentration range. The assay was
recalibrated when control samples were out of range or when a new reagent kit with
a new lot number was used.
In a reaction vessel plasma was combined with three pre-treatment reagents,
containing either a) 1.0 N sodium hydroxide with 0.005% potassium cyanide, b) alpha
monothioglycerol and EDTA or c) cobinamide dicyanide in borate buffer with protein
stabilisers (avian). An aliquot of the pre-treatment solution and potassium hydroxide
(KOH) was aspirated and dispensed into a second reaction vessel. An aliquot of the
pre-treatment solution was mixed in a new reaction vessel with assay diluent (borate
buffer with EDTA) and intrinsic factor (porcine) coated microparticles (in borate buffer
with bovine protein stabilisers). Vitamin B12 present in the plasma binds to the
intrinsic factor coated microparticles. After washing with a PBS solution, B12–
acridinium labelled conjugate (in MES buffer) was added, which binds to unoccupied
sites on the intrinsic factor coated microparticles. Pre-trigger (1.32% w/v hydrogen
peroxide) and trigger (0.35 N sodium hydroxide) solutions were then added to the

Chapter 6: Folate metabolism and Alzheimer’s diseas e
170
reaction mixture, resulting in a chemiluminescent reaction that can be measured in
relative light units (RLUs). An inverse relationship exists between the amount of
Vitamin B12 in the plasma and the RLUs detected by the ARCHITECT® i optical
system. Vitamin B12 concentrations of the samples were determined from the
standard (calibration) curve by matching the absorbance readings with the
corresponding B12 concentrations. The concentration of vitamin B12 was expressed
as pmol/L. Quantification of Vitamin B12 in plasma was performed by the Division of
Clinical Biochemistry, Institute of Medical and Veterinary Science, Adelaide.
6.3.5 Quantification of plasma total L-homocysteine
L-homocysteine in plasma was quantified using the AxSYM® homocysteine (Hcy)
assay (Abbott, Wiedbaden, Germany), a fluorescence polarisation immunoassay
(FPIA), on the AxSYM ® system. The AxSYM® Hcy assay exhibits total imprecision of
< 6% within the calibration range (0.0 – 50 µmol/L). Prior to quantification of the Hcy
samples, the AxSYM® Hcy assay was calibrated using the test calibrators supplied by
the manufacturer and a calibration curve was generated. A single sample of all
control levels was tested every 24 hours to ensure the control values were within the
manufacturers specified concentration range. The assay was recalibrated when
control samples were out of range or when a new reagent kit with a new lot number
was used.
In the assay homocysteine, mixed disulfide, and protein-bound forms of Hcy are
reduced to form free Hcy by dithiothreitol (DTT). Free Hcy is converted to S-
adenosylHcy (SAH) by SAH hydrolase and excess adenosine. Under physiological

Chapter 6: Folate metabolism and Alzheimer’s diseas e
171
conditions, SAH hydrolase converts SAH to Hcy. Excess adenosine in the pre-
treatment solution drives the conversion of Hcy to SAH by SAH hydrolase.
Plasma was pre-treated in a reaction vessel with 0.1 M phosphate buffer, bovine
SAH hydrolase (in phosphate buffer with bovine protein stabilizers) and a pre-
treatment solution containing DTT and adenosine in citric acid. An aliquot of this
solution was mixed with monoclonal mouse anti-S-adenosyl-L-Hcy (in phosphate
buffer with bovine protein stabilisers) and 0.1 M phosphate buffer, and transferred to
the cuvette of the reaction vessel. A second aliquot of the pre-treated plasma solution
was mixed with S-adenosyl-L-cysteine fluorescence tracer (in phosphate buffer with
bovine protein stabiliser) and 0.1 M phosphate buffer, and transferred to the cuvette.
SAH and the labelled fluorescent tracer compete for the sites on the antibody
molecule. The intensity of the resulting polarised fluorescent light was measured by
the FPIA optical assembly. Total L-Hcy concentrations of the samples were
determined from the standard curve by matching the absorbance readings with the
corresponding total L-Hcy concentrations. The concentration of total L-Hcy was
expressed as µmol/L. Quantification of plasma Hcy was performed by the Division of
Clinical Biochemistry, Institute of Medical and Veterinary Science, Adelaide.
6.3.6 DNA isolation for genotyping
The isolation of DNA from buccal cells and brain tissue was performed under
conditions that minimise in vitro oxidation. These conditions are not essential for DNA
isolation for genotyping but were originally performed to investigate telomere length
as outlined in chapter 4. DNA was isolated using the silica-gel membrane based

Chapter 6: Folate metabolism and Alzheimer’s diseas e
172
DNeasy blood and tissue kit (Qiagen Cat no 69506), following the manufacturers
instructions. Prior to isolation all buffers were purged for five minutes in nitrogen and
supplemented with 50µM phenyl-tert-butyl nitrone (Sigma B7263) which acts as a
free radical trap and scavenger, the use of phenol and high temperatures (>56 oC)
were avoided.
All samples were quantified using a nanodrop ND-1000 spectrophotometer
(Nanodrop Technologies, Wilmington, U.S.A)
DNA from buccal cells was isolated as follows: Buccal cell pellets were resuspended in 0.5ml of BC buffer and 100µl used for the
DNA isolation. 100µl of the buccal pellet was added to a microtube containing 20µl of
proteinase K and adjusted to 220µl with phosphate buffered saline (PBS). 200µl of
nitrogen purged DNeasy (Qiagen) AL buffer was added and incubated at 37 oC
overnight. 200µl of ethanol was added and vortexed for 10 seconds. The mixture was
pipetted into another microtube housed in a collection tube and spun for 1 min at
8000rpm (Eppendorf, Centrifuge 5415R). The spin column was placed inside another
collection tube and 500µl nitrogen purged DNeasy (Qiagen) AW1 buffer was added
and spun for 1 minute at 8000 rpm. The spin column was placed inside another
collection tube and 500µl nitrogen purged DNeasy (Qiagen) AW2 buffer was added
and centrifuged for 3 minutes at 14, 0000 rpm to dry the DNeasy membrane. DNA
was eluted by placing the spin column in a 2ml collection tube and adding 200µl of
nitrogen purged DNeasy (Qiagen) AE buffer and spun at 8000 rpm for 1 minute.

Chapter 6: Folate metabolism and Alzheimer’s diseas e
173
Isolation of DNA from brain tissue We used a modified version of the above protocol to isolate DNA from brain tissue.
25 mg of brain tissue was cut into small pieces and placed into a microcentrifuge
containing 180µl of nitrogen purged DNeasy (Qiagen) ATL buffer. After the addition
of proteinase K the samples were incubated at 37 oC for 4hr until completely lysed.
DNA elution occurred as above.
6.3.7 Genotyping
Additional genotype data from age and gender matched healthy controls were used
from historical data bases of our previous studies [324], to increase the number of
older healthy controls (N=84) to achieve comparable numbers when comparing
genotypes with the Alzheimer’s cohort. All additional individuals were recruited
through CSIRO clinic of Human Nutrition after CSIRO ethics committee approval.
Isolated DNA from all cohorts was genotyped for MTHFR C677T, MTHFR A1298C,
MTR A2756G and MTRR A66G polymorphisms using the Applied Biosystems
7900HT Real Time PCR system, and ABI 7300 Sequence detection system with the
SDS Version 1.9 software (Applied Biosystems, Foster City, CA). Each reaction was
performed in duplicate. Control samples for homozygotes and heterozygotes for each
polymorphism were also included to act as internal controls for each reaction. These
genotypes had previously been determined using the PCR Restriction Fragment
Length Polymorphism method.

Chapter 6: Folate metabolism and Alzheimer’s diseas e
174
The allelic discrimination assay used in determining genotype is a multiplexed; end
point assay that detects variants within a single nucleic acid sequence. The presence
of two primer/probes that are specific for each allele within a single reaction allows
the detection of the two possible variants at the polymorphic site within the target
template sequence. The primers/probes can be distinguished, as they are labelled
with different fluorescent reporter dyes such as FAM and VIC. During strand
replacement a fully hybridised probe remains bound, resulting in probe cleavage and
release of the reporter dye. A mismatch between primer/probe and the target
sequence reduces probe hybridisation and subsequent cleavage. Increases in the
fluorescence of reporter molecule fluorescence containing FAM or VIC indicate
specific allele homozygosity, or an increase in both signals indicates allele
heterozygosity. (Figure 2)
Figure 2 : Allelic discrimination scatter plot for allele X (G) versus allele Y (A) for
methionine synthase reductase A66G polymorphism

Chapter 6: Folate metabolism and Alzheimer’s diseas e
175
6.3.8 Allelic discrimination primers for genotype d etection
Primers for MTHFR C677T and MTR A2756G were obtained from Applied
Biosystems as assays on demand (Catalogue numbers: C-1202883-20 and C-
12005959-10 respectively). The primer and reporter sequences for MTHFR A1298C
(Catalogue number: C-850486-20) and MTRR A66G (Catalogue number: C-
3068176-10) which were ordered as assays by design are outlined below.
MTHFR A1298C
Forward primer: 5’-GGAGGAGCTGCTGAAGATGTG-3’
Reverse primer: 5’-CCCGAGAGGTAAAGAACAAAGACTT-3’
Reporter 1: 5’-CCAGTGAAGCAAGTGT-3’ VIC
Reporter 2: 5’-CCAGTGAAGAAAGTGT-3’ FAM (Common Allele A)
MTRR A66G
Forward primer: 5’-AGCAGGGACAGGCAAAGG-3’
Reverse primer: 5’-CCCGAGAGGTAAAGAACAAAGACTT-3’
Reporter 1: 5’-ATCGCAGAAGAAATGTGTGA -3’ VIC
Reporter 2: 5’-TCGCAGAAGAAATATGTGA -3’ FAM (Common Allele A)
6.3.9 PCR conditions and reagents
The PCR master mix for each 20 µl reaction consisted of 10.0 µl Taqman® 2x
Universal PCR Master mix without Amperase® UNG (Applied Biosystems, Foster city,
CA, catalogue number: 4324018), 1.0 µl of each primer contained in 20x assay on
demandTM SNP genotyping assay mix , 6 µl of distilled water and 20ng of genomic
DNA.
Chapter 6: Folate metabolism and Alzheimer’s diseas e
176
The thermal cycling conditions for MTHFR C677T and MTR A2756G comprised of 10
mins at 95oC as an initial denaturation followed by 50 cycles at 92oC for 15 seconds
and 60oC for 60 seconds to complete annealing. The thermal cycling conditions for
MTHFR A1298C and MTRR A66G consisted of 10 mins at 95oC followed by 50
cycles at 96oC for 15 seconds and 60oC for 90 seconds to complete annealing.
6.4 Statistics
One way ANOVA analysis was used to determine the significance of difference
between groups for plasma micronutrient and protein levels, whereas pair wise
comparison of significance was determined using Tukey’s test. Gender ratios were
tested using the Chi square test. ANOVA analysis values and cross correlation
analysis was calculated using Graphpad PRISM (Graphpad inc., San Diego, CA).
Significance was accepted at P<0.05. The Chi square test was used to determine
differences in allelic and genotype frequencies between the old control and
Alzheimer’s cohorts for all polymorphisms investigated. The Hardy –Weinberg
equilibrium equation was performed on all genotyping data. Chi square and odds
ratios were calculated using Graphpad PRISM (Graphpad inc., San Diego, CA).
6.5 Results
6.5.1 Folate, B12 and homocysteine
The results for plasma folate, vitamin B12 and Hcy for all cohorts are summarised
and illustrated in Figures 3-5.

Chapter 6: Folate metabolism and Alzheimer’s diseas e
177
A significantly lower plasma folate was found in the young cohort compared to both
old controls and the younger AD cohort (P=0.0008), but not with the older AD group.
No significant difference was found between the old controls and both AD groups.
The older AD group showed a slightly reduced plasma folate level compared to both
older controls and the younger AD group but this did not achieve significance (Figure
3). All values are within the normal range for plasma folate (6.9-39nmol/litre).
Concentration of plasma B12 levels did not show significant differences between any
of the four cohorts investigated (P=0.874) (Figure 4). All values are within the normal
range for plasma B12 (133-664 pmol/litre). It has been shown that micronucleus
formation is minimised when B12>300pmol/liter, all subjects achieved this
level.[142,325]
Concentrations of plasma homocysteine showed a significant increase in both AD
groups compared to both control groups (P=0.0003) (Figure 5). All values are within
the normal range for plasma Hcy (5-15µmol/litre). It has been shown that
micronucleus formation is minimised when Hcy<7.5µmol/liter, all subjects exceeded
this level. [142,325]

Chapter 6: Folate metabolism and Alzheimer’s diseas e
178
youn
g co
ntro
ls
old co
n trols
youn
ger A
D
older
AD
0
10
20
30
P=0.0008
Plasma folate levels
a
bb
ab
nmol
/litr
e
Figure 3: Plasma folate levels in nmol/litre for young controls (N=30), old controls
(N=26), younger AD (N=23) and older AD (N=31). Groups not showing the same
letter are significantly different from each other. Error bars denote SE of the mean.

Chapter 6: Folate metabolism and Alzheimer’s diseas e
179
youn
g con
t rols
old co
ntrols
youn
ger A
D
older A
D
050
100150200250300350400450
P=0.874
Plasma B12
a a
a a
pmol
/litr
e
Figure 4 : Plasma B12 levels in pmol/litre for young controls (N=30), old controls
(N=26), younger AD (N=23) and older AD (N=31). Groups not showing the same
letter are significantly different from each other. Error bars denote SE of the mean.

Chapter 6: Folate metabolism and Alzheimer’s diseas e
180
yo
u ng contr
ols
old co
ntrol
s
you nge
r AD
older
AD
0123456789
101112
P=0.0003
Plasma Homocysteine
a a
bb
µµ µµm
ol/li
tre
Figure 5 : Plasma total homocysteine levels in µmol/litre for young controls (N=30),
old controls (N=26), younger AD (N=23) and older AD (N=31). Groups not showing
the same letter are significantly different from each other. Error bars denote SE of the
mean.

Chapter 6: Folate metabolism and Alzheimer’s diseas e
181
6.5.2 Polymorphisms Genotype frequencies for the four polymorphisms examined were calculated and
found to fit the Hardy-Weinberg equilibrium. The genotype frequencies of MTHFR,
MTR and MTRR in the Alzheimer’s cohorts did not differ significantly from the
genotype frequencies in the old control group (P>0.05) (Table 2).
There were no significant differences in the allelic frequencies between all the
cohorts for all of the polymorphisms examined (P>0.05) (Table 3).
Table 2: Folate metabolism polymorphism genotype frequencies for Alzheimer’s
* Value for chi square test of differences in genotype frequencies between old control and AD cohort.
Polymorphisms Young control (N=30)
Older control (N=84)
Alzheimer’s group (N=64)
Chi-Square P value*
MTHFR C677T CC 13 (0.433) 46 (0.547) 36 (0.562) CT 12 (0.400) 32 (0.380) 24 (0.375) p=0.970 TT 5 (0.166) 6 (0.380) 4 (0.062) MTHFR A1298C
AA 21(0.700) 37 (0.440) 25 (0.390) AC 6 (0.200) 37 (0.440) 32 (0.500) p=0.770 CC 3 (0.100) 10 (0.119) 7 (0.109) MTR A2576G AA 20 (0.666) 53 (0.638) 46 (0.718) AG 9 (0.300) 27 (0.325) 18 (0.281) p=0.306 GG 1 (0.033) 3 (0.036) 0 (0.000) MTRR A66G AA 7 (0.233) 7 (0.083) 14 (0.225) AG 16 (0.533) 57 (0.678) 31 (0.500) p=0.577 GG 7 (0.233) 20 (0.238) 17 (0.274)

Chapter 6: Folate metabolism and Alzheimer’s diseas e
182
Table 3 : Folate metabolism polymorphism allele frequencies for Alzheimer’s cohort and controls
Polymorphisms Young Controls (N=30)
Older controls (N=84)
Alzheimer’s cohort (N=64)
Chi square P value*
Odds ratio**
MTHFR C677T C 0.63 0.74 0.75 p=0.871 0.94 T 0.37 0.26 0.25 MTHFR A1298C A 0.80 0.66 0.64 p=0.766 1.09 C 0.20 0.34 0.36 MTR A2756G A 0.82 0.80 0.86 p=0.258 0.65 G 0.18 0.20 0.14 MTRR A66G A 0.50 0.42 0.48 p=0.390 0.78 G 0.50 0.58 0.52
* Value for chi square test of differences in allele frequencies between old control and AD cohort. ** Odds ratio for less common allele relative to common allele

Chapter 6: Folate metabolism and Alzheimer’s diseas e
183
6.5.3 Correlations Cross correlation analysis between the biomarkers of the buccal cytome assay for
the young controls, old controls and for the combined Alzheimer’s cohorts and levels
of plasma folate, B12 and homocysteine are shown in Tables 4-6. Buccal cytome
analysis for these cohorts had previously been performed and is described in
Chapters 2 and 3.
In the young controls plasma folate, B12 and Hcy showed no significant correlation
with any of the buccal cytome parameters measured.
For the old controls plasma folate showed no significant correlation with any of the
buccal cytome parameters measured. Plasma B12 showed a positive correlation with
pyknosis (r=0.5365, P=0.0047), karyolysis (r=0.5447, P=0.0040) and condensed
chromatin (r=0.5238, P=0.0060). Plasma Hcy showed no significant correlation with
any of the buccal cytome parameters measured.
In the Alzheimer’s cohort plasma folate showed no positive correlation with any of the
buccal parameters measured. Plasma B12 showed a positive correlation with the
number of micronuclei scored in 1000 cells (r= 0.3552, P=0.0425) and with the
number of basal cells (r=0.3448, P=0.0494) scored in the assay. Plasma Hcy showed
a negative correlation with the number of karyorrhectic cells (r=-0.4107, P=0.0176)
scored in the assay.
No significant correlation was found between the MMSE scores and plasma folate,
B12 and Hcy.

Chapter 6: Folate metabolism and Alzheimer’s diseas e
184
Table 4 : Cross correlation results between biomarkers of the buccal micronucleus cytome assay and plasma micronutrients for young controls (N=30). Plasma Folate Plasma B12 Plasma
Homocysteine Number of buccal cells with MN
Pearson Correlation Sig. (2-tailed)
-0.0084 0.9646
-0.2732 0.1441
-0.0140 0.9411
Number of MN in 1000 cells
Pearson Correlation Sig. (2-tailed)
-0.0124 0.9480
-0.2197 0.2433
-0.2173 0.2487
Karyorrhexis
Pearson Correlation Sig. (2-tailed)
-0.2938 0.1151
-0.3063 0.0997
0.0873 0.6461
Pyknosis
Pearson Correlation Sig. (2-tailed)
-0.3474 0.0599
0.1005 0.5970
0.1154 0.5436
Binucleates
Pearson Correlation Sig. (2-tailed)
0.1180 0.5347
0.2521 0.1790
-0.2474 0.1875
Karyolysis
Pearson Correlation Sig. (2-tailed)
0.0798 0.6750
0.2235 0.2351
-0.0686 0.7185
Nuclear buds
Pearson Correlation Sig. (2-tailed)
-0.1133 0.5513
-0.2732 0.1441
0.1339 0.4807
Condensed chromatin
Pearson Correlation Sig. (2-tailed)
-0.0414 0.8277
-0.0923 0.6273
-0.0281 0.8824
Basal cells
Pearson Correlation Sig. (2-tailed)
0.0926 0.6264
-0.3572 0.0526
-0.0015 0.9936
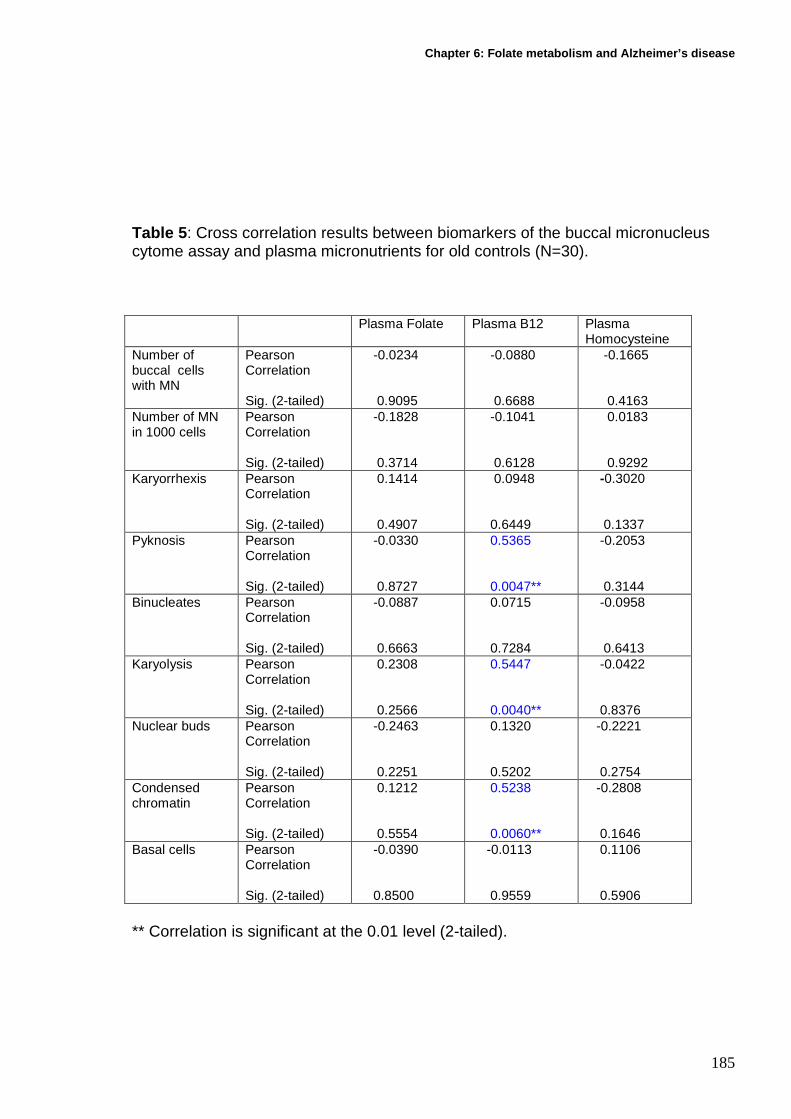
Chapter 6: Folate metabolism and Alzheimer’s diseas e
185
Table 5 : Cross correlation results between biomarkers of the buccal micronucleus cytome assay and plasma micronutrients for old controls (N=30). Plasma Folate Plasma B12 Plasma
Homocysteine Number of buccal cells with MN
Pearson Correlation Sig. (2-tailed)
-0.0234 0.9095
-0.0880 0.6688
-0.1665 0.4163
Number of MN in 1000 cells
Pearson Correlation Sig. (2-tailed)
-0.1828 0.3714
-0.1041 0.6128
0.0183 0.9292
Karyorrhexis
Pearson Correlation Sig. (2-tailed)
0.1414 0.4907
0.0948 0.6449
-0.3020 0.1337
Pyknosis
Pearson Correlation Sig. (2-tailed)
-0.0330 0.8727
0.5365 0.0047**
-0.2053 0.3144
Binucleates
Pearson Correlation Sig. (2-tailed)
-0.0887 0.6663
0.0715 0.7284
-0.0958 0.6413
Karyolysis
Pearson Correlation Sig. (2-tailed)
0.2308 0.2566
0.5447 0.0040**
-0.0422 0.8376
Nuclear buds
Pearson Correlation Sig. (2-tailed)
-0.2463 0.2251
0.1320 0.5202
-0.2221 0.2754
Condensed chromatin
Pearson Correlation Sig. (2-tailed)
0.1212 0.5554
0.5238 0.0060**
-0.2808 0.1646
Basal cells
Pearson Correlation Sig. (2-tailed)
-0.0390 0.8500
-0.0113 0.9559
0.1106 0.5906
** Correlation is significant at the 0.01 level (2-tailed).

Chapter 6: Folate metabolism and Alzheimer’s diseas e
186
Table 6 : Cross correlation results between biomarkers of the buccal micronucleus cytome assay and plasma micronutrients for Alzheimer’s cohort (N=54). Plasma Folate Plasma B12 Plasma
Homocysteine Number of buccal cells with MN
Pearson Correlation Sig. (2-tailed)
-0.0975 0.5893
0.2120 0.2363
-0.1189 0.5098
Number of MN in 1000 cells
Pearson Correlation Sig. (2-tailed)
-0.2361 0.1860
0.3552 0.0425*
-0.0963 0.5938
Karyorrhexis
Pearson Correlation Sig. (2-tailed)
0.0810 0.6537
0.2808 0.1134
-0.4107 0.0176*
Pyknosis
Pearson Correlation Sig. (2-tailed)
0.0171 0.9244
0.0918 0.6112
-0.2431 0.1728
Binucleates
Pearson Correlation Sig. (2-tailed)
0.1507 0.4025
-0.1013 0.5749
0.1382 0.4433
Karyolysis
Pearson Correlation Sig. (2-tailed)
-0.1847 0.3036
-0.0181 0.9203
0.0419 0.8165
Nuclear buds
Pearson Correlation Sig. (2-tailed)
0.2468 0.1733
0.1977 0.2781
-0.3142 0.0799
Condensed chromatin
Pearson Correlation Sig. (2-tailed)
0.0553 0.7596
-0.1477 0.4122
0.1110 0.5385
Basal cells
Pearson Correlation Sig. (2-tailed)
-0.0201 0.9113
0.3448 0.0494*
-0.1473 0.4133
MMSE
Pearson Correlation Sig. (2-tailed)
0.2359 0.1862
0.0035 0.9844
-0.0664 0.7134
* Correlation is significant at the 0.05 level (2-tailed).

Chapter 6: Folate metabolism and Alzheimer’s diseas e
187
6.6 Discussion One of the aims of the study was to investigate levels of plasma folate, vitamin B12
and homocysteine in Alzheimer’s patients compared to non-clinically diagnosed
control groups. It has been well documented that Alzheimer’s patients often have
reduced levels of folate, making them susceptible to genomic instability events [326-
328]. The results of the study showed only a slight non significant reduction in
plasma folate levels for the Alzheimer’ cohorts compared to the age-matched old
control group. However, it is possible that that although plasma levels appear to be
adequate, bioavailability of folate may still be impaired as many physiological and
biochemical processes are required to effectively deliver dietary folate from plasma
into the cells [329]. Furthermore, defects in uptake and storage of folate could result
in an apparent increase in plasma folate [330,331]. It is expected that red blood cell
folate should give a more accurate determination of folate status in this cohort and
should be considered for future studies.
Plasma levels for vitamin B12 in this study showed no significant differences between
any of the cohorts investigated. Vitamin B12 is an essential cofactor for methionine
synthase, but in order to be biologically effective it needs to be in a reduced state
[332]. AD has been shown to be associated with oxidative stress [134,137,333]. It is
possible that under such conditions oxidative stress could lead to deactivation of
cob(I)alamin by its subsequent oxidation to cob(II)alamin resulting in a functional B12
deficiency [332]. This in turn would lead to reduced methionine synthase activity
leading to Hcy accumulation following failure to be converted to methionine, and an
inability to convert 5-Methyltetrahydrofolate to tetrahydrofolate the form of folate that
is polyglutamated and stored [334,335]. Such changes in the oxidation state were not

Chapter 6: Folate metabolism and Alzheimer’s diseas e
188
determined in the analysis but would be of great interest in any future studies
undertaken given the evidence for increased oxidative stress in AD [44,127-129].
Alternatively, as with folate, the plasma B12 levels do not reflect the bioavailability of
B12 at the cellular level. Physiologically in order to deliver B12 from the gut to the
tissues at least five peptides are necessary, (R binder, intrinsic factor, ileal receptors,
transcobalamin I, transcobalamin II), and a further four enzymes are required to
obtain the reduced state for effective methionine synthase function (cbIF, cbIC/D,
cbIE/G and microsomal reductase [142]. It is possible that any changes in these
biological components may lead to functional B12 deficiency which would not be
reflected in plasma B12 analysis. Measurement of transcobalamin II and Methyl
malonyl CoA are considered to be better biomarkers of functional B12 status and
should be considered for future studies [336,337].
Plasma Hcy was found to be significantly increased in both the Alzheimer’s cohorts
compared to age matched controls confirming earlier studies with these findings
[145,338,339]. There is substantial evidence to show that total Hcy is an independent
vascular risk factor, and subjects with such risk factors and cerebrovascular disease
have an increased risk for developing AD [146,320]. It has been shown that
hyperhomocysteinemia sensitises nervous tissue to increased glutamate toxicity via
activation of N-methyl-D-aspartate receptors and damages neuronal DNA giving rise
to apoptosis. There is evidence that elevated levels of Hcy are also associated with
increased β amyloid peptide generation, impairment of DNA repair and sensitization
of neurons to amyloid toxicity [149,340]. It has been proposed that such findings
result in neuronal damage within the hippocampus leading to cognitive impairment
which is characteristic of AD.

Chapter 6: Folate metabolism and Alzheimer’s diseas e
189
A second aim of the study was to determine whether polymorphisms within the folate
methionine pathway contribute to AD pathogenesis. AD patients within this study
were found to have elevated levels of homocysteine compared to age-matched
controls. The remethylation of Hcy to methionine is regulated by the effective activity
of certain enzymes involved in folate metabolism. The genotypic and allelic
frequencies were determined for MTHFR C677T, MTHFR A1298C, MTR A2756G,
and MTRR A66G. Genotype frequencies for the four polymorphisms examined were
found to fit Hardy-Weinberg equilibrium and did not deviate substantially from
previously reported frequencies for these polymorphisms [161,164,341-343]. The
genotypic frequencies for the AD cohort did not differ significantly from those
reported for the older control groups, inferring that these particular polymorphisms do
not play a critical role in AD pathology in the cohorts studied. It is possible that these
polymorphisms may not be directly responsible for the observed elevated Hcy levels
but their enzymatic efficiency may be compromised by inadequate levels of cofactors
which are required for efficient enzyme activity. Changes in the oxidative state of B12
resulting from oxidative stress may result in inefficient MTR enzyme activity leading
to the observed elevation in Hcy in the Alzheimer’s cohorts. Only further studies
investigating the relationship between cofactor enzyme activity and polymorphism
status and its relation to AD folate metabolism may answer this question.
Alternatively Hcy can also be catabolised via the transulphuration pathway. This
pathway involves the condensation of Hcy with serine through the action of the B6
dependent cystathionine β synthase (CBS) to form cystathionine [152]. Cystathionine
is then metabolised to cysteine through the action of the B6 dependent cystathionine-

Chapter 6: Folate metabolism and Alzheimer’s diseas e
190
γ-lysase that can then be utilised for glutathione synthesis. It is possible that
polymorphisms within the CBS gene such as C699T, C1080T or the short tandem
repeat -5697, or deficiency in B6 as an effective cofactor could lead to reduced CBS
activity resulting in elevated levels of Hcy.
Finally, cross correlation analysis was performed between the biomarkers of the
buccal cytome assay and levels of folate, B12 and Hcy for the young, old and
combined AD cohorts. In the young controls no association was apparent between
buccal cytome parameters and any of the micronutrient levels investigated (Table 4).
The results from the old control cohort showed a positive correlation for vitamin B12
with the cell death parameters pyknosis (r=0.5365. P=0.0047), karyolysis (r=0.5447,
P=0.004) and condensed chromatin (r=0.5238, P=0.006), no significant correlation
was evident for either folate or Hcy (Table 5). This may suggest that B12 may in
some way facilitate the cell death process in normal buccal mucosa, and could
explain the association of B12 with lower MN frequency observed in previous studies
involving smokers [344]. However, no association with MN was observed in this
study.
In the AD cohort folate showed no significant correlation with any of the buccal
parameters measured. Plasma B12 showed a slight positive correlation with the
number of basal cells (r=0.3448, P=0.04) showing an association with the
proliferative index of these cells. Plasma B12 also showed a slight positive
correlation with the number of MN scored (r=0.3552, P=0.04) indicating an
association with chromosomal instability and proliferation rate in basal cells possibly
via association with reduced apoptosis (Table 6). Dose response experiments

Chapter 6: Folate metabolism and Alzheimer’s diseas e
191
involving vitamin B12 are necessary in order to determine the relationship between
B12 and these cytome measures. Plasma Hcy showed a negative correlation with
the number of karyorrhectic cells (r=-0.4107, P=0.017) indicating a suppressive effect
on cell death under conditions of high Hcy. In the AD cohort plasma Hcy was
elevated and the number of karyorrhectic cells scored in the buccal cytome assay
was significantly reduced compared to age matched controls with a lower Hcy level.
These results suggest that a) the buccal cytome of AD subjects exhibits a different
relationship to B12 and Hcy compared to the relationship seen in normal controls,
and b) a low B12 and high Hcy status could be an underlying cause of the low basal
cell and low karyorrhectic cell frequency seen in AD relative to matched and healthy
controls.

Chapter 7: Ageing and polyphenols
192
7 Chapter 7: Ageing and polyphenols in a transgenic
mouse model for Alzheimer’s disease

Chapter 7: Ageing and polyphenols
193
7.1 Abstract The study set out to determine a) whether DNA damage is elevated with time in mice
that carry mutations that predispose to Alzheimer’s disease (AD) relative to non
transgenic control mice, and b) whether increasing the intake of dietary polyphenols
curcumin and grape seed extract could reduce genomic instability events in a
transgenic mouse model for AD. Micronuclei (MN) frequency was recorded in both
buccal mucosa and whole blood. After 9 months a non-significant 2 fold increase in
buccal MN frequency and a non-significant 1.3 fold increase in whole blood MN
frequency were found in the AD control group compared to the WT control group. A
significant 91% decrease (P=0.04) in absolute buccal telomere length and a non-
significant 2 fold decrease in absolute olfactory lobe telomere length was evident
between the AD control and WT control group. A significant 10 fold decrease in
buccal micronucleus (MN) frequency (P=0.01) was found for both curcumin and
microencapsulated grape seed extract (MGSE) and a 7 fold decrease (P=0.02) for
the grape seed extract (GSE) AD cohorts compared to the AD group on control diet.
Similarly, within whole blood a non-significant reduction in MN frequency was found
for the curcumin (49.5%), GSE (33.3%) and MGSE (62.5%) AD groups when
compared to the AD group on control diet. A non-significant 2 fold increase in buccal
cell telomere length was evident for the curcumin, GSE and MGSE groups compared
to the AD control group. Olfactory lobe telomere length was found to be non-
significantly 2 fold longer in mice fed on an enriched curcumin diet compared to
controls. These results suggest potential protective effects of polyphenols against
genomic instability events in different somatic tissues of a transgenic mouse model
for AD.

Chapter 7: Ageing and polyphenols
194
7.2 Introduction Alzheimer’s disease (AD) is associated with elevated rates of oxidative stress that
contribute to increased rates of genomic instability such as micronuclei,
chromosomal aberrations, telomere length and apoptosis [96,127-129,345]. The
characteristic hallmarks of AD involve the deposition of proteins leading to amyloid
plaques and neurofibrillary tangles in areas of the brain that are associated with
reduced cognitive function [10,62,346-348]. These proteins have also been linked
with oxidative stress [43,349]. It has been suggested that both plaques and tangles
are produced in order to protect sensitive areas of the brain from the effects of
oxidative related injury [349]. However, other studies have shown that plaques may
produce reactive oxygen species when they form complexes with metals such as
copper and iron [200,259]. Free radical generation is the result of normal metabolic
processes, whereby the levels are maintained within normal homeostatic boundaries
by an elaborate endogenous antioxidant system. However, when levels of free
radicals exceeds the normal clearing capacity of the cells oxidative stress follows
resulting in potential cellular damage [350]. It has recently been shown that
individuals with mild cognitive impairment (MCI) and more advanced AD have a 2
fold increase in DNA damage levels and oxidized bases in their leucocytes compared
with age matched controls not clinically diagnosed with AD [134]. This is suggestive
that oxidative stress occurs in the early stages of the disease, as MCI individuals
progress to AD with an estimated probability of 50% within 4 years [134,135],
suggesting MCI may be representative of early AD and that oxidative stress may
directly contribute to disease pathology. It has also been shown that within the post
mortem Alzheimer’s brain that there is an increase in mitochondrial and nuclear
oxidative damage [44].

Chapter 7: Ageing and polyphenols
195
Recently, a number of studies have suggested the positive effects of dietary
antioxidants as an aid in potentially reducing somatic cell and neuronal damage by
free radicals [43,175,176,184,351]. Curcumin is the yellow phenolic compound in the
Indian curry spice turmeric. This spice is used as a food preservative in India where
the incidence of AD in individuals aged between 70 and 79 years of age is 4.4 fold
less than that in the United States [352]. It has been shown to act as an antioxidant
through modulation of glutathione levels [353] and possesses anti- inflammatory
properties possibly mediated by inhibition of IL-8 release [353] as well as the ability to
reduce Aβ42 toxicity by preventing the formation of β42 oligomers leading to amyloid
plaque formation [178,351,354,355]. It has further been shown to block the
aggregation of the β fibrils that comprise the structure of the amyloid plaque
[180,354,356]. Curcumin may also contribute to reducing amyloid plaque formation
by acting as a chelator, binding metals such as copper and iron that have been
shown to form complexes with Aβ42 resulting in oxidative stress, free radical
formation that leads to oxidative neurotoxicity [181]. Curcumin has also been shown
to be a significantly more potent free radical scavenger than vitamin E and to protect
the brain from the effects of lipid peroxidation [357,358].
Grape Seed Extract (GSE) contains a number of polyphenols Including
proanthocyanidins and procyanidins [359-361]. They have been shown to be
powerful free radical scavengers, possess anti-inflammatory properties, reduce
apoptosis and prevent H202 induced chromosomal damage in human lymphoblastoid
cells [362-364]. It has been shown that their free radical scavenging capacity is 20
times more effective than vitamin E and 50 times more effective than vitamin C [185].

Chapter 7: Ageing and polyphenols
196
It has also been shown in rat models that cells are protected against β amyloid
toxicity when treated with GSE compared to unprotected neurons, possibly as a
result of the antioxidant or chelating properties [186,187].
The aims of this study were a) to investigate whether DNA damage events increase
with time to a greater extent in AD mice relative to controls and b) to determine the
potential protective effects of natural products rich in polyphenols on genomic
instability events in a transgenic mouse model for AD. We investigated the effects of
curcumin and GSE polyphenols on DNA damage by testing the mice over a 9 month
period utilizing a buccal micronucleus cytome assay, an erythrocyte micronucleus
assay and by determining telomere length in both buccal cells and olfactory lobe
tissue from the brain.
7.3 Materials and methods
7.3.1 Mouse model
The study involved the use of a double transgenic mouse model (Jackson
Laboratory, Maine, USA) that expresses a chimeric mouse/human amyloid precursor
protein (Mo/Hu APP695swe) and a mutant presenilin 1 (PSEN1-dE9) that are both
directed to CNS neurons (Figure 1). These mutations are both associated with early
onset AD. The “humanized” Mo/HuAPP695swe transgene allows the mice to secrete
a human A-beta amyloid peptide. The transgenic peptide and holoprotein can be
detected through immunohistochemistry using antibodies specific for the human
sequence within this region (monoclonal 6E10 antibody, Signet laboratories, Cat No:
Sig-39320). The included “swedish” mutations (K595N/M596L) elevate the amount of

Chapter 7: Ageing and polyphenols
197
A-beta peptide produced from the transgene by favoring processing through the
beta-secretase pathway. The Mo/HuAPP695swe protein and the transgenic mutant
human presenilin protein (PSEN1-dE9) are both immunodetected in whole brain
homogenates [365,366].
Figure 1 : B6C3-Tg (APPswePSEN1dE9)85Dbo/J transgenic mouse model for AD.
The strain was developed by using two expression plasmids (Mo/HuAPP696swe and
PSEN1-dE9) that were designed to each be controlled by independent mouse prion
promoter elements, directing transgene expression predominantly to CNS neurons.
The Mo/HuAPP695swe transgene expresses a “humanized” mouse amyloid
precursor gene modified at three amino acids to reflect the human residues, and
further modified to contain the K595N and M596L mutations that are linked to familial
AD [367]. The PSEN1-dE9 transgene expresses a mutant human presenilin 1
carrying the exon 9 deleted variant (PSEN1dE9) which is also associated with
familial AD. These constructs were co-injected into B6C3HF2 pronuclei and insertion
of the transgenes occurred at a single locus. Founder line 85 was obtained and the
resulting colony was maintained as a hemizygote by crossing transgenic mice to
B6C3F1/J mice [368,369].

Chapter 7: Ageing and polyphenols
198
These transgenic mice develop amyloid plaques in the hippocampus and cortex at
four months and in the thalamus at 6 months. At 9 months there is significant amyloid
present in the cortex, hippocampus and thalamus [369,370]. At 12 months the plaque
area accounts for 10.5±2.9% of the total cortex, 4.1±1.6% in the hippocampus and
2.3±1.3% in the thalamus [371]. The plaques consist of diffused β amyloid alone or
with the thioflavine S positive compact core. The amyloid plaques were of a compact
core nature surrounded with dilated dystrophic neurites and associated with
aggregated microglia and astrocytes.
7.3.2 Genotyping
All animals prior to receipt were genotyped at the Jackson laboratory for Tg(PSEN1)
and Tg(APPswe). The protocols used are outlined below.
7.3.2.1 Tg(PSEN1) protocol 20µl reactions used 5-20ng of DNA per reaction. The reaction components for the
amplification of the PSEN 1 transgene consisted of 10x PCR buffer, 25mM MgCl2,
2.5mM dNTP, 20µM o1MR 1644 (forward primer for PSEN 1, 5’-AAT AGA GAA CGG
CAG GAG CA-3’), 20µM o1MR 1645 (reverse primer for PSEN 1, 5’-GCC ATG AGG
GCA CTA ATC AT-3’) 5u/µl Taq polymerase and distilled water. The cycling
conditions consisted of 94oC for 3 mins and 35 cycles of 94oC for 30 seconds, 67oC
for 1 min and 72oC for 2 mins with a final annealing step of 72oC for 2 mins. The PCR
products were separated by gel electrophoresis on a 1.5% agarose gel at 67V for 30
mins. The reaction amplifies a 608 bp product from the PSEN 1Tg.

Chapter 7: Ageing and polyphenols
199
A second reaction involving the amplification of the PrP gene was performed to act
as an internal control. 20µl reactions used 5-20ng of DNA per reaction. The reaction
components for the amplification of the PrP transgene consisted of 10x PCR buffer,
25mM MgCl2, 2.5mM dNTP, 20µM o1MR 1588 (forward primer for PrP 5’-GTG GAT
AAC CCC TCC CCC AGC CTA GAC C-3’), 20µM o1MR 944 (reverse primer for PrP
5’-CCT CTT TGT GAC TAT GTG GAC TGA TGT CGG-3’), 5u/µl Taq polymerase
and distilled water. The cycling conditions consisted of 94oC for 3 mins and 35 cycles
of 94oC for 30 seconds, 70oC for 1 min and 72oC for 2 mins with a final annealing
step of 72oC for 2 mins. The PCR products were separated by gel electrophoresis on
a 1.5% agarose gel at 67V for 30 mins. The reaction amplifies a 750 bp product from
the PrP gene.
7.3.2.2 Tg(APPswe) protocol 20µl reactions used 5-20ng of DNA per reaction. The reaction components for the
amplification of the APPswe transgene consisted of 10x PCR buffer, 25mM MgCl2,
2.5mM dNTP, 20µM o1MR 1597 (forward primer for APPswe 5’-GAC TGA CCA CTC
GAC CAG GTT CTG-3’), 20µM o1MR 1598 (reverse primer for APPswe 5’-CTT GTA
AGT TGG ATT CTC ATA TCC G-3’), 5u/µl Taq polymerase and distilled water. The
cycling conditions consisted of 94oC for 3 mins and 35 cycles of 94oC for 30 seconds,
69oC for 1 min and 72oC for 2 mins with a final annealing step of 72oC for 2 mins.
The PCR products were separated by gel electrophoresis on a 1.5% agarose gel at
67V for 30 mins. The reaction amplifies a 350 bp product from the APPswe Tg.

Chapter 7: Ageing and polyphenols
200
7.4 Study design
Approval for this 9 month study was obtained from CSIRO Human Nutrition and
Flinders University Animal Ethics committees. The experimental design is a parallel
dietary intervention involving four different dietary treatments using the B6C3-
Tg(APPswePSEN1dE9)85Dbo/J mouse starting at an age of 3-4 months. The design
of the study is intended to determine whether grape seed extract is as effective as
curcumin in reducing the AD related genomic instability pathology observed in
Alzheimer’s patients and whether micro-encapsulation of GSE enhances the observed
effects. Normal mice with the same genetic background, but lacking defective APP and
PSEN1 genes were included as an added control to identify the point in time when
buccal and blood differences between normal and Alzheimer’s mice become evident,
and to test the hypothesis that the Alzheimer’s prone mice exhibited elevated DNA
damage. Double the numbers of normal mice relative to Alzheimer’s mice were used
because it was necessary to practice the buccal sampling procedure on half of these
mice. The mice used for buccal sampling practice were kept in the study on a normal
control diet and were otherwise treated in the same way as the other normal mice. The
mice used in the pilot buccal sampling were also used as additional controls. The
design is summarised below.

Chapter 7: Ageing and polyphenols
201
* Control groups
** DNA damage biomarkers (Micronucleus and telomere length)
# Mice will be sacrificed at this point
Figure 2 : Shows dietary groups, schedule and sampling points.AIN-93G denotes
control diet.
The mice were randomly grouped with good balance in age, sex and breeding pairs
(Table 1). All animals were housed in the Flinders Medical Centre animal holding
facility, 2-3 per cage in standard cages ~600cm2 (150-200cm2 per animal) and were
genotyped prior to the commencement of the study following breeding from the
originally acquired transgenic model. All groups were kept in the same room on a
14/10hr light dark cycle and had free access to food and water ad libitum. Food
consumption and bodyweight data was collected by the staff at the animal facility at 3
and 9 months.
AIN-93G N=20 Normal*
AIN-93G N=10 AD Mice*
AIN-93G+ 500pp Curcumin N=10 AD Mice
AIN-93G+ 20,000pp GSE N=10 AD Mice
AIN-93G+ 20,000pp MGSE N=10 AD Mice
Buccal samples taken at 3 and 6 months dietary intervention. Blood samples taken at 3 months**
Brain, buccal and blood samples taken at 9 month dietary intervention**#

Chapter 7: Ageing and polyphenols
202
Table1 : Age and gender of study cohort mice
WT Control AD Control Curcumin GSE MGSE
N=20 N=10 N=10 N=10 N=10
AGE (days)
(Mean ±SD)
119.9±21.04 116.1±25.15 111.5±21.04 119.9±21.04 119 .9±21.04
Gender Ratio
(male: female)
10:10 6:4 5:5 5:5 6:4
There were no significant differences in gender ratio or age between cohorts
7.5 Diets
All diets were prepared by Specialty Feeds, Glen Forrest, Western Australia. The
control diet consisted of 95% standard AIN-93G rodent diet comprising of 39.7% corn
starch, 20% casein (vitamin free), 13.2% dextrin, 10% sucrose, 7% soybean oil, 5%
powdered cellulose, 3.5% AIN-93G mineral mix, 1% AIN-93G vitamin mix, 0.3% L-
cysteine, 0.25% Choline bitartrate, 0.001% t-Butylhydroquinone and 5% maize
starch. Diet 2 consisted of 95% AIN-93G, 4.93% maize starch and 0.07% Curcumin
(Sigma, Cat No: C1386, Australia). Diet 3 consisted of 95% AIN-93G, 3% maize
starch and 2% free grape seed extract. Diet 4 consisted of 95% AIN-93G and 5%
encapsulated grape seed extract. Enough diet was ordered for the duration of the
study and housed at the Flinders Medical Centre animal holding facility.
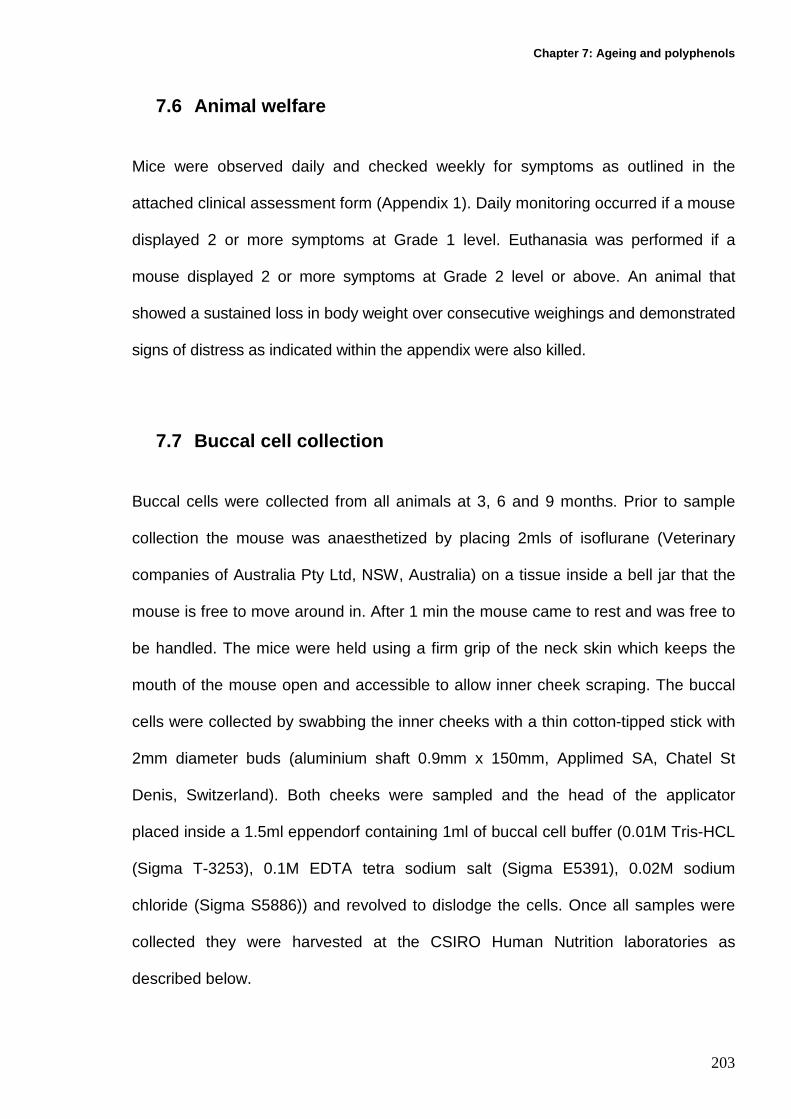
Chapter 7: Ageing and polyphenols
203
7.6 Animal welfare
Mice were observed daily and checked weekly for symptoms as outlined in the
attached clinical assessment form (Appendix 1). Daily monitoring occurred if a mouse
displayed 2 or more symptoms at Grade 1 level. Euthanasia was performed if a
mouse displayed 2 or more symptoms at Grade 2 level or above. An animal that
showed a sustained loss in body weight over consecutive weighings and demonstrated
signs of distress as indicated within the appendix were also killed.
7.7 Buccal cell collection
Buccal cells were collected from all animals at 3, 6 and 9 months. Prior to sample
collection the mouse was anaesthetized by placing 2mls of isoflurane (Veterinary
companies of Australia Pty Ltd, NSW, Australia) on a tissue inside a bell jar that the
mouse is free to move around in. After 1 min the mouse came to rest and was free to
be handled. The mice were held using a firm grip of the neck skin which keeps the
mouth of the mouse open and accessible to allow inner cheek scraping. The buccal
cells were collected by swabbing the inner cheeks with a thin cotton-tipped stick with
2mm diameter buds (aluminium shaft 0.9mm x 150mm, Applimed SA, Chatel St
Denis, Switzerland). Both cheeks were sampled and the head of the applicator
placed inside a 1.5ml eppendorf containing 1ml of buccal cell buffer (0.01M Tris-HCL
(Sigma T-3253), 0.1M EDTA tetra sodium salt (Sigma E5391), 0.02M sodium
chloride (Sigma S5886)) and revolved to dislodge the cells. Once all samples were
collected they were harvested at the CSIRO Human Nutrition laboratories as
described below.

Chapter 7: Ageing and polyphenols
204
Cells were spun in a microfuge (Centrifuge 5415R, eppendorf) at 1800rpm for 10
mins. The supernatant was removed leaving approximately 150µl and replaced with I
ml of buccal cell buffer. The cells were spun and washed twice more to remove
DNAses and bacteria which may hamper scoring. Cells were not homogenised or
filtered so as not to lose cells unnecessarily. Buffer was removed leaving ~120µl. 6µl
of DMSO (5%) was added to the cell suspension, agitated and added to cytospin
cups and spun at 600rpm for 5 mins in a cytocentrifuge (Shandon cytospin 3). Slides
were then air dried for 10 mins and fixed in ethanol: acetic acid (3:1) for 10 mins prior
to staining. The nuclei were counterstained with Propidium Iodide (Sigma P-4170)
(0.05µg/ml in 4XSSC (Standard saline citrate, 0.15 M sodium chloride, Sigma
S9888/0.015 M sodium citrate, Sigma S4641)/with 0.06% Tween 20, Sigma P1379)
for 3 min at room temperature in the dark and cover-slipped in anti-fade solution and
kept at –20°C until analysis could be performed. Slides were scored using a Nikon
E600 microscope equipped with a triple band filter (Dapi, FITC and rhodamine) at
1000x magnification.
7.7.1 Scoring criteria for murine buccal micronucle us assay
The various distinct populations used in the murine buccal micronucleus cytome
assay were determined based on criteria outlined in the two previous human studies
(Chapter 2 and 3). These criteria are intended to classify buccal cells into categories
that distinguish between “normal” cells and cells that are considered “abnormal”,
based on nuclear morphology. These abnormal nuclear morphologies are thought to
be indicative of DNA damage or cell death. Images showing distinct cell populations
as scored in assay are shown in Figure 3.

Chapter 7: Ageing and polyphenols
205
Basal Cells (Figure 3a): These are the cells from the basal layer. The nuclear to cytoplasm ratio is larger than
that in typical normal differentiated buccal cells. Basal cells are smaller in size when
compared to differentiated buccal cells and may occasionally contain micronuclei.
Normal differentiated Cells (Figure 3b): These cells have a uniformly stained nucleus which is usually oval or round in shape
and a nuclear to cytoplasmic ratio smaller than that of basal cells. No other DNA
containing structures apart from the nucleus are observed in these cells.
Basal and differentiated cells with micronuclei (Figure 3c): These cells are characterized by the presence of both a main nucleus and one or
more smaller nuclei called micronuclei. The micronuclei are usually round or oval in
shape and their diameter may range between 1/3 to 1/16 the diameter of the main
nucleus. Cells with micronuclei usually contain only one micronucleus. It is possible
but rare to find cells with more than 2 micronuclei. The nuclei in micronucleated cells
may have the morphology of normal cells or that of dying cells (ie karyolytic cells).
The micronuclei must be located within the cytoplasm of the cells. The presence of
micronuclei is indicative of chromosome loss or fragmentation occurring during
previous nuclear division. Micronuclei were scored only in basal and normal
differentiated cells. Those cells undergoing any forms of cell death (three
characterized stages of karyolysis) were not scored for micronuclei.

Chapter 7: Ageing and polyphenols
206
Karyolytic cells (Figure 3d-f): Early karyolysis (Figure 3d): These cells show the first signs of nuclear disintegration
and appear to resemble the early stages of apoptosis. It is unclear at this time
whether this group is representative of early apoptotic or necrotic pathways. This
would need to be determined in future studies using specific cell surface markers.
Mid karyolysis (Figure 3e): This group appears to still have the final stages of a
nuclear membrane but the staining in these cells is very faint.
Late karyolysis (Figure 3f): In these cells the nucleus is completely depleted of DNA
and apparent as a ghost-like image that has weak to negative fluorescent staining.
These cells may also appear to have no nucleus. Karyolitic cells may be in the late
stages of apoptosis.
7.7.2 Scoring method
1000 cells were scored per mouse for all the various cells types outlined in the buccal
cytome assay. These consisted of nucleated differentiated cells, basal cells, and the
three stages of karyolysis. Only basal and normal differentiated cells were scored for
micronuclei and their scores were combined to give the overall incidence.
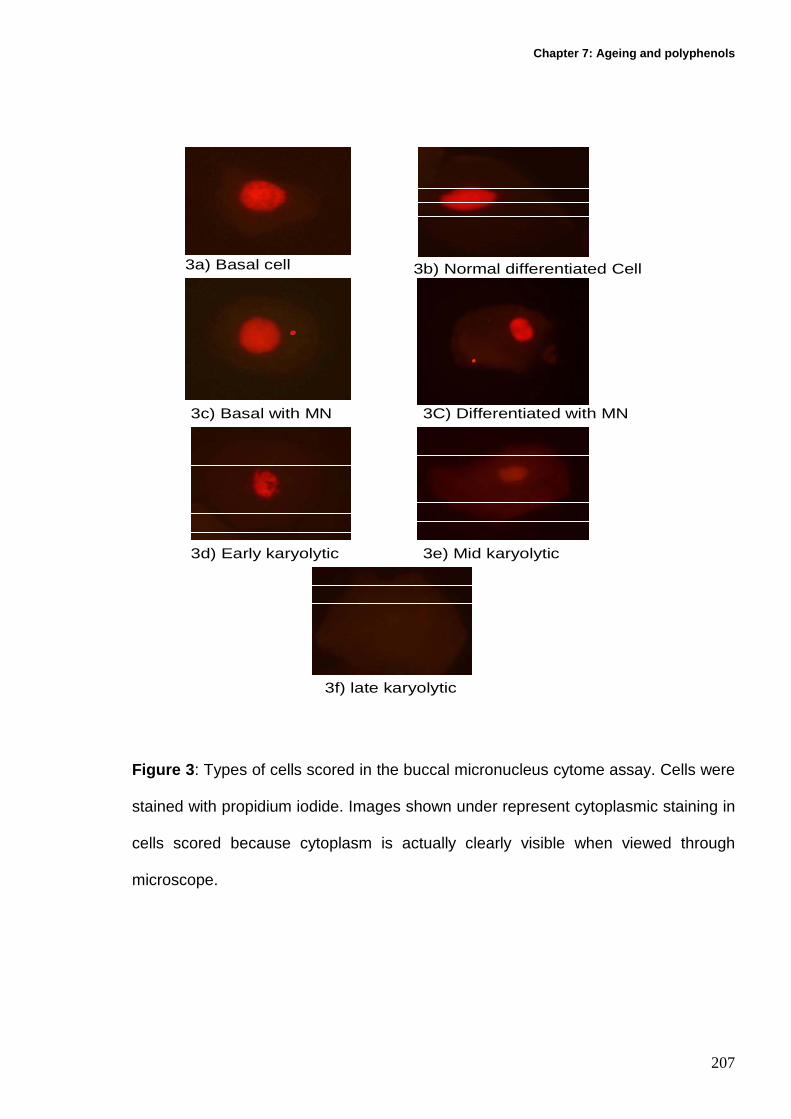
Chapter 7: Ageing and polyphenols
207
3a) Basal cell 3b) Normal differentiated Cell
3c) Basal with MN 3C) Differentiated with MN
3d) Early karyolytic 3e) Mid karyolytic
3f) late karyolytic
Figure 3 : Types of cells scored in the buccal micronucleus cytome assay. Cells were
stained with propidium iodide. Images shown under represent cytoplasmic staining in
cells scored because cytoplasm is actually clearly visible when viewed through
microscope.

Chapter 7: Ageing and polyphenols
208
7.8 Blood collection for micronucleated erythrocyte assay
Blood was collected from the tail at 3 months and from the right atrium during post
mortem at 9 months. The cell preparation for this assay was the same at both time
points. 500ul of RPMI-1640 media was added to a multivette tube (Sarstedt ref No:
15.1673). As mouse blood coagulates more so than human an additional 20 units of
heparin was added to each tube. 10,000 lyophilized heparin (Sigma, cat no H3393-
10KU) was reconstituted with 1 ml of 0.9% saline and 2µl (20 units) added to each
multivette tube. The mouse was anaesthetized with isoflurane and the end of the tail
is removed (~1mm), 50µl of blood is acquired and added to the heparinised media.
The blood sample was then thoroughly mixed to prevent clotting. Within a biosafety
hazard cabinet 30µl was pipetted onto a clean slide and a blood film prepared by
running a coverslip along the length of the slide. The slide is air dried for 10 mins and
then fixed in methanol for 10 mins.
7.8.1 Acridine orange staining
A stock solution of Acridine orange (Sigma A-6014) was prepared in phosphate
buffer saline (120 mM sodium chloride, 2.7 mM pottasium chloride, 10 mM potassium
phosphate monobasic, 10 mM sodium phosphate dibasic, pH 7.4) at a concentration
of 10mg/ml. A 1:250 dilution was prepared in 4xSSC to give a final concentration of
40µg/ml (200µl of 10mg/ml Acridine orange in 50 mls of 4xSSC). Slides were stained
for 4 mins, rinsed briefly in 2xSSC and coverslipped prior to analysis using a
fluorescent microscope. Immature erythrocytes i.e. polychromatic erythrocytes (PCE)
were identified by their orange–red color, mature erythrocytes by their green-brown
color and micronuclei by their yellow color. The frequency of PCE’s in a total of 2000

Chapter 7: Ageing and polyphenols
209
erythrocytes was determined as well as the number of micronucleated PCE’s in 1000
PCE’s scored. Figure 4 outlines the different cell types scored in the assay.
a) Polychromatic erythrocyte with micronuclei
b) Polychromatic erythrocyte with micronuclei
c) Mature erythrocytes with micronuclei
d) Polychromatic erythrocyte (bright orange) and mature erythrocyte.
PCE
Micronuclei in Mature and immature erythrocytes
Figure 4 : a,b) Showing immature polychromatic erythrocytes with micronucleus, c)
mature erythrocyte with micronucleus, d) Polychromatic erythrocyte and mature
erythrocyte without micronuclei in same field if view. Cells were stained with acridine
orange.
7.9 DNA isolation for telomere length determination
The isolation of DNA from buccal cells and olfactory lobes of the mouse brain were
performed under conditions that minimise in vitro oxidation. We therefore used a
modified version of the protocol outlined by Lu et al [276]. DNA was isolated using
the silica-gel membrane based DNeasy tissue kit (Qiagen Cat no 69506), following
the manufacturer’s instructions. Prior to isolation all buffers were purged for five

Chapter 7: Ageing and polyphenols
210
minutes in nitrogen and supplemented with 50µM phenyl-tert-butyl nitrone (Sigma
B7263) which acts as a free radical trap and scavenger, the use of phenol and high
temperatures (>56oC) were avoided. Each of the tissues was isolated separately.
7.9.1 DNA isolation of buccal cells
100µl of suspended buccal cells was added to a microtube containing 20µl of
proteinase K and adjusted to 220µl with phosphate buffered saline (PBS). 200µl of
nitrogen purged manufacturer’s AL buffer was added and incubated at 37 oC
overnight. 200µl of ethanol was added and vortexed for 10 seconds. The mixture was
pipetted into another microtube housed in a collection tube and spun for 1 min at
8000rpm (Eppendorf, Centrifuge 5415R). The spin column was placed inside another
collection tube and 500µl nitrogen-purged manufacturer’s AW1 buffer was added and
spun for 1 minute at 8000 rpm. The spin column was placed inside another collection
tube and 500µl nitrogen purged manufacturer’s AW2 buffer was added and
centrifuged for 3 minutes at 14, 0000 rpm to dry the DNeasy membrane. DNA was
eluted by placing the spin column in a 2ml collection tube and adding 200µl of
nitrogen purged manufacturer’s AE buffer and spun at 8000rpm for 1 minute.
7.9.2 DNA isolation of Brain tissue
The above protocol was followed using the entire olfactory lobe sample (<4mg) which
was cut into small pieces and placed into a microcentrifuge where 180µl of nitrogen
purged manufacturer’s ATL buffer was added. After the addition of proteinase K the

Chapter 7: Ageing and polyphenols
211
samples were left at 37 oC for 4 hrs until completely lysed. DNA elution occurred as
above.
DNA in all samples was quantitated using a nanodrop ND-1000 spectrophotometer
(Biolab, Australia).
7.10 Real time PCR for absolute quantitation for te lomere length
The quantitative Real-Time amplification of the telomere sequence was performed as
described by Cawthon (2002) with the following modifications. A standard curve was
established by dilution of known quantities of a synthesised 84mer oligonucleotide
containing 14 TTAGGG repeats. The number of repeats in each standard was
calculated using standard techniques, as follows: the oligomer is TTAGGG repeated
14 times, 84bp in length (MW= 26667.2). The highest concentration standard
(standard 1) contained 1.9 x10¹⁰ telomere hexamer repeats units in 60pg which is
equivalent to 1.18 x10⁸ kb of telomere sequence. Assays on serial dilutions were
performed to determine a standard curve for measuring kb of telomeric sequence
(Figure 1). Plasmid DNA (pBR3222) was added to each standard to maintain a
constant 20ng of total DNA per reaction tube.
All samples were run on an ABI 7300 Sequence Detection System with the SDS Ver.
1.9 software (Applied Biosystems, Foster City, CA). After the reaction is completed
the AB system produces a value that is equivalent to telomere sequence length (kb)
per 20ng of total genomic DNA which is equivalent to telomere sequence length (kb)
per 3472 mouse diploid genomes. The telomere sequence length (kb) per diploid

Chapter 7: Ageing and polyphenols
212
genome can then be derived from this value by dividing by 3472. A standard curve
was generated in each assay run. Each sample was analysed in duplicate. 36B4
amplification for every sample was also performed to verify accurate quantification of
the amount of template in each well. If the results for duplicate samples differed by
more than one CT value, the results were discarded and the assay repeated. Each
20µl reaction was performed as follows: 20ng DNA, 1xSYBR Green master mix,
100nM telo1 forward (CGGTTTGTTTGGGTTTGGGTTTGGGTTTGGGTTTGGGTT),
100nM telo2 reverse (GGCTTGCCTTACCCTTACCCTTACCCTTACCCTTACCCT)
[273,277]. Cycling conditions (for both telomere and 36B4 amplicons) were: 10min at
95oC, followed by 40 cycles of 95oC for 15sec, 60oC for 1min. Primers for the 36B4
reaction consisted of (forward primer, 5’-ACT GGT CTA GGA CCC GAG AAG-3’)
and (reverse primer, 5’-TCA ATG GTG CCT CTG GAG ATT-3’ geneworks, Adelaide,
Australia). DNA from the 1301 lymphoblastoid cell line was used as a control in each
plate run. Using the 1301 data we estimated that the inter-experimental variability
was ≤ 7 % (N=34) and the intra-experimental variability ±1.1 % (N=17).
7.11 Statistical analysis
One way ANOVA analysis was used to determine the significance of differences
between groups for all measurements, whereas pair wise comparison of significance
was determined using the parametric Tukey’s test if distribution of values is
Gaussian, or the non-parametric Kruskal wallis if values were not Gaussian. 2 way
ANOVA was performed to investigate the effect of time on each of the parameters
measured. Comparisons between the two control groups were performed using the
Mann-Whitney non parametric t-test if values were not Gaussian or parametric t-test

Chapter 7: Ageing and polyphenols
213
if values were found to be Gaussian in distribution (Graphpad PRISM (Graphpad inc.,
San Diego, CA)). P values <0.05 were considered to be significant.
7.12 Results
7.12.1 Food consumption
Food consumption data was measured at 3 and 9 months over a period of 1 week.
Data was collected and averaged for these two time points and is shown in Figure 5.
There was no significant difference in the amount of food consumed between the AD
control and the WT control group. No significant differences in food consumption
occurred between the AD control group and any of the polyphenol cohorts.
7.12.2 Bodyweight Bodyweight data for all groups at 3, 6 and 9 months is shown in Figure 6. There was
a significant increase in bodyweight for the AD control group compared to the WT
control group at the 3 month (P=0.04), 6 month (P=0.009) and 9 month (P=0.02) time
points. A significant increase in bodyweight occurred in the curcumin and free GSE
cohorts between months 3 and 9. A significant decrease between AD control and the
GSE cohort occurred at 3 months.

Chapter 7: Ageing and polyphenols
214
W
T co
ntro
l
AD Con
trol
Curcu
min
GSE
MGSE
0
10
20
30
40
50
P=0.7838
Food Consumption
gram
s/w
eek
Figure 5 : Food consumption data for average of 3 and 9 month time points for wild
type control (N=20), AD control (N=10), AD Curcumin (N=10), AD GSE (N=10) and
AD MGSE (N=10). Groups were not significantly different from each other. Error bars
denote SE of the mean.

Chapter 7: Ageing and polyphenols
215
3 6 9 3 6 9 3 6 9 3 6 9 3 6 905
10152025303540455055
WT Control
AD/Control diet
AD/ Curcumin
AD/GSE
AD/MGSE
Time in months
Bodyweight
ab
b
ab
b1 1 12
Bod
ywei
ght
in g
ram
s
Source of Variation % of total variation P valu e
Interaction 5.19 0.0823
Diet group 12.15 P<0.0001
Time 16.11 P<0.0001
Figure 6 : Bodyweight data at 3, 6 and 9 month time points for wild type control
(N=20), AD control (N=10), AD Curcumin (N=10), AD GSE (N=10) and AD MGSE
(N=10). Letters denote comparisons within the same group. Time points not showing
the same letter are significantly different from each other. Numbers denote
comparisons between all the cohorts for the same time point. Time points not
showing the same number are significantly different from each other. Error bars
denote SE of the mean.

Chapter 7: Ageing and polyphenols
216
7.12.3 Buccal micronucleus cytome assay
The results for the buccal micronucleus cytome assay are summarized and illustrated
in Figures 7a-f.
7.12.3.1 Basal cells The results for basal cell frequency are shown in Figure 7a. There were no significant
differences in basal cell frequency between the AD control group and the WT control
at any of the sample points. There were no significant differences in basal cell
frequency between any of the polyphenol cohorts and the AD control group at the
three time points sampled.

Chapter 7: Ageing and polyphenols
217
Basal cells
3 6 9 3 6 9 3 6 9 3 6 9 3 6 90.0
0.5
1.0
1.5
2.0
WT Control
AD Control
AD Curcumin
AD GSE
AD MGSE
Time in months
% o
f to
tal c
ells
sam
pled
Source of Variation % of total variat ion P value
Interaction 4.01 0.4519
Diet group 4.56 0.0672
Time 1.06 0.3546
Figure 7a : Basal cell frequency sampled as a percentage of total cells sampled for
WT Control (N=20), AD control (N=10), AD curcumin (N=10), AD GSE (N=10) and
AD MGSE (N=10) at 3, 6 and 9 months. Error bars denote SE of the mean.
7.12.3.2 Differentiated cells
The results for differentiated cell frequency are shown in Figure 7b. There were no
significant differences in differential cell frequency between the AD and WT control
groups or between the AD control and polyphenol cohorts for any of the time points
sampled. There was a significant increase (P<0.001) in the frequency of
Chapter 7: Ageing and polyphenols
218
differentiated cells in all cohorts between 3 and 6 months (average increase in value
of 353.8%). There was a significant decrease (P<0.001) in the frequency of
differentiated cells in all cohorts between months 6 and 9 (average decreased value-
72.9%).
3 6 9 3 6 9 3 6 9 3 6 9 3 6 90
1
2
3
4
5
6
7
8
Differentiated Cells
WT Control
AD Control
AD Curcumin
AD GSE
AD MGSE
a a a a a aa
aa
a
b bb b
b
Time in Months
% o
f to
tal c
ells
sam
pled
Source of Variation % of total variation P value
Interaction 1.55 0.3579
Diet group 1.20 0.1465
Time 66.36 P<0.0001
Figure 7b : Frequency of differentiated cells sampled as a percentage of total cells
sampled for WT Control (N=20), AD control (N=10), AD curcumin (N=10), AD GSE
(N=10) and AD MGSE (N=10) at 3, 6 and 9 months. Groups not sharing the same
letter are significantly different. Error bars denote SE of the mean.

Chapter 7: Ageing and polyphenols
219
7.12.3.3 Micronucleated cells (combined basal and d ifferentiated micronucleated cells)
The results for combined micronucleus frequency for all cohorts are shown in Figure
7c. A non-significant 2 fold increase in micronucleated buccal cells occurred in the
AD control compared to the WT control group over the 9 month duration of the study.
A decrease in micronuclei occurred within the curcumin group between months 6 and
9, although this decrease did not achieve significance. A non-significant decrease in
micronuclei occurred in both the GSE and MGSE groups compared to the AD control
over the 9 month duration of the study.

Chapter 7: Ageing and polyphenols
220
3 6 9 3 6 9 3 6 9 3 6 9 3 6 90.000.050.100.150.200.250.300.350.400.450.500.550.600.65
Micronucleated cells
WT Control
AD Control
AD Curcumin
AD GSE
AD MGSE
Time in months
% o
f to
tal c
ells
sam
pled
Source of Variation % of total variation P value
Interaction 2.53 0.7808
Diet group 2.98 0.2360
Time 0.33 0.7329
Figure 7c : Combined frequency of micronuclei for both basal and differentiated cells
in WT Control (N=20), AD control (N=10), AD curcumin (N=10), AD GSE (N=10) and
AD MGSE (N=10) at 3, 6 and 9 months. Error bars denote SE of the mean.

Chapter 7: Ageing and polyphenols
221
7.12.3.4 Early Karyolytic cells
The result for early karyolitic cell frequency is shown in Figure 7d. There were no
significant differences in the frequencies of early karyolitic cells between the AD
control and the WT control groups at each of the 3, 6 and 9 month time points. In
each cohort studied there was a significant increase (P<0.001) in the frequency of
early karyolytic cells between the 3 month and 6 month time points. An average
increase in the control groups was 284.30% whereas the curcumin, GSE and MGSE
had an average increase of 394.40%. There was a significant decrease (P<0.001) in
early karyolytic frequency between the 6 month and 9 month time points for all study
cohorts. The average decrease in the control groups was -82.25% whereas the
curcumin, GSE and MGSE cohorts had an average decrease of -87.40%. At month 6
inter group comparisons showed a significant increase (P<0.01) in curcumin early
karyolitic frequency compared to the AD control and MGSE cohorts.

Chapter 7: Ageing and polyphenols
222
3 6 9 3 6 9 3 6 9 3 6 9 3 6 90
1
2
3
4
5
6
7
8
Early karyolytic cells
WT Control
AD Control
AD Curcumin
AD GSE
AD MGSE
a
b
a a
b
a a
b
aa
b
a a
b
a
Time in Months
% o
f tot
al c
ells
sam
pled
Source of Variation % of total variation P value
Interaction 4.11 0.0067
Diet group 2.19 0.0219
Time 60.80 P<0.0001
Figure 7d : Early karyolytic frequencies for WT Control (N=20), AD control (N=10),
AD curcumin (N=10), AD GSE (N=10) and AD MGSE (N=10) at 3, 6 and 9 months.
Groups not sharing the same letter are significantly different. Error bars are SE of the
mean.

Chapter 7: Ageing and polyphenols
223
7.12.3.5 Mid Karyolysis
The results for mid karyolytic cells for all the cohorts sampled are shown in Figure 7e.
There was no significant difference in mid karyolytic cell frequency between the AD
and WT control groups at the three time points sampled. There was a significant
increase (P<0.05) in the frequency of mid karyolytic cells in both the WT control and
the MGSE cohorts between the 3 month and 6 month time points. A significant
decrease (P<0.05) in mid karyolytic cell frequency occurred between the 6 month
and 9 month time points for both the WT control and the MGSE cohort. Similar trends
occurred for the AD control and GSE cohorts over the 3, 6 and 9 month period but
these changes did not achieve significance.

Chapter 7: Ageing and polyphenols
224
3 6 9 3 6 9 3 6 9 3 6 9 3 6 90.0
0.5
1.0
1.5
2.0
2.5
Mid Karyolytic cells
WT Control
AD Control
AD Curcumin
AD GSE
AD MGSE
a
b
a
a
b
a
1 1
2
1
1
Time in Months
% o
f to
tal c
ells
sam
pled
Source of Variation % of total variation P value
Interaction 5.35 0.1205
Diet group 5.47 0.0118
Time 16.40 P<0.0001
Figure 7e : Mid karyolytic frequencies for WT Control (N=20), AD control (N=10), AD
curcumin (N=10), AD GSE (N=10) and AD MGSE (N=10) at 3, 6 and 9 months.
Letters denote intra group comparisons whereas numbers denote inter group
comparisons Groups not sharing the same letter or number are significantly different.
Error bars are SE of the mean.

Chapter 7: Ageing and polyphenols
225
7.12.3.6 Late Karyolysis
Results for the late karyolytic frequencies for all sample cohorts at 3, 6 and 9 month
time points are shown in Figure 7f. There was no significant difference in late
karyolytic cell frequency between the AD and WT control group. There was no
significant difference in late karyolytic cell frequency between the AD control group
and any of the polyphenol cohorts at any of the time points measured. There was a
significant reduction (P<0.001) in late karyolytic cells for all cohorts inclusive of
controls between the 3 month and 6 month sample points. A significant increase
(P<0.001) in the number of late karyolytic cells sampled at 9 months compared to the
6 month sample occurred for all study cohorts.

Chapter 7: Ageing and polyphenols
226
3 6 9 3 6 9 3 6 9 3 6 9 3 6 90
25
50
75
100
Late Karyolytic cells
WT Control
AD Control
AD Curcumin
AD GSE
AD MGSEa ab
a a a a a a a ab b b b
Time in Months
% o
f to
tal c
ells
sam
pled
Source of Variation % of total variation P value
Interaction 1.20 0.4342
Diet group 0.09 0.9621
Time 72.28 P<0.0001
Figure 7f : Late karyolytic frequencies for WT Control (N=20), AD control (N=10), AD
curcumin (N=10), AD GSE (N=10) and AD MGSE (N=10) at 3, 6 and 9 months.
Letters denote intra group comparisons; groups not sharing the same letter are
significantly different. Error bars are SE of the mean.
Chapter 7: Ageing and polyphenols
227
7.12.4 Whole blood micronucleus erythrocyte assay
Results for this assay are shown in Table 2.
7.12.4.1 Micronucleated PCE
There were no significant differences in the frequency of micronucleated
polychromatic erythrocytes between the WT control and AD control groups for both
the 3 and 9 month sampled time points. A non-significant increase in micronucleated
PCE’s occurred between month 3 and 9 for the WT control group (24.25%), whereas
for the AD control cohort a non-significant 50% increase was measured at the 9
month timeframe compared to the 3 month sample point. Non-significant reductions
were apparent for the curcumin cohort (49.5%), GSE (33.3%) and MGSE (62.79%)
for measured micronucleated PCE frequency at the 3 month and 9 month sampled
time points. No significant difference in micronuclei frequency was apparent at 3
months when all polyphenol cohorts were compared to the AD control group. At 9
months each of the polyphenol cohorts had significantly lower micronucleated PCE’s
(P<0.001) when compared to the AD control.
7.12.4.2 Micronucleated Non polychromatic erythrocy tes
No significant differences occurred in the micronucleated non-polychromatic
erythrocyte frequency between the AD and WT control groups when compared to
each other at the 3 and 9 month time point. No significant differences occurred
between the AD control and the polyphenol cohorts at both the 3 and 9 month for
measured non PCE micronucleus frequency.

Chapter 7: Ageing and polyphenols
228
7.12.4.3 Polychromatic erythrocyte percentage
No Significant difference in polychromatic frequency occurred between the WT
control and the AD control groups when compared at the 3 and 9 month time points.
Intragroup comparisons between the 3 and 9 month PCE frequency showed a
significant increase (P<0.05) for the curcumin group (49.99%), a significant increase
(P<0.001) for the GSE group (60.71%) and the MGSE group (P<0.05) which had an
increased frequency of (43.75%).

Chapter 7: Ageing and polyphenols
229
Table 2: Frequencies of micronuclei in 1000 polychromatic (MN-PCE) and nonpolychromatic (MN-NCE) erythrocytes and PCE/ NCE relationship in control and polyphenol treated mice. Treatment group MN-PCE
(Mean ± SD) MN-NCE (Mean ± SD)
PCE/2000 NCE (%) (Mean ± SD)
WT Control
3 month* 4.33±1.44 6.62±3.31 3.07±0.51
9 Month* 5.38±3.24 6.29±2.54 3.54±0.69
AD Control
3 Month* 4.60±1.17 6.30±3.86 3.30±0.81
9 Month* 6.90±2.02 5.60±1.84 3.96±0.84
AD Curcumin
3 Month* 3.91±1.97 5.36±1.50 2.61±0.34
9 Month* 2.81±1.32** 5.45±1.91 3.96±0.66a
AD GSE
3 Month* 3.00±1.55 5.90±1.92 2.82±0.31
9 Month* 2.00±1.18** 4.36±1.86 4.54±1.78b
AD MGSE
3 Month* 4.30±1.76 5.60±2.76 3.24±0.49
9 Month* 1.60±1.17** 4.00±1.76 4.56±15.57a * Months on assigned diet ** P<0.001 when compared to the AD control group of the same month. a P<0.05 comparing values for 3 and 9 months on diet within the same cohort. b P<0.001 comparing values for 3 and 9 months on diet within the same cohort. 2 way analysis results for micronucleated polychromatic erythrocytes Source of Variation % of total variation P value Interaction 12.12 0.0004 Diet groups 23.46 P<0.0001 Time in months 0.33 0.4377

Chapter 7: Ageing and polyphenols
230
7.12.5 Correlation between micronuclei in buccal ce lls and polychromatic erythrocytes
Combined data for all cohorts showed no significant correlation (r=0.09, P=0.28)
between the combined MN for basal and differentiated buccal cells and micronuclei
in the polychromatic erythrocytes (Figure 8).
0.0 0.5 1.0 1.5 2.0 2.50.0
2.5
5.0
7.5
10.0
12.5
15.0
17.5
MN in Buccal cells
Correlation between MN in buccal Cells and PCE
r=0.09, P=0.28
MN
in P
CE
Figure 8: Graph showing correlation data between MN in buccal cells and
polychromatic erythrocytes.

Chapter 7: Ageing and polyphenols
231
7.12.6 Telomere length at 9 months
7.12.6.1 Olfactory lobe brain tissue
The results for absolute telomere length for all the cohorts sampled are shown in
Figure 9. A non significant 2 fold decrease in absolute olfactory lobe telomere length
was evident between the AD control and WT control groups. The polyphenol
curcumin cohort had non-significantly longer telomeres compared to the AD control
and both grape seed extract cohorts (P>0.05).
W
T Con
trol
AD Con
trol
AD Cur
cumin
AD GSE
AD MGSE
0
10
20
30
40
50
Absolute brain telomere length
P=0.22
a
a
a
aa
Abs
olut
e te
lom
ere
leng
th(K
b pe
r di
ploi
d ge
nom
e)
Figure 9 : Absolute telomere length in olfactory lobes of WT controls (N=20), AD controls (N=10), AD curcumin (N=10), AD GSE (N=10), AD MGSE (N=10).Groups not sharing the same letter are significantly different. Error bars are SE of the mean.

Chapter 7: Ageing and polyphenols
232
7.12.6.2 Buccal cell absolute telomere length
The results for absolute telomere length in buccal cells for all the cohorts sampled
are shown in Figure 10. A significant decrease (P=0.04) in absolute buccal telomere
length was evident in the AD control when compared to the WT control. All
polyphenol cohorts had a non-significant increase in telomere length when compared
to AD controls.
W
T Con
trol
AD Con
trol
AD Cur
c umin
AD GSE
AD MGSE
0.0
2.5
5.0
7.5
Absolute buccal telomere length
a
a
a aa
P=0.09
Abs
olut
e te
lom
ere
leng
th(K
b pe
r di
ploi
d ge
nom
e)
Figure 10: Absolute telomere length in buccal cells of WT controls (N=20), AD controls (N=10), AD curcumin (N=10), AD GSE (N=10), AD MGSE (N=10).Groups not sharing the same letter are significantly different. Error bars are SE of the mean.
There were no significant gender effects within any of the cohorts for any of the
parameters investigated.

Chapter 7: Ageing and polyphenols
233
7.12.7 Correlation between buccal cell and olfactor y lobe telomere length
Combined data for all cohorts showed a non significant inverse correlation
(r=-0.12, P=0.23) between buccal cell and olfactory lobe telomere length (Figure 11).
Correlation between buccal cell and olfactory lobe telomere length
0.01 0.1 1 10 1000.01
0.1
1
10
100
1000
r=-0.15, P=0.24
Buccal cell telomere length (log scale)
Olfa
ctor
y lo
be t
elom
ere
leng
th(l
og s
cale
)
Figure 11: Graph showing correlation between buccal cell and olfactory lobe
telomere length.
7.13 Discussion Oxidative stress has been accepted as playing a key role in AD pathology. It results
from an imbalance between free radical formation, and the counteractive
endogenous antioxidant defense systems such as superoxide dismutase (SOD),
catalase (CAT) and glutathione peroxidase (GPx). Reactive oxygen species (ROS)
are damaging to cells leading to the oxidation of essential cellular components such

Chapter 7: Ageing and polyphenols
234
as proteins and lipids, leading to eventual genomic instability events such as MN
formation and telomere shortening [96,345]. The aim of the study was to a)
determine whether DNA damage events are increased to a greater extent with time
in carriers of mutations that predispose to AD relative to controls and b) to investigate
whether increasing the intake of dietary polyphenols such as curcumin and GSE
prevent the onset and severity of genomic instability biomarkers in a transgenic
mouse model for AD.
Results from the study show differences in biomarkers for DNA damage between the
transgenic AD control group and the WT control groups. Both were confined to the
same AIN-93G diet for the duration of the study. MN frequency was determined in
both buccal cells and whole blood. Buccal cell analysis showed an increase in MN
frequency for both control groups over the duration of the 9 month study. WT controls
showed an 8% increase whereas the AD control group showed an increase in MN
frequency of 20%. After 9 months a non significant 2 fold increase in MN frequency
was apparent in the transgenic AD buccal mucosa compared to the WT group.
Similarly in whole blood a 24% increase in micronucleated polychromatic
erythrocytes occurred in the WT control group compared to a 50% increase in the AD
controls. After 9 months the AD control had a non significant 1.3 fold increase in MN
frequency compared to the WT control. Taken together, the data suggest that the AD
control cohorts have an increased rate of DNA damage in different tissues beyond
the rate of normal ageing. It is possible that had sampling occurred later these initial
trends may prove to be significantly different. These findings are similar to the results
in human buccal mucosa which show a similar trend for increased MN frequency in
the younger AD group and age matched controls (Chapter 3).

Chapter 7: Ageing and polyphenols
235
Differences were apparent in biomarkers for DNA damage, cell proliferation and cell
death parameters between AD control mice and those cohorts with an increased
dietary polyphenol intake. MN were scored in both buccal cells and whole blood. The
results suggest a potential protective effect from a polyphenol enriched diet as the
MN frequency in both buccal and whole blood was reduced compared to the control
diets. The curcumin cohort showed a non-significant decrease of 72% whereas the
GSE and MGSE cohorts showed an overall decrease of 9 and 84% respectively.
There was a significant ten fold decrease (P=0.01) in MN frequency at 9 months
between the AD control group and both the curcumin and MGSE cohorts and a
significant seven fold decrease for the GSE cohort (P=0.02). This is the first time that
buccal cells have been used to investigate the effects of polyphenols on MN
frequency in a transgenic mouse model for AD. Similarly in whole blood differences
were apparent between the AD control and polyphenol diet groups. All the
polyphenol groups saw a reduction in MN frequency between the 3 and 9 month
sample points. Curcumin showed a reduction of 49.5% and the GSE and MGSE
cohorts showed an overall reduction of 33.3% and 62.5% respectively. However, no
significant positive correlation for MN frequency between these tissues was evident
(r=0.09, P=0.28) (Figure 8). These results suggest that the polyphenol diets may be
protective in reducing the MN frequency in both buccal mucosa and whole blood, at
the levels investigated confirming the results of earlier studies involving human
lymphocytes [364,372-374].
It has previously been shown that both curcumin and GSE are effective antioxidants
and have contributory roles in protecting cells from oxidative stress and the resulting
DNA damage [363,375]. It is thought that the effectiveness of these compounds as

Chapter 7: Ageing and polyphenols
236
free radical scavengers can be directly attributed to their structural characteristics.
The phenolic and methoxy groups on the curcumin benzene rings and the 1,3-
diketone system are thought to be important structures for effective oxygen free
radical scavenging [376,377] . GSE has been shown to have a high number of
conjugated structures between the B-ring catechol groups and the 3-OH free groups
of the polymeric skeleton allowing these compounds to be effective free radical
scavengers and metal chelators [372,378]. As GSE scavenges for free radicals, the
resulting aroxyl radical formed has been shown to be more stable than those
generated from other polyphenolic compounds [379] potentially aiding in preventing
further DNA damage.
Further mechanisms that have been attributed to both curcumin and GSE that
enhance their effectiveness as powerful antioxidants involve the enhanced synthesis
of the endogenous antioxidant enzymes SOD, CAT and GPx [373,380,381].
Reduced glutathione (GSH) is another endogenous antioxidant that regulates the
expression of antioxidant genes [353,382-384]. GSH levels and subsequent activity
is maintained by the enzyme γ-glutamylcysteine ligase catalytic subunit (GCLC)
which in turn is regulated by oxidative stress [385]. It has been shown that both
curcumin and GSE protect against GSH depletion by sequestering ROS and
increases GSH synthesis by enhancing GCLC expression [353,386].
Telomere length was investigated as a biomarker of genomic instability in both
buccal cells and olfactory lobe brain tissue, as telomere length has been shown to be
compromised in AD and under conditions of oxidative stress [112,267]. In buccal
cells a significant (P=0.04) 11 fold reduction in telomere length was found in the AD

Chapter 7: Ageing and polyphenols
237
control group compared to the WT control. This reduction in buccal telomere length in
the AD control cohort may be due to increased levels of oxidative stress, or a higher
turnover rate of cells. These results are in agreement with the findings from the
human study (chapter 4) where telomere length was found to be shorter in AD buccal
cells compared to age and gender matched controls. All polyphenol cohorts showed
a non-significant 2 fold increase in buccal cell telomere length compared to the AD
control cohort and a non-significant 4.3 fold decrease compared to the WT cohort.
This would suggest that polyphenols through their effective scavenging of ROS and
activation of endogenous defense mechanisms, may provide some degree of
protection towards telomere maintenance in the buccal mucosa at the levels
investigated.
Telomere length within the olfactory lobe brain tissue of AD controls was found to be
non-significantly reduced by 2 fold compared to the WT control group. Both the GSE
and MGSE polyphenol group were found to have a 34% and 25% reduction in brain
telomere length compared to the AD control group. AD mice that were fed a curcumin
rich diet were found to have a 2 fold increase in brain telomere length compared to
the AD control group, and were found to be only 4% shorter than the WT control
cohort. It has been shown that curcumin has the ability to induce expression of genes
involved in the cellular stress response network. Curcumin can activate Heme
oxygenase-1 (HO-1) which increases cellular resistance to oxidative stress and
phase II enzyme expression in neural tissue through the activation of the
transcription factor Nrf2, affording significant protection to neurons exposed to
oxidative stress [387-390]. Furthermore, curcumin and GSE have been shown to
inhibit the formation of amyloid oligomers and prevents fibril formation that lead to the

Chapter 7: Ageing and polyphenols
238
formation of amyloid plaques [180,186,351,354]. Beta amyloid has been shown to
form complexes with copper and iron to produce hypochlorous acid that increase the
levels of oxidative stress within the brain [200,259]. Both Curcumin and GSE have
been shown to act as a metal chelator binding these metals and possibly reducing
amyloid levels resulting in lower levels of oxidative stress [181,391].
A weak non-significant inverse correlation was found between telomere length in
brain tissue and buccal mucosa (r=-0.15, P=0.24) (Figure 11). At this stage it is
uncertain the contribution made by each cellular population to overall telomere
length. It has been shown in this study that a high proportion of buccal cells are
under going various stages of karyolysis which may distort the true telomere length of
the progenitor basal cells by over representing senescent cells that would be
expected to contain shorter telomeres. Only future studies on progenitor cells will be
able to determine whether a stronger correlation exists between these two tissues,
which if proven may lead to buccal cells potentially being used as a noninvasive
biomarker reflecting physiological changes within telomere length in the brains of
premature ageing mouse models for AD.
The buccal cytome micronucleus assay also provided measures of potential cell
proliferation and cell death in relation to potential genotoxicity of the polyphenols at
the levels investigated. Basal cell frequency within both the control groups showed a
slight but non-significant decrease over the three time points measured. After 9
months the basal cell frequency in the AD control group had decreased by 7%
possibly indicating the initial stages leading to the flattening of the rete pegs which
are associated with advancing age. It would have been interesting to have sampled

Chapter 7: Ageing and polyphenols
239
the buccal mucosa at later time points, in order to determine whether similar changes
in basal cell frequency reflect those observed in the earlier human study. The
curcumin cohort showed a slight but non- significant decrease between months 6 and
nine whereas both GSE groups showed a slight non-significant increase over the last
three months of the study. All of the polyphenol cohorts did not show any marked
changes in the cell proliferation rate of basal cells compared to controls suggesting
that polyphenols at the dose used in the study had no cytotoxic or cytostatic effects.
Similarly, differences were evident in the frequencies of differentiated cells measured
between all of the cohorts. A significant increase (P<0.001, average increase
353.8%) in differential cell frequency occurred in all groups between months 3 and 6
suggesting a higher turn over of cells at this time point whilst a significant decrease
(P<0.001, average decrease 72.9%) occurred in all groups between months 6 and 9 .
These marked changes in proliferative rates at 6 months may reflect changes in the
cellular kinetics of the buccal mucosa during growth and need to be further
investigated in future studies.
The three stages of cell death characterized in the assay represent over 95% of the
cells sampled. This would indicate that the stratum corneum or keratinized layer of
the murine buccal mucosa is significantly thickened and may be necessary to offset
excessive sloughing off during mastication and to maintain the structural profile of the
mouse’s buccal mucosa. At this stage it is uncertain whether these stages of
karyolysis may represent specific forms of cell death such as apoptosis. Only future
studies using cell death markers will determine their true origin. Early karyolysis was
significantly increased (P<0.0001, average increase 286.96%) in both the control
cohorts whereas the polyphenol cohorts had an average increase of 393.69%.
Chapter 7: Ageing and polyphenols
240
Similarly after 9 months the control groups showed a significant decrease (P<0.001,
average decrease 82.25%) in early karyolysis and the polyphenol cohorts showed a
decrease of 87.40%. These changes in cell death parameters exhibited similar trends
in all the groups of the study indicating that these changes did not arise from dietary
genotoxicity. There were no significant inter-group changes for both the mid and late
karyolitic parameters measured.
In conclusion, these results suggest a potential protective effect of a polyphenol
enriched diet in terms of reducing DNA damage events, such as micronuclei and
telomere length in different somatic tissue types, with no adverse effects on cell
proliferation rates or cell death markers. This is reflected in that bodyweight and food
consumption were also not significantly different between any of the cohorts
suggesting that unpalatability of the diet at the doses investigated was not a variable
affecting the observed results. This confirms earlier findings that increased dietary
intake of polyphenols had no adverse effect on bodyweight [187,392]. However, due
to multiple comparisons, the study was underpowered to demonstrate significant
effects for some of the comparisons made. The results suggest that replication of this
study with more mice per group, would be required to conclusively verify the possible
protective effects of curcumin, GSE and MGSE in this model of AD. Further studies
designed to elucidate the underlying molecular mechanisms for the observed
protective effects should also be performed.

Chapter 7: Ageing and polyphenols
241
7.14 Appendix 1: Clinical morbidity assessment for AD Mice performed weekly
• Switch to daily monitoring when mouse displays 2 or more symptoms at Grade1 or above
• Perform euthanasia when mouse displays 2 or more sy mptoms Grade 2 or above.
Signs Grade 0 Grade 1 Grade 2 Grade 3
*Chronic weight loss compared with mean of aged matched normal controls
Normal weight
5-10% 11-15% >15%
*Acute body weight loss compared to animal’s weight 7 days earlier
No change 5-10% 11-15% >15%
Degree of anaemia Normal Slightly pale eyes, ears, tail
Obvious pale extremities
Very pale extremities, blood apparent in stools; cool extremities
Behaviour/posture/ activity
Normal Slightly hunched, sometimes on own; transiently dull; occasional lurch when disturbed
Quiet and often on own; sometimes hunched; dull; occasional lurch.
Often hunched or curled posture; isolated, does not interact with others; significantly dull; frequent lurch.
Appearance Normal Slight porphyrin staining
Moderate porphyrin staining; mild failure to groom
Severe porphyrin staining; moderate failure to groom
Vocalisation Normal Squeals when palpated
Squeals when handled
Struggles and squeals loudly when handled/palpated
*If a study involves the use of growing animals the reduction in growth rate compared to healthy aged matched controls should be assessed rather than weight loss.

Chapter 7: Ageing and polyphenols
242
Weekly Animal monitoring sheet
AEC Project Number:
Investigator Name & Contact:
Animal ID Number:
Diet:
Comments:
• Each animal is examined (am) for abnormalities weekly if normal and switch to daily
monitoring when mouse displays 2 or more symptoms at Grade1 or above.
� Observations are recorded in the table below.
� Normal clinical signs are recorded as “N”
� Abnormalities are recorded as “A” and severity is scored in brackets eg. Appearance: A
(2) where score is derived from clinical assessment form
� Comments concerning abnormalities are recorded in the comments section of the table
� Additional observations tailored to the monitoring requirements for each animal
experiment are to be added at “Other”

Chapter 7: Ageing and polyphenols
243
Weekly Animal monitoring sheet
Clinical Observation (N or A)
Date
Chronic weight loss compared with aged matched controls
Acute body weight loss
Anaemia
Behaviour/posture
Appearance
Vocalisation reaction to Handling/gait
Other:
Comments
Initials of assessor
Signature of (responsible) Investigator: Date:

Chapter 8: Conclusions and future directions
244
8 Chapter 8: Conclusions and future directions

Chapter 8: Conclusions and future directions
245
The aim of this thesis was to investigate changes in buccal genomic instability
biomarkers in relation to normal ageing as well as in premature ageing syndromes
such as AD and DS. A buccal cytome micronucleus assay was developed involving
cellular/nuclear classification specific for DNA damage, potential cell proliferation and
cell death markers. The assay was validated in cohorts of young, old and
prematurely aged DS individuals to determine age-related changes. It was found that
micronuclei, basal cells, karyorrhectic cells and condensed chromatin cells increased
significantly with normal ageing (P<0.0001). Micronuclei and binucleated cells
increased (P<0.0001) and condensed chromatin, karyorrhectic, karyolytic and
pyknotic cells decreased (P<0.002) significantly in DS individuals relative to young
controls. These changes show distinct differences between the cytome profile of
normal ageing relative to that for a premature ageing syndrome, and highlights the
diagnostic value of the cytome approach for measuring changes in genome damage,
cell death and cell proliferative effects with normal and accelerated ageing.
The buccal cytome assay was then used to investigate a cohort of individuals that
had been clinically diagnosed with AD, to determine if specific changes in the buccal
profile could also be identified in this cohort. It was found that frequencies of basal
cells (P<0.0001), condensed chromatin (P<0.0001) and karyorrhectic cells
(P<0.0001) were significantly lower in Alzheimer’s patients. These changes may
reflect alterations in the cellular kinetics or structural profile of the buccal mucosa,
and may be useful as potential biomarkers in identifying individuals with a high risk of
developing AD. The odd’s ratio of being diagnosed with AD for those individuals with
a basal plus karyorrhectic cell frequency <41 per 1000 cells is 140, with a specificity
of 97% and sensitivity of 82%.

Chapter 8: Conclusions and future directions
246
Although encouraging these preliminary results need to be performed in larger
cohorts to determine the accuracy and reproducibility of these findings. Future
studies are important to determine if these changes are specific to AD or whether
they reflect alterations in the cellular kinetics of the buccal mucosa that can be linked
to non-specific pathological situations. Thus, the same parameters need to be
measured in mucosal cells from patients affected by other neurodegenerative
dementia disorders such as vascular dementia or Huntingdon’s disease to determine
specificity to AD. Furthermore, it is important to determine whether patients who have
different genetic forms of familial AD exhibit the same changes and whether these
changes can be identified presymptomatically. The proposed models (Chapter 3
Figures 8a-c) derived from the studies that reflect potential structural profile changes
can only be validated through further research involving histopathological sections
and biopsies. Once this has been established more accurate models can be
proposed for future testing. Testing for concentrations of micronutrients such as zinc
may be important in explaining the changes in the structural mucosa of AD patients
and may eventually be useful as a non-invasive model for individual micronutrient
status. It may also be possible to culture buccal cells which would allow a wide range
of in vitro experiments to be performed to investigate genotoxicity due to
micronutrient deficiency or excess and identify the nutritional requirements for the
reduction of genomic instability events. Further improvements in methodology
involving image analysis and flow cytometry should be investigated and subsequently
validated, to allow the development of an automated system that could potentially
allow for scoring larger numbers of cells, in order to more accurately define changes
in cellular kinetics and genomic instability events within the buccal mucosa.
Chapter 8: Conclusions and future directions
247
A quantitative RTm-PCR method was developed and validated in order to determine
absolute telomere length (in Kb per diploid genome) in a number of somatic tissues
from AD patients. A significantly lower telomere length was observed in white blood
cells (P<0.001) and buccal cells (P<0.01), and a significantly greater telomere length
was found in hippocampus cells from AD patients relative to healthy age-matched
controls. It was also observed that telomere length in buccal cells was 52.2%-74.2%
shorter than in the corresponding white blood cells from the same cohorts
investigated. The odds ratio for AD diagnosis was 4.6 (95% CI 1.22-17.66) if buccal
cell telomere length was less than 40Kb per diploid genome with a sensitivity of
72.7% and a specificity of 63.1%. It is not evident from these preliminary findings
which cells from the heterogeneous populations investigated contribute to the
observed changes in telomere length. Future studies need to be performed using
flow cytometry to accurately determine the contribution from each cellular subset.
Q FISH could be implemented to determine if there is uniform telomere shortening
amongst chromosomes or whether shortening occurs in a select few chromosomes.
As AD is associated with oxidative stress the integrity of the telomere sequence may
be compromised if oxidized bases or abasic sites accumulate within the telomere
sequence. A RTm-PCR method that would allow us to determine oxidized bases in
the telomere sequence may provide a more accurate risk assessment of AD.
The buccal cytome assay was also used to investigate aneuploidy events for both
chromosome 17 and 21. An age related increase in both chromosome 17 and 21
monosomy and trisomy occurred between the young and old cohorts investigated.
The study showed a 1.5 fold increase in trisomy 21 (P<0.001) and a 1.2 fold increase
in trisomy 17 (P<0.001) in buccal cells of AD patients compare to age matched

Chapter 8: Conclusions and future directions
248
controls, which was beyond the effects of normal ageing. DS individuals also showed
a significant increase in chromosome 17 monosomy and trisomy within their buccal
cells compared to age-matched controls. It is possible that the observed increase in
aneuploidy status for chromosome 17 and 21 in both AD and DS patients may lead
to altered gene dosage and expression for both tau and APP. Through the utilization
of specific fluorescently labeled antibodies for both these proteins, it may be possible
to quantify the amount of protein present within individual aneuploidy cells, allowing
us to determine the significance of aneuploidy as a contributing factor for altered
gene expression of tau and APP in the early stages of AD. It is possible that
micronutrient deficiency (e.g. folate deficiency) may have influenced the observed
elevated chromosomal malsegregation frequencies for the chromosomes
investigated [103,319]. Folate and B12 are important in the maintenance of
methylation patterns that could potentially modify gene expression. Abnormal folate
and methyl metabolism may result in a state of DNA hypomethylation leading to
abnormal chromosome malsegregation and altered gene expression
[140,141,143,171,172].
The levels of plasma folate, B12 and Hcy in AD individuals compared to age-
matched controls were investigated. Results from previous studies were confirmed
showing that AD patients have higher levels of plasma Hcy (P<0.0003), however no
significant difference in folate or B12 status was found suggesting the possibility of
differences in folate/methionine metabolism due to genetic factors. However,
genotypic frequencies for common polymorphisms for genes coding for key enzymes
in folate and methionine metabolism in AD cases did not differ significantly from
those for the older control group. Future studies could explore other possibilities such

Chapter 8: Conclusions and future directions
249
as defects in folate uptake and storage which may be a more accurate predictor for
Hcy status in AD patients. Similarly, the oxidative state of B12 and its impact as an
effective cofactor for methionine synthase in the remethylation of Hcy should also be
investigated, and measurements of methylmalonyl COA and transcobalamin (II)
should also be considered in order to determine whether either may be a more
informative biomarker in relation to B12 status. Elevated levels of Hcy may also be
accounted for as a result of deficiencies in vitamins B2 and B6 which act as cofactors
for MTHFR and cystathionine β synthase respectively. Therefore, it would be of
interest to determine B2 and B6 levels and the polymorphism status of other
enzymes that may affect Hcy metabolism.
The last investigation involved a dietary study of the effects of antioxidants in relation
to somatic genomic instability events in a transgenic mouse model of AD. It was
found that animals fed on a diet rich in curcumin and GSE had a positive effect in
reducing micronuclei frequency within the blood and buccal cells compared to control
animals on normal diets. Curcumin also appeared to have a protective effect on
olfactory lobe telomere length compared to control animals. The effects of
phytonutrient antioxidants, in particular curcumin, need to be further investigated to
determine their effectiveness as potential agents in reducing oxidative stress and
genomic instability events associated with AD. It may also be reasonable to consider
using Immunohistochemistry to determine whether levels of specific Alzheimer’s
proteins in buccal cells are correlated with levels of the same protein within brain
tissue from areas of the brain primarily affected by AD. This would then allow testing
the possibility of using buccal cells as a potential surrogate tissue that may reflect the
pathophysiological changes that occur within the brain of AD individuals.

Chapter 8: Conclusions and future directions
250
In conclusion, changes within the buccal micronucleus cytome assay may be useful
as potential biomarkers to gauge both normal ageing and in the identification of
individuals associated with premature ageing syndromes such as AD and DS.
Through further studies it may be possible to overlay data from tau and APP
measurements together with the genomic instability events already investigated to
increase the sensitivity, specificity, NPV, PPV and odds ratio to give a more precise
and sensitive assay. In the future the buccal cytome may form the basis of a non-
invasive diagnostic test that may eventually be used to identify presymptomatically
those individuals with an increase risk of developing AD. It may then be possible to
develop and implement potential prophylactic measures based on dietary
intervention studies that may result in a cessation or reversal of the changes that are
characteristic of the disease. Buccal cytome changes may eventually be used to
reflect disease severity or as a within subject biomarker to gauge the effectiveness of
preventative interventions aimed at slowing down the progression of the disease.

References
251
9 References [1] K. Maurer, S. Volk and H. Gerbaldo Auguste D and Alzheimer's disease,
Lancet 349 (1997) 1546-1549.
[2] A. Alzheimer Uber Einen eigenartigen schweren Erkrankungsprozeb der
Hirnrinde., Neurologisches cenrealblatt 23 (1906) 1129-1136.
[3] A. Burns, E.J. Byrne and K. Maurer Alzheimer's disease, Lancet 360 (2002)
163-165.
[4] C.P. Ferri, M. Prince, C. Brayne, H. Brodaty, L. Fratiglioni, M. Ganguli, K. Hall,
K. Hasegawa, H. Hendrie, Y. Huang, A. Jorm, C. Mathers, P.R. Menezes, E.
Rimmer and M. Scazufca Global prevalence of dementia: a Delphi consensus
study, Lancet 366 (2005) 2112-2117.
[5] A. Wimo, B. Winblad, H. Aguero-Torres and E. von Strauss The magnitude of
dementia occurrence in the world, Alzheimer Dis Assoc Disord 17 (2003) 63-
67.
[6] A.J. Henderson, AF Dementia n Australia, Aged and community care service
development and evaluation report No 35, AGPS,Canberra (1998).
[7] A. economics delaying the onset of Alzheimer's disease, (August 2004).
[8] C.H. Kawas Clinical practice. Early Alzheimer's disease, N Engl J Med 349
(2003) 1056-1063.
[9] K. Ritchie and S. Lovestone The dementias, Lancet 360 (2002) 1759-1766.
[10] P.H. St George-Hyslop Piecing together Alzheimer's, Sci Am 283 (2000) 76-
83.
[11] R.J. Lederman What tests are necessary to diagnose Alzheimer disease?,
Cleve Clin J Med 67 (2000) 615-618.

References
252
[12] G. McKhann, D. Drachman, M. Folstein, R. Katzman, D. Price and E.M.
Stadlan Clinical diagnosis of Alzheimer's disease: report of the NINCDS-
ADRDA Work Group under the auspices of Department of Health and Human
Services Task Force on Alzheimer's Disease, Neurology 34 (1984) 939-944.
[13] G.W. Small, Rabins,P.V, Barry P.P Diagnosis and treatment od ALzheimer
disease and related disorders, jama 278 (1997) 1363-1371.
[14] K.S. Santacruz and D. Swagerty Early diagnosis of dementia, Am Fam
Physician 63 (2001) 703-713, 717-708.
[15] Z. Khalil Early diagnosis of dementia, melbourne Health Research week
(2004).
[16] Z. Khalil, H. Poliviou, C.J. Maynard, K. Beyreuther, C.L. Masters and Q.X. Li
Mechanisms of peripheral microvascular dysfunction in transgenic mice
overexpressing the Alzheimer's disease amyloid Abeta protein, J Alzheimers
Dis 4 (2002) 467-478.
[17] M. Higuchi, N. Iwata, Y. Matsuba, K. Sato, K. Sasamoto and T.C. Saido (19)F
and (1)H MRI detection of amyloid beta plaques in vivo, Nat Neurosci (2005).
[18] K. Iqbal, I. Grundke-Iqbal, A.J. Smith, L. George, Y.C. Tung and T. Zaidi
Identification and localization of a tau peptide to paired helical filaments of
Alzheimer disease, Proc Natl Acad Sci U S A 86 (1989) 5646-5650.
[19] M. Goedert, M.G. Spillantini, R. Jakes, D. Rutherford and R.A. Crowther
Multiple isoforms of human microtubule-associated protein tau: sequences
and localization in neurofibrillary tangles of Alzheimer's disease, Neuron 3
(1989) 519-526.

References
253
[20] K. Iqbal, A.C. Alonso, C.X. Gong, S. Khatoon, J.J. Pei, J.Z. Wang and I.
Grundke-Iqbal Mechanisms of neurofibrillary degeneration and the formation
of neurofibrillary tangles, J Neural Transm Suppl 53 (1998) 169-180.
[21] A. Gomez-Ramos, M.A. Smith, G. Perry and J. Avila Tau phosphorylation and
assembly, Acta Neurobiol Exp (Wars) 64 (2004) 33-39.
[22] A.D. Cash, G. Aliev, S.L. Siedlak, A. Nunomura, H. Fujioka, X. Zhu, A.K.
Raina, H.V. Vinters, M. Tabaton, A.B. Johnson, M. Paula-Barbosa, J. Avila,
P.K. Jones, R.J. Castellani, M.A. Smith and G. Perry Microtubule reduction in
Alzheimer's disease and aging is independent of tau filament formation, Am J
Pathol 162 (2003) 1623-1627.
[23] G.D. Schellenberg Genetic dissection of Alzheimer disease, a heterogeneous
disorder, Proc Natl Acad Sci U S A 92 (1995) 8552-8559.
[24] M. Hogg, Z.M. Grujic, M. Baker, S. Demirci, A.L. Guillozet, A.P. Sweet, L.L.
Herzog, S. Weintraub, M.M. Mesulam, N.E. LaPointe, T.C. Gamblin, R.W.
Berry, L.I. Binder, R. de Silva, A. Lees, M. Espinoza, P. Davies, A. Grover, N.
Sahara, T. Ishizawa, D. Dickson, S.H. Yen, M. Hutton and E.H. Bigio The
L266V tau mutation is associated with frontotemporal dementia and Pick-like
3R and 4R tauopathy, Acta Neuropathol (Berl) 106 (2003) 323-336.
[25] C.F. Lippa, V. Zhukareva, T. Kawarai, K. Uryu, M. Shafiq, L.E. Nee, J.
Grafman, Y. Liang, P.H. St George-Hyslop, J.Q. Trojanowski and V.M. Lee
Frontotemporal dementia with novel tau pathology and a Glu342Val tau
mutation, Ann Neurol 48 (2000) 850-858.
[26] L. Buee, T. Bussiere, V. Buee-Scherrer, A. Delacourte and P.R. Hof Tau
protein isoforms, phosphorylation and role in neurodegenerative disorders,
Brain Res Brain Res Rev 33 (2000) 95-130.

References
254
[27] M. Hutton, C.L. Lendon, P. Rizzu, M. Baker, S. Froelich, H. Houlden, S.
Pickering-Brown, S. Chakraverty, A. Isaacs, A. Grover, J. Hackett, J.
Adamson, S. Lincoln, D. Dickson, P. Davies, R.C. Petersen, M. Stevens, E. de
Graaff, E. Wauters, J. van Baren, M. Hillebrand, M. Joosse, J.M. Kwon, P.
Nowotny, P. Heutink and et al. Association of missense and 5'-splice-site
mutations in tau with the inherited dementia FTDP-17, Nature 393 (1998) 702-
705.
[28] E.H. Koo The beta-amyloid precursor protein (APP) and Alzheimer's disease:
does the tail wag the dog?, Traffic 3 (2002) 763-770.
[29] D.R. Howlett, D.L. Simmons, C. Dingwall and G. Christie In search of an
enzyme: the beta-secretase of Alzheimer's disease is an aspartic proteinase,
Trends Neurosci 23 (2000) 565-570.
[30] B.D. Bennett, P. Denis, M. Haniu, D.B. Teplow, S. Kahn, J.C. Louis, M. Citron
and R. Vassar A furin-like convertase mediates propeptide cleavage of BACE,
the Alzheimer's beta -secretase, J Biol Chem 275 (2000) 37712-37717.
[31] D.J. Selkoe Alzheimer's disease: genes, proteins, and therapy, Physiol Rev 81
(2001) 741-766.
[32] G. Periz and M.E. Fortini Proteolysis in Alzheimer's disease. Can plasmin tip
the balance?, EMBO Rep 1 (2000) 477-478.
[33] R. Vassar, Citron,M. Ab-Generating enzymes:Recent advances in beta and
gamma secretase research, Neuron 27 (2000) 419-422.
[34] D.J. Selkoe Alzheimer disease: mechanistic understanding predicts novel
therapies, Ann Intern Med 140 (2004) 627-638.
[35] C.L. Masters, G. Multhaup, G. Simms, J. Pottgiesser, R.N. Martins and K.
Beyreuther Neuronal origin of a cerebral amyloid: neurofibrillary tangles of
References
255
Alzheimer's disease contain the same protein as the amyloid of plaque cores
and blood vessels, Embo J 4 (1985) 2757-2763.
[36] A.M. Cataldo, S. Petanceska, N.B. Terio, C.M. Peterhoff, R. Durham, M.
Mercken, P.D. Mehta, J. Buxbaum, V. Haroutunian and R.A. Nixon Abeta
localization in abnormal endosomes: association with earliest Abeta elevations
in AD and Down syndrome, Neurobiol Aging 25 (2004) 1263-1272.
[37] C. Haass, E.H. Koo, A. Mellon, A.Y. Hung and D.J. Selkoe Targeting of cell-
surface beta-amyloid precursor protein to lysosomes: alternative processing
into amyloid-bearing fragments, Nature 357 (1992) 500-503.
[38] S. Tomita, Y. Kirino and T. Suzuki Cleavage of Alzheimer's amyloid precursor
protein (APP) by secretases occurs after O-glycosylation of APP in the protein
secretory pathway. Identification of intracellular compartments in which APP
cleavage occurs without using toxic agents that interfere with protein
metabolism, J Biol Chem 273 (1998) 6277-6284.
[39] O. Wirths, G. Multhaup and T.A. Bayer A modified beta-amyloid hypothesis:
intraneuronal accumulation of the beta-amyloid peptide--the first step of a fatal
cascade, J Neurochem 91 (2004) 513-520.
[40] L.M. Billings, S. Oddo, K.N. Green, J.L. McGaugh and F.M. Laferla
Intraneuronal Abeta causes the onset of early Alzheimer's disease-related
cognitive deficits in transgenic mice, Neuron 45 (2005) 675-688.
[41] D.T. Loo, A. Copani, C.J. Pike, E.R. Whittemore, A.J. Walencewicz and C.W.
Cotman Apoptosis is induced by beta-amyloid in cultured central nervous
system neurons, Proc Natl Acad Sci U S A 90 (1993) 7951-7955.
[42] G. Forloni beta-Amyloid neurotoxicity, Funct Neurol 8 (1993) 211-225.

References
256
[43] Y. Christen Oxidative stress and Alzheimer disease, Am J Clin Nutr 71 (2000)
621S-629S.
[44] P. Mecocci, U. MacGarvey and M.F. Beal Oxidative damage to mitochondrial
DNA is increased in Alzheimer's disease, Ann Neurol 36 (1994) 747-751.
[45] K.-F. Lin, R.C.-C. Chang, K.-C. Suen, K.-F. So and J. Hugon Modulation of
calcium/calmodulin kinase-II provides partial neuroprotection against beta-
amyloid peptide toxicity, Eur J Neurosci 19 (2004) 2047-2055.
[46] m.p. Mattson Pathways towards and away from Alzheimer's disease, Nature
430 (2004) 631-639.
[47] D.C. Lu, S. Rabizadeh, S. Chandra, R.F. Shayya, L.M. Ellerby, X. Ye, G.S.
Salvesen, E.H. Koo and D.E. Bredesen A second cytotoxic proteolytic peptide
derived from amyloid beta-protein precursor, Nat Med 6 (2000) 397-404.
[48] K.J. Ivins, P.L. Thornton, T.T. Rohn and C.W. Cotman Neuronal apoptosis
induced by beta-amyloid is mediated by caspase-8, Neurobiol Dis 6 (1999)
440-449.
[49] T. Nakagawa, H. Zhu, N. Morishima, E. Li, J. Xu, B.A. Yankner and J. Yuan
Caspase-12 mediates endoplasmic-reticulum-specific apoptosis and
cytotoxicity by amyloid-beta, Nature 403 (2000) 98-103.
[50] M.P. Mattson, J.N. Keller and J.G. Begley Evidence for synaptic apoptosis,
Exp Neurol 153 (1998) 35-48.
[51] J. Hardy, K. Duff, K.G. Hardy, J. Perez-Tur and M. Hutton Genetic dissection
of Alzheimer's disease and related dementias: amyloid and its relationship to
tau, Nat Neurosci 1 (1998) 355-358.
[52] J. Hardy and D. Allsop Amyloid deposition as the central event in the aetiology
of Alzheimer's disease, Trends Pharmacol Sci 12 (1991) 383-388.

References
257
[53] J. Hardy Amyloid, the presenilins and Alzheimer's disease, Trends Neurosci
20 (1997) 154-159.
[54] B. Schonheit, R. Zarski and T.G. Ohm Scientific progress and a Hardy
paradigm-the 'amyloid cascade hypothesis' revisited, Neurobiol Aging 25
(2004) 743-746.
[55] B. Schonheit, R. Zarski and T.G. Ohm Spatial and temporal relationships
between plaques and tangles in Alzheimer-pathology, Neurobiol Aging 25
(2004) 697-711.
[56] J. Hardy and D.J. Selkoe The amyloid hypothesis of Alzheimer's disease:
progress and problems on the road to therapeutics, Science 297 (2002) 353-
356.
[57] J. Hardy The genetic causes of neurodegenerative diseases, J Alzheimers Dis
3 (2001) 109-116.
[58] D. Scheuner, C. Eckman, M. Jensen, X. Song, M. Citron, N. Suzuki, T.D. Bird,
J. Hardy, M. Hutton, W. Kukull, E. Larson, E. Levy-Lahad, M. Viitanen, E.
Peskind, P. Poorkaj, G. Schellenberg, R. Tanzi, W. Wasco, L. Lannfelt, D.
Selkoe and S. Younkin Secreted amyloid beta-protein similar to that in the
senile plaques of Alzheimer's disease is increased in vivo by the presenilin 1
and 2 and APP mutations linked to familial Alzheimer's disease, Nat Med 2
(1996) 864-870.
[59] K.E. Wisniewski, H.M. Wisniewski and G.Y. Wen Occurrence of
neuropathological changes and dementia of Alzheimer's disease in Down's
syndrome, Ann Neurol 17 (1985) 278-282.

References
258
[60] D.M. Mann, P.O. Yates, B. Marcyniuk and C.R. Ravindra The topography of
plaques and tangles in Down's syndrome patients of different ages,
Neuropathol Appl Neurobiol 12 (1986) 447-457.
[61] D.M. Mann and M.M. Esiri The pattern of acquisition of plaques and tangles in
the brains of patients under 50 years of age with Down's syndrome, J Neurol
Sci 89 (1989) 169-179.
[62] J. Lewis, D.W. Dickson, W.L. Lin, L. Chisholm, A. Corral, G. Jones, S.H. Yen,
N. Sahara, L. Skipper, D. Yager, C. Eckman, J. Hardy, M. Hutton and E.
McGowan Enhanced neurofibrillary degeneration in transgenic mice
expressing mutant tau and APP, Science 293 (2001) 1487-1491.
[63] K.R. Bales, T. Verina, R.C. Dodel, Y. Du, L. Altstiel, M. Bender, P. Hyslop,
E.M. Johnstone, S.P. Little, D.J. Cummins, P. Piccardo, B. Ghetti and S.M.
Paul Lack of apolipoprotein E dramatically reduces amyloid beta-peptide
deposition, Nat Genet 17 (1997) 263-264.
[64] R.D. Terry The pathogenesis of Alzheimer disease: an alternative to the
amyloid hypothesis, J Neuropathol Exp Neurol 55 (1996) 1023-1025.
[65] M.C. Irizarry, F. Soriano, M. McNamara, K.J. Page, D. Schenk, D. Games and
B.T. Hyman Abeta deposition is associated with neuropil changes, but not with
overt neuronal loss in the human amyloid precursor protein V717F (PDAPP)
transgenic mouse, J Neurosci 17 (1997) 7053-7059.
[66] R. Crook, A. Verkkoniemi, J. Perez-Tur, N. Mehta, M. Baker, H. Houlden, M.
Farrer, M. Hutton, S. Lincoln, J. Hardy, K. Gwinn, M. Somer, A. Paetau, H.
Kalimo, R. Ylikoski, M. Poyhonen, S. Kucera and M. Haltia A variant of
Alzheimer's disease with spastic paraparesis and unusual plaques due to
deletion of exon 9 of presenilin 1, Nat Med 4 (1998) 452-455.

References
259
[67] H. Houlden, M. Baker, E. McGowan, P. Lewis, M. Hutton, R. Crook, N.W.
Wood, S. Kumar-Singh, J. Geddes, M. Swash, F. Scaravilli, J.L. Holton, T.
Lashley, T. Tomita, T. Hashimoto, A. Verkkoniemi, H. Kalimo, M. Somer, A.
Paetau, J.J. Martin, C. Van Broeckhoven, T. Golde, J. Hardy, M. Haltia and T.
Revesz Variant Alzheimer's disease with spastic paraparesis and cotton wool
plaques is caused by PS-1 mutations that lead to exceptionally high amyloid-
beta concentrations, Ann Neurol 48 (2000) 806-808.
[68] H. Braak and K. Del Tredici Alzheimer's disease: intraneuronal alterations
precede insoluble amyloid-beta formation, Neurobiol Aging 25 (2004) 713-718;
discussion 743-716.
[69] H. Braak and E. Braak Frequency of stages of Alzheimer-related lesions in
different age categories, Neurobiol Aging 18 (1997) 351-357.
[70] j.l. Price, Morris,j.c So what if tangles precede plaques?, Neurobiology of
ageing 25 (2004) 721-723.
[71] J.C. Morris, M. Storandt, D.W. McKeel, Jr., E.H. Rubin, J.L. Price, E.A. Grant
and L. Berg Cerebral amyloid deposition and diffuse plaques in "normal"
aging: Evidence for presymptomatic and very mild Alzheimer's disease,
Neurology 46 (1996) 707-719.
[72] W. Silverman, H.M. Wisniewski, M. Bobinski and J. Wegiel Frequency of
stages of Alzheimer-related lesions in different age categories, Neurobiol
Aging 18 (1997) 377-379; discussion 389-392.
[73] J.L. Price Tangles and plaques in healthy aging and Alzheimer's disease.
independence or interaction?, Semin neurosci 6 (1994) 395-402.
[74] M. Nishimura, G. Yu and P.H. St George-Hyslop Biology of presenilins as
causative molecules for Alzheimer disease, Clin Genet 55 (1999) 219-225.

References
260
[75] J. Hardy The genetic causes of neurodegenerative diseasesi, Joural of
Alzheimer's disease 3 (2001) 109-116.
[76] N. Suzuki, T.T. Cheung, X.D. Cai, A. Odaka, L. Otvos, Jr., C. Eckman, T.E.
Golde and S.G. Younkin An increased percentage of long amyloid beta protein
secreted by familial amyloid beta protein precursor (beta APP717) mutants,
Science 264 (1994) 1336-1340.
[77] J. Theuns, J. Del-Favero, B. Dermaut, C.M. van Duijn, H. Backhovens, M.V.
Van den Broeck, S. Serneels, E. Corsmit, C.V. Van Broeckhoven and M. Cruts
Genetic variability in the regulatory region of presenilin 1 associated with risk
for Alzheimer's disease and variable expression, Hum Mol Genet 9 (2000)
325-331.
[78] M. Wragg, M. Hutton and C. Talbot Genetic association between intronic
polymorphism in presenilin-1 gene and late-onset Alzheimer's disease.
Alzheimer's Disease Collaborative Group, Lancet 347 (1996) 509-512.
[79] A.D. Roses A model for susceptibility polymorphisms for complex
diseases:apolipoprotein E and alzheimer's disease, Neurogenetics 1 (1997) 3-
11.
[80] E.H. Corder, A.M. Saunders, W.J. Strittmatter, D.E. Schmechel, P.C. Gaskell,
G.W. Small, A.D. Roses, J.L. Haines and M.A. Pericak-Vance Gene dose of
apolipoprotein E type 4 allele and the risk of Alzheimer's disease in late onset
families, Science 261 (1993) 921-923.
[81] R.C. Dodel, Y. Du, K.R. Bales, F. Gao, B. Eastwood, B. Glazier, R. Zimmer, B.
Cordell, A. Hake, R. Evans, D. Gallagher-Thompson, L.W. Thompson, J.R.
Tinklenberg, A. Pfefferbaum, E.V. Sullivan, J. Yesavage, L. Alstiel, T. Gasser,

References
261
M.R. Farlow, G.M. Murphy, Jr. and S.M. Paul Alpha2 macroglobulin and the
risk of Alzheimer's disease, Neurology 54 (2000) 438-442.
[82] D. Blacker, M.A. Wilcox, N.M. Laird, L. Rodes, S.M. Horvath, R.C. Go, R.
Perry, B. Watson, Jr., S.S. Bassett, M.G. McInnis, M.S. Albert, B.T. Hyman
and R.E. Tanzi Alpha-2 macroglobulin is genetically associated with Alzheimer
disease, Nat Genet 19 (1998) 357-360.
[83] L. Bertram, D. Blacker, K. Mullin, D. Keeney, J. Jones, S. Basu, S. Yhu, M.G.
McInnis, R.C. Go, K. Vekrellis, D.J. Selkoe, A.J. Saunders and R.E. Tanzi
Evidence for genetic linkage of Alzheimer's disease to chromosome 10q,
Science 290 (2000) 2302-2303.
[84] N. Ertekin-Taner, N. Graff-Radford, L.H. Younkin, C. Eckman, M. Baker, J.
Adamson, J. Ronald, J. Blangero, M. Hutton and S.G. Younkin Linkage of
plasma Abeta42 to a quantitative locus on chromosome 10 in late-onset
Alzheimer's disease pedigrees, Science 290 (2000) 2303-2304.
[85] M. Takehashi, S. Tanaka, E. Masliah and K. Ueda Association of monoamine
oxidase A gene polymorphism with Alzheimer's disease and Lewy body
variant, Neurosci Lett 327 (2002) 79-82.
[86] O. Combarros, J. Infante, J. Llorca, N. Pena, C. Fernandez-Viadero and J.
Berciano The myeloperoxidase gene in Alzheimer's disease: a case-control
study and meta-analysis, Neurosci Lett 326 (2002) 33-36.
[87] F.C. Crawford, M.J. Freeman, J.A. Schinka, M.D. Morris, L.I. Abdullah, D.
Richards, S. Sevush, R. Duara and M.J. Mullan Association between
Alzheimer's disease and a functional polymorphism in the Myeloperoxidase
gene, Exp Neurol 167 (2001) 456-459.

References
262
[88] U. Byrne, Waldvogel,H. , Dragunow,M. ,Kettle,A., Faull, R. Myeloperoxidase
expression in alzheimer's disease, Experimental neurology 155 (1999) 31-41.
[89] H. Tanahashi, T. Asada and T. Tabira Association between tau polymorphism
and male early-onset Alzheimer's disease, Neuroreport 15 (2004) 175-179.
[90] M.J. Bullido, J. Aldudo, A. Frank, F. Coria, J. Avila and F. Valdivieso A
polymorphism in the tau gene associated with risk for Alzheimer's disease,
Neurosci Lett 278 (2000) 49-52.
[91] S. Mace, E. Cousin, S. Ricard, E. Genin, E. Spanakis, C. Lafargue-Soubigou,
B. Genin, R. Fournel, S. Roche, G. Haussy, F. Massey, S. Soubigou, G.
Brefort, P. Benoit, A. Brice, D. Campion, M. Hollis, L. Pradier, J. Benavides
and J.F. Deleuze ABCA2 is a strong genetic risk factor for early-onset
Alzheimer's disease, Neurobiol Dis 18 (2005) 119-125.
[92] F. Licastro, M. Chiappelli, L.M. Grimaldi, K. Morgan, N. Kalsheker, E.
Calabrese, A. Ritchie, E. Porcellini, G. Salani, M. Franceschi and N. Canal A
new promoter polymorphism in the alpha-1-antichymotrypsin gene is a
disease modifier of Alzheimer's disease, Neurobiol Aging 26 (2005) 449-453.
[93] L. Bertram, M. Hiltunen, M. Parkinson, M. Ingelsson, C. Lange, K. Ramasamy,
K. Mullin, R. Menon, A.J. Sampson, M.Y. Hsiao, K.J. Elliott, G. Velicelebi, T.
Moscarillo, B.T. Hyman, S.L. Wagner, K.D. Becker, D. Blacker and R.E. Tanzi
Family-based association between Alzheimer's disease and variants in
UBQLN1, N Engl J Med 352 (2005) 884-894.
[94] A.L. Mah, G. Perry, M.A. Smith and M.J. Monteiro Identification of ubiquilin, a
novel presenilin interactor that increases presenilin protein accumulation, J
Cell Biol 151 (2000) 847-862.

References
263
[95] M. Baker, I.R. Mackenzie, S.M. Pickering-Brown, J. Gass, R. Rademakers, C.
Lindholm, J. Snowden, J. Adamson, A.D. Sadovnick, S. Rollinson, A. Cannon,
E. Dwosh, D. Neary, S. Melquist, A. Richardson, D. Dickson, Z. Berger, J.
Eriksen, T. Robinson, C. Zehr, C.A. Dickey, R. Crook, E. McGowan, D. Mann,
B. Boeve, H. Feldman and M. Hutton Mutations in progranulin cause tau-
negative frontotemporal dementia linked to chromosome 17, Nature 442
(2006) 916-919.
[96] L. Petrozzi, C. Lucetti, R. Scarpato, G. Gambaccini, F. Trippi, S. Bernardini, P.
Del Dotto, L. Migliore and U. Bonuccelli Cytogenetic alterations in lymphocytes
of Alzheimer's disease and Parkinson's disease patients, Neurol Sci 23 Suppl
2 (2002) S97-98.
[97] L. Migliore, A. Testa, R. Scarpato, N. Pavese, L. Petrozzi and U. Bonuccelli
Spontaneous and induced aneuploidy in peripheral blood lymphocytes of
patients with Alzheimer's disease, Hum Genet 101 (1997) 299-305.
[98] L. Migliore, N. Botto, R. Scarpato, L. Petrozzi, G. Cipriani and U. Bonuccelli
Preferencial occurence of chromosome 21 malsegregation in peripheral blood
lymphocytes of alzheimer disease patients, Cytogenet cell genet 87 (1999) 41-
46.
[99] L.N. Geller and H. Potter Chromosome missegregation and trisomy 21
mosaicism in Alzheimer's disease, Neurobiol Dis 6 (1999) 167-179.
[100] H. Potter Review and hypothesis: Alzheimer disease and Down syndrome--
chromosome 21 nondisjunction may underlie both disorders, Am J Hum Genet
48 (1991) 1192-1200.

References
264
[101] H.M. Wisniewski, A. Rabe and K.E. Wisniewski Neuropathology and dementia
in people with Down's syndrome, Cold spring harbour Laboratory Press, New
York, 1988.
[102] J.K. Teller, C. Russo, L.M. DeBusk, G. Angelini, D. Zaccheo, F. Dagna-
Bricarelli, P. Scartezzini, S. Bertolini, D.M. Mann, M. Tabaton and P. Gambetti
Presence of soluble amyloid beta-peptide precedes amyloid plaque formation
in Down's syndrome, Nat Med 2 (1996) 93-95.
[103] X. Wang, P. Thomas, J. Xue and M. Fenech Folate deficiency induces
aneuploidy in human lymphocytes in vitro-evidence using cytokinesis-blocked
cells and probes specific for chromosomes 17 and 21, Mutat Res 551 (2004)
167-180.
[104] G.D. Schellenberg, T.D. Bird, E.M. Wijsman, H.T. Orr, L. Anderson, E.
Nemens, J.A. White, L. Bonnycastle, J.L. Weber, M.E. Alonso and et al.
Genetic linkage evidence for a familial Alzheimer's disease locus on
chromosome 14, Science 258 (1992) 668-671.
[105] R. Sherrington, E.I. Rogaev, Y. Liang, E.A. Rogaeva, G. Levesque, M. Ikeda,
H. Chi, C. Lin, G. Li, K. Holman and et al. Cloning of a gene bearing missense
mutations in early-onset familial Alzheimer's disease, Nature 375 (1995) 754-
760.
[106] J. Li, M. Xu, H. Zhou, J. Ma and H. Potter Alzheimer presenilins in the nuclear
membrane, interphase kinetochores, and centrosomes suggest a role in
chromosome segregation, Cell 90 (1997) 917-927.
[107] G. Deng, C.J. Pike and C.W. Cotman Alzheimer-associated presenilin-2
confers increased sensitivity to apoptosis in PC12 cells, FEBS Lett 397 (1996)
50-54.

References
265
[108] T. Wisniewski, J. Ghiso and B. Frangione Biology of A beta amyloid in
Alzheimer's disease, Neurobiol Dis 4 (1997) 313-328.
[109] S. Das and H. Potter Expression of the Alzheimer amyloid promoting factor
antichymotrypsin is induced in human astrocytes by IL-1., Neuron 14 (1995)
447-456.
[110] M.J. Ramirez, S. Puerto, P. Galofre, E.M. Parry, J.M. Parry, A. Creus, R.
Marcos and J. Surralles Multicolour FISH detection of radioactive iodine-
induced 17cen-p53 chromosomal breakage in buccal cells from therapeutically
exposed patients, Carcinogenesis 21 (2000) 1581-1586.
[111] J. Surralles, M.P. Hande, R. Marcos and P.M. Lansdorp Accelerated telomere
shortening in the human inactive X chromosome, Am J Hum Genet 65 (1999)
1617-1622.
[112] L.A. Panossian, V.R. Porter, H.F. Valenzuela, X. Zhu, E. Reback, D.
Masterman, J.L. Cummings and R.B. Effros Telomere shortening in T cells
correlates with Alzheimer's disease status, Neurobiol Aging 24 (2003) 77-84.
[113] N. Rufer, T.H. Brummendorf, S. Kolvraa, C. Bischoff, K. Christensen, L.
Wadsworth, M. Schulzer and P.M. Lansdorp Telomere fluorescence
measurements in granulocytes and T lymphocyte subsets point to a high
turnover of hematopoietic stem cells and memory T cells in early childhood, J
Exp Med 190 (1999) 157-167.
[114] X. Wu, C.I. Amos, Y. Zhu, H. Zhao, B.H. Grossman, J.W. Shay, S. Luo, W.K.
Hong and M.R. Spitz Telomere dysfunction: a potential cancer predisposition
factor, J Natl Cancer Inst 95 (2003) 1211-1218.

References
266
[115] R.M. Cawthon, K.R. Smith, E. O'Brien, A. Sivatchenko and R.A. Kerber
Association between telomere length in blood and mortality in people aged 60
years or older, Lancet 361 (2003) 393-395.
[116] V.s. Thomas von Zglinicki, Mario lorenz, Gabriele Saretzki, Romana Lenzen-
grobimlighaus, Reiner Gebner, Angela Risch, Elisabeth Steinhagen-Thiessen
Short telomeres in parients with vascular dementia: An indicator of low
antioxidative capacity and a possible risk factor ?, Laboratory investigation 80
(2000) 1739-1747.
[117] V. Pennaneach and R.D. Kolodner Recombination and the Tel1 and Mec1
checkpoints differentially effect genome rearrangements driven by telomere
dysfunction in yeast, 36 (2004) 612-617.
[118] D. Shore CELL BIOLOGY:Enhanced: Telomeres--Unsticky Ends, Science 281
(1998) 1818-1819.
[119] C. Scheel, K.L. Schaefer, A. Jauch, M. Keller, D. Wai, C. Brinkschmidt, F. van
Valen, W. Boecker, B. Dockhorn-Dworniczak and C. Poremba Alternative
lengthening of telomeres is associated with chromosomal instability in
osteosarcomas, Oncogene 20 (2001) 3835-3844.
[120] M. Fenech and J.W. Crott Micronuclei, nucleoplasmic bridges and nuclear
buds induced in folic acid deficient human lymphocytes-evidence for
breakage-fusion-bridge cycles in the cytokinesis-block micronucleus assay,
Mutat Res 504 (2002) 131-136.
[121] B. McClintock Spotaneous alterations in chromosome size and form in Zea
mays, Cold spring Harb Sym quant Biol 8 (1941) 72-81.

References
267
[122] U. Martens, Zijlmans m,j,m, Poon,s. dragowska, W. Yui,J. Chavez, E.A,
Ward,R,K. Lansdorp,P.M Short telomeres on human chromosome 17p, Nature
genetics 18 (1998) 76-80.
[123] A.W. Lo, L. Sabatier, B. Fouladi, G. Pottier, M. Ricoul and J.P. Murnane DNA
amplification by breakage/fusion/bridge cycles initiated by spontaneous
telomere loss in a human cancer cell line, Neoplasia 4 (2002) 531-538.
[124] N.T. Leach, C. Rehder, K. Jensen, S. Holt and C. Jackson-Cook Human
chromosomes with shorter telomeres and large heterochromatin regions have
a higher frequency of acquired somatic cell aneuploidy, Mech Ageing Dev 125
(2004) 563-573.
[125] R.S. Maser and R.A. DePinho Connecting chromosomes, crisis, and cancer,
Science 297 (2002) 565-569.
[126] T.v. Zglinicki Oxidative stress shorrtens telomeres, Trends in biochemical
sciences 27 (2002) 339-344.
[127] S.P. Gabbita, Lovell,M.A., Markesbery,W.R. Increased nuclear DNA oxidation
in the brain in Alzheimer's disease, J Neurochem 71 (1998) 2034-2040.
[128] M.A. Lovell, S.P. Gabbita and W.R. Markesbery Increased DNA oxidation and
decreased levels of repair products in Alzheimer's disease ventricular CSF, J
Neurochem 72 (1999) 771-776.
[129] P. Mecocci, M.C. Polidori, T. Ingegni, A. Cherubini, F. Chionne, R. Cecchetti
and U. Senin Oxidative damage to DNA in lymphocytes from AD patients,
Neurology 51 (1998) 1014-1017.
[130] M.A. Smith, M. Rudnicka-Nawrot, P.L. Richey, D. Praprotnik, P. Mulvihill, C.A.
Miller, L.M. Sayre and G. Perry Carbonyl-related posttranslational modification

References
268
of neurofilament protein in the neurofibrillary pathology of Alzheimer's disease,
J Neurochem 64 (1995) 2660-2666.
[131] M. Miyata and J.D. Smith Apolipoprotein E allele-specific antioxidant activity
and effects on cytotoxicity by oxidative insults and beta-amyloid peptides, Nat
Genet 14 (1996) 55-61.
[132] J. Poirier Apolipoprotein E in animal models of CNS injury and in Alzheimer's
disease, Trends Neurosci 17 (1994) 525-530.
[133] K. Ramasamy, Krzywokowski, P., Bastianetto,S. Apolipoprotein E, oxidative
stress and EGb 761 in Alzheimer's disease brain, packer, L., Christen, Y., eds
Ginkgo biloba extract (EGb 761) study: lessson from cell biology.
Paris:elsevier, 1998:69-83 (1998).
[134] L. Migliore, I. Fontana, F. Trippi, R. Colognato, F. Coppede, G. Tognoni, B.
Nucciarone and G. Siciliano Oxidative DNA damage in peripheral leukocytes
of mild cognitive impairment and AD patients, Neurobiol Aging 26 (2005) 567-
573.
[135] M. Flint Beal Oxidative damage as an early marker of Alzheimer's disease and
mild cognitive impairment, neurobiology of ageing 26 (2005) 585-586.
[136] P. Mecocci, M.C. Polidori, A. Cherubini, T. Ingegni, P. Mattioli, M. Catani, P.
Rinaldi, R. Cecchetti, W. Stahl, U. Senin and M.F. Beal Lymphocyte oxidative
DNA damage and plasma antioxidants in Alzheimer disease, Arch Neurol 59
(2002) 794-798.
[137] A. Nunomura, G. Perry, G. Aliev, K. Hirai, A. Takeda, E.K. Balraj, P.K. Jones,
H. Ghanbari, T. Wataya, S. Shimohama, S. Chiba, C.S. Atwood, R.B.
Petersen and M.A. Smith Oxidative damage is the earliest event in Alzheimer
disease, J Neuropathol Exp Neurol 60 (2001) 759-767.

References
269
[138] P.S. Aisen, S. Egelko, H. Andrews, R. Diaz-Arrastia, M. Weiner, C. DeCarli,
W. Jagust, J.W. Miller, R. Green, K. Bell and M. Sano A pilot study of vitamins
to lower plasma homocysteine levels in Alzheimer disease, Am J Geriatr
Psychiatry 11 (2003) 246-249.
[139] T.B. Shea and E. Rogers Homocysteine and dementia, N Engl J Med 346
(2002) 2007; author reply 2008.
[140] S. Scarpa, A. Fuso, F. D'Anselmi and R.A. Cavallaro Presenilin 1 gene
silencing by S-adenosylmethionine: a treatment for Alzheimer disease?, FEBS
Lett 541 (2003) 145-148.
[141] T. Suzuki, M. Fujii and D. Ayusawa Demethylation of classical satellite 2 and 3
DNA with chromosomal instability in senescent human fibroblasts, Exp
Gerontol 37 (2002) 1005-1014.
[142] M. Fenech The role of folic acid and Vitamin B12 in genomic stability of human
cells, Mutat Res 475 (2001) 57-67.
[143] J.M. Zingg and P.A. Jones Genetic and epigenetic aspects of DNA
methylation on genome expression, evolution, mutation and carcinogenesis,
Carcinogenesis 18 (1997) 869-882.
[144] R. Clarke, A.D. Smith, K.A. Jobst, H. Refsum, L. Sutton and P.M. Ueland
Folate, Vitamin B12, and Serum Total Homocysteine Levels in Confirmed
Alzheimer Disease, Arch Neurol 55 (1998) 1449-1455.
[145] M.S. Morris Homocysteine and Alzheimer's disease, Lancet Neurol 2 (2003)
425-428.
[146] S. Seshadri, A. Beiser, J. Selhub, P.F. Jacques, I.H. Rosenberg, R.B.
D'Agostino, P.W. Wilson and P.A. Wolf Plasma homocysteine as a risk factor
for dementia and Alzheimer's disease, N Engl J Med 346 (2002) 476-483.

References
270
[147] H.X. Wang, A. Wahlin, H. Basun, J. Fastbom, B. Winblad and L. Fratiglioni
Vitamin B(12) and folate in relation to the development of Alzheimer's disease,
Neurology 56 (2001) 1188-1194.
[148] A. McCaddon, G. Davies, P. Hudson, S. Tandy and H. Cattell Total serum
homocysteine in senile dementia of Alzheimer type, Int J Geriatr Psychiatry 13
(1998) 235-239.
[149] Kruman, II, T.S. Kumaravel, A. Lohani, W.A. Pedersen, R.G. Cutler, Y.
Kruman, N. Haughey, J. Lee, M. Evans and M.P. Mattson Folic acid deficiency
and homocysteine impair DNA repair in hippocampal neurons and sensitize
them to amyloid toxicity in experimental models of Alzheimer's disease, J
Neurosci 22 (2002) 1752-1762.
[150] J.H. Williams, E.A. Pereira, M.M. Budge and K.M. Bradley Minimal
hippocampal width relates to plasma homocysteine in community-dwelling
older people, Age Ageing 31 (2002) 440-444.
[151] T. den Heijer, S.E. Vermeer and R. Clarke Homocysteine and brain atrophy on
MRI of non-demented elderly., Brain 126 (2003) 170-175.
[152] B.E. Dwyer, A.K. Raina, G. Perry and M.A. Smith Homocysteine and
Alzheimer's disease: a modifiable risk?, Free Radic Biol Med 36 (2004) 1471-
1475.
[153] M.P. Mattson and T.B. Shea Folate and homocysteine metabolism in neural
plasticity and neurodegenerative disorders, Trends Neurosci 26 (2003) 137-
146.
[154] T.B. Shea, J. Lyons-Weiler and E. Rogers Homocysteine, folate deprivation
and Alzheimer neuropathology, J Alzheimers Dis 4 (2002) 261-267.

References
271
[155] D. Bunce, M. Kivipelto and A. Wahlin Utilization of cognitive support in
episodic free recall as a function of apolipoprotein E and vitamin B12 or folate
among adults aged 75 years and older, Neuropsychology 18 (2004) 362-370.
[156] M.C. Morris, D.A. Evans, J.L. Bienias, P.A. Scherr, C.C. Tangney, L.E. Hebert,
D.A. Bennett, R.S. Wilson and N. Aggarwal Dietary niacin and the risk of
incident Alzheimer's disease and of cognitive decline, J Neurol Neurosurg
Psychiatry 75 (2004) 1093-1099.
[157] M. Cohen-Armon, L. Visochek, A. Katzoff, D. Levitan, A.J. Susswein, R. Klein,
M. Valbrun and J.H. Schwartz Long-term memory requires polyADP-
ribosylation, Science 304 (2004) 1820-1822.
[158] W. Qin, T. Yang, L. Ho, Z. Zhao, J. Wang, L. Chen, M. Thiyagarajan, D.
Macgrogan, J.T. Rodgers, P. Puigserver, J. Sadoshima, H.H. Deng, S.
Pedrini, S. Gandy, A. Sauve and G.M. Pasinetti Neuronal SIRT1 activation as
a novel mechanism underlying the prevention of Alzheimer's disease amyloid
neuropathology by calorie restriction, J Biol Chem (2006).
[159] S.J. James, M. Pogribna, I.P. Pogribny, S. Melnyk, R.J. Hine, J.B. Gibson, P.
Yi, D.L. Tafoya, D.H. Swenson, V.L. Wilson and D.W. Gaylor Abnormal folate
metabolism and mutation in the methylenetetrahydrofolate reductase gene
may be maternal risk factors for Down syndrome, Am J Clin Nutr 70 (1999)
495-501.
[160] P. Frosst, H.J. Blom, R. Milos, P. Goyette, C.A. Sheppard, R.G. Matthews,
G.J. Boers, M. den Heijer, L.A. Kluijtmans, L.P. van den Heuvel and et al. A
candidate genetic risk factor for vascular disease: a common mutation in
methylenetetrahydrofolate reductase, Nat Genet 10 (1995) 111-113.

References
272
[161] K.J. Lievers, G.H. Boers, P. Verhoef, M. den Heijer, L.A. Kluijtmans, N.M. van
der Put, F.J. Trijbels and H.J. Blom A second common variant in the
methylenetetrahydrofolate reductase (MTHFR) gene and its relationship to
MTHFR enzyme activity, homocysteine, and cardiovascular disease risk, J Mol
Med 79 (2001) 522-528.
[162] T. Brunelli, S. Bagnoli, B. Giusti, B. Nacmias, G. Pepe, S. Sorbi and R. Abbate
The C677T methylenetetrahydrofolate reductase mutation is not associated
with Alzheimer's disease, Neurosci Lett 315 (2001) 103-105.
[163] Y. Wakutani, H. Kowa, M. Kusumi, K. Nakaso, K. Yasui, K. Isoe-Wada, H.
Yano, K. Urakami, T. Takeshima and K. Nakashima A haplotype of the
methylenetetrahydrofolate reductase gene is protective against late-onset
Alzheimer's disease, Neurobiol Aging 25 (2004) 291-294.
[164] K. Beyer, J.I. Lao, P. Latorre, N. Riutort, B. Matute, M.T. Fernandez-Figueras,
J.L. Mate and A. Ariza Methionine synthase polymorphism is a risk factor for
Alzheimer disease, Neuroreport 14 (2003) 1391-1394.
[165] A. McCaddon, P. Hudson, D. Hill, J. Barber, A. Lloyd, G. Davies and B.
Regland Alzheimer's disease and total plasma aminothiols, Biol Psychiatry 53
(2003) 254-260.
[166] L.D. Morrison, D.D. Smith and S.J. Kish Brain S-adenosylmethionine levels
are severely decreased in Alzheimer's disease, J Neurochem 67 (1996) 1328-
1331.
[167] K. Abe, Kimura,H. the possible role of hydrogen sulphide as an endogenous
Neuromodulator, Journal of neuroscience 16 (1996) 1066-1071.

References
273
[168] K. Eto, T. Asada, K. Arima, T. Makifuchi and H. Kimura Brain hydrogen
sulphide is severely decreased in Alzheimer's disease, Biochem Biophys Res
Commun 293 (2002) 1485-1488.
[169] Y. Kimura and H. Kimura Hydrogen sulfide protects neurons from oxidative
stress, Faseb J 18 (2004) 1165-1167.
[170] S. Barbaux, R. Plomin and A. Whitehesd Polymorphisms of genes controlling
honmocysteine/folate metabolism and cognitive function., Neuroreport 11
(2000) 1133-1136.
[171] S.L. Payao, M.D. Smith and P.H. Bertolucci Differential chromosome
sensitivity to 5-azacytidine in Alzheimer's disease, Gerontology 44 (1998) 267-
271.
[172] L.S. Andrea Fuso, Rosaria A. Cavallaro, Fabrizio D'Anselmi, Sifrido Scarpa S-
adenosylmethionine/homocysteine cycle alterations modify DNA methylation
status with consequent deregulation of PS1 and BACE and beta-amyloid
production., Mol.Cell.Neuroscience 28 (2005) 195-204.
[173] R.L. West, J.M. Lee and L.E. Maroun Hypomethylation of the amyloid
precursor protein gene in the brain of an Alzheimer's disease patient, J Mol
Neurosci 6 (1995) 141-146.
[174] G. Perry, A.K. Raina, A. Nunomura, T. Wataya, L.M. Sayre and M.A. Smith
How important is oxidative damage? Lessons from Alzheimer's disease, Free
Radic Biol Med 28 (2000) 831-834.
[175] G. Perry, M.A. Taddeo, A. Nunomura, X. Zhu, T. Zenteno-Savin, K.L. Drew, S.
Shimohama, J. Avila, R.J. Castellani and M.A. Smith Comparative biology and
pathology of oxidative stress in Alzheimer and other neurodegenerative

References
274
diseases: beyond damage and response, Comp Biochem Physiol C Toxicol
Pharmacol 133 (2002) 507-513.
[176] P.P. Zandi, J.C. Anthony, A.S. Khachaturian, S.V. Stone, D. Gustafson, J.T.
Tschanz, M.C. Norton, K.A. Welsh-Bohmer and J.C. Breitner Reduced risk of
Alzheimer disease in users of antioxidant vitamin supplements: the Cache
County Study, Arch Neurol 61 (2004) 82-88.
[177] C. Rota, Rimbach,G., Minnihane,A., Stocecklin,E., Barella,L. Dietary Vitamin E
modulates differential gene expression in the rat hippocampus:Potential
implications for its neuroprotective properties, Nutritional neuroscience 8
(2005) 21-29.
[178] J.M. Ringman, S.A. Frautschy, G.M. Cole, D.L. Masterman and J.L.
Cummings A potential role of the curry spice curcumin in Alzheimer's disease,
Curr Alzheimer Res 2 (2005) 131-136.
[179] L.G. Yang F, Begum AN, Ubeda OJ, Simmons MR, Ambegaokar SS, Chen
PP, and G.C. Kayed R, Frautschy SA, Cole GM. curcumin inhibits formation of
amyloid beta oligomers and fibrils , binds plaques, and reduces amyloid in
vivo, j biol chem 18 (2005) 5892-5901.
[180] K. Ono, K. Hasegawa, H. Naiki and M. Yamada Preformed beta-amyloid fibrils
are destabilized by coenzyme Q10 in vitro, Biochem Biophys Res Commun
330 (2005) 111-116.
[181] L. Baum and A. Ng Curcumin interaction with copper and iron suggests one
possible mechanism of action in Alzheimer's disease animal models, J
Alzheimers Dis 6 (2004) 367-377; discussion 443-369.

References
275
[182] X. Wu, G.R. Beecher, J.M. Holden, D.B. Haytowitz, S.E. Gebhardt and R.L.
Prior Lipophilic and hydrophilic antioxidant capacities of common foods in the
United States, J Agric Food Chem 52 (2004) 4026-4037.
[183] J.A. Joseph, N.A. Denisova, G. Arendash, M. Gordon, D. Diamond, B. Shukitt-
Hale and D. Morgan Blueberry supplementation enhances signaling and
prevents behavioral deficits in an Alzheimer disease model, Nutr Neurosci 6
(2003) 153-162.
[184] J.A. Joseph, B. Shukitt-Hale, N.A. Denisova, D. Bielinski, A. Martin, J.J.
McEwen and P.C. Bickford Reversals of age-related declines in neuronal
signal transduction, cognitive, and motor behavioral deficits with blueberry,
spinach, or strawberry dietary supplementation, J Neurosci 19 (1999) 8114-
8121.
[185] J. Shi, J. Yu, J.E. Pohorly and Y. Kakuda Polyphenolics in grape seeds-
biochemistry and functionality, J Med Food 6 (2003) 291-299.
[186] M.H. Li, J.H. Jang, B. Sun and Y.J. Surh Protective effects of oligomers of
grape seed polyphenols against beta-amyloid-induced oxidative cell death,
Ann N Y Acad Sci 1030 (2004) 317-329.
[187] J. Deshane, L. Chaves, K.V. Sarikonda, S. Isbell, L. Wilson, M. Kirk, C.
Grubbs, S. Barnes, S. Meleth and H. Kim Proteomics analysis of rat brain
protein modulations by grape seed extract, J Agric Food Chem 52 (2004)
7872-7883.
[188] S. Mandel, T. Amit, L. Reznichenko, O. Weinreb and M.B. Youdim Green tea
catechins as brain-permeable, natural iron chelators-antioxidants for the
treatment of neurodegenerative disorders, Mol Nutr Food Res 50 (2006) 229-
234.

References
276
[189] K. Rezai-Zadeh, D. Shytle, N. Sun, T. Mori, H. Hou, D. Jeanniton, J. Ehrhart,
K. Townsend, J. Zeng, D. Morgan, J. Hardy, T. Town and J. Tan Green tea
epigallocatechin-3-gallate (EGCG) modulates amyloid precursor protein
cleavage and reduces cerebral amyloidosis in Alzheimer transgenic mice, J
Neurosci 25 (2005) 8807-8814.
[190] E.J. Okello, S.U. Savelev and E.K. Perry In vitro anti-beta-secretase and dual
anti-cholinesterase activities of Camellia sinensis L. (tea) relevant to treatment
of dementia, Phytother Res 18 (2004) 624-627.
[191] S. Kuriyama, A. Hozawa, K. Ohmori, T. Shimazu, T. Matsui, S. Ebihara, S.
Awata, R. Nagatomi, H. Arai and I. Tsuji Green tea consumption and cognitive
function: a cross-sectional study from the Tsurugaya Project 1, Am J Clin Nutr
83 (2006) 355-361.
[192] A.I. Bush Metals and neuroscience, Curr Opin Chem Biol 4 (2000) 184-191.
[193] S. Assaf and Chungs-h Release of endogenous Zinc from brain tissue, Nature
308 (1984) 734-736.
[194] A. Bush and R. Tanzi The galavanization of b-amyloid in alzheimer's disease,
Proceedings of the National Academy of sciences 99 (2002) 7317-7319.
[195] M.A. Lovell, J.D. Robertson, W.J. Teesdale, J.L. Campbell and W.R.
Markesbery Copper, iron and zinc in Alzheimer's disease senile plaques, J
Neurol Sci 158 (1998) 47-52.
[196] S.W. Suh, K.B. Jensen, M.S. Jensen, D.S. Silva, P.J. Kesslak, G. Danscher
and C.J. Frederickson Histochemically-reactive zinc in amyloid plaques,
angiopathy, and degenerating neurons of Alzheimer's diseased brains, Brain
Res 852 (2000) 274-278.

References
277
[197] C.S. Atwood, R.D. Moir, X. Huang, R.C. Scarpa, N.M. Bacarra, D.M. Romano,
M.A. Hartshorn, R.E. Tanzi and A.I. Bush Dramatic aggregation of Alzheimer
abeta by Cu(II) is induced by conditions representing physiological acidosis, J
Biol Chem 273 (1998) 12817-12826.
[198] X. Huang, C.S. Atwood, M.A. Hartshorn, G. Multhaup, L.E. Goldstein, R.C.
Scarpa, M.P. Cuajungco, D.N. Gray, J. Lim, R.D. Moir, R.E. Tanzi and A.I.
Bush The A beta peptide of Alzheimer's disease directly produces hydrogen
peroxide through metal ion reduction, Biochemistry 38 (1999) 7609-7616.
[199] X. Huang, M.P. Cuajungco, C.S. Atwood, M.A. Hartshorn, J.D. Tyndall, G.R.
Hanson, K.C. Stokes, M. Leopold, G. Multhaup, L.E. Goldstein, R.C. Scarpa,
A.J. Saunders, J. Lim, R.D. Moir, C. Glabe, E.F. Bowden, C.L. Masters, D.P.
Fairlie, R.E. Tanzi and A.I. Bush Cu(II) potentiation of alzheimer abeta
neurotoxicity. Correlation with cell-free hydrogen peroxide production and
metal reduction, J Biol Chem 274 (1999) 37111-37116.
[200] A.I. Bush Metal complexing agents as therapies for Alzheimer's disease,
Neurobiology of aging (2002) 1031-1038.
[201] M.P. Cuajungco, L.E. Goldstein, A. Nunomura, M.A. Smith, J.T. Lim, C.S.
Atwood, X. Huang, Y.W. Farrag, G. Perry and A.I. Bush Evidence that the
beta-amyloid plaques of Alzheimer's disease represent the redox-silencing
and entombment of abeta by zinc, J Biol Chem 275 (2000) 19439-19442.
[202] J.Y. Lee, I. Mook-Jung and J.Y. Koh Histochemically reactive zinc in plaques
of the Swedish mutant beta-amyloid precursor protein transgenic mice, J
Neurosci 19 (1999) RC10.

References
278
[203] S. Gonzalez, J.M. Huerta, J. Alvarez-Uria, S. Fernandez, A.M. Patterson and
C. Lasheras Serum selenium is associated with plasma homocysteine
concentrations in elderly humans, J Nutr 134 (2004) 1736-1740.
[204] D.P. Perl and A.R. Brody Alzheimer's disease: X-ray spectrometric evidence
of aluminum accumulation in neurofibrillary tangle-bearing neurons, Science
208 (1980) 297-299.
[205] P.F. Good, D.P. Perl, L.M. Bierer and J. Schmeidler Selective accumulation of
aluminum and iron in the neurofibrillary tangles of Alzheimer's disease: a laser
microprobe (LAMMA) study, Ann Neurol 31 (1992) 286-292.
[206] S. Duckett, P. Galle, R. Escourolle and F. Grey [Presence of aluminum and
magnesium in the cerebral arteries and parenchyma of patients with
striatonigral syndrome: study by Castaing's microprobe], C R Acad Sci Hebd
Seances Acad Sci D 282 (1976) 2115-2117.
[207] J.P. Landsberg, B. McDonald and F. Watt Absence of aluminium in neuritic
plaque cores in Alzheimer's disease, Nature 360 (1992) 65-68.
[208] L.C. Neri and D. Hewitt Aluminium, Alzheimer's disease, and drinking water,
Lancet 338 (1991) 390.
[209] T.P. Flaten Aluminium as a risk factor in Alzheimer's disease, with emphasis
on drinking water, Brain Res Bull 55 (2001) 187-196.
[210] j. Bayley (Ed.) Elegy for Iris, St Martins, New york, 1999.
[211] C. Bolognesi, C. Lando, A. Forni, E. Landini, R. Scarpato, L. Migliore and S.
Bonassi Chromosomal damage and ageing: effect on micronuclei frequency in
peripheral blood lymphocytes, Age Ageing 28 (1999) 393-397.
[212] Miller the biology of ageing and longevity. in : hazzard wr ed. principles of
geriatric medicine and gerontology., Mcgraw -hill, New york:, 1993.

References
279
[213] M. Fenech Chromosomal damage rate, aging, and diet, Ann N Y Acad Sci 854
(1998) 23-36.
[214] Martin genetic and enviromental modulations of chromosomal stability, Ann
NY Acad Sci 621 (1991) 401-417.
[215] C. Fraga, M. Shigenaga, J. Park, P. Degan and B. Ames Oxidative Damage to
DNA During Aging: 8-Hydroxy-2'-Deoxyguanosine in Rat Organ DNA and
Urine, PNAS 87 (1990) 4533-4537.
[216] D. Goukassian, F. Gad, M. Yaar, M.S. Eller, U.S. Nehal and B.A. Gilchrist
Mechanisms and implications of the age-associated decrease in DNA repair
capacity, FASEB J. 14 (2000) 1325-1334.
[217] M. Fenech and A.A. Morley Cytokinesis-block micronucleus method in human
lymphocytes: effect of in vivo ageing and low dose X-irradiation, Mutat Res
161 (1986) 193-198.
[218] A. Antoccia, C. Tanzarella, D. Modesti and F. Degrassi Cytokinesis-block
micronucleus assay with kinetochore detection in colchicine-treated human
fibroblasts, Mutat Res 287 (1993) 93-99.
[219] H. Norppa and G.C.-M. Falck What do human micronuclei contain?
Mutagenesis 18 (2003) 221-233.
[220] E.E. Visvardis, A.M. Tassiou and S.M. Piperakis Study of DNA damage
induction and repair capacity of fresh and cryopreserved lymphocytes
exposed to H2O2 and gamma-irradiation with the alkaline comet assay, Mutat
Res 383 (1997) 71-80.
[221] N.P. Singh, D.B. Danner, R.R. Tice, L. Brant and E.L. Schneider DNA damage
and repair with age in individual human lymphocytes, Mutat Res 237 (1990)
123-130.

References
280
[222] V.S. Dhillon, P. Thomas and M. Fenech Comparison of DNA damage and
repair following radiation challenge in buccal cells and lymphocytes using
single-cell gel electrophoresis, Int J Radiat Biol 80 (2004) 517-528.
[223] H. Weirich-Schwaiger, H.G. Weirich, B. Gruber, M. Schweiger and M. Hirsch-
Kauffmann Correlation between senescence and DNA repair in cells from
young and old individuals and in premature aging syndromes, Mutat Res 316
(1994) 37-48.
[224] P.E. Tolbert, C.M. Shy and J.W. Allen Micronuclei and other nuclear
anomalies in buccal smears: methods development, Mutat Res 271 (1992) 69-
77.
[225] J.A. Belien, M.P. Copper, B.J. Braakhuis, G.B. Snow and J.P. Baak
Standardization of counting micronuclei: definition of a protocol to measure
genotoxic damage in human exfoliated cells, Carcinogenesis 16 (1995) 2395-
2400.
[226] P.E. Tolbert, C.M. Shy and J.W. Allen Micronuclei and other nuclear
anomalies in buccal smears: a field test in snuff users, Am J Epidemiol 134
(1991) 840-850.
[227] N. Shimizu, N. Itoh, H. Utiyama and G.M. Wahl Selective Entrapment of
Extrachromosomally Amplified DNA by Nuclear Budding and Micronucleation
during S Phase, J. Cell Biol. 140 (1998) 1307-1320.
[228] N. Shimizu, F. Kamezaki and S. Shigematsu Tracking of microinjected DNA in
live cells reveals the intracellular behavior and elimination of
extrachromosomal genetic material, Nucl. Acids Res. 33 (2005) 6296-6307.
[229] J.A. Veiro and P.G. Cummins Imaging of skin epidermis from various origins
using confocal laser scanning microscopy, Dermatology 189 (1994) 16-22.

References
281
[230] B.R. Masters, G. Gonnord and P. Corcuff Three-dimensional microscopic
biopsy of in vivo human skin: a new technique based on a flexible confocal
microscope,1997.d01-624.x, Journal of Microscopy 185 (1997) 329-338.
[231] M. Guttenbach, R. Schakowski and M. Schmid Aneuploidy and ageing: sex
chromosome exclusion into micronuclei, Hum Genet 94 (1994) 295-298.
[232] J.C. Hando, J. Nath and J.D. Tucker Sex chromosomes, micronuclei and
aging in women, Chromosoma 103 (1994) 186-192.
[233] G.J. Gattas, A. Cardoso Lde, A. Medrado-Faria Mde and P.H. Saldanha
Frequency of oral mucosa micronuclei in gas station operators after
introducing methanol, Occup Med (Lond) 51 (2001) 107-113.
[234] Y. Ozkul, H. Donmez, A. Erenmemisoglu, H. Demirtas and N. Imamoglu
Induction of micronuclei by smokeless tobacco on buccal mucosa cells of
habitual users, Mutagenesis 12 (1997) 285-287.
[235] D. Pinto, J.M. Ceballos, G. Garcia, P. Guzman, L.M. Del Razo, E. Vera, H.
Gomez, A. Garcia and M.E. Gonsebatt Increased cytogenetic damage in
outdoor painters, Mutat Res 467 (2000) 105-111.
[236] D.M. Williams, Cruchley,A.T The structural aspects of ageing in the oral
mucosa In: The effect of ageing in oral mucosa and skin, CRC press, 1994.
[237] T. Burns, breathnack,S., Cox,N. Rook's textbook of Dermatology,
Oxford,UK:Blackwell Publishing, 2004.
[238] D.R. Thomas Age-related changes in wound healing, Drugs Aging 18 (2001)
607-620.
[239] N.J. Roizen and D. Patterson Down's syndrome, The Lancet 361 (2003) 1281-
1289.

References
282
[240] J. Korenberg, X. Chen, R. Schipper, Z. Sun, R. Gonsky, S. Gerwehr, N.
Carpenter, C. Daumer, P. Dignan, C. Disteche, J. Graham, Jr, L. Hudgins, B.
McGillivray, K. Miyazaki, N. Ogasawara, J. Park, R. Pagon, S. Pueschel, G.
Sack, B. Say, S. Schuffenhauer, S. Soukup and T. Yamanaka Down
Syndrome Phenotypes: The Consequences of Chromosomal Imbalance
, PNAS 91 (1994) 4997-5001.
[241] S.W. Maluf and B. Erdtmann Genomic instability in Down syndrome and
Fanconi anemia assessed by micronucleus analysis and single-cell gel
electrophoresis, Cancer Genet Cytogenet 124 (2001) 71-75.
[242] M.R. Scarfi, A. Cossarizza, D. Monti, F. Bersani, M. Zannotti, M.B. Lioi and C.
Franceschi Age-related increase of mitomycin C-induced micronuclei in
lymphocytes from Down's syndrome subjects, Mutat Res 237 (1990) 247-252.
[243] Q. Shi and R.W. King Chromosome nondisjunction yields tetraploid rather
than aneuploid cells in human cell lines, Nature 437 (2005) 1038-1042.
[244] D.W. Dickson Neuropathological diagnosis of Alzheimer's disease: a
perspective from longitudinal clinicopathological studies, Neurobiol Aging 18
(1997) S21-26.
[245] H. Braak and E. Braak Evolution of neuronal changes in the course of
Alzheimer's disease, J Neural Transm Suppl 53 (1998) 127-140.
[246] P. Thomas and M. Fenech A review of genome mutation and Alzheimer's
disease, Mutagenesis 22 (2007) 15-33.
[247] F. Trippi, N. Botto, R. Scarpato, L. Petrozzi, U. Bonuccelli, S. Latorraca, S.
Sorbi and L. Migliore Spontaneous and induced chromosome damage in
somatic cells of sporadic and familial Alzheimer's disease patients
Mutagenesis 16 (2001) 323-327.

References
283
[248] C.A. Squier and M.J. Kremer Biology of oral mucosa and esophagus, J Natl
Cancer Inst Monogr (2001) 7-15.
[249] M.W. Hill Epithelial proliferation and turn over in oral epithelia and epidermis
with age. In: the effects of ageing in the oral mucosa and skin, 1994.
[250] A. Moragas, C. Castells and M. Sans Mathematical morphologic analysis of
aging-related epidermal changes, Anal Quant Cytol Histol 15 (1993) 75-82.
[251] M.T. Hull and K.A. Warfel Age-related changes in the cutaneous basal lamina:
scanning electron microscopic study, J Invest Dermatol 81 (1983) 378-380.
[252] R.L. Neve, D.L. McPhie and Y. Chen Alzheimer's disease: a dysfunction of the
amyloid precursor protein(1), Brain Res 886 (2000) 54-66.
[253] H. Hattori, M. Matsumoto, K. Iwai, H. Tsuchiya, E. Miyauchi, M. Takasaki, K.
Kamino, J. Munehira, Y. Kimura, K. Kawanishi, T. Hoshino, H. Murai, H.
Ogata, H. Maruyama and H. Yoshida The tau protein of oral epithelium
increases in Alzheimer's disease, J Gerontol A Biol Sci Med Sci 57 (2002)
M64-70.
[254] M. Sashima, M. Satoh and A. Suzuki Oral senile amyloidosis in senescence
accelerated mouse (SAM), J Oral Pathol Med 19 (1990) 381-384.
[255] J. Hoffmann, C. Twiesselmann, M.P. Kummer, P. Romagnoli and V. Herzog A
possible role for the Alzheimer amyloid precursor protein in the regulation of
epidermal basal cell proliferation, Eur J Cell Biol 79 (2000) 905-914.
[256] S.J. Gerson, J. Meyer and D. Gandor Decreased zinc concentration does not
lead to atrophy of rat oral epithelium, J Nutr 115 (1985) 820-823.
[257] C.E. Joseph, S.H. Ashrafi and J.P. Waterhouse Structural changes in rabbit
oral epithelium caused by zinc deficiency, J Nutr 111 (1981) 53-57.

References
284
[258] D. Hsu, J. Meyer, S. Gerson and J. Daniel Sequence of changes in rat buccal
mucosa induced by zinc deficiency, J Oral Pathol Med 20 (1991) 443-448.
[259] A.I. Bush The metallobiology of Alzheimer's disease, Trends in Neurosciences
26 (2003) 207-214.
[260] P. Kruk, N. Rampino and V. Bohr DNA Damage and Repair in Telomeres:
Relation to Aging, PNAS 92 (1995) 258-262.
[261] J. O'Sullivan, R.A. Risques, M.T. Mandelson, L. Chen, T.A. Brentnall, M.P.
Bronner, M.P. Macmillan, Z. Feng, J.R. Siebert, J.D. Potter and P.S.
Rabinovitch Telomere length in the colon declines with age: a relation to
colorectal cancer?, Cancer Epidemiol Biomarkers Prev 15 (2006) 573-577.
[262] R.C. Allsopp, H. Vaziri, C. Patterson, S. Goldstein, E.V. Younglai, A.B.
Futcher, C.W. Greider and C.B. Harley Telomere length predicts replicative
capacity of human fibroblasts, Proc Natl Acad Sci U S A 89 (1992) 10114-
10118.
[263] J.M. Wong and K. Collins Telomere maintenance and disease, Lancet 362
(2003) 983-988.
[264] M.S. Rao and M.P. Mattson Stem cells and aging: expanding the possibilities,
Mech Ageing Dev 122 (2001) 713-734.
[265] R.J. Hodes Telomere length, aging, and somatic cell turnover, J Exp Med 190
(1999) 153-156.
[266] R.W. Frenck, Jr., E.H. Blackburn and K.M. Shannon The rate of telomere
sequence loss in human leukocytes varies with age, Proc Natl Acad Sci U S A
95 (1998) 5607-5610.
[267] T. Von Zglinicki Role of Oxidative Stress in Telomere Length Regulation and
Replicative Senescence, Ann NY Acad Sci 908 (2000) 99-110.

References
285
[268] J.N. O'Sullivan, M.P. Bronner, T.A. Brentnall, J.C. Finley, W.T. Shen, S.
Emerson, M.J. Emond, K.A. Gollahon, A.H. Moskovitz, D.A. Crispin, J.D.
Potter and P.S. Rabinovitch Chromosomal instability in ulcerative colitis is
related to telomere shortening, Nat Genet 32 (2002) 280-284.
[269] S.E. Artandi, S. Chang, S.-L. Lee, S. Alson, G.J. Gottlieb, L. Chin and R.A.
DePinho Telomere dysfunction promotes non-reciprocal translocations and
epithelial cancers in mice, 406 (2000) 641-645.
[270] N.J. Samani, R. Boultby, R. Butler, J.R. Thompson and A.H. Goodall
Telomere shortening in atherosclerosis, The Lancet 358 (2001) 472-473.
[271] E.C. Jenkins, M.T. Velinov, L. Ye, H. Gu, S. Li, E.C. Jenkins, Jr., S.S. Brooks,
D. Pang, D.A. Devenny, W.B. Zigman, N. Schupf and W.P. Silverman
Telomere shortening in T lymphocytes of older individuals with Down
syndrome and dementia, Neurobiol Aging 27 (2006) 941-945.
[272] M. de Arruda Cardoso Smith, B. Borsatto-Galera, R.I. Feller, A. Goncalves,
R.S. Oyama, R. Segato, E. Chen, G.M. Carvalheira, A.S. Filho, R.R. Burbano
and S.L. Payao Telomeres on chromosome 21 and aging in lymphocytes and
gingival fibroblasts from individuals with Down syndrome, J Oral Sci 46 (2004)
171-177.
[273] R.M. Cawthon Telomere measurement by quantitative PCR, Nucleic Acids
Res 30 (2002) e47.
[274] A. Collins, J. Cadet, B. Epe and C. Gedik Problems in the measurement of 8-
oxoguanine in human DNA. Report of a workshop, DNA oxidation, held in
Aberdeen, UK, 19-21 January, 1997, Carcinogenesis 18 (1997) 1833-1836.
[275] H.J. Helbock, K.B. Beckman, M.K. Shigenaga, P.B. Walter, A.A. Woodall, H.C.
Yeo and B.N. Ames DNA oxidation matters: the HPLC-electrochemical

References
286
detection assay of 8-oxo-deoxyguanosine and 8-oxo-guanine, Proc Natl Acad
Sci U S A 95 (1998) 288-293.
[276] T. Lu, Y. Pan, S.Y. Kao, C. Li, I. Kohane, J. Chan and B.A. Yankner Gene
regulation and DNA damage in the ageing human brain, Nature 429 (2004)
883-891.
[277] R.J. Callicott and J.E. Womack Real-time PCR assay for measurement of
mouse telomeres, Comp Med 56 (2006) 17-22.
[278] P.E. Slagboom, S. Droog and D.I. Boomsma Genetic determination of
telomere size in humans: a twin study of three age groups, Am J Hum Genet
55 (1994) 876-882.
[279] K. Prowse and C. Greider Developmental and Tissue-Specific Regulation of
Mouse Telomerase and Telomere Length, PNAS 92 (1995) 4818-4822.
[280] J.C.Y. Wang, J.K. Warner, N. Erdmann, P.M. Lansdorp, L. Harrington and J.E.
Dick Dissociation of telomerase activity and telomere length maintenance in
primitive human hematopoietic cells, PNAS 102 (2005) 14398-14403.
[281] O. Alvares, M.R. Skougaard, J.J. Pindborg and B. Roed-Petersen In vitro
incorporation of tritiated thymidine in oral homogeneous leukoplakias, Scand J
Dent Res 80 (1972) 510-514.
[282] D. Shemin and D. Rittenberg THE LIFE SPAN OF THE HUMAN RED BLOOD
CELL, J. Biol. Chem. 166 (1946) 627-636.
[283] G.M. Gillespie Renewal of buccal epithelium, Oral Surg Oral Med Oral Pathol
27 (1969) 83-89.
[284] D.C. Dale, W.C. Liles, C. Llewellyn and T.H. Price Effects of granulocyte-
macrophage colony-stimulating factor (GM-CSF) on neutrophil kinetics and
function in normal human volunteers, Am J Hematol 57 (1998) 7-15.

References
287
[285] J.D. Robertson, R.E. Gale, R.F. Wynn, M. Dougal, D.C. Linch, N.G. Testa and
R. Chopra Dynamics of telomere shortening in neutrophils and T lymphocytes
during ageing and the relationship to skewed X chromosome inactivation
patterns, Br J Haematol 109 (2000) 272-279.
[286] H.G. Kuhn, H. Dickinson-Anson and F.H. Gage Neurogenesis in the dentate
gyrus of the adult rat: age-related decrease of neuronal progenitor
proliferation, J Neurosci 16 (1996) 2027-2033.
[287] P.S. Eriksson, E. Perfilieva, T. Bjork-Eriksson, A.M. Alborn, C. Nordborg, D.A.
Peterson and F.H. Gage Neurogenesis in the adult human hippocampus, Nat
Med 4 (1998) 1313-1317.
[288] S. Gonzalo, I. Jaco, M.F. Fraga, T. Chen, E. Li, M. Esteller and M.A. Blasco
DNA methyltransferases control telomere length and telomere recombination
in mammalian cells, Nat Cell Biol 8 (2006) 416-424.
[289] M.A. Blasco The epigenetic regulation of mammalian telomeres, 8 (2007)
299-309.
[290] A.T. Du, N. Schuff, D. Amend, M.P. Laakso, Y.Y. Hsu, W.J. Jagust, K. Yaffe,
J.H. Kramer, B. Reed, D. Norman, H.C. Chui and M.W. Weiner Magnetic
resonance imaging of the entorhinal cortex and hippocampus in mild cognitive
impairment and Alzheimer's disease, J Neurol Neurosurg Psychiatry 71 (2001)
441-447.
[291] V. Haroutunian, D.P. Perl, D.P. Purohit, D. Marin, K. Khan, M. Lantz, K.L.
Davis and R.C. Mohs Regional Distribution of Neuritic Plaques in the
Nondemented Elderly and Subjects With Very Mild Alzheimer Disease
Arch Neurol 55 (1998) 1185-1191.
References
288
[292] A.J. Hunt and J.R. McIntosh The dynamic behavior of individual microtubules
associated with chromosomes in vitro, Mol Biol Cell 9 (1998) 2857-2871.
[293] D.A. Devenny, J. Wegiel, N. Schupf, E. Jenkins, W. Zigman, S.J. Krinsky-
McHale and W.P. Silverman Dementia of the Alzheimer's Type and
Accelerated Aging in Down Syndrome, Sci. Aging Knowl. Environ. 2005
(2005) dn1-.
[294] M. Franceschi, M. Comola, F. Piattoni, W. Gualandri and N. Canal Prevalence
of dementia in adult patients with trisomy 21, Am J Med Genet Suppl 7 (1990)
306-308.
[295] L. Migliore, G. Boni, R. Bernardini, F. Trippi, R. Colognato, I. Fontana, F.
Coppede and I. Sbrana Susceptibility to chromosome malsegregation in
lymphocytes of women who had a Down syndrome child in young age,
Neurobiology of Aging 27 (2006) 710-716.
[296] C.A. Evers, Starr, Lisa Biology:Concepts and Applications, Thompson, United
States, 2006.
[297] I. Dunham, C. Lengauer, T. Cremer and T. Featherstone Rapid generation of
chromosome-specific alphoid DNA probes using the polymerase chain
reaction, Hum Genet 88 (1992) 457-462.
[298] J.S. Waye and H.F. Willard Structure, organization, and sequence of alpha
satellite DNA from human chromosome 17: evidence for evolution by unequal
crossing-over and an ancestral pentamer repeat shared with the human X
chromosome, Mol Cell Biol 6 (1986) 3156-3165.
[299] D.A. Eastmond and D. Pinkel Detection of aneuploidy and aneuploidy-
inducing agents in human lymphocytes using fluorescence in situ hybridization
with chromosome-specific DNA probes, Mutat Res 234 (1990) 303-318.

References
289
[300] D. Pinkel, J. Landegent, C. Collins, J. Fuscoe, R. Segraves, J. Lucas and J.
Gray Fluorescence in situ hybridization with human chromosome-specific
libraries: detection of trisomy 21 and translocations of chromosome 4, Proc
Natl Acad Sci U S A 85 (1988) 9138-9142.
[301] Q. Shi, I.D. Adler, J. Zhang, X. Zhang, X. Shan and R. Martin Incidence of
mosaic cell lines in vivo and malsegregation of chromosome 21 in
lymphocytes in vitro of trisomy 21 patients: detection by fluorescence in situ
hybridization on binucleated lymphocytes, Hum Genet 106 (2000) 29-35.
[302] N.S. Edmund C. Jenkins, Marilyn Genovese, Ling Ling Ye, Deborah Kapell,
Basilisa Canto, Marsha Harris, Darlynne Devenny, Joseph H. Lee, W. Ted
Brown, Increased low-level chromosome 21 mosaicism in older individuals
with Down syndrome, American Journal of Medical Genetics 68 (1997) 147-
151.
[303] I. Nishimoto A new paradigm for neurotoxicity by FAD mutants of betaAPP: a
signaling abnormality, Neurobiol Aging 19 (1998) S33-38.
[304] Y. Senechal, Larmet, Y., Dev,K.K. Unraveling in vivo Functions of Amyloid
Precursor Protein: Insights from Knockout and Knockdown Studies,
Neurodegenerative Diseases 3 (2006) 134-147.
[305] N. Schupf, D. Kapell, J.H. Lee, R. Ottman and R. Mayeux Increased risk of
Alzheimer's disease in mothers of adults with Down's syndrome, Lancet 344
(1994) 353-356.
[306] P. Rakic Limits of neurogenesis in primates, Science 227 (1985) 1054-1056.
[307] M.B. Petersen, G. Karadima, M. Samaritaki, D. Avramopoulos, D.
Vassilopoulos and M. Mikkelsen Association between presenilin-1
References
290
polymorphism and maternal meiosis II errors in Down syndrome, Am J Med
Genet 93 (2000) 366-372.
[308] M. Yamada, N. Sodeyama, Y. Itoh, N. Suematsu, E. Otomo, M. Matsushita
and H. Mizusawa Association of presenilin-1 polymorphism with cerebral
amyloid angiopathy in the elderly, Stroke 28 (1997) 2219-2221.
[309] j. Tyrrel, Cosgrave,M., Hawi, Z., Mcpherson,J., Lawlor, B., Gill,M. A protective
effect of apolipoprotein E e2 allele on dementia in Down's syndrome, Biol
Psychiatr 43 (1998) 397-400.
[310] D.M. Holtzman Alzheimer disease and Down syndrome, Cytogenet Cell Genet
77(Suppl 1) (1997).
[311] D. Avramopoulos, M. Mikkelsen, D. Vassilopoulos, M. Grigoriadou and M.B.
Petersen Apolipoprotein E allele distribution in parents of Down's syndrome
children, Lancet 347 (1996) 862-865.
[312] C.A. Hobbs, S.L. Sherman, P. Yi, S.E. Hopkins, C.P. Torfs, R.J. Hine, M.
Pogribna, R. Rozen and S.J. James Polymorphisms in genes involved in
folate metabolism as maternal risk factors for Down syndrome, Am J Hum
Genet 67 (2000) 623-630.
[313] V.B. O'Leary, A. Parle-McDermott, A.M. Molloy, P.N. Kirke, Z. Johnson, M.
Conley, J.M. Scott and J.L. Mills MTRR and MTHFR polymorphism: link to
Down syndrome?, Am J Med Genet 107 (2002) 151-155.
[314] S.W. Choi and J.B. Mason Folate status: effects on pathways of colorectal
carcinogenesis, J Nutr 132 (2002) 2413S-2418S.
[315] S.W. Choi and J.B. Mason Folate and carcinogenesis: an integrated scheme,
J Nutr 130 (2000) 129-132.

References
291
[316] B.C. Blount and B.N. Ames DNA damage in folate deficiency, Baillieres Clin
Haematol 8 (1995) 461-478.
[317] B.C. Blount, M.M. Mack, C.M. Wehr, J.T. MacGregor, R.A. Hiatt, G. Wang,
S.N. Wickramasinghe, R.B. Everson and B.N. Ames Folate deficiency causes
uracil misincorporation into human DNA and chromosome breakage:
implications for cancer and neuronal damage, Proc Natl Acad Sci U S A 94
(1997) 3290-3295.
[318] E. Calvaresi and J. Bryan B vitamins, cognition, and aging: a review, J
Gerontol B Psychol Sci Soc Sci 56 (2001) P327-339.
[319] S. Beetstra, P. Thomas, C. Salisbury, J. Turner and M. Fenech Folic acid
deficiency increases chromosomal instability, chromosome 21 aneuploidy and
sensitivity to radiation-induced micronuclei, Mutat Res 578 (2005) 317-326.
[320] G. Ravaglia, P. Forti, F. Maioli, M. Martelli, L. Servadei, N. Brunetti, E.
Porcellini and F. Licastro Homocysteine and folate as risk factors for dementia
and Alzheimer disease, Am J Clin Nutr 82 (2005) 636-643.
[321] P.I. Ho, S.C. Collins, S. Dhitavat, D. Ortiz, D. Ashline, E. Rogers and T.B.
Shea Homocysteine potentiates beta-amyloid neurotoxicity: role of oxidative
stress, J Neurochem 78 (2001) 249-253.
[322] X. Sai, Y. Kawamura, K. Kokame, H. Yamaguchi, H. Shiraishi, R. Suzuki, T.
Suzuki, M. Kawaichi, T. Miyata, T. Kitamura, B. De Strooper, K. Yanagisawa
and H. Komano Endoplasmic Reticulum Stress-inducible Protein, Herp,
Enhances Presenilin-mediated Generation of Amyloid beta -Protein, J. Biol.
Chem. 277 (2002) 12915-12920.
[323] D.J. Gaughan, L.A. Kluijtmans, S. Barbaux, D. McMaster, I.S. Young, J.W.
Yarnell, A. Evans and A.S. Whitehead The methionine synthase reductase

References
292
(MTRR) A66G polymorphism is a novel genetic determinant of plasma
homocysteine concentrations, Atherosclerosis 157 (2001) 451-456.
[324] M.F. Fenech, I.E. Dreosti and J.R. Rinaldi Folate, vitamin B12, homocysteine
status and chromosome damage rate in lymphocytes of older men,
Carcinogenesis 18 (1997) 1329-1336.
[325] C. Lasseur, F. Parrot, Y. Delmas, C. Level, C. Ged, I. Redonnet-Vernhet, D.
Montaudon, C. Combe and P. Chauveau Impact of high-flux/high-efficiency
dialysis on folate and homocysteine metabolism, J Nephrol 14 (2001) 32-35.
[326] E. Joosten, E. Lesaffre, R. Riezler, V. Ghekiere, L. Dereymaeker, W.
Pelemans and E. Dejaeger Is metabolic evidence for vitamin B-12 and folate
deficiency more frequent in elderly patients with Alzheimer's disease?, J
Gerontol A Biol Sci Med Sci 52 (1997) M76-79.
[327] H.X. Wang, A. Wahlin, H. Basun, J. Fastbom, B. Winblad and L. Fratiglioni
Vitamin B12 and folate in relation to the development of Alzheimer's disease,
Neurology 56 (2001) 1188-1194.
[328] J. Selhub, L.C. Bagley, J. Miller and I.H. Rosenberg B vitamins, homocysteine,
and neurocognitive function in the elderly1, Am J Clin Nutr 71 (2000) 614s-
620.
[329] B. Fowler Genetic defects of folate and cobalamin metabolism, Eur J Pediatr
157 Suppl 2 (1998) S60-66.
[330] A.C. Antony The biological chemistry of folate receptors, Blood 79 (1992)
2807-2820.
[331] N. Habibzadeh, C.J. Schorah, M.J. Seller, R.W. Smithells and M.I. Levene
Uptake and utilization of DL-5-[methyl-14C] tetrahydropteroylmonoglutamate

References
293
by cultured cytotrophoblasts associated with neural tube defects, Proc Soc
Exp Biol Med 203 (1993) 45-54.
[332] A. McCaddon, B. Regland, P. Hudson and G. Davies Functional vitamin B(12)
deficiency and Alzheimer disease, Neurology 58 (2002) 1395-1399.
[333] R.J. Castellani, P.L. Harris, L.M. Sayre, J. Fujii, N. Taniguchi, M.P. Vitek, H.
Founds, C.S. Atwood, G. Perry and M.A. Smith Active glycation in
neurofibrillary pathology of Alzheimer disease: N(epsilon)-(carboxymethyl)
lysine and hexitol-lysine, Free Radic Biol Med 31 (2001) 175-180.
[334] M. Pogribna, S. Melnyk, I. Pogribny, A. Chango, P. Yi and S.J. James
Homocysteine metabolism in children with Down syndrome: in vitro
modulation, Am J Hum Genet 69 (2001) 88-95.
[335] B. Aguilar, J.C. Rojas and M.T. Collados Metabolism of homocysteine and its
relationship with cardiovascular disease, J Thromb Thrombolysis 18 (2004)
75-87.
[336] J.W. Miller Assessing the association between vitamin B-12 status and
cognitive function in older adults, Am J Clin Nutr 84 (2006) 1259-1260.
[337] C. McCracken, P. Hudson, R. Ellis and A. McCaddon Methylmalonic acid and
cognitive function in the Medical Research Council Cognitive Function and
Ageing Study, Am J Clin Nutr 84 (2006) 1406-1411.
[338] J.W. Miller Homocysteine and Alzheimer's disease, Nutr Rev 57 (1999) 126-
129.
[339] J.W. Miller Homocysteine, Alzheimer's disease, and cognitive function,
Nutrition 16 (2000) 675-677.

References
294
[340] P.I. Ho, D. Ortiz, E. Rogers and T.B. Shea Multiple aspects of homocysteine
neurotoxicity: glutamate excitotoxicity, kinase hyperactivation and DNA
damage, J Neurosci Res 70 (2002) 694-702.
[341] J.A. Schneider, D.C. Rees, Y.T. Liu and J.B. Clegg Worldwide distribution of a
common methylenetetrahydrofolate reductase mutation, Am J Hum Genet 62
(1998) 1258-1260.
[342] N.M. van der Put, F. Gabreels, E.M. Stevens, J.A. Smeitink, F.J. Trijbels, T.K.
Eskes, L.P. van den Heuvel and H.J. Blom A second common mutation in the
methylenetetrahydrofolate reductase gene: an additional risk factor for neural-
tube defects?, Am J Hum Genet 62 (1998) 1044-1051.
[343] P.L. Rady, S. Szucs, J. Grady, S.D. Hudnall, L.H. Kellner, H. Nitowsky, S.K.
Tyring and R.K. Matalon Genetic polymorphisms of methylenetetrahydrofolate
reductase (MTHFR) and methionine synthase reductase (MTRR) in ethnic
populations in Texas; a report of a novel MTHFR polymorphic site, G1793A,
Am J Med Genet 107 (2002) 162-168.
[344] C.J. Piyathilake, M. Macaluso, R.J. Hine, D.W. Vinter, E.W. Richards and C.L.
Krumdieck Cigarette smoking, intracellular vitamin deficiency, and occurrence
of micronuclei in epithelial cells of the buccal mucosa, Cancer Epidemiol
Biomarkers Prev 4 (1995) 751-758.
[345] N. Bresgen, G. Karlhuber, I. Krizbai, H. Bauer, H.C. Bauer and P.M. Eckl
Oxidative stress in cultured cerebral endothelial cells induces chromosomal
aberrations, micronuclei, and apoptosis, J Neurosci Res 72 (2003) 327-333.
[346] J. Gotz, F. Chen, J. van Dorpe and R.M. Nitsch Formation of Neurofibrillary
Tangles in P301L Tau Transgenic Mice Induced by Abeta 42 Fibrils, Science
293 (2001) 1491-1495.

References
295
[347] C. Hock, U. Konietzko, J.R. Streffer, J. Tracy, A. Signorell, B. Muller-
Tillmanns, U. Lemke, K. Henke, E. Moritz, E. Garcia, M.A. Wollmer, D.
Umbricht, D.J.F. de Quervain, M. Hofmann, A. Maddalena, A.
Papassotiropoulos and R.M. Nitsch Antibodies against [beta]-Amyloid Slow
Cognitive Decline in Alzheimer's Disease, Neuron 38 (2003) 547-554.
[348] J. Naslund, V. Haroutunian, R. Mohs, K.L. Davis, P. Davies, P. Greengard and
J.D. Buxbaum Correlation Between Elevated Levels of Amyloid {beta}-Peptide
in the Brain and Cognitive Decline, JAMA 283 (2000) 1571-1577.
[349] P.I. Moreira, M.A. Smith, X. Zhu, K. Honda, H.G. Lee, G. Aliev and G. Perry
Oxidative damage and Alzheimer's disease: are antioxidant therapies useful?,
Drug News Perspect 18 (2005) 13-19.
[350] S.J. van Rensburg, J.M. van Zyl, F.C. Potocnik, W.M. Daniels, J. Uys, L.
Marais, D. Hon, B.J. van der Walt and R.T. Erasmus The effect of stress on
the antioxidative potential of serum: implications for Alzheimer's disease,
Metab Brain Dis 21 (2006) 171-179.
[351] G.P. Lim, T. Chu, F. Yang, W. Beech, S.A. Frautschy and G.M. Cole The curry
spice curcumin reduces oxidative damage and amyloid pathology in an
Alzheimer transgenic mouse, J Neurosci 21 (2001) 8370-8377.
[352] M. Ganguli, V. Chandra, M.I. Kamboh, J.M. Johnston, H.H. Dodge, B.K.
Thelma, R.C. Juyal, R. Pandav, S.H. Belle and S.T. DeKosky Apolipoprotein E
polymorphism and Alzheimer disease: The Indo-US Cross-National Dementia
Study, Arch Neurol 57 (2000) 824-830.
[353] S.K. Biswas, D. McClure, L.A. Jimenez, I.L. Megson and I. Rahman Curcumin
induces glutathione biosynthesis and inhibits NF-kappaB activation and

References
296
interleukin-8 release in alveolar epithelial cells: mechanism of free radical
scavenging activity, Antioxid Redox Signal 7 (2005) 32-41.
[354] F. Yang, G.P. Lim, A.N. Begum, O.J. Ubeda, M.R. Simmons, S.S.
Ambegaokar, P.P. Chen, R. Kayed, C.G. Glabe, S.A. Frautschy and G.M.
Cole Curcumin inhibits formation of amyloid beta oligomers and fibrils, binds
plaques, and reduces amyloid in vivo, J Biol Chem 280 (2005) 5892-5901.
[355] A. Wu, Z. Ying and F. Gomez-Pinilla Dietary curcumin counteracts the
outcome of traumatic brain injury on oxidative stress, synaptic plasticity, and
cognition, Exp Neurol 197 (2006) 309-317.
[356] S.A. Frautschy, W. Hu, P. Kim, S.A. Miller, T. Chu, M.E. Harris-White and
G.M. Cole Phenolic anti-inflammatory antioxidant reversal of Abeta-induced
cognitive deficits and neuropathology, Neurobiol Aging 22 (2001) 993-1005.
[357] B.L. Zhao, X.J. Li, R.G. He, S.J. Cheng and W.J. Xin Scavenging effect of
extracts of green tea and natural antioxidants on active oxygen radicals, Cell
Biophys 14 (1989) 175-185.
[358] S. Martin-Aragon, J.M. Benedi and A.M. Villar Modifications on antioxidant
capacity and lipid peroxidation in mice under fraxetin treatment, J Pharm
Pharmacol 49 (1997) 49-52.
[359] D. Bagchi, M. Bagchi, S.J. Stohs, D.K. Das, S.D. Ray, C.A. Kuszynski, S.S.
Joshi and H.G. Pruess Free radicals and grape seed proanthocyanidin extract:
importance in human health and disease prevention, Toxicology 148 (2000)
187-197.
[360] D. Bagchi, C.K. Sen, S.D. Ray, D.K. Das, M. Bagchi, H.G. Preuss and J.A.
Vinson Molecular mechanisms of cardioprotection by a novel grape seed

References
297
proanthocyanidin extract, Mutation Research/Fundamental and Molecular
Mechanisms of Mutagenesis 523-524 (2003) 87-97.
[361] S.L. Nuttall, M.J. Kendall, E. Bombardelli and P. Morazzoni An evaluation of
the antioxidant activity of a standardized grape seed extract, Leucoselect®,
Journal of Clinical Pharmacy and Therapeutics 23 (1998) 385-389.
[362] Y. Feng, Y.M. Liu, J.D. Fratkins and M.H. LeBlanc Grape seed extract
suppresses lipid peroxidation and reduces hypoxic ischemic brain injury in
neonatal rats, Brain Res Bull 66 (2005) 120-127.
[363] M. Balu, P. Sangeetha, G. Murali and C. Panneerselvam Modulatory role of
grape seed extract on age-related oxidative DNA damage in central nervous
system of rats, Brain Res Bull 68 (2006) 469-473.
[364] A. Sugisawa, S. Inoue and K. Umegaki Grape seed extract prevents H(2)O(2)-
induced chromosomal damage in human lymphoblastoid cells, Biol Pharm Bull
27 (2004) 1459-1461.
[365] W.V. Nikolic, Y. Bai, D. Obregon, H. Hou, T. Mori, J. Zeng, J. Ehrhart, R.D.
Shytle, B. Giunta, D. Morgan, T. Town and J. Tan Transcutaneous beta-
amyloid immunization reduces cerebral beta-amyloid deposits without T cell
infiltration and microhemorrhage, Proc Natl Acad Sci U S A 104 (2007) 2507-
2512.
[366] J.L. Jankowsky, D.J. Fadale, J. Anderson, G.M. Xu, V. Gonzales, N.A.
Jenkins, N.G. Copeland, M.K. Lee, L.H. Younkin, S.L. Wagner, S.G. Younkin
and D.R. Borchelt Mutant presenilins specifically elevate the levels of the 42
residue {beta}-amyloid peptide in vivo: evidence for augmentation of a 42-
specific {gamma} secretase, Hum. Mol. Genet. 13 (2004) 159-170.

References
298
[367] D.R. Borchelt, G. Thinakaran, C.B. Eckman, M.K. Lee, F. Davenport, T.
Ratovitsky, C.M. Prada, G. Kim, S. Seekins, D. Yager, H.H. Slunt, R. Wang,
M. Seeger, A.I. Levey, S.E. Gandy, N.G. Copeland, N.A. Jenkins, D.L. Price,
S.G. Younkin and S.S. Sisodia Familial Alzheimer's disease-linked presenilin 1
variants elevate Abeta1-42/1-40 ratio in vitro and in vivo, Neuron 17 (1996)
1005-1013.
[368] J.L. Jankowsky, H.H. Slunt, T. Ratovitski, N.A. Jenkins, N.G. Copeland and
D.R. Borchelt Co-expression of multiple transgenes in mouse CNS: a
comparison of strategies, Biomolecular Engineering 17 (2001) 157-165.
[369] D.R. Borchelt, T. Ratovitski, J. van Lare, M.K. Lee, V. Gonzales, N.A. Jenkins,
N.G. Copeland, D.L. Price and S.S. Sisodia Accelerated Amyloid Deposition in
the Brains of Transgenic Mice Coexpressing Mutant Presenilin 1 and Amyloid
Precursor Proteins, Neuron 19 (1997) 939-945.
[370] D.R. Borchelt, G. Thinakaran, C.B. Eckman, M.K. Lee, F. Davenport, T.
Ratovitsky, C.-M. Prada, G. Kim, S. Seekins, D. Yager, H.H. Slunt, R. Wang,
M. Seeger, A.I. Levey, S.E. Gandy, N.G. Copeland, N.A. Jenkins, D.L. Price,
S.G. Younkin and S.S. Sisodia Familial Alzheimer's Disease-Linked Presenilin
1 Variants Elevate A[beta]1-42/1-40 Ratio In Vitro and In Vivo, Neuron 17
(1996) 1005-1013.
[371] Y.J. Wang, Pollard, A.N, Zhou, H.D, Zhong,J.H, Zhou,X.F Charecterization of
an Alzheimer's disease mouse model bearing mutant genes of amyloid
precursor protein and human presenilin 1, Submitted (2007).
[372] J. Castillo, O. Benavente-Garcia, J. Lorente, M. Alcaraz, A. Redondo, A.
Ortuno and J.A. Del Rio Antioxidant activity and radioprotective effects against
chromosomal damage induced in vivo by X-rays of flavan-3-ols (Procyanidins)

References
299
from grape seeds (Vitis vinifera): comparative study versus other phenolic and
organic compounds, J Agric Food Chem 48 (2000) 1738-1745.
[373] M. Srinivasan, N. Rajendra Prasad and V.P. Menon Protective effect of
curcumin on gamma-radiation induced DNA damage and lipid peroxidation in
cultured human lymphocytes, Mutat Res 611 (2006) 96-103.
[374] R. Parshad, K.K. Sanford, F.M. Price, V.E. Steele, R.E. Tarone, G.J. Kelloff
and C.W. Boone Protective action of plant polyphenols on radiation-induced
chromatid breaks in cultured human cells, Anticancer Res 18 (1998) 3263-
3266.
[375] R.A. Sharma, A.J. Gescher and W.P. Steward Curcumin: the story so far, Eur
J Cancer 41 (2005) 1955-1968.
[376] N. Sreejayan and M.N. Rao Free radical scavenging activity of curcuminoids,
Arzneimittelforschung 46 (1996) 169-171.
[377] Sreejayan and M.N. Rao Nitric oxide scavenging by curcuminoids, J Pharm
Pharmacol 49 (1997) 105-107.
[378] J. Castillo, O. Benavente-Garcia, M.J. Del Bano, J. Lorente, M. Alcaraz and
M.J. Dato Radioprotective Effects Against Chromosomal Damage Induced in
Human Lymphocytes by gamma-Rays as a Function of Polymerization Grade
of Grape Seed Extracts, J Med Food 4 (2001) 117-123.
[379] O. Benavente-Garcia, J. Castillo, F.R. Marin, A. Ortuno and J.A. Del Rio Uses
and Properties of Citrus Flavonoids, J. Agric. Food Chem. 45 (1997) 4505-
4515.
[380] A.C. Reddy and B.R. Lokesh Effect of dietary turmeric (Curcuma longa) on
iron-induced lipid peroxidation in the rat liver, Food Chem Toxicol 32 (1994)
279-283.

References
300
[381] M. Balu, P. Sangeetha, D. Haripriya and C. Panneerselvam Rejuvenation of
antioxidant system in central nervous system of aged rats by grape seed
extract, Neurosci Lett 383 (2005) 295-300.
[382] M. Dikshit, L. Rastogi, R. Shukla and R.C. Srimal Prevention of ischaemia-
induced biochemical changes by curcumin & quinidine in the cat heart, Indian
J Med Res 101 (1995) 31-35.
[383] I. Rahman and W. MacNee Role of transcription factors in inflammatory lung
diseases, Thorax 53 (1998) 601-612.
[384] I. Rahman and W. MacNee Regulation of redox glutathione levels and gene
transcription in lung inflammation: therapeutic approaches, Free Radic Biol
Med 28 (2000) 1405-1420.
[385] I. Rahman and W. MacNee Oxidative stress and regulation of glutathione in
lung inflammation, Eur Respir J 16 (2000) 534-554.
[386] M.C.W. Myhrstad, H. Carlsen, O. Nordstrom, R. Blomhoff and J.O. Moskaug
Flavonoids increase the intracellular glutathione level by transactivation of the
[gamma]-glutamylcysteine synthetase catalytical subunit promoter, Free
Radical Biology and Medicine 32 (2002) 386-393.
[387] V. Calabrese, D. Boyd-Kimball, G. Scapagnini and D.A. Butterfield Nitric oxide
and cellular stress response in brain aging and neurodegenerative disorders:
the role of vitagenes, In Vivo 18 (2004) 245-267.
[388] V. Calabrese, G. Scapagnini, A. Ravagna, R.G. Fariello, A.M. Giuffrida Stella
and N.G. Abraham Regional distribution of heme oxygenase, HSP70, and
glutathione in brain: relevance for endogenous oxidant/antioxidant balance
and stress tolerance, J Neurosci Res 68 (2002) 65-75.

References
301
[389] K.D. Poss and S. Tonegawa Reduced stress defense in heme oxygenase 1-
deficient cells, Proc Natl Acad Sci U S A 94 (1997) 10925-10930.
[390] G. Scapagnini, C. Colombrita, M. Amadio, V. D'Agata, E. Arcelli, M. Sapienza,
A. Quattrone and V. Calabrese Curcumin activates defensive genes and
protects neurons against oxidative stress, Antioxid Redox Signal 8 (2006) 395-
403.
[391] Y. Yilmaz and R.T. Toledo Health aspects of functional grape seed
constituents, Trends in Food Science & Technology 15 (2004) 422-433.
[392] J. Yamakoshi, M. Saito, S. Kataoka and S. Tokutake Procyanidin-rich extract
from grape seeds prevents cataract formation in hereditary cataractous (ICR/f)
rats, J Agric Food Chem 50 (2002) 4983-4988.

Appendix
302
10 Appendix: Paper Reprints

Thomas, P. and Fenech, M. (2007) A review of genome mutation and Alzheimer's disease. Mutagenesis v. 22 (1) pp. 15-33, January 2007
NOTE: This publication is included in the print copy of the thesis
held in the University of Adelaide Library.
It is also available online to authorised users at:
http://dx.doi.org/10.1093/mutage/gel055

Thomas, P., Harvey, S., Gruner, T. and Fenech, M. (2007) The buccal cytome and micronucleus frequency is substantially altered in Down's syndrome and normal ageing compared to young healthy controls. Mutation Research, v. 638 (1-2) pp. 37-47, February 2008
NOTE: This publication is included in the print copy of the thesis
held in the University of Adelaide Library.
It is also available online to authorised users at:
http://dx.doi.org/10.1016/j.mrfmmm.2007.08.012

Thomas, P., Hecker, J., Faunt, J. and Fenech, M. (2007) Buccal micronucleus cytome biomarkers may be associated with Alzheimer's disease. Mutagenesis v. 22 (6) pp. 371-379, November 2007
NOTE: This publication is included in the print copy of the thesis
held in the University of Adelaide Library.
It is also available online to authorised users at:
http://dx.doi.org/10.1093/mutage/gem029
Related Documents


