Changes in algal, coral and fish assemblages along water quality gradients on the inshore Great Barrier Reef Katharina Fabricius a,b, * , Glenn DeÕath a,b , Laurence McCook c , Emre Turak a , David McB. Williams a,b a Australian Institute of Marine Science, PMB No. 3, Townsville MC, Qld 4810, Australia b CRC Reef Research Centre, P.O. Box 772, Townsville, Qld 4810, Australia c Great Barrier Reef Marine Park Authority, P.O. Box 1379, Townsville, Qld 4810, Australia Abstract Macroalgae, hard corals, octocorals, and fish were surveyed on 10 to 13 inshore coral reefs of the Great Barrier Reef, along a water quality gradient in two regions with contrasting agricultural land use. A water quality index was calculated for each reef based on available data of particulate and dissolved nutrients, chlorophyll and suspended solids. Strong gradients in ecological attributes occurred along the water quality gradient. Macroalgae of the divisions Rhodophyta and Chlorophyta increased with increasing nutrients, while Phaeophyta remained similar. Octocoral richness and abundances of many hard coral and octocoral taxa decreased, and none of the hundreds of species increased. At reefs in higher nutrient environments, hard coral and octocoral assemblages were composed of subsets of the many species found in lower nutrient environments, whereas fish and macroalgal assemblages consisted of contrasting suites of species. The study identifies species groups that are likely to increase or decrease in abundance with changing water quality. Crown Copyright Ó 2004 Published by Elsevier Ltd. All rights reserved. Keywords: Nutrient enrichment; Sedimentation; Coral reef; Macroalgae; Hard coral; Octocoral; Fish; Biodiversity 1. Introduction Evidence that nutrient enrichment, increased siltation and excess turbidity can lead to the local degradation of coral reefs is unequivocal (Smith, 1981; Hunter and Evans, 1995; Grigg, 1995; Stimson and Larned, 2000; Stimson et al., 2001; Loya et al., 2004; review in Fabri- cius, in press). Field studies suggest that areas down- stream of well-defined point sources are characterized by (a) low or locally reduced coral biodiversity, (b) low (or failed) coral recruitment, (c) high rates of partial mortality, (d) reduced skeletal density, (e) reduced depth distribution, (f) high rates of bioerosion, and (g) a tran- sition of hard coral dominated communities to commu- nities dominated by non-reef building organisms, especially turfing and fleshy macroalgae (Montaggioni et al., 1993; West and Van Woesik, 2001, review by Schaffelke et al., in press), and filter feeders (Smith, 1981; Birkeland, 1988). While pollution effects on coral reefs at local scales are well understood, links at regional scales between increasing sediment and nutrient loads in rivers, and the degradation of coral reefs, have been more difficult to demonstrate (Fabricius and DeÕath, 2004). This is due to a lack of historic data and the confounding effects of other disturbances such as bleaching, cyclones, fishing pressure and outbreaks of the coral eating crown-of- thorns starfish (Acanthaster planci), and is further com- plicated by the naturally high variability in monsoonal 0025-326X/$ - see front matter Crown Copyright Ó 2004 Published by Elsevier Ltd. All rights reserved. doi:10.1016/j.marpolbul.2004.10.041 * Corresponding author. Address: Australian Institute of Marine Science, PMB No. 3, Townsville MC, Qld 4810, Australia. Tel./fax: +61 7 4772 5852. E-mail address: [email protected] (K. Fabricius). www.elsevier.com/locate/marpolbul Marine Pollution Bulletin 51 (2005) 384–398

Welcome message from author
This document is posted to help you gain knowledge. Please leave a comment to let me know what you think about it! Share it to your friends and learn new things together.
Transcript
www.elsevier.com/locate/marpolbul
Marine Pollution Bulletin 51 (2005) 384–398
Changes in algal, coral and fish assemblages along waterquality gradients on the inshore Great Barrier Reef
Katharina Fabricius a,b,*, Glenn De�ath a,b, Laurence McCook c,Emre Turak a, David McB. Williams a,b
a Australian Institute of Marine Science, PMB No. 3, Townsville MC, Qld 4810, Australiab CRC Reef Research Centre, P.O. Box 772, Townsville, Qld 4810, Australia
c Great Barrier Reef Marine Park Authority, P.O. Box 1379, Townsville, Qld 4810, Australia
Abstract
Macroalgae, hard corals, octocorals, and fish were surveyed on 10 to 13 inshore coral reefs of the Great Barrier Reef, along a
water quality gradient in two regions with contrasting agricultural land use. A water quality index was calculated for each reef based
on available data of particulate and dissolved nutrients, chlorophyll and suspended solids. Strong gradients in ecological attributes
occurred along the water quality gradient. Macroalgae of the divisions Rhodophyta and Chlorophyta increased with increasing
nutrients, while Phaeophyta remained similar. Octocoral richness and abundances of many hard coral and octocoral taxa decreased,
and none of the hundreds of species increased. At reefs in higher nutrient environments, hard coral and octocoral assemblages were
composed of subsets of the many species found in lower nutrient environments, whereas fish and macroalgal assemblages consisted
of contrasting suites of species. The study identifies species groups that are likely to increase or decrease in abundance with changing
water quality.
Crown Copyright � 2004 Published by Elsevier Ltd. All rights reserved.
Keywords: Nutrient enrichment; Sedimentation; Coral reef; Macroalgae; Hard coral; Octocoral; Fish; Biodiversity
1. Introduction
Evidence that nutrient enrichment, increased siltation
and excess turbidity can lead to the local degradation of
coral reefs is unequivocal (Smith, 1981; Hunter and
Evans, 1995; Grigg, 1995; Stimson and Larned, 2000;
Stimson et al., 2001; Loya et al., 2004; review in Fabri-
cius, in press). Field studies suggest that areas down-
stream of well-defined point sources are characterizedby (a) low or locally reduced coral biodiversity, (b)
low (or failed) coral recruitment, (c) high rates of partial
mortality, (d) reduced skeletal density, (e) reduced depth
0025-326X/$ - see front matter Crown Copyright � 2004 Published by Elsedoi:10.1016/j.marpolbul.2004.10.041
* Corresponding author. Address: Australian Institute of Marine
Science, PMB No. 3, Townsville MC, Qld 4810, Australia. Tel./fax:
+61 7 4772 5852.
E-mail address: [email protected] (K. Fabricius).
distribution, (f) high rates of bioerosion, and (g) a tran-sition of hard coral dominated communities to commu-
nities dominated by non-reef building organisms,
especially turfing and fleshy macroalgae (Montaggioni
et al., 1993; West and Van Woesik, 2001, review by
Schaffelke et al., in press), and filter feeders (Smith,
1981; Birkeland, 1988).
While pollution effects on coral reefs at local scales
are well understood, links at regional scales betweenincreasing sediment and nutrient loads in rivers, and
the degradation of coral reefs, have been more difficult
to demonstrate (Fabricius and De�ath, 2004). This isdue to a lack of historic data and the confounding effects
of other disturbances such as bleaching, cyclones, fishing
pressure and outbreaks of the coral eating crown-of-
thorns starfish (Acanthaster planci), and is further com-
plicated by the naturally high variability in monsoonal
vier Ltd. All rights reserved.
K. Fabricius et al. / Marine Pollution Bulletin 51 (2005) 384–398 385
river flood events. Organism responses are poorly under-
stood, as each of the numerous inshore species has its
own tolerance limit at every life stage, and interactions
between the organisms add to the complexity. Though
considerable knowledge has been gained from single-
species exposure experiments in the laboratory, it is dif-ficult to extrapolate from such laboratory studies to field
settings and ecosystem responses. Taxonomically de-
tailed field survey data of major assemblages along envi-
ronmental gradients should therefore provide valuable
information about ecosystem responses to changing
water quality.
In the Great Barrier Reef (GBR), two coastal regions,
including about 200 coral reefs, have been classified athigh risk of exposure to terrestrial runoff (Devlin
et al., 2003). Exposure risk was estimated based on
distance and direction of the reef from each river (quan-
tifying the probability that a plume reaches the reef),
and data on river pollution. The two areas classified as
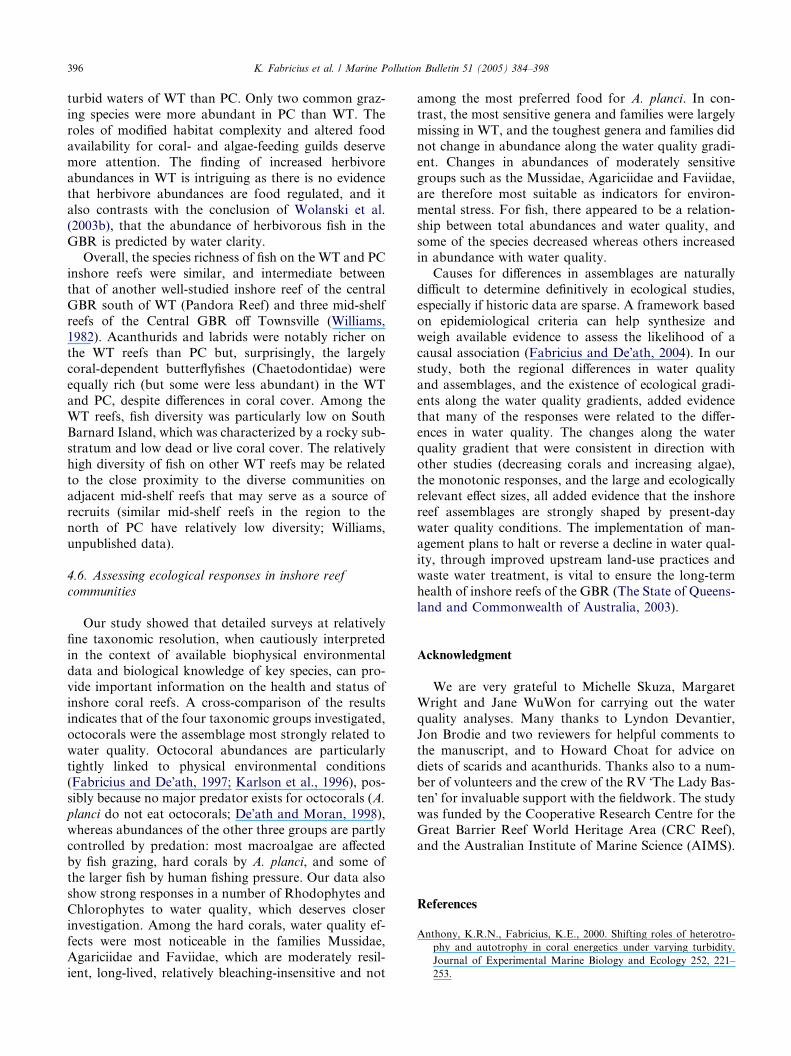
high risk (Fig. 1) were: the inner southern reefs of the
Whitsunday Islands group (central GBR, 20� 0 0–20�30 0 S), and the Wet Tropics in the northern section ofthe GBR (Northern GBR, 15� 40 0–17� 50 0 S).In the Whitsunday Islands, ecological changes have
been documented on seven reefs along a gradient of
increasing concentrations of water and sediment param-
eters (especially suspended particulate matter, turbidity,
silicate, and total organic matter in sediments) towards
reefs located near the Proserpine and O�Connell Rivers
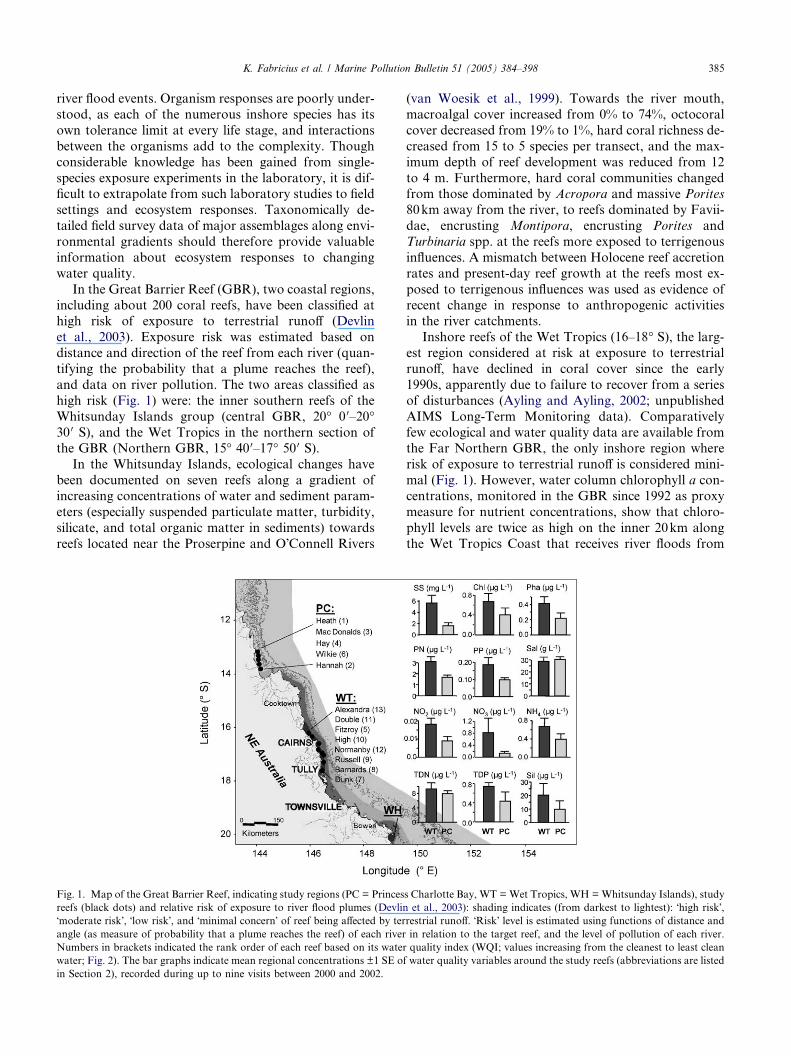
Fig. 1. Map of the Great Barrier Reef, indicating study regions (PC = Princes
reefs (black dots) and relative risk of exposure to river flood plumes (Devlin
�moderate risk�, �low risk�, and �minimal concern� of reef being affected by terangle (as measure of probability that a plume reaches the reef) of each river
Numbers in brackets indicated the rank order of each reef based on its water
water; Fig. 2). The bar graphs indicate mean regional concentrations ±1 SE of
in Section 2), recorded during up to nine visits between 2000 and 2002.
(van Woesik et al., 1999). Towards the river mouth,
macroalgal cover increased from 0% to 74%, octocoral
cover decreased from 19% to 1%, hard coral richness de-
creased from 15 to 5 species per transect, and the max-
imum depth of reef development was reduced from 12
to 4 m. Furthermore, hard coral communities changedfrom those dominated by Acropora and massive Porites
80km away from the river, to reefs dominated by Favii-
dae, encrusting Montipora, encrusting Porites and
Turbinaria spp. at the reefs more exposed to terrigenous
influences. A mismatch between Holocene reef accretion
rates and present-day reef growth at the reefs most ex-
posed to terrigenous influences was used as evidence of
recent change in response to anthropogenic activitiesin the river catchments.
Inshore reefs of the Wet Tropics (16–18� S), the larg-est region considered at risk at exposure to terrestrial
runoff, have declined in coral cover since the early
1990s, apparently due to failure to recover from a series
of disturbances (Ayling and Ayling, 2002; unpublished
AIMS Long-Term Monitoring data). Comparatively
few ecological and water quality data are available fromthe Far Northern GBR, the only inshore region where
risk of exposure to terrestrial runoff is considered mini-
mal (Fig. 1). However, water column chlorophyll a con-
centrations, monitored in the GBR since 1992 as proxy
measure for nutrient concentrations, show that chloro-
phyll levels are twice as high on the inner 20km along
the Wet Tropics Coast that receives river floods from
s Charlotte Bay, WT = Wet Tropics, WH =Whitsunday Islands), study
et al., 2003): shading indicates (from darkest to lightest): �high risk�,restrial runoff. �Risk� level is estimated using functions of distance andin relation to the target reef, and the level of pollution of each river.
quality index (WQI; values increasing from the cleanest to least clean
water quality variables around the study reefs (abbreviations are listed
386 K. Fabricius et al. / Marine Pollution Bulletin 51 (2005) 384–398
agriculturally used catchments, as in the Far Northern
region (14� S) where land use is minimal (Brodie et al.,1997; Devlin et al., 2003). Across the continental shelf,
chlorophyll increases steeply towards the coast in the
Wet Tropics but not in the Far North (Fabricius and
De�ath, 2004), indicating that nutrient availability ishigher in the former region.
In this study we present field survey data on the bio-
diversity of algae, hard corals, octocorals and fish on
naturally turbid inshore coral reefs that vary in their
level of exposure to water-borne sediment, nutrient and
chlorophyll concentrations, and in the degree of agricul-
tural modification in the adjacent catchments from
where flood plumes originate. We investigate the rela-tionships between water quality and a number of ecolog-
ical attributes, and discuss the evidence for water quality
effects on coral reef communities on these inshore reefs.
2. Methods
2.1. Study sites
The study focussed on five to eight (dependent on the
organism) inshore reefs in the Wet Tropics (WT) be-
tween Tully and Port Douglas, and five reefs in the
Claremont Isles, north of the Princess Charlotte Bay re-
gion (PC; Fig. 1). Surveys were conducted on both the
windward and leeward sides of the reefs at several depth
zones. The eight reefs surveyed in the Wet Tropics were(from south to north) Dunk, Barnards, Russell, Nor-
manby, High, Fitzroy, Double and Alexandra, and the
five reefs north of Princess Charlotte Bay were Hannah,
Wilkie, Hay, McDonalds and Heath (Fig. 1). All five PC
reefs were surveyed for all four groups, whereas of the
eight WT reefs, Alexandra Reef was only surveyed for
octocorals, Dunk and Double Island were not surveyed
for fish and the Barnard Islands were not surveyed forhard corals.
All study reefs are located <20km from north to
south oriented coastlines at <20m bathymetry. Reefs
in WT have been identified as having the highest risk
of exposure to agricultural runoff (Devlin et al., 2003),
since they experience river plumes every few years from
wet tropical catchments with intensive agriculture
(Johnstone, Russell-Mulgrave, Tully River), and plumesfrom the large, dry tropical Burdekin River on a decadal
basis. Reefs in PC are exposed to runoff from the dry
tropical Normanby and Stewart Rivers, whose catch-
ments are only slightly modified, being dominated by
low density cattle grazing, and having received little or
no fertilizers and pesticides. Data on the disturbance his-
tory from both regions are sparse. In the last two dec-
ades some of the WT reefs experienced an outbreak ofAcanthaster planci (early1990s), two tropical cyclones
(1986 and 1990), and bleaching-related coral mortality
(1998), whereas the reefs in PC have probably not expe-
rienced A. planci outbreaks, but have been impacted by
four tropical cyclones in the last two decades, and
bleaching mortality in 2002 (after the surveys reported
here were completed).
2.2. Field data
2.2.1. Water quality data
Concentrations of 12 water quality variables (partic-
ulate nitrogen and phosphorus (PN,PP), nitrate, nitrite,
ammonium, total dissolved nitrogen and phosphorus
(TDN,TDP), silicate (Sil), chlorophyll (Chl), phaeopig-
ments (Phae), salinity (Sal) and suspended solids (SS))were determined by taking surface water samples at each
reef during each of nine ship trips to both regions be-
tween December 2000 and April 2002. For logistic rea-
sons, our water sampling was limited to nine visits
(Alexandra Reef only 5 times), but the regional differ-
ences we found were consistent with data from a
monthly water column chlorophyll a monitoring pro-
gram that commenced in 1992 (Brodie et al., 1997),which shows that inshore chlorophyll concentrations
are twice as high in the central section of the GBR
including WT, compared to the remote Far Northern
section including PC (Fabricius and De�ath, 2004). Fur-thermore, in the central GBR but not in the Far North,
chlorophyll concentrations increase steeply towards the
coast, indicating that more nutrients are available in-
shore in the former area (Brodie et al., unpublisheddata).
For dissolved nitrogen, phosphorus and silicate, six
10ml subsamples were filtered through sterile polycar-
bonate filters with 0.2lm pore size, and the particle-freewater frozen at �18 �C for later analysis. For particulatenutrients, chlorophyll and phaeopigments, duplicate
subsamples (250ml, and 100ml respectively) were fil-
tered onto pre-combusted 25mm Whatman GF/F filters(0.2lm nominal pore size) at low vacuum (8kPa). Fil-ters were then wrapped into pre-combusted aluminium
foil, and frozen until further analysis. Dry weight of sus-
pended solids was determined from duplicate 1000ml
water samples filtered through pre-weighed 45mm poly-
carbonate filters with 0.4lm pore size. Surface salinitywas determined from a 500ml water sample stored in
airtight bottles at room temperature. In the laboratory,the samples were analysed following standard proce-
dures (Furnas and Mitchell, 1996).
2.2.2. Abundances and biodiversity
Four groups of taxa were surveyed using rapid eco-
logical assessments based on standardized scuba-swims
by experts: macroalgae, here defined as fleshy macro-
algae, excluding crustose coralline and fine filamentousforms (McCook et al., 2000), hard corals (Devantier
et al., 1998), octocorals (Fabricius and De�ath, 2001),
K. Fabricius et al. / Marine Pollution Bulletin 51 (2005) 384–398 387
and fish (Williams, 1982). Abundances of the three bent-
hic groups were rated on a 6-point scale as 0 = �absent�,1 = �rare�, 2 = �uncommon�, 3 = �common�, 4 = �abun-dant�, and 5 = �dominant�. Abundances of some of thefish species were estimated on a log (base 5) scale (Willi-
ams, 1982), whereas less abundant fish species such asLethrinus spp., Lutjanus spp., Plectropomus spp., Chae-
todon spp., and some pomacanthids, plectorhynchids
and Choerodon spp., were fully enumerated.
Macroalgae surveys were conducted at three depths
(slope: 18–3m, crest: 3–1m, and the reef flat) in early
summer, late summer, and winter, in total covering 12
reefs with 218 surveys. Macroalgae were identified to
genus level, except for Rhipilia and Avrainvillea, andGalaxaura and Tricleocarpa, which were aggregated.
Relative abundances of Rhodophyta (red algae), Chlo-
rophyta (green algae) and Phaeophyta (brown algae,
now also called Heterokontophyta) were estimated as
the sum of ratings of individual genera within these
three major groups of fleshy macroalgae. Hard corals
(Scleractinia) were identified to species level, and were
surveyed at 2 depths (deep: 18–8m, and shallow: 6–1m) on 10 reefs, in a total of 48 surveys. Octocorals
(Octocorallia: zooxanthellate and azooxanthellate
alcyonarian soft corals and sea fans) were identified to
genus level and were surveyed at 5 depths (18–13m,
13–8m, 8–3m, 3–1m, and reef flat) on 13 reefs, in a total
of 147 surveys (each survey covering about 200–300m2).
Cover of the main benthos groups (hard and octocorals,
turf and coralline algae, macroalgae, sand and rubble,sponges etc) were also estimated during the octocoral
surveys for each depth zone. Fish were surveyed be-
tween 12m and the reef crest on 10 reefs, in a total
of 34 surveys. Fish species were identified to species or
species groups.
2.3. Statistical analyses
To facilitate comparison between taxonomic groups,
all analyses were carried out on reef-level data (means
over all survey periods, locations and depths per reef).
Principal components analysis of log-transformed water
quality concentrations (averaged over all visits) was
used to characterize the study reefs and the relationships
between the water quality variables. Concentrations of
all variables except salinity were highly and positivelycorrelated. Therefore, a water quality index (WQI) was
calculated, as follows: (1) all water quality variables (ex-
cept salinity) were standardized to mean zero and stand-
ard deviation one (z-scores), and (2) the standardized
values were summed over the 12 variables for each reef.
Thus, a reef with a high WQI will typically have high
concentrations of most of the variables that form the
index, and a reef with low values has lower concentra-tions. Water with a high WQI value would typically
appear murkier while one with a low WQI is clearer.
Species abundances were fourth-root transformed (ex-
cept hard corals) and reef-averaged over depths and
sites. Redundancy analyses (RDA, Rao, 1964; Jongman
et al., 1995) were used to relate differences in the assem-
blages to regional and water quality effects. Permutation
tests (ter Braak, 1992) were used to assess the statisticalsignificance of the relationships.
Log-linear regression models were used to determine
the regional and gradient effects on benthic cover, abun-
dances and richness. Analyses followed the methods of
Fabricius and De�ath (2004). These models were chosenbecause variation increased with the mean, and the im-
plicit log transformation helped linearise the gradient ef-
fects. The models included regional effects to account fordifferences that may be unrelated to the water quality
gradients. For each response, five models were fitted:
(i) different slopes (gradient effects) within each region
and different intercepts (region effects), (ii) same slope
for both regions, but different intercepts (iii) single gra-
dient common to both regions, (iv) no gradient effect but
regional effects, and (v) no gradient or regional effects.
The number of reefs investigated was small (10–13),and preliminary analyses indicated relatively weak asso-
ciations between the responses and explanatory varia-
bles. Model averaging (Raftery, 1995; Raftery, 1988)
of models based on the Bayesian Information Criterion
(BIC) (Schwarz, 1978) was used for all analyses of abun-
dances and richness (Fabricius and De�ath, 2004).Based on BIC, we calculated the probability of each
model (i) to (v), and the probability of a regional effect,defined as P(iv)/(P(iv) + P(v)), for all taxa seen on at
least 25% of reefs. Probabilities were classified as strong
to moderate (P > 0.8) or weak (0.8 > P > 0.5). Where
differences existed, the direction of this difference was
determined (WT > PC, or WT < PC), to calculate the
percentage of taxa that had higher or lower abundances
in WT. Finally, taxa that increased or decreased in
abundance along the water quality gradient were identi-fied. Only taxa that were encountered on at least 50% of
the reefs were included in this assessment. For each of
these taxa, the probability of the presence of a gradient
effect was calculated as the sum of the probabilities of
the models (i), (ii) and (iii). Probabilities were again clas-
sified as strong to moderate or weak for positive and
negative relationships with water quality. All data anal-
yses used S-Plus Statistical Sciences (Statistical Sciences,1999).
3. Results
3.1. Water quality
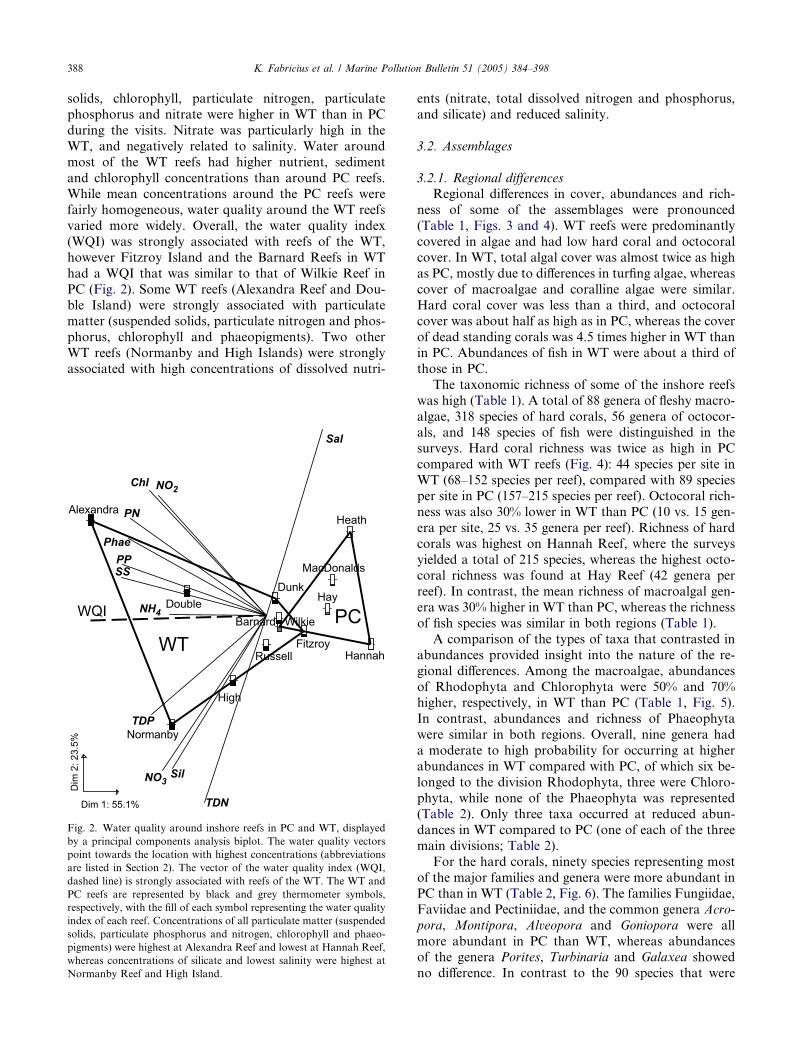
Concentrations of many of the water quality varia-bles differed between the Wet Tropics (WT) and Princess
Charlotte Bay (PC) regions (Fig. 1). Mean suspended
388 K. Fabricius et al. / Marine Pollution Bulletin 51 (2005) 384–398
solids, chlorophyll, particulate nitrogen, particulate
phosphorus and nitrate were higher in WT than in PC
during the visits. Nitrate was particularly high in the
WT, and negatively related to salinity. Water around
most of the WT reefs had higher nutrient, sediment
and chlorophyll concentrations than around PC reefs.While mean concentrations around the PC reefs were
fairly homogeneous, water quality around the WT reefs
varied more widely. Overall, the water quality index
(WQI) was strongly associated with reefs of the WT,
however Fitzroy Island and the Barnard Reefs in WT
had a WQI that was similar to that of Wilkie Reef in
PC (Fig. 2). Some WT reefs (Alexandra Reef and Dou-
ble Island) were strongly associated with particulatematter (suspended solids, particulate nitrogen and phos-
phorus, chlorophyll and phaeopigments). Two other
WT reefs (Normanby and High Islands) were strongly
associated with high concentrations of dissolved nutri-
Dim 1: 55.1%
Dim
2: 2
3.5%
BarnardDouble
Dunk
FitzroyHannah
Hay
Heath
High
MacDonalds
Russell
Wilkie
SS
Chl
Phae
PN
PP
NO3
NH4
TDN
TDP
Sil
Sal
NO2
WQI PCWT
Alexandra
Normanby
Fig. 2. Water quality around inshore reefs in PC and WT, displayed
by a principal components analysis biplot. The water quality vectors
point towards the location with highest concentrations (abbreviations
are listed in Section 2). The vector of the water quality index (WQI,
dashed line) is strongly associated with reefs of the WT. The WT and
PC reefs are represented by black and grey thermometer symbols,
respectively, with the fill of each symbol representing the water quality
index of each reef. Concentrations of all particulate matter (suspended
solids, particulate phosphorus and nitrogen, chlorophyll and phaeo-
pigments) were highest at Alexandra Reef and lowest at Hannah Reef,
whereas concentrations of silicate and lowest salinity were highest at
Normanby Reef and High Island.
ents (nitrate, total dissolved nitrogen and phosphorus,
and silicate) and reduced salinity.
3.2. Assemblages
3.2.1. Regional differences
Regional differences in cover, abundances and rich-
ness of some of the assemblages were pronounced
(Table 1, Figs. 3 and 4). WT reefs were predominantly
covered in algae and had low hard coral and octocoral
cover. In WT, total algal cover was almost twice as high
as PC, mostly due to differences in turfing algae, whereas
cover of macroalgae and coralline algae were similar.
Hard coral cover was less than a third, and octocoralcover was about half as high as in PC, whereas the cover
of dead standing corals was 4.5 times higher in WT than
in PC. Abundances of fish in WT were about a third of
those in PC.
The taxonomic richness of some of the inshore reefs
was high (Table 1). A total of 88 genera of fleshy macro-
algae, 318 species of hard corals, 56 genera of octocor-
als, and 148 species of fish were distinguished in thesurveys. Hard coral richness was twice as high in PC
compared with WT reefs (Fig. 4): 44 species per site in
WT (68–152 species per reef), compared with 89 species
per site in PC (157–215 species per reef). Octocoral rich-
ness was also 30% lower in WT than PC (10 vs. 15 gen-
era per site, 25 vs. 35 genera per reef). Richness of hard
corals was highest on Hannah Reef, where the surveys
yielded a total of 215 species, whereas the highest octo-coral richness was found at Hay Reef (42 genera per
reef). In contrast, the mean richness of macroalgal gen-
era was 30% higher in WT than PC, whereas the richness
of fish species was similar in both regions (Table 1).
A comparison of the types of taxa that contrasted in
abundances provided insight into the nature of the re-
gional differences. Among the macroalgae, abundances
of Rhodophyta and Chlorophyta were 50% and 70%higher, respectively, in WT than PC (Table 1, Fig. 5).
In contrast, abundances and richness of Phaeophyta
were similar in both regions. Overall, nine genera had
a moderate to high probability for occurring at higher
abundances in WT compared with PC, of which six be-
longed to the division Rhodophyta, three were Chloro-
phyta, while none of the Phaeophyta was represented
(Table 2). Only three taxa occurred at reduced abun-dances in WT compared to PC (one of each of the three
main divisions; Table 2).
For the hard corals, ninety species representing most
of the major families and genera were more abundant in
PC than in WT (Table 2, Fig. 6). The families Fungiidae,
Faviidae and Pectiniidae, and the common genera Acro-
pora, Montipora, Alveopora and Goniopora were all
more abundant in PC than WT, whereas abundancesof the genera Porites, Turbinaria and Galaxea showed
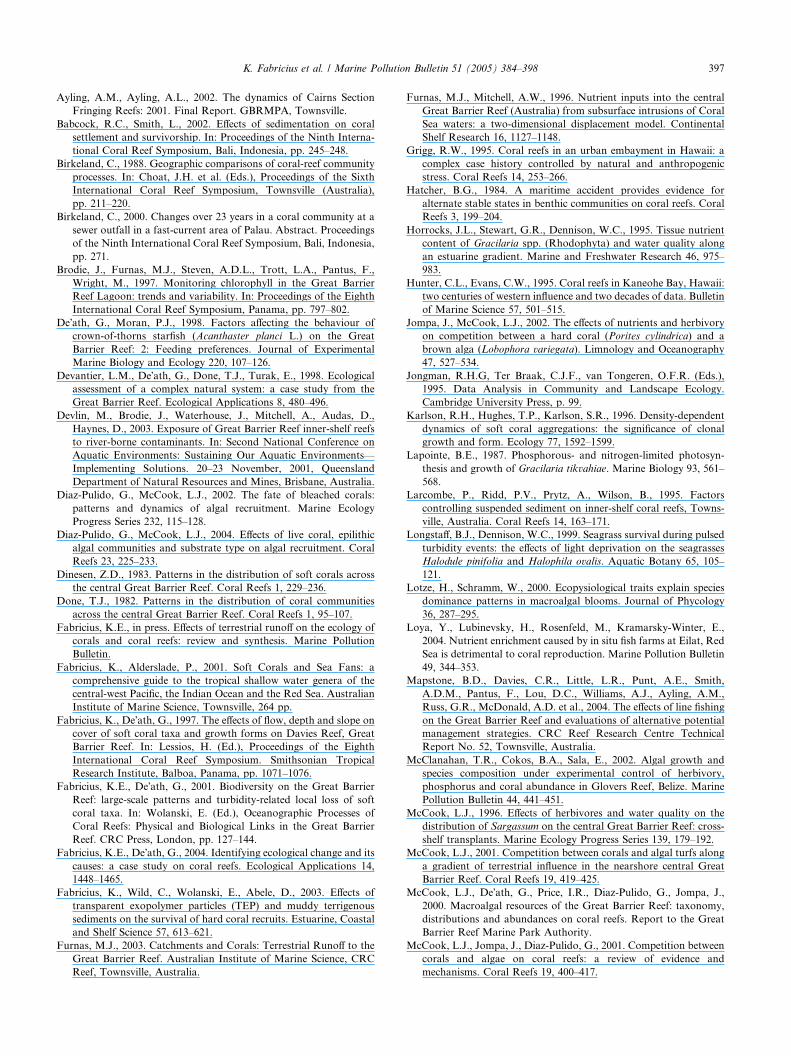
no difference. In contrast to the 90 species that were
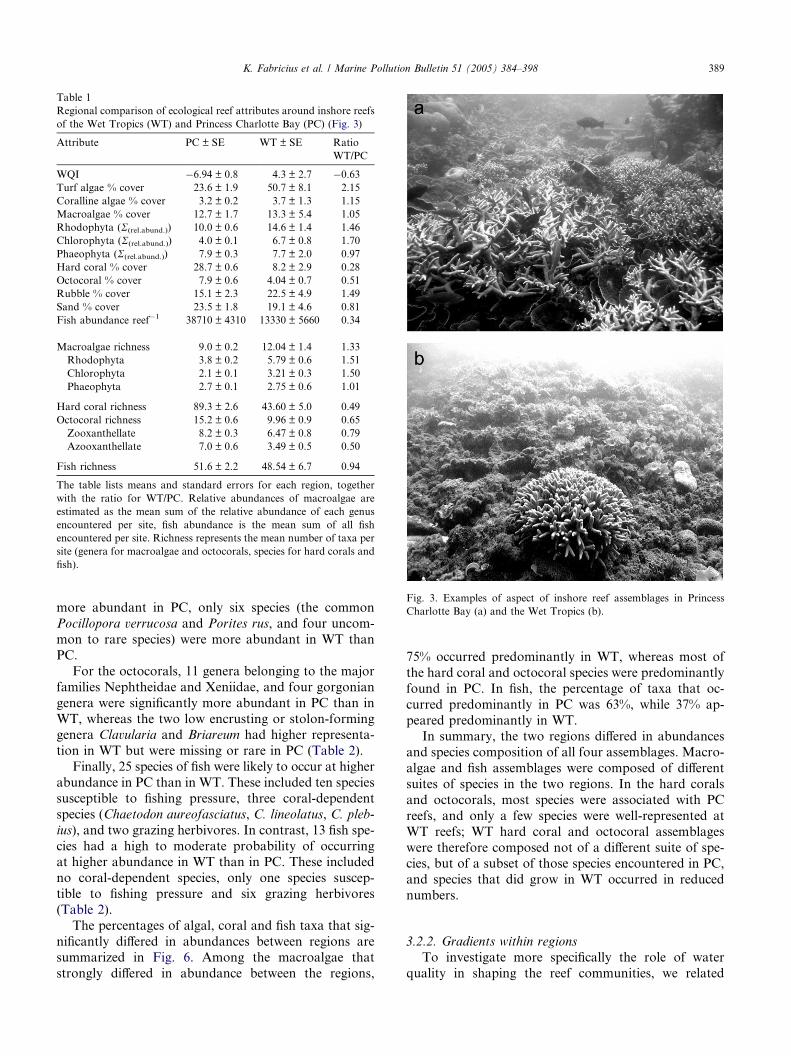
Fig. 3. Examples of aspect of inshore reef assemblages in Princess
Charlotte Bay (a) and the Wet Tropics (b).
Table 1
Regional comparison of ecological reef attributes around inshore reefs
of the Wet Tropics (WT) and Princess Charlotte Bay (PC) (Fig. 3)
Attribute PC ± SE WT ± SE Ratio
WT/PC
WQI �6.94 ± 0.8 4.3 ± 2.7 �0.63Turf algae % cover 23.6 ± 1.9 50.7 ± 8.1 2.15
Coralline algae % cover 3.2 ± 0.2 3.7 ± 1.3 1.15
Macroalgae % cover 12.7 ± 1.7 13.3 ± 5.4 1.05
Rhodophyta (R(rel.abund.)) 10.0 ± 0.6 14.6 ± 1.4 1.46
Chlorophyta (R(rel.abund.)) 4.0 ± 0.1 6.7 ± 0.8 1.70
Phaeophyta (R(rel.abund.)) 7.9 ± 0.3 7.7 ± 2.0 0.97
Hard coral % cover 28.7 ± 0.6 8.2 ± 2.9 0.28
Octocoral % cover 7.9 ± 0.6 4.04 ± 0.7 0.51
Rubble % cover 15.1 ± 2.3 22.5 ± 4.9 1.49
Sand % cover 23.5 ± 1.8 19.1 ± 4.6 0.81
Fish abundance reef�1 38710 ± 4310 13330 ± 5660 0.34
Macroalgae richness 9.0 ± 0.2 12.04 ± 1.4 1.33
Rhodophyta 3.8 ± 0.2 5.79 ± 0.6 1.51
Chlorophyta 2.1 ± 0.1 3.21 ± 0.3 1.50
Phaeophyta 2.7 ± 0.1 2.75 ± 0.6 1.01
Hard coral richness 89.3 ± 2.6 43.60 ± 5.0 0.49
Octocoral richness 15.2 ± 0.6 9.96 ± 0.9 0.65
Zooxanthellate 8.2 ± 0.3 6.47 ± 0.8 0.79
Azooxanthellate 7.0 ± 0.6 3.49 ± 0.5 0.50
Fish richness 51.6 ± 2.2 48.54 ± 6.7 0.94
The table lists means and standard errors for each region, together
with the ratio for WT/PC. Relative abundances of macroalgae are
estimated as the mean sum of the relative abundance of each genus
encountered per site, fish abundance is the mean sum of all fish
encountered per site. Richness represents the mean number of taxa per
site (genera for macroalgae and octocorals, species for hard corals and
fish).
K. Fabricius et al. / Marine Pollution Bulletin 51 (2005) 384–398 389
more abundant in PC, only six species (the common
Pocillopora verrucosa and Porites rus, and four uncom-
mon to rare species) were more abundant in WT than
PC.
For the octocorals, 11 genera belonging to the major
families Nephtheidae and Xeniidae, and four gorgonian
genera were significantly more abundant in PC than in
WT, whereas the two low encrusting or stolon-forminggenera Clavularia and Briareum had higher representa-
tion in WT but were missing or rare in PC (Table 2).
Finally, 25 species of fish were likely to occur at higher
abundance in PC than in WT. These included ten species
susceptible to fishing pressure, three coral-dependent
species (Chaetodon aureofasciatus, C. lineolatus, C. pleb-
ius), and two grazing herbivores. In contrast, 13 fish spe-
cies had a high to moderate probability of occurringat higher abundance in WT than in PC. These included
no coral-dependent species, only one species suscep-
tible to fishing pressure and six grazing herbivores
(Table 2).
The percentages of algal, coral and fish taxa that sig-
nificantly differed in abundances between regions are
summarized in Fig. 6. Among the macroalgae that
strongly differed in abundance between the regions,
75% occurred predominantly in WT, whereas most of
the hard coral and octocoral species were predominantly
found in PC. In fish, the percentage of taxa that oc-
curred predominantly in PC was 63%, while 37% ap-
peared predominantly in WT.In summary, the two regions differed in abundances
and species composition of all four assemblages. Macro-
algae and fish assemblages were composed of different
suites of species in the two regions. In the hard corals
and octocorals, most species were associated with PC
reefs, and only a few species were well-represented at
WT reefs; WT hard coral and octocoral assemblages
were therefore composed not of a different suite of spe-cies, but of a subset of those species encountered in PC,
and species that did grow in WT occurred in reduced
numbers.
3.2.2. Gradients within regions
To investigate more specifically the role of water
quality in shaping the reef communities, we related
0
10
20
30
40
0
5
10
15
-10 -5 0 5 10 150
20
40
60
5
10
15
20
20
40
60
80
100
0
5
10
15
20
25
-10 -5 0 5 10 15
20304050607080
0
10
20
30
0.33 0.40
0.50 0.84
0.84 0.79
0.45 0.29
% H
C C
over
% O
C C
over
OC
Ric
hnes
s
% M
A C
over
MA
Ric
hnes
s
Water Quality Index
Fish
Abu
n. (x
100
0)
Fish
Ric
hnes
sH
C R
ichn
ess
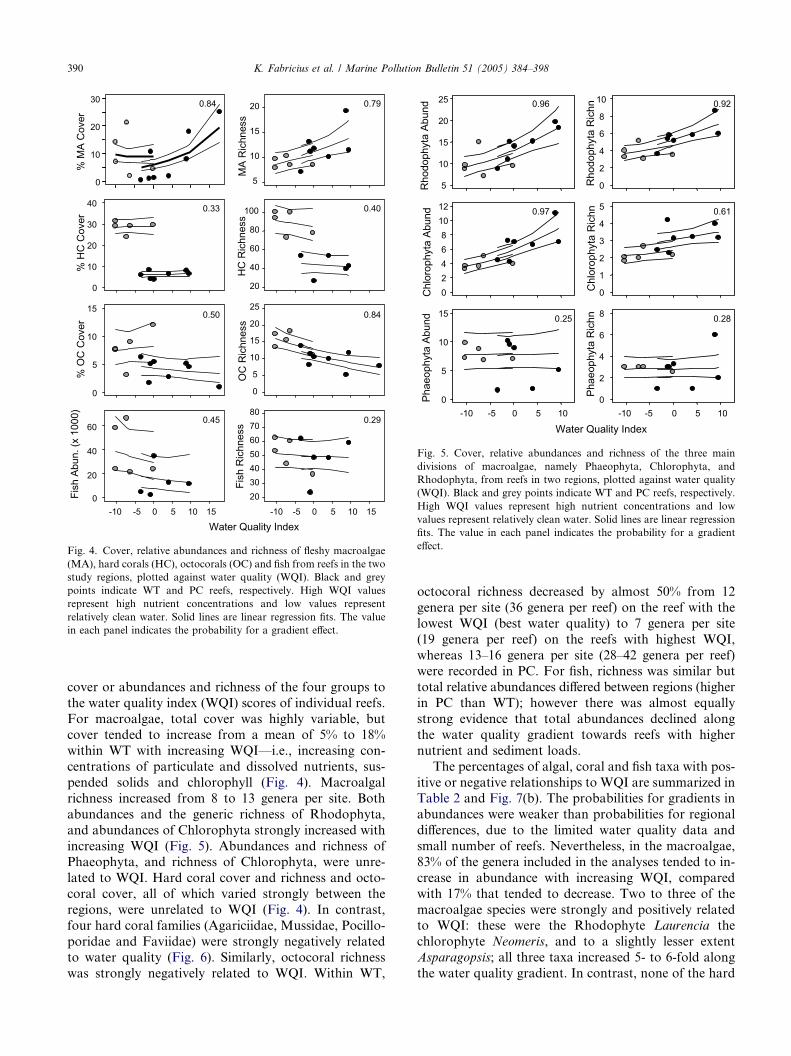
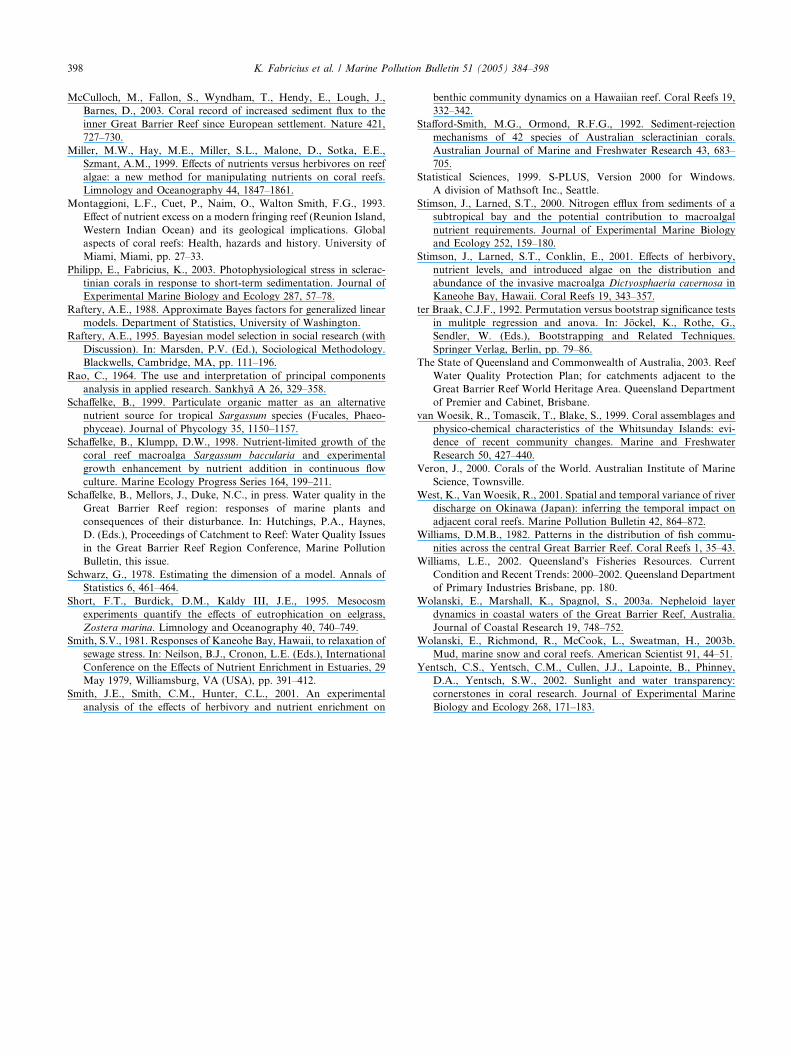
Fig. 4. Cover, relative abundances and richness of fleshy macroalgae
(MA), hard corals (HC), octocorals (OC) and fish from reefs in the two
study regions, plotted against water quality (WQI). Black and grey
points indicate WT and PC reefs, respectively. High WQI values
represent high nutrient concentrations and low values represent
relatively clean water. Solid lines are linear regression fits. The value
in each panel indicates the probability for a gradient effect.
5
10
15
20
25
02468
1012
-10 -5 0 5 100
5
10
15
0
2
4
6
8
10
0
1
2
3
4
5
-10 -5 0 5 100
2
4
6
8
0.96 0.92
0.97 0.61
0.25 0.28
Water Quality Index
Phae
ophy
ta R
ichn
Phae
ophy
ta A
bund
Chl
orop
hyta
Abu
nd
Chl
orop
hyta
Ric
hn
Rho
doph
yta
Abun
d
Rho
doph
yta
Ric
hn
Fig. 5. Cover, relative abundances and richness of the three main
divisions of macroalgae, namely Phaeophyta, Chlorophyta, and
Rhodophyta, from reefs in two regions, plotted against water quality
(WQI). Black and grey points indicate WT and PC reefs, respectively.
High WQI values represent high nutrient concentrations and low
values represent relatively clean water. Solid lines are linear regression
fits. The value in each panel indicates the probability for a gradient
effect.
390 K. Fabricius et al. / Marine Pollution Bulletin 51 (2005) 384–398
cover or abundances and richness of the four groups to
the water quality index (WQI) scores of individual reefs.
For macroalgae, total cover was highly variable, butcover tended to increase from a mean of 5% to 18%
within WT with increasing WQI—i.e., increasing con-
centrations of particulate and dissolved nutrients, sus-
pended solids and chlorophyll (Fig. 4). Macroalgal
richness increased from 8 to 13 genera per site. Both
abundances and the generic richness of Rhodophyta,
and abundances of Chlorophyta strongly increased with
increasing WQI (Fig. 5). Abundances and richness ofPhaeophyta, and richness of Chlorophyta, were unre-
lated to WQI. Hard coral cover and richness and octo-
coral cover, all of which varied strongly between the
regions, were unrelated to WQI (Fig. 4). In contrast,
four hard coral families (Agariciidae, Mussidae, Pocillo-
poridae and Faviidae) were strongly negatively related
to water quality (Fig. 6). Similarly, octocoral richness
was strongly negatively related to WQI. Within WT,
octocoral richness decreased by almost 50% from 12
genera per site (36 genera per reef) on the reef with the
lowest WQI (best water quality) to 7 genera per site
(19 genera per reef) on the reefs with highest WQI,
whereas 13–16 genera per site (28–42 genera per reef)were recorded in PC. For fish, richness was similar but
total relative abundances differed between regions (higher
in PC than WT); however there was almost equally
strong evidence that total abundances declined along
the water quality gradient towards reefs with higher
nutrient and sediment loads.
The percentages of algal, coral and fish taxa with pos-
itive or negative relationships to WQI are summarized inTable 2 and Fig. 7(b). The probabilities for gradients in
abundances were weaker than probabilities for regional
differences, due to the limited water quality data and
small number of reefs. Nevertheless, in the macroalgae,
83% of the genera included in the analyses tended to in-
crease in abundance with increasing WQI, compared
with 17% that tended to decrease. Two to three of the
macroalgae species were strongly and positively relatedto WQI: these were the Rhodophyte Laurencia the
chlorophyte Neomeris, and to a slightly lesser extent
Asparagopsis; all three taxa increased 5- to 6-fold along
the water quality gradient. In contrast, none of the hard
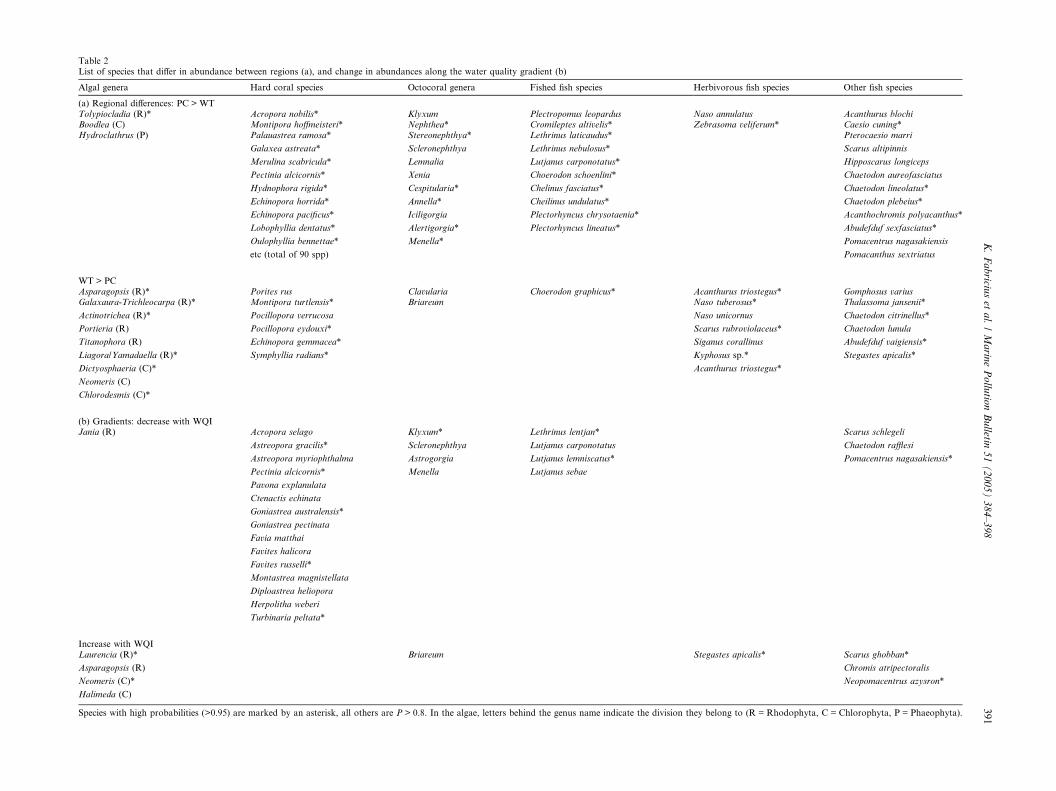
Table 2List of species that differ in abundance between regions (a), and change in abundances along the water quality gradient (b)
Algal genera Hard coral species Octocoral genera Fished fish species Herbivorous fish species Other fish species
(a) Regional differences: PC > WTTolypiocladia (R)* Acropora nobilis* Klyxum Plectropomus leopardus Naso annulatus Acanthurus blochiBoodlea (C) Montipora hoffmeisteri* Nephthea* Cromileptes altivelis* Zebrasoma veliferum* Caesio cuning*Hydroclathrus (P) Palauastrea ramosa* Stereonephthya* Lethrinus laticaudus* Pterocaesio marri
Galaxea astreata* Scleronephthya Lethrinus nebulosus* Scarus altipinnis
Merulina scabricula* Lemnalia Lutjanus carponotatus* Hipposcarus longiceps
Pectinia alcicornis* Xenia Choerodon schoenlini* Chaetodon aureofasciatus
Hydnophora rigida* Cespitularia* Chelinus fasciatus* Chaetodon lineolatus*
Echinopora horrida* Annella* Cheilinus undulatus* Chaetodon plebeius*
Echinopora pacificus* Iciligorgia Plectorhyncus chrysotaenia* Acanthochromis polyacanthus*
Lobophyllia dentatus* Alertigorgia* Plectorhyncus lineatus* Abudefduf sexfasciatus*
Oulophyllia bennettae* Menella* Pomacentrus nagasakiensis
etc (total of 90 spp) Pomacanthus sextriatus
WT > PCAsparagopsis (R)* Porites rus Clavularia Choerodon graphicus* Acanthurus triostegus* Gomphosus variusGalaxaura-Trichleocarpa (R)* Montipora turtlensis* Briareum Naso tuberosus* Thalassoma jansenii*
Actinotrichea (R)* Pocillopora verrucosa Naso unicornus Chaetodon citrinellus*
Portieria (R) Pocillopora eydouxi* Scarus rubroviolaceus* Chaetodon lunula
Titanophora (R) Echinopora gemmacea* Siganus corallinus Abudefduf vaigiensis*
Liagora/Yamadaella (R)* Symphyllia radians* Kyphosus sp.* Stegastes apicalis*
Dictyosphaeria (C)* Acanthurus triostegus*
Neomeris (C)
Chlorodesmis (C)*
(b) Gradients: decrease with WQIJania (R) Acropora selago Klyxum* Lethrinus lentjan* Scarus schlegeli
Astreopora gracilis* Scleronephthya Lutjanus carponotatus Chaetodon rafflesi
Astreopora myriophthalma Astrogorgia Lutjanus lemniscatus* Pomacentrus nagasakiensis*
Pectinia alcicornis* Menella Lutjanus sebae
Pavona explanulata
Ctenactis echinata
Goniastrea australensis*
Goniastrea pectinata
Favia matthai
Favites halicora
Favites russelli*
Montastrea magnistellata
Diploastrea heliopora
Herpolitha weberi
Turbinaria peltata*
Increase with WQILaurencia (R)* Briareum Stegastes apicalis* Scarus ghobban*
Asparagopsis (R) Chromis atripectoralis
Neomeris (C)* Neopomacentrus azysron*
Halimeda (C)
Species with high probabilities (>0.95) are marked by an asterisk, all others are P > 0.8. In the algae, letters behind the genus name indicate the division they belong to (R = Rhodophyta, C = Chlorophyta, P = Phaeophyta).
K.Fabriciu
set
al./Marin
ePollu
tionBulletin
51(2005)384–398
391
10
15
20
25
0
5
10
15
20
5
10
15
0
2
4
6
80.33 0.490.42 0.38
2
4
6
8
2468
1012 0.891.0
10
20
30
40 0.59
2
4
6
80.75
Alve.Goniopora
2
4
6
8
-10 -5 0 5 10 -10 -5 0 5 10
2
4
6
8
10
-10 -5 0 5 10
1
2
3
4
5
1
2
3
4
5
-10 -5 0 5 10
0.490.44 0.36 0.4
Water Quality Index
Acropora
Agar
iciid
ae
Porites
Montipora
Mus
sida
e
Galaxea
Fung
iidae
Poci
llopo
ridae
Turbinaria
Pect
iniid
aeFa
viid
ae
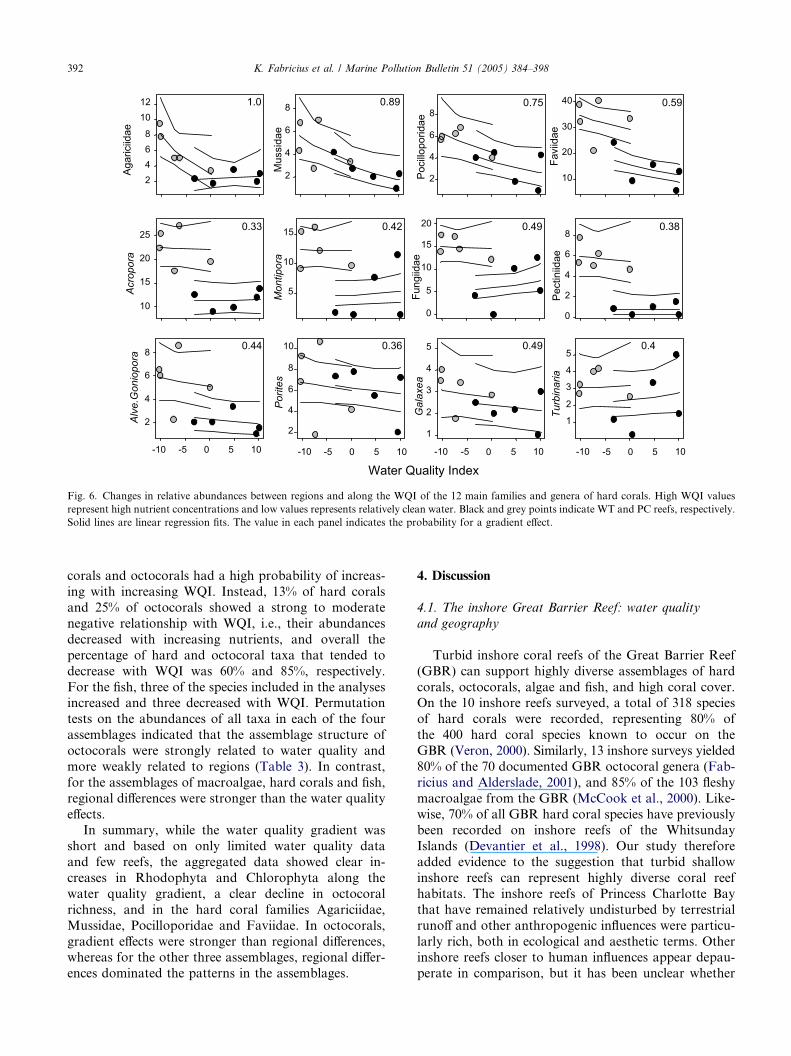
Fig. 6. Changes in relative abundances between regions and along the WQI of the 12 main families and genera of hard corals. High WQI values
represent high nutrient concentrations and low values represents relatively clean water. Black and grey points indicate WT and PC reefs, respectively.
Solid lines are linear regression fits. The value in each panel indicates the probability for a gradient effect.
392 K. Fabricius et al. / Marine Pollution Bulletin 51 (2005) 384–398
corals and octocorals had a high probability of increas-
ing with increasing WQI. Instead, 13% of hard corals
and 25% of octocorals showed a strong to moderate
negative relationship with WQI, i.e., their abundances
decreased with increasing nutrients, and overall the
percentage of hard and octocoral taxa that tended to
decrease with WQI was 60% and 85%, respectively.
For the fish, three of the species included in the analysesincreased and three decreased with WQI. Permutation
tests on the abundances of all taxa in each of the four
assemblages indicated that the assemblage structure of
octocorals were strongly related to water quality and
more weakly related to regions (Table 3). In contrast,
for the assemblages of macroalgae, hard corals and fish,
regional differences were stronger than the water quality
effects.In summary, while the water quality gradient was
short and based on only limited water quality data
and few reefs, the aggregated data showed clear in-
creases in Rhodophyta and Chlorophyta along the
water quality gradient, a clear decline in octocoral
richness, and in the hard coral families Agariciidae,
Mussidae, Pocilloporidae and Faviidae. In octocorals,
gradient effects were stronger than regional differences,whereas for the other three assemblages, regional differ-
ences dominated the patterns in the assemblages.
4. Discussion
4.1. The inshore Great Barrier Reef: water quality
and geography
Turbid inshore coral reefs of the Great Barrier Reef
(GBR) can support highly diverse assemblages of hard
corals, octocorals, algae and fish, and high coral cover.On the 10 inshore reefs surveyed, a total of 318 species
of hard corals were recorded, representing 80% of
the 400 hard coral species known to occur on the
GBR (Veron, 2000). Similarly, 13 inshore surveys yielded
80% of the 70 documented GBR octocoral genera (Fab-
ricius and Alderslade, 2001), and 85% of the 103 fleshy
macroalgae from the GBR (McCook et al., 2000). Like-
wise, 70% of all GBR hard coral species have previouslybeen recorded on inshore reefs of the Whitsunday
Islands (Devantier et al., 1998). Our study therefore
added evidence to the suggestion that turbid shallow
inshore reefs can represent highly diverse coral reef
habitats. The inshore reefs of Princess Charlotte Bay
that have remained relatively undisturbed by terrestrial
runoff and other anthropogenic influences were particu-
larly rich, both in ecological and aesthetic terms. Otherinshore reefs closer to human influences appear depau-
perate in comparison, but it has been unclear whether
MA HC OC Fish
% o
f Tax
a
Regional Differences
% o
f Tax
a
0
20
40
60
WT PC
80
WT PC WT PC WT PC
Incr Decr Incr Decr Incr Decr Incr Decr
80
0
20
40
60
(46) (217) (56) (109)
(18) (129) (39) (46)100
100
(b) Gradients along WQI
(a)
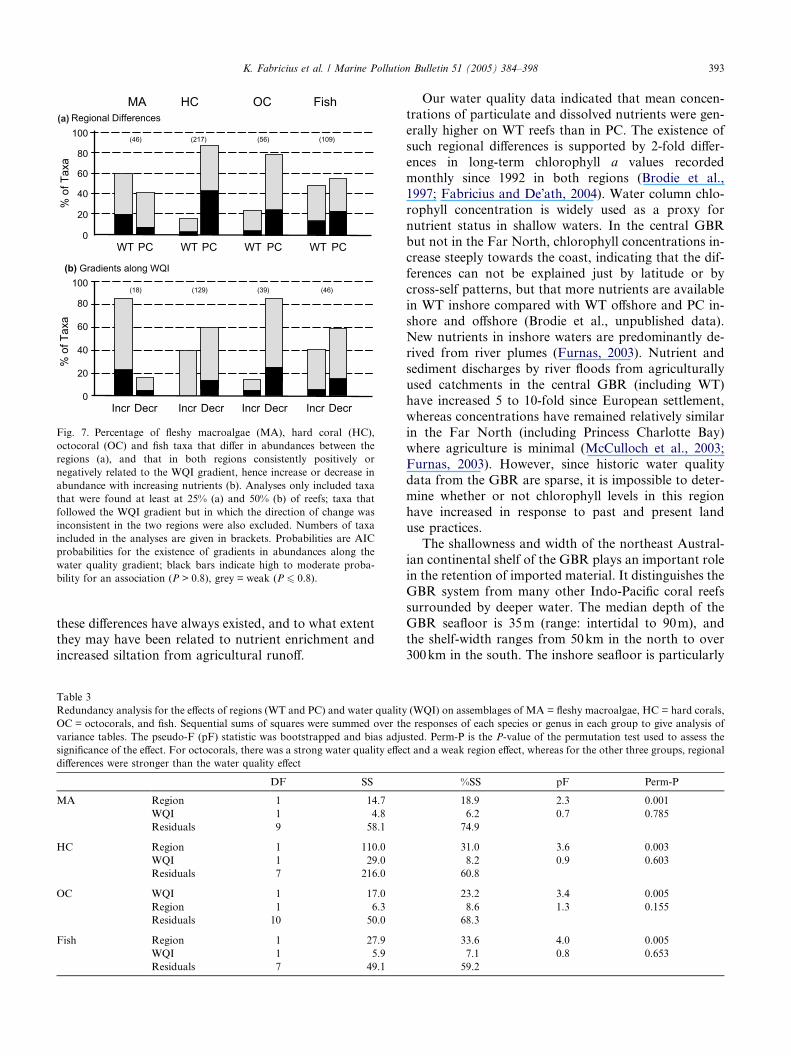
Fig. 7. Percentage of fleshy macroalgae (MA), hard coral (HC),
octocoral (OC) and fish taxa that differ in abundances between the
regions (a), and that in both regions consistently positively or
negatively related to the WQI gradient, hence increase or decrease in
abundance with increasing nutrients (b). Analyses only included taxa
that were found at least at 25% (a) and 50% (b) of reefs; taxa that
followed the WQI gradient but in which the direction of change was
inconsistent in the two regions were also excluded. Numbers of taxa
included in the analyses are given in brackets. Probabilities are AIC
probabilities for the existence of gradients in abundances along the
water quality gradient; black bars indicate high to moderate proba-
bility for an association (P > 0.8), grey = weak (P 6 0.8).
K. Fabricius et al. / Marine Pollution Bulletin 51 (2005) 384–398 393
these differences have always existed, and to what extentthey may have been related to nutrient enrichment and
increased siltation from agricultural runoff.
Table 3
Redundancy analysis for the effects of regions (WT and PC) and water quality
OC = octocorals, and fish. Sequential sums of squares were summed over th
variance tables. The pseudo-F (pF) statistic was bootstrapped and bias adju
significance of the effect. For octocorals, there was a strong water quality effec
differences were stronger than the water quality effect
DF SS
MA Region 1 14.7
WQI 1 4.8
Residuals 9 58.1
HC Region 1 110.0
WQI 1 29.0
Residuals 7 216.0
OC WQI 1 17.0
Region 1 6.3
Residuals 10 50.0
Fish Region 1 27.9
WQI 1 5.9
Residuals 7 49.1
Our water quality data indicated that mean concen-
trations of particulate and dissolved nutrients were gen-
erally higher on WT reefs than in PC. The existence of
such regional differences is supported by 2-fold differ-
ences in long-term chlorophyll a values recorded
monthly since 1992 in both regions (Brodie et al.,1997; Fabricius and De�ath, 2004). Water column chlo-rophyll concentration is widely used as a proxy for
nutrient status in shallow waters. In the central GBR
but not in the Far North, chlorophyll concentrations in-
crease steeply towards the coast, indicating that the dif-
ferences can not be explained just by latitude or by
cross-self patterns, but that more nutrients are available
in WT inshore compared with WT offshore and PC in-shore and offshore (Brodie et al., unpublished data).
New nutrients in inshore waters are predominantly de-
rived from river plumes (Furnas, 2003). Nutrient and
sediment discharges by river floods from agriculturally
used catchments in the central GBR (including WT)
have increased 5 to 10-fold since European settlement,
whereas concentrations have remained relatively similar
in the Far North (including Princess Charlotte Bay)where agriculture is minimal (McCulloch et al., 2003;
Furnas, 2003). However, since historic water quality
data from the GBR are sparse, it is impossible to deter-
mine whether or not chlorophyll levels in this region
have increased in response to past and present land
use practices.
The shallowness and width of the northeast Austral-
ian continental shelf of the GBR plays an important rolein the retention of imported material. It distinguishes the
GBR system from many other Indo-Pacific coral reefs
surrounded by deeper water. The median depth of the
GBR seafloor is 35m (range: intertidal to 90m), and
the shelf-width ranges from 50km in the north to over
300km in the south. The inshore seafloor is particularly
(WQI) on assemblages of MA = fleshy macroalgae, HC = hard corals,
e responses of each species or genus in each group to give analysis of
sted. Perm-P is the P-value of the permutation test used to assess the
t and a weak region effect, whereas for the other three groups, regional
%SS pF Perm-P
18.9 2.3 0.001
6.2 0.7 0.785
74.9
31.0 3.6 0.003
8.2 0.9 0.603
60.8
23.2 3.4 0.005
8.6 1.3 0.155
68.3
33.6 4.0 0.005
7.1 0.8 0.653
59.2
394 K. Fabricius et al. / Marine Pollution Bulletin 51 (2005) 384–398
shallow (intertidal to 20m depth), and much of the fine
sediment is therefore easily resuspended by swell. While
river plumes are short-lived, biological uptake by phyto-
plankton and bacteria converts dissolved inorganic
nutrients into particulate organic matter, the repeated
resuspension of which contributes to turbidity and re-duces the lower depth limit for seagrass and corals
(Short et al., 1995; Longstaff and Dennison, 1999; Anth-
ony and Fabricius, 2000; Yentsch et al., 2002). A large
proportion of the particulate material may remain in
the inshore system for prolonged periods of times (prob-
ably years to decades), undergoing cycles of deposition
and resuspension while it is slowly transported north-
wards, prior to final deposition in a sheltered area(Larcombe et al., 1995), or offshore transport such as
observed in the Cairns region (Wolanski et al., 2003a).
The main issues dominating the water quality of inshore
areas are therefore organic enrichment and the loss of
light rather than the short-lived dissolved inorganic
nutrients. One of the problems in assessing future effects
of terrestrial runoff is the unknown capacity of the sys-
tem to absorb inputs of phosphates and organic materi-als to the GBR lagoon.
4.2. Macroalgae
Total cover of macroalgae, abundance and richness
of Rhodophyta, and abundance of Chlorophyta in-
creased along the water quality gradient from lowest
to highest nutrient and particle concentrations. Thedoubling in relative abundances in both groups was
due to small increases in a large number of genera,
rather than a take-over of one or few genera. The re-
sponse in Rhodophyta and Chlorophyta and the ab-
sence of a response in the Phaeophyta is intriguing.
While hard coral cover was strongly negatively related
to turf algal cover, it was unrelated to macroalgal cover
and abundance of Rhodophytes and Chlorophytes.While algal abundances may have been enhanced by
coral disturbance (McCook et al., 2001; Diaz-Pulido
and McCook, 2004), the data did not suggest that the
coral decline lead to a release in fleshy macroalgae at a
whole-reef scale. The pattern may instead represent a di-
rect response of Rhodophytes and Chlorophytes to
water quality, or to other unspecified habitat character-
istics along the water quality gradient. Non-calcifyingchlorophytes, such as Enteromorpha (Lotze and Sch-
ramm, 2000) and Dictyosphaeria (Smith, 1981) were
identified in previous studies of severe eutrophication
as potential indicators for nutrient enrichment, and var-
ious studies have proposed the use of Rhodophytes as
indicators of eutrophication (Lapointe, 1987; Horrocks
et al., 1995). The Rhodophyte Asparagopsis taxiformis,
one of the taxa strongly correlated with the water qual-ity gradient, is commonly found in disturbed sites, from
eutrophic inshore reefs (Diaz-Pulido and McCook,
2002) to pristine offshore sites (Hatcher, 1984). The lack
of response in the phaeophytes is consistent with previ-
ous results showing that Sargassum thrives and is nutri-
ent-replete on offshore reefs (McCook, 1996), but the
interpretation of these patterns is complex. For example,
the growth of Sargassum is enhanced by small additionsand depressed at slightly higher additions of dissolved
inorganic nutrients, but growth is also enhanced by
the adhesion of particulate matter to the leaf surfaces
in controlled laboratory studies (Schaffelke and
Klumpp, 1998; Schaffelke, 1999). Similarly, slow-release
fertilizer application suppressed brown frondose macro-
algae in a field study in the Caribbean, while enhancing
the green filamentous macroalgae Enteromorpha proli-
fera and other green turf algae and having no effect on
red algae (McClanahan et al., 2002).
Net growth rates in macroalgae can be limited by one
or a combination of factors, including nutrients, herbi-
vory, light, flow and wave action, and limitations can
depend on species, habitat types and region. In particu-
lar, herbivory is known to obscure the responses of algae
to nutrients and sediments (McCook, 2001; Miller et al.,1999; McCook et al., 2001; Jompa and McCook, 2002;
Smith et al., 2001). However, in our study, macroalgal
abundance increased with increasing nutrients within
the WT reefs, despite the relatively high abundance of
herbivores on the WT reefs. This suggests that growth
rates of some algae outstripped consumption by herbiv-
ores, perhaps due to nutrient enhanced growth or re-
duced fish grazing as a result of increased sedimenttrapping by the algae.
4.3. Hard corals
For hard corals, richness was only half as high in WT
as in PC. This was due to low abundances in the sensi-
tive taxa Acropora and Montipora, some of the Pocillo-
poridae, and some of the more persistent Pectiniidae andFungiidae. In contrast, differences were weaker in the
genera Porites, Galaxea and Turbinaria, which are
known to be among the most persistent and sediment-
and nutrient-tolerant coral genera (Done, 1982;
Stafford-Smith and Ormond, 1992; Birkeland, 2000;
Philipp and Fabricius, 2003). Coral cover has declined
due to bleaching, A. planci and a cyclone on Russell
and Normanby Reefs in WT since 1990 (Ayling andAyling, 2002), and these hard coral specific disturbances
will have strongly contributed to the low abundances of
the more sensitive taxa in WT. On these reefs, coral
cover did not recover but either remained level or
continued to decline in the years when no obvious
disturbances were recorded. A similar �1% per yeardecline in coral cover from an average of 22% in 1986
to �8% in 2002 was recorded on eight WT inshore reefsin the WT region (AIMS Long-term Monitoring Pro-
gram, unpublished manta tow data), three of which
K. Fabricius et al. / Marine Pollution Bulletin 51 (2005) 384–398 395
were part of our investigation (Barnard, Normanby, and
Fitzroy Reef). These two data sets indicate that storms,
bleaching and A. planci were the direct causes for the ob-
served decline in coral cover, explaining the low abun-
dances of genera such as Montipora and Acropora.
However, our data of a number of species graduallydecreasing along the water quality gradient suggest that
water quality conditions may have added to the effects
of other disturbances and latitude.
Along the water quality gradient, decreases were
observed in the moderately resilient, long-lived and
relatively bleaching-insensitive families Mussidae, Aga-
riciidae and Faviidae, and the pioneer family Pocillopor-
idae. In contrast, no changes along the water qualitygradient were recorded in the most sensitive genera
and families (as these taxa were largely missing in
WT), and in the toughest genera and families. A latitu-
dinal decline in hard coral richness is well established,
but the 50% difference in richness between the regions
cannot be entirely explained by latitude: hard coral rich-
ness decreases by only 25% along the whole length of the
GBR, and richness of inshore reefs increases both southand north of WT (Devantier et al., unpublished data).
Many of the species that were found in higher abun-
dances in PC than in WT in this study, also occur in
the Whitsunday Islands at the cleaner sites but not at
sites with high chlorophyll levels closer to the river
mouth (e.g., Hydnophora rigida, Palauastrea ramosa,
Acropora nobilis, Echinopora horrida, and many others;
van Woesik et al., 1999; Devantier et al., 1998). Thelow abundances or absence of many of these taxa in
WT is therefore not due to latitudinal effects and only
partly due to the specific disturbance history of the
WT, but likely to be at least partly related to water qual-
ity conditions. It is important to note that the assem-
blages on our study reefs did not undergo species
replacement from low to high nutrient conditions. In-
stead, reefs in the most nutrient-rich environments sup-ported a subset of species of the least nutrient-enriched
environments, with about 50% of species missing and
no additional species entering the assemblage.
Early life stages of hard corals are particularly sensi-
tive to changes in water quality, and coral settlement
and juvenile survival are inhibited by sedimentation
especially when sediments are organically enriched
(Babcock and Smith, 2002; Fabricius et al., 2003). Hardcoral recruitment rates are 3 times higher on PC than
WT inshore reefs, for unknown reasons (Fabricius,
unpublished data). It is possible that the main effect
of organic enrichment on hard coral assemblages is
impairment of recruitment. Thus, while the present-
day WT inshore hard coral assemblages reflect a history
of repeated disturbances, water quality may affect hard
coral assemblages by slowing their recovery rates, orby increasing their vulnerability to disturbances. In the
absence of further severe disturbances, these reefs may
eventually return to being occupied by highly diverse
hard coral assemblages.
4.4. Octocorals
Octocoral richness declined by 60% along the waterquality gradient. Octocoral richness declines with lati-
tude by �30% along the length of the GBR (Fabriciusand De�ath, 2001). Hence as with hard corals, latitudealone is insufficient to explain the difference between
the two regions. Soft coral abundance has been found
to be significantly negatively correlated with turbidity,
suspended particulate matter, silicate and total organic
sediment contents (van Woesik et al., 1999). Further-more, richness of zooxanthellate octocorals has been
found to decline along a gradient of increasing chloro-
phyll across the continental shelf off the Wet Tropics
(Fabricius and De�ath, 2004), and declines by one genusfor each meter of visibility lost in otherwise comparable
GBR habitats (Fabricius and De�ath, 2001). An investi-gation of the types of taxa missing in WT further con-
firms that water quality affects octocoral richness. Thetwo taxa found in higher abundances in WT than PC
(Briareum and Clavularia) generally occur in highest
abundances in turbid waters throughout the GBR,
whereas genera within the families Nephtheidae and
Xeniidae (that had higher representation in PC than in
WT) are generally found in moderately clear water
(Dinesen, 1983; Fabricius and Alderslade, 2001). Evi-
dence is therefore increasing that octocorals respondmore strongly and more specifically to water quality
than do hard corals.
4.5. Fish
For fish, total relative abundances were 3 times higher
in PC than WT, however there was also evidence that
total abundances declined with decreasing water quality.Importantly, fish assemblages were composed of differ-
ent suites of species in the two regions. This contrasted
with the hard corals and octocorals in which WT assem-
blages were composed of subsets of PC species rather
than different suites of species. The most striking differ-
ences in the fish assemblages were the greater abundance
of species vulnerable to fishing in PC and the greater
abundances of grazing herbivores in WT. The greaterfishing pressure in WT compared to PC (Mapstone
et al., 2004; Williams, 2002), and the observation that
any fished species in WT were generally at or below
the minimum legal size for capture (in contrast to their
large sizes in PC) strongly indicates that the difference
in species vulnerable to fishing between the regions is a
result of relative fishing pressures. The second major dif-
ference was the greater abundance of the common graz-ing herbivores in WT, with six species that comprised
the majority of grazers being more abundant in the more
396 K. Fabricius et al. / Marine Pollution Bulletin 51 (2005) 384–398
turbid waters of WT than PC. Only two common graz-
ing species were more abundant in PC than WT. The
roles of modified habitat complexity and altered food
availability for coral- and algae-feeding guilds deserve
more attention. The finding of increased herbivore
abundances in WT is intriguing as there is no evidencethat herbivore abundances are food regulated, and it
also contrasts with the conclusion of Wolanski et al.
(2003b), that the abundance of herbivorous fish in the
GBR is predicted by water clarity.
Overall, the species richness of fish on the WT and PC
inshore reefs were similar, and intermediate between
that of another well-studied inshore reef of the central
GBR south of WT (Pandora Reef) and three mid-shelfreefs of the Central GBR off Townsville (Williams,
1982). Acanthurids and labrids were notably richer on
the WT reefs than PC but, surprisingly, the largely
coral-dependent butterflyfishes (Chaetodontidae) were
equally rich (but some were less abundant) in the WT
and PC, despite differences in coral cover. Among the
WT reefs, fish diversity was particularly low on South
Barnard Island, which was characterized by a rocky sub-stratum and low dead or live coral cover. The relatively
high diversity of fish on other WT reefs may be related
to the close proximity to the diverse communities on
adjacent mid-shelf reefs that may serve as a source of
recruits (similar mid-shelf reefs in the region to the
north of PC have relatively low diversity; Williams,
unpublished data).
4.6. Assessing ecological responses in inshore reef
communities
Our study showed that detailed surveys at relatively
fine taxonomic resolution, when cautiously interpreted
in the context of available biophysical environmental
data and biological knowledge of key species, can pro-
vide important information on the health and status ofinshore coral reefs. A cross-comparison of the results
indicates that of the four taxonomic groups investigated,
octocorals were the assemblage most strongly related to
water quality. Octocoral abundances are particularly
tightly linked to physical environmental conditions
(Fabricius and De�ath, 1997; Karlson et al., 1996), pos-sibly because no major predator exists for octocorals (A.
planci do not eat octocorals; De�ath and Moran, 1998),whereas abundances of the other three groups are partly
controlled by predation: most macroalgae are affected
by fish grazing, hard corals by A. planci, and some of
the larger fish by human fishing pressure. Our data also
show strong responses in a number of Rhodophytes and
Chlorophytes to water quality, which deserves closer
investigation. Among the hard corals, water quality ef-
fects were most noticeable in the families Mussidae,Agariciidae and Faviidae, which are moderately resil-
ient, long-lived, relatively bleaching-insensitive and not
among the most preferred food for A. planci. In con-
trast, the most sensitive genera and families were largely
missing in WT, and the toughest genera and families did
not change in abundance along the water quality gradi-
ent. Changes in abundances of moderately sensitive
groups such as the Mussidae, Agariciidae and Faviidae,are therefore most suitable as indicators for environ-
mental stress. For fish, there appeared to be a relation-
ship between total abundances and water quality, and
some of the species decreased whereas others increased
in abundance with water quality.
Causes for differences in assemblages are naturally
difficult to determine definitively in ecological studies,
especially if historic data are sparse. A framework basedon epidemiological criteria can help synthesize and
weigh available evidence to assess the likelihood of a
causal association (Fabricius and De�ath, 2004). In ourstudy, both the regional differences in water quality
and assemblages, and the existence of ecological gradi-
ents along the water quality gradients, added evidence
that many of the responses were related to the differ-
ences in water quality. The changes along the waterquality gradient that were consistent in direction with
other studies (decreasing corals and increasing algae),
the monotonic responses, and the large and ecologically
relevant effect sizes, all added evidence that the inshore
reef assemblages are strongly shaped by present-day
water quality conditions. The implementation of man-
agement plans to halt or reverse a decline in water qual-
ity, through improved upstream land-use practices andwaste water treatment, is vital to ensure the long-term
health of inshore reefs of the GBR (The State of Queens-
land and Commonwealth of Australia, 2003).
Acknowledgment
We are very grateful to Michelle Skuza, MargaretWright and Jane WuWon for carrying out the water
quality analyses. Many thanks to Lyndon Devantier,
Jon Brodie and two reviewers for helpful comments to
the manuscript, and to Howard Choat for advice on
diets of scarids and acanthurids. Thanks also to a num-
ber of volunteers and the crew of the RV �The Lady Bas-ten� for invaluable support with the fieldwork. The studywas funded by the Cooperative Research Centre for theGreat Barrier Reef World Heritage Area (CRC Reef),
and the Australian Institute of Marine Science (AIMS).
References
Anthony, K.R.N., Fabricius, K.E., 2000. Shifting roles of heterotro-
phy and autotrophy in coral energetics under varying turbidity.
Journal of Experimental Marine Biology and Ecology 252, 221–
253.
K. Fabricius et al. / Marine Pollution Bulletin 51 (2005) 384–398 397
Ayling, A.M., Ayling, A.L., 2002. The dynamics of Cairns Section
Fringing Reefs: 2001. Final Report. GBRMPA, Townsville.
Babcock, R.C., Smith, L., 2002. Effects of sedimentation on coral
settlement and survivorship. In: Proceedings of the Ninth Interna-
tional Coral Reef Symposium, Bali, Indonesia, pp. 245–248.
Birkeland, C., 1988. Geographic comparisons of coral-reef community
processes. In: Choat, J.H. et al. (Eds.), Proceedings of the Sixth
International Coral Reef Symposium, Townsville (Australia),
pp. 211–220.
Birkeland, C., 2000. Changes over 23 years in a coral community at a
sewer outfall in a fast-current area of Palau. Abstract. Proceedings
of the Ninth International Coral Reef Symposium, Bali, Indonesia,
pp. 271.
Brodie, J., Furnas, M.J., Steven, A.D.L., Trott, L.A., Pantus, F.,
Wright, M., 1997. Monitoring chlorophyll in the Great Barrier
Reef Lagoon: trends and variability. In: Proceedings of the Eighth
International Coral Reef Symposium, Panama, pp. 797–802.
De�ath, G., Moran, P.J., 1998. Factors affecting the behaviour ofcrown-of-thorns starfish (Acanthaster planci L.) on the Great
Barrier Reef: 2: Feeding preferences. Journal of Experimental
Marine Biology and Ecology 220, 107–126.
Devantier, L.M., De�ath, G., Done, T.J., Turak, E., 1998. Ecologicalassessment of a complex natural system: a case study from the
Great Barrier Reef. Ecological Applications 8, 480–496.
Devlin, M., Brodie, J., Waterhouse, J., Mitchell, A., Audas, D.,
Haynes, D., 2003. Exposure of Great Barrier Reef inner-shelf reefs
to river-borne contaminants. In: Second National Conference on
Aquatic Environments: Sustaining Our Aquatic Environments—
Implementing Solutions. 20–23 November, 2001, Queensland
Department of Natural Resources and Mines, Brisbane, Australia.
Diaz-Pulido, G., McCook, L.J., 2002. The fate of bleached corals:
patterns and dynamics of algal recruitment. Marine Ecology
Progress Series 232, 115–128.
Diaz-Pulido, G., McCook, L.J., 2004. Effects of live coral, epilithic
algal communities and substrate type on algal recruitment. Coral
Reefs 23, 225–233.
Dinesen, Z.D., 1983. Patterns in the distribution of soft corals across
the central Great Barrier Reef. Coral Reefs 1, 229–236.
Done, T.J., 1982. Patterns in the distribution of coral communities
across the central Great Barrier Reef. Coral Reefs 1, 95–107.
Fabricius, K.E., in press. Effects of terrestrial runoff on the ecology of
corals and coral reefs: review and synthesis. Marine Pollution
Bulletin.
Fabricius, K., Alderslade, P., 2001. Soft Corals and Sea Fans: a
comprehensive guide to the tropical shallow water genera of the
central-west Pacific, the Indian Ocean and the Red Sea. Australian
Institute of Marine Science, Townsville, 264 pp.
Fabricius, K., De�ath, G., 1997. The effects of flow, depth and slope oncover of soft coral taxa and growth forms on Davies Reef, Great
Barrier Reef. In: Lessios, H. (Ed.), Proceedings of the Eighth
International Coral Reef Symposium. Smithsonian Tropical
Research Institute, Balboa, Panama, pp. 1071–1076.
Fabricius, K.E., De�ath, G., 2001. Biodiversity on the Great BarrierReef: large-scale patterns and turbidity-related local loss of soft
coral taxa. In: Wolanski, E. (Ed.), Oceanographic Processes of
Coral Reefs: Physical and Biological Links in the Great Barrier
Reef. CRC Press, London, pp. 127–144.
Fabricius, K.E., De�ath, G., 2004. Identifying ecological change and itscauses: a case study on coral reefs. Ecological Applications 14,
1448–1465.
Fabricius, K., Wild, C., Wolanski, E., Abele, D., 2003. Effects of
transparent exopolymer particles (TEP) and muddy terrigenous
sediments on the survival of hard coral recruits. Estuarine, Coastal
and Shelf Science 57, 613–621.
Furnas, M.J., 2003. Catchments and Corals: Terrestrial Runoff to the
Great Barrier Reef. Australian Institute of Marine Science, CRC
Reef, Townsville, Australia.
Furnas, M.J., Mitchell, A.W., 1996. Nutrient inputs into the central
Great Barrier Reef (Australia) from subsurface intrusions of Coral
Sea waters: a two-dimensional displacement model. Continental
Shelf Research 16, 1127–1148.
Grigg, R.W., 1995. Coral reefs in an urban embayment in Hawaii: a
complex case history controlled by natural and anthropogenic
stress. Coral Reefs 14, 253–266.
Hatcher, B.G., 1984. A maritime accident provides evidence for
alternate stable states in benthic communities on coral reefs. Coral
Reefs 3, 199–204.
Horrocks, J.L., Stewart, G.R., Dennison, W.C., 1995. Tissue nutrient
content of Gracilaria spp. (Rhodophyta) and water quality along
an estuarine gradient. Marine and Freshwater Research 46, 975–
983.
Hunter, C.L., Evans, C.W., 1995. Coral reefs in Kaneohe Bay, Hawaii:
two centuries of western influence and two decades of data. Bulletin
of Marine Science 57, 501–515.
Jompa, J., McCook, L.J., 2002. The effects of nutrients and herbivory
on competition between a hard coral (Porites cylindrica) and a
brown alga (Lobophora variegata). Limnology and Oceanography
47, 527–534.
Jongman, R.H.G, Ter Braak, C.J.F., van Tongeren, O.F.R. (Eds.),
1995. Data Analysis in Community and Landscape Ecology.
Cambridge University Press, p. 99.
Karlson, R.H., Hughes, T.P., Karlson, S.R., 1996. Density-dependent
dynamics of soft coral aggregations: the significance of clonal
growth and form. Ecology 77, 1592–1599.
Lapointe, B.E., 1987. Phosphorous- and nitrogen-limited photosyn-
thesis and growth of Gracilaria tikvahiae. Marine Biology 93, 561–
568.
Larcombe, P., Ridd, P.V., Prytz, A., Wilson, B., 1995. Factors
controlling suspended sediment on inner-shelf coral reefs, Towns-
ville, Australia. Coral Reefs 14, 163–171.
Longstaff, B.J., Dennison, W.C., 1999. Seagrass survival during pulsed
turbidity events: the effects of light deprivation on the seagrasses
Halodule pinifolia and Halophila ovalis. Aquatic Botany 65, 105–
121.
Lotze, H., Schramm, W., 2000. Ecopysiological traits explain species
dominance patterns in macroalgal blooms. Journal of Phycology
36, 287–295.
Loya, Y., Lubinevsky, H., Rosenfeld, M., Kramarsky-Winter, E.,
2004. Nutrient enrichment caused by in situ fish farms at Eilat, Red
Sea is detrimental to coral reproduction. Marine Pollution Bulletin
49, 344–353.
Mapstone, B.D., Davies, C.R., Little, L.R., Punt, A.E., Smith,
A.D.M., Pantus, F., Lou, D.C., Williams, A.J., Ayling, A.M.,
Russ, G.R., McDonald, A.D. et al., 2004. The effects of line fishing
on the Great Barrier Reef and evaluations of alternative potential
management strategies. CRC Reef Research Centre Technical
Report No. 52, Townsville, Australia.
McClanahan, T.R., Cokos, B.A., Sala, E., 2002. Algal growth and
species composition under experimental control of herbivory,
phosphorus and coral abundance in Glovers Reef, Belize. Marine
Pollution Bulletin 44, 441–451.
McCook, L.J., 1996. Effects of herbivores and water quality on the
distribution of Sargassum on the central Great Barrier Reef: cross-
shelf transplants. Marine Ecology Progress Series 139, 179–192.
McCook, L.J., 2001. Competition between corals and algal turfs along
a gradient of terrestrial influence in the nearshore central Great
Barrier Reef. Coral Reefs 19, 419–425.
McCook, L.J., De�ath, G., Price, I.R., Diaz-Pulido, G., Jompa, J.,2000. Macroalgal resources of the Great Barrier Reef: taxonomy,
distributions and abundances on coral reefs. Report to the Great
Barrier Reef Marine Park Authority.
McCook, L.J., Jompa, J., Diaz-Pulido, G., 2001. Competition between
corals and algae on coral reefs: a review of evidence and
mechanisms. Coral Reefs 19, 400–417.
398 K. Fabricius et al. / Marine Pollution Bulletin 51 (2005) 384–398
McCulloch, M., Fallon, S., Wyndham, T., Hendy, E., Lough, J.,
Barnes, D., 2003. Coral record of increased sediment flux to the
inner Great Barrier Reef since European settlement. Nature 421,
727–730.
Miller, M.W., Hay, M.E., Miller, S.L., Malone, D., Sotka, E.E.,
Szmant, A.M., 1999. Effects of nutrients versus herbivores on reef
algae: a new method for manipulating nutrients on coral reefs.
Limnology and Oceanography 44, 1847–1861.
Montaggioni, L.F., Cuet, P., Naim, O., Walton Smith, F.G., 1993.
Effect of nutrient excess on a modern fringing reef (Reunion Island,
Western Indian Ocean) and its geological implications. Global
aspects of coral reefs: Health, hazards and history. University of
Miami, Miami, pp. 27–33.
Philipp, E., Fabricius, K., 2003. Photophysiological stress in sclerac-
tinian corals in response to short-term sedimentation. Journal of
Experimental Marine Biology and Ecology 287, 57–78.
Raftery, A.E., 1988. Approximate Bayes factors for generalized linear
models. Department of Statistics, University of Washington.
Raftery, A.E., 1995. Bayesian model selection in social research (with
Discussion). In: Marsden, P.V. (Ed.), Sociological Methodology.
Blackwells, Cambridge, MA, pp. 111–196.
Rao, C., 1964. The use and interpretation of principal components
analysis in applied research. Sankhya A 26, 329–358.
Schaffelke, B., 1999. Particulate organic matter as an alternative
nutrient source for tropical Sargassum species (Fucales, Phaeo-
phyceae). Journal of Phycology 35, 1150–1157.
Schaffelke, B., Klumpp, D.W., 1998. Nutrient-limited growth of the
coral reef macroalga Sargassum baccularia and experimental
growth enhancement by nutrient addition in continuous flow
culture. Marine Ecology Progress Series 164, 199–211.
Schaffelke, B., Mellors, J., Duke, N.C., in press. Water quality in the
Great Barrier Reef region: responses of marine plants and
consequences of their disturbance. In: Hutchings, P.A., Haynes,
D. (Eds.), Proceedings of Catchment to Reef: Water Quality Issues
in the Great Barrier Reef Region Conference, Marine Pollution
Bulletin, this issue.
Schwarz, G., 1978. Estimating the dimension of a model. Annals of
Statistics 6, 461–464.
Short, F.T., Burdick, D.M., Kaldy III, J.E., 1995. Mesocosm
experiments quantify the effects of eutrophication on eelgrass,
Zostera marina. Limnology and Oceanography 40, 740–749.
Smith, S.V., 1981. Responses of Kaneohe Bay, Hawaii, to relaxation of
sewage stress. In: Neilson, B.J., Cronon, L.E. (Eds.), International
Conference on the Effects of Nutrient Enrichment in Estuaries, 29
May 1979, Williamsburg, VA (USA), pp. 391–412.
Smith, J.E., Smith, C.M., Hunter, C.L., 2001. An experimental
analysis of the effects of herbivory and nutrient enrichment on
benthic community dynamics on a Hawaiian reef. Coral Reefs 19,
332–342.
Stafford-Smith, M.G., Ormond, R.F.G., 1992. Sediment-rejection
mechanisms of 42 species of Australian scleractinian corals.
Australian Journal of Marine and Freshwater Research 43, 683–
705.
Statistical Sciences, 1999. S-PLUS, Version 2000 for Windows.
A division of Mathsoft Inc., Seattle.
Stimson, J., Larned, S.T., 2000. Nitrogen efflux from sediments of a
subtropical bay and the potential contribution to macroalgal
nutrient requirements. Journal of Experimental Marine Biology
and Ecology 252, 159–180.
Stimson, J., Larned, S.T., Conklin, E., 2001. Effects of herbivory,
nutrient levels, and introduced algae on the distribution and
abundance of the invasive macroalga Dictyosphaeria cavernosa in
Kaneohe Bay, Hawaii. Coral Reefs 19, 343–357.
ter Braak, C.J.F., 1992. Permutation versus bootstrap significance tests
in mulitple regression and anova. In: Jockel, K., Rothe, G.,
Sendler, W. (Eds.), Bootstrapping and Related Techniques.
Springer Verlag, Berlin, pp. 79–86.
The State of Queensland and Commonwealth of Australia, 2003. Reef
Water Quality Protection Plan; for catchments adjacent to the
Great Barrier Reef World Heritage Area. Queensland Department
of Premier and Cabinet, Brisbane.
van Woesik, R., Tomascik, T., Blake, S., 1999. Coral assemblages and
physico-chemical characteristics of the Whitsunday Islands: evi-
dence of recent community changes. Marine and Freshwater
Research 50, 427–440.
Veron, J., 2000. Corals of the World. Australian Institute of Marine
Science, Townsville.
West, K., Van Woesik, R., 2001. Spatial and temporal variance of river
discharge on Okinawa (Japan): inferring the temporal impact on
adjacent coral reefs. Marine Pollution Bulletin 42, 864–872.
Williams, D.M.B., 1982. Patterns in the distribution of fish commu-
nities across the central Great Barrier Reef. Coral Reefs 1, 35–43.
Williams, L.E., 2002. Queensland�s Fisheries Resources. CurrentCondition and Recent Trends: 2000–2002. Queensland Department
of Primary Industries Brisbane, pp. 180.
Wolanski, E., Marshall, K., Spagnol, S., 2003a. Nepheloid layer
dynamics in coastal waters of the Great Barrier Reef, Australia.
Journal of Coastal Research 19, 748–752.
Wolanski, E., Richmond, R., McCook, L., Sweatman, H., 2003b.
Mud, marine snow and coral reefs. American Scientist 91, 44–51.
Yentsch, C.S., Yentsch, C.M., Cullen, J.J., Lapointe, B., Phinney,
D.A., Yentsch, S.W., 2002. Sunlight and water transparency:
cornerstones in coral research. Journal of Experimental Marine
Biology and Ecology 268, 171–183.
Related Documents


