Change in the Properties of Linear Low-Density Polyethylene (LLDPE)/Montmorillonite Clay Nanocomposites after a Fuel-Aging Process Daniel Komatsu,* ,† Caio Ma ́ rcio Paranhos, † Tiago Vena ̂ ncio, † and Adhemar Ruvolo-Filho ‡ † Department of Chemistry and ‡ Department of Materials Engineering, Federal University of Sã o Carlos, Rodovia Washington Luís, km 235 - SP-310, Sã o Carlos, Sã o Paulo, Brazil ABSTRACT: Linear low-density polyethylene (LLDPE)/montmorillonite clay (MMT) nanocomposites were obtained by dilution of a master batch containing 20.0% clay content in a twin screw extruder to obtain samples with 1.5-10.0% clay content. Samples were aged in fuel (ethanol or gasoline) for 30 days at room temperature (25 °C). In the present study, wide-angle X-ray diffraction (WAXD) showed that ethanol interacts with clay more than gasoline does, rearranging the clay structure that was lost during the preparation of the nanocomposites. Solid-state 13 C NMR spectroscopy showed that MMT modified the morphological structure of the LLDPE matrix, making it more heterogeneous. Moreover, the fuel-aging process generates structures that are more heterogeneous than nonaged nanocomposites. Finally, fuel sorption analysis was used to verify the structure of the LLDPE matrix after the addition MMT. It was observed that the gasoline diffusion coefficients were higher than the ethanol diffusion coefficients. 1. INTRODUCTION Over the past decade, interest in polymer layered silicate nanocomposites has increased at an unprecedented level, both in industry and in academia, because of their potential for enhanced physical, chemical, and mechanical properties compared to those of conventionally filled composites. These nanocomposites have the potential of being a low-cost alternative to high-performance composites for commercial applications in both the automotive and packaging industries. It is well-known that, when layered silicates are uniformly dispersed and exfoliated into a polymer matrix, the polymer properties can be dramatically improved. These improvements can include increased strength, higher modulus, better thermal stability and barrier properties, and decreased flammability. Hence, to capitalize on the potential offered by nanoparticles in areas such as reinforcement, higher levels of fully dispersed nanoparticles must be obtained. 1,2 Polymer-clay nanocompo- sites are two-phase materials in which the polymers are reinforced by nanoscale fillers. The most heavily used filler material is based on the smectite class of aluminum silicate clays, of which the most common representative is montmor- illonite, which has been employed in many polymer-clay nanocomposite systems because it has a potentially high aspect ratio and high surface area that could potentially lead to materials with significantly improved properties and lower cost. 3-7 The dispersal of nanosized fillers into the polymer matrix affects the barrier properties of a homogeneous polymer film in two specific ways. The first way is by creating a tortuous path for gas diffusion. Because the filler materials are essentially impermeable inorganic crystals, gas molecules must diffuse around them rather than taking a (mean) direct path that lies perpendicular to the film surface. The result is a longer mean path for gas diffusion through the film in the presence of fillers. Essentially, the tortuous path allows larger effective film thicknesses to be attained with smaller amounts of polymer. 8 Whereas tortuosity is usually the primary mechanism by which nanofillers impact the barrier properties of polymer-clay nanocomposites, this is not always the case. The second way that nanoparticulate fillers influence the barrier properties is by causing changes to the polymer matrix itself in the interfacial regions. If the polymer-nanoparticle interactions are favorable, polymer strands located in close proximity to each nanoparticle can be partially immobilized. The result is that gas molecules traveling through these interfacial zones have attenuated hopping rates between free-volume holes or altered density and/or hole size, as has been observed directly by positron annihilation lifetime spectroscopy (PALS). 9 In addition, the presence of surfactants or other additives used to efficiently incorporate the filler into the matrix can also affect the diffusivity or solubility of permeants. The effects of the interfacial regions have been found to be particularly important in polymer matrixes such as polyolefins that have very high native gas permeabilities. Attempts have been made to model the effect of the interfacial regions on the diffusivity properties of migrant gases through polymer films, but the relevant parameters are not always easy to measure. Molecular diffusion in general is a random-walk process and is proportional to a driving force (concentration gradient) and inversely proportional to the resistance (length). For example, Fick’s law can be described as J A = D AB dC A /dz, where J A is the flux per unit area of species A, D AB is the diffusion constant of species A through species B, and dC A /dz is the concentration gradient of species A. Fickian diffusion assumes that each molecule proceeds along a random path and only collides with Received: November 21, 2012 Revised: April 4, 2013 Accepted: April 29, 2013 Published: April 29, 2013 Article pubs.acs.org/IECR © 2013 American Chemical Society 7382 dx.doi.org/10.1021/ie303112w | Ind. Eng. Chem. Res. 2013, 52, 7382-7390

Welcome message from author
This document is posted to help you gain knowledge. Please leave a comment to let me know what you think about it! Share it to your friends and learn new things together.
Transcript
Change in the Properties of Linear Low-Density Polyethylene(LLDPE)/Montmorillonite Clay Nanocomposites after a Fuel-AgingProcessDaniel Komatsu,*,† Caio Marcio Paranhos,† Tiago Venancio,† and Adhemar Ruvolo-Filho‡
†Department of Chemistry and ‡Department of Materials Engineering, Federal University of Sao Carlos, Rodovia Washington Luís,km 235 - SP-310, Sao Carlos, Sao Paulo, Brazil
ABSTRACT: Linear low-density polyethylene (LLDPE)/montmorillonite clay (MMT) nanocomposites were obtained bydilution of a master batch containing 20.0% clay content in a twin screw extruder to obtain samples with 1.5−10.0% clay content.Samples were aged in fuel (ethanol or gasoline) for 30 days at room temperature (25 °C). In the present study, wide-angle X-raydiffraction (WAXD) showed that ethanol interacts with clay more than gasoline does, rearranging the clay structure that was lostduring the preparation of the nanocomposites. Solid-state 13C NMR spectroscopy showed that MMT modified themorphological structure of the LLDPE matrix, making it more heterogeneous. Moreover, the fuel-aging process generatesstructures that are more heterogeneous than nonaged nanocomposites. Finally, fuel sorption analysis was used to verify thestructure of the LLDPE matrix after the addition MMT. It was observed that the gasoline diffusion coefficients were higher thanthe ethanol diffusion coefficients.
1. INTRODUCTION
Over the past decade, interest in polymer layered silicatenanocomposites has increased at an unprecedented level, bothin industry and in academia, because of their potential forenhanced physical, chemical, and mechanical propertiescompared to those of conventionally filled composites. Thesenanocomposites have the potential of being a low-costalternative to high-performance composites for commercialapplications in both the automotive and packaging industries. Itis well-known that, when layered silicates are uniformlydispersed and exfoliated into a polymer matrix, the polymerproperties can be dramatically improved. These improvementscan include increased strength, higher modulus, better thermalstability and barrier properties, and decreased flammability.Hence, to capitalize on the potential offered by nanoparticles inareas such as reinforcement, higher levels of fully dispersednanoparticles must be obtained.1,2 Polymer−clay nanocompo-sites are two-phase materials in which the polymers arereinforced by nanoscale fillers. The most heavily used fillermaterial is based on the smectite class of aluminum silicateclays, of which the most common representative is montmor-illonite, which has been employed in many polymer−claynanocomposite systems because it has a potentially high aspectratio and high surface area that could potentially lead tomaterials with significantly improved properties and lowercost.3−7
The dispersal of nanosized fillers into the polymer matrixaffects the barrier properties of a homogeneous polymer film intwo specific ways. The first way is by creating a tortuous pathfor gas diffusion. Because the filler materials are essentiallyimpermeable inorganic crystals, gas molecules must diffusearound them rather than taking a (mean) direct path that liesperpendicular to the film surface. The result is a longer meanpath for gas diffusion through the film in the presence of fillers.Essentially, the tortuous path allows larger effective film
thicknesses to be attained with smaller amounts of polymer.8
Whereas tortuosity is usually the primary mechanism by whichnanofillers impact the barrier properties of polymer−claynanocomposites, this is not always the case. The second waythat nanoparticulate fillers influence the barrier properties is bycausing changes to the polymer matrix itself in the interfacialregions. If the polymer−nanoparticle interactions are favorable,polymer strands located in close proximity to each nanoparticlecan be partially immobilized. The result is that gas moleculestraveling through these interfacial zones have attenuatedhopping rates between free-volume holes or altered densityand/or hole size, as has been observed directly by positronannihilation lifetime spectroscopy (PALS).9 In addition, thepresence of surfactants or other additives used to efficientlyincorporate the filler into the matrix can also affect thediffusivity or solubility of permeants. The effects of theinterfacial regions have been found to be particularly importantin polymer matrixes such as polyolefins that have very highnative gas permeabilities. Attempts have been made to modelthe effect of the interfacial regions on the diffusivity propertiesof migrant gases through polymer films, but the relevantparameters are not always easy to measure.Molecular diffusion in general is a random-walk process and
is proportional to a driving force (concentration gradient) andinversely proportional to the resistance (length). For example,Fick’s law can be described as JA = DAB dCA/dz, where JA is theflux per unit area of species A, DAB is the diffusion constant ofspecies A through species B, and dCA/dz is the concentrationgradient of species A. Fickian diffusion assumes that eachmolecule proceeds along a random path and only collides with
Received: November 21, 2012Revised: April 4, 2013Accepted: April 29, 2013Published: April 29, 2013
Article
pubs.acs.org/IECR
© 2013 American Chemical Society 7382 dx.doi.org/10.1021/ie303112w | Ind. Eng. Chem. Res. 2013, 52, 7382−7390
other molecules (alike or unalike) and that collisions with thepore walls do not contribute to the diffusion process. ForFickian diffusion to hold, the average distance that a moleculetravels between collisions, defined as the mean free path λ, mustbe much shorter than the dimensions of the pore. Other typesof molecular diffusion, such as Knudsen diffusion, occur when amolecule diffuses in a pore that is smaller than λ or whendiffusion occurs at very low pressures. A collision with the porewalls makes a significant contribution to the overall diffusionunder these conditions, and these collisions are taken intoaccount in Knudsen diffusion.10 The transport of smallmolecules through polymeric membranes is due to the randommotion of the individual molecules. The liquid transportprocess through the polymer occurs by a phenomenon whoseinitial mechanism is due to molecular sorption on the surfaceand subsequently by a molecular diffusion process. Theequation that thermodynamically defines this process, describedin terms of sorption and diffusion, is P = SD, where S is a termof thermodynamic nature that is determined by polymer/penetrant liquid interactions and the excess free volume thatexists in the polymer and D is a term of kinetic nature that isreflected in the mobility of the liquid through the polymermatrix, that is, it is related to the diffusion process.11 However,there are some factors that influence these processes. Forexample, solubility is affected by the presence of free volume12
and the relative polarity of the penetrant/polymer and matrix/filler. The diffusion process is affected by the presence of freevolume and the crystallinity degree of the polymer matrix,because the diffusion takes place exclusively in the amorphousphase of the polymer.13
Solid-state nuclear magnetic resonance (NMR) spectroscopyis a common technique for investigating the morphology ofsolid polymers. In particular, NMR spectroscopy offers theadvantage that local order in noncrystalline phases can bestudied, something that cannot be effectively achieved by othertechniques such as small-angle X-ray or neutron scattering. Thesolid-state NMR method is based on the study of relaxationbehavior, including determination of spin−lattice (T1) andspin−spin (T2) relaxation times of the nuclei of interest. Therelaxation times vary as a function of Tc, the correlation time.14
Within this context, the determination of proton spin−latticerelaxation times through solid-state NMR spectroscopy waschosen in this work, because it is an important tool employedto study both molecular structure and dynamic behavior. It cangenerate new support and responses on nanocompositeintermolecular interactions and structural organization. Theuse of solid-state techniques will aid in the observation ofchanges in the structural/microstructural and dynamicalbehavior, focusing on the molecular motion of the polymerchains.15
In this study, linear low-density polyethylene (LLDPE),LLDPE grafted with maleic anhydride (LLDPE-g-MA), andmontmorillonite clay (Cloisite 20A) were used. LLDPE/montmorillonite clay nanocomposites were aged at roomtemperature (25 °C) for 30 days in ethanol or gasoline. Thisstudy aimed to investigate the influence of ethanol and gasolineaging processes on the properties of nanocomposites,simulating a real situation that happens with automotive fuelstorage tanks during their lifetime. Wide-angle X-ray diffraction(WAXD), NMR spectroscopy, and gasoline and ethanolsorption analyses were performed.
2. EXPERIMENTAL SECTION
2.1. Materials. The materials used in this work were asfollows: LLDPE [melt flow index (MFI) = 0.5 g/10 min]purchased from Braskem, Sao Paulo, Brazil; montmorilloniteclay (Cloisite 20A) was purchased from Southern ClayProducts, Gonzales, TX; and linear low-density polyethylenegrafted with maleic anhydride (LLDPE-g-MA, DuPont,Fusabond MX110D, MFI = 22.9 g/10 min) was supplied byCromex Company, Sao Paulo, Brazil.
2.2. Preparation of Nanocomposites. The master batchwas prepared by bmixing LLDPE-g-MA and montmorilloniteclay at a 2:1 ratio in a mixer with a high shear rate (w = 3000rpm); this melted the LLDPE-g-MA because of the frictiongenerated inside the chamber of the mixer, to produce aconcentrate with 20% montmorillonite clay. The master batchwas then cryogenically ground in an IKA Werke M20 modelmill with rotation of 20000 rpm. It was then diluted in theLLDPE matrix to obtain nanocomposites by melt intercalationusing a B&P Process and Systems Equipment model MT19TC-25 twin-screw extruder [length/diameter ratio (L/D) = 25]with a temperature profile of 150, 170, 170, 200, and 200 °Cand a screw rotation speed of 120 rpm, to obtain nano-composites with 1.5−10.0% clay content by weight in thepolymer matrix. Samples were prepared in the form of films andplates by thermopressing at a temperature of 180 °C andsubsequently cooled under pressure (9.65 MPa) to roomtemperature.
2.3. Analysis and Characterization Techniques. Struc-tural analysis was performed by wide-angle X-ray diffraction(WAXD) using a Rigaku Geigerflex instrument with 2θscanning in the range of 1.6−30.0°, with 1.54-Å Cu Kαradiation, operating at 40 kV and 25 mA. The XRD patternsobtained were used to calculate the crystallinities of aged andnonaged samples. For this purpose, a deconvolution procedurewas applied to the XRD patterns of curves, calculating the areasrelating to the crystalline portion and the total area (partcrystalline and part amorphous) according to the Rulandmethod.16 Thus, the crystallinity of each sample was calculatedby the equation
= ×degree of crystallinity (%)crystalline area
total area100
(1)
Solid-state 13C NMR spectroscopy was performed using aBruker Avance III-400 spectrometer operating in a magneticfield of 9.4 T and with a probe for solid samples using 4-mm-diameter zirconia rotors at a rotation rate of 5 kHz. Thelongitudinal relaxation time (T1
H) was determined indirectlyusing cross-polarization and magic angle spinning (CPMAS)with sample rotation around the magic angle. All experimentswere performed at 25 °C.The ethanol and gasoline sorption analyses were performed
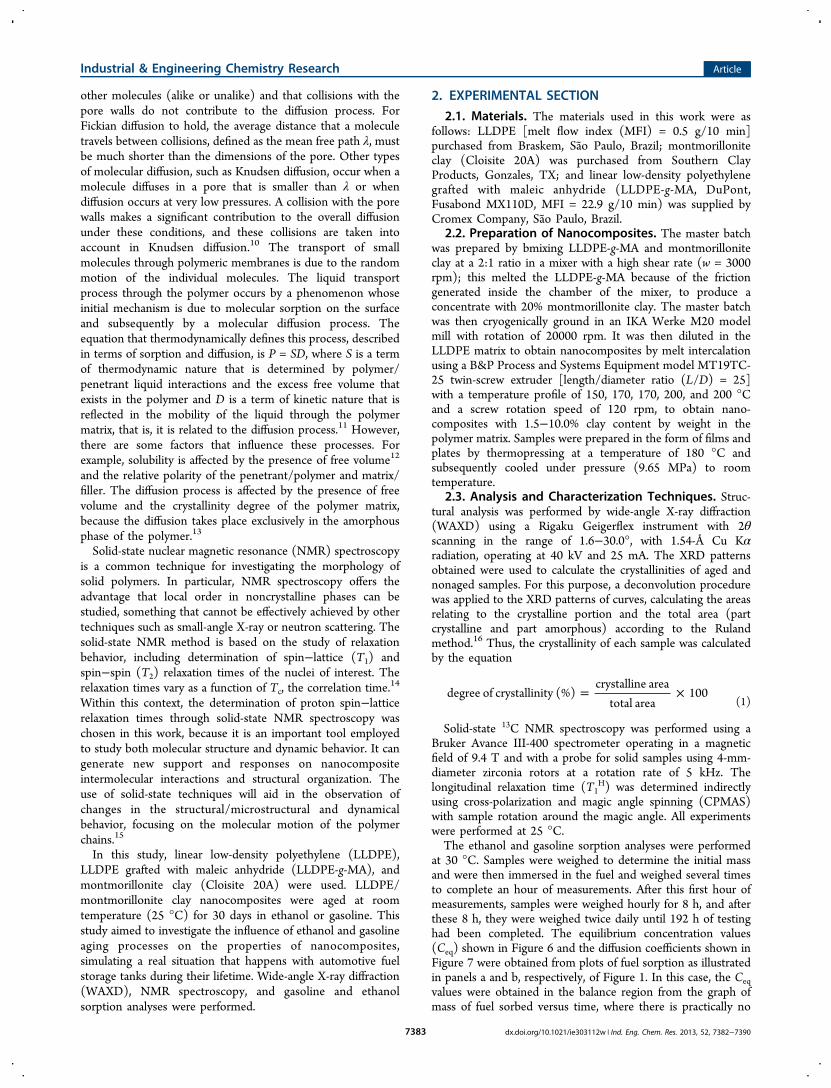
at 30 °C. Samples were weighed to determine the initial massand were then immersed in the fuel and weighed several timesto complete an hour of measurements. After this first hour ofmeasurements, samples were weighed hourly for 8 h, and afterthese 8 h, they were weighed twice daily until 192 h of testinghad been completed. The equilibrium concentration values(Ceq) shown in Figure 6 and the diffusion coefficients shown inFigure 7 were obtained from plots of fuel sorption as illustratedin panels a and b, respectively, of Figure 1. In this case, the Ceqvalues were obtained in the balance region from the graph ofmass of fuel sorbed versus time, where there is practically no
Industrial & Engineering Chemistry Research Article
dx.doi.org/10.1021/ie303112w | Ind. Eng. Chem. Res. 2013, 52, 7382−73907383
change in mass of fuel with the passage of time. The diffusioncoefficient was obtained in the sloping region near the smallsorption time values in a graph of the relative mass of fuelsorbed versus the square root of time (t1/2). The slope of thecurve is related to the value of the diffusion coefficient by theequation according to Crank and Park.17 The diffusioncoefficient (D) is given in centimeters squared per second(cm2·s−1) as shown in eq 2.
α π=DL
57.600
2 2
(2)
where α is the slope of the sorption graph and L is the samplethickness.
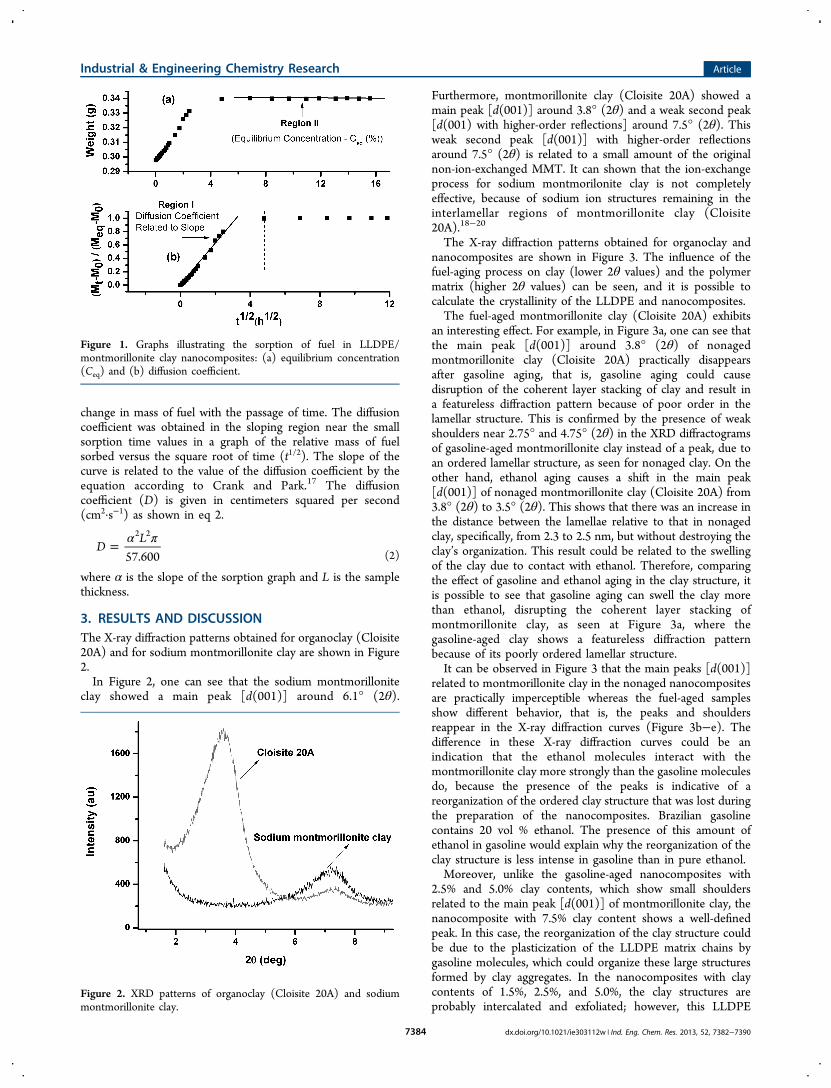
3. RESULTS AND DISCUSSIONThe X-ray diffraction patterns obtained for organoclay (Cloisite20A) and for sodium montmorillonite clay are shown in Figure2.In Figure 2, one can see that the sodium montmorillonite
clay showed a main peak [d(001)] around 6.1° (2θ).
Furthermore, montmorillonite clay (Cloisite 20A) showed amain peak [d(001)] around 3.8° (2θ) and a weak second peak[d(001) with higher-order reflections] around 7.5° (2θ). Thisweak second peak [d(001)] with higher-order reflectionsaround 7.5° (2θ) is related to a small amount of the originalnon-ion-exchanged MMT. It can shown that the ion-exchangeprocess for sodium montmorilonite clay is not completelyeffective, because of sodium ion structures remaining in theinterlamellar regions of montmorillonite clay (Cloisite20A).18−20
The X-ray diffraction patterns obtained for organoclay andnanocomposites are shown in Figure 3. The influence of thefuel-aging process on clay (lower 2θ values) and the polymermatrix (higher 2θ values) can be seen, and it is possible tocalculate the crystallinity of the LLDPE and nanocomposites.The fuel-aged montmorillonite clay (Cloisite 20A) exhibits
an interesting effect. For example, in Figure 3a, one can see thatthe main peak [d(001)] around 3.8° (2θ) of nonagedmontmorillonite clay (Cloisite 20A) practically disappearsafter gasoline aging, that is, gasoline aging could causedisruption of the coherent layer stacking of clay and result ina featureless diffraction pattern because of poor order in thelamellar structure. This is confirmed by the presence of weakshoulders near 2.75° and 4.75° (2θ) in the XRD diffractogramsof gasoline-aged montmorillonite clay instead of a peak, due toan ordered lamellar structure, as seen for nonaged clay. On theother hand, ethanol aging causes a shift in the main peak[d(001)] of nonaged montmorillonite clay (Cloisite 20A) from3.8° (2θ) to 3.5° (2θ). This shows that there was an increase inthe distance between the lamellae relative to that in nonagedclay, specifically, from 2.3 to 2.5 nm, but without destroying theclay’s organization. This result could be related to the swellingof the clay due to contact with ethanol. Therefore, comparingthe effect of gasoline and ethanol aging in the clay structure, itis possible to see that gasoline aging can swell the clay morethan ethanol, disrupting the coherent layer stacking ofmontmorillonite clay, as seen at Figure 3a, where thegasoline-aged clay shows a featureless diffraction patternbecause of its poorly ordered lamellar structure.It can be observed in Figure 3 that the main peaks [d(001)]
related to montmorillonite clay in the nonaged nanocompositesare practically imperceptible whereas the fuel-aged samplesshow different behavior, that is, the peaks and shouldersreappear in the X-ray diffraction curves (Figure 3b−e). Thedifference in these X-ray diffraction curves could be anindication that the ethanol molecules interact with themontmorillonite clay more strongly than the gasoline moleculesdo, because the presence of the peaks is indicative of areorganization of the ordered clay structure that was lost duringthe preparation of the nanocomposites. Brazilian gasolinecontains 20 vol % ethanol. The presence of this amount ofethanol in gasoline would explain why the reorganization of theclay structure is less intense in gasoline than in pure ethanol.Moreover, unlike the gasoline-aged nanocomposites with
2.5% and 5.0% clay contents, which show small shouldersrelated to the main peak [d(001)] of montmorillonite clay, thenanocomposite with 7.5% clay content shows a well-definedpeak. In this case, the reorganization of the clay structure couldbe due to the plasticization of the LLDPE matrix chains bygasoline molecules, which could organize these large structuresformed by clay aggregates. In the nanocomposites with claycontents of 1.5%, 2.5%, and 5.0%, the clay structures areprobably intercalated and exfoliated; however, this LLDPE
Figure 1. Graphs illustrating the sorption of fuel in LLDPE/montmorillonite clay nanocomposites: (a) equilibrium concentration(Ceq) and (b) diffusion coefficient.
Figure 2. XRD patterns of organoclay (Cloisite 20A) and sodiummontmorillonite clay.
Industrial & Engineering Chemistry Research Article
dx.doi.org/10.1021/ie303112w | Ind. Eng. Chem. Res. 2013, 52, 7382−73907384
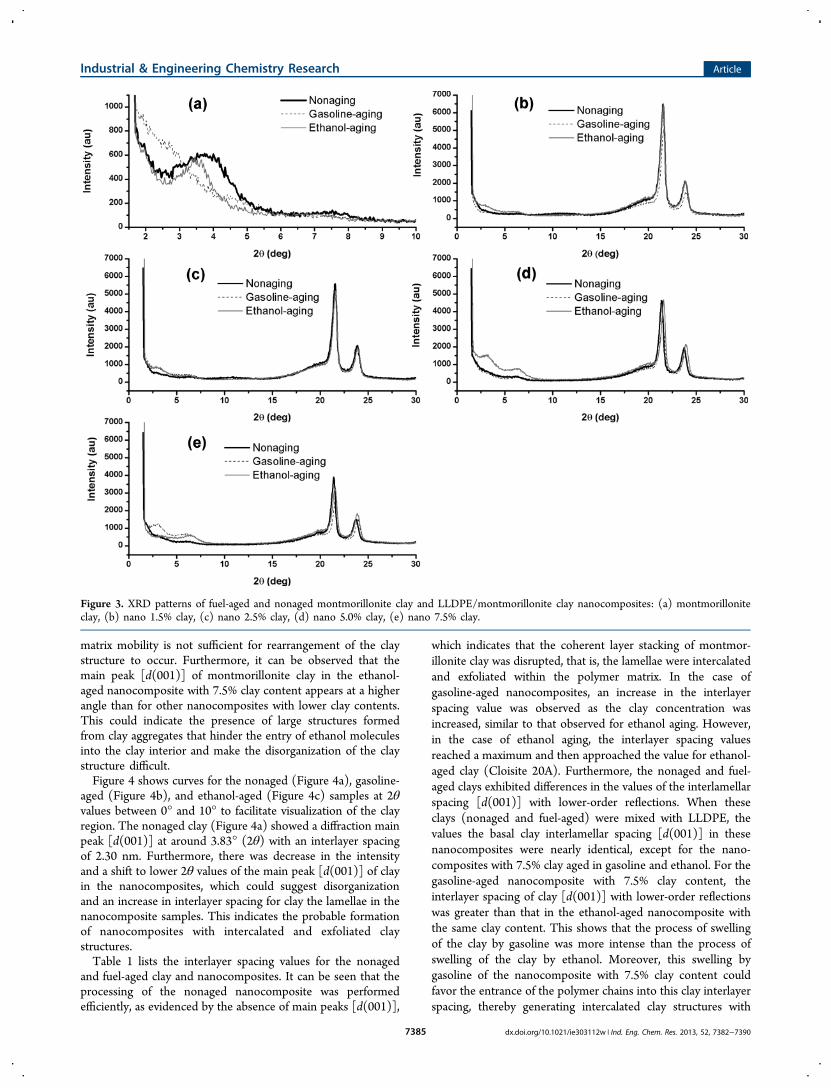
matrix mobility is not sufficient for rearrangement of the claystructure to occur. Furthermore, it can be observed that themain peak [d(001)] of montmorillonite clay in the ethanol-aged nanocomposite with 7.5% clay content appears at a higherangle than for other nanocomposites with lower clay contents.This could indicate the presence of large structures formedfrom clay aggregates that hinder the entry of ethanol moleculesinto the clay interior and make the disorganization of the claystructure difficult.Figure 4 shows curves for the nonaged (Figure 4a), gasoline-
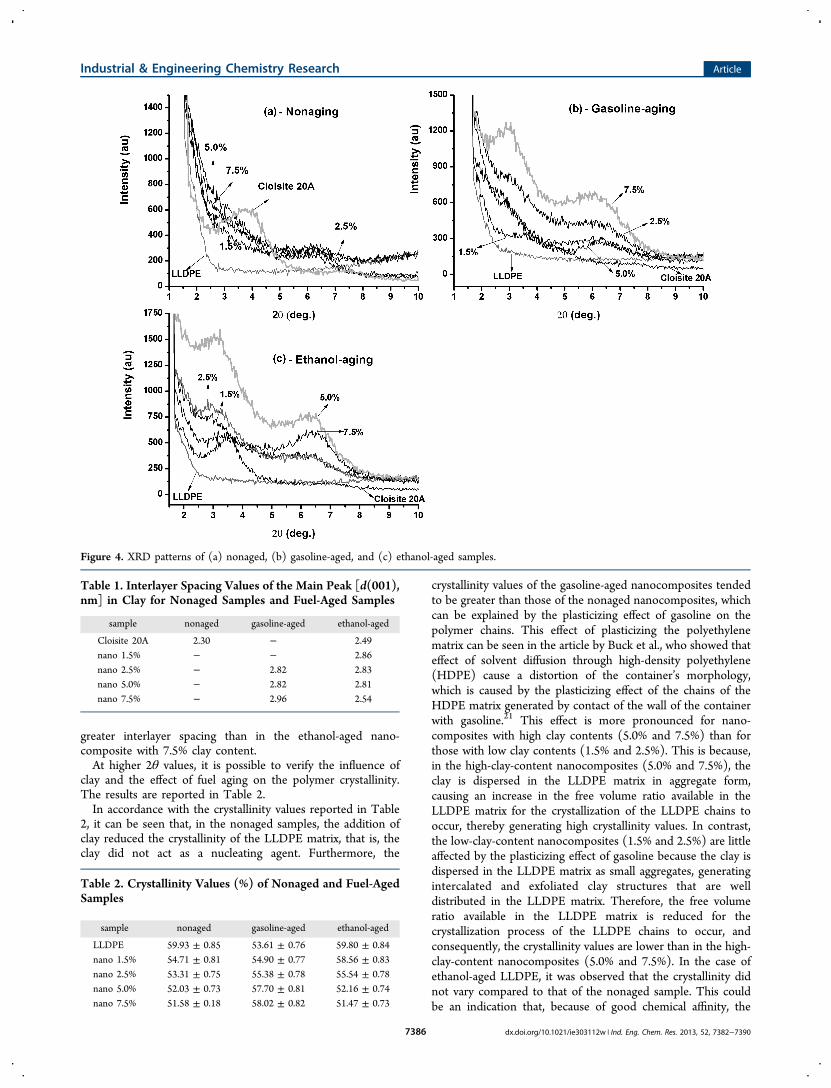
aged (Figure 4b), and ethanol-aged (Figure 4c) samples at 2θvalues between 0° and 10° to facilitate visualization of the clayregion. The nonaged clay (Figure 4a) showed a diffraction mainpeak [d(001)] at around 3.83° (2θ) with an interlayer spacingof 2.30 nm. Furthermore, there was decrease in the intensityand a shift to lower 2θ values of the main peak [d(001)] of clayin the nanocomposites, which could suggest disorganizationand an increase in interlayer spacing for clay the lamellae in thenanocomposite samples. This indicates the probable formationof nanocomposites with intercalated and exfoliated claystructures.Table 1 lists the interlayer spacing values for the nonaged
and fuel-aged clay and nanocomposites. It can be seen that theprocessing of the nonaged nanocomposite was performedefficiently, as evidenced by the absence of main peaks [d(001)],
which indicates that the coherent layer stacking of montmor-illonite clay was disrupted, that is, the lamellae were intercalatedand exfoliated within the polymer matrix. In the case ofgasoline-aged nanocomposites, an increase in the interlayerspacing value was observed as the clay concentration wasincreased, similar to that observed for ethanol aging. However,in the case of ethanol aging, the interlayer spacing valuesreached a maximum and then approached the value for ethanol-aged clay (Cloisite 20A). Furthermore, the nonaged and fuel-aged clays exhibited differences in the values of the interlamellarspacing [d(001)] with lower-order reflections. When theseclays (nonaged and fuel-aged) were mixed with LLDPE, thevalues the basal clay interlamellar spacing [d(001)] in thesenanocomposites were nearly identical, except for the nano-composites with 7.5% clay aged in gasoline and ethanol. For thegasoline-aged nanocomposite with 7.5% clay content, theinterlayer spacing of clay [d(001)] with lower-order reflectionswas greater than that in the ethanol-aged nanocomposite withthe same clay content. This shows that the process of swellingof the clay by gasoline was more intense than the process ofswelling of the clay by ethanol. Moreover, this swelling bygasoline of the nanocomposite with 7.5% clay content couldfavor the entrance of the polymer chains into this clay interlayerspacing, thereby generating intercalated clay structures with
Figure 3. XRD patterns of fuel-aged and nonaged montmorillonite clay and LLDPE/montmorillonite clay nanocomposites: (a) montmorilloniteclay, (b) nano 1.5% clay, (c) nano 2.5% clay, (d) nano 5.0% clay, (e) nano 7.5% clay.
Industrial & Engineering Chemistry Research Article
dx.doi.org/10.1021/ie303112w | Ind. Eng. Chem. Res. 2013, 52, 7382−73907385
greater interlayer spacing than in the ethanol-aged nano-composite with 7.5% clay content.At higher 2θ values, it is possible to verify the influence of
clay and the effect of fuel aging on the polymer crystallinity.The results are reported in Table 2.In accordance with the crystallinity values reported in Table
2, it can be seen that, in the nonaged samples, the addition ofclay reduced the crystallinity of the LLDPE matrix, that is, theclay did not act as a nucleating agent. Furthermore, the
crystallinity values of the gasoline-aged nanocomposites tendedto be greater than those of the nonaged nanocomposites, whichcan be explained by the plasticizing effect of gasoline on thepolymer chains. This effect of plasticizing the polyethylenematrix can be seen in the article by Buck et al., who showed thateffect of solvent diffusion through high-density polyethylene(HDPE) cause a distortion of the container’s morphology,which is caused by the plasticizing effect of the chains of theHDPE matrix generated by contact of the wall of the containerwith gasoline.21 This effect is more pronounced for nano-composites with high clay contents (5.0% and 7.5%) than forthose with low clay contents (1.5% and 2.5%). This is because,in the high-clay-content nanocomposites (5.0% and 7.5%), theclay is dispersed in the LLDPE matrix in aggregate form,causing an increase in the free volume ratio available in theLLDPE matrix for the crystallization of the LLDPE chains tooccur, thereby generating high crystallinity values. In contrast,the low-clay-content nanocomposites (1.5% and 2.5%) are littleaffected by the plasticizing effect of gasoline because the clay isdispersed in the LLDPE matrix as small aggregates, generatingintercalated and exfoliated clay structures that are welldistributed in the LLDPE matrix. Therefore, the free volumeratio available in the LLDPE matrix is reduced for thecrystallization process of the LLDPE chains to occur, andconsequently, the crystallinity values are lower than in the high-clay-content nanocomposites (5.0% and 7.5%). In the case ofethanol-aged LLDPE, it was observed that the crystallinity didnot vary compared to that of the nonaged sample. This couldbe an indication that, because of good chemical affinity, the
Figure 4. XRD patterns of (a) nonaged, (b) gasoline-aged, and (c) ethanol-aged samples.
Table 1. Interlayer Spacing Values of the Main Peak [d(001),nm] in Clay for Nonaged Samples and Fuel-Aged Samples
sample nonaged gasoline-aged ethanol-aged
Cloisite 20A 2.30 − 2.49nano 1.5% − − 2.86nano 2.5% − 2.82 2.83nano 5.0% − 2.82 2.81nano 7.5% − 2.96 2.54
Table 2. Crystallinity Values (%) of Nonaged and Fuel-AgedSamples
sample nonaged gasoline-aged ethanol-aged
LLDPE 59.93 ± 0.85 53.61 ± 0.76 59.80 ± 0.84nano 1.5% 54.71 ± 0.81 54.90 ± 0.77 58.56 ± 0.83nano 2.5% 53.31 ± 0.75 55.38 ± 0.78 55.54 ± 0.78nano 5.0% 52.03 ± 0.73 57.70 ± 0.81 52.16 ± 0.74nano 7.5% 51.58 ± 0.18 58.02 ± 0.82 51.47 ± 0.73
Industrial & Engineering Chemistry Research Article
dx.doi.org/10.1021/ie303112w | Ind. Eng. Chem. Res. 2013, 52, 7382−73907386
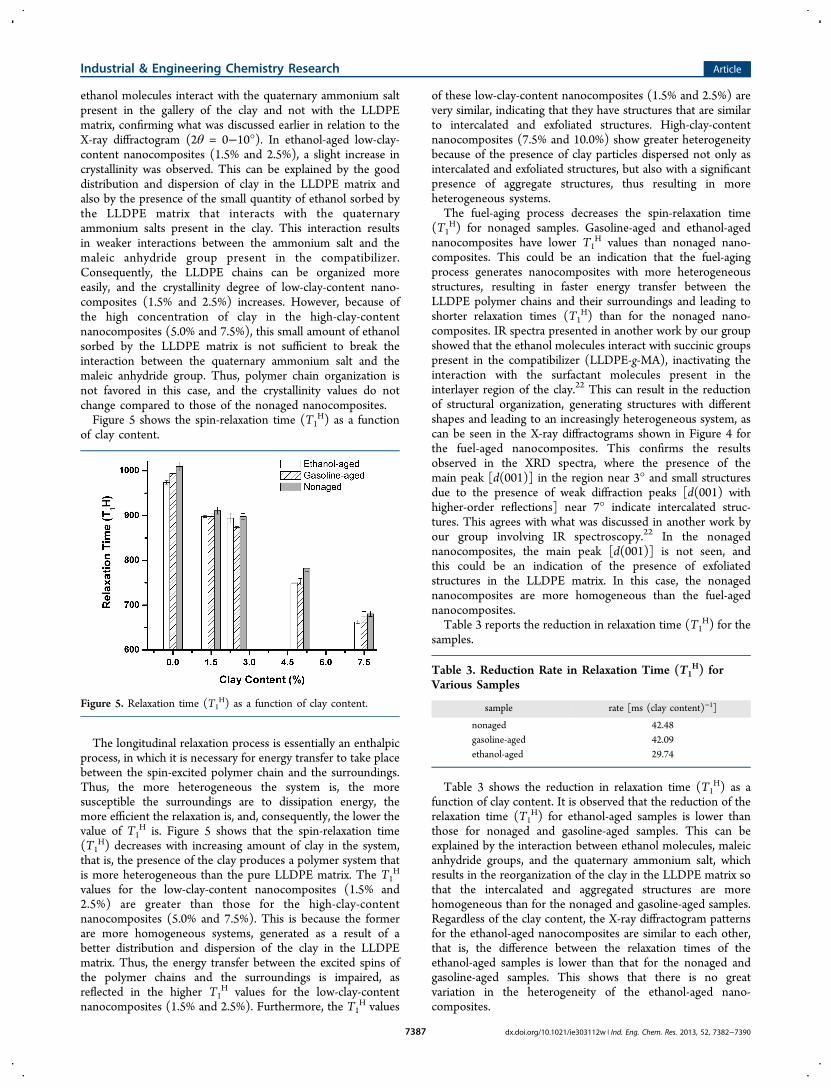
ethanol molecules interact with the quaternary ammonium saltpresent in the gallery of the clay and not with the LLDPEmatrix, confirming what was discussed earlier in relation to theX-ray diffractogram (2θ = 0−10°). In ethanol-aged low-clay-content nanocomposites (1.5% and 2.5%), a slight increase incrystallinity was observed. This can be explained by the gooddistribution and dispersion of clay in the LLDPE matrix andalso by the presence of the small quantity of ethanol sorbed bythe LLDPE matrix that interacts with the quaternaryammonium salts present in the clay. This interaction resultsin weaker interactions between the ammonium salt and themaleic anhydride group present in the compatibilizer.Consequently, the LLDPE chains can be organized moreeasily, and the crystallinity degree of low-clay-content nano-composites (1.5% and 2.5%) increases. However, because ofthe high concentration of clay in the high-clay-contentnanocomposites (5.0% and 7.5%), this small amount of ethanolsorbed by the LLDPE matrix is not sufficient to break theinteraction between the quaternary ammonium salt and themaleic anhydride group. Thus, polymer chain organization isnot favored in this case, and the crystallinity values do notchange compared to those of the nonaged nanocomposites.Figure 5 shows the spin-relaxation time (T1
H) as a functionof clay content.
The longitudinal relaxation process is essentially an enthalpicprocess, in which it is necessary for energy transfer to take placebetween the spin-excited polymer chain and the surroundings.Thus, the more heterogeneous the system is, the moresusceptible the surroundings are to dissipation energy, themore efficient the relaxation is, and, consequently, the lower thevalue of T1
H is. Figure 5 shows that the spin-relaxation time(T1
H) decreases with increasing amount of clay in the system,that is, the presence of the clay produces a polymer system thatis more heterogeneous than the pure LLDPE matrix. The T1
H
values for the low-clay-content nanocomposites (1.5% and2.5%) are greater than those for the high-clay-contentnanocomposites (5.0% and 7.5%). This is because the formerare more homogeneous systems, generated as a result of abetter distribution and dispersion of the clay in the LLDPEmatrix. Thus, the energy transfer between the excited spins ofthe polymer chains and the surroundings is impaired, asreflected in the higher T1
H values for the low-clay-contentnanocomposites (1.5% and 2.5%). Furthermore, the T1
H values
of these low-clay-content nanocomposites (1.5% and 2.5%) arevery similar, indicating that they have structures that are similarto intercalated and exfoliated structures. High-clay-contentnanocomposites (7.5% and 10.0%) show greater heterogeneitybecause of the presence of clay particles dispersed not only asintercalated and exfoliated structures, but also with a significantpresence of aggregate structures, thus resulting in moreheterogeneous systems.The fuel-aging process decreases the spin-relaxation time
(T1H) for nonaged samples. Gasoline-aged and ethanol-aged
nanocomposites have lower T1H values than nonaged nano-
composites. This could be an indication that the fuel-agingprocess generates nanocomposites with more heterogeneousstructures, resulting in faster energy transfer between theLLDPE polymer chains and their surroundings and leading toshorter relaxation times (T1
H) than for the nonaged nano-composites. IR spectra presented in another work by our groupshowed that the ethanol molecules interact with succinic groupspresent in the compatibilizer (LLDPE-g-MA), inactivating theinteraction with the surfactant molecules present in theinterlayer region of the clay.22 This can result in the reductionof structural organization, generating structures with differentshapes and leading to an increasingly heterogeneous system, ascan be seen in the X-ray diffractograms shown in Figure 4 forthe fuel-aged nanocomposites. This confirms the resultsobserved in the XRD spectra, where the presence of themain peak [d(001)] in the region near 3° and small structuresdue to the presence of weak diffraction peaks [d(001) withhigher-order reflections] near 7° indicate intercalated struc-tures. This agrees with what was discussed in another work byour group involving IR spectroscopy.22 In the nonagednanocomposites, the main peak [d(001)] is not seen, andthis could be an indication of the presence of exfoliatedstructures in the LLDPE matrix. In this case, the nonagednanocomposites are more homogeneous than the fuel-agednanocomposites.Table 3 reports the reduction in relaxation time (T1
H) for thesamples.
Table 3 shows the reduction in relaxation time (T1H) as a
function of clay content. It is observed that the reduction of therelaxation time (T1
H) for ethanol-aged samples is lower thanthose for nonaged and gasoline-aged samples. This can beexplained by the interaction between ethanol molecules, maleicanhydride groups, and the quaternary ammonium salt, whichresults in the reorganization of the clay in the LLDPE matrix sothat the intercalated and aggregated structures are morehomogeneous than for the nonaged and gasoline-aged samples.Regardless of the clay content, the X-ray diffractogram patternsfor the ethanol-aged nanocomposites are similar to each other,that is, the difference between the relaxation times of theethanol-aged samples is lower than that for the nonaged andgasoline-aged samples. This shows that there is no greatvariation in the heterogeneity of the ethanol-aged nano-composites.
Figure 5. Relaxation time (T1H) as a function of clay content.
Table 3. Reduction Rate in Relaxation Time (T1H) for
Various Samples
sample rate [ms (clay content)−1]
nonaged 42.48gasoline-aged 42.09ethanol-aged 29.74
Industrial & Engineering Chemistry Research Article
dx.doi.org/10.1021/ie303112w | Ind. Eng. Chem. Res. 2013, 52, 7382−73907387
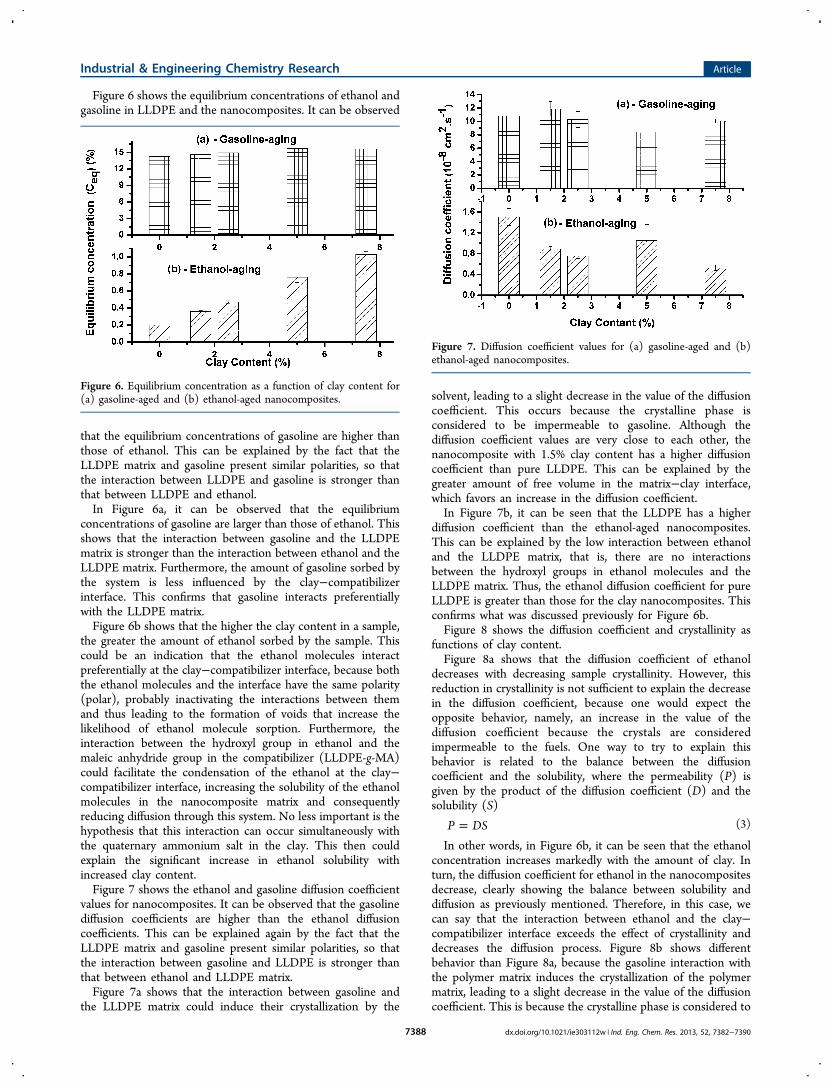
Figure 6 shows the equilibrium concentrations of ethanol andgasoline in LLDPE and the nanocomposites. It can be observed
that the equilibrium concentrations of gasoline are higher thanthose of ethanol. This can be explained by the fact that theLLDPE matrix and gasoline present similar polarities, so thatthe interaction between LLDPE and gasoline is stronger thanthat between LLDPE and ethanol.In Figure 6a, it can be observed that the equilibrium
concentrations of gasoline are larger than those of ethanol. Thisshows that the interaction between gasoline and the LLDPEmatrix is stronger than the interaction between ethanol and theLLDPE matrix. Furthermore, the amount of gasoline sorbed bythe system is less influenced by the clay−compatibilizerinterface. This confirms that gasoline interacts preferentiallywith the LLDPE matrix.Figure 6b shows that the higher the clay content in a sample,
the greater the amount of ethanol sorbed by the sample. Thiscould be an indication that the ethanol molecules interactpreferentially at the clay−compatibilizer interface, because boththe ethanol molecules and the interface have the same polarity(polar), probably inactivating the interactions between themand thus leading to the formation of voids that increase thelikelihood of ethanol molecule sorption. Furthermore, theinteraction between the hydroxyl group in ethanol and themaleic anhydride group in the compatibilizer (LLDPE-g-MA)could facilitate the condensation of the ethanol at the clay−compatibilizer interface, increasing the solubility of the ethanolmolecules in the nanocomposite matrix and consequentlyreducing diffusion through this system. No less important is thehypothesis that this interaction can occur simultaneously withthe quaternary ammonium salt in the clay. This then couldexplain the significant increase in ethanol solubility withincreased clay content.Figure 7 shows the ethanol and gasoline diffusion coefficient
values for nanocomposites. It can be observed that the gasolinediffusion coefficients are higher than the ethanol diffusioncoefficients. This can be explained again by the fact that theLLDPE matrix and gasoline present similar polarities, so thatthe interaction between gasoline and LLDPE is stronger thanthat between ethanol and LLDPE matrix.Figure 7a shows that the interaction between gasoline and
the LLDPE matrix could induce their crystallization by the
solvent, leading to a slight decrease in the value of the diffusioncoefficient. This occurs because the crystalline phase isconsidered to be impermeable to gasoline. Although thediffusion coefficient values are very close to each other, thenanocomposite with 1.5% clay content has a higher diffusioncoefficient than pure LLDPE. This can be explained by thegreater amount of free volume in the matrix−clay interface,which favors an increase in the diffusion coefficient.In Figure 7b, it can be seen that the LLDPE has a higher
diffusion coefficient than the ethanol-aged nanocomposites.This can be explained by the low interaction between ethanoland the LLDPE matrix, that is, there are no interactionsbetween the hydroxyl groups in ethanol molecules and theLLDPE matrix. Thus, the ethanol diffusion coefficient for pureLLDPE is greater than those for the clay nanocomposites. Thisconfirms what was discussed previously for Figure 6b.Figure 8 shows the diffusion coefficient and crystallinity as
functions of clay content.Figure 8a shows that the diffusion coefficient of ethanol
decreases with decreasing sample crystallinity. However, thisreduction in crystallinity is not sufficient to explain the decreasein the diffusion coefficient, because one would expect theopposite behavior, namely, an increase in the value of thediffusion coefficient because the crystals are consideredimpermeable to the fuels. One way to try to explain thisbehavior is related to the balance between the diffusioncoefficient and the solubility, where the permeability (P) isgiven by the product of the diffusion coefficient (D) and thesolubility (S)
=P DS (3)
In other words, in Figure 6b, it can be seen that the ethanolconcentration increases markedly with the amount of clay. Inturn, the diffusion coefficient for ethanol in the nanocompositesdecrease, clearly showing the balance between solubility anddiffusion as previously mentioned. Therefore, in this case, wecan say that the interaction between ethanol and the clay−compatibilizer interface exceeds the effect of crystallinity anddecreases the diffusion process. Figure 8b shows differentbehavior than Figure 8a, because the gasoline interaction withthe polymer matrix induces the crystallization of the polymermatrix, leading to a slight decrease in the value of the diffusioncoefficient. This is because the crystalline phase is considered to
Figure 6. Equilibrium concentration as a function of clay content for(a) gasoline-aged and (b) ethanol-aged nanocomposites.
Figure 7. Diffusion coefficient values for (a) gasoline-aged and (b)ethanol-aged nanocomposites.
Industrial & Engineering Chemistry Research Article
dx.doi.org/10.1021/ie303112w | Ind. Eng. Chem. Res. 2013, 52, 7382−73907388
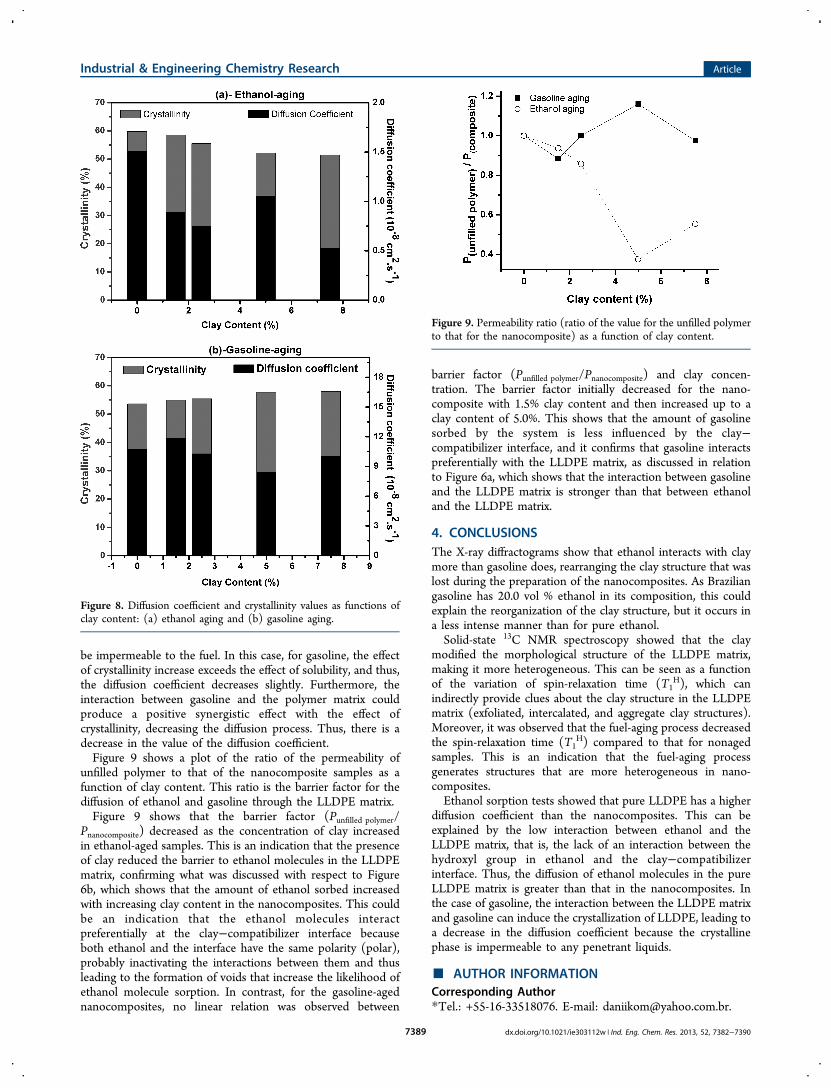
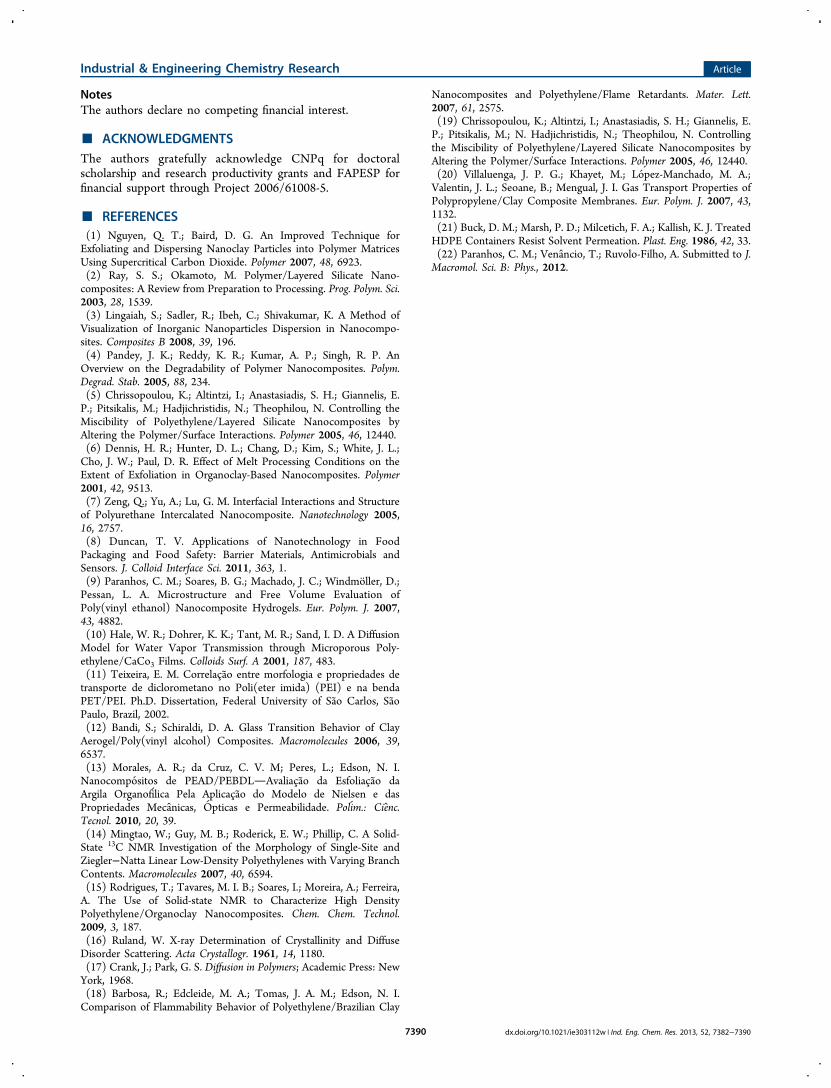
be impermeable to the fuel. In this case, for gasoline, the effectof crystallinity increase exceeds the effect of solubility, and thus,the diffusion coefficient decreases slightly. Furthermore, theinteraction between gasoline and the polymer matrix couldproduce a positive synergistic effect with the effect ofcrystallinity, decreasing the diffusion process. Thus, there is adecrease in the value of the diffusion coefficient.Figure 9 shows a plot of the ratio of the permeability of
unfilled polymer to that of the nanocomposite samples as afunction of clay content. This ratio is the barrier factor for thediffusion of ethanol and gasoline through the LLDPE matrix.Figure 9 shows that the barrier factor (Punfilled polymer/
Pnanocomposite) decreased as the concentration of clay increasedin ethanol-aged samples. This is an indication that the presenceof clay reduced the barrier to ethanol molecules in the LLDPEmatrix, confirming what was discussed with respect to Figure6b, which shows that the amount of ethanol sorbed increasedwith increasing clay content in the nanocomposites. This couldbe an indication that the ethanol molecules interactpreferentially at the clay−compatibilizer interface becauseboth ethanol and the interface have the same polarity (polar),probably inactivating the interactions between them and thusleading to the formation of voids that increase the likelihood ofethanol molecule sorption. In contrast, for the gasoline-agednanocomposites, no linear relation was observed between
barrier factor (Punfilled polymer/Pnanocomposite) and clay concen-tration. The barrier factor initially decreased for the nano-composite with 1.5% clay content and then increased up to aclay content of 5.0%. This shows that the amount of gasolinesorbed by the system is less influenced by the clay−compatibilizer interface, and it confirms that gasoline interactspreferentially with the LLDPE matrix, as discussed in relationto Figure 6a, which shows that the interaction between gasolineand the LLDPE matrix is stronger than that between ethanoland the LLDPE matrix.
4. CONCLUSIONSThe X-ray diffractograms show that ethanol interacts with claymore than gasoline does, rearranging the clay structure that waslost during the preparation of the nanocomposites. As Braziliangasoline has 20.0 vol % ethanol in its composition, this couldexplain the reorganization of the clay structure, but it occurs ina less intense manner than for pure ethanol.Solid-state 13C NMR spectroscopy showed that the clay
modified the morphological structure of the LLDPE matrix,making it more heterogeneous. This can be seen as a functionof the variation of spin-relaxation time (T1
H), which canindirectly provide clues about the clay structure in the LLDPEmatrix (exfoliated, intercalated, and aggregate clay structures).Moreover, it was observed that the fuel-aging process decreasedthe spin-relaxation time (T1
H) compared to that for nonagedsamples. This is an indication that the fuel-aging processgenerates structures that are more heterogeneous in nano-composites.Ethanol sorption tests showed that pure LLDPE has a higher
diffusion coefficient than the nanocomposites. This can beexplained by the low interaction between ethanol and theLLDPE matrix, that is, the lack of an interaction between thehydroxyl group in ethanol and the clay−compatibilizerinterface. Thus, the diffusion of ethanol molecules in the pureLLDPE matrix is greater than that in the nanocomposites. Inthe case of gasoline, the interaction between the LLDPE matrixand gasoline can induce the crystallization of LLDPE, leading toa decrease in the diffusion coefficient because the crystallinephase is impermeable to any penetrant liquids.
■ AUTHOR INFORMATIONCorresponding Author*Tel.: +55-16-33518076. E-mail: [email protected].
Figure 8. Diffusion coefficient and crystallinity values as functions ofclay content: (a) ethanol aging and (b) gasoline aging.
Figure 9. Permeability ratio (ratio of the value for the unfilled polymerto that for the nanocomposite) as a function of clay content.
Industrial & Engineering Chemistry Research Article
dx.doi.org/10.1021/ie303112w | Ind. Eng. Chem. Res. 2013, 52, 7382−73907389
NotesThe authors declare no competing financial interest.
■ ACKNOWLEDGMENTSThe authors gratefully acknowledge CNPq for doctoralscholarship and research productivity grants and FAPESP forfinancial support through Project 2006/61008-5.
■ REFERENCES(1) Nguyen, Q. T.; Baird, D. G. An Improved Technique forExfoliating and Dispersing Nanoclay Particles into Polymer MatricesUsing Supercritical Carbon Dioxide. Polymer 2007, 48, 6923.(2) Ray, S. S.; Okamoto, M. Polymer/Layered Silicate Nano-composites: A Review from Preparation to Processing. Prog. Polym. Sci.2003, 28, 1539.(3) Lingaiah, S.; Sadler, R.; Ibeh, C.; Shivakumar, K. A Method ofVisualization of Inorganic Nanoparticles Dispersion in Nanocompo-sites. Composites B 2008, 39, 196.(4) Pandey, J. K.; Reddy, K. R.; Kumar, A. P.; Singh, R. P. AnOverview on the Degradability of Polymer Nanocomposites. Polym.Degrad. Stab. 2005, 88, 234.(5) Chrissopoulou, K.; Altintzi, I.; Anastasiadis, S. H.; Giannelis, E.P.; Pitsikalis, M.; Hadjichristidis, N.; Theophilou, N. Controlling theMiscibility of Polyethylene/Layered Silicate Nanocomposites byAltering the Polymer/Surface Interactions. Polymer 2005, 46, 12440.(6) Dennis, H. R.; Hunter, D. L.; Chang, D.; Kim, S.; White, J. L.;Cho, J. W.; Paul, D. R. Effect of Melt Processing Conditions on theExtent of Exfoliation in Organoclay-Based Nanocomposites. Polymer2001, 42, 9513.(7) Zeng, Q.; Yu, A.; Lu, G. M. Interfacial Interactions and Structureof Polyurethane Intercalated Nanocomposite. Nanotechnology 2005,16, 2757.(8) Duncan, T. V. Applications of Nanotechnology in FoodPackaging and Food Safety: Barrier Materials, Antimicrobials andSensors. J. Colloid Interface Sci. 2011, 363, 1.(9) Paranhos, C. M.; Soares, B. G.; Machado, J. C.; Windmoller, D.;Pessan, L. A. Microstructure and Free Volume Evaluation ofPoly(vinyl ethanol) Nanocomposite Hydrogels. Eur. Polym. J. 2007,43, 4882.(10) Hale, W. R.; Dohrer, K. K.; Tant, M. R.; Sand, I. D. A DiffusionModel for Water Vapor Transmission through Microporous Poly-ethylene/CaCo3 Films. Colloids Surf. A 2001, 187, 483.(11) Teixeira, E. M. Correlacao entre morfologia e propriedades detransporte de diclorometano no Poli(eter imida) (PEI) e na bendaPET/PEI. Ph.D. Dissertation, Federal University of Sao Carlos, SaoPaulo, Brazil, 2002.(12) Bandi, S.; Schiraldi, D. A. Glass Transition Behavior of ClayAerogel/Poly(vinyl alcohol) Composites. Macromolecules 2006, 39,6537.(13) Morales, A. R.; da Cruz, C. V. M; Peres, L.; Edson, N. I.Nanocompositos de PEAD/PEBDLAvaliacao da Esfoliacao daArgila Organofilica Pela Aplicacao do Modelo de Nielsen e dasPropriedades Mecanicas, Opticas e Permeabilidade. Polim.: Cienc.Tecnol. 2010, 20, 39.(14) Mingtao, W.; Guy, M. B.; Roderick, E. W.; Phillip, C. A Solid-State 13C NMR Investigation of the Morphology of Single-Site andZiegler−Natta Linear Low-Density Polyethylenes with Varying BranchContents. Macromolecules 2007, 40, 6594.(15) Rodrigues, T.; Tavares, M. I. B.; Soares, I.; Moreira, A.; Ferreira,A. The Use of Solid-state NMR to Characterize High DensityPolyethylene/Organoclay Nanocomposites. Chem. Chem. Technol.2009, 3, 187.(16) Ruland, W. X-ray Determination of Crystallinity and DiffuseDisorder Scattering. Acta Crystallogr. 1961, 14, 1180.(17) Crank, J.; Park, G. S. Diffusion in Polymers; Academic Press: NewYork, 1968.(18) Barbosa, R.; Edcleide, M. A.; Tomas, J. A. M.; Edson, N. I.Comparison of Flammability Behavior of Polyethylene/Brazilian Clay
Nanocomposites and Polyethylene/Flame Retardants. Mater. Lett.2007, 61, 2575.(19) Chrissopoulou, K.; Altintzi, I.; Anastasiadis, S. H.; Giannelis, E.P.; Pitsikalis, M.; N. Hadjichristidis, N.; Theophilou, N. Controllingthe Miscibility of Polyethylene/Layered Silicate Nanocomposites byAltering the Polymer/Surface Interactions. Polymer 2005, 46, 12440.(20) Villaluenga, J. P. G.; Khayet, M.; Lopez-Manchado, M. A.;Valentin, J. L.; Seoane, B.; Mengual, J. I. Gas Transport Properties ofPolypropylene/Clay Composite Membranes. Eur. Polym. J. 2007, 43,1132.(21) Buck, D. M.; Marsh, P. D.; Milcetich, F. A.; Kallish, K. J. TreatedHDPE Containers Resist Solvent Permeation. Plast. Eng. 1986, 42, 33.(22) Paranhos, C. M.; Venancio, T.; Ruvolo-Filho, A. Submitted to J.Macromol. Sci. B: Phys., 2012.
Industrial & Engineering Chemistry Research Article
dx.doi.org/10.1021/ie303112w | Ind. Eng. Chem. Res. 2013, 52, 7382−73907390
Related Documents