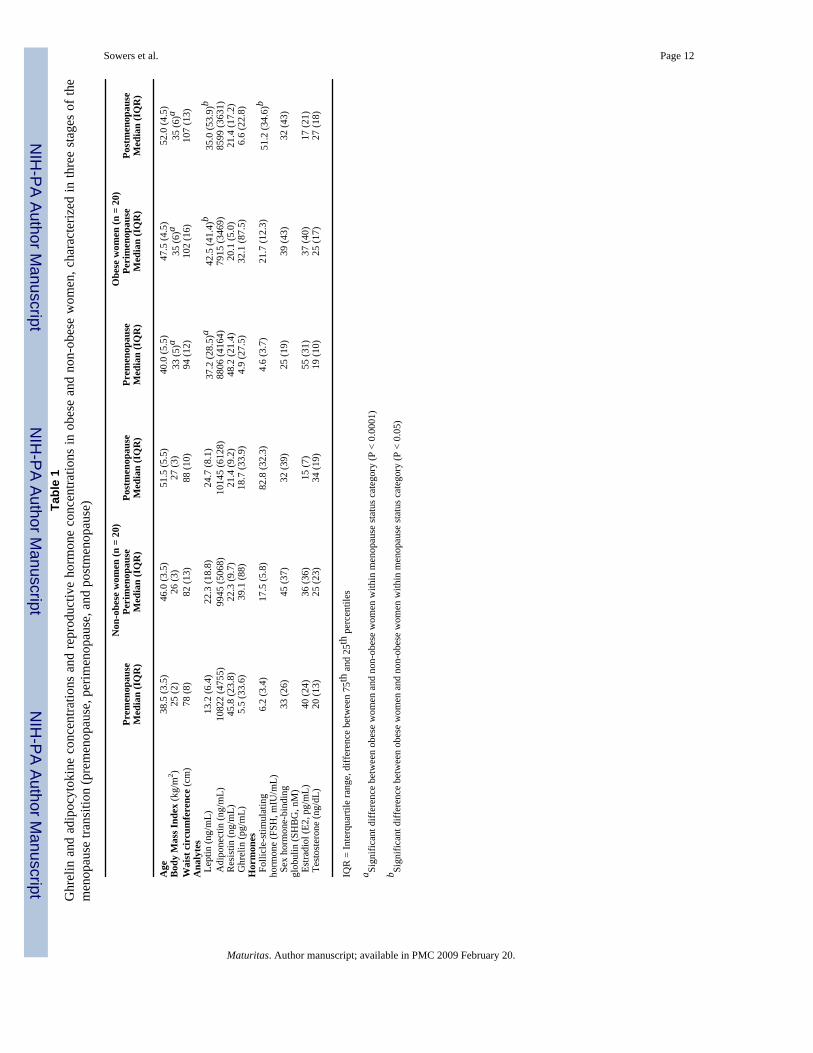
CHANGE IN ADIPOCYTOKINES AND GHRELIN WITH MENOPAUSE MaryFran R. Sowers 1 , Rachel P. Wildman 2 , Peter Mancuso 3 , Aimee D. Eyvazzadeh 1,4 , Carrie A. Karvonen-Gutierrez 1 , Eileen Rillamas-Sun 1 , and Mary L. Jannausch 1 1Department of Epidemiology, University of Michigan School of Public Health, Ann Arbor, MI 2Department of Epidemiology and Population Health, Albert Einstein College of Medicine, Bronx, NY 3Department of Environmental Health Sciences, University of Michigan School of Public Health, Ann Arbor, MI 4Department of Obstetrics and Gynecology, University of Michigan, Ann Arbor, MI Abstract Objectives—To determine if ghrelin and adipocytokine (leptin, adiponectin, resistin) levels vary with menopause stage or with estradiol (E2), testosterone (T), follicle-stimulating hormone (FSH) and sex hormone-binding globulin (SHBG) concentrations measured in three stages of the menopause transition. Methods—A study of adipocytokines and menopause was nested in a population-based, longitudinal study of Caucasian women [Michigan Bone Health and Metabolism Study (MBHMS)]. Annual serum and urine samples, available from the MBHMS repository, were selected to correspond to the pre-, peri-, and postmenopause stages of the menopause transition. Participants included forty women, stratified into obese vs. non-obese groups based upon their baseline body mass index, who had specimens corresponding to the three menopause stages. Results—Mean resistin levels were approximately two times higher during premenopause compared to peri- or postmenopause. There were significantly lower adiponectin and higher ghrelin levels in the perimenopause stage, compared to either the pre- or postmenopause stage. Increases in FSH concentrations were significantly and positively associated with higher leptin in non-obese women (P<0.01) but not in obese women (P<0.23). Increases in FSH concentrations were also significantly (P<0.005) and positively associated with higher adiponectin concentrations but were negatively associated with ghrelin concentrations (P<0.005). Associations remained following adjustment for waist circumference, waist circumference change, chronological age, and time between measures. Conclusions—Menopause stages and underlying FSH changes are associated with notable changes in levels of the metabolically-active adipocytokines and ghrelin and these changes may be related to selected health outcomes observed in women at mid-life. Correspondence and reprints to: MaryFran Sowers, PhD, Department of Epidemiology, University of Michigan School of Public Health, 339 East Liberty Street Suite 310, Ann Arbor, MI 48104, Phone: 734-936-3892, Fax: 734-998-8027, Email: [email protected]. Publisher's Disclaimer: This is a PDF file of an unedited manuscript that has been accepted for publication. As a service to our customers we are providing this early version of the manuscript. The manuscript will undergo copyediting, typesetting, and review of the resulting proof before it is published in its final citable form. Please note that during the production process errors may be discovered which could affect the content, and all legal disclaimers that apply to the journal pertain. NIH Public Access Author Manuscript Maturitas. Author manuscript; available in PMC 2009 February 20. Published in final edited form as: Maturitas. 2008 February 20; 59(2): 149–157. NIH-PA Author Manuscript NIH-PA Author Manuscript NIH-PA Author Manuscript

Welcome message from author
This document is posted to help you gain knowledge. Please leave a comment to let me know what you think about it! Share it to your friends and learn new things together.
Transcript

CHANGE IN ADIPOCYTOKINES AND GHRELIN WITHMENOPAUSE
MaryFran R. Sowers1, Rachel P. Wildman2, Peter Mancuso3, Aimee D. Eyvazzadeh1,4, CarrieA. Karvonen-Gutierrez1, Eileen Rillamas-Sun1, and Mary L. Jannausch1
1Department of Epidemiology, University of Michigan School of Public Health, Ann Arbor, MI
2Department of Epidemiology and Population Health, Albert Einstein College of Medicine, Bronx, NY
3Department of Environmental Health Sciences, University of Michigan School of Public Health, Ann Arbor,MI
4Department of Obstetrics and Gynecology, University of Michigan, Ann Arbor, MI
AbstractObjectives—To determine if ghrelin and adipocytokine (leptin, adiponectin, resistin) levels varywith menopause stage or with estradiol (E2), testosterone (T), follicle-stimulating hormone (FSH)and sex hormone-binding globulin (SHBG) concentrations measured in three stages of themenopause transition.
Methods—A study of adipocytokines and menopause was nested in a population-based,longitudinal study of Caucasian women [Michigan Bone Health and Metabolism Study (MBHMS)].Annual serum and urine samples, available from the MBHMS repository, were selected to correspondto the pre-, peri-, and postmenopause stages of the menopause transition. Participants included fortywomen, stratified into obese vs. non-obese groups based upon their baseline body mass index, whohad specimens corresponding to the three menopause stages.
Results—Mean resistin levels were approximately two times higher during premenopausecompared to peri- or postmenopause. There were significantly lower adiponectin and higher ghrelinlevels in the perimenopause stage, compared to either the pre- or postmenopause stage. Increases inFSH concentrations were significantly and positively associated with higher leptin in non-obesewomen (P<0.01) but not in obese women (P<0.23). Increases in FSH concentrations were alsosignificantly (P<0.005) and positively associated with higher adiponectin concentrations but werenegatively associated with ghrelin concentrations (P<0.005). Associations remained followingadjustment for waist circumference, waist circumference change, chronological age, and timebetween measures.
Conclusions—Menopause stages and underlying FSH changes are associated with notablechanges in levels of the metabolically-active adipocytokines and ghrelin and these changes may berelated to selected health outcomes observed in women at mid-life.
Correspondence and reprints to: MaryFran Sowers, PhD, Department of Epidemiology, University of Michigan School of PublicHealth, 339 East Liberty Street Suite 310, Ann Arbor, MI 48104, Phone: 734-936-3892, Fax: 734-998-8027, Email:[email protected]'s Disclaimer: This is a PDF file of an unedited manuscript that has been accepted for publication. As a service to our customerswe are providing this early version of the manuscript. The manuscript will undergo copyediting, typesetting, and review of the resultingproof before it is published in its final citable form. Please note that during the production process errors may be discovered which couldaffect the content, and all legal disclaimers that apply to the journal pertain.
NIH Public AccessAuthor ManuscriptMaturitas. Author manuscript; available in PMC 2009 February 20.
Published in final edited form as:Maturitas. 2008 February 20; 59(2): 149–157.
NIH
-PA Author Manuscript
NIH
-PA Author Manuscript
NIH
-PA Author Manuscript
KeywordsMenopause; adipocytokines; leptin; adiponectin; resistin; ghrelin; obesity
INTRODUCTIONLongitudinally, we have demonstrated changes in body fat and its distribution during themenopause transition [1], but the health-related implications for these body compositionchanges are ill-defined. In addition to being an energy reservoir, adipose tissue is an endocrineorgan and site of sex steroid metabolism and leptin production [2–4]. It remains to bedemonstrated whether sex steroid production or their change impacts the size and distributionof fat cells or, conversely, whether products associated with fat cells influence sex steroid levelchanges, particularly those associated with the menopause.
Reports suggest that adipocytokines and ghrelin are related to reproduction and menopause.In studies of infertility, high leptin levels reduce ovarian responsiveness to gonadotropintreatment [5] leading investigators to suggest that leptin represents a physiological link betweenobesity and infertility [6]. Agarwal [6] argued that high physiologic concentrations of leptincould interfere with the dominant follicle's estradiol (E2) production and with aromataseenzyme activity or expression. Such an effect could produce an inadequate luteinizing hormone(LH) surge and an immature or absent preovulatory follicle. Since the menopause transitionincludes a diminished number of follicles available for selection and the increasing likelihoodthat no viable dominant follicle is produced, factors that impinge upon follicle selection mayalter age at menopause.
Compared to non-obese women, obese women may have a different age at menopause,different menopausal bleeding patterns and symptom pattern [7], but there have been limitedstudy of the adipocytokines to explain this variation. In Japanese women, adiponectin levelswere similar in premenopausal and postmenopausal women [8]. Ghrelin was negativelycorrelated with measures of adiposity in postmenopausal women, but exhibited no correlationwith any measure of adiposity in premenopausal women [9]. Others have reported that estrogenis a negative regulator of resistin gene expression [10].
Using a nested prospective study design, we assayed adipocytokines and ghrelin from samplesin 40 women using specimens from three stages of their menopause transition (pre-, peri, andpostmenopause), combined with existing information about body size and sex steroid hormoneconcentrations. Recognizing that there are differences in adipocytokines by body size, an equalnumber of obese and non-obese women were evaluated to address the following questions:
1. Is there an association of menopause stage with the adipocytokines and ghrelin, andare these the same in obese and non-obese women?
2. Are follicle-stimulating hormone (FSH), estradiol (E2), total testosterone (T) and sexhormone-binding globulin (SHBG) concentrations measured in three menopausestages associated with adipocytokine and ghrelin measures and their changes?
With the increasing prevalence of obesity, it is important to identify if adipose-tissue derivedadipocytokines alter risks for health outcomes during the menopause experience.
Sowers et al. Page 2
Maturitas. Author manuscript; available in PMC 2009 February 20.
NIH
-PA Author Manuscript
NIH
-PA Author Manuscript
NIH
-PA Author Manuscript
METHODS AND MATERIALSStudy Population and Sample Selection
Specimens and data were assembled from the longitudinal Michigan Bone Health andMetabolism Study (MBHMS) located in Tecumseh, Michigan. MBHMS enrollees were thepremenopausal female offspring of the Tecumseh Community Health Study (TCHS)participants. MBHMS enrollees were recruited for study in 1988 when they were 20 to 40 yearsof age and premenopausal. In 1992, Tecumseh female residents whose parents had notparticipated in TCHS were identified and enrolled using a population-based sampling framethat included age, name, address and telephone number; 121 additional women were enrolled.Therefore, the MBHMS cohort consists of 664 women, aged 24 to 44 years in 1992. Womenhave been followed annually since 1992, and at follow-up visits, specimens (urine and blood)and information about menstrual bleeding patterns are collected.
This study includes three measures (premenopause, perimenopause, postmenopause) nestedwithin the larger longitudinal MBHMS study as shown in Figure 1. Women were excludedfrom analyses if all menopause stages were not represented (i.e., if they were still pre- orperimenopausal at the latest MBHMS visit). Also excluded were hormone therapy (HT) usersand those with hysterectomy or a bilateral oophorectomy, diabetes, or thyroid disease. Womenselected were limited to two baseline body size groups (BMI 23–27 kg/m2 or BMI 29–36 kg/m2) so women who did not have a BMI in the ranges of interest were excluded. Writteninformed consent was obtained from all participants, and this study was approved by theUniversity of Michigan Institutional Review Board.
MeasurementsMenopause stages were defined by menstrual bleeding regularity and follicle-stimulatinghormone (FSH) levels. A woman was classified as premenopausal with menstrual regularityand an FSH < 10 mIU/mL at the study visit. Perimenopause was defined with menstrualirregularity and an FSH value between 10 and 40 mIU/mL. Postmenopausal women had atleast twelve consecutive months of amenorrhea with no other medical cause and an FSH > 40mIU/mL. Specimens were collected in days 2–7 of the follicular phase of the menstrual cyclein the morning and following an overnight fast. In postmenopausal women, specimens werecollected on the anniversary of her study enrollment ± 15 days. Specimens were aliquoted andstored at −80 degrees Centigrade without thaw until assay.
Adipocytokines and Ghrelin—Serum adipocytokines (leptin, adiponectin, and resistin)and acylated ghrelin were determined spectrophotometrically using commercially availablecolorimetric enzyme immunoassay kits (leptin and acylated ghrelin kits, Cayman Chemical,Ann Arbor, MI and adiponectin and resistin, Linco, St. Charles, MO). The mean coefficientof variation percent (CV%) and standard errors for duplicate samples for each subject andlower limit of detection, respectively, were: adiponectin: 4.64 ± 0.34, 1.5 ng/mL; leptin: 4.22± 0.36, 1 ng/mL; resistin: 3.65 ± 0.24, 0.16 ng/mL; and, acylated ghrelin: 8.77 ± 1.24, 2 pg/mL.
Sex Steroid Hormones—Follicle-stimulating hormone (FSH) concentrations weremeasured with a two-site chemiluminometric immunoassay directed to different regions onthe beta subunit with CV% of 12.0% and 6.0% and a lower limit of detection of 1.05 mIU/mL.Serum E2 concentrations were measured with a modified, off-line ACS:180 (E2-6)immunoassay to increase sensitivity, with a lower limit of detection of 1.0 pg/mL and CVs%of 10.6% and 6.4%. SHBG was assessed using a de novo two-site chemiluminescent assaydeveloped on-site using rabbit anti-SHBG antibodies, with a CV% of 9.9% and 6.1% and lowerlimit of detection of 1.95 nM. Serum testosterone (T) concentrations were determined by
Sowers et al. Page 3
Maturitas. Author manuscript; available in PMC 2009 February 20.
NIH
-PA Author Manuscript
NIH
-PA Author Manuscript
NIH
-PA Author Manuscript
competitive binding of a DMAE-labeled T derivative to a rabbit polyclonal anti--testosteroneantibody premixed with monoclonal anti-rabbit IgG antibody immobilized on the solid phaseparamagnetic particles. Inter- and intra-assay coefficients of variation were 10.5% and 8.5%,respectively, and the lower limit of detection was 2 ng/dl.
Anthropometric Measures—Height (cm) and weight (kg) were measured at annual visitsusing calibrated stadiometers and balance-beam scales, respectively. BMI was calculated bydividing the weight (in kilograms) by the square of the height (in meters). Data were organizedas non-obese if the baseline BMI was 23 to 27 kg/m2 and obese if the baseline BMI was 29 to36 kg/m2. Waist circumference was measured in centimeters at the narrowest point betweenthe rib cage and iliac crest using a non-stretching tape.
Data analysesMedian and inter-quartile ranges were calculated for adipocytokines and ghrelin measures, sexsteroid hormone measures (E2, FSH, SHBG, total T), age, and BMI. Non-normal measureswere log-transformed for data analyses. Adipocytokines and ghrelin were modeled as thedependent variables while menopause state and sex steroid hormones were modeled as theindependent variables. Longitudinal regression models were used to estimate beta coefficientsas well as provide the LSmeans and standard errors for the adipocytokines at each menopausestage while adjusting for age at the pre-menopause stage, waist circumference, waistcircumference change, and time interval between each menopause stage date of collection. Byadjusting for premenopausal age as well as the duration of time between menopausal states,the changes in adipocytokines/ghrelin modeled are those across the menopause transition,independent of chronological aging. Adjustment was made for baseline waist circumferenceand waist circumference change between the previous and current menopausal state becausewaist increases across the menopause transition. A first-order autoregressive covariancestructure was assumed for longitudinal models. P-values < 0.05 were considered statisticallysignificant; all analyses were completed using SAS v9.1 software.
RESULTSNon-obese women had a median age of 38.5 years at the premenopausal time point and 51.5years at the postmenopausal time point (Table 1). Obese women had a median age of 40.0 and52.0 years at the pre- and postmenopausal time points, respectively.
As shown in Table 1, in any given menopause status group, obese women had leptinconcentrations that were greater than those of non-obese women (P < 0.05), and this differencepersisted after adjustment for covariates (Figure 2). Adiponectin concentrations were lower inthe obese group than the non-obese group although these values were not statisticallysignificantly different (Table 1). Median resistin and ghrelin concentrations were not differentin the two body size groups (Table 1).
Leptin, menopause stage, and hormonesWhile mean leptin levels increased in non-obese women from their pre- to postmenopausestage (P < 0.05) (Figure 2), this association was largely accounted for when adjusting for waistcircumference, waist circumference change, and the time interval between menopause stages.In the obese group, there was no association of leptin with menopause stage before or afteradjusting for covariates.
Baseline FSH levels were not associated with leptin levels, but FSH change [β (SE): 0.209(0.08), p=0.014] was positively associated with leptin levels in non-obese women (Table 2).
Sowers et al. Page 4
Maturitas. Author manuscript; available in PMC 2009 February 20.
NIH
-PA Author Manuscript
NIH
-PA Author Manuscript
NIH
-PA Author Manuscript
In obese women, there was no association between leptin change and change in FSHconcentrations.
E2, T, and their respective changes were not significantly associated with leptin concentrations.Change in SHBG was negatively associated with leptin levels in the non-obese [β (SE): −0.60(.20), p=0.009] and obese group [β (SE): −0.16 (.21), P>0.05], but the association wassignificant only in the non-obese group, adjusted for covariates.
Adiponectin, menopause stage and hormonesMean adjusted adiponectin levels were lower in women during their perimenopausal stagerelative to their pre- or postmenopausal stages (Figure 2) in both obese and non-obese women.Differences persisted after adjusting for the covariates.
Change in levels of FSH was positively associated with change in adiponectin concentrations(P<0.005), following adjustment for covariates (Table 2). Change in E2, T, and SHBGconcentrations were not predictive of adiponectin concentrations.
Resistin, menopause stage and hormonesResistin levels were twice as high in women during the premenopause as compared to the peri-and postmenopause stages (Figure 3) (P<0.05) in both obese and non-obese groups. Neitherbaseline nor changes in FSH, E2, T, and SHBG concentrations predicted resistin concentrations(Table 2).
Ghrelin, menopause stage and hormonesGhrelin concentrations were markedly higher in the perimenopause stage, compared to bothpremenopause and postmenopause stages (Figure 3). Levels remained higher in obese and non-obese women following adjustment for covariates.
Change in FSH levels were negatively associated with ghrelin concentrations (P<0.005),although baseline FSH was not predictive of ghrelin concentrations (Table 2). However, changein T levels negatively predicted ghrelin levels (P≤0.05) while change in E2 concentrations werepositively associated ghrelin concentrations (P<0.05) following adjustment for covariates.
DISCUSSIONThis study describes the association of adipocytokines and ghrelin among obese and non-obesewomen studied in each of the three menopause stages of their menopause. Women wererecruited from an epidemiological study of women's health rather than being recruited fromclinical practices. The nature and direction of associations with menopause stage variedaccording to analyte. Leptin levels, as expected based on its origin in adipocytes, were markedlydifferent based on body size. Notably, leptin concentrations varied with changes in FSH ormenopause stage only among non-obese women; associations were not detected in the obesewomen. In contrast, adiponectin and ghrelin concentrations were different in theperimenopause stage compared to the postmenopause stage; these observations werecorroborated by statistically significant associations with FSH change. Levels of resistin weretwice as great during the premenopause stage as compared to the peri- or postmenopause stages.Importantly, these relationships remained after incorporating waist circumference, change inwaist circumference, age, and the time intervals between each of these stages in statisticalmodels.
In non-obese women, leptin levels increased from the premenopause stage to thepostmenopause stage, though this pattern was not observed in obese women, who had
Sowers et al. Page 5
Maturitas. Author manuscript; available in PMC 2009 February 20.
NIH
-PA Author Manuscript
NIH
-PA Author Manuscript
NIH
-PA Author Manuscript
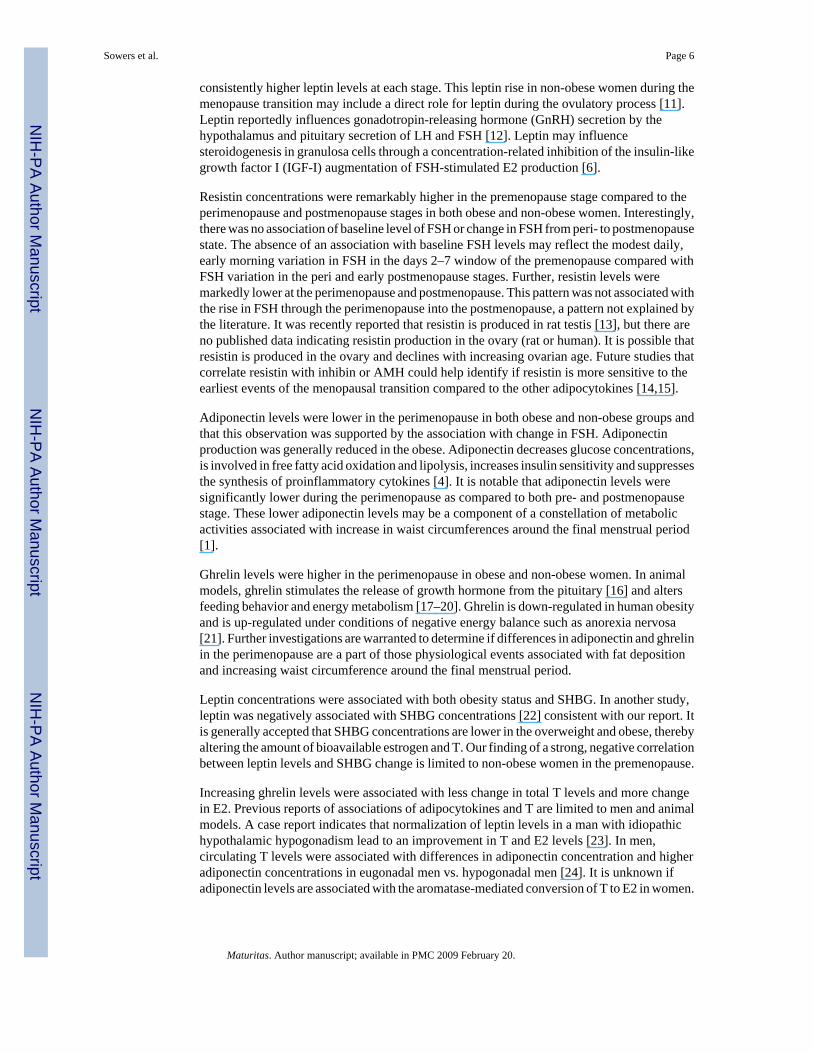
consistently higher leptin levels at each stage. This leptin rise in non-obese women during themenopause transition may include a direct role for leptin during the ovulatory process [11].Leptin reportedly influences gonadotropin-releasing hormone (GnRH) secretion by thehypothalamus and pituitary secretion of LH and FSH [12]. Leptin may influencesteroidogenesis in granulosa cells through a concentration-related inhibition of the insulin-likegrowth factor I (IGF-I) augmentation of FSH-stimulated E2 production [6].
Resistin concentrations were remarkably higher in the premenopause stage compared to theperimenopause and postmenopause stages in both obese and non-obese women. Interestingly,there was no association of baseline level of FSH or change in FSH from peri- to postmenopausestate. The absence of an association with baseline FSH levels may reflect the modest daily,early morning variation in FSH in the days 2–7 window of the premenopause compared withFSH variation in the peri and early postmenopause stages. Further, resistin levels weremarkedly lower at the perimenopause and postmenopause. This pattern was not associated withthe rise in FSH through the perimenopause into the postmenopause, a pattern not explained bythe literature. It was recently reported that resistin is produced in rat testis [13], but there areno published data indicating resistin production in the ovary (rat or human). It is possible thatresistin is produced in the ovary and declines with increasing ovarian age. Future studies thatcorrelate resistin with inhibin or AMH could help identify if resistin is more sensitive to theearliest events of the menopausal transition compared to the other adipocytokines [14,15].
Adiponectin levels were lower in the perimenopause in both obese and non-obese groups andthat this observation was supported by the association with change in FSH. Adiponectinproduction was generally reduced in the obese. Adiponectin decreases glucose concentrations,is involved in free fatty acid oxidation and lipolysis, increases insulin sensitivity and suppressesthe synthesis of proinflammatory cytokines [4]. It is notable that adiponectin levels weresignificantly lower during the perimenopause as compared to both pre- and postmenopausestage. These lower adiponectin levels may be a component of a constellation of metabolicactivities associated with increase in waist circumferences around the final menstrual period[1].
Ghrelin levels were higher in the perimenopause in obese and non-obese women. In animalmodels, ghrelin stimulates the release of growth hormone from the pituitary [16] and altersfeeding behavior and energy metabolism [17–20]. Ghrelin is down-regulated in human obesityand is up-regulated under conditions of negative energy balance such as anorexia nervosa[21]. Further investigations are warranted to determine if differences in adiponectin and ghrelinin the perimenopause are a part of those physiological events associated with fat depositionand increasing waist circumference around the final menstrual period.
Leptin concentrations were associated with both obesity status and SHBG. In another study,leptin was negatively associated with SHBG concentrations [22] consistent with our report. Itis generally accepted that SHBG concentrations are lower in the overweight and obese, therebyaltering the amount of bioavailable estrogen and T. Our finding of a strong, negative correlationbetween leptin levels and SHBG change is limited to non-obese women in the premenopause.
Increasing ghrelin levels were associated with less change in total T levels and more changein E2. Previous reports of associations of adipocytokines and T are limited to men and animalmodels. A case report indicates that normalization of leptin levels in a man with idiopathichypothalamic hypogonadism lead to an improvement in T and E2 levels [23]. In men,circulating T levels were associated with differences in adiponectin concentration and higheradiponectin concentrations in eugonadal men vs. hypogonadal men [24]. It is unknown ifadiponectin levels are associated with the aromatase-mediated conversion of T to E2 in women.
Sowers et al. Page 6
Maturitas. Author manuscript; available in PMC 2009 February 20.
NIH
-PA Author Manuscript
NIH
-PA Author Manuscript
NIH
-PA Author Manuscript
We identified no association of adiponectin concentrations in this study of women and the roleof ghrelin with T concentrations in women awaits further investigation.
A study strength is that women serve as their own controls. Other strengths include theavailability of both menstrual bleeding data and FSH measures to corroborate the menopausalstatus and the ability to evaluate women with natural menopause; thus, the capacity to selectwomen for study free of competing health conditions or HT use. A limitation of this preliminarystudy is the sample size which reduces our ability to test interactions between body size, thegonadotropins, and measures of carbohydrate metabolism or growth hormone metabolism. Themost biologically relevant limitation is the relative absence many data points per woman acrossthe transition to understand whether the menopause changes influence the adipocytokines orthe converse. It is also possible that directionality is unique to a particular cytokine. Based ona post hoc false discovery rate approach, the associations of adipcytokines and ghrelin withFSH are unlikely to have occurred as a result of the impact of multiple tests on Type I error.
In summary, the menopause transition reflects important changes in metabolites associatedwith adipose tissues. Leptin levels increased across the menopause in non-obese women andthis change was independently associated with FSH levels. Further, adiponectin and ghrelinwere associated with a specific menopause stage and change in FSH levels. Resistin levelswere high in the premenopause and dropped markedly at the perimenopause to levels that weresustained in the postmenopause. While the clinical relevance of adipocytokines and ghrelinduring the menopause is yet to be defined, this study indicates that there are marked andchanging interrelationships in the hormone-adipocytokine interface during menopause thatmay have important health-related effects.
ACKNOWLEDGEMENT
Grants or fellowships supporting the writing of the paper: This work was supported by AR041384 (Sowers, PI).Dr. Mancuso has grant support from NIH (HL077417). Dr. Eyvazzadeh has an Obstetrics and Gynecology HealthServices Research Training grant (T32HD049340-01A1).
REFERENCES1. Sowers M, Zheng H, Tomey K, Karvonen-Gutierrez C, Jannausch M, Li X, Yosef M, Symons J.
Changes in body composition in women over six years at midlife: ovarian and chronological aging. JClin Endocrinol Metab 2007;92(3):895–901. [PubMed: 17192296]
2. Siiteri PK. Adipose tissue as a source of hormones. Am J Clin Nutr 1987;45(1 Suppl):277–282.[PubMed: 3541569]
3. Zhang Y, Proenca R, Maffei M, Barone M, Leopold L, Friedman JM. Positional cloning of the mouseobese gene and its human homologue. Nature 1994;372(6505):425–432. [PubMed: 7984236]
4. Meier U, Gressner AM. Endocrine regulation of energy metabolism: review of pathobiochemical andclinical chemical aspects of leptin, ghrelin, adiponectin, and resistin. Clin Chem 2004;50:1511–1525.[PubMed: 15265818]
5. Tsai EM, Yang CH, Chen SC, Liu YH, Chen HS, Hsu SC, Lee JN. Leptin affects pregnancy outcomeof in vitro fertilization and steroidogenesis of human granulosa cells. J Assist Reprod Genet2002;19:169–176. [PubMed: 12036084]
6. Agarwal SK, Vogel K, Weitsman SR, Magoffin DA. Leptin antagonizes the insulin-like growthfactor-1 augmentation of steroidogenesis in granulosa and theca cells of the human ovary. J ClinEndocrinol Metab 1999;84:1072–1076. [PubMed: 10084597]
7. Gold EB, Bromberger J, Crawford S, Samuels S, Greendale GA, Harlow SD, Skurnick J. Factorsassociated with age at natural menopause in a multiethnic sample of midlife women. Am J Epidemiol2001;153:865–874. [PubMed: 11323317]
8. Nishizawa H, Shimomura I, Kishida K, Maeda N, Kuriyama H, Nagaretani H, Matsuda M, Kondo H,Furuyama N, Kihara S, Nakamura T, Tochino Y, Funahashi T, Matsuzawa Y. Androgens decrease
Sowers et al. Page 7
Maturitas. Author manuscript; available in PMC 2009 February 20.
NIH
-PA Author Manuscript
NIH
-PA Author Manuscript
NIH
-PA Author Manuscript

plasma adiponectin, an insulin-sensitizing adipocyte-derived protein. Diabetes 2002;51:2734–2741.[PubMed: 12196466]
9. Iwamoto I, Yoshimitsu N, Fujino T, Douchi T. Menopausal status influences the relationship betweenserum ghrelin levels and fat mass in healthy women. J Endocrinol Invest 2005;28:405–409. [PubMed:16075921]
10. Huang SW, Seow KM, Ho LT, Chien Y, Chung DY, Chang CL, Lai YH, Hwang JL, Juan CC. ResistinmRNA levels are downregulated by estrogen in vivo and in vitro. FEBS Lett 2005;579:449–454.[PubMed: 15642357]
11. Duggal PS, Van Der Hoek KH, Milner CR, Ryan NK, Armstrong DT, Magoffin DA, Norman RJ.The in vivo and in vitro effects of exogenous leptin on ovulation in the rat. Endocrinology2000;141:1971–1976. [PubMed: 10830279]
12. Nagatani S, Guthikonda P, Thompson RC, Tsukamura H, Maeda KI, Foster DL. Evidence for GnRHregulation by leptin: leptin administration prevents reduced pulsatile LH secretion during fasting.Neuroendocrinology 1998;67:370–376. [PubMed: 9662716]
13. Nogueiras R, Barreiro ML, Caminos JE, Gaytan F, Suominen JS, Navarro VM, Casanueva FF, AguilarE, Toppari J, Dieguez C, Tena-Sempere M. Novel expression of resistin in rat testis: functional roleand regulation by nutritional status and hormonal factors. J Cell Sci 2004;117:3247–3257. [PubMed:15226398]
14. van Rooij IA, Tonkelaar I, Broekmans FJ, Looman CW, Scheffer GJ, de Jong FH, Themmen AP, teVelde ER. Anti-mullerian hormone is a promising predictor for the occurrence of the menopausaltransition. Menopause 2004;11:601–606. [PubMed: 15545787]
15. Overlie I, Morkrid L, Andersson AM, Skakkebaek NE, Moen MH, Holte A. Inhibin A and B asmarkers of menopause: a five-year prospective longitudinal study of hormonal changes during themenopause transition. Acta Obstet Gynecol Scand 2005;84:281–285. [PubMed: 15715537]
16. Kojima M, Hosoda H, Date Y, Nakazato M, Matsuo H, Kangawa K. Ghrelin is a growth-hormone-releasing acylated peptide from stomach. Nature 1999;402:656–660. [PubMed: 10604470]
17. Tschop M, Smiley DL, Heiman ML. Ghrelin induces adiposity in rodents. Nature 2000;407:908–913.[PubMed: 11057670]
18. Wren AM, Small CJ, Ward HL, Murphy KG, Dakin CL, Taheri S, Kennedy AR, Roberts GH, MorganDG, Ghatei MA, Bloom SR. The novel hypothalamic peptide ghrelin stimulates food intake andgrowth hormone secretion. Endocrinology 2000;141:4325–4328. [PubMed: 11089570]
19. Masuda Y, Tanaka T, Inomata N, Ohnuma N, Tanaka S, Itoh Z, Hosoda H, Kojima M, Kangawa K.Ghrelin stimulates gastric acid secretion and motility in rats. Biochem Biophys Res Commun2000;276:905–908. [PubMed: 11027567]
20. Nakazato M, Murakami N, Date Y, Kojima M, Matsuo H, Kangawa K, Matsukura S. A role forghrelin in the central regulation of feeding. Nature 2001;409:194–198. [PubMed: 11196643]
21. Shiiya T, Nakazato M, Mizuta M, Date Y, Mondal MS, Tanaka M, Nozoe S, Hosoda H, KangawaK, Matsukura S. Plasma ghrelin levels in lean and obese humans and the effect of glucose on ghrelinsecretion. J Clin Endocrinol Metab 2002;87:240–244. [PubMed: 11788653]
22. Mingrone G, Greco AV, Giancaterini A, Scarfone A, Castagneto M, Pugeat M. Sex hormone-bindingglobulin levels and cardiovascular risk factors in morbidly obese subjects before and after weightreduction induced by diet or malabsorptive surgery. Atherosclerosis 2002;161:455–462. [PubMed:11888531]
23. Ogura T, Tobe K, Mimura Y, Otsuka F, Yamauchi T, Imai A, Tsukamoto C, Iwasaki Y, Matsuura.Testosterone modulates serum leptin concentrations in a male patient with hypothalamichypogonadism. J Endocrinol Invest 2000;23(4):246–250. [PubMed: 10853711]
24. Lanfranco F, Zitzmann M, Simoni M, Nieschlag E. Serum adiponectin levels in hypgonadal males:influence of testosterone replacement therapy. Clin Endocrinol 2004;60:500–507.
Sowers et al. Page 8
Maturitas. Author manuscript; available in PMC 2009 February 20.
NIH
-PA Author Manuscript
NIH
-PA Author Manuscript
NIH
-PA Author Manuscript
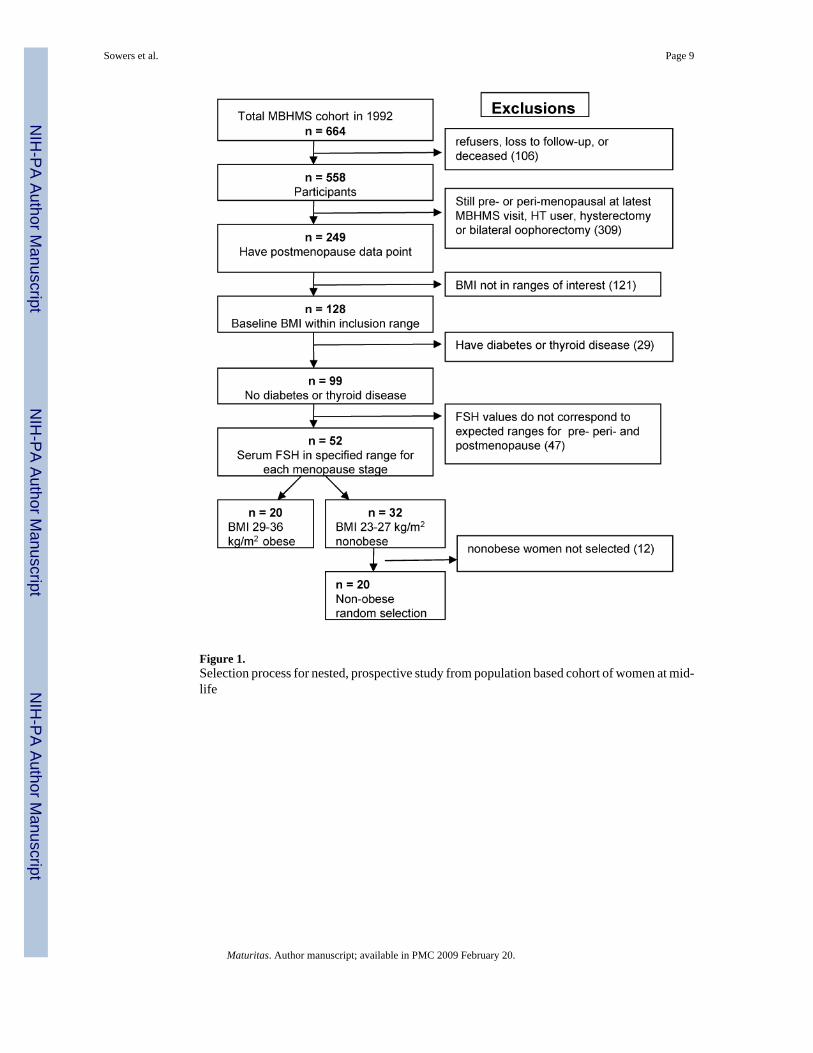
Figure 1.Selection process for nested, prospective study from population based cohort of women at mid-life
Sowers et al. Page 9
Maturitas. Author manuscript; available in PMC 2009 February 20.
NIH
-PA Author Manuscript
NIH
-PA Author Manuscript
NIH
-PA Author Manuscript
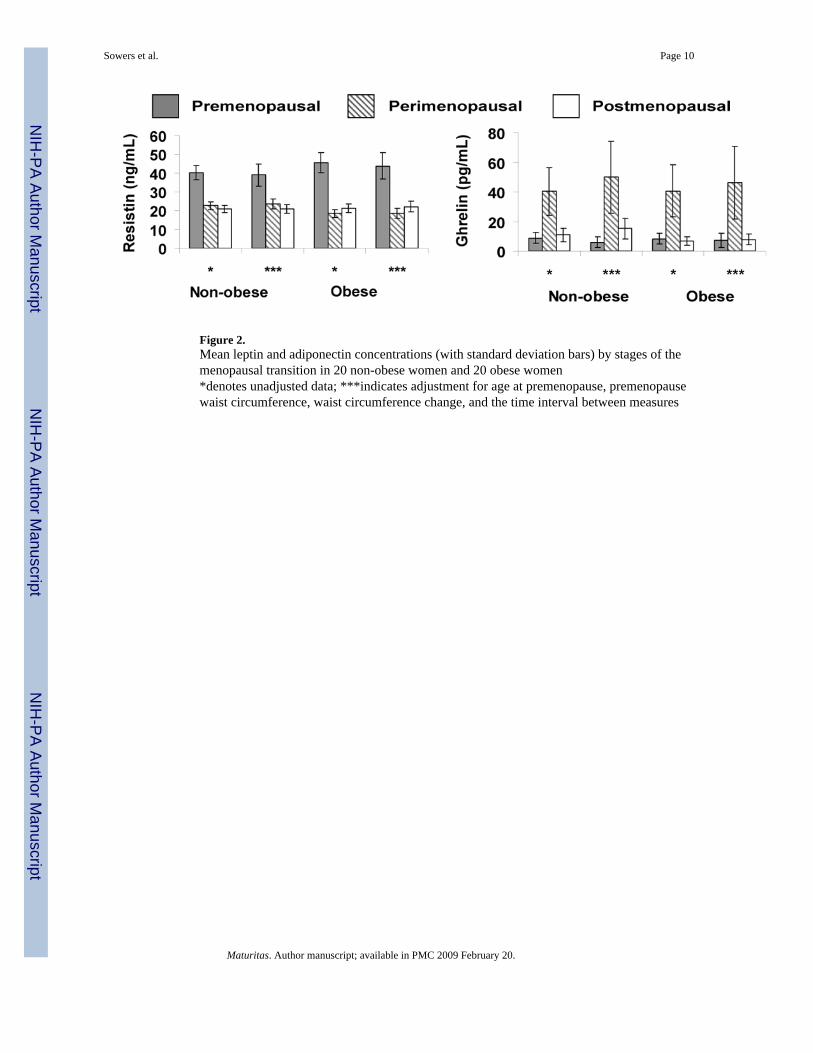
Figure 2.Mean leptin and adiponectin concentrations (with standard deviation bars) by stages of themenopausal transition in 20 non-obese women and 20 obese women*denotes unadjusted data; ***indicates adjustment for age at premenopause, premenopausewaist circumference, waist circumference change, and the time interval between measures
Sowers et al. Page 10
Maturitas. Author manuscript; available in PMC 2009 February 20.
NIH
-PA Author Manuscript
NIH
-PA Author Manuscript
NIH
-PA Author Manuscript

Figure 3.Mean resistin and ghrelin concentrations (with standard deviation bars) by stages of themenopausal transition in 20 non-obese women and 20 obese women*denotes unadjusted data; ***indicates adjustment for age at premenopause, premenopausewaist circumference, waist circumference change, and the time interval between measures
Sowers et al. Page 11
Maturitas. Author manuscript; available in PMC 2009 February 20.
NIH
-PA Author Manuscript
NIH
-PA Author Manuscript
NIH
-PA Author Manuscript
NIH
-PA Author Manuscript
NIH
-PA Author Manuscript
NIH
-PA Author Manuscript
Sowers et al. Page 12Ta
ble
1G
hrel
in a
nd a
dipo
cyto
kine
con
cent
ratio
ns a
nd re
prod
uctiv
e ho
rmon
e co
ncen
tratio
ns in
obe
se a
nd n
on-o
bese
wom
en, c
hara
cter
ized
in th
ree
stag
es o
f the
men
opau
se tr
ansi
tion
(pre
men
opau
se, p
erim
enop
ause
, and
pos
tmen
opau
se)
Non
-obe
se w
omen
(n =
20)
Obe
se w
omen
(n =
20)
Prem
enop
ause
Peri
men
opau
sePo
stm
enop
ause
Prem
enop
ause
Peri
men
opau
sePo
stm
enop
ause
Med
ian
(IQ
R)
Med
ian
(IQ
R)
Med
ian
(IQ
R)
Med
ian
(IQ
R)
Med
ian
(IQ
R)
Med
ian
(IQ
R)
Age
38.5
(3.5
)46
.0 (3
.5)
51.5
(5.5
)40
.0 (5
.5)
47.5
(4.5
)52
.0 (4
.5)
Bod
y M
ass I
ndex
(kg/
m2 )
25 (2
)26
(3)
27 (3
)33
(5)a
35 (6
)a35
(6)a
Wai
st c
ircu
mfe
renc
e (c
m)
78 (8
)82
(13)
88 (1
0)94
(12)
102
(16)
107
(13)
Ana
lyte
s L
eptin
(ng/
mL)
13.2
(6.4
)22
.3 (1
8.8)
24.7
(8.1
)37
.2 (2
8.5)
a42
.5 (4
1.4)
b35
.0 (5
3.9)
b A
dipo
nect
in (n
g/m
L)10
822
(475
5)99
45 (5
068)
1014
5 (6
128)
8806
(416
4)79
15 (3
469)
8599
(363
1) R
esis
tin (n
g/m
L)45
.8 (2
3.8)
22.3
(9.7
)21
.4 (9
.2)
48.2
(21.
4)20
.1 (5
.0)
21.4
(17.
2) G
hrel
in (p
g/m
L)5.
5 (3
3.6)
39.1
(88)
18.7
(33.
9)4.
9 (2
7.5)
32.1
(87.
5)6.
6 (2
2.8)
Hor
mon
es F
ollic
le-s
timul
atin
gho
rmon
e (F
SH, m
IU/m
L)6.
2 (3
.4)
17.5
(5.8
)82
.8 (3
2.3)
4.6
(3.7
)21
.7 (1
2.3)
51.2
(34.
6)b
Sex
hor
mon
e-bi
ndin
ggl
obul
in (S
HB
G, n
M)
33 (2
6)45
(37)
32 (3
9)25
(19)
39 (4
3)32
(43)
Est
radi
ol (E
2, p
g/m
L)40
(24)
36 (3
6)15
(7)
55 (3
1)37
(40)
17 (2
1) T
esto
ster
one
(ng/
dL)
20 (1
3)25
(23)
34 (1
9)19
(10)
25 (1
7)27
(18)
IQR
= In
terq
uarti
le ra
nge,
diff
eren
ce b
etw
een
75th
and
25t
h pe
rcen
tiles
a Sign
ifica
nt d
iffer
ence
bet
wee
n ob
ese
wom
en a
nd n
on-o
bese
wom
en w
ithin
men
opau
se st
atus
cat
egor
y (P
< 0
.000
1)
b Sign
ifica
nt d
iffer
ence
bet
wee
n ob
ese
wom
en a
nd n
on-o
bese
wom
en w
ithin
men
opau
se st
atus
cat
egor
y (P
< 0
.05)
Maturitas. Author manuscript; available in PMC 2009 February 20.

NIH
-PA Author Manuscript
NIH
-PA Author Manuscript
NIH
-PA Author Manuscript
Sowers et al. Page 13
Table 2Regression modelsa for adipocytokine or ghrelin as predicted by serum hormone levels
Premenopausal logFSH β (SE) Change in logFSH β(SE)
Premenopausal logEstradiol β(SE)
Changein logEstradiol β
(SE)logLeptin Non-obese −0.054 (0.15) 0.209 (0.08)* 0.278 (0.18) −0.146 (0.08) Obese −0.207 (0.16) 0.234 (0.12) 0.018 (0.14) 0.060 (0.10)logAdiponectin 0.071 (0.06) 0.085 (0.02)*** −0.024 (0.05) −0.017 (0.02)logResistin 0.067 (0.07) −0.024 (0.04) 0.022 (0.07) 0.067 (0.04)logGhrelin −0.333 (0.25) −0.849 (0.22)*** −0.006 (0.23) 0.436 (0.21)*
Premenopausal logTestosterone β(SE)
Changein logTestosterone β
(SE)
Premenopausal logSHBG β(SE)
Changein logSHBG β
(SE)logLeptin Non-obese −0.273 (0.13) −0.203 (0.23) 0.167 (0.17) −0.600 (0.20)** Obese 0.196 (0.19) −0.290 (0.26) −0.115 (0.24) −0.156 (0.21)logAdiponectin −0.052 (0.06) 0.115 (0.07) 0.098 (0.07) 0.088 (0.06)logResistin −0.066 (0.08) 0.174 (0.11) 0.066 (0.10) −0.047 (0.09)logGhrelin 0.112 (0.25) −1.031 (0.49)* −0.693 (0.39) 0.843 (0.47)aadjusted for age at premenopausal state, concurrent waist circumference, waist change, and elapsed time between menopause states
*p≤0.05
**p≤0.01
***p≤0.005
Maturitas. Author manuscript; available in PMC 2009 February 20.
Related Documents