arXiv:astro-ph/0606382v1 15 Jun 2006 DRAFT VERSION FEBRUARY 5, 2008 Preprint typeset using L A T E X style emulateapj v. 05/04/06 CHANDRA X-RAY SOURCES IN THE COLLAPSED-CORE GLOBULAR CLUSTER M30 (NGC 7099) PHYLLIS M. LUGGER AND HALDAN N. COHN Indiana University, Department of Astronomy, 727 E. Third St., Bloomington, IN 47405; [email protected] CRAIG O. HEINKE Northwestern University, Department of Physics & Astronomy, 2145 Sheridan Rd., Evanston, IL 60208 AND J ONATHAN E. GRINDLAY AND PETER D. EDMONDS Harvard-Smithsonian Center for Astrophysics, 60 Garden St., Cambridge, MA 02138 Draft version February 5, 2008 ABSTRACT We report the detection of six discrete, low-luminosity (L X < 10 33 erg s -1 ) X-ray sources, located within 12 ′′ of the center of the collapsed-core globular cluster M30 (NGC 7099), and a total of 13 sources within the half-mass radius, from a 50 ksec Chandra ACIS-S exposure. Three sources lie within the very small upper limit of 1. ′′ 9 on the core radius. The brightest of the three core sources has a luminosity of L X (0.5–6 keV) ≈ 6 × 10 32 erg s -1 and a blackbody-like soft X-ray spectrum, which are both consistent with it being a quiescent low-mass X-ray binary (qLMXB). We have identified optical counterparts to four of the six central sources and a number of the outlying sources, using deep Hubble Space Telescope and ground-based imaging. While the two proposed counterparts that lie within the core may represent chance superpositions, the two identified central sources that lie outside of the core have X-ray and optical properties consistent with being CVs. Two additional sources outside of the core have possible active binary counterparts. We discuss the X-ray source population of M30 in light of its collapsed-core status. Subject headings: globular clusters: individual (M30, NGC 7099) — X-rays: binaries — novae, cataclysmic variables — stars: neutron 1. INTRODUCTION M30 (NGC 7099) is one of 21 Galactic globular clusters that show strong evidence of having undergone core collapse (Djorgovski & King 1986; Lugger et al. 1995). The col- lapsed state of the core has been confirmed by Hubble Space Telescope (HST ) imaging (Yanny et al. 1994; Sosin 1997; Guhathakurta et al. 1998). Sosin (1997) has placed an up- per limit of 1. ′′ 9 (0.08 pc) on the core radius of M30 from high-resolution HST Faint Object Camera imaging. The ex- traordinarily high central density of M30, which may exceed ∼ 10 6 M ⊙ pc -3 , makes its core and the surrounding power-law cusp one of the highest density environments in the Galaxy. A high rate of stellar interactions is expected in the core and cusp regions, resulting in blue straggler formation via stellar merg- ers, binary formation via tidal capture and/or 3-body inter- actions, and binary interactions such as exchange encounters (Hut et al. 1992). M30 shows some of the strongest evidence of stellar interactions seen in any globular cluster. It has a very high blue straggler frequency, a very large bluer-inward color gradient, and a large deficit of bright giants in the inner region (Guhathakurta et al. 1998; Howell et al. 2000). Thus, the cen- tral region of M30 is expected to be a conducive environment for the formation of X-ray binaries. Like the nearby collapsed collapsed-core globular clus- ter NGC 6397, M30 does not contain any bright (L X 10 35 erg s -1 ) low-mass X-ray binaries (LMXBs). This opens the possibility of studying the distribution of low-luminosity sources near the center of M30, which would be hindered by the presence of bright sources. Previous ROSAT observa- tions of M30 detected low-luminosity X-ray emission from the vicinity of the core, with about 10 ′′ positional accuracy (Johnston et al. 1994; Verbunt 2001). Since this is compara- ble to the size of the cusp region, the ROSAT detection is con- sistent with either a single source or a centrally concentrated source population. In order to further investigate the X-ray source population of M30, we have obtained and analyzed a medium-depth Chandra-ACIS exposure. As expected, we de- tected a central population of X-ray sources. We describe the X-ray data, analysis method, and results in the following sec- tions. 2. DATA We obtained a 49.4 ksec ACIS-S 1 exposure of M30 on 2001 Nov 11, with the center of the cluster placed in the S3 chip. We chose the back-illuminated S3 chip for its high sensitivity and spectral resolution. The cluster center was offset by -0. ′ 7 in the Y-coordinate from the nominal ACIS-S aimpoint, to en- sure that the half-mass region of the cluster was well covered by the chip. The location of the cluster center was approx- imately 2. ′ 5 from the nearest chip edge. We used the timed exposure mode with the faint telemetry format. The low red- dening (E (B-V )=0.03) toward M30 results in a low neutral hydrogen column density, N H ≈ 1.7 × 10 20 cm -2 . We have adopted a distance 9.0 ± 0.5 kpc for M30, based on the Hip- parcos results of Carretta et al. (2000). Our adopted detection threshold of 4.5 counts, for the 49.4 ksec ACIS-S exposure, translates to a flux of F X ≈ 4 × 10 -16 erg s -1 cm -2 in the 0.5– 6 keV energy band, for a range of spectral models, e.g. a 6 keV thermal plasma spectrum. This limiting flux corresponds to a luminosity of L X ≈ 4 × 10 30 erg s -1 . 1 Advanced CCD Imaging Spectrometer/S-Array

Welcome message from author
This document is posted to help you gain knowledge. Please leave a comment to let me know what you think about it! Share it to your friends and learn new things together.
Transcript
arX
iv:a
stro
-ph/
0606
382v
1 1
5 Ju
n 20
06DRAFT VERSIONFEBRUARY 5, 2008Preprint typeset using LATEX style emulateapj v. 05/04/06
CHANDRAX-RAY SOURCES IN THE COLLAPSED-CORE GLOBULAR CLUSTER M30 (NGC 7099)
PHYLLIS M. L UGGER AND HALDAN N. COHNIndiana University, Department of Astronomy, 727 E. Third St., Bloomington, IN 47405; [email protected]
CRAIG O. HEINKENorthwestern University, Department of Physics & Astronomy, 2145 Sheridan Rd., Evanston, IL 60208
AND
JONATHAN E. GRINDLAY AND PETER D. EDMONDSHarvard-Smithsonian Center for Astrophysics, 60 Garden St., Cambridge, MA 02138
Draft version February 5, 2008
ABSTRACTWe report the detection of six discrete, low-luminosity (LX < 1033 erg s−1) X-ray sources, located within
12′′ of the center of the collapsed-core globular cluster M30 (NGC 7099), and a total of 13 sources within thehalf-mass radius, from a 50 ksecChandraACIS-S exposure. Three sources lie within the very small upperlimit of 1.′′9 on the core radius. The brightest of the three core sources has a luminosity ofLX (0.5–6 keV)≈6×1032 erg s−1 and a blackbody-like soft X-ray spectrum, which are both consistent with it being a quiescentlow-mass X-ray binary (qLMXB). We have identified optical counterparts to four of the six central sourcesand a number of the outlying sources, using deepHubble Space Telescopeand ground-based imaging. Whilethe two proposed counterparts that lie within the core may represent chance superpositions, the two identifiedcentral sources that lie outside of the core have X-ray and optical properties consistent with being CVs. Twoadditional sources outside of the core have possible activebinary counterparts. We discuss the X-ray sourcepopulation of M30 in light of its collapsed-core status.Subject headings:globular clusters: individual (M30, NGC 7099) — X-rays: binaries — novae, cataclysmic
variables — stars: neutron
1. INTRODUCTION
M30 (NGC 7099) is one of 21 Galactic globular clustersthat show strong evidence of having undergone core collapse(Djorgovski & King 1986; Lugger et al. 1995). The col-lapsed state of the core has been confirmed byHubble SpaceTelescope(HST) imaging (Yanny et al. 1994; Sosin 1997;Guhathakurta et al. 1998). Sosin (1997) has placed an up-per limit of 1.′′9 (0.08 pc) on the core radius of M30 fromhigh-resolutionHST Faint Object Camera imaging. The ex-traordinarily high central density of M30, which may exceed∼ 106 M⊙ pc−3, makes its core and the surrounding power-lawcusp one of the highest density environments in the Galaxy. Ahigh rate of stellar interactions is expected in the core andcuspregions, resulting in blue straggler formation via stellarmerg-ers, binary formation via tidal capture and/or 3-body inter-actions, and binary interactions such as exchange encounters(Hut et al. 1992). M30 shows some of the strongest evidenceof stellar interactions seen in any globular cluster. It hasa veryhigh blue straggler frequency, a very large bluer-inward colorgradient, and a large deficit of bright giants in the inner region(Guhathakurta et al. 1998; Howell et al. 2000). Thus, the cen-tral region of M30 is expected to be a conducive environmentfor the formation of X-ray binaries.
Like the nearby collapsed collapsed-core globular clus-ter NGC 6397, M30 does not contain any bright (LX &1035 erg s−1) low-mass X-ray binaries (LMXBs). This opensthe possibility of studying the distribution of low-luminositysources near the center of M30, which would be hinderedby the presence of bright sources. PreviousROSAT observa-tions of M30 detected low-luminosity X-ray emission fromthe vicinity of the core, with about 10′′ positional accuracy(Johnston et al. 1994; Verbunt 2001). Since this is compara-
ble to the size of the cusp region, theROSATdetection is con-sistent with either a single source or a centrally concentratedsource population. In order to further investigate the X-raysource population of M30, we have obtained and analyzed amedium-depthChandra-ACIS exposure. As expected, we de-tected a central population of X-ray sources. We describe theX-ray data, analysis method, and results in the following sec-tions.
2. DATA
We obtained a 49.4 ksec ACIS-S1 exposure of M30 on 2001Nov 11, with the center of the cluster placed in the S3 chip.We chose the back-illuminated S3 chip for its high sensitivityand spectral resolution. The cluster center was offset by−0.′7in the Y-coordinate from the nominal ACIS-S aimpoint, to en-sure that the half-mass region of the cluster was well coveredby the chip. The location of the cluster center was approx-imately 2.′5 from the nearest chip edge. We used the timedexposure mode with the faint telemetry format. The low red-dening (E(B−V) = 0.03) toward M30 results in a low neutralhydrogen column density,NH ≈ 1.7× 1020 cm−2. We haveadopted a distance 9.0±0.5 kpc for M30, based on theHip-parcosresults of Carretta et al. (2000). Our adopted detectionthreshold of 4.5 counts, for the 49.4 ksec ACIS-S exposure,translates to a flux ofFX ≈ 4×10⁻¹⁶ erg s−1 cm−2 in the 0.5–6 keV energy band, for a range of spectral models, e.g. a 6 keVthermal plasma spectrum. This limiting flux corresponds to aluminosity ofLX ≈ 4×1030 erg s−1.
1 Advanced CCD Imaging Spectrometer/S-Array
2 Lugger et al.
40.0 30.0 21:40:20.0 10.0
07:00.0
08:00.0
09:00.0
-23:10:00.0
11:00.0
12:00.0
13:00.0
14:00.0
RA
Dec
50
47
46 45
44
4342
41
40
39
38
37
36
35
34
3332
31
30
29
28
27
26
25
24
23
22
21
20
19
18
D
16
15
1413
12
11
10
9
8
7
6
FIG. 1.— ChandraACIS-S image of M30 and the surrounding region in the 0.3–7 keV energy band. The cluster half-mass radius of 1.′15 is indicated by thecircle. The extraction regions for the detected sources areindicated by small polygons and are labeled by the source numbers from Table 1. The five centralsources are labeled in Fig. 2. Source D is the brightest object in the field.(See the electronic edition of the Journal for a color version of this figure.)
3. ChandraDATA ANALYSIS AND RESULTS
3.1. Basic Processing
We reprocessed the data from level 1 data products usingthe CIAO 3.2 software2, using current calibration files andexcluding the pixel randomization that is performed in thestandard processing to remove the artificial substructure in-troduced by the precession of the spacecraft. An exposure of50 ksec includes a sufficient number of dither cycles (∼ 50)to smooth out the substructure without additional randomiza-tion. The exclusion of randomization is expected to sharpenthe image slightly, which is useful in this case because of po-tential source image crowding in the collapsed core region.We used the acis_run_hotpix CIAO script to identify badcolumns and bad pixels, and removed these as well as eventsnot exhibiting one of the standard ASCA grades. We alsoapplied time-dependent gain corrections and charge transferinefficiency corrections where appropriate. Periods of highbackground were searched for, but none was found.
TheChandra-ACIS X-ray background is energy dependent,with a fairly sharp rise above 7 keV. Figure 1 shows an8.′5× 8.′5 region about the cluster center, in the 0.3–7 keVenergy band, with the cluster half-mass radius (rh = 1.′15;Harris 1996) indicated and the detected sources labeled withthe numbers from Table 1. There is a strong concentrationof sources about the cluster center, with a decreasing den-sity toward the half-mass radius. Figure 2 shows a central
2 http://cxc.harvard.edu/ciao/
32′′×32′′ region of the ACIS-S image with the standard 0.′′5binning. Three bright central sources (labeled A1, B, and C)are clearly visible and two additional fainter sources (A2 andA3) are seen within the core. We shall refer to the brightestsource in the field as source D.
The optical center of the cluster is located about 1.′′8 (3.6pix) south of the centroid of the brightest source A1, as de-termined from our boresight correction (see §4.1). Figure 3shows a comparison of images of the central region in low-and high-energy bands (0.3–2.5 keV versus 2.5–7 keV). Notethat source A1 nearly disappears in the high-energy band, in-dicating that it has an extremely soft spectrum. As discussedbelow, this provides strong evidence that it is a quiescent low-mass X-ray binary (qLMXB).
3.2. Source Detection
We used the CIAO WAVDETECT (Freeman et al. 2002)and PWDETECT (Damiani et al. 1997) utilities for detect-ing sources in the 0.3–7 keV band, after experimenting withseveral choices of detection bands and source detection pro-grams. We used spatial scales of 1, 1.4, 2, and 2.8 pix-els for both the WAVEDETECT and PWDETECT runs. Wefind that PWDETECT is very effective at identifying faint X-ray sources within a few arcseconds of brighter sources, butappears to identify some spurious sources and to miss realsources when applied across large fields. WAVDETECT ap-pears to have a more accurate algorithm for detecting faint un-crowded X-ray sources without false detections. The sourceA2 (but not A3) is detected in the 2.5–7 keV energy band (but

ChandraSources in M30 3
23.0 22.5 21:40:22.0 21.5
35.0
10:40.0
45.0
50.0
55.0
-23:11:00.0
RA
Dec
A3
A1
B
C
A2
7
6
FIG. 2.— The central 32′′×32′′ region of theChandraACIS-S image ofM30 in the energy band 0.3− 7 keV. The cluster core radius upper limit of1.′′9 is indicated by the central circle. The extraction regionsfor the detectedsources are indicated by polygons. The possible millisecond pulsar X-raycounterpart that has been reported by Ransom et al. (2004) isindicated bythe tick marks to the left of source A2. The dashed circle has aradius of 9′′
= 5 rc and is used in the estimation of possible unresolved flux (§3.7). (Seethe electronic edition of the Journal for a color version of this figure.)
not in softer or broad-band images) by WAVDETECT, whilePWDETECT detects both A2 and A3 in broad-band images.
We ran PWDETECT on the S3 chip, and WAVDETECT ona circular region with radius 4.′5 centered on the cluster (i.e.extending out to 3.9rh). We also ran WAVDETECT on animage of the entire ACIS-S detection array (6 chips), binnedby a factor of two to accommodate the increasing size of theChandrapoint-spread function. The reason for extending be-yond the S3 chip, in both WAVDETECT runs, was to searchfor possibleChandrasource counterparts in the cluster halo.For each run, we choose a significance threshold designed toproduce at most two false detections per image.
Our final source list includes the detections from the 0.3–7 keV WAVDETECT run, removing three sources that wejudge spurious (one having less than four counts and two fromspurious double detections of off-axis sources), and addingthe sources A2 and A3 identified in the PWDETECT run.Fifty sources were detected within 4.′5 of the cluster center,and these sources are listed in Table 1. An additional 46sources were found on the remainder of the array, after re-jecting spurious sources; these sources will be discussed else-where.
3.3. Source Properties
Table 1 (located at end of text) lists parameters for the 50sources within 4.′5 of the cluster center, including position,distance from the cluster center (see §4.1), counts in the 0.3–7 keV band, X-ray flux, X-ray color indices, and other iden-tifiers. Of these sources, 13 lie within the cluster half-massradius and are thus the most likely candidates to be actualcluster members.
Source extractions were performed using the IDL scriptACIS_EXTRACT3 (Broos et al. 2002), which uses CIAO and
3 Version 3.65, http://www.astro.psu.edu/xray/docs/TARA/ae_users_guide.html
FIG. 3.— A comparison ofChandraimages of the central 32′′×32′′ regionof M30 in low-energy versus high-energy bands. The left panel shows the0.3−2.5 keV band and the right panel shows the 2.5−7 keV band. The sourceextraction regions are as in Fig. 2. Note that the likely qLMXB, source A1 inFig. 2, nearly disappears in the high-energy band.(See the electronic editionof the Journal for a color version of this figure.)
FTOOLS4 tools and TARA5 IDL software. We follow thegeneral procedures of Feigelson et al. (2002); we briefly dis-cuss the method here. Point-spread functions (psfs) were gen-erated for each source, and polygonal extraction regions weregenerated to match the 90% encircled-energy contour (at 1.5keV) for most sources. For a few bright sources, we chose alarger encircled energy; for sources A1, A2, and A3 we chosea smaller region due to crowding.
We refined the positions of all sources by iteratively cen-troiding the counts within the extraction regions. Event lists,spectra, and light curves were extracted for each source,and response files, background spectra, and effective areafiles were constructed for each source using current (CALDB3.03) quantum efficiency degradation corrections and the newMKACISRMF tool to generate responses. The psf fractionenclosed by the extraction regions was calculated at five en-ergies and interpolated for other energies, and the effectivearea functions were altered to take account of these aperturecorrections.
We computed background-subtracted photometry for eachsource in several bands. X-ray energy fluxes for each sourcewere derived by computing photon fluxes in seven relativelynarrow bands. We computed the transformation from pho-ton fluxes to unabsorbed energy fluxes for each band, assum-ing the photoelectric absorption appropriate for the distance toM30, for two very different spectra: a 6 keV thermal plasmaspectrum and a 106 K hydrogen-atmosphere spectrum. Thedifferences between the transformation coefficients were lessthan 4% for bands below 2 keV, and less than 7% for higherenergy bands. We adopted the 6 keV thermal plasma spec-trum and summed the unabsorbed energy fluxes (and errors)from each band to obtain the fluxes (and errors) presented inTable 1.
Relatively few sources in our field exhibit clearsigns of variability. A Kolmogorov-Smirnov test (fromACIS_EXTRACT), which was applied to the light curve ofeach source, finds that only 3 of 50 sources show variabilityat the 99% confidence level or higher, viz. sources 37, 39,and 40 (CXOU J214030.86-231308.2, 214033.30-231236.3,and 214008.37-231118.9, respectively); all three are locatedbeyond 3′ from the cluster center. Of these, source 39 has alikely identification as a bright foreground star (see §§3.6.2,4.7).
4 Version 5.2, http://heasarc.gsfc.nasa.gov/docs/software/ftools/ftools_menu.html5 http://www.astro.psu.edu/xray/docs/TARA/
4 Lugger et al.
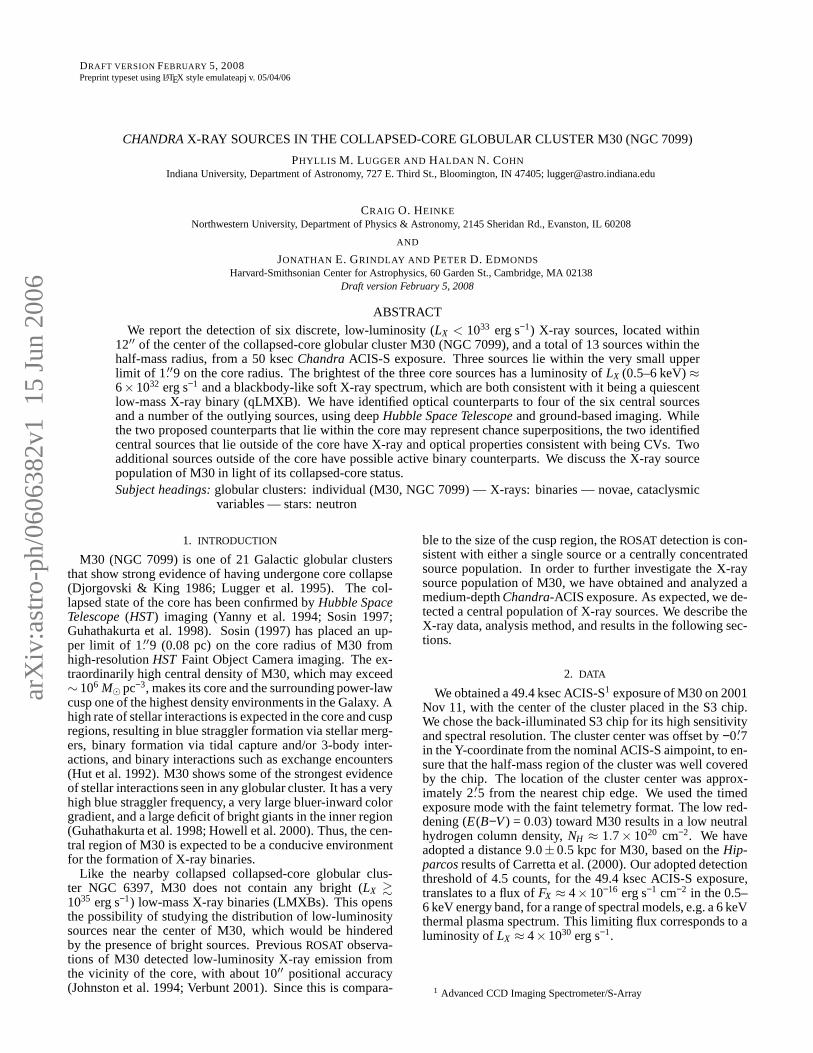
FIG. 4.— Cumulative radial distribution of excessChandrasource countsover the background predicted from the Giacconi et al. (2001) extragalacticsource counts. Error bars represent the statistical uncertainty of the back-ground correction. The dashed curve is the cumulative background distribu-tion for the expected background density of 0.77 arcmin−2.
In order to estimate the number of sources that are likelymembers of M30, we computed the expected backgrounddensity of extragalactic sources based on Giacconi et al.(2001). Their counts predict a background source den-sity of Nbkgd = 0.77 arcmin−2 detected above 4.5 counts inthe 0.3–7 keV band, corresponding to a flux limit 4.0×
10−16 erg s−1 cm−2 in the 0.5–6 keV band for a power-lawspectrum with photon index 1.7. Fig. 4 shows the cumula-tive radial distribution of the excess number of sources overthe background level. The cumulative excess source profileflattens at about 1′, in agreement with the expectation thatthe source distribution should be concentrated within the half-mass radius (rh = 1.′15). Fig. 4 indicates that the background-corrected number of cluster sources withinrh is about 10±2,where the expected number of background sources withinrhis 3.2. (We note that the error represents the statistical un-certainty in the background correction only.) For comparison,Pooley et al. (2003) report the detection of a total of 7 sourceswithin the half-mass radius of M30 to a limiting luminosity of4×1030 erg s−1 (0.5–6 keV; which corresponds to a flux limitof 4× 10⁻¹⁶ erg s−1 cm−2 for our adopted cluster distance of9.0 kpc), based on an analysis of the same Chandra observa-tions reported here. They estimate that 1–2 of these are back-ground objects, using extragalactic source counts from Giac-coni et al. (2001). We note that two of our detected sourcesare located just inside ofrh, as seen in Fig. 1, and thus maynot have been counted by Pooley et al. (2003).
It can be seen from Fig. 4 that there is a second rise in theexcess number of sources over the expected background be-tweenrh and 2rh. While the Giacconi et al. (2001) countspredict a total of 9.6 extragalactic sources in this region,theactual number of detected sources is 14. This excess persistsif we adopt a higher flux limit of 10−15 erg s−1 cm−2 (0.5–6 keV), for which 4.5 sources are predicted while 9 are de-tected. While this difference does not have a high level ofstatistical significance, we note that similar overdensities ofsources interpreted as belonging to the background popula-tion have been seen outside the half-mass radii of other glob-ular clusters (Gendre et al. 2003; Heinke et al. 2003a, 2005),
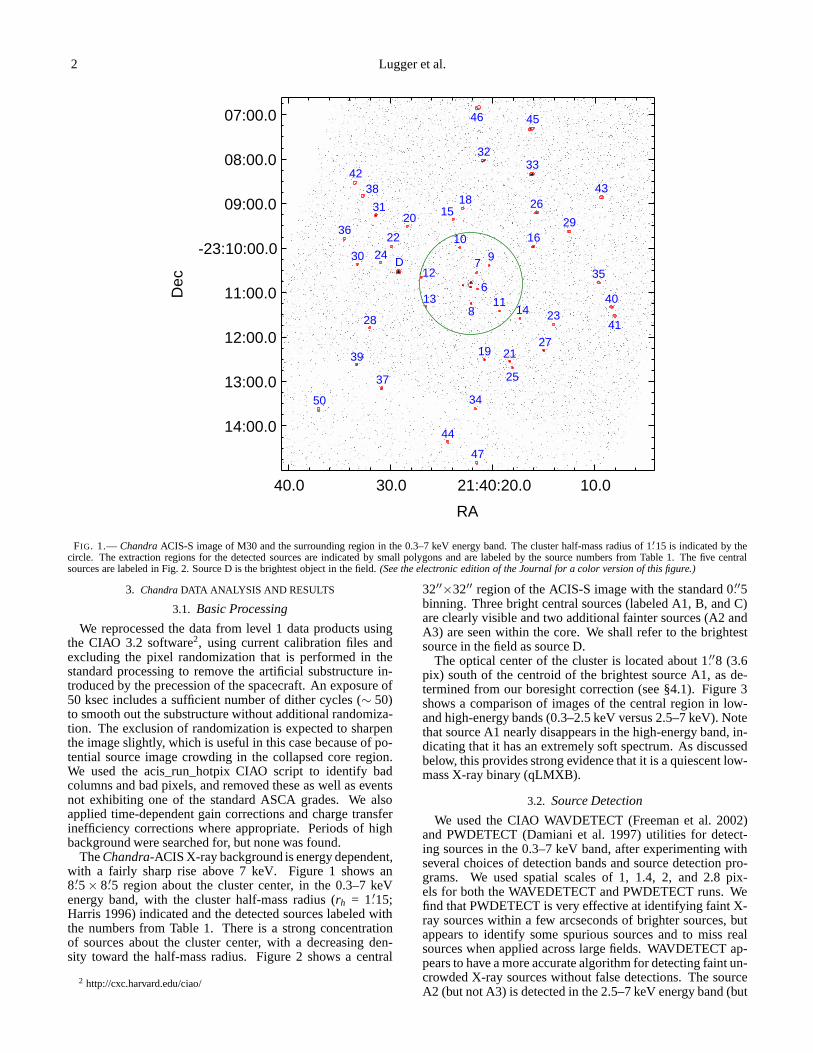
FIG. 5.— Cumulative, background-corrected radial distribution of Chan-dra sources in M30 (stairstep) with a power-law fit (smooth curve). Themaximum-likelihood, power-law slope is−1.52±0.14, from which we infera mean source mass of 1.27±0.16 M⊙ (see text).
suggesting that some of these objects may actually be X-raysources in the cluster halo. Such sources might have beenejected into the halo from the central regions or else mightnaturally reside in the halo owing to their low masses. Brandt& Hasinger (2005) have reviewed the issue of possible cos-mic variance in the extragalactic source counts, concludingthat there is some evidence for significant number fluctuationsbelow fluxes of about 10−15 erg s−1 cm−2. In light of this, wealso investigated by how much the background source densitywould have to be increased to eliminate the apparent excessof sources beyondrh. This would require that the density beincreased by about 30% (which is within the variance rangediscussed by Brandt & Hasinger 2005), which would increasethe expected background number withinrh to 4.2. Such an up-ward adjustment in the background count level would reducethe likely source population withinrh by just one source.
3.4. Source Spatial Distribution
As in our previous studies of globular cluster X-ray sourcedistributions, we have analyzed the radial distribution ofthe likely cluster sources by fitting models to the two-dimensional source distribution using maximum-likelihoodtechniques (c.f. Grindlay et al. 2002). Given the small samplesize (∼10 sources above background withinrh) and the smalloptical core radius of M30 (. 2′′), we have fit a pure power-law model. We took the background level to be that given bythe Giacconi et al. (2001) extragalactic source counts, as dis-cussed in §3.3, and use the Monte-Carlo procedure describedin Grindlay et al. (2002) to correct for background. The best-fit power-law slope of the source surface density profileS(r)is α = d lnS/d lnr = −1.52±0.14; the uncertainty representsthe 68% range about the median value for 1000 bootstrap re-samplings of the source sample. Figure 5 shows this fit to thecumulative source distribution, demonstrating that it providesa good fit to the profile. Since M30 is a collapsed-core cluster,the relation between cusp slope and object mass presented byCohn (1985) is appropriate; we have previously applied thisanalysis to the source distribution in the collapsed-core clus-ter NGC 6397 (Taylor et al. 2005). The predicted slope of a
ChandraSources in M30 5
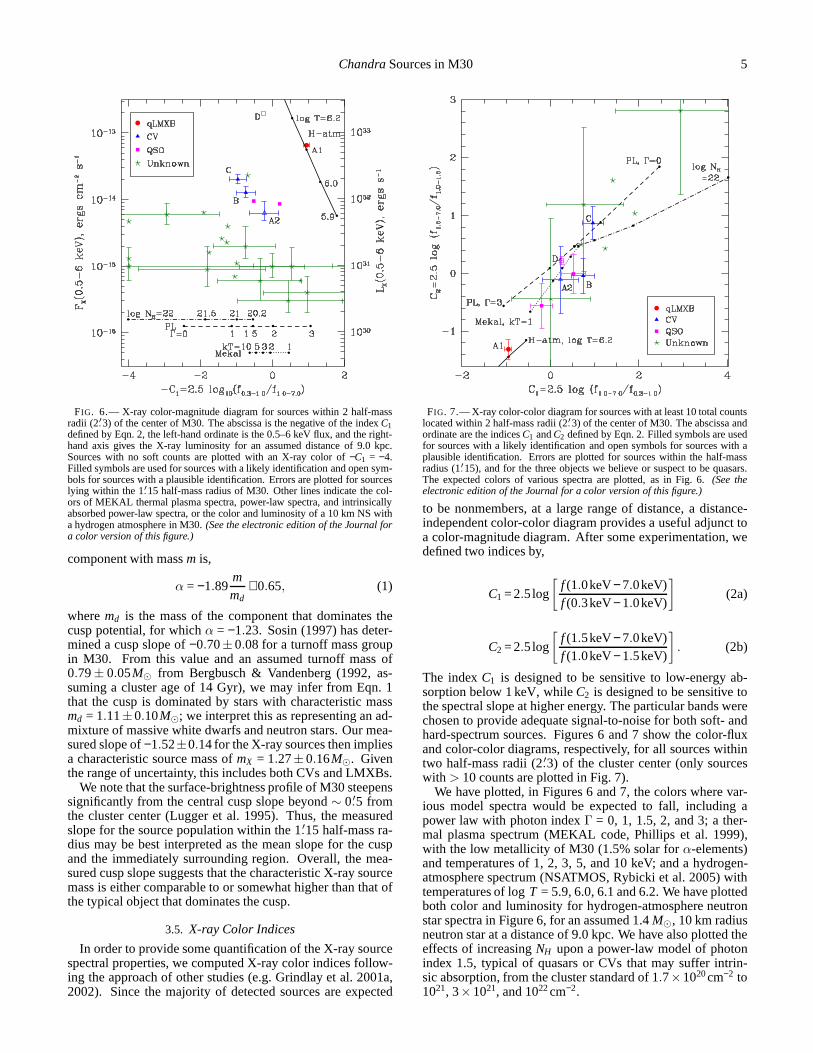
FIG. 6.— X-ray color-magnitude diagram for sources within 2 half-massradii (2.′3) of the center of M30. The abscissa is the negative of the indexC1defined by Eqn. 2, the left-hand ordinate is the 0.5–6 keV flux,and the right-hand axis gives the X-ray luminosity for an assumed distanceof 9.0 kpc.Sources with no soft counts are plotted with an X-ray color of−C1 = −4.Filled symbols are used for sources with a likely identification and open sym-bols for sources with a plausible identification. Errors areplotted for sourceslying within the 1.′15 half-mass radius of M30. Other lines indicate the col-ors of MEKAL thermal plasma spectra, power-law spectra, andintrinsicallyabsorbed power-law spectra, or the color and luminosity of a10 km NS witha hydrogen atmosphere in M30.(See the electronic edition of the Journal fora color version of this figure.)
component with massm is,
α = −1.89mmd
+ 0.65, (1)
wheremd is the mass of the component that dominates thecusp potential, for whichα = −1.23. Sosin (1997) has deter-mined a cusp slope of−0.70±0.08 for a turnoff mass groupin M30. From this value and an assumed turnoff mass of0.79± 0.05M⊙ from Bergbusch & Vandenberg (1992, as-suming a cluster age of 14 Gyr), we may infer from Eqn. 1that the cusp is dominated by stars with characteristic massmd = 1.11±0.10M⊙; we interpret this as representing an ad-mixture of massive white dwarfs and neutron stars. Our mea-sured slope of−1.52±0.14 for the X-ray sources then impliesa characteristic source mass ofmX = 1.27±0.16M⊙. Giventhe range of uncertainty, this includes both CVs and LMXBs.
We note that the surface-brightness profile of M30 steepenssignificantly from the central cusp slope beyond∼ 0.′5 fromthe cluster center (Lugger et al. 1995). Thus, the measuredslope for the source population within the 1.′15 half-mass ra-dius may be best interpreted as the mean slope for the cuspand the immediately surrounding region. Overall, the mea-sured cusp slope suggests that the characteristic X-ray sourcemass is either comparable to or somewhat higher than that ofthe typical object that dominates the cusp.
3.5. X-ray Color Indices
In order to provide some quantification of the X-ray sourcespectral properties, we computed X-ray color indices follow-ing the approach of other studies (e.g. Grindlay et al. 2001a,2002). Since the majority of detected sources are expected
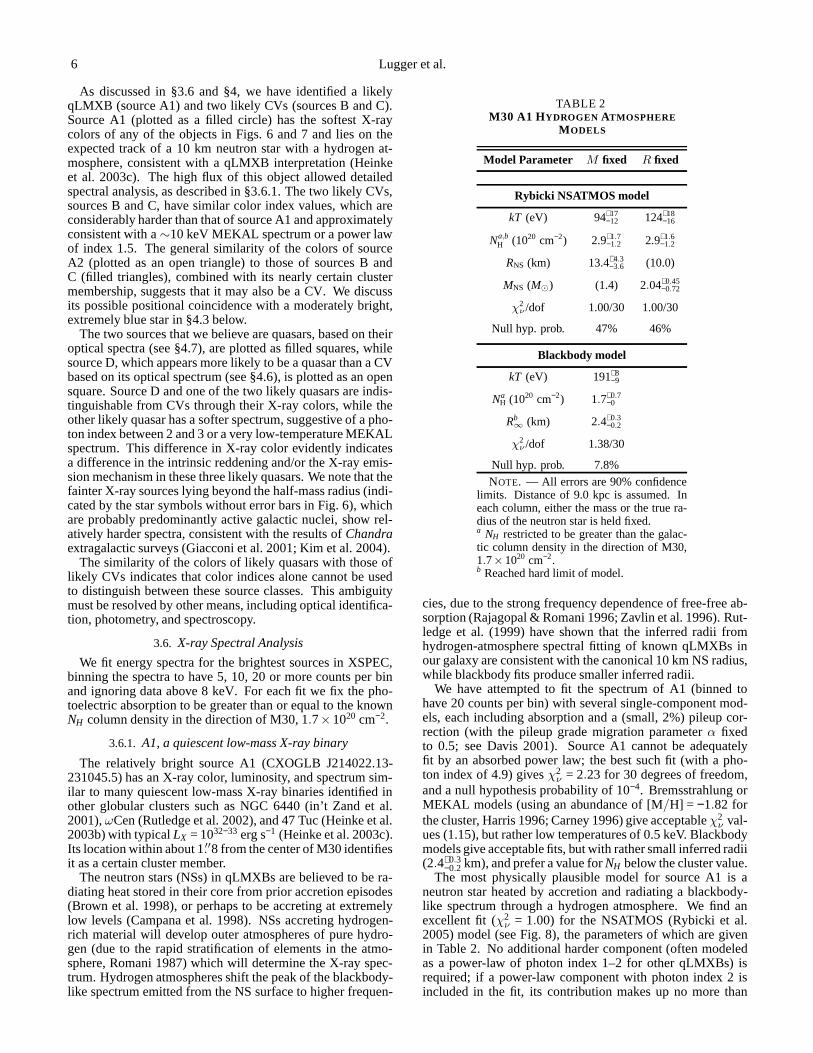
FIG. 7.— X-ray color-color diagram for sources with at least 10 total countslocated within 2 half-mass radii (2.′3) of the center of M30. The abscissa andordinate are the indicesC1 andC2 defined by Eqn. 2. Filled symbols are usedfor sources with a likely identification and open symbols forsources with aplausible identification. Errors are plotted for sources within the half-massradius (1.′15), and for the three objects we believe or suspect to be quasars.The expected colors of various spectra are plotted, as in Fig. 6. (See theelectronic edition of the Journal for a color version of thisfigure.)
to be nonmembers, at a large range of distance, a distance-independent color-color diagram provides a useful adjuncttoa color-magnitude diagram. After some experimentation, wedefined two indices by,
C1 = 2.5log
[
f (1.0keV− 7.0keV)f (0.3keV− 1.0keV)
]
(2a)
C2 = 2.5log
[
f (1.5keV− 7.0keV)f (1.0keV− 1.5keV)
]
. (2b)
The indexC1 is designed to be sensitive to low-energy ab-sorption below 1 keV, whileC2 is designed to be sensitive tothe spectral slope at higher energy. The particular bands werechosen to provide adequate signal-to-noise for both soft- andhard-spectrum sources. Figures 6 and 7 show the color-fluxand color-color diagrams, respectively, for all sources withintwo half-mass radii (2.′3) of the cluster center (only sourceswith > 10 counts are plotted in Fig. 7).
We have plotted, in Figures 6 and 7, the colors where var-ious model spectra would be expected to fall, including apower law with photon indexΓ = 0, 1, 1.5, 2, and 3; a ther-mal plasma spectrum (MEKAL code, Phillips et al. 1999),with the low metallicity of M30 (1.5% solar forα-elements)and temperatures of 1, 2, 3, 5, and 10 keV; and a hydrogen-atmosphere spectrum (NSATMOS, Rybicki et al. 2005) withtemperatures of logT = 5.9, 6.0, 6.1 and 6.2. We have plottedboth color and luminosity for hydrogen-atmosphere neutronstar spectra in Figure 6, for an assumed 1.4M⊙, 10 km radiusneutron star at a distance of 9.0 kpc. We have also plotted theeffects of increasingNH upon a power-law model of photonindex 1.5, typical of quasars or CVs that may suffer intrin-sic absorption, from the cluster standard of 1.7×1020cm−2 to1021, 3×10²¹, and 1022cm−2.
6 Lugger et al.
As discussed in §3.6 and §4, we have identified a likelyqLMXB (source A1) and two likely CVs (sources B and C).Source A1 (plotted as a filled circle) has the softest X-raycolors of any of the objects in Figs. 6 and 7 and lies on theexpected track of a 10 km neutron star with a hydrogen at-mosphere, consistent with a qLMXB interpretation (Heinkeet al. 2003c). The high flux of this object allowed detailedspectral analysis, as described in §3.6.1. The two likely CVs,sources B and C, have similar color index values, which areconsiderably harder than that of source A1 and approximatelyconsistent with a∼10 keV MEKAL spectrum or a power lawof index 1.5. The general similarity of the colors of sourceA2 (plotted as an open triangle) to those of sources B andC (filled triangles), combined with its nearly certain clustermembership, suggests that it may also be a CV. We discussits possible positional coincidence with a moderately bright,extremely blue star in §4.3 below.
The two sources that we believe are quasars, based on theiroptical spectra (see §4.7), are plotted as filled squares, whilesource D, which appears more likely to be a quasar than a CVbased on its optical spectrum (see §4.6), is plotted as an opensquare. Source D and one of the two likely quasars are indis-tinguishable from CVs through their X-ray colors, while theother likely quasar has a softer spectrum, suggestive of a pho-ton index between 2 and 3 or a very low-temperature MEKALspectrum. This difference in X-ray color evidently indicatesa difference in the intrinsic reddening and/or the X-ray emis-sion mechanism in these three likely quasars. We note that thefainter X-ray sources lying beyond the half-mass radius (indi-cated by the star symbols without error bars in Fig. 6), whichare probably predominantly active galactic nuclei, show rel-atively harder spectra, consistent with the results ofChandraextragalactic surveys (Giacconi et al. 2001; Kim et al. 2004).
The similarity of the colors of likely quasars with those oflikely CVs indicates that color indices alone cannot be usedto distinguish between these source classes. This ambiguitymust be resolved by other means, including optical identifica-tion, photometry, and spectroscopy.
3.6. X-ray Spectral Analysis
We fit energy spectra for the brightest sources in XSPEC,binning the spectra to have 5, 10, 20 or more counts per binand ignoring data above 8 keV. For each fit we fix the pho-toelectric absorption to be greater than or equal to the knownNH column density in the direction of M30, 1.7×1020 cm−2.
3.6.1. A1, a quiescent low-mass X-ray binary
The relatively bright source A1 (CXOGLB J214022.13-231045.5) has an X-ray color, luminosity, and spectrum sim-ilar to many quiescent low-mass X-ray binaries identified inother globular clusters such as NGC 6440 (in’t Zand et al.2001),ωCen (Rutledge et al. 2002), and 47 Tuc (Heinke et al.2003b) with typicalLX = 1032−33 erg s−1 (Heinke et al. 2003c).Its location within about 1.′′8 from the center of M30 identifiesit as a certain cluster member.
The neutron stars (NSs) in qLMXBs are believed to be ra-diating heat stored in their core from prior accretion episodes(Brown et al. 1998), or perhaps to be accreting at extremelylow levels (Campana et al. 1998). NSs accreting hydrogen-rich material will develop outer atmospheres of pure hydro-gen (due to the rapid stratification of elements in the atmo-sphere, Romani 1987) which will determine the X-ray spec-trum. Hydrogen atmospheres shift the peak of the blackbody-like spectrum emitted from the NS surface to higher frequen-
TABLE 2M30 A1 HYDROGEN ATMOSPHERE
M ODELS
Model Parameter M fixed R fixed
Rybicki NSATMOS model
kT (eV) 94+17−12 124+18
−16
Na,bH (1020 cm−2) 2.9+1.7
−1.2 2.9+1.6−1.2
RNS (km) 13.4+4.3−3.6 (10.0)
MNS (M⊙) (1.4) 2.04+0.45−0.72
χ2ν /dof 1.00/30 1.00/30
Null hyp. prob. 47% 46%
Blackbody model
kT (eV) 191+8−9
NaH (1020 cm−2) 1.7+0.7
−0
Rb∞ (km) 2.4+0.3
−0.2
χ2ν /dof 1.38/30
Null hyp. prob. 7.8%
NOTE. — All errors are 90% confidencelimits. Distance of 9.0 kpc is assumed. Ineach column, either the mass or the true ra-dius of the neutron star is held fixed.a NH restricted to be greater than the galac-tic column density in the direction of M30,1.7×1020 cm−2.b Reached hard limit of model.
cies, due to the strong frequency dependence of free-free ab-sorption (Rajagopal & Romani 1996; Zavlin et al. 1996). Rut-ledge et al. (1999) have shown that the inferred radii fromhydrogen-atmosphere spectral fitting of known qLMXBs inour galaxy are consistent with the canonical 10 km NS radius,while blackbody fits produce smaller inferred radii.
We have attempted to fit the spectrum of A1 (binned tohave 20 counts per bin) with several single-component mod-els, each including absorption and a (small, 2%) pileup cor-rection (with the pileup grade migration parameterα fixedto 0.5; see Davis 2001). Source A1 cannot be adequatelyfit by an absorbed power law; the best such fit (with a pho-ton index of 4.9) givesχ2
ν= 2.23 for 30 degrees of freedom,
and a null hypothesis probability of 10−4. Bremsstrahlung orMEKAL models (using an abundance of [M/H] = −1.82 forthe cluster, Harris 1996; Carney 1996) give acceptableχ2
νval-
ues (1.15), but rather low temperatures of 0.5 keV. Blackbodymodels give acceptable fits, but with rather small inferred radii(2.4+0.3
−0.2 km), and prefer a value forNH below the cluster value.The most physically plausible model for source A1 is a
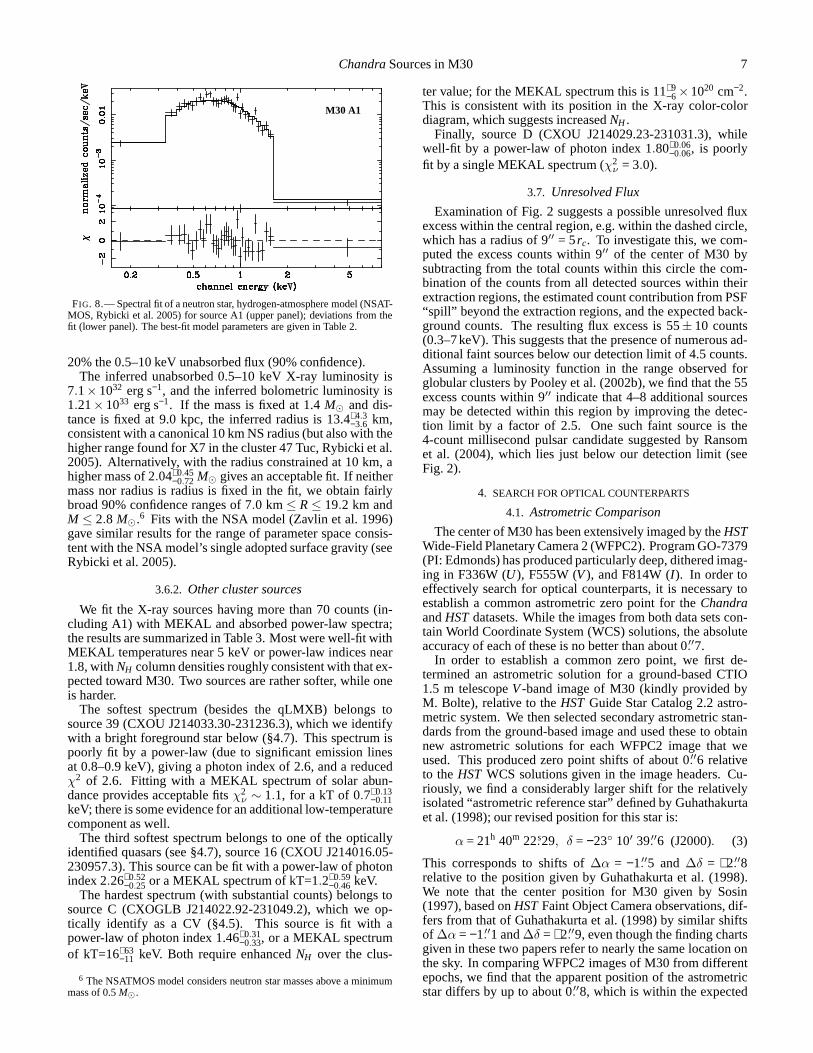
neutron star heated by accretion and radiating a blackbody-like spectrum through a hydrogen atmosphere. We find anexcellent fit (χ2
ν= 1.00) for the NSATMOS (Rybicki et al.
2005) model (see Fig. 8), the parameters of which are givenin Table 2. No additional harder component (often modeledas a power-law of photon index 1–2 for other qLMXBs) isrequired; if a power-law component with photon index 2 isincluded in the fit, its contribution makes up no more than
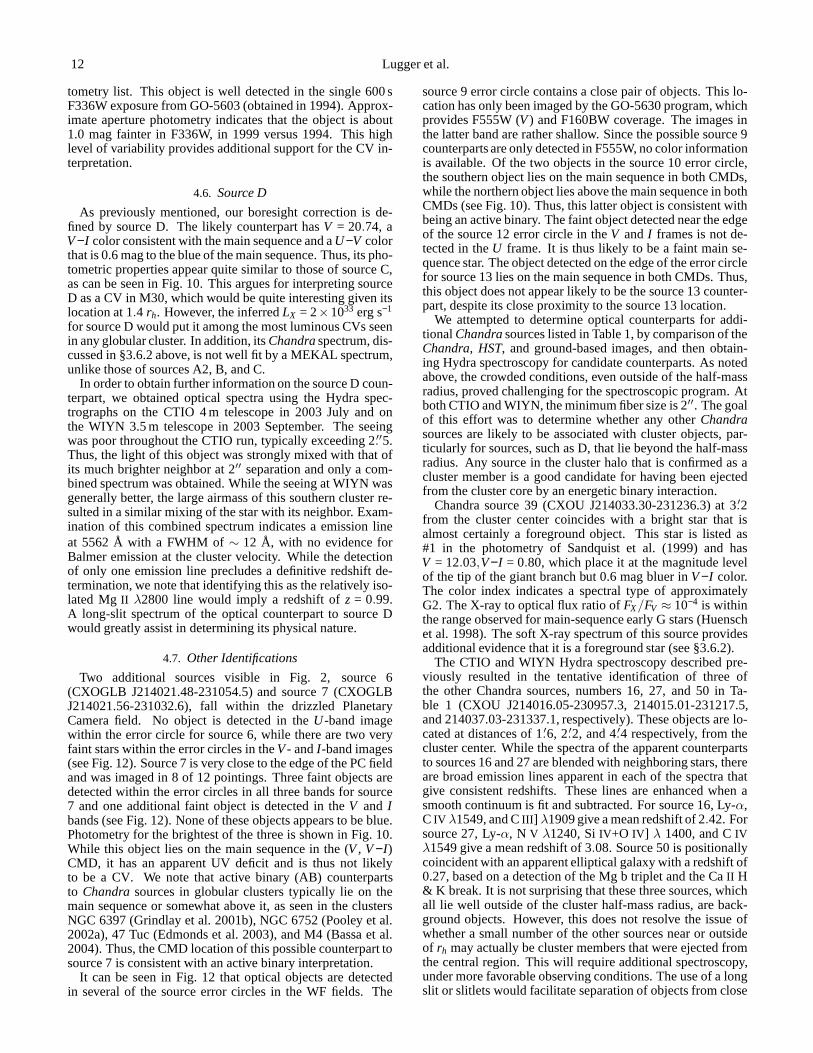
ChandraSources in M30 7
M30 A1
FIG. 8.— Spectral fit of a neutron star, hydrogen-atmosphere model (NSAT-MOS, Rybicki et al. 2005) for source A1 (upper panel); deviations from thefit (lower panel). The best-fit model parameters are given in Table 2.
20% the 0.5–10 keV unabsorbed flux (90% confidence).The inferred unabsorbed 0.5–10 keV X-ray luminosity is
7.1× 1032 erg s−1, and the inferred bolometric luminosity is1.21× 1033 erg s−1. If the mass is fixed at 1.4M⊙ and dis-tance is fixed at 9.0 kpc, the inferred radius is 13.4+4.3
−3.6 km,consistent with a canonical 10 km NS radius (but also with thehigher range found for X7 in the cluster 47 Tuc, Rybicki et al.2005). Alternatively, with the radius constrained at 10 km,ahigher mass of 2.04+0.45
−0.72 M⊙ gives an acceptable fit. If neithermass nor radius is radius is fixed in the fit, we obtain fairlybroad 90% confidence ranges of 7.0 km≤ R≤ 19.2 km andM ≤ 2.8 M⊙.6 Fits with the NSA model (Zavlin et al. 1996)gave similar results for the range of parameter space consis-tent with the NSA model’s single adopted surface gravity (seeRybicki et al. 2005).
3.6.2. Other cluster sources
We fit the X-ray sources having more than 70 counts (in-cluding A1) with MEKAL and absorbed power-law spectra;the results are summarized in Table 3. Most were well-fit withMEKAL temperatures near 5 keV or power-law indices near1.8, withNH column densities roughly consistent with that ex-pected toward M30. Two sources are rather softer, while oneis harder.
The softest spectrum (besides the qLMXB) belongs tosource 39 (CXOU J214033.30-231236.3), which we identifywith a bright foreground star below (§4.7). This spectrum ispoorly fit by a power-law (due to significant emission linesat 0.8–0.9 keV), giving a photon index of 2.6, and a reducedχ2 of 2.6. Fitting with a MEKAL spectrum of solar abun-dance provides acceptable fitsχ2
ν∼ 1.1, for a kT of 0.7+0.13
−0.11keV; there is some evidence for an additional low-temperaturecomponent as well.
The third softest spectrum belongs to one of the opticallyidentified quasars (see §4.7), source 16 (CXOU J214016.05-230957.3). This source can be fit with a power-law of photonindex 2.26+0.52
−0.25 or a MEKAL spectrum of kT=1.2+0.59−0.46 keV.
The hardest spectrum (with substantial counts) belongs tosource C (CXOGLB J214022.92-231049.2), which we op-tically identify as a CV (§4.5). This source is fit with apower-law of photon index 1.46+0.31
−0.33, or a MEKAL spectrumof kT=16+63
−11 keV. Both require enhancedNH over the clus-
6 The NSATMOS model considers neutron star masses above a minimummass of 0.5M⊙.
ter value; for the MEKAL spectrum this is 11+9−6×1020 cm−2.
This is consistent with its position in the X-ray color-colordiagram, which suggests increasedNH .
Finally, source D (CXOU J214029.23-231031.3), whilewell-fit by a power-law of photon index 1.80+0.06
−0.06, is poorlyfit by a single MEKAL spectrum (χ2
ν= 3.0).
3.7. Unresolved Flux
Examination of Fig. 2 suggests a possible unresolved fluxexcess within the central region, e.g. within the dashed circle,which has a radius of 9′′ = 5rc. To investigate this, we com-puted the excess counts within 9′′ of the center of M30 bysubtracting from the total counts within this circle the com-bination of the counts from all detected sources within theirextraction regions, the estimated count contribution fromPSF“spill” beyond the extraction regions, and the expected back-ground counts. The resulting flux excess is 55± 10 counts(0.3–7keV). This suggests that the presence of numerous ad-ditional faint sources below our detection limit of 4.5 counts.Assuming a luminosity function in the range observed forglobular clusters by Pooley et al. (2002b), we find that the 55excess counts within 9′′ indicate that 4–8 additional sourcesmay be detected within this region by improving the detec-tion limit by a factor of 2.5. One such faint source is the4-count millisecond pulsar candidate suggested by Ransomet al. (2004), which lies just below our detection limit (seeFig. 2).
4. SEARCH FOR OPTICAL COUNTERPARTS
4.1. Astrometric Comparison
The center of M30 has been extensively imaged by theHSTWide-Field Planetary Camera 2 (WFPC2). Program GO-7379(PI: Edmonds) has produced particularly deep, dithered imag-ing in F336W (U), F555W (V), and F814W (I ). In order toeffectively search for optical counterparts, it is necessary toestablish a common astrometric zero point for theChandraandHSTdatasets. While the images from both data sets con-tain World Coordinate System (WCS) solutions, the absoluteaccuracy of each of these is no better than about 0.′′7.
In order to establish a common zero point, we first de-termined an astrometric solution for a ground-based CTIO1.5 m telescopeV-band image of M30 (kindly provided byM. Bolte), relative to theHST Guide Star Catalog 2.2 astro-metric system. We then selected secondary astrometric stan-dards from the ground-based image and used these to obtainnew astrometric solutions for each WFPC2 image that weused. This produced zero point shifts of about 0.′′6 relativeto theHST WCS solutions given in the image headers. Cu-riously, we find a considerably larger shift for the relativelyisolated “astrometric reference star” defined by Guhathakurtaet al. (1998); our revised position for this star is:
α = 21h 40m 22.s29, δ = −23◦ 10′ 39.′′6 (J2000). (3)
This corresponds to shifts of∆α = −1.′′5 and ∆δ = +2.′′8relative to the position given by Guhathakurta et al. (1998).We note that the center position for M30 given by Sosin(1997), based onHSTFaint Object Camera observations, dif-fers from that of Guhathakurta et al. (1998) by similar shiftsof ∆α = −1.′′1 and∆δ = +2.′′9, even though the finding chartsgiven in these two papers refer to nearly the same location onthe sky. In comparing WFPC2 images of M30 from differentepochs, we find that the apparent position of the astrometricstar differs by up to about 0.′′8, which is within the expected
8 Lugger et al.
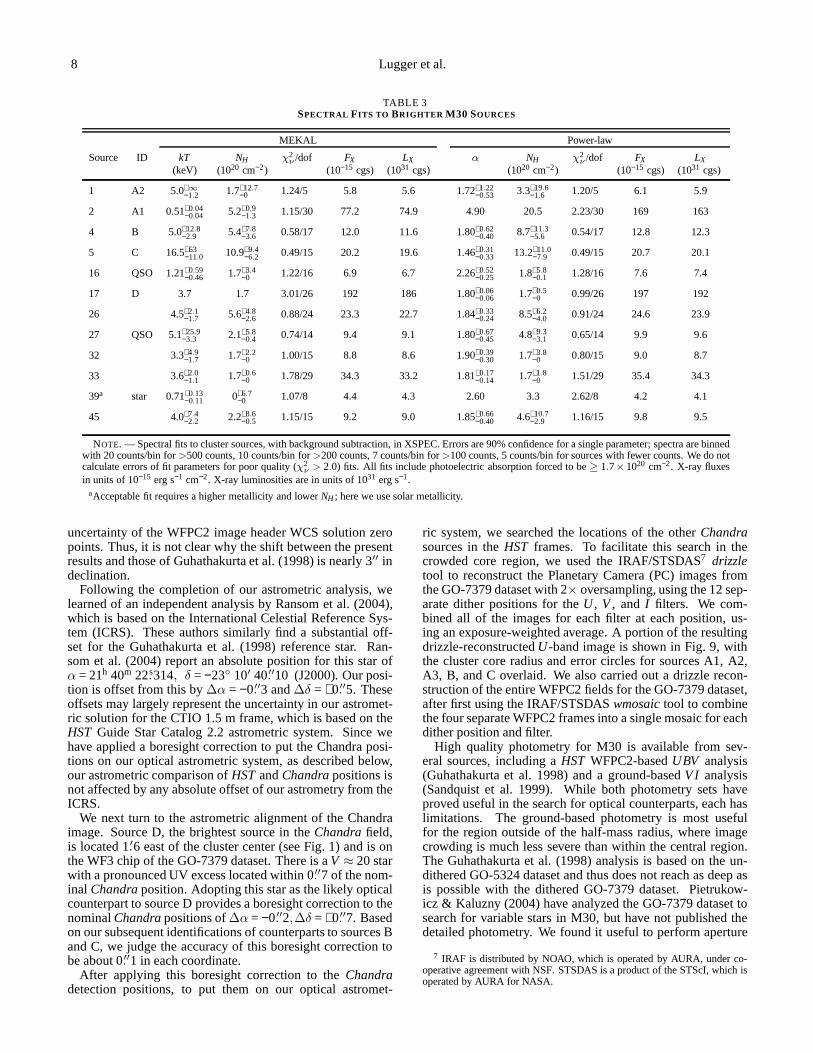
TABLE 3SPECTRAL F ITS TO BRIGHTER M30 SOURCES
MEKAL Power-law
Source ID kT NH χ2ν /dof FX LX α NH χ
2ν /dof FX LX
(keV) (1020 cm−2) (10−15 cgs) (1031 cgs) (1020 cm−2) (10−15 cgs) (1031 cgs)
1 A2 5.0+∞−1.2 1.7+12.7
−0 1.24/5 5.8 5.6 1.72+1.22−0.53 3.3+19.6
−1.6 1.20/5 6.1 5.9
2 A1 0.51+0.04−0.04 5.2+0.9
−1.3 1.15/30 77.2 74.9 4.90 20.5 2.23/30 169 163
4 B 5.0+12.8−2.9 5.4+7.8
−3.6 0.58/17 12.0 11.6 1.80+0.62−0.40 8.7+11.3
−5.6 0.54/17 12.8 12.3
5 C 16.5+63−11.0 10.9+9.4
−6.2 0.49/15 20.2 19.6 1.46+0.31−0.33 13.2+11.0
−7.9 0.49/15 20.7 20.1
16 QSO 1.21+0.59−0.46 1.7+3.4
−0 1.22/16 6.9 6.7 2.26+0.52−0.25 1.8+5.8
−0.1 1.28/16 7.6 7.4
17 D 3.7 1.7 3.01/26 192 186 1.80+0.06−0.06 1.7+0.5
−0 0.99/26 197 192
26 4.5+2.1−1.7 5.6+4.8
−2.6 0.88/24 23.3 22.7 1.84+0.33−0.24 8.5+6.2
−4.0 0.91/24 24.6 23.9
27 QSO 5.1+25.9−3.3 2.1+5.8
−0.4 0.74/14 9.4 9.1 1.80+0.67−0.45 4.8+9.3
−3.1 0.65/14 9.9 9.6
32 3.3+4.9−1.7 1.7+2.2
−0 1.00/15 8.8 8.6 1.90+0.39−0.30 1.7+3.8
−0 0.80/15 9.0 8.7
33 3.6+2.0−1.1 1.7+0.6
−0 1.78/29 34.3 33.2 1.81+0.17−0.14 1.7+1.8
−0 1.51/29 35.4 34.3
39a star 0.71+0.13−0.11 0+6.7
−0 1.07/8 4.4 4.3 2.60 3.3 2.62/8 4.2 4.1
45 4.0+7.4−2.2 2.2+8.6
−0.5 1.15/15 9.2 9.0 1.85+0.66−0.40 4.6+10.7
−2.9 1.16/15 9.8 9.5
NOTE. — Spectral fits to cluster sources, with background subtraction, in XSPEC. Errors are 90% confidence for a single parameter; spectra are binnedwith 20 counts/bin for>500 counts, 10 counts/bin for>200 counts, 7 counts/bin for>100 counts, 5 counts/bin for sources with fewer counts. We donotcalculate errors of fit parameters for poor quality (χ
2ν > 2.0) fits. All fits include photoelectric absorption forced to be≥ 1.7×1020 cm−2. X-ray fluxes
in units of 10−15 erg s−1 cm−2. X-ray luminosities are in units of 1031 erg s−1.aAcceptable fit requires a higher metallicity and lowerNH ; here we use solar metallicity.
uncertainty of the WFPC2 image header WCS solution zeropoints. Thus, it is not clear why the shift between the presentresults and those of Guhathakurta et al. (1998) is nearly 3′′ indeclination.
Following the completion of our astrometric analysis, welearned of an independent analysis by Ransom et al. (2004),which is based on the International Celestial Reference Sys-tem (ICRS). These authors similarly find a substantial off-set for the Guhathakurta et al. (1998) reference star. Ran-som et al. (2004) report an absolute position for this star ofα = 21h 40m 22.s314, δ = −23◦ 10′ 40.′′10 (J2000). Our posi-tion is offset from this by∆α = −0.′′3 and∆δ = +0.′′5. Theseoffsets may largely represent the uncertainty in our astromet-ric solution for the CTIO 1.5 m frame, which is based on theHST Guide Star Catalog 2.2 astrometric system. Since wehave applied a boresight correction to put the Chandra posi-tions on our optical astrometric system, as described below,our astrometric comparison ofHSTandChandrapositions isnot affected by any absolute offset of our astrometry from theICRS.
We next turn to the astrometric alignment of the Chandraimage. Source D, the brightest source in theChandrafield,is located 1.′6 east of the cluster center (see Fig. 1) and is onthe WF3 chip of the GO-7379 dataset. There is aV ≈ 20 starwith a pronounced UV excess located within 0.′′7 of the nom-inal Chandraposition. Adopting this star as the likely opticalcounterpart to source D provides a boresight correction to thenominalChandrapositions of∆α = −0.′′2,∆δ = +0.′′7. Basedon our subsequent identifications of counterparts to sources Band C, we judge the accuracy of this boresight correction tobe about 0.′′1 in each coordinate.
After applying this boresight correction to theChandradetection positions, to put them on our optical astromet-
ric system, we searched the locations of the otherChandrasources in theHST frames. To facilitate this search in thecrowded core region, we used the IRAF/STSDAS7 drizzletool to reconstruct the Planetary Camera (PC) images fromthe GO-7379 dataset with 2× oversampling, using the 12 sep-arate dither positions for theU , V, and I filters. We com-bined all of the images for each filter at each position, us-ing an exposure-weighted average. A portion of the resultingdrizzle-reconstructedU-band image is shown in Fig. 9, withthe cluster core radius and error circles for sources A1, A2,A3, B, and C overlaid. We also carried out a drizzle recon-struction of the entire WFPC2 fields for the GO-7379 dataset,after first using the IRAF/STSDASwmosaictool to combinethe four separate WFPC2 frames into a single mosaic for eachdither position and filter.
High quality photometry for M30 is available from sev-eral sources, including aHST WFPC2-basedUBV analysis(Guhathakurta et al. 1998) and a ground-basedVI analysis(Sandquist et al. 1999). While both photometry sets haveproved useful in the search for optical counterparts, each haslimitations. The ground-based photometry is most usefulfor the region outside of the half-mass radius, where imagecrowding is much less severe than within the central region.The Guhathakurta et al. (1998) analysis is based on the un-dithered GO-5324 dataset and thus does not reach as deep asis possible with the dithered GO-7379 dataset. Pietrukow-icz & Kaluzny (2004) have analyzed the GO-7379 dataset tosearch for variable stars in M30, but have not published thedetailed photometry. We found it useful to perform aperture
7 IRAF is distributed by NOAO, which is operated by AURA, underco-operative agreement with NSF. STSDAS is a product of the STScI, which isoperated by AURA for NASA.
ChandraSources in M30 9
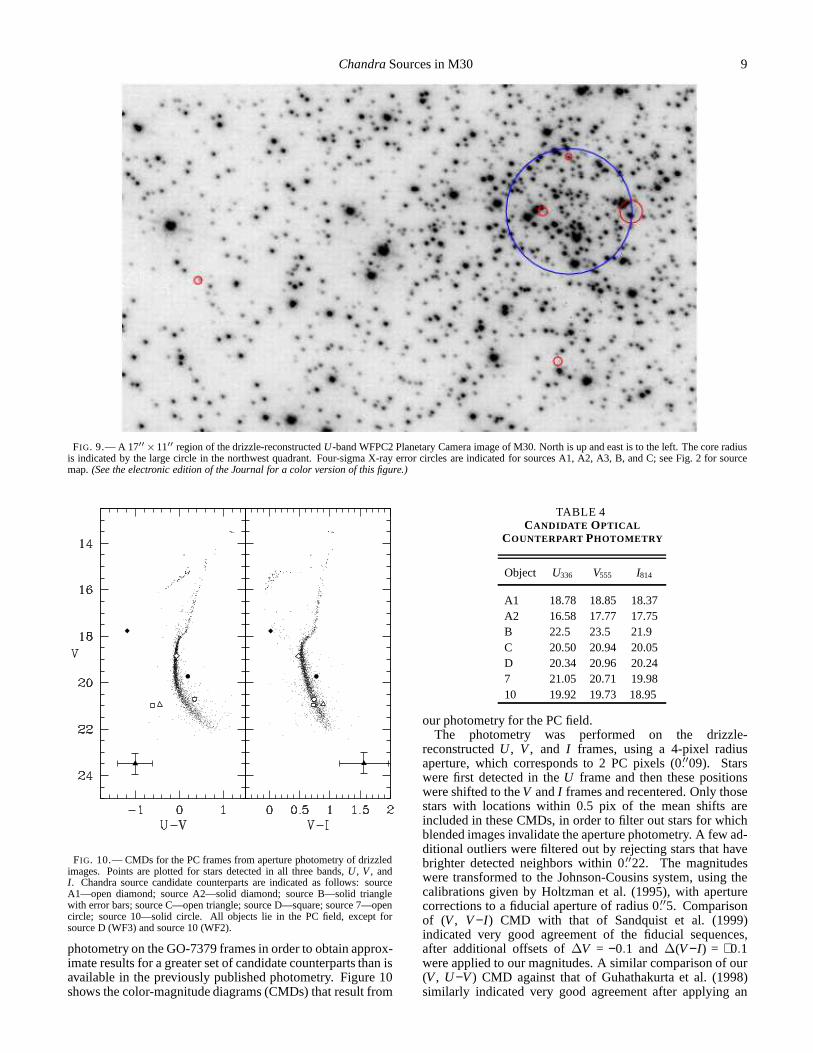
FIG. 9.— A 17′′×11′′ region of the drizzle-reconstructedU-band WFPC2 Planetary Camera image of M30. North is up and east is to the left. The core radiusis indicated by the large circle in the northwest quadrant. Four-sigma X-ray error circles are indicated for sources A1,A2, A3, B, and C; see Fig. 2 for sourcemap.(See the electronic edition of the Journal for a color version of this figure.)
FIG. 10.— CMDs for the PC frames from aperture photometry of drizzledimages. Points are plotted for stars detected in all three bands,U , V, andI . Chandra source candidate counterparts are indicated as follows: sourceA1—open diamond; source A2—solid diamond; source B—solid trianglewith error bars; source C—open triangle; source D—square; source 7—opencircle; source 10—solid circle. All objects lie in the PC field, except forsource D (WF3) and source 10 (WF2).
photometry on the GO-7379 frames in order to obtain approx-imate results for a greater set of candidate counterparts than isavailable in the previously published photometry. Figure 10shows the color-magnitude diagrams (CMDs) that result from
TABLE 4CANDIDATE OPTICAL
COUNTERPART PHOTOMETRY
Object U336 V555 I814
A1 18.78 18.85 18.37A2 16.58 17.77 17.75B 22.5 23.5 21.9C 20.50 20.94 20.05D 20.34 20.96 20.247 21.05 20.71 19.9810 19.92 19.73 18.95
our photometry for the PC field.The photometry was performed on the drizzle-
reconstructedU , V, and I frames, using a 4-pixel radiusaperture, which corresponds to 2 PC pixels (0.′′09). Starswere first detected in theU frame and then these positionswere shifted to theV andI frames and recentered. Only thosestars with locations within 0.5 pix of the mean shifts areincluded in these CMDs, in order to filter out stars for whichblended images invalidate the aperture photometry. A few ad-ditional outliers were filtered out by rejecting stars that havebrighter detected neighbors within 0.′′22. The magnitudeswere transformed to the Johnson-Cousins system, using thecalibrations given by Holtzman et al. (1995), with aperturecorrections to a fiducial aperture of radius 0.′′5. Comparisonof (V, V−I ) CMD with that of Sandquist et al. (1999)indicated very good agreement of the fiducial sequences,after additional offsets of∆V = −0.1 and ∆(V−I) = +0.1were applied to our magnitudes. A similar comparison of our(V, U−V) CMD against that of Guhathakurta et al. (1998)similarly indicated very good agreement after applying an
10 Lugger et al.
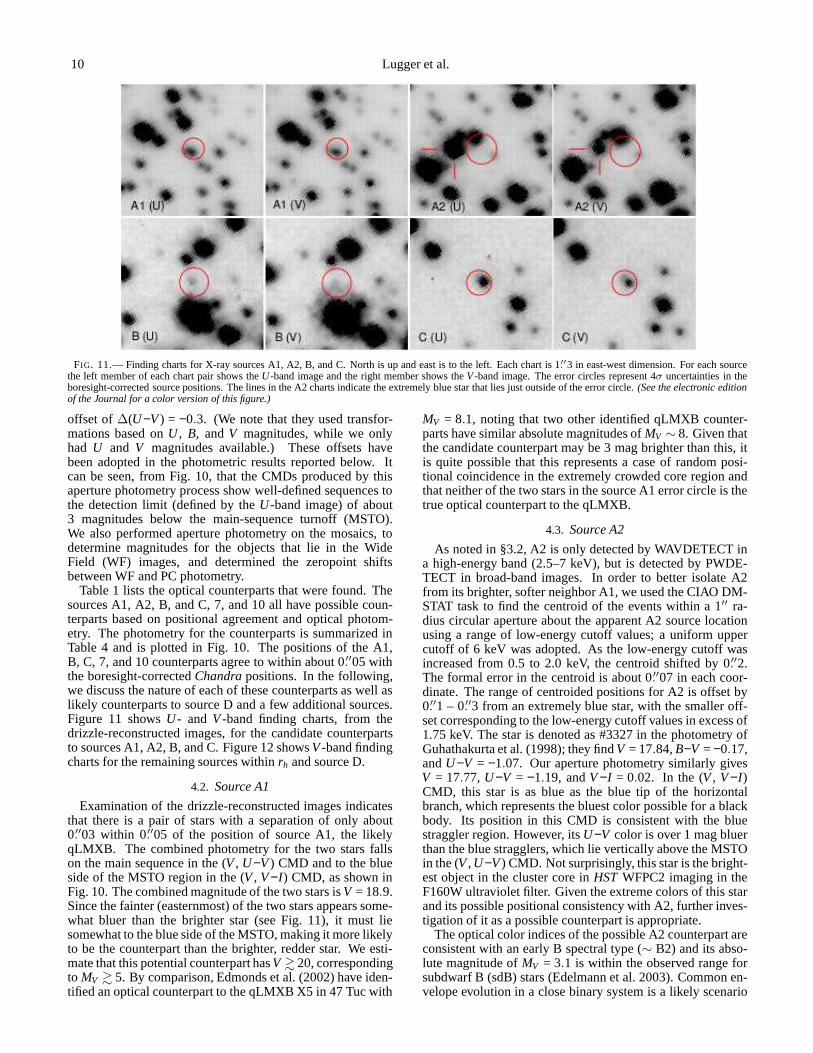
FIG. 11.— Finding charts for X-ray sources A1, A2, B, and C. Northis up and east is to the left. Each chart is 1.′′3 in east-west dimension. For each sourcethe left member of each chart pair shows theU-band image and the right member shows theV-band image. The error circles represent 4σ uncertainties in theboresight-corrected source positions. The lines in the A2 charts indicate the extremely blue star that lies just outside of the error circle.(See the electronic editionof the Journal for a color version of this figure.)
offset of ∆(U−V) = −0.3. (We note that they used transfor-mations based onU , B, andV magnitudes, while we onlyhad U and V magnitudes available.) These offsets havebeen adopted in the photometric results reported below. Itcan be seen, from Fig. 10, that the CMDs produced by thisaperture photometry process show well-defined sequences tothe detection limit (defined by theU-band image) of about3 magnitudes below the main-sequence turnoff (MSTO).We also performed aperture photometry on the mosaics, todetermine magnitudes for the objects that lie in the WideField (WF) images, and determined the zeropoint shiftsbetween WF and PC photometry.
Table 1 lists the optical counterparts that were found. Thesources A1, A2, B, and C, 7, and 10 all have possible coun-terparts based on positional agreement and optical photom-etry. The photometry for the counterparts is summarized inTable 4 and is plotted in Fig. 10. The positions of the A1,B, C, 7, and 10 counterparts agree to within about 0.′′05 withthe boresight-correctedChandrapositions. In the following,we discuss the nature of each of these counterparts as well aslikely counterparts to source D and a few additional sources.Figure 11 showsU- and V-band finding charts, from thedrizzle-reconstructed images, for the candidate counterpartsto sources A1, A2, B, and C. Figure 12 showsV-band findingcharts for the remaining sources withinrh and source D.
4.2. Source A1
Examination of the drizzle-reconstructed images indicatesthat there is a pair of stars with a separation of only about0.′′03 within 0.′′05 of the position of source A1, the likelyqLMXB. The combined photometry for the two stars fallson the main sequence in the (V, U−V) CMD and to the blueside of the MSTO region in the (V, V−I ) CMD, as shown inFig. 10. The combined magnitude of the two stars isV = 18.9.Since the fainter (easternmost) of the two stars appears some-what bluer than the brighter star (see Fig. 11), it must liesomewhat to the blue side of the MSTO, making it more likelyto be the counterpart than the brighter, redder star. We esti-mate that this potential counterpart hasV & 20, correspondingto MV & 5. By comparison, Edmonds et al. (2002) have iden-tified an optical counterpart to the qLMXB X5 in 47 Tuc with
MV = 8.1, noting that two other identified qLMXB counter-parts have similar absolute magnitudes ofMV ∼ 8. Given thatthe candidate counterpart may be 3 mag brighter than this, itis quite possible that this represents a case of random posi-tional coincidence in the extremely crowded core region andthat neither of the two stars in the source A1 error circle is thetrue optical counterpart to the qLMXB.
4.3. Source A2
As noted in §3.2, A2 is only detected by WAVDETECT ina high-energy band (2.5–7 keV), but is detected by PWDE-TECT in broad-band images. In order to better isolate A2from its brighter, softer neighbor A1, we used the CIAO DM-STAT task to find the centroid of the events within a 1′′ ra-dius circular aperture about the apparent A2 source locationusing a range of low-energy cutoff values; a uniform uppercutoff of 6 keV was adopted. As the low-energy cutoff wasincreased from 0.5 to 2.0 keV, the centroid shifted by 0.′′2.The formal error in the centroid is about 0.′′07 in each coor-dinate. The range of centroided positions for A2 is offset by0.′′1 – 0.′′3 from an extremely blue star, with the smaller off-set corresponding to the low-energy cutoff values in excessof1.75 keV. The star is denoted as #3327 in the photometry ofGuhathakurta et al. (1998); they findV = 17.84,B−V = −0.17,andU−V = −1.07. Our aperture photometry similarly givesV = 17.77, U−V = −1.19, andV−I = 0.02. In the (V, V−I )CMD, this star is as blue as the blue tip of the horizontalbranch, which represents the bluest color possible for a blackbody. Its position in this CMD is consistent with the bluestraggler region. However, itsU−V color is over 1 mag bluerthan the blue stragglers, which lie vertically above the MSTOin the (V,U−V) CMD. Not surprisingly, this star is the bright-est object in the cluster core inHST WFPC2 imaging in theF160W ultraviolet filter. Given the extreme colors of this starand its possible positional consistency with A2, further inves-tigation of it as a possible counterpart is appropriate.
The optical color indices of the possible A2 counterpart areconsistent with an early B spectral type (∼ B2) and its abso-lute magnitude ofMV = 3.1 is within the observed range forsubdwarf B (sdB) stars (Edelmann et al. 2003). Common en-velope evolution in a close binary system is a likely scenario
ChandraSources in M30 11
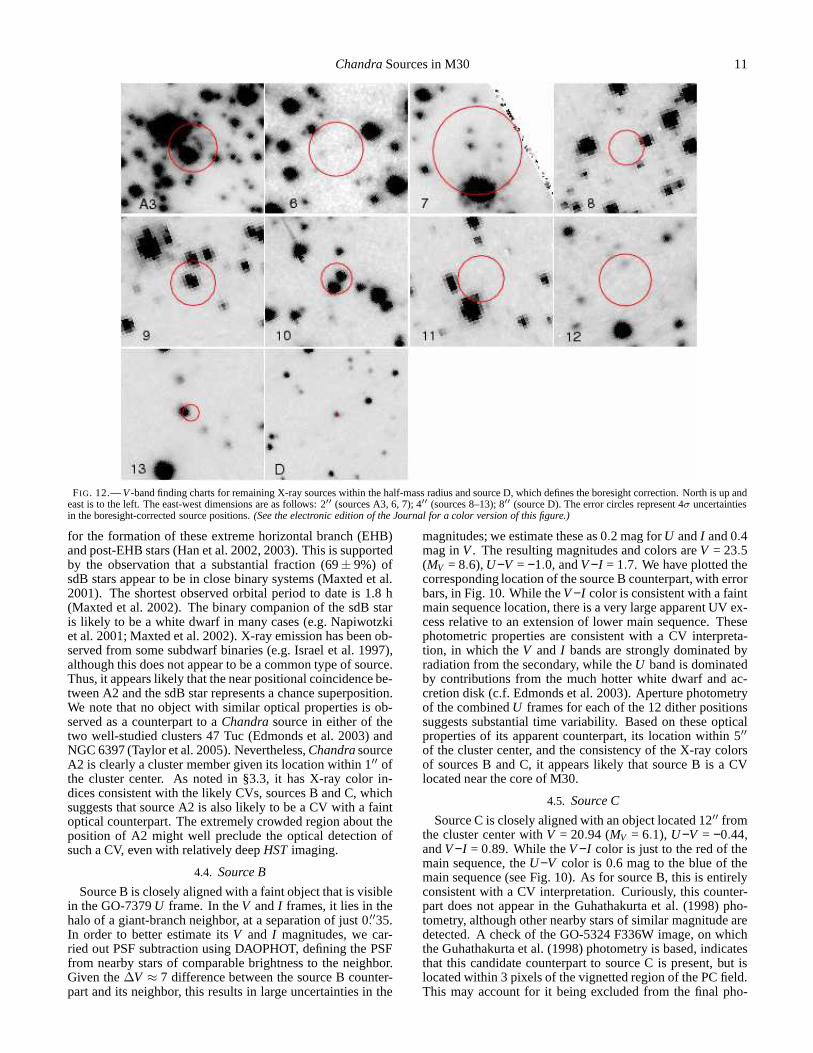
FIG. 12.—V-band finding charts for remaining X-ray sources within the half-mass radius and source D, which defines the boresight correction. North is up andeast is to the left. The east-west dimensions are as follows:2′′ (sources A3, 6, 7); 4′′ (sources 8–13); 8′′ (source D). The error circles represent 4σ uncertaintiesin the boresight-corrected source positions.(See the electronic edition of the Journal for a color version of this figure.)
for the formation of these extreme horizontal branch (EHB)and post-EHB stars (Han et al. 2002, 2003). This is supportedby the observation that a substantial fraction (69± 9%) ofsdB stars appear to be in close binary systems (Maxted et al.2001). The shortest observed orbital period to date is 1.8 h(Maxted et al. 2002). The binary companion of the sdB staris likely to be a white dwarf in many cases (e.g. Napiwotzkiet al. 2001; Maxted et al. 2002). X-ray emission has been ob-served from some subdwarf binaries (e.g. Israel et al. 1997),although this does not appear to be a common type of source.Thus, it appears likely that the near positional coincidence be-tween A2 and the sdB star represents a chance superposition.We note that no object with similar optical properties is ob-served as a counterpart to aChandrasource in either of thetwo well-studied clusters 47 Tuc (Edmonds et al. 2003) andNGC 6397 (Taylor et al. 2005). Nevertheless,ChandrasourceA2 is clearly a cluster member given its location within 1′′ ofthe cluster center. As noted in §3.3, it has X-ray color in-dices consistent with the likely CVs, sources B and C, whichsuggests that source A2 is also likely to be a CV with a faintoptical counterpart. The extremely crowded region about theposition of A2 might well preclude the optical detection ofsuch a CV, even with relatively deepHST imaging.
4.4. Source B
Source B is closely aligned with a faint object that is visiblein the GO-7379U frame. In theV andI frames, it lies in thehalo of a giant-branch neighbor, at a separation of just 0.′′35.In order to better estimate itsV and I magnitudes, we car-ried out PSF subtraction using DAOPHOT, defining the PSFfrom nearby stars of comparable brightness to the neighbor.Given the∆V ≈ 7 difference between the source B counter-part and its neighbor, this results in large uncertainties in the
magnitudes; we estimate these as 0.2 mag forU andI and 0.4mag inV. The resulting magnitudes and colors areV = 23.5(MV = 8.6),U−V = −1.0, andV−I = 1.7. We have plotted thecorresponding location of the source B counterpart, with errorbars, in Fig. 10. While theV−I color is consistent with a faintmain sequence location, there is a very large apparent UV ex-cess relative to an extension of lower main sequence. Thesephotometric properties are consistent with a CV interpreta-tion, in which theV and I bands are strongly dominated byradiation from the secondary, while theU band is dominatedby contributions from the much hotter white dwarf and ac-cretion disk (c.f. Edmonds et al. 2003). Aperture photometryof the combinedU frames for each of the 12 dither positionssuggests substantial time variability. Based on these opticalproperties of its apparent counterpart, its location within 5′′
of the cluster center, and the consistency of the X-ray colorsof sources B and C, it appears likely that source B is a CVlocated near the core of M30.
4.5. Source C
Source C is closely aligned with an object located 12′′ fromthe cluster center withV = 20.94 (MV = 6.1), U−V = −0.44,andV−I = 0.89. While theV−I color is just to the red of themain sequence, theU−V color is 0.6 mag to the blue of themain sequence (see Fig. 10). As for source B, this is entirelyconsistent with a CV interpretation. Curiously, this counter-part does not appear in the Guhathakurta et al. (1998) pho-tometry, although other nearby stars of similar magnitude aredetected. A check of the GO-5324 F336W image, on whichthe Guhathakurta et al. (1998) photometry is based, indicatesthat this candidate counterpart to source C is present, but islocated within 3 pixels of the vignetted region of the PC field.This may account for it being excluded from the final pho-
12 Lugger et al.
tometry list. This object is well detected in the single 600 sF336W exposure from GO-5603 (obtained in 1994). Approx-imate aperture photometry indicates that the object is about1.0 mag fainter in F336W, in 1999 versus 1994. This highlevel of variability provides additional support for the CVin-terpretation.
4.6. Source D
As previously mentioned, our boresight correction is de-fined by source D. The likely counterpart hasV = 20.74, aV−I color consistent with the main sequence and aU−V colorthat is 0.6 mag to the blue of the main sequence. Thus, its pho-tometric properties appear quite similar to those of sourceC,as can be seen in Fig. 10. This argues for interpreting sourceD as a CV in M30, which would be quite interesting given itslocation at 1.4 rh. However, the inferredLX = 2×1033 erg s−1
for source D would put it among the most luminous CVs seenin any globular cluster. In addition, itsChandraspectrum, dis-cussed in §3.6.2 above, is not well fit by a MEKAL spectrum,unlike those of sources A2, B, and C.
In order to obtain further information on the source D coun-terpart, we obtained optical spectra using the Hydra spec-trographs on the CTIO 4 m telescope in 2003 July and onthe WIYN 3.5 m telescope in 2003 September. The seeingwas poor throughout the CTIO run, typically exceeding 2.′′5.Thus, the light of this object was strongly mixed with that ofits much brighter neighbor at 2′′ separation and only a com-bined spectrum was obtained. While the seeing at WIYN wasgenerally better, the large airmass of this southern cluster re-sulted in a similar mixing of the star with its neighbor. Exam-ination of this combined spectrum indicates a emission lineat 5562 Å with a FWHM of∼ 12 Å, with no evidence forBalmer emission at the cluster velocity. While the detectionof only one emission line precludes a definitive redshift de-termination, we note that identifying this as the relatively iso-lated MgII λ2800 line would imply a redshift ofz = 0.99.A long-slit spectrum of the optical counterpart to source Dwould greatly assist in determining its physical nature.
4.7. Other Identifications
Two additional sources visible in Fig. 2, source 6(CXOGLB J214021.48-231054.5) and source 7 (CXOGLBJ214021.56-231032.6), fall within the drizzled PlanetaryCamera field. No object is detected in theU-band imagewithin the error circle for source 6, while there are two veryfaint stars within the error circles in theV- andI -band images(see Fig. 12). Source 7 is very close to the edge of the PC fieldand was imaged in 8 of 12 pointings. Three faint objects aredetected within the error circles in all three bands for source7 and one additional faint object is detected in theV and Ibands (see Fig. 12). None of these objects appears to be blue.Photometry for the brightest of the three is shown in Fig. 10.While this object lies on the main sequence in the (V, V−I)CMD, it has an apparent UV deficit and is thus not likelyto be a CV. We note that active binary (AB) counterpartsto Chandrasources in globular clusters typically lie on themain sequence or somewhat above it, as seen in the clustersNGC 6397 (Grindlay et al. 2001b), NGC 6752 (Pooley et al.2002a), 47 Tuc (Edmonds et al. 2003), and M4 (Bassa et al.2004). Thus, the CMD location of this possible counterpart tosource 7 is consistent with an active binary interpretation.
It can be seen in Fig. 12 that optical objects are detectedin several of the source error circles in the WF fields. The
source 9 error circle contains a close pair of objects. This lo-cation has only been imaged by the GO-5630 program, whichprovides F555W (V) and F160BW coverage. The images inthe latter band are rather shallow. Since the possible source 9counterparts are only detected in F555W, no color informationis available. Of the two objects in the source 10 error circle,the southern object lies on the main sequence in both CMDs,while the northern object lies above the main sequence in bothCMDs (see Fig. 10). Thus, this latter object is consistent withbeing an active binary. The faint object detected near the edgeof the source 12 error circle in theV andI frames is not de-tected in theU frame. It is thus likely to be a faint main se-quence star. The object detected on the edge of the error circlefor source 13 lies on the main sequence in both CMDs. Thus,this object does not appear likely to be the source 13 counter-part, despite its close proximity to the source 13 location.
We attempted to determine optical counterparts for addi-tionalChandrasources listed in Table 1, by comparison of theChandra, HST, and ground-based images, and then obtain-ing Hydra spectroscopy for candidate counterparts. As notedabove, the crowded conditions, even outside of the half-massradius, proved challenging for the spectroscopic program.Atboth CTIO and WIYN, the minimum fiber size is 2′′. The goalof this effort was to determine whether any otherChandrasources are likely to be associated with cluster objects, par-ticularly for sources, such as D, that lie beyond the half-massradius. Any source in the cluster halo that is confirmed as acluster member is a good candidate for having been ejectedfrom the cluster core by an energetic binary interaction.
Chandra source 39 (CXOU J214033.30-231236.3) at 3.′2from the cluster center coincides with a bright star that isalmost certainly a foreground object. This star is listed as#1 in the photometry of Sandquist et al. (1999) and hasV = 12.03,V−I = 0.80, which place it at the magnitude levelof the tip of the giant branch but 0.6 mag bluer inV−I color.The color index indicates a spectral type of approximatelyG2. The X-ray to optical flux ratio ofFX/FV ≈ 10−4 is withinthe range observed for main-sequence early G stars (Huenschet al. 1998). The soft X-ray spectrum of this source providesadditional evidence that it is a foreground star (see §3.6.2).
The CTIO and WIYN Hydra spectroscopy described pre-viously resulted in the tentative identification of three ofthe other Chandra sources, numbers 16, 27, and 50 in Ta-ble 1 (CXOU J214016.05-230957.3, 214015.01-231217.5,and 214037.03-231337.1, respectively). These objects arelo-cated at distances of 1.′6, 2.′2, and 4.′4 respectively, from thecluster center. While the spectra of the apparent counterpartsto sources 16 and 27 are blended with neighboring stars, thereare broad emission lines apparent in each of the spectra thatgive consistent redshifts. These lines are enhanced when asmooth continuum is fit and subtracted. For source 16, Ly-α,C IV λ1549, and CIII ] λ1909 give a mean redshift of 2.42. Forsource 27, Ly-α, N V λ1240, SiIV+O IV ] λ 1400, and CIVλ1549 give a mean redshift of 3.08. Source 50 is positionallycoincident with an apparent elliptical galaxy with a redshift of0.27, based on a detection of the Mg b triplet and the CaII H& K break. It is not surprising that these three sources, whichall lie well outside of the cluster half-mass radius, are back-ground objects. However, this does not resolve the issue ofwhether a small number of the other sources near or outsideof rh may actually be cluster members that were ejected fromthe central region. This will require additional spectroscopy,under more favorable observing conditions. The use of a longslit or slitlets would facilitate separation of objects from close
ChandraSources in M30 13
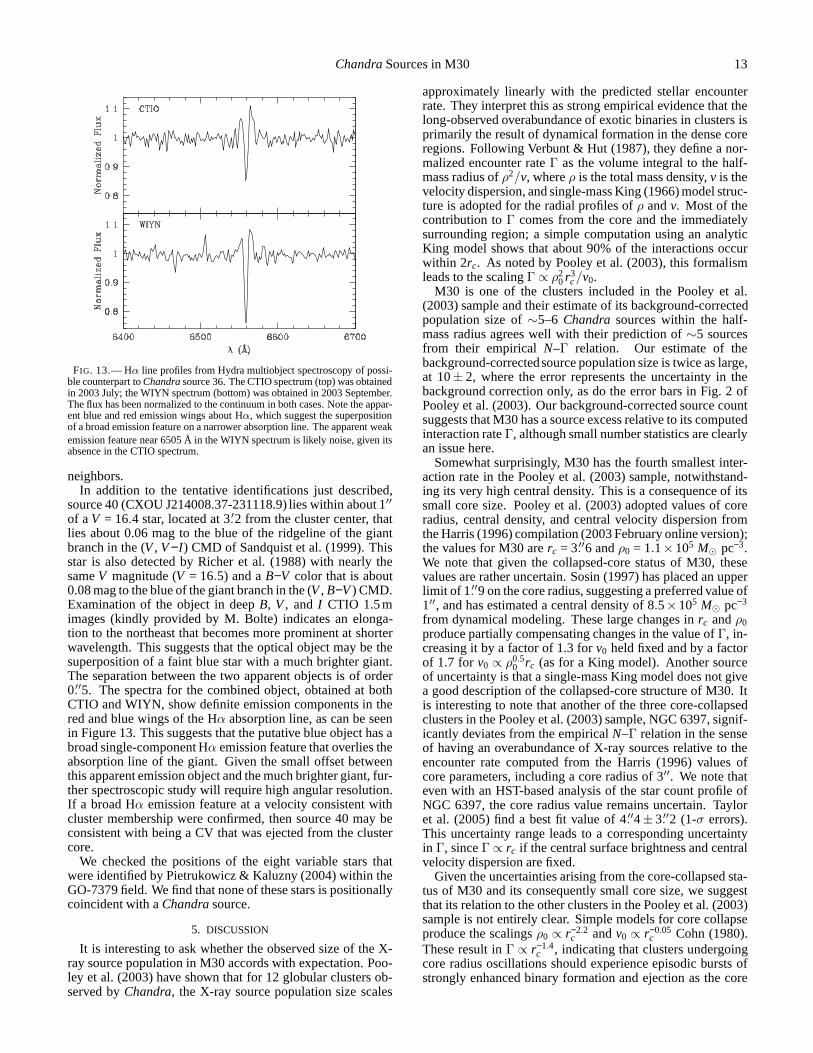
FIG. 13.— Hα line profiles from Hydra multiobject spectroscopy of possi-ble counterpart toChandrasource 36. The CTIO spectrum (top) was obtainedin 2003 July; the WIYN spectrum (bottom) was obtained in 2003September.The flux has been normalized to the continuum in both cases. Note the appar-ent blue and red emission wings about Hα, which suggest the superpositionof a broad emission feature on a narrower absorption line. The apparent weakemission feature near 6505 Å in the WIYN spectrum is likely noise, given itsabsence in the CTIO spectrum.
neighbors.In addition to the tentative identifications just described,
source 40 (CXOU J214008.37-231118.9) lies within about 1′′
of aV = 16.4 star, located at 3.′2 from the cluster center, thatlies about 0.06 mag to the blue of the ridgeline of the giantbranch in the (V, V−I ) CMD of Sandquist et al. (1999). Thisstar is also detected by Richer et al. (1988) with nearly thesameV magnitude (V = 16.5) and aB−V color that is about0.08 mag to the blue of the giant branch in the (V, B−V) CMD.Examination of the object in deepB, V, and I CTIO 1.5 mimages (kindly provided by M. Bolte) indicates an elonga-tion to the northeast that becomes more prominent at shorterwavelength. This suggests that the optical object may be thesuperposition of a faint blue star with a much brighter giant.The separation between the two apparent objects is of order0.′′5. The spectra for the combined object, obtained at bothCTIO and WIYN, show definite emission components in thered and blue wings of the Hα absorption line, as can be seenin Figure 13. This suggests that the putative blue object hasabroad single-component Hα emission feature that overlies theabsorption line of the giant. Given the small offset betweenthis apparent emission object and the much brighter giant, fur-ther spectroscopic study will require high angular resolution.If a broad Hα emission feature at a velocity consistent withcluster membership were confirmed, then source 40 may beconsistent with being a CV that was ejected from the clustercore.
We checked the positions of the eight variable stars thatwere identified by Pietrukowicz & Kaluzny (2004) within theGO-7379 field. We find that none of these stars is positionallycoincident with aChandrasource.
5. DISCUSSION
It is interesting to ask whether the observed size of the X-ray source population in M30 accords with expectation. Poo-ley et al. (2003) have shown that for 12 globular clusters ob-served byChandra, the X-ray source population size scales
approximately linearly with the predicted stellar encounterrate. They interpret this as strong empirical evidence thatthelong-observed overabundance of exotic binaries in clusters isprimarily the result of dynamical formation in the dense coreregions. Following Verbunt & Hut (1987), they define a nor-malized encounter rateΓ as the volume integral to the half-mass radius ofρ2/v, whereρ is the total mass density,v is thevelocity dispersion, and single-mass King (1966) model struc-ture is adopted for the radial profiles ofρ andv. Most of thecontribution toΓ comes from the core and the immediatelysurrounding region; a simple computation using an analyticKing model shows that about 90% of the interactions occurwithin 2rc. As noted by Pooley et al. (2003), this formalismleads to the scalingΓ ∝ ρ2
0 r3c/v0.
M30 is one of the clusters included in the Pooley et al.(2003) sample and their estimate of its background-correctedpopulation size of∼5–6 Chandrasources within the half-mass radius agrees well with their prediction of∼5 sourcesfrom their empiricalN–Γ relation. Our estimate of thebackground-correctedsource population size is twice as large,at 10± 2, where the error represents the uncertainty in thebackground correction only, as do the error bars in Fig. 2 ofPooley et al. (2003). Our background-corrected source countsuggests that M30 has a source excess relative to its computedinteraction rateΓ, although small number statistics are clearlyan issue here.
Somewhat surprisingly, M30 has the fourth smallest inter-action rate in the Pooley et al. (2003) sample, notwithstand-ing its very high central density. This is a consequence of itssmall core size. Pooley et al. (2003) adopted values of coreradius, central density, and central velocity dispersion fromthe Harris (1996) compilation (2003 February online version);the values for M30 arerc = 3.′′6 andρ0 = 1.1×10⁵ M⊙ pc−3.We note that given the collapsed-core status of M30, thesevalues are rather uncertain. Sosin (1997) has placed an upperlimit of 1.′′9 on the core radius, suggesting a preferred value of1′′, and has estimated a central density of 8.5×10⁵ M⊙ pc−3
from dynamical modeling. These large changes inrc andρ0produce partially compensating changes in the value ofΓ, in-creasing it by a factor of 1.3 forv0 held fixed and by a factorof 1.7 for v0 ∝ ρ0.5
0 rc (as for a King model). Another sourceof uncertainty is that a single-mass King model does not givea good description of the collapsed-core structure of M30. Itis interesting to note that another of the three core-collapsedclusters in the Pooley et al. (2003) sample, NGC 6397, signif-icantly deviates from the empiricalN–Γ relation in the senseof having an overabundance of X-ray sources relative to theencounter rate computed from the Harris (1996) values ofcore parameters, including a core radius of 3′′. We note thateven with an HST-based analysis of the star count profile ofNGC 6397, the core radius value remains uncertain. Tayloret al. (2005) find a best fit value of 4.′′4± 3.′′2 (1-σ errors).This uncertainty range leads to a corresponding uncertaintyin Γ, sinceΓ ∝ rc if the central surface brightness and centralvelocity dispersion are fixed.
Given the uncertainties arising from the core-collapsed sta-tus of M30 and its consequently small core size, we suggestthat its relation to the other clusters in the Pooley et al. (2003)sample is not entirely clear. Simple models for core collapseproduce the scalingsρ0 ∝ r−2.2
c andv0 ∝ r−0.05c Cohn (1980).
These result inΓ ∝ r−1.4c , indicating that clusters undergoing
core radius oscillations should experience episodic bursts ofstrongly enhanced binary formation and ejection as the core
14 Lugger et al.
passes through its densest phases. Thus, the size of the X-ray binary population in a collapsed-core cluster may undergosubstantial fluctuations in time. In light of these issues, de-tailed dynamical simulations of the evolution of binary pop-ulations in clusters undergoing core collapse would be veryhelpful.
6. SUMMARY
Our ChandraACIS-S imaging of the collapsed-core glob-ular cluster M30 has detected a centrally concentrated popu-lation of X-ray sources, including six within 12′′ of the clus-ter center and three within the 1.′′9 core radius. There is anet excess of about 10 sources above background within thehalf-mass radius. The brightest core source (A1) has an X-ray flux and spectrum that are both consistent with it beinga qLMXB. The other central sources (A2, A3, B, and C) allhave X-ray properties consistent with being CVs. We haveidentified likely optical counterparts to sources B and C thatare similarly consistent with a CV interpretation. While wehave suggested possible counterparts to sources A1 and A2,the status of these is uncertain and will require further inves-tigation. Sources 7 and 10, which lie at 17′′ and 51′′ from thecluster center, respectively, have possible active binarycoun-terparts. There remains a possibility of a significant number ofadditional faint sources in and near the core that lie somewhatbelow our detection limit of about 4.5 counts (correspond-ing to to a source luminosity of∼ 4× 1030 erg s−1). Addi-tionalChandraimaging would be very useful in searching fora fainter source population.
Our analysis of the radial distribution of the sources sug-gests that those belonging to the cluster are largely confinedto the half-mass radius. There is some evidence for a smallexcess of sources over the expected background betweenrhand 2rh; some of these may have been ejected from the cen-tral regions. The radial profile of the sources withinrh impliesa typical source mass of about 1.3±0.2M⊙, which is consis-tent with a variety of binary systems, including CVs.
Our analysis of the X-ray spectrum of source A1 indicatesthat it is best fit by a model for a neutron star thermally ra-diating through a hydrogen atmosphere, consistent with the
qLMXB interpretation. While the spectral modeling does notprovide tight constraints on the neutron star mass and radius,it does demonstrate consistency with standard neutron starstructure models.
Our effort to identify additional sources using ground-basedoptical spectroscopy with the CTIO and WIYN Hydra mul-tiobject spectrographs demonstrated that two of the sourcesbeyond the half-mass radius are quasars. The optical spec-trum of source D, the brightest source in the field, shows noevidence for Hα emission, while it does show a possible red-shifted emission line. Thus it is more likely consistent with abackground AGN than with a cluster CV. The spectroscopydid identify an object, also located beyond the half-mass ra-dius, that shows Hα emission wings about an absorption line.This object appears to be the superposition of two stars thatare not well resolved by ground-based imaging and are out-side of the field of HST imaging. Further investigation of thisintriguing object is clearly warranted.
The core-collapsed status of M30 complicates a compar-ison of its Chandrasource population sizeN with the em-pirical relation betweenN and collision rateΓ establishedfor other clusters. While the observed population of about10 sources above background within the half-mass radius istwice as large as the prediction of the relation, the determi-nation of an appropriateΓ value for M30 is challenging givenits very small core size and strong deviation from King-modelstructure in the inner region. A deeper X-ray luminosity func-tion and detailed modeling of source population evolution ina collapsed-core cluster would facilitate further investigationof this issue.
We are grateful to Mike Bolte and Ron Gilliland for gra-ciously providing ground-based images of M30 for our study.We thank Xavier Koenig and Allen Rogel for obtaining Hydraspectra of candidate source counterparts. We also appreciatethe helpful suggestions of the referee.
This project was supported by NASAChandragrant GO2-3037X to Indiana University.
REFERENCES
Bassa, C., Pooley, D., Homer, L., Verbunt, F., Gaensler, B. M., Lewin,W. H. G., Anderson, S. F., Margon, B., Kaspi, V. M., & van der Klis, M.2004, ApJ, 609, 755
Bergbusch, P. A., & Vandenberg, D. A. 1992, ApJS, 81, 163Brandt, W. N., & Hasinger, G. 2005, ARA&A, 43, 827Broos, P., Townsley, L., Getman, K., & Bauer, F. 2002, ACIS Extract, An
ACIS Point Source Extraction Package, Pennsylvania State University,http://www.astro.psu.edu/xray/docs/TARA/ae_users_guide.html
Brown, E. F., Bildsten, L., & Rutledge, R. E. 1998, ApJ, 504, L95Campana, S., Colpi, M., Mereghetti, S., Stella, L., & Tavani, M. 1998,
A&A Rev., 8, 279Carney, B. W. 1996, PASP, 108, 900Carretta, E., Gratton, R. G., Clementini, G., & Fusi Pecci, F. 2000, ApJ, 533,
215Cohn, H. 1980, ApJ, 242, 765Cohn, H. 1985, in IAU Symp. 113: Dynamics of Star Clusters, 161–177Damiani, F., Maggio, A., Micela, G., & Sciortino, S. 1997, ApJ, 483, 370Davis, J. E. 2001, ApJ, 562, 575Djorgovski, S., & King, I. R. 1986, ApJ, 305, L61Edelmann, H., Heber, U., Hagen, H.-J., Lemke, M., Dreizler,S., Napiwotzki,
R., & Engels, D. 2003, A&A, 400, 939Edmonds, P. D., Gilliland, R. L., Heinke, C. O., & Grindlay, J. E. 2003, ApJ,
596, 1177Edmonds, P. D., Heinke, C. O., Grindlay, J. E., & Gilliland, R. L. 2002, ApJ,
564, L17
Feigelson, E. D., Broos, P., Gaffney, J. A., Garmire, G., Hillenbrand, L. A.,Pravdo, S. H., Townsley, L., & Tsuboi, Y. 2002, ApJ, 574, 258
Freeman, P. E., Kashyap, V., Rosner, R., & Lamb, D. Q. 2002, ApJS, 138,185
Gendre, B., Barret, D., & Webb, N. A. 2003, A&A, 400, 521Giacconi, R., Rosati, P., Tozzi, P., & et al. 2001, ApJ, 551, 624Grindlay, J. E., Camilo, F., Heinke, C. O., Edmonds, P. D., Cohn, H., &
Lugger, P. 2002, ApJ, 581, 470Grindlay, J. E., Heinke, C., Edmonds, P. D., & Murray, S. S. 2001a, Science,
292, 2290Grindlay, J. E., Heinke, C. O., Edmonds, P. D., Murray, S. S.,& Cool, A. M.
2001b, ApJ, 563, L53Guhathakurta, P., Webster, Z. T., Yanny, B., Schneider, D. P., & Bahcall, J. N.
1998, AJ, 116, 1757Han, Z., Podsiadlowski, P., Maxted, P. F. L., & Marsh, T. R. 2003, MNRAS,
341, 669Han, Z., Podsiadlowski, P., Maxted, P. F. L., Marsh, T. R., & Ivanova, N.
2002, MNRAS, 336, 449Harris, W. E. 1996, AJ, 112, 1487Heinke, C. O., Grindlay, J. E., Edmonds, P. D., Cohn, H. N., Lugger, P. M.,
Camilo, F., Bogdanov, S., & Freire, P. C. 2005, ApJ, 625, 796Heinke, C. O., Grindlay, J. E., Edmonds, P. D., Lloyd, D. A., Murray, S. S.,
Cohn, H. N., & Lugger, P. M. 2003a, ApJ, 598, 516Heinke, C. O., Grindlay, J. E., Lloyd, D. A., & Edmonds, P. D. 2003b, ApJ,
588, 452
ChandraSources in M30 15
Heinke, C. O., Grindlay, J. E., Lugger, P. M., Cohn, H. N., Edmonds, P. D.,Lloyd, D. A., & Cool, A. M. 2003c, ApJ, 598, 501
Holtzman, J. A., Burrows, C. J., Casertano, S., Hester, J. J., Trauger, J. T.,Watson, A. M., & Worthey, G. 1995, PASP, 107, 1065
Howell, J. H., Guhathakurta, P., & Tan, A. 2000, AJ, 119, 1259Huensch, M., Schmitt, J. H. M. M., & Voges, W. 1998, A&AS, 132,155Hut, P., McMillan, S., Goodman, J., Mateo, M., Phinney, E. S., Pryor, C.,
Richer, H. B., Verbunt, F., & Weinberg, M. 1992, PASP, 104, 981in’t Zand, J. J. M., van Kerkwijk, M. H., Pooley, D., Verbunt,F., Wijnands,
R., & Lewin, W. H. G. 2001, ApJ, 563, L41Israel, G. L., Stella, L., Angelini, L., White, N. E., Kallman, T. R., Giommi,
P., & Treves, A. 1997, ApJ, 474, L53+Johnston, H. M., Verbunt, F., & Hasinger, G. 1994, A&A, 289, 763Kim, D.-W., Cameron, R. A., Drake, J. J., Evans, N. R., Freeman, P., Gaetz,
T. J., Ghosh, H., Green, P. J., Harnden, Jr., F. R., Karovska,M., Kashyap,V., Maksym, P. W., Ratzlaff, P. W., Schlegel, E. M., Silverman, J. D.,Tananbaum, H. D., Vikhlinin, A. A., Wilkes, B. J., & Grimes, J. P. 2004,ApJS, 150, 19
King, I. R. 1966, AJ, 71, 64Lugger, P. M., Cohn, H. N., & Grindlay, J. E. 1995, ApJ, 439, 191Maxted, P. f. L., Heber, U., Marsh, T. R., & North, R. C. 2001, MNRAS, 326,
1391Maxted, P. F. L., Marsh, T. R., Heber, U., Morales-Rueda, L.,North, R. C.,
& Lawson, W. A. 2002, MNRAS, 333, 231Napiwotzki, R., Edelmann, H., Heber, U., Karl, C., Drechsel, H., Pauli, E.-
M., & Christlieb, N. 2001, A&A, 378, L17Phillips, K. J. H., Mewe, R., Harra-Murnion, L. K., Kaastra,J. S.,
Beiersdorfer, P., Brown, G. V., & Liedahl, D. A. 1999, A&AS, 138, 381Pietrukowicz, P., & Kaluzny, J. 2004, Acta Astronomica, 54,19Pooley, D., Lewin, W. H. G., Anderson, S. F., Baumgardt, H., Filippenko,
A. V., Gaensler, B. M., Homer, L., Hut, P., Kaspi, V. M., Makino, J.,Margon, B., McMillan, S., Portegies Zwart, S., van der Klis,M., &Verbunt, F. 2003, ApJ, 591, L131
Pooley, D., Lewin, W. H. G., Homer, L., Verbunt, F., Anderson, S. F.,Gaensler, B. M., Margon, B., Miller, J. M., Fox, D. W., Kaspi,V. M., &van der Klis, M. 2002a, ApJ, 569, 405
Pooley, D., Lewin, W. H. G., Verbunt, F., Homer, L., Margon, B., Gaensler,B. M., Kaspi, V. M., Miller, J. M., Fox, D. W., & van der Klis, M.2002b,ApJ, 573, 184
Rajagopal, M., & Romani, R. W. 1996, ApJ, 461, 327Ransom, S. M., Stairs, I. H., Backer, D. C., Greenhill, L. J.,Bassa, C. G.,
Hessels, J. W. T., & Kaspi, V. M. 2004, ApJ, 604, 328Richer, H. B., Fahlman, G. G., & Vandenberg, D. A. 1988, ApJ, 329, 187Romani, R. W. 1987, ApJ, 313, 718Rutledge, R. E., Bildsten, L., Brown, E. F., Pavlov, G. G., & Zavlin, V. E.
1999, ApJ, 514, 945—. 2002, ApJ, 578, 405Rybicki, G. B., Heinke, C. O., Narayan, R., & Grindlay, J. E. 2005, ApJ,
submittedSandquist, E. L., Bolte, M., Langer, G. E., Hesser, J. E., & Mendes de
Oliveira, C. 1999, ApJ, 518, 262Sosin, C. 1997, AJ, 114, 1517Taylor, J. M., Grindlay, J. E., Edmonds, P. D., Cool, A. C., Cohn, H. N., &
Lugger, P. M. 2005, ApJ, submittedVerbunt, F. 2001, A&A, 368, 137Verbunt, F., & Hut, P. 1987, in IAU Symp. 125: The Origin and Evolution of
Neutron Stars, 187–+Yanny, B., Guhathakurta, P., Schneider, D. P., & Bahcall, J.N. 1994, ApJ,
435, L59Zavlin, V. E., Pavlov, G. G., & Shibanov, Y. A. 1996, A&A, 315,141
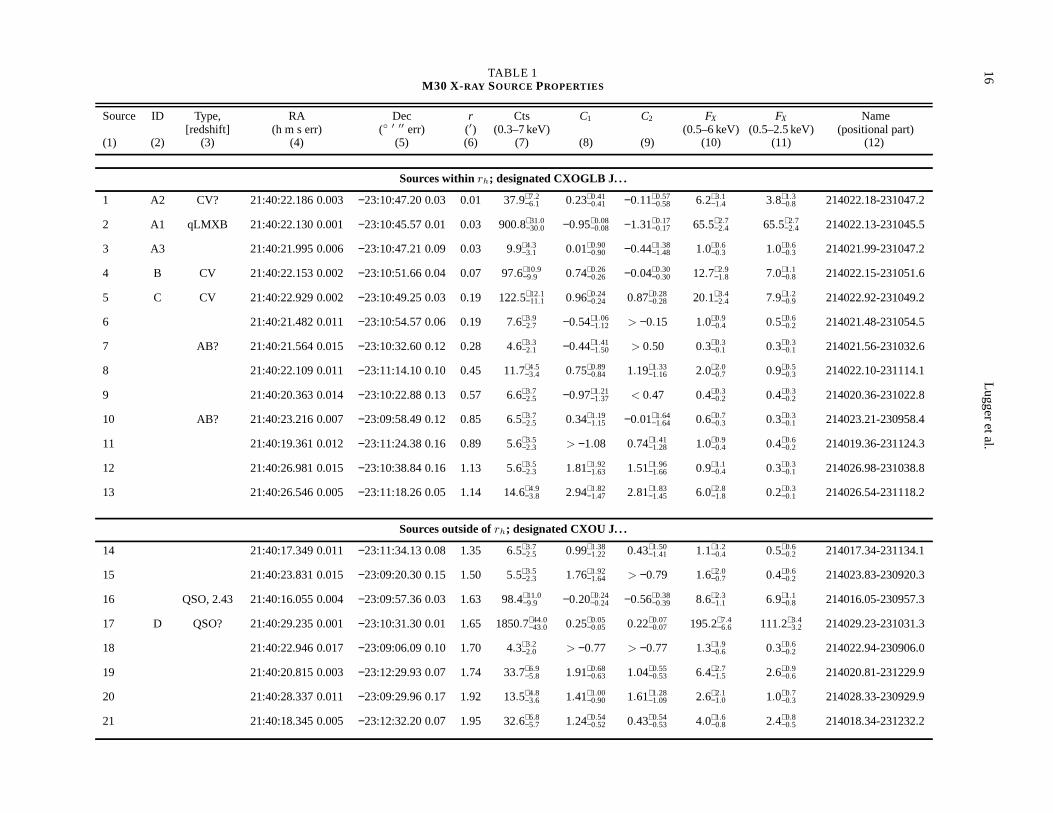
16
Lu
gg
eretal.TABLE 1
M30 X-RAY SOURCE PROPERTIES
Source ID Type, RA Dec r Cts C1 C2 FX FX Name[redshift] (h m s err) (◦ ′ ′′ err) (′) (0.3–7 keV) (0.5–6 keV) (0.5–2.5 keV) (positional part)
(1) (2) (3) (4) (5) (6) (7) (8) (9) (10) (11) (12)
Sources withinrh; designated CXOGLB J. . .
1 A2 CV? 21:40:22.186 0.003 −23:10:47.20 0.03 0.01 37.9+7.2−6.1 0.23+0.41
−0.41 −0.11+0.57−0.58 6.2+3.1
−1.4 3.8+1.3−0.8 214022.18-231047.2
2 A1 qLMXB 21:40:22.130 0.001 −23:10:45.57 0.01 0.03 900.8+31.0−30.0 −0.95+0.08
−0.08 −1.31+0.17−0.17 65.5+2.7
−2.4 65.5+2.7−2.4 214022.13-231045.5
3 A3 21:40:21.995 0.006 −23:10:47.21 0.09 0.03 9.9+4.3−3.1 0.01+0.90
−0.90 −0.44+1.38−1.48 1.0+0.6
−0.3 1.0+0.6−0.3 214021.99-231047.2
4 B CV 21:40:22.153 0.002 −23:10:51.66 0.04 0.07 97.6+10.9−9.9 0.74+0.26
−0.26 −0.04+0.30−0.30 12.7+2.9
−1.8 7.0+1.1−0.8 214022.15-231051.6
5 C CV 21:40:22.929 0.002 −23:10:49.25 0.03 0.19 122.5+12.1−11.1 0.96+0.24
−0.24 0.87+0.28−0.28 20.1+3.4
−2.4 7.9+1.2−0.9 214022.92-231049.2
6 21:40:21.482 0.011 −23:10:54.57 0.06 0.19 7.6+3.9−2.7 −0.54+1.06
−1.12 > −0.15 1.0+0.9−0.4 0.5+0.6
−0.2 214021.48-231054.5
7 AB? 21:40:21.564 0.015 −23:10:32.60 0.12 0.28 4.6+3.3−2.1 −0.44+1.41
−1.50 > 0.50 0.3+0.3−0.1 0.3+0.3
−0.1 214021.56-231032.6
8 21:40:22.109 0.011 −23:11:14.10 0.10 0.45 11.7+4.5−3.4 0.75+0.89
−0.84 1.19+1.33−1.16 2.0+2.0
−0.7 0.9+0.5−0.3 214022.10-231114.1
9 21:40:20.363 0.014 −23:10:22.88 0.13 0.57 6.6+3.7−2.5 −0.97+1.21
−1.37 < 0.47 0.4+0.3−0.2 0.4+0.3
−0.2 214020.36-231022.8
10 AB? 21:40:23.216 0.007 −23:09:58.49 0.12 0.85 6.5+3.7−2.5 0.34+1.19
−1.15 −0.01+1.64−1.64 0.6+0.7
−0.3 0.3+0.3−0.1 214023.21-230958.4
11 21:40:19.361 0.012 −23:11:24.38 0.16 0.89 5.6+3.5−2.3 > −1.08 0.74+1.41
−1.28 1.0+0.9−0.4 0.4+0.6
−0.2 214019.36-231124.3
12 21:40:26.981 0.015 −23:10:38.84 0.16 1.13 5.6+3.5−2.3 1.81+1.92
−1.63 1.51+1.96−1.66 0.9+1.1
−0.4 0.3+0.3−0.1 214026.98-231038.8
13 21:40:26.546 0.005 −23:11:18.26 0.05 1.14 14.6+4.9−3.8 2.94+1.82
−1.47 2.81+1.83−1.45 6.0+2.8
−1.8 0.2+0.3−0.1 214026.54-231118.2
Sources outside ofrh; designated CXOU J. . .
14 21:40:17.349 0.011 −23:11:34.13 0.08 1.35 6.5+3.7−2.5 0.99+1.38
−1.22 0.43+1.50−1.41 1.1+1.2
−0.4 0.5+0.6−0.2 214017.34-231134.1
15 21:40:23.831 0.015 −23:09:20.30 0.15 1.50 5.5+3.5−2.3 1.76+1.92
−1.64 > −0.79 1.6+2.0−0.7 0.4+0.6
−0.2 214023.83-230920.3
16 QSO, 2.43 21:40:16.055 0.004−23:09:57.36 0.03 1.63 98.4+11.0−9.9 −0.20+0.24
−0.24 −0.56+0.38−0.39 8.6+2.3
−1.1 6.9+1.1−0.8 214016.05-230957.3
17 D QSO? 21:40:29.235 0.001−23:10:31.30 0.01 1.65 1850.7+44.0−43.0 0.25+0.05
−0.05 0.22+0.07−0.07 195.2+7.4
−6.6 111.2+3.4−3.2 214029.23-231031.3
18 21:40:22.946 0.017 −23:09:06.09 0.10 1.70 4.3+3.2−2.0 > −0.77 > −0.77 1.3+1.9
−0.6 0.3+0.6−0.2 214022.94-230906.0
19 21:40:20.815 0.003 −23:12:29.93 0.07 1.74 33.7+6.9−5.8 1.91+0.68
−0.63 1.04+0.55−0.53 6.4+2.7
−1.5 2.6+0.9−0.6 214020.81-231229.9
20 21:40:28.337 0.011 −23:09:29.96 0.17 1.92 13.5+4.8−3.6 1.41+1.00
−0.90 1.61+1.28−1.09 2.6+2.1
−1.0 1.0+0.7−0.3 214028.33-230929.9
21 21:40:18.345 0.005 −23:12:32.20 0.07 1.95 32.6+6.8−5.7 1.24+0.54
−0.52 0.43+0.54−0.53 4.0+1.6
−0.8 2.4+0.8−0.5 214018.34-231232.2
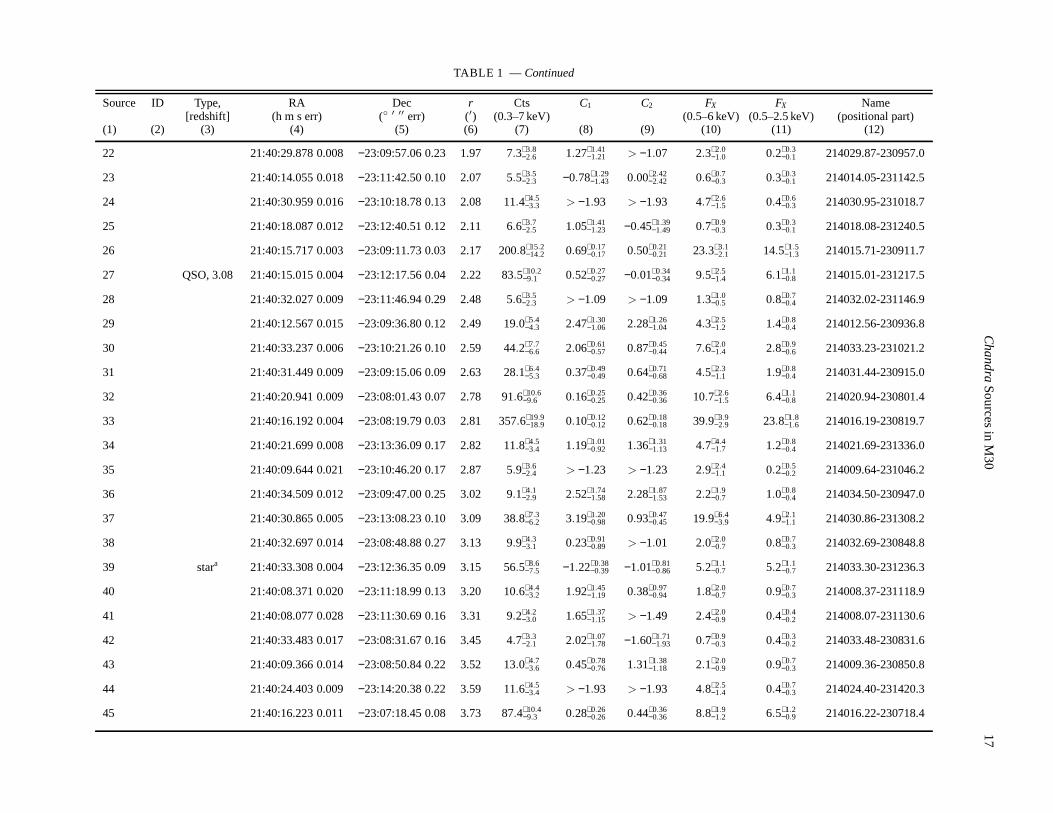
Ch
an
draS
ou
rcesin
M3
01
7TABLE 1 — Continued
Source ID Type, RA Dec r Cts C1 C2 FX FX Name[redshift] (h m s err) (◦ ′ ′′ err) (′) (0.3–7 keV) (0.5–6 keV) (0.5–2.5 keV) (positional part)
(1) (2) (3) (4) (5) (6) (7) (8) (9) (10) (11) (12)
22 21:40:29.878 0.008 −23:09:57.06 0.23 1.97 7.3+3.8−2.6 1.27+1.41
−1.21 > −1.07 2.3+2.0−1.0 0.2+0.3
−0.1 214029.87-230957.0
23 21:40:14.055 0.018 −23:11:42.50 0.10 2.07 5.5+3.5−2.3 −0.78+1.29
−1.43 0.00+2.42−2.42 0.6+0.7
−0.3 0.3+0.3−0.1 214014.05-231142.5
24 21:40:30.959 0.016 −23:10:18.78 0.13 2.08 11.4+4.5−3.3 > −1.93 > −1.93 4.7+2.6
−1.5 0.4+0.6−0.3 214030.95-231018.7
25 21:40:18.087 0.012 −23:12:40.51 0.12 2.11 6.6+3.7−2.5 1.05+1.41
−1.23 −0.45+1.39−1.49 0.7+0.9
−0.3 0.3+0.3−0.1 214018.08-231240.5
26 21:40:15.717 0.003 −23:09:11.73 0.03 2.17 200.8+15.2−14.2 0.69+0.17
−0.17 0.50+0.21−0.21 23.3+3.1
−2.1 14.5+1.5−1.3 214015.71-230911.7
27 QSO, 3.08 21:40:15.015 0.004−23:12:17.56 0.04 2.22 83.5+10.2−9.1 0.52+0.27
−0.27 −0.01+0.34−0.34 9.5+2.5
−1.4 6.1+1.1−0.8 214015.01-231217.5
28 21:40:32.027 0.009 −23:11:46.94 0.29 2.48 5.6+3.5−2.3 > −1.09 > −1.09 1.3+1.0
−0.5 0.8+0.7−0.4 214032.02-231146.9
29 21:40:12.567 0.015 −23:09:36.80 0.12 2.49 19.0+5.4−4.3 2.47+1.30
−1.06 2.28+1.26−1.04 4.3+2.5
−1.2 1.4+0.8−0.4 214012.56-230936.8
30 21:40:33.237 0.006 −23:10:21.26 0.10 2.59 44.2+7.7−6.6 2.06+0.61
−0.57 0.87+0.45−0.44 7.6+2.0
−1.4 2.8+0.9−0.6 214033.23-231021.2
31 21:40:31.449 0.009 −23:09:15.06 0.09 2.63 28.1+6.4−5.3 0.37+0.49
−0.49 0.64+0.71−0.68 4.5+2.3
−1.1 1.9+0.8−0.4 214031.44-230915.0
32 21:40:20.941 0.009 −23:08:01.43 0.07 2.78 91.6+10.6−9.6 0.16+0.25
−0.25 0.42+0.36−0.36 10.7+2.6
−1.5 6.4+1.1−0.8 214020.94-230801.4
33 21:40:16.192 0.004 −23:08:19.79 0.03 2.81 357.6+19.9−18.9 0.10+0.12
−0.12 0.62+0.18−0.18 39.9+3.9
−2.9 23.8+1.8−1.6 214016.19-230819.7
34 21:40:21.699 0.008 −23:13:36.09 0.17 2.82 11.8+4.5−3.4 1.19+1.01
−0.92 1.36+1.31−1.13 4.7+4.4
−1.7 1.2+0.8−0.4 214021.69-231336.0
35 21:40:09.644 0.021 −23:10:46.20 0.17 2.87 5.9+3.6−2.4 > −1.23 > −1.23 2.9+2.4
−1.1 0.2+0.5−0.2 214009.64-231046.2
36 21:40:34.509 0.012 −23:09:47.00 0.25 3.02 9.1+4.1−2.9 2.52+1.74
−1.58 2.28+1.87−1.53 2.2+1.9
−0.7 1.0+0.8−0.4 214034.50-230947.0
37 21:40:30.865 0.005 −23:13:08.23 0.10 3.09 38.8+7.3−6.2 3.19+1.20
−0.98 0.93+0.47−0.45 19.9+6.4
−3.9 4.9+2.1−1.1 214030.86-231308.2
38 21:40:32.697 0.014 −23:08:48.88 0.27 3.13 9.9+4.3−3.1 0.23+0.91
−0.89 > −1.01 2.0+2.0−0.7 0.8+0.7
−0.3 214032.69-230848.8
39 stara 21:40:33.308 0.004 −23:12:36.35 0.09 3.15 56.5+8.6−7.5 −1.22+0.38
−0.39 −1.01+0.81−0.86 5.2+1.1
−0.7 5.2+1.1−0.7 214033.30-231236.3
40 21:40:08.371 0.020 −23:11:18.99 0.13 3.20 10.6+4.4−3.2 1.92+1.45
−1.19 0.38+0.97−0.94 1.8+2.0
−0.7 0.9+0.7−0.3 214008.37-231118.9
41 21:40:08.077 0.028 −23:11:30.69 0.16 3.31 9.2+4.2−3.0 1.65+1.37
−1.15 > −1.49 2.4+2.0−0.9 0.4+0.4
−0.2 214008.07-231130.6
42 21:40:33.483 0.017 −23:08:31.67 0.16 3.45 4.7+3.3−2.1 2.02+1.07
−1.78 −1.60+1.71−1.93 0.7+0.9
−0.3 0.4+0.3−0.2 214033.48-230831.6
43 21:40:09.366 0.014 −23:08:50.84 0.22 3.52 13.0+4.7−3.6 0.45+0.78
−0.76 1.31+1.38−1.18 2.1+2.0
−0.9 0.9+0.7−0.3 214009.36-230850.8
44 21:40:24.403 0.009 −23:14:20.38 0.22 3.59 11.6+4.5−3.4 > −1.93 > −1.93 4.8+2.5
−1.4 0.4+0.7−0.3 214024.40-231420.3
45 21:40:16.223 0.011 −23:07:18.45 0.08 3.73 87.4+10.4−9.3 0.28+0.26
−0.26 0.44+0.36−0.36 8.8+1.9
−1.2 6.5+1.2−0.9 214016.22-230718.4

18
Lu
gg
eretal.TABLE 1 — Continued
Source ID Type, RA Dec r Cts C1 C2 FX FX Name[redshift] (h m s err) (◦ ′ ′′ err) (′) (0.3–7 keV) (0.5–6 keV) (0.5–2.5 keV) (positional part)
(1) (2) (3) (4) (5) (6) (7) (8) (9) (10) (11) (12)
46 21:40:21.436 0.018 −23:06:50.14 0.15 3.95 43.1+7.6−6.5 2.82+0.90
−0.78 1.92+0.61−0.57 9.3+3.0
−1.8 3.3+1.1−0.7 214021.43-230650.1
47 21:40:21.558 0.012 −23:14:49.49 0.15 4.04 16.5+5.1−4.0 1.29+0.84
−0.78 0.86+0.87−0.82 4.0+2.3
−1.1 1.4+0.9−0.4 214021.55-231449.4
48 21:40:20.501 0.013 −23:15:05.59 0.25 4.32 14.4+4.9−3.7 0.44+0.74
−0.72 0.22+0.98−0.96 2.2+1.3
−0.6 1.8+0.9−0.5 214020.50-231505.5
49 21:40:03.419 0.020 −23:11:34.42 0.15 4.37 28.1+6.4−5.3 0.71+0.52
−0.51 −0.38+0.62−0.63 9.2+4.1
−1.9 6.5+2.4−1.4 214003.41-231134.4
50 Ellipt., 0.27 21:40:37.036 0.012 −23:13:37.17 0.31 4.44 13.1+4.7−3.6 1.42+1.01
−0.91 0.59+0.93−0.88 3.2+2.1
−0.9 0.9+0.6−0.3 214037.03-231337.1
NOTE. — Properties of X-ray sources in M30. Energy bands for counts and fluxes are in keV. X-ray fluxes (corrected for photoelectric absorption of 1.7×1020 cm−2) are in unitsof 10−15 erg s−1 cm−2. See §§3.2,3.3 for details.
a Bright foreground star.
Related Documents