The Astrophysical Journal, 769:90 (13pp), 2013 June 1 doi:10.1088/0004-637X/769/2/90 C 2013. The American Astronomical Society. All rights reserved. Printed in the U.S.A. CHANDRA VIEW OF THE WARM-HOT INTERGALACTIC MEDIUM TOWARD 1ES 1553+113: ABSORPTION-LINE DETECTIONS AND IDENTIFICATIONS. I. F. Nicastro 1 ,2 , M. Elvis 2 , Y. Krongold 3 , S. Mathur 4 , A. Gupta 4 , C. Danforth 5 , X. Barcons 6 , S. Borgani 7 ,8 , E. Branchini 9 , R. Cen 10 , R. Dav ´ e 11 , J. Kaastra 12 , F. Paerels 13 , L. Piro 14 , J. M. Shull 5 , Y. Takei 15 , and L. Zappacosta 1 1 Osservatorio Astronomico di Roma-INAF, Via di Frascati 33, I-00040 Monte Porzio Catone, RM, Italy 2 Harvard-Smithsonian Center for Astrophysics, 60 Garden St., MS-04, Cambridge, MA 02138, USA 3 Instituto de Astronomia, Universidad Nacional Autonoma de Mexico, Mexico City Mexico 4 Ohio State University, Columbus, OH, USA 5 CASA, Department of Astrophysical and Planetary Sciences, University of Colorado, 389-UCB, Boulder, CO 80309, USA 6 Instituto de F´ ısica de Cantabria (CSIC-UC), E-39005 Santander, Spain 7 Dipartimento di Astronomia dell’Universit` a di Trieste, Via G.B. Tiepolo 11, I-34131 Trieste, Italy 8 INAF- Osservatorio Astronomico di Trieste, Via G.B. Tiepolo 11, I-34131 Trieste, Italy 9 Dipartimento di Fisica “E. Amaldi,” Universit` a degli Studi “Roma Tre,” via della Vasca Navale 84, I-00146 Roma, Italy 10 Princeton University Observatory, Princeton, NJ 08544, USA 11 Astronomy Department, University of Arizona, Tucson, AZ 85721, USA 12 SRON Netherlands Institute for Space Research, Sorbonnelaan 2, 3584 CA, Utrecht, The Netherlands 13 Columbia Astrophysics Laboratory and Department of Astronomy, Columbia University, 550 West 120th Street, New York, NY 10027, USA 14 INAF-IAPS, Via del Fosso del Cavaliere 100, I-00133 Roma, Italy 15 Institute of Space and Astronautical Science, Japan Aerospace Exploration Agency, 3-1-1 Yoshinodai, Chuo-ku, Sagamihara, Kanagawa 252-5210, Japan Received 2012 October 26; accepted 2013 March 12; published 2013 May 7 ABSTRACT We present the first results from our pilot 500 ks Chandra Low Energy Transmission Grating Large Program observation of the soft X-ray brightest source in the z 0.4 sky, the blazar 1ES 1553+113, aimed to secure the first uncontroversial detections of the missing baryons in the X-rays. We identify a total of 11 possible absorption lines, with single-line statistical significances between 2.2σ and 4.1σ . Six of these lines are detected at high single-line statistical significance (3.6 σ 4.1), while the remaining five are regarded as marginal detections in association with either other X-ray lines detected at higher significance and/or far-ultraviolet (FUV) signposts. Three of these lines are consistent with metal absorption at z 0, and we identify them with Galactic O i and C ii. The remaining eight lines may be imprinted by intervening absorbers and are all consistent with being high-ionization counterparts of FUV H i and/or O vi intergalactic medium signposts. In particular, five of these eight possible intervening absorption lines (single-line statistical significances of 4.1σ , 4.1σ , 3.9σ , 3.8σ , and 2.7σ ), are identified as C v and C vi Kα absorbers belonging to three WHIM systems at z X = 0.312, z X = 0.237, and z X = 0.133, which also produce broad H i (and O vi for the z X = 0.312 system) absorption in the FUV. For two of these systems (z X = 0.312 and 0.237), the Chandra X-ray data led the a posteriori discovery of physically consistent broad H i associations in the FUV (for the third system the opposite applies), so confirming the power of the X-ray–FUV synergy for WHIM studies. The true statistical significances of these three X-ray absorption systems, after properly accounting for the number of redshift trials, are 5.8σ (z X = 0.312; 6.3σ if the low-significance O v and C v Kβ associations are considered), 3.9σ (z X = 0.237), and 3.8σ (z X = 0.133), respectively. Key words: atomic processes – intergalactic medium – line: identification – opacity – X-rays: general Online-only material: color figures 1. INTRODUCTION According to the latest baryon census in the local (z 0.4) universe (Shull et al. 2012, and references therein), about 30%–40% of the total number of baryons predicted by big bang nucleosynthesis (e.g., Kirkman et al. 2003), inferred by density fluctuations of the cosmic microwave background (e.g., Bennett et al. 2003; Spergel et al. 2007), and seen at z ∼ 3 in the “Lyα Forest” (e.g., Rauch 1998; Weinberg et al. 1997), are missing at the present epoch. Of the low-z baryons we can account for in a recent census (Shull et al. 2012), (18 ± 4)% lie in a collapsed phase (stars, cold atomic and molecular gas in galaxies, circumgalactic medium (CGM), and hot virialized gas in groups and clusters of galaxies), (28 ± 11)% lie in the local photoionized Lyα forest, and finally, as much as (25 ± 8)%, are estimated to be found in the O vi/BLA-traced warm-hot intergalactic medium (IGM). 16 The remaining (29 ± 13)% of baryons still remains elusive, and are likely to lie in the hot phase of the WHIM, at temperatures larger than logT 5.5 K. This is predicted by nearly all hydrodynamical simulations for the formation of structures in a ΛCDM universe (e.g., Cen & Ostriker 2006; Tornatore et al. 2010; Bertone et al. 2010; Branchini et al. 2009; Smith et al. 2011). According to simulations, starting at redshift of z ∼ 2 some of the 16 This estimate is based on an average ionization and metallicity, versus column density, correction derived by hydrodynamical simulations, and therefore suffers not only the large scatter found in the given simulation between these parameters (i.e., Figure 8 in Shull et al. 2012), but also the scatter of theoretical predictions from simulation to simulation (e.g., Cen & Ostriker 2006; Tornatore et al. 2010; Bertone et al. 2010; Branchini et al. 2009; Smith et al. 2011). The resulting number of baryons still missing also depends on these uncertainties. 1 brought to you by CORE View metadata, citation and similar papers at core.ac.uk provided by Digital.CSIC

Welcome message from author
This document is posted to help you gain knowledge. Please leave a comment to let me know what you think about it! Share it to your friends and learn new things together.
Transcript
The Astrophysical Journal, 769:90 (13pp), 2013 June 1 doi:10.1088/0004-637X/769/2/90C© 2013. The American Astronomical Society. All rights reserved. Printed in the U.S.A.
CHANDRA VIEW OF THE WARM-HOT INTERGALACTIC MEDIUM TOWARD 1ES 1553+113:ABSORPTION-LINE DETECTIONS AND IDENTIFICATIONS. I.
F. Nicastro1,2, M. Elvis2, Y. Krongold3, S. Mathur4, A. Gupta4, C. Danforth5, X. Barcons6, S. Borgani7,8,E. Branchini9, R. Cen10, R. Dave11, J. Kaastra12, F. Paerels13, L. Piro14, J. M. Shull5, Y. Takei15, and L. Zappacosta1
1 Osservatorio Astronomico di Roma-INAF, Via di Frascati 33, I-00040 Monte Porzio Catone, RM, Italy2 Harvard-Smithsonian Center for Astrophysics, 60 Garden St., MS-04, Cambridge, MA 02138, USA
3 Instituto de Astronomia, Universidad Nacional Autonoma de Mexico, Mexico City Mexico4 Ohio State University, Columbus, OH, USA
5 CASA, Department of Astrophysical and Planetary Sciences, University of Colorado, 389-UCB, Boulder, CO 80309, USA6 Instituto de Fısica de Cantabria (CSIC-UC), E-39005 Santander, Spain
7 Dipartimento di Astronomia dell’Universita di Trieste, Via G.B. Tiepolo 11, I-34131 Trieste, Italy8 INAF- Osservatorio Astronomico di Trieste, Via G.B. Tiepolo 11, I-34131 Trieste, Italy
9 Dipartimento di Fisica “E. Amaldi,” Universita degli Studi “Roma Tre,” via della Vasca Navale 84, I-00146 Roma, Italy10 Princeton University Observatory, Princeton, NJ 08544, USA
11 Astronomy Department, University of Arizona, Tucson, AZ 85721, USA12 SRON Netherlands Institute for Space Research, Sorbonnelaan 2, 3584 CA, Utrecht, The Netherlands
13 Columbia Astrophysics Laboratory and Department of Astronomy, Columbia University, 550 West 120th Street, New York, NY 10027, USA14 INAF-IAPS, Via del Fosso del Cavaliere 100, I-00133 Roma, Italy
15 Institute of Space and Astronautical Science, Japan Aerospace Exploration Agency, 3-1-1 Yoshinodai, Chuo-ku, Sagamihara, Kanagawa 252-5210, JapanReceived 2012 October 26; accepted 2013 March 12; published 2013 May 7
ABSTRACT
We present the first results from our pilot 500 ks Chandra Low Energy Transmission Grating Large Programobservation of the soft X-ray brightest source in the z � 0.4 sky, the blazar 1ES 1553+113, aimed to secure the firstuncontroversial detections of the missing baryons in the X-rays. We identify a total of 11 possible absorption lines,with single-line statistical significances between 2.2σ and 4.1σ . Six of these lines are detected at high single-linestatistical significance (3.6 � σ � 4.1), while the remaining five are regarded as marginal detections in associationwith either other X-ray lines detected at higher significance and/or far-ultraviolet (FUV) signposts. Three of theselines are consistent with metal absorption at z � 0, and we identify them with Galactic O i and C ii. The remainingeight lines may be imprinted by intervening absorbers and are all consistent with being high-ionization counterpartsof FUV H i and/or O vi intergalactic medium signposts. In particular, five of these eight possible interveningabsorption lines (single-line statistical significances of 4.1σ , 4.1σ , 3.9σ , 3.8σ , and 2.7σ ), are identified as C vand C vi Kα absorbers belonging to three WHIM systems at zX = 0.312, zX = 0.237, and 〈zX〉 = 0.133, whichalso produce broad H i (and O vi for the zX = 0.312 system) absorption in the FUV. For two of these systems(zX = 0.312 and 0.237), the Chandra X-ray data led the a posteriori discovery of physically consistent broad H iassociations in the FUV (for the third system the opposite applies), so confirming the power of the X-ray–FUVsynergy for WHIM studies. The true statistical significances of these three X-ray absorption systems, after properlyaccounting for the number of redshift trials, are 5.8σ (zX = 0.312; 6.3σ if the low-significance O v and C v Kβassociations are considered), 3.9σ (zX = 0.237), and 3.8σ (〈zX〉 = 0.133), respectively.
Key words: atomic processes – intergalactic medium – line: identification – opacity – X-rays: general
Online-only material: color figures
1. INTRODUCTION
According to the latest baryon census in the local (z � 0.4)universe (Shull et al. 2012, and references therein), about30%–40% of the total number of baryons predicted by big bangnucleosynthesis (e.g., Kirkman et al. 2003), inferred by densityfluctuations of the cosmic microwave background (e.g., Bennettet al. 2003; Spergel et al. 2007), and seen at z ∼ 3 in the “LyαForest” (e.g., Rauch 1998; Weinberg et al. 1997), are missing atthe present epoch.
Of the low-z baryons we can account for in a recent census(Shull et al. 2012), (18 ± 4)% lie in a collapsed phase (stars,cold atomic and molecular gas in galaxies, circumgalacticmedium (CGM), and hot virialized gas in groups and clusters ofgalaxies), (28 ± 11)% lie in the local photoionized Lyα forest,and finally, as much as (25 ± 8)%, are estimated to be found in
the O vi/BLA-traced warm-hot intergalactic medium (IGM).16
The remaining (29 ± 13)% of baryons still remains elusive, andare likely to lie in the hot phase of the WHIM, at temperatureslarger than logT � 5.5 K.
This is predicted by nearly all hydrodynamical simulationsfor the formation of structures in a ΛCDM universe (e.g.,Cen & Ostriker 2006; Tornatore et al. 2010; Bertone et al.2010; Branchini et al. 2009; Smith et al. 2011). Accordingto simulations, starting at redshift of z ∼ 2 some of the
16 This estimate is based on an average ionization and metallicity, versuscolumn density, correction derived by hydrodynamical simulations, andtherefore suffers not only the large scatter found in the given simulationbetween these parameters (i.e., Figure 8 in Shull et al. 2012), but also thescatter of theoretical predictions from simulation to simulation (e.g., Cen &Ostriker 2006; Tornatore et al. 2010; Bertone et al. 2010; Branchini et al. 2009;Smith et al. 2011). The resulting number of baryons still missing also dependson these uncertainties.
1
brought to you by COREView metadata, citation and similar papers at core.ac.uk
provided by Digital.CSIC

The Astrophysical Journal, 769:90 (13pp), 2013 June 1 Nicastro et al.
IGM was shock-heated to temperatures of 105–107 K duringthe continued process of collapse and structure formation, andenriched up to ZWHIM = 0.1–1 Z� by galaxy super-winds (e.g.,Cen & Ostriker 2006) already at redshifts of ∼0.5, remainingessentially unchanged from then to z � 0. The first piecesof observational evidence of this violent process of structureformation are starting to be gathered in the densest nodes ofthis filamentary IGM, at and inside the virial radius of massiveclusters of galaxies (e.g., Keshet et al. 2012). However, diffuseWHIM filaments are too tenuous to be detected through theirbremsstrahlung and line emission with current far-ultraviolet(FUV) or X-ray instruments (e.g., Yoshikawa et al. 2003).Absorption is more promising.
The lowest temperature tail of the WHIM distribution, fromT ∼ 105 up to ∼105.5 K (where the fraction of O vi peaks),has been most likely detected in the FUV, with FUSE andthe STIS spectrometer on board the Hubble Space Telescope(HST), in O vi and narrow Lyα absorbers, though the fractionof this gas that actually belongs to the shock-heated WHIM ishighly uncertain (e.g., Danforth & Shull 2008). More recently,the advent of the larger throughput Cosmic Origins Spectro-graph (COS) of HST has enabled the detection of somewhathotter (T ∼ 105–105.7) and possibly truly shock-heated WHIM,through the detectability of the strongest (i.e., large columndensity) broad Lyα absorbers (BLAs) with thermal Doppler pa-rameter bth = √
2kT /mp � 40–90 km s−1 (Danforth et al.2010b).17 These BLAs are in principle good tracers of the warm(T ∼ 105–105.7 K) portion of the WHIM, where a significantfraction of the WHIM (∼30%–40%; e.g., Cen & Ostriker 2006)is supposed to reside. However, observing bth � 40–90 km s−1
BLAs requires data of excellent quality and accurate contin-uum definition to detect the low-contrast features. In addition,measuring H i without an ionization correction18 will alwaysunderestimate the actual baryon fraction in the fraction of hotIGM sampled by these tracers. Given the temperature of thisgas, such an ionization correction can only come from theX-ray detection of the highly ionized counterparts to such BLAs.Finally, the T � 105.7 K portion of the WHIM (the vast majorityof the WHIM mass) can only be detected through highly ionizedmetals in the X-rays.
However, detecting the metal tracers of the bulk of the “miss-ing baryons” in the “X-ray Forest,” has proven to be extremelydifficult. This is because of the unfortunate combination of(1) the still limited resolving power (R ∼ 400 at the location ofthe O vii Kα transition, at λ = 21.6 Å) and the low throughput(AEff ∼ 15–70 cm2) of the current high-resolution X-ray spec-trometers (the XMM-Newton Reflection Grating Spectrometer(RGS; den Herder et al. 2001) and the Chandra Low EnergyTransmission Grating (LETG; Brinkman et al. 2000)), (2) thelack of bright (f0.5–2 keV � 10−11 erg s−1 cm−2) extragalacticpoint-like targets at sufficiently high redshifts, and (3) the dra-matic steepening in slope (Δα � 1.5) of the predicted numberdensity of metal He-like WHIM filaments per unit redshift at ioncolumn densities �1015 cm−2 (e.g., Cen & Fang 2006). Currentevidence is still limited, and highly controversial.
17 The thermal Doppler parameter, is typically narrower than the measuredDoppler parameter b, which includes a combination of internal turbulence andHubble-flow broadening. Danforth et al. (2010b) estimate an averagecorrection factor (b/bth) � 1.2.18 The measured H i Doppler parameter gives only an upper limit on the gastemperature, and in addition, the proper ionization correction depends also onthe gas density because of the second-order contribution of photoionization,and this can only be estimated through multi-ion metal measurements, e.g.,Nicastro et al. (2002).
The statistically strongest evidence to date comes from theevidence for large amounts of baryonic matter in two interveningWHIM filaments along the line of sight to the nearby (z = 0.03)blazar Mkn 421 (Nicastro et al. 2005a, 2005b). However, theseresults are controversial (Kaastra et al. 2006; Rasmussen et al.2007; Danforth et al. 2011; Yao et al. 2012; but see also Williamset al. 2006, 2010; Nicastro et al. 2008).
Over the last few years there have been new discoveriesreported (Buote et al. 2009: B09; Fang et al. 2010: F10; Nicastroet al. 2010; Zappacosta et al. 2010, 2012). However, suchtentative discoveries are either serendipitous (and so biasedtoward the strongest systems; Nicastro et al. 2010; Zappacostaet al. 2012), or trace extreme galaxy overdensity regions(Zappacosta et al. 2010) or even just galaxy halos (Buote et al.2009; Zappacosta et al. 2010; Williams et al. 2012). In all cases,these sample only the hottest and densest IGM or CGM, whichis not representative of the majority of the WHIM.
Thus a firm, high-significance detection of the bulk of themissing baryon mass has not been secured yet. To do so, theonly pursuable observational strategy, with current instrumen-tation, is to first identify “true” gaseous signposts (e.g., Mathuret al. 2003) of the T ∼ 105.3–105.7 WHIM (i.e., BLAs), andthen search for their metal counterparts in the soft X-rays,along optimally selected sightlines. Over the past two yearswe selected 1ES 1553+113 as “the best WHIM target in theuniverse” (because of its extreme soft X-ray brightness, rela-tively high redshift, and the presence of BLA signposts in itsHST-COS spectrum—Danforth et al. 2010a), and started theX-ray campaign with a pilot 500 ks Chandra cycle 12 observa-tion of 1ES 1553+113. In our observing proposal, we conserva-tively tuned the exposure of this first pilot observation to test thereliability of the strongest FUV systems as gaseous signposts forX-ray WHIM filaments. The results are well beyond the mostoptimistic expectations and confirm the effectiveness of such anobservational strategy. In this article, we report on these resultsfrom the pilot Chandra-LETG spectrum.
The paper is organized as follows. In Section 2, we describethe target of our LETG observation, and summarize the rele-vant results from the HST-COS observations reported by Dan-forth et al. (2010a). Section 3 describes the Chandra-LETGdata reduction and analysis, while in Section 4, we discuss ourfindings and present possible absorption system identifications.Finally in Section 5, we summarize our conclusions. In a forth-coming article (“Paper II”), we will present a self-consistentmodeling of the spectral features detected in the LETG spec-trum of 1ES 1553+113 by making use of our WHIM hybridcollisional-ionization plus photoionization models, and so de-riving preliminary estimates of metallicities of these systems,the ionization-corrected baryon cosmological mass density ofthe WHIM at T ∼ 105.5 K, and the number density of C vand O vii WHIM absorbers as a function of the ion columndensity.
2. 1ES 1553+113 AND THE WHIM SIGNPOSTS ALONGITS LINE OF SIGHT
Four years ago, we selected 1ES 1553+113 as the optimal tar-get for FUV and X-ray WHIM studies, because of its relativelyhigh estimated redshift prior to spectroscopic determinations(z � 0.25, from the non-detection of the host galaxy in a deepHST R image; Treves et al. 2007), its high Galactic latitude(b � 44◦), and its extreme average 0.1–2.4 keV brightness of2 mCrab (4 × 10⁻¹¹ erg s−1 cm−2), coupled with a bright andstable FUV flux of νfν(1600 Å) � 3 × 10⁻¹¹ erg s−1 cm−2.
2
The Astrophysical Journal, 769:90 (13pp), 2013 June 1 Nicastro et al.
1ES 1553+113 was first observed with the HST-COS on 2009September 22, for three orbits (one orbit with the G130M andtwo with the G160M grating; Danforth et al. 2010a). Almost2 yr later, on 2011 July 24, the target was re-observed for twoadditional orbits with the G130 M and four additional orbitswith the G160M. The first COS spectrum of 1ES 1553+113was published in 2010 by Danforth and collaborators. Here,we summarize the main findings from this 2009 observation,relevant to this work.
The published HST-COS spectrum of 1ES 1553+113 secureda robust lower limit on the spectroscopic redshift of 1ES1553+113. Narrow H i Lyα (NLA) and O vi absorption isobserved at a combined 19.3σ significance at z = 0.395(Figure 2 of Danforth et al. 2010a), establishing a spectroscopiclower limit on the redshift of 1ES 1553+113 of z � 0.4 (almosttwice the non-spectroscopic value upon which we based ouroriginal selection) and making this target by far the brightest,non-transient, X-ray source in the z � 0.4 sky. Moreover,Danforth et al. (2010a) report on the presence of five possibleBLAs, at z = 0.04281, 0.10230, 0.12325, 0.13334, and 0.15234,plus a rare and complex triple-H i-metal absorption system atz = 0.1864–0.1899, spanning a range of 1200 km s−1 invelocity (Figure 2 and Table 1 in Danforth et al. 2010a). Inour work, we use these systems as initial gaseous signposts forour X-ray search of either WHIM filaments (BLA counterparts),or highly ionized galaxy outflows and hot CGM from nearbygalaxies (counterparts to the triple-H i-metal system). However,since the 2011 COS observation almost doubled the signal-to-noise ratio (S/N) of the first published spectrum of 1ES1553+113, we also retrieved and reduced the total final COSspectrum of 1ES 1553+113, and present here a re-analysis of itwhenever the higher S/N data detect FUV lines associated to theproposed X-ray identifications and that had eluded detections inthe published spectrum because of its lower S/N.
3. THE CHANDRA-LETG SPECTRUM OF 1ES 1553+113
Chandra observed 1ES 1553+113 between 2011 May andJune, for 500 ks, with the LETG spectrometer (constant resolu-tion Δλ = 50 mÅ, i.e., resolving power R = 400 at λ = 20 Å)dispersed across the High Resolution Camera for Spectroscopy(HRC-S; Murray & Chappell 1996) plates. The observation con-sisted of three visits with exposures of 166.3 ks (2011 May 4–6),175.4 ks (2011 May 6–9), and 153.9 ks (2011 June 18–20).
3.1. Data Reduction
The data were reduced with the latest version of the ChandraInteractive Analysis of Observation software (CIAO v. 4.4.1,CALDB v. 4.5.2), following the standard processing proceduresoutlined in the HRC-S-LETG grating analysis thread.19
The Chandra HRC-S detector has virtually no spectral res-olution, which prevents the separation of the different spectralorders dispersed by the LETG. For each observation, we there-fore extracted all-order negative and positive sources and back-ground spectra with the CIAO tool tg_extract. This produced atotal of six LETG spectra, three (one per LETG visit) negative-order and three positive-order source and background spectra,extracted at a binning pace of Δλ = 12.5 mÅ, i.e., oversamplingthe LETG FWHM resolution of 50 mÅ by a factor of four.
Due to the impossibility of separating HRC-LETG spectralorders, the spectral modeling of these spectra must be performed
19 http://cxc.harvard.edu/ciao/guides/gspec_hrcsletg.html
by folding the fitting models with the sum of the convolutionproducts of the redistribution matrices (RMFs) and ancillaryresponse files (ARFs) belonging to the first N positive andnegative orders, respectively. For our LETG observations of1ES 1553+113, we conservatively decided to build our finalall-order response matrix by adding up positive and negativeorders up to N = 10. For each order, we used the CIAO toolsmkgarf and mkgrmf to build 20 effective area and photon-redistribution matrices, which were then read together withthe data into the CIAO fitting-package Sherpa, through thecommands load_multi_arfs and load_multi_rmfs.
To maximize the S/N of our spectra (we note that theHRC-S-LETG combination has an effective area of onlyAEff � 15 cm2 at both λ = 22 and 44 Å), we first co-added the three negative- and three positive-order spectra(source and background) from the three observations (CIAOtool add_grating_spectra), to produce two LETG spectra (onenegative- and one positive-order spectrum), with net exposuresof 495.6 ks each. Effective area matrices of the three observa-tions, for each of the ten negative and ten positive orders, wereaveraged together, producing 20 averaged effective area matri-ces (ARFs). Finally, we used the CIAO tool add_grating_ordersto co-add the two negative- and positive-order source and back-ground spectra and ARFs, to end up with a single LETGspectrum, containing all counts from the ten negative-orderand the ten positive-order spectra of the three Chandra ob-servations of 1ES 1553+113. The final co-added spectrum hasroughly 250–300 net (i.e., background subtracted) counts perΔλ = 50 mÅ, resolution element, over the two interesting spec-tral bands covering the z < 0.4 O vii Kα (λ = 21.6–30 Å)and C v Kα (λ = 40.2–56 Å) ranges at redshifts where WHIMabsorption might be found, for a signal-to-noise ratio per reso-lution element (S/N) � 16.
Because of our co-adding procedure, particular care must betaken to account for the wavelength calibration inaccuracy. TheChandra LETG-HRC-S spectrometer suffers a variable intrinsicwavelength uncertainty owing to the nonlinearity in the effectivedispersion relation. This nonlinearity is due to a spatial imagingnonlinearity of the HRC-S detector caused by the combinationof (1) partial charge loss in the 3-tap readout algorithm ofeach of the three HRC-S microchannel plates, each of whichis divided into 190 taps along the dispersion direction; and (2) ahardware problem that corrupts the data from the position tapsunder a specific set of conditions. The net result is that photonevent positions obtained from processing HRC-S telemetry canbe offset from their true values.20 The wavelength errors thusdepend on the physical location of dispersed photon events onthe HRC-S, and so on both precise nominal pointing directionand the deliberate Lissajous figure “dither” about this point.21
An updated version of the degap polynomial coefficients basedon empirical wavelength corrections from multiple HRC-S/LETG observations of Capella has been released since CALDB3.2.15. This update allows the correction of the nonlinearitiesin the HRC-S dispersion relation improving the 90% statisticalsignificance uncertainties across the detector (i.e., 1.6σ ) from22 mÅ to 16 mÅ. Since we have co-added three differentobservations, and then the resulting positive and negative orders,we should consider a larger uncertainty. By propagating fourtimes, in quadrature, the quoted deviations, we obtain 90%uncertainties of 32 mÅ. However, since the updated wavelength
20 See http://cxc.harvard.edu/cal/Letg/Hrc_disp/degap.html.21 See, e.g., http://cxc.harvard.edu/cal/Letg/Corrlam/.
3
The Astrophysical Journal, 769:90 (13pp), 2013 June 1 Nicastro et al.
corrections have been applied to the rest-frame position ofthe strongest soft X-ray metal electronic transitions and theinterpolation of the correction may not be strictly valid to theposition of blueshifted and redshifted lines, we conservativelyadopt a 90% wavelength uncertainty 40 mÅ, 80% of the LETGline-spread function (LSF) FWHM.
In the following, we report all uncertainties at the 1σ(68%) statistical significance level, with the exception ofX-ray wavelength and redshifts, for which we use 90% sta-tistical confidences (i.e., 1.6σ ).
3.2. Data Analysis
We used the fitting package Sherpa, in CIAO, to fit ourChandra-LETG spectrum of 1ES 1553+113. We ignored dataoutside the 10–60 Å spectral interval, where S/N was either toolow (λ > 60 Å and λ < 5 Å) and/or the spectral resolving powertoo low (at λ < 10 Å, R < 200, implying Δv > 1500 km s−1).
We first fitted the spectrum with a model consisting of a singlepower law absorbed by neutral gas. This yielded a best-fittingpower-law energy spectral index and cold-absorber columndensity of Γ = 2.66 ± 0.01 and NH = (3.71 ± 0.05)×1020 cm−2
(fully consistent with the Galactic value along the line of sightto 1ES 1553+113: NGal
H = 3.65 × 1020 cm−2; Kalberla et al.2005). The integrated reduced χ2 was acceptable, χ2
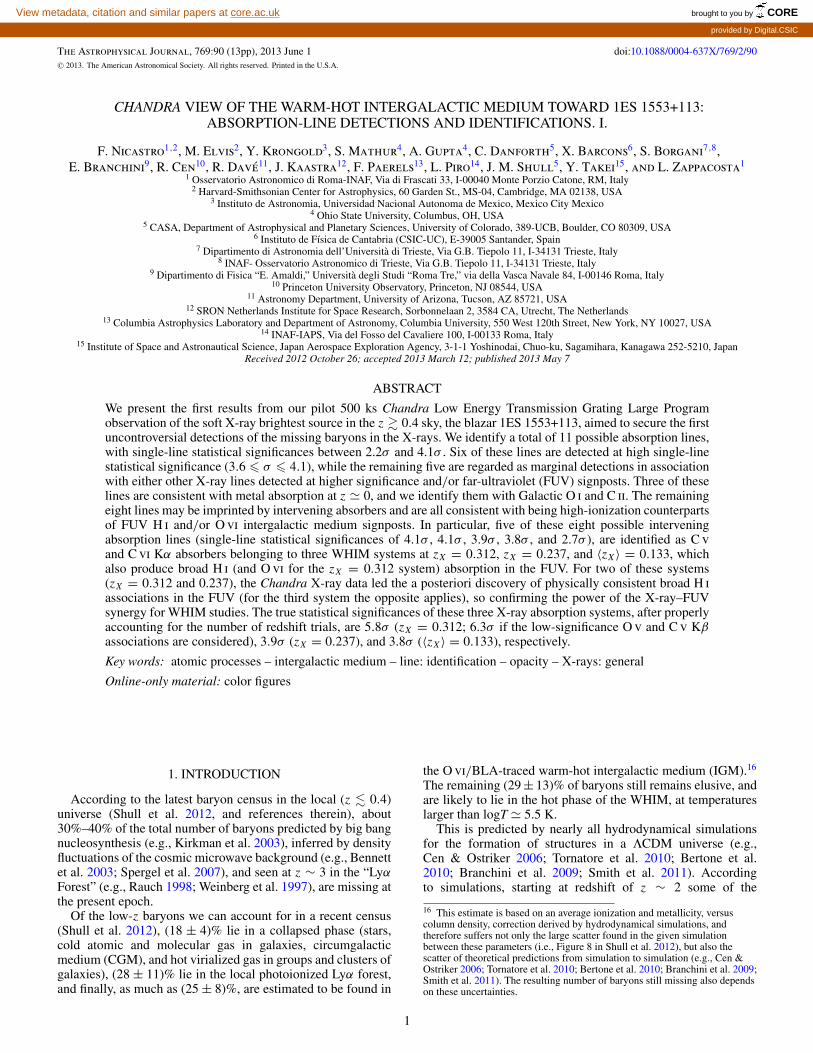
r (dof) =0.90(3995). However, a visual inspection of the residualsshowed both broad deviations around the K instrumental edgesof O i (λ = 23.3 Å) and C i (λ = 43.6 Å), the M edges of I and Cs(λ � 11.5–12.4 Å), and the HRC-S plate gaps (λ � 48–58 Å),as well as narrow deficit of counts at specific wavelengths.Figure 1 (top panel) shows these residuals smoothed througha convolution with the LETG LSF, in re-normalized (aftersmoothing) standard deviations.
At first, we excluded the possible absorption lines (whichdo not affect the continuum fitting over the integrated 10–60 Åband) and focused on curing the residual calibration uncertain-ties around the positions of the instrumental I, Cs, O, and Cedges and the HRC-S plate gaps, with the aim of reaching anoptimal model of the continuum that would allow us to prop-erly assess the statistical significance of true physical spectralfeatures possibly present in the spectrum. We then added to thecontinuum model (1) an edge with negative optical depth, tocure the sharp edge-like emission feature present in the residu-als at λ � 43.8 Å and due to either an overestimated modelingof the C i instrumental edge in the LETG effective area, or a non-accurate modeling of the C i absorption edge in the wabs modelof XSPEC, or both (best-fit τ = −0.04); (2) three broad emis-sion Gaussians at λ = 41.61 Å, λ = 50.10 Å, and λ = 56.39 Å(best-fitting σ = 0.8 Å for the first two and σ = 0.2 Å for thethird) to model residuals broad wiggles at the wavelength of theC i edge, and the dithering-shaped HRC-S plate gaps22; (3) fivenotch XSPEC component models: four negative (at λ = 11.48,43.99, 48.34, and 52.14 Å, with total widths of 0.6, 0.4, 0.2,and 1.1 A, respectively), to model residual narrower (but stillwell resolved) deviations at the I and Cs M edges and the C Kedge and plate-gap wavelengths (Figure 1, top panel), and onepositive with central λ = 20.14 Å and total width of 5.5 Å, to
22 During every pointing the Chandra satellite dithers around the aim-pointsky coordinates producing a Lissajous figure in detector coordinates. Thisimplies that plate gaps are not blind to photons at all times during theobservation, and their dispersion position (for dispersed spectra) can bereconstructed a posteriori by applying the aspect solution. However, the exactshape of the effective area at the plate-gap wavelengths depends on theaccuracy of the aspect reconstruction and the zeroth-order centroid.
10 20 30 40 50 60
-4
-2
0
2
4
10 20 30 40 50 60
-4
-2
0
2
4
Figure 1. LSF-smoothed residuals (in re-normalized, after smoothing, standarddeviations) of the 10–60 Å 500 ks LETG spectrum of 1ES 1553+113, to (a) amodel consisting of a power law absorbed by a neutral absorber (top panel),and (b) the same continuum model with the addition of seven components (anedge with negative optical depth, two broad Gaussians, three negative, and onepositive notches, to cure the residual systematic calibration uncertainties visiblein the top panel and due to the instrumental O i and C i edges and the dithering-shaped HRC-S-LETG effective area at the wavelengths of the HRC-S plate gaps(bottom panel). In the bottom panel, the positions of the 12 possible absorptionlines are marked with color-coded segments (Section 4) and labeled with theirsingle-line statistical significances.
(A color version of this figure is available in the online journal.)
model a systematic excess over the 18–23 Å spectral region, justleftward of the instrumental O K edge.
We re-fitted the data, and obtained an improvement ofΔχ2 = 107, for 20 additional degrees of freedom, withalmost unchanged best-fitting parameters: Γ = 2.62 ± 0.01 andNH = (3.60±0.05)×1020 cm−2. We measure a (0.1–2) keV fluxof F0.1–2 = (2.45 ± 0.03) × 10−11 erg s−1 cm−2 (1.2 mCrab).The LSF-smoothed residuals now appear flat over the entire10–60 Å band (Figure 1, bottom panel).
3.2.1. Unresolved Absorption Lines: Detectabilityof Carbon versus Oxygen
A visual inspection of the LSF-smoothed residuals inFigure 1 (bottom panel) shows clear narrow (i.e., unresolved:Δλ � 0.05 Å) deficit of counts involving 3–6 consecutive bins,especially in the spectral region where redshifted C absorptionis expected. This is expected: indeed, the sensitivity of dis-persed spectrometers with constant Δλ and S/N per resolutionelement, over a given bandpass, to a given ion column density,increases with wavelengths. This is because of the concurrenceof two independent facts. First, the absorption-line equivalentwidth (EW) sensitivity of a dispersed spectrum with given con-stant Δλ and S/N, down to a statistical significance Nσ , can bewritten as follows:
EWthresh = Nσ [Δλ/(S/N)]. (1)
Second, the absorption-line EW is related to the column densityof the ion imprinting the line in the spectrum through the
4

The Astrophysical Journal, 769:90 (13pp), 2013 June 1 Nicastro et al.
rest-frame position of the line and the redshift of the absorber.For unsaturated lines, we can write
EW(Xi) � 8.9 × 10⁻²¹ × NXi ξXi λ2rf (1 + z), (2)
with EW in Å and where NXi is the column density of the ioni of the element X in cm−2, ξXi is the oscillator strength of thegiven transition of the ion Xi, λrf is the rest-frame wavelength(in Å) of the given transition of the ion Xi, and z is the redshiftof the absorber. Therefore, from Equations (1) and (2):
NThreshXi � 1.1 × 10²⁰ × Nσξ−1
Xi λ−2rf (1 + z)−1Δλ(S/N)−1. (3)
Let us now consider, the LETG spectrometer and, for example,the strongest Kα transitions of the two stable and most abundantions of carbon and oxygen at T � 106 K, i.e., C v and O vii. Therest-frame wavelengths of these two transitions are in a 1:2 ratio,and fall in regions of the spectrometer with similar effectivearea (i.e., similar S/N in the same spectrum). Therefore, fromEquation (3), one gets
[NThresh
C v /NThreshO vii
] � [λ(C v Kα)/λ(O vii Kα)]−2 � 1/4.
For a broad range of WHIM temperatures, log T � 5.5–6, thefraction of C v and O vii are similar and between 0.7 and 1. At5 < log T < 5.5, C v largely dominates over O vii. Moreover, ingas with solar-like composition, oxygen is roughly twice moreabundant than carbon. So, for 5 < log T < 6, the minimumdetectable C v column density is at least twice smaller than theminimum detectable O vii column density.
3.2.2. Automated Identification of Absorption-line Candidates
To identify candidate unresolved absorption lines we wrotea routine that scans the LSF-smoothed residuals (Figure 1,bottom panel) over Δλ = 125 mÅ wide contiguous bins (2.5LETG resolution elements), to search for negative deficitsof counts involving between 3 and 7 consecutive bins (i.e.,0.75–1.75 LETG LSF FWHM at our oversampled resolution),and line shaped, i.e., symmetrically distributed around a centralnegative peak (at least one left and one right bin with valueshigher than the peak). We do not consider resolved lines here(i.e., consecutive deficits of counts spreading over more than�7 bins), since we assume that any ISM or IGM absorptionlines must have intrinsic FWHM 800 km s−1. By definition,LSF-smoothing of the residuals tends to smooth flickering inadjacent sub-resolution bins. Thus, on the one hand it high-lights real absorption (or emission) lines, but on the other handit also increases the number of false absorption (or emission)line-like features with typical LSF width (see, e.g., Figure 1,bottom panel). We can estimate the expected number of LSF-shaped emission or absorption features exceeding a bin-by-binintegrated (in quadrature) significance of 3σ , by using a sim-ple Gaussian argument. At our 4× LSF oversampled binning,we have a total of (60–10)/0.0125 = 4000 bins. Therefore,the Gaussian-predicted number of positive or negative LSF-shaped fluctuations at �3σ is (1–0.997)×4000 = 12. So, onaverage, we expect a total of six emission and six absorptionLSF-shaped fluctuations. Indeed, the blind run of the scanningroutine over the 10–60 Å LSF-smoothed residuals (oversampledat a resolution of 0.25× the LETG LSF FWHM) finds exactlysix LSF-shaped emission features exceeding the bin-by-bin in-tegrated (in quadrature) statistical significance of 3σ , accordingto expectations given the blazar nature of the target and the con-sequent absence of intrinsic emission in the optical or infrared
spectra of 1ES 1553+113. On the contrary, 50 of such featuresare found in absorption, clearly suggesting that real absorptionlines are imprinted on the 10–60 Å LETG continuum spectrumof 1ES 1553+113. Given the way the scanning routine works,moving on contiguous 2.5 LETG-LSF wide bins, some of the 50absorption-line candidates found by the routine are simply thesame strong feature, detected twice over adjacent scanned bins.This leaves about 40 absorption-line candidates, still many morethan predicted by Gaussian statistics and found in emission.
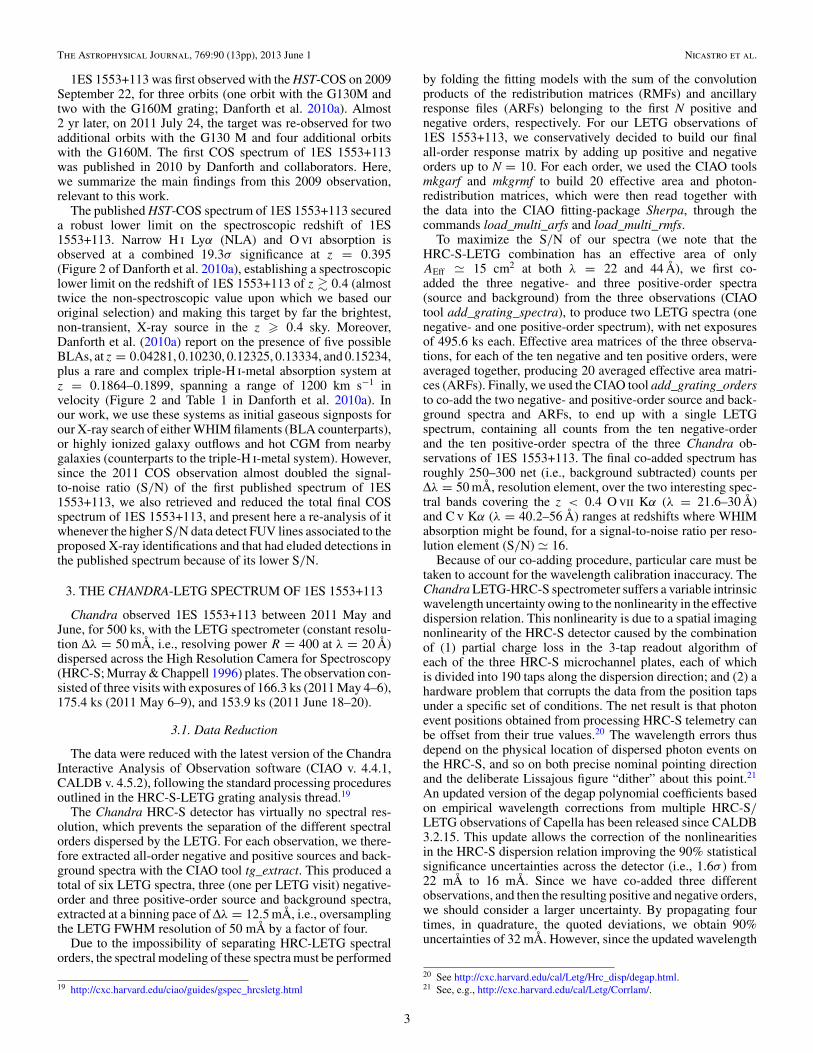
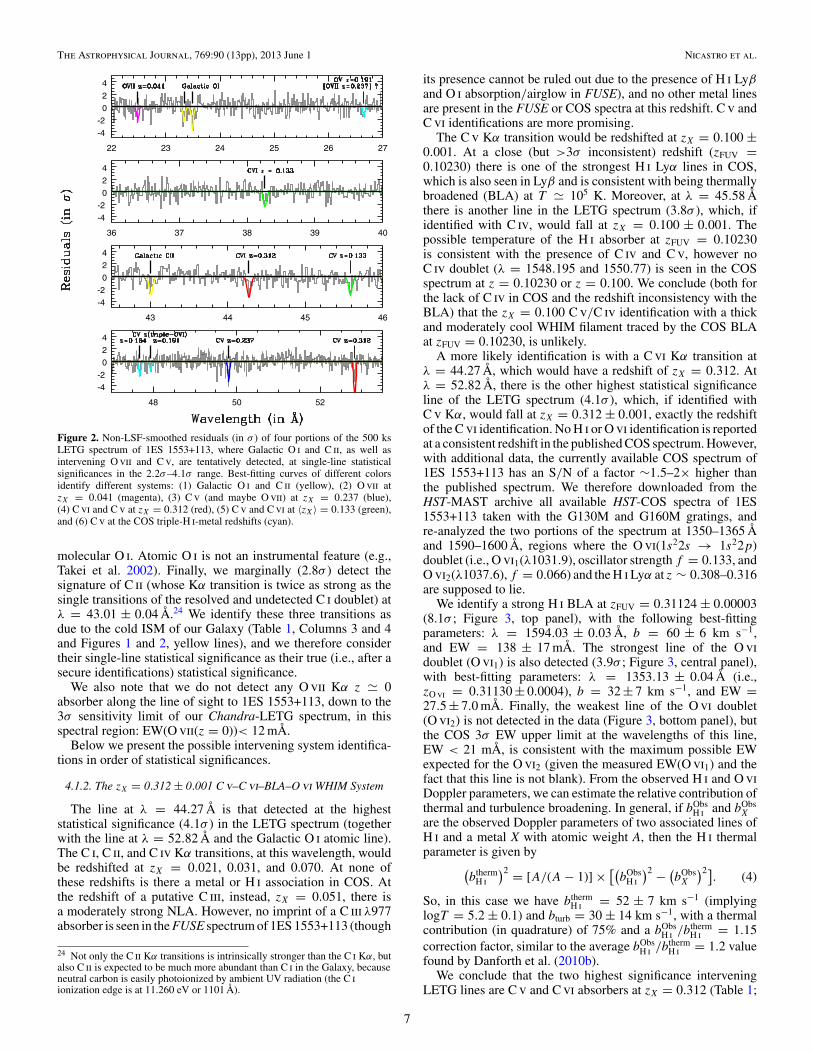
To confirm the real absorption-line nature of these candidates(at least down to the sensitivity of the current LETG spectrum),we therefore used unresolved (line FWHM frozen at 5 mÅ)absorption Gaussians to model the non-smoothed data. Weadded these Gaussians one by one and refitted the data, byallowing the line position to vary within 0.5 Å around the scan-routine determined position of the centroid. This procedureyielded the results summarized in Table 1 (Columns 1 and 2).Only 12 of the possible ∼40 absorption candidates were actuallyconfirmed by the fitting procedure at >90% (1.6σ ) statisticalsignificance. The single-line (prior to secure identification)statistical significances of 11 of these lines (computed as theratio between the best-fitting line normalization and its 1σuncertainty) are in the range (2.2–4.1)σ : three lines at >4σ ,three at 3.6 � σ < 4, and five at 2.2 � σ � 2.8. (Table 1,Column 2 and Figure 1, bottom panel). An additional line-likefeature is only hinted by the data and can be fitted with a negativeGaussian with single-line statistical significance of 1.7σ . In thefollowing, we consider the six lines with prior-to-identificationstatistical significance �3.6σ (0.04 and 0.08 expected by chanceup to z = 0.4 in the oxygen and carbon bands, respectively;see Section 4.2) as real absorption lines, which need to beidentified. The remaining six absorption features are consideredas tentative detections that need confirmation, and we considerthem here only in association with either higher significanceLETG absorbers or COS signposts, or both. In Figure 2, we showthe best-fitting models of the 12 absorption lines superposed onthe non-LSF-smoothed residuals (in standard deviations) of thedata to the best-fitting continuum model. Best-fitting Gaussiansmodels are color-grouped into six different systems, accordingto their possible identifications (Section 4.1).
4. DISCUSSION
The LETG spectrum of 1ES 1553+113 reveals the presenceof unresolved line-like absorption in both the z < 0.4 oxygenKα and carbon Kα regions. These absorption lines could bethe imprints of either Galactic ISM and/or CGM, or of warm-hot intervening IGM, or both. To identify these systems, weconsider all the strongest ground-state metal transitions (Kα)from all ions of the two most abundant elements in gas withsolar-like composition (O and C). We try to match the possibleidentifications, with the available redshift priors: (1) z = 0,rest-frame absorption by the ISM of our Galaxy, or CGM (theLETG resolution does not allow us to kinematically distinguishbetween the two; e.g., Gupta et al. 2012, and references therein);and (2) the redshifts of the possible BLAs (or NLAs) and/orO vi absorbers identified in the COS spectrum of 1ES 1553+113(Danforth et al. 2010a).
4.1. Absorption System Identifications
The longest wavelength H i Lyα securely identified in theCOS spectrum of 1ES 1553+113, is at λ � 1695 Å andz = 0.395. At longer wavelengths, and up to the COS G160M
5
The Astrophysical Journal, 769:90 (13pp), 2013 June 1 Nicastro et al.
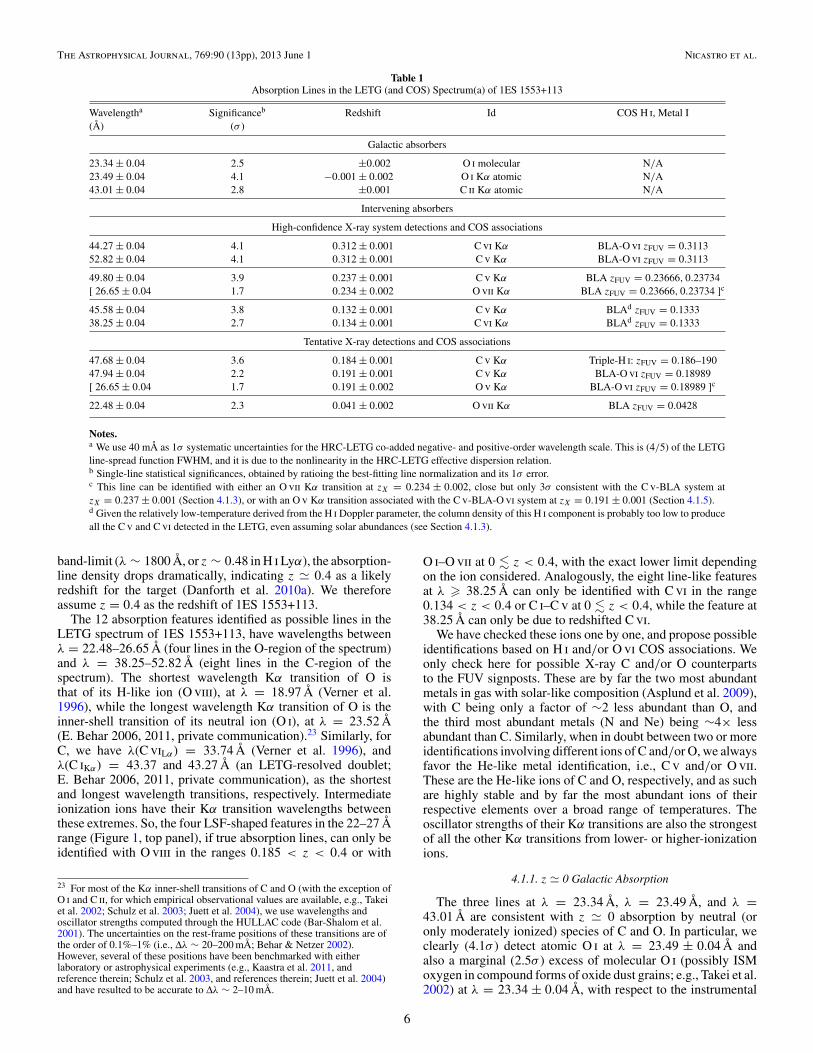
Table 1Absorption Lines in the LETG (and COS) Spectrum(a) of 1ES 1553+113
Wavelengtha Significanceb Redshift Id COS H i, Metal I(Å) (σ )
Galactic absorbers
23.34 ± 0.04 2.5 ±0.002 O i molecular N/A23.49 ± 0.04 4.1 −0.001 ± 0.002 O i Kα atomic N/A43.01 ± 0.04 2.8 ±0.001 C ii Kα atomic N/A
Intervening absorbers
High-confidence X-ray system detections and COS associations
44.27 ± 0.04 4.1 0.312 ± 0.001 C vi Kα BLA-O vi zFUV = 0.311352.82 ± 0.04 4.1 0.312 ± 0.001 C v Kα BLA-O vi zFUV = 0.3113
49.80 ± 0.04 3.9 0.237 ± 0.001 C v Kα BLA zFUV = 0.23666, 0.23734[ 26.65 ± 0.04 1.7 0.234 ± 0.002 O vii Kα BLA zFUV = 0.23666, 0.23734 ]c
45.58 ± 0.04 3.8 0.132 ± 0.001 C v Kα BLAd zFUV = 0.133338.25 ± 0.04 2.7 0.134 ± 0.001 C vi Kα BLAd zFUV = 0.1333
Tentative X-ray detections and COS associations
47.68 ± 0.04 3.6 0.184 ± 0.001 C v Kα Triple-H i: zFUV = 0.186–19047.94 ± 0.04 2.2 0.191 ± 0.001 C v Kα BLA-O vi zFUV = 0.18989[ 26.65 ± 0.04 1.7 0.191 ± 0.002 O v Kα BLA-O vi zFUV = 0.18989 ]c
22.48 ± 0.04 2.3 0.041 ± 0.002 O vii Kα BLA zFUV = 0.0428
Notes.a We use 40 mÅ as 1σ systematic uncertainties for the HRC-LETG co-added negative- and positive-order wavelength scale. This is (4/5) of the LETGline-spread function FWHM, and it is due to the nonlinearity in the HRC-LETG effective dispersion relation.b Single-line statistical significances, obtained by ratioing the best-fitting line normalization and its 1σ error.c This line can be identified with either an O vii Kα transition at zX = 0.234 ± 0.002, close but only 3σ consistent with the C v-BLA system atzX = 0.237 ± 0.001 (Section 4.1.3), or with an O v Kα transition associated with the C v-BLA-O vi system at zX = 0.191 ± 0.001 (Section 4.1.5).d Given the relatively low-temperature derived from the H i Doppler parameter, the column density of this H i component is probably too low to produceall the C v and C vi detected in the LETG, even assuming solar abundances (see Section 4.1.3).
band-limit (λ ∼ 1800 Å, or z ∼ 0.48 in H i Lyα), the absorption-line density drops dramatically, indicating z � 0.4 as a likelyredshift for the target (Danforth et al. 2010a). We thereforeassume z = 0.4 as the redshift of 1ES 1553+113.
The 12 absorption features identified as possible lines in theLETG spectrum of 1ES 1553+113, have wavelengths betweenλ = 22.48–26.65 Å (four lines in the O-region of the spectrum)and λ = 38.25–52.82 Å (eight lines in the C-region of thespectrum). The shortest wavelength Kα transition of O isthat of its H-like ion (O viii), at λ = 18.97 Å (Verner et al.1996), while the longest wavelength Kα transition of O is theinner-shell transition of its neutral ion (O i), at λ = 23.52 Å(E. Behar 2006, 2011, private communication).23 Similarly, forC, we have λ(C viLα) = 33.74 Å (Verner et al. 1996), andλ(C iKα) = 43.37 and 43.27 Å (an LETG-resolved doublet;E. Behar 2006, 2011, private communication), as the shortestand longest wavelength transitions, respectively. Intermediateionization ions have their Kα transition wavelengths betweenthese extremes. So, the four LSF-shaped features in the 22–27 Årange (Figure 1, top panel), if true absorption lines, can only beidentified with O viii in the ranges 0.185 < z < 0.4 or with
23 For most of the Kα inner-shell transitions of C and O (with the exception ofO i and C ii, for which empirical observational values are available, e.g., Takeiet al. 2002; Schulz et al. 2003; Juett et al. 2004), we use wavelengths andoscillator strengths computed through the HULLAC code (Bar-Shalom et al.2001). The uncertainties on the rest-frame positions of these transitions are ofthe order of 0.1%–1% (i.e., Δλ ∼ 20–200 mÅ; Behar & Netzer 2002).However, several of these positions have been benchmarked with eitherlaboratory or astrophysical experiments (e.g., Kaastra et al. 2011, andreference therein; Schulz et al. 2003, and references therein; Juett et al. 2004)and have resulted to be accurate to Δλ ∼ 2–10 mÅ.
O i–O vii at 0 � z < 0.4, with the exact lower limit dependingon the ion considered. Analogously, the eight line-like featuresat λ � 38.25 Å can only be identified with C vi in the range0.134 < z < 0.4 or C i–C v at 0 � z < 0.4, while the feature at38.25 Å can only be due to redshifted C vi.
We have checked these ions one by one, and propose possibleidentifications based on H i and/or O vi COS associations. Weonly check here for possible X-ray C and/or O counterpartsto the FUV signposts. These are by far the two most abundantmetals in gas with solar-like composition (Asplund et al. 2009),with C being only a factor of ∼2 less abundant than O, andthe third most abundant metals (N and Ne) being ∼4× lessabundant than C. Similarly, when in doubt between two or moreidentifications involving different ions of C and/or O, we alwaysfavor the He-like metal identification, i.e., C v and/or O vii.These are the He-like ions of C and O, respectively, and as suchare highly stable and by far the most abundant ions of theirrespective elements over a broad range of temperatures. Theoscillator strengths of their Kα transitions are also the strongestof all the other Kα transitions from lower- or higher-ionizationions.
4.1.1. z � 0 Galactic Absorption
The three lines at λ = 23.34 Å, λ = 23.49 Å, and λ =43.01 Å are consistent with z � 0 absorption by neutral (oronly moderately ionized) species of C and O. In particular, weclearly (4.1σ ) detect atomic O i at λ = 23.49 ± 0.04 Å andalso a marginal (2.5σ ) excess of molecular O i (possibly ISMoxygen in compound forms of oxide dust grains; e.g., Takei et al.2002) at λ = 23.34 ± 0.04 Å, with respect to the instrumental
6
The Astrophysical Journal, 769:90 (13pp), 2013 June 1 Nicastro et al.
22 23 24 25 26 27
-4
-2
0
2
4
36 37 38 39 40
-4
-2
0
2
4
43 44 45 46
-4
-2
0
2
4
48 50 52
-4
-2
0
2
4
Figure 2. Non-LSF-smoothed residuals (in σ ) of four portions of the 500 ksLETG spectrum of 1ES 1553+113, where Galactic O i and C ii, as well asintervening O vii and C v, are tentatively detected, at single-line statisticalsignificances in the 2.2σ–4.1σ range. Best-fitting curves of different colorsidentify different systems: (1) Galactic O i and C ii (yellow), (2) O vii atzX = 0.041 (magenta), (3) C v (and maybe O vii) at zX = 0.237 (blue),(4) C vi and C v at zX = 0.312 (red), (5) C v and C vi at 〈zX〉 = 0.133 (green),and (6) C v at the COS triple-H i-metal redshifts (cyan).
molecular O i. Atomic O i is not an instrumental feature (e.g.,Takei et al. 2002). Finally, we marginally (2.8σ ) detect thesignature of C ii (whose Kα transition is twice as strong as thesingle transitions of the resolved and undetected C i doublet) atλ = 43.01 ± 0.04 Å.24 We identify these three transitions asdue to the cold ISM of our Galaxy (Table 1, Columns 3 and 4and Figures 1 and 2, yellow lines), and we therefore considertheir single-line statistical significance as their true (i.e., after asecure identifications) statistical significance.
We also note that we do not detect any O vii Kα z � 0absorber along the line of sight to 1ES 1553+113, down to the3σ sensitivity limit of our Chandra-LETG spectrum, in thisspectral region: EW(O vii(z = 0))< 12 mÅ.
Below we present the possible intervening system identifica-tions in order of statistical significances.
4.1.2. The zX = 0.312 ± 0.001 C v–C vi–BLA–O vi WHIM System
The line at λ = 44.27 Å is that detected at the higheststatistical significance (4.1σ ) in the LETG spectrum (togetherwith the line at λ = 52.82 Å and the Galactic O i atomic line).The C i, C ii, and C iv Kα transitions, at this wavelength, wouldbe redshifted at zX = 0.021, 0.031, and 0.070. At none ofthese redshifts is there a metal or H i association in COS. Atthe redshift of a putative C iii, instead, zX = 0.051, there isa moderately strong NLA. However, no imprint of a C iii λ977absorber is seen in the FUSE spectrum of 1ES 1553+113 (though
24 Not only the C ii Kα transitions is intrinsically stronger than the C i Kα, butalso C ii is expected to be much more abundant than C i in the Galaxy, becauseneutral carbon is easily photoionized by ambient UV radiation (the C iionization edge is at 11.260 eV or 1101 Å).
its presence cannot be ruled out due to the presence of H i Lyβand O i absorption/airglow in FUSE), and no other metal linesare present in the FUSE or COS spectra at this redshift. C v andC vi identifications are more promising.
The C v Kα transition would be redshifted at zX = 0.100 ±0.001. At a close (but >3σ inconsistent) redshift (zFUV =0.10230) there is one of the strongest H i Lyα lines in COS,which is also seen in Lyβ and is consistent with being thermallybroadened (BLA) at T � 105 K. Moreover, at λ = 45.58 Åthere is another line in the LETG spectrum (3.8σ ), which, ifidentified with C iv, would fall at zX = 0.100 ± 0.001. Thepossible temperature of the H i absorber at zFUV = 0.10230is consistent with the presence of C iv and C v, however noC iv doublet (λ = 1548.195 and 1550.77) is seen in the COSspectrum at z = 0.10230 or z = 0.100. We conclude (both forthe lack of C iv in COS and the redshift inconsistency with theBLA) that the zX = 0.100 C v/C iv identification with a thickand moderately cool WHIM filament traced by the COS BLAat zFUV = 0.10230, is unlikely.
A more likely identification is with a C vi Kα transition atλ = 44.27 Å, which would have a redshift of zX = 0.312. Atλ = 52.82 Å, there is the other highest statistical significanceline of the LETG spectrum (4.1σ ), which, if identified withC v Kα, would fall at zX = 0.312 ± 0.001, exactly the redshiftof the C vi identification. No H i or O vi identification is reportedat a consistent redshift in the published COS spectrum. However,with additional data, the currently available COS spectrum of1ES 1553+113 has an S/N of a factor ∼1.5–2× higher thanthe published spectrum. We therefore downloaded from theHST-MAST archive all available HST-COS spectra of 1ES1553+113 taken with the G130M and G160M gratings, andre-analyzed the two portions of the spectrum at 1350–1365 Åand 1590–1600 Å, regions where the O vi(1s22s → 1s22p)doublet (i.e., O vi1(λ1031.9), oscillator strength f = 0.133, andO vi2(λ1037.6), f = 0.066) and the H i Lyα at z ∼ 0.308–0.316are supposed to lie.
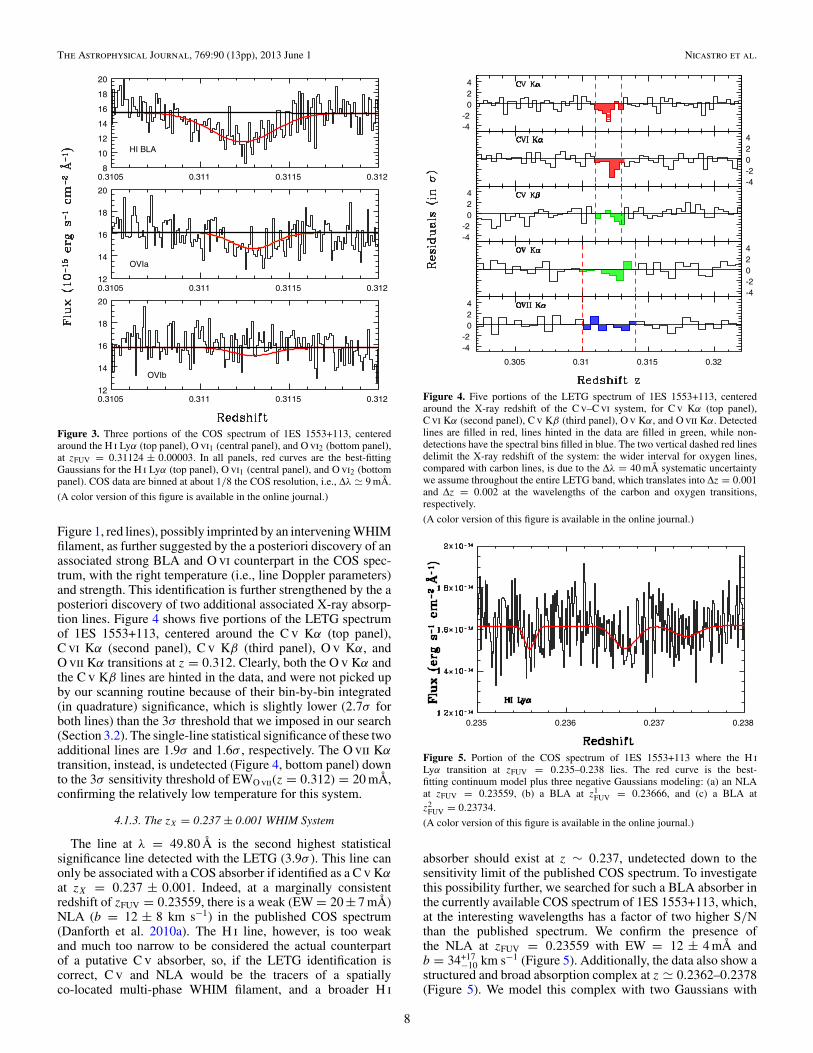
We identify a strong H i BLA at zFUV = 0.31124 ± 0.00003(8.1σ ; Figure 3, top panel), with the following best-fittingparameters: λ = 1594.03 ± 0.03 Å, b = 60 ± 6 km s−1,and EW = 138 ± 17 mÅ. The strongest line of the O vidoublet (O vi1) is also detected (3.9σ ; Figure 3, central panel),with best-fitting parameters: λ = 1353.13 ± 0.04 Å (i.e.,zO vi = 0.31130 ± 0.0004), b = 32 ± 7 km s−1, and EW =27.5 ± 7.0 mÅ. Finally, the weakest line of the O vi doublet(O vi2) is not detected in the data (Figure 3, bottom panel), butthe COS 3σ EW upper limit at the wavelengths of this line,EW < 21 mÅ, is consistent with the maximum possible EWexpected for the O vi2 (given the measured EW(O vi1) and thefact that this line is not blank). From the observed H i and O viDoppler parameters, we can estimate the relative contribution ofthermal and turbulence broadening. In general, if bObs
H i and bObsX
are the observed Doppler parameters of two associated lines ofH i and a metal X with atomic weight A, then the H i thermalparameter is given by
(btherm
H i
)2 = [A/(A − 1)] × [(bObs
H i
)2 − (bObs
X
)2]. (4)
So, in this case we have bthermH i = 52 ± 7 km s−1 (implying
logT = 5.2 ± 0.1) and bturb = 30 ± 14 km s−1, with a thermalcontribution (in quadrature) of 75% and a bObs
H i /bthermH i = 1.15
correction factor, similar to the average bObsH i /btherm
H i = 1.2 valuefound by Danforth et al. (2010b).
We conclude that the two highest significance interveningLETG lines are C v and C vi absorbers at zX = 0.312 (Table 1;
7
The Astrophysical Journal, 769:90 (13pp), 2013 June 1 Nicastro et al.
0.3105 0.311 0.3115 0.3128
10
12
14
16
18
20
HI BLA
0.3105 0.311 0.3115 0.31212
14
16
18
20
OVIa
0.3105 0.311 0.3115 0.31212
14
16
18
20
OVIb
Figure 3. Three portions of the COS spectrum of 1ES 1553+113, centeredaround the H i Lyα (top panel), O vi1 (central panel), and O vi2 (bottom panel),at zFUV = 0.31124 ± 0.00003. In all panels, red curves are the best-fittingGaussians for the H i Lyα (top panel), O vi1 (central panel), and O vi2 (bottompanel). COS data are binned at about 1/8 the COS resolution, i.e., Δλ � 9 mÅ.
(A color version of this figure is available in the online journal.)
Figure 1, red lines), possibly imprinted by an intervening WHIMfilament, as further suggested by the a posteriori discovery of anassociated strong BLA and O vi counterpart in the COS spec-trum, with the right temperature (i.e., line Doppler parameters)and strength. This identification is further strengthened by the aposteriori discovery of two additional associated X-ray absorp-tion lines. Figure 4 shows five portions of the LETG spectrumof 1ES 1553+113, centered around the C v Kα (top panel),C vi Kα (second panel), C v Kβ (third panel), O v Kα, andO vii Kα transitions at z = 0.312. Clearly, both the O v Kα andthe C v Kβ lines are hinted in the data, and were not picked upby our scanning routine because of their bin-by-bin integrated(in quadrature) significance, which is slightly lower (2.7σ forboth lines) than the 3σ threshold that we imposed in our search(Section 3.2). The single-line statistical significance of these twoadditional lines are 1.9σ and 1.6σ , respectively. The O vii Kαtransition, instead, is undetected (Figure 4, bottom panel) downto the 3σ sensitivity threshold of EWO vii(z = 0.312) = 20 mÅ,confirming the relatively low temperature for this system.
4.1.3. The zX = 0.237 ± 0.001 WHIM System
The line at λ = 49.80 Å is the second highest statisticalsignificance line detected with the LETG (3.9σ ). This line canonly be associated with a COS absorber if identified as a C v Kαat zX = 0.237 ± 0.001. Indeed, at a marginally consistentredshift of zFUV = 0.23559, there is a weak (EW = 20 ± 7 mÅ)NLA (b = 12 ± 8 km s−1) in the published COS spectrum(Danforth et al. 2010a). The H i line, however, is too weakand much too narrow to be considered the actual counterpartof a putative C v absorber, so, if the LETG identification iscorrect, C v and NLA would be the tracers of a spatiallyco-located multi-phase WHIM filament, and a broader H i
-4-2
024
-4-2024
-4-2024
-4-2
024
0.305 0.31 0.315 0.32
-4-2
024
Figure 4. Five portions of the LETG spectrum of 1ES 1553+113, centeredaround the X-ray redshift of the C v–C vi system, for C v Kα (top panel),C vi Kα (second panel), C v Kβ (third panel), O v Kα, and O vii Kα. Detectedlines are filled in red, lines hinted in the data are filled in green, while non-detections have the spectral bins filled in blue. The two vertical dashed red linesdelimit the X-ray redshift of the system: the wider interval for oxygen lines,compared with carbon lines, is due to the Δλ = 40 mÅ systematic uncertaintywe assume throughout the entire LETG band, which translates into Δz = 0.001and Δz = 0.002 at the wavelengths of the carbon and oxygen transitions,respectively.
(A color version of this figure is available in the online journal.)
0.235 0.236 0.237 0.238
Figure 5. Portion of the COS spectrum of 1ES 1553+113 where the H iLyα transition at zFUV = 0.235–0.238 lies. The red curve is the best-fitting continuum model plus three negative Gaussians modeling: (a) an NLAat zFUV = 0.23559, (b) a BLA at z1
FUV = 0.23666, and (c) a BLA atz2
FUV = 0.23734.
(A color version of this figure is available in the online journal.)
absorber should exist at z ∼ 0.237, undetected down to thesensitivity limit of the published COS spectrum. To investigatethis possibility further, we searched for such a BLA absorber inthe currently available COS spectrum of 1ES 1553+113, which,at the interesting wavelengths has a factor of two higher S/Nthan the published spectrum. We confirm the presence ofthe NLA at zFUV = 0.23559 with EW = 12 ± 4 mÅ andb = 34+17
−10 km s−1 (Figure 5). Additionally, the data also show astructured and broad absorption complex at z � 0.2362–0.2378(Figure 5). We model this complex with two Gaussians with
8
The Astrophysical Journal, 769:90 (13pp), 2013 June 1 Nicastro et al.
-4
-2
0
2
4
0.23 0.235 0.24 0.245
-4
-2
0
2
4
-4
-2
0
2
4
-4
-2
0
2
4
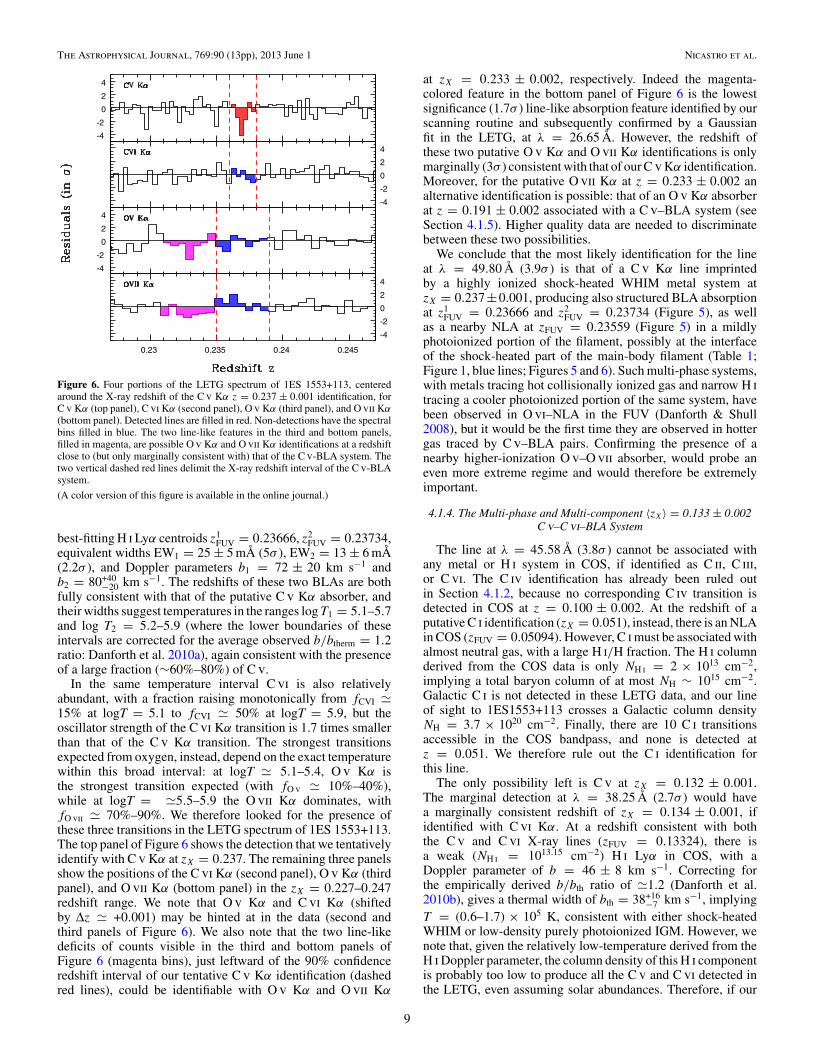
Figure 6. Four portions of the LETG spectrum of 1ES 1553+113, centeredaround the X-ray redshift of the C v Kα z = 0.237 ± 0.001 identification, forC v Kα (top panel), C vi Kα (second panel), O v Kα (third panel), and O vii Kα
(bottom panel). Detected lines are filled in red. Non-detections have the spectralbins filled in blue. The two line-like features in the third and bottom panels,filled in magenta, are possible O v Kα and O vii Kα identifications at a redshiftclose to (but only marginally consistent with) that of the C v-BLA system. Thetwo vertical dashed red lines delimit the X-ray redshift interval of the C v-BLAsystem.
(A color version of this figure is available in the online journal.)
best-fitting H i Lyα centroids z1FUV = 0.23666, z2
FUV = 0.23734,equivalent widths EW1 = 25 ± 5 mÅ (5σ ), EW2 = 13 ± 6 mÅ(2.2σ ), and Doppler parameters b1 = 72 ± 20 km s−1 andb2 = 80+40
−20 km s−1. The redshifts of these two BLAs are bothfully consistent with that of the putative C v Kα absorber, andtheir widths suggest temperatures in the ranges log T1 = 5.1–5.7and log T2 = 5.2–5.9 (where the lower boundaries of theseintervals are corrected for the average observed b/btherm = 1.2ratio: Danforth et al. 2010a), again consistent with the presenceof a large fraction (∼60%–80%) of C v.
In the same temperature interval C vi is also relativelyabundant, with a fraction raising monotonically from fCVI �15% at logT = 5.1 to fCVI � 50% at logT = 5.9, but theoscillator strength of the C vi Kα transition is 1.7 times smallerthan that of the C v Kα transition. The strongest transitionsexpected from oxygen, instead, depend on the exact temperaturewithin this broad interval: at logT � 5.1–5.4, O v Kα isthe strongest transition expected (with fO v � 10%–40%),while at logT = �5.5–5.9 the O vii Kα dominates, withfO vii � 70%–90%. We therefore looked for the presence ofthese three transitions in the LETG spectrum of 1ES 1553+113.The top panel of Figure 6 shows the detection that we tentativelyidentify with C v Kα at zX = 0.237. The remaining three panelsshow the positions of the C vi Kα (second panel), O v Kα (thirdpanel), and O vii Kα (bottom panel) in the zX = 0.227–0.247redshift range. We note that O v Kα and C vi Kα (shiftedby Δz � +0.001) may be hinted at in the data (second andthird panels of Figure 6). We also note that the two line-likedeficits of counts visible in the third and bottom panels ofFigure 6 (magenta bins), just leftward of the 90% confidenceredshift interval of our tentative C v Kα identification (dashedred lines), could be identifiable with O v Kα and O vii Kα
at zX = 0.233 ± 0.002, respectively. Indeed the magenta-colored feature in the bottom panel of Figure 6 is the lowestsignificance (1.7σ ) line-like absorption feature identified by ourscanning routine and subsequently confirmed by a Gaussianfit in the LETG, at λ = 26.65 Å. However, the redshift ofthese two putative O v Kα and O vii Kα identifications is onlymarginally (3σ ) consistent with that of our C v Kα identification.Moreover, for the putative O vii Kα at z = 0.233 ± 0.002 analternative identification is possible: that of an O v Kα absorberat z = 0.191 ± 0.002 associated with a C v–BLA system (seeSection 4.1.5). Higher quality data are needed to discriminatebetween these two possibilities.
We conclude that the most likely identification for the lineat λ = 49.80 Å (3.9σ ) is that of a C v Kα line imprintedby a highly ionized shock-heated WHIM metal system atzX = 0.237±0.001, producing also structured BLA absorptionat z1
FUV = 0.23666 and z2FUV = 0.23734 (Figure 5), as well
as a nearby NLA at zFUV = 0.23559 (Figure 5) in a mildlyphotoionized portion of the filament, possibly at the interfaceof the shock-heated part of the main-body filament (Table 1;Figure 1, blue lines; Figures 5 and 6). Such multi-phase systems,with metals tracing hot collisionally ionized gas and narrow H itracing a cooler photoionized portion of the same system, havebeen observed in O vi–NLA in the FUV (Danforth & Shull2008), but it would be the first time they are observed in hottergas traced by C v–BLA pairs. Confirming the presence of anearby higher-ionization O v–O vii absorber, would probe aneven more extreme regime and would therefore be extremelyimportant.
4.1.4. The Multi-phase and Multi-component 〈zX〉 = 0.133 ± 0.002C v–C vi–BLA System
The line at λ = 45.58 Å (3.8σ ) cannot be associated withany metal or H i system in COS, if identified as C ii, C iii,or C vi. The C iv identification has already been ruled outin Section 4.1.2, because no corresponding C iv transition isdetected in COS at z = 0.100 ± 0.002. At the redshift of aputative C i identification (zX = 0.051), instead, there is an NLAin COS (zFUV = 0.05094). However, C i must be associated withalmost neutral gas, with a large H i/H fraction. The H i columnderived from the COS data is only NH i = 2 × 1013 cm−2,implying a total baryon column of at most NH ∼ 1015 cm−2.Galactic C i is not detected in these LETG data, and our lineof sight to 1ES1553+113 crosses a Galactic column densityNH = 3.7 × 1020 cm−2. Finally, there are 10 C i transitionsaccessible in the COS bandpass, and none is detected atz = 0.051. We therefore rule out the C i identification forthis line.
The only possibility left is C v at zX = 0.132 ± 0.001.The marginal detection at λ = 38.25 Å (2.7σ ) would havea marginally consistent redshift of zX = 0.134 ± 0.001, ifidentified with C vi Kα. At a redshift consistent with boththe C v and C vi X-ray lines (zFUV = 0.13324), there isa weak (NH i = 1013.15 cm−2) H i Lyα in COS, with aDoppler parameter of b = 46 ± 8 km s−1. Correcting forthe empirically derived b/bth ratio of �1.2 (Danforth et al.2010b), gives a thermal width of bth = 38+16
−7 km s−1, implyingT = (0.6–1.7) × 105 K, consistent with either shock-heatedWHIM or low-density purely photoionized IGM. However, wenote that, given the relatively low-temperature derived from theH i Doppler parameter, the column density of this H i componentis probably too low to produce all the C v and C vi detected inthe LETG, even assuming solar abundances. Therefore, if our
9
The Astrophysical Journal, 769:90 (13pp), 2013 June 1 Nicastro et al.
-4
-2
0
2
4
-4
-2
0
2
4
-4
-2
0
2
4
0.125 0.13 0.135 0.14
-4
-2
0
2
4
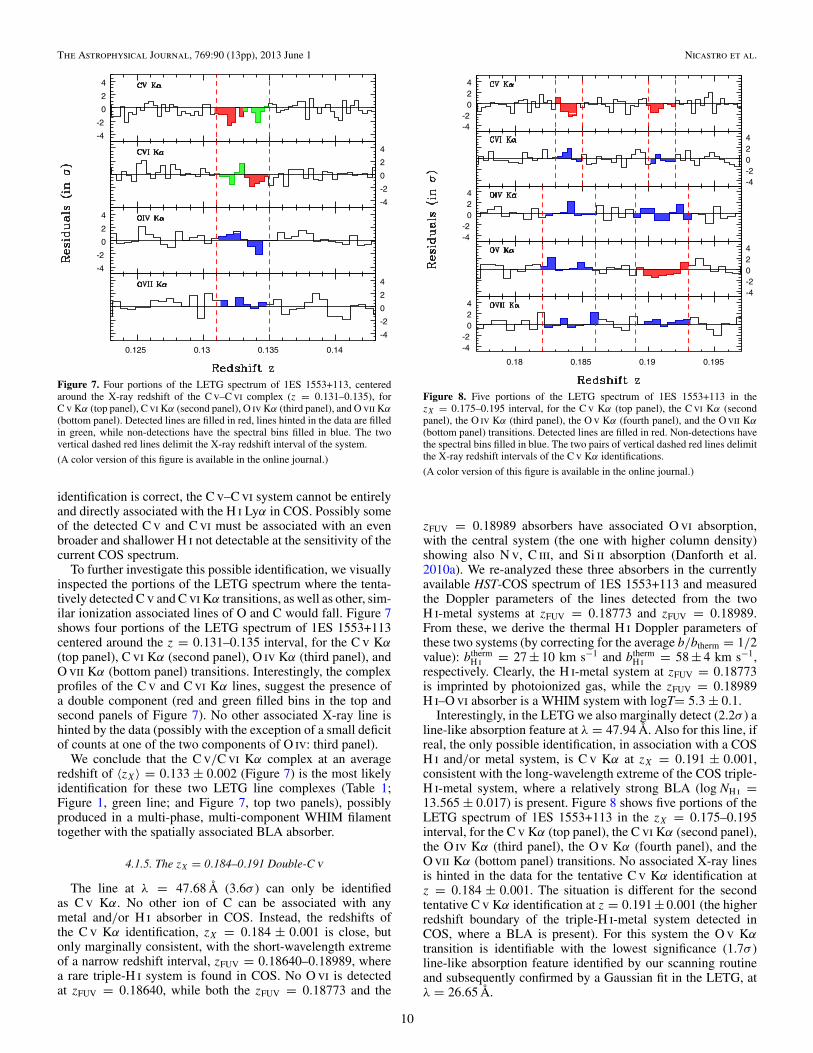
Figure 7. Four portions of the LETG spectrum of 1ES 1553+113, centeredaround the X-ray redshift of the C v–C vi complex (z = 0.131–0.135), forC v Kα (top panel), C vi Kα (second panel), O iv Kα (third panel), and O vii Kα
(bottom panel). Detected lines are filled in red, lines hinted in the data are filledin green, while non-detections have the spectral bins filled in blue. The twovertical dashed red lines delimit the X-ray redshift interval of the system.
(A color version of this figure is available in the online journal.)
identification is correct, the C v–C vi system cannot be entirelyand directly associated with the H i Lyα in COS. Possibly someof the detected C v and C vi must be associated with an evenbroader and shallower H i not detectable at the sensitivity of thecurrent COS spectrum.
To further investigate this possible identification, we visuallyinspected the portions of the LETG spectrum where the tenta-tively detected C v and C vi Kα transitions, as well as other, sim-ilar ionization associated lines of O and C would fall. Figure 7shows four portions of the LETG spectrum of 1ES 1553+113centered around the z = 0.131–0.135 interval, for the C v Kα(top panel), C vi Kα (second panel), O iv Kα (third panel), andO vii Kα (bottom panel) transitions. Interestingly, the complexprofiles of the C v and C vi Kα lines, suggest the presence ofa double component (red and green filled bins in the top andsecond panels of Figure 7). No other associated X-ray line ishinted by the data (possibly with the exception of a small deficitof counts at one of the two components of O iv: third panel).
We conclude that the C v/C vi Kα complex at an averageredshift of 〈zX〉 = 0.133 ± 0.002 (Figure 7) is the most likelyidentification for these two LETG line complexes (Table 1;Figure 1, green line; and Figure 7, top two panels), possiblyproduced in a multi-phase, multi-component WHIM filamenttogether with the spatially associated BLA absorber.
4.1.5. The zX = 0.184–0.191 Double-C v
The line at λ = 47.68 Å (3.6σ ) can only be identifiedas C v Kα. No other ion of C can be associated with anymetal and/or H i absorber in COS. Instead, the redshifts ofthe C v Kα identification, zX = 0.184 ± 0.001 is close, butonly marginally consistent, with the short-wavelength extremeof a narrow redshift interval, zFUV = 0.18640–0.18989, wherea rare triple-H i system is found in COS. No O vi is detectedat zFUV = 0.18640, while both the zFUV = 0.18773 and the
-4-2
024
-4-2024
-4-2
024
-4-2024
0.18 0.185 0.19 0.195
-4-2
024
Figure 8. Five portions of the LETG spectrum of 1ES 1553+113 in thezX = 0.175–0.195 interval, for the C v Kα (top panel), the C vi Kα (secondpanel), the O iv Kα (third panel), the O v Kα (fourth panel), and the O vii Kα
(bottom panel) transitions. Detected lines are filled in red. Non-detections havethe spectral bins filled in blue. The two pairs of vertical dashed red lines delimitthe X-ray redshift intervals of the C v Kα identifications.
(A color version of this figure is available in the online journal.)
zFUV = 0.18989 absorbers have associated O vi absorption,with the central system (the one with higher column density)showing also N v, C iii, and Si ii absorption (Danforth et al.2010a). We re-analyzed these three absorbers in the currentlyavailable HST-COS spectrum of 1ES 1553+113 and measuredthe Doppler parameters of the lines detected from the twoH i-metal systems at zFUV = 0.18773 and zFUV = 0.18989.From these, we derive the thermal H i Doppler parameters ofthese two systems (by correcting for the average b/btherm = 1/2value): btherm
H i = 27 ± 10 km s−1 and bthermH i = 58 ± 4 km s−1,
respectively. Clearly, the H i-metal system at zFUV = 0.18773is imprinted by photoionized gas, while the zFUV = 0.18989H i–O vi absorber is a WHIM system with logT= 5.3 ± 0.1.
Interestingly, in the LETG we also marginally detect (2.2σ ) aline-like absorption feature at λ = 47.94 Å. Also for this line, ifreal, the only possible identification, in association with a COSH i and/or metal system, is C v Kα at zX = 0.191 ± 0.001,consistent with the long-wavelength extreme of the COS triple-H i-metal system, where a relatively strong BLA (log NH i =13.565 ± 0.017) is present. Figure 8 shows five portions of theLETG spectrum of 1ES 1553+113 in the zX = 0.175–0.195interval, for the C v Kα (top panel), the C vi Kα (second panel),the O iv Kα (third panel), the O v Kα (fourth panel), and theO vii Kα (bottom panel) transitions. No associated X-ray linesis hinted in the data for the tentative C v Kα identification atz = 0.184 ± 0.001. The situation is different for the secondtentative C v Kα identification at z = 0.191 ± 0.001 (the higherredshift boundary of the triple-H i-metal system detected inCOS, where a BLA is present). For this system the O v Kαtransition is identifiable with the lowest significance (1.7σ )line-like absorption feature identified by our scanning routineand subsequently confirmed by a Gaussian fit in the LETG, atλ = 26.65 Å.
10
The Astrophysical Journal, 769:90 (13pp), 2013 June 1 Nicastro et al.
We thus speculate that these LETG lines at λ = 47.68 Å(3.6σ ), λ = 47.94 Å (2.2σ ), and λ = 26.65 Å (only 1.7σ ), maybe the high-ionization C v Kα (zX = 0.184 and zX = 0.191)and O v Kα (zX = 0.191) counterparts (Table 1; Figure 8, toppanel, red bins) of the interesting, likely multi-phase, triple-H i-metal system detected in COS, possibly witnessing the on-goinginterplay between nearby galaxy outflows and a WHIM filamentat zFUV = 0.188989, where a C v–O v–BLA system is present.
4.1.6. The zX = 0.041 ± 0.02 WHIM System
Finally, the marginal detection at λ = 22.47 Å (2.3σ ) canonly be redshifted O v or higher. The O v Kα transition wouldbe redshifted to zX = 0.005 ± 0.002. There is an NLA presentin COS at zFUV = 0.00717, i.e., marginally consistent with theX-ray redshift. However, in photoionized gas O v shows frac-tional abundances similar to O vi. No O vi absorption is seen atthis redshift either in the FUSE spectrum of 1ES 1553+113 or inits LETG spectrum. The O vi Kα transition would be redshiftedto zX = 0.020 ± 0.002. No H i Lyα or O vi(1s22s → 1s22p)is seen at a consistent redshifts in COS or FUSE. Finally, theO vii and O viii Kα transitions, would be redshifted to zX =0.041 ± 0.002 and zX = 0.185 ± 0.002. These two redshifts areboth consistent with either the broadest (bH i = 73 ± 7 km s−1,corresponding to logT = 5.3–5.6 K) and strongest (EW(BLA) =135 ± 14 mÅ) BLA detected in the published COS spectrum, atzFUV = 0.04281, or the redshift range of the unusual triple-H i-metal system at zFUV = 0.18640–0.18989, respectively.However, while a possible double-C v counterpart to the triple-H i-metal system seen in COS is possibly detected in the LETG(Section 4.1.5), no O vii counterpart is detected. So, it appearsunlikely that the line at λ = 22.47 Å is O viii associated withthe triple-H i-metal system.
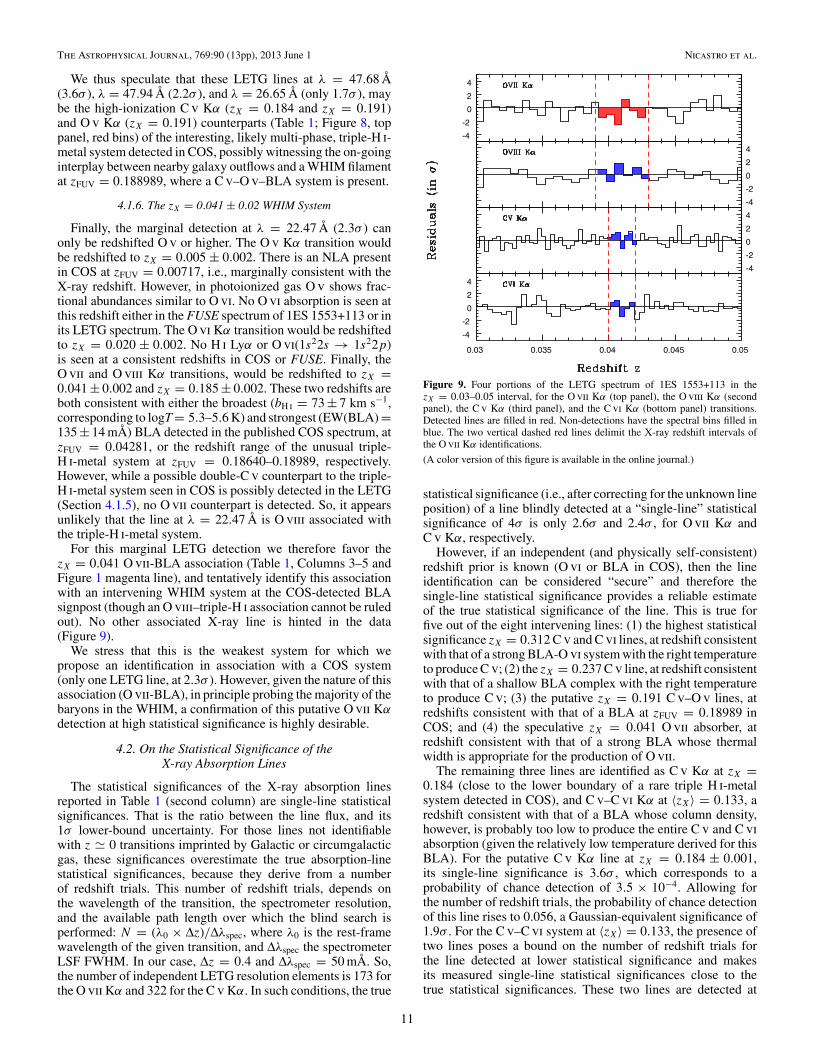
For this marginal LETG detection we therefore favor thezX = 0.041 O vii-BLA association (Table 1, Columns 3–5 andFigure 1 magenta line), and tentatively identify this associationwith an intervening WHIM system at the COS-detected BLAsignpost (though an O viii–triple-H i association cannot be ruledout). No other associated X-ray line is hinted in the data(Figure 9).
We stress that this is the weakest system for which wepropose an identification in association with a COS system(only one LETG line, at 2.3σ ). However, given the nature of thisassociation (O vii-BLA), in principle probing the majority of thebaryons in the WHIM, a confirmation of this putative O vii Kαdetection at high statistical significance is highly desirable.
4.2. On the Statistical Significance of theX-ray Absorption Lines
The statistical significances of the X-ray absorption linesreported in Table 1 (second column) are single-line statisticalsignificances. That is the ratio between the line flux, and its1σ lower-bound uncertainty. For those lines not identifiablewith z � 0 transitions imprinted by Galactic or circumgalacticgas, these significances overestimate the true absorption-linestatistical significances, because they derive from a numberof redshift trials. This number of redshift trials, depends onthe wavelength of the transition, the spectrometer resolution,and the available path length over which the blind search isperformed: N = (λ0 × Δz)/Δλspec, where λ0 is the rest-framewavelength of the given transition, and Δλspec the spectrometerLSF FWHM. In our case, Δz = 0.4 and Δλspec = 50 mÅ. So,the number of independent LETG resolution elements is 173 forthe O vii Kα and 322 for the C v Kα. In such conditions, the true
-4
-2
0
2
4
-4
-2
0
2
4
-4
-2
0
2
4
0.03 0.035 0.04 0.045 0.05
-4
-2
0
2
4
Figure 9. Four portions of the LETG spectrum of 1ES 1553+113 in thezX = 0.03–0.05 interval, for the O vii Kα (top panel), the O viii Kα (secondpanel), the C v Kα (third panel), and the C vi Kα (bottom panel) transitions.Detected lines are filled in red. Non-detections have the spectral bins filled inblue. The two vertical dashed red lines delimit the X-ray redshift intervals ofthe O vii Kα identifications.
(A color version of this figure is available in the online journal.)
statistical significance (i.e., after correcting for the unknown lineposition) of a line blindly detected at a “single-line” statisticalsignificance of 4σ is only 2.6σ and 2.4σ , for O vii Kα andC v Kα, respectively.
However, if an independent (and physically self-consistent)redshift prior is known (O vi or BLA in COS), then the lineidentification can be considered “secure” and therefore thesingle-line statistical significance provides a reliable estimateof the true statistical significance of the line. This is true forfive out of the eight intervening lines: (1) the highest statisticalsignificance zX = 0.312 C v and C vi lines, at redshift consistentwith that of a strong BLA-O vi system with the right temperatureto produce C v; (2) the zX = 0.237 C v line, at redshift consistentwith that of a shallow BLA complex with the right temperatureto produce C v; (3) the putative zX = 0.191 C v–O v lines, atredshifts consistent with that of a BLA at zFUV = 0.18989 inCOS; and (4) the speculative zX = 0.041 O vii absorber, atredshift consistent with that of a strong BLA whose thermalwidth is appropriate for the production of O vii.
The remaining three lines are identified as C v Kα at zX =0.184 (close to the lower boundary of a rare triple H i-metalsystem detected in COS), and C v–C vi Kα at 〈zX〉 = 0.133, aredshift consistent with that of a BLA whose column density,however, is probably too low to produce the entire C v and C viabsorption (given the relatively low temperature derived for thisBLA). For the putative C v Kα line at zX = 0.184 ± 0.001,its single-line significance is 3.6σ , which corresponds to aprobability of chance detection of 3.5 × 10⁻⁴. Allowing forthe number of redshift trials, the probability of chance detectionof this line rises to 0.056, a Gaussian-equivalent significance of1.9σ . For the C v–C vi system at 〈zX〉 = 0.133, the presence oftwo lines poses a bound on the number of redshift trials forthe line detected at lower statistical significance and makesits measured single-line statistical significances close to thetrue statistical significances. These two lines are detected at
11

The Astrophysical Journal, 769:90 (13pp), 2013 June 1 Nicastro et al.
single-line significances of 3.8σ and 2.7σ , corresponding toprobabilities of chance detections of 1.5 × 10⁻⁴ and 7 × 10⁻³,respectively. Allowing for the number of redshift trials, theprobability of chance detection of the strongest of these twolines rises to 0.024, a Gaussian-equivalent significance of 2.3σ .However, considering this as a prior for the second line, theprobability of having by chance both lines (independently) isthe product of the two probabilities: P = 0.024 × 0.007 =1.7×10⁻⁴, corresponding to a Gaussian-equivalent significanceof 3.8σ .
5. CONCLUSIONS
We report on the detection of six absorption lines and fiveadditional features associated with either other X-ray linesdetected at higher significance and/or FUV signposts, in the500 ks Chandra-LETG spectrum of the bright (F0.1–2 =1.2 mCrab) and distant (z � 0.4) blazar 1ES 1553+113. Thesix detections have single-line statistical significances between3.6σ and 4.1σ , while the five additional associations aredetected with single-line statistical significances of 2.2σ–2.8σ .
We tentatively identify these absorption lines as belonging tosix different systems: the Galaxy cold ISM, and five interveningwarm-hot IGM filaments.
Three out of the five intervening absorption systems showmultiple-ion associations in the X-rays, have BLA (and O vi forthe system at zX = 0.312) counterparts at consistent redshifts inthe HST-COS spectrum of 1ES 1553+113 and have true X-raystatistical significances of 5.8σ (zX = 0.312; 6.3σ if the low-significance O v and C v Kβ associations are considered), 3.9σ(zX = 0.237) and 3.8σ (〈zX〉 = 0.133). For these three systems,the COS counterparts are also physically consistent with theionization degree and temperature of the X-ray absorbers ina shock-heated gas scenario. However, for the 〈zX〉 = 0.133system, given the temperature implied by the BLA width, the H icolumn density is probably too low to produce all the detectedC v and C vi absorption.
The two remaining proposed identifications are X-ray single-ion tentative detections (with the exception of the C v-BLA-O vizX = 0.191 system, where O v may also be present), both with apossible, physically consistent, COS counterpart: (1) the doubleC v Kα system at zX = 0.184 (3.6σ ) and zX = 0.191 (2.2σ , plusO v Kα, 1.7σ ), both with H i (BLA-O vi for the putative C v–O vat zx = 0.191) counterparts; and (2) the possible O vii Kαabsorber at zX = 0.041 (2.3σ ) with a BLA counterpart.
Here, we summarize our identifications as follows.
1. Galactic ISM. We detect atomic O i (and possibly an excessof ISM oxygen in compound forms, over the instrumentalmolecular O i), as well as C ii at z � 0, and associate theseabsorbers with the cold ISM of our Galaxy along the lineof sight to 1ES 1553+113.
2. Intervening system I. This is the highest significance LETGsystem, with two lines detected at single-line statisticalsignificances of 4.1σ each. We identify these two lines withC v and C vi absorption at zX = 0.312 ± 0.001, possiblyimprinted by an intervening WHIM filament, as furthersuggested by our a posteriori discovery of an associatedstrong BLA and O vi counterpart in the COS spectrum,with the right temperature (i.e., line Doppler parameters)and strength. Associated O v and C v Kβ absorption arealso possibly hinted by the X-ray data. The combined (inquadrature) statistical significance of this system in theLETG (C v and C v Kα lines only) is 5.8σ . If the association
with O v Kα and C vi Kβ is considered, the statisticalsignificance of the system is 6.3σ .
3. Intervening System II. We identify C v absorption at zX =0.237 ± 0.001, consistent with the redshift of a structuredBLA complex that we discovered a posteriori in thecurrently available COS spectrum of 1ES 1553+113. Giventhe presence of a physically self-consistent redshift prior(the BLA complex in COS), the true statistical significanceof this line in the LETG is of 3.9σ .
4. Intervening system III. We identify a C v–C vi–BLA systemat 〈zX〉 = 0.133 ± 0.002, and associate this absorber withan intervening warm WHIM filament, where only part ofthe X-ray absorption is physically related to the detectedBLA. The statistical significance of this system in the LETG(after properly accounting for the number of redshift trials)is 3.8σ .
5. Tentative intervening system IV. We identify two C v Kα ab-sorbers at redshifts zX = 0.184 ± 0.001 and zX = 0.191 ±0.001, where also O v Kα is tentatively detected, adjacentto the redshifts of the extremes of a narrow redshift intervalcontaining a rare triple-H i-metal absorption system. Oneof these three H i absorber is a BLA-O vi pair, with redshiftand temperature fully consistent with that of the C v–O vabsorber at zX = 0.191 ± 0.001. We speculate that theX-ray C v–O v absorbers trace the same multi-phasemedium traced by the triple-H i-metal system in COS, pos-sibly representing the result of the interplay between galaxywinds and a WHIM filament at zX = 0.191 ± 0.001. TheC v line at zX = 0.184±0.001 is detected at single-line sta-tistical significance of 3.6σ (a true statistical significance ofonly 1.9σ , after allowing for the number of redshift trials),while the C v–BLA–O vi system at zX = 0.191 ± 0.001 isdetected at a true significance of 2.2σ (2.8σ if the O v Kαassociation is considered).
6. Tentative intervening system V. We tentatively identify anO vii–BLA system at zX = 0.041 ± 0.002 and associatethis absorber with an intervening hot WHIM filament. Thisis the weakest system for which we report a possibleidentification, with only one X-ray line at a single-linestatistical significance of 2.3σ , but with a possible redshiftprior identified in the broadest and strongest BLA reportedin the published COS spectrum.
This moderate quality 500 ks Chandra-LETG spectrum ofthe, by far, brightest steady soft X-ray target in the z > 0.4 sky,strongly hints at the existence of possible X-ray metal WHIMcounterparts to genuine gaseous signposts, previously securedwith the HST-COS (or vice versa), and so demonstrates theefficiency of this observational strategy and the power of theX-ray–FUV synergy for WHIM studies. Moreover, these re-sults suggest that the gas may be often found to be multi-phase,possibly indicating that the IGM structure is richer than typi-cally found in hydrodynamical simulations. Longer integrationswith both the available high-resolution soft X-ray spectrometers(the Chandra-LETG and the XMM-Newton-RGSs) are neededto confirm at high statistical significances and with two inde-pendent measurements these tentative identifications and asso-ciations (especially for the three lowest statistical significanceassociations), and to conduct a sensitive exploration of evenhotter WHIM systems along this line of sight.
We thank Ehud Behar for providing wavelength, oscilla-tor strengths, and transition probabilities of inner shell tran-sitions of C, O, and Ne. F.N. acknowledges support from
12
The Astrophysical Journal, 769:90 (13pp), 2013 June 1 Nicastro et al.
Chandra Grant GO1-12174X, and from INAF-ASI ADAEGrant 1.05.04.13.15. M.S. and C.D. acknowledge support fromCOS Grant NNX08AC14G to the University of Colorado, fromNASA. X.B. acknowledges support by the Spanish Ministry ofEconomy and Competitiveness through grant AYA2010-21490-C02-01.
REFERENCES
Asplund, M., Grevesse, N., Sauval, A. J., & Scott, P. 2009, ARA&A, 47, 481Bar-Shalom, A., Klapish, M., & Oreg, J. 2001, JQSRT, 71, 169Behar, E., & Netzer, H. 2002, ApJ, 570, 165Bennett, C. L., Halpern, M., Hinshaw, G., et al. 2003, ApJS, 148, 1Bertone, S., Schaye, J., Dalla Vecchia, C., et al. 2010, MNRAS, 407, 544Branchini, E., Ursino, E., Corsi, A., et al. 2009, ApJ, 697, 328Brinkman, A. C., Gunsing, C. J. T., Kaastra, J. S., et al. 2000, ApJL, 530, L111Buote, D. A., Zappacosta, L., Fang, T., et al. 2009, ApJ, 695, 1351Cen, R., & Fang, T. 2006, ApJ, 650, 573Cen, R., & Ostriker, J. P. 2006, ApJ, 650, 560Danforth, C. W., Keeney, B. A., Stocke, J. T., Shull, J. M., & Yao, Y. 2010a, ApJ,
720, 976Danforth, C. W., & Shull, J. M. 2008, ApJ, 679, 194Danforth, C. W., Stocke, J. T., Keeney, B. A., et al. 2011, ApJ, 743, 18Danforth, C. W., Stocke, J. T., & Shull, J. M. 2010b, ApJ, 720, 976den Herder, J. W., Brinkman, A. C., Kahn, S. M., et al. 2001, A&A, 365, L7Fang, T., Buote, D. A., Humphrey, P. J., et al. 2010, ApJ, 714, 1715Gupta, A., Mathur, S., Krongold, Y., Nicastro, F., & Galeazzi, M. 2012, ApJL,
756, L8Juett, A. M., Schulz, N. S., & Chakrabarty, D. 2004, ApJ, 612, 308Kaastra, J. S., de Vries, C. P., Steenbrugge, K. C., et al. 2011, A&A, 534, 37Kaastra, J. S., Werner, N., den Herder, J. W. A., et al. 2006, ApJ, 652, 189
Kalberla, P. M. W., Burton, W. B., Hartmann, D., et al. 2005, A&A, 440, 775Keshet, U., Kushnir, D., Loeb, A., & Waman, E. 2012, arXiv:1210.1574Kirkman, D., Tytler, D., Suzuki, N., O’Meara, J. M., & Lubin, D. 2003, ApJS,
149, 1Mathur, S., Weinberg, D. H., & Chen, X. 2003, ApJ, 582, 82Murray, S. S., & Chappell, J. H. 1996, Proc. SPIE, 597, 279Nicastro, F., Krongold, Y., Fields, D., et al. 2010, ApJ, 715, 854Nicastro, F., Mathur, S., & Elvis, M. 2008, Sci, 319, 55Nicastro, F., Mathur, S., Elvis, M., et al. 2005a, Natur, 433, 495Nicastro, F., Mathur, S., Elvis, M., et al. 2005b, ApJ, 629, 700Nicastro, F., Zezas, A., Drake, J., et al. 2002, ApJ, 573, 157Rasmussen, A. P., Kahn, S. M., Paerels, F., et al. 2007, ApJ, 656, 129Rauch, M. 1998, ARA&A, 36, 267Schulz, N. S., Juett, A., Chakrabarty, D., & Canizares, C. R. 2003, AN,
324, 166Shull, J. M., Smith, B. D., & Danforth, C. W. 2012, ApJ, 759, 23Smith, B. D., Hallman, E. J., Shull, J. M., & O’Shea, B. W. 2011, ApJ, 731, 6Spergel, D. N., Bean, R., Dore, O., et al. 2007, ApJS, 170, 377Takei, Y., Fujimoto, R., & Mitsuda, K. 2002, ApJ, 581, 307Tornatore, L., Borgani, S., Viel, M., & Springel, V. 2010, MNRAS, 402, 1911Treves, A., Falomo, R., & Uslenghi, M. 2007, A&A, 473, L17Verner, D. A., Verner, E. M., & Ferland, G. J. 1996, AtPhy, 4003Weinberg, D. H., Miralda-Escude, J., Hernquist, L., & Katz, N. 1997, ApJ, 490,
564Williams, R. J., Mathur, S., Nicastro, F., & Elvis, M. 2006, ApJL, 624, L95Williams, R. J., Mulchaey, J. S., & Kollmeier, J. A. 2012, ApJL, 762, L10Williams, R. J., Mulchaey, J. S., Kollmeier, J. A., & Cox, T. J. 2010, ApJL,
724, L25Yao, Y., Shull, J. M., Wang, Q. D., & Cash, W. 2012, ApJ, 746, 166Yoshikawa, K., Yamasaki, N. Y., Suto, Y., et al. 2003, PASJ, 55, 879Zappacosta, L., Nicastro, F., Krongold, Y., & Maiolini, R. 2012, ApJ, 753, 137Zappacosta, L., Nicastro, F., Maiolino, R., et al. 2010, ApJ, 717, 74
13
Related Documents