235 Oceanography and Marine Biology: An Annual Review, 2012, 50, 235–286 © R. N. Gibson, R. J. A. Atkinson, J. D. M. Gordon, R. N. Hughes, D. J. Hughes and I. P. Smith, Editors Taylor & Francis CHALLENGES TO THE ASSESSMENT OF BENTHIC POPULATIONS AND BIODIVERSITY AS A RESULT OF RHYTHMIC BEHAVIOUR: VIDEO SOLUTIONS FROM CABLED OBSERVATORIES JACOPO AGUZZI 1 , JOAN B. COMPANY 1 , CORRADO COSTA 2 , MARJOLAINE MATABOS 3 , ERNESTO AZZURRO 4 , ANTONI MàNUEL 5 , PAOLO MENESATTI 2 , FRANCESC SARDà 1 , MIQUEL CANALS 6 , ERIC DELORY 7 , DANELLE CLINE 8 , PAOLO FAVALI 9 , S. KIM JUNIPER 10 , YASUO FURUSHIMA 11 , YOSHIRO FUJIWARA 11 , JUAN J. CHIESA 12 , LEONARDO MAROTTA 13 , NIXON BAHAMON 14 & IMANTS G. PRIEDE 15 1 Instituto de Ciencias del Mar (ICM-CSIC), Paseo Marítimo de la Barceloneta 37-49, 08003 Barcelona, Spain E-mail: [email protected]; [email protected]; [email protected] 2 AgritechLab-Agricultural Engineering Research Unit of the Agriculture Research Council (CRA-ING), Via della Pascolare 16, 00015 Monterotondo Scalo (Rome), Italy E-mail: [email protected], [email protected] 3 NEPTUNE-Canada, University of Victoria, PO Box 1700 STN CSC, Victoria BC V8W 2Y2, Canada E-mail: [email protected] 4 ISPRA, Institute for Environmental Protection and Research, Piazzale dei Marmi 2, 57123 Livorno, Italy E-mail: [email protected] 5 Technological Development Centre for Remote Acquisition and Data Processing System (SARTI), Electronics Department, Technical University of Catalonia (UPC), Rambla de la Exposición 24, 08800 Vilanova i la Geltrú (Barcelona), Spain E-mail: [email protected] 6 GRC Geociències Marines, Departament d’Estratigrafia, Paleontologia i Geociències Marines, Facultat de Geologia, Universitat de Barcelona (UB), Martí i Franqués s/n, 08028 Barcelona, Spain E-mail: [email protected] 7 Plataforma Oceánica de Canarias (PLOCAN), Carretera de Taliarte s/n, 35200 Telde (Canarias), Spain E-mail: [email protected] 8 Monterey Bay Aquarium Research Institute (MBARI), 7700 Sandholt Rd, Moss Landing, CA 95039, USA E-mail: [email protected] 9 Istituto Nazionale di Geofisica e Vulcanologia (INGV). Via di Vigna Murata 605, 00143 Rome, Italy E-mail: [email protected]

Welcome message from author
This document is posted to help you gain knowledge. Please leave a comment to let me know what you think about it! Share it to your friends and learn new things together.
Transcript
235
Oceanography and Marine Biology: An Annual Review, 2012, 50, 235–286© R. N. Gibson, R. J. A. Atkinson, J. D. M. Gordon, R. N. Hughes, D. J. Hughes and I. P. Smith, Editors
Taylor & Francis
CHAllENGES To THE ASSESSMENT oF bENTHIC PoPulATIoNS AND bIoDIvERSITy AS A
RESulT oF RHyTHMIC bEHAvIouR: vIDEo SoluTIoNS FRoM CAblED obSERvAToRIES
JACoPo AGuzzI1, JoAN b. CoMPANy1, CoRRADo CoSTA2, MARJolAINE MATAboS3, ERNESTo AzzuRRo4, ANToNI MàNuEl5, PAolo MENESATTI2, FRANCESC SARDà1,
MIquEl CANAlS6, ERIC DEloRy7, DANEllE ClINE8, PAolo FAvAlI9, S. KIM JuNIPER10, yASuo FuRuSHIMA11, yoSHIRo FuJIwARA11, JuAN J. CHIESA12,
lEoNARDo MARoTTA13, NIxoN bAHAMoN14 & IMANTS G. PRIEDE15
1Instituto de Ciencias del Mar (ICM- CSIC), Paseo Marítimo de la Barceloneta 37-49, 08003 Barcelona, Spain
E- mail: [email protected]; [email protected]; [email protected] Agricultural Engineering Research Unit of the Agriculture Research
Council (CRA- ING), Via della Pascolare 16, 00015 Monterotondo Scalo (Rome), ItalyE- mail: [email protected], [email protected]
3NEPTUNE- Canada, University of Victoria, PO Box 1700 STN CSC, Victoria BC V8W 2Y2, Canada
E- mail: [email protected], Institute for Environmental Protection and Research,
Piazzale dei Marmi 2, 57123 Livorno, ItalyE- mail: [email protected]
5Technological Development Centre for Remote Acquisition and Data Processing System (SARTI), Electronics Department, Technical University of Catalonia (UPC),
Rambla de la Exposición 24, 08800 Vilanova i la Geltrú (Barcelona), SpainE- mail: [email protected]
6GRC Geociències Marines, Departament d’Estratigrafia, Paleontologia i Geociències Marines, Facultat de Geologia, Universitat de Barcelona (UB), Martí i Franqués s/n,
08028 Barcelona, SpainE- mail: [email protected]
7Plataforma Oceánica de Canarias (PLOCAN), Carretera de Taliarte s/n, 35200 Telde (Canarias), SpainE- mail: [email protected]
8Monterey Bay Aquarium Research Institute (MBARI), 7700 Sandholt Rd, Moss Landing, CA 95039, USA
E- mail: [email protected] Nazionale di Geofisica e Vulcanologia (INGV). Via
di Vigna Murata 605, 00143 Rome, ItalyE- mail: [email protected]
JACoPo AGuzzI ET Al.
236
10School of Earth and Ocean Sciences and Department of Biology, University of Victoria, PO Box 3065 STN CSC, Victoria B.C. V8W 3V6, Canada
E- mail: [email protected] of Biogeosciences Japan Agency for Marine- Earth Science and Technology (JAMSTEC),
2-15 Natsushima- cho, Yokosuka 237-0061, JapanE- mail: [email protected]; [email protected]
12Departamento de Ciencia y Tecnología, Universidad Nacional de Quilmes/CONICET, Buenos Aires, Argentina
E- mail: [email protected] Snc. and Scientific Committee AISA (Associazione Italiana Scienze Ambientali),
Via Corridoni 3, 62019 Recanati, ItalyE- mail: leonardo.marotta@entropia- env.it
14Centro de Estudios Avanzados de Blanes (CEAB- CSIC), Accés Cala St. Francesc 14, 17300 Blanes, Spain
E- mail: [email protected], University of Aberdeen. Main Street, Newburgh,
Aberdeen AB41 6AA, United KingdomE- mail: [email protected]
Abstract All marine species studied thus far show rhythmic temporal patterns in their behav-ioural, physiological, and molecular functions, which are collectively known as biological rhythms. biological rhythms are generated by biological clocks that time biological functions and are syn-chronized by geophysical cycles, such as the solar light- dark cycle and tidal cycle. on continental margins, behavioural rhythms can be detected by diel (i.e., 24-hour based) or seasonal periodical trawling as a consequence of massive inward and outward displacements of populations to and from the sample areas. As a result, significant errors in population/stock and biodiversity assessments performed by trawling may occur if timing of sampling is not taken into account. The increasing number of cabled and permanent multiparametric seafloor observatories now allows direct, contin-uous, and long- lasting monitoring of benthic ecosystems and analysis in relation to several habitat cycles. This review describes the adaptation of this technology to investigations of rhythmic behav-iour by focussing on automated video imaging. Diel fluctuations in the number of video- observed individuals can be used as a measure of average population rhythmic behaviour. The potential implementation of automated video image analysis in relation to animal tracking and classification procedures based on the combined use of morphometric tools and multivariate statistics is detailed in relation to populational and community studies. based on video cameras mounted at multipa-rametric cabled observatories, an integrated time- series analysis protocol using chronobiomedical procedures is proposed to place video- recorded bioinformation in an oceanographic context.
The missing chronobiology framework in marine ecological studies
Chronobiology in deep- water areas
The evolution of life occurs within a framework of deterministic (predictable) habitat fluctuations (i.e., geophysical cycles; Aschoff 1981), such as light intensity or tidal cycles. As a result, biological processes are governed by internal oscillatory mechanisms (i.e., biological clocks) that have evolved as mechanisms to regulate the period and phase of rhythmic behaviour and physiology (Daan & Aschoff 2001, Carr et al. 2003). because biological clocks are ‘entrained’ (or synchronized) to spe-cific environmental cycles, the biological rhythms they generate are in tune with the cyclic temporal
CHAllENGES To ASSESSING bENTHIC PoPulATIoNS AND bIoDIvERSITy
237
habitat of each species. biological rhythms are collectively defined as fluctuations in biological functions at any level of complexity, from molecular, physiological, and behavioural processes in individuals to oscillations at the population and community levels (Aguzzi & Company 2010). Chronobiology is a rapidly developing field that studies the generation and entrainment of biological rhythms using approaches that include reductionist strategies such as molecular biology to holistic level ecology (Naylor 2010).
The definition of rhythmic activity is usually the first step in biological rhythm analysis, being the result of all underlying physiological fluctuations. Presently, rhythmic behaviour is mostly stud-ied in terrestrial animals by conducting laboratory tests in which geophysical cycles are simulated or eliminated (i.e., constant conditions) to reveal intrinsic (endogenous) mechanisms underlying the functioning of biological clocks (Johnson et al. 2003). This laboratory- oriented research allows the study of biological timing to be carried out in controlled conditions, conditions that cannot be easily satisfied in field studies. laboratory research responds to the needs of biomedicine (e.g., chrono-pharmacology), which studies behaviour as a phenotypic expression of molecular clock mechanisms (Tosini & Aguzzi 2005, Hu et al. 2007, bertolucci et al. 2008). For example, the neurophysiologic basis of circadian (24-hour endogenously based) clocks and their light entrainment pathways are currently being studied in several mammalian and insect species (e.g., Golombek & Rosenstein 2010) to establish the complex arrangement of neural oscillator cells in the nervous system and their relationships with peripheral tissues (welsh et al. 2010).
In marine animals, rhythmic behaviour occurs in the form of predictable variations in the rates of swimming, walking, and crawling, which are difficult to study in the laboratory given the 3-dimensional character of the marine environment (i.e., the water column plus the seabed) where these activities take place (Aguzzi & Company 2010). laboratory and field research on this topic has chiefly been developed using shallow or inland water fishes and decapod crustaceans of com-mercial interest (e.g., related to fisheries and aquaculture) or other invertebrates (e.g., the gastro-pods Aplysia or the American horseshoe crab; lickey et al. 1976, watson et al. 2008) based on the combination of pragmatism in sampling (accessibility of animals for collection) and high rates of survival in controlled laboratory conditions (Reebs 2002, Naylor 2005). If from one side terrestrial chronobiology is well studied and control processes deeply characterized, marine chronobiology has only been developed to a similar degree for the intertidal zone (Naylor 2010). Data on rhyth-mic behaviour for species inhabiting the continental margin areas of shelves and slopes, including the deep sea, are currently scant (Aguzzi et al. 2004b). The paucity of data on rhythmic behaviour becomes dramatically evident as the depth range inhabited by species increases. laboratory studies using deep- water continental margin species (i.e., those of the middle and lower shelves or slopes) are less common, with major animals studied being decapod Crustacea such as the Norway and the American clawed lobsters (Nephrops norvegicus and Homarus americanus, respectively) (reviewed by Aguzzi & Sardà 2008, Aguzzi et al. 2008).
In a context where the behavioural habit is unknown for the vast majority of marine species, rhythmic displacement of individuals can fundamentally influence the perception of sampled popu-lation sizes and therefore community compositions according to the time of the day (Naylor 2005). Accordingly, biodiversity observations should be somehow linked to individual behavioural per-formances in relation to changing habit conditions. This fact has been poorly considered to date as day- night scheduled field- sampling procedures are not often employed due to a lack of suitable technology or sufficient resources for repetition. The aim of this review is to describe the application of the newly developed video methods associated with permanent cabled observatory stations to the study of the behavioural rhythms of benthic species. This technology has the potential to provide important data for evaluation of the reliability of population, stock and biodiversity assessments in depth contexts where sampling repeatability and duration are strongly constrained.
JACoPo AGuzzI ET Al.
238
Ecological implications of behavioural rhythms
A number of biological traits, including rhythmic behaviour, are still unknown for the majority of benthic species, including many of commercial interest (Company & Sardà 1998, 2000, Company et al. 2003). Rhythmic movements related to the seabed environment occur in a complex habitat scenario characterized by marked depth- dependent variations in key oceanographic parameters.
Behavioural rhythms as unknown displacement typologies in the complex environmental context of continental margins
light plays a central role in the regulation of the rhythmic behaviour of animals inhabiting bottom areas within the twilight zone range (Chiesa et al. 2010). because light intensity decreases and spectral quality narrows with increasing depth (Herring 2002), day- night- driven rhythms should also be weaker in slope species in comparison with shallower- dwelling shelf species (Aguzzi et al. 2009a). In the oligotrophic western Mediterranean Sea, the twilight zone ends on the middle slope (Margalef 1986), and light can potentially regulate the circadian system of benthic species down to depths of 1000 m (Tobar & Sardà 1992, Sardà et al. 2003). As light progressively fades with depth, the day- night control of behaviour decreases; therefore, other geophysical variables and cycles are expected to control the behavioural rhythms of benthos.
It is known that internal tides influence the rhythmic behaviour of fishes (e.g., zoarcids) inhab-iting the aphotic deep sea (Aguzzi et al. 2010b). wagner et al. (2007) showed that deep- sea fishes living at continental rise and abyssal depths, beyond the reach of solar light, have an endogenous clock mediated through release of melatonin (Priede et al. 1999). water flow variations based on a 12.4-hour tidal cycle affect the rhythmic production of this hormone, the function of which is related to variations in metabolic activity in association with animal behavioural activation (wagner et al. 2007). In areas where the tidal pull is negligible (e.g., the Mediterranean Sea), other cycles, such as weaker atmosphere- driven inertial currents, appear to be an effective means of geophysical control over the rhythmic behaviour and physiology of benthos (Aguzzi et al. 2009e). Anyway, the rhythmic behaviour of deep- water species in relation to depth- variable light intensity regimes and geographically variable tidally or inertially driven current flows remains very poorly understood.
A traditional sampling methodology for the study of behavioural rhythms in marine species is the temporally scheduled use of pelagic and bottom trawling. Rhythmic catch patterns associated with these temporally modulated sampling methods are considered as a proxy for rhythmic dis-placements of populations into and out of seabed sampling areas (Aguzzi et al. 2009d).
The behavioural rhythms of many pelagic species are characterized by diel (i.e., 24-hour based) vertical migrations (DvMs) that occur within the water column in response to defined light intensity variations (Naylor 2006, Gaten et al. 2008) typified by ascent towards the surface at night- time and descent at dawn. Repetition of pelagic sampling at different depth strata at similar times has allowed the characterization of migration extension ranges for different demographic components of micro- and macronekton (i.e., gender- related and ontogenetic modulations of behaviour) (Foxton 1970a,b, Franqueville 1971, Foxton & Roe 1974, Herring & Roe 1988, Frank & widder 2002). within the DvM displacement category, a diel cycle of occurrence of benthopelagic species is reported in sea-bed collections taken at different times (Aguzzi et al. 2006a). Animal catches increase during day-time when benthopelagic populations descend in the water column, hiding on the sediment surface from pelagic visual predators (Aguzzi et al. 2006a).
Similarly detailed knowledge regarding the behaviour of benthos is still a long way off. Several species apparently perform long- range migrations within the benthic boundary layer, following bathymetric gradients across continental shelves and slopes (benoit- bird & Au 2006). These move-ments can be broadly defined as nektobenthic (Cartes et al. 1993). Catches of populations of these species vary rhythmically at a certain depth stratum as the result of arrival and departure of schools (Aguzzi & Company 2010). The occurrence of this behaviour has been inferred in most cases by
CHAllENGES To ASSESSING bENTHIC PoPulATIoNS AND bIoDIvERSITy
239
combining direct observations, such as trawl catch patterns, with indirect ones, such as comparisons of morphological and metabolic adaptations (Company & Sardà 1998, Pulcini et al. 2008, Aguzzi et al. 2009b, Antonucci et al. 2009).
The effects of behavioural rhythms on population/stock and biodiversity assessments
Deep oceans represent one of the last frontiers for human exploration on Earth, with deep- sea marine biology being a relatively recent scientific discipline (Glover et al. 2010a). ocean zones with water depths below 200 m cover 65% of the planet’s surface, but very little is known about the spe-cies inhabiting these zones and their life histories (waterman 2001). Deep- water ocean areas poten-tially host some of the ecosystems with the highest biodiversity levels on the planet (Ramirez- llodra et al. 2010). Most of these deep- sea areas along continental margins are threatened by increasing anthropogenic pressures (Sheppard 2000), mainly related to searching for minerals, oil, and gas, with commercial fisheries apparently exerting the greatest impact (benn et al. 2010). For example, a deep- water fishery in the north- eastern Atlantic ocean trawling down to a maximum depth of 1500 m has been shown to deplete the demersal fish assemblage, affecting up to 77 species of fish in addition to the 3 main species targeted by the fishing vessels (bailey et al. 2009, Priede et al. 2011). Furthermore, in these deep- sea areas anthropogenic changes in species composition should be distinguished from more long- term natural ones that can be associated with climate (bailey et al. 2006, billett et al. 2009).
Studies of biodiversity in deep- water areas should be linked to the concept of community functioning in the face of habitat changes through time (Smith et al. 2009). The management of new fisheries grounds, or any other area where human activity may represent a potential source of impacts, requires precise data on population demography and distribution as well as the evaluation of biodiversity (Pauly et al. 2003, Morato et al. 2006). Commercially targeted species represent the focus of management policies, and the preservation of their biomass for sustainable exploitation also requires investigation of all other surrounding species, from which data must be derived and integrated into increasingly holistic models (Roberts 2002). This requirement is one of the main justifications for biodiversity studies in deep- water areas and attempts to link community function-ing with habitat changes through space and time (Danovaro et al. 2010).
one of the great limitations to improving the reliability of estimating species abundance esti-mates using trawl surveys is the overall variability of data collected at sea (Godø 1998). In trawl surveys, the time of the day is usually preserved as constant, or it may represent a random character due to technical factors (Raffaelli et al. 2003). Random sampling with respect to time produces unpredictable variability in the species composition of catches (bahamon et al. 2009). Planning temporally scheduled sampling to standardize field data has been generally accepted in terrestrial ecology studies for quite some time (Park 1941), but this approach is still inconsistently applied in marine research (Naylor 2005).
Trawl timing is intuitively perceived as a biasing factor when sampling is not repetitively per-formed at a given depth. Changes in species abundances and composition are related to the rhythmic behaviour of individuals (Aguzzi & Company 2010). Therefore, sampling at a given depth should be repeated at different times of day and in different seasons to evaluate the biasing effects of time on the reported trawl data (Aguzzi & bahamon 2009). unfortunately, these factors are not often taken into account. There is a conflict between allocation of effort to sampling and space or time not only in deep- water sampling but also for coastal- water sampling. An increase in the surveyed area, as required for the assessment of population distributions, usually implies a concomitant reduction in the frequency of repetitive sampling within a certain location (benoit & Swain 2003). only tempo-rally scheduled sampling within a fixed area can provide the data required for the characterization of behavioural rhythms.
within this framework, specifically planned day- night trawl surveys show the occurrence of broad diel variations in communities from different continental margin areas exposed to fluctuations
JACoPo AGuzzI ET Al.
240
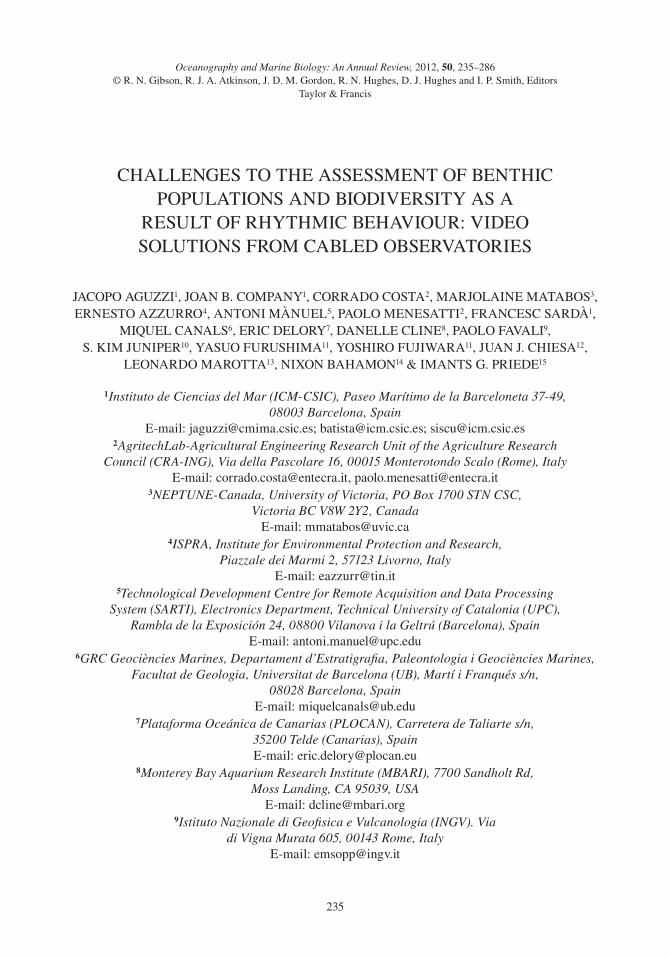
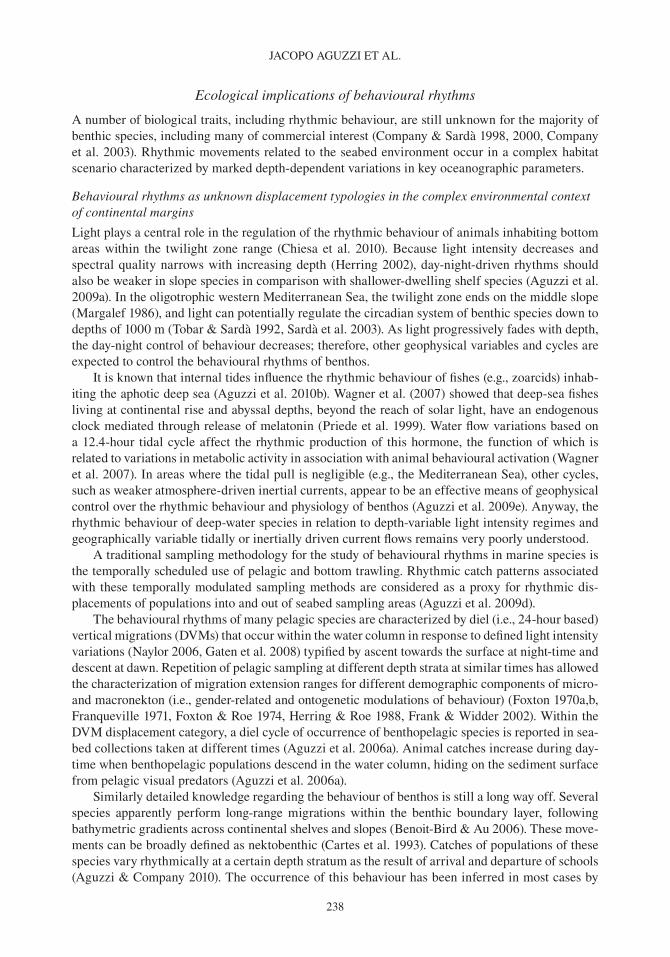
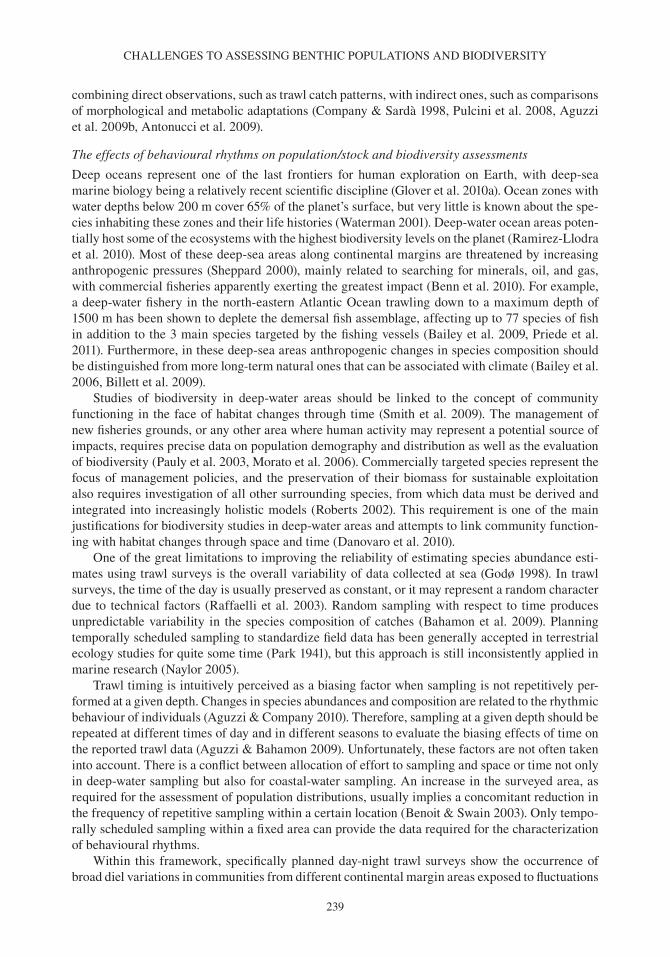
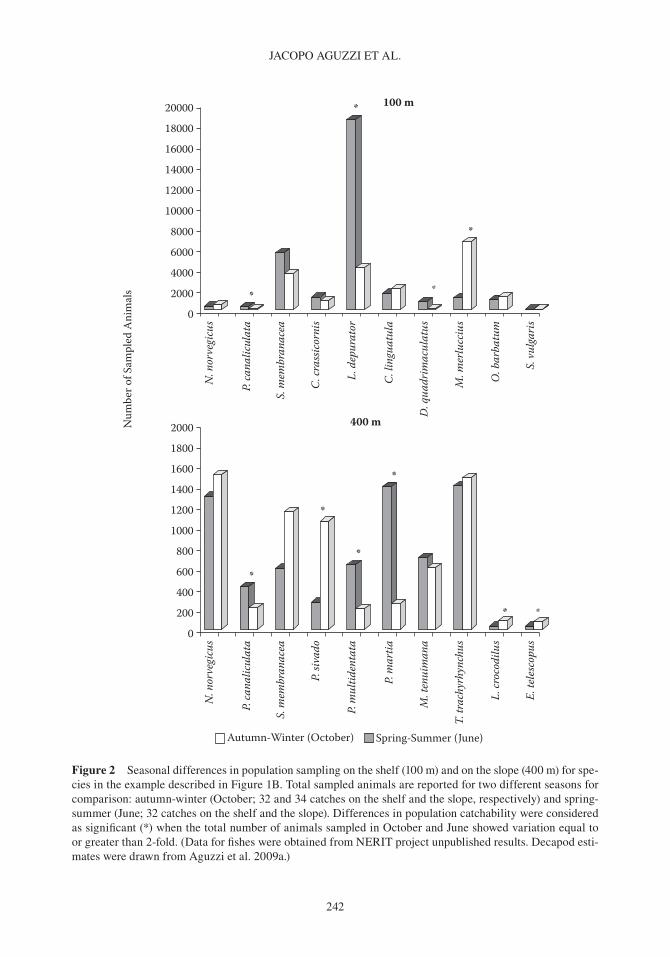
in solar light intensity (Petrakis et al. 2001, benoit & Swain 2003, Carpentieri et al. 2005, benoit- bird & Au 2006, benoit- bird et al. 2008, Aguzzi & bahamon 2009). For example, in the western Mediterranean Sea, diel differences in catch composition are the product of the rhythmic appear-ance and disappearance of populations from trawl- hauling windows (Figure 1). This variation can also follow a seasonal pattern. Several decapod and fish species appear to modify their depth ranges from autumn- winter to spring- summer (Figure 2; Aguzzi et al. 2009a). In benthic species, the number of individuals collected at a given depth and location may vary over the year, not only because of the reproductive cycle (i.e., the recruitment of pelagic larvae into benthic adult cohorts; e.g., Company et al. 2003) but also due to the modulation of behavioural rhythms in response to changing photoperiod lengths. Some populations appear to move into darker, deep waters when the duration of the photophase increases, while others move to shallower depths, where they become exposed to brighter daytime environmental illumination levels (Aguzzi et al. 2009a, Aguzzi & Company 2010). Such seasonal bathymetric changes have also been observed in other continental margin and abyssal areas. For example, seasonal changes in the population size- frequency distribu-tion of grenadier fishes (Coryphaenoides spp.) have been detected in both the Central North Pacific ocean at a depth of 5800 m (Priede et al. 2003) and on the Porcupine abyssal plain of the North Atlantic ocean at a depth of 4800 m (Smith et al. 1997). It was proposed that seasonal changes in size- frequency indicate the occurrence of basin- scale seasonal migrations of these fishes across the seafloor into and out of the study area.
Studies employing day- night scheduled trawling between 700-m and 1000-m depths have also reported diel variations in the composition of communities (Cartes et al. 1993, Sardà et al. 2003), indicating the effect exerted by the few remaining photons on the extremely sensitive visual organs of midslope species. Despite these observations, population, biomass and biodiversity studies mak-ing extensive use of oceanographic data very rarely consider solar light measurements as a poten-tially helpful tool for interpreting data (e.g., Hart et al. 2010).
The needs of a new observational technology
Changes in communities over a 24-hour or a seasonal period within a benthic sampling area rep-resent the sum of all species rhythmic displacements that result from synchronic movement of all individuals of a population within different depths of the water column and the continental margin. In this sense, investigations of behavioural rhythms in populations of different species in an area can be placed within the broad framework of studies on ecosystem functioning (Kronfeld- Schor & Dayan 2003).
In this context, sampling methodologies and their applicability represent a major bottleneck in understanding the biology of species inhabiting deep- water continental margins and the deep sea. Trawling is still one of the most effective and more economically feasible methods of sampling (Raffaelli et al. 2003, Sardà et al. 2004). Trawling studies are broadly conducted over large seabed areas for the assessment of the distribution and demography of populations (e.g., stock assessment), as well as for overall biodiversity evaluations (Coll et al. 2010). Pluriannual surveys are common on several of the world’s continental margins for these purposes, for example, in the Mediterranean (Relini & Piccinetti 1994, bertrand et al. 2002); parts of the North Atlantic, such as the Gulf of St. lawrence (bailey & Elner 1989, Hurlbut & Clay 1990); the bering Sea (bakkala 1993); and the Pacific ocean (Knuckey & Dichmont 2009).
Automated video imaging from cabled observatories for the study of behavioural rhythms
The lack of tools for obtaining direct ethological observations leads to major knowledge gaps regarding the behavioural mechanism underlying trawl sampling variability. Technological limita-tions in direct observation capabilities are at the base of the presently scarce modelling capacity
CHAllENGES To ASSESSING bENTHIC PoPulATIoNS AND bIoDIvERSITy
241
8:388:02
17:48
5:5810:449:37
15:086:18
15:0211:14
5:3915:04
5:388:40
17:31
15:4610:2517:2918:35
20:1621:5720:5322:343:113:07
22:3122:56
19:46
20:57
3:18
3:21
18:078:035:396:06
10:188:33
10:388:31
14:5410:42
8:045:40
10:5014:4222:5320:2822:47
3:053:333:073:395:59
22:3020:1522:22
0.0 0.2 0.4 0.6 0.8 1.0
400 m
0.0 0.2 0.4 0.6 0.8 1.0
Nephrops norvegicus*(Norway lobster)
Processa canaliculata(Processid shrimp)
Liocarcinus depurator(Portunid swimming crab)
Solenocera membranacea(Mud shrimp)
Citharus linguatula(Spotted flounder)
Deltentosteus quadrimaculatus(Four-spotted goby)
Merluccius merluccius(European hake)
Ophidium barbatum(Snake blenny)
Solea vulgaris(Common sole)
Chlorotocus crassicornis(Pandalid caridean shrimp)
Pasiphaea multidentata(Rose glass shirmp)
Plesionika martia(Pandalid caridean shrimp)
Munida tenuimana(Galatheid squat lobster)
Trachyrhynchus trachyrhynchus(Deep-water fish)
Lampanyctus crocodilus(Jewel lanternfish)
Epigonus telescopus(Black cardinal fish)
Pasiphaea sivado(With glass shrimps)
Similarity index
Tim
e of t
raw
ling
(h)
Time (24-h)
% M
ax.
A
B
100 m
Figure 1 variation in species composition as reported from 24-hour trawl hauls conducted continuously over consecutive days at different depths (i.e., shelf: 100 m; slope: 400 m) in the western Mediterranean in autumn- winter (october 1998). The temporal variation in the species composition within different samples is shown by similarity index- based cluster analysis (A), which discriminates day from night hauls (bold black in grey boxes) (adapted by bahamon et al. 2009). variations in catches are the product of changing species abundances (b) according to day- night cycles (grey vertical bars indicate night), as can be seen for some ecologically and economically important crustacean, fish and decapod species; all values are surface density estimates (no. ind. km–2) standardized as a percentage of the maximum for comparison. (Fish catch patterns were obtained from NERIT (NEphrops Rhythms In Trawl) project unpublished data. Decapod catch plots were adapted from different studies, all reviewed in Aguzzi et al. 2009a.)
JACoPo AGuzzI ET Al.
242
20000
Autumn-Winter (October) Spring-Summer (June)
18000
16000
14000
12000
10000
8000
6000
* *
*
* 100 m
400 m
4000
2000
0
N. n
orve
gicu
s
P. ca
nalic
ulat
a
S. m
embr
anac
ea
C. cr
assic
orni
s
L. d
epur
ator
C. li
ngua
tula
D. q
uadr
imac
ulat
us
M. m
erlu
cciu
s
O. b
arba
tum
S. vu
lgaris
2000
1800
1600
1400
1200
1000
800
600
*
*
*
*
*
*400
200
0
N. n
orve
gicu
s
P. ca
nalic
ulat
a
S. m
embr
anac
ea
P. siv
ado
P. m
ultid
enta
ta
P. m
artia
M. t
enui
man
a
T. tr
achy
rhyn
chus
L. cr
ocod
ilus
E. te
lesc
opus
Num
ber o
f Sam
pled
Ani
mal
s
Figure 2 Seasonal differences in population sampling on the shelf (100 m) and on the slope (400 m) for spe-cies in the example described in Figure 1b. Total sampled animals are reported for two different seasons for comparison: autumn- winter (october; 32 and 34 catches on the shelf and the slope, respectively) and spring- summer (June; 32 catches on the shelf and the slope). Differences in population catchability were considered as significant (*) when the total number of animals sampled in october and June showed variation equal to or greater than 2-fold. (Data for fishes were obtained from NERIT project unpublished results. Decapod esti-mates were drawn from Aguzzi et al. 2009a.)
CHAllENGES To ASSESSING bENTHIC PoPulATIoNS AND bIoDIvERSITy
243
regarding population/stock and biodiversity assessments as well as ecosystem functioning in con-tinental margin areas. Improvement in this field requires a new observational technology to moni-tor community changes produced by the synergic sum of behavioural rhythms of all constituting species. This technology must be (1) continuous and long- lasting with respect to the frequency and duration of data collection; (2) automated in relation to the real- time processing of biological data; and (3) multiparametric in terms of the integrated acquisition and processing of biological and habi-tat data (see the section ‘Multiparametric Measurements and Chronobiological Analytic Protocols for the Characterization of Ecosystem Functioning’).
Cabled seafloor observatories for multiparametric video and oceanographic monitoring
behavioural rhythms of species within a community represent the core of ecosystem temporal func-tioning, having still poorly known implications on results of assessment surveys in continental mar-gin areas and the deep sea. The study of rhythmic behaviour at diel and seasonal scales requires a technological development mostly directed towards coupled acquisition and analysis of diversified and enlarged datasets over periods of time larger than 1 year (Matabos et al. 2011).
The state of art in video- sampling technology and cabled observatories as innovative technology
In the last 30 years, the development of video imaging in association with multisensor measurements for habitat characterization has been applied to understanding patterns of biomass and biodiversity variations at different spatial and temporal scales (reviewed by Glover et al. 2010b). Technological effort has been applied to development of observational tools for remote exploration and monitoring of the sea. Remotely operated vehicles (Rovs), autonomous underwater vehicles (Auvs), and non- permanent camera stations have provided glimpses of the continental margin and, more generally, of deep- sea ecosystem functioning over a range of temporal windows (Allen et al. 1978, Stoner et al. 2008). However, none of these technologies can currently be used to produce continuous time series of integrated biological, geological, and oceanographic data over consecutive years, as is required for reliable monitoring of benthic ecosystems in relation to present challenges of manage-ment and conservation.
Cabled multiparametric seafloor observatories connected to the shore for power and real- time data transmission represent a substantial innovation in this respect. In principle, the data provided by such platforms satisfies these needs. Cabled observatories use a vast array of instruments on submarine platforms, including seismometers, acoustic current profilers, hydrophones, sonar, echo sounders, conductivity and temperature sensors, and pressure sensors (Aguzzi et al. 2011b). In addi-tion to imaging cameras, the biological tools available for these experiments include plankton sam-plers, sediment traps that capture falling particulates to the deep- sea floor, turbidity sensors, and benthic flow simulation chambers. Chemical and gas sensors for measuring carbon dioxide, oxygen, methane, and nitrates are also available (Matabos et al. 2011).
Sensors deployed over the seabed are only a part of the relatively complex instrument arrays that can be set up in cabled observatories. Profiler instrument packages installed at scientific nodes can provide multiparametric measurements of ecological processes within the water column above. An example of that is represented by the Regional Scale Nodes associated with the u.S. ocean observatory Initiative (ooI) (see the section ‘Networking of Seafloor Cabled observatories as a Tool for Future Predictive and Informative Studies’); these are sensors attached to profilers that ver-tically traverse the ocean from just above the seafloor to the subsurface. Conductivity, temperature, and density meters (CTDs), dissolved oxygen sensors, current meters, and fluorometers are expected to be installed in these profiler instrument packages to provide temporal and spatial measurements over almost the entire oceanic depth range.
JACoPo AGuzzI ET Al.
244
A complex management scenario for data acquisition
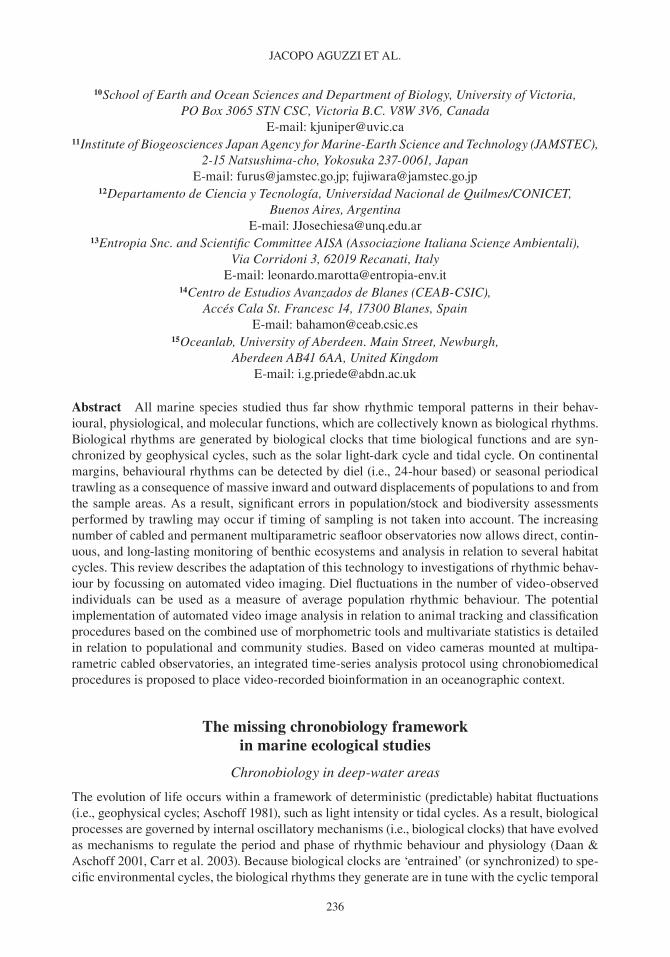
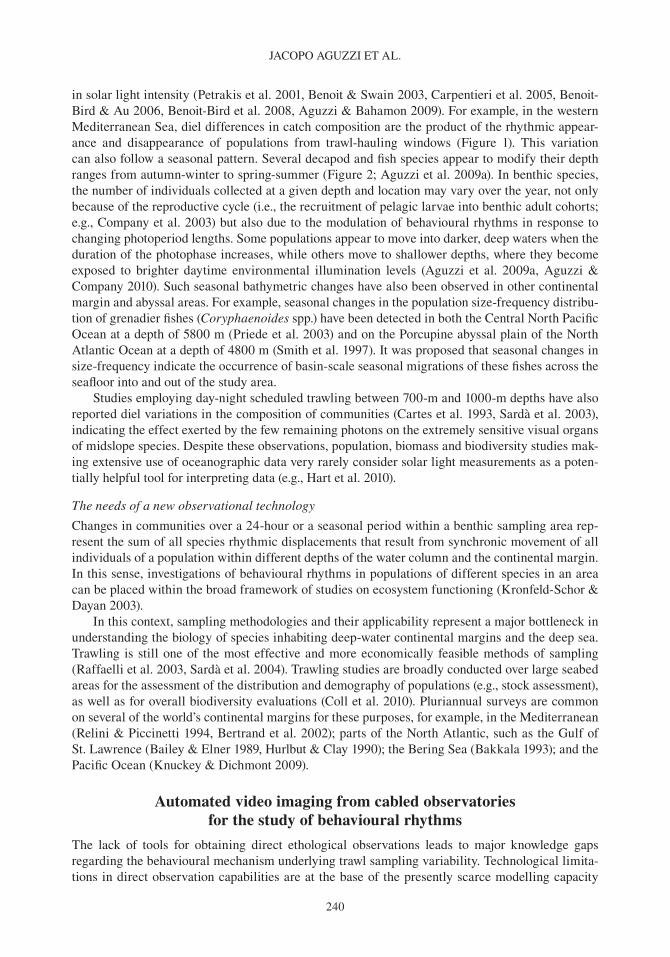
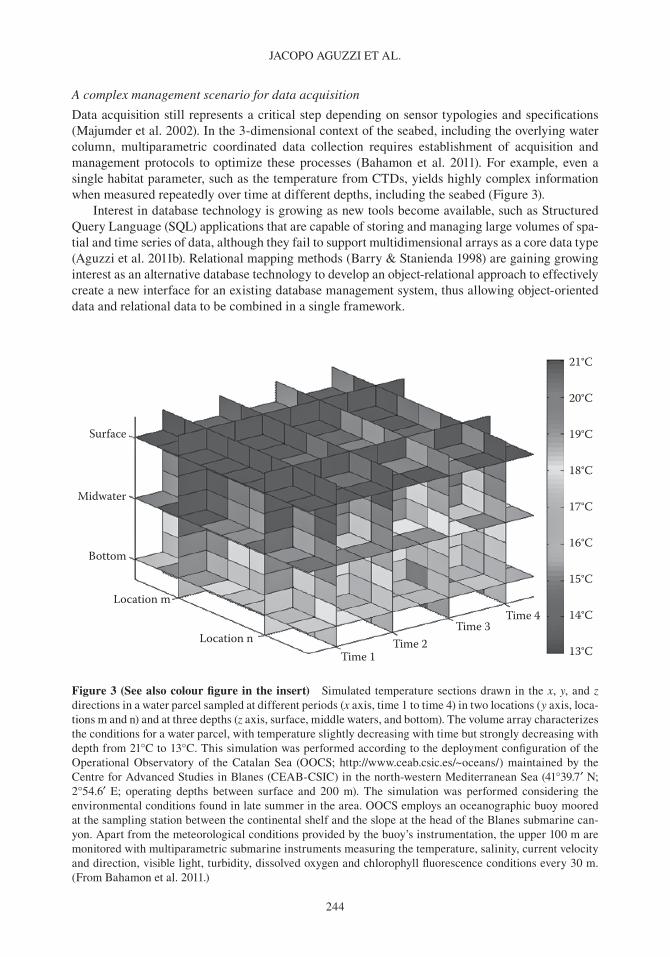
Data acquisition still represents a critical step depending on sensor typologies and specifications (Majumder et al. 2002). In the 3-dimensional context of the seabed, including the overlying water column, multiparametric coordinated data collection requires establishment of acquisition and management protocols to optimize these processes (bahamon et al. 2011). For example, even a single habitat parameter, such as the temperature from CTDs, yields highly complex information when measured repeatedly over time at different depths, including the seabed (Figure 3).
Interest in database technology is growing as new tools become available, such as Structured query language (Sql) applications that are capable of storing and managing large volumes of spa-tial and time series of data, although they fail to support multidimensional arrays as a core data type (Aguzzi et al. 2011b). Relational mapping methods (barry & Stanienda 1998) are gaining growing interest as an alternative database technology to develop an object- relational approach to effectively create a new interface for an existing database management system, thus allowing object- oriented data and relational data to be combined in a single framework.
Surface
Midwater
Bottom
Location m
Location nTime 1
Time 2Time 3
Time 4
21°C
20°C
19°C
18°C
17°C
16°C
15°C
14°C
13°C
Figure 3 (See also colour figure in the insert) Simulated temperature sections drawn in the x, y, and z directions in a water parcel sampled at different periods (x axis, time 1 to time 4) in two locations (y axis, loca-tions m and n) and at three depths (z axis, surface, middle waters, and bottom). The volume array characterizes the conditions for a water parcel, with temperature slightly decreasing with time but strongly decreasing with depth from 21°C to 13°C. This simulation was performed according to the deployment configuration of the operational observatory of the Catalan Sea (ooCS; http://www.ceab.csic.es/~oceans/) maintained by the Centre for Advanced Studies in blanes (CEAb- CSIC) in the north- western Mediterranean Sea (41°39.7′ N; 2°54.6′ E; operating depths between surface and 200 m). The simulation was performed considering the environmental conditions found in late summer in the area. ooCS employs an oceanographic buoy moored at the sampling station between the continental shelf and the slope at the head of the blanes submarine can-yon. Apart from the meteorological conditions provided by the buoy’s instrumentation, the upper 100 m are monitored with multiparametric submarine instruments measuring the temperature, salinity, current velocity and direction, visible light, turbidity, dissolved oxygen and chlorophyll fluorescence conditions every 30 m. (From bahamon et al. 2011.)
CHAllENGES To ASSESSING bENTHIC PoPulATIoNS AND bIoDIvERSITy
245
Data fusion is a fairly new informatics discipline, as it represents the capacity to integrate data from different instruments (Klein 2004, Mitchell 2007). Technologies should be adopted if they can be constantly calibrated and in which interinstrumental transfer of data is possible. A good example of this type of technology, although from a different field, is provided by meteorological stations that can be coupled with networks used to forecast weather conditions in relation to ani-mal health and production (Menesatti et al. 2009b). Thus, local dairy cow housing environments can be monitored by sensors of different types integrated into the same managing system. within these networks, only a few stations for which calibrated instruments are available can be used for forecasting purposes.
Video imaging as novel biosensor approach
Geophysical and oceanographic sensors are able to measure parameters driving processes of inter-est directly. In contrast, one of the difficulties associated with marine biology research is the lack of sensors capable of measuring life functions directly at the level of individuals, species and com-munities. Most biosensors are indirect since they measure products of life processes in terms of chemical derivates (e.g., dissolved oxygen, chlorophyll or nitrates; Aguzzi et al. 2011b).
Cabled observatories often have video cameras (Favali & beranzoli 2006, Favali et al. 2010). In relation to benthic ecosystems, these cameras potentially represent the primary effective biosen-sor at individual animal, population, and species levels, provided that automated image analysis is sufficiently developed to classify animals based on differences in shape, texture and colour. video cameras may thus be used to efficiently detect fluctuations in the numbers of individuals of different species over time as a proxy of population behavioural rhythms (Aguzzi et al. 2009c, 2010b). when image time series are coupled with other physical parameters collected synchronously, information on rhythmic activities can be related to environmental fluctuations within the habitat under investiga-tion (Matabos et al. 2011). This could be helpful in searching for the geophysical cycles and processes ultimately controlling the behaviour of individuals and populations of different species as one of the major driving forces of ecosystem functioning (see the section ‘Multiparametric Measurements and Chronobiological Analytic Protocols for the Characterization of Ecosystem Functioning’).
Previous time- lapse imagery studies carried out with semiautonomous observatories (e.g., land-ers) have indicated the effectiveness of cameras for the characterization of ecosystem functioning. Kemp et al. (2008) described the Dobo (Deep ocean benthic observatory) system, which is capa-ble of remaining on the seafloor for up to 12 months, releasing bait at regular intervals. Time- series observations were obtained for squat lobsters (Munidopsis spp.) and macrourid and zoarcid fishes at a depth of 3664 m in the Atlantic ocean. This type of system is capable of providing information during winter months when sampling using surface vessels is not feasible due to adverse weather conditions. Dobo is also equipped with multiple sensors for conductivity, temperature and pressure and an acoustic Doppler current profiler.
Investigation of biological rhythms of marine populations through time- lapse video imaging
video cameras on cabled seafloor observatories are often installed as an accessory to the primary purpose of acquisition of geological, chemical, and physical data. Hence these video sources are rarely used for continuous, long- term ecosystem surveying. one limitation on their use is the lack of an acceptable level of automation of image processing (Costa et al. 2011). Human inspection of videos is time consuming and represents an important bottleneck for the extraction of quantitative information from video footage (walther et al. 2004, Cline et al. 2007, Glover et al. 2010b).
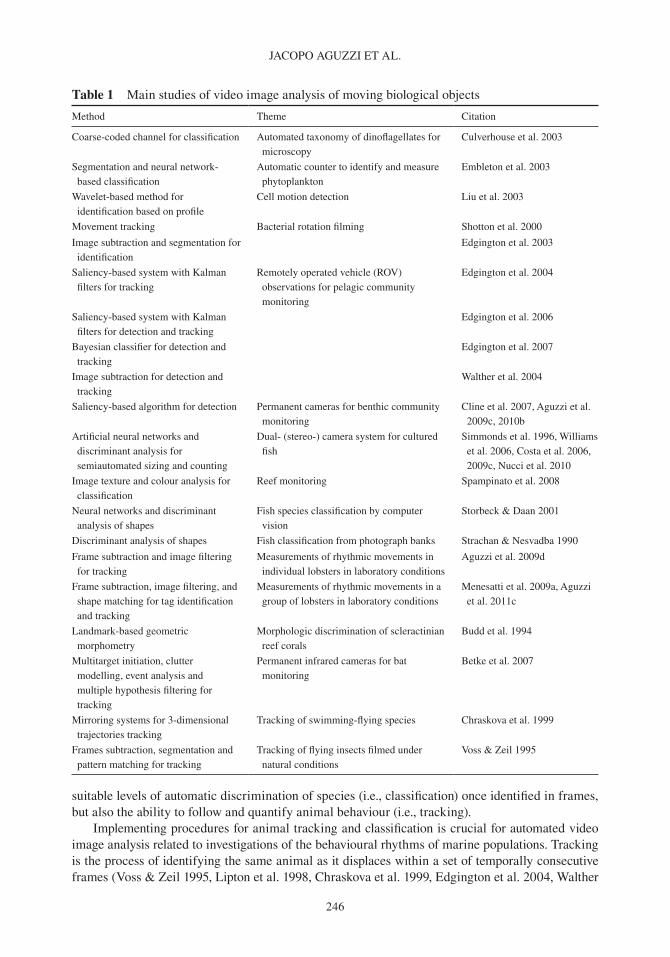
Since the 1990s, automated video- imaging techniques have been increasingly used to extract quantitative biological information for a wide variety of land and marine species (Table 1). This information includes not only the shape and the colour of organisms for the purpose of achieving
JACoPo AGuzzI ET Al.
246
suitable levels of automatic discrimination of species (i.e., classification) once identified in frames, but also the ability to follow and quantify animal behaviour (i.e., tracking).
Implementing procedures for animal tracking and classification is crucial for automated video image analysis related to investigations of the behavioural rhythms of marine populations. Tracking is the process of identifying the same animal as it displaces within a set of temporally consecutive frames (voss & zeil 1995, lipton et al. 1998, Chraskova et al. 1999, Edgington et al. 2004, walther
Table 1 Main studies of video image analysis of moving biological objects
Method Theme Citation
Coarse- coded channel for classification Automated taxonomy of dinoflagellates for microscopy
Culverhouse et al. 2003
Segmentation and neural network- based classification
Automatic counter to identify and measure phytoplankton
Embleton et al. 2003
wavelet- based method for identification based on profile
Cell motion detection liu et al. 2003
Movement tracking bacterial rotation filming Shotton et al. 2000
Image subtraction and segmentation for identification
Edgington et al. 2003
Saliency- based system with Kalman filters for tracking
Remotely operated vehicle (Rov) observations for pelagic community monitoring
Edgington et al. 2004
Saliency- based system with Kalman filters for detection and tracking
Edgington et al. 2006
bayesian classifier for detection and tracking
Edgington et al. 2007
Image subtraction for detection and tracking
walther et al. 2004
Saliency- based algorithm for detection Permanent cameras for benthic community monitoring
Cline et al. 2007, Aguzzi et al. 2009c, 2010b
Artificial neural networks and discriminant analysis for semiautomated sizing and counting
Dual- (stereo-) camera system for cultured fish
Simmonds et al. 1996, williams et al. 2006, Costa et al. 2006, 2009c, Nucci et al. 2010
Image texture and colour analysis for classification
Reef monitoring Spampinato et al. 2008
Neural networks and discriminant analysis of shapes
Fish species classification by computer vision
Storbeck & Daan 2001
Discriminant analysis of shapes Fish classification from photograph banks Strachan & Nesvadba 1990
Frame subtraction and image filtering for tracking
Measurements of rhythmic movements in individual lobsters in laboratory conditions
Aguzzi et al. 2009d
Frame subtraction, image filtering, and shape matching for tag identification and tracking
Measurements of rhythmic movements in a group of lobsters in laboratory conditions
Menesatti et al. 2009a, Aguzzi et al. 2011c
landmark- based geometric morphometry
Morphologic discrimination of scleractinian reef corals
budd et al. 1994
Multitarget initiation, clutter modelling, event analysis and multiple hypothesis filtering for tracking
Permanent infrared cameras for bat monitoring
betke et al. 2007
Mirroring systems for 3-dimensional trajectories tracking
Tracking of swimming- flying species Chraskova et al. 1999
Frames subtraction, segmentation and pattern matching for tracking
Tracking of flying insects filmed under natural conditions
voss & zeil 1995
CHAllENGES To ASSESSING bENTHIC PoPulATIoNS AND bIoDIvERSITy
247
et al. 2004). Classification is the grouping of each newly identified animal within a preestablished category, which is usually the species (Strachan & Nesvadba 1990, lipton et al. 1998, Dah- Jye et al. 2008). while tracking is critical for characterization of behavioural rhythms (i.e., the counting of indi-viduals over time), classification is necessary for the characterization of communities at a local scale.
Tracking procedures should be considered at different temporal scales in relation to two major aspects of animal behaviour (Aguzzi et al. 2009c,d, Menesatti et al. 2009a): (1) the average tem-poral presence of an organism in the field of view (Fov), according to its speed of displacement; and (2) the average time interval required by an organism to reoccur in the Fov, according to the periodicity of its behaviour rhythm. In relation to the first aspect, frame collection should be set at frequencies four to five times higher than the average probability of spotting a targeted organism in the Fov (Nyquist- Shannon frequency; Shannon 1949). Regarding the second aspect, video acquisi-tion has to be carried out over a temporal window encompassing several cycles (equivalent to the periodicity) in the fluctuation of a certain habitat driver to allow consistent and reliable time- series analysis (see the section ‘Multiparametric Measurements and Chronobiological Analytic Protocols for the Characterization of Ecosystem Functioning’). This requirement is particularly strong in field studies in which the measured rhythms are noisy due to the variable level of synchronism in the activities of all individuals constituting the population (Aguzzi et al. 2010a,b).
Depending on frame acquisition frequency, video- imaging techniques can be broadly subdi-vided in two major groups: ‘single frame’ (i.e., a collection of temporally isolated and still images, as in the case of ‘time- lapse photography’ [Sherman & Smith 2009] and ‘motion vision’, the con-tinuous acquisition of frames at 24 fps or more, conventionally known as ‘video footage’ [Aguzzi et al. 2010b]). In the first mode, the frequency of acquisition tends to be lower than the movement rate of animals, which implies that tracking cannot be performed, and only classification is achiev-able. In the motion vision mode, the frequency of image acquisition is usually higher than displace-ment velocity, and tracking of animals through consecutive frames can be carried out together with the computation of their trajectories of displacement. Frame interval should be chosen to match the expected movement rate of the species.
Estimation of local population abundances by video imaging is hindered by the problem of repeat counting of individuals as they move around in the Fov (Trenkel et al. 2004). one way of avoiding this problem is by estimating displacement trajectories and subsequently eliminating all initially counted individuals within the same frame set (Smith et al. 1993). video studies of behav-ioural rhythms of populations may produce biases in the estimation of counted individuals when trajectories are not considered. However, because those biases are constant throughout the sampling period, they do not mask inherent fluctuations in the individuals counted as a result of behavioural rhythms (Aguzzi et al. 2010b).
Having identified displacing animals in single frames, the problem reduces to tracking their displacement across a set of temporally consecutive frames. Assuming that an animal is already tracked in a temporally continuous group of frames, certain algorithms can be used to match the identified animal in a new frame, hence connecting it to the precedent trajectory. This assignment can be done by comparing an object’s position with its expected position for each event, extrapo-lated from its positions in the past with each object being assigned to the event that it matches best (Edgington et al. 2004). Computation of trajectories (spatial tracking) can be implemented using Kalman filters (Cline et al. 2007) as a group of mathematical equations providing an efficient and recursive solution to the method of minimum squares (lauritzen 1981). This solution allows com-puting an optimum statistical spatial estimation of an object at any time point. For this purpose, the available information at time t − 1 is updated with the information during the following t moment. Another algorithmic approach includes recursive bayesian filters (betke et al. 2007). This approach solves the problem of tracking a single object in an image sequence recursively by estimating the state s of the object in the current frame t, defined as s(t), based on its state in the previous frame, s(t − 1), and by filtering measurement x(t) in the current frame.
JACoPo AGuzzI ET Al.
248
Methods for the automated classification of tracked animals
Identification of individuals to species or classification is fundamental to the study of behavioural rhythms using automated video image analysis. The automated counting of individuals can be effi-ciently carried out only after a suitable level of efficiency in the pattern recognition of targeted spe-cies is achieved. Classification can be carried out by considering the outlines of animals (i.e., the profile given by the silhouette) or their colour and physical properties.
The ‘pattern recognition problem’ consists of determining a procedure that can assign each entity to its proper class based on its attributes. Automated systems for pattern recognition and classification are based on a supervised approach and, for this reason, should be tuned in their effi-ciency by a training process. This programming procedure consists of a ‘visual census’ performed by trained operators on a subset of data for the entities considered, with this subset referred to as the training set. Thus, a training set consists of entities characterized by a set of attributes that belong to known classes (Nieddu & Patrizi 2000). In the case of imaging products from cabled observato-ries, training sets are represented by a collection of selected images depicting the targeted species viewed from different angles (Aguzzi et al. 2011b).
Statistical tools for classification
Multivariate classification analyses can be generally divided into two main categories: unsupervised and supervised (Costa et al. 2011). For unsupervised techniques, grouping or clustering methods for multivariate elements (x- block) are based on functional relationships among these elements (i.e., dis-tances or variances). They do not require a priori knowledge of the class categories. by contrast, in supervised techniques, class attribution is provided by single or multiple variables (y- block). Thus, multivariate methods are forced to cluster into a priori established classes. unsupervised methods are mainly applied in an exploratory sense, when the aim is to analyse or visualize non- forced aggregating relationships (unsupervised) among elements.
Concerning supervised techniques, it is possible to distinguish two main analytical approaches: classification and modelling. Classification analysis requires a decision rule, referred to as the ‘clas-sification criterion’, to sort objects into classes based on selected quantitative features (Jayas et al. 2000). by contrast, in modelling, it is possible to attribute objects not only to one or more classes but also to none (i.e., in this case, the object is an outlier). Modelling techniques calculate the ‘prediction probability’ using a classification threshold for each modelled class (Costa et al. 2011). The modelling efficiency is indicated by statistical parameters, such as ‘sensitivity’ and ‘specificity’. Sensitivity rep-resents the percentage of the objects of a category accepted by the modelled class. Specificity is the percentage of objects different from the modelled classes that were rejected by the classification cri-terion. However, for classification, a matrix of correct classifications can be used (Costa et al. 2008b).
The choice of suitable statistics to treat the different categories of data (i.e., morphometric or colorimetric descriptors) represents an important step in the development of automated video image analysis. The many different algorithms that can be used for classification can be summarized into the following categories:
1. Probabilistic based:• Parametric: linear discriminant analysis (li & yuan 2004) and quadratic discriminant
analysis (wu et al. 1996)• Non- parametric: potential function (Pei & xie 1999)
2. Distance based: k nearest neighbour (KNN; Findik et al. 2010), soft independent modelling of class analogies (SIMCA; Aguzzi et al. 2009b) and partial least squares discriminant analysis (PlSDA; Costa et al. 2008b).
3. Experience based: support vector machine (Amit & boaz 2005) and artificial neural net-works (Costa et al. 2009c)
CHAllENGES To ASSESSING bENTHIC PoPulATIoNS AND bIoDIvERSITy
249
As stated by Mitchie et al. (1994, page 2): “Machine learning aims to generate classifying expressions simple enough to be understood easily by humans. They must mimic human reasoning sufficiently well to provide insight into the decision process”. Machine- learning approaches can be implemented by combining video- acquired morphological descriptors and multivariate statis-tics. Existing methods are based on random forest classifiers (i.e., an ensemble of decision trees, with each tree a computer- generated structure analogous to a dichotomous key) taken directly from descriptors (reviewed by lytle et al. 2010). In a random forest, each tree is constructed using a pro-cess that incorporates a random component to introduce variation amongst the trees.
The fuzzy logic approach in animals’ classification
In extreme environments such as the deep sea, where the wide range of animal diversity is often currently unexplained, the use of a fuzzy logic approach within object classification could return an interesting way of classifying new (not- yet- classified) objects in a trained guild. A fuzzy set is a set in which the elements have degrees of membership. An element of a fuzzy set can be full member, or a partial membership value can be assigned to an element that is no longer restricted only to two values, 0 or 1, but also any value in between (bahamon et al. 2009). Fuzzy systems have the capabil-ity of representing classification decisions explicitly in the form of fuzzy ‘if- then’ rules. Fuzzy sets allow the assignment of partial- and multiple- value memberships. Fuzzy systems use vague, impre-cise or uncertain information to generate simpler, more suitable models that are easier to handle and more familiar to human thinking. Concerning quantitative features for the automated classification of marine organisms, these classifications can be based on shape, colour, texture or a scale- invariant feature transform (SIFT) algorithm (see the next section).
Morphometric and colorimetric descriptors for automated animal classification
For quantitative image analysis (i.e., chromatic or hyperspectral derived) different elaborative steps finalized altogether to enhance the chromatic properties (contrast, equalization, amplification, denoising, smoothing, etc.) and to extract the relevant part of the image can be used to differenti-ate objects from the background (segmentation and thresholding). This procedure can be used to measure selected objects by morphometric, optical densing or texture mapping (bharati et al. 2004, lillholm et al. 2003, Huang & Dai 2003). Among the different features to be extracted and processed with image analysis tools, shape and colour are some of the most important and easy to extract.
The shape of a given animal can be automatically classified and assigned to a species by many different methods, including univariate techniques, such as fractal indices or ratios, or multivariate techniques, such as Fourier methods (Rohlf & Archie 1984). These tools allow the recognition of an organism through the fitting of its profile with a set of harmonic functions.
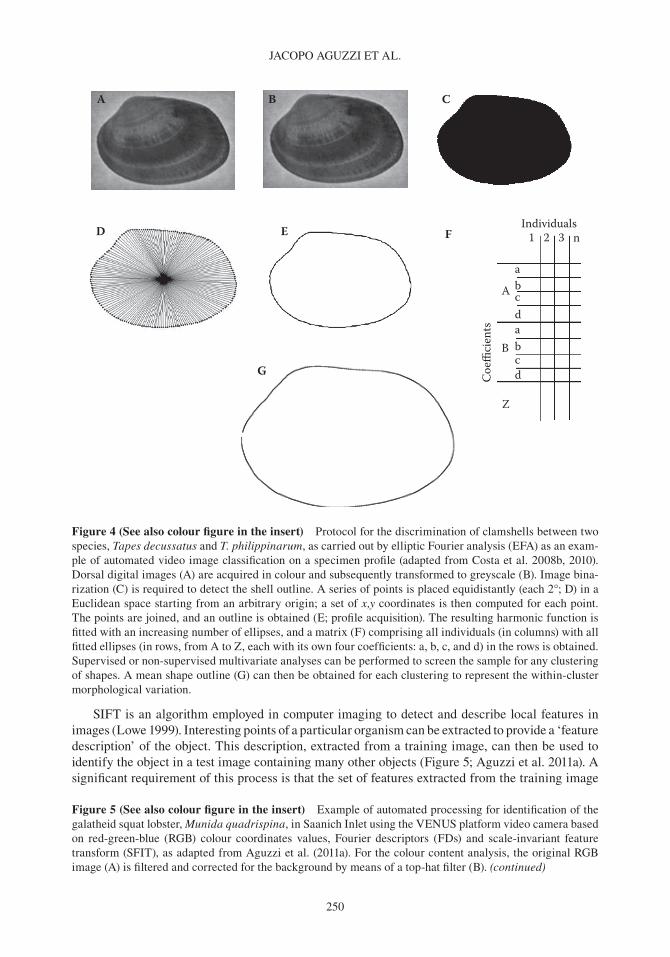
In elliptic Fourier analysis (EFA), the animal’s shape can be studied by profile digitization (Figure 4; Costa et al. 2009a, 2010, 2011). A set of points is automatically positioned along the outline in an equiangular or equidistant fashion. The contour is transformed into an incremental harmonic function when a set of x,y coordinates is computed for each point. That function is then fitted with a set of different ellipses to approximate its variation with the highest precision. At the end of the fitting process, each biological sample is represented by a set of ellipses, each of which has four coefficients. As a result, a matrix comprising all individuals with their respective ellipse coefficients can be obtained. This matrix is the input required for multivariate statistical analysis (Costa et al. 2011).
Fourier descriptors (FDs) are also employed for the automated recognition of tracked animals during the study of behavioural rhythms (Toth & Aach 2003, veeraraghavan et al. 2005). FDs can be utilized to describe the shape outline of a biological form in terms of its frequency variability (Aguzzi et al. 2009c). This description is obtained by fitting a set of circular harmonic functions, each with its own coefficients (the FDs), onto the outline of a newly tracked animal. by choosing the correct number of harmonics, it is possible to tune the precision of the outline approximation.
JACoPo AGuzzI ET Al.
250
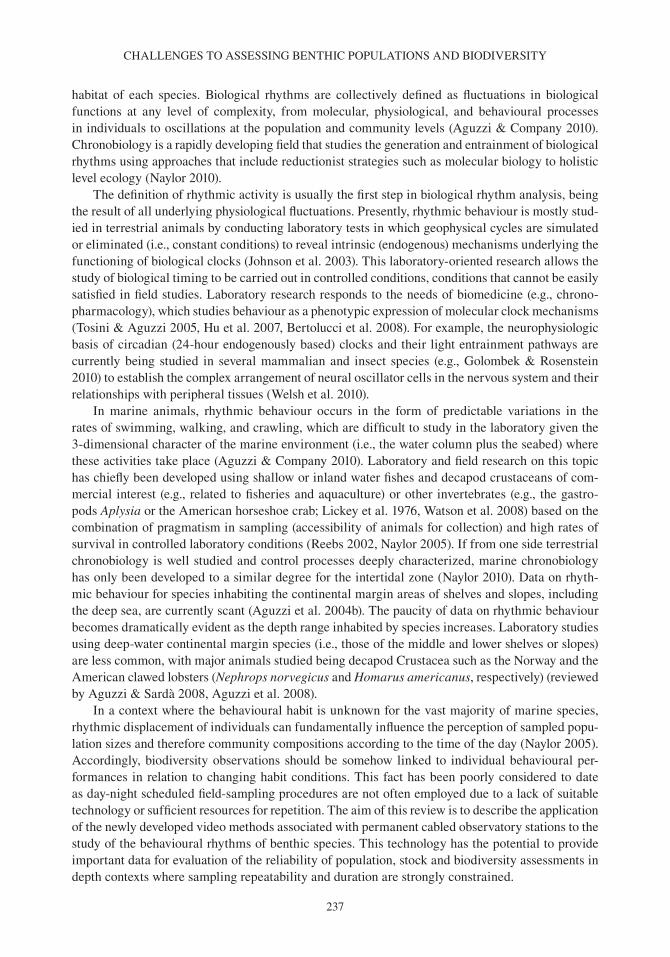
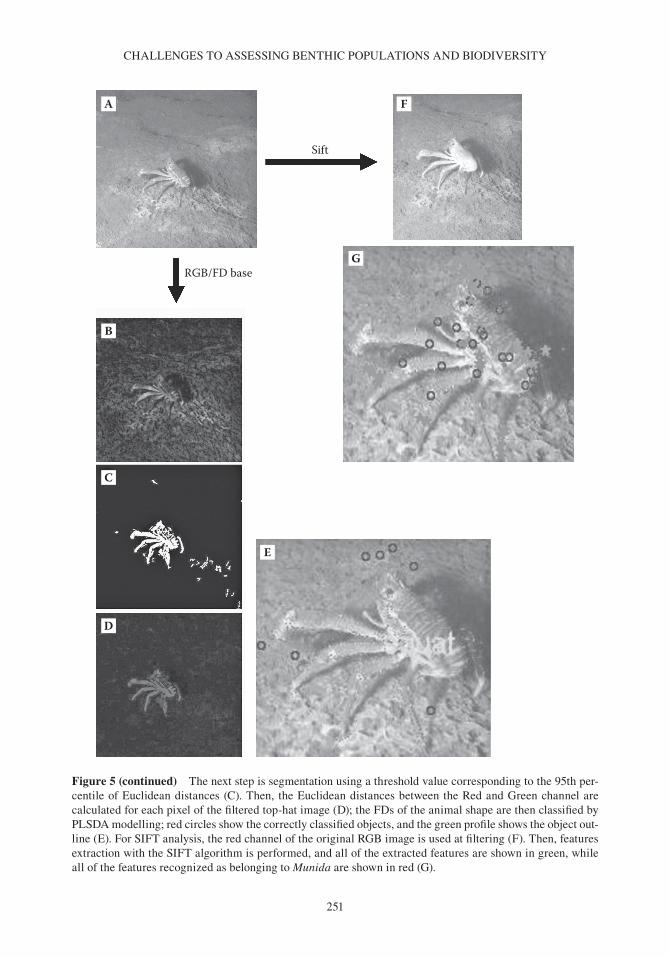
SIFT is an algorithm employed in computer imaging to detect and describe local features in images (lowe 1999). Interesting points of a particular organism can be extracted to provide a ‘feature description’ of the object. This description, extracted from a training image, can then be used to identify the object in a test image containing many other objects (Figure 5; Aguzzi et al. 2011a). A significant requirement of this process is that the set of features extracted from the training image
Figure 5 (See also colour figure in the insert) Example of automated processing for identification of the galatheid squat lobster, Munida quadrispina, in Saanich Inlet using the vENuS platform video camera based on red- green- blue (RGb) colour coordinates values, Fourier descriptors (FDs) and scale- invariant feature transform (SFIT), as adapted from Aguzzi et al. (2011a). For the colour content analysis, the original RGb image (A) is filtered and corrected for the background by means of a top- hat filter (b). (continued)
A B C
D E Individuals1 2 3 n
A
B
Z
abcdabcdCo
efficien
ts
F
G
Figure 4 (See also colour figure in the insert) Protocol for the discrimination of clamshells between two species, Tapes decussatus and T. philippinarum, as carried out by elliptic Fourier analysis (EFA) as an exam-ple of automated video image classification on a specimen profile (adapted from Costa et al. 2008b, 2010). Dorsal digital images (A) are acquired in colour and subsequently transformed to greyscale (b). Image bina-rization (C) is required to detect the shell outline. A series of points is placed equidistantly (each 2°; D) in a Euclidean space starting from an arbitrary origin; a set of x,y coordinates is then computed for each point. The points are joined, and an outline is obtained (E; profile acquisition). The resulting harmonic function is fitted with an increasing number of ellipses, and a matrix (F) comprising all individuals (in columns) with all fitted ellipses (in rows, from A to z, each with its own four coefficients: a, b, c, and d) in the rows is obtained. Supervised or non- supervised multivariate analyses can be performed to screen the sample for any clustering of shapes. A mean shape outline (G) can then be obtained for each clustering to represent the within- cluster morphological variation.
CHAllENGES To ASSESSING bENTHIC PoPulATIoNS AND bIoDIvERSITy
251
A F
GRGB/FD base
Sift
E
B
C
D
Figure 5 (continued) The next step is segmentation using a threshold value corresponding to the 95th per-centile of Euclidean distances (C). Then, the Euclidean distances between the Red and Green channel are calculated for each pixel of the filtered top-hat image (D); the FDs of the animal shape are then classified by PlSDA modelling; red circles show the correctly classified objects, and the green profile shows the object out-line (E). For SIFT analysis, the red channel of the original RGb image is used at filtering (F). Then, features extraction with the SIFT algorithm is performed, and all of the extracted features are shown in green, while all of the features recognized as belonging to Munida are shown in red (G).
JACoPo AGuzzI ET Al.
252
must be robust enough to allow efficient identification despite changes in image scale, noise, illumi-nation, and local geometric distortion. This method robustly identifies objects even under conditions of clutter and partial occlusion because the SIFT feature descriptor is invariant to scale, orientation, and affine distortion and is partially invariant to illumination changes (lytle et al. 2010).
Flow charts of image processing and animal classification for the study of population behavioural rhythms
Different automated video- imaging trials have been elaborated in the past few years when working with imaging products from cabled observatories in different continental margin areas. The proce-dure of image treatment at each video station necessarily requires the implementation of specific algorithms, due to different light levels in relation to artificial lighting conditions, as well as tur-bidity, fouling and substrate texture/heterogeneity. based on tracking and classification processes, general image treatment flow charts can be proposed for the automated processing of time series of images collected by cabled observatories (e.g., the Canadian vENuS [victoria Experimental Network under the Sea] in Saanich Inlet or the Japanese Sagami bay observatories at 103 and 1100 m depth, respectively; see the section ‘Networking of Seafloor Cabled observatories as a Tool for Future Predictive and Informative Studies’) to study population behavioural rhythms.
Colour features, numerically defined by coordinates in n- dimensional colour spaces, can be important descriptors for animal classification (bruno & Svoronos 2005). For example, in combina-tion with shape analysis, the RGb (red- green- blue) content of organisms can be added to increase recognition efficiency. Morphological classification can be then based on EFA, FD, SIFT, and FD plus RGb semiautomated procedures (Aguzzi et al. 2009c, 2010b, 2011a). Each tracked animal can be recognized based on its set of FDs and its average colour content coordinates (Figure 5; Aguzzi et al. 2011a). A library of manually supervised and classified images is required for each target spe-cies (Storbeck & Daan 2001, Culverhouse et al. 2003, Edgington et al. 2006). A subset of frames is chosen, and manual classification of animals is performed by a human observer through interac-tive scripts. Images of animals from different angles can be saved in a binary format to allow later morphometric comparisons and recognition. Moving animals are identified and assigned to species as preestablished categories by using multivariate supervised statistics, which allow constructing colorimetric and morphological models of reference (see the next section).
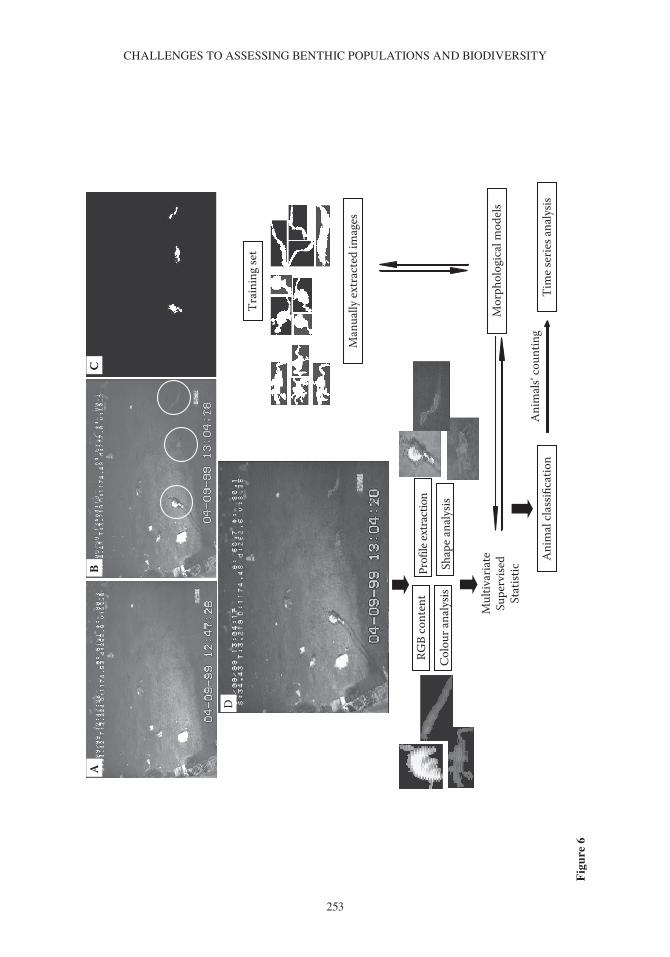
The acquired frames are processed for greyscale transformation and segmentation (i.e., bina-rization of the coloured image in black and white) (Figure 6A,b). Subsequent subtraction of consec-utive frames is then applied to detect all moving objects, and areal thresholding permits selecting object sizes of interest that correspond to the general body size of animals (Figure 6C). The profile of identified objects can then be superimposed on the original image according to an area that cor-responds to the animal’s body with its peculiar RGb coordinates (Figure 6D). both the animals’ profiles and their RGb contents can be subsequently classified by multivariate supervised statistics (i.e., KNN or PlSDA; reviewed by Costa et al. 2011) according to morphological models of refer-ence extracted from libraries of manually classified images (i.e., the training set).
Figure 6 (See also colour figure in the insert) Flow chart describing the processing of animal tracking and classification in automated video image analysis of digital videos obtained from the permanent deep- sea station of Sagami bay (1100 m depth, central Japan) (adapted from Aguzzi et al. 2009c). The identification of moving animals (within a circle: an eelpout; a red crab, Paralomis multispina; and finally a snail, Buccinum soyomaruae) occurs at frame subtraction (A – b) and after image binarization and area filtering (C; the removal of fouling allows identification of the animals’ shapes). At profile extraction (D), shapes and RGb content coordinates can be automatically processed for classification in relation to morphological models of reference (i.e., from a library of images as training set) by means of supervised multivariate statistics.
CHAllENGES To ASSESSING bENTHIC PoPulATIoNS AND bIoDIvERSITy
253
Trai
ning
set
Ani
mal
clas
sifica
tion
Mul
tivar
iate
Supe
rvise
dSt
atist
ic
Tim
e ser
ies a
naly
sis
AB
E
Mor
phol
ogic
al m
odel
s
Man
ually
extr
acte
d im
ages
D
Ani
mal
s’ co
untin
g
C
RGB
cont
ent
Colo
ur an
alys
is
Profi
le ex
tract
ion
Shap
e ana
lysis
Fig
ure
6
JACoPo AGuzzI ET Al.
254
Acoustic tracking as a complementary method to automated video imaging in investigations of the behaviour of marine species
A concern related to use of video imaging is that the lights necessary to acquire the images may influence the behaviour of the organisms being observed. widder et al. (2005) used red light to illuminate a scene and demonstrated differences in the fauna observed. The use of acoustic imaging may solve problems of photic contamination (i.e., lighting at moments of frame/footage acquisition) at depths below the twilight zone.
Active sonar sensors oriented vertically upwards from a seafloor observatory seem to present a scope similar to video cameras in relation to population behavioural rhythms. These instruments allow depiction of zooplankton and pelagic fish displacements within the pelagic environment (reviewed by lemon et al. 2007, Kaartvedt et al. 2009, borstad et al. 2010, Cox & borchers 2011). Horne et al. (2010) deployed the Deepwater Echo Integrating Marine observatory System (DEIMoS) with Simrad 38-kHz upward- looking sonar at a depth of 890 m in Monterey bay off the coast of California and recorded seasonal variability in diel migrations. borstad et al. (2010) recorded a 2-year time series using a 200-kHz system deployed in Saanich Inlet, british Columbia, and made major progress in the analysis and presentation of this type of large dataset, which was derived from a 0.3-Hz ping rate. The Deep- Sea long- term observatory System (DEloS) at 1500 m deep off Angola is not presently cabled, being retrieved yearly for data downloading (see the sec-tion ‘Networking of Seafloor Cabled observatories as a Tool for Future Predictive and Informative Studies’). This multiparametric platform is also equipped with Kongsberg high- resolution, 675-kHz scanning sonar oriented horizontally outward to a range of 150 m. This positioning enables track-ing movements of fishes and other targets around the observatory. Appropriately configured arrays can track whales in three dimensions, identifying different types of behaviours and feeding events (Nosal & Frazer 2007).
Acoustic technology in general does not allow ultimate species classification, although multiple emissions frequency and resulting echo- trace analysis (using frequency responses) can distinguish the sizes of moving animals, thus allowing some distinctions to be made (Petitgas et al. 2003, Jech & Michaels 2006, Reier Knudsen & larsson 2009). Acoustic video cameras could be used in the benthic environment to create high- resolution images of moving animals, similar to what can be done using video- imaging systems (Mueller et al. 2006). However, the problem of species classifi-cation on acoustic image products still remains. Acoustic imaging could efficiently replace video cameras only when targeted taxa show very different morphologies (i.e., without the requirement of distinction based on colour and its patterning) (boswell et al. 2008). Recent methodological improvements reached an acceptable level of acoustic classification with a reduced group of small fishes under laboratory controlled conditions (Roberts et al. 2011).
An alternative to optical methods for observing the behaviour of organisms is acoustic pas-sive and active tracking, together with the use of tags or transponders (Sarriá et al. 2011). As an example of this, the DEloS platform is equipped with passive listening devices (bagley et al. 2011). These sensors can detect sounds produced by crustaceans, fishes, and cetaceans. Individual fish can be tracked using ingestible transponders that are tracked by sonar mounted on an observa-tory platform (Priede & bagley 2000). using ingestible acoustic transmitters, Priede et al. (1994) detected seasonal changes in the swimming speeds of abyssal grenadier fishes in the north- eastern Pacific ocean. The global ocean Tracking Network (oTN; o’Dor et al. 2010) uses a chain of acous-tic observatories around the world to detect fishes with surgically implanted acoustic identity tags (o’Dor & Stokesbury 2009). using multiple observatories, oTN will be able to track mobile spe-cies throughout their annual or multiannual migration patterns. The data and power capabilities of cabled observatories are enabling great advances to be made in the application of acoustic methods to long- term time- series research.
CHAllENGES To ASSESSING bENTHIC PoPulATIoNS AND bIoDIvERSITy
255
Multiparametric measurements and chronobiological analytic protocols for the characterization of ecosystem functioning
The temporal functioning of continental margin and deep- sea communities according to habitat cycles at diel and seasonal scales is essentially unknown at present (barans et al. 2005, wagner et al. 2007). Reports on species presence and abundance from the deep ocean are too limited in both space and time mainly because of observational technological limitations (see the section ‘The Missing Chronobiology Framework in Marine Ecological Studies’). Marine species display rhyth-mic behaviours in response to geophysical cycles, and these responses affect observable populations during field sampling. This phenomenon influences population/stock and biodiversity assessments.
From descriptive to more cause- effect- based deep- water ecology
The integrated processing of biological and habitat information is a pending issue in continental margin ecology and represents one of the most promising ways to move beyond the current, chiefly descriptive, approach. The transition from descriptive to a more cause- effect- based marine research could be achieved by implementing the conceptual framework of integrated time- series analysis (Dickey & bidigare 2005, Kelly et al. 2010). Inspiration can be obtained, for example, from chrono-biology, which compares and integrates very different datasets involving behavioural, physiologi-cal, and molecular levels of complexity to study circadian clocks (yamada & Forger 2010).
The temporal regulation of physiological processes within a whole organism involves the clock- coordinated activities of oscillators in the central nervous system and in several peripheral tissues (Dibner et al. 2010, Harrington 2010). The centralized control of biological clocks over all biological rhythms in an animal’s body can be studied by characterizing the direction of flow of regulating information (yamazaki et al. 2000). This characterization can be methodologically approached by obtaining synchronic time series for different physiological or molecular indicators in different tissues and organs and by detecting the peaks of rhythms as markers of the activity of the oscilla-tor (Fukuhara et al. 2005). This type of comparison seeks anticipations and delays in the peaks of each oscillator in relation to each other, which could yield information on the direction of the flow of controlling information (Tosini & Aguzzi 2005). Similarly, in the case of multiparametric data acquisition from seafloor stations, time series of several habitat parameters should be compared and cross- checked to portray which incremental combination of such parameters causes a subsequent biological response (i.e., peaks in the counted individuals of a given population).
The statistical tools required for such analyses are already available in commercial chronobio-logical software applications used to describe rhythms statistically at molecular, physiological and behavioural level (e.g., Aguzzi & Chiesa 2005, Aguzzi et al. 2006b, Tosini et al. 2007). However, further development is needed for these tools to become more user friendly and to fully satisfy the needs of biological and habitat data multiparametric analyses in field study of populations, that is, in terms of applying automated sequential steps for data preprocessing (i.e., filtering; see next section) and consequent time- series analysis.
Integrated waveform analysis as a protocol for multiparametric data treatment
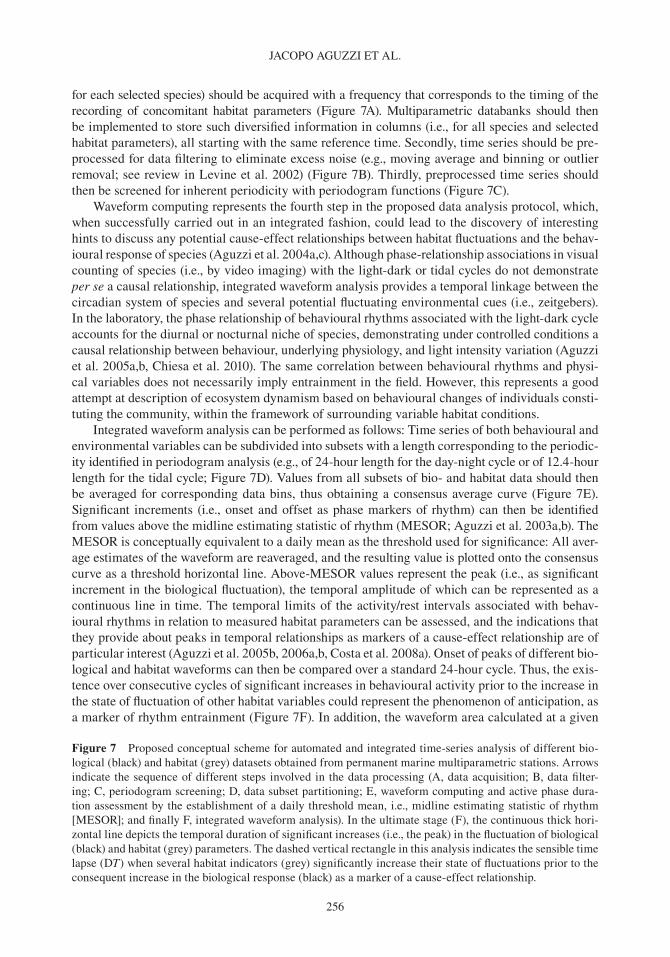
A general protocol for the automatic and integrated treatment of bio- and habitat data can be pro-posed (Figure 7) according to the principle of anticipation and delay as a marker of cause- effect rela-tionships between habitat fluctuations (i.e., the cause) and consequent population rhythms (i.e., the effect). Firstly, time series of biological observations (i.e., the number of video- counted individuals
JACoPo AGuzzI ET Al.
256
for each selected species) should be acquired with a frequency that corresponds to the timing of the recording of concomitant habitat parameters (Figure 7A). Multiparametric databanks should then be implemented to store such diversified information in columns (i.e., for all species and selected habitat parameters), all starting with the same reference time. Secondly, time series should be pre-processed for data filtering to eliminate excess noise (e.g., moving average and binning or outlier removal; see review in levine et al. 2002) (Figure 7b). Thirdly, preprocessed time series should then be screened for inherent periodicity with periodogram functions (Figure 7C).
waveform computing represents the fourth step in the proposed data analysis protocol, which, when successfully carried out in an integrated fashion, could lead to the discovery of interesting hints to discuss any potential cause- effect relationships between habitat fluctuations and the behav-ioural response of species (Aguzzi et al. 2004a,c). Although phase- relationship associations in visual counting of species (i.e., by video imaging) with the light- dark or tidal cycles do not demonstrate per se a causal relationship, integrated waveform analysis provides a temporal linkage between the circadian system of species and several potential fluctuating environmental cues (i.e., zeitgebers). In the laboratory, the phase relationship of behavioural rhythms associated with the light- dark cycle accounts for the diurnal or nocturnal niche of species, demonstrating under controlled conditions a causal relationship between behaviour, underlying physiology, and light intensity variation (Aguzzi et al. 2005a,b, Chiesa et al. 2010). The same correlation between behavioural rhythms and physi-cal variables does not necessarily imply entrainment in the field. However, this represents a good attempt at description of ecosystem dynamism based on behavioural changes of individuals consti-tuting the community, within the framework of surrounding variable habitat conditions.
Integrated waveform analysis can be performed as follows: Time series of both behavioural and environmental variables can be subdivided into subsets with a length corresponding to the periodic-ity identified in periodogram analysis (e.g., of 24-hour length for the day- night cycle or of 12.4-hour length for the tidal cycle; Figure 7D). values from all subsets of bio- and habitat data should then be averaged for corresponding data bins, thus obtaining a consensus average curve (Figure 7E). Significant increments (i.e., onset and offset as phase markers of rhythm) can then be identified from values above the midline estimating statistic of rhythm (MESoR; Aguzzi et al. 2003a,b). The MESoR is conceptually equivalent to a daily mean as the threshold used for significance: All aver-age estimates of the waveform are reaveraged, and the resulting value is plotted onto the consensus curve as a threshold horizontal line. Above- MESoR values represent the peak (i.e., as significant increment in the biological fluctuation), the temporal amplitude of which can be represented as a continuous line in time. The temporal limits of the activity/rest intervals associated with behav-ioural rhythms in relation to measured habitat parameters can be assessed, and the indications that they provide about peaks in temporal relationships as markers of a cause- effect relationship are of particular interest (Aguzzi et al. 2005b, 2006a,b, Costa et al. 2008a). onset of peaks of different bio-logical and habitat waveforms can then be compared over a standard 24-hour cycle. Thus, the exis-tence over consecutive cycles of significant increases in behavioural activity prior to the increase in the state of fluctuation of other habitat variables could represent the phenomenon of anticipation, as a marker of rhythm entrainment (Figure 7F). In addition, the waveform area calculated at a given
Figure 7 Proposed conceptual scheme for automated and integrated time- series analysis of different bio-logical (black) and habitat (grey) datasets obtained from permanent marine multiparametric stations. Arrows indicate the sequence of different steps involved in the data processing (A, data acquisition; b, data filter-ing; C, periodogram screening; D, data subset partitioning; E, waveform computing and active phase dura-tion assessment by the establishment of a daily threshold mean, i.e., midline estimating statistic of rhythm [MESoR]; and finally F, integrated waveform analysis). In the ultimate stage (F), the continuous thick hori-zontal line depicts the temporal duration of significant increases (i.e., the peak) in the fluctuation of biological (black) and habitat (grey) parameters. The dashed vertical rectangle in this analysis indicates the sensible time lapse (DT) when several habitat indicators (grey) significantly increase their state of fluctuations prior to the consequent increase in the biological response (black) as a marker of a cause- effect relationship.
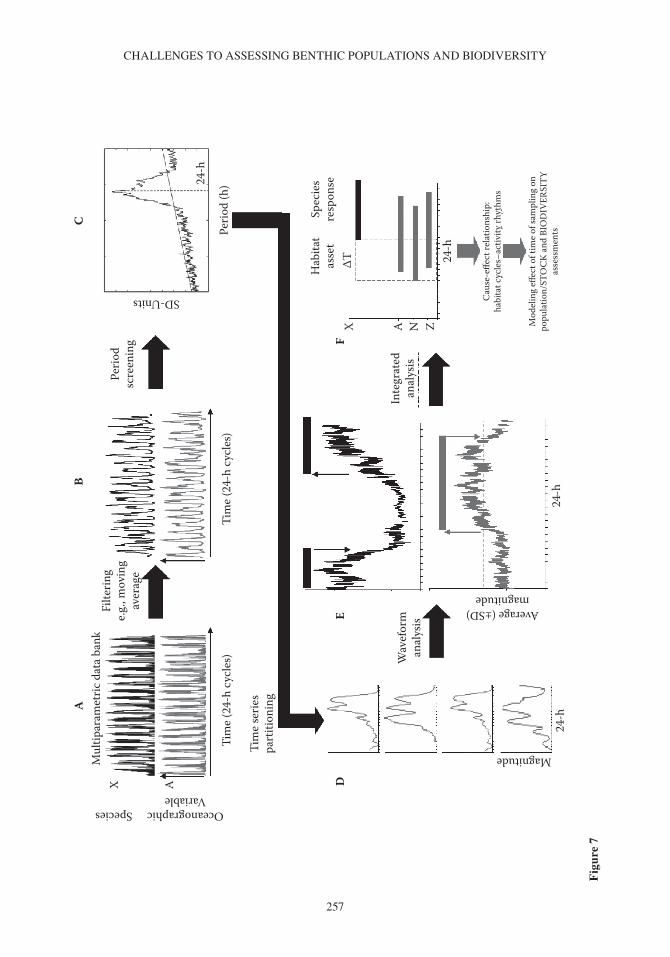
CHAllENGES To ASSESSING bENTHIC PoPulATIoNS AND bIoDIvERSITy
257
Mul
tipar
amet
ric d
ata
bank
A
DE
F
Tim
e (2
4-h
cycl
es)
Tim
e se
ries
part
ition
ing
Tim
e (2
4-h
cycl
es)
Wav
efor
man
alys
is
Inte
grat
edan
alys
is
Cau
se-e
ffect
rela
tions
hip:
habi
tat c
ycle
s–ac
tivity
rhyt
hms
Average (±SD)magnitude
Magnitude
Mod
elin
g eff
ect o
f tim
e of
sam
plin
g on
popu
latio
n/ST
OC
K a
nd B
IOD
IVER
SIT
Yas
sess
men
ts
Hab
itat
asse
tSp
ecie
sre
spon
se
Perio
d (h
)
X
Species OceanographicVariable
A
AX∆
T 24-h
24-h
24-h
24-h
N Z
SD-Units
BC
Filte
ring
e.g.
, mov
ing
aver
age
Peri
odsc
reen
ing
Fig
ure
7
JACoPo AGuzzI ET Al.
258
time interval can be used to estimate the amount of activity related to any endogenous or exogenous component regulating behavioural rhythms (Chiesa et al. 2005, Anglès et al. 2006).
Networking of seafloor cabled observatories as a tool for future predictive and informative studies
Seafloor cabled observatory video studies on the behavioural rhythms of animal populations pro-vide an important source of data for modelling variability in sampling related to these rhythms responding to changeable habitat conditions (Aguzzi et al. 2010a). Regardless of their quantifica-tion efficiency, local direct population and biodiversity estimations using video methods should be undertaken very cautiously. Derived animal counts should not be extrapolated to population demography given the overly geographically localized character of the observations. Also, a lack of records for a given species does not imply its absence within a geographical area (barans et al. 2005) as such records are challenged by remote video observations using food (i.e., bait) attractors (e.g., Cappo et al. 2004). For example, abyssal demersal fishes can be observed using free- fall lander technology, as they can be actively attracted to bait placed within view of seafloor cameras (Priede & bagley 2000).
Accordingly, data from a permanent video cabled observatory can only assist in understanding how temporal biases in population/stock and biodiversity assessments may occur if the timing of sam-pling is not considered. In the future, increasing knowledge about the behavioural rhythms of deep- water species and their modulation based on geophysical cycles will be of great value to researchers in modelling such biases in other sampling methods, such as trawling (barans et al. 2005).
Spatial coverage of existing or planned cabled observatory networks
Presently, insufficient spatial coverage greatly biases any potential estimate of population demogra-phy and local biodiversity in continental margin areas (Coll et al. 2010). The easiest solution to this problem would be increasing the number of observational sites and the length of monitoring periods in a given area. An interesting opportunity for extending the currently limited underwater monitor-ing capability in terms of both space and time is presented by the creation of networks of permanent multisensor cabled seafloor observatories, deployed from coastal areas to abyssal plains. Although at the present state of technological development this objective is not realistic in the short term, the increase in the number of these platforms represents a real future opportunity to perform prolonged observations in a wide range of habitat conditions (beranzoli et al. 2002, Favali & beranzoli 2006, Favali et al. 2006a,b, Frugoni et al. 2006, Mànuel et al. 2010).
A sustained stream of high- quality interdisciplinary data on the marine environment associated with appropriate sampling is being acquired to study biological, geological and oceanographic inter-linked phenomena (lampitt et al. 2010). Network configurations are particularly suitable for disci-plines that require real- time integration of different submarine nodes deployed over large areas. Several countries and consortia have started long- term multiparametric monitoring initiatives by installing individual or networks of permanent and integrated cabled observatories (Table 2 lists marine multi-parametric cabled seafloor observatories bearing video cameras) for a variety of purposes over large geographic areas (Favali et al. 2006a, 2010, Favali & beranzoli 2009). Although ecological discovery and ecosystem biomonitoring are not prime targets of these observatories, they often include associ-ate science components that could quite easily host the type of research under consideration here. Countries currently driving large international programmes aimed at creating underwater permanent cabled installations networks are Japan, Europe, the united States, and Canada.
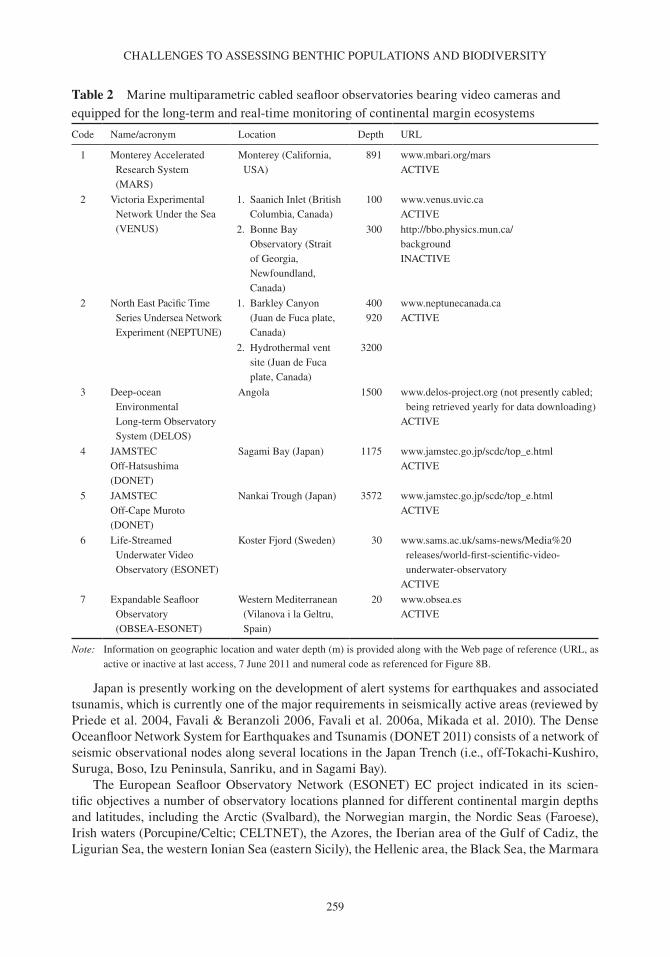
CHAllENGES To ASSESSING bENTHIC PoPulATIoNS AND bIoDIvERSITy
259
Japan is presently working on the development of alert systems for earthquakes and associated tsunamis, which is currently one of the major requirements in seismically active areas (reviewed by Priede et al. 2004, Favali & beranzoli 2006, Favali et al. 2006a, Mikada et al. 2010). The Dense oceanfloor Network System for Earthquakes and Tsunamis (DoNET 2011) consists of a network of seismic observational nodes along several locations in the Japan Trench (i.e., off- Tokachi- Kushiro, Suruga, boso, Izu Peninsula, Sanriku, and in Sagami bay).
The European Seafloor observatory Network (ESoNET) EC project indicated in its scien-tific objectives a number of observatory locations planned for different continental margin depths and latitudes, including the Arctic (Svalbard), the Norwegian margin, the Nordic Seas (Faroese), Irish waters (Porcupine/Celtic; CElTNET), the Azores, the Iberian area of the Gulf of Cadiz, the ligurian Sea, the western Ionian Sea (eastern Sicily), the Hellenic area, the black Sea, the Marmara
Table 2 Marine multiparametric cabled seafloor observatories bearing video cameras and equipped for the long- term and real- time monitoring of continental margin ecosystems
Code Name/acronym location Depth uRl
1 Monterey Accelerated Research System (MARS)
Monterey (California, uSA)
891 www.mbari.org/marsACTIvE
2 victoria Experimental Network under the Sea (vENuS)
1. Saanich Inlet (british Columbia, Canada)
100 www.venus.uvic.caACTIvE
2. bonne bay observatory (Strait of Georgia, Newfoundland, Canada)
300 http://bbo.physics.mun.ca/backgroundINACTIvE
2 North East Pacific Time Series undersea Network Experiment (NEPTuNE)
1. barkley Canyon (Juan de Fuca plate, Canada)
400920
www.neptunecanada.caACTIvE
2. Hydrothermal vent site (Juan de Fuca plate, Canada)
3200
3 Deep- ocean Environmental long- term observatory System (DEloS)
Angola 1500 www.delos- project.org (not presently cabled; being retrieved yearly for data downloading)
ACTIvE
4 JAMSTEC off- Hatsushima(DoNET)
Sagami bay (Japan) 1175 www.jamstec.go.jp/scdc/top_e.htmlACTIvE
5 JAMSTECoff- Cape Muroto(DoNET)
Nankai Trough (Japan) 3572 www.jamstec.go.jp/scdc/top_e.htmlACTIvE
6 life- Streamed underwater video observatory (ESoNET)
Koster Fjord (Sweden) 30 www.sams.ac.uk/sams- news/ Media%20releases/world- first- scientific- video- underwater- observatory
ACTIvE
7 Expandable Seafloor observatory (obSEA- ESoNET)
western Mediterranean (vilanova i la Geltru, Spain)
20 www.obsea.esACTIvE
Note: Information on geographic location and water depth (m) is provided along with the web page of reference (uRl, as active or inactive at last access, 7 June 2011 and numeral code as referenced for Figure 8b.
JACoPo AGuzzI ET Al.
260
Sea, and the Canary Islands (PloCAN; Platforma oceánica de CANarias) (Favali et al. 2010). The large- scale research infrastructure European Multidisciplinary Seafloor observatory (EMSo 2011) forms part of the European Strategy Forum on Research Infrastructures (ESFRI 2011) road map and intends to develop permanent nodes of the underwater network at these sites. within the central Mediterranean, aims are related to geophysical and oceanographic applications and to the capture by means of photomultiplier tubes of neutrinos crossing Earth (Amram et al. 2000, Priede et al. 2008, Ageron et al. 2009, Aguilar et al. 2010, Favali et al. 2011). In particular, the western Ionian Sea cabled node of EMSo manages a variety of different instruments covering the scientific fields of geophysics, physical oceanography and bioacoustics (Favali et al. 2006a, 2011), acquiring the data in real time. In the future, it is planned to host video cameras at these locations.
off the coast of the united States of America, video cabled platforms are fully operative in the deep- water Californian margin (e.g., the Eye- in- the- Sea [EITS], http://www.mbari.org/earth/mar_tech/EITS/eits_live.html, from the Monterey Accelerated Research System [MARS]; see Table 2). other platforms that could also be easily equipped with cameras are the shallow- water Martha’s vineyard Coastal observatory (MvCo 2011) of Massachusetts’ Katama Air Park and the long- Term Environmental observatory (lEo 2011) of New Jersey. The united States is also promoting the complex ooI (2011), based initially on the deployment of permanent oceanographic buoys in the years from 2010 to 2014, which could be used in future for the deployment of cabled observatories.
NEPTuNE (North East Pacific Time Series undersea Network Experiment) Canada (NC; see Table 2) is an operating cabled regional network across the Juan de Fuca plate in the north- eastern Pacific off vancouver Island, british Columbia (barnes et al. 2008), which is part of the ocean Networks Canada observatory. The system now provides the continuous power and bandwidth to collect integrated data on physical, chemical, geological, and biological gradients at temporal resolutions relevant to the dynamics of the earth- ocean system. The location of this system over an entire tectonic plate provides a unique setting in which to study the influence of geological, physical, and tectonic processes on species dynamics and biodiversity in a comprehensive manner at temporal scales ranging from minutes to decades. Furthermore, that network encompasses a high diversity of ecosystems, including a coastal embayment (with both hard- ground and soft- bottom environments), the continental slope, a marine canyon, methane hydrate fields, and an abyssal plain with hydrothermal vents. The scientific outputs of the network will be easily applicable to other locations in the world ocean. The NC regional network is currently equipped with six video camera systems located at depths ranging from 20 to 980 m, and two additional systems were deployed in 2011 at hydrothermal vents on the Endeavour segment of the Juan de Fuca Ridge, at a depth of about 2190 m. These cameras are operated through a web interface available anywhere on the planet, and videos are freely accessible and available for download through the NC web site (NEPTuNE 2011).
Although, in several cases, the primary target of observatory deployment is not image acqui-sition, presently installed nodes potentially represent a powerful laboratory for investigating the modulation of behavioural rhythms of local animal populations correlated with geophysical cycles (and events), such as those involving annual formations of water masses, light intensity fluctua-tions, and internal tides or inertial currents. because of differences in geographic location, detected rhythms ultimately respond to local latitude, oceanographic setting, water depth, seafloor morphol-ogy, and the likely effects of climate change associated with global warming (Canals et al. 2006, Somot et al. 2006).
The acquisition of biological data using video- imaging systems will likely become more wide-spread with the development of seafloor observatory technology and networking. Multidisciplinary data acquisition is not currently being conducted using standardized protocols of reference; this lack of standardization inhibits interdisciplinary analysis, as will be required, for example, to improve geohazard warning and to evaluate the influences of climate change and anthropogenic impacts (Ruhl et al. 2011). Consequently, the scientific community is in urgent need of standard protocols to
CHAllENGES To ASSESSING bENTHIC PoPulATIoNS AND bIoDIvERSITy
261
acquire biological and habitat data with these platforms in different areas of the planet, to provide a global understanding of the dynamics of marine ecosystems, and to predict their evolution in the context of changing oceans.
Future issues to address in the use of cabled observatory technology
with the increase in the number of cabled video observatories, the efficiency of automated image processing (i.e., biodata), and the integration of biological and habitat data analysis, it will be possible to undertake a series of studies of general interest within the context of novel ocean observ-ing framework topics (Integrated Framework for Sustained ocean observing [IFSoo] 2011).
Ecosystem dynamic functioning in areas with geophysical cycles of conflicting periodicity
In the near future, the use of video observation networks should allow for the study of the oceano-graphic modulation of behavioural rhythms in species with a wide distribution range, which are thus subjected to different combinations of day- night, internal tidal or inertial current cycles. within the twilight zone, the light intensity cycle varies as a function of depth and latitude, the latter acting through the poleward decrease in angle of elevation of the sun (Fraenkel 1986).
Day- night shifts in seabed- living or demersal communities are found at continental margin depths within the twilight zone stratum at all latitudes from the tropical to polar regions, such as off Antarctica (Kaufmann et al. 2003). Studies based on temporally scheduled trawling along continen-tal slopes, rises, and abyssal plains show that day- night variations in catches resulting from species’ behavioural rhythms are widespread, showing great potential for installation of video observatories (Figure 8A). At the same time, complex propagation patterns of internal tidal waves may occur due to the effect of seafloor topography (Figure 8b) (Garrett 2003, Garrett & Kunze 2007), which would lead to the occurrence of semi- diurnal or inertial behavioural rhythms in populations (wagner et al. 2007, Aguzzi et al. 2010b).
From a global perspective, the deployment of an integrated network of permanent video obser-vatories is fully justified for the purpose of understanding geographic differences in community responses under mixed day- night, internal tidal, and inertial regimes. observatories located in shelf and slope areas, where productivity is generally low and transparency high, are particularly well suited for the study of diel and seasonal behavioural rhythms. other observatories in the almost- tideless, oligotrophic Mediterranean Sea represent excellent platforms for the study of day- night- based community rhythms (reviewed by Aguzzi et al. 2009e).
by contrast, remote monitoring by observatory sites within coastal turbid areas (including estu-aries) may not be as useful because of inherent difficulties in tracking animals and classifying them in poor visibility or when fouling occurs (Aguzzi et al. 2009c). other observatories located in ocean areas associated with strong tidal motion could be used to identify community responses to water speed increases, irrespective of the level of sunlight exposure. Furthermore, deeper observatories in the Mediterranean basin may facilitate the investigation of behavioural rhythms correlated with geophysical cycles involving water displacement that are much weaker than those produced by internal tides, such as atmospherically driven deep- water inertial currents with an 18-hour periodic-ity (reviewed by Aguzzi et al. 2009d).
The role of large diel nektobenthic and benthopelagic migrations in the indirect day- night regulation of deep- sea ecosystems
The implementation of integrated permanent video observation networks should be useful for study-ing how the behavioural rhythms of continental margin species act as regulators of ecosystem func-tioning in different depth strata. Species receiving day- night- based light intensity entrainment in superficial depth strata may influence the functioning of deeper ecosystems in aphotic continental
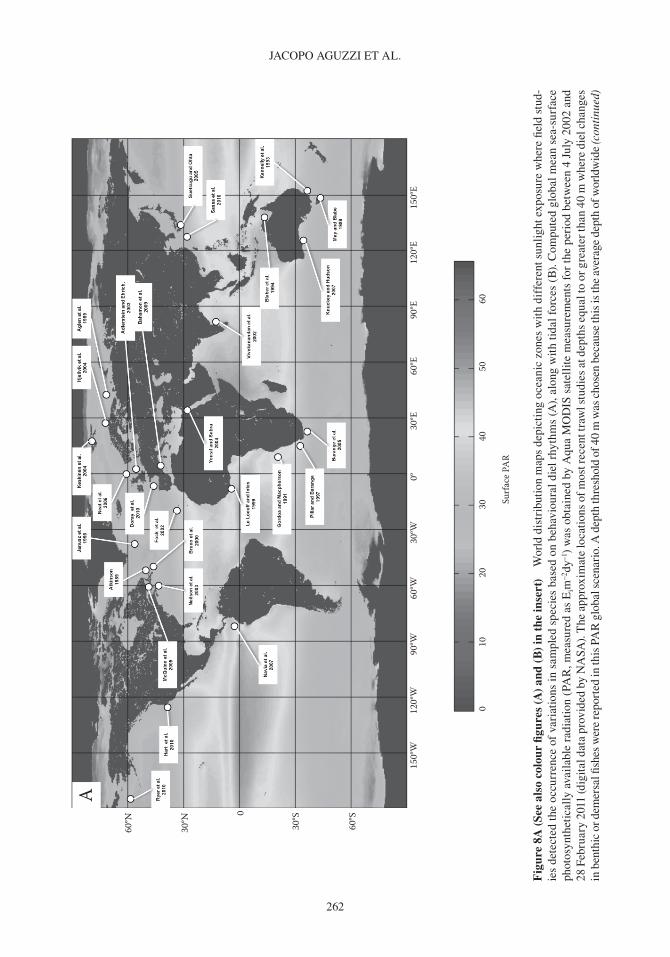
JACoPo AGuzzI ET Al.
262
A
60º N
30º N
30º S
60º S
150º
W12
0ºW
90º W
60º W
30º W
30º E
60º E
90º E
120º
E15
0ºE
0
0º
010
2030
4050
60
Surfa
ce P
AR
Fig
ure
8A (S
ee a
lso
colo
ur fi
gure
s (A
) an
d (B
) in
the
inse
rt)
wor
ld d
istr
ibut
ion
map
s de
pict
ing
ocea
nic
zone
s w
ith
diff
eren
t sun
ligh
t exp
osur
e w
here
fiel
d st
ud-
ies
dete
cted
the
occ
urre
nce
of v
aria
tion
s in
sam
pled
spe
cies
bas
ed o
n be
havi
oura
l die
l rhy
thm
s (A
), a
long
wit
h ti
dal f
orce
s (b
). C
ompu
ted
glob
al m
ean
sea-
surf
ace
phot
osyn
thet
ical
ly a
vail
able
rad
iati
on (
PAR
, mea
sure
d as
Eim
–2dy
–1)
was
obt
aine
d by
Aqu
a M
oD
IS s
atel
lite
mea
sure
men
ts f
or t
he p
erio
d be
twee
n 4
July
200
2 an
d 28
Feb
ruar
y 20
11 (d
igit
al d
ata
prov
ided
by
NA
SA).
The
app
roxi
mat
e lo
cati
ons
of m
ost r
ecen
t tra
wl s
tudi
es a
t dep
ths
equa
l to
or g
reat
er th
an 4
0 m
whe
re d
iel c
hang
es
in b
enth
ic o
r dem
ersa
l fish
es w
ere
repo
rted
in th
is P
AR
glo
bal s
cena
rio.
A d
epth
thre
shol
d of
40
m w
as c
hose
n be
caus
e th
is is
the
aver
age
dept
h of
wor
ldw
ide
(con
tinu
ed)
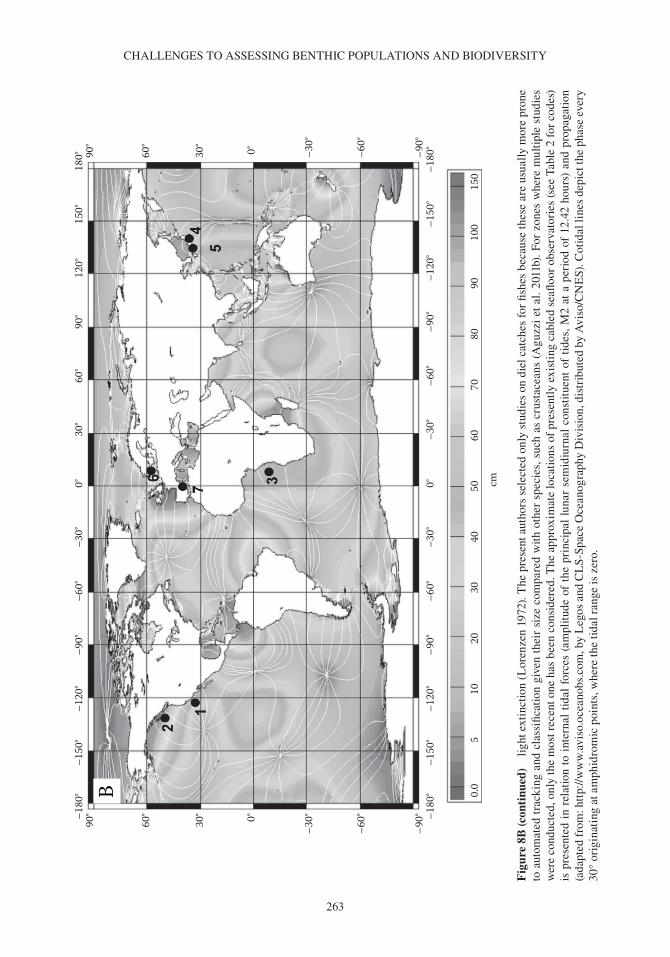
CHAllENGES To ASSESSING bENTHIC PoPulATIoNS AND bIoDIvERSITy
263
cm0.0
–180
°–1
80°
–150
°–1
50°
–120
°–1
20°
–90°
–90°
–60°
–60°
–30°
–30°
0°
–180
°18
0°–1
50°
90°
60°
30°
–30°
–60°
–90°0°
90°
60°
30°
–30°
–60°
–90°
0°
150°
–120
°12
0°–9
0°90
°–6
0°60
°–3
0°30
°0°
510
2030
4050
6070
8090
100
150
B
Fig
ure
8B (c
onti
nued
) li
ght e
xtin
ctio
n (l
oren
zen
1972
). T
he p
rese
nt a
utho
rs s
elec
ted
only
stu
dies
on
diel
cat
ches
for
fish
es b
ecau
se th
ese
are
usua
lly
mor
e pr
one
to a
utom
ated
tra
ckin
g an
d cl
assi
ficat
ion
give
n th
eir
size
com
pare
d w
ith
othe
r sp
ecie
s, s
uch
as c
rust
acea
ns (
Agu
zzi
et a
l. 20
11b)
. For
zon
es w
here
mul
tipl
e st
udie
s w
ere
cond
ucte
d, o
nly
the
mos
t rec
ent o
ne h
as b
een
cons
ider
ed. T
he a
ppro
xim
ate
loca
tion
s of
pre
sent
ly e
xist
ing
cabl
ed s
eaflo
or o
bser
vato
ries
(see
Tab
le 2
for
cod
es)
is p
rese
nted
in
rela
tion
to
inte
rnal
tid
al f
orce
s (a
mpl
itud
e of
the
pri
ncip
al l
unar
sem
idiu
rnal
con
stit
uent
of
tide
s, M
2 at
a p
erio
d of
12.
42 h
ours
) an
d pr
opag
atio
n (a
dapt
ed f
rom
: htt
p://w
ww
.avi
so.o
cean
obs.
com
, by
leg
os a
nd C
lS
- Spa
ce o
cean
ogra
phy
Div
isio
n, d
istr
ibut
ed b
y A
viso
/CN
ES)
. Cot
idal
line
s de
pict
the
phas
e ev
ery
30°
orig
inat
ing
at a
mph
idro
mic
poi
nts,
whe
re th
e ti
dal r
ange
is z
ero.
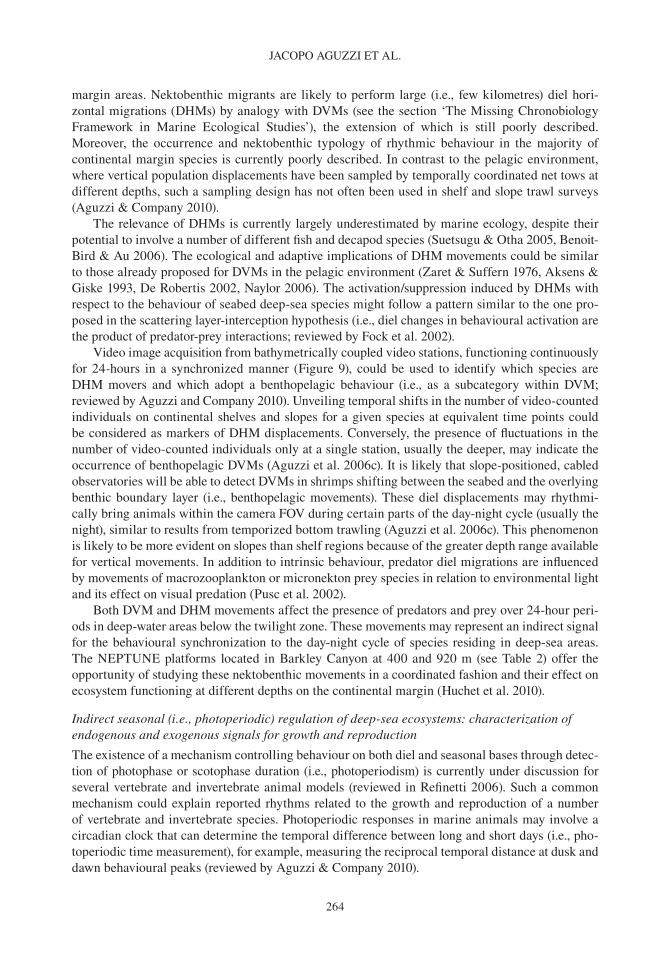
JACoPo AGuzzI ET Al.
264
margin areas. Nektobenthic migrants are likely to perform large (i.e., few kilometres) diel hori-zontal migrations (DHMs) by analogy with DvMs (see the section ‘The Missing Chronobiology Framework in Marine Ecological Studies’), the extension of which is still poorly described. Moreover, the occurrence and nektobenthic typology of rhythmic behaviour in the majority of continental margin species is currently poorly described. In contrast to the pelagic environment, where vertical population displacements have been sampled by temporally coordinated net tows at different depths, such a sampling design has not often been used in shelf and slope trawl surveys (Aguzzi & Company 2010).
The relevance of DHMs is currently largely underestimated by marine ecology, despite their potential to involve a number of different fish and decapod species (Suetsugu & otha 2005, benoit- bird & Au 2006). The ecological and adaptive implications of DHM movements could be similar to those already proposed for DvMs in the pelagic environment (zaret & Suffern 1976, Aksens & Giske 1993, De Robertis 2002, Naylor 2006). The activation/suppression induced by DHMs with respect to the behaviour of seabed deep- sea species might follow a pattern similar to the one pro-posed in the scattering layer- interception hypothesis (i.e., diel changes in behavioural activation are the product of predator- prey interactions; reviewed by Fock et al. 2002).
video image acquisition from bathymetrically coupled video stations, functioning continuously for 24-hours in a synchronized manner (Figure 9), could be used to identify which species are DHM movers and which adopt a benthopelagic behaviour (i.e., as a subcategory within DvM; reviewed by Aguzzi and Company 2010). unveiling temporal shifts in the number of video- counted individuals on continental shelves and slopes for a given species at equivalent time points could be considered as markers of DHM displacements. Conversely, the presence of fluctuations in the number of video- counted individuals only at a single station, usually the deeper, may indicate the occurrence of benthopelagic DvMs (Aguzzi et al. 2006c). It is likely that slope- positioned, cabled observatories will be able to detect DvMs in shrimps shifting between the seabed and the overlying benthic boundary layer (i.e., benthopelagic movements). These diel displacements may rhythmi-cally bring animals within the camera Fov during certain parts of the day- night cycle (usually the night), similar to results from temporized bottom trawling (Aguzzi et al. 2006c). This phenomenon is likely to be more evident on slopes than shelf regions because of the greater depth range available for vertical movements. In addition to intrinsic behaviour, predator diel migrations are influenced by movements of macrozooplankton or micronekton prey species in relation to environmental light and its effect on visual predation (Pusc et al. 2002).
both DvM and DHM movements affect the presence of predators and prey over 24-hour peri-ods in deep- water areas below the twilight zone. These movements may represent an indirect signal for the behavioural synchronization to the day- night cycle of species residing in deep- sea areas. The NEPTuNE platforms located in barkley Canyon at 400 and 920 m (see Table 2) offer the opportunity of studying these nektobenthic movements in a coordinated fashion and their effect on ecosystem functioning at different depths on the continental margin (Huchet et al. 2010).
Indirect seasonal (i.e., photoperiodic) regulation of deep- sea ecosystems: characterization of endogenous and exogenous signals for growth and reproduction
The existence of a mechanism controlling behaviour on both diel and seasonal bases through detec-tion of photophase or scotophase duration (i.e., photoperiodism) is currently under discussion for several vertebrate and invertebrate animal models (reviewed in Refinetti 2006). Such a common mechanism could explain reported rhythms related to the growth and reproduction of a number of vertebrate and invertebrate species. Photoperiodic responses in marine animals may involve a circadian clock that can determine the temporal difference between long and short days (i.e., pho-toperiodic time measurement), for example, measuring the reciprocal temporal distance at dusk and dawn behavioural peaks (reviewed by Aguzzi & Company 2010).
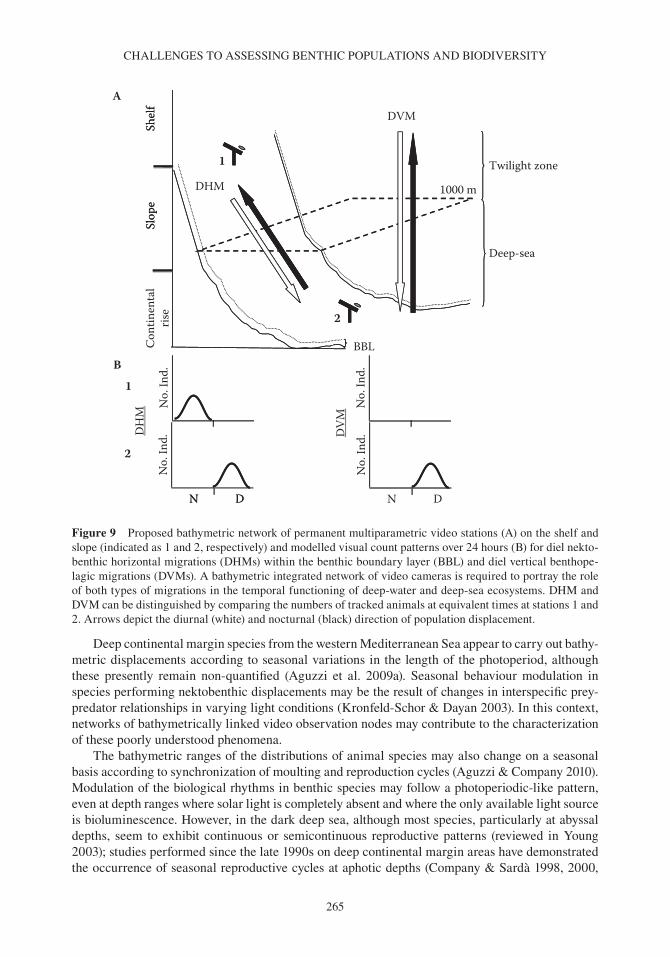
CHAllENGES To ASSESSING bENTHIC PoPulATIoNS AND bIoDIvERSITy
265
Deep continental margin species from the western Mediterranean Sea appear to carry out bathy-metric displacements according to seasonal variations in the length of the photoperiod, although these presently remain non- quantified (Aguzzi et al. 2009a). Seasonal behaviour modulation in species performing nektobenthic displacements may be the result of changes in interspecific prey- predator relationships in varying light conditions (Kronfeld- Schor & Dayan 2003). In this context, networks of bathymetrically linked video observation nodes may contribute to the characterization of these poorly understood phenomena.
The bathymetric ranges of the distributions of animal species may also change on a seasonal basis according to synchronization of moulting and reproduction cycles (Aguzzi & Company 2010). Modulation of the biological rhythms in benthic species may follow a photoperiodic- like pattern, even at depth ranges where solar light is completely absent and where the only available light source is bioluminescence. However, in the dark deep sea, although most species, particularly at abyssal depths, seem to exhibit continuous or semicontinuous reproductive patterns (reviewed in young 2003); studies performed since the late 1990s on deep continental margin areas have demonstrated the occurrence of seasonal reproductive cycles at aphotic depths (Company & Sardà 1998, 2000,
Shel
fSl
ope
Cont
inen
tal
rise
Twilight zone
BBL
Deep-sea
1000 m
DVM
DHM
1
2
No.
Ind.
No.
Ind.
N
1
2
D
DH
M
No.
Ind.
No.
Ind.
N D
DVM
A
B
Shel
fSl
ope
N D
Figure 9 Proposed bathymetric network of permanent multiparametric video stations (A) on the shelf and slope (indicated as 1 and 2, respectively) and modelled visual count patterns over 24 hours (b) for diel nekto-benthic horizontal migrations (DHMs) within the benthic boundary layer (bbl) and diel vertical benthope-lagic migrations (DvMs). A bathymetric integrated network of video cameras is required to portray the role of both types of migrations in the temporal functioning of deep- water and deep- sea ecosystems. DHM and DvM can be distinguished by comparing the numbers of tracked animals at equivalent times at stations 1 and 2. Arrows depict the diurnal (white) and nocturnal (black) direction of population displacement.
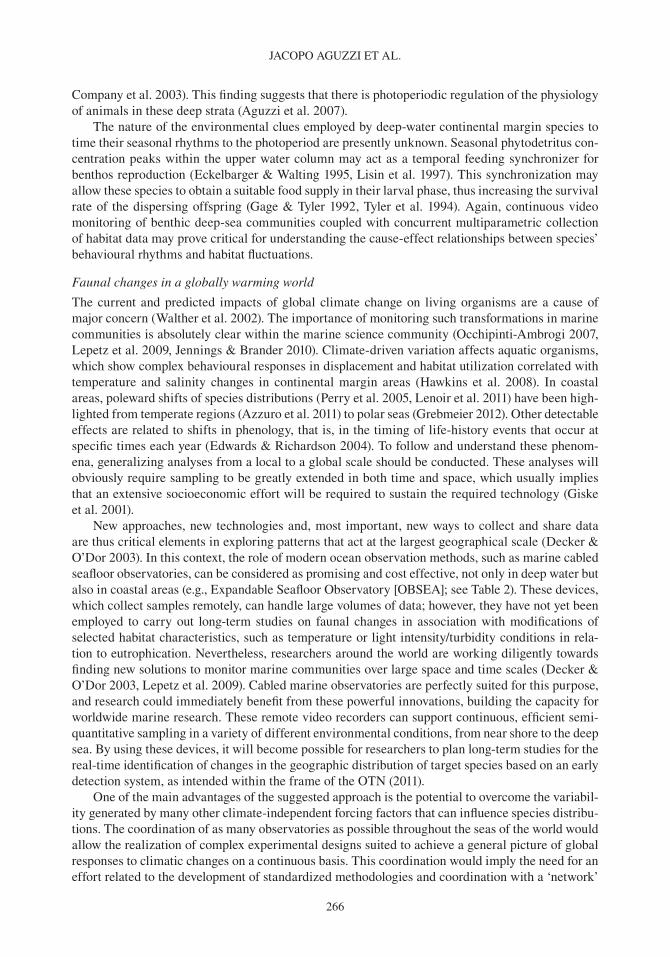
JACoPo AGuzzI ET Al.
266
Company et al. 2003). This finding suggests that there is photoperiodic regulation of the physiology of animals in these deep strata (Aguzzi et al. 2007).
The nature of the environmental clues employed by deep- water continental margin species to time their seasonal rhythms to the photoperiod are presently unknown. Seasonal phytodetritus con-centration peaks within the upper water column may act as a temporal feeding synchronizer for benthos reproduction (Eckelbarger & walting 1995, lisin et al. 1997). This synchronization may allow these species to obtain a suitable food supply in their larval phase, thus increasing the survival rate of the dispersing offspring (Gage & Tyler 1992, Tyler et al. 1994). Again, continuous video monitoring of benthic deep- sea communities coupled with concurrent multiparametric collection of habitat data may prove critical for understanding the cause- effect relationships between species’ behavioural rhythms and habitat fluctuations.
Faunal changes in a globally warming world
The current and predicted impacts of global climate change on living organisms are a cause of major concern (walther et al. 2002). The importance of monitoring such transformations in marine communities is absolutely clear within the marine science community (occhipinti- Ambrogi 2007, lepetz et al. 2009, Jennings & brander 2010). Climate- driven variation affects aquatic organisms, which show complex behavioural responses in displacement and habitat utilization correlated with temperature and salinity changes in continental margin areas (Hawkins et al. 2008). In coastal areas, poleward shifts of species distributions (Perry et al. 2005, lenoir et al. 2011) have been high-lighted from temperate regions (Azzuro et al. 2011) to polar seas (Grebmeier 2012). other detectable effects are related to shifts in phenology, that is, in the timing of life- history events that occur at specific times each year (Edwards & Richardson 2004). To follow and understand these phenom-ena, generalizing analyses from a local to a global scale should be conducted. These analyses will obviously require sampling to be greatly extended in both time and space, which usually implies that an extensive socioeconomic effort will be required to sustain the required technology (Giske et al. 2001).
New approaches, new technologies and, most important, new ways to collect and share data are thus critical elements in exploring patterns that act at the largest geographical scale (Decker & o’Dor 2003). In this context, the role of modern ocean observation methods, such as marine cabled seafloor observatories, can be considered as promising and cost effective, not only in deep water but also in coastal areas (e.g., Expandable Seafloor observatory [obSEA]; see Table 2). These devices, which collect samples remotely, can handle large volumes of data; however, they have not yet been employed to carry out long- term studies on faunal changes in association with modifications of selected habitat characteristics, such as temperature or light intensity/turbidity conditions in rela-tion to eutrophication. Nevertheless, researchers around the world are working diligently towards finding new solutions to monitor marine communities over large space and time scales (Decker & o’Dor 2003, lepetz et al. 2009). Cabled marine observatories are perfectly suited for this purpose, and research could immediately benefit from these powerful innovations, building the capacity for worldwide marine research. These remote video recorders can support continuous, efficient semi-quantitative sampling in a variety of different environmental conditions, from near shore to the deep sea. by using these devices, it will become possible for researchers to plan long- term studies for the real- time identification of changes in the geographic distribution of target species based on an early detection system, as intended within the frame of the oTN (2011).
one of the main advantages of the suggested approach is the potential to overcome the variabil-ity generated by many other climate- independent forcing factors that can influence species distribu-tions. The coordination of as many observatories as possible throughout the seas of the world would allow the realization of complex experimental designs suited to achieve a general picture of global responses to climatic changes on a continuous basis. This coordination would imply the need for an effort related to the development of standardized methodologies and coordination with a ‘network’
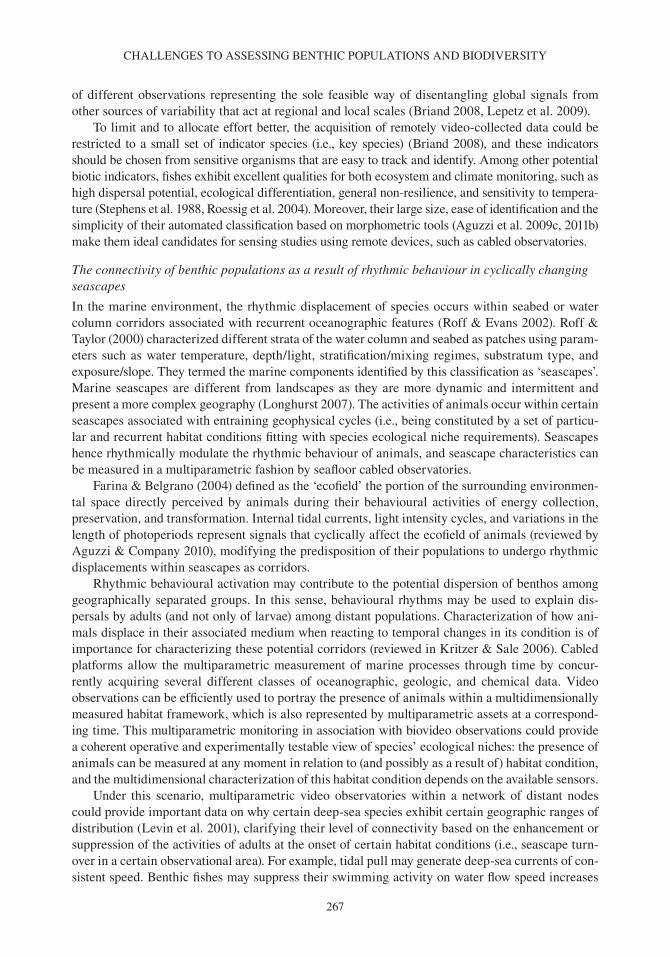
CHAllENGES To ASSESSING bENTHIC PoPulATIoNS AND bIoDIvERSITy
267
of different observations representing the sole feasible way of disentangling global signals from other sources of variability that act at regional and local scales (briand 2008, lepetz et al. 2009).
To limit and to allocate effort better, the acquisition of remotely video- collected data could be restricted to a small set of indicator species (i.e., key species) (briand 2008), and these indicators should be chosen from sensitive organisms that are easy to track and identify. Among other potential biotic indicators, fishes exhibit excellent qualities for both ecosystem and climate monitoring, such as high dispersal potential, ecological differentiation, general non- resilience, and sensitivity to tempera-ture (Stephens et al. 1988, Roessig et al. 2004). Moreover, their large size, ease of identification and the simplicity of their automated classification based on morphometric tools (Aguzzi et al. 2009c, 2011b) make them ideal candidates for sensing studies using remote devices, such as cabled observatories.
The connectivity of benthic populations as a result of rhythmic behaviour in cyclically changing seascapes
In the marine environment, the rhythmic displacement of species occurs within seabed or water column corridors associated with recurrent oceanographic features (Roff & Evans 2002). Roff & Taylor (2000) characterized different strata of the water column and seabed as patches using param-eters such as water temperature, depth/light, stratification/mixing regimes, substratum type, and exposure/slope. They termed the marine components identified by this classification as ‘seascapes’. Marine seascapes are different from landscapes as they are more dynamic and intermittent and present a more complex geography (longhurst 2007). The activities of animals occur within certain seascapes associated with entraining geophysical cycles (i.e., being constituted by a set of particu-lar and recurrent habitat conditions fitting with species ecological niche requirements). Seascapes hence rhythmically modulate the rhythmic behaviour of animals, and seascape characteristics can be measured in a multiparametric fashion by seafloor cabled observatories.
Farina & belgrano (2004) defined as the ‘ecofield’ the portion of the surrounding environmen-tal space directly perceived by animals during their behavioural activities of energy collection, preservation, and transformation. Internal tidal currents, light intensity cycles, and variations in the length of photoperiods represent signals that cyclically affect the ecofield of animals (reviewed by Aguzzi & Company 2010), modifying the predisposition of their populations to undergo rhythmic displacements within seascapes as corridors.
Rhythmic behavioural activation may contribute to the potential dispersion of benthos among geographically separated groups. In this sense, behavioural rhythms may be used to explain dis-persals by adults (and not only of larvae) among distant populations. Characterization of how ani-mals displace in their associated medium when reacting to temporal changes in its condition is of importance for characterizing these potential corridors (reviewed in Kritzer & Sale 2006). Cabled platforms allow the multiparametric measurement of marine processes through time by concur-rently acquiring several different classes of oceanographic, geologic, and chemical data. video observations can be efficiently used to portray the presence of animals within a multidimensionally measured habitat framework, which is also represented by multiparametric assets at a correspond-ing time. This multiparametric monitoring in association with biovideo observations could provide a coherent operative and experimentally testable view of species’ ecological niches: the presence of animals can be measured at any moment in relation to (and possibly as a result of) habitat condition, and the multidimensional characterization of this habitat condition depends on the available sensors.
under this scenario, multiparametric video observatories within a network of distant nodes could provide important data on why certain deep- sea species exhibit certain geographic ranges of distribution (levin et al. 2001), clarifying their level of connectivity based on the enhancement or suppression of the activities of adults at the onset of certain habitat conditions (i.e., seascape turn-over in a certain observational area). For example, tidal pull may generate deep- sea currents of con-sistent speed. benthic fishes may suppress their swimming activity on water flow speed increases
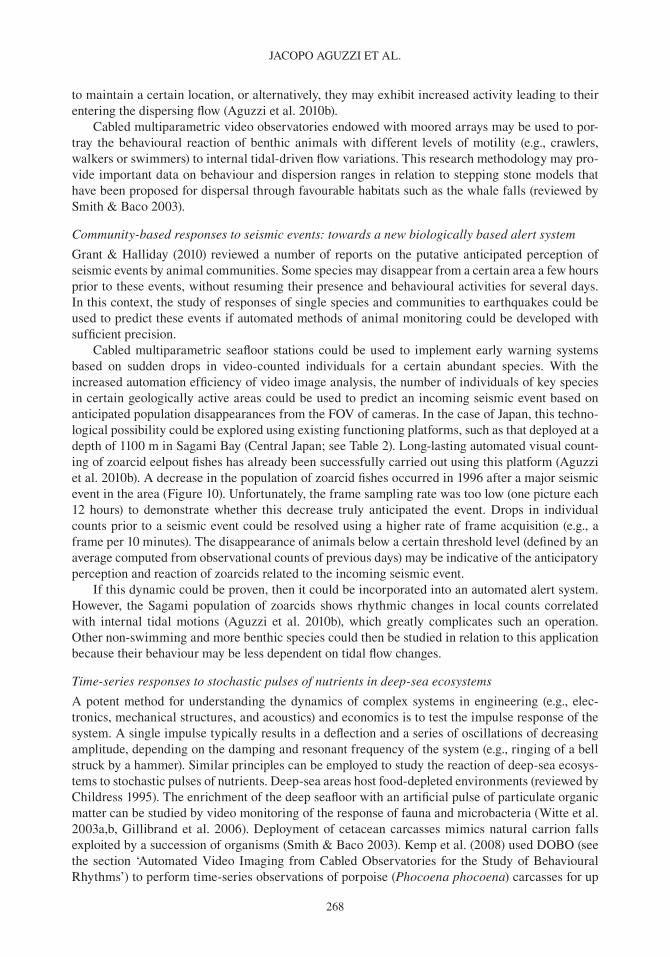
JACoPo AGuzzI ET Al.
268
to maintain a certain location, or alternatively, they may exhibit increased activity leading to their entering the dispersing flow (Aguzzi et al. 2010b).
Cabled multiparametric video observatories endowed with moored arrays may be used to por-tray the behavioural reaction of benthic animals with different levels of motility (e.g., crawlers, walkers or swimmers) to internal tidal- driven flow variations. This research methodology may pro-vide important data on behaviour and dispersion ranges in relation to stepping stone models that have been proposed for dispersal through favourable habitats such as the whale falls (reviewed by Smith & baco 2003).
Community- based responses to seismic events: towards a new biologically based alert system
Grant & Halliday (2010) reviewed a number of reports on the putative anticipated perception of seismic events by animal communities. Some species may disappear from a certain area a few hours prior to these events, without resuming their presence and behavioural activities for several days. In this context, the study of responses of single species and communities to earthquakes could be used to predict these events if automated methods of animal monitoring could be developed with sufficient precision.
Cabled multiparametric seafloor stations could be used to implement early warning systems based on sudden drops in video- counted individuals for a certain abundant species. with the increased automation efficiency of video image analysis, the number of individuals of key species in certain geologically active areas could be used to predict an incoming seismic event based on anticipated population disappearances from the Fov of cameras. In the case of Japan, this techno-logical possibility could be explored using existing functioning platforms, such as that deployed at a depth of 1100 m in Sagami bay (Central Japan; see Table 2). long- lasting automated visual count-ing of zoarcid eelpout fishes has already been successfully carried out using this platform (Aguzzi et al. 2010b). A decrease in the population of zoarcid fishes occurred in 1996 after a major seismic event in the area (Figure 10). unfortunately, the frame sampling rate was too low (one picture each 12 hours) to demonstrate whether this decrease truly anticipated the event. Drops in individual counts prior to a seismic event could be resolved using a higher rate of frame acquisition (e.g., a frame per 10 minutes). The disappearance of animals below a certain threshold level (defined by an average computed from observational counts of previous days) may be indicative of the anticipatory perception and reaction of zoarcids related to the incoming seismic event.
If this dynamic could be proven, then it could be incorporated into an automated alert system. However, the Sagami population of zoarcids shows rhythmic changes in local counts correlated with internal tidal motions (Aguzzi et al. 2010b), which greatly complicates such an operation. other non- swimming and more benthic species could then be studied in relation to this application because their behaviour may be less dependent on tidal flow changes.
Time- series responses to stochastic pulses of nutrients in deep- sea ecosystems
A potent method for understanding the dynamics of complex systems in engineering (e.g., elec-tronics, mechanical structures, and acoustics) and economics is to test the impulse response of the system. A single impulse typically results in a deflection and a series of oscillations of decreasing amplitude, depending on the damping and resonant frequency of the system (e.g., ringing of a bell struck by a hammer). Similar principles can be employed to study the reaction of deep- sea ecosys-tems to stochastic pulses of nutrients. Deep- sea areas host food- depleted environments (reviewed by Childress 1995). The enrichment of the deep seafloor with an artificial pulse of particulate organic matter can be studied by video monitoring of the response of fauna and microbacteria (witte et al. 2003a,b, Gillibrand et al. 2006). Deployment of cetacean carcasses mimics natural carrion falls exploited by a succession of organisms (Smith & baco 2003). Kemp et al. (2008) used Dobo (see the section ‘Automated video Imaging from Cabled observatories for the Study of behavioural Rhythms’) to perform time- series observations of porpoise (Phocoena phocoena) carcasses for up
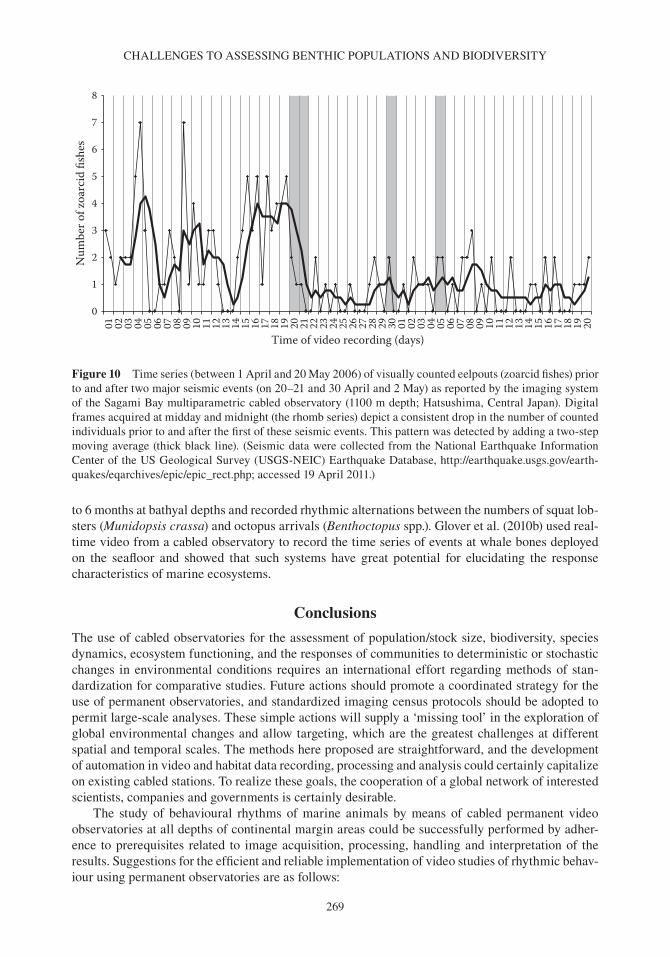
CHAllENGES To ASSESSING bENTHIC PoPulATIoNS AND bIoDIvERSITy
269
to 6 months at bathyal depths and recorded rhythmic alternations between the numbers of squat lob-sters (Munidopsis crassa) and octopus arrivals (Benthoctopus spp.). Glover et al. (2010b) used real- time video from a cabled observatory to record the time series of events at whale bones deployed on the seafloor and showed that such systems have great potential for elucidating the response characteristics of marine ecosystems.
Conclusions
The use of cabled observatories for the assessment of population/stock size, biodiversity, species dynamics, ecosystem functioning, and the responses of communities to deterministic or stochastic changes in environmental conditions requires an international effort regarding methods of stan-dardization for comparative studies. Future actions should promote a coordinated strategy for the use of permanent observatories, and standardized imaging census protocols should be adopted to permit large- scale analyses. These simple actions will supply a ‘missing tool’ in the exploration of global environmental changes and allow targeting, which are the greatest challenges at different spatial and temporal scales. The methods here proposed are straightforward, and the development of automation in video and habitat data recording, processing and analysis could certainly capitalize on existing cabled stations. To realize these goals, the cooperation of a global network of interested scientists, companies and governments is certainly desirable.
The study of behavioural rhythms of marine animals by means of cabled permanent video observatories at all depths of continental margin areas could be successfully performed by adher-ence to prerequisites related to image acquisition, processing, handling and interpretation of the results. Suggestions for the efficient and reliable implementation of video studies of rhythmic behav-iour using permanent observatories are as follows:
0
1
2
3
4
5
6
7
801 02 03 04 05 06 07 08 09 10 11 12 13 14 15 16 17 18 19 20 21 22 23 24 25 26 27 28 29 30 01 02 03 04 05 06 07 08 09 10 11 12 13 14 15 16 17 18 19 20
Time of video recording (days)
Num
ber o
f zoa
rcid
fish
es
Figure 10 Time series (between 1 April and 20 May 2006) of visually counted eelpouts (zoarcid fishes) prior to and after two major seismic events (on 20–21 and 30 April and 2 May) as reported by the imaging system of the Sagami bay multiparametric cabled observatory (1100 m depth; Hatsushima, Central Japan). Digital frames acquired at midday and midnight (the rhomb series) depict a consistent drop in the number of counted individuals prior to and after the first of these seismic events. This pattern was detected by adding a two- step moving average (thick black line). (Seismic data were collected from the National Earthquake Information Center of the uS Geological Survey (uSGS- NEIC) Earthquake Database, http://earthquake.usgs.gov/earth-quakes/eqarchives/epic/epic_rect.php; accessed 19 April 2011.)
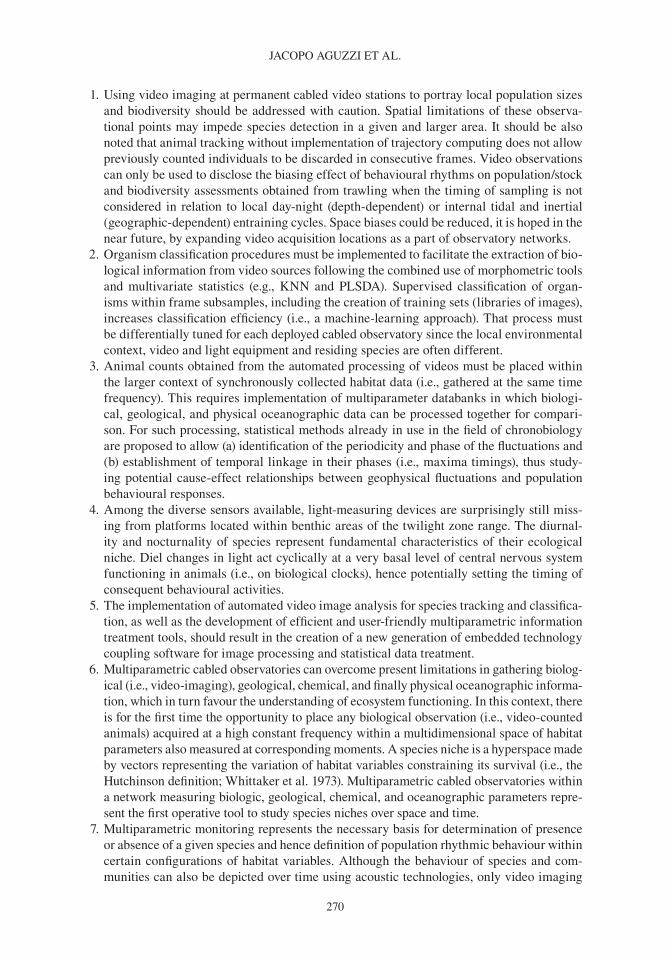
JACoPo AGuzzI ET Al.
270
1. using video imaging at permanent cabled video stations to portray local population sizes and biodiversity should be addressed with caution. Spatial limitations of these observa-tional points may impede species detection in a given and larger area. It should be also noted that animal tracking without implementation of trajectory computing does not allow previously counted individuals to be discarded in consecutive frames. video observations can only be used to disclose the biasing effect of behavioural rhythms on population/stock and biodiversity assessments obtained from trawling when the timing of sampling is not considered in relation to local day- night (depth- dependent) or internal tidal and inertial (geographic- dependent) entraining cycles. Space biases could be reduced, it is hoped in the near future, by expanding video acquisition locations as a part of observatory networks.
2. organism classification procedures must be implemented to facilitate the extraction of bio-logical information from video sources following the combined use of morphometric tools and multivariate statistics (e.g., KNN and PlSDA). Supervised classification of organ-isms within frame subsamples, including the creation of training sets (libraries of images), increases classification efficiency (i.e., a machine- learning approach). That process must be differentially tuned for each deployed cabled observatory since the local environmental context, video and light equipment and residing species are often different.
3. Animal counts obtained from the automated processing of videos must be placed within the larger context of synchronously collected habitat data (i.e., gathered at the same time frequency). This requires implementation of multiparameter databanks in which biologi-cal, geological, and physical oceanographic data can be processed together for compari-son. For such processing, statistical methods already in use in the field of chronobiology are proposed to allow (a) identification of the periodicity and phase of the fluctuations and (b) establishment of temporal linkage in their phases (i.e., maxima timings), thus study-ing potential cause- effect relationships between geophysical fluctuations and population behavioural responses.
4. Among the diverse sensors available, light- measuring devices are surprisingly still miss-ing from platforms located within benthic areas of the twilight zone range. The diurnal-ity and nocturnality of species represent fundamental characteristics of their ecological niche. Diel changes in light act cyclically at a very basal level of central nervous system functioning in animals (i.e., on biological clocks), hence potentially setting the timing of consequent behavioural activities.
5. The implementation of automated video image analysis for species tracking and classifica-tion, as well as the development of efficient and user- friendly multiparametric information treatment tools, should result in the creation of a new generation of embedded technology coupling software for image processing and statistical data treatment.
6. Multiparametric cabled observatories can overcome present limitations in gathering biolog-ical (i.e., video- imaging), geological, chemical, and finally physical oceanographic informa-tion, which in turn favour the understanding of ecosystem functioning. In this context, there is for the first time the opportunity to place any biological observation (i.e., video- counted animals) acquired at a high constant frequency within a multidimensional space of habitat parameters also measured at corresponding moments. A species niche is a hyperspace made by vectors representing the variation of habitat variables constraining its survival (i.e., the Hutchinson definition; whittaker et al. 1973). Multiparametric cabled observatories within a network measuring biologic, geological, chemical, and oceanographic parameters repre-sent the first operative tool to study species niches over space and time.
7. Multiparametric monitoring represents the necessary basis for determination of presence or absence of a given species and hence definition of population rhythmic behaviour within certain configurations of habitat variables. Although the behaviour of species and com-munities can also be depicted over time using acoustic technologies, only video imaging
CHAllENGES To ASSESSING bENTHIC PoPulATIoNS AND bIoDIvERSITy
271
can ultimately discriminate individuals of given species without the need for verification by other means (e.g., pelagic/benthic trawling). Therefore, video cameras can be placed at the highest rank of a multisensor scale of complexity in which oceanographic (physi-cal) and chemical (geologically or life- derived) variables are at the base (Figure 11). This ranking of sensors is related to the character of the obtained information, with individual, population or species detection the result of surrounding physical, chemical, and geologic conditioning (i.e., the ecological niche measured in a multiparametric fashion).
Acknowledgements
we would like to thank all members of the ‘Tecnoterra’ Associated unit (uPC- CSIC) for their collaboration, coordination, help, and scientific advice that they generously provided over the last years. A special thank you is also given to Em. Prof. E. Naylor (bangor university) and Prof. H. De la Iglesia (university of washington) for their advice during the preparation of this manu-script. we also thank Dr. P. Puig (ICM- CSIC) for his advice on inertial currents. The present work was developed within the framework of five research projects funded by the Spanish Ministry for Science and Innovation (PRoMETEo, ref. CTM 2007-66316-C02-02; RITFIM, ref. CTM2010-16274; operatividad laboratorio Submarino obSEA ref. ACI2009-0983; DoS MARES, ref. CTM2010-21810-C03-03; and finally GRACCIE- CoNSolIDER INGENIo 2010, ref. CSD2007-00067) and the Italian Ministry of Agricultural, Food and Forestry Politics- MIPAAF (Highvision, DM 19177/7303/08). The E.u.-funded HERMIoNE (ref. 226354-HERMIoNE), EMSo- PP (grant
Chlorophyll
Pelagic Benthic
Acoustic Video
Multiparametric monitoring
Mea
sure
d en
viro
nmen
tal c
ompl
exity
Mea
sure
men
t of l
ife p
erfo
rman
ces
Chem.Hab
itat
Com
mun
ity
Dire
ctIn
dire
ct
Geo. Ocean.
Imaging
Figure 11 organization scheme for measuring capability at different levels of ecosystem complexity using sensors installed in multiparametric cabled observatories. Sensors for physical measurements (i.e., chemical, geological, and oceanographic) portray ecosystem dynamism at a very deterministic baseline level, accounting indirectly for events affecting life performances. At intermediate levels of environmental complexity, there are sensors that measure biological performance only in an indirect manner (e.g., chlorophyll sensors). A max-imum level of environmental complexity is obtained through direct biological process measurements, which are taken by video- imaging sensors that directly allow species recognition and the counting of individuals within local populations (by automated video image analysis).
JACoPo AGuzzI ET Al.
272
agreement no. 211816), the KM3NeT- PP (grant agreement no. 212525), and finally the PERSEuS (CE, vII PM, Grant Agreement no: 287600) RTD projects of the vII Framework Programmes should be equally acknowledged along with the CRG Marine Geosciences (grant 2009 SGR 1305) at the university of barcelona (Generalitat of Catalunya). Jacopo Aguzzi is a postdoctoral fellow of the Ramón y Cajal Program (MICINN).
ReferencesAdlerstein, S. & Ehrich, S. 2003. Patterns in diel variation of cod catches in North Sea bottom trawl surveys.
Fisheries Research 63, 169–178.Aglen, A., Engas, A., Huse, I., Michalsen, K. & Stensholt, b.K. 1999. How vertical fish distribution may affect
survey results. ICES Journal of Marine Science 56, 345–360.Ageron, M., Aguilar, J.A., Albert, A., Ameli, F., Anghinolfi, M., Anton, G., Anvar, S., Ardid, M., Aubert,
J.J., Aublin, J., et al. 2009. Performance of the first ANTARES detector line. Astroparticle Physics 31, 277–283.
Aguilar, J.A., Samarai, A.l., Albert, A., Anghinolfi, M., Anton, G., Anvar, S., Ardid, M., Assis Jesus, A.C., Astraatmadja, T., Aubert, J.-J., et al. 2010. Measurement of the atmospheric muon flux with a 4 Gev threshold in the ANTARES neutrino telescope. Astroparticle Physics 33, 86–90.
Aguzzi, J., Abelló, P. & Depledge, M. 2004a. Endogenous cardiac activity rhythm of the Northwestern Mediterranean Nephrops norvegicus (l.) inhabiting the upper slope. Marine Freshwater Behaviour Physiology 37, 55–64.
Aguzzi, J. & bahamon, N. 2009. Modeled day- night biases in decapod assessment by bottom trawling survey. Fisheries Research 100, 274–280.
Aguzzi, J., bahamon, N. & Marotta, l. 2009a. Modulation of activity rhythms in continental margin decapods by light availability and predatory behaviour of Nephrops norvegicus. Marine Ecology 30, 366–375.
Aguzzi, J., bullock, N.M. & Tosini, G. 2006a. Spontaneous internal desynchronization of locomotor activity and body temperature rhythms from plasma melatonin rhythm in rats exposed to constant dim light. Journal of Circadian Rhythms 4, 6 only.
Aguzzi, J. & Chiesa, J.J. 2005. The cardiac activity of Nephrops norvegicus (Decapoda: Nephropidae): the relationship between ultradian and circadian rhythms. Journal of Crustacean Biology 25, 577–584.
Aguzzi, J., Chiesa, J., Abelló, P. & Díez- Noguera, A. 2005a. Temporal modifications in cardiac rhythmicity of Nephrops norvegicus (Crustacea: Decapoda) in relation to trawl capture stress. Scientia Marina 69, 369–374.
Aguzzi, J., Chiesa, J.J., Caprioli, R., Cascione, D., Magnifico, G., Rimatori, v. & Costa, C. 2006b. Preliminary evidences of circadian fan activity rhythm in Sabella spallanzanii (Gmelin, 1791) (Polychaeta: Sabellidae). Scientia Marina 70, 727–724.
Aguzzi, J. & Company, J.b. 2010. Chronobiology of deep water continental margin decapods. Advances in Marine Biology, an Annual Review 58, 155–225.
Aguzzi, J., Company, J.b., Abelló, P. & García, J.A. 2006c. ontogenetic changes in the vertical migratory rhythms of benthopelagic shrimps Pasiphaea multidentata and P. sivado (Crustacea: Caridea). Marine Ecology Progress Series 335, 167–174.
Aguzzi, J., Company, J.b., Costa, C., Menesatti, P., bahamon, N. & Sardà, F. 2010a. Activity rhythms in the deep- sea crustacean: chronobiological challenges and potential technological scenarios. Frontiers in Bioscience 16, 131–150.
Aguzzi, J., Company, J.b. & Sardà F. 2004b. The feeding activity rhythm of Nephrops norvegicus (l.) of the western Mediterranean shelf and slope grounds. Marine Biology 144, 463–472.
Aguzzi, J., Company, J.b., Sardà, F. & Abelló, P. 2003a. Circadian oxygen consumption patterns in conti-nental slope Nephrops norvegicus (Decapoda: Nephropidae) in the western Mediterranean. Journal of Crustacean Biology 23, 749–757.
Aguzzi, J., Company, J.b., Sardà, F., Sánchez, J., García, J.A. & Rotllant, G. 2004c. Is the glucose concentra-tion in the hemolymph a suitable indicator of circadian rhythmicity in Nephrops norvegicus (Decapoda: Nephropidae)? Crustaceana 77, 213–229.
CHAllENGES To ASSESSING bENTHIC PoPulATIoNS AND bIoDIvERSITy
273
Aguzzi, J., Costa, C., Antonucci, F., Company, J.b., Menesatti, P. & Sardà, F. 2009b. Influence of rhythmic behaviour in the morphology of decapod Natantia. Biological Journal of the Linnaean Society 96, 517–532.
Aguzzi, J., Costa, C., Furushima, y., Chiesa, J.J., Company, J.b., Menesatti, P., Iwase R. & Fujiwara, y. 2010b. behavioural rhythms of hydrocarbon seep fauna in relation to internal tides. Marine Ecology Progress Series 418, 47–56.
Aguzzi, J., Costa, C., Matabos, M., Antonucci, F., Juniper, K. & Menesatti, P. 2011a. Automated video- imaging applications for the detection of benthic crustaceans and bacterial mat coverage at vENuS cabled obser-vatory. Sensors 11, 10534–10556.
Aguzzi, J., Costa, C., Menesatti, P., Fujiwara, y., Iwase, R. & Ramirez- llodra, E. 2009c. A novel morphometry- based protocol of automated video- image analysis for species recognition and activity rhythms monitor-ing in deep- sea fauna. Sensors 9, 8438–8455.
Aguzzi, J., Costa, C., Menesatti, P., García, J.A. & Sardà, F. 2009d. Monochromatic blue light entrains diel activity cycles in the Norway lobster, Nephrops norvegicus (l.) as measured by automated video- image analysis. Scientia Marina 73, 773–783.
Aguzzi, J., Cuesta, J.A., librero, M. & Toja, J. 2005b. Daily and seasonal feeding rhythmicity of Palaemonetes varians (leach, 1814) from southwestern Europe. Marine Biology 148, 141–147.
Aguzzi, J., Mànuel, A., Condal, F., Nogueras, M., del Río, J., Costa, C., Menesatti, P., Sardà, F., Toma, D., Puig, P., Guillen, J. & Palanques, A. 2011b. The new Seafloor observatory (obSEA) for remote and long- term coastal ecosystem monitoring. Sensors 11, 5850–5872.
Aguzzi, J., Puig, P. & Company, J.b. 2009e. Hydrodynamic, non- photic modulation of biorhythms in the Norway lobster, Nephrops norvegicus (l.). Deep Sea Research I 56, 366–373.
Aguzzi, J., Ramirez- llodra, E., Telesnicki, G. & Camps, M. 2007. Day- night activity rhythm of the cold seep shrimp Alvinocaris stactophila (Caridea: Alvinocarididae) from the Gulf of Mexico. Journal of the Marine Biological Association of the United Kingdom 87, 1175–1180.
Aguzzi, J. & Sardà, F. 2008. A history of recent advancements on Nephrops norvegicus behavioural and physi-ological rhythms. Reviews in Fish Biology and Fisheries 18, 235–248.
Aguzzi, J., Sardà, F., Abelló P., Company, J.b. & Rotllant, G. 2003b. Diel patterns of Nephrops norvegicus catchability (Decapoda: Nephropidae) in the western Mediterranean: a perspective through depth and season. Marine Ecology Progress Series 258, 201–211.
Aguzzi, J., Sbragaglia, v., Sarriá, D., García, J.A., Costa, C., del Río, J., Mànuel, A., Menesatti, P. & Sardà, F. 2011c. A new RFID technology for the laboratory monitoring of behaviour in marine organisms. Sensors 11, 9532–9548.
Aguzzi, J., Sarriá, D., García, J.A., del Río, J., Sardà, F. & Mànuel, A. 2008. A new tracking system for the measurement of diel locomotor rhythms in the Norway lobster, Nephrops norvegicus (l.). Journal of Neuroscience Methods 173, 215–224.
Aksens, D.l. & Giske, J. 1993. A theoretical model for aquatic visual feeding. Ecological Modelling 67, 233–250.
Allen, P.z., Thorndike, E.M., Sullivan, b.C.H. & Gerard, R.D. 1978. observations of the deep- sea floor from 202 days of time- lapse photography. Nature 272, 812–814.
Amit, D. & boaz, l. 2005. Support vector machine- based image classification for genetic syndrome diagnosis. Pattern Recognition Letters 26, 1029–1038.
Amram, P., Anvar, S., Aslanides, E., Aubert, J.J., Azoulay, R., basa, S., benhammou, y., bernard, F., bertin, v., billault, M., et al. 2000. background light in potential sites for the ANTARES undersea neutrino telescope. Astroparticle Physics 13, 127–136.
Anglès- Pujolràs, M., Chiesa, J.J., Díez- Noguera, A. & Cambras, T. 2006. Motor activity rhythms of forced desynchronized rats subjected to restricted feeding. Physiological Behaviour 88, 30–38.
Antonucci, F., Costa, C., Aguzzi, J. & Cataudella, S. 2009. Ecomorphology of morpho- functional relationships in the family of Sparidae: a quantitative statistic approach. Journal of Morphology 270, 843–855.
Aschoff, J. 1981. Free- running and entrained circadian rhythms. In Handbook of Behavioral Neurobiology, vol. 4, J. Aschoff (ed.). New york: Plenum Press, 81–93.
Atkinson, D.b. 1989. Diel movements of beaked redfish and implications of these for stratified random bot-tom trawl estimates of biomass and abundance. North American Journal of Fisheries Management 9, 163–170.
JACoPo AGuzzI ET Al.
274
Azzurro, E., Moschella, P. & Maynou, F. 2011. Tracking signals of change in Mediterranean fish diversity based on local ecological knowledge. PLoS ONE 6, e24885. doi:10.1371/journal.pone.0024885
bagley, P.M., Smith, K.l., bett, b., Priede, I.G., Rowe, G., Clarke, J., walls, A., Ruhl, H.A. & bailey, D.M. 2011. The DEloS project: long- term observatories in an oil field environment in the tropical Atlantic ocean. In Seafloor Observatories: A New Version of the Earth from the Abyss, P. Favali et al. (eds). Chichester, uK: Springer Praxis, Praxis Publishing ltd.
bahamon, N., Aguzzi, J., bernardello, R., Ahumada, M.-A., Puigdefabregas, J., Muñoz, E., velásquez, z. & Cruzado, A. 2011. The new pelagic operational observatory of the Catalan Sea (ooCS) for the multisen-sor coordinated measurement of atmospheric and oceanographic conditions. Sensors 11, 11251–11272.
bahamon, N., Sardà, F. & Aguzzi, J. 2009. Fuzzy diel pattern in commercial catchability of deep- water conti-nental margin species. ICES Journal of Marine Science 66, 2211–2218.
bailey, D.M., Collins, M.A., Gordon, J.D.M., zuur, A.F. & Priede, I.G. 2009. long- term changes in deep- water fish populations in the North East Atlantic: deeper- reaching effect of fisheries? Proceedings of the Royal Society of London B 275, 1965–1969.
bailey, R.F. & Elner, R.w. 1989. Northwestern Atlantic snow crab fisheries: lessons in research and manage-ment. In Marine Invertebrate Fisheries. Their Assessment and Management, J.F. Caddy (ed.). New york: wiley, 261–280.
bailey, D.M., Ruhl, H.A. & Smith, K.l. 2006. long- term change in benthopelagic fish abundance in the abys-sal North- East Pacific ocean. Ecology 87, 549–555.
bakkala, R.G. 1993. Structure and historic changes in the ground fish complex of the eastern bering Sea. Seattle, wA: NoAA/National Marine Fisheries Service (NMFS) Technical Reports 114.
barange, M., Pillar, S.C., Huse, I. & Hutchings, l. 2005. vertical migration, catchability and acoustic assess-ment of semi- pelagic Cape horse mackerel Trachurus trachurus capensis in the southern benguel. African Journal of Marine Science 27, 459–469.
barans, C.A., Ardent, M.D., Moore, T. & Schmidt, D. 2005. Remote video revisited: a visual technique for conduct-ing long- term monitoring of reef fishes on the continental shelf. Marine Technology Society Journal 39, 80–88.
barnes, C.R., best, M.M.R., Johnson, F., Phibbs, P. & Pirenne, b. 2008. latest developments in building the world’s first regional cabled observatory: NEPTuNE Canada. building the world’s first regional cabled observatory: NEPTuNE Canada. Journal of Ocean Technology 3, 1–3.
barry, D. & Stanienda, T. 1998. Solving the Java object storage problem. IEEE- Computer 31, 33–40.benn, A.R., weaver, P.P., billet, D.S.M., van den Hove, S., Murdock, A.P., Doneghan, G.b. & le bas, T. 2010.
Human activities on the deep seafloor in the North East Atlantic: an assessment of spatial extent. PLoS ONE 5, e12730.
benoit- bird, K.J. & Au, w.w. 2006. Extreme diel horizontal migrations by a tropical nearshore resident micronekton community. Marine Ecology Progress Series 319, 1–14.
benoit- bird, K.J., zirbel, M.J. & McManus, M.A. 2008. Diel variation of zooplankton distributions in Hawaiian waters favours horizontal diel migration by midwater micronekton. Marine Ecology Progress Series 367, 109–123.
benoit, H.P. & Swain, D.P. 2003. Accounting for length- and depth- dependent diel variation in catchability of fish and invertebrates in an annual bottom- trawl survey. ICES Journal of Marine Science 60, 1298–1317.
beranzoli, l., Favali, P. & Smriglio, G. (eds) 2002. Science- Technology Synergy for Research in the Marine Environment: Challenges for the XXI Century. Amsterdam: Elsevier.
bertolucci, C., Colognesi, I., Caruso, P., Aguzzi, J., Chen, z., Foà, A., Tosini, G., bernardi, F., McKnight, S.l. & Pinotti, M. 2008. Evidence for an overlapping role of CloCK and NPAS2 transcription factors in liver circadian oscillators. Molecular and Cellular Biology 28, 3070–3075.
bertrand, J., Gil de Sola, l., Papacostantinou, P., Relini, G. & Souplet, A. 2002. The general specifications of the MEDITS surveys. Scientia Marina 66, 9–17.
betke, M., Hirsh, D.E., bagchi, A., Hristov, N.I., Makris, N.C. & Kunz, T.H. 2007. Tracking large variable numbers of objects in clutter. In Proceedings of the IEEE Conference on Computer Vision and Pattern Recognition (CVPR’07). Minneapolis, MN: IEEE Press, 1–8.
bharati, M.H., liu, J.J. & MacGregor, J.F. 2004. Image texture analysis: methods and comparisons. Chemometrics and Intelligent Laboratory Systems 72, 57 -71.
billett, D.S.M., bett, b.J., Reid, w.D.K., boorman, b. & Priede, I.G. 2009. long- term change in the abyssal NE Atlantic: the ‘Amperima event’ revisited. Deep Sea Research II 57, 1406–1417.
CHAllENGES To ASSESSING bENTHIC PoPulATIoNS AND bIoDIvERSITy
275
blaber, S.J.M., brewer, D.T. & Harris, A.N. 1994. Distribution, biomass and community structure of demersal fishes of the Gulf of Carpentaria, Australia. Australian Journal of Marine and Freshwater Research 45, 375–396.
borstad, G., brown, l., Sato, M., lemon, D., Kerr, R. & willis, P. 2010. long zooplankton time series with high temporal and spatial resolution. In Proceedings of IEEE- OCEANS’10. Seattle, wA: IEEE Press, 1–9.
boswell, K.M., wilson, M.P. & Cowan, J.H., Jr. 2008. A semiautomated approach to estimating fish size, abun-dance, and behavior from Dual- Frequency Identification Sonar (DIDSoN) data. North American Journal of Fisheries Management 28, 799–807.
briand, F. (ed.) 2008. Climate Warming and Related Changes in Mediterranean Marine Biota. Monaco: CIESM workshop Monographs 35.
bruno, I., Costas, G., González, C. & Paz, x. 2000. Feeding chronology of yellowtail flounder (Limanda ferru-ginea) and American plaice (Hippoglossoides platessoides) on Grand bank (NAFo Division 3N). NAFO Scientific Council Studies 33, 103–116.
bruno, T.J. & Svoronos, P.D.N. 2005. CRC Handbook of Fundamental Spectroscopic Correlation Charts. boca Raton, Fl: Taylor &Francis/CRC Press.
budd, A.F., Johnson, K.G. & Potts, D.C. 1994. Recognizing morphospecies in colonial reef corals: I. landmark- based methods. Paleobiology 20, 484–505.
Canals, M., Puig, P., Heussner, S., Durrieu de Madron, x., Palanques, A. & Fabres, J. 2006. Flushing submarine canyons. Nature 444, 354–357.
Cappo, M., Speare, P. & De’ath, G. 2004. Comparison of baited remote underwater video stations (bRvuS) and prawn (shrimp) trawls for assessment of fish biodiversity in inter- reefal areas of the Great barrier Reef marine park. Journal of Experimental Marine Biology and Ecology 302, 123–152.
Carpentieri, P., Colloca, F. & Ardizzone, G.D. 2005. Day- night variations in the demersal nekton assemblage on the Mediterranean shelf- break. Estuarine and Coastal Shelf Science 63, 577–588.
Carr, A.J., Johnston, J.D., Semikhodskii, A.G., Nolan, T., Cagampang, F.R.J.A., Stirland, J.A. & loudon, A.S. 2003. Photoperiod differentially regulates circadian oscillators in central and peripheral tissues of the Syrian hamster. Current Biology 13, 1543–1548.
Cartes, J.E., Sardà, F., Company, J.b. & llenorat, J. 1993. Day- night migrations by deep- sea decapod crus-taceans in experimental samplings in the western Mediterranean Sea. Journal of Experimental Marine Biology and Ecology 171, 63–73.
Chiesa, J.J., Aguzzi, J., García, J.A., Sardà, F. & de la Iglesia, H. 2010. light intensity determines tempo-ral niche switching of behavioural activity in deep water Nephrops norvegicus (Crustacea: Decapoda). Journal of Biological Rhythms 25, 277–287.
Chiesa, J.J., Anglès- Pujolràs, M., Díez- Noguera, A. & Cambras, T. 2005. Activity rhythm of golden hamster (Mesocricetus auratus) can be entrained to a 19-h light- dark cycle. American Journal of Physiology 289, 998–1005.
Childress, J.J. 1995. Do animals present biochemical adaptations to depths? Trends in Ecology and Evolution 10, 30–36.
Chraskova, J., Kaminsky, y. & Krekule, I. 1999. An automatic 3D tracking system with a PC and a single Tv camera. Journal of Neuroscience Methods 88, 195–200.
Cline, D.E., Edgington, D.R. & Mariette, J. 2007. An automated visual event detection system for cabled obser-vatory video. In Proceedings of IEEE- OCEANS’07. vancouver, bC: IEEE Press, 1–5.
Coll, M., Piroddi, C., Steenbeek, J., Kaschner, K., ben Rais Asram, F., Aguzzi, J., ballesteros, E., bianchi, C.N., Corbera, J., Dailianis, T., Danovaro, R., Dimitris, v., Estrada, M., Froglia, C., Galil, b.S., Gasol, J.M., Gertwagen, R., Gil, J., Gorsky, G., Guilhaumon, F., Kesner- Reyes, K., Kitsos, M.-S., Koukouras, A., lampadariou, N., laxamana, E., lloris, D., lópez- Fé De la Cuadra, C.M., lotze, H.K., Martin, D., Moullot, D., oro, D., Raichevich, S., Rius- barile, J., Saiz- Salinas, J.I., San vicente, C., Somot, S., Templado, J., Turon, x., villanueva, R. & voultsiadou, E. 2010. biodiversity of the Mediterranean Sea: status, patterns, and threats. PLoS ONE 5, e11842.
Company, J.b. & Sardà, F. 1998. Metabolic rates and energy content of deep- sea benthic decapod crustaceans in the western Mediterranean Sea. Deep Sea Research I 45, 1861–1880.
Company, J.b. & Sardà, F. 2000. Growth parameters of deep- water decapod crustaceans in the Northwestern Mediterranean Sea: a comparative approach. Marine Biology 136, 79–90.
JACoPo AGuzzI ET Al.
276
Company, J.b., Sardà, F., Puig, P., Cartes, J.E. & Palanques, A. 2003. Duration and timing of reproduction in decapod crustaceans of the Nw Mediterranean continental margin: is there a general pattern? Marine Ecology Progress Series 261, 201–216.
Costa, C., Aguzzi, J., Chiesa, J.J., Magnifico, G., Cascione, D. & Caprioli, R. 2008a. Evidences on the transient disruption of Sabella spallanzanii (Polychaeta: Sabellidae) endogenous fan activity rhythm as result of stress of capture and acclimation to laboratory. Italian Journal of Zoology 75, 337–344.
Costa, C., Aguzzi, J., Menesatti, P., Antonucci, F., Rimatori, v. & Mattoccia, M. 2008b. Shape analysis of dif-ferent populations of clams in relation to their geographical structure. Journal of Zoology 276, 71–80.
Costa, C., Antonucci, F., Pallottino, F., Aguzzi, J., Sun, D.-w. & Menesatti, P. 2011. Shape analysis of agricul-tural products: a review of recent research advances and potential application to computer vision. Food and Bioprocess Technology 4, 673–692.
Costa, C., loy, A., Cataudella, S., Davis, D. & Scardi, M. 2006. Extracting fish size using dual underwater cameras. Aquaculture Engineering 35, 218–227.
Costa, C., Menesatti, P., Aguzzi, J., D’Andrea, S., Antonucci, F., Rimatori, v., Pallottino, F. & Mattoccia, M. 2010. External shape differences between sympatric populations of commercial clams Tapes decussatus and T. philippinarum. Food and Bioprocessing Technology 3, 43–48.
Costa, C., Menesatti, P., Paglia, G., Pallottino, F., Aguzzi, J., Rimatori, v., Russo, G., Recupero, S. & Reforgiato, R.G. 2009a. quantitative evaluation of Tarocco sweet orange fruit shape using opto- electronic elliptic Fourier based analysis. Postharvest Biology and Technology 54, 38–47.
Costa, C., Scardi, M., vitalini, v. & Cataudella, S. 2009c. A dual camera system for counting and sizing north-ern bluefin tuna (Thunnus thynnus; linnaeus, 1758) stock, during transfer to aquaculture cages, with a semi automatic artificial neural network tool. Aquaculture 291, 161–167.
Cox, M.J. & borchers, D.l. 2011. Estimating the density of Antarctic krill (Euphausia superba) from multi- beam echo- sounder observations using distance sampling methods. Journal of the Royal Statistical Society C (Applied Statistics) 60, 301–316.
Culverhouse, P.F., williams, R., Reguera, b., Herry, v. & González- Gil, S. 2003. Do experts make mistakes? A com-parison of human and machine identification of dinoflagellates. Marine Ecology Progress Series 247, 17–25.
Daan, S. & Aschoff, J. 2001. The entrainment of circadian systems. In Handbook of Behavioral Neurobiology: Circadian Clocks, J.S. Takahashi & F. Turek (eds). New york: Kluwer Academic/Plenum, 7–42.
Dah- Jye, l., Archibald, J.K., Schoenberger, R.b., Dennis, A.w. & Shiozawa, D.K. 2008. Contour matching for fish species recognition and migration monitoring. Studies in Computational Intelligence 122, 183–207.
Danovaro, R., Company, J.b., Corinaldesi, C., D’onghia, G., Galil, b., Gambi, C., Gooday, A.J., lampadariou, N., luna, G.M., Morigi, C., olu, K., Polymenakou, P., Ramirez- llodra, E., Sabbatini, A., Sardà, F., Sibuet, M. & Tselepides, A. 2010. Deep- sea biodiversity in the Mediterranean Sea: the known, the unknown, and the unknowable. PLoS ONE 5, e11832.
Decker, C.D. & o’Dor, R. 2003. Census of marine life: unknowable or just unknown? Oceanologica Acta 25, 179–186.
Dense oceanfloor Network System for Earthquakes and Tsunamis (DoNET) 2011. Home page. online. Available HTTP: http://www.jamstec.go.jp/jamstec- e/maritec/donet/ Accessed 7 July 2011.
De Robertis, A. 2002. Size- dependent visual predation risk and the timing of vertical migration: an optimized model. Limnological Oceanography 47, 925–933.
Dibner, C., Schibler, u. & Albrecht, u. 2010. The mammalian circadian timing system: organization and coor-dination of central and peripheral clocks. Annual Review of Physiology 72, 517–549.
Dickey, T.D. & bidigare, R.R. 2005. Interdisciplinary oceanographic observations: the wave of the future. Scientia Marina 69, 23–42.
Eckelbarger, K.J. & walting, l. 1995. Role of phylogenetic constraints in determining the reproductive patterns in deep- sea invertebrates. Invertebrate Biology 114, 256–269.
Edgington, D.R., Cline, D.E., Davis, D., Kerkez, I. & Mariette, J. 2006. Detecting, tracking and classifying animals in underwater video. In Proceedings of the MTS/IEEE- OCEANS’06. boston: IEEE Press, 1–5.
Edgington, D.R., Cline, D.E., Kerkez, I. & Mariette, J. 2007. Detecting, tracking, and classifying animals in underwater observatory video. In Proceedings of the Underwater Technology Symposium (UT07)/Workshop on Scientific Use of Submarine Cables & Related Technologies (SSC07). Tokyo, Japan: IEEE Press, 634–638.
CHAllENGES To ASSESSING bENTHIC PoPulATIoNS AND bIoDIvERSITy
277
Edgington, D.R., walther, D., Cline, D.E., Sherlock, R.E. & Koch, C. 2004. Detecting and tracking animals in underwater video. In Proceedings of the IEEE Computer Society Conference on Computer Vision and Pattern Recognition (CVPR’04). washington, DC: IEEE Press, 544–549.
Edgington, D.R., walther, D., Salamy, K.A., Risi, M., Sherlock, R.E. & Koch, C. 2003 Automated event detection in underwater video. In Proceedings of the IEEE- OCEANS’03. San Diego, CA: IEEE Press, 2749–2753.
Edwards, M. & Richardson, A.J. 2004. Impact of climate change on marine pelagic phenology and trophic mismatch. Nature 430, 881–883.
Embleton, K.v., Gibson, C.E. & Heaney, S.I. 2003. Automated counting of phytoplankton by pattern recogni-tion: a comparison with a manual counting method. Journal of Plankton Research 25, 669–681.
European Commission for Research Infrastructures (ESFRI) 2011. Introduction. online. Available HTTP: http://cordis.europa.eu/esfri/roadmap.htm/ Accessed 7 July 2011.
European Multidisciplinary Seafloor observatory (EMSo) 2011. Home page. online. Available HTTP: http://www.emso- eu.org/ Accessed 7 June 2011.
Farina, A. & belgrano, A. 2004. The eco- field: a new paradigm for landscape ecology. Ecological Research 19, 107–110.
Favali, P. & beranzoli, l. 2006. Seafloor observatory science: a review. Annals of Geophysics 49, 515–567.Favali, P. & beranzoli, l. 2009. EMSo: European Multidisciplinary Seafloor observatory. Nuclear Instruments
and Methods in Physics Research A 602, 21–27.Favali, P., beranzoli, l., D’Anna, G., Gasparoni, F. & Gerber, H.w. 2006a. NEMo- SN1. The first ‘real- time’
seafloor observatory of ESoNET. Nuclear Instruments and Methods in Physics Research A 567/2, 462–467.
Favali, P., beranzoli, l., D’Anna, G., Gasparoni, F., Marvaldi, J., Clauss, G., Gerber, H.w., Nicot, M., Marani, M.P., Gamberi, F., Millot, C. & Flueh, E.R. 2006b. A fleet of multiparameter observatories for geophysi-cal and environmental monitoring at seafloor. Annals of Geophysics 49, 659–680.
Favali, P., beranzoli, l., Italiano, F., Migneco, E., Musumeci, M. & Papaleo, R. 2011. NEMo- SN1 obser-vatory developments in view of the European research infrastructures EMSo and KM3NeT. Nuclear Instruments and Methods in Physics Research Section A 626–627, 53–56.
Favali, P., Person, R., barnes, C.R., Kaneda y., Delaney, J.R. & Hsu, S.K. 2010. Seafloor observatory science. In Proceedings of the Observations and Information for Society conference (OceanObs’09): Sustained Ocean, J. Hall et al. (eds). venice, Italy: ESA, 306 only.
Findik, o., babaoğlua, I. & Ülkera, E. 2010. A colour image watermarking scheme based on hybrid classifica-tion method: particle swarm optimization and k- nearest neighbour algorithm. Optics Communications 283, 4916–4922.
Fock, H., uiblein, F., Koster, F. & von westernhagen, H. 2002. Diel and habitat- dependent resource utilisation by deep- sea fishes at the Great Meteor seamount: niche overlap and support for the sound scattering layer interception hypothesis. Marine Ecology Progress Series 244, 219–233.
Foxton, F. 1970a. The vertical distribution of pelagic decapods (Crustacea: Natantia) collected on the second cruise 1965. I. The Caridea. Journal of the Marine Biological Association of the United Kingdom 50, 939–960.
Foxton, F. 1970b. The vertical distribution of pelagic decapods (Crustacea: Natantia) collected on the second cruise 1965. II. The Penaeidea and general discussion. Journal of the Marine Biological Association of the United Kingdom 50, 961–1000.
Foxton, F. & Roe, H.S.J. 1974. observations on the nocturnal feeding of some mesopelagic decapod crustacea. Marine Biology 28, 37–49.
Fraenkel, P.l. 1986. Water lifting devices. Rome: Food & Agriculture organization of the united Nations (FAo), FAo Irrigation and Drainage Paper 43.
Frank, T.M. & widder, E.A. 2002. Effects of a decrease in downwelling irradiance on the daytime vertical distribution patterns of zooplankton and micronekton. Marine Biology 140, 1181–1193.
Franqueville, C. 1971. Macroplancton profond (Invertébrés) de la Méditerranée nord occidentale. Téthys 3, 11–56.
Frugoni, F., beranzoli, l., Favali, P. & basili, A. (eds) 2006. Special issue dedicated to Giuseppe Smriglio. From land networks to seafloor observatories. Annals of Geophysics 49, 515–879.
Fukuhara, C., Aguzzi, J., bullock, N.M. & Tosini, G. 2005. Effect of long term- exposure to constant dim light on the circadian system of rats. Neurosignals 14, 117–125.
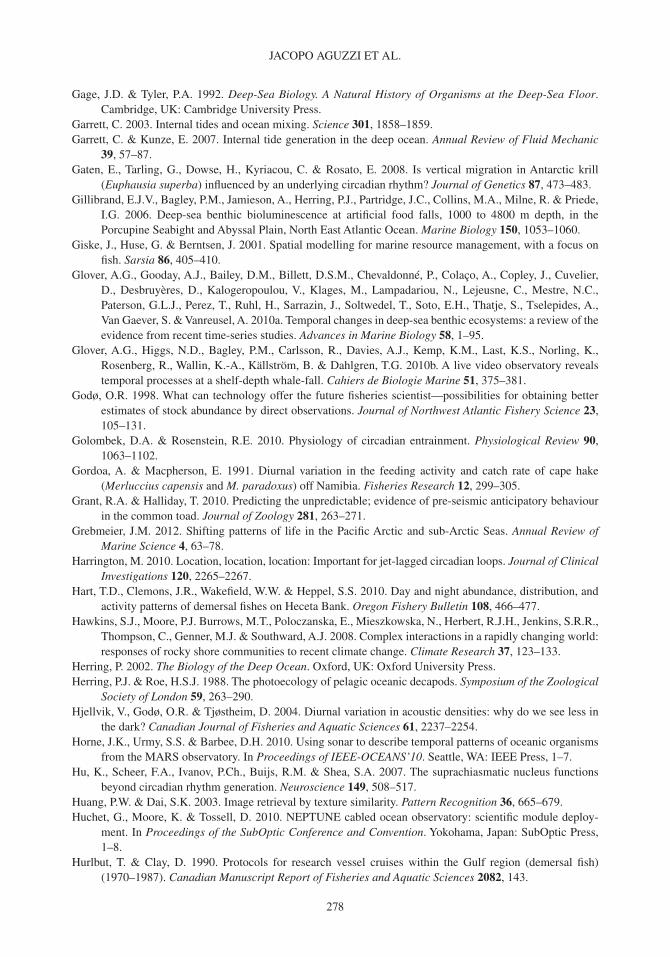
JACoPo AGuzzI ET Al.
278
Gage, J.D. & Tyler, P.A. 1992. Deep- Sea Biology. A Natural History of Organisms at the Deep- Sea Floor. Cambridge, uK: Cambridge university Press.
Garrett, C. 2003. Internal tides and ocean mixing. Science 301, 1858–1859.Garrett, C. & Kunze, E. 2007. Internal tide generation in the deep ocean. Annual Review of Fluid Mechanic
39, 57–87.Gaten, E., Tarling, G., Dowse, H., Kyriacou, C. & Rosato, E. 2008. Is vertical migration in Antarctic krill
(Euphausia superba) influenced by an underlying circadian rhythm? Journal of Genetics 87, 473–483.Gillibrand, E.J.v., bagley, P.M., Jamieson, A., Herring, P.J., Partridge, J.C., Collins, M.A., Milne, R. & Priede,
I.G. 2006. Deep- sea benthic bioluminescence at artificial food falls, 1000 to 4800 m depth, in the Porcupine Seabight and Abyssal Plain, North East Atlantic ocean. Marine Biology 150, 1053–1060.
Giske, J., Huse, G. & berntsen, J. 2001. Spatial modelling for marine resource management, with a focus on fish. Sarsia 86, 405–410.
Glover, A.G., Gooday, A.J., bailey, D.M., billett, D.S.M., Chevaldonné, P., Colaço, A., Copley, J., Cuvelier, D., Desbruyères, D., Kalogeropoulou, v., Klages, M., lampadariou, N., lejeusne, C., Mestre, N.C., Paterson, G.l.J., Perez, T., Ruhl, H., Sarrazin, J., Soltwedel, T., Soto, E.H., Thatje, S., Tselepides, A., van Gaever, S. & vanreusel, A. 2010a. Temporal changes in deep- sea benthic ecosystems: a review of the evidence from recent time- series studies. Advances in Marine Biology 58, 1–95.
Glover, A.G., Higgs, N.D., bagley, P.M., Carlsson, R., Davies, A.J., Kemp, K.M., last, K.S., Norling, K., Rosenberg, R., wallin, K.-A., Källström, b. & Dahlgren, T.G. 2010b. A live video observatory reveals temporal processes at a shelf- depth whale- fall. Cahiers de Biologie Marine 51, 375–381.
Godø, o.R. 1998. what can technology offer the future fisheries scientist—possibilities for obtaining better estimates of stock abundance by direct observations. Journal of Northwest Atlantic Fishery Science 23, 105–131.
Golombek, D.A. & Rosenstein, R.E. 2010. Physiology of circadian entrainment. Physiological Review 90, 1063–1102.
Gordoa, A. & Macpherson, E. 1991. Diurnal variation in the feeding activity and catch rate of cape hake (Merluccius capensis and M. paradoxus) off Namibia. Fisheries Research 12, 299–305.
Grant, R.A. & Halliday, T. 2010. Predicting the unpredictable; evidence of pre- seismic anticipatory behaviour in the common toad. Journal of Zoology 281, 263–271.
Grebmeier, J.M. 2012. Shifting patterns of life in the Pacific Arctic and sub-Arctic Seas. Annual Review of Marine Science 4, 63–78.
Harrington, M. 2010. location, location, location: Important for jet- lagged circadian loops. Journal of Clinical Investigations 120, 2265–2267.
Hart, T.D., Clemons, J.R., wakefield, w.w. & Heppel, S.S. 2010. Day and night abundance, distribution, and activity patterns of demersal fishes on Heceta bank. Oregon Fishery Bulletin 108, 466–477.
Hawkins, S.J., Moore, P.J. burrows, M.T., Poloczanska, E., Mieszkowska, N., Herbert, R.J.H., Jenkins, S.R.R., Thompson, C., Genner, M.J. & Southward, A.J. 2008. Complex interactions in a rapidly changing world: responses of rocky shore communities to recent climate change. Climate Research 37, 123–133.
Herring, P. 2002. The Biology of the Deep Ocean. oxford, uK: oxford university Press.Herring, P.J. & Roe, H.S.J. 1988. The photoecology of pelagic oceanic decapods. Symposium of the Zoological
Society of London 59, 263–290.Hjellvik, v., Godø, o.R. & Tjøstheim, D. 2004. Diurnal variation in acoustic densities: why do we see less in
the dark? Canadian Journal of Fisheries and Aquatic Sciences 61, 2237–2254.Horne, J.K., urmy, S.S. & barbee, D.H. 2010. using sonar to describe temporal patterns of oceanic organisms
from the MARS observatory. In Proceedings of IEEE- OCEANS’10. Seattle, wA: IEEE Press, 1–7.Hu, K., Scheer, F.A., Ivanov, P.Ch., buijs, R.M. & Shea, S.A. 2007. The suprachiasmatic nucleus functions
beyond circadian rhythm generation. Neuroscience 149, 508–517.Huang, P.w. & Dai, S.K. 2003. Image retrieval by texture similarity. Pattern Recognition 36, 665–679.Huchet, G., Moore, K. & Tossell, D. 2010. NEPTuNE cabled ocean observatory: scientific module deploy-
ment. In Proceedings of the SubOptic Conference and Convention. yokohama, Japan: Suboptic Press, 1–8.
Hurlbut, T. & Clay, D. 1990. Protocols for research vessel cruises within the Gulf region (demersal fish) (1970–1987). Canadian Manuscript Report of Fisheries and Aquatic Sciences 2082, 143.
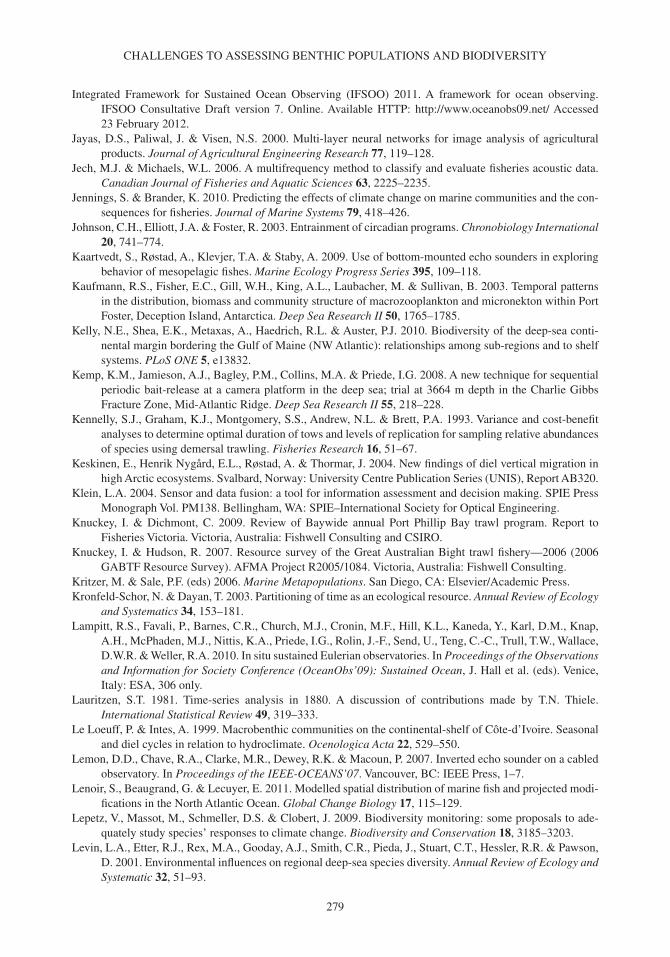
CHAllENGES To ASSESSING bENTHIC PoPulATIoNS AND bIoDIvERSITy
279
Integrated Framework for Sustained ocean observing (IFSoo) 2011. A framework for ocean observing. IFSoo Consultative Draft version 7. online. Available HTTP: http://www.oceanobs09.net/ Accessed 23 February 2012.
Jayas, D.S., Paliwal, J. & visen, N.S. 2000. Multi- layer neural networks for image analysis of agricultural products. Journal of Agricultural Engineering Research 77, 119–128.
Jech, M.J. & Michaels, w.l. 2006. A multifrequency method to classify and evaluate fisheries acoustic data. Canadian Journal of Fisheries and Aquatic Sciences 63, 2225–2235.
Jennings, S. & brander, K. 2010. Predicting the effects of climate change on marine communities and the con-sequences for fisheries. Journal of Marine Systems 79, 418–426.
Johnson, C.H., Elliott, J.A. & Foster, R. 2003. Entrainment of circadian programs. Chronobiology International 20, 741–774.
Kaartvedt, S., Røstad, A., Klevjer, T.A. & Staby, A. 2009. use of bottom- mounted echo sounders in exploring behavior of mesopelagic fishes. Marine Ecology Progress Series 395, 109–118.
Kaufmann, R.S., Fisher, E.C., Gill, w.H., King, A.l., laubacher, M. & Sullivan, b. 2003. Temporal patterns in the distribution, biomass and community structure of macrozooplankton and micronekton within Port Foster, Deception Island, Antarctica. Deep Sea Research II 50, 1765–1785.
Kelly, N.E., Shea, E.K., Metaxas, A., Haedrich, R.l. & Auster, P.J. 2010. biodiversity of the deep- sea conti-nental margin bordering the Gulf of Maine (Nw Atlantic): relationships among sub- regions and to shelf systems. PLoS ONE 5, e13832.
Kemp, K.M., Jamieson, A.J., bagley, P.M., Collins, M.A. & Priede, I.G. 2008. A new technique for sequential periodic bait- release at a camera platform in the deep sea; trial at 3664 m depth in the Charlie Gibbs Fracture zone, Mid- Atlantic Ridge. Deep Sea Research II 55, 218–228.
Kennelly, S.J., Graham, K.J., Montgomery, S.S., Andrew, N.l. & brett, P.A. 1993. variance and cost- benefit analyses to determine optimal duration of tows and levels of replication for sampling relative abundances of species using demersal trawling. Fisheries Research 16, 51–67.
Keskinen, E., Henrik Nygård, E.l., Røstad, A. & Thormar, J. 2004. New findings of diel vertical migration in high Arctic ecosystems. Svalbard, Norway: university Centre Publication Series (uNIS), Report Ab320.
Klein, l.A. 2004. Sensor and data fusion: a tool for information assessment and decision making. SPIE Press Monograph vol. PM138. bellingham, wA: SPIE–International Society for optical Engineering.
Knuckey, I. & Dichmont, C. 2009. Review of baywide annual Port Phillip bay trawl program. Report to Fisheries victoria. victoria, Australia: Fishwell Consulting and CSIRo.
Knuckey, I. & Hudson, R. 2007. Resource survey of the Great Australian bight trawl fishery—2006 (2006 GAbTF Resource Survey). AFMA Project R2005/1084. victoria, Australia: Fishwell Consulting.
Kritzer, M. & Sale, P.F. (eds) 2006. Marine Metapopulations. San Diego, CA: Elsevier/Academic Press.Kronfeld- Schor, N. & Dayan, T. 2003. Partitioning of time as an ecological resource. Annual Review of Ecology
and Systematics 34, 153–181.lampitt, R.S., Favali, P., barnes, C.R., Church, M.J., Cronin, M.F., Hill, K.l., Kaneda, y., Karl, D.M., Knap,
A.H., McPhaden, M.J., Nittis, K.A., Priede, I.G., Rolin, J.-F., Send, u., Teng, C.-C., Trull, T.w., wallace, D.w.R. & weller, R.A. 2010. In situ sustained Eulerian observatories. In Proceedings of the Observations and Information for Society Conference (OceanObs’09): Sustained Ocean, J. Hall et al. (eds). venice, Italy: ESA, 306 only.
lauritzen, S.T. 1981. Time- series analysis in 1880. A discussion of contributions made by T.N. Thiele. International Statistical Review 49, 319–333.
le loeuff, P. & Intes, A. 1999. Macrobenthic communities on the continental- shelf of Cote- d’Ivoire. Seasonal and diel cycles in relation to hydroclimate. Ocenologica Acta 22, 529–550.
lemon, D.D., Chave, R.A., Clarke, M.R., Dewey, R.K. & Macoun, P. 2007. Inverted echo sounder on a cabled observatory. In Proceedings of the IEEE- OCEANS’07. vancouver, bC: IEEE Press, 1–7.
lenoir, S., beaugrand, G. & lecuyer, E. 2011. Modelled spatial distribution of marine fish and projected modi-fications in the North Atlantic ocean. Global Change Biology 17, 115–129.
lepetz, v., Massot, M., Schmeller, D.S. & Clobert, J. 2009. biodiversity monitoring: some proposals to ade-quately study species’ responses to climate change. Biodiversity and Conservation 18, 3185–3203.
levin, l.A., Etter, R.J., Rex, M.A., Gooday, A.J., Smith, C.R., Pieda, J., Stuart, C.T., Hessler, R.R. & Pawson, D. 2001. Environmental influences on regional deep- sea species diversity. Annual Review of Ecology and Systematic 32, 51–93.
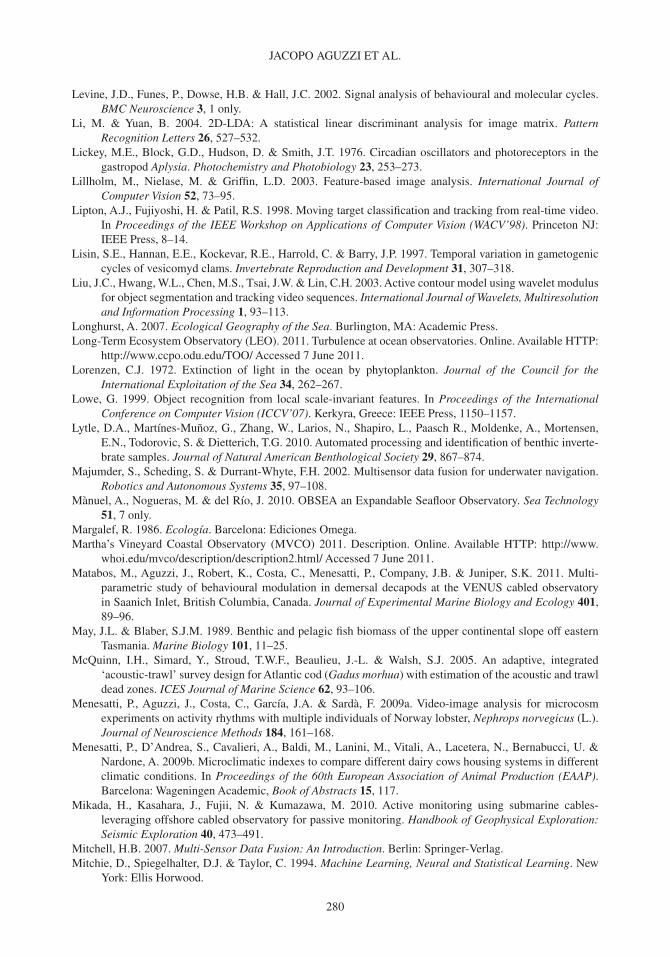
JACoPo AGuzzI ET Al.
280
levine, J.D., Funes, P., Dowse, H.b. & Hall, J.C. 2002. Signal analysis of behavioural and molecular cycles. BMC Neuroscience 3, 1 only.
li, M. & yuan, b. 2004. 2D- lDA: A statistical linear discriminant analysis for image matrix. Pattern Recognition Letters 26, 527–532.
lickey, M.E., block, G.D., Hudson, D. & Smith, J.T. 1976. Circadian oscillators and photoreceptors in the gastropod Aplysia. Photochemistry and Photobiology 23, 253–273.
lillholm, M., Nielase, M. & Griffin, l.D. 2003. Feature- based image analysis. International Journal of Computer Vision 52, 73–95.
lipton, A.J., Fujiyoshi, H. & Patil, R.S. 1998. Moving target classification and tracking from real- time video. In Proceedings of the IEEE Workshop on Applications of Computer Vision (WACV’98). Princeton NJ: IEEE Press, 8–14.
lisin, S.E., Hannan, E.E., Kockevar, R.E., Harrold, C. & barry, J.P. 1997. Temporal variation in gametogenic cycles of vesicomyd clams. Invertebrate Reproduction and Development 31, 307–318.
liu, J.C., Hwang, w.l., Chen, M.S., Tsai, J.w. & lin, C.H. 2003. Active contour model using wavelet modulus for object segmentation and tracking video sequences. International Journal of Wavelets, Multiresolution and Information Processing 1, 93–113.
longhurst, A. 2007. Ecological Geography of the Sea. burlington, MA: Academic Press.long- Term Ecosystem observatory (lEo). 2011. Turbulence at ocean observatories. online. Available HTTP:
http://www.ccpo.odu.edu/Too/ Accessed 7 June 2011.lorenzen, C.J. 1972. Extinction of light in the ocean by phytoplankton. Journal of the Council for the
International Exploitation of the Sea 34, 262–267.lowe, G. 1999. object recognition from local scale- invariant features. In Proceedings of the International
Conference on Computer Vision (ICCV’07). Kerkyra, Greece: IEEE Press, 1150–1157.lytle, D.A., Martínes- Muñoz, G., zhang, w., larios, N., Shapiro, l., Paasch R., Moldenke, A., Mortensen,
E.N., Todorovic, S. & Dietterich, T.G. 2010. Automated processing and identification of benthic inverte-brate samples. Journal of Natural American Benthological Society 29, 867–874.
Majumder, S., Scheding, S. & Durrant- whyte, F.H. 2002. Multisensor data fusion for underwater navigation. Robotics and Autonomous Systems 35, 97–108.
Mànuel, A., Nogueras, M. & del Río, J. 2010. obSEA an Expandable Seafloor observatory. Sea Technology 51, 7 only.
Margalef, R. 1986. Ecología. barcelona: Ediciones omega.Martha’s vineyard Coastal observatory (MvCo) 2011. Description. online. Available HTTP: http://www.
whoi.edu/mvco/description/description2.html/ Accessed 7 June 2011.Matabos, M., Aguzzi, J., Robert, K., Costa, C., Menesatti, P., Company, J.b. & Juniper, S.K. 2011. Multi-
parametric study of behavioural modulation in demersal decapods at the vENuS cabled observatory in Saanich Inlet, british Columbia, Canada. Journal of Experimental Marine Biology and Ecology 401, 89–96.
May, J.l. & blaber, S.J.M. 1989. benthic and pelagic fish biomass of the upper continental slope off eastern Tasmania. Marine Biology 101, 11–25.
Mcquinn, I.H., Simard, y., Stroud, T.w.F., beaulieu, J.-l. & walsh, S.J. 2005. An adaptive, integrated ‘acoustic- trawl’ survey design for Atlantic cod (Gadus morhua) with estimation of the acoustic and trawl dead zones. ICES Journal of Marine Science 62, 93–106.
Menesatti, P., Aguzzi, J., Costa, C., García, J.A. & Sardà, F. 2009a. video- image analysis for microcosm experiments on activity rhythms with multiple individuals of Norway lobster, Nephrops norvegicus (l.). Journal of Neuroscience Methods 184, 161–168.
Menesatti, P., D’Andrea, S., Cavalieri, A., baldi, M., lanini, M., vitali, A., lacetera, N., bernabucci, u. & Nardone, A. 2009b. Microclimatic indexes to compare different dairy cows housing systems in different climatic conditions. In Proceedings of the 60th European Association of Animal Production (EAAP). barcelona: wageningen Academic, Book of Abstracts 15, 117.
Mikada, H., Kasahara, J., Fujii, N. & Kumazawa, M. 2010. Active monitoring using submarine cables- leveraging offshore cabled observatory for passive monitoring. Handbook of Geophysical Exploration: Seismic Exploration 40, 473–491.
Mitchell, H.b. 2007. Multi- Sensor Data Fusion: An Introduction. berlin: Springer- verlag.Mitchie, D., Spiegelhalter, D.J. & Taylor, C. 1994. Machine Learning, Neural and Statistical Learning. New
york: Ellis Horwood.
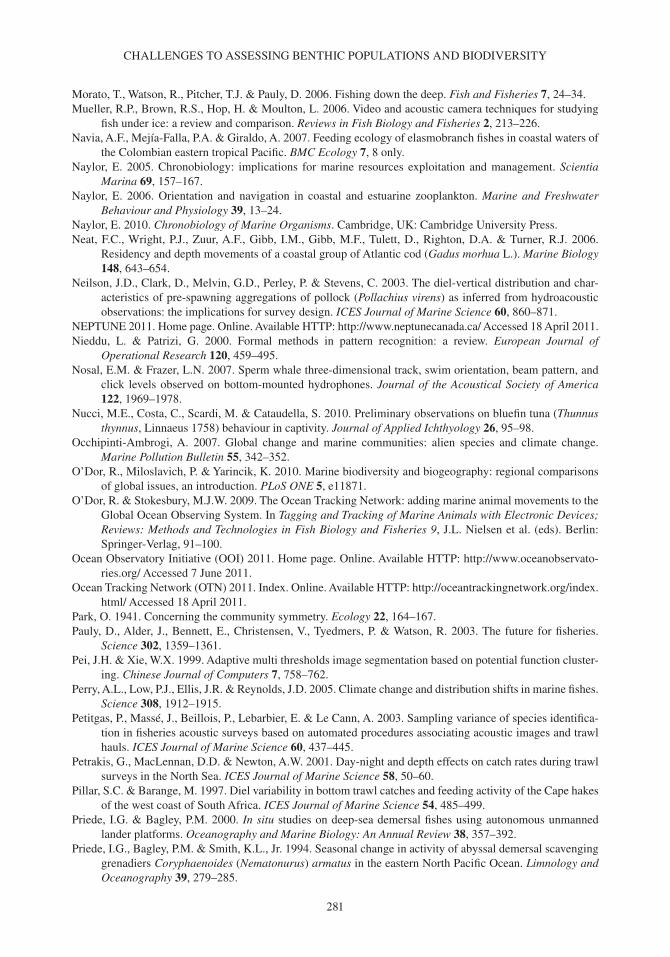
CHAllENGES To ASSESSING bENTHIC PoPulATIoNS AND bIoDIvERSITy
281
Morato, T., watson, R., Pitcher, T.J. & Pauly, D. 2006. Fishing down the deep. Fish and Fisheries 7, 24–34.Mueller, R.P., brown, R.S., Hop, H. & Moulton, l. 2006. video and acoustic camera techniques for studying
fish under ice: a review and comparison. Reviews in Fish Biology and Fisheries 2, 213–226.Navia, A.F., Mejía- Falla, P.A. & Giraldo, A. 2007. Feeding ecology of elasmobranch fishes in coastal waters of
the Colombian eastern tropical Pacific. BMC Ecology 7, 8 only.Naylor, E. 2005. Chronobiology: implications for marine resources exploitation and management. Scientia
Marina 69, 157–167.Naylor, E. 2006. orientation and navigation in coastal and estuarine zooplankton. Marine and Freshwater
Behaviour and Physiology 39, 13–24.Naylor, E. 2010. Chronobiology of Marine Organisms. Cambridge, uK: Cambridge university Press.Neat, F.C., wright, P.J., zuur, A.F., Gibb, I.M., Gibb, M.F., Tulett, D., Righton, D.A. & Turner, R.J. 2006.
Residency and depth movements of a coastal group of Atlantic cod (Gadus morhua l.). Marine Biology 148, 643–654.
Neilson, J.D., Clark, D., Melvin, G.D., Perley, P. & Stevens, C. 2003. The diel- vertical distribution and char-acteristics of pre- spawning aggregations of pollock (Pollachius virens) as inferred from hydroacoustic observations: the implications for survey design. ICES Journal of Marine Science 60, 860–871.
NEPTuNE 2011. Home page. online. Available HTTP: http://www.neptunecanada.ca/ Accessed 18 April 2011.Nieddu, l. & Patrizi, G. 2000. Formal methods in pattern recognition: a review. European Journal of
Operational Research 120, 459–495.Nosal, E.M. & Frazer, l.N. 2007. Sperm whale three- dimensional track, swim orientation, beam pattern, and
click levels observed on bottom- mounted hydrophones. Journal of the Acoustical Society of America 122, 1969–1978.
Nucci, M.E., Costa, C., Scardi, M. & Cataudella, S. 2010. Preliminary observations on bluefin tuna (Thunnus thynnus, linnaeus 1758) behaviour in captivity. Journal of Applied Ichthyology 26, 95–98.
occhipinti- Ambrogi, A. 2007. Global change and marine communities: alien species and climate change. Marine Pollution Bulletin 55, 342–352.
o’Dor, R., Miloslavich, P. & yarincik, K. 2010. Marine biodiversity and biogeography: regional comparisons of global issues, an introduction. PLoS ONE 5, e11871.
o’Dor, R. & Stokesbury, M.J.w. 2009. The ocean Tracking Network: adding marine animal movements to the Global ocean observing System. In Tagging and Tracking of Marine Animals with Electronic Devices; Reviews: Methods and Technologies in Fish Biology and Fisheries 9, J.l. Nielsen et al. (eds). berlin: Springer- verlag, 91–100.
ocean observatory Initiative (ooI) 2011. Home page. online. Available HTTP: http://www.oceanobservato-ries.org/ Accessed 7 June 2011.
ocean Tracking Network (oTN) 2011. Index. online. Available HTTP: http://oceantrackingnetwork.org/index.html/ Accessed 18 April 2011.
Park, o. 1941. Concerning the community symmetry. Ecology 22, 164–167.Pauly, D., Alder, J., bennett, E., Christensen, v., Tyedmers, P. & watson, R. 2003. The future for fisheries.
Science 302, 1359–1361.Pei, J.H. & xie, w.x. 1999. Adaptive multi thresholds image segmentation based on potential function cluster-
ing. Chinese Journal of Computers 7, 758–762.Perry, A.l., low, P.J., Ellis, J.R. & Reynolds, J.D. 2005. Climate change and distribution shifts in marine fishes.
Science 308, 1912–1915.Petitgas, P., Massé, J., beillois, P., lebarbier, E. & le Cann, A. 2003. Sampling variance of species identifica-
tion in fisheries acoustic surveys based on automated procedures associating acoustic images and trawl hauls. ICES Journal of Marine Science 60, 437–445.
Petrakis, G., Maclennan, D.D. & Newton, A.w. 2001. Day- night and depth effects on catch rates during trawl surveys in the North Sea. ICES Journal of Marine Science 58, 50–60.
Pillar, S.C. & barange, M. 1997. Diel variability in bottom trawl catches and feeding activity of the Cape hakes of the west coast of South Africa. ICES Journal of Marine Science 54, 485–499.
Priede, I.G. & bagley, P.M. 2000. In situ studies on deep- sea demersal fishes using autonomous unmanned lander platforms. Oceanography and Marine Biology: An Annual Review 38, 357–392.
Priede, I.G., bagley, P.M. & Smith, K.l., Jr. 1994. Seasonal change in activity of abyssal demersal scavenging grenadiers Coryphaenoides (Nematonurus) armatus in the eastern North Pacific ocean. Limnology and Oceanography 39, 279–285.
JACoPo AGuzzI ET Al.
282
Priede, I.G., Deary, A.R., bailey, D.M. & Smith, K.l. 2003. low activity and seasonal change in population size structure of grenadiers in the oligotrophic abyssal central North Pacific ocean. Journal of Fish Biology 63,187–196.
Priede, I.G., Godbold, J.A., Niedzielski, T., Collins, M.A., bailey, D.M., Gordon, J.D.M. & zuur, A.F. 2011. A review of the spatial extent of fishery effects and species vulnerability of the deep- sea demersal fish assemblage of the Porcupine Seabight, northeast Atlantic ocean (ICES Subarea vII). ICES Journal of Marine Science 68, 281–289.
Priede, M., Solan, M., Mienert, J., Person, R., van weering, T.C.E., Pfannkuche, o., o’Neill, N., Tselepides, A., Thomsen, l., Favali, P., Gasparoni, F., zitellini, N., Millot, A., Gerber, H.w., DeMiranda, J.M.A., Klages, M. & Sigray, P. 2004. ESoNET—European Sea Floor observatory Network. In Proceedings of the IEEE- OCEANS’04. Kobe, Japan: IEEE Press, 2155–2163.
Priede, I.G., Jamieson, A., Heger, A., Craig, J. & zuur, A.F. 2008. The potential influence of bioluminescence from marine animals on a deep- sea underwater neutrino telescope array in the Mediterranean Sea. Deep Sea Research I 55, 1474–1483.
Priede, I.G., williams, l.M., wagner, H.-J., Thom, A., brierley, I., Collins, M.A., Collin, S.P., Merrett, N.R. & yau, C. 1999. Implication of the visual system in regulation of activity cycles in the absence of solar light: 2-[125I]iodomelatonin binding sites and melatonin receptor gene expression in the brains of demersal deep- sea gadiform fishes. Proceedings of the Royal Society Series B 26, 2295–2302.
Pulcini, D., Costa, C., Aguzzi, J. & Cataudella, S. 2008. light and shape: a contribution to demonstrate mor-phological differences in diurnal and nocturnal teleosts. Journal of Morphology 269, 375–385.
Pusc, C., Fock, H., Porteiro, F.M. & von westernhagen, H. 2002. Interaction of mesopelagic fish and shallow topography in different latitudes of the NE Atlantic. ICES theme session on oceanography and ecology of seamounts: indications of unique ecosystems, Copenhagen, Denmark. CM 2002/M:10.
Raffaelli, D., bell, E., weithoff, G., Matsumoto, A., Cruz- Motta, J.J., Kershaw, P., Parker, R., Parry, D. & Jones, M. 2003. The ups and downs of benthic ecology: considerations of scale, heterogeneity and surveillance for benthic- pelagic coupling. Journal of Experimental Marine Biology and Ecology 285–286, 191–203.
Ramirez- llodra, E., brandt, A., Danovaro, R., De Mol, b., Escobar, E., German, C.R., levin, l.A., Martinez- Arbizu, P., Menot, l., buhl- Mortensen, P., Narayanaswamy, b.E., Smith, C.R., Tittensor, D.P., Tyler, P.A., vanreusel, A. & vecchione, M. 2010. Deep, diverse and definitely different: unique attributes of the world’s largest ecosystem. Biogeosciences 7, 2851–2899.
Reebs, S.G. 2002. Plasticity of diel and circadian activity rhythms in fishes. Reviews of Fish Biology and Fisheries 12, 349–371.
Refinetti, R. 2006. Circadian Physiology. New york: Taylor & Francis.Reier Knudsen, F. & larsson, P. 2009. Discriminating the diel vertical migration of fish and Chaoborus flavi-
cans larvae in a lake using a dual- frequency echo sounder. Aquatic Living Resources 22, 273–280.Relini, G. & Piccinetti, C. 1994. Ten years of trawl surveys in Italian Seas (1985–1995). FAO Fishery Report
533, 21–41.Roberts, C.M. 2002. Deep impact: the rising toll of fishing in the deep- sea. Trends in Ecology and Evolution
17, 242–245.Roberts, P.D., Jaffe J.S. & Trivedi, M.M. 2011. Multiview, broadband acoustic classification of marine fish: a
machine learning framework and comparative analysis. IEEE Journal of Oceanic Engineering 36, 90–104.Roessig, J.M., woodley, C.M., Cech, J.J., Jr. & Hansen, l.J. 2004. Effects of global climate change on marine
and estuarine fishes and fisheries. Reviews of Fish Biology and Fisheries 14, 251–275.Roff, J.C. & Evans, S.M.J. 2002. Frameworks for marine conservation: non- hierarchical approaches and dis-
tinctive habitats. Aquatic Conservation: Marine and Freshwater Ecosystems 12, 635–648.Roff, J.C. & Taylor, M.E. 2000. National frameworks for marine conservation—a hierarchical geophysical
approach. Aquatic Conservation: Marine and Freshwater Ecosystems 10, 209–223.Rohlf, F.J. & Archie, J.w. 1984. A comparison of Fourier methods for the description of wing shape in mosqui-
toes (Diptera: Culicidae). Systems Biology 33, 302–317.Ruhl, H.A., André, M., beranzoli, l., Çağatay, N.M., Colaço, A., Cannat, M., Dañobeitia, J.J., Favali, P.,
Géli, l., Gillooly, M., Greinert, J., Hall, P.o.J., Huber, R., Karstensen, J., lampitt, R.S., larkin, K.E., lykousis, v., Mienert, J., Miranda, J.M., Person, R., Priede, I.G., Puillat, I., Thomsen, l. & waldmann, C. 2011. open- ocean observatories in Europe. Progress in Oceanography in press.
CHAllENGES To ASSESSING bENTHIC PoPulATIoNS AND bIoDIvERSITy
283
Ryer, C.H., Rose, C.S. & Iseri, P.J. 2010. Flatfish herding behaviour in response to trawl sweeps: a comparison of diel responses to conventional sweeps and elevated sweeps. Fishery Bulletin 108, 145–154.
Sardà, F., Company, J.b. & Castellón, A. 2003. Intraspecific aggregation structure of a shoal of western Mediterranean (Catalan coast) deep- sea shrimp, Aristeus antennatus (Risso, 1816), during the reproduc-tive period. Journal of Shellfish Research 22, 569–579.
Sardà, F., D’onghia, G., Politou, C.y. & Tselepides, A. (eds) 2004. Mediterranean deep- sea biology. Scientia Marina 68, 1–204.
Sarriá, D., Molino, E., Rotllant, G., Mànuel, A., Aguzzi, J. & Sardà, F. 2011. Monitoring species in artificial reefs using acoustic communications. Instrumentation Viewpoint 11, 48 only.
Sassa, C., Tsukamoto, y., yamamoto, K. & Tokimura, M. 2010. Spatio- temporal distribution and biomass of Benthosema pterotum (Pisces: Myctophidae) in the shelf region of the East China Sea. Marine Ecology Progress Series 407, 227–241.
Shannon, C.E. 1949. Communication in the presence of noise. Proceedings of the Institute of Radio Engineers 37, 10–21.
Sheppard, D.C. 2000. Seas at the Millennium: An Environmental Evaluation. Global Issues and Processes. Amsterdam: Pergamon Press.
Sherman, A.D. & Smith, Jr., K.l. 2009. Deep- sea benthic boundary layer communities and food supply: a long- term monitoring strategy. Deep Sea Research II 56, 1754–1762.
Shotton, D.M., Rodriguez, A., Guil, N. & Trelles, o. 2000. object tracking and event recognition in bio-logical microscopy videos. In Proceedings of the 15th International Conference on Pattern Recognition (ICPR’2000). barcelona: IEEE Press, 226–229.
Simmonds, E.J., Armstrong, F. & Copland, P.J. 1996. Species identification using wideband backscatter with neural network and discriminant analysis. ICES Journal of Marine Science 53, 189–195.
Smith, A., Priede, I.G., bagley, P.M. & Addison, S.w. 1997. Interception and dispersal of artificial food falls by scavenging fishes in the abyssal NE Atlantic: early season observations prior to annual deposition of phytodetritus. Marine Biology 128, 329–336.
Smith, C.R. & baco, A.R. 2003. Ecology of whale falls at the deep- sea floor. Oceanography and Marine Biology: An Annual Review 41, 311–354.
Smith, K.l., Kaufmann, R.S. & wakefield, w.w. 1993. Mobile megafaunal activity monitored with a time- lapse camera in the abyssal North Pacific. Deep Sea Research I 411, 2307–2324.
Smith, K.l., Ruhl, H.A., bett, b.J., billett, D.S.M., lampitt, R.S. & Kaufmann, R.S. 2009. Climate, carbon cycling, and deep- ocean ecosystems. Proceedings of the National Academy of Sciences 106, 19211–19218.
Somot, S., Sevault, F. & Déqué, M. 2006. Transient climate change scenario simulation of the Mediterranean Sea for the twenty- first century using a high- resolution ocean circulation model. Climate Dynamics 27, 851–879.
Spampinato, C., Chen- burger, y.-H., Nadarajan, G. & Fisher, R.b. 2008. Detecting, tracking and counting fish in low quality unconstrained underwater videos. In Proceedings of the Third International Conference on Computer Vision Theory and Applications (VISAPP’8). Madeira, Portugal: vISAPP Press, 514–519.
Stephens, J.S., Jr., Hose, J.E. & love, M.S. 1988. Fish assemblages as indicators of environmental change in nearshore environments. In Marine Organisms as Indicators, D.F. Soule & G.S. Keppel (eds). berlin: Springer, 91–105.
Stoner, A.w., Ryer, C.H., Parker, S.J., Auster, P.J. & wakefield, w.w. 2008. Evaluating the role of fish behav-iour in surveys conducted with underwater vehicles. Canadian Journal of Fish and Aquatic Sciences 65, 1230–1243.
Storbeck, F. & Daan, b. 2001. Fish species recognition using computer vision and a neural network. Fisheries Research 51, 11–15.
Strachan, N.J.C. & Nesvadba, P. 1990. Fish species recognition by shape analysis of images. Pattern Recognition 23, 539–544.
Suetsugu, K. & otha, S. 2005. Day and nighttime changes in species composition of deep- sea demersal fishes. Journal of Oceanography 61, 187–196.
Tobar, R. & Sardà, F. 1992. Annual and diel light cycle as a predictive factor in the fisheries for the prawn (Aristeus antennatus Risso, 1816). Fisheries Research 15, 169–179.
Tosini, G. & Aguzzi, J. 2005. Effects of space flight on circadian rhythms. In Experimentation with the Animal Model in Space, G. Sonnenfield (ed.). Amsterdam: Elsevier, 165–174.
JACoPo AGuzzI ET Al.
284
Tosini, G., Aguzzi, J., bullock, N.M., liu, C. & Kasamatsu, M. 2007. Effect of photoreceptor degeneration on circadian photoreception and free- running period in the Royal College of Surgeons rat. Brain Research 1148, 76–82.
Toth, D. & Aach, T. 2003. Detection and recognition of moving objects using statistical motion detection and Fourier descriptors. In Proceedings of the 12th International Conference on Image Analysis and Processing (ICIAP’03). los Alamitos, CA: IEEE Press, 430–435.
Trenkel, v.M., lorance, P. & Mahévas, S. 2004. Do visual transects provide true population density estimates for deepwater fish? ICES Journal of Marine Science 61, 1050–1056.
Tyler, P.A., Campos- Creasy, l.S. & Giles, l.A. 1994. Environmental control of quasi- continuous and sea-sonal reproduction in deep- sea benthic invertebrates. In Reproduction, Larval Biology and Recruitment of the Deep- Sea Benthos, C.M. young & K.J. Eckelbarger (eds). New york: Columbia university Press, 158–178.
veeraraghavan, A., Roy- Chowdhury, A.K. & Chellappa, R. 2005. Matching shape sequences in video with applications in human movement analysis. IEEE Transactions on Pattern Analysis and Machine Intelligence 27, 1896–1909.
vivekanandan, E., Mweyiappan, E.E., Mohanraj, G., Nammalwar, P., Thangaraj, S.v. & Sarvesan, R. 2002. Marine fishery resources off Chennai: landings by day and night trawlers. In Proceedings of the Fifth Indian Fishery Forum, S. Ayyappan et al. (eds). orissa, India: Asian Fishery Society, Indian branch (AFSIb), Mangalore, and AoA, 331–334.
voss, R. & zeil, J. 1995. Automatic tracking of complex objects under natural conditions. Biological Cybernetics 73, 415–423.
wagner, H.J., Kemp, K., Mattheus, u. & Priede, I.G. 2007. Rhythms at the bottom of the deep- sea: cyclic current flow changes and melatonin patterns in two species of demersal fish. Deep Sea Research I 54, 1944–1956.
walther, D., Edgington, D.R. & Koch, C. 2004. Detection and tracking of objects in underwater video. In Proceedings of the IEEE Computer Society Conference on Computer Vision and Pattern Recognition (CVPR’04). washington, DC: IEEE Press, 544–549.
walther, G.R., Post, E., Convey, P., Menzel, A., Parmesan, C., beebee, T.J., Fromentin, J.M., Hoegh- Guldberg, o. & bairlein, F. 2002. Ecological responses to recent climate change. Nature 416, 389–395.
waterman, T. 2001. Evolutionary challenges of extreme environments (part 2). Journal of Experimental Zoology 291, 130–168.
watson, w.H., bedford, l. & Chabot, C.C. 2008. Rhythms of locomotion expressed by Limulus polyphe-mus, the American horseshoe crab: II. Relationship to circadian rhythms of visual sensitivity. Biological Bulletin 215, 46–56.
welsh, D.K., Takahashi, J.S. & Kay, S.A. 2010. Suprachiasmatic nucleus: cell autonomy and network proper-ties. Annual Review of Physiology 72, 551–577.
whittaker, R.H., levin, S.A. & Root, R.b. 1973. Niche, habitat, and ecotope. The American Naturalist 107, 321–338.
widder, E.A., Robison, b.H., Reisenbichler, K.R. & Haddock, S.D.H. 2005. using red light for in situ obser-vations of deep- sea fishes. Deep Sea Research 52, 2077–2085.
williams, R.N., lambert, T.J., Kelsall, A.F. & Pauly, T. 2006. Detecting marine animals in underwater video: let’s start with salmon. In Proceedings of the 12th Americas Conference on Information Systems (AMCIS). Acapulco, Mexico: AMCIS Press, 1482–1490.
witte, u., Aberle, N., Sand, M. & wenzhöfer, F. 2003a. Rapid response of a deep- sea benthic community to PoM enrichment: an in situ experimental study. Marine Ecology Progress Series 251, 27–36.
witte, u., wenzhöfer, F., Sommer, S., boetius, A., Heinz, P., Aberle, N., Sand, M., Cremer, A., Abraham, w.R., Jørgensen, b.b. & Pfannkuche, o. 2003b. In situ experimental evidence of the fate of a phytodetritus pulse at the abyssal sea floor. Nature 424, 763–766.
wu, w., Mallet, y., walczak, b., Penninckx, w., Massart, D.l., Heuerding, S. & Erni, F. 1996. Comparison of regularized discriminant analysis linear discriminant analysis and quadratic discriminant analysis applied to NIR data. Analytica Chimica Acta 329, 257–265.
yamada, y. & Forger, D. 2010. Multiscale complexity in the mammalian circadian clock. Current Opinion in Genetic and Development 20, 626–633.
CHAllENGES To ASSESSING bENTHIC PoPulATIoNS AND bIoDIvERSITy
285
yamazaki, S., Numano, R., Abe, M., Hida, A., Takahashi, R., ueda, M., block, G.D., Sakaki, y., Menaker, M. & Tei, H. 2000. Resetting central and peripheral circadian oscillators in transgenic rats. Science 288, 682 only.
young, C.M. 2003. Reproduction, development and life- history traits. In Ecosystems of the Deep Oceans, P.A. Tyler (ed.). Amsterdam: Elsevier, 381–426.
yousif, A. & Sabrah, M.M. 2004. Catchability of the red mullet (Upeneus spp.) from north- west Red Sea during autumn. Egyptian Journal of Aquatic Research 30, 290–305.
zaret, T.M. & Suffern, J.S. 1976. vertical migration in zooplankton as a predator avoidance mechanism. Limnological Oceanography 21, 804–813.

Related Documents