CHALLENGES THAT FACE IMPORT TARIFFS REVENUE COLLECTION IN ZANZIBAR HAWA HUSSEIN JUMA A DISSERTATION SUBMITTED IN PARTIAL FULFILMENT OF THE REQUIREMENTS FOR THE DEGREE OF MASTER OF BUSINESS ADMINISTRATION OF THE OPEN UNIVERSITY OF TANZANIA 2013 brought to you by CORE View metadata, citation and similar papers at core.ac.uk provided by Digital Library of Open University of Tanzania

Welcome message from author
This document is posted to help you gain knowledge. Please leave a comment to let me know what you think about it! Share it to your friends and learn new things together.
Transcript

CHALLENGES THAT FACE IMPORT TARIFFS REVENUE COLLECTION
IN ZANZIBAR
HAWA HUSSEIN JUMA
A DISSERTATION SUBMITTED IN PARTIAL FULFILMENT OF THE
REQUIREMENTS FOR THE DEGREE OF MASTER OF BUSINESS
ADMINISTRATION OF THE OPEN UNIVERSITY OF TANZANIA
2013
brought to you by COREView metadata, citation and similar papers at core.ac.uk
provided by Digital Library of Open University of Tanzania

ii
CERTIFICATION
The undersigned certifies that he has read and hereby recommends for acceptance by
the Open University of Tanzania a dissertation entitled: The Challenges that Face
Import Tariffs Revenue Collection in Zanzibar in partial fulfilment of the
requirements of the degree of Master of Business Administration of the Open
University of Tanzania.
……………………………………………………
Dr. Hamed R. H. Hikmany
(Supervisor)
…………………………………………
Date

iii
COPYRIGHT
No part of this dissertation may be reproduced, stored in any retrieval system, or
transmitted in any form by any means, electronic, mechanical, photocopying,
recording or otherwise without prior written permission of the author or the Open
University of Tanzania in that behalf.

iv
DECLARATION
I, Hawa Hussein Juma do hereby declare that this dissertation is my own original
work and that it has not been presented and will not be presented to any academic or
non- academic institution, and that to the best of my knowledge and understanding it
does not contain any materials previously published or written by another
academician except where due respect and reference clearly indicated in this
dissertation.
……………………………………………
Hawa Hussein Juma
…………………………………………
Date

v
DEDICATION
This work is dedicated to my lovely children; Ali, Hussein and Zinduna for the love
and patience which they showed me during all the times I have been concentrating to
the completion of study.

vi
ACKNOWLEDGEMENT
I would like to thank The ALMIGHT ALLAH who always blesses and guides me in
my academic and non-academic success. The succession of the dissertation is a result
of the suggestions, opinions and material support by the different institutions and
individuals who are greatly appreciated. It is not possible to mention all those who
have provided some form of support in this work. Hence I would like to take this
opportunity to thank all of them. However, there are some people who deserve
special mention and expression of thanks from me.
In the first place I am heartily thankful to my sponsor who agrees to pay my tuition
fees and encourage joining this course (I would not like to mention the name).
Secondly, I would like to extend my sincere gratitude and heartfelt thanks to my
supervisor, Dr. Hamed R. H. Hikmany for his tireless efforts to provide valuable
intellectual support, inspiration and guidance. His constructive opinions, criticisms
and encouragement made this study possible.
Further, I would like to convey my special thanks to my husband Mr. S. K. Nassor
who has always been a key person behind my academic progress even to take care of
our children when I was away from home. I would also like to convey my special
thanks and appreciation to my children; Ali, Hussein and Zinduna who have been
patiently waiting for my home coming. Last but not least I express my gratitude to all
the employees and heads of departments of the Zanzibar Revenue Board (ZRB),
Tanzania Revenue Authority (TRA), clearing and forwarding agents and importers
for their kind and close collaboration during the data collection process.

vii
ABSTRACT
This study aimed at analysing the challenges that face the trend of import tariff
revenue collection in Zanzibar. Import tariff revenue is one among the sources of
income of the Revolution Government of Zanzibar. It contributes an average of
twenty percent of the total tax collected (20.6%) and the rest from other sources of
income. This source of income is obtained from International trade (importation of
goods). Where the importer must pay duties for the goods imported. However, some
goods are not eligible for import tax (goods exempted duties). The analysis on this
study is based on both of the secondary and primary sources of data from the Tax
administration institutions (TRA and ZRB), as well as stakeholders views.
Questionnaires were the main instrument used for the primary data collection from
the Tax administration officials, importers, clearing and forwarding agents. Data
collected is divided into qualitative and quantitative. The analysis revealed that the
import tariff revenue collection has an effect on the total revenue collection in
Zanzibar and it fluctuates each year. Tariff revenue collection faces the main
challenge of “tax exemption”. When the importation of goods increased, the revenue
on importation increased too, but the tax exemption also increased each year which
erodes overall collection. Tax exemption is on an average of 86.47% percent of the
total import tariffs revenue collection. It appears that there is no corrective measure
taken to reduce the exemption. Owing to this problem, the study recommended that
the Government should review tax exemption laws and exercise monitoring of
granted exemption. Use monitoring of exemption will detect the abuse and misuse
which help to rectify or amend existing laws and regulations.

viii
TABLE OF CONTENT
CERTIFICATION ..................................................................................................... ii
COPYRIGHT ............................................................................................................ iii
DECLARATION ....................................................................................................... iv
DEDICATION ............................................................................................................ v
ACKNOWLEDGEMENT ........................................................................................ vi
ABSTRACT .............................................................................................................. vii
LIST OF TABLES ................................................................................................... xii
LIST OF FIGURES ................................................................................................ xiv
LIST OF APPENDICES ......................................................................................... xv
LIST OF ABBREVIATION ................................................................................... xvi
CHAPTER ONE ........................................................................................................ 1
1.0 INTRODUCTION ............................................................................................ 1
1.1 Background Information ..................................................................................... 1
1.1.1 Zanzibar Overview ............................................................................................. 1
1.1.2 Population ........................................................................................................... 1
1.1.3 Administration .................................................................................................... 2
1.1.4 The Zanzibar Economy....................................................................................... 2
1.1.5 The Trend of Macroeconomic Situation in Zanzibar .......................................... 4
1.1.6 The Trend of Import Tariffs Collection in Zanzibar ........................................... 8
1.2 Statement of the Problem.................................................................................. 10
1.3 Study Objectives ............................................................................................... 11
1.3.1 General Objective.............................................................................................. 11

ix
1.3.2 Specific Objectives........................................................................................... 12
1.4 Research Questions ........................................................................................... 12
1.5 Significance of the Study .................................................................................. 13
1.6 Limitations of the Study ................................................................................... 13
CHAPTER TWO ..................................................................................................... 14
2.0 LITERATURE REVIEW ............................................................................... 14
2.1 Introduction....................................................................................................... 14
2.2 Conceptual Framework ..................................................................................... 14
2.2.1 Import Tariffs .................................................................................................... 14
2.2.2 Tanzania Tax Structure in International Trade (Import Tariffs) ....................... 16
2.2.3 Import Tariffs in Zanzibar ................................................................................ 17
2.3 Theoretical Background.................................................................................... 18
2.3.1 Trade Liberalization Policy and Average Tariffs Rate ..................................... 19
2.3.2 World Trade Organization Agreements............................................................ 21
2.3.3 Regional Integration and Tariffs Rate Reduction ............................................. 26
2.3.4 Trade Protectionism and Cumbersome Trade Procedures ................................ 35
2.3.5 Tax Exemptions ................................................................................................ 39
2.4 Conclusion ........................................................................................................ 43
CHAPTER THREE ................................................................................................. 45
3.0 RESEARCH METHODOLOGY .................................................................. 45
3.1 Introduction....................................................................................................... 45
3.2 Research design ................................................................................................ 45
3.3 Population and Sampling .................................................................................. 46
3.4 Institutional Arrangements ............................................................................... 46

x
3.5 Annual Reports from different Institutions....................................................... 46
3.6 The Questionnaires ........................................................................................... 47
3.7 Administration of the Questionnaires ............................................................... 47
3.8 Data Processing and Management .................................................................... 48
CHAPTER FOUR .................................................................................................... 49
4.0 FINDINGS AND DISCUSSION .................................................................... 49
4.1 Introduction....................................................................................................... 49
4.2 The Trend that Characterized the Import Tariff Revenue in Zanzibar ............. 49
4.3 Tax Exemption Management ............................................................................ 50
4.4 The Possible Reasons/ Factors that have Influenced the Trends of the Import
Tariffs Revenue in Zanzibar..............................................................................56
4.4.1 Political Atmosphere ......................................................................................... 56
4.4.2 Level of Tariff Charge ...................................................................................... 56
4.5 Problems which Lead to Low Import Tariff Revenue Collection .................... 65
4.5.1 Some Imported Goods do not Pass through the System (ASCUDA++) ........... 65
4.5.2 Self-assessments on Importation of Goods ...................................................... 66
4.5.3 Double Taxation ................................................................................................ 66
4.5.4 Lack of Transparency ....................................................................................... 67
4.5.5 Lack of Customs Warehouse and Inadequate Port Area .................................. 68
CHAPTER FIVE ...................................................................................................... 69
5.0 CONCLUSION AND RECOMMENDATION ........................................... 69
5.1 Introduction....................................................................................................... 69
5.2 Conclusion ........................................................................................................ 69
5.2.1 The Trend of Import Tariffs Revenue .............................................................. 69

xi
5.2.2 Tax Exemption .................................................................................................. 69
5.2.3 Political Atmosphere ......................................................................................... 70
5.2.4 Level of Tariff Charge ...................................................................................... 70
5.1.5 Some Imported Goods do not Pass through the System (ASCUDA++) ........... 70
5.1.6 Self-assessment on Imported Goods and Lack of Transparency ...................... 71
5.1.7 Double Taxation ................................................................................................ 71
5.1.8 Lack of Customs Warehouse and Insufficient Port Area .................................. 71
5.2 Recommendations............................................................................................. 72
5.3 Areas for Further Studies .................................................................................. 73
REFERENCES ......................................................................................................... 75
APPENDICES .......................................................................................................... 80

xii
LIST OF TABLES
Table 1.1: The trend of import and export trade in Zanzibar (Millions inTzs) .......... 3
Table 1.2: Zanzibar contributions of sectors to GDP 2005 - 2009 in Percentage (%)6
Table 1.3: Zanzibar selected macroeconomic indicators 2005 - 2009 ....................... 7
Table 1.4: Zanzibar import taxes estimated vs collection from 2005 - 2009 ............. 8
Table 2.1: Initial and charge in tariff revenue under alternative
scenarios .................................................................................................. 24
Table 2.2: An overview of the total net trade and welfare effects of the phased
Tariff Cuts (2005 - 2009) ........................................................................ 32
Table 3.1: Population and sample size ..................................................................... 46
Table 3.2: Distribution of Questionnaires ................................................................ 48
Table 4.1: Total Import Tariffs Revenue Collection ('000" Tzs) 2005 –
2009 ......................................................................................................... 49
Table 4.2: Percentage Change in Total Import Tariff Revenue Collection .............. 50
Table 4.3: The Tax Exempted in Total Tariffs Revenue Collection from 2005 –
2009 ......................................................................................................... 51
Table 4.4: Total Import Revenue Collection including Exemptions ('000' Tzs) ...... 53
Table 4.5: Percentage Change in Total Tariffs Revenue Collection with Exemption
2005 - 2009.............................................................................................. 54
Table 4.6: Regression Analysis Between Tax Exemption and total Tariffs Revenue
................................................................................................................. 55
Table 4.7: Level of tariff Charged ............................................................................ 57
Table 4.8: Distribution of Trend of Importation of Goods and Level of Tariff
Charged ................................................................................................... 58

xiii
Table 4.9: Distribution of Reasons for Reducing Tariff Charged ............................ 59
Table 4.10: Trend of Importation of Goods ............................................................... 60
Table 4.11: Distribution of Reasons for Increased Importation of Goods ................. 62
Table 4.12: Distribution of Response for Level of Tariff Charged by Working
Experience of the Respondent ................................................................. 63
Table 4.13: Distribution of Responses for Trend of Importation of Goods by
Working Experience of the Respondent.................................................. 64
Table 4.14: Tariff Charge and Products ..................................................................... 65

xiv
LIST OF FIGURES
Figure 1.1: The trend of import and export trade ......................................................... 4
Figure 1.2: Zanzibar import taxes estimated vs collection ......................................... 9
Figure 4.1: Percentage change in total import tariff revenue collection.....................50
Figure 4.2: Total import tariff revenue and tax exemption ....................................... 52
Figure 4.3: Percentage of exemption in total import tariffs revenue ......................... 53
Figure 4.4: Percentage change in import tariff revenue with exemption .................. 55
Figure 4.5: Level of tariff charged ............................................................................. 57
Figure 4.6: Reasons for reducing tariff charge........................................................... 60
Figure 4.7: Trend of importation of goods ................................................................. 61
Figure 4.8: Reasons for increase of importation of goods ......................................... 62

xv
LIST OF APPENDICES
Appendix 1: Questionare to Clearing and Fowarding Agents and Importers ........... 80
Appendix 2: Questionare to Tanzania Revenue Authority and Zanzibar Revenue
Board Staffs .......................................................................................... 85

xvi
LIST OF ABBREVIATION
ASEAN Association of South East Asian Nations
AU African Union
BoT Bank of Tanzania
CET Common External Tariff
CGE Computed General Equilibrium
C.I.F Cost Insurance and Freight
COMESA Common Market for Eastern and Southern Africa
DC’s Developed Countries
EAC East African Countries
EAPS East Africa Partner States
ECOWAS Economic Community of West African States
GDP Gross Domestic Product
GTAP Global Trade Analysis Project
IMF International Monetary Fund
IFS International Financial Statistics
LDC’s Least Developing Countries
MACEMP Marine and Coastal Environmental Management Project
MFN Most Favored Nation
MKUZA Mkakati wa Kukuza Uchumi na Kupunguza Umasikini Zanzibar
MoFEA Ministry of Finance and Economic Affairs
NTBs Non – Tariff Bariers
NAMA Non-Agricultural Market Access

xvii
NAFTA North American Free Trade Agreement
OECD Organization for Economic Co-operation and Development
PADEP Participatory Agriculture and Development Empowerment Project
SADC Southern African Development Community
SADCC Southern African Development Coordination Conference
SAP Social Adjustment Programme
TRA Tanzania Revenue Authority
TPD Transaction Price Database
UMVS Used Motor vehicle Valuation System
URT United Republic of Tanzania
VAT Value-Added Tax
WTO World Trade Organization
ZRB Zanzibar Revenue Board


1
CHAPTER ONE
1.0 INTRODUCTION
1.1 Background Information
1.1.1 Zanzibar Overview
Zanzibar archipelago comprises the islands of Unguja (also called Zanzibar) and
Pemba with a number of islets adjacent thereto. It is part of the United Republic of
Tanzania. The island of Zanzibar is the largest island in the east coast of Africa and
is separated from the mainland of East Africa (Tanzania) by a channel and lies
between latitudes 5° 40' and 6° 30' south; and longitude 39° east. It is about 85 km
(53 miles) in length and 39 km (24 miles) in breadth at its broadest point. Its area is
about 1660 square km (640 square miles).
The island of Pemba lies about 40 km (25 miles) NNE of Zanzibar between latitude
4° 80' south and longitude 39° 35' and 39° 50' east. It is separated from the main
continent by a channel some 56 km (35 miles) wide. It is smaller than Zanzibar,
being 67 km (42miles) long by 23 km (14 miles) wide (maximum) and having an
area of 985 square km (380 square miles).
1.1.2 Population
Zanzibar had a population of 981,754 with a growth rate of 3.1 percent and a
population density of 370 per square kilometers. Of the total population, 40 percent
lived in urban area and the remaining 60 percent settled in rural areas. The outburst
of population growth rate was mostly attributed to high fertility rate of 5.3. The
projected population in 2005 was 1,072,000 (Population and Housing Census, 2002).

2
1.1.3 Administration
Zanzibar is part of the United Republic of Tanzania, but is semi-autonomous. It has
its own Government, a legislative assembly known as the House of Representative,
the Executive, headed by the President of Zanzibar and its own Judicial System.
Zanzibar is divided into five administrative regions (three in Unguja and two in
Pemba), 10 districts two in each region, 50 constituencies and 296 shehias.
1.1.4 The Zanzibar Economy
Since pre-colonial era, Zanzibar economy was basically dependant on agricultural
production (mainly cloves) and trade. The cloves production alone was contributing
more than 90% of the foreign earnings over the period from 1968 to 1978. The
performance of the cloves production was encouraging, in terms of both good world
prices and level of production. During the period, the prices increased from
US$1,948 per ton to US$7,220. Although the price declined drastically to US$
3,834 per ton in 1978/79, the decline was followed by the boom during 1981/82 with
the price rising to US$ 9,067 per ton. The economy of Zanzibar started to shrink in
1984/85 when the production and world prices of cloves started to decline (Zanzibar
State Trading Corporation, 2009).
Furthermore, from the late 1970’s up to early 1980’s, Zanzibar economy suffered
from scarcity of basic commodities and consumer goods. Every sector of the
economy was at a standstill. The economy as a whole was rather fragmented. The
Revolutionary Government of Zanzibar reacted positively to revamp the economy
and embarked on several economic reforms in mid 1980’s.These include the

3
establishment of Private Investment Promotion and Protection Act (1986), Economic
Recovery Programs, Zanzibar Investment Promotion Authority, Commission for
Tourism, Free Economic Zones and Free Port Services. These reforms were geared
towards stabilizing the economy and sustain its growth. This was the time when trade
liberalization policy took its path to stimulate the worsening situation of the
economy. Since then, several policy reforms in socioeconomic areas were instituted.
After the economic reforms that took place in 2005 -2009, the trend of the trade
(import and export) improved although there were annual variations. According to
Zanzibar Economic Survey Report (2005 – 2009), Bank of Tanzania Report (200 –
2009) and Tanzania Revenue Authority Report (2005 – 2009), import was higher
during the year 2005, 2007 and 2009 compared to 2006 and 2008. The situation was
caused by the fact that most products consumed in Zanzibar are imported outside
country due to scarcity of domestic products.
The value of exports decreased from Tzs. million 30,189.2 in 2008 to million Tzs.
29,744.5 in 2009 due to the decrease of the cloves which is the main export followed
by the Seaweed. In 2009, the total imports amounted to Million Tzs 120,882
compared to the exports which amounted to Tzs. million Tzs 29,744.5. See Table 1.1
and Figure 1.1.
Table 1.1 The trend of import and export trade in Zanzibar (Millions inTzs)
Year 2005 2006 2007 2008 2009
Imports 120,700.90 87,465.30 107,689.90 93,439.60 120,882.00
Exports 12,703.10 15,242.30 21,177.70 30,189.20 29,744.50
Source: Zanzibar Economic Survey, 2009

4
0.00
0.02
0.04
0.06
0.08
0.10
0.12
0.14
2005 2006 2007 2008 2009
Mil
lio
ns
in T
zs
Year
Imports
Exports
Figure 1.1: The trend of import and export trade
Source: Zanzibar Economic Survey, 2009
1.1.5 The Trend of Macroeconomic Situation in Zanzibar
With time, the economic structure of Zanzibar in terms of sectoral contribution to
GDP has been changing. The structure of the economy and the path of
macroeconomic indicators of an economy provide vital background information on
the revenue generation potential of any given economy. Sound economic growth,
high degree of financial deepening and the overall economic structure reflects the tax
opportunity of the given economy.
The dominant sectors of the Zanzibar economy are the agricultural sector, trade,
hotel and restaurants, public administration and other services. In terms of
percentage of GDP, agricultural sector accounts for around 26.7 percent. The
agricultural sector shows an increased each year (except in 2007), which is attributed
to the increase of clove production, seaweeds and rubber (Zanzibar Economic

5
Survey, 2009 and BOT Report, 2009). This situation is the result of favourable
weather condition and the agricultural programs pursued by the government,
particularly the Marine and Coastal Environmental Management Project
(MACEMP), PADEP and ASPD-S. The public administration constitutes 13.1
percent, while trade, hotels and restaurants comprise 16.2 percent. The relatively
dominant trade sector in Zanzibar reflects that the country’s fiscal position needs
improvement.
The period between 2005-2009 recorded an increase of investments in hotels,
restaurant industry and importation (Zanzibar Economic Survey, 2009). This reflects
the fiscal position that depends on trade. The manufacturing sector is relatively
small, contributing to around 4.5% of GDP, due to changing fashion, high production
cost, decline in the production of clove oil and unreliable electricity supply. On the
other hand, the Zanzibar economy has a relatively lower degree of non-monetization
of the economy, accounting for less than 10.0 percent of GDP. Therefore, the
macroeconomic data suggests that Zanzibar economy seems to have better tax
opportunities. Table 1.2 shows the structure of the GDP in the Zanzibar economy.
During the period 2005-2009 Zanzibar recorded high but less stable real economic
growth (See Table 1.3). Economic growth during the period fluctuated between 4.9%
and 6.7 %. In 2005 and 2008, the economic growth showed a decline which was
attributed by the rise of fuel prices coupled by declining world prices of clove
exports and the global economic slowdown which adversely affected the services
activity notably the tourism related sub-activities. Inflation during the period was

6
managed at single-digit level in 2005 (9.7%) but continued to be slightly volatile
except in 2008, the inflation rate rose to 20.6%.
Table 1.2: Zanzibar contributions of sectors to GDP 2005 - 2009 in Percentage (%)
Sector 2005 2006 2007 2008 2009 Period
average
Agriculture 23.4 29.5 27.4 30.7 30.8 26.7
Mining and Quarrying 0.8 0.8 0.8 0.9 1.0 1.3
Manufacturing 4.9 4.6 4.5 4.3 4.1 4.5
Electricity and Water 1.9 1.9 1.9 1.7 1.4 1.7
Construction 6.2 7.5 7.8 7.3 6.6 6.6
Trade, Hotels and Restaurant 17.5 16.5 17.4 16.1 15.6 16.2
Transport and Communication 8.0 6.8 6.9 8.0 11.0 8.1
Financial and Business Services 2.9 2.5 2.7 2.7 2.6 2.6
Public Administration and Other Services 14.8 10.9 10.5 10.0 9.4 13.1
Taxes on Products 12.6 12.2 13.4 12.3 12.1 12.7
Source: Office of the Chief Government Statistician, Zanzibar (2010)
The sharp increase was mainly driven by increases in the world food and oil prices.
Low domestic food production also contributed to the increase in inflation during the
year. It should thus be within the objectives of the Government to stabilize domestic
food production and prices. Much as the growth in real GDP was sporadic, it was
supportive of higher level of revenue generation potential.
Investment, defined in terms of capital formation, continue to exhibit upward trend
since 2005. The average capital formation during the period is Tzs. 125,591.6 bill.
The good performance in capital formation was mainly due to increased investment
in infrastructure projects. Private sector investment concentrated on construction of
tourist hotels while government investments were directed to economic and social
infrastructure in line with the reforms currently taking place under MKUZA. In
2008, the capital formation shows the lower growth since 2007. This was mainly
7
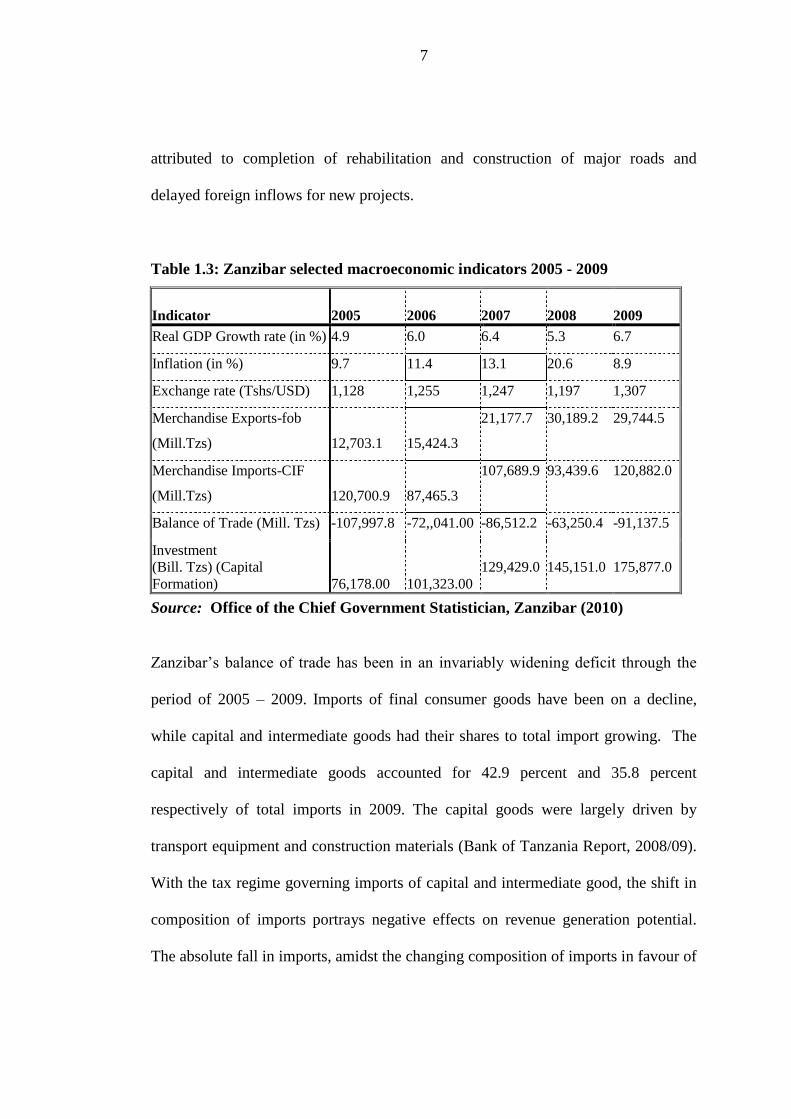
attributed to completion of rehabilitation and construction of major roads and
delayed foreign inflows for new projects.
Table 1.3: Zanzibar selected macroeconomic indicators 2005 - 2009
Indicator 2005 2006
2007
2008
2009
Real GDP Growth rate (in %) 4.9 6.0 6.4 5.3 6.7
Inflation (in %) 9.7 11.4 13.1 20.6 8.9
Exchange rate (Tshs/USD) 1,128 1,255 1,247 1,197 1,307
Merchandise Exports-fob
(Mill.Tzs) 12,703.1 15,424.3
21,177.7 30,189.2 29,744.5
Merchandise Imports-CIF
(Mill.Tzs) 120,700.9 87,465.3
107,689.9 93,439.6 120,882.0
Balance of Trade (Mill. Tzs) -107,997.8 -72,,041.00 -86,512.2 -63,250.4 -91,137.5
Investment
(Bill. Tzs) (Capital
Formation) 76,178.00 101,323.00
129,429.0
145,151.0
175,877.0
Source: Office of the Chief Government Statistician, Zanzibar (2010)
Zanzibar’s balance of trade has been in an invariably widening deficit through the
period of 2005 – 2009. Imports of final consumer goods have been on a decline,
while capital and intermediate goods had their shares to total import growing. The
capital and intermediate goods accounted for 42.9 percent and 35.8 percent
respectively of total imports in 2009. The capital goods were largely driven by
transport equipment and construction materials (Bank of Tanzania Report, 2008/09).
With the tax regime governing imports of capital and intermediate good, the shift in
composition of imports portrays negative effects on revenue generation potential.
The absolute fall in imports, amidst the changing composition of imports in favour of
8
the less taxed or untaxed products, mean that in the short run, less and less revenue
generation was the feasible result ( TRA Report 2005).
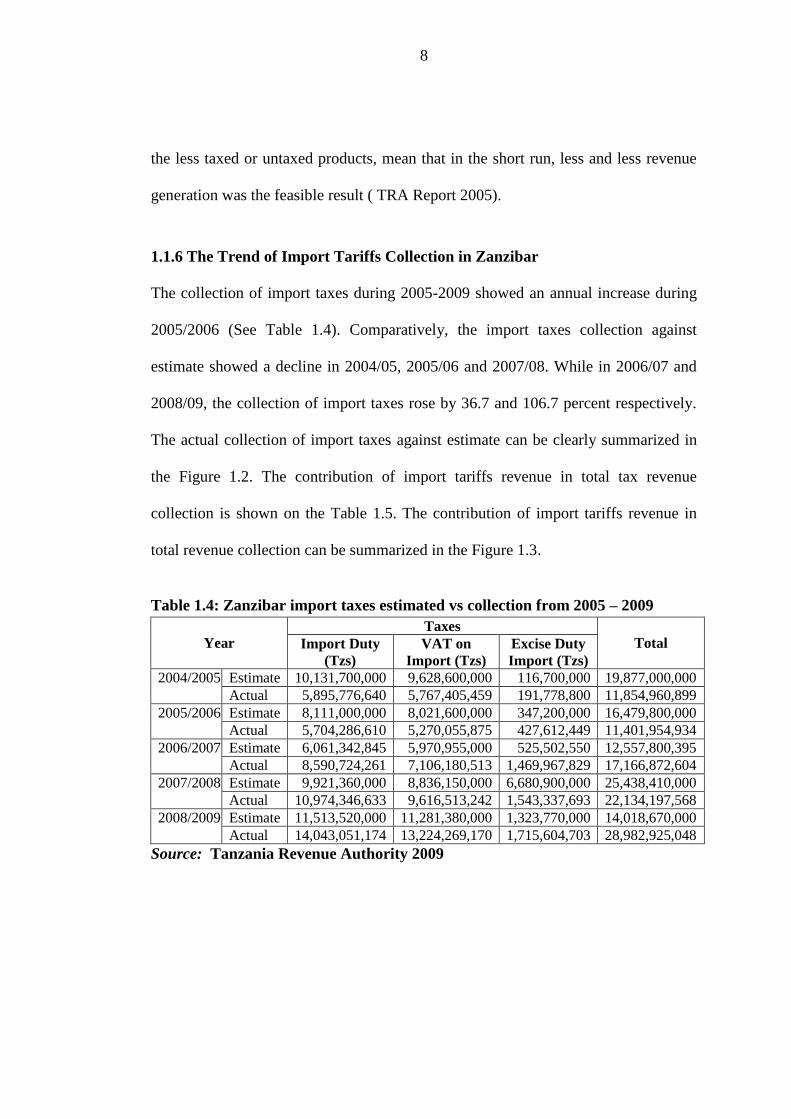
1.1.6 The Trend of Import Tariffs Collection in Zanzibar
The collection of import taxes during 2005-2009 showed an annual increase during
2005/2006 (See Table 1.4). Comparatively, the import taxes collection against
estimate showed a decline in 2004/05, 2005/06 and 2007/08. While in 2006/07 and
2008/09, the collection of import taxes rose by 36.7 and 106.7 percent respectively.
The actual collection of import taxes against estimate can be clearly summarized in
the Figure 1.2. The contribution of import tariffs revenue in total tax revenue
collection is shown on the Table 1.5. The contribution of import tariffs revenue in
total revenue collection can be summarized in the Figure 1.3.
Table 1.4: Zanzibar import taxes estimated vs collection from 2005 – 2009
Year
Taxes
Total Import Duty
(Tzs)
VAT on
Import (Tzs)
Excise Duty
Import (Tzs)
2004/2005 Estimate 10,131,700,000 9,628,600,000 116,700,000 19,877,000,000
Actual 5,895,776,640 5,767,405,459 191,778,800 11,854,960,899
2005/2006 Estimate 8,111,000,000 8,021,600,000 347,200,000 16,479,800,000
Actual 5,704,286,610 5,270,055,875 427,612,449 11,401,954,934
2006/2007 Estimate 6,061,342,845 5,970,955,000 525,502,550 12,557,800,395
Actual 8,590,724,261 7,106,180,513 1,469,967,829 17,166,872,604
2007/2008 Estimate 9,921,360,000 8,836,150,000 6,680,900,000 25,438,410,000
Actual 10,974,346,633 9,616,513,242 1,543,337,693 22,134,197,568
2008/2009 Estimate 11,513,520,000 11,281,380,000 1,323,770,000 14,018,670,000
Actual 14,043,051,174 13,224,269,170 1,715,604,703 28,982,925,048
Source: Tanzania Revenue Authority 2009

9
0
2
4
6
8
10
12
14
16
Estimate Actual estimate Actual estimate Actual estimate Actual estimate Actual
2004/2005 2005/2006 2006/2007 2007/2008 2008/2009
Bil
lio
ns
in T
zs
Year
Import Duty
VAT on Import
Excise Duty
Import
Figure 1.2: Zanzibar import taxes estimated vs collection
Source: Tanzania Revenue Authority 2009
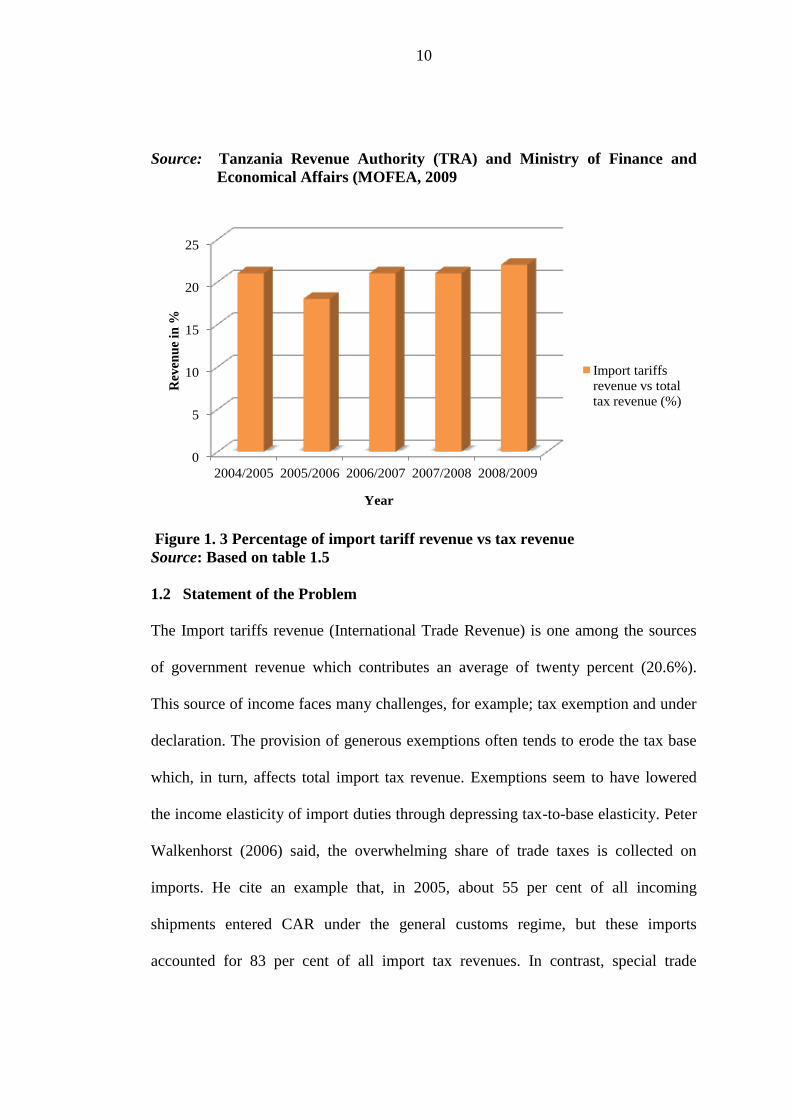
Table 1.5: The contribution of import tariffs revenue in total tax revenue
collection 2005-2009
Year Import Tariffs
Revenue (Tzs)
Total Tax Revenue
(Tzs)
Import Tariffs
Revenue Total Tax
Revenue (%)
2004/2005 11,854,960,899 55,851,179,724 21%
2005/2006 11,401,954,943 63,749,964,862 18%
2006/2007 17,166,872,604 83,149,575,075 21%
2007/2008 22,134,197,568 103,155,142,148 21%
2008/2009 28,982,925,048 130219,019,651 22%
10
Source: Tanzania Revenue Authority (TRA) and Ministry of Finance and
Economical Affairs (MOFEA, 2009
0
5
10
15
20
25
2004/2005 2005/2006 2006/2007 2007/2008 2008/2009
Rev
enu
e in
%
Year
Import tariffs
revenue vs total
tax revenue (%)
Figure 1. 3 Percentage of import tariff revenue vs tax revenue
Source: Based on table 1.5
1.2 Statement of the Problem
The Import tariffs revenue (International Trade Revenue) is one among the sources
of government revenue which contributes an average of twenty percent (20.6%).
This source of income faces many challenges, for example; tax exemption and under
declaration. The provision of generous exemptions often tends to erode the tax base
which, in turn, affects total import tax revenue. Exemptions seem to have lowered
the income elasticity of import duties through depressing tax-to-base elasticity. Peter
Walkenhorst (2006) said, the overwhelming share of trade taxes is collected on
imports. He cite an example that, in 2005, about 55 per cent of all incoming
shipments entered CAR under the general customs regime, but these imports
accounted for 83 per cent of all import tax revenues. In contrast, special trade

11
regimes that offered exemptions under regional trade agreements provided merely 17
per cent of revenues, although they accounted for 45 per cent of imports.
Hence, the existing exemptions led to a considerable loss of fiscal revenue. He
continue to say, if all imports under special regimes would have generated the same
fiscal yield as the average of imports under the general customs regime (i.e. 40.5 per
cent), import tax receipts would have been 50 per cent higher. Alternatively, without
exemptions, the same revenue could have been raised with border taxes that are a
third lower than those actually in effect. These static calculations of lost revenue due
to exemptions do not take the incentive effects of border taxes on trade flows into
account.
These problems are occurring in many countries, and Zanzibar is no exception.
Hence, this research paper will study the issue of tax exemption management, high
import duties, and hidden taxes, the legal framework and its implementation (tax
policy, laws & regulations). Specifically the study will investigate the problem of
multiple taxation that resulted to trade diversion and causes the decline of import
tariff revenue for the year 2004/2005, 2005/2006 and 2007/2008 and the issue of tax
exemption.
1.3 Study Objectives
The objectives of this study are presented in two categories as follows;
1.3.1 General Objective
To identifying the possible reasons that tend to fluctuate the import tariffs revenue
collection.
12
1.3.2 Specific Objectives
The specific objectives of the study were:
1. To study the trends of import tariffs revenue in the last five years (2005-2009).
2. To identify the possible reasons for such trends of import taxes revenue.
3. To propose policy perspectives and policy changes that may have an effect on
raising import taxes revenue.
4. To identify cumbersome procedures caused by tax administrators that have a
negative effect on import tax revenue in Zanzibar.
1.4 Research Questions
After the collection and analysis of data, the study aims to answer the following
research questions respectively.
Research Questions
The researcher was guided by the following research questions:
1. What kinds of trends characterize the import tariffs revenue in Zanzibar in the
period of 2005-2009?
2. What are the possible reasons/factors that have influenced the trends of the
import tariffs revenue in Zanzibar?
3. Is there a conflict between Government policy (i.e. change of rates) and the
need to raise revenue through import taxes?
4. Are there any administrative and cumbersome procedures, caused by the tax
administrative machineries in Zanzibar that have direct or indirect effect on
import taxes revenue in Zanzibar?

13
1.5 Significance of the Study
The study focuses on proposing way for enhancing the import taxes revenue
collection in Zanzibar. This involves identifying the revenue trends and the possible
reasons for such trends. The findings of the study will be beneficial to the tax
administrators, policy makers and other related stakeholders. All concerned parties
will be able to understand the scope of the problem and hence develop measures to
be taken to address them. In addition, the study will add knowledge to students of the
related subject or field, and serves as a stimulant for doing research on similar or
related topics. The research findings will help the Government of Zanzibar to see the
need of enhancing both human capacity and institution strengths in the area of tax
administration.
1.6 Limitations of the Study
Due to time and financial constraints the researcher could not cover the broader area
of the study. However, efforts were directed on the issue of tax exemption
management, high import duties, hidden taxes, double taxation and the legal
framework and its implementation (tax policy, laws & regulations). The other
constraints relate to data sensitivity on taxes; sometimes permission was rejected and
in other cases respondents refused to cooperate with the researcher. Even for those
who agree to cooperate, they took long time to fill and deliver the questionnaires to
the researcher.
14
CHAPTER TWO
2.0 LITERATURE REVIEW
2.1 Introduction
This chapter presents literature review and concept of the study. The aim of this
chapter is to provide the relevant literature and concept in the field selected for
research.
2.2 Conceptual Framework
This part of the report explains the concepts that are used in this study.
2.2.1 Import Tariffs
An import tariff or duty is a tax levied on imports. Historically it was used as part of
an attempt to protect domestic businesses from competition from overseas firms.
Today an import duty's primary role is usually purely to raise revenue. Tariffs fall
into two categories, Specific tariffs and Ad valorem tariffs. Specific tariffs are levied
as a fixed charge for each unit of a good imported (for example 300 Tshs per liter of
alcohol). Ad valorem tariffs are levied as a proportion of the value of the imported
goods. An example of an ad valorem is the 18 percent tariff the Tanzania
Government placed on imported goods and services as the VAT on Imported goods.
A tariff raises the cost of the imported products relative to domestic products. The
import tariff increases the price of imported products relative to the domestic
produced products. The goal of this tariff is merely to protect the market share of
locally produced goods. While the principal objective of most tariffs in developed

15
countries is to protect domestic producers and employees against foreign
competition, in developing countries they aim is to raise the domestic revenue.
Import tariffs have been traditionally popular in Least Developing Countries (LDC’s)
including Zanzibar. Empirical research has shown that one third of their revenue
came from this source. The report of the World Development Indicators (2001) and
the report of the United Nation Development Program (2001) indicated that many
developing countries such as Egypt, Venezuela and Pakistan, to mention a few rely
on import tariffs for more than 10% of their central government revenue. India
relies on import duties for more than 20% of its revenue from tariffs and Ethiopia
contributed approximately 38 percent of its government revenues in 2006/07 (NBE,
2007/08), implying the importance of this source of revenue to the country (United
Nation Development Program, 2009).
There is a simple explanation for the fact that developing countries, and especially
poorer developing countries, tend to be heavily dependent on tariffs revenue to
support their government budget. It is relatively easy to tax goods that are brought
into the country at a border crossing, port or airport. By comparisons, most of other
taxes (income taxes, payroll taxes or sales taxes) require an extensive tax collection
system including administration and enforcement that can collect taxes from a large
number of business or even large number of individuals scattered throughout the
country.
Many studies (for example, Corzine, 2008, Peter Walkenhorst, 2006, Laird, Vanzetti
and de Cordoba and others) show that tariffs may be actual the most efficient form of

16
tax for developing countries, since an alternative form of taxation would be very
expensive to administer and enforce. In these countries switching from tariffs to
other revenue sources would likely result in large economic losses.
2.2.2 Tanzania Tax Structure in International Trade (Import Tariffs)
The East Africa Partner States (EAPS) have adopted Common External Tariff that is
applied throughout the region effective from 1stJanuary, 2005. The process of
harmonizing the external tariff has resulted into changes in tariff rates and even tariff
codes in certain areas. The Customs and Excise Department administers all taxes on
international trade. The taxes include Import Duty, Excise Duty and Value Added
Tax (VAT) on imports.
2.2.2.1 Import Duty
Import duty is a tax levied on imported goods. The duty is usually calculated as an
ad-valorem rate on C.I.F value of goods imported into the country, and is collected
before goods leave the entry point into the country and/or bonded warehouses.
There are three applicable import duty rates: -
(i) 0% rate is applied for raw material, capital goods, and agricultural tractors.
Pure breed animals, fertilizers, and medicine.
(ii) 10% rate for importation of semi-finished goods.
(iii) 25% rate for importation of finished final consumer goods.
However, there are some sensitive goods which attract more than 25% duty rate.
These include rice, wheat grain, maize, maize flour, jute bags, used clothing, khanga,

17
kitenge, kikoi, linen of cotton and sugar. The objective is to protect the local
industries in the partner states. The Harmonized Tariff System is used to classify
goods for tax purposes as well as for trade statistics compilation. To encourage trade
within EAPS member states, imports from EAPS are generally charged duties at
lower rates compared to imports from none EAPS member states.
2.2.2.2 Excise Duty on Imports
Excise duty is levied on certain consumer goods on importation. The traditionally
excisable goods are goods whose consumption is seen by the society as immoral i.e.
beer and cigarettes, and goods whose consumption creates negative externalities to
the society i.e. petroleum. In Tanzania apart from the traditional excisable goods, soft
drinks and motor vehicles are excisable for revenue generation purposes. Excise duty
is charged on specific or ad-valorem rate, and the tax base for the ad-valorem rate is
the C.I.F value plus the import duty. The applicable ad-valorem excise duty rates are:
(i) 10% rate applicable to saloons and station wagon motor vehicles with engine
capacity in excess of 2000cc.
(ii) 30% rate on importation of consumer luxuries and cosmetics.
2.2.2.3 VAT on Imports
The tax is imposed on scheduled imports into the mainland Tanzania at a single
positive rate of 18%. The taxable value for VAT on imports is the CIF value plus
customs duty, excise duty and any other import tax applicable.
2.2.3 Import Tariffs in Zanzibar
Import tariffs in Zanzibar comprise three main duties charged on goods and services
that are imported at the entry point (i.e. Sea port, Airport or Land port/ Border

18
crossing). The duties are import duty (which is charged in ad valorem/percent on the
value of the goods or services), Value Added Tax – VAT on import- which is also
charged in percentage wise; and excise duty which is charged on specific rate per
item/ unit. The three duties are also sometimes known as the international taxes.
These duties are administered by Tanzania Revenue Authority – TRA- as being
under Union matters. Therefore, in this research the term Import tariffs revenue
encompasses revenue from import duties, excise duties and VAT on import.
2.3 Theoretical Background
To identify the challenges that face the import tariffs revenue collection, many
articles were visited and the challenges were analyzed. What was found is that,
import tariffs is a major source of revenue for most of the developing countries. The
source has not been stable and similarly its contribution to the government revenue
as found by some writers (for example, IMF 2005, Paul Brenton, Mombert Hoppe
and Erik von Uexkull 2007 and Nathan Associates Inc. 2000).
In most of the developing countries, it has been identified that apart from what has
been explained as the economic growth, there is slow growth and declining of
revenue from the import tariffs (IMF 2005, Paul Brenton, Mombert Hoppe and Erik
von Uexkull 2005). Some of the factors identified to that slow growth or sometimes
declining of the revenue from this source are Trade Liberalization Policy, World
Trade Organization Agreement, Regional Integration and Tariffs Reduction Policy,
Trade Protectionism and cumbersome trade procedures, and tax exemptions which
are all explained here below.

19
2.3.1 Trade Liberalization Policy and Average Tariffs Rate
Since the mid-1980s, many developing countries embarked on Social Adjustment
Programme (SAP) which, among other measures, promoted wide-ranging trade
policy reforms. In spite of the accumulated experience from these “experiments”,
debate continues to rage in the literature with respect to various questions associated
with the design, implementation and impact of trade policy reforms. In the context of
this debate, trade liberalization has generally been treated as any or a combination of
the following three: import liberalization, a move towards neutrality in the structure
of relative prices, and the substitution of less distorting for more distorting forms of
interventions (T. Ademola Oyejide 2004). Generally trade liberalization has two
closely inter-related component parts, i.e., import liberalization and export
promotion. The former has taken the lead in the reforms associated with the shift to
an outward-oriented development strategy in many African countries which has
effect to the revenue collection.
The main objective of trade liberalization is to reduce and later to eliminate tariffs,
subsidies and import quotas where Weisbrot and Baker (2002) came to identify that
the reduction or elimination of tariffs in developing countries due to trade
liberalization, has reduced the revenue from the tariffs. Vito Tanzi and Howell Zee
(2001) see that reducing import tariffs rates as part of an overall program of trade
liberalization is a major policy challenge currently facing many developing
countries. Two concerns should be carefully addressed. First, tariff reduction should
not lead to unintended changes in the relative rates of effective protection across
sectors. Second, nominal tariff reductions are likely to entail short-term revenue loss.

20
Baunsgaard and Keen (2005) said that low-income countries, and particularly the
least developed countries (LDCs), frequently lack adequate administrative capacity
and a well functioning domestic tax system. They tend to rely heavily on trade taxes
as sources of government revenue. Lowering or eliminating tariffs on trade with
regional partners, therefore, can constitute a significant risk to a country’s fiscal
position.
Busse and Grossmann (2004) state the following statement “For example, estimates
of the prospective impact of the Economic Partnership Agreement between the
European Union and the Economic Community of West African States (ECOWAS)
indicate that some of the participating African countries could lose more than 20
percent of their government revenues as a result of preferential tariff reductions”.
Joweria M. Teera (2004) find that, the African countries that made the fastest
progress on trade liberalization over the last 10 years saw a significant decrease in
revenues from international trade taxes. But in some, including Morocco, Ghana,
Tunisia and Senegal, this did not translate into higher deficits. However, Ocampo et
al., (1998) illustrated that trade liberalization in developing countries embraces
modest benefits but a large and regressive distribution effect, as well as a negative
effect on prices and productivity growth. Bird, R.M. and Zolt, E.M., (2003) insisted
that developing countries face a difficult task in designing and implementing suitable
tax systems. In practice, countries have often relied heavily on taxes on international
trade, but this tax base is also becoming increasingly hard to implement in the face of
pressures for trade liberalization.

21
Walkenhorst, Peter (2006, pg 6-7), state that Central African Republic (CAR)
continues to rely heavily on trade taxes to finance the government budget. In 2006,
55 per cent of all tax revenues were expected to relate to cross-border transactions.
Trade-specific taxes, such as export taxes, import duties, petrol taxes, and customs
charges, thereby account for two-thirds of trade tax revenue, while the remaining
third is derived from general taxes collected at the border, such as VAT and excises.
The overwhelming share of trade taxes is collected on imports. In 2005, about 55 per
cent of all incoming shipments entered CAR under the general customs regime; but
these imports accounted for 83 per cent of all import tax revenues.
William and Kwasi (2008, pg. 6), state that on an annual basis, significant progress
has been made in tariff reforms since the mid 1990s, particularly with further
lowering of the level of tariff rates. However, the collection rates have remained low.
This could mean that despite the upsurge in imports, revenues collected from import
duties have not improved to match increases in imports since the latter part of the
1990s. Growth in real imports over the adjustment period averaged 32.4 percent,
which far exceeded the 17.7 percent average growth in duty revenue.
2.3.2 World Trade Organization Agreements
World Trade Organization Agreements also been identified to have impact on the
revenue that comes from the import tariffs. De Córdoba and David Vanzetti (2005),
analyze various proposals put forward during the WTO negotiations on Non-
Agricultural Market Access (NAMA), using a general equilibrium model -Global
Trade Analysis Project (GTAP). They point out the implications in terms of changes

22
in imports, exports, output, employment and welfare gains for various countries and
regions.
De Córdoba and David Vanzetti (2005) continue to say that the NAMA negotiations
is an opportunity to address tariff and non-tariff barriers, but the later package text on
NAMA leaves considerable uncertainty about the future direction of the
negotiations. For example; it is said that “An agreement to reduce NAMA barriers
could lead to significant gains for developing countries in exports, employment and
economic efficiency,” De Córdoba and David Vanzetti (2005). The writers also said
that, “However, as this study shows, these gains will come with short term
adjustment costs such as loss of employment and output in import-competing sectors
and loss of government revenue” (2005, page 3).
De Córdoba and David Vanzetti (2006) make use of different scenarios based on
three different tariff-cutting proposals: a Swiss “harmonizing” formula, the “WTO
proposal” (proposed by former NAMA group chairman Pierre-Louis Girard) and a
capping formula (uniform reduction, with a cap on tariffs at three times the national
average applied rate). Each proposal is then subjected to three levels of tariff
reduction: ambitious, moderate and flexible De Córdoba and David Vanzetti (2006,
page 3).
The analysis shows that (De Córdoba and Vanzetti, 2006) the generally modest
overall results conceal important changes in individual sectors. Some countries will
gain in key sectors, but in other countries, some sectors will face important

23
adjustments. “Moreover, the estimated tariff revenue losses could have a strong
negative impact on government revenues in a number of countries,” (De Córdoba
and Vanzetti, 2006, pg. 4). De Córdoba and David Vanzetti (2005) continue to say
that the most ambitious (Swiss) scenario modeled here results in a global reduction
in tariff revenues of 50 per cent (see Table 4). In each case, the harmonizing Swiss
formula leads to greater losses in revenue than the alternative WTO or linear Capped
approaches. This applies at the three levels of ambition, and the pattern tends to hold
across all regions, De Córdoba and David Vanzetti (2005, page. 29 - 30).
De Córdoba and David Vanzetti (2005) clearly conclude that the large falls are more
significant in developing countries that are more dependent on tariffs as a source of
revenue. The lowest income developing countries tend to have greatest dependence
on tariffs as a source of revenue, De Córdoba and David Vanzetti (2005, page 31).
Therefore, according to analysis made by De Córdoba and David Vanzetti (2005)
through the general model with three scenario (Swiss scenario, WTO and linear
Capped approaches) shows that Least Developing Countries has large falls of
revenue because of more dependence of tariffs revenue.
Peter Walkenhorst (2006 pg. 310) said “For countries that have weak domestic tax
administrations and rely heavily on trade taxes for government finances, lowering or
eliminating tariffs on trade with regional partners can pose a significant fiscal risk.”
Sam Laird, Vanzetti and de Córdoba (2006, pg 7) say, the World Bank data indicate
that the contribution of tariff revenues to total government revenues ranges greatly
from virtually nothing in the European Union to over 76 per cent in Guinea.

24
Table 2.1: Initial and charge in tariff revenue under alternative scenarios
Revenue Ambitious Moderate Flexible Ambitious Moderate Flexible Ambitious Moderate Flexible
Country $billion % % % % % % % % %
EU 27.1 -58 -58 -33 -56 -61 -50 -53 -53 -32
United State 20 -79 -79 -49 -79 -83 -72 -78 -77 -46
Japan 17.1 -45 -46 -30 -46 -48 -42 -44 -44 -24
Canada 3 -58 -58 -39 -55 -60 -52 -53 -53 -34
Rest of OECD 8 -47 -47 -28 -34 -41 -30 -33 -33 -13
High-income As ia 17.7 -55 -37 -30 -58 -31 -29 -53 -33 -30
China,including Hong Kong 32.5 -79 -70 -65 -81 -64 -61 -77 -67 -62
India 12.9 -61 -44 -30 -44 -7 -5 -40 -11 -8
Brazi l 5.6 -56 -31 -13 -43 0 1 -39 -2 0
Mexico 6.8 -50 -26 -11 -39 -8 -7 -37 -8 -7
Bangladesh 1.7 1 1 1 1 2 2 1 2 1
Phi l ippines 1.2 -32 -2 -1 -27 1 1 -23 1 -1
Malawi 0.1 5 5 3 5 3 2 5 2 2
Zambia 0.1 0 0 0 1 0 0 1 0 0
Bulgaria 0.5 -41 -22 -12 -34 -5 -4 -28 -6 -4
Rest of South As ia 2.5 -38 -20 -9 -18 3 2 -8 2 0
South-East As ia 14 -37 -14 -9 -33 -2 -2 -21 -4 -4
Centra l America and Carribean 3.6 -23 -8 -1 -19 3 3 -19 2 1
Andean Pact 4.8 -42 -26 -10 -29 -1 -1 -25 -2 -1
Argentina, Chi le and Uruguay 3.3 -40 -19 -6 -29 0 1 -26 0 1
Middle East and North Africa 22 -32 -24 -16 -24 -5 -4 -20 -7 -5
Sub-Saharan Africa 10.6 -16 -8 -5 -16 -3 -2 -13 -2 -2
Al l other regions 15.2 -19 -10 -6 -17 -3 -3 -15 -4 -3
Developing countries 142.7 -44 -30 -23 -38 -15 -14 -34 -17 -15
World 230.2 -50 -40 -27 -45 -30 -27 -42 -30 -21
Swiss WTO Capped
Source: GTAP database and simulations

25
Less extreme examples are Cameroon and India, where tariff revenues represent
some 28 and 18 per cent of government revenues, respectively. Ten countries collect
more than half their revenues from tariffs and 43 countries collect more than a
quarter. In OECD countries, tariff revenues represent on average 1 per cent or less.
Tariff revenues are the product of tariffs and imports (Sam Laird, Vanzetti and de
Córdoba 2006). Within the non-agricultural sector, that is excluding primary and
processed agriculture and services, revenues amount to $171 billion. The major
sectors contributing to global distortions are textiles and wearing apparel ($37
billion), motor vehicles ($21 billion), manufactured metal products ($32 billion) and
chemicals, rubber and plastics ($22 billion). About half the revenue ($83 billion) in
the non-agricultural sector is collected in developing countries. The European Union,
Japan and the United States collect duties of $28 billion, $22 billion and $21 billion
respectively, (Sam Laird, Vanzetti and de Córdoba 2006, pg 14).
According to Azharia, Salih and Marc MullerIn in the CGE model (2005, pg 8-9),
the performed simulations for Sudan included reduction of import tariffs and activity
tax by 50 percent and 100 percent. This complied with the World Trade Organization
(WTO) regulations to reform tax policy. One critical tax policy issue in developing
countries is the revenue implications of the tariff reduction given its high share in the
public revenue. Given this situation, it would be imperative to look for alternatives
for compensation of such budget revenue reduction. An increase in the direct tax was
seen as a second best approach. As such, the model opted for estimating the expected
increase in the direct taxes for offsetting the effect of the reduction of tariff revenue

26
to prevent deterioration of government revenue and of the balance of payment,
Azharia cited by (Devarajan et al., 1994). In the same text it is said that in 2000,
Sudan import tariff and activity tax represented 24 percent and 16 percent of the total
government income respectively. Reduction of import tariff and activity tax reduces
government savings, which would negatively affect total investment.
2.3.3 Regional Integration and Tariffs Rate Reduction
During the late 60’s and early 80’s there emerged the formation of economic
regional bodies termed as Regional Integration such as ASEAN for Asian countries
and NAFTA for North American countries. This integration has not been formulated
in Asia, North America and South America only but even in Africa they follow the
fashion. In Africa emerged bodies like COMESA which is a Common Market for
Eastern and Southern Africa, ECOWAS for West African Countries, SADCC and
later on SADC for Southern African countries, the East Africa Community (EAC)
which collapsed in 1977 and re-introduced in 1998 bringing back Kenya, United
Republic of Tanzania and Uganda. Currently Rwanda and Burundi have joined
mainly for economic purposes.
According to Goldstein and Ndung’u (2001 pg. 20) the aims of formulating these
organization are first the establishment of a customs union, then the creation of a
common market, subsequently a monetary union, and ultimately a political
federation among the member states. Achieving these goals is predicated on progress
in policy harmonization, macroeconomic stability, and development of
infrastructure. The hope is that co-operation in these areas will open up investment
and trade opportunities for local producers to enjoy economies of scale. Among the

27
agreement for this body to work properly is to establish Common External Tariffs
(CET) for all member states.
The expected benefits from regional integration must be weighed against the costs
stemming from the loss of tariff revenues. The delays accumulated so far largely
result from differences in the economic development and industrialization, the
success obtained in reaching macroeconomic stability and the varying degree of
dependence on trade taxes. To compound these challenges, the political commitment
to surrender national sovereignty when regional decisions are perceived to go against
national interests has been limited. The dilemma has come up in the case of the loss
in fiscal revenue, the risk of incurring trade deficits, and the removal of protection to
infant industries.
Goldstein and Ndung’u (2001 pg. 21) quoted the speech of President Benjamin
Mkapa of URT which state that “While I was undertaking reforms [in the tariff
structure], government depended very heavily on imports for its revenues. If,
suddenly, you tell me these have to go, where do I get a substitute source of revenue?
We [the EAC members] may have had a common vision, but our starting points were
different and we did not consult enough”.
They continue to say (pg. 23 -24, table 9-11), although differences in tax
classification make it difficult to reach a firm conclusion, Kenya relies more on
import duties and value added/sales taxes on imports than the other countries.
Kenya’s tax effort in relation to economic activity is also higher. The case of Uganda
— where trade taxes were trimmed from 42.2 per cent of total revenue in 1991-92 to

28
10.2 per cent in 1996-97 — illustrates a dramatic transition. Meanwhile, in Kenya,
the trend is towards a stronger dependence on trade duties, whose share in total
receipts has risen from 8.6 per cent in 1991-92 to 15.3 per cent in 1996-97. In
addition to import duties, Tanzania introduced a 20 per cent VAT in 1997, but more
than a quarter of total revenue still comes from international trade taxes. Reducing or
eliminating VAT exemptions would help bring down trade taxes substantially.
M.A. Consulting Group (2007, pg. 21) state that when the EAC customs union
regime was being negotiated, there was a general concern that it would lead to
substantial revenues losses in most Partner States. It is now evident that the customs
union had no negative impact on total tax revenues. Whereas there were initial cases
of customs revenue losses, there have been revenue increases in all sources and in all
the countries. Excise duties are major source of revenues for the member states, but
have a potential to distort regional trade. The charges on some items often differ
country by country and specification; for example cigarettes are charged on the basis
of brand, length or local content. Under these circumstances the taxes tend to act as
non-tariff barriers and distort tax regimes. This problem is recognized in the
Community and the 11th Meeting of the Council of Ministers urged the Partner
States to expedite the constitution of a task force of experts to harmonize the excise
duty structures. It is important that this decision of the Council should be carried out
without delay.
Lucio Castro, Kraus, De La Rocha (2004, pg 13) is of the opinion that Customs
revenue is still significant but declining. The contribution of customs revenue to total
revenue is around 10 percent. Tariff duties and VAT on imports are the most

29
important customs revenue source. In Kenya and Tanzania, suspended duties
contribute minimally to customs revenue; excises are important, particularly in
Kenya, (IMF country reports 2003).
Williamson (2003) noted that Ludwig Kuchne, who was a Prussian civil servant,
wrote an essay showing how net revenues are proportional to the area of the country
imposing the tariffs. Indeed the ratio of the boarder length to area correlates very
well with the actual ratio of administrative cost to custom revenues. When a kernel
regression is estimated implies that countries has to be larger than 2500 square miles
in area to bring in positive revenues from tariffs, and had to be larger than 7500
square miles before net revenues were significant. For countries which have less than
2500 square miles, their revenues from import tariffs tend to be twisted with the slow
growth characteristics, Williamson (2003, page 32 – 33).
Baunsgaard and Keen (2005, pg 305), said that low-income countries, and
particularly the least developed countries (LDCs), frequently lack adequate
administrative capacity and a well functioning domestic tax system. They tend to
rely heavily on trade taxes as sources of government revenue lowering or eliminating
tariffs on trade with regional partners therefore, can constitute a significant risk to a
country’s fiscal position. They give an example, of estimates of the prospective
impact of the Economic Partnership Agreement between the European Union and the
Economic Community of West African States (ECOWAS) indicating that some of
the participating African countries could lose more than 20 percent of their
government revenues as a result of preferential tariff reductions (Busse and
Grossmann 2004).
30
Hoekman et al (2004) estimate the effect on world prices of a 50% reduction in
tariffs for a sample of 267 commodities. The estimated world price effects are then
used to estimate the impact on imports and welfare for 144 countries. The authors
find that least developed countries (mostly SSA) actually experience a welfare loss if
all WTO members reduce tariffs.
According to IMF paper (2005) trade tax revenue typically constitutes between one-
quarter and one-third of total tax revenue in low- and middle-income countries, and
only a negligible share in high income countries. Over the past 20 years, trade
liberalization has been associated with a marked decline in trade tax revenue relative
to GDP, in both developing and developed countries, and in all regions. The
reduction is quite marked: amongst middle-income countries, for instance, trade tax
revenues as a share of GDP fell by about one-third. This development is closely
linked to an overall trend towards trade liberalization—proxies, for example, by a
decline in collected import tariff rates—in all regions and income groups,
particularly between the mid 1980s and the mid 1990s. The collected tariff rate has
almost halved in all three income groups since the mid-1980s, with the largest
absolute decline in the low income group. Collected tariff rates also fell in all
geographic regions over this period, with the sharpest absolute declines in Asia and
Sub-Saharan Africa (IMF paper (2005, pg 3-4).
The paper continue to explain that there are signs in these broad group averages that
some poorer countries have been unable (or unwilling) to recover lost trade tax
revenues through strengthened domestic taxation. Amongst low-income countries,
total tax revenues as a percent of GDP have on average declined in parallel with

31
trade tax revenues. Middle income countries, on the other hand, have managed to
maintain total tax revenues broadly unchanged, while in high income countries they
have increased.
Khorana, Kimbugwe and Perdikis (2007) state that there is, however, negative total
customs revenue effect; its total magnitude is US$ 8.12 million. But this is marginal,
given that it consists of a small share of the total Ugandan trade. The main reason for
revenue losses is that Uganda is a member of COMESA, IGAD and the AU, and
since the preferential tariffs under each of these regional agreements are different,
the importers are free to choose to import products under any regime. As a result, the
Ugandan importers mostly declare their imports under the COMESA because the
notified COMESA tariffs are lower than the EAC (Khorana, Kimbugwe and Perdikis
(2007, pg. 15 – 16).
Khorana, Kimbugwe and Perdikis continue to say, this leads to customs fraud and
revenue losses. In the long term, the revenue losses can be compensated by lowering
tariffs under the different tariff regimes together with an eventual harmonization of
the customs procedures across the various RIAs. This will also address the problem
of informal trade, which is an important drawback of the present regime leading to
revenue losses for the Ugandan government.
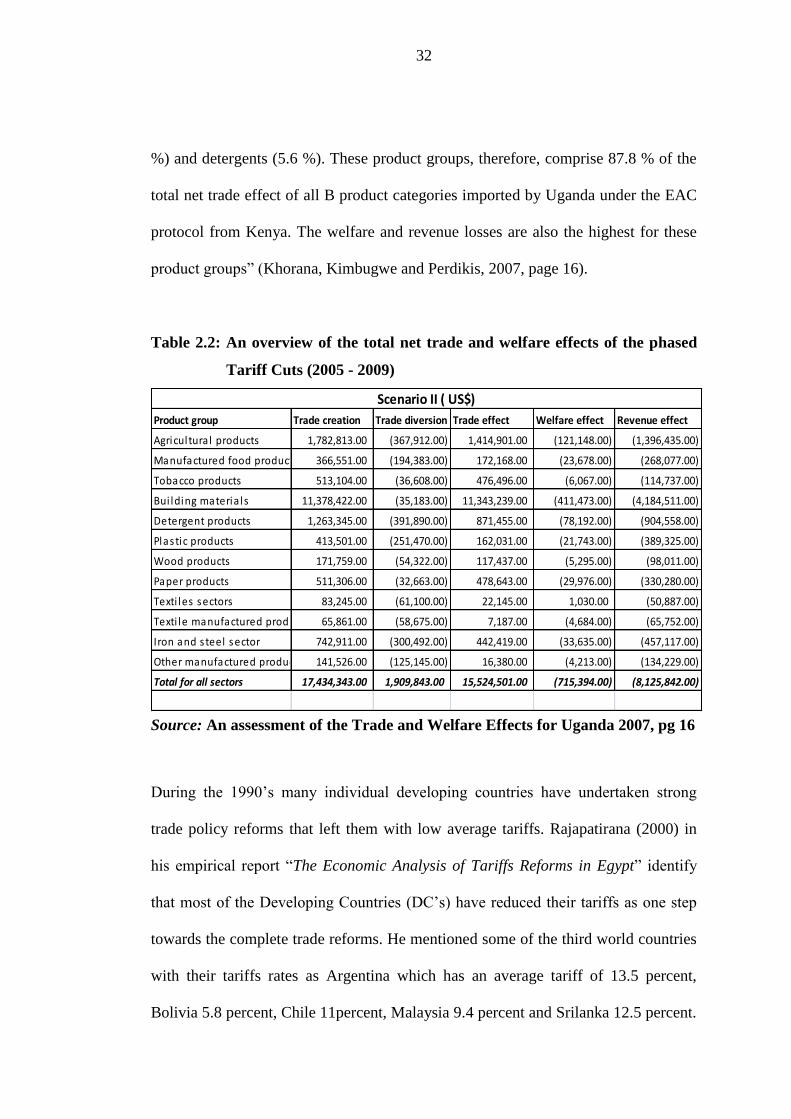
Products with the largest net trade effect are agricultural products; agro processed
products; building materials; detergents; paper; tobacco; iron and steel; and, plastics.
The tariff reduction simulations on a product category basis show that the highest net
trade effect is in building materials (73.1 %) followed by agricultural products (9.1
32
%) and detergents (5.6 %). These product groups, therefore, comprise 87.8 % of the
total net trade effect of all B product categories imported by Uganda under the EAC
protocol from Kenya. The welfare and revenue losses are also the highest for these
product groups” (Khorana, Kimbugwe and Perdikis, 2007, page 16).
Table 2.2: An overview of the total net trade and welfare effects of the phased
Tariff Cuts (2005 - 2009)
Product group Trade creation Trade diversion Trade effect Welfare effect Revenue effect
Agricultura l products 1,782,813.00 (367,912.00) 1,414,901.00 (121,148.00) (1,396,435.00)
Manufactured food products 366,551.00 (194,383.00) 172,168.00 (23,678.00) (268,077.00)
Tobacco products 513,104.00 (36,608.00) 476,496.00 (6,067.00) (114,737.00)
Bui lding materia ls 11,378,422.00 (35,183.00) 11,343,239.00 (411,473.00) (4,184,511.00)
Detergent products 1,263,345.00 (391,890.00) 871,455.00 (78,192.00) (904,558.00)
Plastic products 413,501.00 (251,470.00) 162,031.00 (21,743.00) (389,325.00)
Wood products 171,759.00 (54,322.00) 117,437.00 (5,295.00) (98,011.00)
Paper products 511,306.00 (32,663.00) 478,643.00 (29,976.00) (330,280.00)
Texti les sectors 83,245.00 (61,100.00) 22,145.00 1,030.00 (50,887.00)
Texti le manufactured products 65,861.00 (58,675.00) 7,187.00 (4,684.00) (65,752.00)
Iron and s teel sector 742,911.00 (300,492.00) 442,419.00 (33,635.00) (457,117.00)
Other manufactured product 141,526.00 (125,145.00) 16,380.00 (4,213.00) (134,229.00)
Total for all sectors 17,434,343.00 1,909,843.00 15,524,501.00 (715,394.00) (8,125,842.00)
Scenario II ( US$)
Source: An assessment of the Trade and Welfare Effects for Uganda 2007, pg 16
During the 1990’s many individual developing countries have undertaken strong
trade policy reforms that left them with low average tariffs. Rajapatirana (2000) in
his empirical report “The Economic Analysis of Tariffs Reforms in Egypt” identify
that most of the Developing Countries (DC’s) have reduced their tariffs as one step
towards the complete trade reforms. He mentioned some of the third world countries
with their tariffs rates as Argentina which has an average tariff of 13.5 percent,
Bolivia 5.8 percent, Chile 11percent, Malaysia 9.4 percent and Srilanka 12.5 percent.

33
But he also came to identify that many of the Egypt’s neighbors have higher tariffs
than Egypt. For example Tunisia has an average tariff of 33.6 percent while
Morocco has an average tariff of 25% (based on a calendar-year average of the CIF.
In fact the average tariff level for all IMF member countries is 14 percent (including
both developed and developing countries). This low average tariff left these
countries with small amount of revenue which directly come from the tariffs. The
low average tariffs contributed much to the low growth of government revenue
especially from imports goods.
A study by Oussama Kanaan (2000, pg 31) shows that contracting international trade
eroded revenue and significantly changed its structure, with the share of import
duties in total budgetary revenue falling to 11 percent in fiscal year 1979/80 (July
1979–June 1980) from 22 percent in 1969/70. The government was becoming
increasingly dependent for revenues on transfers from public enterprises, whose
profitability was being undermined by import shortages and rising operating costs.
Oussama Kanaan continues to say that while the tax ratio was gradually being
eroded, trade taxes came to account for an increasing proportion of tax revenue. The
liberalization of the trade and exchange system caused imports, and thus customs
duties, to grow rapidly while revenue from domestic taxes—in particular from sales
and income taxes—was shrinking.
Both the erosion of the total tax ratio and the increased weight of trade taxes in total
revenue led the Tanzanian authorities to delay further reductions in tariff rates until

34
measures were put in place that improved tax and customs administration, reduced
the scope of exemptions, and broadened the domestic tax base. Still, it is clear in
retrospect that Tanzania has come a long way in liberalizing its trade regime over the
past two decades, as reflected by the decline of its IMF trade restrictiveness index
rating to 6 (moderate) from 10 (restrictive).
Meredith A. McIntyre (2005, pg 18), state that the “customs union is expected to
result in revenue losses. The SMART simulations estimated that the full
implementation of the EAC CET in Kenya would result in customs revenue losses of
US$113.3 million. An earlier analysis by the World Bank (2003) estimated the
revenue losses from the proposed three-band structure (0, 10, and 25) of
approximately US$150 million for Kenya. The empirical evidence thus suggests
there will be short-run revenue losses from the full implementation of the EAC
customs union and policymakers have to design policy responses to recoup revenue
losses. World Bank (2003) estimated that in Kenya customs exemptions amount to
22 percent of potential customs revenue, so to compensate for revenue losses,
policymakers could streamline exemptions, widening the tax base and increasing
revenues”.
Laird, Vanzetti, and de Córdoba (2006 Pg 7), said that many developing countries
are concerned that trade liberalization will have a significant adverse impact on
government revenues because tariff revenues represent substantial contribution to
public revenue. They continue to say that World Bank data indicate that the
contribution of tariff revenues to total government revenues ranges greatly from
virtually nothing in the European Union to over 76 per cent in Guinea cited by

35
(World Bank, 2003). Less extreme examples are Cameroon and India, where tariff
revenues represent some 28 and 18 per cent of government revenues, respectively.
Ten countries collect more than half their revenues from tariffs and 43 countries
collect more than a quarter. In OECD countries, tariff revenues represent on average
1 per cent or less.
2.3.4 Trade Protectionism and Cumbersome Trade Procedures
Another significant feature of tariffs in trade is protectionism and cumbersome trade
procedures. Trade Protectionism is the way that Government sets a policy for
importation of the same goods that are produced in the country for the purpose of
protecting domestic industry from foreign competition.
The Government set high tariffs rates for goods that restrict to enter into the country
for the sake of protecting domestic industry which produce the same imported goods.
Cumbersome Trade Procedures are the procedures that are adopted by the
Government to discourage the importation of goods and services in the country. The
Government sets the Non Tariffs Barriers (NTB’s) for goods and services imported
from outside the country. These NTB’s are congestion at the port, customs and
administrative procedures, cumbersome inspection requirements and police road
blocks. These two mechanisms have direct effect to the trade volume or import value
of the trade which results to the less revenue from the import tariffs.
Rajapatirana (2000) empirical report on tariffs reforms in Egypt noted that
“tariffication of quantitative restriction has led to the higher tariffs rate but low
revenue collection from the import duties” (pg 10). For the case of Egypt, the

36
empirical report stated that, these higher tariffs rates are above the maximum bound
rate agreed with the WTO of 40 percent. For example tobacco, textiles and some
motor vehicle with engine capacity larger than 1300cc carry tariff rates ranging from
54 percent to 100 percent. Alcoholic beverages are taxed at inordinately high rates
ranging from 1200% on beer to 3000% on spirit for religious and social reasons.
Hellqvist (2002, pg 13) said that the complexity of international trade procedures
makes it, however, very difficult to put exact figures on the monetary gains of trade
facilitation. Various estimations have calculated the cost of cumbersome trade
procedures to range between 2.5 - 15 percent of the value of traded goods. He
continues to say that cost calculations above 10 percent must, however, be regarded
as somewhat questionable. A rough calculation of the lower estimation (2.5 percent)
on the value of global trade would result in a cost of approximately US$
325,000,000,000. This amount gives a clear indication of the magnitude of the
possible lost of trade to the importers. It is not possible to simply convert these costs
per se into lost. Still, with modest claims from the importers on the costs, genuine
importers or big importers find alternative place where the cost would be minimized.
This will automatically affect the trade value of the destination.
Cumbersome trade procedures cannot only be measured in terms of money cost but
also in other ways. Hellqvist (2002, pg 18) identified the following effects of
cumbersome trade procedures: lack of transparency and predictability, time
consuming, decrease business opportunities, distort customer value, distort the
security of the trade, and decrease the money value of the importers by decreasing
the profit margin.

37
Rajapatirana (2000) empirical report concludes that the cumulative effect of different
standards is that of a non-tariffs barriers that can be expressed as a tariff equivalent.
The delay in clearance of imported goods from customs according to Rajapatirana
(2000) entails demurrage costs and finance charges to the importer. These belong to
the class of restrictions that have been described as “Para-tariffs”. They nevertheless
have the protective effects as tariffs in the importation of goods which have direct
effect on the revenue collected from importation.
Ahmad and Stern (1991) conducted an empirical study in Pakistan on the
effectiveness and efficiency of tariffs. They come to realize that the scope of import
revenue collection is quite circumscribed, not only by the items on the prohibited list,
but also by the quotas and the duty free items that are permitted. The consequences
of this pattern of prohibition, quotas and duty free items is that the number of goods
which yield import revenues is limited and the level of statutory tariffs is higher that
it might otherwise be and reduce both the amount of goods imported as well as the
revenues from the import goods. They said that given the pattern of import in
Pakistan, it is not a surprise that the major revenue earners are commodities in the
raw materials and intermediate goods sectors.
Ahmad and Stern (1991) explained in their empirical study report that among the
major arguments for declining of revenue from customs duties is administrative and
protective mechanisms as identified by others in the previous pages of this research
proposal. The protective argument should be subjected to very scrutiny, as to why
industry in question is likely to show greater learning by doing than others. There is

38
no doubt that administrative consideration painting towards stem and has effect to
the revenues collected from import tariffs.
Corzine (2008, pg 4) state that developing countries use import tariff escalation as a
means of protecting their own agricultural processing industries. Most developing
countries throughout Africa, Asia and Central and South America use some type of
import tariff to protect their main staples (WTO, 2008). Jeniffer Mmasi and Simon
Ihiga (2007, pg. 23) state that during the 2005/06 EAC and 2004 SADC NTBs
consultations, it was found out that a number of NTBs exist which directly affect
imports into Tanzania. Current (2007) consultations indicate that most of these NTBs
still exist. The only area where progress has been made is on customs documentation
through introduction of ASYCUDA++ at Dar es Salaam Port. However the problem
still exists in other entry border points.
NTBs categorize imports under on the following clusters:
(a) Customs and administrative documentation procedures
Examples of NTBs under this cluster include varying systems for imports declaration
and payment of applicable duty rates at entry points, limited customs working hours,
and cumbersome inspection procedures used by TRISCAN18.
(b) Cumbersome inspection requirements
Various NTBs experienced under this cluster include repeated and long inspection
queues during inspection of Gross Vehicle Mass and axle loads, faulty weighing
equipment at some stations, cumbersome and costly quality inspection procedures.

39
(c) Police road blocks
While this is not cited as a very serious obstacle to cross-border EAC and SADC
trade currently, police officers still stop commercial vehicles at various inter-country
road blocks and at border crossings even where there is no proof that goods being
transported are of suspicious nature (for example smuggled goods and drugs, etc).
(d) Congestion at Dar es Salaam Port
The use of old equipment like cranes used to offload cargo from delivery vessels has
led to serious clogging at the port, lack of warehousing space, slow turnaround time
of the vessels and consequently to exorbitant charges for deliveries to Dar es Salaam
port and demurrage charges on cargo.
2.3.5 Tax Exemptions
Exemptions constitute one revenue expenditure area that not only erodes the taxable
base of a tax system but also attracts abuse and generates avenues for tax evasion.
Beneficiaries of exemption in Zanzibar are covered under the main tax laws,
Investment Promotion Act, Export Processing Zones Act and the Free Ports Area.
Judica Tarimo (September, 2010 on The Guardian), noted politicians said on tax
exemptions that Government experts and mining company representatives are
engaged in negotiations aimed at removing tax exemptions on imported fuel for the
firms’ operations in the country.
The Deputy Minister of Finance and Economic Affairs, Omar Yusuf Mzee disclosed
that the negotiations started three months ago, but could not state when they would
be concluded.

40
“The idea is to ensure that mining companies pay taxes on imported fuel like other
people. And this is because factors that forced the government and mining
companies to agree on tax exemptions on imported fuel no longer exist,” said Mzee.
Tax exemptions and relief have become increasingly contentious in Tanzania, with
politicians criticizing it as occasioning losses amounting to billions of shillings in
government revenue.
In a recent interview with this paper, Chadema presidential candidate, Dr Willbrod
Slaa said the government was losing about 700bn/- monthly through tax exemptions.
Dr. Haji Semboja of the University of Dar es Salaam (UDSM), commenting on tax
exemptions in an interview with this paper recently, pointed out that one loophole
draining billions in government revenues was tax exemption on imported fuel for
mining companies.
Vito Tanzi and Howell Zee (2001) make it clear that, granting tax exemption is the
one form of tax incentives to promote investment around the world, evidence
suggests that their effectiveness in attracting incremental investments—above and
beyond the level that would have been reached had no incentives been granted—is
often questionable. As tax exemption can be abused by existing enterprises disguised
as new ones through nominal reorganization, their revenue costs can be high.
Peter Walkenhorst (2006, 7) said, the overwhelming share of trade taxes is collected
on imports. In 2005, about 55 per cent of all incoming shipments entered CAR under
the general customs regime, but these imports accounted for 83 per cent of all import
tax revenues. In contrast, special trade regimes that offered exemptions under

41
regional trade agreements, conventions and bilateral treaties, or other special
arrangements provided merely 17 per cent of revenues, although they accounted for
45 per cent of imports. Hence, the existing exemptions led to a considerable loss of
fiscal revenue. He continue to say, if all imports under special regimes would have
generated the same fiscal yield as the average of imports under the general customs
regime (i.e. 40.5 per cent), import tax receipts would have been 50 per cent higher.
Alternatively, without exemptions, the same revenue could have been raised with
border taxes that are a third lower than those actually in effect. These static
calculations of lost revenue due to exemptions do not take the incentive effects of
border taxes on trade flows into account.
Brenton, Hoppe and von Uexkull (2007, pg 8) said that Mauritius embarked in 2006
on the ambitious objective of becoming a duty free island by 2009. However,
Mauritius had already implemented substantial reform of statutory tariff rates over
the previous 6 years. The unweighted average tariff fell from more than 19 percent in
2000 to around 7 percent in 2005 (the weighted average tariff declined from almost
13 to just over 6 percent). However, these statutory rates mask the true level of
protection due to the extensive granting of exemptions. Actual customs duties
collected as a proportion of the value of imports amounted to 6 percent in 2000 and
had fallen to 3.6 percent in 2006. In 2000 and each year through 2004 the value of
customs duty exempted exceeded the amount collected. In 2000 the value of duty
exemptions was 7.4 percent of the value of imports. The impact of the reform of
tariffs has been primarily to diminish the value of these exemptions. Nevertheless, in
2005 exempted customs duties still amounted to 2.5 percent of the value of imports.

42
They also continue to say that excise duties now contribute more revenue than tariffs.
The key excises are those on alcoholic products and tobacco, fuel and motor
vehicles. The value of exemptions of excise duty is small relative to tariff
exemptions, being about half in 2005. Nevertheless, the excise duty exemptions are
highly concentrated with 72 percent relating to vehicles (duty exemptions for civil
servants account for almost half of the vehicle duty exemptions).
The main source of revenue from imports is now the VAT, which accounts for over a
half of revenues from trade compared, with around one third in 2000. This reflects
both the increasing value of imports and increases in the rate of VAT from 10 to 15
percent (in two steps). Exemptions from VAT are also substantial, being around one
third of the VAT actually collected on imports. There are also a number of products
that are zero-rated for VAT (Source: calculation based on Information from
Mauritius Customs).
William and Kwasi (2008, pg 39), said that in developing countries, tariff
exemptions usually apply to state organizations, any organization linked to aid
projects, international organizations, diplomatic groups, and expenditures financed
by project aid. In most cases, exemptions are discretionary. As such their scope tends
to increase over time. Exemptions make up a very important source of revenue loss.
Consequently, trade reforms that reduce exemptions tend to increase revenue
collections.
William and Kwasi (2008, pg 5 – 6) continue to say that the possible cause for the
decline in the effective rate is the widespread use of exemptions despite substantial

43
growth in the total value of imports. Growth in imports is partially attributed to the
removal of most direct quantitative restrictions on imports. Notably, the import
licensing system was abolished in 1989, but the widespread use of exemptions
created a gap in the government’s tax base, both directly through legitimate imports
of exempted goods and indirectly through the misuse of the exemptions offered.
Available data indicate that total exempt imports constituted close to 40.1% of total
imports in 1998. A little over 50% of such goods were exempted on the basis of the
third schedule of the Customs and Excise Act, whilst the rest were exempt because
of clearance through bonded warehouses and free zones (WTO, 2001).
They continue to say that on an annual basis, significant progress has been made in
tariff reforms since the mid 1990s, particularly with further lowering of the level of
tariff rates. However, the collection rates have remained low. This could mean that
despite the upsurge in imports, revenues collected from import duties have not
improved to match increases in imports since the latter part of the 1990s. Revenue
leakages from duty evasion and wide use of exemptions could be a major cause of
the low effective collection rates for some years.
Oussama Kanaan (2000, pg. 32) said that the erosion of the tax-to-GDP ratio could
have been if the shift in income from the public sphere to farmers, small enterprises,
and the informal sector had been accompanied by adequate improvements in tax and
customs administration and by reductions in the scope of exemptions.
2.4 Conclusion
In this chapter different documents and publications have been reviewed that define
and explain the import tariffs revenue and challenges that face collection. The review

44
shows that an import tariff is one among the sources of revenue of the government.
The government uses this source of income sustenance and implementing socio-
economic development programmes. Import tariffs face a major challenge of
exemption. Tax exemption erodes the import tariffs revenue which reduces
government’s ability to undertake socio-economic programs. In Tanzania, tax
exemption is also the major challenge that faces import tariffs revenue collection.

45
CHAPTER THREE
3.0 RESEARCH METHODOLOGY
3.1 Introduction
The research on Challenges that Face Import Tariffs Revenue Collection in Zanzibar
was conducted by using questionnaires. The process involved establishment of the
scope and coverage of the study, institutional arrangements and annual reports from
different institutions.
3.2 Research Design
Based on this study, both qualitative and quantitative approaches are used so as to
get in-depth investigation and analysis as well as descriptive statistics. A quantitative
approach is mostly used to gather data in a large sample while qualitative can be
used in a small sample whereby an in- depth of study can be obtained through
interview, observation, focus group and other instruments. In this study qualitative
method of data collection is considered more subjective in understanding matters
while quantitative approach is objective as argued by Ghauri and Grönhaug (2002).
However, some of the researchers argued that both quantitative and qualitative
methods can be used in the data collection because they increase the value and
justification of the research. Qualitative data will enable the researcher to gather data
which focus on participants’ attitudes and perceptions whilst quantitative data
collection can be used to measure its frequencies (Cooper and Schindler, 2008).
Hence both methods (quantitative and qualitative) were applied in this study.

46
3.3 Population and Sampling
The population of this study included business persons especially importers and
clearing and forwarding agents, and officials from Zanzibar Revenue Board (ZRB)
and Tanzania Revenue Authority (TRA). The sampling technique that was used for
importers and clearing and forwarding agents is based on the registered and
frequently visit to TRA, and for TRA and ZRB officials based on their duties
assigned. Table no. 3.1 show the population and sample size.
Table 3.1: Population and sample size
Response Population Targeted Rate (%)
Tanzania Revenue Board 160 80 50%
Zanzibar Revenue Board 130 55 42%
Total 400 205 51.25
Clearing and forwarding
agents and importers 110 70 63.64%
Source: Base on TRA and ZRB document
3.4 Institutional Arrangements
The study covered mainly two institutions namely: the Zanzibar Revenue Board
(ZRB) and Tanzania Revenue Authority (TRA). The reasons of involving these
institutions were to obtain accurate data and information and sharing of experience
for the collection of revenue. The second reason is that these are the only revenue
authorities in Zanzibar and hence information obtained therein is official and within
the law.
3.5 Annual Reports from different Institutions
Identification of the trend of import tariffs revenue collection for the study was based
on the annual report from Zanzibar Revenue Board (ZRB), Tanzania Revenue
47
Authority (TRA), Ministry of Finance and Economic Affairs (MOFEA), Office of
Chief Government Statistician (OCGS) and Bank of Tanzania (BOT). Main data
collected from these reports are: annual collection, sources of revenue and reasons
for increase and decrease of the collection. Several problems were encountered in the
course of obtaining these reports for the study including timely delivery, availability
of right people for consultations and some level of confidentiality that had to be
maintained.
3.6 The Questionnaires
Two different sets of questionnaires were designed and distributed to institutions and
business companies covered in the study. The first questionnaire was for the staffs
of Tanzania Revenue Authority (TRA) and Zanzibar Revenue Board (ZRB).
Questionnaires were directed to assist in the analysis of the increasing and decreasing
of import tariffs revenue. The second questionnaire was for the Clearing and
Forwarding Agents and Importers for the analysis of importation of goods and
payment of duties.
3.7 Administration of the Questionnaires
Due to easy geographical proximity of the registered importers and clearing and
forwarding agents who frequently visit TRA offices in Zanzibar, some
questionnaires were physically handed over and some were left to TRA offices, for
distribution. All questionnaires for the TRA and ZRB staffs were distributed to their
relevant head offices.
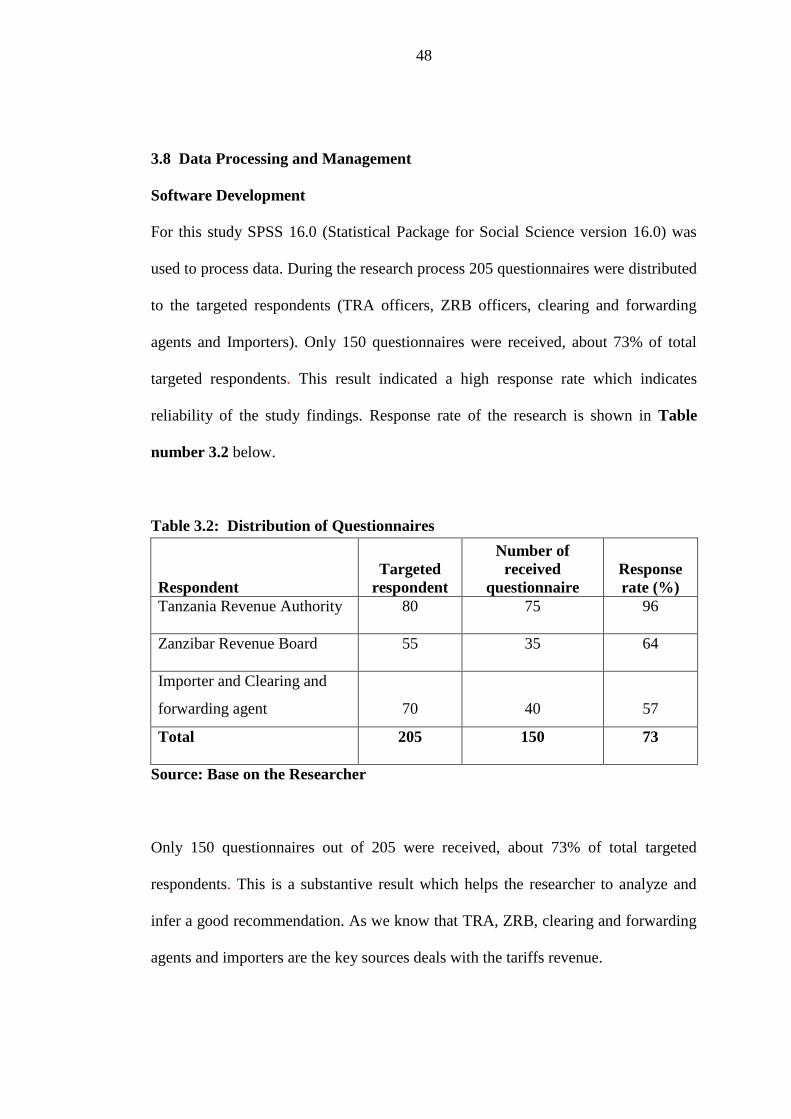
48
3.8 Data Processing and Management
Software Development
For this study SPSS 16.0 (Statistical Package for Social Science version 16.0) was
used to process data. During the research process 205 questionnaires were distributed
to the targeted respondents (TRA officers, ZRB officers, clearing and forwarding
agents and Importers). Only 150 questionnaires were received, about 73% of total
targeted respondents. This result indicated a high response rate which indicates
reliability of the study findings. Response rate of the research is shown in Table
number 3.2 below.
Table 3.2: Distribution of Questionnaires
Respondent
Targeted
respondent
Number of
received
questionnaire
Response
rate (%)
Tanzania Revenue Authority 80 75 96
Zanzibar Revenue Board 55 35 64
Importer and Clearing and
forwarding agent 70 40 57
Total 205 150 73
Source: Base on the Researcher
Only 150 questionnaires out of 205 were received, about 73% of total targeted
respondents. This is a substantive result which helps the researcher to analyze and
infer a good recommendation. As we know that TRA, ZRB, clearing and forwarding
agents and importers are the key sources deals with the tariffs revenue.
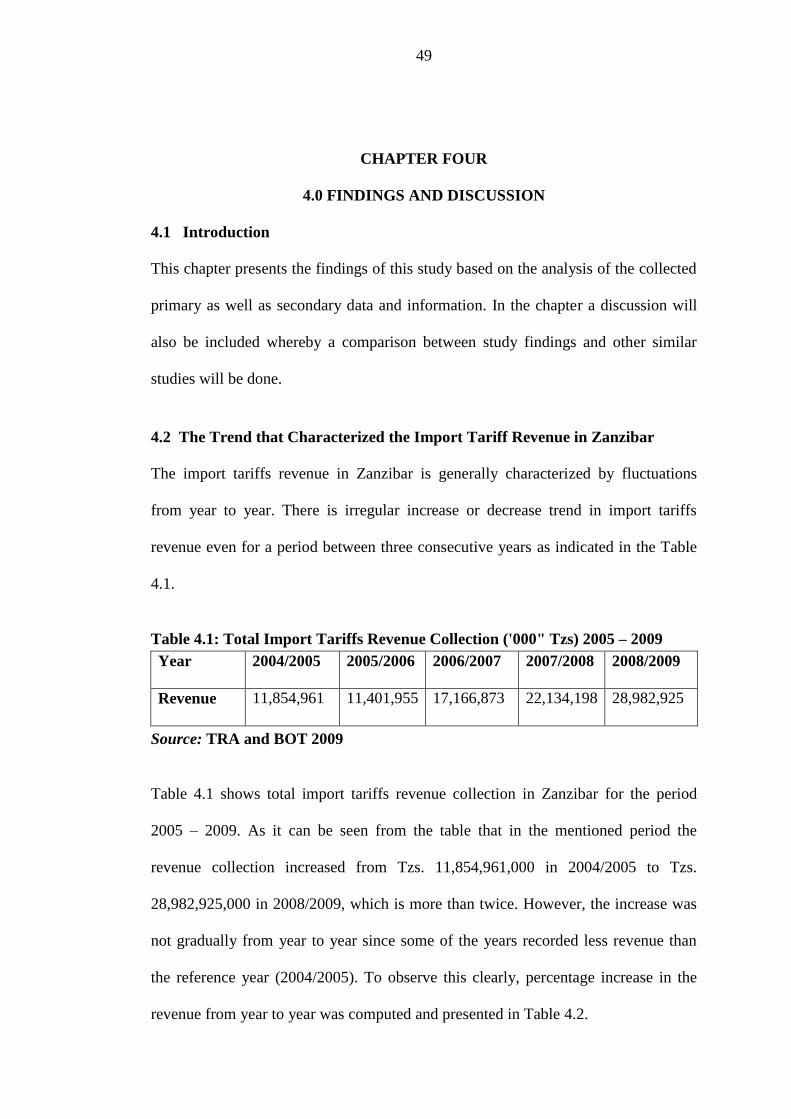
49
CHAPTER FOUR
4.0 FINDINGS AND DISCUSSION
4.1 Introduction
This chapter presents the findings of this study based on the analysis of the collected
primary as well as secondary data and information. In the chapter a discussion will
also be included whereby a comparison between study findings and other similar
studies will be done.
4.2 The Trend that Characterized the Import Tariff Revenue in Zanzibar
The import tariffs revenue in Zanzibar is generally characterized by fluctuations
from year to year. There is irregular increase or decrease trend in import tariffs
revenue even for a period between three consecutive years as indicated in the Table
4.1.
Table 4.1: Total Import Tariffs Revenue Collection ('000" Tzs) 2005 – 2009
Year 2004/2005 2005/2006 2006/2007 2007/2008 2008/2009
Revenue 11,854,961 11,401,955 17,166,873 22,134,198 28,982,925
Source: TRA and BOT 2009
Table 4.1 shows total import tariffs revenue collection in Zanzibar for the period
2005 – 2009. As it can be seen from the table that in the mentioned period the
revenue collection increased from Tzs. 11,854,961,000 in 2004/2005 to Tzs.
28,982,925,000 in 2008/2009, which is more than twice. However, the increase was
not gradually from year to year since some of the years recorded less revenue than
the reference year (2004/2005). To observe this clearly, percentage increase in the
revenue from year to year was computed and presented in Table 4.2.

50
Table 4.2: Percentage Change in Total Import Tariff Revenue Collection
2005 - 2009
Year 2004/2005 2005/2006 2006/2007 2007/2008 2008/2009
%tage change
of import tariff
revenue -12.97 -3.82 50.56 28.94 30.94
Source: Computed by researcher from TRA documents (2009)
Table 4.2 makes it clear the trend of increase in total import tariffs revenue
collection. As said earlier that the trend is not gradual and is generally characterized
by fluctuations from year to year; see Figure 4.1 for further illustrations.
-20
-10
0
10
20
30
40
50
60
2004/2005 2005/2006 2006/2007 2007/2008 2008/2009
Pe
rce
nta
ge
Year
%tage change of import tariff revenue
Figure 4.1: Percentage Change in Total Import Tariff Revenue Collection
4.3 Tax Exemption Management
One major weakness of the tax system is that it allows for numerous and generous
exemptions. Most of these exemptions apply to indirect taxes (excise duties, import
duties and VAT on importation). Nevertheless, exemptions also extend to direct

51
taxes. The discussion of exemptions is important since they have a significant impact
on the effective tax base. The provision of generous exemptions often tends to erode
the tax base which, in turn, affects total import tax revenue. Exemptions seem to
have lowered the income elasticity of import duties through depressing tax-to-base
elasticity.
The percentage of tax exemption to actual total tax revenue has been varying over
the period. The percentage of tax exemption to actual total import tariffs revenue was
at 80.54 percent of the total import tariffs revenue in the year 2004/2005. In
2005/2006 there was a slight decline up to 79.83 percent followed by a sharp
increasing to 117.99 percent in the year 2006/2007. The following years (2007/2008
and 2008/2009) tax exemption to total import tariffs revenue declined to 81.07 and
72.91 percent respectively. Table 4.3 shows the tax exemption as a percentage of
total import tariffs revenue.
Table 4.3: The Tax Exempted in Total Tariffs Revenue Collection from 2005 –
2009
Year 2004/2005 2005/2006 2006/2007 2007/2008 2008/2009
Total import
tariffs revenue
collection
11,854,960,899.00
11,401,954,934.00
17,166,872,604.00
22,134,197,568.00
28,982,925,048.00
Tax
exemption
9,548,000,000.00
9,102,614,079.00
20,255,710,975.00
17,943,380,000.00
21,131,680,000.00
%tage of
exemption vs
Total import
tariffs revenue
collection
80.54
79.83
117.99
81.07
72.91
Source: Computed by researcher from Tanzania Revenue Authority documents
(2009)

52
Figure 4.2 and 4.3 shows a graphical presentation of the total import tariffs revenue
collection and tax exemption, and percentage of tax exemption on total import tariffs
revenue collection respectively.
0.00
5.00
10.00
15.00
20.00
25.00
30.00
35.00
2004/2005 2005/2006 2006/2007 2007/2008 2008/2009
Bil
lio
ns
in T
zs
Year
Total import
tariffs revenue
collection Tax exemption
Figure 4.2: Total import tariff revenue and tax exemption
Source: Based on table 4.3

53
0
20
40
60
80
100
120
140
2004/2005 2005/2006 2006/2007 2007/2008 2008/2009
Pe
rce
nta
ge
Year
%tage of exemption vs Total import tariffs revenue collection
Figure 4.3: Percentage of exemption in total import tariffs revenue
Source: Based on table 4.3
The total import tariffs revenue collection presented in Table 4.1 previously (page
57) excludes tax exemptions which when included in the total revenue give figures
shown in Table 4.4.
Table 4.4: Total Import Revenue Collection including Exemptions ('000' Tzs)
Year 2004/2005 2005/2006 2006/2007 2007/2008 2008/2009
Total import
tariff
collection 11,854,961.00 11,401,955.00 17,166,873.00 22,134,198.00 28,982,925.00
Tax
exemption 9,548,000.00 9,102,614.00 20,255,711.00 17,943,380.00 21,131,680.00
Total import
tariff revenue
collection 21,402,961.00 20,504,569.00 37,422,584.00 40,077,578.00 50,114,605.00
Source: MOFEA 2009 and TRA 2009

54
From the table it can be observed that there is a slight decrease is from year
2004/2005 to 2005/2006 and then an increase from year 2005/2006 throughout to
year 2008/2009. Similarly, the percentage change of the revenue is computed and
presented in Table 4.5.
Table 4.5: Percentage Change in Total Tariffs Revenue Collection with
Exemption 2005 - 2009
Year 2004/2005 2005/2006 2006/2007 2007/2008 2008/2009
%tage change in
import tariffs
revenue
collection with
exemption 10.5 -4.2 82.51 7.09 25.04
Source: Calculated based on Table 4.4 above
Although the percentages changes in Table 4.5 differs in values from those shown in
Table 4.2, they have a comparative trend throughout the period 2005/2006 to
2008/2009. Figure 4.4 shows the trend which is depicted from the percentage
changes displayed in Table 4.5.
The trends shown in Figure 4.1 and 4.3 depict a relationship between total import
tariffs revenue and tax exemptions. Any one may expect that exemptions will depend
on total tariffs revenue collection. To verify this technically, it is appropriate to run a
regression analysis of total tariffs revenue on tax exemption. The result of this
regression is displayed in Table 4.6.

55
-10
0
10
20
30
40
50
60
70
80
90
2004/2005 2005/2006 2006/2007 2007/2008 2008/2009
Per
cen
tag
e
Year
%tage change in
import tariffs
revenue
collection with
exemption
Figure 4.4: Percentage Change in Import Tariff Revenue with Exemption
Source: Based on table 4.5
Table 4.6: Regression Analysis Between Tax Exemption and total Tariffs
Revenue
Parameter Value
Model
F-value 28.485
Sig. (p-value) 0.013
R-squared (R2) 0.905
Coefficients
Constant 801,851
Total tariffs 0.436
Note: Dependent variable: Tax exemption
As expected that the regression model between total tariffs revenue and tax
exemption is significant at 0.05 level based on F-values = 28.485 and p-value =
0.013 < 0.05. In addition to that, a high value of R2 which is 0.905 signifies that
about 90% of the variation in tax exemption is due to total tariffs revenue collection.
Also, a unit increase in total tariffs revenue may results in 0.436 unit increase in tax
exemptions. This statistical test is in accordance with usual expectation as noted
earlier that if revenue collection increases due to high amount of imports similarly

56
the tax exemption is expected to increase with a comparative rate to that of total
revenue.
4.4 The Possible Reasons/ Factors that have Influenced the Trends of the
Import Tariffs Revenue in Zanzibar
Based on reviewed literature, a number of factors have been mentioned which, in one
way or another, influence the trends of the import tariffs revenue in various
countries. Some of these factors seem to persist in many countries including
Zanzibar.
4.4.1 Political Atmosphere
Political atmosphere is one of the major factors which influence the whole economy
of Zanzibar. Both Figure 4.1 and 4.3 show a remarkable decrease in import tariff
revenue collections in the year 2005/2006. It is well known that it is in this year
when Zanzibar had its general election. Many economic activities slowed down due
to the nature and the way political campaigns for the election were conducted. Most
of the times there were crisis between police and political parties which sometimes
lead into fighting and hence destruction of properties. Apart from this factor, there
are other factors which are found to have significant impact in the trend of import
tariff revenue in Zanzibar.
4.4.2 Level of Tariff Charge
According to the responses of officers from tax management institutions, Zanzibar
Revenue Board (ZRB) and Tanzania Revenue Authority (TRA), on the nature of
import tariff revenue collected in Zanzibar, nearly three quarters of the respondents,
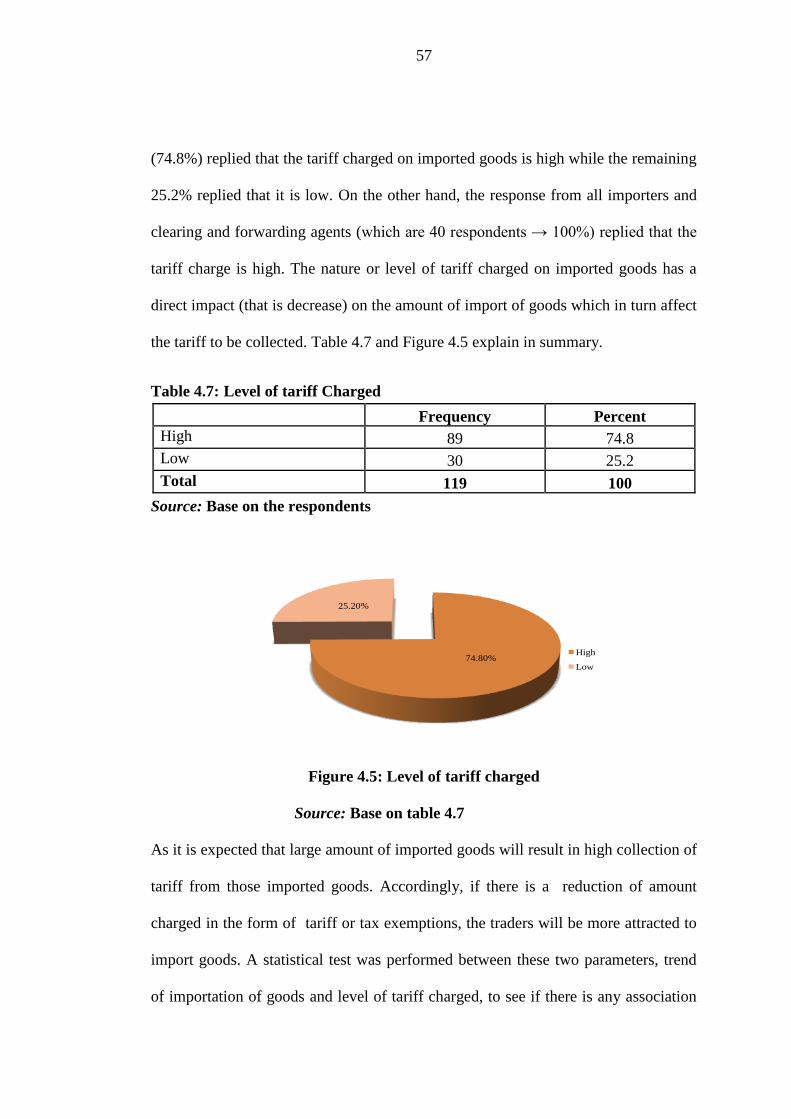
57
(74.8%) replied that the tariff charged on imported goods is high while the remaining
25.2% replied that it is low. On the other hand, the response from all importers and
clearing and forwarding agents (which are 40 respondents → 100%) replied that the
tariff charge is high. The nature or level of tariff charged on imported goods has a
direct impact (that is decrease) on the amount of import of goods which in turn affect
the tariff to be collected. Table 4.7 and Figure 4.5 explain in summary.
Table 4.7: Level of tariff Charged
Frequency Percent
High 89 74.8
Low 30 25.2
Total 119 100
Source: Base on the respondents
74.80%
25.20%
High
Low
Figure 4.5: Level of tariff charged
Source: Base on table 4.7
As it is expected that large amount of imported goods will result in high collection of
tariff from those imported goods. Accordingly, if there is a reduction of amount
charged in the form of tariff or tax exemptions, the traders will be more attracted to
import goods. A statistical test was performed between these two parameters, trend
of importation of goods and level of tariff charged, to see if there is any association

58
between the two. The result of the test yield a Chi-square value = 8.66 with p-value =
0.003 as shown in Table 4.8.
Table 4.8: Distribution of Trend of Importation of Goods and Level of Tariff
Charged
Level of
tariff
charged
Trend of importation of goods
Increase Decrease Total
Frequency Percentage Frequency Percentage Frequency Percentage
High 64 71.9 25 28.1 89 100
Low 24 100 0 0 24 100
Total 88 77.9 25 22.1 113 100
Chi-square vale = 8.66, p-value = 0.003
Source: Calculation based onthe respondents
Two useful information are derived from chi-square test are Chi-square value and p-
value. Chi-square value measures the magnitude of the variation of one variable due
to variation in the other variable while p-value measure the significance of the chi-
square value itself. This means that the higher the chi-square value is the higher the
association that exists between two variables under consideration. However, p-value
has an important role of determining the significance of that association. Based on
the data that is available, the test results confirm a significant association between
trend of importation of goods and level of tariff.
This is clearly apparent from p-value = 0.003 which is less than 0.05, a desirable
level of significance, thereby suggesting that the chi-square value of 8.66 is
significant and hence showing significant association between trend of importation
of goods and level of tariff.. Based on the result from the table it is clearly seen that

59
increasing importation of goods is associated more with low level of tariff charged
than with high level, that volume of goods imported is increasingly proportional to
revenue collected.
Table 4.9: Distribution of Reasons for Reducing Tariff Charged
Frequency Percent
Increase importation of goods 19 27.1
Increase business activities 13 18.6
Increase domestic revenue 27 38.6
Other problems 11 15.7
Total 70 100
Source: Based on the respondents
All respondents who replied that the level of tariff charged is high were asked on
whether it is reasonable to reduce it or not. Out of 89 respondents, 78.7% of them
replied that it is reasonable to reduce the tariff charged on imported goods. The
reasons behind reduction of tariff charged on imported goods are presented in Table
4.9 and Figure 4.6.
Three main reasons were presented which have comparative distribution among
respondents. About 38.6% of the respondents said that the reduction in tariff on
imported goods will results in increasing domestic revenue and hence reducing
poverty level among the community. In addition to that, 27.1% of respondents said
that reduction in charged tariff will result in increasing importation of goods which
in turn have impact on tariff itself as explained earlier. The third reason of reducing

60
charged tariff was increase in business activities which in turn increase Government
revenue, 18.6% of the respondents support this notions.
0
5
10
15
20
25
30
35
40
Increase importation
of goods
Increase business activities
Increase domestic revenue
Other problems
Perc
enta
ge
Reasons
Percent
Figure 4.6: Reasons for reducing tariff charge
Source: Based on table 4.9
Increasing importation of goods is likely to increase the tariff revenue collection.
Hence, trend of importation of goods is considered as one of the determinants of the
trend of tariff revenue collection. Table 4.10 and Figure 4.7 below present response
of interviewed officers on the trend of importation of goods. As it is seen that more
than three quarters (77.9%) of them said that the trend is increasing while the
remaining 22.1% replied that the trend is decreasing.
Table 4.10: Trend of Importation of Goods
Frequency Percent
Increase 88 77.9
Decrease 25 22.1

61
Total 113 100
Source: Based on the respondents
Increasing trend of importation of goods is the result of, among other things,
increasing trend of tax exemptions. Recalling the results from Table 4.3 and 4.4 it
was shown that there is an increasing trend of total tariff revenue collection and also
a high relationship between tariff revenue collection and tax exemption. Hence,
increasing total tariff revenue collection implies increasing tax exemption. It is this
increasing trend of tax exemption which leads to the reported increasing trend of
importation of goods albeit uncorresponding total revenue collection.
77.90%
22.10%
Increase
Decrease
Figure 4.7: Trend of Importation of Goods
Source: Based on table 4.1
Based on the results of the responses from the interviewed officers, there are other
reasons for increasing importation of goods apart from those verified by the data.

62
Table 4.11 and Figure 4.8 display distribution of reasons for increasing importation
of goods based on responses from interviewed officers.
Table 4. 11: Distribution of Reasons for Increased Importation of Goods
Frequency Percent
High integrity of tax officers 12 12.8
Improve clearance customs facilities 32 34
Introduction of new system of clearance of imported
goods 24 25.5
Other reasons 26 27.7
Total 94 100
Source: Based on the respondents
As the table shows that majority of the respondents mentioned that improved
clearance customs facilities is one among the reasons for increasing importation of
goods with 34.0% of respondents replied to this reason. Introduction of new system
of clearance of imported goods was named as another reason for increasing
importation of goods with 25.5% of respondents while only 12.8% of respondents
said that the reason behind increasing importation of goods is high integrity of tax
officers. The remaining proportion of officers replied to other reasons.
0
5
10
15
20
25
30
35
40
High integrity of
tax officers
Improve
clearance
customs facilities
Introduction of
new system of
clearance of
imported goods
Other reasons
Per
cen
tage
Reasons
Percent
Figure 4.8: Reasons for increase of importation of goods
Source: Based on table 4.11

63
Further verification of tariff charged and importation goods found that it was
necessary to seek clerification from tax offices with experience on the field of
taxation. This exercise gave more useful result, in determining whether the trend is
really increasing or decreasing. Table 4.12 illustrates the findings.
Table 4.12: Distribution of Response for Level of Tariff Charged by Working
Experience of the Respondent
Experience
Level of tariff charged
High Low Total
Frequency Percentage Frequency Percentage Frequency Percentage
Less than
4 years 9 60 6 40 15 100
5-8 years 12 40 18 60 30 100
9-12 years 27 100 0 0 27 100
13 years
and above 41 87.2 6 12.8 47 100
Total 89 74.8 30 25.2 119 100
Chi-square value = 33.96, p-value =0.000
Source:Calculation based on the respondents
The Table shows the distribution of the responses for the level of tariff charged by
working experience of the interviewed officers. The table is accompanied with a Chi-
square test for association between the two parameters, a Chi-square value = 33.96
with p-value = 0.000. Based on these results it can be concluded that there is an
association between the two and according to the scores from the Table 4.12.
Majority of those with long experience reported that the level of tariff is high as
compared to those with short-term experience. This implies that as the years go on
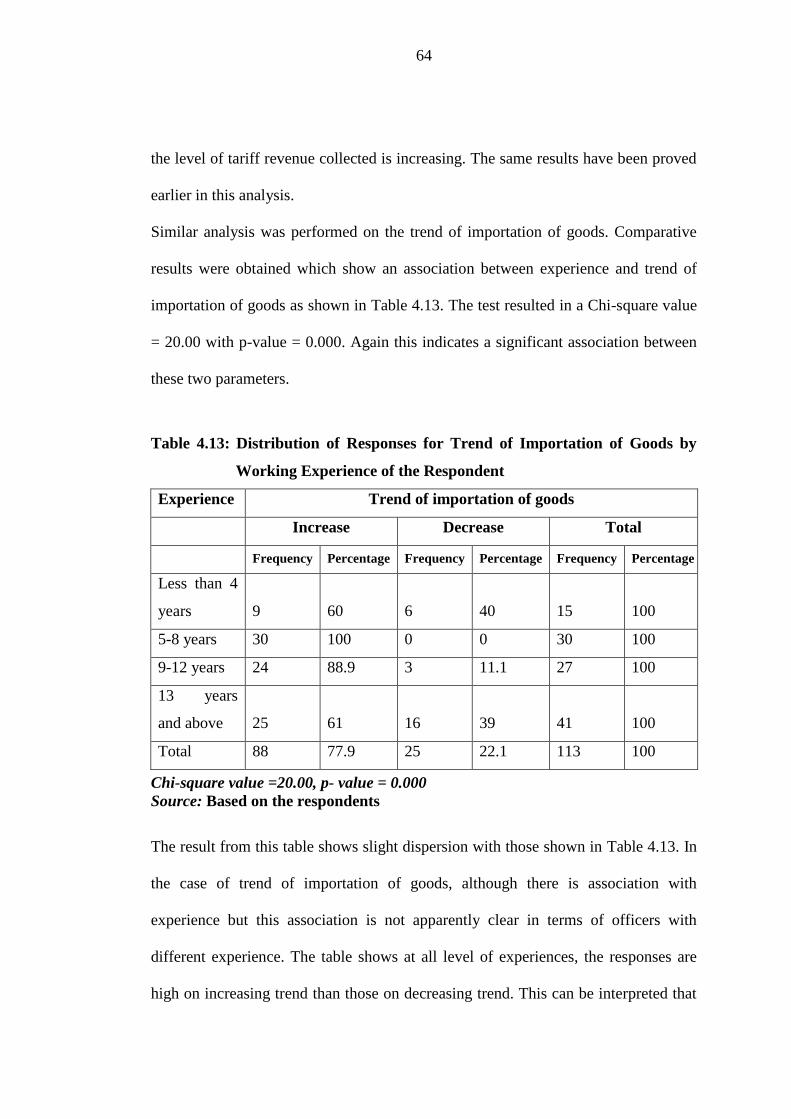
64
the level of tariff revenue collected is increasing. The same results have been proved
earlier in this analysis.
Similar analysis was performed on the trend of importation of goods. Comparative
results were obtained which show an association between experience and trend of
importation of goods as shown in Table 4.13. The test resulted in a Chi-square value
= 20.00 with p-value = 0.000. Again this indicates a significant association between
these two parameters.
Table 4.13: Distribution of Responses for Trend of Importation of Goods by
Working Experience of the Respondent
Experience Trend of importation of goods
Increase Decrease Total
Frequency Percentage Frequency Percentage Frequency Percentage
Less than 4
years 9 60 6 40 15 100
5-8 years 30 100 0 0 30 100
9-12 years 24 88.9 3 11.1 27 100
13 years
and above 25 61 16 39 41 100
Total 88 77.9 25 22.1 113 100
Chi-square value =20.00, p- value = 0.000
Source: Based on the respondents
The result from this table shows slight dispersion with those shown in Table 4.13. In
the case of trend of importation of goods, although there is association with
experience but this association is not apparently clear in terms of officers with
different experience. The table shows at all level of experiences, the responses are
high on increasing trend than those on decreasing trend. This can be interpreted that

65
trend of imported goods is increasing steadily with a positive growth rate in each
year so that even within a short term period there is no negative rate of increasing
which was observed.
4.5 Problems which Lead to Low Import Tariff Revenue Collection
Beside those challenges which contribute to fluctuations in import tariff collection in
Zanzibar, as discussed in section 4.2, there are a number of problems which have
been mentioned to be the challenges to collect tariff revenue in Zanzibar. These
major problems are explained hereunder:
4.5.1 Some Imported Goods do not Pass through the System (ASCUDA++)
Tanzania Revenue Authority (TRA) has put in place a system called ASCUDA++.
This is a computerized system used mainly for controlling and documentation of
logistics, clearing and forwarding activities. For the case of TRA, they use the
system mainly for controlling and documenting imported goods which enter in the
country through sea ports, airports, border stations and any other legal means of
importation. The system has different tariffs for different goods imported. However,
this system is not applicable for foodstuffs and petroleum products in Zanzibar. The
following Table 4.14 shows the different tariff rates and different goods with
different systems.
Table 4.14: Tariff Charge and Products
Product name
Tariff charge in the
system
Tariff charge not in
the system
Petroleum products
Illuminating Kerosene (IK) Tzs. 122 per litre Tzs. 30 per litre
Gasoline regular (MSP) Tzs. 135 per litre Tzs. 30 per litre
Gasoline regular premium
(MSP) Petrol Tzs. 146 per litre Tzs. 80 per litre

66
Foodstuffs
Sugar 35% 12.50%
Rice 25% 12.50%
Wheat flour 25% 12.50%
Source: Based on Tanzania Revenue Authority (TRA) documents
As can be seen in Table 4.14 the rate charged through the system is higher compared
to the rate applicable for those goods which do not pass through the system. The
reason behind why Zanzibar does not process foodstuffs and petroleum products is to
minimize the cost of living for Zanzibari’s. Therefore, some importers take this
opportunity to hide goods imported to the country. This result in an underestimation
of imported goods and badly the government lose its import revenue.
4.5.2 Self-assessments on Importation of Goods
Self assessment is the method according to law which empowers importers to assess
themselves for all goods imported. The importer surrenders the supplier’s invoice
and or bill of lading which shows the value of goods imported that is, Cost,
Insurance and Freight (C. I. F). The value is the base of charging taxes. Therefore,
most of the times importers do not declare truly what they have imported leading to
underestimation of the value of goods thereby reducing tax revenue.
4.5.3 Double Taxation
All goods imported in Zanzibar are eligible for duties, but not all goods imported are
used in Zanzibar; some are transferred to Tanzania Mainland. Those goods
transferred to Mainland especially motor vehicle are charged duties on importation.
The valuation method used to charge duties is called Used Motor vehicle Valuation

67
System (UMVS). This is an electronic system which determines the value of all
motor vehicles entered into Tanzania Mainland. The method identifies year of
manufacture, capacity of a car and the value of the car according to worldwide
market, but the method does not consider depreciation of the motor vehicle. This is
the base of charging duties. However, this method is not used in Zanzibar. Zanzibar
uses Depreciation Method or Book Value Method which determines depreciation of
a car and then computing applicable duties.
According to these methods, UMVS determines high value of charging duties while
Depreciation Method determines low value of charging duties. Therefore,
Depreciation Method is not acceptable in Tanzania Mainland and all motor vehicle
transferred to Tanzania Mainland are eligible to pay the difference on the duties
according to UMVS valuation. That is why traders divert their imported motor
vehicles to Tanzania Mainland and reduce volume of imported goods and import
revenue.
4.5.4 Lack of Transparency
As mentioned earlier, all goods entering the country are charged duties based on the
value mentioned on the supplier’s invoice or Bill of Lading (BL) which shows Cost,
Insurance and Freight (C.I.F). The customs officers have discretionary powers,
which create uncertainty and unpredictability in the trade environment. Customs
officials constantly uplift the value of the goods instead of using the C.I.F value
provided or the supplier’s invoice. Valuation of goods is usually the base on which

68
tariff and tax liabilities are calculated and an uplift result in a higher tax liability and
creates the tendency of the importers to underestimate the value of the goods. It is the
behavior of some custom officials that contributes to reduction in the collection of
import duties.
4.5.5 Lack of Customs Warehouse and Inadequate Port Area
All goods imported into the country are subjected to examination and assessment.
The examination process is conducted when the goods are delivered to the port. After
the examination, the next step is valuation. The valuation method is conducted to
determine the tax liability. Customs warehouse is a very important place to store
imported goods. All goods imported are not required to stay for more than twenty
one days (21 days) at the port area. However, ssometimes, goods stay for more than
21 days at the port hence are technically converted into uncleared goods “long stay
goods”, “abandoned goods” or “ceased goods”. Such goods have to be transferred to
the customs warehouse. Unfortunately, Zanzibar has no customs warehouse and
hence all goods are remain at the port. This unfortunate circumstance causes
difficulty in assessing imported goods due to congestion and obstruction. Movement
between containers and in between bulk goods becomes tedious.

69
CHAPTER FIVE
5.0 CONCLUSION AND RECOMMENDATION
5.1 Introduction
This chapter addresses findings raised in the study and highlights policy implications
which may serve as a challenge to policy makers, researchers and the academic
community.
5.2 Conclusion
5.2.1 The Trend of Import Tariffs Revenue
The import tariffs revenue in Zanzibar is generally characterized by fluctuations
from year to year. Revenue collection increased from Tzs.11,854,961,000 in
2004/2005 to Tzs. 28,982,925,000 in 2008/2009, which is more than twice. The main
goods imported are used motor cars and used electronic goods. Importation of used
electronic goods leads to increase revenue on importation and the Government as
well, but in terms of country’s environment these goods normally are not in a good
condition for usage (obsolete). The situation makes the country a dumping place for
obsolete goods.
5.2.2 Tax Exemption
Based on the collected data in this study, it was found that there is a high proportion
of tax exemption for the imported goods; hence the Zanzibar Government loses
much of import tariff revenue. The percentage of tax exemption to actual total import
tariffs revenue was at 80.54 percent in the year 2004/2005. In 2005/2006 there a was
slight decline down to 79.83 percent followed by a sharp increase to 117.99 percent
in the year 2006/2007. The following years (2007/2008 and 2008/2009) tax

70
exemption to total import tariffs revenue declined to 81.07 and 72.91 percent
respectively.
Some importers who are granted exemption tend to abuse (misuse) the facility. In
case of foodstuffs, the businessman use exempt facility to yield high profit in their
business by sets a price including government tax to be paid by consumers. But in
actual fact the importer did not pay tax and hence consumers add to their profit.
5.2.3 Political Atmosphere
There is uncertainty in the collection of revenue on importation. It is high risk for
Government to depend on international trade. For a country to be stable it should
depend on local taxes like VAT derived from well-established industries and
functioning policies instead of depending on importation.
5.2.4 Level of Tariff Charge
Based on the findings of this study, nearly three quarters (74.8%) of the respondents
(TRA and ZRB officers), replied that the tariff charged on imported goods is high
and on the other hand, the response from all importers and clearing and forwarding
agents (40 respondents → 100%) replied the same. The nature or level of tariff
charged on imported goods has a direct impact on the amount of import of goods
which in turn affect the tariff to be collected.
5.2.5 Some Imported Goods do not Pass through the System (ASCUDA++)
Based on findings, foodstuffs and petroleum products are not passed through the
computerized system (ASCUDA++) hence leads some importers to take this
opportunity to conceal goods imported.
71
5.2.6 Self-assessment on Imported Goods and Lack of Transparency
Self assessment is the method used to assess the value of goods imported. Normally
importers by using this method under declare the value of the goods which is the
base of charging duties. The customs officers have discretionary power to uplift the
value of the goods imported because of lack of transparency which tend to under
declare the true value of the goods imported. The TRA as a tax institution need to
establish and maintain Transaction Price Database (TPD) for evaluation of imported
goods.
5.2.7 Double Taxation
The TRA mainland makes valuation of motor vehicle through the system called Used
Motor Vehicle Valuation System (UMVS) to determine the value to charge duties,
while TRA Zanzibar used Depreciation Method. The results of these two methods
are differing. UMVS determine high value of motor vehicle while Depreciation
Method determines low value for considering depreciation of the motor vehicle. This
issue should be discussed between two partners (Tanzania mainland and Tanzania
Zanzibar) for a solution. Therefore, the transfer of goods from one part to another is
not an importation is just a transfer which is not required to charge any duties
concerning importation, the duties already paid at the point of entering goods in the
country.
5.2.8 Lack of Customs Warehouse and Insufficient Port Area
Zanzibar port is insufficient to handle all goods entered to the country for customs
clearance including examination and valuation of goods imported. Unfortunately,

72
Zanzibar has lack of customs warehouse for storage goods which are unclear (long
stay goods), abandoned goods and ceased goods.
5.3 Recommendations
1. The Trend of Import Tariffs Revenue
The Government sets policies and laws for importation of used electronic goods by
charging high rate on importation for those goods which are used for two years and
above. This will help to protect people as well as country’s environment.
2. Tax Exemption
The laws of granting exemption must be reviewed and emended by remove
exemption on foodstuffs, and exempt only 50 percent (50%) of duties for those who
entitled according to law to have exemption.
3. Political Atmosphere
Government should improve existing industries and installing new industries, also to
have well established Block Management System (BMS) which used for monitoring
and controlling domestic revenue generated from different business activities.
4. Level of Tariff Charge
It is right time for the Government to introduce a policy of Special Economic Zone
(SEZ) so as to reduce tax with expectation that importation of goods will increase as
well as business activities which in turn to increase import revenue and domestic
revenue and hence reducing poverty level among the community.

73
5. Some Imported Goods do not Pass Through the System (ASCUDA++)
There is a need for TRA in Zanzibar to have a system to the sea ports, airports,
border stations and any other legal means of importation which will monitor and
control all importation of goods.
6. Self-assessment on Imported goods and Lack of Transparency
TRA as a tax institution need to establish and maintain Transaction Price Database
(TPD) for evaluation of imported goods.
7. Double Taxation
Tanzania mainland and Tanzania Zanzibar, should agree to use only one system
whether Depreciation method or Used Motor vehicle Valuation System (UMVS) on
the valuation of imported motor vehicle.
8. Lack of Customs Warehouse and Inadequate Port Area
TRA must have to establish and accommodate customs warehouse and yards for
accurate valuation and examination of all imported goods for establishment of tax
liability.
5.4 Areas for Further Studies
The aim of the study was to examine and identify the challenges that face import
tariffs revenue collection in Zanzibar. The study based mainly on the issue of tax
exemption management, high import duties, hidden taxes, the legal framework and
its implementation (tax policy, laws & regulations) and double taxation.

74
Because of lack of time and other resources the researcher could not cover broader
area such as global financial and economic crisis during the time of the study. Other
areas not covered include transparency in import tax collection leading to corruption,
lack of improper import tax information system, the problem of the tax system to
meet requirements of a market economy to ensure trade competitiveness and the
fluctuation of the value currency. The researcher believes that further studies into
these areas bring substantive results that will show reasons on fluctuation of the
import tariff revenue collection thereby eroding the tax base. Not only that; these
challenges will show whether the Government should continue to depend on this
source of revenue or to diversify tax base.

75
REFERENCES
Ahmad, E. S & Stern, N. (1991), “The Theory and Practice of Tax Reforms in
Developing Countries”, Cambridge University Press.
Andrea Goldstein And Njuguna S. Ndung’u (2001), “Regional Integration
Experience In The Eastern African Region”. OECD Development Centre.
Working Paper No. 171 (Formerly Technical Paper No. 171)
Azharia Abdelbag Elbushra , Ali A. A. Salih , Marc Muller “Effects of Tariff Reform
on Sudan’s Economy: Applied General Equilibrium Analysis”.
Bank of Tanzania (BOT), (2004/2005), Annual Report
Bank of Tanzania (BOT), (2005/2006), Annual Report
Bank of Tanzania (BOT), (2006/2007), Annual Report
Bank of Tanzania (BOT), (2007/2008), Annual Report
Bank of Tanzania (BOT), (2008/2009), Annual Report
Baunsgaard, T., and M. Keen, 2005. Tax Revenue and (or?) Trade Liberalization.
Working Paper WP/05/112. International Monetary Fund, Washington, DC.
Bird, R.M. and Zolt, E.M. (2003) “Introduction to Tax Policy Design and
Development” Draft prepared for a course on Practical Issues of Tax Policy
in Developing Countries, World
Busse, M., and H. Grossmann (2004) “Assessing the Impact of ACP/EU Economic
Partnership Agreement on West African Countries”. HWWA Discussion
Paper 294 Hamburgisches Welt Wirtschafts-Archiv, Hamburg.
Ghauri, P and Grönhaug, K (2002): Research Methods in Business Studies, Pearson
Education, London.
76
Hellqvist, Marcus (2002), Trade Facilitation – Impact and Potential Gains. National
Board of Trade / SWEPRO. Stockholm, August 2002
Hoekman, B., F. Ng and M. Olarreaga (2004), ‘Agricultural Tariffs or
Subsidies:Which are more important for Developing Economies?’, World
Bank Economic Review, 18, 2, 175-204.
International Monetary Fund (2005), “Dealing with the Revenue Consequences of
Trade Reform” Prepared by the Fiscal Affairs Department In consultation
with Other Departments Approved by Teresa Ter-Minassian
Jeniffer Mmasi and Simon Ihiga (2007), A Survey of Non-Tariff Barriers That Affect
Tanzanian Imports and Exports within EAC, SADC and COMESA Countries.
Final Report
Jeffrey G. Williamson (2003), “Was It Stolper-Samuelson, Infant Industry or
Something Else?” World Tariffs 1789-1938 Working Paper 9656
National Bureau of Economic Research
Online at http://www.nber.org/papers/w9656
Joaquim Bento De Souza Ferreira Filho (2007), “Fiscal Reform and Compensatory
Mechanisms” PEP-IDB Policy Forum on Trade & Poverty.
Joweria M. Teera (2004), “Determinants of Tax Revenue Share in Uganda”
Judica Tarimo “Government acts on tax exemptions” The Guardian, 21st
September 2010.
Lucio Castro, Christiane Kraus, Manuel De La Rocha (2004), “Trade and Revenue
Impacts Of The Planned East African Community Customs Union” Regional
Trade Integration in East Africa. Africa Region Working Paper Series No.
72.
77
M.A. Consulting Group (2005), “Study on the Establishment of an East African
Community Common Market”. East African Community Secretariat, Final
Report
Mark Weisbrot and Dean Baker (2002), “The Relative Impact of Trade
Liberalization on Developing Countries” Center for Economic and Policy
Research (CEPR).
Meredith A. McIntyre (2005), “Trade Integration in the East African Community: An
Assessment for Kenya”. IMF Working Paper WP/05/143
Michelle N. Corzine (2008), “An Analysis of Import Tariff Escalation: Case Of
Maize Trade Between South Africa And Mozambique” Master of Science on
Agriculture, Food and Resource Economics
Ocampo, J. Antonio, T. Lance (1998), “Trade Liberalization in Developing
Economies: Modest Benefits but Problems with Productivity”. Economic
Journal, Sept.1998, vol. 108, Issue 450, p. 1523, 24p
Oussama Kanaan (2000) “Tanzania’s Experience with Trade Liberalization”
Finance & Development paper
Paul Brenton, Mombert Hoppe and Erik von Uexkull (2007), Evaluating the
Revenue Effects of Trade Policy Options for COMESA Countries: the
Impacts of a Customs Union and an EPA with the European Union. Trade
Department World Bank.
Rajapatirana, Sarath (2000), “The Economic analysis of Tariff Reform in Egypt” in
Development Economic Policy Reform Analysis Project Report, Vol. II,
American Enterprises Institute.

78
Revolutionary Government of Zanzibar “Zanzibar Strategy for Growth and
Reduction of Poverty” (ZSGRP), (2007)
Revolutionary Government of Zanzibar “Population and Housing Census” (2002)
Revolutionary Government of Zanzibar (2009) “Socio - Economic Survey”
Statistical Report (Preliminary Results)-(12 May 2010) Office of Chief
Government Statistician Zanzibar
Sam Laird, David Vanzetti and Santiago Fernandez de Córdoba (2006) “Smoke and
Mirrors: Making Sense of the WTO Industrial Tariff Negotiations”. Policy
Issues in International Trade and Commodities Study Series No. 30.
UNCTAD UNITED NATIONS. New York and Geneva, 2006
Sangeeta Khorana, Kato Kimbugwe and Nicholas Perdikis (2007), Regional
Integration under the East African Community: “An Assessment of the Trade
and Welfare Effects for Uganda”
Santiago Fernandez De Cordoba and David Vanzetti (31 August – 2 September
2005), “Searching For a Solution to the WTO Industrial Tariff
Negotiations”Africa Regional Workshop on WTO Negotiations Cape Town,
South Africa Now What? Hosted By Tralac And Commonwealth Secretariat
Tanzania Revenue Authority (TRA), (2004/2005), Annual Report
Tanzania Revenue Authority (TRA), (2005/2006), Annual Report
Tanzania Revenue Authority (TRA), (2006/2007), Annual Report
Tanzania Revenue Authority (TRA), (2007/2008), Annual Report
Tanzania Revenue Authority (TRA), (2008/2009), Annual Report
Tanzania Revenue Authority (TRA), (2009/2010), Annual Report
TRA, (2004), Tax Administration and structure in Tanzania

79
United Nation Development Program (2001) report
United Nation Development Program (2009).
Vito Tanzi and Howell Zee (2001), “Tax Policy for Developing Countries”
International Monetary Fund
Walkenhorst, Peter (2006), Trade policy and regionalism in the Central African
Republic. World Bank. Online at http://mpra.ub.uni-muenchen.de/23863/
MPRA Paper No. 23863 posted 13. July 2010
Walkenhorst, Peter (2006) “Compensating Lost Revenue in Regional Trade
Agreements”.
William Gabriel Brafu-Insaidoo and Camara Kwasi Obeng (2008), “Effect of Import
Liberalization on Tariff Revenue in Ghana” Department of Economics
University of Cape Coast, Ghana AERC Research Paper 180, African
Economic Research Consortium, Nairobi.
William Gabriel Brafu-Insaidoo and Camara Kwasi Obeng (2008), “Effect of Import
Liberalization on Tariff Revenue in Ghana” AERC Research Paper 180
African Economic Research Consortiums, Nairobi.
World Development Indicators (2001) report
Williamson (2003), “Strategic Tariffs and Revenue needs”
Zanzibar State Trading Cooperation (2006) “Annual Report”
Zanzibar State Trading Cooperation (2007) “Annual Report”
Zanzibar State Trading Cooperation (2008) “Annual Report”
Zanzibar State Trading Cooperation (2009) “Annual Report”
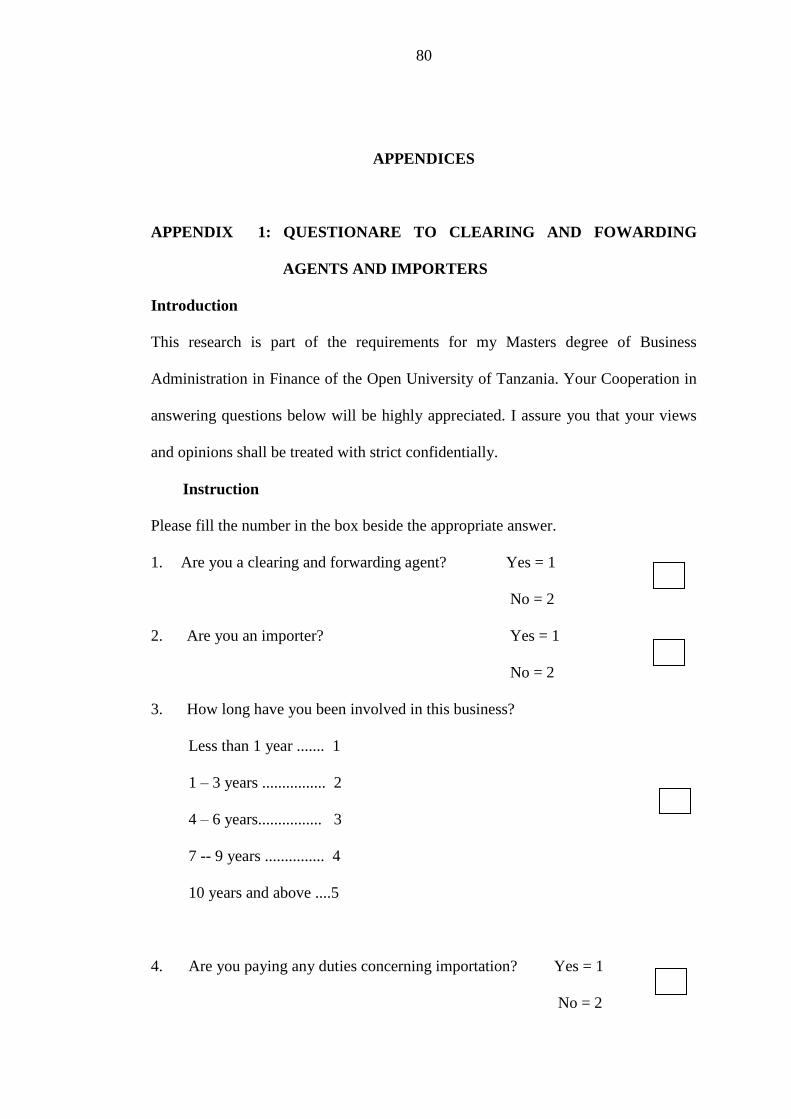
80
APPENDICES
APPENDIX 1: QUESTIONARE TO CLEARING AND FOWARDING
AGENTS AND IMPORTERS
Introduction
This research is part of the requirements for my Masters degree of Business
Administration in Finance of the Open University of Tanzania. Your Cooperation in
answering questions below will be highly appreciated. I assure you that your views
and opinions shall be treated with strict confidentially.
Instruction
Please fill the number in the box beside the appropriate answer.
1. Are you a clearing and forwarding agent? Yes = 1
No = 2
2. Are you an importer? Yes = 1
No = 2
3. How long have you been involved in this business?
Less than 1 year ....... 1
1 – 3 years ................ 2
4 – 6 years................ 3
7 -- 9 years ............... 4
10 years and above ....5
4. Are you paying any duties concerning importation? Yes = 1
No = 2
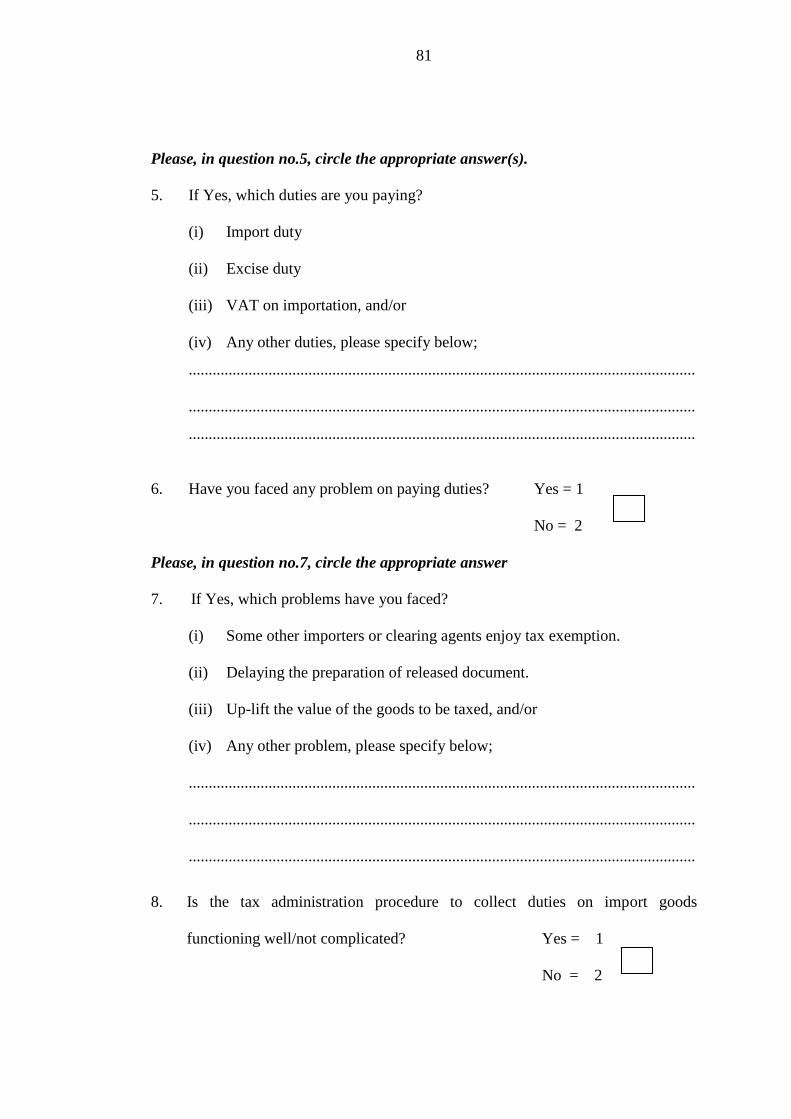
81
Please, in question no.5, circle the appropriate answer(s).
5. If Yes, which duties are you paying?
(i) Import duty
(ii) Excise duty
(iii) VAT on importation, and/or
(iv) Any other duties, please specify below;
...............................................................................................................................
...............................................................................................................................
...............................................................................................................................
6. Have you faced any problem on paying duties? Yes = 1
No = 2
Please, in question no.7, circle the appropriate answer
7. If Yes, which problems have you faced?
(i) Some other importers or clearing agents enjoy tax exemption.
(ii) Delaying the preparation of released document.
(iii) Up-lift the value of the goods to be taxed, and/or
(iv) Any other problem, please specify below;
...............................................................................................................................
...............................................................................................................................
...............................................................................................................................
8. Is the tax administration procedure to collect duties on import goods
functioning well/not complicated? Yes = 1
No = 2

82
Please, in question no.9, circle the appropriate answer
9. If No, what is the problem(s):
(i) Long process and too bureaucracy to collect duties.
(ii) Dishonest of tax officer(s).
(iii) Delaying to release cargo from the port, and/or
(iv) Any other problem(s), please specify below;
..............................................................................................................................
..............................................................................................................................
...............................................................................................................................
10. Are the tariffs used to charge on importation of goods are high or low?
High = 1
Low = 2
11. If High, do you think it is reasonable to reduce? Yes = 1
No = 2
Please, in question no.12, circle the appropriate answer
12. If Yes, what is the reason(s) to reduce it:
(i) To increase importation of goods.
(ii) Increase revenue collected from importation.
(iii) Increase business activities which cause increase government revenue,
and/or
(iv) Any other reason(s), please specify below
...............................................................................................................................
...............................................................................................................................
...............................................................................................................................

83
13. If Low, do you think is better to increase? Yes = 1
No = 2
Please, in question no.14, circle the appropriate answer
14. If Yes, what is the reason(s) to increase it:
(i) Increase revenue collected from importation of goods.
(ii) Reduce the importation of obsolete/out of standard goods.
(iii) Reduce the overloads of cargo from the custom, and/or
(iv) Any other reason(s), please specify below
...............................................................................................................................
...............................................................................................................................
...............................................................................................................................
15. Does the importation of goods are increased or decreased? Increased = 1
Decreased = 2
Please, in question no.16 and 17, circle the appropriate answer
16. If increased, what is the reason(s):
(i) Tax procedure and administration is working efficiently and tax officers
are honest.
(ii) No delaying of cargo released from customs.
(iii) No bureaucracy and too long procedure for clearing cargo and/or
(iv) Any other reason(s), please specify below
...............................................................................................................................
...............................................................................................................................
...............................................................................................................................

84
17. If decreased, what is the reason(s):
(i) Poor facilities for clearing goods from customs.
(ii) Too long procedure and bureaucracy
(iii) Decrease our value currency (increase inflation rate), and/or
(iv) Any other reason(s), please specify below;
...............................................................................................................................
...............................................................................................................................
...............................................................................................................................
Thanks for your cooperation

85
APPENDIX 2: QUESTIONARE TO TANZANIA REVENUE AUTHORITY
AND ZANZIBAR REVENUE BOARD STAFFS
Introduction
This research is part of the requirements for my Masters degree of Business
Administration in Finance of the Open University of Tanzania. Your Cooperation in
answering questions below will be highly appreciated. I assure you that your views
and opinions shall be treated with strict confidentially.
Instruction
Please fill the number in the box beside the appropriate answer.
1. Are you working at Tanzania Revenue Authority or Zanzibar Revenue Board?
TRA = 1
ZRB = 2
2. How long have you been working in TRA or ZRB?
(i) Less than 1 – 4 years = 1
(ii) 5 – 8 years = 2
(iii) 9 – 12 years = 3
(iv) 13 years and above = 4
3. Are you working at collection department? Yes = 1
No = 2
4. Which department are you working? .................................................................
5. Do you face any problem on collecting duties on importation? Yes = 1
No = 2

86
Please in question no.6 and 8, circle the appropriate answer(s)
6. If Yes, which problem(s)
(i) Some taxpayers are tax exempted while others no.
(ii) False declaration on the value of imported goods.
(iii) Different tariffs on imported goods due to different Regional Integration
(such as EAC, COMESA) and/or
(iv) Any other problem(s), please specify below;
...............................................................................................................................
...............................................................................................................................
...............................................................................................................................
7. Is the tariff revenue collection declining? Yes = 1
No = 2
8. If Yes, which reason(s):
(i) Increasing tax exemption.
(ii) Reduction of import tariffs on importation.
(iii) Decline our value of Tshs. against foreign currency ($) (increase in
inflation rate), and/or
(iv) Any other reason(s), please specify below;
...............................................................................................................................
...............................................................................................................................
...............................................................................................................................

87
9. Is the tax administration procedure to collect duties on import goods
functioning well/ not complicated? Yes = 1
No = 2
10. If No, which problem(s):
(i) The new system of ASCUDA++ is not well familiar to some staffs.
(ii) Some other goods are not passes through the system (ASCUDA++).
(iii) Self assessment leads the importer and/or agent to under declare the
value of the goods imported, and/or
(iv) Any other problem(s), please specify below;
......................................................................................................................
......................................................................................................................
......................................................................................................................
11. Are the tariffs used to charge on importation are high or low?
High = 1
Low = 2
12. If High, do you think is reasonable to reduce? Yes = 1
No = 2
Please in question no.13, 14, 16, 18 and 19, circle the appropriate answer(s)
13. If Yes, which reason(s) to reduce it:
(i) Increase importation of goods.
(ii) Increase business activities.

88
(iii) Increase domestic revenue, and/or
(iv) Any other reason(s), please specify below;
...............................................................................................................................
...............................................................................................................................
...............................................................................................................................
14. If No, which reason(s)
(i) Reduce import tariffs revenue collection.
(ii) Reduce government total revenue collection.
(iii) Increase the importation of obsolete goods, and/or
(iv) Any other reason(s), please specify below;
...............................................................................................................................
...............................................................................................................................
...............................................................................................................................
15. If Low, do you think is better to increase? Yes = 1
No = 2
16. If Yes, which reason(s) to increase it:
(i) Increase import tariffs revenue.
(ii) Reduce the importation of obsolete goods
(iii) Increase government total collection, and/or
(iv) Any other reason(s), please specify below;
...............................................................................................................................
...............................................................................................................................
...............................................................................................................................

89
17. Does the importation of goods are increased or decreased?
Increase = 1
Decrease = 2
18. If increased, which reason(s):
(i) High integrity of tax officers
(ii) Improve clearance customs facilities.
(iii) Introduction of new system of clearance of imported goods (ASCUDA
++), and/or
(iv) Any other reason(s), please specify below;
...............................................................................................................................
...............................................................................................................................
...............................................................................................................................
19. If decreased, which reason(s):
(i) Decline our value currency against foreign currency ($)(increase
inflation rate).
(ii) Poor facility for clearance of imported goods from customs.
(iii) Too long bureaucracy and dishonest of some staffs, and/or
(iv) Any other reason(s), please specify below;
...............................................................................................................................
...............................................................................................................................
...............................................................................................................................
20. Any other comment(s) concerning on the revenue collection on importation of
goods.

90
……………………………………………………………………………………
……………………………………………………………………………………
……………………………………………………………………………………
……………………………………………………………………………………
……………………………………………………………………………………
……………………………………………………………………………………
……………………………………………………………………………………
……………………………………………………………………………………
……………………………………………………………………………………
Thanks for your cooperation
Related Documents


