1 Stephen Letwin EVP, Gas Transmission and International Enbridge Inc. Challenges and Opportunities for Natural Gas Delivery Insight Information – Natural Gas Forum April 26, 2010 Calgary, AB

Welcome message from author
This document is posted to help you gain knowledge. Please leave a comment to let me know what you think about it! Share it to your friends and learn new things together.
Transcript

1
Stephen LetwinEVP, Gas Transmission and International
Enbridge Inc.
Challenges and Opportunities for
Natural Gas Delivery
Insight Information –
Natural Gas Forum
April 26, 2010
Calgary, AB
2
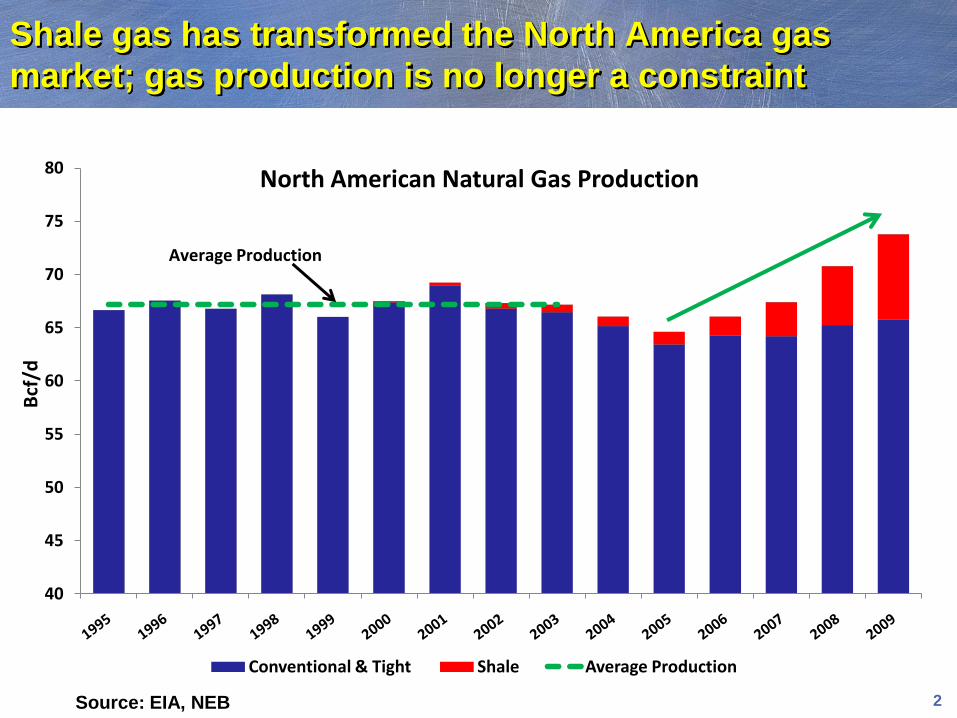
Shale gas has transformed the North America gas
market; gas production is no longer a constraint
40
45
50
55
60
65
70
75
80
Bcf
/d
North American Natural Gas Production
Conventional & Tight Shale Average Production
Average Production
Source: EIA, NEB

3
Unconventional gas provides opportunities to
diversify supply and transportation routes
Supply reductions shown in red
Mackenzie Delta
2015 – 0
2020 – 0
2025 – 0
Alaska
2015 – 0
2020 – 0
2025 – 0
WCSB
2015 – (1.4)
2020 – (0.4)
2025 – 0.6
Appalachia
2015 – 1.5
2020 – 4.1
2025 – 5.8MidCon
2015 – 3.4
2020 – 4.2
2025 – 4.6
West Coast
2015 – (0.2)
2020 – (0.3)
2025 – (0.4)
Rockies
2015 – 1.2
2020 – 2.4
2025 – 2.9
San Juan
2015 – (0.8)
2020 – (1.1)
2025 – (1.5)
North America
2015 – 2.2
2020 – 8.4
2025 – 12.6
LNG
2015 – 0.7
2020 – (0.5)
2025– (0.5)
Cumulative Change from 2008 (Bcf/d)
Eastern Canada
2015 – 0
2020 – (0.1)
2025 – (0.2)
Gulf Coast
2015 – 2.8
2020 – 3.9
2025 – 4.3Offshore
2015 – (2.4)
2020 – (2.9)
2025 – (3.1)
Permian
2015 – (1.9)
2020 – (1.4)
2025 – (0.5)
Source: Enbridge
4
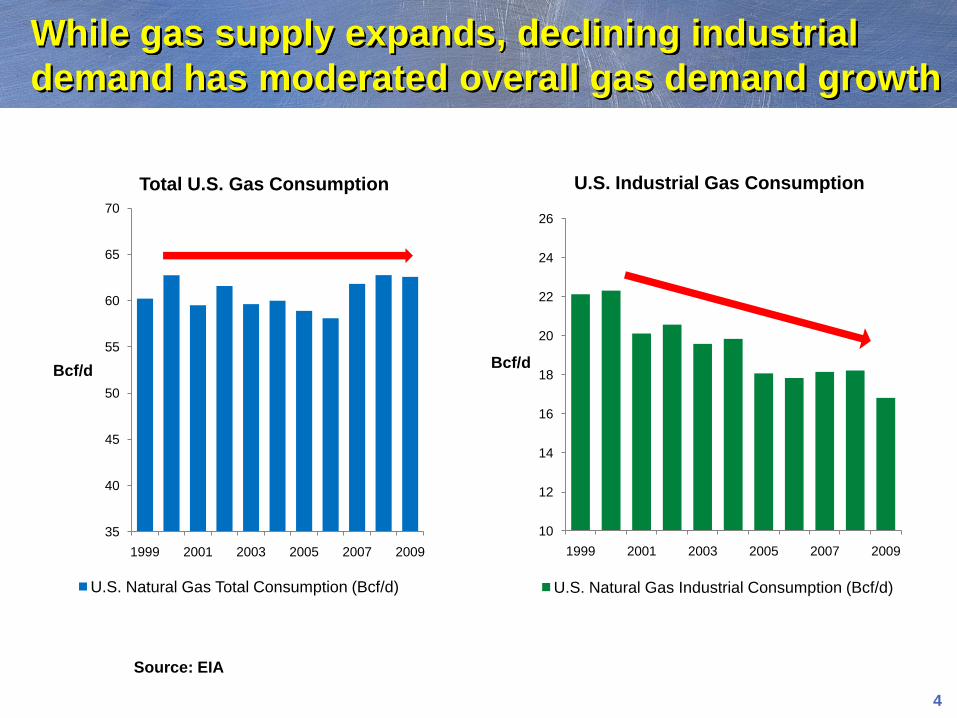
While gas supply expands, declining industrial
demand has moderated overall gas demand growth
35
40
45
50
55
60
65
70
1999 2001 2003 2005 2007 2009
Bcf/d
Total U.S. Gas Consumption
U.S. Natural Gas Total Consumption (Bcf/d)
10
12
14
16
18
20
22
24
26
1999 2001 2003 2005 2007 2009
Bcf/d
U.S. Industrial Gas Consumption
U.S. Natural Gas Industrial Consumption (Bcf/d)
Source: EIA

5
Improved efficiencies and conservation are
also moderating gas demand growth
300
320
340
360
380
400
420
440
460
480
500
0.6
0.8
1.0
1.2
1.4
1.6
1.8
2.0
1999 2000 2001 2002 2003 2004 2005 2006 2007 2008 2009
BCF
Mil
lio
ns o
f C
us
tom
ers
Enbridge Gas Distribution - Comparison of Customer Base with Gas Demand
Average Customer Base Demand Normalized to 2009 DD Bcf
6
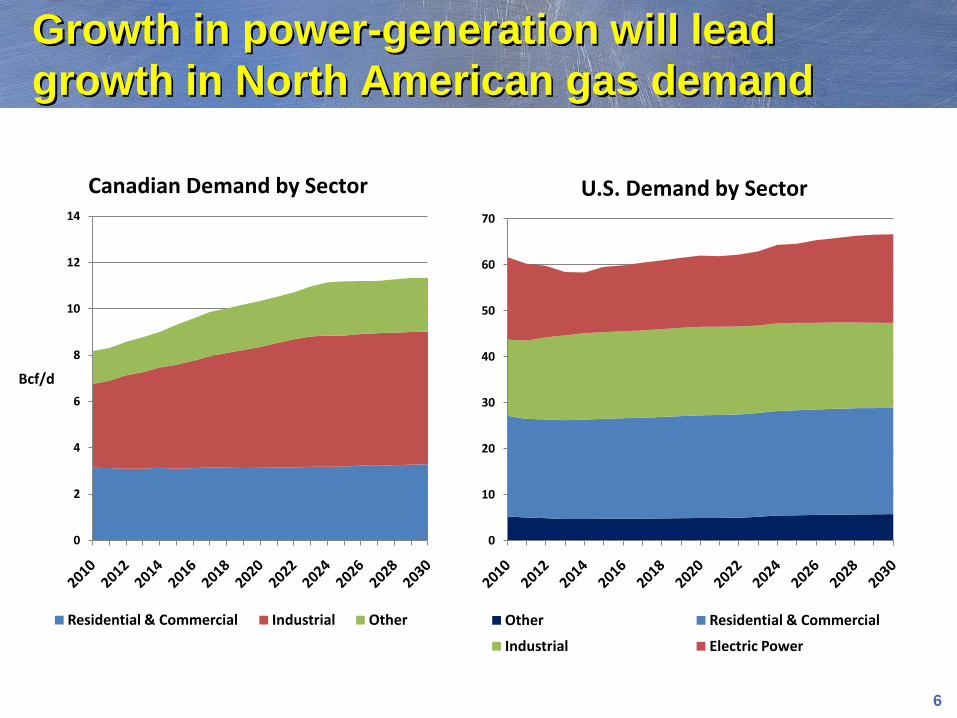
Growth in power-generation will lead
growth in North American gas demand
0
2
4
6
8
10
12
14
Bcf/d
Canadian Demand by Sector
Residential & Commercial Industrial Other
0
10
20
30
40
50
60
70
U.S. Demand by Sector
Other Residential & Commercial
Industrial Electric Power
7
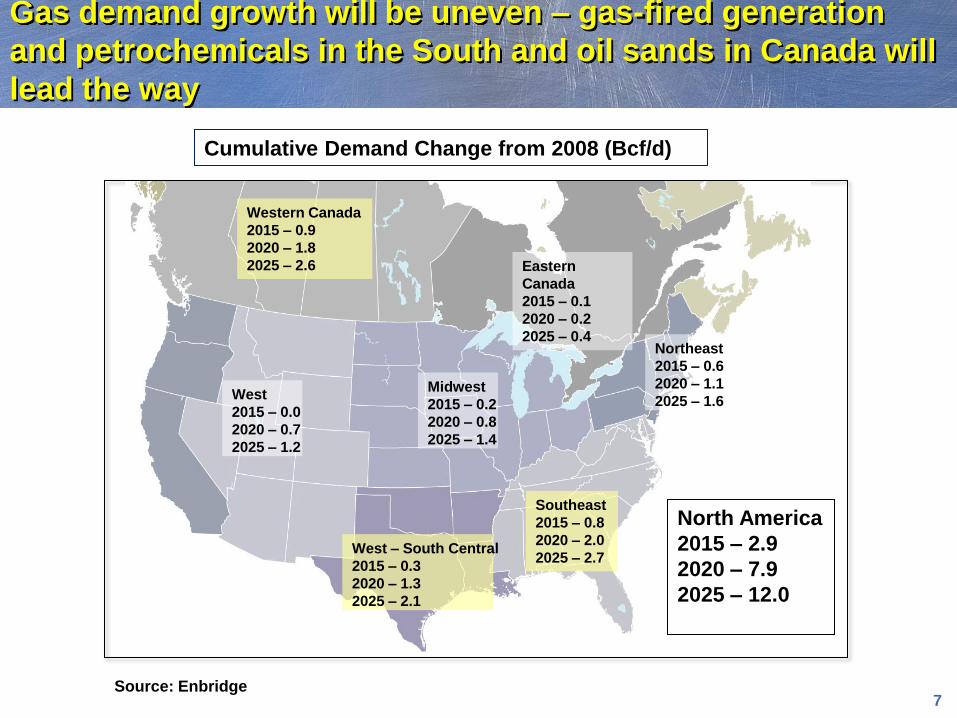
Gas demand growth will be uneven – gas-fired generation
and petrochemicals in the South and oil sands in Canada will
lead the way
Western Canada
2015 – 0.9
2020 – 1.8
2025 – 2.6 Eastern
Canada
2015 – 0.1
2020 – 0.2
2025 – 0.4Northeast
2015 – 0.6
2020 – 1.1
2025 – 1.6West
2015 – 0.0
2020 – 0.7
2025 – 1.2
Midwest
2015 – 0.2
2020 – 0.8
2025 – 1.4
Southeast
2015 – 0.8
2020 – 2.0
2025 – 2.7West – South Central
2015 – 0.3
2020 – 1.3
2025 – 2.1
North America
2015 – 2.9
2020 – 7.9
2025 – 12.0
Cumulative Demand Change from 2008 (Bcf/d)
Source: Enbridge
8
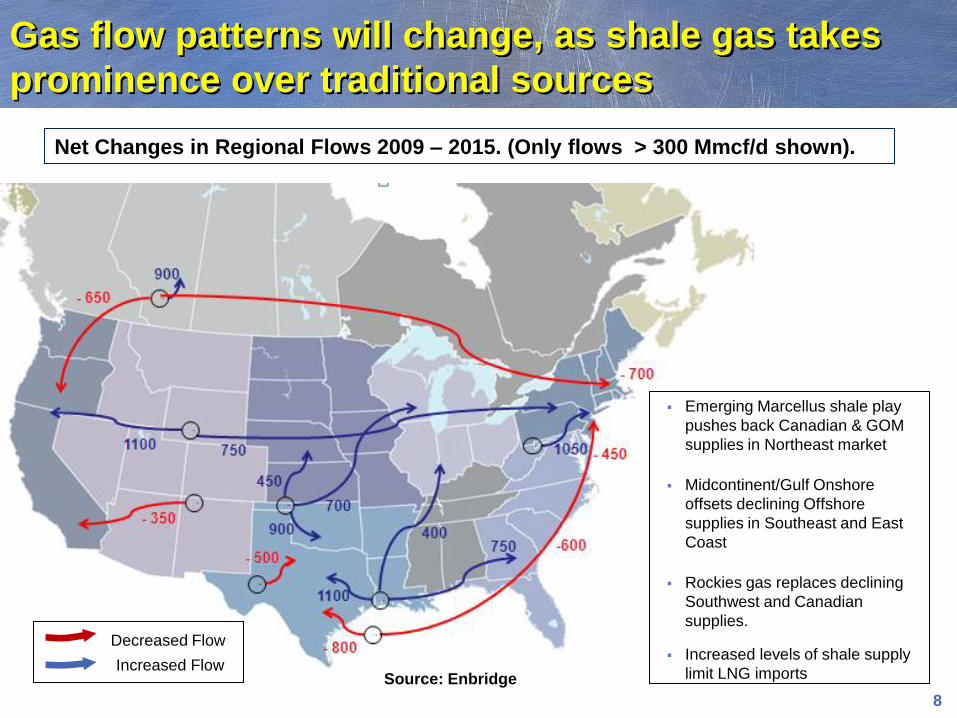
Gas flow patterns will change, as shale gas takes
prominence over traditional sources
Net Changes in Regional Flows 2009 – 2015. (Only flows > 300 Mmcf/d shown).
Source: Enbridge
Emerging Marcellus shale play
pushes back Canadian & GOM
supplies in Northeast market
Midcontinent/Gulf Onshore
offsets declining Offshore
supplies in Southeast and East
Coast
Rockies gas replaces declining
Southwest and Canadian
supplies.
Increased levels of shale supply
limit LNG importsIncreased Flow
Decreased Flow
9
The U.S. and Canada will need 29,000 to 62,000 miles of additional
pipeline and 370 to 600 Bcf of additional storage capacity.
From 2009 to 2030, US $133 to $210 billion (or US $6 to 10 billion per
year) will be needed for pipelines and related infrastructure.
Infrastructure needs are driven by:
the shift to unconventional gas areas from traditional sources, and
market growth from power generation
Insufficient natural gas infrastructures can lead to price volatility,
reduced economic growth, and reduced delivery of natural gas supply.
Significant and continuous investment in additional
infrastructure will be required as supply dynamics shift
Source: INGAA
10
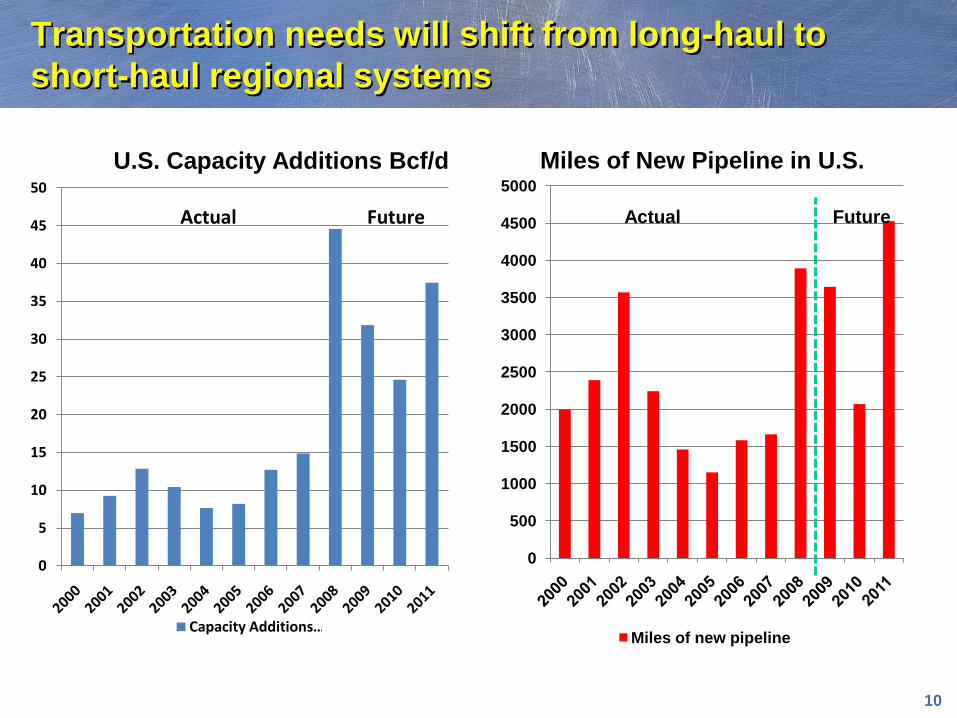
Transportation needs will shift from long-haul to
short-haul regional systems
0
5
10
15
20
25
30
35
40
45
50
Capacity Additions …
Actual Future
0
500
1000
1500
2000
2500
3000
3500
4000
4500
5000
Miles of New Pipeline in U.S.
Miles of new pipeline
Actual Future
U.S. Capacity Additions Bcf/d

11
Enbridge Gas Distribution Operates Storage Facilities
with links to the Ontario and eastern U.S. markets
~100 Bcf of capacity
10 storage pools
Pipeline Interconnects
• Union (Dawn)
• TCPL
• Link
• Vector
12
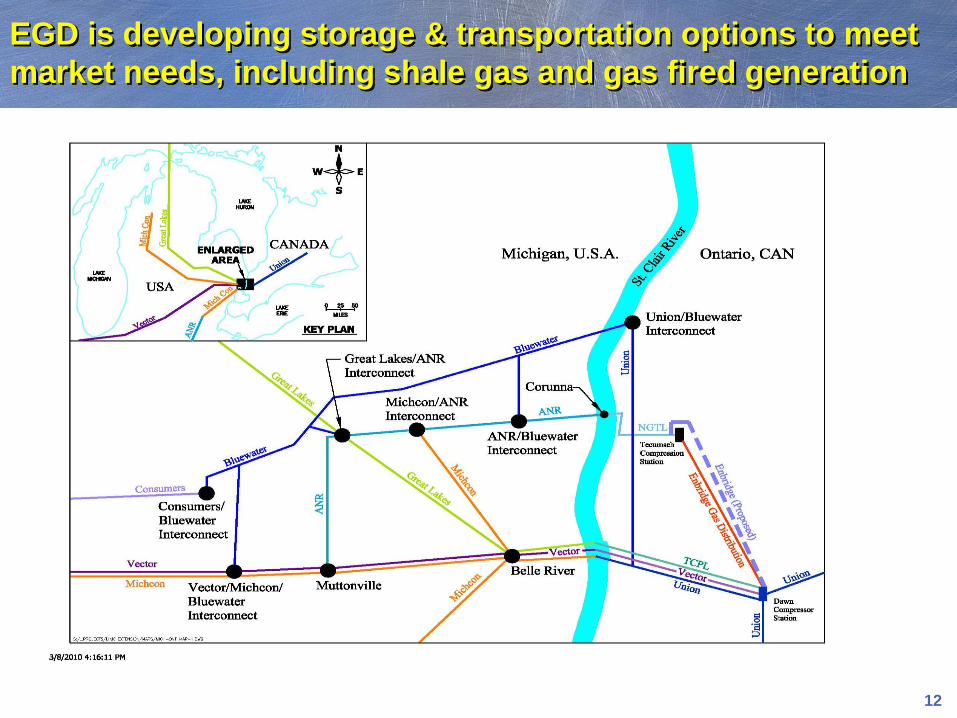
EGD is developing storage & transportation options to meet
market needs, including shale gas and gas fired generation
13
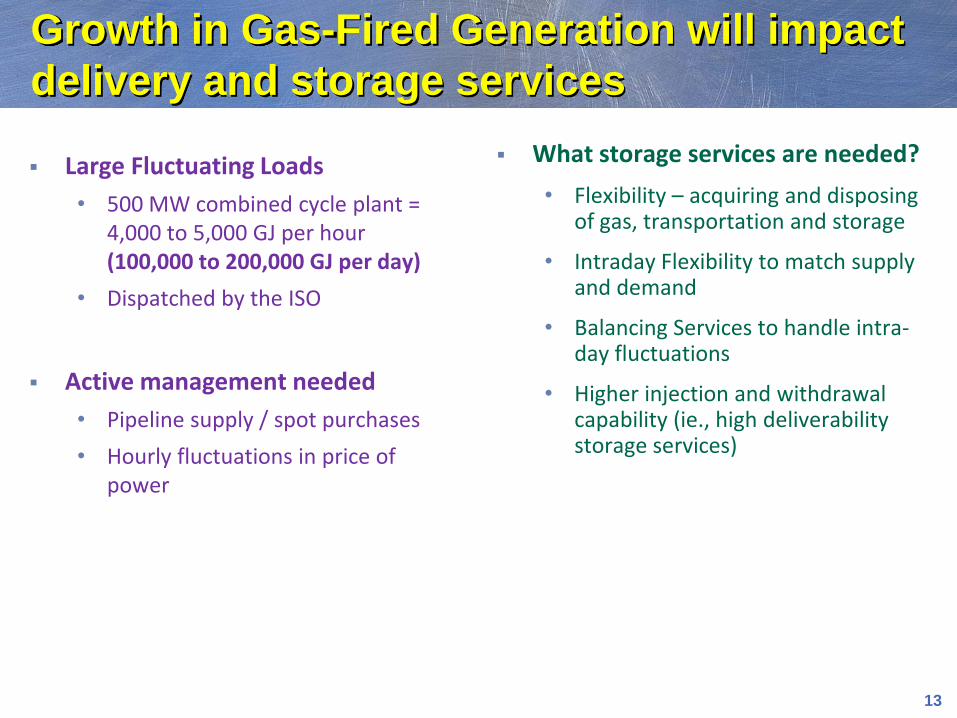
Growth in Gas-Fired Generation will impact
delivery and storage services
Large Fluctuating Loads
• 500 MW combined cycle plant = 4,000 to 5,000 GJ per hour (100,000 to 200,000 GJ per day)
• Dispatched by the ISO
Active management needed
• Pipeline supply / spot purchases
• Hourly fluctuations in price of power
What storage services are needed?
• Flexibility – acquiring and disposing of gas, transportation and storage
• Intraday Flexibility to match supply and demand
• Balancing Services to handle intra-day fluctuations
• Higher injection and withdrawal capability (ie., high deliverability storage services)
14
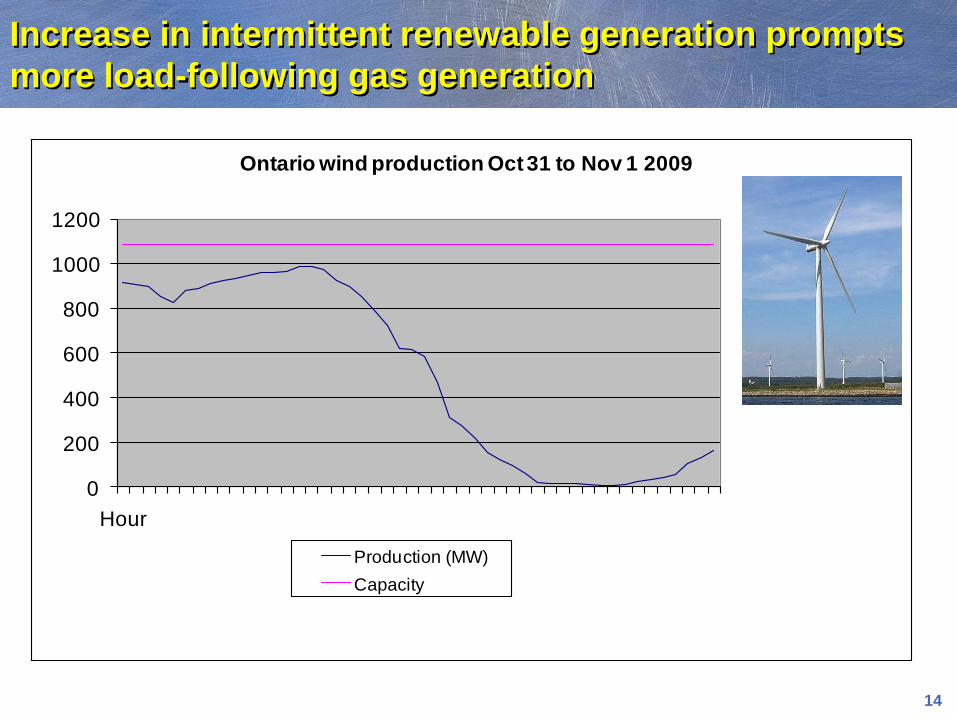
Increase in intermittent renewable generation prompts
more load-following gas generation
0
200
400
600
800
1000
1200
Hour
Ontario wind production Oct 31 to Nov 1 2009
Production (MW)
Capacity
15
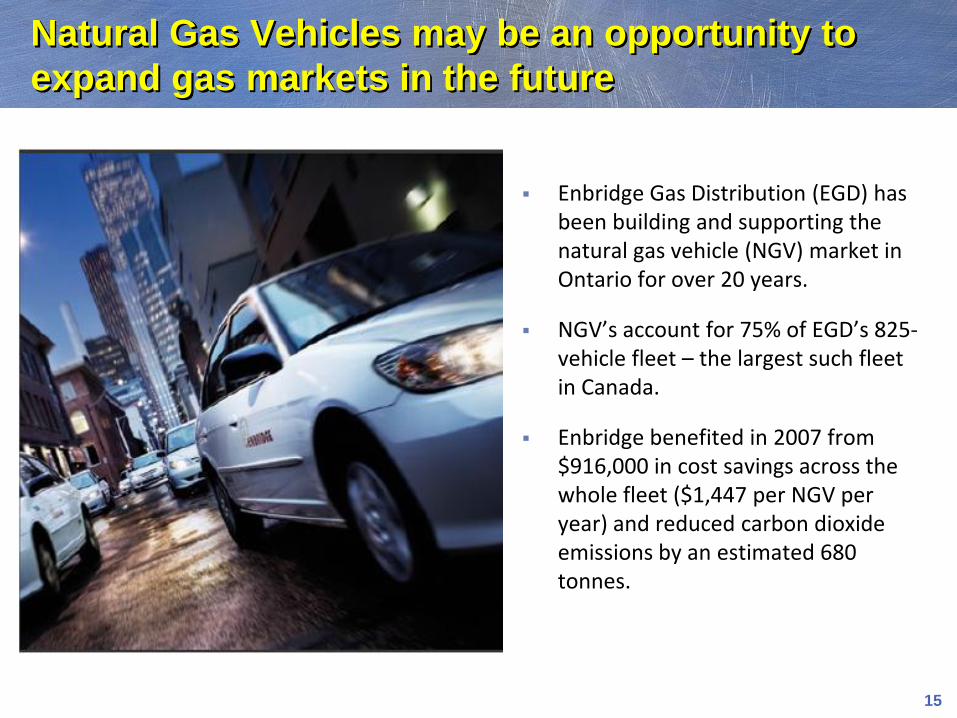
Enbridge Gas Distribution (EGD) has been building and supporting the natural gas vehicle (NGV) market in Ontario for over 20 years.
NGV’s account for 75% of EGD’s 825-vehicle fleet – the largest such fleet in Canada.
Enbridge benefited in 2007 from $916,000 in cost savings across the whole fleet ($1,447 per NGV per year) and reduced carbon dioxide emissions by an estimated 680 tonnes.
Natural Gas Vehicles may be an opportunity to
expand gas markets in the future
16
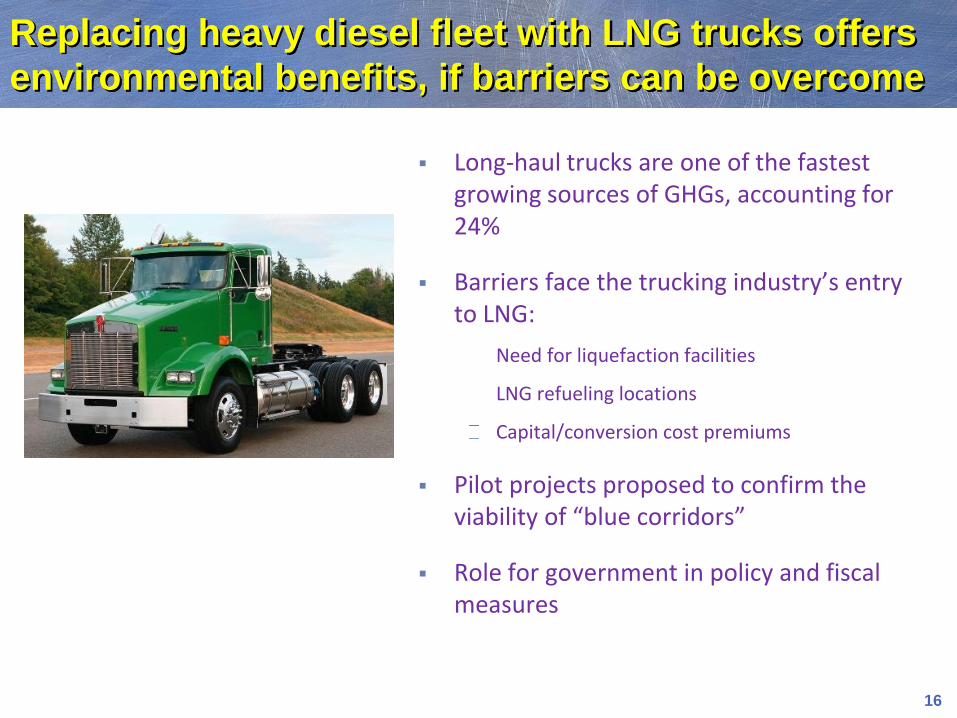
Replacing heavy diesel fleet with LNG trucks offers
environmental benefits, if barriers can be overcome
Long-haul trucks are one of the fastest growing sources of GHGs, accounting for 24%
Barriers face the trucking industry’s entry to LNG:
Need for liquefaction facilities
LNG refueling locations
Capital/conversion cost premiums
Pilot projects proposed to confirm the viability of “blue corridors”
Role for government in policy and fiscal measures
17
In conclusion, the industry simply needs
demand!
Unconventional gas is a “game-changer”Resource base is vastly expanded
Diversity in supply sources and transportation options is increased
Gas prices will be moderate
Investment in infrastructure is critical
More pipelines are required to deliver gas from unconventional sources to markets
Expansions to storage capacity
North American market is demand-constrainedPower generation will lead growth, but resource endowment can support more
Is this the time for NGVs?
Related Documents