Journal of Macromolecular Science R , Part B: Physics, 49:174–206, 2010 Copyright © Taylor & Francis Group, LLC ISSN: 0022-2348 print / 1525-609X online DOI: 10.1080/00222340903346734 Chain Degradation during Dissolution of Polymer-Fullerene Nanocomposites as a Result of Interaction of Entangled Polymer Matrix with the Filler ELENA V. CHUBAROVA AND ELENA YU. MELENEVSKAYA Institute of Macromolecular Compounds, Russian Academy of Sciences, Bolshoi, St. Petersburg, Russia Chain degradation of poly(α-methylstyrene) and polystyrene during dissolution of their nanocomposites with fullerene C 60 in solvents of different quality with respect to fullerene was studied in detail by size exclusion chromatography and UV spectroscopy. Chain ruptures have been shown to arise during swelling of composites but only for samples with entangled polymer matrix. The data obtained confirm that the hindered mobility of chains because of interaction of the entangled matrix with fullerene is the only cause of degradation. Chain rupture leads to radical depolymerization accompanied by covalent binding of fullerene with the chain fragments, which results in changing of the polymer matrix structure. Chain degradation indicates deterioration of the mechanical properties of the polymers in the presence of C 60 . The possibility of chain degradation in polymer-filler nanocomposites under deformation with the simultaneous observation of an apparent reinforcement effect because of the addition of filler in the polymer matrix is discussed. Keywords chain rupture, polymer-fullerene C 60 nanocomposites, swelling Introduction Fullerene C 60 is now frequently used in the synthesis of composite materials. The small (∼10 Å) dimension of the rigid molecule C 60 and its ability to accept up to 12 electrons [1] allows fullerene to be used for covalent bonding [2–5] with various polymers, in particular, for synthesis of star-shaped polymers with different number of polymeric arms attached to the C 60 core, including stars with the highest possible number of arms (six-armed stars) under nucleophilic attachment. [6,7] The property of fullerene to form various noncovalent compounds of the donor-acceptor type predetermines its appreciable solubility [8] in a wide class of organic solvents, which is another unique feature of this allotropic modification of carbon. In the unbound composite systems obtained by mixing polymers with fullerene (fur- ther in the text called “composites” for brevity) charge-transfer complexation between C 60 and electron-donating units of block copolymers can change, e.g., the morphology of the self-assembled structures. [9] Fullerene tendency to form aggregates [8] in different solvents, Received 24 March 2009; accepted 7 May 2009. Address correspondence to Elena V. Chubarova, Institute of Macromolecular Com- pounds, Russian Academy of Sciences, 199004 Bolshoi pr. 31, St. Petersburg, Russia. E-mail: [email protected] 174

Welcome message from author
This document is posted to help you gain knowledge. Please leave a comment to let me know what you think about it! Share it to your friends and learn new things together.
Transcript
Journal of Macromolecular Science R©, Part B: Physics, 49:174–206, 2010Copyright © Taylor & Francis Group, LLCISSN: 0022-2348 print / 1525-609X onlineDOI: 10.1080/00222340903346734
Chain Degradation during Dissolution ofPolymer-Fullerene Nanocomposites as a Result
of Interaction of Entangled Polymer Matrixwith the Filler
ELENA V. CHUBAROVA AND ELENA YU. MELENEVSKAYA
Institute of Macromolecular Compounds, Russian Academy of Sciences,Bolshoi, St. Petersburg, Russia
Chain degradation of poly(α-methylstyrene) and polystyrene during dissolution of theirnanocomposites with fullerene C60 in solvents of different quality with respect to fullerenewas studied in detail by size exclusion chromatography and UV spectroscopy. Chainruptures have been shown to arise during swelling of composites but only for sampleswith entangled polymer matrix. The data obtained confirm that the hindered mobilityof chains because of interaction of the entangled matrix with fullerene is the onlycause of degradation. Chain rupture leads to radical depolymerization accompanied bycovalent binding of fullerene with the chain fragments, which results in changing of thepolymer matrix structure. Chain degradation indicates deterioration of the mechanicalproperties of the polymers in the presence of C60. The possibility of chain degradation inpolymer-filler nanocomposites under deformation with the simultaneous observation ofan apparent reinforcement effect because of the addition of filler in the polymer matrixis discussed.
Keywords chain rupture, polymer-fullerene C60 nanocomposites, swelling
Introduction
Fullerene C60 is now frequently used in the synthesis of composite materials. The small(∼10 Å) dimension of the rigid molecule C60 and its ability to accept up to 12 electrons[1]
allows fullerene to be used for covalent bonding[2–5] with various polymers, in particular,for synthesis of star-shaped polymers with different number of polymeric arms attached tothe C60 core, including stars with the highest possible number of arms (six-armed stars)under nucleophilic attachment.[6,7] The property of fullerene to form various noncovalentcompounds of the donor-acceptor type predetermines its appreciable solubility[8] in a wideclass of organic solvents, which is another unique feature of this allotropic modification ofcarbon. In the unbound composite systems obtained by mixing polymers with fullerene (fur-ther in the text called “composites” for brevity) charge-transfer complexation between C60
and electron-donating units of block copolymers can change, e.g., the morphology of theself-assembled structures.[9] Fullerene tendency to form aggregates[8] in different solvents,
Received 24 March 2009; accepted 7 May 2009.Address correspondence to Elena V. Chubarova, Institute of Macromolecular Com-
pounds, Russian Academy of Sciences, 199004 Bolshoi pr. 31, St. Petersburg, Russia. E-mail:[email protected]
174
Chain degradation during dissolution of polymer-fullerene nanocomposites 175
in both unbound and bound polymer-fullerene systems, is currently used for develop-ment of composite materials with the intriguing morphology of self-assembled structures.Such fullerene-based materials are promising for practical implementation because of theirunique electronic, magnetic, and optical properties.[2,3,5] Furthermore, improvement of thethermal, mechanical, and elastic properties of fullerene-containing composites has beenreported.[10]
The formation of polymer-fullerene complexes during composite preparation may be acontributory factor for retention of C60 in solutions during composite dissolution in solventsof poor quality for C60. The idea, originally proposed by Yamagoshi and colleagues,[11]
assumed the possibility of solubilization of fullerene that is practically insoluble in water[8],because of formation of strong complexes with a water-soluble polymer. The idea attractedattention, since it offered challenging resources for application of biologically active C60
in medicine.[12–14] We studied[15] the feasibility of fullerene transport owing to the polymerfor the polystyrene-C60 (PS-C60) composite solutions in tetrahydrofurane (THF) within awide range of molecular weights of PS (M = 104–2·106 g/mol) and for different contentsof C60. This is the most simple system for study, which may be considered as a model of awater-soluble system, because C60 forms a strong molecular complex with PS, while THFis a good solvent for PS and poor solvent for C60.
The main, and very disappointing, result of our study of composite solutions was thedegradation of PS chains in the composite samples regardless of the polymer molecularweight (M) and C60 content. Unequivocal evidence of chain degradation were extremelysmall fragments with evaluated hydrodynamic radii Rh < 10 Å, recorded by size exclu-sion chromatography (SEC), and appearance of PS-C60 covalent bonds recorded by UVspectroscopy. We suggested that chain degradation was caused by formation of a tense net-work cross-linked through molecular complexes PS-C60. The complexes restrained chainmobility during dissolution in a solvent poor for C60, which facilitated chain rupture.
Chain degradation was also recorded later by a translation diffusion technique[16] instudying PS-C60 composite solutions with a molecular mass M ∼ 240 ×·103 g/mol atvarious content of C60 in such a good solvent for both PS and C60 as toluene. A surprisinglylarge amount of extremely small fragments in solutions of these composites allowed usto suppose that chain degradation was accompanied by a depolymerization reaction. Thestudy of influence of the solvent type, polymer structure, and M of the polymer on chaindegradation carried out by SEC and UV spectroscopy for polymer-C60 composite solutionsconfirmed that it was just during dissolution of composite samples that C-C bond scission ofchain backbone took place and allowed us to lay out the origin and the mechanism of chainrupture in more detail.[17] In the current work we present the total data set obtained, alongwith its detailed analysis. The major part of the work is devoted to comparative examinationof solutions of poly(α-methylstyrene) (PαMS) and polystyrene and of their composites.These polymers differ in that PαMS has methyl groups in place of tertiary hydrogen atomsin PS. The result of this structural distinction is the dramatic difference in the degree ofdepolymerization zip length of radicals formed after the chains’ rupture of these polymers,which must influence the degree of degradation of their chains in composite samples. Chaindegradation study for PαMS-C60 composite solutions was carried out for samples withentangled (M > Mc) and unentangled (M < Mc) polymer matrices, where Mc = 28000 g/molis the critical entanglement molecular weight of PαMS.[18] The influence of the solvent onchain degradation was studied with solvents of different thermodynamic quality with respectto C60. To establish the mechanism of chain degradation under composite dissolution, thedata obtained were compared with the literature data on thermal degradation of similarsystems.
176 E. V. Chubarova and E. Yu. Melenevskaya
In addition, we studied fullerene solutions and mixed fullerene with PS solutionsin various solvents by UV spectroscopy.[19] Since the important conclusions concerningdegradation of polymer matrix and its structural changes are based on the UV-spectroscopicdata, we consider it necessary to discuss the correlations between the changes in the UVspectrum of C60 and the character of C60-solvent interaction as well as the type of C60-polymer bonding in more detail than in our previous works.[15,19]
Essentially, the polymer-fullerene system is not distinguished from most othernanocomposites, fullerene being just a rigid filler interacting with polymer by van derWaals forces. Chain degradation during dissolution of polymer-fullerene composites pointsto deterioration of the mechanical properties of the polymer in the presence of the filler.This fact directly contradicts the conclusions of the authors of numerous publications aboutthe improvement of the mechanical properties of nanocomposites with different fillers ascompared with those of matrix polymers. The analysis of recent publications has shown thatin most of them, transient network formation and increase of polymer-filler interaction areconsidered as dominant causes of nanocomposite reinforcement, while the data obtainedin our experiments show that polymer-fullerene interaction is, on the contrary, the origin ofchain degradation during dissolution of nanocomposites with an entangled polymer matrix.This contradiction prompted us to analyze the possibility of a combination of apparentreinforcement effect measured by mechanical tests of composites with simultaneous chaindegradation. In the last section of the article we offer our reasoning in support of suchpossibility and examine the results of some investigations, which can well be explained bychain degradation.
Experimental
Materials and Preparation of Samples
The solutions of fullerene C60 (purity 99.5 wt%; Fullerene Technologies, Russia) wereobtained by dissolution of crystalline C60 in various solvents under intensive mixing withsimultaneous ultrasonication. Mixed solutions PS(2M)+C60 and PS(1M)+C60 in varioussolvents (benzene, p-xylene, chloroform) with a fixed number of n ∼= 100 PS monomer unitsper C60-molecule were prepared by mixing the individual polymer and C60 solutions. ThePS(2M) sample is a PS standard with a peak molecular weight of Mp = 1.987·× 106 g/moland Mw/Mn = 1.14. The PS(1M) sample with Mw = 1.03·× 106 g/mol and Mw/Mn = 1.4was obtained by anionic polymerization. The star-shaped fullerene-containing polystyreneswere synthesized in our laboratory by nucleophylic attachment of living polystyryllithiumchains to fullerene double bonds:[20] sample S-2A was a two-armed “star” with Marm =5000 g/mol (n = 100); sample S-6A was a six-armed “star” with Marm = 5000 g/mol (n =300). All star-shaped samples had intensive yellow color.
The samples of PS and PαMS synthesized by anionic polymerization and characterizedby SEC in our laboratory (Table 1) were used for preparation of composites. The compositeswere obtained by mixing (using a magnetic stirrer) benzene solutions of C60 and selectedpolymers with subsequent lyophilization. The lyophilized samples with M > Mc had acotton-like structure and low, intense violet color. The composite film PαMS-2-C60 obtainedon a glass substrate by slow evaporation of solvent from mixed benzene solution had a moreintense violet color as compared with the lyophilized samples. In all the mixed solutionsused for preparing composites, the initial concentration of the polymer was below thecritical entanglement concentration (cc). All composites were prepared at n ∼= 100 except
Chain degradation during dissolution of polymer-fullerene nanocomposites 177
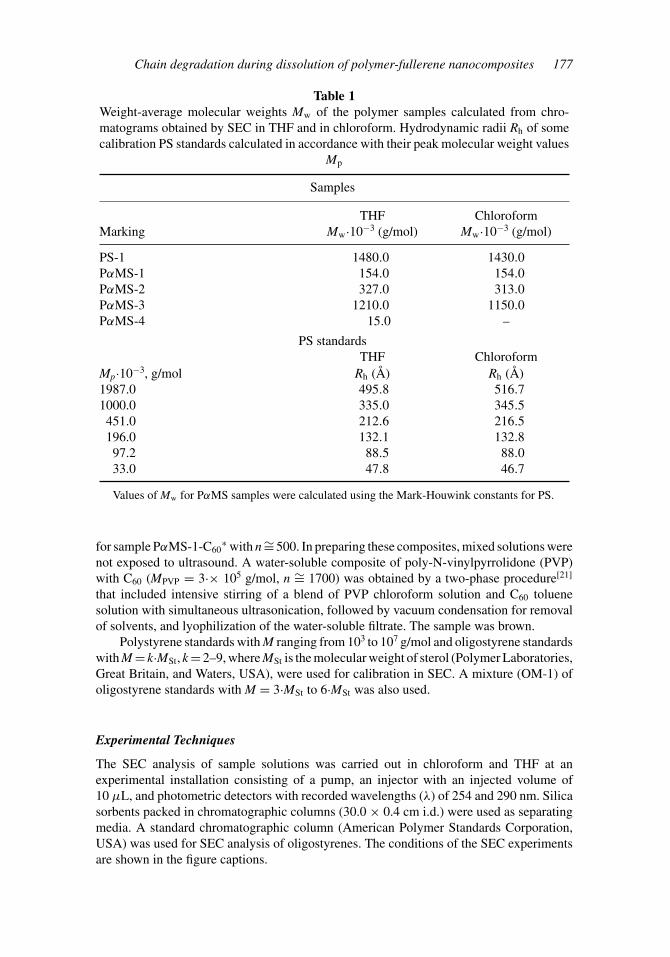
Table 1Weight-average molecular weights Mw of the polymer samples calculated from chro-matograms obtained by SEC in THF and in chloroform. Hydrodynamic radii Rh of somecalibration PS standards calculated in accordance with their peak molecular weight values
Mp
Samples
THF ChloroformMarking Mw·10−3 (g/mol) Mw·10−3 (g/mol)
PS-1 1480.0 1430.0PαMS-1 154.0 154.0PαMS-2 327.0 313.0PαMS-3 1210.0 1150.0PαMS-4 15.0 –
PS standardsTHF Chloroform
Mp·10−3, g/mol Rh (Å) Rh (Å)1987.0 495.8 516.71000.0 335.0 345.5
451.0 212.6 216.5196.0 132.1 132.897.2 88.5 88.033.0 47.8 46.7
Values of Mw for PαMS samples were calculated using the Mark-Houwink constants for PS.
for sample PαMS-1-C60∗ with n ∼= 500. In preparing these composites, mixed solutions were
not exposed to ultrasound. A water-soluble composite of poly-N-vinylpyrrolidone (PVP)with C60 (MPVP = 3·× 105 g/mol, n ∼= 1700) was obtained by a two-phase procedure[21]
that included intensive stirring of a blend of PVP chloroform solution and C60 toluenesolution with simultaneous ultrasonication, followed by vacuum condensation for removalof solvents, and lyophilization of the water-soluble filtrate. The sample was brown.
Polystyrene standards with M ranging from 103 to 107 g/mol and oligostyrene standardswith M = k·MSt, k = 2–9, where MSt is the molecular weight of sterol (Polymer Laboratories,Great Britain, and Waters, USA), were used for calibration in SEC. A mixture (OM-1) ofoligostyrene standards with M = 3·MSt to 6·MSt was also used.
Experimental Techniques
The SEC analysis of sample solutions was carried out in chloroform and THF at anexperimental installation consisting of a pump, an injector with an injected volume of10 µL, and photometric detectors with recorded wavelengths (λ) of 254 and 290 nm. Silicasorbents packed in chromatographic columns (30.0 × 0.4 cm i.d.) were used as separatingmedia. A standard chromatographic column (American Polymer Standards Corporation,USA) was used for SEC analysis of oligostyrenes. The conditions of the SEC experimentsare shown in the figure captions.
178 E. V. Chubarova and E. Yu. Melenevskaya
The UV spectra of C60 solutions, mixed solutions PS+C60, and composite solutionswere recorded using a UV VIS SF-2000 (OKB SepKtr, Russia) spectrophotometer with a2-mm thick quartz cuvette.
All tests were carried out only with as-prepared solutions.
Experimental Data Processing
The elution curve (chromatogram) of a sample solution obtained using SEC describesthe weight distribution (non-normalized) of the sample species according to their elu-tion volumes Ve. SEC is the method of separation of macromolecules according to theirsizes, which is supported by the existence of a so-called universal calibration curve. It hasbeen experimentally confirmed[22] that irrespective of the macromolecular architecture, apolymer fraction having the given hydrodynamic volume, [η]M, is eluted with fixed Ve,once the SEC system with columns is specified. Recently, it has been shown[23] that useof the values of hydrodynamic radii, Rh, as the macromolecular sizes provides the bestuniversality of the calibration curve. Hence, calibration dependence Rh = f (Ve) exper-imentally ascertained for a given chromatographic system using standards with knownvalues of Rh, first, is universal and, second, allows a chromatogram to be converted intothe weight differential distribution, dW(Rh)/dRh, of hydrodynamic radii of sample species.The algorithm of chromatogram transformation into dW(Rh)/dRh is analogous to that ofthe common chromatogram transformation into weight differential distribution of molec-ular weights, dW(M)/dM (the so-called molecular weight distribution, MWD), using thecalibration dependence M = g(Ve). Similar to MWD, the dW(Rh)/dRh distribution maybe named molecular radius distribution (MRD). The weight-average hydrodynamic radiusRhw corresponds to the mathematical expectation of MRD.
In the current work, every chromatographic system was calibrated in both THF andchloroform, using PS standards. For these solvents the effective values of Rh of PS stan-dards were calculated (Table 1) by their peak values Mp from the relation obtained bycombination[24] of the Einstein viscosity equation with Rh and the Mark-Houwink equa-tion:
Rh =(
30
π
K
NA· Ma+1
)1/3
,
where NA is the Avogadro number and K and a are the Mark-Houwink constants. Toconstruct the universal calibration curve, the log Rh values of PS standards and the corre-sponding Ve values obtained for a given chromatographic column in both solvents wereused. For every column the log Rh = A + B ·Ve dependence was built by linear approxima-tion of the data set obtained in both solvents. Standard deviation for linear approximationof calibration dependence was below 0.015 in all cases. The universal calibrations thusobtained were used to calculate MRDs and the values of Rhw of PS and PαMS samples aswell as of their composites.
The values of critical entanglement concentration (the onset of polymer sphereoverlapping)[18] for PS+C60 mixed solutions were evaluated from the relation
cc ≈ 6−1/2
π
M
NAR−3
g .
The radii of gyration, Rg, of chains were calculated from the equation proposed by P.J. Flory[24],
Chain degradation during dissolution of polymer-fullerene nanocomposites 179
Rg = 6−1/2�−1/3∞ [KMa+1]1/3,
where �∞ = 2.84·1023 is the Flory constant. The following values were obtained: for thePS(2M) sample Rg = 596 Å, cc = 1.99 mg/mL in benzene and Rg = 592 Å, cc = 2.05mg/mL in chloroform; for PS(1M) sample Rg = 414 Å, cc = 3.14 mg/mL in benzene. Inall calculations the following Mark-Houwink constants were used: K = 1.25·× 10−4, a= 0.713 (THF); K = 0.716·× 10−4, a = 0.76 (chloroform); K = 11.3·× 10−5, a = 0.73(benzene).
Under the assumption that fullerene molecules are uniformly distributed in the solutionand in view of their small size, the average distance between fullerenes was evaluated fromthe relation
l ≈(
1
N
)1/3
=(
MF
cFNA
)1/3
,
where N is the number of fullerenes in unit volume, MF the molecular weight of fullerene,and cF the fullerene concentration. The relation was used for calculation of l values inmixed (PS+C60) solutions.
Results
Spectroscopic Responses to Interactions in Fullerene-Solvent Systems
Mainly, fullerene C60 manifests acceptor properties and is regarded as a π -acceptor.[1,3,8]
Noncovalent C60 compounds of the donor-acceptor type are conditionally divided intomolecular complexes (van der Waals interactions) and complexes with partial transfer ofcharge from donor to acceptor (charge-transfer complexes).[1] Dissolution of fullerene C60
in a wide class of organic solvents proceeds because of complexation of fullerene moleculeswith solvent molecules.
The spectra of fullerene solutions in solvents transparent in the UV region show threeintensive absorption bands with maxima at λ ∼ 220, ∼260, and ∼330 nm as well as veryweak bands in the range of 400–800 nm.[25] The solvatochromism of fullerene in solutions,i.e., variation of the C60 spectrum in UV and visible regions with the solvent used[26] aswell as with the composition of the mixed solvent and with the concentration of fullerenesolution,[8] is a very interesting phenomenon from the scientific point of view. In studyingthis phenomenon, variations in the fullerene spectrum are commonly described in termsof the widths of characteristic bands, absorption values in these bands, and wavelengths(or frequencies) corresponding to their maxima. In [26] the spectral behavior of the threecharacteristic peaks at λmax ∼ 330, ∼ 400, and ∼ 620 nm in the spectra of fullerenedissolved in various solvents was analyzed to establish the possibility of formation ofcharge-transfer or hydrogen-bonding complexes between C60 and these solvents. Linearcorrelations between the frequencies corresponding to the maxima of these characteristicpeaks and dipolarity-polarizability values of the solvents were only found for fullerenesolutions in aliphatic solvents, which allowed the authors to conclude that the interactionof fullerene with these solvents was realized through the charge transfer from solventmolecules to fullerene. No correlations were found for C60 solutions in aromatic solvents.
In the present work we also compared the UV spectra of C60 solutions in some selectedsolvents. The results are presented in Fig. 1a. One can see that in the region of strongabsorption (240–400 nm) the spectra differ quite noticeably. Since the band at λmax ∼ 330
180 E. V. Chubarova and E. Yu. Melenevskaya
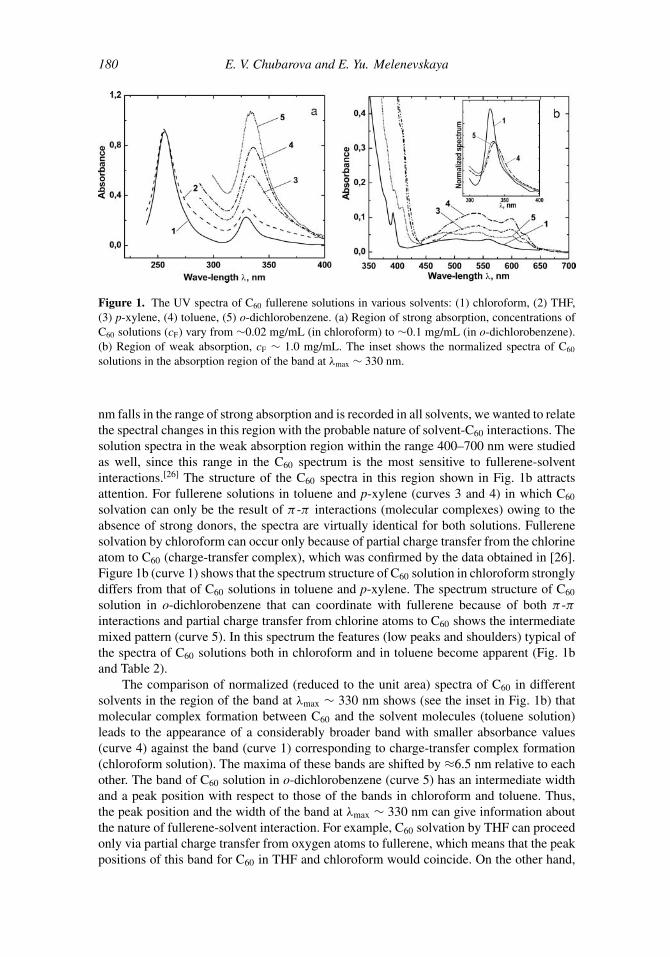
Figure 1. The UV spectra of C60 fullerene solutions in various solvents: (1) chloroform, (2) THF,(3) p-xylene, (4) toluene, (5) o-dichlorobenzene. (a) Region of strong absorption, concentrations ofC60 solutions (cF) vary from ∼0.02 mg/mL (in chloroform) to ∼0.1 mg/mL (in o-dichlorobenzene).(b) Region of weak absorption, cF ∼ 1.0 mg/mL. The inset shows the normalized spectra of C60
solutions in the absorption region of the band at λmax ∼ 330 nm.
nm falls in the range of strong absorption and is recorded in all solvents, we wanted to relatethe spectral changes in this region with the probable nature of solvent-C60 interactions. Thesolution spectra in the weak absorption region within the range 400–700 nm were studiedas well, since this range in the C60 spectrum is the most sensitive to fullerene-solventinteractions.[26] The structure of the C60 spectra in this region shown in Fig. 1b attractsattention. For fullerene solutions in toluene and p-xylene (curves 3 and 4) in which C60
solvation can only be the result of π -π interactions (molecular complexes) owing to theabsence of strong donors, the spectra are virtually identical for both solutions. Fullerenesolvation by chloroform can occur only because of partial charge transfer from the chlorineatom to C60 (charge-transfer complex), which was confirmed by the data obtained in [26].Figure 1b (curve 1) shows that the spectrum structure of C60 solution in chloroform stronglydiffers from that of C60 solutions in toluene and p-xylene. The spectrum structure of C60
solution in o-dichlorobenzene that can coordinate with fullerene because of both π -πinteractions and partial charge transfer from chlorine atoms to C60 shows the intermediatemixed pattern (curve 5). In this spectrum the features (low peaks and shoulders) typical ofthe spectra of C60 solutions both in chloroform and in toluene become apparent (Fig. 1band Table 2).
The comparison of normalized (reduced to the unit area) spectra of C60 in differentsolvents in the region of the band at λmax ∼ 330 nm shows (see the inset in Fig. 1b) thatmolecular complex formation between C60 and the solvent molecules (toluene solution)leads to the appearance of a considerably broader band with smaller absorbance values(curve 4) against the band (curve 1) corresponding to charge-transfer complex formation(chloroform solution). The maxima of these bands are shifted by ≈6.5 nm relative to eachother. The band of C60 solution in o-dichlorobenzene (curve 5) has an intermediate widthand a peak position with respect to those of the bands in chloroform and toluene. Thus,the peak position and the width of the band at λmax ∼ 330 nm can give information aboutthe nature of fullerene-solvent interaction. For example, C60 solvation by THF can proceedonly via partial charge transfer from oxygen atoms to fullerene, which means that the peakpositions of this band for C60 in THF and chloroform would coincide. On the other hand,
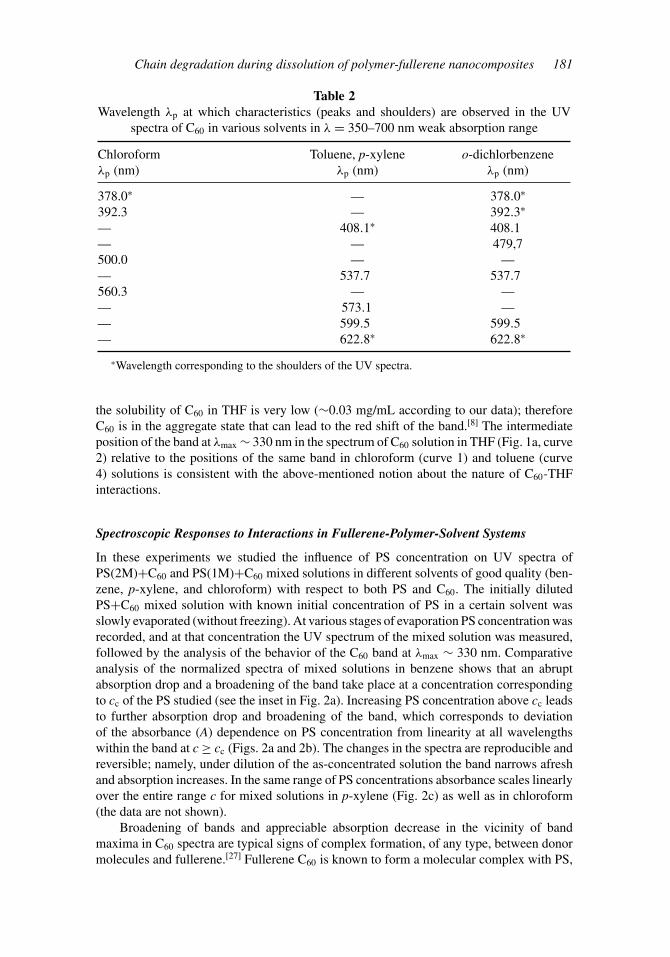
Chain degradation during dissolution of polymer-fullerene nanocomposites 181
Table 2Wavelength λp at which characteristics (peaks and shoulders) are observed in the UV
spectra of C60 in various solvents in λ = 350–700 nm weak absorption range
Chloroform Toluene, p-xylene o-dichlorbenzeneλp (nm) λp (nm) λp (nm)
378.0∗ — 378.0∗
392.3 — 392.3∗
— 408.1∗ 408.1— — 479,7500.0 — —— 537.7 537.7560.3 — —— 573.1 —— 599.5 599.5— 622.8∗ 622.8∗
∗Wavelength corresponding to the shoulders of the UV spectra.
the solubility of C60 in THF is very low (∼0.03 mg/mL according to our data); thereforeC60 is in the aggregate state that can lead to the red shift of the band.[8] The intermediateposition of the band at λmax ∼ 330 nm in the spectrum of C60 solution in THF (Fig. 1a, curve2) relative to the positions of the same band in chloroform (curve 1) and toluene (curve4) solutions is consistent with the above-mentioned notion about the nature of C60-THFinteractions.
Spectroscopic Responses to Interactions in Fullerene-Polymer-Solvent Systems
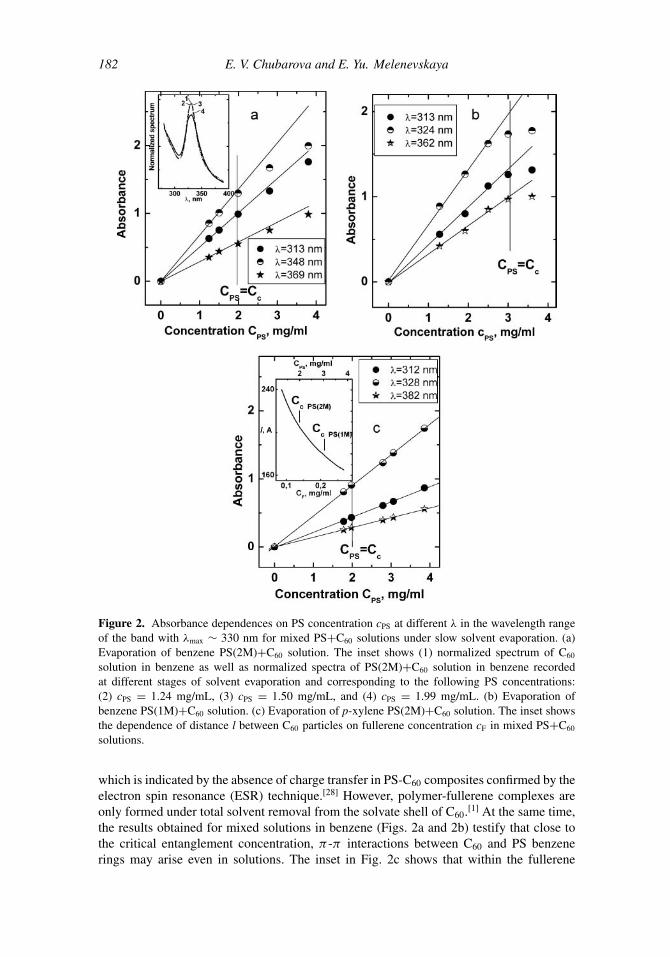
In these experiments we studied the influence of PS concentration on UV spectra ofPS(2M)+C60 and PS(1M)+C60 mixed solutions in different solvents of good quality (ben-zene, p-xylene, and chloroform) with respect to both PS and C60. The initially dilutedPS+C60 mixed solution with known initial concentration of PS in a certain solvent wasslowly evaporated (without freezing). At various stages of evaporation PS concentration wasrecorded, and at that concentration the UV spectrum of the mixed solution was measured,followed by the analysis of the behavior of the C60 band at λmax ∼ 330 nm. Comparativeanalysis of the normalized spectra of mixed solutions in benzene shows that an abruptabsorption drop and a broadening of the band take place at a concentration correspondingto cc of the PS studied (see the inset in Fig. 2a). Increasing PS concentration above cc leadsto further absorption drop and broadening of the band, which corresponds to deviationof the absorbance (A) dependence on PS concentration from linearity at all wavelengthswithin the band at c ≥ cc (Figs. 2a and 2b). The changes in the spectra are reproducible andreversible; namely, under dilution of the as-concentrated solution the band narrows afreshand absorption increases. In the same range of PS concentrations absorbance scales linearlyover the entire range c for mixed solutions in p-xylene (Fig. 2c) as well as in chloroform(the data are not shown).
Broadening of bands and appreciable absorption decrease in the vicinity of bandmaxima in C60 spectra are typical signs of complex formation, of any type, between donormolecules and fullerene.[27] Fullerene C60 is known to form a molecular complex with PS,
182 E. V. Chubarova and E. Yu. Melenevskaya
Figure 2. Absorbance dependences on PS concentration cPS at different λ in the wavelength rangeof the band with λmax ∼ 330 nm for mixed PS+C60 solutions under slow solvent evaporation. (a)Evaporation of benzene PS(2M)+C60 solution. The inset shows (1) normalized spectrum of C60
solution in benzene as well as normalized spectra of PS(2M)+C60 solution in benzene recordedat different stages of solvent evaporation and corresponding to the following PS concentrations:(2) cPS = 1.24 mg/mL, (3) cPS = 1.50 mg/mL, and (4) cPS = 1.99 mg/mL. (b) Evaporation ofbenzene PS(1M)+C60 solution. (c) Evaporation of p-xylene PS(2M)+C60 solution. The inset showsthe dependence of distance l between C60 particles on fullerene concentration cF in mixed PS+C60
solutions.
which is indicated by the absence of charge transfer in PS-C60 composites confirmed by theelectron spin resonance (ESR) technique.[28] However, polymer-fullerene complexes areonly formed under total solvent removal from the solvate shell of C60.[1] At the same time,the results obtained for mixed solutions in benzene (Figs. 2a and 2b) testify that close tothe critical entanglement concentration, π -π interactions between C60 and PS benzenerings may arise even in solutions. The inset in Fig. 2c shows that within the fullerene
Chain degradation during dissolution of polymer-fullerene nanocomposites 183
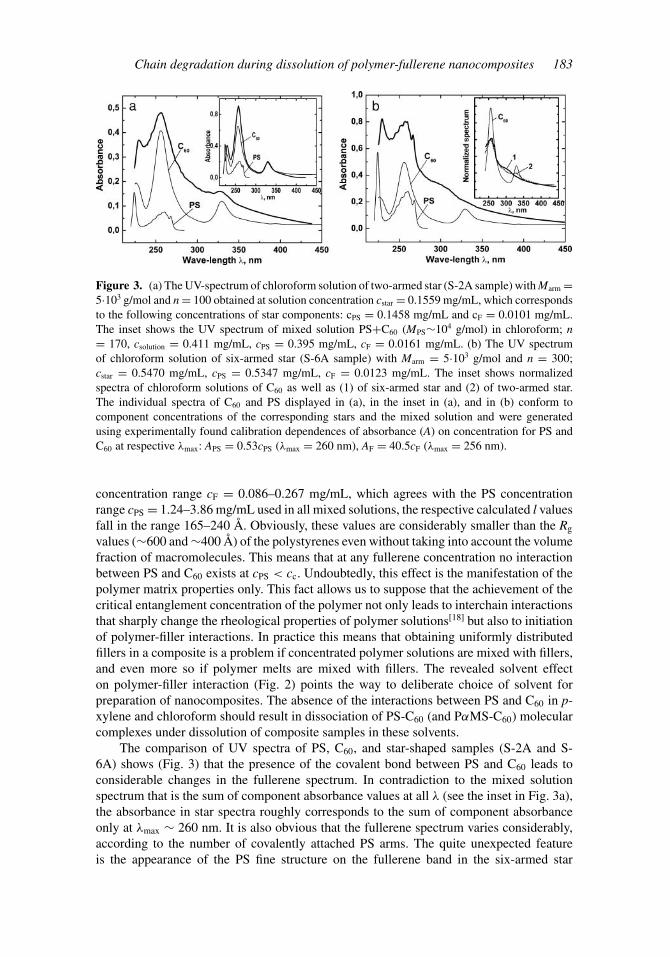
Figure 3. (a) The UV-spectrum of chloroform solution of two-armed star (S-2A sample) with Marm =5·103 g/mol and n = 100 obtained at solution concentration cstar = 0.1559 mg/mL, which correspondsto the following concentrations of star components: cPS = 0.1458 mg/mL and cF = 0.0101 mg/mL.The inset shows the UV spectrum of mixed solution PS+C60 (MPS∼104 g/mol) in chloroform; n= 170, csolution = 0.411 mg/mL, cPS = 0.395 mg/mL, cF = 0.0161 mg/mL. (b) The UV spectrumof chloroform solution of six-armed star (S-6A sample) with Marm = 5·103 g/mol and n = 300;cstar = 0.5470 mg/mL, cPS = 0.5347 mg/mL, cF = 0.0123 mg/mL. The inset shows normalizedspectra of chloroform solutions of C60 as well as (1) of six-armed star and (2) of two-armed star.The individual spectra of C60 and PS displayed in (a), in the inset in (a), and in (b) conform tocomponent concentrations of the corresponding stars and the mixed solution and were generatedusing experimentally found calibration dependences of absorbance (A) on concentration for PS andC60 at respective λmax: APS = 0.53cPS (λmax = 260 nm), AF = 40.5cF (λmax = 256 nm).
concentration range cF = 0.086–0.267 mg/mL, which agrees with the PS concentrationrange cPS = 1.24–3.86 mg/mL used in all mixed solutions, the respective calculated l valuesfall in the range 165–240 Å. Obviously, these values are considerably smaller than the Rg
values (∼600 and ∼400 Å) of the polystyrenes even without taking into account the volumefraction of macromolecules. This means that at any fullerene concentration no interactionbetween PS and C60 exists at cPS < cc. Undoubtedly, this effect is the manifestation of thepolymer matrix properties only. This fact allows us to suppose that the achievement of thecritical entanglement concentration of the polymer not only leads to interchain interactionsthat sharply change the rheological properties of polymer solutions[18] but also to initiationof polymer-filler interactions. In practice this means that obtaining uniformly distributedfillers in a composite is a problem if concentrated polymer solutions are mixed with fillers,and even more so if polymer melts are mixed with fillers. The revealed solvent effecton polymer-filler interaction (Fig. 2) points the way to deliberate choice of solvent forpreparation of nanocomposites. The absence of the interactions between PS and C60 in p-xylene and chloroform should result in dissociation of PS-C60 (and PαMS-C60) molecularcomplexes under dissolution of composite samples in these solvents.
The comparison of UV spectra of PS, C60, and star-shaped samples (S-2A and S-6A) shows (Fig. 3) that the presence of the covalent bond between PS and C60 leads toconsiderable changes in the fullerene spectrum. In contradiction to the mixed solutionspectrum that is the sum of component absorbance values at all λ (see the inset in Fig. 3a),the absorbance in star spectra roughly corresponds to the sum of component absorbanceonly at λmax ∼ 260 nm. It is also obvious that the fullerene spectrum varies considerably,according to the number of covalently attached PS arms. The quite unexpected featureis the appearance of the PS fine structure on the fullerene band in the six-armed star
184 E. V. Chubarova and E. Yu. Melenevskaya
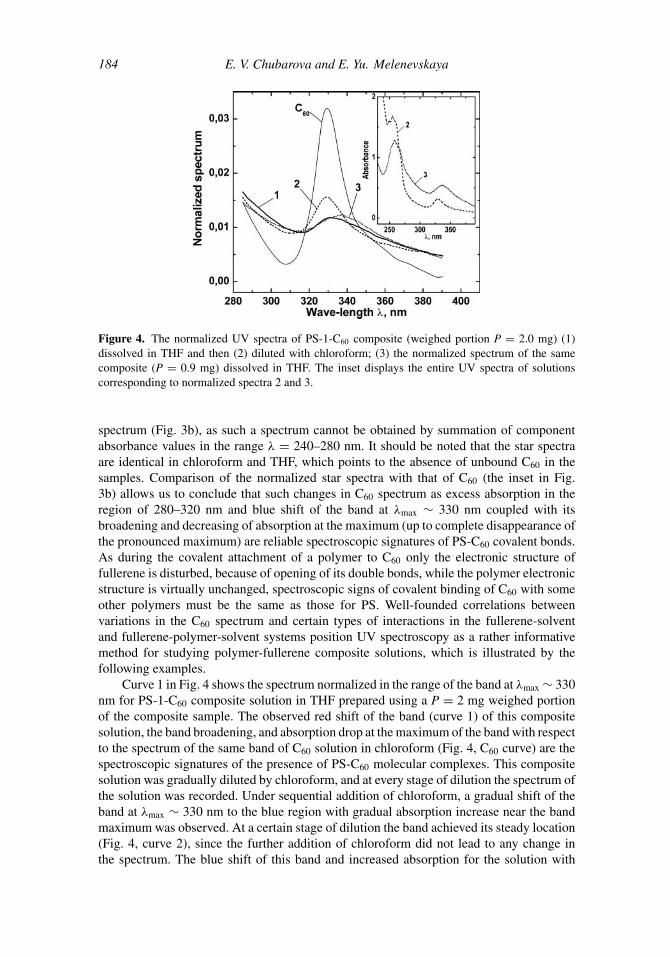
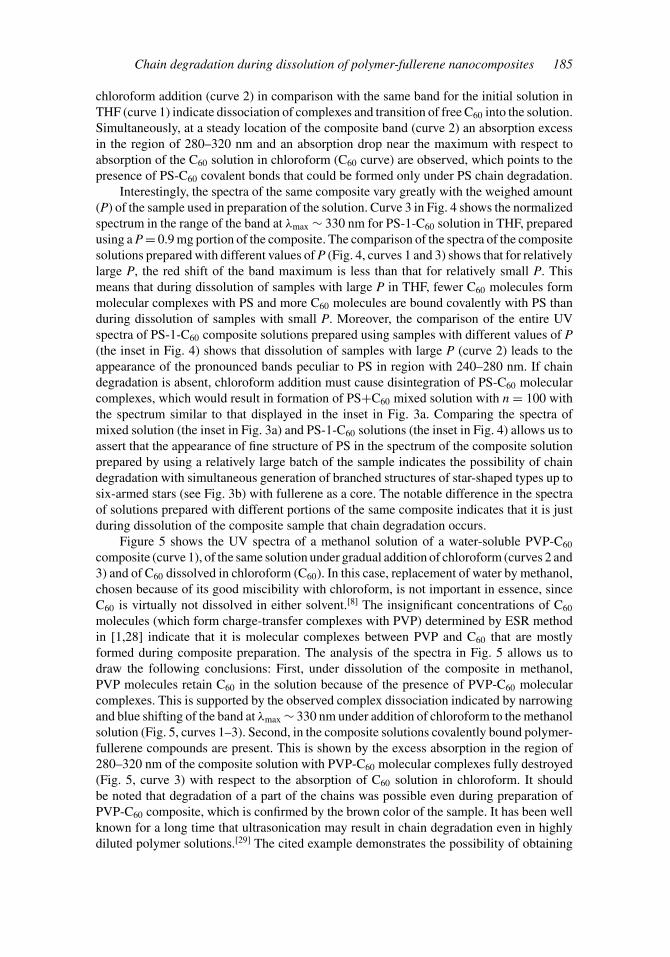
Figure 4. The normalized UV spectra of PS-1-C60 composite (weighed portion P = 2.0 mg) (1)dissolved in THF and then (2) diluted with chloroform; (3) the normalized spectrum of the samecomposite (P = 0.9 mg) dissolved in THF. The inset displays the entire UV spectra of solutionscorresponding to normalized spectra 2 and 3.
spectrum (Fig. 3b), as such a spectrum cannot be obtained by summation of componentabsorbance values in the range λ = 240–280 nm. It should be noted that the star spectraare identical in chloroform and THF, which points to the absence of unbound C60 in thesamples. Comparison of the normalized star spectra with that of C60 (the inset in Fig.3b) allows us to conclude that such changes in C60 spectrum as excess absorption in theregion of 280–320 nm and blue shift of the band at λmax ∼ 330 nm coupled with itsbroadening and decreasing of absorption at the maximum (up to complete disappearance ofthe pronounced maximum) are reliable spectroscopic signatures of PS-C60 covalent bonds.As during the covalent attachment of a polymer to C60 only the electronic structure offullerene is disturbed, because of opening of its double bonds, while the polymer electronicstructure is virtually unchanged, spectroscopic signs of covalent binding of C60 with someother polymers must be the same as those for PS. Well-founded correlations betweenvariations in the C60 spectrum and certain types of interactions in the fullerene-solventand fullerene-polymer-solvent systems position UV spectroscopy as a rather informativemethod for studying polymer-fullerene composite solutions, which is illustrated by thefollowing examples.
Curve 1 in Fig. 4 shows the spectrum normalized in the range of the band at λmax ∼ 330nm for PS-1-C60 composite solution in THF prepared using a P = 2 mg weighed portionof the composite sample. The observed red shift of the band (curve 1) of this compositesolution, the band broadening, and absorption drop at the maximum of the band with respectto the spectrum of the same band of C60 solution in chloroform (Fig. 4, C60 curve) are thespectroscopic signatures of the presence of PS-C60 molecular complexes. This compositesolution was gradually diluted by chloroform, and at every stage of dilution the spectrum ofthe solution was recorded. Under sequential addition of chloroform, a gradual shift of theband at λmax ∼ 330 nm to the blue region with gradual absorption increase near the bandmaximum was observed. At a certain stage of dilution the band achieved its steady location(Fig. 4, curve 2), since the further addition of chloroform did not lead to any change inthe spectrum. The blue shift of this band and increased absorption for the solution with
Chain degradation during dissolution of polymer-fullerene nanocomposites 185
chloroform addition (curve 2) in comparison with the same band for the initial solution inTHF (curve 1) indicate dissociation of complexes and transition of free C60 into the solution.Simultaneously, at a steady location of the composite band (curve 2) an absorption excessin the region of 280–320 nm and an absorption drop near the maximum with respect toabsorption of the C60 solution in chloroform (C60 curve) are observed, which points to thepresence of PS-C60 covalent bonds that could be formed only under PS chain degradation.
Interestingly, the spectra of the same composite vary greatly with the weighed amount(P) of the sample used in preparation of the solution. Curve 3 in Fig. 4 shows the normalizedspectrum in the range of the band at λmax ∼ 330 nm for PS-1-C60 solution in THF, preparedusing a P = 0.9 mg portion of the composite. The comparison of the spectra of the compositesolutions prepared with different values of P (Fig. 4, curves 1 and 3) shows that for relativelylarge P, the red shift of the band maximum is less than that for relatively small P. Thismeans that during dissolution of samples with large P in THF, fewer C60 molecules formmolecular complexes with PS and more C60 molecules are bound covalently with PS thanduring dissolution of samples with small P. Moreover, the comparison of the entire UVspectra of PS-1-C60 composite solutions prepared using samples with different values of P(the inset in Fig. 4) shows that dissolution of samples with large P (curve 2) leads to theappearance of the pronounced bands peculiar to PS in region with 240–280 nm. If chaindegradation is absent, chloroform addition must cause disintegration of PS-C60 molecularcomplexes, which would result in formation of PS+C60 mixed solution with n = 100 withthe spectrum similar to that displayed in the inset in Fig. 3a. Comparing the spectra ofmixed solution (the inset in Fig. 3a) and PS-1-C60 solutions (the inset in Fig. 4) allows us toassert that the appearance of fine structure of PS in the spectrum of the composite solutionprepared by using a relatively large batch of the sample indicates the possibility of chaindegradation with simultaneous generation of branched structures of star-shaped types up tosix-armed stars (see Fig. 3b) with fullerene as a core. The notable difference in the spectraof solutions prepared with different portions of the same composite indicates that it is justduring dissolution of the composite sample that chain degradation occurs.
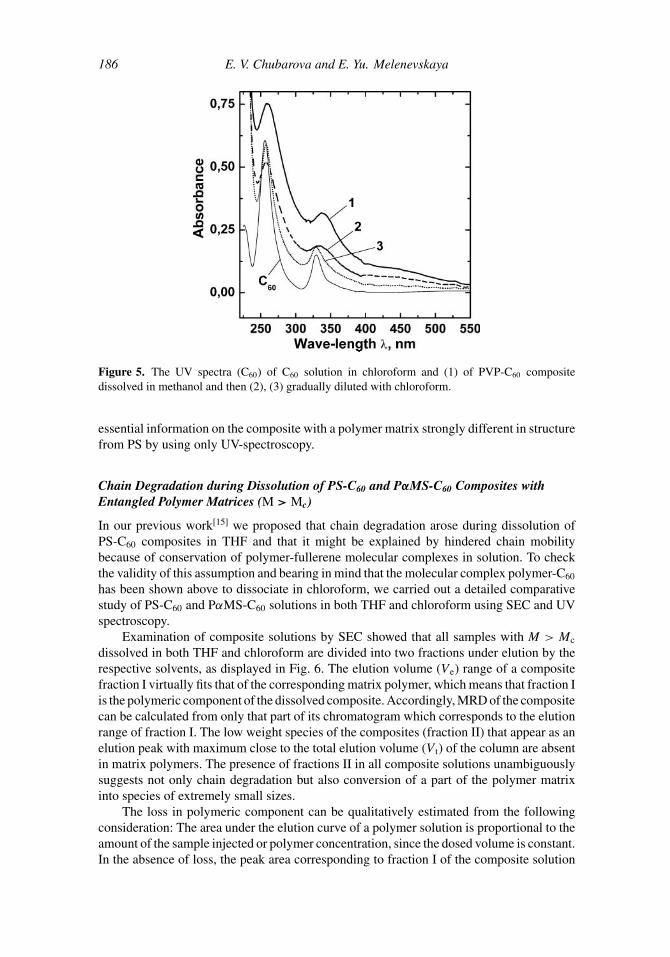
Figure 5 shows the UV spectra of a methanol solution of a water-soluble PVP-C60
composite (curve 1), of the same solution under gradual addition of chloroform (curves 2 and3) and of C60 dissolved in chloroform (C60). In this case, replacement of water by methanol,chosen because of its good miscibility with chloroform, is not important in essence, sinceC60 is virtually not dissolved in either solvent.[8] The insignificant concentrations of C60
molecules (which form charge-transfer complexes with PVP) determined by ESR methodin [1,28] indicate that it is molecular complexes between PVP and C60 that are mostlyformed during composite preparation. The analysis of the spectra in Fig. 5 allows us todraw the following conclusions: First, under dissolution of the composite in methanol,PVP molecules retain C60 in the solution because of the presence of PVP-C60 molecularcomplexes. This is supported by the observed complex dissociation indicated by narrowingand blue shifting of the band at λmax ∼ 330 nm under addition of chloroform to the methanolsolution (Fig. 5, curves 1–3). Second, in the composite solutions covalently bound polymer-fullerene compounds are present. This is shown by the excess absorption in the region of280–320 nm of the composite solution with PVP-C60 molecular complexes fully destroyed(Fig. 5, curve 3) with respect to the absorption of C60 solution in chloroform. It shouldbe noted that degradation of a part of the chains was possible even during preparation ofPVP-C60 composite, which is confirmed by the brown color of the sample. It has been wellknown for a long time that ultrasonication may result in chain degradation even in highlydiluted polymer solutions.[29] The cited example demonstrates the possibility of obtaining
186 E. V. Chubarova and E. Yu. Melenevskaya
Figure 5. The UV spectra (C60) of C60 solution in chloroform and (1) of PVP-C60 compositedissolved in methanol and then (2), (3) gradually diluted with chloroform.
essential information on the composite with a polymer matrix strongly different in structurefrom PS by using only UV-spectroscopy.
Chain Degradation during Dissolution of PS-C60 and PαMS-C60 Composites withEntangled Polymer Matrices (M > Mc)
In our previous work[15] we proposed that chain degradation arose during dissolution ofPS-C60 composites in THF and that it might be explained by hindered chain mobilitybecause of conservation of polymer-fullerene molecular complexes in solution. To checkthe validity of this assumption and bearing in mind that the molecular complex polymer-C60
has been shown above to dissociate in chloroform, we carried out a detailed comparativestudy of PS-C60 and PαMS-C60 solutions in both THF and chloroform using SEC and UVspectroscopy.
Examination of composite solutions by SEC showed that all samples with M > Mc
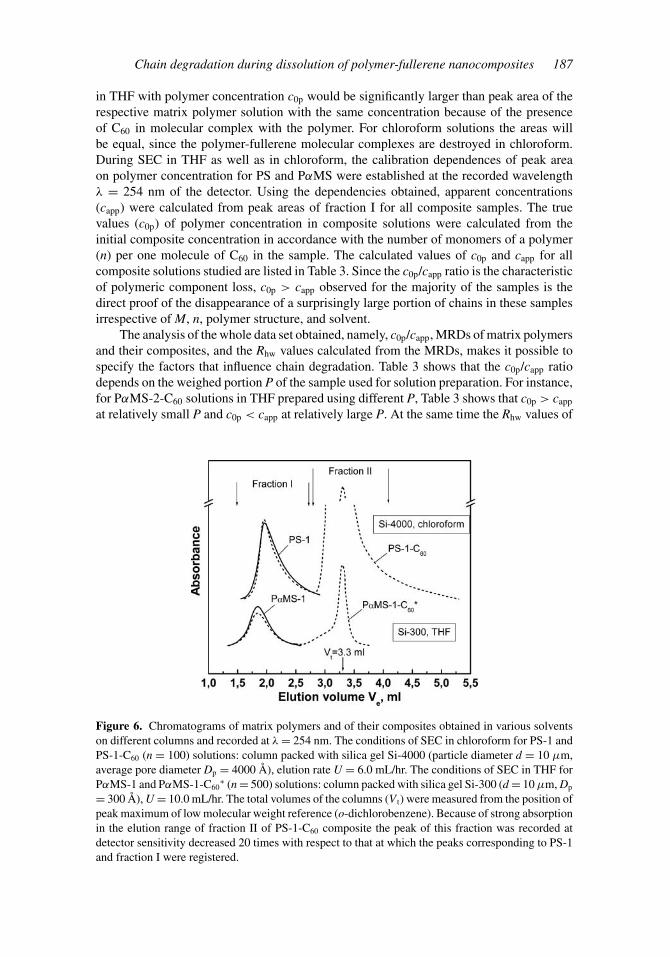
dissolved in both THF and chloroform are divided into two fractions under elution by therespective solvents, as displayed in Fig. 6. The elution volume (Ve) range of a compositefraction I virtually fits that of the corresponding matrix polymer, which means that fraction Iis the polymeric component of the dissolved composite. Accordingly, MRD of the compositecan be calculated from only that part of its chromatogram which corresponds to the elutionrange of fraction I. The low weight species of the composites (fraction II) that appear as anelution peak with maximum close to the total elution volume (V t) of the column are absentin matrix polymers. The presence of fractions II in all composite solutions unambiguouslysuggests not only chain degradation but also conversion of a part of the polymer matrixinto species of extremely small sizes.
The loss in polymeric component can be qualitatively estimated from the followingconsideration: The area under the elution curve of a polymer solution is proportional to theamount of the sample injected or polymer concentration, since the dosed volume is constant.In the absence of loss, the peak area corresponding to fraction I of the composite solution
Chain degradation during dissolution of polymer-fullerene nanocomposites 187
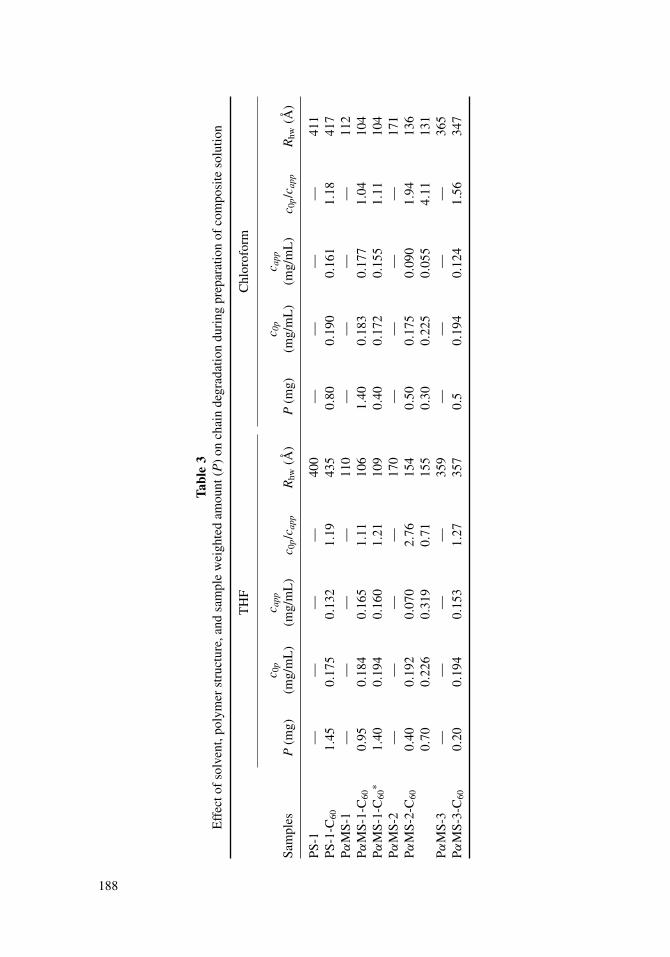
in THF with polymer concentration c0p would be significantly larger than peak area of therespective matrix polymer solution with the same concentration because of the presenceof C60 in molecular complex with the polymer. For chloroform solutions the areas willbe equal, since the polymer-fullerene molecular complexes are destroyed in chloroform.During SEC in THF as well as in chloroform, the calibration dependences of peak areaon polymer concentration for PS and PαMS were established at the recorded wavelengthλ = 254 nm of the detector. Using the dependencies obtained, apparent concentrations(capp) were calculated from peak areas of fraction I for all composite samples. The truevalues (c0p) of polymer concentration in composite solutions were calculated from theinitial composite concentration in accordance with the number of monomers of a polymer(n) per one molecule of C60 in the sample. The calculated values of c0p and capp for allcomposite solutions studied are listed in Table 3. Since the c0p/capp ratio is the characteristicof polymeric component loss, c0p > capp observed for the majority of the samples is thedirect proof of the disappearance of a surprisingly large portion of chains in these samplesirrespective of M, n, polymer structure, and solvent.
The analysis of the whole data set obtained, namely, c0p/capp, MRDs of matrix polymersand their composites, and the Rhw values calculated from the MRDs, makes it possible tospecify the factors that influence chain degradation. Table 3 shows that the c0p/capp ratiodepends on the weighed portion P of the sample used for solution preparation. For instance,for PαMS-2-C60 solutions in THF prepared using different P, Table 3 shows that c0p > capp
at relatively small P and c0p < capp at relatively large P. At the same time the Rhw values of
Figure 6. Chromatograms of matrix polymers and of their composites obtained in various solventson different columns and recorded at λ = 254 nm. The conditions of SEC in chloroform for PS-1 andPS-1-C60 (n = 100) solutions: column packed with silica gel Si-4000 (particle diameter d = 10 µm,average pore diameter Dp = 4000 Å), elution rate U = 6.0 mL/hr. The conditions of SEC in THF forPαMS-1 and PαMS-1-C60
∗ (n = 500) solutions: column packed with silica gel Si-300 (d = 10 µm, Dp
= 300 Å), U = 10.0 mL/hr. The total volumes of the columns (V t) were measured from the position ofpeak maximum of low molecular weight reference (o-dichlorobenzene). Because of strong absorptionin the elution range of fraction II of PS-1-C60 composite the peak of this fraction was recorded atdetector sensitivity decreased 20 times with respect to that at which the peaks corresponding to PS-1and fraction I were registered.
Tabl
e3
Eff
ecto
fso
lven
t,po
lym
erst
ruct
ure,
and
sam
ple
wei
ghte
dam
ount
(P)
onch
ain
degr
adat
ion
duri
ngpr
epar
atio
nof
com
posi
teso
lutio
n
TH
FC
hlor
ofor
m
Sam
ples
P(m
g)c 0
p
(mg/
mL
)c a
pp
(mg/
mL
)c 0
p/c
app
Rhw
(Å)
P(m
g)c 0
p
(mg/
mL
)c a
pp
(mg/
mL
)c 0
p/c
app
Rhw
(Å)
PS-1
——
——
400
——
——
411
PS-1
-C60
1.45
0.17
50.
132
1.19
435
0.80
0.19
00.
161
1.18
417
PαM
S-1
——
——
110
——
——
112
PαM
S-1-
C60
0.95
0.18
40.
165
1.11
106
1.40
0.18
30.
177
1.04
104
PαM
S-1-
C60
∗1.
400.
194
0.16
01.
2110
90.
400.
172
0.15
51.
1110
4Pα
MS-
2—
——
—17
0—
——
—17
1Pα
MS-
2-C
600.
400.
192
0.07
02.
7615
40.
500.
175
0.09
01.
9413
60.
700.
226
0.31
90.
7115
50.
300.
225
0.05
54.
1113
1Pα
MS-
3—
——
—35
9—
——
—36
5Pα
MS-
3-C
600.
200.
194
0.15
31.
2735
70.
50.
194
0.12
41.
5634
7
188
Chain degradation during dissolution of polymer-fullerene nanocomposites 189
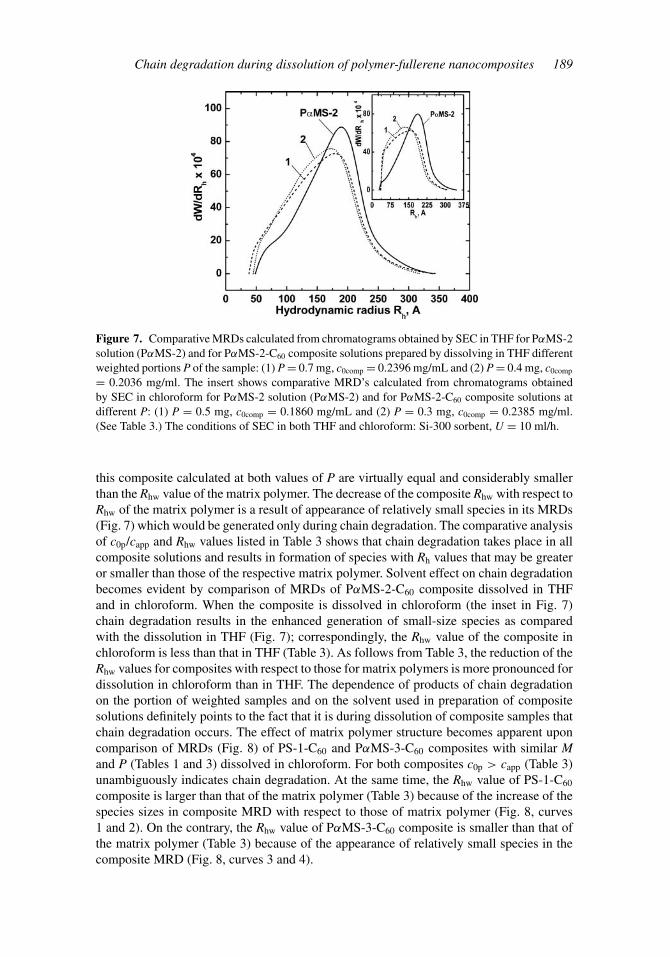
Figure 7. Comparative MRDs calculated from chromatograms obtained by SEC in THF for PαMS-2solution (PαMS-2) and for PαMS-2-C60 composite solutions prepared by dissolving in THF differentweighted portions P of the sample: (1) P = 0.7 mg, c0comp = 0.2396 mg/mL and (2) P = 0.4 mg, c0comp
= 0.2036 mg/ml. The insert shows comparative MRD’s calculated from chromatograms obtainedby SEC in chloroform for PαMS-2 solution (PαMS-2) and for PαMS-2-C60 composite solutions atdifferent P: (1) P = 0.5 mg, c0comp = 0.1860 mg/mL and (2) P = 0.3 mg, c0comp = 0.2385 mg/ml.(See Table 3.) The conditions of SEC in both THF and chloroform: Si-300 sorbent, U = 10 ml/h.
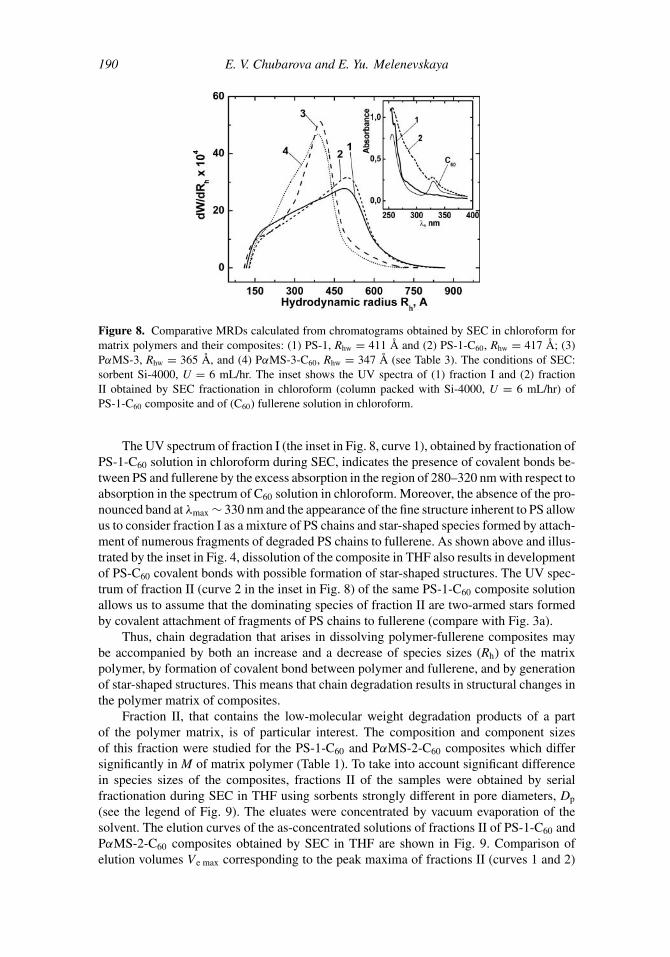
this composite calculated at both values of P are virtually equal and considerably smallerthan the Rhw value of the matrix polymer. The decrease of the composite Rhw with respect toRhw of the matrix polymer is a result of appearance of relatively small species in its MRDs(Fig. 7) which would be generated only during chain degradation. The comparative analysisof c0p/capp and Rhw values listed in Table 3 shows that chain degradation takes place in allcomposite solutions and results in formation of species with Rh values that may be greateror smaller than those of the respective matrix polymer. Solvent effect on chain degradationbecomes evident by comparison of MRDs of PαMS-2-C60 composite dissolved in THFand in chloroform. When the composite is dissolved in chloroform (the inset in Fig. 7)chain degradation results in the enhanced generation of small-size species as comparedwith the dissolution in THF (Fig. 7); correspondingly, the Rhw value of the composite inchloroform is less than that in THF (Table 3). As follows from Table 3, the reduction of theRhw values for composites with respect to those for matrix polymers is more pronounced fordissolution in chloroform than in THF. The dependence of products of chain degradationon the portion of weighted samples and on the solvent used in preparation of compositesolutions definitely points to the fact that it is during dissolution of composite samples thatchain degradation occurs. The effect of matrix polymer structure becomes apparent uponcomparison of MRDs (Fig. 8) of PS-1-C60 and PαMS-3-C60 composites with similar Mand P (Tables 1 and 3) dissolved in chloroform. For both composites c0p > capp (Table 3)unambiguously indicates chain degradation. At the same time, the Rhw value of PS-1-C60
composite is larger than that of the matrix polymer (Table 3) because of the increase of thespecies sizes in composite MRD with respect to those of matrix polymer (Fig. 8, curves1 and 2). On the contrary, the Rhw value of PαMS-3-C60 composite is smaller than that ofthe matrix polymer (Table 3) because of the appearance of relatively small species in thecomposite MRD (Fig. 8, curves 3 and 4).
190 E. V. Chubarova and E. Yu. Melenevskaya
Figure 8. Comparative MRDs calculated from chromatograms obtained by SEC in chloroform formatrix polymers and their composites: (1) PS-1, Rhw = 411 Å and (2) PS-1-C60, Rhw = 417 Å; (3)PαMS-3, Rhw = 365 Å, and (4) PαMS-3-C60, Rhw = 347 Å (see Table 3). The conditions of SEC:sorbent Si-4000, U = 6 mL/hr. The inset shows the UV spectra of (1) fraction I and (2) fractionII obtained by SEC fractionation in chloroform (column packed with Si-4000, U = 6 mL/hr) ofPS-1-C60 composite and of (C60) fullerene solution in chloroform.
The UV spectrum of fraction I (the inset in Fig. 8, curve 1), obtained by fractionation ofPS-1-C60 solution in chloroform during SEC, indicates the presence of covalent bonds be-tween PS and fullerene by the excess absorption in the region of 280–320 nm with respect toabsorption in the spectrum of C60 solution in chloroform. Moreover, the absence of the pro-nounced band at λmax ∼ 330 nm and the appearance of the fine structure inherent to PS allowus to consider fraction I as a mixture of PS chains and star-shaped species formed by attach-ment of numerous fragments of degraded PS chains to fullerene. As shown above and illus-trated by the inset in Fig. 4, dissolution of the composite in THF also results in developmentof PS-C60 covalent bonds with possible formation of star-shaped structures. The UV spec-trum of fraction II (curve 2 in the inset in Fig. 8) of the same PS-1-C60 composite solutionallows us to assume that the dominating species of fraction II are two-armed stars formedby covalent attachment of fragments of PS chains to fullerene (compare with Fig. 3a).
Thus, chain degradation that arises in dissolving polymer-fullerene composites maybe accompanied by both an increase and a decrease of species sizes (Rh) of the matrixpolymer, by formation of covalent bond between polymer and fullerene, and by generationof star-shaped structures. This means that chain degradation results in structural changes inthe polymer matrix of composites.
Fraction II, that contains the low-molecular weight degradation products of a partof the polymer matrix, is of particular interest. The composition and component sizesof this fraction were studied for the PS-1-C60 and PαMS-2-C60 composites which differsignificantly in M of matrix polymer (Table 1). To take into account significant differencein species sizes of the composites, fractions II of the samples were obtained by serialfractionation during SEC in THF using sorbents strongly different in pore diameters, Dp
(see the legend of Fig. 9). The eluates were concentrated by vacuum evaporation of thesolvent. The elution curves of the as-concentrated solutions of fractions II of PS-1-C60 andPαMS-2-C60 composites obtained by SEC in THF are shown in Fig. 9. Comparison ofelution volumes Ve max corresponding to the peak maxima of fractions II (curves 1 and 2)
Chain degradation during dissolution of polymer-fullerene nanocomposites 191
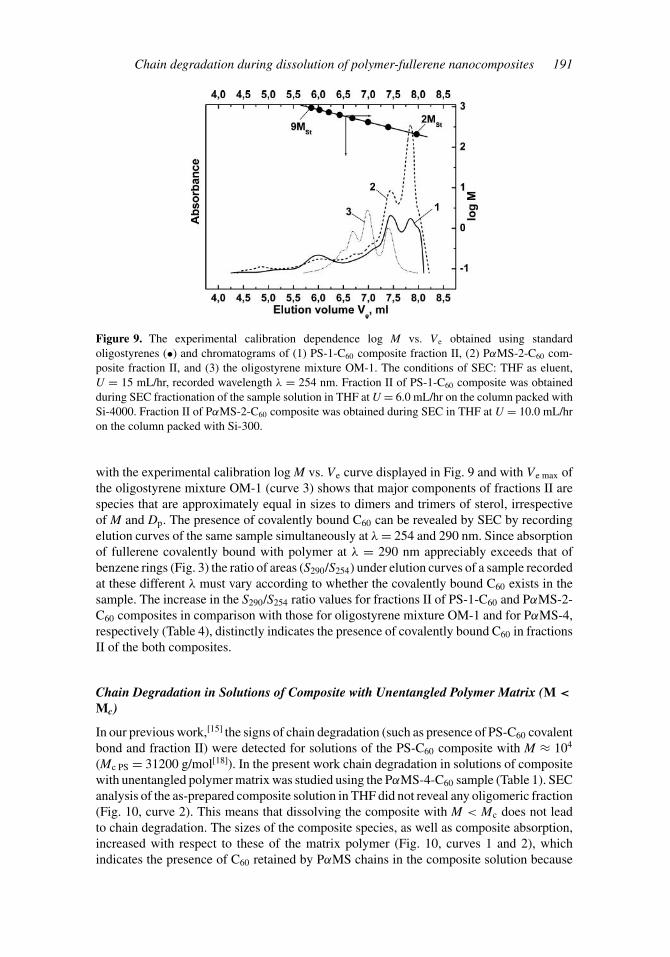
Figure 9. The experimental calibration dependence log M vs. Ve obtained using standardoligostyrenes (•) and chromatograms of (1) PS-1-C60 composite fraction II, (2) PαMS-2-C60 com-posite fraction II, and (3) the oligostyrene mixture OM-1. The conditions of SEC: THF as eluent,U = 15 mL/hr, recorded wavelength λ = 254 nm. Fraction II of PS-1-C60 composite was obtainedduring SEC fractionation of the sample solution in THF at U = 6.0 mL/hr on the column packed withSi-4000. Fraction II of PαMS-2-C60 composite was obtained during SEC in THF at U = 10.0 mL/hron the column packed with Si-300.
with the experimental calibration log M vs. Ve curve displayed in Fig. 9 and with Ve max ofthe oligostyrene mixture OM-1 (curve 3) shows that major components of fractions II arespecies that are approximately equal in sizes to dimers and trimers of sterol, irrespectiveof M and Dp. The presence of covalently bound C60 can be revealed by SEC by recordingelution curves of the same sample simultaneously at λ = 254 and 290 nm. Since absorptionof fullerene covalently bound with polymer at λ = 290 nm appreciably exceeds that ofbenzene rings (Fig. 3) the ratio of areas (S290/S254) under elution curves of a sample recordedat these different λ must vary according to whether the covalently bound C60 exists in thesample. The increase in the S290/S254 ratio values for fractions II of PS-1-C60 and PαMS-2-C60 composites in comparison with those for oligostyrene mixture OM-1 and for PαMS-4,respectively (Table 4), distinctly indicates the presence of covalently bound C60 in fractionsII of the both composites.
Chain Degradation in Solutions of Composite with Unentangled Polymer Matrix (M <
Mc)
In our previous work,[15] the signs of chain degradation (such as presence of PS-C60 covalentbond and fraction II) were detected for solutions of the PS-C60 composite with M ≈ 104
(Mc PS = 31200 g/mol[18]). In the present work chain degradation in solutions of compositewith unentangled polymer matrix was studied using the PαMS-4-C60 sample (Table 1). SECanalysis of the as-prepared composite solution in THF did not reveal any oligomeric fraction(Fig. 10, curve 2). This means that dissolving the composite with M < Mc does not leadto chain degradation. The sizes of the composite species, as well as composite absorption,increased with respect to these of the matrix polymer (Fig. 10, curves 1 and 2), whichindicates the presence of C60 retained by PαMS chains in the composite solution because
192 E. V. Chubarova and E. Yu. Melenevskaya
Table 4Ratios of areas (S290/S254) under elution curves obtained at λ = 290 nm
and λ = 254 nm
Sample S290/S254
Oligostyrene mixture OM-1 0.1033Fraction II of PS-1-C60 composite 0.2670Fraction II of PαMS-2-C60 composite 0.1386PαMS-4 0.0945PαMS-4-C60, as-prepared solution 0.1250PαMS-4-C60, storage during 3 months 0.1000∗
0.4608∗∗
∗Calculated value corresponds to polymeric component of elution curve.∗∗Calculated value corresponds to oligomeric component of elution curve.
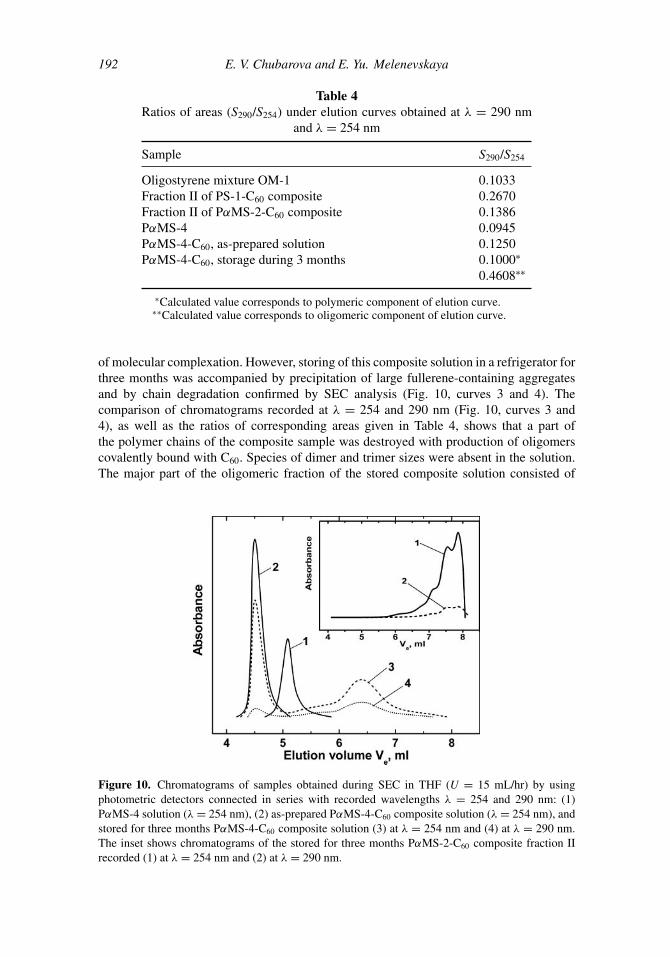
of molecular complexation. However, storing of this composite solution in a refrigerator forthree months was accompanied by precipitation of large fullerene-containing aggregatesand by chain degradation confirmed by SEC analysis (Fig. 10, curves 3 and 4). Thecomparison of chromatograms recorded at λ = 254 and 290 nm (Fig. 10, curves 3 and4), as well as the ratios of corresponding areas given in Table 4, shows that a part ofthe polymer chains of the composite sample was destroyed with production of oligomerscovalently bound with C60. Species of dimer and trimer sizes were absent in the solution.The major part of the oligomeric fraction of the stored composite solution consisted of
Figure 10. Chromatograms of samples obtained during SEC in THF (U = 15 mL/hr) by usingphotometric detectors connected in series with recorded wavelengths λ = 254 and 290 nm: (1)PαMS-4 solution (λ = 254 nm), (2) as-prepared PαMS-4-C60 composite solution (λ = 254 nm), andstored for three months PαMS-4-C60 composite solution (3) at λ = 254 nm and (4) at λ = 290 nm.The inset shows chromatograms of the stored for three months PαMS-2-C60 composite fraction IIrecorded (1) at λ = 254 nm and (2) at λ = 290 nm.
Chain degradation during dissolution of polymer-fullerene nanocomposites 193
species with sizes corresponding to these of sterol oligomers of ∼5–9 monomer units. Thisfollows from the comparison of elution volumes of the oligomeric fraction (Fig. 10, curves3 and 4) with the calibration dependence shown in Fig. 9. It should be noted that for thesolution of fraction II of PαMS-2-C60 composite stored under the same conditions for thesame time, precipitation of fullerene-containing aggregates was not observed though somechanges in the size distribution of fragments occurred. The change becomes obvious fromcomparison between the chromatogram of fraction II obtained immediately after compositefractionation (Fig. 9, curve 2) with the chromatogram of the same fraction II stored duringthree months (the inset in Fig. 10, curves 1 and 2). Comparison of degradation productsformed under dissolution of composites with M > Mc and during storage of solution ofcomposite with M < Mc indicates that mechanisms of chain degradation in these cases isstrongly different.
It should be emphasized that a minor amount of fullerene sediment appeared immedi-ately during dissolution of the PαMS-4-C60 composite in THF. For the composites with theentangled polymer matrices (M > Mc) no sediment was observed during dissolution at thesame fullerene content. This means that the ability of polymer chains to retain fullerene insolution because of molecular complexation depends on the chain length. Roughly in 2 hrafter solution preparation, precipitation of larger-sized fullerene aggregates was observed.The appearance of precipitate caused by the tendency of C60 molecules to aggregate insolution was observed for all composite solutions. However, the larger the M of matrixpolymer is, the more slowly the aggregation proceeds. For polymer-fullerene compositeswith M ≥ 105 g/mol no precipitate was observed during several days. In other words, thelonger the chains are, the more stable the polymer-fullerene composite solution is. Thisobservation contradicts, at least for polymer-fullerene composites, the conclusions of theo-retical work[30] that predicts narrowing of the miscibility window with increasing polymerchain length for any strength of monomer-filler and filler-filler interactions.
Relying on the data obtained for the PαMS-4-C60 composite we can argue with a fairdegree of confidence that chain degradation of PS with M < Mc discovered previously[15] isnot connected with the solution process itself. It should be particularly emphasized that allthe results in the present work were obtained with only as-prepared composite solutions.
Discussion
The Origin of Chain Degradation Phenomenon during Dissolution ofPolymer-Fullerene Composites with M > Mc
The data obtained show that chain entanglement is the necessary condition for chain degra-dation during dissolution of polymer-C60 composites. Dissolution leads to chain degrada-tion irrespective of the polymer structure, M, quantity of C60 molecules in composite, andsolvent used.
It is interesting to watch the composite dissolution, especially for samples with rel-atively large M, in solvent that is poor for C60 and good for polymer (THF, e.g.). Afteraddition of such a solvent, the weighed sample instantly breaks into pieces that literally flyapart over the solvent volume and then almost instantly break into still smaller fragmentsand dissolve. The solution becomes of uniform color. It is clear that chain degradation isthe result of the spectacular disintegration of the composite sample, which arises at theinitial phase of sample dissolution, namely, during its swelling. The disintegration processis similar to that observed in swelling of cross-linked PS samples.[31] No degradation wasobserved during dissolution of both lyophilized and film samples of matrix polymers. This
194 E. V. Chubarova and E. Yu. Melenevskaya
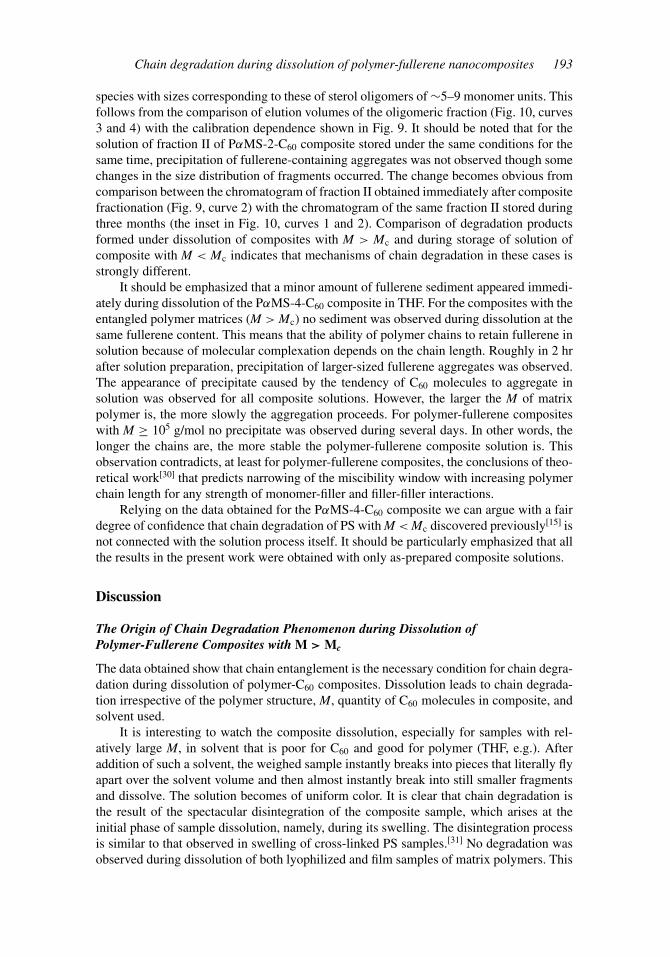
Scheme 1. Diagrammatic representation of a piece of entangled polymer matrix in the presence ofC60 as a filler, which shows loop entanglement and possibility to form polymer-fullerene molecularcomplexes simultaneously with several chains.
means that the necessary condition of chain degradation during composite dissolution isthe presence of filler.
When studying the phenomenon of swelling fracture in glassy polymers, Alfrey andcolleagues[31] considered a gradually swelling sample as consisting of an unswollen glassycore surrounded by a swollen shell attached to it. Theoretical treatment performed forspecimens of different geometry (flat slab and long cylinder) shows that the swollen shellis in a state of compression while the glass core is in a state of tension for every instantof swelling time. It is especially important that tensile stress on a glassy core increasesendlessly with increase in shell thickness. This means the possibility of a fracture of theglassy core when the tensile stress exceeds its ultimate strength. The explosive behaviorof fractures after a latent period and the predicted location of cracks for swelling styrene-divinylbenzene copolymer (5% divinylbenzene and 95% styrene) specimens with the samegeometries constitute the experimental confirmation[31] of the validity of the theoreticalmodel. The model may be directly applied to polymer-C60 composites. The regions closeto fullerene, where the mobility of those parts of chains that include the molecular com-plexes polymer-fullerene (Scheme 1) is most hindered, may be considered in a swellingcomposite as “glassy cores” that will be eventually fractured by the gradually arising ten-sile stress. This implies that the swelling fracture will propagate in the immediate vicinityof fullerenes. Breakdown of these regions means the possibility both of disintegration ofpolymer-fullerene contacts and of chain ruptures. Then it may be suggested that the “ulti-mate strength” of these glassy regions at which chain ruptures take place depends on thestate of chains (presence of strained bonds) in the entangled matrix, while the possibilityof arriving at the critical state during swelling of polymer-fullerene composites depends onthe solvent.
Indeed, the number of chain ruptures depends on the thermodynamic quality of thesolvent with respect to C60, namely, on the dissociation rate of polymer-fullerene complex(see Fig. 11, especially the inset). The solubilities of C60 in chloroform, benzene, and
Chain degradation during dissolution of polymer-fullerene nanocomposites 195
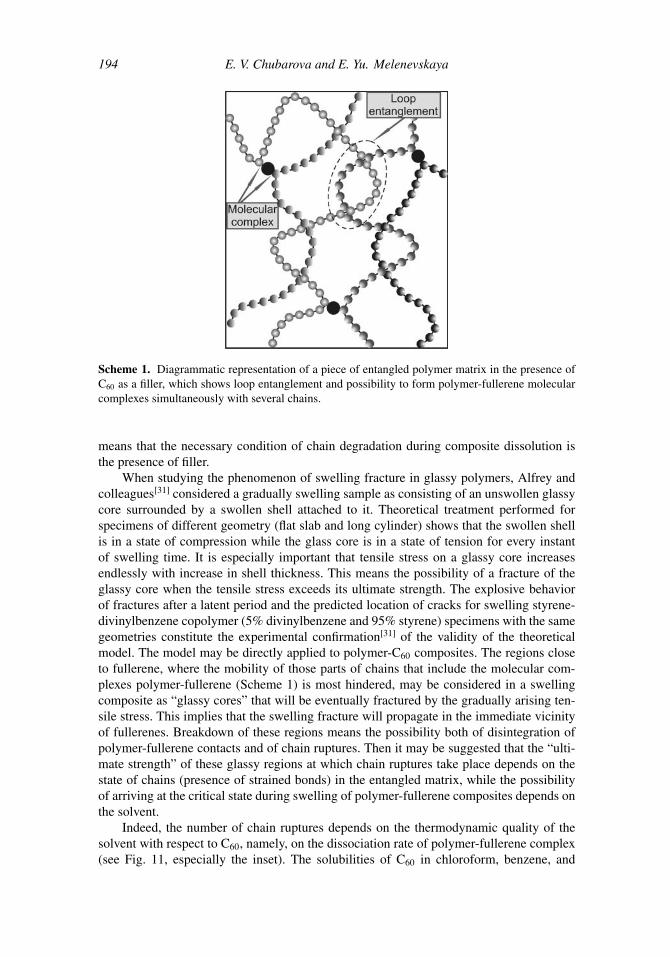
Figure 11. The comparative normalized UV spectra of C60 solutions and of composites in varioussolvents: (1), (2), (3) for C60, PS-1-C60, and PαMS-2-C60 solutions in chloroform, respectively;(4), (5) for C60 and PS-1-C60 solutions in benzene, respectively. The inset shows the comparativenormalized UV spectra of p-xylene solutions of (1) C60, (2) PαMS-2-C60 composite, (3) PS-1-C60
composite, and (4) PS(10M)-C60 composite.
p-xylene are 0.25, 1.5, and 3.14–5.9 mg/mL, respectively.[8] Comparison between theabsorption of composite and that of C60 at the maximum of the band at λmax ∼ 330 nmas well as in the region of 280–320 nm in the spectra of their solutions in each of thesesolvents shows that with the increase of solubility, the amount of C60 covalently bound withpolymer decreases which means that the number of chain ruptures decreases.
The capability of fullerene to complex simultaneously with several chains will leadto formation of an elastically stressed (nonequilibrium) spatial network with polymer-fullerene molecular complexes as the nodes (see Scheme 1) during composite preparation.As was shown above (Figs. 2a and 2b), interaction between polymer and fullerene ispossible even prior to the complete removal of solvent by slow evaporation from PS+C60
mixed solutions. The interaction decreases the mobility of the chains and thus impedestheir free entanglement under further evaporation of solvent, which leads to the appearanceof thermodynamically nonequilibrium chain conformations. The tendency of fullereneto aggregate also promotes forced deformation of chains. As a result, a nonequilibriumnetwork is formed after solvent is completely removed. The increased deformation of chainsis confirmed by the increased molecular packing density in PS-C60 films as compared withthat of PS films.[32] Under composite preparation by lyophilization, mobility of chains isdramatically hindered during snap freezing of the mixed solution. A quickly frozen systemis not in equilibrium by itself, and polymer-fullerene complexation on further solventsublimation adds to the nonequilibrium of the system. The samples of composite preparedby lyophilization have a looser structure than that of film composite samples, which indicatesthe less stressed state of chains in lyophilic samples with respect to the state in films. Thegreater the strain energy stored by chains during formation of nonequilibrium network,the less the activation energy of chain degradation and the greater the number of chainruptures. The effect of molecular packing density (as well as of the method of samplepreparation) on chain degradation is illustrated by the spectra of THF solutions of PαMS-2-C60 composite prepared by lyophilization and as a film (Fig. 12). The excess absorption in
196 E. V. Chubarova and E. Yu. Melenevskaya
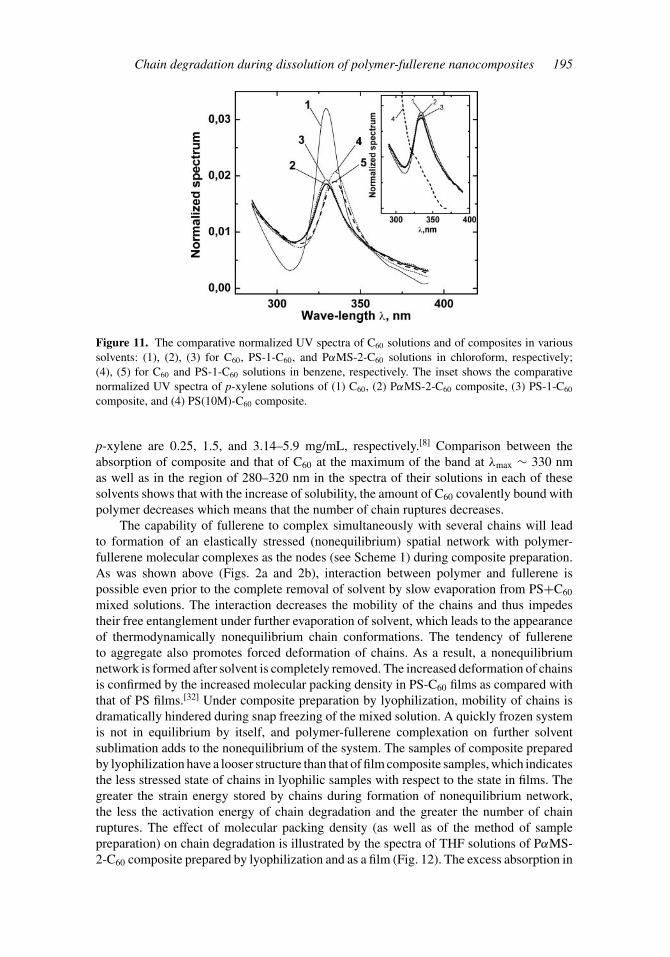
Figure 12. The UV spectra of PαMS-2-C60 composite solutions in THF: (1) the sample prepared bylyophilization and (2) film. The UV spectrum of fullerene corresponds to the curve labeled C60 beingthe spectrum of a C60 solution in chloroform.
the range 280–320 nm and a minor red shift of the band at λmax ∼ 330 nm in the spectrumof lyophilized composite (Fig. 12, curve 1) became apparent when compared with thespectrum of C60 in chloroform; it indicates the presence of not only covalently bound C60
but also polymer-fullerene molecular complexes. In the film solution (Fig. 12, curve 2) allfullerenes are covalently bound with polymer. The spectra in Fig. 12 show, as well, that themain degradation products of the samples with denser packing are multi-armed structures.
Dependence of degradation on the chain length (Fig. 11, the inset) points to theimportance of chain parameters. With increasing of chain length (M of polymer), itsrelaxation time increases, promoting increase of stored elastic energy during compositepreparation. Besides, the larger the chain length, the more the network nodes formed onit (at n = const). Correspondingly, the probability of numerous ruptures along the chainincreases. Comparison between the spectra of PαMS-2-C60 and PS-C60 composite solutionsin chloroform (Fig. 11, curves 2 and 3) and in p-xylene (the inset in Fig. 11, curves 2 and 3)shows that for relatively long PS chains the amount of covalently bound C60 is somewhatlarger than that for relatively short PαMS-2 chains. The spectrum of the p-xylene solutionof PS(10M)-C60 composite (n ∼= 100, MPS ∼ 107 g/mol; see the inset in Fig. 11, curve 4)prepared previously[15] by lyophilization indicates the presence of only covalently boundC60. It is important to note that theoretical statements true to the discussed model ofswelling fracture[31] can be applied to the case of solvent desorption from a swollen sample.Adapted to our case of polymer-fullerene composites, the model predicts the possibilityof degradation of the longest chains already in the process of composite preparation. Thisprediction is supported by the presence of covalently bound C60 in composite solutions insuch a good for C60 solvent as p-xylene and, especially, by the bright yellow color of ourPS(10M)-C60 sample. In our further investigations we are planning to check the possibilityof degradation of some portion of chains even during preparation of composite samples.
Thus, the experimental results presented confirm the model of Alfrey and colleagues[31]
to be valid for explanation of chain degradation phenomenon during dissolution of polymer-fullerene composite samples and allow us to conclude that the sole origin of chain degrada-tion in entangled matrices is their hindered mobility owing to the interaction with fullerene.
Chain degradation during dissolution of polymer-fullerene nanocomposites 197
Chain degradation during swelling may be expected to occur in other compositesystems of matrix polymers and fillers. Considerable difference in hydrodynamic radiivalues of matrix polymer (Rh = 1170 nm) and of composite (Rh = 270 nm) has been foundby dynamic light scattering of respective solutions in studying of solvent mass uptakeand swelling dynamics of CdS-polyacrylamide (MPAA∼ 5·106 g/mol) composite ultrathinfilms.[33] The authors point out, as well, that during composite preparation nanoparticlesbind with the polymer so strongly that they cannot be separated from polymer chains bycentrifugation of the composite sol at 20,000 rpm. We believe that this experimental datadirectly indicate chain degradation, although the authors did not consider this possibility.
Mechanism of Chain Degradation
Characteristic consequences of chain degradation during dissolution of polymer-fullerenecomposites, namely, changes in the sizes of matrix polymer species and transformation of aconsiderable part of the polymer matrix into extremely small fragments (fractions II) withthe formation of covalent bonds between C60 and the polymer fragments, suggest scissionof numerous C-C bonds along the backbones of the polymer molecules.
Though conditions of the polymer C-C bond scission and subsequent chemical reac-tions should be subjects of investigation in each specific case, general characteristic featuresof this type of degradation process are known as well.[34] Scission of C-C bond results information of free radicals and is accompanied by a depolymerization reaction in whichmonomers are zipped off in rapid succession from the newly formed chain ends. The num-ber of monomers generated in the time needed for transformation of radicals into “dead”polymer chains corresponds to the polymer zip length. In solution or in bulk, chain scissionproceeds via a medium cage; therefore the degradation process may be reversed during thetime that is needed for radicals to diffuse out of cage. This time depends on local viscosityinside the cage and chain length. The cage effect furthers the termination reaction duringzipping because of recombination of radicals formed from the same or any other chain aswell as cross-linkage.
The major low-molecular weight degradation products of PS (zip length ∼ 3.3monomers[35]) owing to C-C bond scission are sterol, dimer, and trimer.[36] Upon C-Cbond scission PαMS tends to depolymerize completely.[34] The low-molecular weightdegradation products of PS-C60 and PαMS-C60 composites (fractions II) with covalentlybound C60 present (Table 4) are similar in sizes to dimers and trimers of sterol (Fig. 9).Since the presence of reactive monomer in solution seems to be improbable, the mostprobable species of fractions II are covalently bound structures such as monomer-fullerene,monomer-fullerene-monomer, and dimer-fullerene. The dimensions of the structures shalldiffer from these of dimer and trimer of sterol because of different effective radii of theC60 molecule and of sterol. The van der Waals radius of fullerene[1] is 5.09 Å, and theeffective radius of sterol is 3.28 Å (monomer dimensions calculated from the known valuesof valence bond length and valence angles are length 8.3 Å, width 6.0 Å, thickness 3.0 Å).Thus, composition of fractions II for both matrix polymers confirms that chain degradationduring composite dissolution is accompanied by depolymerization of the radicals formed.The ratios of fragments of dimeric and trimeric sizes in fractions II of PS-C60 and PαMS-C60 composites (Fig. 9, curves 1 and 2) demonstrate distinctly the zip length effect. Theimpact of polymer structure on c0p/capp, MRD, and Rhw for composites’ fractions I (Table3 and Fig. 8) can be attributed to the difference in zip lengths of the matrix polymers aswell.
198 E. V. Chubarova and E. Yu. Melenevskaya
During lyophilization, polymer chains form a spatial network with a loose (cotton-like)structure, which allows us to suppose that P of the weighed composite sample correlateswith its volume. Under solvent addition, the volume occupied by the sample will influencethe kinetics of sample swelling, as well as the diffusion of polymer chains and radicals,formed during chain ruptures, into the solvent. The effect of this volume reveals itselfin the dependence of the degradation degree of the polymer matrix (of c0p/capp) on P ofthe weighed sample discussed in detail above. Introduction of fullerenes in cross-linkedpolystyrenes has been shown to enhance thermal stability of the samples, as fullerenesinhibit radical depolymerization of PS.[37] In our case, the cage effect, combined with theinhibiting effect of C60, results in increased sizes of composite species with respect to thoseof matrix polymers (Table 3 and Fig. 8, curves 1 and 2), in the formation of star-shapedstructures (the inset in Fig. 4, curve 2; the inset in Fig. 8, curves 1 and 2) and, intrinsically,in the existence of the polymeric component itself (fraction I) in PαMS-C60 compositesolutions. The solvent effect on chain degradation may be explained by the cage effectas well. For example, during composite dissolution in THF conservation of molecularcomplex, on the one hand, provokes C-C bond scission but, on the other hand, impedesdiffusion of radicals from the medium cage. As a result, depolymerization of radicals israpidly inhibited by fullerene. During dissolution of the same composite in chloroform therate of complex dissociation is not high enough to prevent C-C bond scission, but complexdissociation facilitates diffusion of radicals from the medium cage promoting their furtherdepolymerization. This leads to lower Rhw values of composites dissolved in chloroformwith respect to these of the same composites dissolved in THF (Table 3).
Attention should be given to the following facts: Oxidative destruction is known toproceed faster in the folded parts of partly crystalline polymers than in their amorphousregions, which is attributed to the presence of stressed bonds since they possess additionalstrain energy.[34] In studying thermal degradation of various cross-linked polymer networksin vacuum, formation of nonequilibrium network structures under certain synthesis condi-tions has been concluded to result in the decrease of activation energy of degradation.[37,38]
Moreover, the initial degradation rate for filled polymer matrices, in comparison with thatfor those unfilled, has been found to increase as well. The results cited are consistent withour notion that formation of a nonequilibrium network in preparing polymer-C60 compositeresults in the decrease of activation energy of C-C bond scission during sample swelling.
The analysis done shows that chain degradation during swelling of PS-C60 and PαMS-C60 composite samples with entangled polymer matrices follows a radical depolymerizationmechanism.
May Chain Degradation Accompany Composite Reinforcement?
The experimental data obtained for polymer-fullerene composites show that tensile strainarising in a nanocomposite after routine addition of solvent can result in chain rupture, ifchains are entangled and polymer-filler interaction is present. This means that for the sameconditions, chain degradation would take place for polymer composite systems with anyfiller not only during swelling but also during deformation. On one hand, the phenomenonof chain degradation during swelling of polymer-fullerene composites clearly indicatesdeterioration of the mechanical properties of matrix polymers in the presence of fullerene;on the other hand, the repeatedly reported phenomenon of composite reinforcement isattributed mainly to the presence of fillers interacting with polymer. This implies thatboth phenomena have common origins, which allows us to assume that reinforcementmay be accompanied by polymer chain degradation. This idea is supported by the data[39]
Chain degradation during dissolution of polymer-fullerene nanocomposites 199
obtained for concentrated solutions of polystyrenes with very high molecular weightsduring rheological experiments. At the instant of the shear-induced phase transition, whichactually corresponds to precipitation of the polymer gel fraction with possible adhesion onthe surface of the rheometer cell, strong overshoot in transient stresses accompanied by chainruptures was recorded. The idea is furthermore confirmed by the data[40–44] obtained duringdetailed investigations of the impact of chain entanglement on the mechanical propertiesof unfilled polymer systems. The research has revealed the dual role of chain entanglementduring fracture of polymer samples as well. On the one hand, chain entanglement causesthe expenditure of energy during plastic deformation before polymer samples fracture toincrease; on the other hand, the fracture mechanism changes from chain pullout for sampleswith unentangled matrices to chain scission for samples with entangled matrices. Chainpullout can also become apparent at M > Mc, at elevated temperature, i.e., with increasedchain mobility.[40] For entangled matrices chains can be ruptured before any large-scaleplastic deformation of sample occurs.[43,44]
Reinforcement phenomenon for composites is commonly associated with the enhance-ment of such strength characteristics as dynamic moduli, Young’ modulus, and yield stressrelative to matrix polymers. For systems with various matrix polymers and fillers (silica par-ticles, carbon nanotubes, fullerenes) the above characteristics do, in general, improve.[45–48]
Meanwhile, for composites the decrease of such characteristics as tensile strength andelongation at break are recorded[46,48] simultaneously with the apparent reinforcement. Toachieve reinforcement without drop of elongation at break special methods are used,[49–51]
e.g., incorporation of supramolecular filler solely into the hard segments of the thermo-plastic elastomer via supramolecular interactions[49] or formation of a thick polymer layersurrounding the filler and covalently bound with it.[50] Analysis of the above publicationsshows that the problem remains unsolved for composites prepared by conventional mixingof polymer and filler. The schematic drawing of a fragment of PS entangled matrix attachedto C60 by means of a molecular complex (Scheme 1) demonstrates that polymer-fillerinteraction impeding free disentanglement of chains prevents loop-entangled chains frombeing elongated to their full lengths under tensile load. It is clear that under tensile strainof such a network the probability of chain scission will exceed that of the unfilled networkand will increase with increasing of polymer-filler interaction. This means that elonga-tion at break of composite samples will be below that of matrix polymer samples for anypolymer-filler interaction force and will decrease with increasing of filler content; the latteris confirmed experimentally.[46] This implies that the apparent reinforcement observed maybe accompanied by premature chain degradation.
The probable origin of polymer reinforcement effect in the presence of filler has beendiscussed in the literature for a long time. One can attempt to consider reinforcementeffects in accordance with the following statements: First, relaxation phenomena, the roleof which is dominant in manifestation of the set of the mechanical properties of polymers,are governed by chain mobility. Second, reinforcement phenomenon of filled polymersis a manifestation of the properties of polymer matrix only. The latter was confirmedexperimentally by Westermann and colleagues[52] for a model composite system. Theauthors found an affine correlation of the filler displacement with macroscopic samplestrain (using small-angle X-ray scattering) and presented direct microscopic proof of matrixchain overstrain in the presence of filler (using small-angle neuron scattering). That is whythe assumption that the origin of reinforcement is the transfer of stress from matrix to rigidfiller[46,50,53] seems to be unjustified.
Analyzing polymer reinforcement resulting from addition of fillers to matrix polymersin terms of molecular mobility, one can say that this phenomenon is quite predictable.
200 E. V. Chubarova and E. Yu. Melenevskaya
Fillers introduce great surface distributed in the volume of the polymer matrix. The in-teraction of chains with fillers’ surface impedes free movement of chains, which shouldincrease their average relaxation times. It is found experimentally[54] that chain mobilitynear a flat surface dramatically decreases within a distance of ∼3Rg of the chain, whilethe substrate effect has been observed at distances up to ∼5Rg. Theoretical treatment ofthe behavior of chains near flat surface predicts an increase in the density of the near-the-surface polymer layer and the presence of stretche local conformations of chains.[55] Thedirect experimental proof of influence of polymer-filler interaction on chain mobility wasobtained for poly(methyl acrylate)-clay nanocomposites.[56] The region of hindered chainmobility was shown to extend to ∼5–15 nm with the increase of interaction. Simulationof structure and dynamics of linear monodisperse polyethylene melts containing homoge-neously distributed spherical nanoparticles confirmed the slow-down of chain dynamicsin the presence of fillers.[57] It was found, as well, that the Rouse relaxation time of theentire chain increases when the distance between particles falls below ∼1.5Rg and whenthere is attractive monomer-filler interaction. Simulation of adsorption-desorption dynam-ics of linear chains on spherical nanoparticles revealed that strengthening of polymer-fillerinteraction retards chain desorption.[58] Relying on this analysis, it might be supposedthat relaxation times of polymer chains in the presence of fillers, as well as the strengthand viscous characteristics of composites, should increase with polymer Rg, polymer-fillerinterphase area, and polymer-filler interaction.
The approach in terms of chain mobility might seem to be sufficient to elucidatethe reinforcement phenomenon in composite systems. However, a series of publicationshave reported decreases in the values of moduli, viscosity, and relaxation times for somecomposite systems,[45,53,59–62] which directly indicates deterioration of their mechanicalproperties with respect to those of the matrix polymer and does not follow this logic. Theauthors of these publications have explained the obtained data in a different way, but thepossibility of chain degradation is not considered at all.
Tuteja and colleagues[45] compared the rheological properties of melts of matrixpolystyrenes with those of their composites containing nanoparticles of cross-linked PS.Studies were carried out for composites with either entangled (M > Mc) or unentangled(M < Mc) matrices. The most important points are as follows: Addition of nanoparticlesto PS matrix with M < Mc resulted in a rise of viscosity and moduli, as expected in termsof chain mobility. After addition of nanoparticles to PS matrix with M > Mc, a drop ofviscosity and plateau moduli (up to 80%) was observed. The drop increased with both therise of M and the decrease of the distance l between particles. For unentangled matrix thereduction of viscosity increase rate with the decrease of l was observed at l < Rg. Forthe entangled matrix with moderate M the abrupt transition from viscosity increase at l >
Rg to its decrease at l < Rg with the decrease of l was found. The authors explained theseresults partly by chains’ confinement. It is difficult to agree with such an explanation. First,strictly speaking, such a notion as “confined chain” relates to the one-dimensional case,namely, to the change in configuration of a single chain confined in a tube with D < RF
as diameter (RF is the Flory radius of a chain) in a good solvent in the absence of chaininteraction with the tube wall.[63,64] Second, the relaxation time of the confined chain isincreased by a factor of (RF/D)1/3 with respect to that of the free chain, which would resultin increase of both viscosity and moduli of the melt and not the reverse. For D ≥ RF thereare no changes in chain configuration and, correspondingly, in relaxation time as well;therefore viscosities and moduli of the melts should remain constant and not increase withl decreasing while l > Rg. The approach in terms of chain mobility readily elucidates the
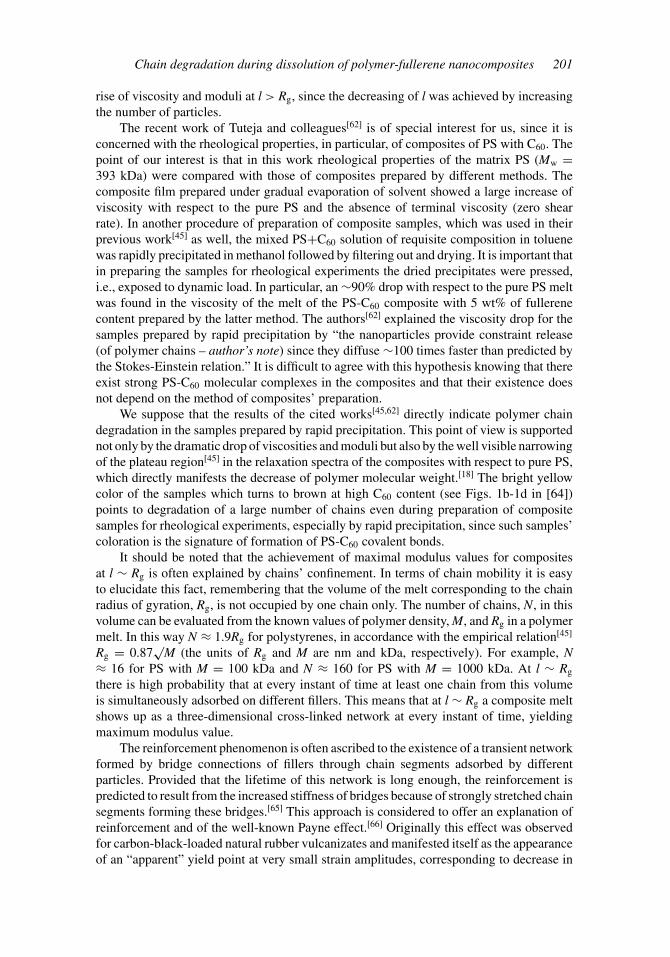
Chain degradation during dissolution of polymer-fullerene nanocomposites 201
rise of viscosity and moduli at l > Rg, since the decreasing of l was achieved by increasingthe number of particles.
The recent work of Tuteja and colleagues[62] is of special interest for us, since it isconcerned with the rheological properties, in particular, of composites of PS with C60. Thepoint of our interest is that in this work rheological properties of the matrix PS (Mw =393 kDa) were compared with those of composites prepared by different methods. Thecomposite film prepared under gradual evaporation of solvent showed a large increase ofviscosity with respect to the pure PS and the absence of terminal viscosity (zero shearrate). In another procedure of preparation of composite samples, which was used in theirprevious work[45] as well, the mixed PS+C60 solution of requisite composition in toluenewas rapidly precipitated in methanol followed by filtering out and drying. It is important thatin preparing the samples for rheological experiments the dried precipitates were pressed,i.e., exposed to dynamic load. In particular, an ∼90% drop with respect to the pure PS meltwas found in the viscosity of the melt of the PS-C60 composite with 5 wt% of fullerenecontent prepared by the latter method. The authors[62] explained the viscosity drop for thesamples prepared by rapid precipitation by “the nanoparticles provide constraint release(of polymer chains – author’s note) since they diffuse ∼100 times faster than predicted bythe Stokes-Einstein relation.” It is difficult to agree with this hypothesis knowing that thereexist strong PS-C60 molecular complexes in the composites and that their existence doesnot depend on the method of composites’ preparation.
We suppose that the results of the cited works[45,62] directly indicate polymer chaindegradation in the samples prepared by rapid precipitation. This point of view is supportednot only by the dramatic drop of viscosities and moduli but also by the well visible narrowingof the plateau region[45] in the relaxation spectra of the composites with respect to pure PS,which directly manifests the decrease of polymer molecular weight.[18] The bright yellowcolor of the samples which turns to brown at high C60 content (see Figs. 1b-1d in [64])points to degradation of a large number of chains even during preparation of compositesamples for rheological experiments, especially by rapid precipitation, since such samples’coloration is the signature of formation of PS-C60 covalent bonds.
It should be noted that the achievement of maximal modulus values for compositesat l ∼ Rg is often explained by chains’ confinement. In terms of chain mobility it is easyto elucidate this fact, remembering that the volume of the melt corresponding to the chainradius of gyration, Rg, is not occupied by one chain only. The number of chains, N, in thisvolume can be evaluated from the known values of polymer density, M, and Rg in a polymermelt. In this way N ≈ 1.9Rg for polystyrenes, in accordance with the empirical relation[45]
Rg = 0.87√
M (the units of Rg and M are nm and kDa, respectively). For example, N≈ 16 for PS with M = 100 kDa and N ≈ 160 for PS with M = 1000 kDa. At l ∼ Rg
there is high probability that at every instant of time at least one chain from this volumeis simultaneously adsorbed on different fillers. This means that at l ∼ Rg a composite meltshows up as a three-dimensional cross-linked network at every instant of time, yieldingmaximum modulus value.
The reinforcement phenomenon is often ascribed to the existence of a transient networkformed by bridge connections of fillers through chain segments adsorbed by differentparticles. Provided that the lifetime of this network is long enough, the reinforcement ispredicted to result from the increased stiffness of bridges because of strongly stretched chainsegments forming these bridges.[65] This approach is considered to offer an explanation ofreinforcement and of the well-known Payne effect.[66] Originally this effect was observedfor carbon-black-loaded natural rubber vulcanizates and manifested itself as the appearanceof an “apparent” yield point at very small strain amplitudes, corresponding to decrease in
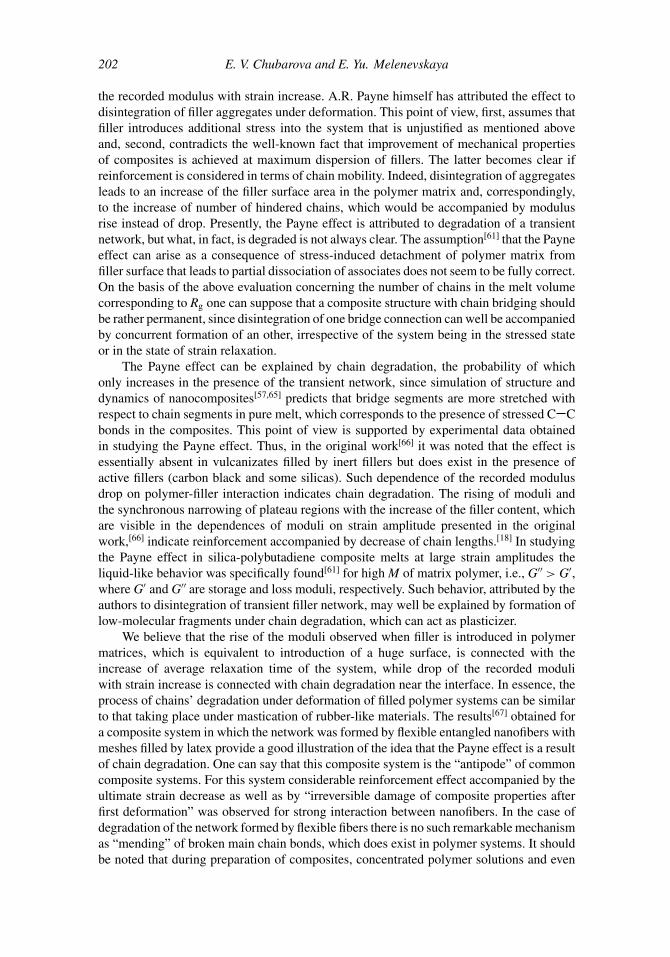
202 E. V. Chubarova and E. Yu. Melenevskaya
the recorded modulus with strain increase. A.R. Payne himself has attributed the effect todisintegration of filler aggregates under deformation. This point of view, first, assumes thatfiller introduces additional stress into the system that is unjustified as mentioned aboveand, second, contradicts the well-known fact that improvement of mechanical propertiesof composites is achieved at maximum dispersion of fillers. The latter becomes clear ifreinforcement is considered in terms of chain mobility. Indeed, disintegration of aggregatesleads to an increase of the filler surface area in the polymer matrix and, correspondingly,to the increase of number of hindered chains, which would be accompanied by modulusrise instead of drop. Presently, the Payne effect is attributed to degradation of a transientnetwork, but what, in fact, is degraded is not always clear. The assumption[61] that the Payneeffect can arise as a consequence of stress-induced detachment of polymer matrix fromfiller surface that leads to partial dissociation of associates does not seem to be fully correct.On the basis of the above evaluation concerning the number of chains in the melt volumecorresponding to Rg one can suppose that a composite structure with chain bridging shouldbe rather permanent, since disintegration of one bridge connection can well be accompaniedby concurrent formation of an other, irrespective of the system being in the stressed stateor in the state of strain relaxation.
The Payne effect can be explained by chain degradation, the probability of whichonly increases in the presence of the transient network, since simulation of structure anddynamics of nanocomposites[57,65] predicts that bridge segments are more stretched withrespect to chain segments in pure melt, which corresponds to the presence of stressed C Cbonds in the composites. This point of view is supported by experimental data obtainedin studying the Payne effect. Thus, in the original work[66] it was noted that the effect isessentially absent in vulcanizates filled by inert fillers but does exist in the presence ofactive fillers (carbon black and some silicas). Such dependence of the recorded modulusdrop on polymer-filler interaction indicates chain degradation. The rising of moduli andthe synchronous narrowing of plateau regions with the increase of the filler content, whichare visible in the dependences of moduli on strain amplitude presented in the originalwork,[66] indicate reinforcement accompanied by decrease of chain lengths.[18] In studyingthe Payne effect in silica-polybutadiene composite melts at large strain amplitudes theliquid-like behavior was specifically found[61] for high M of matrix polymer, i.e., G′′ > G′,where G′ and G′′ are storage and loss moduli, respectively. Such behavior, attributed by theauthors to disintegration of transient filler network, may well be explained by formation oflow-molecular fragments under chain degradation, which can act as plasticizer.
We believe that the rise of the moduli observed when filler is introduced in polymermatrices, which is equivalent to introduction of a huge surface, is connected with theincrease of average relaxation time of the system, while drop of the recorded moduliwith strain increase is connected with chain degradation near the interface. In essence, theprocess of chains’ degradation under deformation of filled polymer systems can be similarto that taking place under mastication of rubber-like materials. The results[67] obtained fora composite system in which the network was formed by flexible entangled nanofibers withmeshes filled by latex provide a good illustration of the idea that the Payne effect is a resultof chain degradation. One can say that this composite system is the “antipode” of commoncomposite systems. For this system considerable reinforcement effect accompanied by theultimate strain decrease as well as by “irreversible damage of composite properties afterfirst deformation” was observed for strong interaction between nanofibers. In the case ofdegradation of the network formed by flexible fibers there is no such remarkable mechanismas “mending” of broken main chain bonds, which does exist in polymer systems. It shouldbe noted that during preparation of composites, concentrated polymer solutions and even
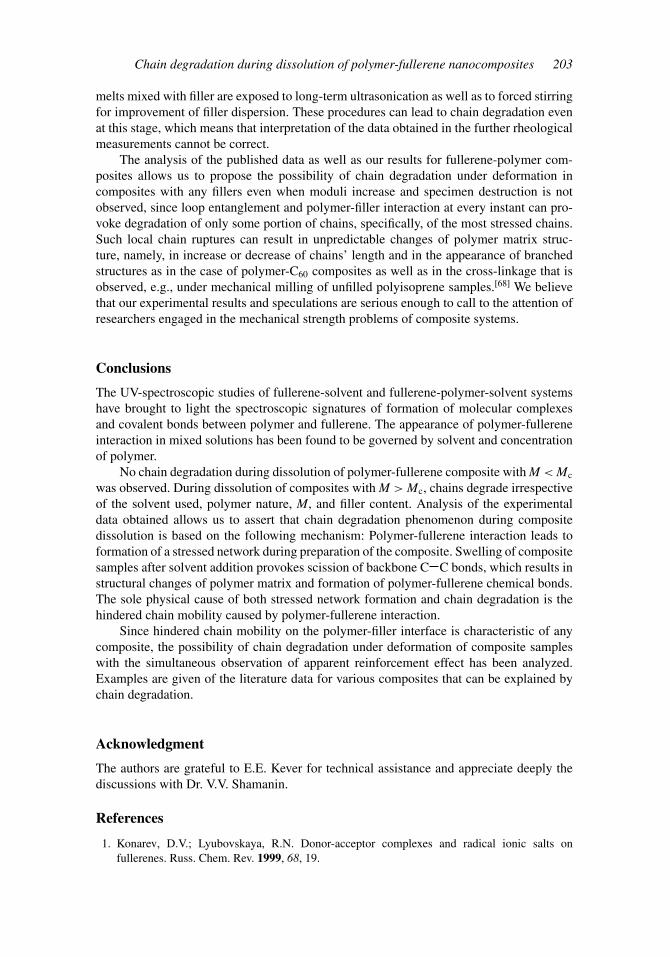
Chain degradation during dissolution of polymer-fullerene nanocomposites 203
melts mixed with filler are exposed to long-term ultrasonication as well as to forced stirringfor improvement of filler dispersion. These procedures can lead to chain degradation evenat this stage, which means that interpretation of the data obtained in the further rheologicalmeasurements cannot be correct.
The analysis of the published data as well as our results for fullerene-polymer com-posites allows us to propose the possibility of chain degradation under deformation incomposites with any fillers even when moduli increase and specimen destruction is notobserved, since loop entanglement and polymer-filler interaction at every instant can pro-voke degradation of only some portion of chains, specifically, of the most stressed chains.Such local chain ruptures can result in unpredictable changes of polymer matrix struc-ture, namely, in increase or decrease of chains’ length and in the appearance of branchedstructures as in the case of polymer-C60 composites as well as in the cross-linkage that isobserved, e.g., under mechanical milling of unfilled polyisoprene samples.[68] We believethat our experimental results and speculations are serious enough to call to the attention ofresearchers engaged in the mechanical strength problems of composite systems.
Conclusions
The UV-spectroscopic studies of fullerene-solvent and fullerene-polymer-solvent systemshave brought to light the spectroscopic signatures of formation of molecular complexesand covalent bonds between polymer and fullerene. The appearance of polymer-fullereneinteraction in mixed solutions has been found to be governed by solvent and concentrationof polymer.
No chain degradation during dissolution of polymer-fullerene composite with M < Mc
was observed. During dissolution of composites with M > Mc, chains degrade irrespectiveof the solvent used, polymer nature, M, and filler content. Analysis of the experimentaldata obtained allows us to assert that chain degradation phenomenon during compositedissolution is based on the following mechanism: Polymer-fullerene interaction leads toformation of a stressed network during preparation of the composite. Swelling of compositesamples after solvent addition provokes scission of backbone C C bonds, which results instructural changes of polymer matrix and formation of polymer-fullerene chemical bonds.The sole physical cause of both stressed network formation and chain degradation is thehindered chain mobility caused by polymer-fullerene interaction.
Since hindered chain mobility on the polymer-filler interface is characteristic of anycomposite, the possibility of chain degradation under deformation of composite sampleswith the simultaneous observation of apparent reinforcement effect has been analyzed.Examples are given of the literature data for various composites that can be explained bychain degradation.
Acknowledgment
The authors are grateful to E.E. Kever for technical assistance and appreciate deeply thediscussions with Dr. V.V. Shamanin.
References
1. Konarev, D.V.; Lyubovskaya, R.N. Donor-acceptor complexes and radical ionic salts onfullerenes. Russ. Chem. Rev. 1999, 68, 19.
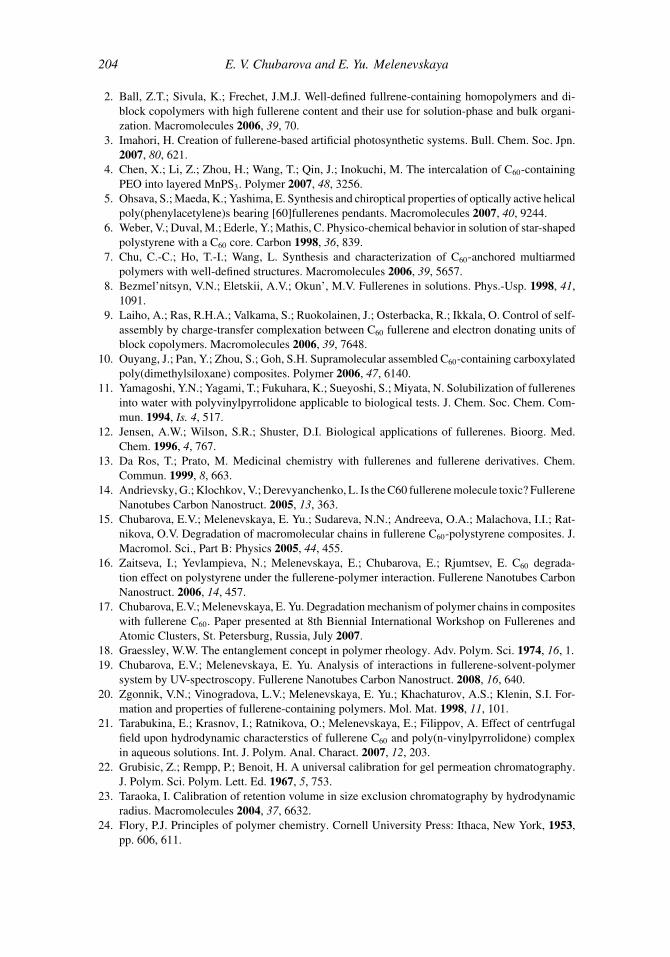
204 E. V. Chubarova and E. Yu. Melenevskaya
2. Ball, Z.T.; Sivula, K.; Frechet, J.M.J. Well-defined fullrene-containing homopolymers and di-block copolymers with high fullerene content and their use for solution-phase and bulk organi-zation. Macromolecules 2006, 39, 70.
3. Imahori, H. Creation of fullerene-based artificial photosynthetic systems. Bull. Chem. Soc. Jpn.2007, 80, 621.
4. Chen, X.; Li, Z.; Zhou, H.; Wang, T.; Qin, J.; Inokuchi, M. The intercalation of C60-containingPEO into layered MnPS3. Polymer 2007, 48, 3256.
5. Ohsava, S.; Maeda, K.; Yashima, E. Synthesis and chiroptical properties of optically active helicalpoly(phenylacetylene)s bearing [60]fullerenes pendants. Macromolecules 2007, 40, 9244.
6. Weber, V.; Duval, M.; Ederle, Y.; Mathis, C. Physico-chemical behavior in solution of star-shapedpolystyrene with a C60 core. Carbon 1998, 36, 839.
7. Chu, C.-C.; Ho, T.-I.; Wang, L. Synthesis and characterization of C60-anchored multiarmedpolymers with well-defined structures. Macromolecules 2006, 39, 5657.
8. Bezmel’nitsyn, V.N.; Eletskii, A.V.; Okun’, M.V. Fullerenes in solutions. Phys.-Usp. 1998, 41,1091.
9. Laiho, A.; Ras, R.H.A.; Valkama, S.; Ruokolainen, J.; Osterbacka, R.; Ikkala, O. Control of self-assembly by charge-transfer complexation between C60 fullerene and electron donating units ofblock copolymers. Macromolecules 2006, 39, 7648.
10. Ouyang, J.; Pan, Y.; Zhou, S.; Goh, S.H. Supramolecular assembled C60-containing carboxylatedpoly(dimethylsiloxane) composites. Polymer 2006, 47, 6140.
11. Yamagoshi, Y.N.; Yagami, T.; Fukuhara, K.; Sueyoshi, S.; Miyata, N. Solubilization of fullerenesinto water with polyvinylpyrrolidone applicable to biological tests. J. Chem. Soc. Chem. Com-mun. 1994, Is. 4, 517.
12. Jensen, A.W.; Wilson, S.R.; Shuster, D.I. Biological applications of fullerenes. Bioorg. Med.Chem. 1996, 4, 767.
13. Da Ros, T.; Prato, M. Medicinal chemistry with fullerenes and fullerene derivatives. Chem.Commun. 1999, 8, 663.
14. Andrievsky, G.; Klochkov, V.; Derevyanchenko, L. Is the C60 fullerene molecule toxic? FullereneNanotubes Carbon Nanostruct. 2005, 13, 363.
15. Chubarova, E.V.; Melenevskaya, E. Yu.; Sudareva, N.N.; Andreeva, O.A.; Malachova, I.I.; Rat-nikova, O.V. Degradation of macromolecular chains in fullerene C60-polystyrene composites. J.Macromol. Sci., Part B: Physics 2005, 44, 455.
16. Zaitseva, I.; Yevlampieva, N.; Melenevskaya, E.; Chubarova, E.; Rjumtsev, E. C60 degrada-tion effect on polystyrene under the fullerene-polymer interaction. Fullerene Nanotubes CarbonNanostruct. 2006, 14, 457.
17. Chubarova, E.V.; Melenevskaya, E. Yu. Degradation mechanism of polymer chains in compositeswith fullerene C60. Paper presented at 8th Biennial International Workshop on Fullerenes andAtomic Clusters, St. Petersburg, Russia, July 2007.
18. Graessley, W.W. The entanglement concept in polymer rheology. Adv. Polym. Sci. 1974, 16, 1.19. Chubarova, E.V.; Melenevskaya, E. Yu. Analysis of interactions in fullerene-solvent-polymer
system by UV-spectroscopy. Fullerene Nanotubes Carbon Nanostruct. 2008, 16, 640.20. Zgonnik, V.N.; Vinogradova, L.V.; Melenevskaya, E. Yu.; Khachaturov, A.S.; Klenin, S.I. For-
mation and properties of fullerene-containing polymers. Mol. Mat. 1998, 11, 101.21. Tarabukina, E.; Krasnov, I.; Ratnikova, O.; Melenevskaya, E.; Filippov, A. Effect of centrfugal
field upon hydrodynamic characterstics of fullerene C60 and poly(n-vinylpyrrolidone) complexin aqueous solutions. Int. J. Polym. Anal. Charact. 2007, 12, 203.
22. Grubisic, Z.; Rempp, P.; Benoit, H. A universal calibration for gel permeation chromatography.J. Polym. Sci. Polym. Lett. Ed. 1967, 5, 753.
23. Taraoka, I. Calibration of retention volume in size exclusion chromatography by hydrodynamicradius. Macromolecules 2004, 37, 6632.
24. Flory, P.J. Principles of polymer chemistry. Cornell University Press: Ithaca, New York, 1953,pp. 606, 611.
Chain degradation during dissolution of polymer-fullerene nanocomposites 205
25. Andrievsky, G.V.; Klochkov, V.K.; Bordyuh, A.B.; Dovleshko, G.I. Comparative analysis of twoaqueous-colloidal solutions of C60 fullerene with help FTIR reflectance and UV-Vis spectroscopy.Chem. Phys. Let. 2002, 364, 8.
26. Catalan, J. On the solvatochromism of C60 and its color in solution. New J. Chem. 1995, 19,1233.
27. Konarev, D.V.; Semkin, V.N.; Lyubovskaya, R.N.; Graja, A. Electronic absorption of the C60
complexes with some organic donors. Syn. Met. 1997, 88, 225.28. Yu-H, C.; Khairullin, I.I.; Suen, M.-P. Electron spin resonance and infrared spectroscopy study
of polyvinylpyrrolidone-C60 composite. Fullerene Sci. Technol. 1999, 7, 807.29. Frenkel, Ya. Orientation and rupture of linear macromolecules in dilute solutions under the
influence of viscous flow. Acta Physicochim. URSS 1944, 19, 51.30. Hooper, J.B.; Schweizer, K.S. Theory of phase separation in polymer nanocomposites. Macro-
molecules 2006, 39, 5133.31. Alfrey, T.; Gurnee, E.F.; Lloyd, W.G. Diffusion in glassy polymers. J. Polym. Sci. Part C
(Published Polymer Symposium) 1966, No. 12, 249.32. Polotskaya, G.A.; Gladchenko, S.V.; Zgonnik, V.N. Gas diffusion and dielectric studies of
polystyrene-fullerene compositions. J. Appl. Polym. Sci. 2002, 85, 2946.33. Singh, A.; Mukherjee, M. Effect of polymer-particle interaction in swelling dynamics of ultrathin
nanocomposite films. Macromolecules 2005, 38, 8795.34. Jellinek, H.H.G. Degradation and depolymerization kinetics. In: Aspects of degradation and sta-
bilization of polymers (ed. Jellinek, H.H.G.). Amsterdam, Oxford, New York: Elsevier Scientific,1978, pp. 1–38.
35. Cameron, G.G.; McWalter, T. On transfer reactions during vacuum pyrolysis of polystyrene. Eur.Polym. J. 1970, 6, 1601.
36. Kruse, T.M.; Woo, O.S.; Wong, H.-W.; Khan, S.S.; Broadbelt, L.J. Mechanistic modeling ofpolymer degradation: a comprehensive study of polystyrene. Macromolecules 2002, 35, 7830.
37. Volkova, N.N.; Summanen, E.V.; Smirnov, L.P. Polym. Sci., Thermal degredation of hyper-crosslinked polystyrenes. Ser. A 2003, 45, 986.
38. Smirnov, L.P.; Volkova, N.N. Kinetic regularities of polymer network thermal degradation. Prog.Colloid Polym. Sci. 1992, 90, 222.
39. Takahashi, Y.; Ochiai, N.; Yanagida, M.; Kitade, S.; Noda, I. Chain degradation in rheologicalmeasurements and effects of molecular weight distributions on rheological data for polymersolutions undergoing flow-induced phase separation. Polymer 1998, 39, 4313.
40. Willett, J.L.; O’Connor, K.M.; Wool, R.P. The role of chain scission in fracture of amorphouspolymers. J. Polym. Sci.: Polym. Phys. 1986, 24, 2583.
41. Cole, P.J.; Cook, R.F.; Macosko, C.W. Adhesion between immisible polymers correlated withinterfacial entanglements. Macromolecules 2003, 36, 2808.
42. Karger-Kocsis, J.; Moskala, E.J. Molecular dependence of essential and non- essential work offracture of amorphous films of poly(ethylene-2,6-naphthalate) (PEN). Polymer 2000, 41, 6301.
43. Dai, C.-A.; Kramer, E.J.; Washiyama, J.; Hui, C.-Y. Fracture toughness of polymer interfacereinforced with diblock copolymer: effect of homopolymer molecular weight. Macromolecules1996, 29, 7536.
44. Dai, C.-A.; Jandt, K.D.; Iyengar, D.R.; Slack, N.L.; Dai, K.H.; Davidson, W.B.; Kramer, E.J.Strengthening polymer interfaces with triblock copolymers. Macromolecules 1997, 30, 549.
45. Tuteja, A.; Mackay, M.E.; Hawker, C.J.; Van Horn, B. Effect of ideal, organic nanoparticles onthe flow properties of linear polymers: non-Einstein-like behavior. Macromolecules 2005, 38,8000.
46. Chen, X.; Burger, C.; Fang, D.; Sics, I.; Wang, X.; He, W.; Somani, R.H.; Yoon, K.; Hsiao,B.S.; Chu, B. In-situ X-ray deformation study of fluorinated multiwalled carbon nanotubes andfluorinated ethylene-propylene nanocomposite fiber. Macromolecules 2006, 39, 5427.
47. Coleman, J.N.; Cadek, M.; Ryan, K.P.; Fonseca, A.; Nagy, J.B.; Blau, W.J.; Ferreira, M.S.Reinforcement of polymers with carbon nanotubes. The order of an ordered polymer interfacialregion. Experiment and modeling. Polymer 2006, 47, 8556.
206 E. V. Chubarova and E. Yu. Melenevskaya
48. Hernandes, J.J.; Grarcıa-Gutierres, M.C.; Nogales, A.; Rueda, D.R.; Sanz, A.; Sics, I.; Hsiao,B.S.; Roslaniec, Z.; Broza, G.; Ezquerra, T.A. Deformation behavior during cold drawing ofnanocomposites based on single wall nanotubes and poly(ether ester) copolymers. Polymer2007, 48, 3286.
49. Wisse, E.; Govaert, L.E.; Meijer, H.E.H.; Meijer, E.W. Unusual tuning of mechanical propertiesof thermoplastic elastomers using supramolecular fillers. Macromolecules 2006, 39, 7425.
50. Xie, L.; Xu, F.; Qiu, F.; Li, H.; Yang, Y. Single-walled carbon nanotubes functionalized withhigh bonding density of polymer layers and enhanced mechanical properties of composites.Macromolecules 2007, 40, 3296.
51. Wang, M.; Pramoda, K.P.; Goh, S.H. Reinforcing and toughening of poly(vinyl chloride) withdouble-C60-end-capped poly(n-butyl methacrylate). Macromolecules 2006, 39, 4932.
52. Westermann, S.; Kreitschmann, M.; Pyckhout-Hintzen, W.; Richter, D.; Straube, E.; Farado,B.; Goerigk, G. Matrix chain deformation in reinforced networks: a SANS approach. Macro-molecules 1999, 32, 5793.
53. Ciprari, D.; Jacob, K.; Tannenbaum, R. Characterization of polymer nanocomposite interphaseand its impact on mechanical properties. Macromolecules 2006, 39, 6565.
54. Lin, E.K.; Kolb, R.; Satija, S.K.; Wu, W.-L. Reduced polymer mobility near the polymer/solidinterface as measured by neutron reflectivity. Macromolecules 1999, 32, 3753.
55. Jang, J.H.; Mattice, W.L. The effect of solid wall interaction on an amorphous polyethylene thinfilm, using a Monte Carlo simulation on a high coordination lattice. Polymer 1999, 40, 4685.
56. Miva, Y.; Drews, A.R.; Schlick, S. Detection of the direct effect of clay on polymer dynamics:the case of spin-labeled poly(methyl acrilate)/clay nanocomposites studied by ESP, XRD, andDSC. Macromolecules 2006, 39, 3304.
57. Dionne, P.J.; Ozisik, R.; Picu, C.R. Structure and dynamics of polyethylene nanocomposites.Macromolecules 2005, 38, 9351.
58. Dionne, P.J.; Picu, C.R.; Ozisik, R. Adsorption and desorption dynamics of linear polymer chainsto spherical nanoparticles: a Monte Carlo investigation. Macromolecules 2006, 39, 3089.
59. Loizou, E.; Butler, P.; Schmidt, G. Dynamic responses in nanocomposite hydrogels. Macro-molecules 2006, 39, 1614.
60. Mijovic, J.; Lee, H.; Kenny, J.; Mays, J. Dynamics in polymer-silicate nanocomposites as studiedby dielectric relaxation spectroscopy and dynamic mechanical spectroscopy. Macromolecules2006, 39, 2172.
61. Zhu, Z.; Thompson, T.; Wang, S.-Q.; von Meerwall, E.D.; Halasa, A. Investigating linear andnonlinear viscoelastic behavior using model silica-particle-filled polybutadiene. Macromolecules2005, 38, 8816.
62. Tuteja, A.; Duxbury, P.M.; Mackay, M.E. Multifunctional nanocomposites with reduced viscos-ity. Macromolecules 2007, 40, 9427.
63. Brochard, F.; de Gennes, P.G. Dynamics of confined polymer chains. J. Chem. Phys. 1977, 67,52.
64. Daoudi, S.; Brochard, F. Flows of flexible polymer solutions in pores. Macromolecules 1978, 11,751.
65. Ozmusul, M.S.; Picu, C.R.; Sternstein, S.S.; Kumar, S.K. Lattice Monte Carlo simulations ofchain conformation in polymer nanocomposites. Macromolecules 2005, 38, 4495.
66. Payne, A.R. The dynamic properties of carbon black-loaded natural rubber vulcanizates. J. Appl.Polym. Sci. 1962, 6, 57.
67. Dalmas, F.; Chazeau, L.; Gauthier, C.; Cavaille, J.-Y.; Dendievel, R. Large deformation mechan-ical behavior of flexible nanofiber filled polymer nanocomposites. Polymer 2006, 47, 2802.
68. Smith, A.P.; Shay, J.S.; Spontak, R.J.; Balik, C.M.; Ade, H.; Smith, S.D.; Koch, C.C. High-energy mechanical milling of poly(methyl methacrylate), polyisoprene and poly(ethylene-alt-propylene). Polymer 2000, 41, 6271.
Related Documents