12 diet colas 5 cans of lemonade 3 cans of root beer 20 TOTAL (a) PROBABILITY OF NEXT DRINK TO BE diet colas 60% cans of lemonade 25% cans of root beer 15% (b) Relative Frequency Definition of Probability

Welcome message from author
This document is posted to help you gain knowledge. Please leave a comment to let me know what you think about it! Share it to your friends and learn new things together.
Transcript

12 diet colas
5 cans of lemonade
3 cans of root beer
20 TOTAL
(a) PROBABILITY OF NEXT DRINK TO BE
diet colas 60%
cans of lemonade 25%
cans of root beer 15%
(b) Relative Frequency Definition of Probability

(a) (b)
Card 1 Card 2 SUM Value Frequency
1 1 2 2 1 Probability of the sum being 5
2 1 3 3 1
3 1 4 4 2
4 1 5 5 2
5 1 6 6 3 (c )
6 1 7 7 3
7 1 8 8 4 Probability of the sum being 2
8 1 9 9 4
9 1 10 10 5
10 1 11 11 5
2 2 4 12 5
3 2 5 13 4
4 2 6 14 4
5 2 7 15 3
6 2 8 16 3
7 2 9 17 2
8 2 10 18 2
9 2 11 19 1
10 2 12 20 1
3 3 6 TOTAL 55
4 3 7
5 3 8
6 3 9
7 3 10
8 3 11
9 3 12
10 3 13
4 4 8
5 4 9
6 4 10
7 4 11
8 4 12
9 4 13
10 4 14
5 5 10
6 5 11
7 5 12
8 5 13
9 5 14
10 5 15
6 6 12
7 6 13
8 6 14
9 6 15
10 6 16
SAMPLE SPACE
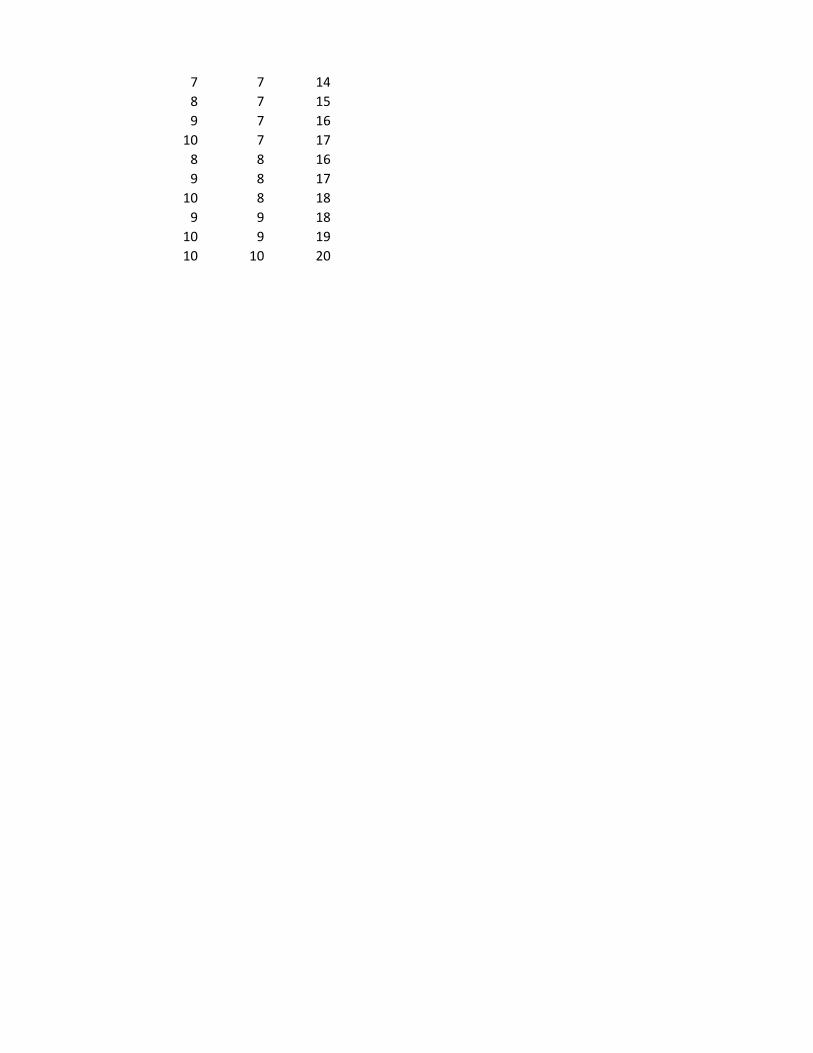
7 7 14
8 7 15
9 7 16
10 7 17
8 8 16
9 8 17
10 8 18
9 9 18
10 9 19
10 10 20

Probability of the sum being 5 3.64%
Probability of the sum being 2 1.82%

T T T 0.125
T T H 0.125
T H T 0.125
T H H 0.125
H T T 0.125
H T H 0.125
H H T 0.125
H H H 0.125
Sample Space
Pro
bab
ilities of e
ach o
utco
me

M Monster
RB Red Bull
RS Rockstar
(a) (b) Probability that RB will be the first choice
M RB RS
M RS RB
RB M RS
RB RS M (c ) Probability that two (independent) respondents will choose RB as their first
RS M RB
RS RB M
SAMPLE SPACE

=2/6
0.333333
Probability that two (independent) respondents will choose RB as their first
=2/6 * 2/6
0.111111

A Total card value is 5 or less
A^C Total card value is 6 or more
P(A) = 10.91%
P(B) = 89.09%

(a) A: exactly two heads P(A) = 3/8 0.375
(b) B: at most 1 heads P(B) = 4/8 0.5
(c ) C: at least 2 heads P(C ) = 4/8 0.5
(d) A and B are mutually exclusive
P(A or B) = 3/8 + 4/8 0.875
(e) A and C are not mutually exclusive.
P(A or C) = 3/8 + 4/8 - 3/8 0.5

(a) Event Name Description Probability
C1 Column 1 number 31.58%
C2 Column 2 number 31.58%
C3 Column 3 number 31.58%
O Odd Number 47.37%
E Even Number 47.37% Does not consider 0 or 00 even numbers
G Green Number 5.26%
F12 First 12 numbers 31.58%
S12 Second 12 numbers 31.58%
T12 Third 12 numbers 31.58%
(b) G or O 52.63%
O or F12 63.16% O and F12 15.79%
C1 or C3 63.16%
E and F12 15.79%
E or F12 63.16%
S12 and T12 63.16%
O or C2 63.16% O and C2 15.79%

Over the past 6 months
25 early
150 on time
45 late
30 cancelled
250 TOTAL
(a)
10% early
60% on time
18% late
12% cancelled
(b) The events are mutually exclusive
(c ) P(early or on time) 70%
PROBABILITIES

Of 100 graduates
50 only mutual funds
35 only stocks
15 both
(a) P(Own a mutual fund) 65%
P(Own a stock) 50%
(b) P(Neither stocks nor mutual funds) 0
(c ) P(Either stocks or mutual funds) 100

Census Education Data
Not a High
School Grad
High School
Graduate
Some College
No Degree
Associate's
Degree
Bachelor's
Degree
Total Persons 29,620,292 58,207,318 29,620,292 12,915,825 28,242,604
Age
25-34 4,683,126 12,553,926 7,792,092 3,423,798 8,382,402
35-44 5,335,440 15,117,080 8,136,546 4,134,966 8,136,546
45-54 4,427,540 10,932,618 6,062,324 2,894,930 5,960,150
55-64 4,562,275 8,301,115 3,338,250 1,157,260 2,893,150
65-74 5,165,297 6,505,772 2,466,474 768,539 1,787,300
75 and older 5,399,420 4,717,388 1,847,170 454,688 1,150,929
Gender
Male 14,168,672 26,607,448 14,086,296 5,683,944 14,086,296
Female 15,361,785 31,621,920 15,541,455 7,186,800 14,193,930
Race
White 23,647,714 49,181,442 24,953,416 11,171,006 24,373,104
Black 4,650,240 6,975,360 3,700,816 1,201,312 1,995,728
Other 1,279,740 1,977,780 1,047,060 550,676 1,915,732
Marital Status
Never Married 4,120,320 7,777,104 4,789,872 1,828,392 5,124,648
Married, spouse present 15,516,160 36,382,720 18,084,352 8,346,624 19,154,432
Married, spouse absent 1,847,880 2,368,024 1,184,012 465,392 670,712
Separated 1,188,090 1,667,010 842,715 336,165 405,240
Widowed 5,145,683 4,670,488 1,765,010 556,657 977,544
Divorced 2,968,680 7,003,040 3,806,000 1,674,640 2,340,690
Civilian Labor Force
Employed 11,668,755 36,228,706 20,448,104 9,890,659 22,115,069
Unemployed 1,057,310 1,783,636 809,072 317,193 455,103
Not in Labor Force 16,858,244 20,040,098 8,205,834 2,623,634 5,582,200

Advanced
Degree TOTAL
Not a High
School Grad
High School
Graduate
Some College
No Degree
Associate's
Degree
13,604,669 172,211,000 a) 10.49% 32.57% 18.38% 8.89%
2,439,948 b) A: has at least Associate's Degree
3,556,960 B: is at least a high school graduate
3,848,554
2,047,460 P(A) = 31.80%
1,179,618
625,196 P(B) = 82.80%
7,743,344 They are not mutually exclusive, since B includes A.
5,929,110
P(A or B) = P(B) = 82.80%
11,751,318
852,544
992,768
2,137,416
9,523,712
301,136
165,780
475,195
1,217,920
10,890,838 111,242,131
170,089
2,511,990
PROBABILITIES

Bachelor's
Degree
Advanced
Degree
19.88% 9.79%
PROBABILITIES
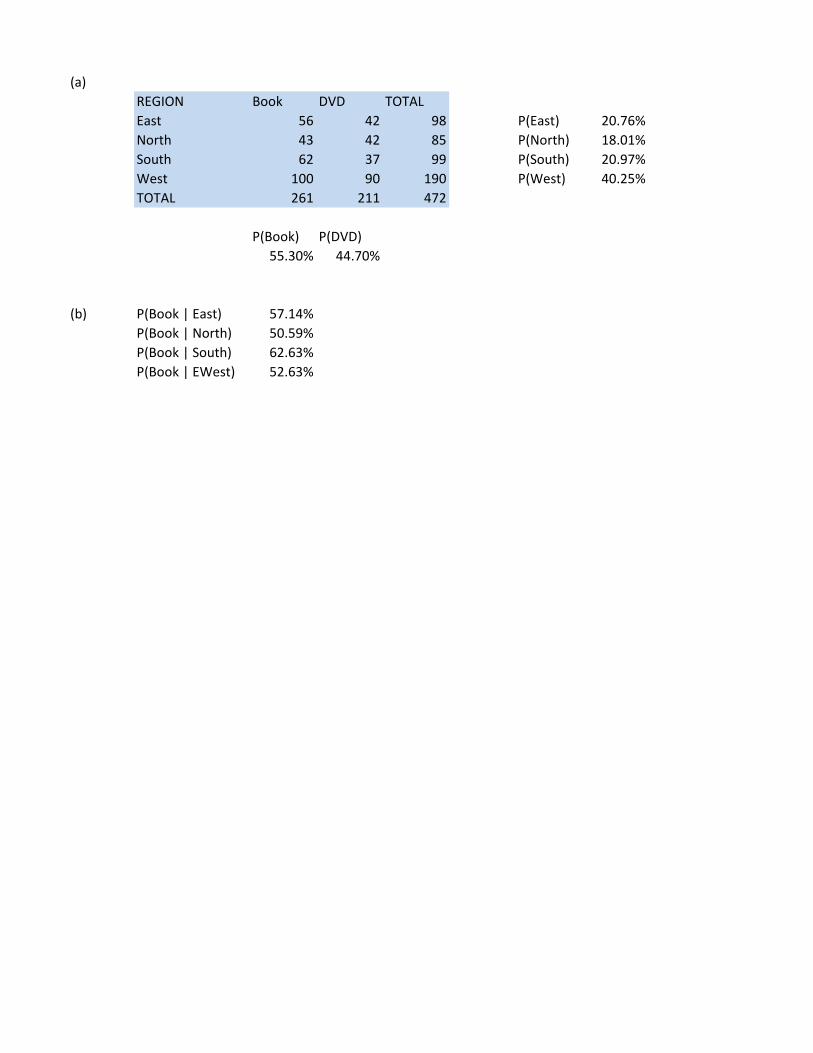
(a)
REGION Book DVD TOTAL
East 56 42 98 P(East) 20.76%
North 43 42 85 P(North) 18.01%
South 62 37 99 P(South) 20.97%
West 100 90 190 P(West) 40.25%
TOTAL 261 211 472
P(Book) P(DVD)
55.30% 44.70%
(b) P(Book | East) 57.14%
P(Book | North) 50.59%
P(Book | South) 62.63%
P(Book | EWest) 52.63%

a) P(unemployed and advanced degree)= 0.10%
b) P(unemployed advanced degree)= 0.10%
c) P(not a high school grad unemployed) = 0.61%
d) They are not independent, knowing the existence of one will affect the probability of the other.

Consumer Transportation Survey
Vehicle
Driven
Type Satisfacti
on with
vehicle
Gender
Truck Domestic Yes Male Count of Type Column Labels
Truck Domestic Yes Male Row Labels Car Mini Van
Truck Foreign No Male Female 16 8
Truck Domestic No Male Male 6 1
SUV Domestic Yes Male Grand Total 22 9
SUV Foreign Yes Male
SUV Domestic Yes Male
SUV Foreign Yes Male
SUV Domestic Yes Male a) 42%
SUV Domestic Yes Male
SUV Foreign Yes Male b) 18%
SUV Domestic Yes Male
SUV Foreign No Female c) 2%
SUV Foreign Yes Female
SUV Foreign Yes Female d) 10%
SUV Domestic Yes Male
SUV Domestic No Female e) 27%
SUV Domestic No Female
SUV Domestic Yes Male f) 17%
Mini Van Domestic Yes Female
Mini Van Domestic No Female g) They are not independent. Men are more likely to drive SUVs. Women do not drive Trucks.
Mini Van Domestic Yes Female
Mini Van Foreign Yes Female
Mini Van Foreign Yes Female
Mini Van Domestic No Male
Mini Van Domestic Yes Female
Mini Van Foreign Yes Female
Mini Van Foreign Yes Female
Car Domestic Yes Female
Car Domestic No Female
Car Domestic Yes Female
Car Foreign Yes Male
Car Domestic No Male
Car Domestic Yes Female
Car Domestic Yes Female
Car Domestic No Male
Car Domestic No Male
Car Foreign No Female
Car Foreign Yes Female
Car Domestic No Female
Car Domestic Yes Female
Car Foreign Yes Female

Car Foreign Yes Male
Car Foreign Yes Male
Car Domestic Yes Female
Car Foreign Yes Female
Car Foreign Yes Female
Car Domestic No Female
Car Domestic Yes Female
Car Foreign No Female

SUV Truck Grand Total
5 29
10 4 21
15 4 50
g) They are not independent. Men are more likely to drive SUVs. Women do not drive Trucks.

TP: Test shows pregnancy
NTP: Test does not show pregnancy
WP: Woman pregnant
NWP: Woman not pregnant
P(TP given NWP)= 0.02
P(NTP given WP)= 0.03
P(WP) = 0.70
P(WP given NTP) = P( WP and NTP) / P(NTP)
= [ P(NPT given WP) * P(WP) ] / P(NTP)
P(NTP) = P(NTP given WP) * P(WP) + P(NTP given NWP) *P(NWP)
0.03 * 0.70 + 0.98 * 0.30
31.50%
P(WP given NTP) = [ 0.03 * 0.70 ] / 0.315
6.67%
NOTE: THIS PROBLEM REQUIRES CONCEPTS OF BAYES'S THEOREM IN CHAPTER 18. IT WILL BE MODIFIED IN THE NEXT EDITION TO BETTER FIT THIS CHAPTER.

NOTE: THIS PROBLEM REQUIRES CONCEPTS OF BAYES'S THEOREM IN CHAPTER 18. IT WILL BE MODIFIED IN THE NEXT EDITION TO BETTER FIT THIS CHAPTER.

Drawing two 10s = 4 /40 * 3/39
0.77%
Drawing three 10s = 4 /40 * 3/39 * 2/38
0.04%

Two greens in a row = 2/38 * 2/38
0.28%
Two blacks in a row =18/38 * 18/38
22.44%

1
2
3
4
5
6
7
8
9
10
11
12
13
A B C D E G
e.g., P(S and F) = P(S given F)P(F)
P( Successful given Favorable) 48% P(Successful product and favorable test market)
P( Successful given Unfavorable) 12% P(Successful product and unfavorable test market)
P( Unsuccessful given Unfavorable) 28% P(Unuccessful product and favorable test market)
P( Unsuccessful given Favorable) 12% P(Unsuccessful product and unfavorable test market)
F: favorable 60%
UF: unfavorable 40%
S: successful 60%
US: unsuccessful 40%

1
2
3
4
5
6
7
8
9
10
11
12
13
H
28.8%
4.8%
7.2%
11.2%

Return Probability
-20% 0.10
0% 0.20
15% 0.40
30% 0.30
Expected Value 13%

Demand, x Probability, f(x) (x - Expected Value)^2
0 0.1 2.89
1 0.3 0.49
2 0.4 0.09
3 0.2 1.69
1.7 0.81
Expected Value Variance

0.90
Std Dev

7.84% 7.84% 7.84% 7.84% 7.84% 7.84% 7.84%
2 3 4 5 6 7 8
7.69% 2 0.45% 0.60% 0.60% 0.60% 0.60% 0.60% 0.60%
7.69% 3 0.60% 0.45% 0.60% 0.60% 0.60% 0.60% 0.60%
7.69% 4 0.60% 0.60% 0.45% 0.60% 0.60% 0.60% 0.60%
7.69% 5 0.60% 0.60% 0.60% 0.45% 0.60% 0.60% 0.60%
7.69% 6 0.60% 0.60% 0.60% 0.60% 0.45% 0.60% 0.60%
7.69% 7 0.60% 0.60% 0.60% 0.60% 0.60% 0.45% 0.60%
7.69% 8 0.60% 0.60% 0.60% 0.60% 0.60% 0.60% 0.45%
7.69% 9 0.60% 0.60% 0.60% 0.60% 0.60% 0.60% 0.60%
30.77% 10 2.41% 2.41% 2.41% 2.41% 2.41% 2.41% 2.41%
7.69% 11 0.60% 0.60% 0.60% 0.60% 0.60% 0.60% 0.60%
2 3 4 5 6 7 8
2 4 5 6 7 8 9 10
3 5 6 7 8 9 10 11
4 6 7 8 9 10 11 12
5 7 8 9 10 11 12 13
6 8 9 10 11 12 13 14
7 9 10 11 12 13 14 15
8 10 11 12 13 14 15 16
9 11 12 13 14 15 16 17
10 12 13 14 15 16 17 18
11 13 14 15 16 17 18 19

7.84% 31.37% 7.84% 2-CARD VALUE PROBABILITY Cumulative
9 10 11 4 0.45% 0.45%
0.60% 2.41% 0.60% 5 1.21% 1.66%
0.60% 2.41% 0.60% 6 1.66% 3.32%
0.60% 2.41% 0.60% 7 2.41% 5.73%
0.60% 2.41% 0.60% 8 2.87% 8.60%
0.60% 2.41% 0.60% 9 3.62% 12.22%
0.60% 2.41% 0.60% 10 4.07% 16.29%
0.60% 2.41% 0.60% 11 4.83% 21.12%
0.45% 2.41% 0.60% 12 8.90% 30.02%
2.41% 9.05% 2.41% 13 9.65% 39.67%
0.60% 2.41% 0.45% 14 8.90% 48.57%
15 8.45% 57.01%
9 10 11 16 7.69% (b) 64.71%
11 12 13 17 7.24% 71.95%
12 13 14 18 6.49% 78.43%
13 14 15 19 6.03% 84.46%
14 15 16 20 10.26% 94.72%
15 16 17 21 4.83% (a) 99.55%
16 17 18 22 0.45% 100.00%
17 18 19
18 19 20 P(16 or less) 64.71% ( c )
19 20 21
20 21 22 P(btw 12 & 16) 43.59%
P(btw 17 & 20) 30.02%
E[X] 14.62 ( d )
Variance 16.71
STD DEV 4.09

(X- E{X])^2
112.69
92.46
74.22
57.99
43.76
31.53
21.30
13.07
6.84
2.61
0.38
0.15
1.92
5.69
11.46
19.22
28.99
40.76
54.53

Consumer Transportation Survey
Vehicle
Driven
Type Satisfacti
on with
vehicle
Gender Age # of hours
per week in
vehicle
Miles
driven
per week
Number
of
Children
Average
number
of riders
Truck Domestic Yes Male 31 10 450 0 1
Truck Domestic Yes Male 29 5 370 1 1
Truck Foreign No Male 26 12 580 0 1
Truck Domestic No Male 18 6 300 0 1
SUV Domestic Yes Male 49 21 1000 0 1
SUV Foreign Yes Male 50 16 840 2 1
SUV Domestic Yes Male 48 15 1400 3 4
SUV Foreign Yes Male 45 5 300 2 2
SUV Domestic Yes Male 45 15 850 0 1
SUV Domestic Yes Male 44 10 700 2 1
SUV Foreign Yes Male 41 5 350 1 1
SUV Domestic Yes Male 41 30 1500 4 3
SUV Foreign No Female 39 6 280 1 1
SUV Foreign Yes Female 36 4 400 0 1
SUV Foreign Yes Female 33 3 420 0 1
SUV Domestic Yes Male 31 10 675 0 1
SUV Domestic No Female 31 15 800 1 1
SUV Domestic No Female 29 4 300 1 1
SUV Domestic Yes Male 28 3 400 1 1
Mini Van Domestic Yes Female 55 8 400 0 2
Mini Van Domestic No Female 43 10 700 2 3
Mini Van Domestic Yes Female 41 10 720 1 2
Mini Van Foreign Yes Female 38 10 450 4 5
Mini Van Foreign Yes Female 39 15 1000 1 2
Mini Van Domestic No Male 35 5 350 2 2
Mini Van Domestic Yes Female 33 10 800 2 3
Mini Van Foreign Yes Female 32 2 200 4 5
Mini Van Foreign Yes Female 28 8 350 3 4
Car Domestic Yes Female 21 4 150 0 1
Car Domestic No Female 62 5 175 0 2
Car Domestic Yes Female 61 5 355 0 1
Car Foreign Yes Male 60 5 150 0 1
Car Domestic No Male 58 10 600 0 1
Car Domestic Yes Female 51 11 600 0 1
Car Domestic Yes Female 47 4 300 0 1
Car Domestic No Male 46 4 275 0 1
Car Domestic No Male 44 6 285 2 3
Car Foreign No Female 42 5 400 2 3
Car Foreign Yes Female 41 5 350 2 2
Car Domestic No Female 41 10 600 1 2
Car Domestic Yes Female 39 10 700 1 2

Car Foreign Yes Female 34 10 600 1 2
Car Foreign Yes Male 33 5 400 1 2
Car Foreign Yes Male 30 5 350 1 2
Car Domestic Yes Female 29 5 250 0 1
Car Foreign Yes Female 27 6 355 0 2
Car Foreign Yes Female 26 5 175 0 1
Car Domestic No Female 24 5 300 0 1
Car Domestic Yes Female 22 5 350 0 1
Car Foreign No Female 19 5 500 0 2
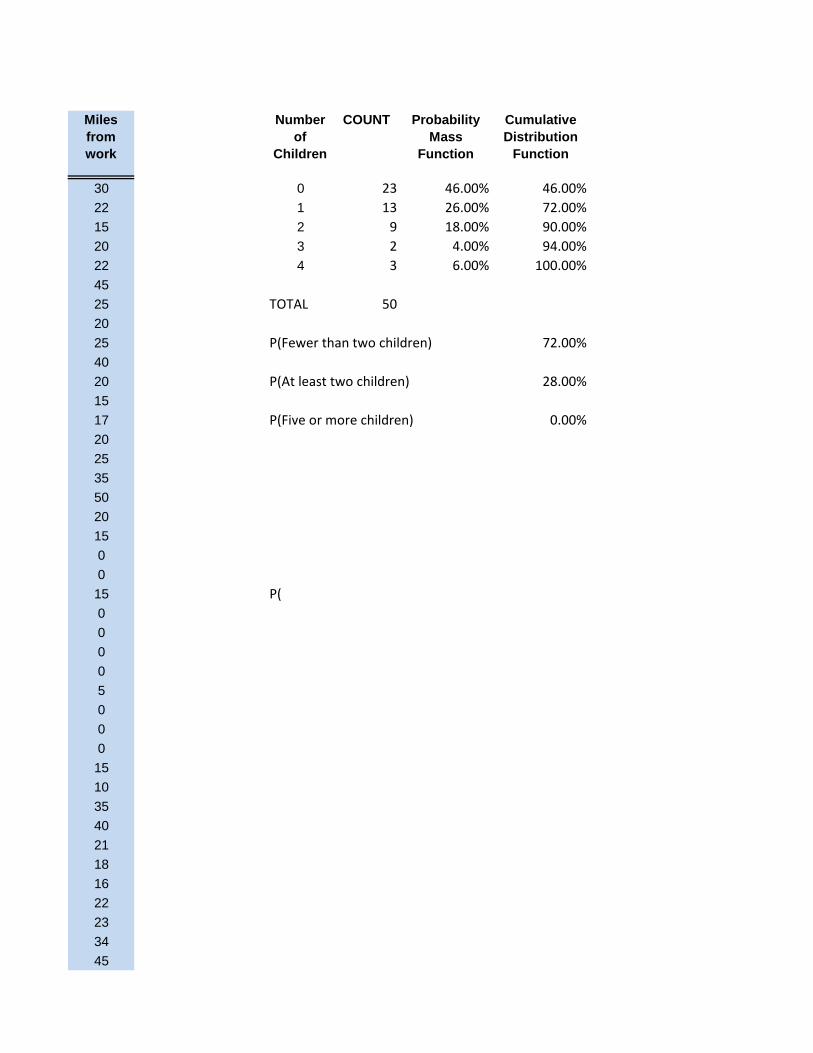
Miles
from
work
Number
of
Children
COUNT Probability
Mass
Function
Cumulative
Distribution
Function
30 0 23 46.00% 46.00%
22 1 13 26.00% 72.00%
15 2 9 18.00% 90.00%
20 3 2 4.00% 94.00%
22 4 3 6.00% 100.00%
45
25 TOTAL 50
20
25 P(Fewer than two children) 72.00%
40
20 P(At least two children) 28.00%
15
17 P(Five or more children) 0.00%
20
25
35
50
20
15
0
0
15 P(
0
0
0
0
5
0
0
0
15
10
35
40
21
18
16
22
23
34
45

16
22
18
19
23
11
4
3
4

x f(x)
Months of Retention Probability (x-E[x])^2 E[x] Variance
1 15.00% 31.86 6.64 36.82
2 12.75% 21.57
3 10.84% 13.28
4 9.21% 6.99
5 7.83% 2.70
6 6.66% 0.42
7 5.66% 0.13
8 4.81% 1.84
9 4.09% 5.55
10 3.47% 11.26
11 2.95% 18.97
12 2.51% 28.68
13 2.13% 40.40
14 1.81% 54.11
15 1.54% 69.82
16 1.31% 87.53
17 1.11% 107.24
18 0.95% 128.95
19 0.80% 152.66
20 0.68% 178.38
21 0.58% 206.09
22 0.49% 235.80
23 0.42% 267.51
24 0.36% 301.22
25 0.30% 336.93
26 0.26% 374.64
27 0.22% 414.36
28 0.19% 456.07
29 0.16% 499.78
30 0.13% 545.49
31 0.11% 593.20
32 0.10% 642.91
33 0.08% 694.62
34 0.07% 748.33
35 0.06% 804.05
36 0.05% 861.76
37 0.04% 921.47
38 0.04% 983.18
39 0.03% 1,046.89
40 0.03% 1,112.60
41 0.02% 1,180.31
42 0.02% 1,250.03
43 0.02% 1,321.74
44 0.01% 1,395.45

45 0.01% 1,471.16
46 0.01% 1,548.87
47 0.01% 1,628.58
48 0.01% 1,710.29

Std Dev
6.07

Call Center Data
Male = 1
Female =
0
Yes = 1
No = 0
Yes = 1
No = 0
GenderStarting Age Prior Call Center ExperienceCollege DegreeLength of Service (years)
0 18 0 0 7.02
1 18 1 0 3.47
0 19 0 0 2.07
0 19 0 0 1.78
0 19 0 0 4.42
0 19 0 0 3.29
0 19 1 0 3.05
1 19 1 0 0.49
1 19 1 0 0.61
1 19 0 0 3.12
0 20 0 0 2.95
0 20 1 0 2.15
0 20 0 0 4.03
1 20 0 0 3.53
1 20 0 0 2.47
0 21 0 0 2.15
1 21 0 0 3.27
1 21 0 0 1.10
1 21 0 0 1.78
0 22 0 0 1.94
0 22 1 0 2.91
0 23 1 0 3.02
0 23 1 0 2.53
0 23 0 1 1.84
1 23 1 0 2.88
1 23 0 0 2.20
1 23 0 1 1.44
1 24 0 0 2.53
1 24 0 1 1.41
1 24 0 1 1.08
0 25 1 1 0.98
1 25 1 0 0.63
1 25 0 1 1.30
1 25 1 1 2.13
0 26 1 0 2.30
0 26 1 1 2.05
0 26 1 1 2.13
1 26 1 1 2.12
1 26 0 1 2.16
1 27 0 0 2.04
0 28 0 0 1.70

0 28 0 1 2.11
1 29 0 1 1.75
0 30 0 1 2.15
1 30 1 0 2.12
1 30 0 1 0.37
0 31 0 0 1.95
0 31 0 0 1.02
0 31 0 1 1.26
1 31 0 0 1.04
0 32 0 1 1.64
1 32 1 0 1.75
1 32 1 1 1.71
1 33 0 0 1.29
0 34 1 0 1.48
0 34 0 1 1.31
1 34 0 0 1.46
1 34 1 0 1.88
1 36 0 1 1.16
0 39 0 0 1.16
0 39 0 1 1.05
1 39 0 0 0.96
0 40 1 0 1.24
0 40 0 0 0.81
1 41 1 0 0.87
0 43 1 0 0.99
0 43 1 0 0.76
0 45 0 0 0.32
0 47 1 1 0.35
0 50 1 0 0.57

Binomial distribution
Experience Count
0 43
1 27
Probability of Experience 38.57%
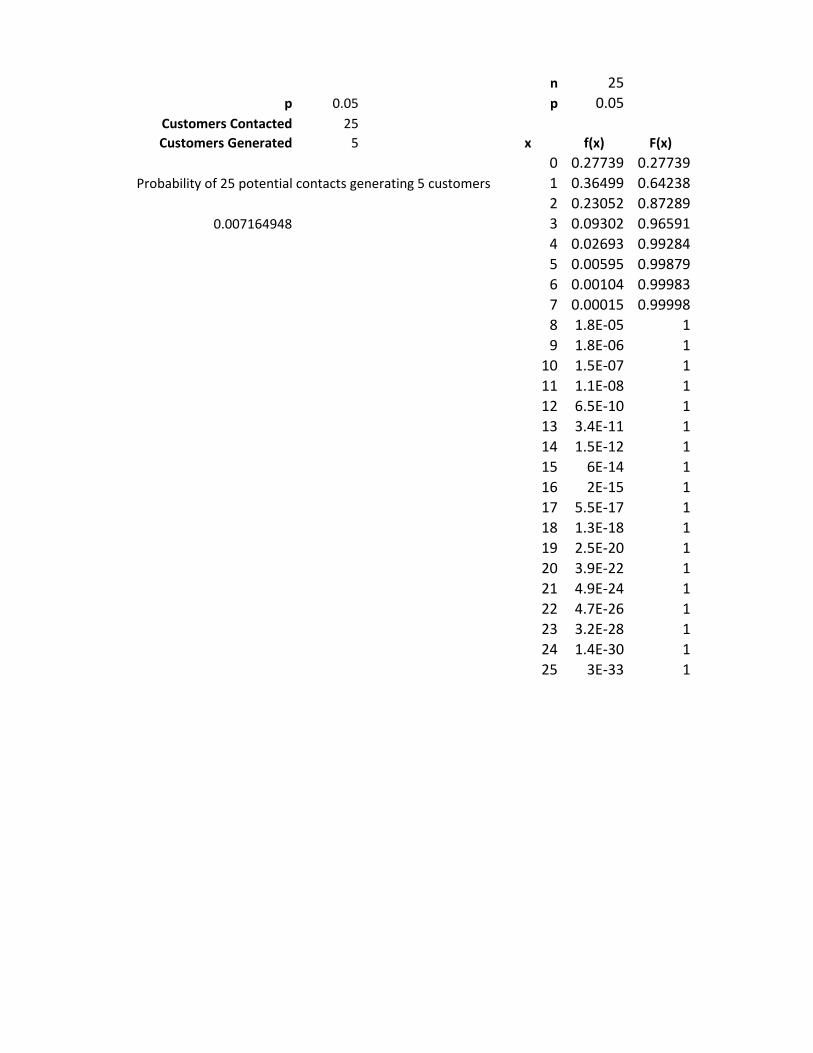
n 25
p 0.05 p 0.05
Customers Contacted 25
Customers Generated 5 x f(x) F(x)
0 0.27739 0.27739
Probability of 25 potential contacts generating 5 customers 1 0.36499 0.64238
2 0.23052 0.87289
0.007164948 3 0.09302 0.96591
4 0.02693 0.99284
5 0.00595 0.99879
6 0.00104 0.99983
7 0.00015 0.99998
8 1.8E-05 1
9 1.8E-06 1
10 1.5E-07 1
11 1.1E-08 1
12 6.5E-10 1
13 3.4E-11 1
14 1.5E-12 1
15 6E-14 1
16 2E-15 1
17 5.5E-17 1
18 1.3E-18 1
19 2.5E-20 1
20 3.9E-22 1
21 4.9E-24 1
22 4.7E-26 1
23 3.2E-28 1
24 1.4E-30 1
25 3E-33 1

p 50% success
Total Weeks 52
Success Weeks 33
Probability of 33 weeks of success by chance
1.70%

p 4%
Hotel Rooms 300
Cancellations 20 (300 - 280)
Probability of at least 280 rooms will be occupied
98.99%
Normal Approximation
Mean 288.00
S.D. 3.39
For 280 rooms, z score
z (2.36)
Probability 99.08%

p 0.10
Number of Calls 78
Number of Successes 4
Probability of up to 4 successes
9.94%
Probability of 5 or more successes
90.06%

1
2
3
4
5
6
7
8
9
10
11
A B C D E
Average 6 customers per day
Customers per
day Probability
0 0.25%
1 1.49%
2 4.46%
3 8.92%
4 13.39%
at least 5 71.49%

Empirical Theoretical
Number Frequency Probability Probability
0 5 7.35% 7.52%
1 16 23.53% 19.45%
2 19 27.94% 25.17%
3 13 19.12% 21.72%
4 3 4.41% 14.05%
5 5 7.35% 7.27%
6 4 5.88% 3.14%
7 2 2.94% 1.16%
8 1 1.47% 0.38%
TOTAL 68
2.59 Expected Value0.00%
5.00%
10.00%
15.00%
20.00%
25.00%
30.00%
1 2 3

3 4 5 6 7 8 9
Empirical Probability
Theoretical Probability

Using formulas
a. P(x<8) 60% 0.60
b. P(x>7) 40% 0.40
c. P(6<x<10) 80% 0.80
d. P(8<x<11) 30% 0.30

a 20 minutes
b 60 minutes
a. Mean 40.00 minutes
Variance 133.33
b. 12.50%
c. 50.00%

Using formula
a 10 Minimum a 10
b 20 Maximum b = ? 20 (18-10) = .8x and solve for x
P(in 18 days) 0.8 P(in 18 days) 0.80

(18-10) = .8x and solve for x

Mean 30 mpg
S.D. 1.5 mpg
a. P(X<28) 9.12%
b. P(X<32) 90.88%
P(28<X<32) 81.76%
c. P(X<33) 97.72%
P(X>33) 2.28%
d. P(X<31) 74.75%
e. Upper tail 5%
Lower cum 95%
mpg 32.47 upper 5%

Mean 580
S.D. 25
a. P(X<550) 11.51%
b. P(X<600) 78.81%
P(X<560) 21.19%
P(560<X<600) 57.63%
c. P(X<620) 94.52%
P(X>620) 5.48%
d. P(X<700) 99.9999%
P(X>700) 0.0001%
e. 500 (3.20)
Z-scores 600 0.80
700 4.80

Mean 2000 ml
S.D. 20 ml
a. P(X<2060) 99.87%
Overfill 0.13%
b. P(X<1970) 6.68%

1
2
3
4
5
6
7
8
9
10
11
12
13
14
15
16
17
18
19
20
21
22
23
24
25
26
27
28
A B C D E F G H I J
Mean 1.98 cm
S.D. 0.10 cm
a. P(X<2.04) 72.57%
P(X<1.96) 42.07%
Meet the specs 30.50%
b.
Mean 2.00 cm
S.D. 0.10 cm
P(X<2.04) 65.54%
P(X<1.96) 34.46%
Meet the specs 31.08%
c. Using formula lower limit 2.04
upper limit 1.96
Mean 2.00 cm Mean 2.00 cm
S.D. 0.017 cm S.D. 0.0172 cm
Z=
P(X<2.04) 99.07% P(X<2.04) -2.33
P(X<1.96) 0.93% P(X<1.96) 2.33
Meet the specs 98.14% Meet the specs 98.00%

Mean 20.00$
S.D. 4.00$
P(at most $15) 10.56%
P(at least $15) 89.44%
100 customers
Mean 20.00$
S.D. 0.40$
p(1 customer spends at least $15) 89.44%
P(at least 40 customers) 100.00%

Mean 2750
Lambda 0.0004
P(X>3000) 33.59%

Mean 20 minutes
Lambda 0.05
a. P(X<30) 77.69%
P(X>30) 22.31%
b. P(X<20) 63.21%

PROBABILITY OF NEXT DRINK TO BE OUTCOME
diet colas 0.60 - to less than 0.60 diet colas
cans of lemonade 0.25 0.60 to less than 0.85 cans of lemonade
cans of root beer 0.15 0.85 to less than 1.00 cans of root beer
Interval

OUTCOME Random Number OUTCOME
0.2479 diet colas
cans of lemonade 0.8383 cans of lemonade
cans of root beer 0.6292 cans of lemonade
0.6219 cans of lemonade
0.4159 diet colas
0.8737 cans of root beer
0.7061 cans of lemonade
0.8105 cans of lemonade
0.6448 cans of lemonade
0.3619 diet colas

SAMPLE SPACE
Value Frequency Probability OUTCOME
2 1 0.0182 - to less than 0.0182 2
3 1 0.0182 0.0182 to less than 0.0364 3
4 2 0.0364 0.0364 to less than 0.0727 4
5 2 0.0364 0.0727 to less than 0.1091 5
6 3 0.0545 0.1091 to less than 0.1636 6
7 3 0.0545 0.1636 to less than 0.2182 7
8 4 0.0727 0.2182 to less than 0.2909 8
9 4 0.0727 0.2909 to less than 0.3636 9
10 5 0.0909 0.3636 to less than 0.4545 10
11 5 0.0909 0.4545 to less than 0.5455 11
12 5 0.0909 0.5455 to less than 0.6364 12
13 4 0.0727 0.6364 to less than 0.7091 13
14 4 0.0727 0.7091 to less than 0.7818 14
15 3 0.0545 0.7818 to less than 0.8364 15
16 3 0.0545 0.8364 to less than 0.8909 16
17 2 0.0364 0.8909 to less than 0.9273 17
18 2 0.0364 0.9273 to less than 0.9636 18
19 1 0.0182 0.9636 to less than 0.9818 19
20 1 0.0182 0.9818 to less than 1.0000 20
TOTAL 55
Interval

OUTCOME Random Number OUTCOME
0.4002 10
0.0985 5
0.1781 7
0.7549 14
0.3978 10
0.9806 19
0.3833 10
0.8754 16
0.9646 19
0.5565 12

a 20 minutes
b 60 minutes
RAND NUMBER MEAN 40.70
1 0.9937 59.75 S.D. 12.19
2 0.6465 45.86
3 0.5246 40.98
4 0.7414 49.65
5 0.0290 21.16
6 0.8123 52.49
7 0.6222 44.89
8 0.9325 57.30
9 0.6910 47.64
10 0.1408 25.63
11 0.8166 52.66
12 0.3392 33.57
13 0.6599 46.39
14 0.9174 56.70
15 0.6930 47.72
16 0.4772 39.09
17 0.3777 35.11
18 0.3569 34.28
19 0.9044 56.17
20 0.0175 20.70
21 0.4548 38.19
22 0.2311 29.25
23 0.1528 26.11
24 0.3727 34.91
25 0.0320 21.28

1
2
3
4
5
6
7
8
9
10
11
12
13
14
15
16
17
18
19
20
21
22
23
24
25
26
27
28
29
30
31
32
33
34
35
36
37
38
39
40
41
42
43
44
45
46
A B C D E F G H I
8 Min 2 COUNT FREQ
6 Max 13 2 2
6 3 8
10 4 15
7 5 19
5 6 10
5 7 13
8 8 13
7 9 6
10 10 10
4 11 3
6 12 0
5 13 1
4
3 75% of the days there will be at least 5 customers
6
7
5
9
4
8
6
4
9
5
11
7
4
4
5
3
8
8
8
10
3
13
4
5
9
5
4
7
8
8
11

47
48
49
50
51
52
53
54
55
56
57
58
59
60
61
62
63
64
65
66
67
68
69
70
71
72
73
74
75
76
77
78
79
80
81
82
83
84
85
86
87
88
89
90
91
92
A B C D E F G H I
5
3
4
10
8
5
7
8
9
10
3
8
9
2
5
6
8
7
5
4
4
3
10
5
5
10
7
4
4
8
10
6
5
7
6
6
9
10
4
5
3
7
10
5
7
4

93
94
95
96
97
98
99
100
A B C D E F G H I
5
3
7
2
11
7
6
5

1
2
3
4
5
6
7
8
9
10
11
12
13
14
15
16
17
18
19
20
21
22
23
24
25
26
27
28
29
30
31
32
33
34
35
36
37
38
39
40
41
42
43
44
45
46
J K
of the days there will be at least 5 customers

NOTE: AS A SAMPLING EXPERIMENT, THE RESULTS WILL VARY SLIGHTLY FOR EACH STUDENT
Equity Multiplier 4.00
3.80% 1.50 MEAN
0.40% 0.20 S.D.
Net Profit
Margin
Total Asset
Turnover ROE
3.97% 1.90 0.30 min 0.12
3.01% 1.18 0.14 max 0.37
3.66% 1.65 0.24
3.39% 1.60 0.22
3.69% 1.29 0.19
3.71% 1.83 0.27
3.19% 1.46 0.19
4.19% 1.72 0.29
3.94% 1.34 0.21
4.05% 1.57 0.25
4.15% 1.66 0.28
4.27% 1.53 0.26
4.07% 1.46 0.24
3.64% 1.50 0.22
3.73% 1.48 0.22
3.92% 1.33 0.21
3.50% 1.22 0.17
3.40% 1.24 0.17
3.67% 1.29 0.19
4.01% 1.35 0.22
4.16% 1.17 0.19
3.46% 1.60 0.22
3.71% 1.43 0.21
3.90% 1.46 0.23
3.66% 1.53 0.22
4.64% 1.74 0.32
3.21% 1.49 0.19
3.37% 1.36 0.18
4.41% 1.88 0.33
3.82% 1.48 0.23
4.05% 1.39 0.23
3.83% 1.62 0.25
3.01% 1.62 0.19
4.18% 1.31 0.22
4.12% 1.63 0.27
4.05% 1.49 0.24
3.56% 1.07 0.15
3.74% 1.15 0.17
3.38% 1.62 0.22
4.11% 1.46 0.24

3.97% 1.25 0.20
4.19% 1.61 0.27
3.91% 1.42 0.22
3.72% 1.29 0.19
3.83% 1.23 0.19
3.68% 1.55 0.23
4.31% 1.57 0.27
3.82% 1.58 0.24
3.25% 1.89 0.25
3.87% 1.46 0.23
3.39% 1.18 0.16
3.35% 1.76 0.24
4.07% 1.88 0.31
3.04% 1.39 0.17
3.87% 1.47 0.23
3.46% 1.76 0.24
3.65% 1.64 0.24
4.15% 1.54 0.26
4.54% 1.43 0.26
4.36% 1.42 0.25
4.32% 1.27 0.22
3.46% 1.42 0.20
3.23% 1.34 0.17
3.17% 1.53 0.19
4.00% 1.54 0.25
3.05% 1.32 0.16
2.85% 1.61 0.18
3.64% 1.56 0.23
4.34% 1.28 0.22
4.59% 1.22 0.22
3.71% 1.45 0.22
3.21% 1.58 0.20
3.83% 1.60 0.24
4.09% 1.58 0.26
3.51% 1.78 0.25
3.81% 1.55 0.24
3.52% 1.63 0.23
3.78% 1.43 0.22
3.87% 1.39 0.22
3.99% 1.30 0.21
3.95% 1.66 0.26
4.24% 1.46 0.25
3.10% 1.54 0.19
3.15% 1.24 0.16
4.89% 1.57 0.31
4.26% 1.66 0.28
3.69% 1.70 0.25

3.88% 1.50 0.23
3.52% 1.47 0.21
3.94% 1.54 0.24
4.39% 1.51 0.26
4.54% 1.23 0.22
3.41% 1.42 0.19
4.11% 1.72 0.28
4.08% 1.29 0.21
4.26% 1.57 0.27
4.57% 1.77 0.32
3.69% 1.80 0.27
3.83% 1.68 0.26
4.13% 1.37 0.23
3.25% 1.66 0.22
3.77% 1.71 0.26
4.24% 1.50 0.25
4.42% 1.79 0.32
3.97% 1.82 0.29
4.09% 1.38 0.23
3.86% 1.33 0.21
3.95% 1.34 0.21
3.58% 1.23 0.18
3.52% 1.80 0.25
3.85% 1.48 0.23
3.26% 1.40 0.18
3.22% 1.13 0.15
4.39% 1.62 0.28
3.37% 1.36 0.18
3.62% 1.65 0.24
4.35% 1.55 0.27
4.11% 1.93 0.32
4.78% 1.45 0.28
3.72% 1.67 0.25
3.60% 1.27 0.18
4.31% 1.54 0.27
3.59% 1.76 0.25
3.88% 1.60 0.25
3.47% 1.55 0.22
4.45% 1.30 0.23
4.09% 1.60 0.26
4.04% 1.32 0.21
3.89% 1.37 0.21
3.02% 1.00 0.12
3.05% 1.26 0.15
3.51% 1.32 0.19
3.65% 1.29 0.19
4.02% 1.39 0.22

3.56% 1.52 0.22
3.52% 1.47 0.21
4.04% 1.71 0.28
4.54% 1.59 0.29
3.44% 1.52 0.21
3.33% 1.22 0.16
4.45% 1.69 0.30
4.28% 1.43 0.24
3.73% 1.77 0.26
4.23% 1.40 0.24
4.65% 1.29 0.24
3.72% 1.32 0.20
2.88% 1.18 0.14
4.30% 1.05 0.18
4.35% 1.40 0.24
4.32% 1.90 0.33
3.39% 1.50 0.20
4.19% 1.41 0.24
3.32% 1.68 0.22
3.94% 1.77 0.28
3.59% 1.54 0.22
3.68% 1.46 0.21
4.22% 1.58 0.27
3.06% 1.61 0.20
3.59% 1.25 0.18
3.46% 1.33 0.18
3.54% 1.57 0.22
3.10% 1.53 0.19
3.75% 1.66 0.25
3.52% 1.32 0.19
3.53% 1.34 0.19
3.96% 1.66 0.26
3.55% 1.46 0.21
4.26% 1.39 0.24
3.93% 1.62 0.26
3.76% 1.71 0.26
4.94% 1.40 0.28
3.41% 1.38 0.19
3.83% 1.48 0.23
4.10% 1.90 0.31
3.81% 1.25 0.19
3.95% 1.86 0.29
4.84% 1.29 0.25
3.07% 1.44 0.18
3.25% 1.34 0.17
3.60% 1.57 0.23
2.58% 1.69 0.17

3.79% 1.78 0.27
4.02% 1.31 0.21
4.43% 1.71 0.30
3.89% 1.29 0.20
3.34% 1.44 0.19
3.33% 1.67 0.22
4.20% 1.53 0.26
3.56% 1.53 0.22
4.01% 1.41 0.23
4.06% 1.34 0.22
4.07% 1.33 0.22
4.07% 1.73 0.28
3.62% 1.22 0.18
3.40% 1.69 0.23
3.79% 1.50 0.23
3.55% 1.36 0.19
4.02% 1.32 0.21
3.09% 1.43 0.18
3.48% 1.70 0.24
4.12% 1.65 0.27
3.98% 1.10 0.17
4.10% 1.40 0.23
3.88% 1.89 0.29
4.03% 1.54 0.25
3.76% 1.50 0.23
4.13% 1.39 0.23
4.19% 1.08 0.18
4.36% 1.55 0.27
3.96% 1.21 0.19
3.15% 1.56 0.20
3.54% 1.81 0.26
3.72% 1.48 0.22
3.62% 1.32 0.19
3.65% 1.78 0.26
4.01% 1.06 0.17
3.47% 1.25 0.17
3.84% 1.31 0.20
4.57% 1.26 0.23
3.56% 1.55 0.22
3.86% 1.35 0.21
4.66% 1.88 0.35
4.26% 1.74 0.30
3.67% 1.45 0.21
3.11% 1.49 0.19
3.62% 1.61 0.23
4.48% 1.29 0.23
4.63% 1.60 0.30

3.91% 1.38 0.22
4.05% 1.83 0.30
3.76% 1.29 0.19
3.66% 1.55 0.23
4.31% 1.48 0.25
4.01% 1.54 0.25
3.68% 1.90 0.28
3.22% 1.09 0.14
3.81% 1.52 0.23
3.72% 1.50 0.22
4.12% 1.39 0.23
3.22% 1.48 0.19
3.50% 1.67 0.23
3.95% 1.68 0.27
3.80% 1.23 0.19
4.08% 1.32 0.22
3.86% 1.72 0.27
3.34% 1.26 0.17
3.93% 1.56 0.25
5.12% 1.81 0.37
3.63% 1.39 0.20
3.65% 1.40 0.20

NOTE: AS A SAMPLING EXPERIMENT, THE RESULTS WILL VARY SLIGHTLY FOR EACH STUDENT
Range Cumulative Frequency
0.12 0
0.13 1 1
0.14 3 2
0.15 5 2
0.16 8 3
0.17 15 7
0.18 27 12
0.19 45 18
0.20 66 21
0.21 81 15
0.22 107 26
0.23 141 34
0.24 159 18
0.25 182 23
0.26 198 16
0.27 212 14
0.28 224 12
0.29 231 7
0.30 236 5
0.31 241 5
0.32 244 3
0.33 247 3
0.34 248 1
0.35 248 0
0.36 249 1
0
5
10
15
20
25
30
35
40
0.1
2
0.1
3
0.1
4
0.1
5
0.1
6
0.1
7
0.1
8
0.1
9
0.2
0
0.2
1
0.2
2
0.2
3
0.2
4
0.2
5
0.2
6
0.2
7
0.2
8
0.2
9
0.3
0
Frequency


0.3
0
0.3
1
0.3
2
0.3
3
0.3
4
0.3
5
0.3
6

Scenario 1 2 3 4 5 6 7 8
1 3.38$ 3.60$ 3.72$ 3.08$ 3.84$ 3.55$ 3.77$ 3.84$
2 3.11$ 3.04$ 3.18$ 3.82$ 3.53$ 3.65$ 3.52$ 3.79$
3 3.59$ 3.10$ 3.63$ 3.36$ 3.27$ 3.01$ 3.55$ 3.89$
4 4.12$ 3.05$ 3.78$ 3.19$ 3.56$ 3.71$ 3.68$ 3.48$
5 3.68$ 3.27$ 3.53$ 3.53$ 3.28$ 3.26$ 3.69$ 3.50$
6 3.20$ 3.42$ 3.12$ 3.67$ 3.68$ 2.85$ 3.92$ 3.86$
7 3.37$ 3.71$ 3.28$ 3.65$ 3.90$ 3.64$ 3.77$ 3.79$
8 3.44$ 3.83$ 3.31$ 3.60$ 3.71$ 3.33$ 3.76$ 3.43$
9 3.72$ 3.65$ 3.54$ 3.41$ 3.64$ 3.94$ 3.32$ 3.61$
10 3.28$ 3.40$ 3.18$ 3.60$ 3.40$ 3.31$ 3.63$ 3.49$
11 3.57$ 3.63$ 3.01$ 3.67$ 3.32$ 3.36$ 3.64$ 3.68$
12 3.49$ 3.66$ 3.72$ 3.27$ 3.17$ 2.96$ 3.54$ 3.61$
13 3.73$ 3.09$ 3.52$ 3.74$ 3.20$ 3.76$ 3.37$ 4.20$
14 3.40$ 3.02$ 3.37$ 3.56$ 3.59$ 3.50$ 3.44$ 3.65$
15 3.05$ 3.42$ 3.27$ 3.65$ 3.38$ 3.80$ 4.01$ 2.92$
16 3.20$ 3.75$ 3.54$ 3.86$ 3.43$ 3.51$ 3.62$ 3.44$
17 3.58$ 3.28$ 3.86$ 3.53$ 3.35$ 3.65$ 3.37$ 3.63$
18 3.48$ 3.75$ 3.45$ 3.12$ 3.54$ 3.41$ 2.91$ 3.49$
19 3.41$ 3.41$ 4.11$ 3.32$ 3.64$ 3.79$ 3.55$ 3.55$
20 3.52$ 3.63$ 3.78$ 3.94$ 3.39$ 3.84$ 4.05$ 3.47$
21 3.95$ 3.66$ 3.19$ 3.33$ 3.97$ 3.26$ 3.93$ 3.17$
22 3.49$ 3.62$ 3.71$ 3.13$ 3.41$ 3.51$ 3.40$ 3.59$
23 3.62$ 3.54$ 3.65$ 3.65$ 3.43$ 3.45$ 3.61$ 3.00$
24 3.57$ 3.79$ 3.79$ 2.87$ 2.97$ 3.74$ 3.98$ 3.45$
25 3.29$ 2.93$ 3.98$ 3.69$ 3.23$ 3.88$ 3.85$ 3.66$

9 10 MIN BID MEAN 3.50$ million
3.14$ 3.85$ 3.08$ SD 0.25$ million
2.89$ 3.74$ 2.89$
3.19$ 3.86$ 3.01$
3.71$ 3.14$ 3.05$
3.90$ 3.09$ 3.09$
3.32$ 3.45$ 2.85$
2.90$ 3.77$ 2.90$
3.47$ 3.36$ 3.31$
3.26$ 3.74$ 3.26$
3.48$ 3.64$ 3.18$
3.72$ 3.43$ 3.01$
3.51$ 4.13$ 2.96$
3.55$ 3.80$ 3.09$
3.34$ 3.36$ 3.02$
3.03$ 3.81$ 2.92$
3.35$ 3.20$ 3.20$
3.70$ 3.33$ 3.28$
3.31$ 3.82$ 2.91$
3.55$ 3.13$ 3.13$
3.39$ 3.96$ 3.39$
3.50$ 3.81$ 3.17$
3.82$ 3.34$ 3.13$
3.58$ 3.71$ 3.00$
3.26$ 3.58$ 2.87$
3.37$ 3.14$ 2.93$
3.07$ EXPECTED VALUE

Computer Repair Times
Sample Repair Time (Days)
1 182 153 174 95 376 157 88 299 10
10 1411 1712 1213 13
14 12
15 11
16 14
17 13
18 16
19 13
20 15
21 16
22 12
23 34
24 29
25 13
26 19
27 12
28 15
29 16
30 14
31 15
32 7
33 40
34 16
35 11
36 11
37 10
38 13
39 14
40 9
41 18
42 8
43 13
44 8
45 10
46 13

47 16
48 9
49 9
50 12
51 16
52 9
53 15
54 17
55 38
56 11
57 15
58 16
59 10
60 9
61 25
62 15
63 7
64 11
65 19
66 13
67 12
68 20
69 12
70 13
71 11
72 8
73 14
74 10
75 12
76 15
77 17
78 10
79 13
80 18
81 26
82 14
83 15
84 12
85 15
86 9
87 10
88 21
89 11
90 36
91 8
92 20
93 14

94 18
95 19
96 14
97 12
98 16
99 17
100 12
101 10
102 10
103 15
104 23
105 13
106 19
107 19
108 12
109 13
110 12
111 16
112 12
113 14
114 11
115 14
116 7
117 16
118 12
119 16
120 10
121 12
122 36
123 9
124 9
125 22
126 16
127 12
128 17
129 9
130 25
131 14
132 13
133 13
134 8
135 14
136 8
137 17
138 13
139 12
140 8

141 12
142 17
143 22
144 19
145 10
146 19
147 10
148 17
149 13
150 9
151 13
152 9
153 11
154 12
155 17
156 15
157 15
158 27
159 17
160 10
161 20
162 15
163 12
164 15
165 23
166 17
167 8
168 17
169 10
170 20
171 16
172 12
173 11
174 22
175 11
176 14
177 17
178 18
179 11
180 21
181 15
182 14
183 16
184 10
185 19
186 14
187 20

188 27
189 20
190 15
191 20
192 11
193 14
194 13
195 26
196 9
197 8
198 15
199 16
200 21
201 14
202 15
203 15
204 14
205 15
206 15
207 16
208 5
209 11
210 14
211 8
212 21
213 10
214 18
215 13
216 16
217 11
218 11
219 10
220 18
221 11
222 18
223 23
224 22
225 19
226 9
227 11
228 10
229 6
230 39
231 14
232 10
233 11
234 7

235 13
236 17
237 8
238 25
239 20
240 13
241 21
242 7
243 12
244 16
245 23
246 18
247 31
248 6
249 17
250 13

ONE EXAMPLE:Chi-Square
Related Documents


