Chapter 19 Financial Planning and Forecasting Learning Objectives 1. Explain what a financial plan is and why financial planning is important. 2. Discuss how management uses financial planning models in the planning process, and explain the importance of sales forecasts in the construction of financial planning models. 3. Discuss how the relation between projected sales and balance sheet accounts can be determined, and be able to analyze a strategic investment decision using a percent of sales model. 4. Describe the conditions under which fixed assets vary directly with sales, and discuss the impact of so-called lumpy assets on this relation. 1

Welcome message from author
This document is posted to help you gain knowledge. Please leave a comment to let me know what you think about it! Share it to your friends and learn new things together.
Transcript
Chapter 19Financial Planning and Forecasting
Learning Objectives
1. Explain what a financial plan is and why financial planning is important.
2. Discuss how management uses financial planning models in the planning process,
and explain the importance of sales forecasts in the construction of financial
planning models.
3. Discuss how the relation between projected sales and balance sheet accounts can be
determined, and be able to analyze a strategic investment decision using a percent of
sales model.
4. Describe the conditions under which fixed assets vary directly with sales, and
discuss the impact of so-called lumpy assets on this relation.
5. Explain what factors determine a firm’s sustainable growth rate, discuss why it is of
interest to management, and be able to compute the sustainable growth rate for a
firm.
I. Chapter Outline
19.1 Financial Planning
A. The Planning Documents
1
Financial planning relates to the identification of the kinds of projects that a
firm needs to undertake and the ways of financing those projects. This results
in a financial plan.
In putting together a financial plan, four main issues are addressed by
management through detailed planning.
Strategic plan—Where is the company headed?
Investment plan—What capital resources does the management need to
get there?
Financing plan—How is the firm going to pay for the resources needed?
Cash budget—How is the firm going to pay its day-to-day bills?
The financial plan integrates the firm’s basic plans into a single planning
document with a detailed budget.
Typically, the plan extends over a three- to five-year period called the
planning horizon.
1. The Strategic Plan
It describes the vision of the firm.
It documents the firm’s long-term goals, the strategies that management will
use to achieve the goals, and the capabilities the firm needs to sustain its
competitive position.
The planning is done by the firm’s top management, with the financial
manager providing key input, and it has to be approved by the board of
directors.
The strategic plan identifies:
2
The line of business that the firm will compete in.
Major areas of investment in real assets.
Capital expenditures
Acquisitions and new lines of business
Mergers, alliances, and divestitures that may happen in the near future.
2. The Investment Plan (Capital Budget)
It is the part of the investment plan that describes the firm’s outlay for plant
and equipment.
A firm’s business strategy determines the capital expenditures it will make.
Capital expenditures can be one-time investments or routine investments that
allow the firm to continue its operations.
Once a capital investment is made, it is almost always impossible to reverse.
Three steps are involved in the capital budgeting process:
Management identifies a list of potential projects that are consistent with
the business strategy.
Senior management ranks the projects according to the value they would
create for the shareholders.
Finally, the proposed capital budget schedule is reviewed by senior
management for funding and sets the capital budget.
3. The Financing Plan
Based on the list prepared in the capital budget, management now needs to
decide how to fund the projects
3
The firm will try and use a blend of internally generated funds and externally
raised funds to finance the capital expenditures.
Depending on the level of internally generated funds available to the firm, the
firm will seek to raise funds in the form of either debt or equity.
There are three elements to a financing plan:
First, a financing plan identifies the dollar amount of funds that has to be
raised externally and the sources of funds available to the firm.
Second, the plan states management’s desired capital structure for the
firm.
Finally, the financing plan states the firm’s dividend policy, which is
relevant because it dictates the amount of funds that have to be raised in
the capital markets.
4. Divisional Business Plans
The business plans prepared by the firm’s various business divisions are also
part of the firm’s financial plans.
They identify how the various divisions will strive to achieve the corporate
goals.
They also identify the resources needed by each of the divisions to implement
their strategies.
5. Cash Budget
An overall cash budget for the firm is generated based on all the divisional
cash budgets and that of the corporate offices.
It focuses on the cash inflows and outflows of the firm.
4
It allows the firm to determine if any borrowing is necessary.
A poorly developed cash budget could lead to serious cash shortages.
B. The Financial Plan—Putting It All Together
The plan focuses on the two major decisions that management will make: (1)
the investment decision and (2) the financing decision.
Next, each of the firm’s business divisions’ plans is integrated.
One important tool used in this process is a financial planning model.
Such models provide management with the ability to prepare projected
financial statements.
These projected statements can be used to analyze the investment
alternatives and estimate the amounts of external funding needed.
C. Benefits of Financial Planning—Alignment and Support
It helps management to establish financial and operating goals for the firm and
to communicate those goals throughout the firm.
The financial plan can help align the actions of managers and their operating
units with the firm’s strategic goals.
19.2 Financial Planning Models
They help management analyze investment and financing alternatives.
Most sophisticated planning models are now created as software and make the
process speedy and accurate.
5
A. The Importance of Sales Forecasts
Sales forecast techniques come in quite an array—from best estimates by the
sales staff to complex multivariate forecast models.
They are usually generated from within the company.
Since sales are often correlated to the regional or national economy,
macroeconomic forecast are incorporated into the model.
B. Building a Financial Planning Model: Inputs and Outputs
Inputs are necessary to build the financial models that are designed to provide
specific outputs.
Financial statements serve as the first major input and become the baseline to
compare the projected financial statements.
Next comes the sales forecast in the form of the projected growth in sales.
Changes in the firm’s balance sheet and income statement items as a result of
the growth in sales are also used in these models.
Macroeconomic forecasts and their impact on the firm’s sales are also
included.
Last, investment and financing decisions are incorporated as inputs.
The outputs of the financial planning model are a series of pro forma financial
statements and financial ratios based on these statements.
These pro forma balance sheets may not be balanced. The difference
between assets and liabilities and owners’ equity, often referred to as the
plug value, often represents the external funding needed.
6
C. A Simple Planning Model
A very basic planning model is called the percent of sales model.
The driving factor of this model is the expected sales growth rate.
All or most of the input variables (i.e., the income statement and balance sheet
elements) vary directly with sales.
19.3 A Better Financial Planning Model
Unlike the previously described model, this model takes a more realistic approach in
its assumptions.
Not all balance sheet and income statement items vary directly with sales.
All variable costs and most current assets and current liabilities vary directly with
sales.
A. The Income Statement
The pro forma income statement is generated by recognizing all variable costs
change directly with sales.
Two key ratios are calculated—dividend payout ratio and retention ratio.
The first measures the percentage of net income paid out as dividends to
shareholders, while the second measures the percentage of net income
reinvested by the firm as retained earnings.
B. The Balance Sheet
7
Some balance sheet items vary directly with sales, while others do not.
To determine which accounts vary directly with sales, a trend analysis may be
conducted on historic balance sheets of the firm.
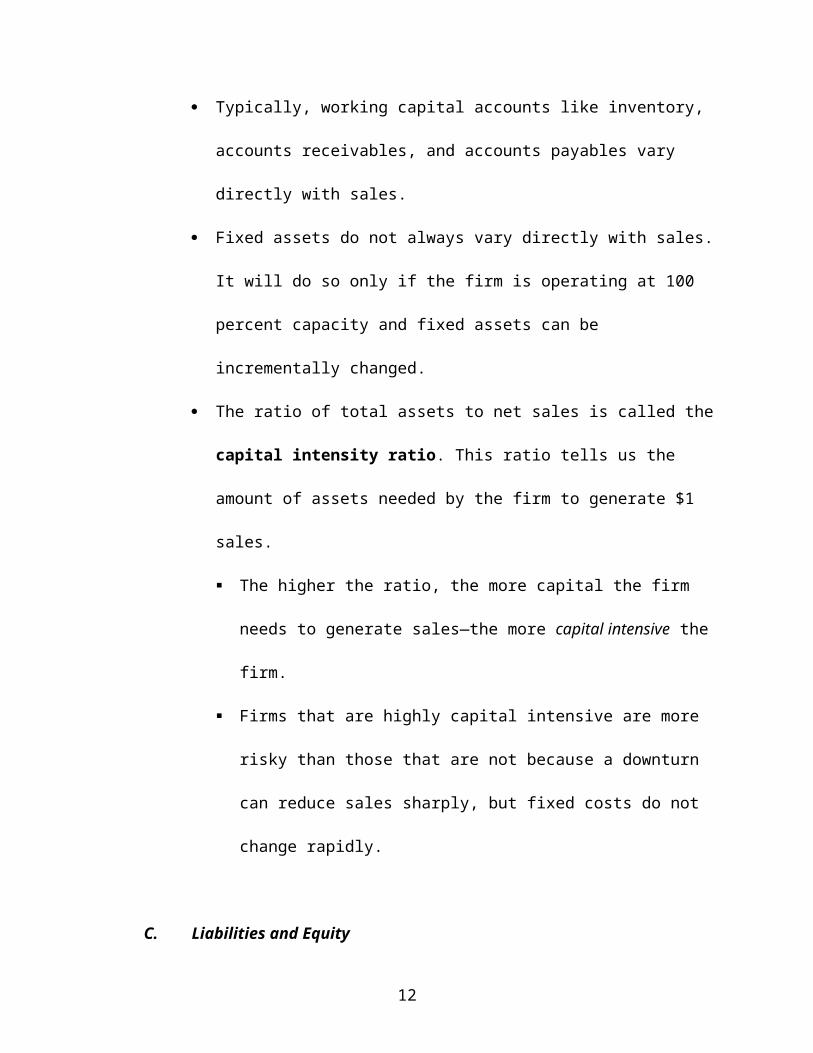
Typically, working capital accounts like inventory, accounts receivables, and
accounts payables vary directly with sales.
Fixed assets do not always vary directly with sales. It will do so only if the
firm is operating at 100 percent capacity and fixed assets can be incrementally
changed.
The ratio of total assets to net sales is called the capital intensity ratio. This
ratio tells us the amount of assets needed by the firm to generate $1 sales.
The higher the ratio, the more capital the firm needs to generate sales—the
more capital intensive the firm.
Firms that are highly capital intensive are more risky than those that are
not because a downturn can reduce sales sharply, but fixed costs do not
change rapidly.
C. Liabilities and Equity
Only current liabilities are likely to vary directly with sales. The exception
here is notes payables (short-term borrowings) that changes as the firm pays it
down or makes an additional borrowing.
Long-term liabilities and equity accounts change as a direct result of
managerial decisions like debt repayment, stock repurchase, and issuing new
debt or equity.
8
Retained earnings will vary as sales change but not directly. It is affected by
the firm’s dividend payout policy.
D. The Preliminary Pro Forma Balance Sheet
First, calculate the projected values for all the accounts that vary with sales.
Second, calculate the projected value of any other balance sheet account for
which an end-of-period value can be forecast or otherwise determined.
Third, enter the current year’s number for all the accounts for which the next
year’s figure cannot be calculated or forecast.
At this point, the balance sheet will be unbalanced. A plug value is necessary
to get the balance sheet to balance.
First, determine the retained earnings based on the firm’s dividend policy.
Next, the plug figure will represent the external financing necessary to
make the total assets equal total liabilities and equity. This calls for
management to choose a financing option—choosing debt, equity or a
combination—to raise the additional funds needed.
E. Management’s Decision
The first decision relates to the firm’s dividend policy. Should the firm alter
its dividend policy to increase the amount of retained earning?
If external funding is still needed, should the firm issue new debt, or issue
equity? Or should it be a mix of both?
9
It is important to recognize that while financial planning models can identify
the amount of external financing needed, the financing option is a managerial
decision.
19.4 Beyond the Basic Planning Models
A. Improving Financial Planning Models
There are several weaknesses in the previously described models.
First, interest expense was not accounted for. This is difficult to do so until all
the financing options are finalized.
Second, all working capital accounts do not necessarily vary directly with
sales, especially cash and inventory.
Third, how fixed assets are adjusted plays a significant role.
When a firm is not operating at full capacity, sales may be increased
without adding any new fixed assets.
Fixed assets are added in large discrete amounts called lumpy assets. Since
it requires time to get new assets operational, they are added as the firm
nears full capacity.
19.5 Managing and Financing Growth
Managers prefer rapid growth as a goal to capture market share and establish a
competitive position.
Most firms experiencing rapid growth fund the growth with debt, increasing
the firm’s leverage and putting it at risk.
10
A. External Funding Needed
External funding needed (EFN) is defined as the additional debt or equity a
firm needs to issue so it can purchase additional assets to support an increase
in sales.
EFN is tied to new investments the management has deemed necessary to
support the sales growth.
The new investments are the projected capital expenditure plus the increase in
working capital necessary to sustain increases in sales.
Companies first resort to internally generated funds in the form of addition to
retained earnings.
Once internally generated funds are exhausted, the firm looks to raise funds
externally. See Equations 19.5 and 19.6.
In analyzing Equation 19.6 two things are apparent.
First, holding dividend policy constant, the amount of EFN depends on the
firm’s projected growth rate. Higher growth rate implies that the firm
needs more new investments and therefore, more funds to have to be
raised externally.
Second, the firm’s dividend policy also affects EFN. Holding the growth
rate constant, the higher the firm’s payout ratio, the larger the amount of
debt or equity financing needed.
B. Internal Growth Rate
11
The internal growth rate (IGR) is defined as the maximum growth rate that
a firm can achieve without external financing. See Equation 19.7.
The higher the retained earnings generated by a firm and the lower the total
assets a firm has, the higher the growth possible without using external
funding.
Equation 19.8 relates IGR to the plowback ratio, return on equity, and
leverage. Firms that achieve higher growth rates without seeking external
financing have the following characteristics:
They have a high plowback ratio.
They employ less equity and/or are able to generate high net income
leading to a high ROE.
They are not highly leveraged.
C. The Sustainable Growth Rate
The sustainable growth rate (SGR) is the rate of growth that the firm can
sustain without selling additional shares of equity.
This measure is important to management because it helps them determine
whether they can avoid issuing new equity. New equity issues are expensive
and cause dilution of earnings to existing shareholders.
As Equation 19.9 shows, the SGR is a function of the plowback ratio and the
ROE.
12
II. Suggested and Alternative Approaches to the Material
The chapter begins with a discussion of what financial planning is all about. This is followed by
an overview of some simple financial planning models. Then the weaknesses in the simple
models are identified, and some better planning models are discussed. The chapter concepts of
internal growth rates and sustainable growth rates are introduced, and this is followed by
coverage of determination of external funding needed to facilitate growth in sales.
Instructors may choose to cover this chapter in a couple of different ways. Some may
choose to take up this chapter in the order it has been placed in the text. Others may elect to
cover it toward the end of the course. This chapter’s material also lends itself to being placed
anywhere the instructor chooses.
13
III. Summary of Learning Objectives
1. What a financial plan is, and why financial planning is so important.
A financial plan is a set of actionable goals derived from the firm’s strategic plan. The
financial plan focuses on selecting the best investment opportunities and determining
how to finance those investments at the lowest possible cost. The overall goal of the
financial plan is to create as much value for the firm as possible. The major outputs from
a financial plan are the pro forma financial statements. A financial plan provides a
blueprint for the firm’s future, aligns all operating units with the firm’s strategic plan, and
provides a common set of goals. An important benefit from financial planning is that it
forces management to think through a number of alternative scenarios, which provides
insights into dealing with unexpected problems as they arise. Finally, financial planning
helps firms prepare contingency plans for events that are unlikely to occur but that would
cause substantial financial injury if they did occur.
2. Discuss how management uses financial planning models in the planning process,
and explain the importance of sales forecasts in the construction of financial
planning models.
Financial models are the analytical part of the financial planning process. A planning
model is simply a series of equations that model a firm’s financial statements, such as the
income statement and balance sheet. Once the model is constructed, management can
generate projected (pro forma) financial statements to determine the financial impact of
proposed strategic initiatives on the firm.
14
For most financial planning models, a forecast of the firm’s sales is the most
important input variable. The sales forecast is the key driver in financial planning models
because many items on the income statement and balance sheet vary directly with sales.
Thus, once sales are forecast, it is easy to generate projected financial statements using
the historical relationship between a particular account and sales.
3. Discuss how the relation between projected sales and balance sheet accounts can be
determined, and be able to analyze a strategic investment decision using a percent of
sales model
Historical financial data can be examined to determine how a variable changes with sales.
One way to do this is to prepare a table that shows four or five years of historical
financial statement data as a percent of sales. Then, fit trend lines to the data to see what
type of relation exists between that variable and sales. Most income statement and
balance sheet items vary directly with sales, but others may vary in a nonlinear manner.
The analysis in the Blackwell Sales Company example illustrates how to analyze a
strategic investment decision.
4. Describe the conditions under which fixed assets vary with sales, and discuss the
impact of so-called lumpy sales on this relation.
Fixed assets vary directly with sales only when assets can be added in small increments
and production facilities are operating near full capacity. This is typically not the case. In
most situations, fixed assets are added in large, discrete units, and, as a result, much of
the new capacity may go unused for a period of time. These types of assets are often
15
called lumpy assets. After lumpy assets are added, sales can increase for a period of time
with no corresponding change in the level of fixed assets.
5. Explain what factors determine a firm’s sustainable growth rate, discuss why it is of
interest to management, and be able to compute the sustainable growth rate for a
firm.
A firm’s sustainable growth rate (SGR) is the maximum rate at which a firm can grow
without external equity financing and with leverage held constant. The determinants of
SGR are (1) profit margins (the greater a firm’s profit margins, the greater the firm’s
SGR); (2) asset utilization (the more efficiently a firm uses its assets, the higher its SGR);
(3) leverage (as a firm increases its use of leverage, its SGR increases); (4) dividend
policy (as a firm decreases its payout ratio, its SGR increases); and (5) economic
conditions (the more favorable the economic environment, the higher the firm’s SGR).
Management may be interested in knowing the SGR for two reasons. First, the SGR is
the rate of growth at which a firm’s capital structure (debt to equity) will remain constant
without the firm selling or repurchasing stock. Second, if a firm’s actual growth rate
exceeds its SGR, the firm could face cash shortage problems in the future unless it can
sell new equity. Learning by Doing Application 19.3 uses the SGR formula.
16
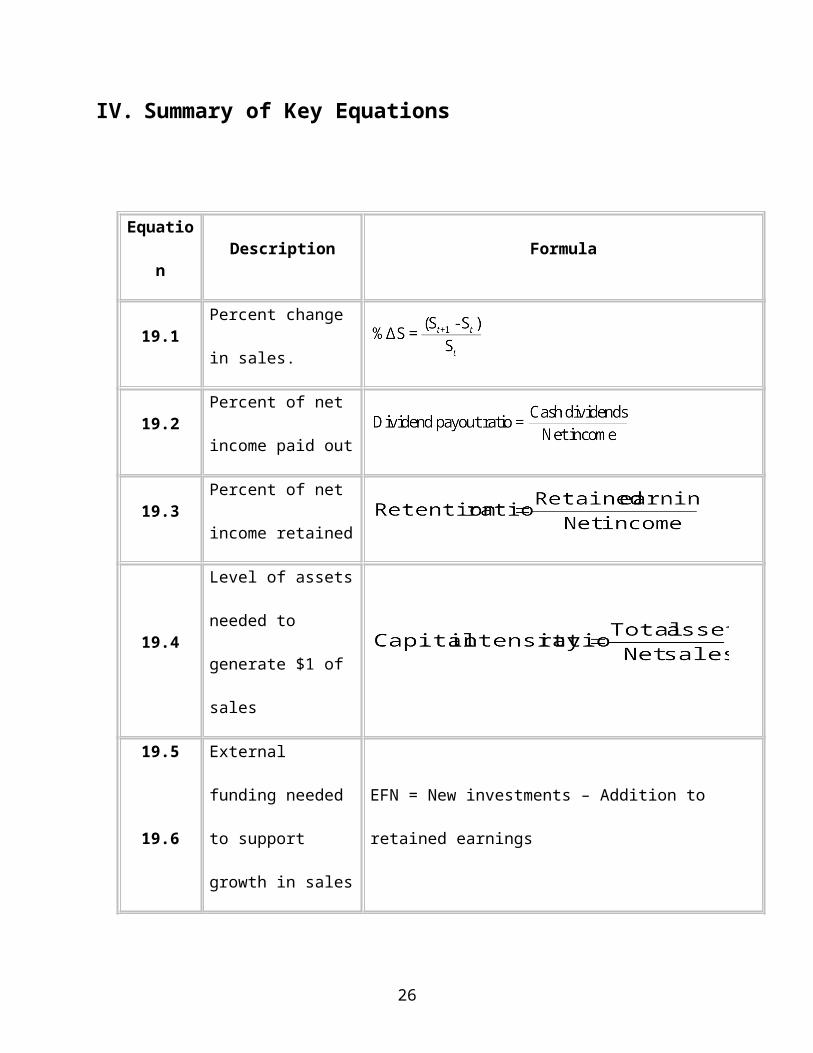
IV. Summary of Key Equations
Equation Description Formula
19.1Percent change in
sales.
19.2Percent of net income
paid out
19.3Percent of net income
retained
19.4Level of assets needed
to generate $1 of sales
19.5
19.6
External funding
needed to support
growth in sales
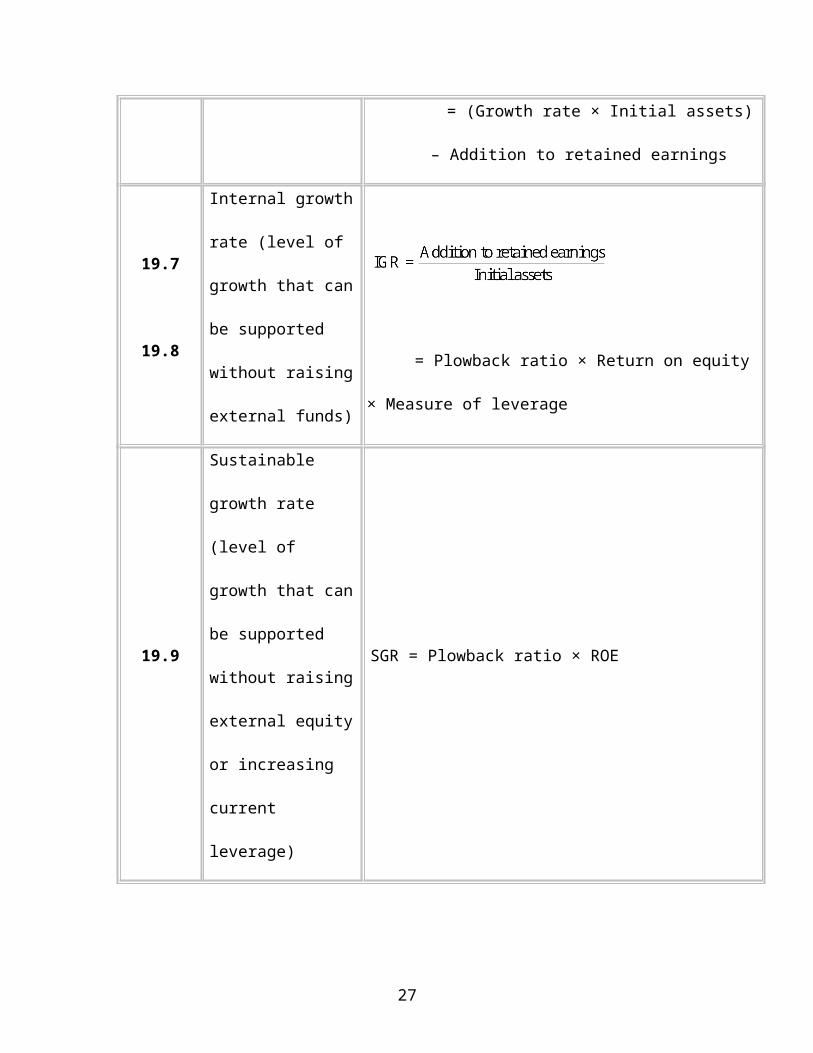
EFN = New investments – Addition to retained earnings
= (Growth rate × Initial assets) – Addition to retained
earnings
19.7
19.8
Internal growth rate
(level of growth that
can be supported
without raising
external funds) = Plowback ratio × Return on equity × Measure of
17
leverage
19.9
Sustainable growth
rate (level of growth
that can be supported
without raising
external equity or
increasing current
leverage)
SGR = Plowback ratio × ROE
18
V. Before You Go On Questions and Answers
Section 19.1
1. What are the four planning documents on which the financial plan is based?
The four important planning documents are: (1) the strategic plan, which describes where
the firm is headed and articulates the strategies that will be used to get it there; (2) the
investment plan, which identifies the capital assets needed to execute the strategies; (3)
the financing plan, which explains how the firm will raise the money to buy the assets;
and (4) the cash budget, which determines whether the firm will have sufficient cash to
pay its bills. These four planning documents provide the foundation for the firm’s
financial plan, which consolidates the documents into a single scheme.
2. What is the strategic plan?
The strategic plan is developed to communicate the firm’s long term goals from a very
high conceptual level. It is extremely important as the strategy of the firm ultimately
drives all other decisions at the firm.
3. How are the investment decision and financing decision related?
19
When a firm makes a decision to invest in some asset, it must also identify a source of
funding to pay for it. Thus, these two decisions are intertwined and must be made
together.
Section 19.2
1. Why is the sales forecast the key component of a financial model?
Sales forecast is the key component in a financial model as the majority of data used are
calculated as a percentage of sales. Hence, it is important to get as accurate a sales
forecast as possible in order to build a meaningful model.
2. What are pro forma financial statements, and why are they an important part of the
financial planning process?
Pro forma financial statements are hypothetical statements that are projected into the
future. They are then evaluated to determine which investment and under what conditions
will be the most beneficial for the firm.
3. What is the plug factor in a financial model?
The plug factor in a financial model is the source of external financing needed to bring
the balance sheet into balance.
20
Section 19.3
1. How are historical financial data used to determine the forecasted values of balance sheet
accounts?
To forecast balance sheet values, the financial manager prepares a table that shows
several years of historical accounting data as a percentage of sales. Then some simple
trend lines are fitted to the data to see if there are any trends. This allows the forecaster to
decide which financial accounts can safely be estimated as a percent of sales and which
must be forecasted using other information.
2. Explain why you might expect accounts receivable to vary with sales.
Accounts receivable can be expected to vary with sales since higher sales mean more
money coming in, and hence increased level of receivables.
Section 19.4
1. Why is it that some working capital accounts may not vary proportionately with sales?
Working capital takes into account current assets and current liabilities, and in many
instances inventories and cash balances do not proportionately change with sales. The
working capital ratio often increases at a decreasing rate as sales increase.
2. What are lumpy assets, and how do these assets vary with sales?
21
In most instances, fixed assets do not vary directly with sales, but are rather periodically
added in large increments or lumps, hence the name “lumpy assets”.
Section 19.5
1. What two factors determine the amount of EFN?
The amount of EFN is determined by the difference between the total amount of new
assets the firm needs to finance less the amount of internal financing available.
2. What is IGR, and why is it of interest to management?
IGR stands for internal growth rate and is defined as the maximum growth rate a firm can
achieve without external financing. IGR is of management interest, as firms that can
generate a high volume of retained earnings and/or use fewer assets can sustain a higher
growth rate without raising more capital
3. If a firm continually exceeds its SGR, what problems may it face in the future?
If the firm’s actual growth rate consistently exceeds its sustainable growth, the firm will
have a cash shortage problem if it is unwilling to change its targeted capital structure or
22
sell equity. If the firm has a high credit rating and its use of leverage is not excessive, the
firm may have no problem going to the market and securing additional funds.
23
VI. Self-Study Problems
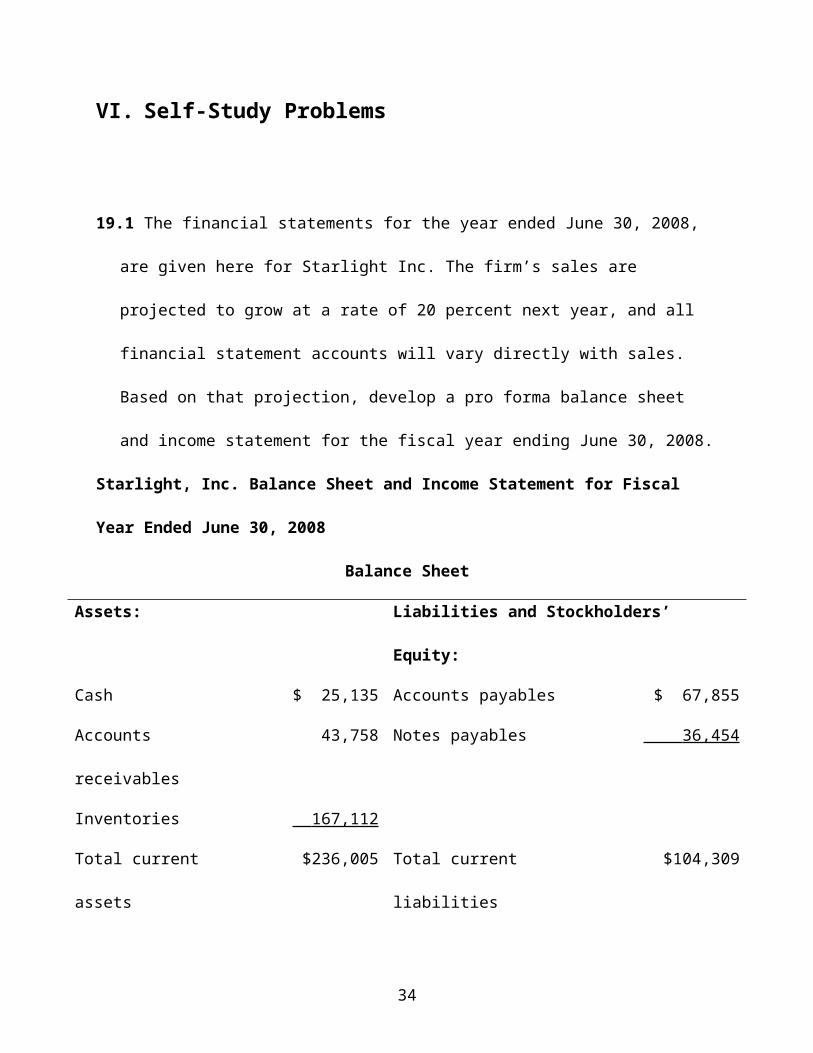
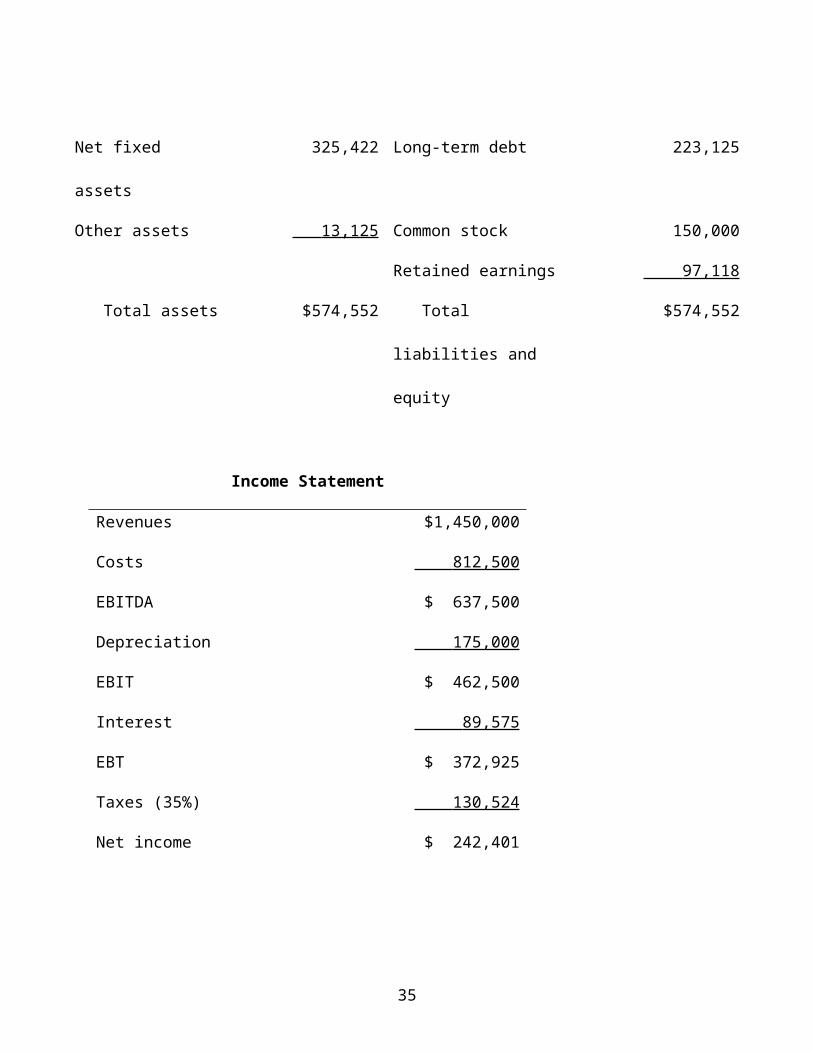
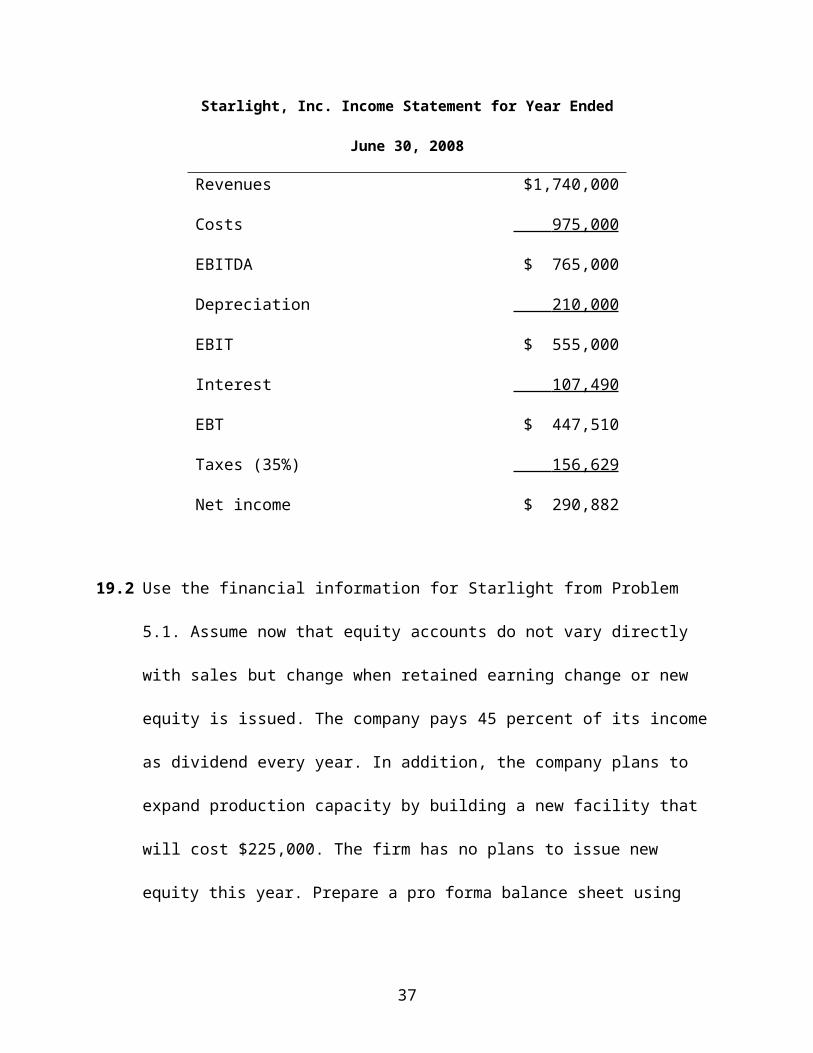
19.1 The financial statements for the year ended June 30, 2008, are given here for Starlight
Inc. The firm’s sales are projected to grow at a rate of 20 percent next year, and all financial
statement accounts will vary directly with sales. Based on that projection, develop a pro
forma balance sheet and income statement for the fiscal year ending June 30, 2008.
Starlight, Inc. Balance Sheet and Income Statement for Fiscal Year Ended June 30, 2008
Balance Sheet
Assets: Liabilities and Stockholders’ Equity:
Cash $ 25,135 Accounts payables $ 67,855
Accounts receivables 43,758 Notes payables 36,454
Inventories 167,112
Total current assets $236,005 Total current liabilities $104,309
Net fixed assets 325,422 Long-term debt 223,125
Other assets 13,125 Common stock 150,000
Retained earnings 97,118
Total assets $574,552 Total liabilities and equity $574,552
Income Statement
Revenues $1,450,000
Costs 812,500
EBITDA $ 637,500
24
Depreciation 175,000
EBIT $ 462,500
Interest 89,575
EBT $ 372,925
Taxes (35%) 130,524
Net income $ 242,401
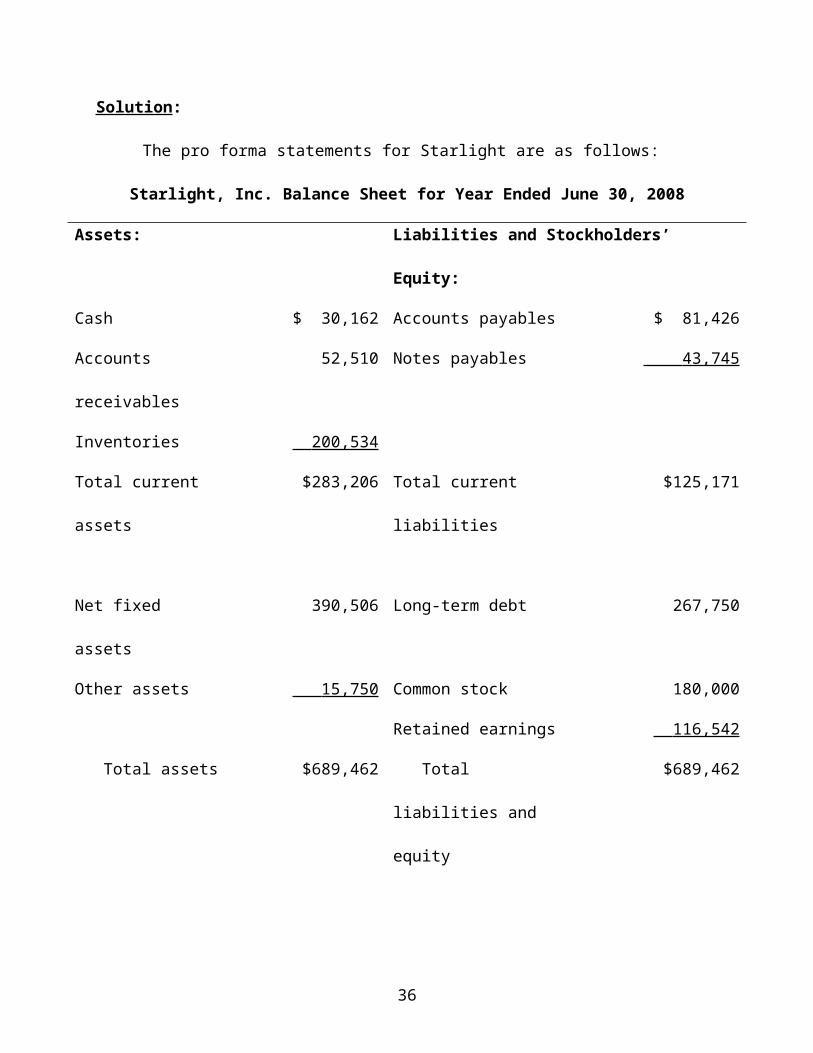
Solution:
The pro forma statements for Starlight are as follows:
Starlight, Inc. Balance Sheet for Year Ended June 30, 2008
Assets: Liabilities and Stockholders’ Equity:
Cash $ 30,162 Accounts payables $ 81,426
Accounts receivables 52,510 Notes payables 43,745
Inventories 200,534
Total current assets $283,206 Total current liabilities $125,171
Net fixed assets 390,506 Long-term debt 267,750
Other assets 15,750 Common stock 180,000
Retained earnings 116,542
Total assets $689,462 Total liabilities and equity $689,462
25
Starlight, Inc. Income Statement for Year Ended June 30, 2008
Revenues $1,740,000
Costs 975,000
EBITDA $ 765,000
Depreciation 210,000
EBIT $ 555,000
Interest 107,490
EBT $ 447,510
Taxes (35%) 156,629
Net income $ 290,882
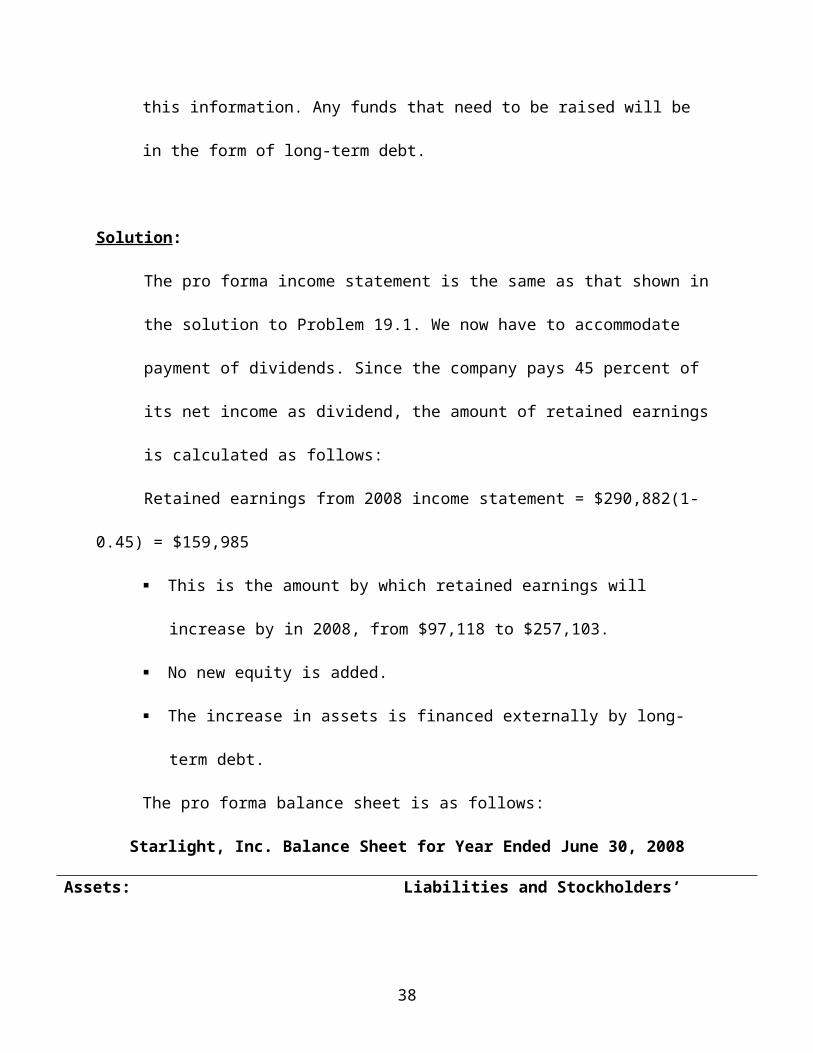
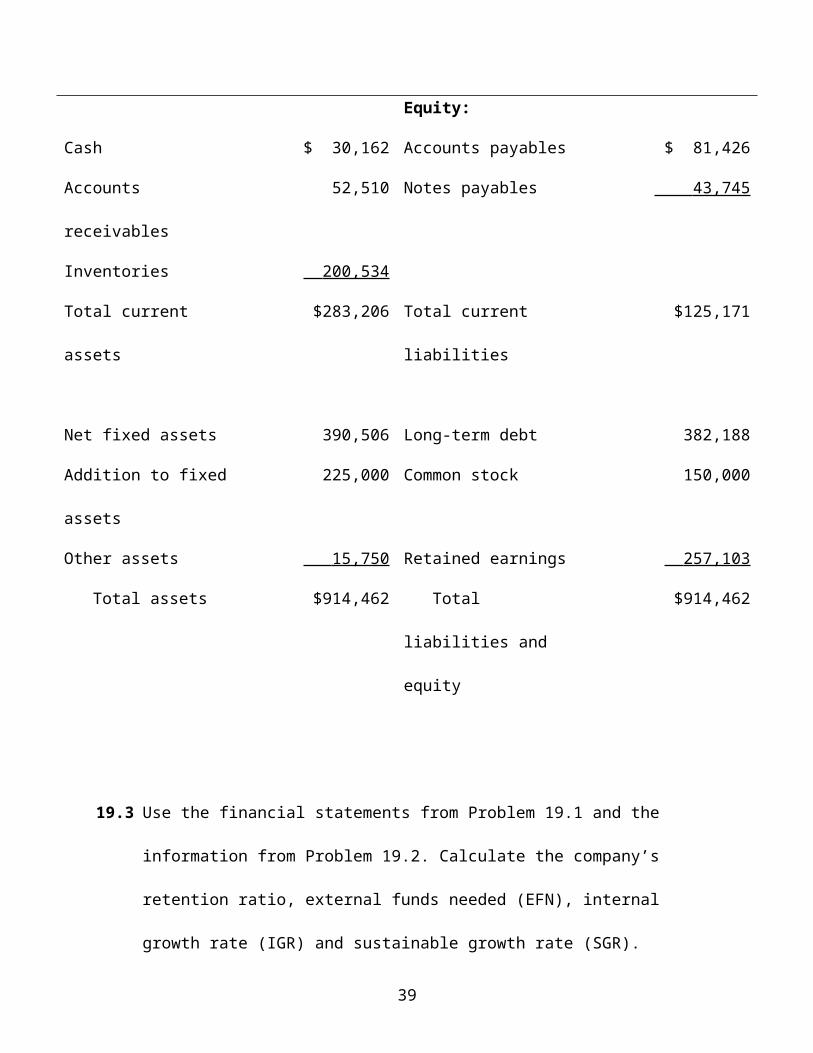
19.2 Use the financial information for Starlight from Problem 5.1. Assume now that equity
accounts do not vary directly with sales but change when retained earning change or new
equity is issued. The company pays 45 percent of its income as dividend every year. In
addition, the company plans to expand production capacity by building a new facility that
will cost $225,000. The firm has no plans to issue new equity this year. Prepare a pro
forma balance sheet using this information. Any funds that need to be raised will be in the
form of long-term debt.
Solution:
The pro forma income statement is the same as that shown in the solution to Problem
19.1. We now have to accommodate payment of dividends. Since the company pays 45
26
percent of its net income as dividend, the amount of retained earnings is calculated as
follows:
Retained earnings from 2008 income statement = $290,882(1-0.45) = $159,985
This is the amount by which retained earnings will increase by in 2008, from $97,118
to $257,103.
No new equity is added.
The increase in assets is financed externally by long-term debt.
The pro forma balance sheet is as follows:
Starlight, Inc. Balance Sheet for Year Ended June 30, 2008
Assets: Liabilities and Stockholders’ Equity:
Cash $ 30,162 Accounts payables $ 81,426
Accounts receivables 52,510 Notes payables 43,745
Inventories 200,534
Total current assets $283,206 Total current liabilities $125,171
Net fixed assets 390,506 Long-term debt 382,188
Addition to fixed assets 225,000 Common stock 150,000
Other assets 15,750 Retained earnings 257,103
Total assets $914,462 Total liabilities and equity $914,462
27
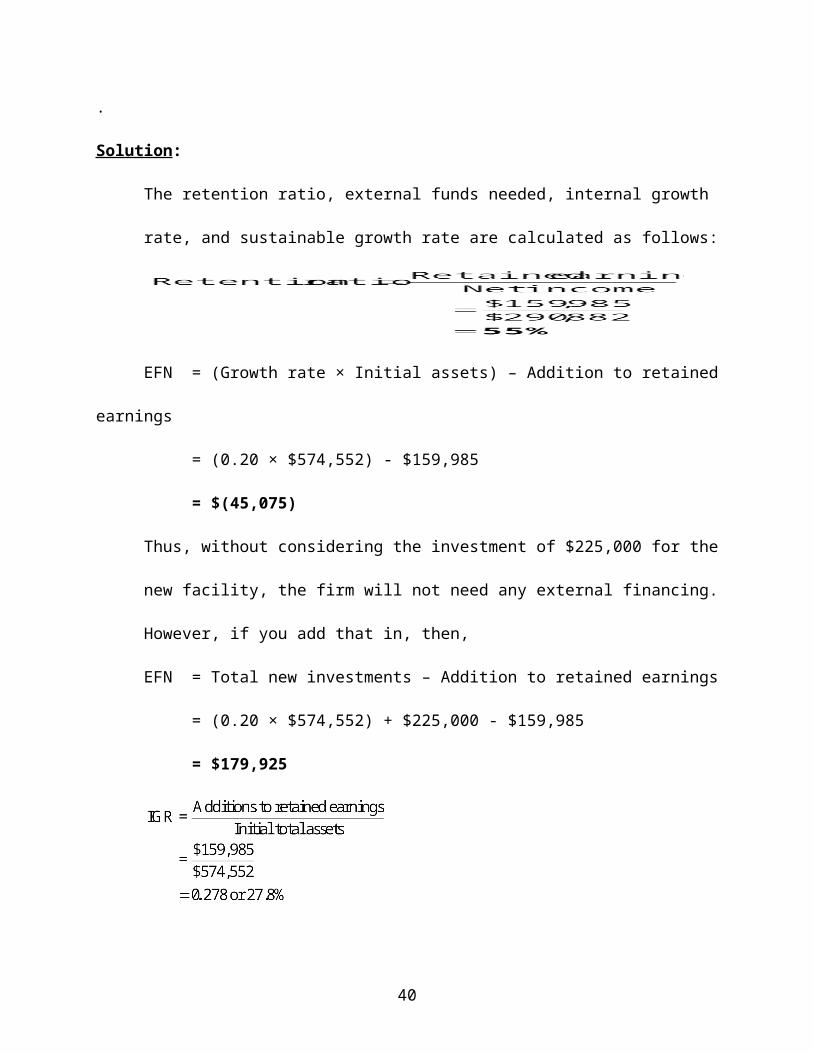
19.3 Use the financial statements from Problem 19.1 and the information from Problem 19.2.
Calculate the company’s retention ratio, external funds needed (EFN), internal growth
rate (IGR) and sustainable growth rate (SGR).
.
Solution:
The retention ratio, external funds needed, internal growth rate, and sustainable growth
rate are calculated as follows:
EFN = (Growth rate × Initial assets) – Addition to retained earnings
= (0.20 × $574,552) - $159,985
= $(45,075)
Thus, without considering the investment of $225,000 for the new facility, the firm will
not need any external financing. However, if you add that in, then,
EFN = Total new investments – Addition to retained earnings
= (0.20 × $574,552) + $225,000 - $159,985
= $179,925
28
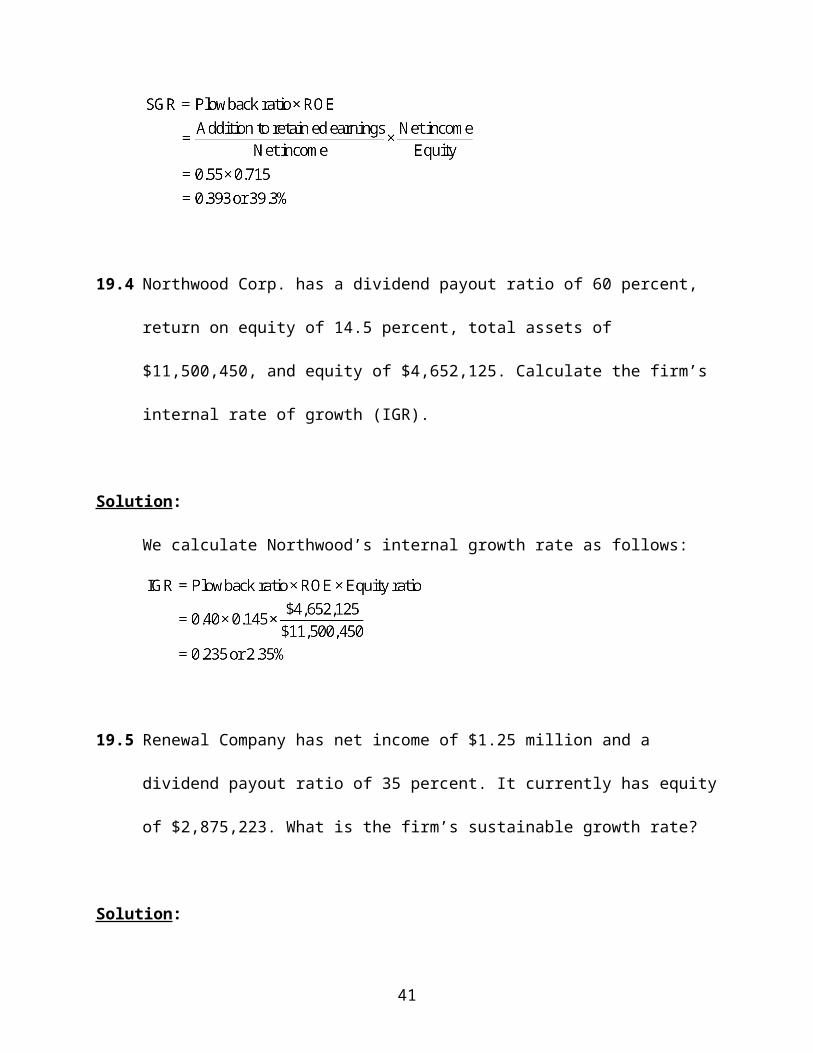
19.4 Northwood Corp. has a dividend payout ratio of 60 percent, return on equity of 14.5
percent, total assets of $11,500,450, and equity of $4,652,125. Calculate the firm’s
internal rate of growth (IGR).
Solution:
We calculate Northwood’s internal growth rate as follows:
19.5 Renewal Company has net income of $1.25 million and a dividend payout ratio of 35
percent. It currently has equity of $2,875,223. What is the firm’s sustainable growth rate?
Solution:
Renewal’s sustainable growth rate is:
29
VII. Critical Thinking Questions
19.1 What is financial planning? What are the four types of plans in financial planning?
Financial planning is the process by which a company’s management identifies the best
investment opportunities from a strategic perspective and determines how to finance
these investments. The end result is referred to as a financial plan. The four plans in
financial planning are the strategic plan, the investment plan or capital budget, the
financing plan, and the cash budget.
19.2 Why is the capital budget an important part of a firm’s financial planning?
The strategic plan of a firm determines the investments the company will make, and the
capital budget describes in detail all the firm’s planned spending on productive assets like
plant and equipment.
19.3 Why do financing and investment decisions have to be made concurrently?
Any investment decision has to be linked to a source of funds to pay for the assets, and
hence the investment decision and the financing decision have to be made concurrently.
19.4 Explain how sales can be used to develop pro forma financial statements.
30
The forecasted sales can be the basis for a financial planning model and is called the
percent of sales method. In such a framework, all financial statement accounts vary
directly with the level of sales.
19.5 Why are sales not always a good measure to forecast fixed assets?
When a percent of sales method is used to prepare pro forma financial statements, the
issue of whether or not a firm is operating at full capacity is ignored. Only if the firm is
operating at full capacity does fixed assets vary directly with sales. If a firm has excess
capacity, then sales can increase without a need to invest in additional fixed assets.
Two industries that may be considered to be capital intensive are the electric utilities
industry and the aluminum processing industry.
19.6 List all the accounts affected by the “plug” value. How does this value help managers?
The plug value relates to the amount of external funds needed given a level of sales.
Thus, all the various sources of funds for a firm like short-term and long-term debt,
common equity, and retained earnings are affected by the plug value.
19.7 Explain why the fixed asset account may or may not vary with sales.
Generally, companies invest in fixed assets in large discrete amounts rather than in small,
continuous amounts. Thus, each investment in fixed assets can accommodate a further
31
growth in sales without calling for additional investment in plant and equipment. Only
after each level of sales is accomplished at full production capacity would management
have to consider another increase in fixed assets.
19.8 How does the dividend payout ratio affect the amount of funds needed to fund growth?
Any change in the dividend payout ratio directly affects the amount of funds retained by
the company. The higher the firm’s ratio for a given level of net income, the lower the
amount of retained earnings, and hence the larger will be the amount of external debt
financing.
19.9 Define internal growth rate (IGR). Identify the characteristics of a high-growth firm with
no external funds needed.
Internal growth rate (IGR) is the maximum growth rate a firm can sustain without
needing any external financing. Such firms have a high enough retention ratio to fund
growth, generate a high level of net income for every dollar of equity, and use low
amounts of leverage or debt financing.
19.10 What is sustainable growth rate? Why is it important?
Sustainable growth rate (SGR) is the maximum growth rate a firm can sustain without
needing any external equity financing, holding leverage constant. Holding the firm to a
32
sustainable growth rate allows the firm to avoid costly equity issues, thus reducing the
dilution of earnings. Whenever firms grow faster than the SGR, the firm is going to need
external financing and may have to resort to debt financing, which increases the
company’s risk.
33
VIII. Questions and Problems
BASIC
19.1 Strategic plan: Explain the importance of the strategic plan.
Solution:
The strategic plan is the blueprint for a company’s management that determines the
firm’s long-term goals, identifies the strategies to achieve these goals, and determines the
company’s ability to be competitive. It drives all decision making within the firm and
covers all areas of a firm’s operations.
19.2 Capital budget: What are the various steps in preparing a capital budget?
Solution:
First, management identifies all strategically acceptable investment opportunities and
ranks them based on their contribution to shareholder wealth. Next, the senior
management reviews the capital budget plan and may revise it, if necessary, based on
need and the amount they can finance.
19.3 Financing plan: What are the elements of a financing plan?
Solution:
34
First, the financing plan identifies the amount of external financing needed and where the
funds could be obtained from. Second the plan identifies the firm’s target capital
structure. Last, the plan identifies the firm’s dividend policy, which determines the
amount of funds that need to be raised by the company.
19.4 Financial planning: Identify the steps in the financial planning process.
Solution:
o Establish a set of financial goals.
o Identify the investment opportunities and financing alternatives.
o Employ a financial planning model.
o Evaluate the investment and financing choices and decide on the ones that are the
best fit for the firm.
o Prepare contingency plans for future use.
19.5 Financial modeling: List the various elements of financial modeling.
Solution:
The important elements of financial modeling are the sales forecast, economic
assumptions, pro forma statements, investment decisions, financing requirements, and the
“plug factor” that determines the source of the external funds needed.
19.6 Payout ratio: Define the retention ratio and the dividend payout ratio.
35
Solution:
The dividend payout ratio tells us how much of a firm’s earnings are paid to the
shareholders as dividends. The retention ratio is complementary to the payout ratio and
tells us how much of the firm’s earnings are retained in the firm.
Thus, the retention ratio equals:
19.7 Addition to retained earnings: Northwood, Inc., has revenue of $455,316 and costs of
$316,487, and pays a tax rate of 31 percent. If the firm pays out 45 percent of its earnings
as dividends every year, what is the amount of retained earnings and what is the firm’s
retention ratio?
Solution:
Revenue = $455,316 Costs = $316,487
Tax rate = 31% Payout ratio = 45%
Retained earnings = 95,792 (1-0.45)
= $52,686
Retention ratio =
36
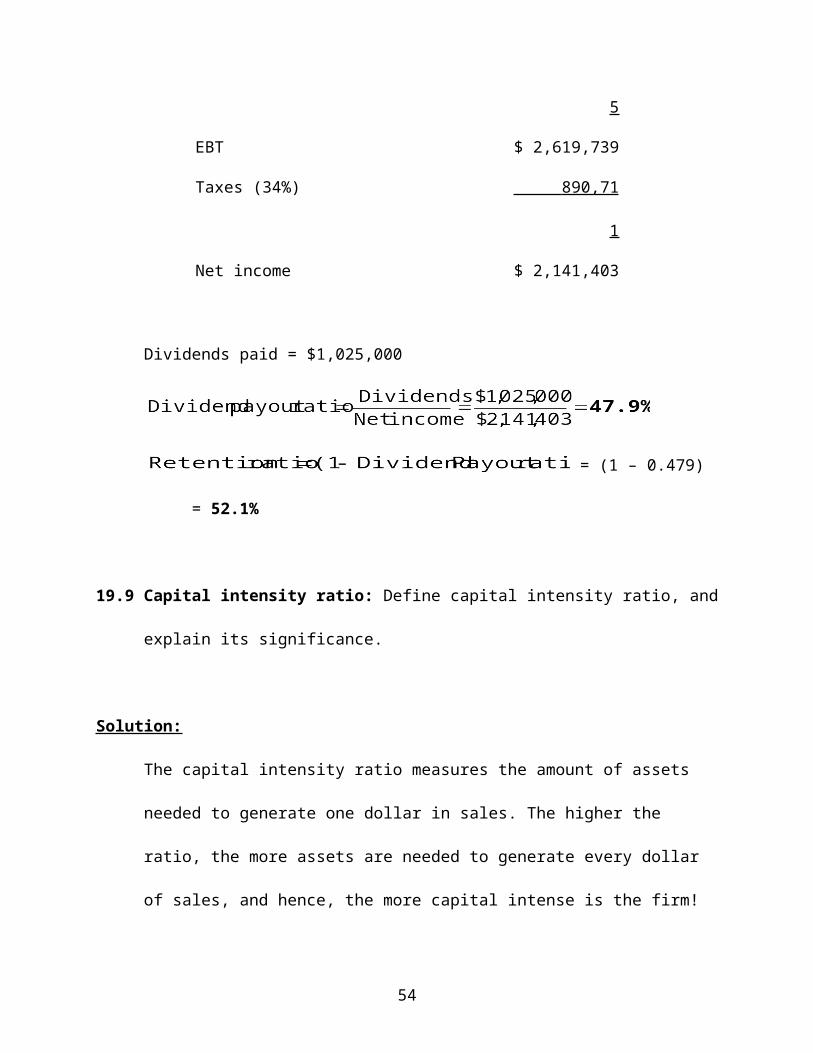
19.8 Payout and retention ratio: Goodwin Corp. has revenues of $12,112,659, costs of
$9,080,545, interest payments of $412,375, and a tax rate of 34 percent. It paid dividends
of $1,025,000 to its shareholders. Find the firm’s dividend payout ratio and retention
ratio.
Solution:
Goodwin Corp.
Revenues $12,112,659
Costs 9,080,545
EBIT $ 3,032,114
Interest 412,375
EBT $ 2,619,739
Taxes (34%) 890,711
Net income $ 2,141,403
Dividends paid = $1,025,000
= (1 – 0.479) = 52.1%
19.9 Capital intensity ratio: Define capital intensity ratio, and explain its significance.
Solution:
37
The capital intensity ratio measures the amount of assets needed to generate one dollar in
sales. The higher the ratio, the more assets are needed to generate every dollar of sales,
and hence, the more capital intense is the firm!
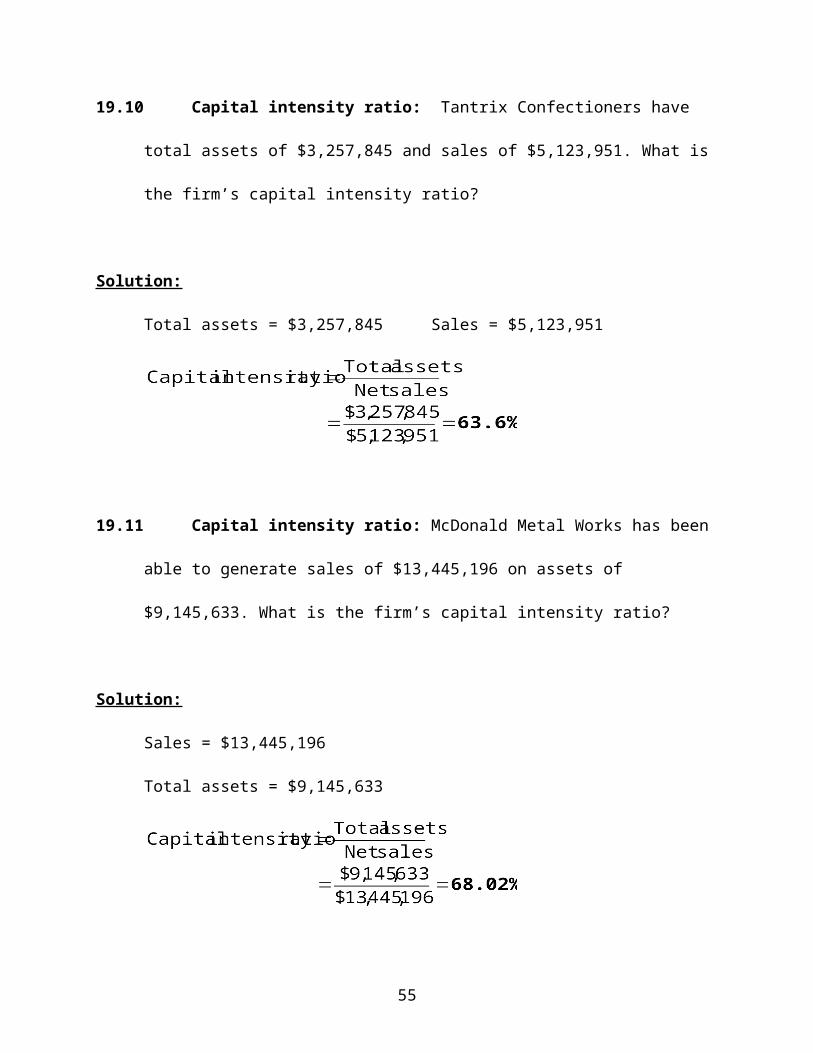
19.10 Capital intensity ratio: Tantrix Confectioners have total assets of $3,257,845 and sales
of $5,123,951. What is the firm’s capital intensity ratio?
Solution:
Total assets = $3,257,845 Sales = $5,123,951
19.11 Capital intensity ratio: McDonald Metal Works has been able to generate sales of
$13,445,196 on assets of $9,145,633. What is the firm’s capital intensity ratio?
Solution:
Sales = $13,445,196
Total assets = $9,145,633
38
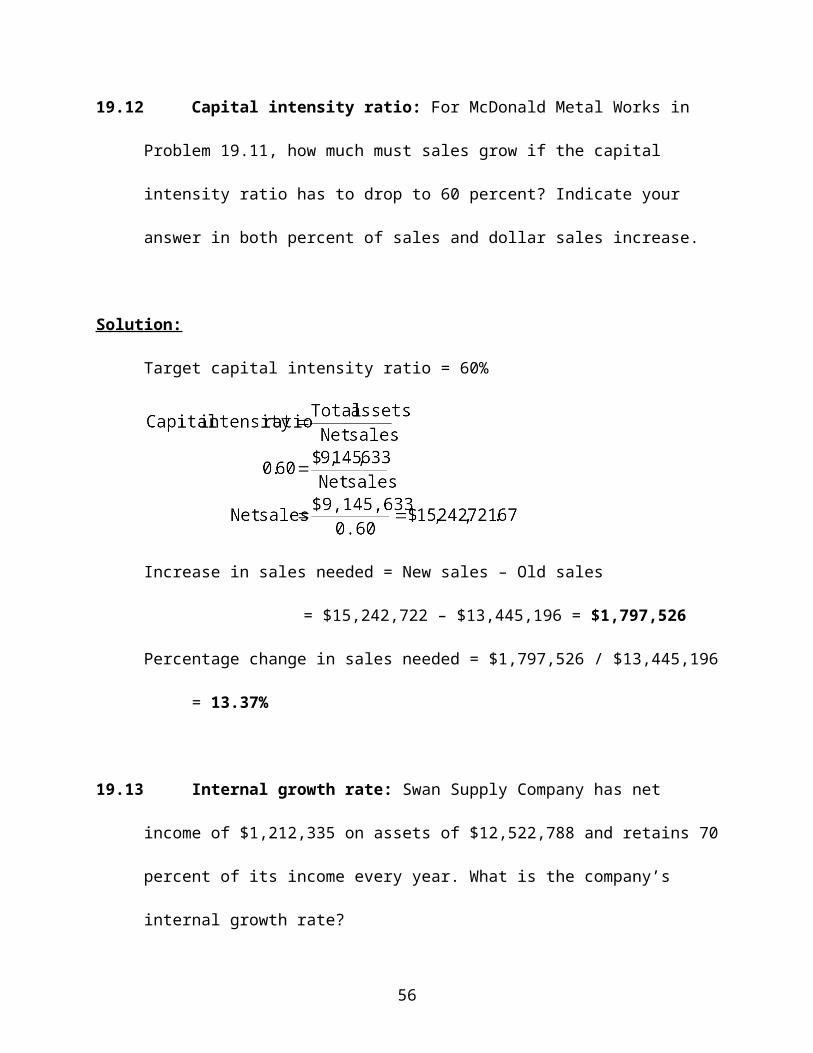
19.12 Capital intensity ratio: For McDonald Metal Works in Problem 19.11, how much must
sales grow if the capital intensity ratio has to drop to 60 percent? Indicate your answer in
both percent of sales and dollar sales increase.
Solution:
Target capital intensity ratio = 60%
Increase in sales needed = New sales – Old sales
= $15,242,722 – $13,445,196 = $1,797,526
Percentage change in sales needed = $1,797,526 / $13,445,196 = 13.37%
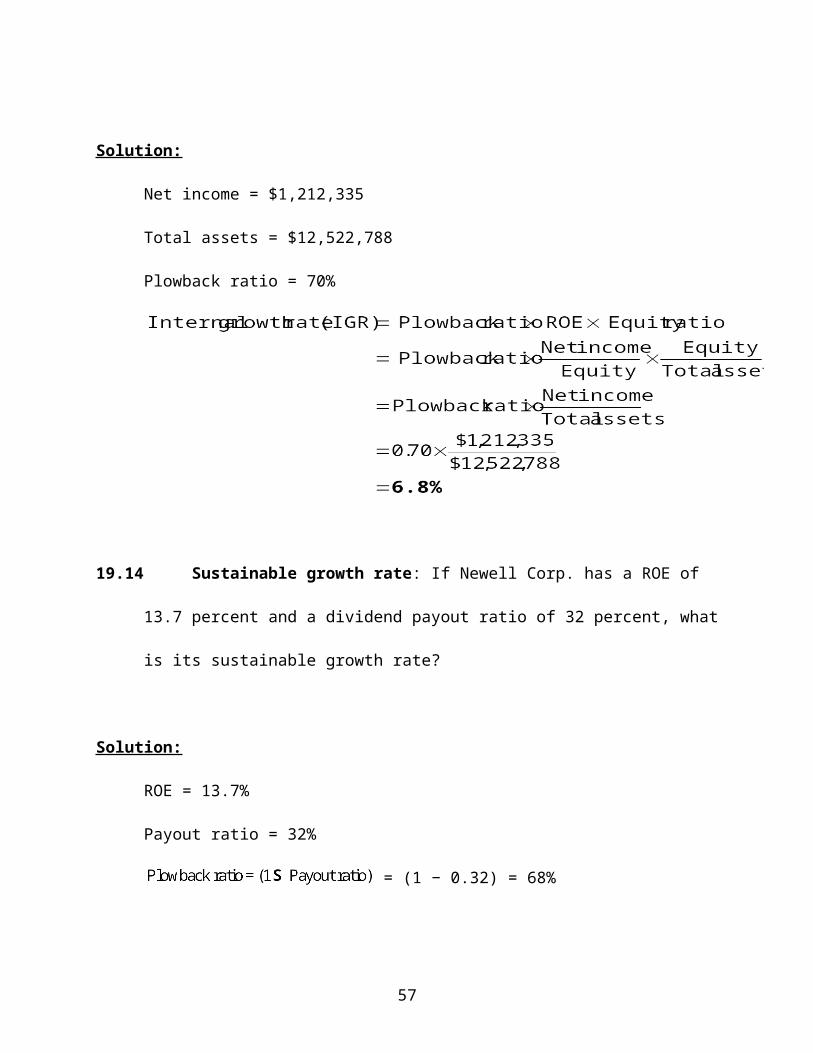
19.13 Internal growth rate: Swan Supply Company has net income of $1,212,335 on assets of
$12,522,788 and retains 70 percent of its income every year. What is the company’s
internal growth rate?
Solution:
Net income = $1,212,335
Total assets = $12,522,788
Plowback ratio = 70%
39
19.14 Sustainable growth rate: If Newell Corp. has a ROE of 13.7 percent and a dividend
payout ratio of 32 percent, what is its sustainable growth rate?
Solution:
ROE = 13.7%
Payout ratio = 32%
= (1 − 0.32) = 68%
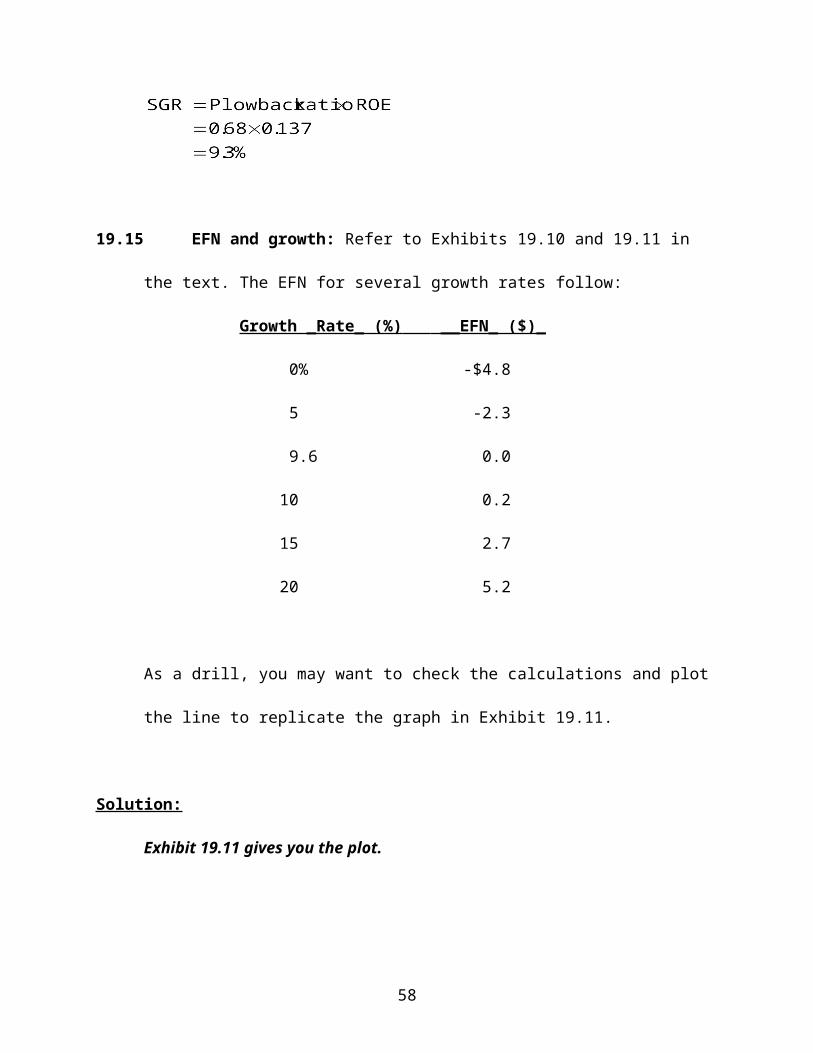
19.15 EFN and growth: Refer to Exhibits 19.10 and 19.11 in the text. The EFN for several
growth rates follow:
Growth _Rate_ (%) __EFN_ ($)_
0% -$4.8
5 -2.3
9.6 0.0
10 0.2
15 2.7
40
20 5.2
As a drill, you may want to check the calculations and plot the line to replicate the graph
in Exhibit 19.11.
Solution:
Exhibit 19.11 gives you the plot.
INTERMEDIATE
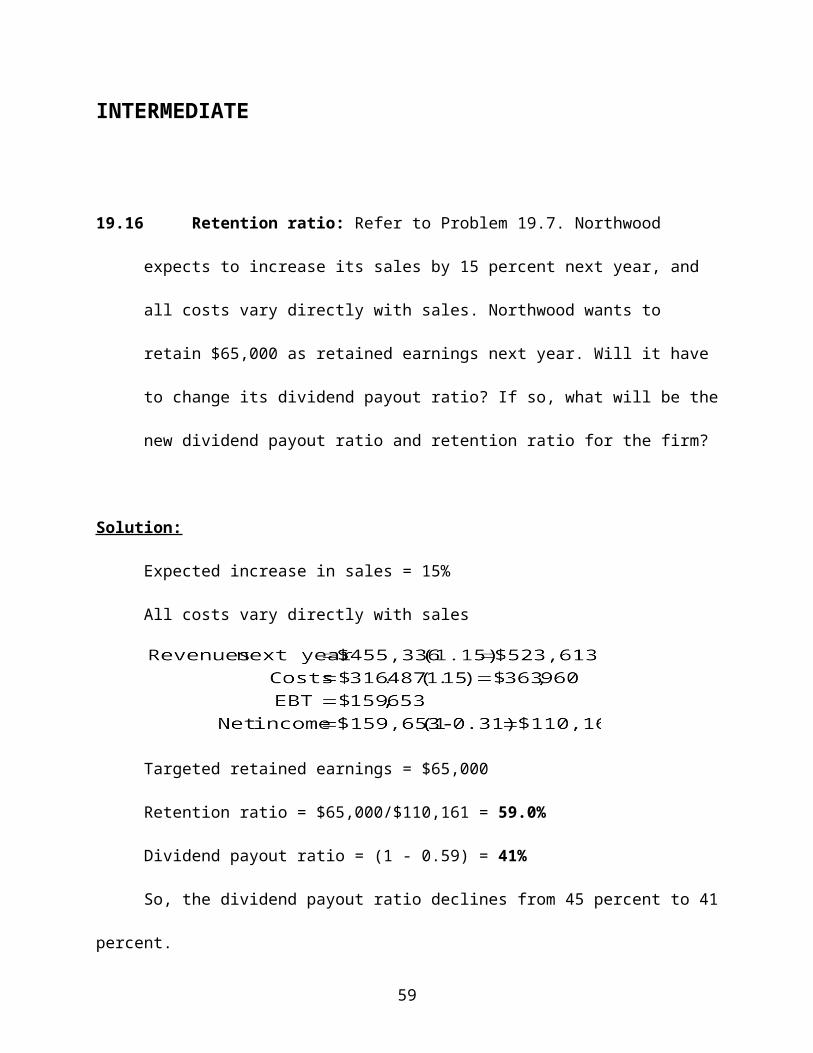
19.16 Retention ratio: Refer to Problem 19.7. Northwood expects to increase its sales by 15
percent next year, and all costs vary directly with sales. Northwood wants to retain
$65,000 as retained earnings next year. Will it have to change its dividend payout ratio?
If so, what will be the new dividend payout ratio and retention ratio for the firm?
Solution:
Expected increase in sales = 15%
All costs vary directly with sales
Targeted retained earnings = $65,000
Retention ratio = $65,000/$110,161 = 59.0%
41

Dividend payout ratio = (1 - 0.59) = 41%
So, the dividend payout ratio declines from 45 percent to 41 percent.
19.17 Capital intensity: Identify two industries (other than airlines) that are capital intensive.
Using online or other data sources, compute the capital-intensive ratio for the largest firm
in each of the chosen industries.
Solution:
Two industries that may be considered to be capital intensive are the electric utilities
industry and the aluminum processing industry.
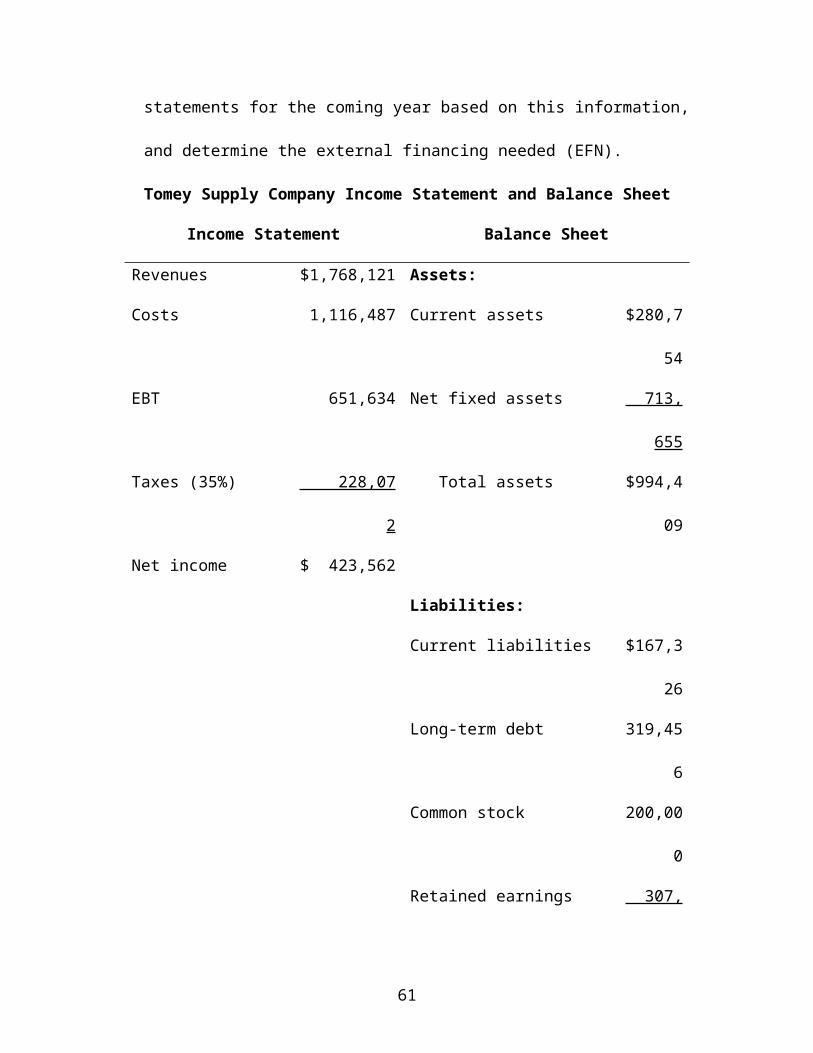
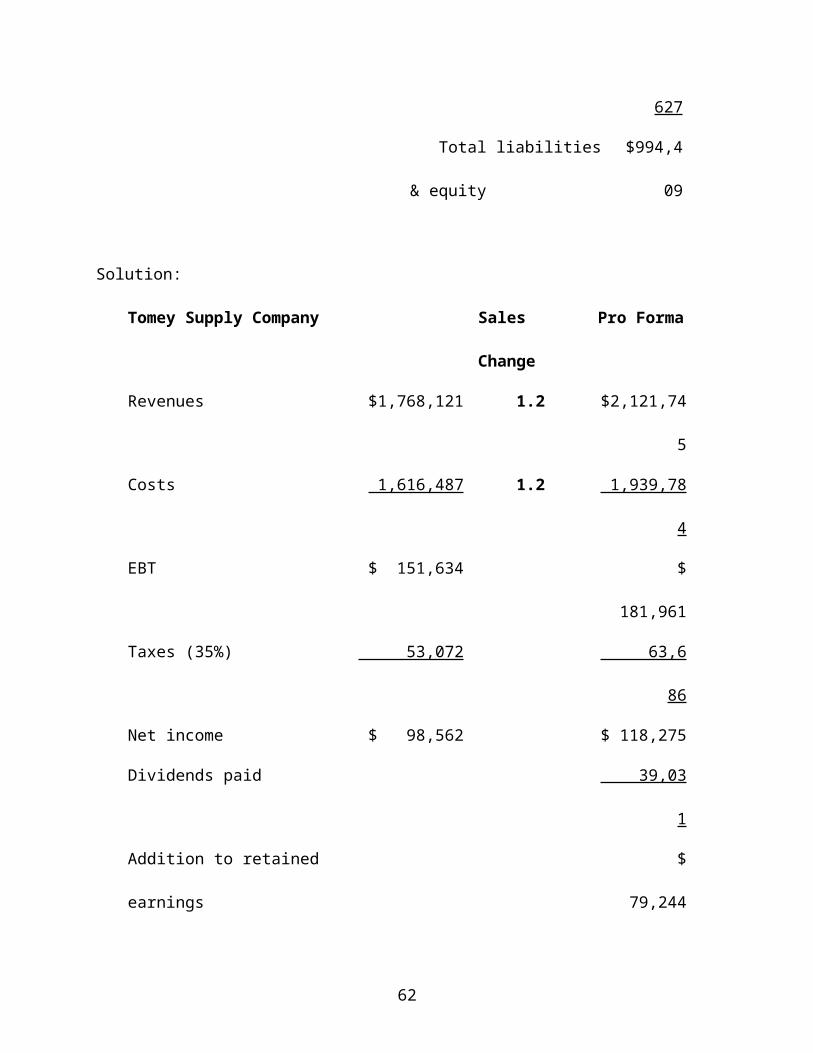
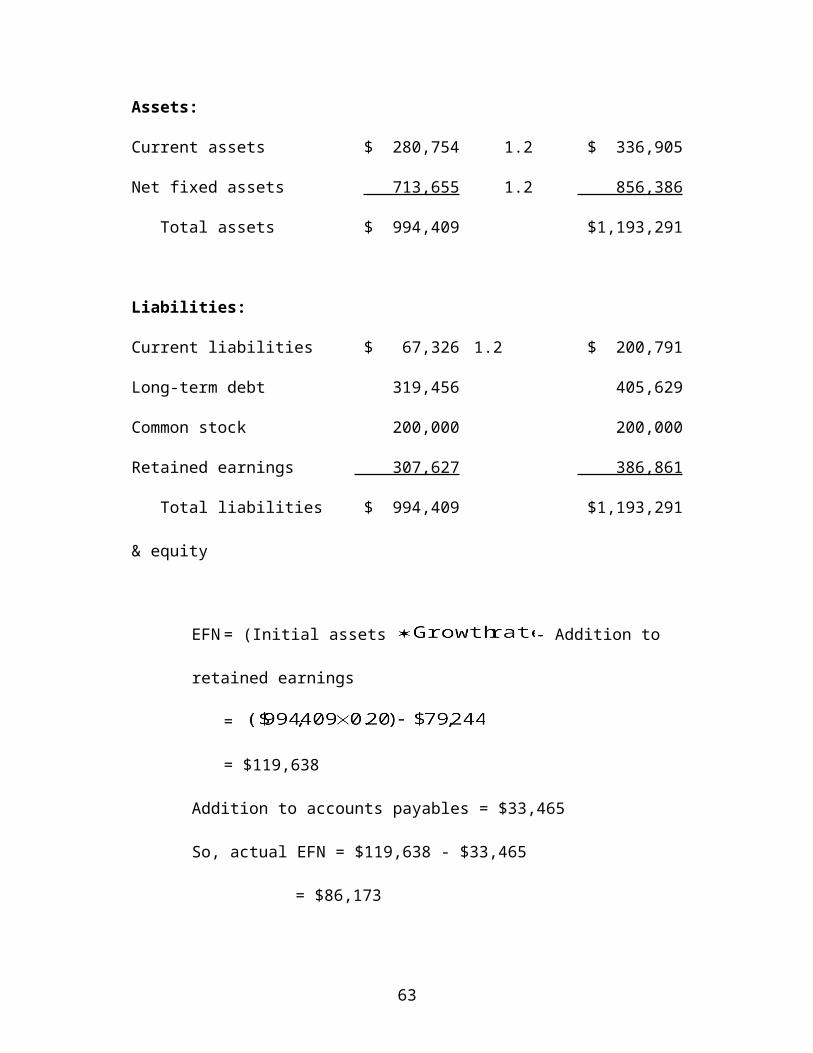
19.18 Percent of sales: Tomey Supply Company’s financial statement for the most recent fiscal
year is shown in the following table. The company projects that sales will increase by 20
percent next year. Assume that all costs and assets increase directly with sales. The
company has a constant 33 percent dividend payout ratio and has no plans to issue new
equity. Any financing needed will be in the form of long-term debt. Prepare pro forma
financial statements for the coming year based on this information, and determine the
external financing needed (EFN).
Tomey Supply Company Income Statement and Balance Sheet
Income Statement Balance Sheet
Revenues $1,768,121 Assets:
Costs 1,116,487 Current assets $280,754
EBT 651,634 Net fixed assets 713,655
42
Taxes (35%) 228,072 Total assets $994,409
Net income $ 423,562
Liabilities:
Current liabilities $167,326
Long-term debt 319,456
Common stock 200,000
Retained earnings 307,627
Total liabilities & equity $994,409
Solution:
Tomey Supply Company Sales Change Pro Forma
Revenues $1,768,121 1.2 $2,121,745
Costs 1,616,487 1.2 1,939,784
EBT $ 151,634 $ 181,961
Taxes (35%) 53,072 63,686
Net income $ 98,562 $ 118,275
Dividends paid 39,031
Addition to retained earnings $ 79,244
Assets:
Current assets $ 280,754 1.2 $ 336,905
Net fixed assets 713,655 1.2 856,386
Total assets $ 994,409 $1,193,291
43
Liabilities:
Current liabilities $ 67,326 1.2 $ 200,791
Long-term debt 319,456 405,629
Common stock 200,000 200,000
Retained earnings 307,627 386,861
Total liabilities & equity $ 994,409 $1,193,291
EFN= (Initial assets - Addition to retained earnings
=
= $119,638
Addition to accounts payables = $33,465
So, actual EFN = $119,638 - $33,465
= $86,173
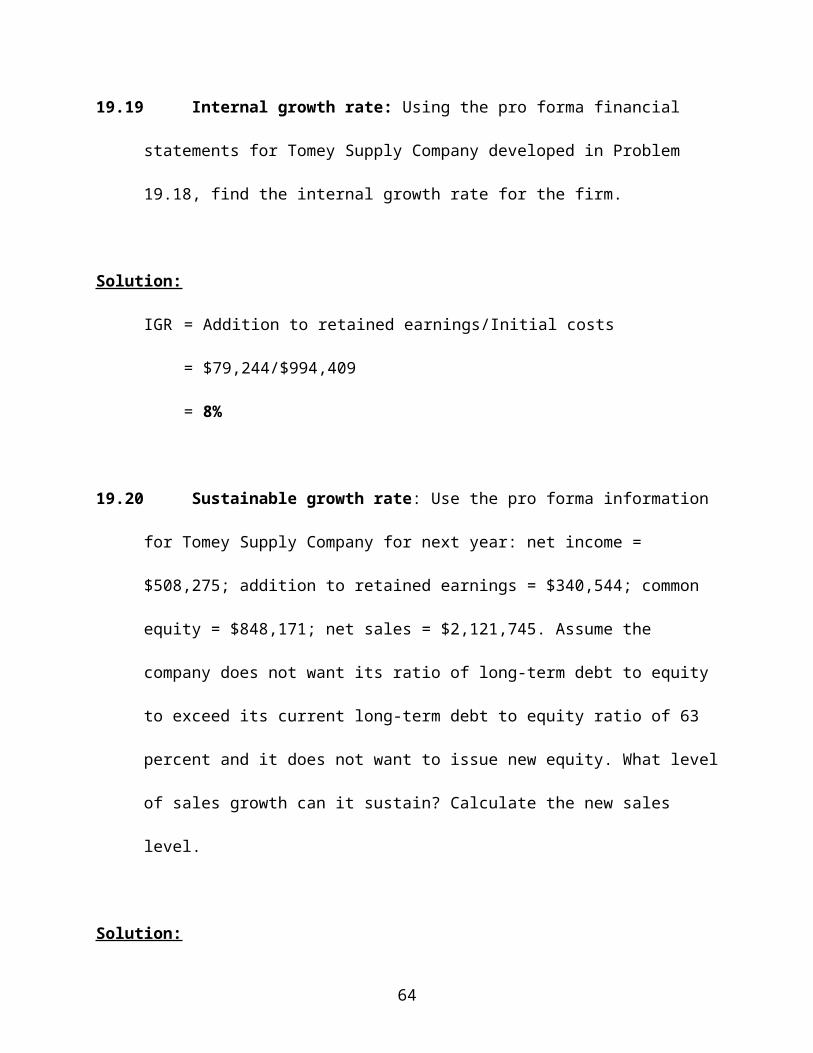
19.19 Internal growth rate: Using the pro forma financial statements for Tomey Supply
Company developed in Problem 19.18, find the internal growth rate for the firm.
Solution:
IGR = Addition to retained earnings/Initial costs
= $79,244/$994,409
= 8%
44
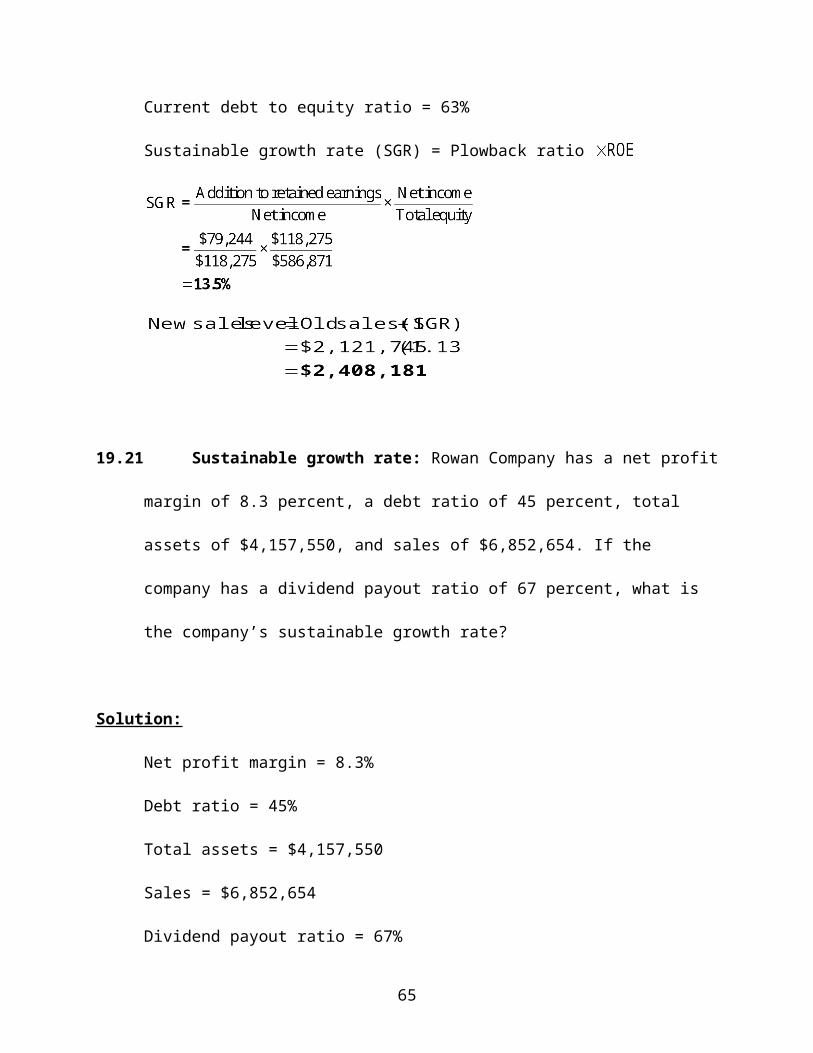
19.20 Sustainable growth rate: Use the pro forma information for Tomey Supply Company
for next year: net income = $508,275; addition to retained earnings = $340,544; common
equity = $848,171; net sales = $2,121,745. Assume the company does not want its ratio
of long-term debt to equity to exceed its current long-term debt to equity ratio of 63
percent and it does not want to issue new equity. What level of sales growth can it
sustain? Calculate the new sales level.
Solution:
Current debt to equity ratio = 63%
Sustainable growth rate (SGR) = Plowback ratio
19.21 Sustainable growth rate: Rowan Company has a net profit margin of 8.3 percent, a debt
ratio of 45 percent, total assets of $4,157,550, and sales of $6,852,654. If the company
has a dividend payout ratio of 67 percent, what is the company’s sustainable growth rate?
Solution:
Net profit margin = 8.3%
Debt ratio = 45%
45
Total assets = $4,157,550
Sales = $6,852,654
Dividend payout ratio = 67%
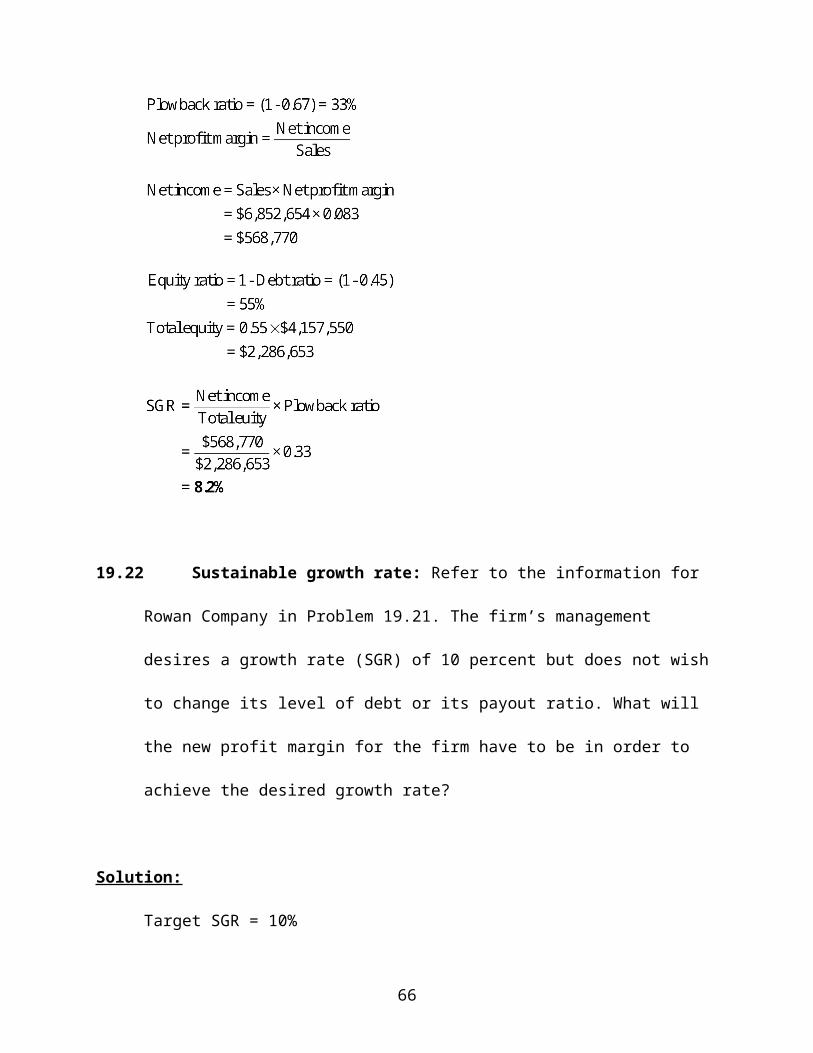
19.22 Sustainable growth rate: Refer to the information for Rowan Company in Problem
19.21. The firm’s management desires a growth rate (SGR) of 10 percent but does not
wish to change its level of debt or its payout ratio. What will the new profit margin for
the firm have to be in order to achieve the desired growth rate?
Solution:
Target SGR = 10%
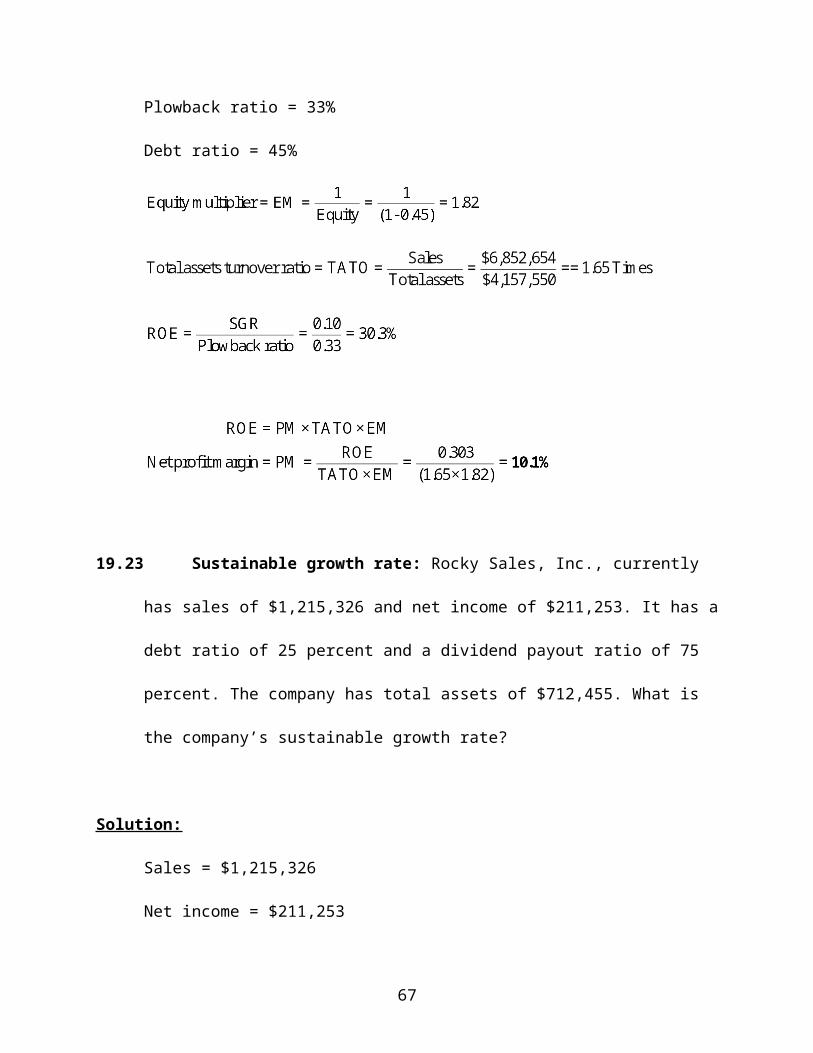
Plowback ratio = 33%
46
Debt ratio = 45%
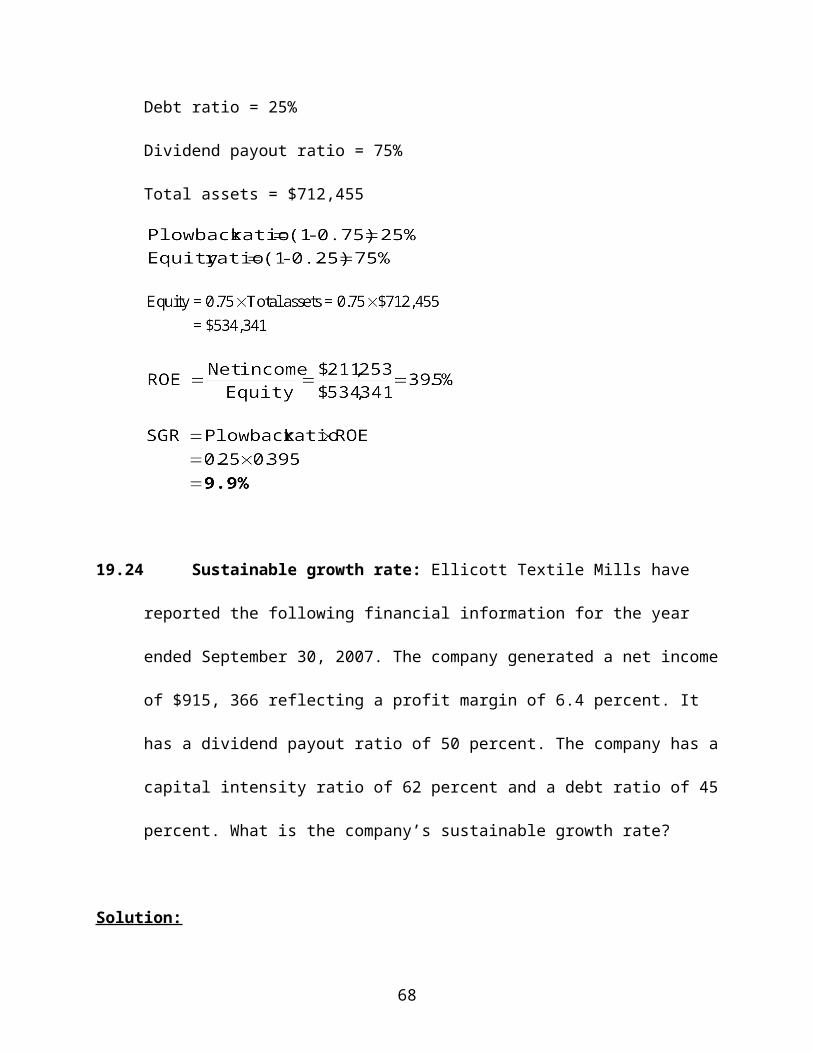
19.23 Sustainable growth rate: Rocky Sales, Inc., currently has sales of $1,215,326 and net
income of $211,253. It has a debt ratio of 25 percent and a dividend payout ratio of 75
percent. The company has total assets of $712,455. What is the company’s sustainable
growth rate?
Solution:
Sales = $1,215,326
Net income = $211,253
Debt ratio = 25%
Dividend payout ratio = 75%
Total assets = $712,455
47
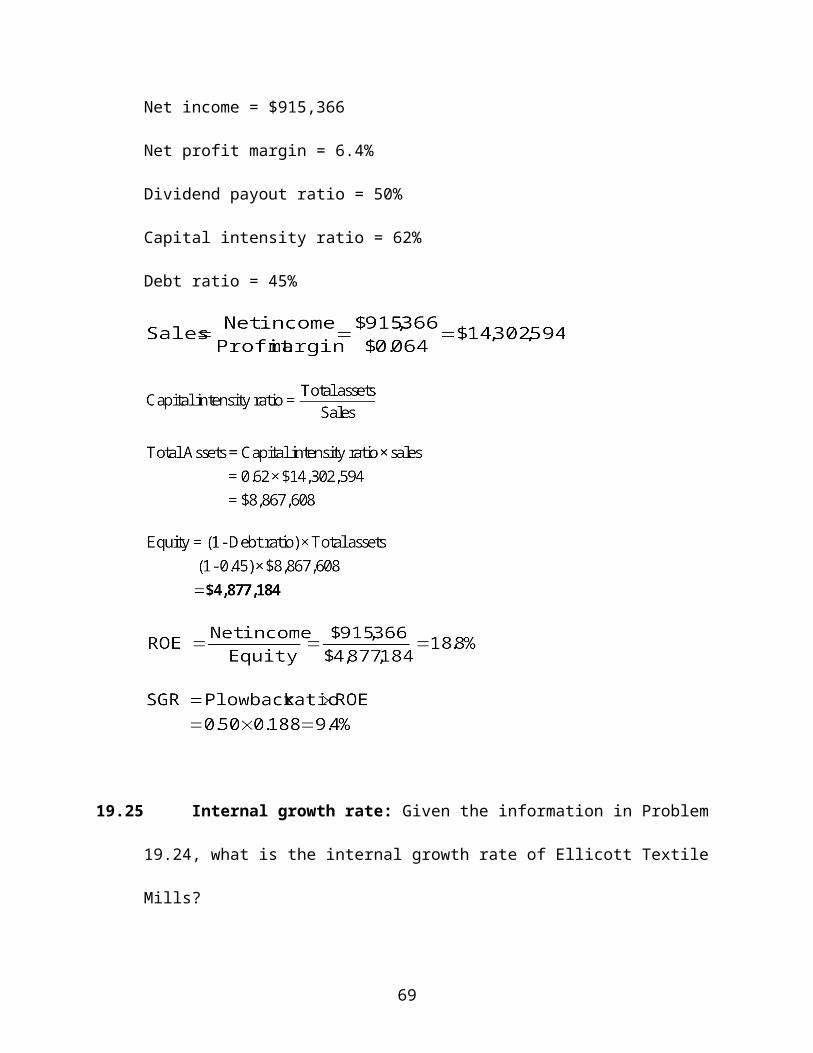
19.24 Sustainable growth rate: Ellicott Textile Mills have reported the following financial
information for the year ended September 30, 2007. The company generated a net income
of $915, 366 reflecting a profit margin of 6.4 percent. It has a dividend payout ratio of 50
percent. The company has a capital intensity ratio of 62 percent and a debt ratio of 45
percent. What is the company’s sustainable growth rate?
Solution:
Net income = $915,366
Net profit margin = 6.4%
Dividend payout ratio = 50%
Capital intensity ratio = 62%
Debt ratio = 45%
48
19.25 Internal growth rate: Given the information in Problem 19.24, what is the internal
growth rate of Ellicott Textile Mills?
Solution:
19.26 Internal growth rate: Fantasy Travel Company has a return on equity of 17.5 percent,
an equity ratio of 65 percent, and a dividend payout ratio of 75 percent. What is the
company’s internal growth rate?
Solution:
ROE = 17.5%
Equity ratio = 65%
Dividend payout ratio = 75%
Plowback ratio = 25%
49
19.27 EFN: Maryland Micro Brewers have for the year ended September 30, 2008, generated
revenues of $12,125,800 with a 72 percent capital intensity ratio. Its net income was
$873,058. With the introduction of half a dozen new specialty beers, the brewery expects
to grow its sales by 15 percent next year. Assume that all costs vary directly with sales
and the firm maintains its dividend payout ratio of 70 percent. What will be the external
financing (EFN) needed by this firm? If the company wanted to raise no more than
$750,000 externally and was not averse to adjusting its payout policy, what will be the
new dividend payout ratio?
Solution:
Total sales = $12,125,800
Capital intensity ratio = 72%
Net income = $873,058
Dividend payout ratio = 70%
50
Target EFN = $750,000
19.28 EFN: Ritchie Marble Company has total assets of $12,899,450, sales of $18,174,652, and
net income of $4,589,774. The company expects its sales to grow by 25 percent next
year. All assets and costs (including taxes) vary directly with sales, and the firm expects
to maintain its payout ratio of 65 percent. Calculate the external financing needed (EFN).
Solution:
Total assets = $12,899,450
Sales = $18,174,652
Net income = $4,589,774
Expected growth rate = 25%
Expected net income = $4,589,774 (1.25) = $5,737,217.50
Payout ratio = 65%
51
19.29 EFN: Norton Group, Inc., expects to add $1,213,777 to retained earnings and currently
has total assets of $23,159,852. If the company has the ability to borrow up to $1 million,
how much growth can the firm support if it is willing to borrow to its maximum capacity?
Solution:
Addition to retained earnings = $1,213,777
Total Assets = $23,159,852
EFN = $1,000,000
(AU: Initial cap needed, e.g., Addition to retained earnings)
19.30 Maximum sales growth: Rockville Consulting Group expects to add $271,898 to
retained earnings this year. The company has total assets of $3,425,693 and wishes to add
no new external funds for the coming year. If assets and costs vary directly with sales,
how much sales growth can the company support while retaining an EFN of zero? What
is the firm’s internal growth rate?
52
Solution:
Addition to retained earnings = $271,898
Total assets = $3,425,693
EFN = 0
With no external financing, the maximum possible growth equals the internal growth
rate.
ADVANCED
19.31 The financial statements for the year ended June 30, 2008, are given for Morgan
Construction Company. The firm’s revenues are projected to grow at a rate of 25 percent
next year, and all financial statement accounts will vary directly with sales. Based on that
projection, develop a pro forma balance sheet and an income statement for the 2007–2008
fiscal year.
Morgan Construction Company Balance Sheet and Income Statement
for Fiscal Year Ended June 30,2008
Balance Sheet
53
Assets: Liabilities and Stockholders’ Equity:
Cash $ 3,349,239 Accounts payables $ 9,041,679
Accounts receivables 5,830,754 Notes payables 4,857,496
Inventories 22,267,674
Total current assets $31,447,667 Total current liabilities $13,899,175
Net fixed assets 43,362,482 Long-term debt 29,731,406
Other assets 1,748,906 Common stock 19,987,500
Retained earnings 12,940,974
Total assets $76,559,055 Total liabilities and equity $76,559,055
Income Statement
Revenues $193,212,500
Costs 145,265,625
EBITDA $ 47,946,875
Depreciation 23,318,750
EBIT $ 24,628,125
Interest 11,935,869
EBT $ 12,692,256
Taxes (35%) 4,442,290
Net income $ 8,249,966
54
Solution:
Morgan Construction Company—Pro Forma Balance Sheet for Year Ended June 20, 2009
2008 2009 2008 2009
Cash $ 3,349,239 1.25 $ 4,186,548 Accounts payable $ 9,041,679 1.25 $11,302,098
Accounts receivables 5,830,754 1.25 7,288,442 Notes payable 4,857,496 1.25 6,071,869
Inventories 22,267,674 1.25 27,834,593
Total current assets $31,447,666 $39,309,583 Total current liabilities $13,899,174 $17,373,968
Net fixed assets 43,362,482 1.25 54,203,102 Long-term debt 29,371,406 1.25 37,164,258
Other assets 1,748,482 1.25 2,186,133 Common stock 19,987,500 1.25 24,984,375
Retained earnings 12,940,974 1.25 16,176,217
Total assets $76,559,054 $95,698,818 Total liabilities & equity $76,559,054 $95,698,818
Pro Forma Income Statement for Year Ended June 30, 2009
2008 2009
Revenues $193,212,500 1.25 $241,515,625
Costs 145,265,625 1.25 181,582,031
EBITDA $ 47,946,875 $ 59,933,594
55
Depreciation 23,318,750 1.25 29,148,438
EBIT $ 24,628,125 $ 30,785,156
Interest 11,935,869 1.25 14,919,836
EBT $ 12,692,256 $ 15,865,320
Taxes (35%) 4,442,290 1.25 5,552,862
Net income $ 8,249,967 $ 10,312,458
56
19.32 Use the financial information for Morgan Construction Company from Problem 19.31.
Assume now that equity accounts do not vary directly with sales but change when
retained earning change or new equity is issued. The company pays 75 percent of its
income as dividend every year. In addition, the company plans to increase production
capacity by expanding the current facility and acquiring additional equipment. This will
cost the firm $10 million. The firm has no plans to issue new equity this year. Prepare a
pro forma balance sheet using this information. Any funds that need to be raised (in
addition to changes in current liabilities) will be in the form of long-term debt. What is
the external financing needed in this case?
57
Solution:
Retention ratio = 25% Net income in 2007 = $10,312,458
Addition to retained earnings = $2,578,114.50 or $2,578,115
Morgan Construction Company—Pro Forma Balance Sheet for Year Ended June 20, 2009
2008 2009 2008 2009
Cash $ 3,349,239 1.25 $ 4,186,548 Accounts payable $ 9,041,679 1.25 $11,302,098
Accounts receivables 5,830,754 1.25 7,288,442 Notes payable 4,857,496 1.25 6,071,869
Inventories 22,267,674 1.25 27,834,593
Total current assets $31,447,666 $ 39,309,583 Total current liabilities $13,899,174 $ 17,373,968
Net fixed assets 43,362,482 1.25 54,203,102 Long-term debt 29,371,406 1.25 52,818,262
Addition to fixed assets 10,000,000 Common stock 19,987,500 1.25 19,987,500
Other assets 1,748,482 1.25 2,186,133 Retained earnings 12,940,974 1.25 12,940,974
Total assets $76,559,054 $105,698,818 Total liabilities & equity $76,559,054 $105,698,818
58
19.33 Using the information for Morgan Construction Company in the preceding problem, calculate the firm’s internal growth rate
and sustainable growth rate.
Solution:
19.34 Use the information for Morgan Construction Company from Problems 19.31 and 19.32. Assume that equity accounts do not
vary directly with sales but change when retained earnings change or new equity is issued. The company’s long-term-debt-to-
equity ratio is approximately 90 percent, and its equity-to-total-assets ratio is about 43 percent. The company wishes to
increase its equity-to-total-assets ratio to at least 50 percent. It is willing to reduce its payout ratio but will retain no more than
40 percent of its retained earnings. The company will raise any additional funds needed, including for expansion in new equity.
No new long-term debt will be issued. Prepare pro forma statements to reflect the new scenario.
a. What is the external financing needed (EFN) to accommodate the expected growth?
59
b. What is the firm’s internal growth rate (IGR)?
c. What is the firm’s sustainable growth rate (SGR)?
d. How much new equity will the firm have to issue?
e. What is the firm’s new equity ratio and debt to equity ratio?
Solution:
a. Retention ratio = 40%
b.
c.
d. Retained earnings in 2009 = $12,940,974 + $4,124,983 = $17,069,957
Total liabilities and equity = $105,698,818
Current liabilities = $17,373,968
Common equity = $105,698,818 – ($17,373,968+$29,731,406+$17,069,957)
= $41,523,486
60
Common equity in 2008 = $19,987,500
New common equity issued = $41,523,486 - $19,987,500 = $21,535,986
e.
EFN including expansion = $25,839,777
Morgan Construction Company—Pro Forma Balance Sheet for Year Ended June 20, 2009
2008 2009 2008 2009
Cash $ 3,349,239 1.25 $ 4,186,548 Accounts payable $ 9,041,679 1.25 $11,302,098
Accounts receivables 5,830,754 1.25 7,288,442 Notes payable 4,857,496 1.25 6,071,869
Inventories 22,267,674 1.25 27,834,593
Total current assets $31,447,666 $ 39,309,583 Total current liabilities $13,899,174 $ 17,373,968
Net fixed assets 43,362,482 1.25 54,203,102 Long-term debt 29,371,406 1.25 52,818,262
Addition to fixed assets 10,000,000 Common stock 19,987,500 1.25 19,987,500
Other assets 1,748,482 1.25 2,186,133 Retained earnings 12,940,974 1.25 12,940,974
Total assets $76,559,054 $105,698,818 Total liabilities & equity $76,559,054 $105,698,818
61
19.35 Munson Communications Company has just reported earnings for the year ended June 30, 2008. Given here are the firm’s
Income Statement and Balance Sheet. The company has a 55 percent dividend payout ratio for the last 10 years and does not
plan to make any changes in its policy. Based on internal forecasts, the company expects the demand for its products to grow at
a rate of 20 percent for the next year, and it has projected the sales growth for 2009 to be right at 20 percent. Assume that
equity accounts and long-term debt do not vary directly with sales but change when retained earning change or additional
capital is issued.
Munson Communications Company Balance Sheet and Income Statement
for Fiscal Year Ended June 30,2008
Balance Sheet
Assets: Liabilities and Stockholders’ Equity:
Cash $ 1,728,639 Accounts payables $ 4,666,673
Accounts receivables 3,009,421 Notes payables 2,507,094
Inventories 11,492,993
Total current assets $16,231,054 Total current liabilities $ 7,173,767
Net fixed assets 22,380,636 Long-term debt 13,345,242
Other assets 1,748,906 Common stock 10,165,235
62
Retained earnings 9,676,351
Total assets $40,360,595 Total liabilities and equity $40,360,595
Income Statement
Revenues $79,722,581
Costs 59,358,499
EBITDA $20,364,082
Depreciation 7,318,750
EBIT $13,045,332
Interest 3,658,477
EBT $ 9,386,855
Taxes (35%) 3,285,399
Net income $ 6,101,456
a. What is the firm’s internal growth rate (IGR)?
b. What is the firm’s sustainable growth rate (SGR)?
63
c. What is the external financing needed (EFN) to accommodate the expected growth?
d. Construct the firm’s 2008 pro forma financial statements under the assumption that all external financing will be done
with long-term debt.
Solution:
a. Retention ratio = 45.0%
Net income in 2008 = $ 6,101,456
Expected net income in 2008 = $6,101,456 (1.20) = $7,321,747
Addition to retained earnings = $ 3,294,786
ROE = 30.8%
Growth rate = 20%
b.
c.
d.
64
Munson Communications Company—Pro Forma Balance Sheet for Year Ended June 20, 2009
2008 2009 2008 2009
Cash $ 1,728,639 1.20 $ 2,074,367 Accounts payable 4,666,673 1.20 $ 5,600,007
Accounts receivables 3,009,421 1.20 3,611,305 Notes payable 2,507,094 1.20 3,008,513
Inventories 11,492,993 1.20 13,791,592
Total current assets $16,231,054 $19,477,264 Total current liabilities $ 7,173,767 $ 8,608,521
Net fixed assets 22,380,635 1.20 26,856,763 Long-term debt 13,345,242 1.20 17,236,953
Other assets 1,748,906 1.20 2,098,688 Common stock 10,165,235 1.20 10,165,235
Retained earnings 9,676,351 1.0 12,422,006
Total assets $40,360,595 $48,432,714 Total liabilities & equity $40,360,595 $48,432,714
Pro Forma Income Statement for Year Ended June 30, 2009
2008 2009
Revenues $79,722,581 1.20 $95,667,097
Costs 59,358,499 1.20 71,230,199
EBITDA $20,364,082 $24,436,898
Depreciation 7,318,750 1.20 8,782,500
65
EBIT $13,045,332 $15,654,398
Interest 3,658,477 1.20 4,390,172
EBT $ 9,386,855 $11,264,226
Taxes (35%) 3,285,399 1.20 3,942,479
Net income $ 6,101,456 $ 7,321,747
66
Sample Test Problems
19.1 Mercury Corp. has produced revenues of $2,512,654, costs of $1,080,227, interest
payments of $132,375 and a tax rate of 34 percent. It paid dividends of $525,000 to its
shareholders. Find the firm’s dividend payout ratio and retention ratio.
Solution:
Net income = ($2,512,654 – $1,080,227 – $132,375)(1 – 0.34) = $858,034.32
Retention ratio= 1 – Dividend payout ratio = (1 – 0.6119) = 0.3881
= 38.81%
19.2 Assume that Rex Corp. was operating at a capital intensity ratio of 63.5 percent and is
able to generate net sales of $3,123,443. What is the firm’s level of assets?
Solution:
Net sales = $3,123,443
67
19.3 Centennial Beverages currently has sales of $1,415,326 and net income of $411,253. It
has a debt ratio of 25 percent and a dividend payout ratio of 70 percent. The company has
total assets of $1,850,325. What is the company’s sustainable growth rate?
Solution:
Payout ratio = 70%
= (1 - 0.70) = 30%
19.4 Given the information in Problem 19.3, what is the internal growth rate of Centennial
Beverages?
Solution:
19.5 Mirabelle Company has total assets of $3,267,450, sales of $5,174,652, and net income
of $1,789,774. The company expects its sales to grow by 20 percent next year. All assets
68
and costs (including taxes) vary directly with sales, and the firm expects to maintain its
payout ratio of 75 percent. Calculate the external financing needed (EFN).
Solution:
Total assets = $3,267,450
Sales = $5,174,652
Net income = $1,789,774
Expected growth rate = 20%
Expected net income = $1,789,774 (1.20) = $2,147,729
Payout ratio = 75%
69
Related Documents