PowerPoint Presentation for Dennis, Wixom & Tegardem Systems Analysis and Design Copyright 2001 © John Wiley & Sons, Inc. All rights reserved. Slide 1 Systems Analysis and Systems Analysis and Design with UML Version Design with UML Version 2.0 2.0 Chapter 4 Project Management Chapter 4 Project Management Alan Dennis, Barbara Wixom, and David Tegarden John Wiley & Sons, Inc.

Welcome message from author
This document is posted to help you gain knowledge. Please leave a comment to let me know what you think about it! Share it to your friends and learn new things together.
Transcript
PowerPoint Presentation for Dennis, Wixom & Tegardem Systems Analysis and Design
Copyright 2001 © John Wiley & Sons, Inc. All rights reserved.Slide 1
Systems Analysis and Systems Analysis and Design with UML Version Design with UML Version 2.02.0Chapter 4 Project ManagementChapter 4 Project Management
Alan Dennis, Barbara Wixom, and David Tegarden
John Wiley & Sons, Inc.

PowerPoint Presentation for Dennis, Wixom & Tegardem Systems Analysis and Design
Copyright 2001 © John Wiley & Sons, Inc. All rights reserved.Slide 2
Copyright © 2005 John Wiley & Sons, Inc.
All rights reserved. Reproduction or translation of this work beyond that permitted in Section 117 of the 1976 United States Copyright Act without the express written permission of the copyright owner is unlawful. Request for further information should be addressed to the Permissions Department, John Wiley & Sons, Inc. The purchaser may make back-up copies for his/her own use only and not for redistribution or resale. The Publisher assumes no responsibility for errors, omissions, or damages, caused by the use of these programs or from the use of the information contained herein.

PowerPoint Presentation for Dennis, Wixom & Tegardem Systems Analysis and Design
Copyright 2001 © John Wiley & Sons, Inc. All rights reserved.Slide 3
Project Management
Chapter 4

PowerPoint Presentation for Dennis, Wixom & Tegardem Systems Analysis and Design
Copyright 2001 © John Wiley & Sons, Inc. All rights reserved.Slide 4
Key Definitions
Project management is the process of planning and controlling the development of a system within a specified timeframe at a minimum cost with the right functionality.A project manager has the primary responsibility for managing the hundreds of tasks and roles that need to be carefully coordinated.

PowerPoint Presentation for Dennis, Wixom & Tegardem Systems Analysis and Design
Copyright 2001 © John Wiley & Sons, Inc. All rights reserved.Slide 5
IDENTIFYING PROJECT SIZE

PowerPoint Presentation for Dennis, Wixom & Tegardem Systems Analysis and Design
Copyright 2001 © John Wiley & Sons, Inc. All rights reserved.Slide 6
Estimation Trade-offs
Size(what it does)Function pointsLines of code
Time (when the project will be finished)
Months
Cost

PowerPoint Presentation for Dennis, Wixom & Tegardem Systems Analysis and Design
Copyright 2001 © John Wiley & Sons, Inc. All rights reserved.Slide 7
Trade-offs
In the beginning of the project, the manager needs to estimate the factors.The estimates developed at the start of a project are based on a range of possible value, and gradually become more specific.

PowerPoint Presentation for Dennis, Wixom & Tegardem Systems Analysis and Design
Copyright 2001 © John Wiley & Sons, Inc. All rights reserved.Slide 8
Two Basic Ways to Estimate the Time
The amount of time spent in the planning phase to predict the time required for the entire project.
We take the time spent in the planning phase and use industry standard percentage to calculate estimates for the other SDLC phaseFrom the past experiences
Function Point Approach

PowerPoint Presentation for Dennis, Wixom & Tegardem Systems Analysis and Design
Copyright 2001 © John Wiley & Sons, Inc. All rights reserved.Slide 9
Estimating a Project Based on Industry Information
Planning Analysis Design Implementation
IndustryStandardFor Business 15% 20% 35% 30%Applications
Actual Estimated Estimated EstimatedTimeRequired 4 5.33 9.33 8in PersonMonths

PowerPoint Presentation for Dennis, Wixom & Tegardem Systems Analysis and Design
Copyright 2001 © John Wiley & Sons, Inc. All rights reserved.Slide 10
Function Point Approach
It is more complex and has three steps: The project manager estimates the size of the
project - - the number of lines of code the new system required
The size estimate is then converted into the amount of effort required to develop - – the number of person-month
The estimated effort is then converted into an estimated schedule time - – the number of months

PowerPoint Presentation for Dennis, Wixom & Tegardem Systems Analysis and Design
Copyright 2001 © John Wiley & Sons, Inc. All rights reserved.Slide 11
Time Estimation Using a More Complex Approach
PowerPoint Presentation for Dennis, Wixom & Tegardem Systems Analysis and Design
Copyright 2001 © John Wiley & Sons, Inc. All rights reserved.Slide 12
Step 1. Estimate System Size
A function point is a measure of program size based on the system’s number and complexity of inputs, outputs, queries, files, and programs interfaces.

PowerPoint Presentation for Dennis, Wixom & Tegardem Systems Analysis and Design
Copyright 2001 © John Wiley & Sons, Inc. All rights reserved.Slide 13
Function Point Estimation-- Step One
Complexity
Description Low Medium High Total
Inputs __x 3 __x 4 __x 6 ____
Outputs 19 4 x 4 10 x 5 5 x 7 ____
Queries __x 3 __x 4 __x 6 ____
Files __x 7 __x 10 __x 15 ____
Program __x 5 __x 7 __x 10 ____Interfaces
TOTAL UNADJUSTED FUNCTION POINTS __338__

PowerPoint Presentation for Dennis, Wixom & Tegardem Systems Analysis and Design
Copyright 2001 © John Wiley & Sons, Inc. All rights reserved.Slide 14
Function Points Estimation-- Step Two
Scale of 1 to 5
Data Communications __3___Heavy Use Configuration __0___Transaction Rate __0___End-User efficiency __0___Complex Processing __0___Installation Ease __0___Multiple sites __0___Performance __0___Distributed functions __2___On-line data entry __2___On-line update __0___Reusability __0___Operational Ease __0___Extensibility __0___
Project Complexity (PC) __7___
PowerPoint Presentation for Dennis, Wixom & Tegardem Systems Analysis and Design
Copyright 2001 © John Wiley & Sons, Inc. All rights reserved.Slide 15
Function Points Estimation
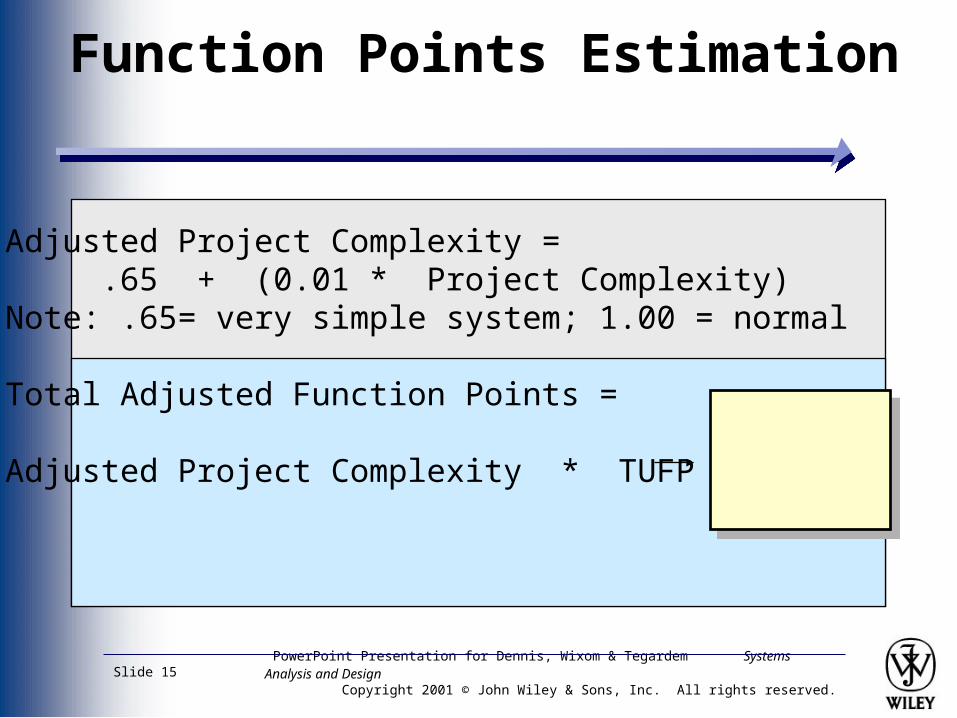
Adjusted Project Complexity =.65 + (0.01 * Project Complexity)
Note: .65= very simple system; 1.00 = normal
Total Adjusted Function Points =
Adjusted Project Complexity * TUFP

PowerPoint Presentation for Dennis, Wixom & Tegardem Systems Analysis and Design
Copyright 2001 © John Wiley & Sons, Inc. All rights reserved.Slide 16
Function Point Estimation -- Step 3
Processing Complexity (PC): ____7____(From Step 2)
Adjusted Processing Complexity (APC) = 0.65 + (0.01 * __7__ )
= 0.72Total Adjusted Function Points: __0.72___ * _338___ = 243 (TUFP -- From Step 1)
PowerPoint Presentation for Dennis, Wixom & Tegardem Systems Analysis and Design
Copyright 2001 © John Wiley & Sons, Inc. All rights reserved.Slide 17
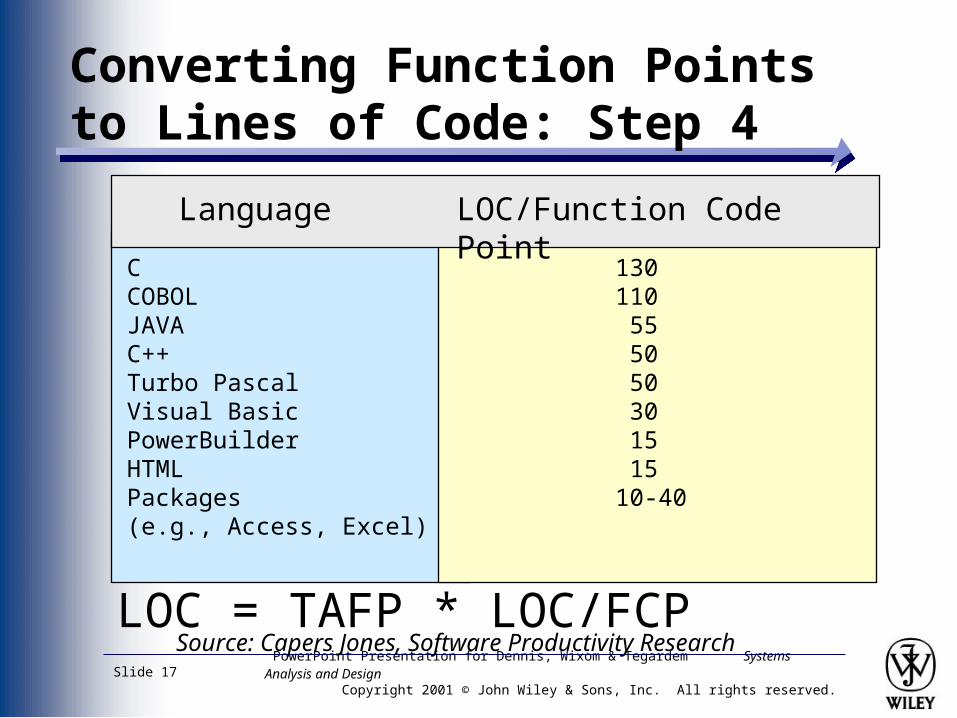
Converting Function Points to Lines of Code: Step 4
Source: Capers Jones, Software Productivity Research
Language LOC/Function Code Point
CCOBOLJAVAC++Turbo PascalVisual BasicPowerBuilderHTMLPackages (e.g., Access, Excel)
130110 55 50 50 30 15 1510-40
LOC = TAFP * LOC/FCP

PowerPoint Presentation for Dennis, Wixom & Tegardem Systems Analysis and Design
Copyright 2001 © John Wiley & Sons, Inc. All rights reserved.Slide 18
Step 2. Estimate Effort
Effort is a function of size and production rate (how much work someone can complete in a given time).COCOMO model
It is used to convert a lines-of-code estimate to a person-month estimate.

PowerPoint Presentation for Dennis, Wixom & Tegardem Systems Analysis and Design
Copyright 2001 © John Wiley & Sons, Inc. All rights reserved.Slide 19
COCOMO Estimation Calculation
Effort = 1.4 * thousands-of-(in Person- lines-of-codeMonths)
Example:
If LOC = 2000 Then...Effort = (1.4 * 2000) = 28
Person Months

PowerPoint Presentation for Dennis, Wixom & Tegardem Systems Analysis and Design
Copyright 2001 © John Wiley & Sons, Inc. All rights reserved.Slide 20
Step 3. Estimate Time Required
Rule of thumb for estimation
Schedule Time (months)
=
3.0 * person-months1/3
PowerPoint Presentation for Dennis, Wixom & Tegardem Systems Analysis and Design
Copyright 2001 © John Wiley & Sons, Inc. All rights reserved.Slide 21
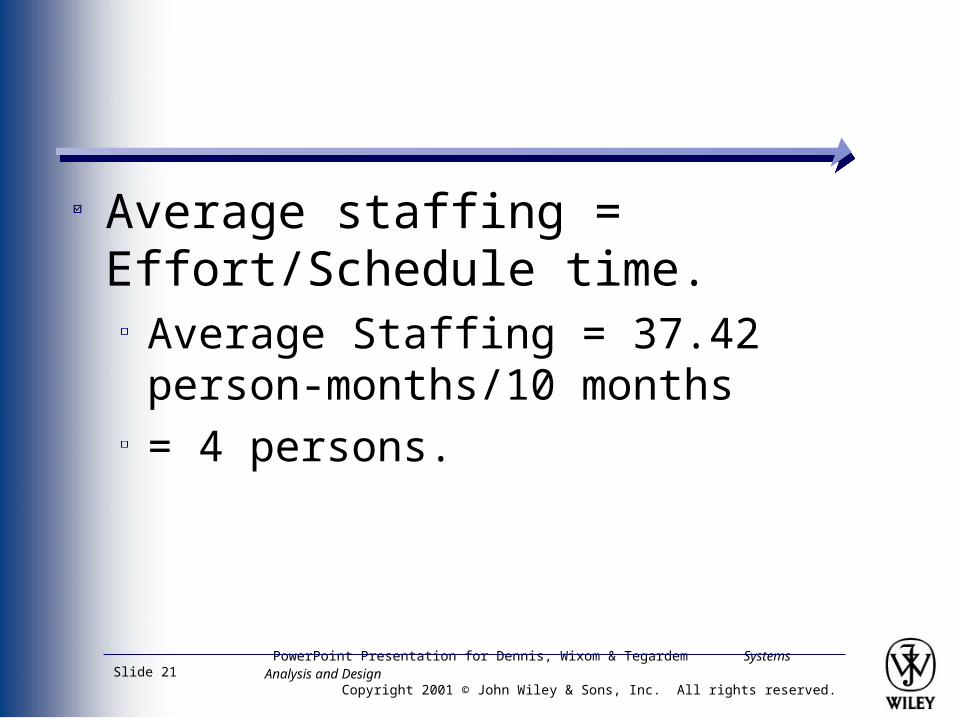
Average staffing = Effort/Schedule time.
Average Staffing = 37.42 person-months/10 months = 4 persons.

PowerPoint Presentation for Dennis, Wixom & Tegardem Systems Analysis and Design
Copyright 2001 © John Wiley & Sons, Inc. All rights reserved.Slide 22
CREATING AND MANAGING THE WORKPLAN
PowerPoint Presentation for Dennis, Wixom & Tegardem Systems Analysis and Design
Copyright 2001 © John Wiley & Sons, Inc. All rights reserved.Slide 23
Workplan is a dynamic schedule that records and keeps track of all of the tasks that need to be accomplished over the course of the project.It lists each task, along with important information

PowerPoint Presentation for Dennis, Wixom & Tegardem Systems Analysis and Design
Copyright 2001 © John Wiley & Sons, Inc. All rights reserved.Slide 24
A Workplan Example
Work Plan Information Example
Name of task Perform economic feasibilityStart date ` Jan 05, 2001Completion date Jan 19, 2001Person assigned Mary Smith, sponsorDeliverable(s) Cost-benefit analysisCompletion status OpenPriority HighResources needed SpreadsheetEstimated time 16 hoursActual time 14.5 hours

PowerPoint Presentation for Dennis, Wixom & Tegardem Systems Analysis and Design
Copyright 2001 © John Wiley & Sons, Inc. All rights reserved.Slide 25
Identifying Tasks
MethodologyUsing standard list of tasks
SDLC Select the steps and deliverables
Consultants or booksTop-down approach
Identify highest level tasksBreak them into increasingly smaller units
Work Breakdown Structure (WBS) By SDLC or by product
PowerPoint Presentation for Dennis, Wixom & Tegardem Systems Analysis and Design
Copyright 2001 © John Wiley & Sons, Inc. All rights reserved.Slide 26
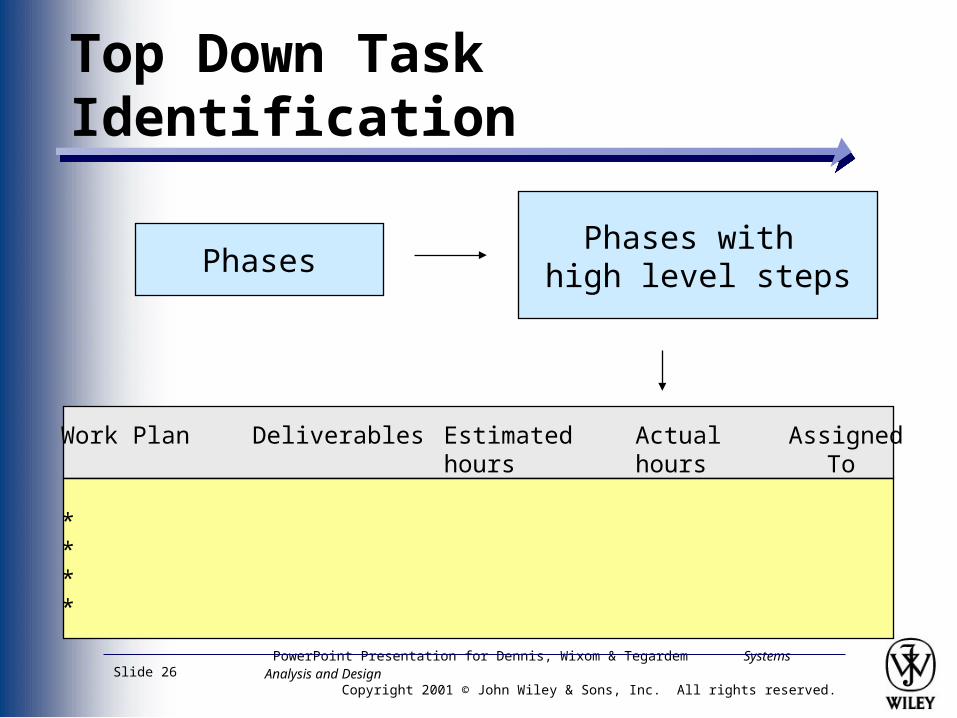
Top Down Task Identification
PhasesPhases with
high level steps
Work Plan Deliverables Estimated Actual Assignedhours hours To
****
PowerPoint Presentation for Dennis, Wixom & Tegardem Systems Analysis and Design
Copyright 2001 © John Wiley & Sons, Inc. All rights reserved.Slide 27
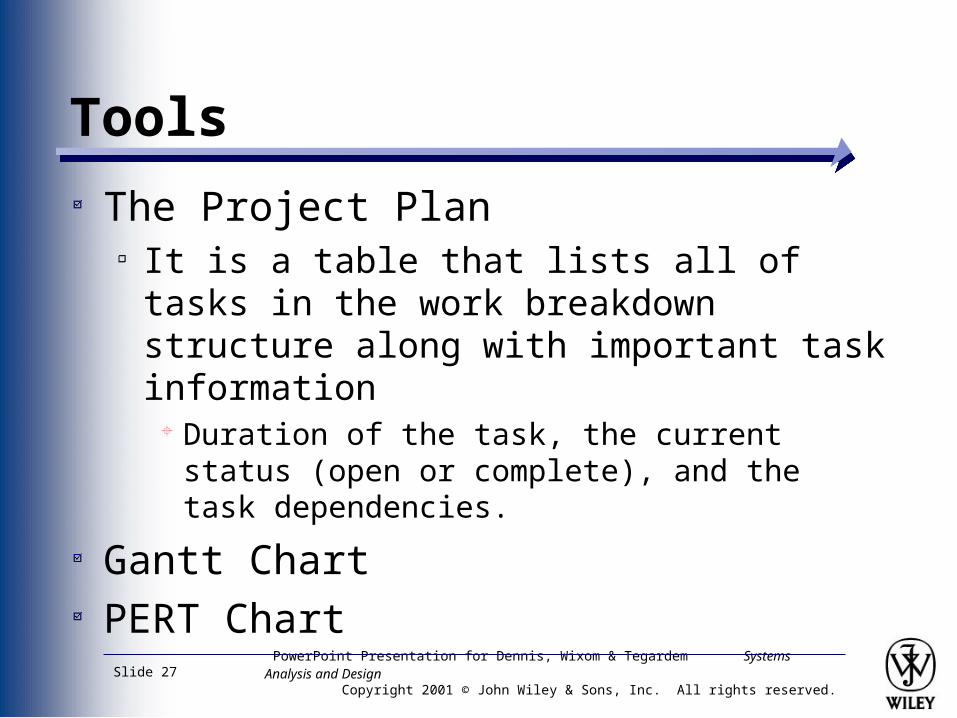
Tools
The Project PlanIt is a table that lists all of tasks in the work breakdown structure along with important task information
Duration of the task, the current status (open or complete), and the task dependencies.
Gantt ChartPERT Chart

PowerPoint Presentation for Dennis, Wixom & Tegardem Systems Analysis and Design
Copyright 2001 © John Wiley & Sons, Inc. All rights reserved.Slide 28
Gantt Chart
Go to Library
Go to Bookstore
Select and Purchase Book
Skim Book
Write Phase One
Read Book Carefully
Write Phase Two
Action Week 2 3 4 5 6 7 8 9 10 11 12 13
PowerPoint Presentation for Dennis, Wixom & Tegardem Systems Analysis and Design
Copyright 2001 © John Wiley & Sons, Inc. All rights reserved.Slide 29
Refining Estimates
Estimating an IS development project - - cost, time and what the final system will actually do follows a hurricane model.
The predictions of when and where become more and more accurate as the storms approach a cost, until they finally arrive.

PowerPoint Presentation for Dennis, Wixom & Tegardem Systems Analysis and Design
Copyright 2001 © John Wiley & Sons, Inc. All rights reserved.Slide 30
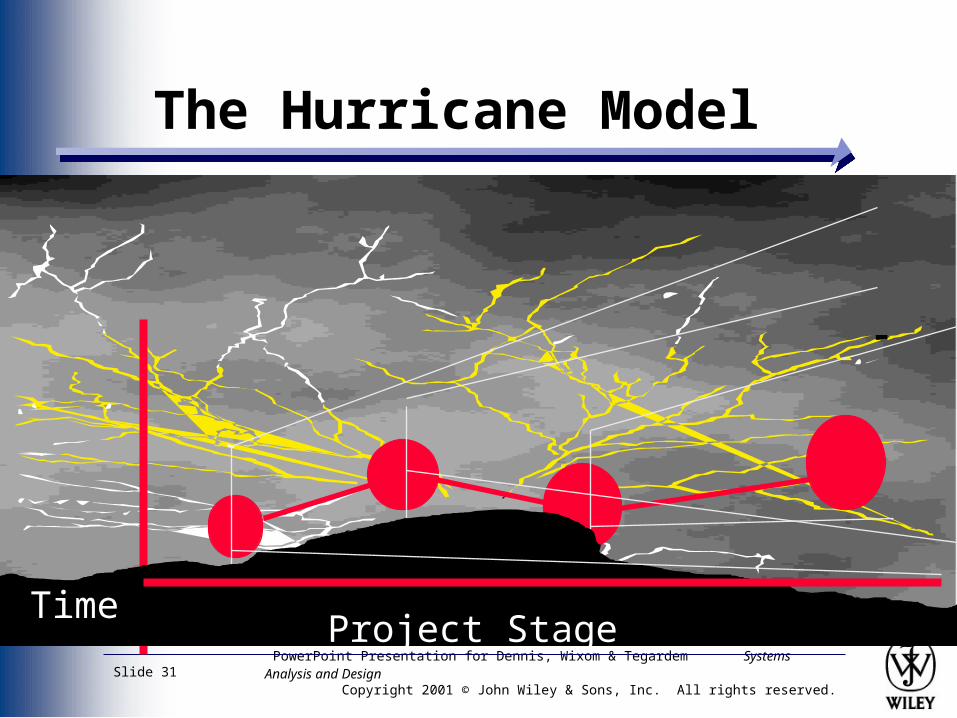
As the system moves closer to completion, the accuracy and precision increase until the final system is delivered.
PowerPoint Presentation for Dennis, Wixom & Tegardem Systems Analysis and Design
Copyright 2001 © John Wiley & Sons, Inc. All rights reserved.Slide 31
The Hurricane Model
Project StageTime

PowerPoint Presentation for Dennis, Wixom & Tegardem Systems Analysis and Design
Copyright 2001 © John Wiley & Sons, Inc. All rights reserved.Slide 32
Margins of Error in Cost and Time Estimates
Typical margins of Error for
Well-done Estimates
Phase Deliverable Cost (%)time (%)
Planning System Request 400 60Project Plan 100 25
Analysis System Proposal 5015
Design System Specification 25 10
Source: Boehm et al. (1995)

PowerPoint Presentation for Dennis, Wixom & Tegardem Systems Analysis and Design
Copyright 2001 © John Wiley & Sons, Inc. All rights reserved.Slide 33
Managing Scope
Scope creep -- a major cause of development problems (schedule and cost overruns)It happens when new requirement are added to the project after the original project scope was defined.
JAD and prototypingFormal change approvalCharging for changes

PowerPoint Presentation for Dennis, Wixom & Tegardem Systems Analysis and Design
Copyright 2001 © John Wiley & Sons, Inc. All rights reserved.Slide 34
Timeboxing
Another approach to scope managementFixed deadlineReduced functionality, if necessaryFewer “finishing touches”

PowerPoint Presentation for Dennis, Wixom & Tegardem Systems Analysis and Design
Copyright 2001 © John Wiley & Sons, Inc. All rights reserved.Slide 35
Timeboxing Steps
1. Set delivery dateDeadline should not be impossibleShould be set by development group
2. Prioritize features by importance3. Build the system core4. Postpone unfinished functionality5. Deliver the system with core functionality6. Repeat steps 3-5 to add refinements and enhancement

PowerPoint Presentation for Dennis, Wixom & Tegardem Systems Analysis and Design
Copyright 2001 © John Wiley & Sons, Inc. All rights reserved.Slide 36
STAFFING THE PROJECT

PowerPoint Presentation for Dennis, Wixom & Tegardem Systems Analysis and Design
Copyright 2001 © John Wiley & Sons, Inc. All rights reserved.Slide 37
Staffing The Project
Determining how many people should be assignedMatching people’s skills with the needsMotivating them to meet the objectiveMinimizing the conflict.

PowerPoint Presentation for Dennis, Wixom & Tegardem Systems Analysis and Design
Copyright 2001 © John Wiley & Sons, Inc. All rights reserved.Slide 38
Key Definitions
The staffing plan describes the kinds of people working on the projectThe project charter describes the project’s objectives and rulesA functional lead manages a group of analystsA technical lead oversees progress of programmers and technical staff members

PowerPoint Presentation for Dennis, Wixom & Tegardem Systems Analysis and Design
Copyright 2001 © John Wiley & Sons, Inc. All rights reserved.Slide 39
Staffing AttributesStaffing levels will change over a project’s lifetimeAdding staff may add more overhead than additional laborKeep team size of 8-10 reporting in a hierarchical structure can reduce complexity
If more people are needed, create subteams.In this way, the project manager can keep the communication effective

PowerPoint Presentation for Dennis, Wixom & Tegardem Systems Analysis and Design
Copyright 2001 © John Wiley & Sons, Inc. All rights reserved.Slide 40
Increasing Complexity with Larger Teams

PowerPoint Presentation for Dennis, Wixom & Tegardem Systems Analysis and Design
Copyright 2001 © John Wiley & Sons, Inc. All rights reserved.Slide 41
MotivationAssigning people isn’t enough, the project managers need to motivate the peopleUse monetary rewards cautiouslyUse intrinsic rewards
RecognitionAchievementThe work itselfResponsibilityAdvancementChance to learn new skills

PowerPoint Presentation for Dennis, Wixom & Tegardem Systems Analysis and Design
Copyright 2001 © John Wiley & Sons, Inc. All rights reserved.Slide 42
Conflict Avoidance Strategies Clearly define roles and project plans Hold individuals accountable Project charter listing norms and
groundrules Develop schedule commitments ahead of
time Forecast other priorities and their
possible impact on the project

PowerPoint Presentation for Dennis, Wixom & Tegardem Systems Analysis and Design
Copyright 2001 © John Wiley & Sons, Inc. All rights reserved.Slide 43
CONTROLLING AND DIRECTING THE PROJECT
PowerPoint Presentation for Dennis, Wixom & Tegardem Systems Analysis and Design
Copyright 2001 © John Wiley & Sons, Inc. All rights reserved.Slide 44
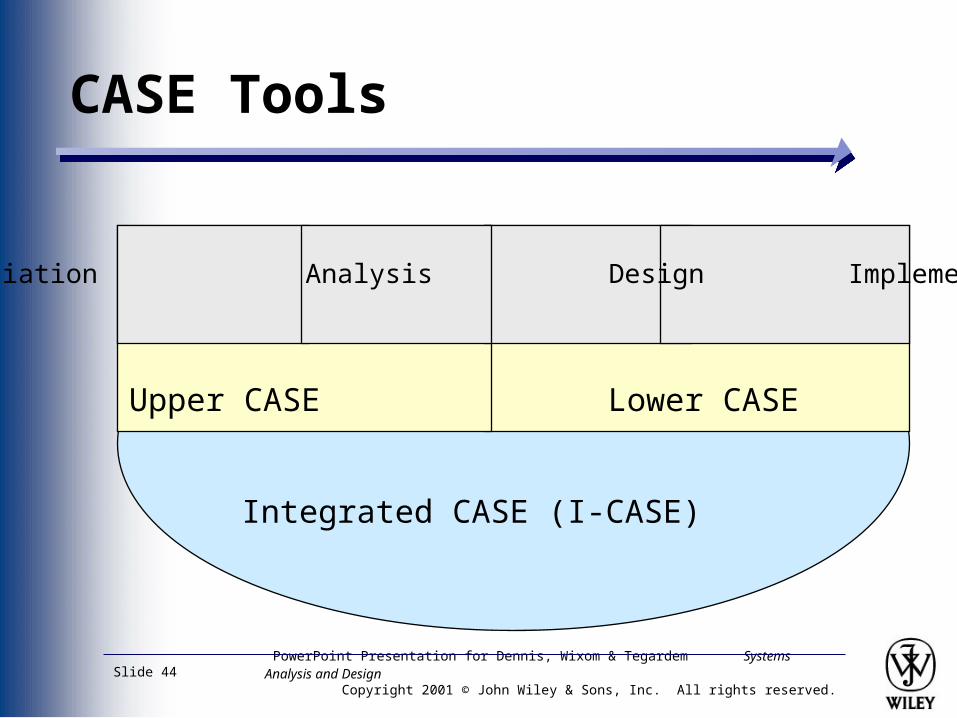
CASE Tools
Initiation Analysis Design Implementation
Upper CASE Lower CASE
Integrated CASE (I-CASE)

PowerPoint Presentation for Dennis, Wixom & Tegardem Systems Analysis and Design
Copyright 2001 © John Wiley & Sons, Inc. All rights reserved.Slide 45
Procedural MetadataLogic
Diagrams ScreenDesigns
CASE Repository
CASE Components

PowerPoint Presentation for Dennis, Wixom & Tegardem Systems Analysis and Design
Copyright 2001 © John Wiley & Sons, Inc. All rights reserved.Slide 46
Standards
The team needs to work together, and things can get confusing.
Examples Formal rules for naming files Forms indicating goals reached Programming guidelines
Can you think of more examples?

PowerPoint Presentation for Dennis, Wixom & Tegardem Systems Analysis and Design
Copyright 2001 © John Wiley & Sons, Inc. All rights reserved.Slide 47
Documentation
Project binder Table of contents Continual updating

PowerPoint Presentation for Dennis, Wixom & Tegardem Systems Analysis and Design
Copyright 2001 © John Wiley & Sons, Inc. All rights reserved.Slide 48
Managing Risk
Risk assessmentThe process of assessing and addressing the risks that are associated with developing a project.
Actions to reduce riskProviding training to the team
Revised assessment

PowerPoint Presentation for Dennis, Wixom & Tegardem Systems Analysis and Design
Copyright 2001 © John Wiley & Sons, Inc. All rights reserved.Slide 49
Classic Mistakes
Very optimistic schedule Failing to monitor schedule Failing to update schedule Adding people to a late project

PowerPoint Presentation for Dennis, Wixom & Tegardem Systems Analysis and Design
Copyright 2001 © John Wiley & Sons, Inc. All rights reserved.Slide 50
Summary
Project management is critical to successful development of new systems
Project management involves planning, controlling and reporting on time, labor, and costs.

PowerPoint Presentation for Dennis, Wixom & Tegardem Systems Analysis and Design
Copyright 2001 © John Wiley & Sons, Inc. All rights reserved.Slide 51
Expanding the Domain
For more detail on project management, visit the project management institute and its special interest group on information systems:
www.pmi.orgwww.pmi-issig.org
Related Documents