Ch 4-1 © 2004 Pearson Education, Inc. Pearson Prentice Hall, Pearson Education, Upper Saddle River, NJ 07458 Ostwald and McLaren / Cost Analysis and Estimating for Engineering and Management Cost Analysis and Estimating for Engineering and Management Chapter 4 Accounting Analysis

Welcome message from author
This document is posted to help you gain knowledge. Please leave a comment to let me know what you think about it! Share it to your friends and learn new things together.
Transcript

Ch 4-1© 2004 Pearson Education, Inc.Pearson Prentice Hall, Pearson Education, Upper Saddle River, NJ 07458Ostwald and McLaren / Cost Analysis and Estimating for Engineering and Management
Cost Analysis and Estimatingfor Engineering and Management
Chapter 4
Accounting Analysis

Ch 4-2© 2004 Pearson Education, Inc.Pearson Prentice Hall, Pearson Education, Upper Saddle River, NJ 07458Ostwald and McLaren / Cost Analysis and Estimating for Engineering and Management
Overview Accounting
Records, Transactions, Reports Depreciation
What It Is, Uses, Calculations Budgeting Overhead
Calculations and Application Variance
Ch 4-3© 2004 Pearson Education, Inc.Pearson Prentice Hall, Pearson Education, Upper Saddle River, NJ 07458Ostwald and McLaren / Cost Analysis and Estimating for Engineering and Management
Accounting
Analyzes Money Transactions Multiple Disciplines Cost Accounting
Cost of Using Productive Assets Tax Accounting
Tax Consequences on Business

Ch 4-4© 2004 Pearson Education, Inc.Pearson Prentice Hall, Pearson Education, Upper Saddle River, NJ 07458Ostwald and McLaren / Cost Analysis and Estimating for Engineering and Management
Accounting & Engineering
EngineeringLooks AheadCost Estimates BEFORE Things Happen
AccountingMoney Transactions That Have HappenedHistorical RecordsIncompatible Data Formats

Ch 4-5© 2004 Pearson Education, Inc.Pearson Prentice Hall, Pearson Education, Upper Saddle River, NJ 07458Ostwald and McLaren / Cost Analysis and Estimating for Engineering and Management
Transactions
Money (or Something of Value) Comes In or Goes Out of the Company
Recorded Twice (In 2 Accounts) Double-Entry Bookkeeping Accounts - Records of Like
Transactions
Ch 4-6© 2004 Pearson Education, Inc.Pearson Prentice Hall, Pearson Education, Upper Saddle River, NJ 07458Ostwald and McLaren / Cost Analysis and Estimating for Engineering and Management
“T” Accounts 2 Columns Left Hand Column - Called “Debit” Right Hand Column - Called “Credit” Each Transaction Has a Debit In One
Account and a Credit In Another Note: Debit or Credit Have NO Value
Meaning - Credit Is Not Always Good
Ch 4-7© 2004 Pearson Education, Inc.Pearson Prentice Hall, Pearson Education, Upper Saddle River, NJ 07458Ostwald and McLaren / Cost Analysis and Estimating for Engineering and Management
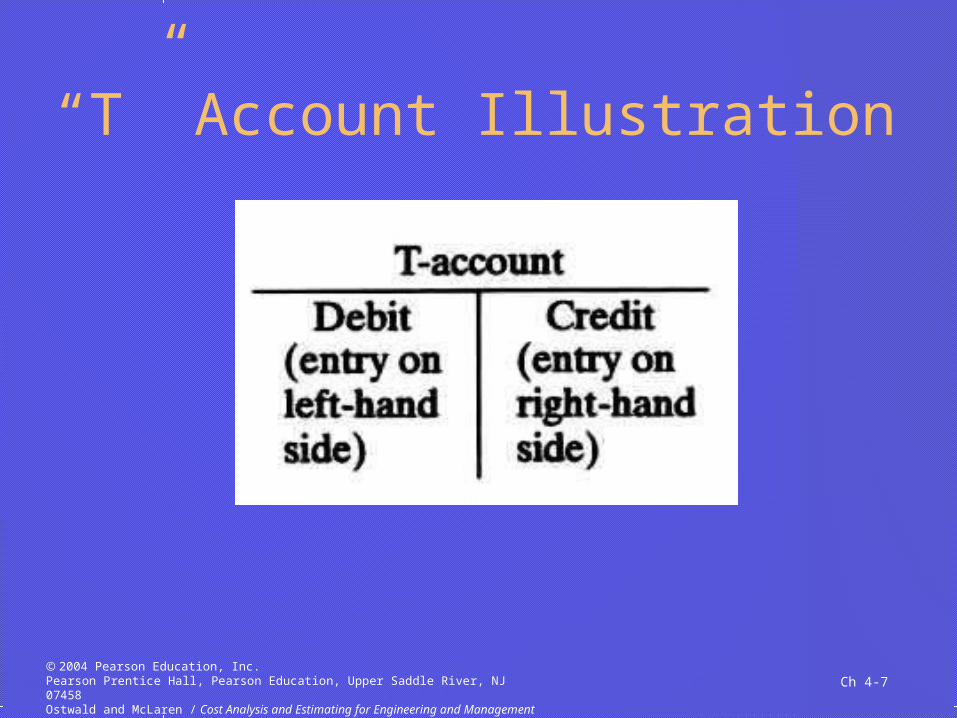
“T” Account Illustration
Ch 4-8© 2004 Pearson Education, Inc.Pearson Prentice Hall, Pearson Education, Upper Saddle River, NJ 07458Ostwald and McLaren / Cost Analysis and Estimating for Engineering and Management
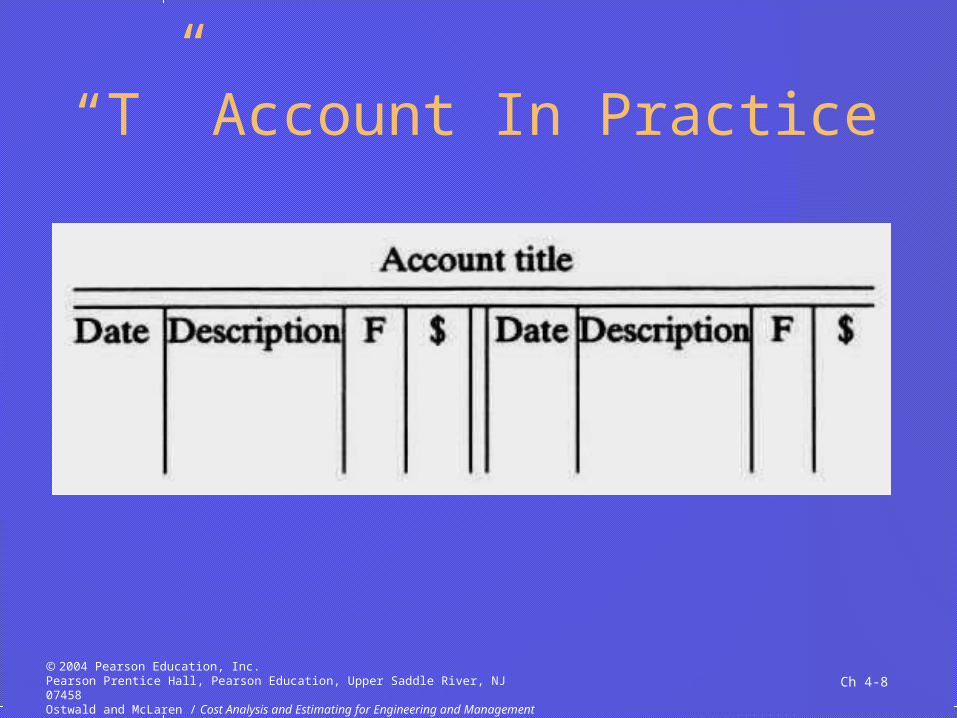
“T” Account In Practice
Ch 4-9© 2004 Pearson Education, Inc.Pearson Prentice Hall, Pearson Education, Upper Saddle River, NJ 07458Ostwald and McLaren / Cost Analysis and Estimating for Engineering and Management
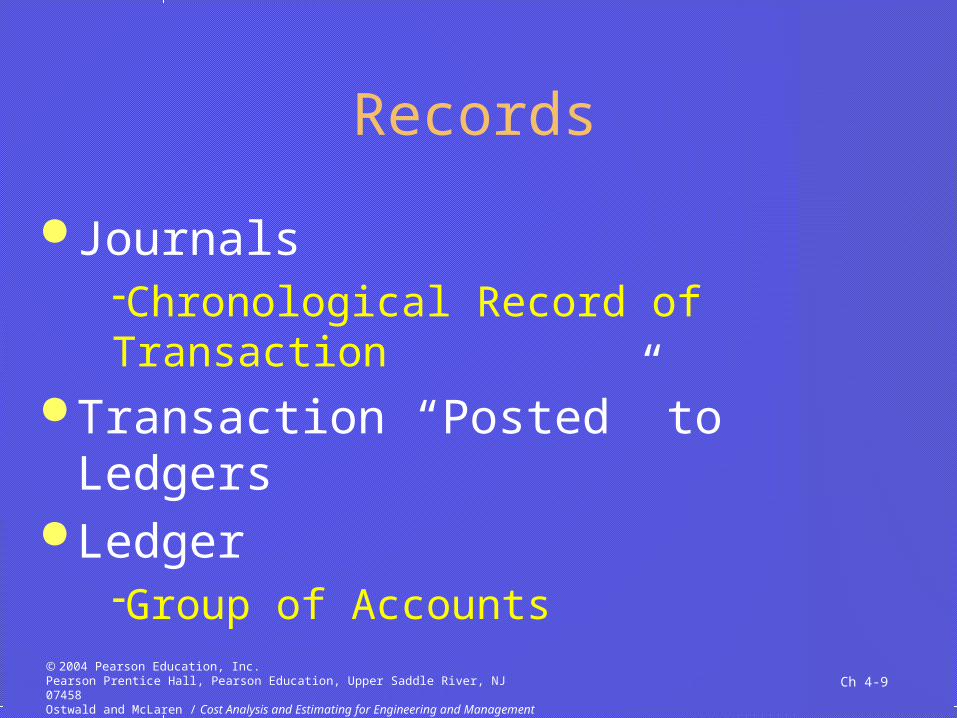
Records
JournalsChronological Record of Transaction
Transaction “Posted” to Ledgers Ledger
Group of Accounts

Ch 4-10© 2004 Pearson Education, Inc.Pearson Prentice Hall, Pearson Education, Upper Saddle River, NJ 07458Ostwald and McLaren / Cost Analysis and Estimating for Engineering and Management
Transaction Record Flow

Ch 4-11© 2004 Pearson Education, Inc.Pearson Prentice Hall, Pearson Education, Upper Saddle River, NJ 07458Ostwald and McLaren / Cost Analysis and Estimating for Engineering and Management
Accounting Conventions Money Measurement
All Transactions Recorded in Money Accounting Equivalence
Double Entry Assets = Liabilities + Net Worth
ConservatismRecord the Lesser Value

Ch 4-12© 2004 Pearson Education, Inc.Pearson Prentice Hall, Pearson Education, Upper Saddle River, NJ 07458Ostwald and McLaren / Cost Analysis and Estimating for Engineering and Management
More Accounting Conventions
ConsistencyAlways Record Transactions the Same Way
Business Perspective“Going Concern”Transactions for the Sake of the Business
Use Cost Not Value

Ch 4-13© 2004 Pearson Education, Inc.Pearson Prentice Hall, Pearson Education, Upper Saddle River, NJ 07458Ostwald and McLaren / Cost Analysis and Estimating for Engineering and Management
Cash vs. Accrual Cash
Transaction When Money ExchangedIndividuals and Very Small Businesses
AccrualTransaction When EarnedReceipts at ShipmentPayables When Material Received

Ch 4-14© 2004 Pearson Education, Inc.Pearson Prentice Hall, Pearson Education, Upper Saddle River, NJ 07458Ostwald and McLaren / Cost Analysis and Estimating for Engineering and Management
Revenue vs. Expense
RevenueMoney ReceivedIncreases to Net Worth
ExpenseCosts IncurredDecreases to Net Worth

Ch 4-15© 2004 Pearson Education, Inc.Pearson Prentice Hall, Pearson Education, Upper Saddle River, NJ 07458Ostwald and McLaren / Cost Analysis and Estimating for Engineering and Management
Account Categories
Asset Liability Net Worth Revenue Expense

Ch 4-16© 2004 Pearson Education, Inc.Pearson Prentice Hall, Pearson Education, Upper Saddle River, NJ 07458Ostwald and McLaren / Cost Analysis and Estimating for Engineering and Management
Assets
Things with Dollar Value Company Owns Current
For Short Period Fixed
Longer Than 1 Year

Ch 4-17© 2004 Pearson Education, Inc.Pearson Prentice Hall, Pearson Education, Upper Saddle River, NJ 07458Ostwald and McLaren / Cost Analysis and Estimating for Engineering and Management
Liabilities Debts the Company Owes Short Term
Accounts PayableShort Term Loans
Long Term Over 1 YearMortgages, Long Term Loans
Ch 4-18© 2004 Pearson Education, Inc.Pearson Prentice Hall, Pearson Education, Upper Saddle River, NJ 07458Ostwald and McLaren / Cost Analysis and Estimating for Engineering and Management
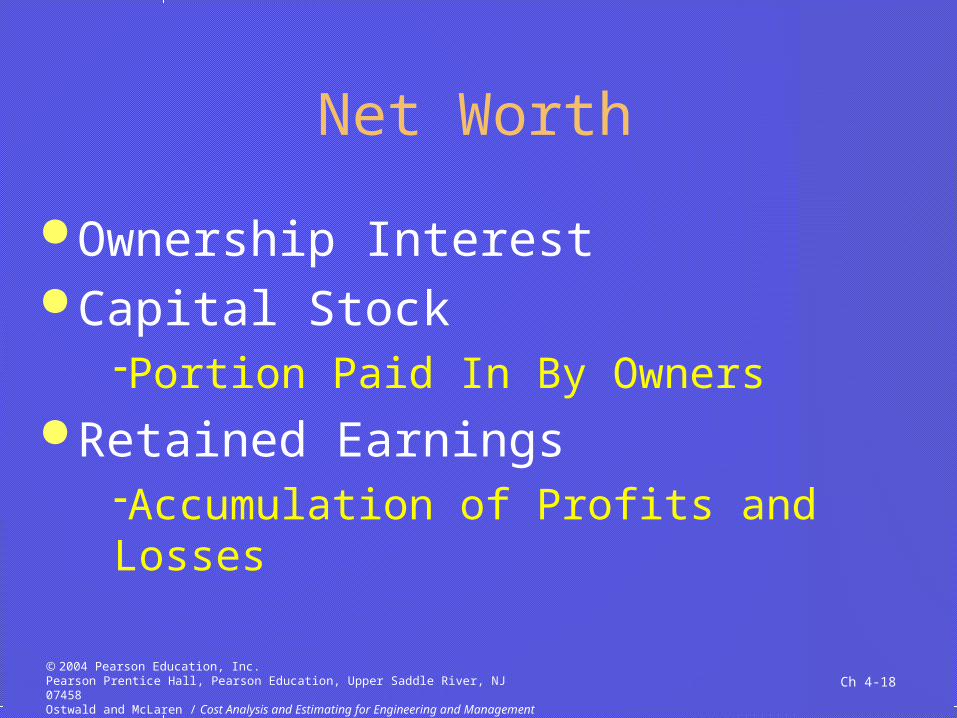
Net Worth
Ownership Interest Capital Stock
Portion Paid In By Owners Retained Earnings
Accumulation of Profits and Losses

Ch 4-19© 2004 Pearson Education, Inc.Pearson Prentice Hall, Pearson Education, Upper Saddle River, NJ 07458Ostwald and McLaren / Cost Analysis and Estimating for Engineering and Management
Revenues & Expenses Revenue
Sales Income Before Deduction of Costs Expenses
Costs of Doing Business Gross Income
Revenue – Expense

Ch 4-20© 2004 Pearson Education, Inc.Pearson Prentice Hall, Pearson Education, Upper Saddle River, NJ 07458Ostwald and McLaren / Cost Analysis and Estimating for Engineering and Management
Profit
Gross Income – Taxes Recorded on Profit and Loss
Statement Contributes to Net Worth

Ch 4-21© 2004 Pearson Education, Inc.Pearson Prentice Hall, Pearson Education, Upper Saddle River, NJ 07458Ostwald and McLaren / Cost Analysis and Estimating for Engineering and Management
Financial and Operating Equation
Eq 4.2
Debit Indicates: Credit Indicates:
Asset increase Asset decrease
Liability decrease Liability increase
Net worth decrease Net worth increase
Revenue decrease Revenue increase
Expense increase Expense decrease

Ch 4-22© 2004 Pearson Education, Inc.Pearson Prentice Hall, Pearson Education, Upper Saddle River, NJ 07458Ostwald and McLaren / Cost Analysis and Estimating for Engineering and Management
Example of TransactionsTransaction Accounts
AffectedType of Account
On Account
Debit ($)
Credit ($)
1. Company founded $50,000 capital stock
Cash Asset Increase 50,000
Stock N-W Increase 50,000
2. Buy materials on account, $10,000
Inventory Asset Increase 10,000
Acct pay Liability Increase 10,000
3. Pay monthly rent on shop, $1500
Rent Expense Increase 1,500
Cash Asset Decrease 1,500
Total 61,500 61,500

Ch 4-23© 2004 Pearson Education, Inc.Pearson Prentice Hall, Pearson Education, Upper Saddle River, NJ 07458Ostwald and McLaren / Cost Analysis and Estimating for Engineering and Management
Example of T-Accounts

Ch 4-24© 2004 Pearson Education, Inc.Pearson Prentice Hall, Pearson Education, Upper Saddle River, NJ 07458Ostwald and McLaren / Cost Analysis and Estimating for Engineering and Management
Balancing
Number of EntriesDebits MUST EQUALMUST EQUAL CreditsFor All Accounts (Not in Each Account)
FootingFind Difference Between Credit and Debit Totals In Each AccountRecord In Positive Column

Ch 4-25© 2004 Pearson Education, Inc.Pearson Prentice Hall, Pearson Education, Upper Saddle River, NJ 07458Ostwald and McLaren / Cost Analysis and Estimating for Engineering and Management
Finish Balancing Balance In Each Account
DebitCredit“Closed” (Debit = Credit)
Balance the BooksSum of All Debit Accounts MUST EQUAL Sum of All Credit Accounts

Ch 4-26© 2004 Pearson Education, Inc.Pearson Prentice Hall, Pearson Education, Upper Saddle River, NJ 07458Ostwald and McLaren / Cost Analysis and Estimating for Engineering and Management
Statements
Balance Sheet“Snap Shot” at a Point in TimeSummary of Assets, Liabilities and NW
Profit and Loss StatementIncome and Expense SummaryOver a Specified Period of Time

Ch 4-27© 2004 Pearson Education, Inc.Pearson Prentice Hall, Pearson Education, Upper Saddle River, NJ 07458Ostwald and McLaren / Cost Analysis and Estimating for Engineering and Management
Balance SheetXYZ Manufacturing Company
Balance SheetMay 31, 20xx
Assets = Liabilities
Cash $15,000 Bank loan $15,000
Inventory 10,000 Mortgage 15,000
Land 15,000
Fixed Assets 40,000 + Net worth
Stock 45,000 ______ Earnings 5,000 $80,000 $80,000

Ch 4-28© 2004 Pearson Education, Inc.Pearson Prentice Hall, Pearson Education, Upper Saddle River, NJ 07458Ostwald and McLaren / Cost Analysis and Estimating for Engineering and Management
Profit and Loss Statement Or Income and Expense Statement Profit: Excess of Revenue Over Cost
Including Depreciation and Taxes Loss: Excess of Cost Over Revenue
Including DepreciationTaxes Are Not Owed In Loss Situation
Profit/Loss Included In Net Worth
Ch 4-29© 2004 Pearson Education, Inc.Pearson Prentice Hall, Pearson Education, Upper Saddle River, NJ 07458Ostwald and McLaren / Cost Analysis and Estimating for Engineering and Management
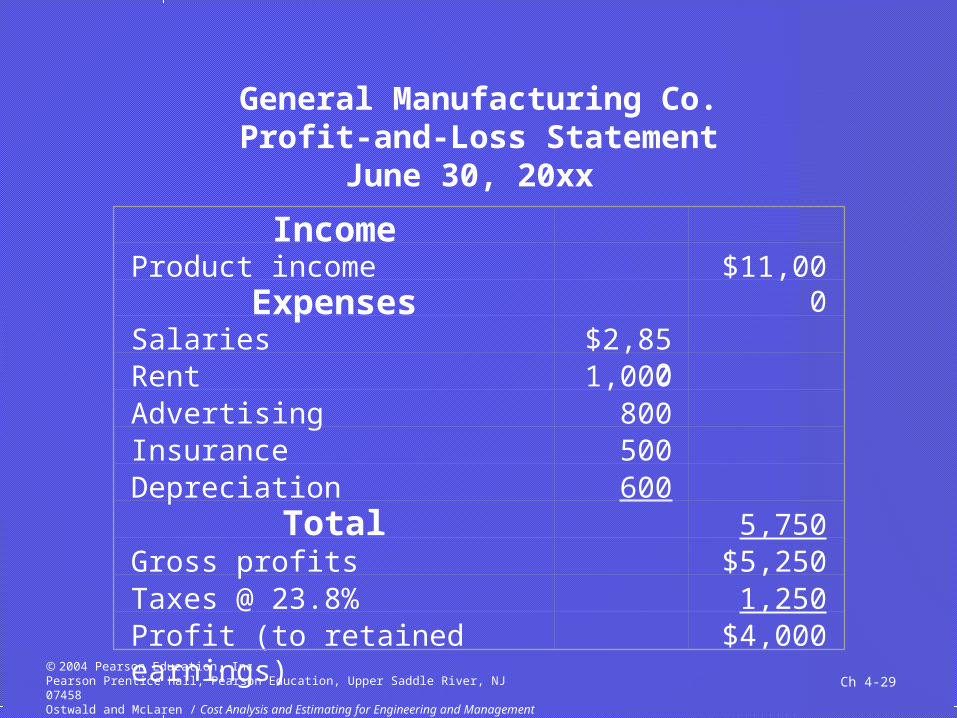
General Manufacturing Co.Profit-and-Loss Statement
June 30, 20xx
Income
Product income $11,000Expenses
Salaries $2,850
Rent 1,000
Advertising 800
Insurance 500
Depreciation 600
Total 5,750Gross profits $5,250Taxes @ 23.8% 1,250Profit (to retained earnings) $4,000

Ch 4-30© 2004 Pearson Education, Inc.Pearson Prentice Hall, Pearson Education, Upper Saddle River, NJ 07458Ostwald and McLaren / Cost Analysis and Estimating for Engineering and Management
Capital Assets Money Spent
Larger AmountsLong Period of Use
Decreasing Value Over TimePhysical Wear for OperationObsolescenceRegulations

Ch 4-31© 2004 Pearson Education, Inc.Pearson Prentice Hall, Pearson Education, Upper Saddle River, NJ 07458Ostwald and McLaren / Cost Analysis and Estimating for Engineering and Management
Depreciation Accounting Charge
Provides for Recovery of Capital CostsOver Time
NOT a Cash Expenditure (Transaction)Money Spent for Initial Acquisition
Deduction to Income StatementLargely for Tax Purposes
Ch 4-32© 2004 Pearson Education, Inc.Pearson Prentice Hall, Pearson Education, Upper Saddle River, NJ 07458Ostwald and McLaren / Cost Analysis and Estimating for Engineering and Management
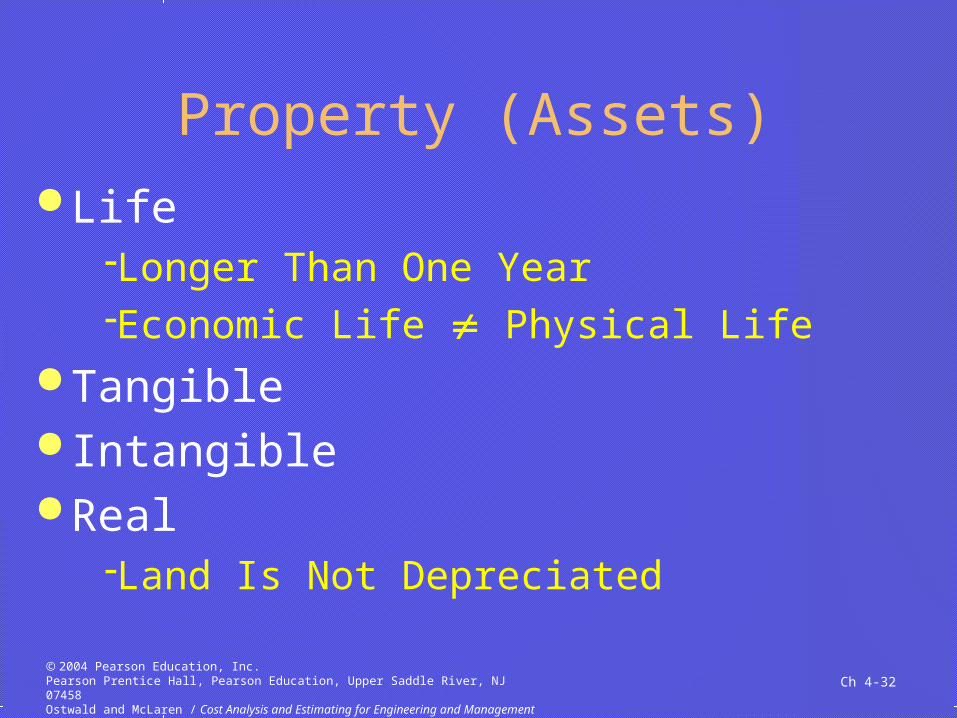
Property (Assets) Life
Longer Than One YearEconomic Life Physical Life
Tangible Intangible Real
Land Is Not Depreciated

Ch 4-33© 2004 Pearson Education, Inc.Pearson Prentice Hall, Pearson Education, Upper Saddle River, NJ 07458Ostwald and McLaren / Cost Analysis and Estimating for Engineering and Management
Annual Depreciation
In General
Straight LineSimplest
PjPD j
1
kNjP
Eq 4.3
1sj FP
kND Eq 4.4 Eq 4.5

Ch 4-34© 2004 Pearson Education, Inc.Pearson Prentice Hall, Pearson Education, Upper Saddle River, NJ 07458Ostwald and McLaren / Cost Analysis and Estimating for Engineering and Management
Definitions
Salvage ValueValue Left at End of Depreciation LifeWhat Asset Could Be Sold for
Book ValueInvestment – Salvage – Depreciation
Ch 4-35© 2004 Pearson Education, Inc.Pearson Prentice Hall, Pearson Education, Upper Saddle River, NJ 07458Ostwald and McLaren / Cost Analysis and Estimating for Engineering and Management
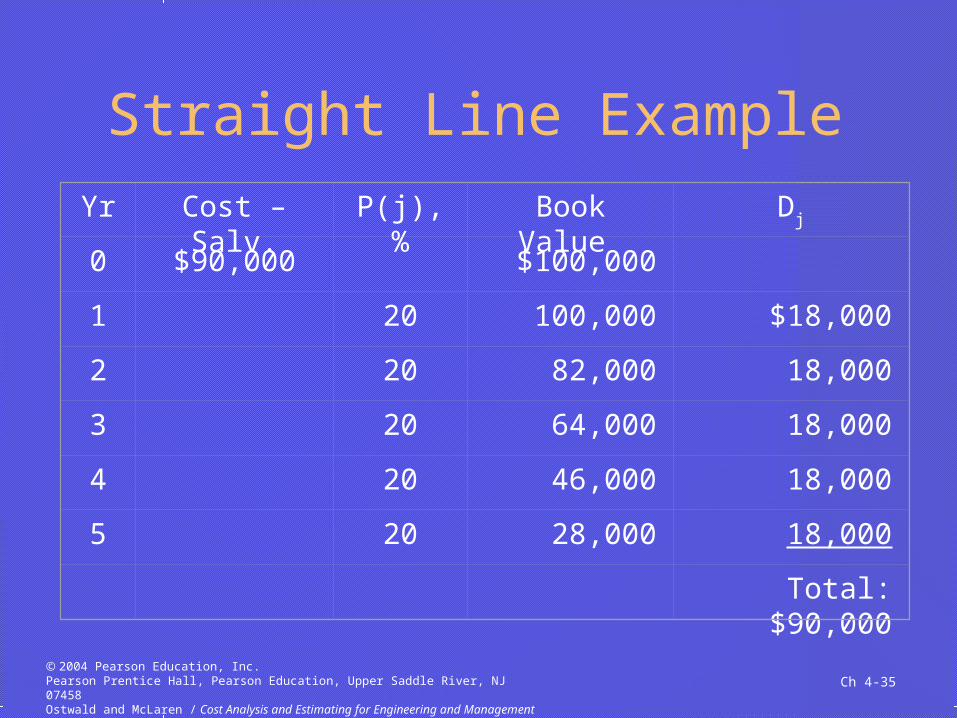
Straight Line Example
Yr Cost –Salv. P(j), % Book Value Dj
0 $90,000 $100,000
1 20 100,000 $18,000
2 20 82,000 18,000
3 20 64,000 18,000
4 20 46,000 18,000
5 20 28,000 18,000
Total: $90,000
Ch 4-36© 2004 Pearson Education, Inc.Pearson Prentice Hall, Pearson Education, Upper Saddle River, NJ 07458Ostwald and McLaren / Cost Analysis and Estimating for Engineering and Management
Accelerated Cost Recovery
Costs Recovered More Quickly Allowed by Tax Laws
Certain MethodsMACRS
Better Approximates Actual Life Cycle Helps Company Profits and Operations

Ch 4-37© 2004 Pearson Education, Inc.Pearson Prentice Hall, Pearson Education, Upper Saddle River, NJ 07458Ostwald and McLaren / Cost Analysis and Estimating for Engineering and Management
Accelerated Recovery Rates
Year 3-Year 5-Year 10-Year
1 33 20 102 45 32 183 22 24 164 16 145 8 126 107 88 69 4
10 2

Ch 4-38© 2004 Pearson Education, Inc.Pearson Prentice Hall, Pearson Education, Upper Saddle River, NJ 07458Ostwald and McLaren / Cost Analysis and Estimating for Engineering and Management
Accelerated Recovery Example
Year Cost P(j) Book Value Dj
0 $100,000 $100,000
1 20 100,000 $20,000
2 32 80,000 32,000
3 24 48,000 24,000
4 16 24,000 16,000
5 8 8,000 8,000 Total: $100,000

Ch 4-39© 2004 Pearson Education, Inc.Pearson Prentice Hall, Pearson Education, Upper Saddle River, NJ 07458Ostwald and McLaren / Cost Analysis and Estimating for Engineering and Management
Budgeting
Written Plan For a Future Period Based On:
Cost EstimatingAccounting RecordsConjectures of Future Activity
Ch 4-40© 2004 Pearson Education, Inc.Pearson Prentice Hall, Pearson Education, Upper Saddle River, NJ 07458Ostwald and McLaren / Cost Analysis and Estimating for Engineering and Management
Budget Types Appropriation
Proposed ExpendituresUsually for Big Items (Building, Equip.)
Fixed BudgetFor Departments
Variable BudgetsTied to Activity Levels Highlights Variations from Planned

Ch 4-41© 2004 Pearson Education, Inc.Pearson Prentice Hall, Pearson Education, Upper Saddle River, NJ 07458Ostwald and McLaren / Cost Analysis and Estimating for Engineering and Management
Cost vs. General Accounts

Ch 4-42© 2004 Pearson Education, Inc.Pearson Prentice Hall, Pearson Education, Upper Saddle River, NJ 07458Ostwald and McLaren / Cost Analysis and Estimating for Engineering and Management
Overhead Collect Costs
Not Tied More Directly to ProductionObtained from Budgets
DistributeRational Apportioning to Products
Allow Accurate Estimates & QuotesAlong With Direct Costs

Ch 4-43© 2004 Pearson Education, Inc.Pearson Prentice Hall, Pearson Education, Upper Saddle River, NJ 07458Ostwald and McLaren / Cost Analysis and Estimating for Engineering and Management
About Costs Direct Labor Costs
Uses Gross Hourly Cost Rate Utilization
Attribute of MachinesPercent of Possible Time In Use (100%)
EfficiencyAttribute of LaborLevel and Amount of Effort

Ch 4-44© 2004 Pearson Education, Inc.Pearson Prentice Hall, Pearson Education, Upper Saddle River, NJ 07458Ostwald and McLaren / Cost Analysis and Estimating for Engineering and Management
Budget (Physical Assets)
Center No. ft2 Hours Hp Hours Dep Tooling
Light 20 3,200 49,300 443,000 $52,500 $200,000
Heavy 2 3,400 6,800 748,000 95,000 80,000
Assy 15 1,100 17,000 24,000 10,000
Testing 8 1,700 13,600 68,000 22,500 65,000
9,400 86,700 1,283,000 $170,000 $355,000

Ch 4-45© 2004 Pearson Education, Inc.Pearson Prentice Hall, Pearson Education, Upper Saddle River, NJ 07458Ostwald and McLaren / Cost Analysis and Estimating for Engineering and Management
Budget (Labor Assets)
Center Wrkrs Wage ($/hr)
Fringes ($/hr)
Gross ($/hr)
Direct Hours
BudgetCost ($)
Light 29 21.40 6.42 27.82
58,000 1,613,560
Heavy 4 25.75 7.73 33.48
8,000 267,800
Assy10 18.65 5.60 24.25
20,000 484,900
Test8 20.05 6.02 26.07
16,000 417,040
Total 51 102,000 2,783,300

Ch 4-46© 2004 Pearson Education, Inc.Pearson Prentice Hall, Pearson Education, Upper Saddle River, NJ 07458Ostwald and McLaren / Cost Analysis and Estimating for Engineering and Management
Collecting Overhead Costs
Costs Tied to ProductionBut Not to Specific Products
General CostsEngineeringManagementSales

Ch 4-47© 2004 Pearson Education, Inc.Pearson Prentice Hall, Pearson Education, Upper Saddle River, NJ 07458Ostwald and McLaren / Cost Analysis and Estimating for Engineering and Management
Annual Overhead
Overhead BudgetFactory
Space $256,000Utilities $239,625Indirect labor $229,000Tooling services $469,600
Engineering
$247,000Management
$505,000
Total budget $1,946,225

Ch 4-48© 2004 Pearson Education, Inc.Pearson Prentice Hall, Pearson Education, Upper Saddle River, NJ 07458Ostwald and McLaren / Cost Analysis and Estimating for Engineering and Management
Allocating Overhead Costs
Single Overhead Rate (Traditional)Divide Total Overhead Over Some Measure of Productione.g. Per Direct Labor Hour (Burden)Misleading, Does Not Apportion Overhead as It Is Used

Ch 4-49© 2004 Pearson Education, Inc.Pearson Prentice Hall, Pearson Education, Upper Saddle River, NJ 07458Ostwald and McLaren / Cost Analysis and Estimating for Engineering and Management
Allocation Basis
Collect Overhead Charges Determine the Concurrent Basis
Labor $, Hours, Prime Cost Calculate the Overhead Rate Apply the Rate
basis
charges overhead rate overhead

Ch 4-50© 2004 Pearson Education, Inc.Pearson Prentice Hall, Pearson Education, Upper Saddle River, NJ 07458Ostwald and McLaren / Cost Analysis and Estimating for Engineering and Management
Overhead Charges

Ch 4-51© 2004 Pearson Education, Inc.Pearson Prentice Hall, Pearson Education, Upper Saddle River, NJ 07458Ostwald and McLaren / Cost Analysis and Estimating for Engineering and Management
Basis

Ch 4-52© 2004 Pearson Education, Inc.Pearson Prentice Hall, Pearson Education, Upper Saddle River, NJ 07458Ostwald and McLaren / Cost Analysis and Estimating for Engineering and Management
Overhead Rate

Ch 4-53© 2004 Pearson Education, Inc.Pearson Prentice Hall, Pearson Education, Upper Saddle River, NJ 07458Ostwald and McLaren / Cost Analysis and Estimating for Engineering and Management
Applying the Rate

Ch 4-54© 2004 Pearson Education, Inc.Pearson Prentice Hall, Pearson Education, Upper Saddle River, NJ 07458Ostwald and McLaren / Cost Analysis and Estimating for Engineering and Management
Single Rate Example
Center
Est. Hours
Wage($/hr)
Direct Labor ($)
O/H ($/hr)
O/H Costs ($)
Total($)
Light 7.31 27.82 203.36 24.23 177.12 380.49
Heavy 471.23 33.48 15,776.78 24.23 11,417.90 27,194.68
Assy 21.26 24.25 515.56 24.23 515.13 1,030.68
Test 7.93 26.07 206.74 24.23 192.14 398.88
Subtot 29,004.73
Mat’l ($/unit)
$173.80
TotalMat’l
36,498.00
Total Cost
65,502.73

Ch 4-55© 2004 Pearson Education, Inc.Pearson Prentice Hall, Pearson Education, Upper Saddle River, NJ 07458Ostwald and McLaren / Cost Analysis and Estimating for Engineering and Management
Productive Hour Cost
Collect O/H Charges by Category Apportion O/H Charges by Use Examples
Maintenance to EquipmentManagement to Labor

Ch 4-56© 2004 Pearson Education, Inc.Pearson Prentice Hall, Pearson Education, Upper Saddle River, NJ 07458Ostwald and McLaren / Cost Analysis and Estimating for Engineering and Management
Assignment to CentersCenter Dep Tooling Space Utilities
Light $52,500 $200,000 $87,149 $82,739
Heavy 95,000 80,000 92,596 139,703
Assy 10,000 29,957 4,482
Test 22,500 65,000 46,298 12,700
$170,000 $355,000 $256,000 $239,625
Allo-cation
MACRS Directly assigned
Shop area HP Hr

Ch 4-57© 2004 Pearson Education, Inc.Pearson Prentice Hall, Pearson Education, Upper Saddle River, NJ 07458Ostwald and McLaren / Cost Analysis and Estimating for Engineering and Management
Assignment to Centers (con’t)Center Indir Lab Tools Engr Mgmt Total O/H
Light $130,216 $162,146 $140,451 $292,763 $1,147,963
Heavy 17,961 273,781 19,373 48,589 767,003
Assy 44,902 8,784 48,431 87,980 234,538
Test 35,922 24,889 38,745 75,667 321,721
$229,000 $469,600 $247,000 $505,000 $2,471,225
Allo-cation
DLHr HP Hr DLHr DL$

Ch 4-58© 2004 Pearson Education, Inc.Pearson Prentice Hall, Pearson Education, Upper Saddle River, NJ 07458Ostwald and McLaren / Cost Analysis and Estimating for Engineering and Management
Productive Hour Cost Rate
PHC = Machine Rate + Direct Rate
Center Total O/HBudget
hr Machine
$/hrWages
$/hrPHC $/hr
Light $1,147,963 49,300 23.29 27.82 51.11
Heavy 767,003 6,800 112.79 33.48 146.27
Assy 234,538 17,000 13.80 24.25 38.04
Test 321,721 13,600 23.66 26.07 49.72 $2,471,225 86,700

Ch 4-59© 2004 Pearson Education, Inc.Pearson Prentice Hall, Pearson Education, Upper Saddle River, NJ 07458Ostwald and McLaren / Cost Analysis and Estimating for Engineering and Management
Applying PHC RatesCenter Est Hrs PHC $/hr Cost, $/lot
Light 7.31 51.11 373.61
Heavy 471.23 146.27 68,926.81
Assy 21.26 38.04 808.73
Test 7.93 49.72 394.28
Subtotal 507.73 70,503.43
Material 36,498.00
Total 107,001.44

Ch 4-60© 2004 Pearson Education, Inc.Pearson Prentice Hall, Pearson Education, Upper Saddle River, NJ 07458Ostwald and McLaren / Cost Analysis and Estimating for Engineering and Management
Methods Comparison Traditional Single Rate
Example Product Cost $65,503
Productive Hour Cost RateExample Product Cost
$107,001
Significant Potential Error

Ch 4-61© 2004 Pearson Education, Inc.Pearson Prentice Hall, Pearson Education, Upper Saddle River, NJ 07458Ostwald and McLaren / Cost Analysis and Estimating for Engineering and Management
Activity Based Costing (ABC)
Volume Related Cost DriversNumber of Product Units Built Directly Effects Costs
Non-Volume Related Cost DriversCosts Not Effected by Number of UnitsCan Be Determined By Various Factorse.g. Engineering, Upper Management

Ch 4-62© 2004 Pearson Education, Inc.Pearson Prentice Hall, Pearson Education, Upper Saddle River, NJ 07458Ostwald and McLaren / Cost Analysis and Estimating for Engineering and Management
Cost Drivers
Volume Non-volume Direct labor hours Input
Machine hours Number of suppliers
Direct labor costs Number of engr changes
Production volume Number of sales orders
Kilowatt hours Output
Utilities Number of products Inventory levels Defect and scrap levels Process Number of schd changes Amount of rework Downtime Number of material moves

Ch 4-63© 2004 Pearson Education, Inc.Pearson Prentice Hall, Pearson Education, Upper Saddle River, NJ 07458Ostwald and McLaren / Cost Analysis and Estimating for Engineering and Management
Calculation
Sum Up Costs By Categories
oib
oii
b
hibihipiuabc C
N
CM
N
ChChC
Eq 4.13

Ch 4-64© 2004 Pearson Education, Inc.Pearson Prentice Hall, Pearson Education, Upper Saddle River, NJ 07458Ostwald and McLaren / Cost Analysis and Estimating for Engineering and Management
Variance Compare Budget to Actual Costs Variance Indicates Deviation from Plan Unfavorable Variance
Actual Costs Exceed Standard Costs Favorable Variance
Actual Costs Are Less Than StandardNot Always Beneficial to the Company

Ch 4-65© 2004 Pearson Education, Inc.Pearson Prentice Hall, Pearson Education, Upper Saddle River, NJ 07458Ostwald and McLaren / Cost Analysis and Estimating for Engineering and Management
Evaluation of Variance Unfavorable Variance
Example Increased Cost Due to Higher Production Than PlannedProbably Results in More Profit for the Company
Favorable VarianceCould Be from Lower Number of Orders

Ch 4-66© 2004 Pearson Education, Inc.Pearson Prentice Hall, Pearson Education, Upper Saddle River, NJ 07458Ostwald and McLaren / Cost Analysis and Estimating for Engineering and Management
Finding the Variance

Ch 4-67© 2004 Pearson Education, Inc.Pearson Prentice Hall, Pearson Education, Upper Saddle River, NJ 07458Ostwald and McLaren / Cost Analysis and Estimating for Engineering and Management
Finding the Variance - Alt.

Ch 4-68© 2004 Pearson Education, Inc.Pearson Prentice Hall, Pearson Education, Upper Saddle River, NJ 07458Ostwald and McLaren / Cost Analysis and Estimating for Engineering and Management
Material Variance
Total Is the Same Depends on Order of Calculation
aeam
eeam
NCCV
CNNV
)(
)('
Eq 4.14

Ch 4-69© 2004 Pearson Education, Inc.Pearson Prentice Hall, Pearson Education, Upper Saddle River, NJ 07458Ostwald and McLaren / Cost Analysis and Estimating for Engineering and Management
Illustration

Ch 4-70© 2004 Pearson Education, Inc.Pearson Prentice Hall, Pearson Education, Upper Saddle River, NJ 07458Ostwald and McLaren / Cost Analysis and Estimating for Engineering and Management
Use of Variances Monitor and Control
Find Causes of VarianceCorrect Causes or Budget Process
ExampleExtra Production
Scrap or More Orders
Scrap is Production ProblemMore Orders Is Sales Forecast Problem

Ch 4-71© 2004 Pearson Education, Inc.Pearson Prentice Hall, Pearson Education, Upper Saddle River, NJ 07458Ostwald and McLaren / Cost Analysis and Estimating for Engineering and Management
Summary
How Accounting Works and Fits Working With and Impact of
Depreciation What a Budget Is, What It’s Used For Determine and Apply Overhead Rates Use Variance for Monitor and Control
Related Documents


