CGA6001 – Cognos Business Intelligence – Using Report Studio Page 1 of 55 SunGard Public Sector- Proprietary Information CGA6001 Cognos Business Intelligence Using Report Studio Lab PLEASE DO NOT REMOVE FROM THE LAB ROOM Document will be available for download after the conference

Welcome message from author
This document is posted to help you gain knowledge. Please leave a comment to let me know what you think about it! Share it to your friends and learn new things together.
Transcript
CGA6001 – Cognos Business Intelligence – Using Report Studio
Page 1 of 55 SunGard Public Sector- Proprietary Information
CGA6001
Cognos Business Intelligence Using Report Studio
Lab
PLEASE DO NOT REMOVE FROM THE LAB ROOM
Document will be available for download after the conference

CGA6001 – Cognos Business Intelligence – Using Report Studio
Page 2 of 55 SunGard Public Sector- Proprietary Information
Table of Contents
Introduction ............................................................................................................................................................ 3
Product Position .................................................................................................................................................... 3
Lab Scenario ............................................................................................................................................................ 3
Launch IBM Cognos .............................................................................................................................................. 4
Start Report Studio ............................................................................................................................................... 5
Select a Package ........................................................................................................................................ 5
(A) Financial Statements displayed in “Recently used packages” ........................................................ 5
(B) Financial Statements is NOT displayed in “Recently used packages” ............................................. 5
Build the Report .................................................................................................................................................... 7
Quick look at the interface ........................................................................................................................ 8
Add Data Items to the Report ................................................................................................................. 10
Drag and Drop Data Items .................................................................................................................. 11
Formatting .............................................................................................................................................. 14
Grouping ............................................................................................................................................. 14
Sorting ................................................................................................................................................. 15
Calculated Field ................................................................................................................................... 15
Summarize Data Items ........................................................................................................................ 18
Filters ................................................................................................................................................... 20
Prompt Pages ...................................................................................................................................... 26
Adding Charts ...................................................................................................................................... 39
Final Formatting ................................................................................................................................................. 50
Run the Report .................................................................................................................................... 52
Next Steps ............................................................................................................................................................. 55

CGA6001 – Cognos Business Intelligence – Using Report Studio
Page 3 of 55 SunGard Public Sector- Proprietary Information
Introduction This Test Drive document is intended to demonstrate basic capabilities available within IBM Cognos
Report Studio. Report Studio is a Web-based report authoring tool used by professional report authors
and developers to build sophisticated, multi-page, multi-query reports against multiple databases. With
Report Studio, you can create any report required by your organization.
Product Position IBM Cognos Report Studio is a web based report authoring tool which is used to create sophisticated, multi-page, multi-query reports against multiple data bases. Reports created using Report Studio can contain charts, lists, images, logos and links to other reports and information. Report Studio is best used for creating reports which:
are intended for a wide audience
exist long enough to require maintenance for changing requirements
require detailed control over the appearance
Lab Scenario The accounting group has come to you with a request for a report. The requirements are as follows:
(1) Include the following data items.
Year
General Ledger Code
General Ledger Description
Account Types - Revenue and Expenses
Period
Debit
Credit
Net Amount (2) Include ability to view either a single year or multiple years (3) Provide information in list format (4) Include two charts:
a. Net Amount for Year/Period b. Net Amount for Year/Account Type

CGA6001 – Cognos Business Intelligence – Using Report Studio
Page 4 of 55 SunGard Public Sector- Proprietary Information
Launch IBM Cognos There are two options for launching IBM Cognos.
1. Double-Click on the IBM Cognos Business Intelligence shortcut on your desktop.
OR
1. Open Internet Explorer (IE)
2. Click the link in the Favorites bar called IBM Cognos Business Intelligence
3. If you are presented with the screen shown below, click on My home, otherwise proceed to step
4.

CGA6001 – Cognos Business Intelligence – Using Report Studio
Page 5 of 55 SunGard Public Sector- Proprietary Information
Start Report Studio 4. We are now logged into IBM Cognos. In the upper right, click on Launch to open a pull-down
menu, then click Report Studio.
Select a Package 5. You are presented with the dialog, “Select a package (Navigate)”. This is where we decide what
data to use in our report.
For this lab we will choose the Financial Statements Package. It may show in the “Recently used packages” window, or, we may need to navigate to it in the “List of all packages”.
(A) Financial Statements displayed in “Recently used packages”
If you see Financial Statements in the list of “Recently used packages”, click on it. Report Studio will open with the Financial Statements package loaded.
(B) Financial Statements is NOT displayed in “Recently used packages”
If you do not see Financial Statements in the list of “Recently used packages”: (1) Review the “List of all packages:” section
(2) Click on ONESolution Finance Packages

CGA6001 – Cognos Business Intelligence – Using Report Studio
Page 6 of 55 SunGard Public Sector- Proprietary Information
(3) Click on Financials
(4) Click on Financial Statements.
Report Studio will open with the Financial Statements package loaded.

CGA6001 – Cognos Business Intelligence – Using Report Studio
Page 7 of 55 SunGard Public Sector- Proprietary Information
Build the Report
6. You are now presented with the IBM Cognos Report Studio Welcome screen seen below; click Create new.
7. Click on List and then click OK.

CGA6001 – Cognos Business Intelligence – Using Report Studio
Page 8 of 55 SunGard Public Sector- Proprietary Information
Quick look at the interface Let’s familiarize ourselves with the Report Studio interface. It will be helpful to know where a few things are.
Below is a view of the Financial Statements package. Each item listed below “Financial Statements” is a Query Subject. The data items used for reporting are contained within these Query Subjects.

CGA6001 – Cognos Business Intelligence – Using Report Studio
Page 9 of 55 SunGard Public Sector- Proprietary Information
By expanding Transaction Detail, we are now presented with individual Data Items which may be used in a report.
All of this information is available in the first tab of this pane. By clicking on the last tab in this viewing pane, we are presented with our report toolbox.
The toolbox contains all of the report objects, or ‘tools’ we can use to build a report. These tools are used by dragging and dropping them in the desired location on the report page. The middle tab of the viewing pane will contain our report query/queries once we have started report development.

CGA6001 – Cognos Business Intelligence – Using Report Studio
Page 10 of 55 SunGard Public Sector- Proprietary Information
The toolbar at the top of the window is quite similar to those used in MS Excel or MS Word.
You should see familiar icons such as Save, Undo, Copy, Paste and Delete, in addition to Cognos specific icons such as Filter and Group. Hovering over each icon will show you their function. These toolbar items are not specific to Report Studio and will be present in other studios in Cognos.
Add Data Items to the Report 8. On the left, expand Transaction Detail by clicking on the “+” to the left of the text.
While the data items are being retrieved case you may be presented with a spinning hourglass.
Once the process is completed, you will be presented with the data items available for the report.

CGA6001 – Cognos Business Intelligence – Using Report Studio
Page 11 of 55 SunGard Public Sector- Proprietary Information
Drag and Drop Data Items
From Transaction Detail we are going to drag and drop the Year, Period, General Ledger, General Ledger Description, Debit and Credit data items onto our report.
9. Click on Year, drag and drop it onto the List in our report. You will see a flashing double line to indicate you are dropping the data item into the list.
Your list should now match the picture below.
10. Repeat the process for General Ledger, General Ledger Description, Period, Debit and Credit. You can CTRL-Click multiple data items to add them at the same time.

CGA6001 – Cognos Business Intelligence – Using Report Studio
Page 12 of 55 SunGard Public Sector- Proprietary Information
Note: Insure the bars to the right of Year look like the above picture, if they do not you will get a
message about creating a Singleton, or, single data item. If that happens, use the undo button on
the toolbar and try again.
The result should appear as below:
11. We will need to add one more field, Object Type (this is the Account Type) from the GL Object Code Information query subject. First, collapse Transaction Detail.
12. Now expand GL Object Code Information by clicking on the ‘+’ next to it.
13. Drag GL Object Type into the report; however, we want to place them between the Period and
Debit columns. Click on GL Object Type, drag them to the desired location and drop.

CGA6001 – Cognos Business Intelligence – Using Report Studio
Page 13 of 55 SunGard Public Sector- Proprietary Information
The results should appear as below:
If your results vary from the above list, you can click Undo in the toolbar and try again.
Click on the Run button in the toolbar to be presented with your report output. This Run button will generate the report using the default output type of HTML.
You will notice that the output is providing you the data items you used, but there is no formatting or sorting, making it difficult to analyze the data.

CGA6001 – Cognos Business Intelligence – Using Report Studio
Page 14 of 55 SunGard Public Sector- Proprietary Information
Formatting Now that we have the basic data in our report, we need to provide formatting to make our report more usable. We are going to add Sorting, Grouping, Summarizing, and Filtering in addition to other basic formatting tasks.
Grouping
We will group several columns to make the report easier to view. Fields can be grouped one at a time,
or you may select multiple columns and group them all at once.
14. CTRL-Click the Year, General Ledger, General Ledger Description, Period and GL Object Type
columns then click on the Group/Ungroup icon on the toolbar.
The results should appear as below:

CGA6001 – Cognos Business Intelligence – Using Report Studio
Page 15 of 55 SunGard Public Sector- Proprietary Information
Sorting
We currently have many Years, Ledgers, Periods, and Object Types in our report. They are now grouped
but will not be displayed in any particular order until sorted. Each column must be sorted one at a time.
15. Click on the Year column, and then click on the sort button in the toolbar. Select Ascending from
the drop down list.
You will now see an arrow next to Year indicating the sort order.
Repeat this step for General Ledger, General Ledger Description, Period, and Object Type.
Calculated Field
One of report requirements is to provide a “Net Amount”. This data item will have to be calculated based on the Debit and Credit data items. A Calculated Field allows us the flexibility to do anything from basic arithmetic to highly complex calculations. There are several ways to add a calculated field in Report Studio; we are going to explore dropping a toolbox item onto the report list.
16. Click on the Toolbox tax in the source pane.

CGA6001 – Cognos Business Intelligence – Using Report Studio
Page 16 of 55 SunGard Public Sector- Proprietary Information
17. Click on Query Calculation, drag and drop to the right of Credit
18. Name your data item. You will be presented with a pop up window titled Create Calculation,
enter the name Net Amount and click OK.
19. Define your calculation expression. The next pop up window is where you will create the
calculation. Click on the second tab from the left, Data Items, to be presented with the items in
our report query.

CGA6001 – Cognos Business Intelligence – Using Report Studio
Page 17 of 55 SunGard Public Sector- Proprietary Information
20. Click and drag Credit from the Available Components to the Expression Definition.
21. Type the minus sign next to Credit in the Expression Definition. Click and drag Debit from the Available Components to the Expression Definition to the right of the minus sign.
Click OK

CGA6001 – Cognos Business Intelligence – Using Report Studio
Page 18 of 55 SunGard Public Sector- Proprietary Information
Your list should now appear as below:
Summarize Data Items
The next step is to summarize the Debit, Credit and Net Amount columns.
22. CNTL-click the Debit, Credit, and Net Amount columns. Next, click on the Summarize icon in the toolbar. Select Total from the drop down list.
The results should appear as below:
CGA6001 – Cognos Business Intelligence – Using Report Studio
Page 19 of 55 SunGard Public Sector- Proprietary Information
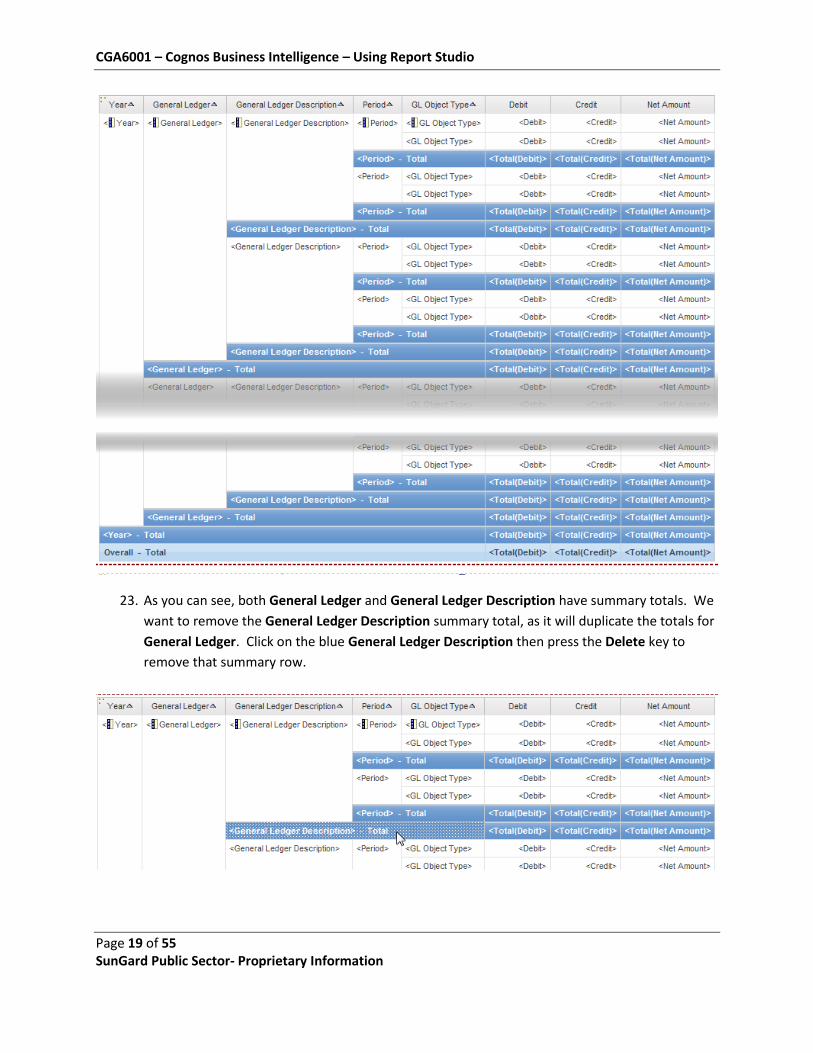
23. As you can see, both General Ledger and General Ledger Description have summary totals. We
want to remove the General Ledger Description summary total, as it will duplicate the totals for
General Ledger. Click on the blue General Ledger Description then press the Delete key to
remove that summary row.

CGA6001 – Cognos Business Intelligence – Using Report Studio
Page 20 of 55 SunGard Public Sector- Proprietary Information
The result should appear as below:
Filters
Now that we have done some basic grouping and sorting, as well as added our calculations, we need to provide filters and prompts. We were asked by the accounting group to provide the ability to display data for one, several, or all the years and ledgers as well as including only account types revenue and expenses. In order to accommodate this we will create a prompt page that will give the user the ability to select the year or years to be included in the results as well as choose from a list of ledgers applicable to the selected years. In order to accomplish this we need to create filters on the query supplying data to our report. There are two types of detail filters which will be used on this report.
(1) Static Detail Filter – limits the data in the report based on the criteria set by the report author. You will use this filter type to limit the GL Object type to RV an XP for this report.
(2) Dynamic Detail Filter – limits the data in the report based on input by the user at runtime through prompt selection. You will use this filter type to limit the Years and Ledgers returned in your report.
24. Hover over Query Explorer and select Query1.

CGA6001 – Cognos Business Intelligence – Using Report Studio
Page 21 of 55 SunGard Public Sector- Proprietary Information
25. Before you add the filters, rename the query from Query1 to Report Query. This is done in the Properties dialog in the lower left of the screen. The name field is located at the bottom of the list.
26. Create a static filter for the GL Object Type. In the Data Items pane, click and drag GL Object Type into the Detail Filters pane.
27. You will be presented with a Detail Filter Expression pop up. In the Expression Definition window, type ‘in’ after GL Object Type. Click on the Data Items tab (second from left) to reveal the Query items.

CGA6001 – Cognos Business Intelligence – Using Report Studio
Page 22 of 55 SunGard Public Sector- Proprietary Information
28. Once you have clicked on the Data Items tab, click on GL Object Type.
29. You now have several icons activated in the top right corner of your window. Click on the Select Multiple Values icon located third in from the left.

CGA6001 – Cognos Business Intelligence – Using Report Studio
Page 23 of 55 SunGard Public Sector- Proprietary Information
30. You will now be presented with a selection window. In the Values list on the left side, CNTR-click on RV and XP. Move them into the Selected Values list on the right side by clicking the arrow.
Click Insert once you have moved your choices into the Selected Values list. Your results should appear as below. NOTE: If your choices were inserted before GL Object Type, you will need to highlight the text, cut and paste at the end of the expression to achieve the below statement.
Click OK.

CGA6001 – Cognos Business Intelligence – Using Report Studio
Page 24 of 55 SunGard Public Sector- Proprietary Information
31. Click on the Toolbox tab, you will now see a toolbox item named Filter.
32. Click and drag a Filter from the Toolbox to the Detail Filters section.
33. The Detail Filter Expression dialog will appear. Click the Data Items Tab.

CGA6001 – Cognos Business Intelligence – Using Report Studio
Page 25 of 55 SunGard Public Sector- Proprietary Information
34. Click and drag Year to the Expression Definition.
35. After [Year] in the Expression Definition pane, type in ?Year? Then click OK.
36. Create an additional filter for General Ledger. Drag a Filter into the Detail Filter area, drag General Ledger into the expression definition and add the text in ?Ledger?.

CGA6001 – Cognos Business Intelligence – Using Report Studio
Page 26 of 55 SunGard Public Sector- Proprietary Information
Click OK. Your results should now appear as below
Prompt Pages
If you were to run the report now, Cognos would automatically generate a prompt for the two filters on the report. These system generated prompts are not formatted nor are there any data relationships between them – you will not be able to limit the ledger presented for selection based on the years chosen. In order to put some formatting around the prompts and create the cascade relationship, you need create a formatted prompt page.
37. Hover over Page Explorer and select Prompt Pages.
38. From the Toolbox, click and drag a Page to the Prompt Pages area.

CGA6001 – Cognos Business Intelligence – Using Report Studio
Page 27 of 55 SunGard Public Sector- Proprietary Information
39. Double click Prompt Page1 to go to the new prompt page for editing.
Your screen should now look like this.
40. Click and drag Table from the Toolbox to the page.

CGA6001 – Cognos Business Intelligence – Using Report Studio
Page 28 of 55 SunGard Public Sector- Proprietary Information
41. The following dialog will appear, change the number of columns to 3, number of rows to 2, uncheck Maximize width, and then click OK.
You will create a descriptive label for each prompt being created. This explains to users running the report how to answer the prompts, and what information is being asked for.
42. From the Toolbox, click and drag a Text Item into the first box in the first row of the table you just added.
43. In the Text Item dialog, enter: Select Year(s)
44. Click and drag a Text Item to the third box in the first row and enter: Select Ledger(s)

CGA6001 – Cognos Business Intelligence – Using Report Studio
Page 29 of 55 SunGard Public Sector- Proprietary Information
Your results should now appear as below
45. In the Toolbox, scroll down and select Value Prompt. Click and drop in the first cell of the second row.
46. You will be presented with the Prompt Wizard. Select Use existing parameter and select Year from the pull-down menu. When you created a filter for Year, you typed in ?Year? in the filter dialog. You are now associating that filter with this prompt. Click Next

CGA6001 – Cognos Business Intelligence – Using Report Studio
Page 30 of 55 SunGard Public Sector- Proprietary Information
47. Allow the Prompt Wizard to create a new query, however, provide a Name for the Query of
YearPrompt.
Click Finish. Your results should appear as below.

CGA6001 – Cognos Business Intelligence – Using Report Studio
Page 31 of 55 SunGard Public Sector- Proprietary Information
48. Click on the Select Year value prompt you just added. In the Properties pane (bottom left of your
screen), click in the Sorting field, then click the ellipsis.
49. You will be presented with a pop up window. Click and drag Year from Data Items to Sort List and click the sort icon at the bottom to change the sort order to descending. You will notice the arrow will change to a down arrow next to Year in the Sort List. Click OK.

CGA6001 – Cognos Business Intelligence – Using Report Studio
Page 32 of 55 SunGard Public Sector- Proprietary Information
50. Next, change Select UI from List box to Check box group.
Your prompt should now appear as below
51. From the Toolbox, click and drag a Value prompt into the third cell in the second row of the
table, under the “Select Ledger(s)” text on the prompt page. Select Use existing parameter and pick Ledger. Click Next.

CGA6001 – Cognos Business Intelligence – Using Report Studio
Page 33 of 55 SunGard Public Sector- Proprietary Information
52. In the query Name field, enter LedgerPrompt. For Values to display: click on the ellipsis to the
right of the field.
In the Choose Package Item window, expand Transaction Detail; click on General Ledger and
Description.
Click OK.
The General Ledger and Description field has been selected as the display value for the Ledger
prompt.

CGA6001 – Cognos Business Intelligence – Using Report Studio
Page 34 of 55 SunGard Public Sector- Proprietary Information
53. In the Cascading source field, select Year. Click Finish.
The Cascading Source field filters the results of this prompt based on the value(s) selected in the first prompt, this insures that any selection made in this prompt is valid and will yield results. If this is not made a cascading prompt users could select a Year – Ledger combination that could be invalid and yield no results. 54. Click on the value prompt you just added and click in the Sorting field and then click the ellipsis
in the right corner of the cell.

CGA6001 – Cognos Business Intelligence – Using Report Studio
Page 35 of 55 SunGard Public Sector- Proprietary Information
55. Click and drag General Ledger from Data Items to Sort List. Click OK.
56. Next, change Select UI to Check box group in the Properties dialog found in the lower left.
Your results should now appear as below

CGA6001 – Cognos Business Intelligence – Using Report Studio
Page 36 of 55 SunGard Public Sector- Proprietary Information
57. In the Toolbox, click and drag a Prompt Button from the Toolbox to the middle cell on the second row of the table.
58. Click on the prompt button you just added, in the Properties adjust the Type to Reprompt.
59. In the Toolbox, scroll to the top. Click and drag a Text Item from the Toolbox onto the prompt button. Drop it on top of the button.

CGA6001 – Cognos Business Intelligence – Using Report Studio
Page 37 of 55 SunGard Public Sector- Proprietary Information
60. You will be presented with a pop up Text dialog box. Enter the text: Show Ledgers. Click OK.
The result should appear as below.
61. Give your prompt page a title by Double-clicking on the text at the top of the page. Enter
Account Listing Prompt Page in the dialog box. Click OK when finished.
NOTE: If Double-click to edit text is already selected and you click on it again, you can edit the text
in the field without being presented with the pop up dialog box. Once you are done editing the text
hit enter.
62. CTRL-Click the first and third cells in the first row on the table (click in the space to the right of the text, not on the text itself) and click the Center icon on the toolbar.

CGA6001 – Cognos Business Intelligence – Using Report Studio
Page 38 of 55 SunGard Public Sector- Proprietary Information
With the title cells still selected, click on the Bold icon in the toolbar.
CGA6001 – Cognos Business Intelligence – Using Report Studio
Page 39 of 55 SunGard Public Sector- Proprietary Information
Adding Charts
You can easily add charts to your report which can increase the value of the report to the end users.
These charts will display not only on this report, but the chart will be available for use later in
dashboards as a report element.
Begin building Charts
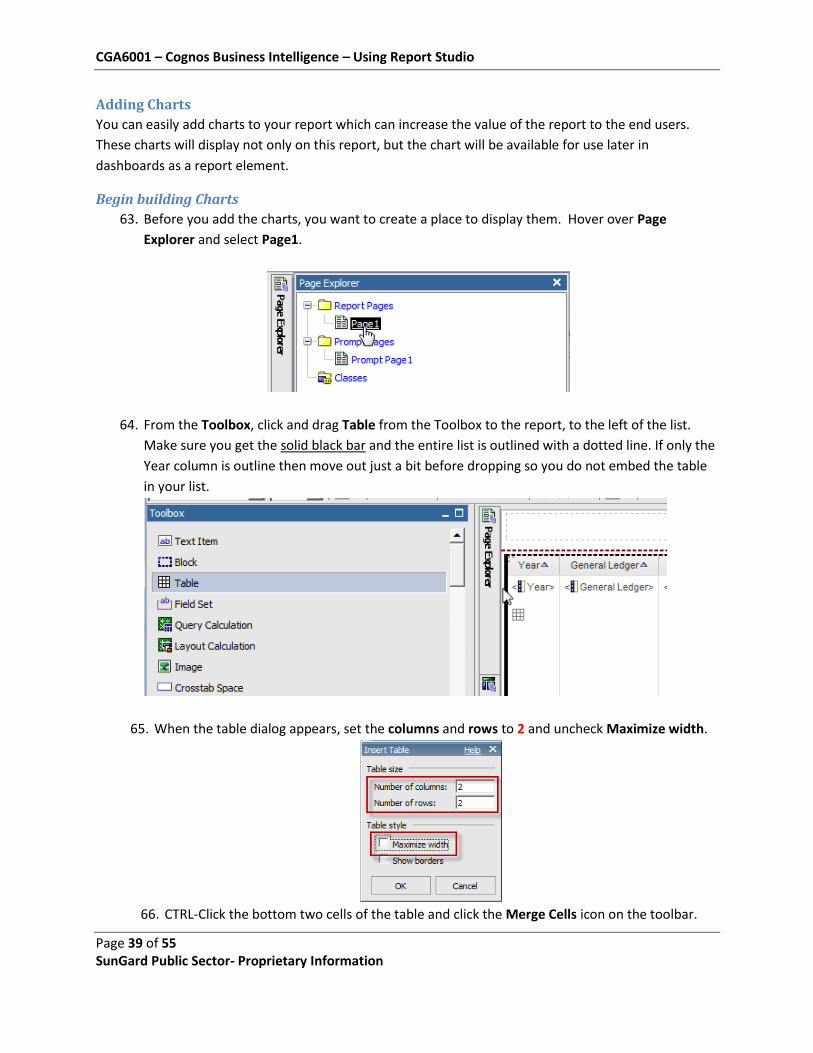
63. Before you add the charts, you want to create a place to display them. Hover over Page
Explorer and select Page1.
64. From the Toolbox, click and drag Table from the Toolbox to the report, to the left of the list.
Make sure you get the solid black bar and the entire list is outlined with a dotted line. If only the
Year column is outline then move out just a bit before dropping so you do not embed the table
in your list.
65. When the table dialog appears, set the columns and rows to 2 and uncheck Maximize width.
66. CTRL-Click the bottom two cells of the table and click the Merge Cells icon on the toolbar.

CGA6001 – Cognos Business Intelligence – Using Report Studio
Page 40 of 55 SunGard Public Sector- Proprietary Information
67. Click the 3 red dots on the top left corner of the list (in the Year header). This will select the
entire list.
68. Now drag the list into the bottom cell of the table.
The result should appear as below.

CGA6001 – Cognos Business Intelligence – Using Report Studio
Page 41 of 55 SunGard Public Sector- Proprietary Information
69. From the Toolbox, click on Chart and drop it into the top left table cell.
70. You will be presented with the following dialog; select Clustered Column with 3D Effects and
click OK.

CGA6001 – Cognos Business Intelligence – Using Report Studio
Page 42 of 55 SunGard Public Sector- Proprietary Information
Your results should appear as below
71. Click on the chart. In the Properties dialog, click on Query. From the drop down menu select
Report Query.
72. Click on the Data Item icon.

CGA6001 – Cognos Business Intelligence – Using Report Studio
Page 43 of 55 SunGard Public Sector- Proprietary Information
73. From the Report Query, CTRL-Click Debit, Credit and Net Amount and drag them into the Series
box on the chart.
74. Click and drag Year from the Report Query into the Categories (x-axis) box.

CGA6001 – Cognos Business Intelligence – Using Report Studio
Page 44 of 55 SunGard Public Sector- Proprietary Information
75. Click and drag General Ledger from the Report Query into the Categories (x-axis) box below
Year.
NOTE: In order to nest Year and General Ledger, ensure that you are receiving a flashing line
BENEATH Year before dropping General Ledger. Once dropped, your results should appear as
below.
76. Click and drag GL Object Type from Report Query into the Categories (x-axis) box below General
Ledger.

CGA6001 – Cognos Business Intelligence – Using Report Studio
Page 45 of 55 SunGard Public Sector- Proprietary Information
Your result should appear as below.
In order to allow users to easily recognize this chart in Workspace Advanced, you will need to
provide a descriptive name.
77. Click on the chart. In the Properties pane scroll all the way to the bottom.

CGA6001 – Cognos Business Intelligence – Using Report Studio
Page 46 of 55 SunGard Public Sector- Proprietary Information
78. In the Name field, replace Combination Chart1 with Amounts by Ledger and Type.
In Cognos Workspace, this Name will be provided to users to identify this graph making it much
simpler to identify the graphs desired for their dashboards.
79. From the Toolbox, click on Chart and drag it to the empty table cell.
80. On the Insert Chart dialog, select Bar on the left and then select Clustered Bar with 3D Effects
on the right. Click OK.

CGA6001 – Cognos Business Intelligence – Using Report Studio
Page 47 of 55 SunGard Public Sector- Proprietary Information
81. Click on the bar chart and in the Properties dialog change the Query from Query1 to Report
Query.
82. Click on the Data Item icon.
83. CTRL-Click Total(Debit) and Total(Credit) from Report Query and drag them into the Series box
on the chart.

CGA6001 – Cognos Business Intelligence – Using Report Studio
Page 48 of 55 SunGard Public Sector- Proprietary Information
84. Click and drag Year from Report Query into the Categories (y-axis) box.
85. Click and drag GL Object Type from Report Query into the Categories box beneath Year.
Your results should appear as below.

CGA6001 – Cognos Business Intelligence – Using Report Studio
Page 49 of 55 SunGard Public Sector- Proprietary Information
86. Click on the chart. In the Properties pane scroll all the way to the bottom.
87. In the Name field, replace Combination Chart1 with Totals by Year and Type.

CGA6001 – Cognos Business Intelligence – Using Report Studio
Page 50 of 55 SunGard Public Sector- Proprietary Information
Final Formatting Once the report and prompt page have been completed, there are only a few formatting items left to be
completed.
88. Add a title to the report. Double-click on the Double-click to edit text at the top of the report
and enter Account Listing in the dialog box; click OK.
89. Center the charts and list in the table cells. In the upper left corner of the table, click the three
red dots. This will select the entire table. Ensure you are not selecting the chart in that cell.
90. With the table selected, click on the Center icon in the toolbar.

CGA6001 – Cognos Business Intelligence – Using Report Studio
Page 51 of 55 SunGard Public Sector- Proprietary Information
91. Add padding to table cells to space objects. Click on the first table cell to the side of the chart, CNTR-click each remaining table cell to the side of the chart or list. Ensure that you do not select the chart or list but the table cell itself.
In the Properties pane, click on Padding then click on the ellipsis in the cell.
92. You will be presented with a pop up window, enter 5 in each entry box. Click OK.

CGA6001 – Cognos Business Intelligence – Using Report Studio
Page 52 of 55 SunGard Public Sector- Proprietary Information
Run the Report
It is time to run the report.
93. Click the Run icon on the toolbar.
You will be presented with the report prompt page, as shown below.
You will notice the Select Ledger(s) list is not populated and several of the buttons at the bottom of the
page are deactivated. Due to the fact that the prompts are REQUIRED, the Finish button is disabled until
all selections are made. Because we only have one prompt page, the Back and Next buttons will remain
disabled.

CGA6001 – Cognos Business Intelligence – Using Report Studio
Page 53 of 55 SunGard Public Sector- Proprietary Information
94. Select the Years 2012 and 2011 then click Show Ledgers. The Ledger prompt will now populate with the Ledgers which were active during the years selected.
95. Click the Select all link below the Ledgers list and then click the Finish button at the bottom of the page.

CGA6001 – Cognos Business Intelligence – Using Report Studio
Page 54 of 55 SunGard Public Sector- Proprietary Information
Your results should appear as below.

CGA6001 – Cognos Business Intelligence – Using Report Studio
Page 55 of 55 SunGard Public Sector- Proprietary Information
Note: at the bottom left there may be paging controls. You can page up, down, go to the top or bottom of the report. The lab is now complete, exit by closing all of your browser windows. If prompted, do not save your
work.
Next Steps You have now completed the Report Studio Test Drive Lab. Other labs such as Cognos Workspace, Cafe and Analysis Studio, will demonstrate how each studio can be useful to your organization. We encourage you to attend those labs.
Related Documents


