CFPP 2007 - 02 O ct 07 Linda Newton, PhD, PMP Manager, Realty Asset Support Quality Garbage is Still Garbage

CFPP 2007 - 02 Oct 07 Linda Newton, PhD, PMP Manager, Realty Asset Support Quality Garbage is Still Garbage.
Dec 15, 2015
Welcome message from author
This document is posted to help you gain knowledge. Please leave a comment to let me know what you think about it! Share it to your friends and learn new things together.
Transcript

CFPP 2007 - 02 Oct 07
Linda Newton, PhD, PMPManager, Realty Asset Support
Quality Garbage is Still GarbageQuality Garbage is Still Garbage
CFPP 2007 - 02 Oct 07
OverviewOverview
• Infrastructure Management Cycle
• Case Study on Impact of Quality
• Way Ahead
• WIFUS (What’s in it for us?)

CFPP 2007 - 02 Oct 07
Infrastructure Management CycleInfrastructure Management Cycle
PlanAcquire
Use
Dispose

CFPP 2007 - 02 Oct 07

CFPP 2007 - 02 Oct 07
Life Cycle ManagementLife Cycle Management
PlanAcquire
Use Dispose$
Time

CFPP 2007 - 02 Oct 07
Ability to Influence Life Cycle CostsAbility to Influence Life Cycle Costs
Time
Lev
el o
f I n
f lue
nce
ConstructionDesign
Operate &Maintain
100%
0%
50%
CFPP 2007 - 02 Oct 07
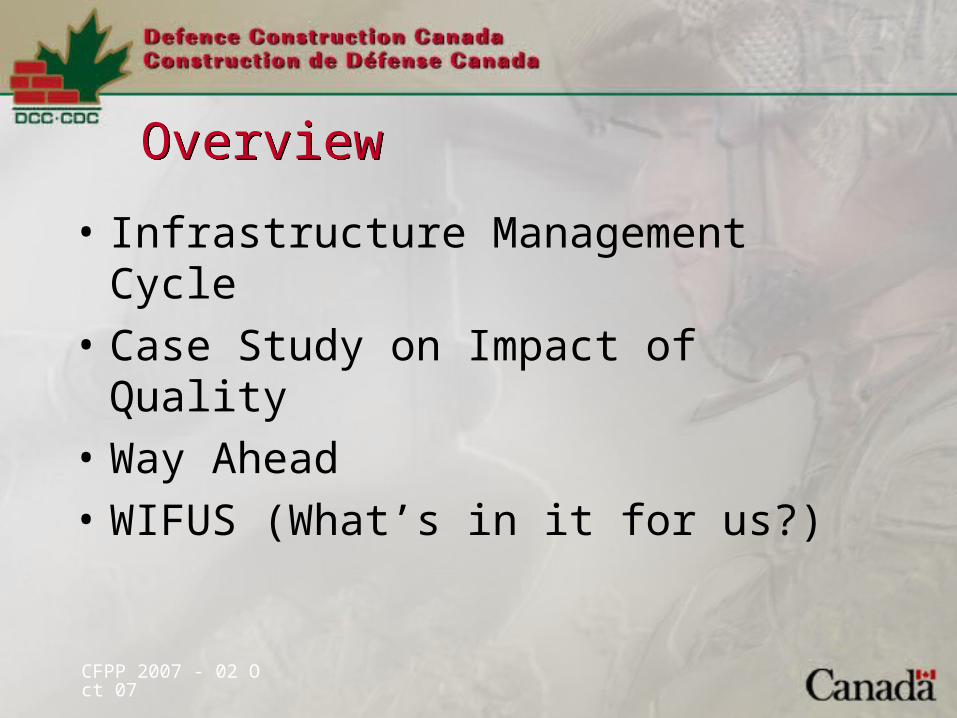
What is Quality?What is Quality?• “Degree of excellence” (Oxford Dictionary, 1992))
• Conformance to requirements (Crosby, 1979)
• “Satisfaction Guaranteed or your money refunded” (T. Eaton Company)
• “Totality of characteristics of an entity that bear on its ability to satisfy stated and implied needs” (American Society for Quality)

CFPP 2007 - 02 Oct 07
Dimensions of QualityDimensions of Quality
• Performance
• Reliability
• Durability
• Serviceability
• Aesthetics
• Conformance
• Perceived quality
Defining the Requirement
Process
Product

CFPP 2007 - 02 Oct 07
Impact of QualityImpact of Quality
• DND Case Study
• Quality Myths: fact or fiction– #1 Save now pay later– #2 We don’t build ‘em like we used to– #3 Perception is everything
• Impact

CFPP 2007 - 02 Oct 07
DND StudyDND Study• Five categories of buildings
– administration, residential, operations, institutional (lecture/training), hangars
• Common design • Constructed after 1950
• Older >41 years of age• Middle-aged 26-41 years of age• Newer <26 years of age
• Focus on costs in first 20 years of building life

CFPP 2007 - 02 Oct 07

CFPP 2007 - 02 Oct 07

CFPP 2007 - 02 Oct 07

CFPP 2007 - 02 Oct 07

CFPP 2007 - 02 Oct 07
100 90 80 70 60 50
20
15
10
5
Annual equivalent construction costs(1999$/m2/yr)
An
nu
al e
quiv
alen
t 2
0 y
rM
&R
cos
ts (
19
99
$/m
2/y
r)
Myth #1: Save Now, Pay LaterMyth #1: Save Now, Pay Later
Comparison of Maintenance/Rehabilitation Costs & Construction Costs

CFPP 2007 - 02 Oct 07
Myth #2: We Don’t Build ‘em Like We Used ToMyth #2: We Don’t Build ‘em Like We Used To
• Construction costs generally lower for newer buildings
• Building services costs comparable
• M&R* costs highest for newer buildings:• Newer 1999$ 11/m2/yr
• Middle-aged 1999$ 10/m2/yr
• Older 1999$ 7/m2/yr
• CMHC study showed higher repair costs for post 1980 bldgs

CFPP 2007 - 02 Oct 07
Myth #3: Perception is EverythingMyth #3: Perception is Everything
E - washrooms
I - adequate/appropriate
lighting
J - timely repairs
Q - mechanical ventilation
R – heating
**********************
PQ – Perceived Quality
DQ – Design Quality
0.0%
20.0%
40.0%
60.0%
80.0%
100.0%
I J E Q R
Quality factor - All buildings
Per
cen
t m
et
DQ
PQ

CFPP 2007 - 02 Oct 07
Impact of Design Quality on CostsImpact of Design Quality on Costs
0.6 0.7 0.8
0
10
20
Design Quality (max score = 1.0)
20 y
r A
EC
M&
R c
osts
(19
99$/
m2/
yr)
Comparison of Maintenance/Rehabilitation Costs & Design Quality

CFPP 2007 - 02 Oct 07
Way AheadWay Ahead
• Focus on ensuring quality in design– Requirements, requirements, requirements– Communicate & collaborate– Mitigation vs litigation
• Whole life/life cycle cost approach
• Examine how we procure design and construction services
CFPP 2007 - 02 Oct 07
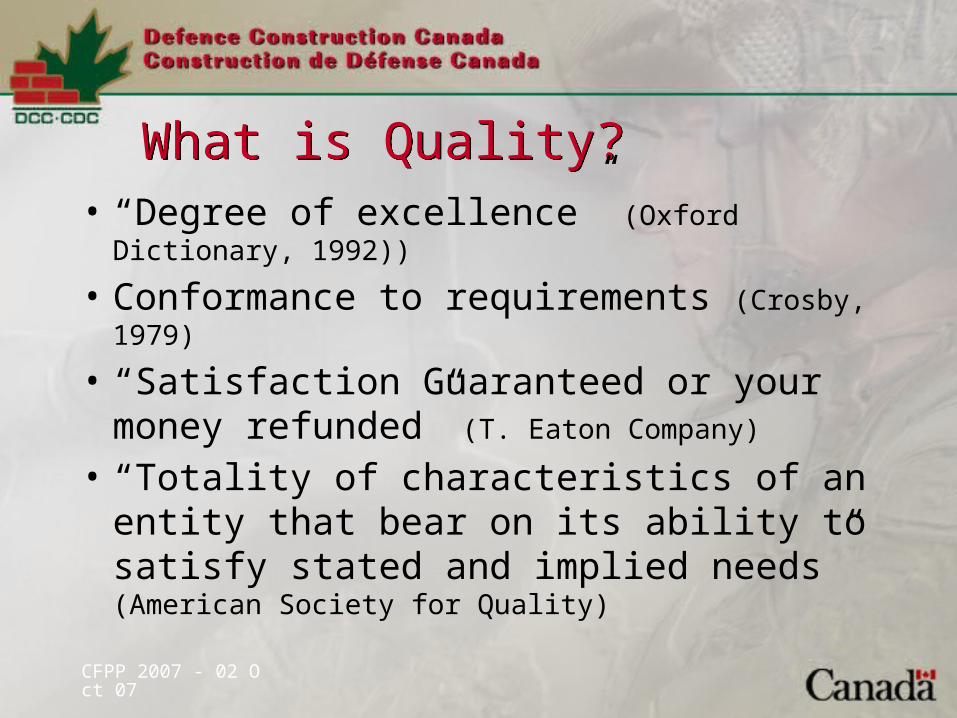
What’s in it for US?What’s in it for US?
As consultants AND owners:• WE define the design requirement• WE have the greatest opportunity to affect
end-user satisfaction• WE have the greatest influence on the life
cycle costs of what you designAs procurement professionals:• YOU have control over how WE do this

CFPP 2007 - 02 Oct 07
Collectively WE can make:Collectively WE can make:
Related Documents