CFI GROUP WORLDWIDE ANN ARBOR ATLANTA BEIJING LONDON MADRID MILAN PARIS SHANGHAI STOCKHOLM REPRESENTATIVE OFFICES BUENOS AIRES KUALA LUMPUR PORTO ALEGRE NASA Earth Observing System Data and Information Systems Customer Satisfaction Results November 6, 2007

CFI GROUP WORLDWIDE ANN ARBOR ATLANTA BEIJING LONDON MADRID MILAN PARIS SHANGHAI STOCKHOLM REPRESENTATIVE OFFICES BUENOS AIRES KUALA LUMPUR PORTO ALEGRE.
Dec 26, 2015
Welcome message from author
This document is posted to help you gain knowledge. Please leave a comment to let me know what you think about it! Share it to your friends and learn new things together.
Transcript

CFI GROUP WORLDWIDE
ANN ARBOR
ATLANTA
BEIJING
LONDON
MADRID
MILAN
PARIS
SHANGHAI
STOCKHOLM
REPRESENTATIVEOFFICES
BUENOS AIRES
KUALA LUMPUR
PORTO ALEGRE
NASA
Earth Observing System Data and Information SystemsCustomer Satisfaction Results
November 6, 2007

2© CFI Group 2007
Today’s Discussion
• Background
• Overview Key Results
• Detailed Analysis
• Summary
3© CFI Group 2007
Background

4© CFI Group 2007
Project BackgroundObjectives
• Measure customer satisfaction with the NASA Earth Observing System Data and Information System at a national level and for each Data Center
– Alaska Satellite Facility (ASF DAAC)– Goddard Space Flight Center Earth Sciences Data and Information Services Center (GSFC
DISC DAAC)– Global Hydrology Resource Center (GHRC)– *MODIS Data Processing System (MODAPS/LAADS)– NASA Langley Atmospheric Science Data Center (ASDC DAAC – LaRC)– Land Processes Distributed Active Archive Center (LP DAAC)– National Snow and Ice Data Center (NSIDC DAAC)– Oak Ridge National Laboratory Distributed Active Archive Center (ORNL DAAC/FLUXNET)– Physical Oceanography Distributed Active Archive Center (PO DAAC - JPL)– Socioeconomic Data and Applications Center (SEDAC)
• Assess the trends in satisfaction with NASA EOSDIS specifically in the following key areas:
– Product Search– Product Selection and Order– Delivery– Product Quality – Product Documentation– Customer Support
• Identify the key areas that NASA can leverage across the Data Centers to continuously improve its service to its users
*Measured for first time in 2007

5© CFI Group 2007
Project BackgroundMeasurement timetable
Finalized questionnaire August 16, 2007
Data collection via web September 9, 2007 – October 10, 2007
Topline results October 15, 2007
Results briefing November 6, 2007

6© CFI Group 2007
Project BackgroundData collection
Respondents• A total of 2,290 responses were received:
Data CenterInvitations
SentEmails
BouncedResponses Received
US DomainOutside US
DomainResponse
Rate*
Alaska Satellite Facility (ASF DAAC) 981 9 97 40 57 10%
Goddard Space Flight Center Earth Sciences Data and Information Services Center (GSFC DISC DAAC)
3,098 88 324 117 207 11%
Global Hydrology Resource Center Marshall Space Flight Center (GHRC)
561 12 56 26 30 10%
MODIS Data Processing SystemGoddard Space Flight Center (MODAPS/LAADS)
2,942 74 380 116 264 13%
NASA Langley Atmospheric Science Data Center (ASDC DAAC -LaRC)
2,037 18 197 85 112 10%
Land Processes Distributed Active Archive Center EDC, USGS (LP DAAC)
5,462 51 748 214 534 14%
National Snow and Ice Data Center (NSIDC DAAC) 2,346 34 220 87 133 10%
Oak Ridge National Laboratory Distributed Active Archive Center (ORNL DAAC/FLUXNET)
1,785 5 101 48 53 6%
Physical Oceanography Distributed Active Archive Center (PO.DAAC - JPL)
2,962 205 99 32 67 4%
Socioeconomic Data and Applications CenterCIESIN, Columbia University (SEDAC)
1,890 17 68 26 42 4%
Total 24,064 513 2,290 791 1,499 10%
*Response rate based on original invitations sent minus bounced emails

7© CFI Group 2007
Project BackgroundRespondent information
Q8. For which disciplines do you need or use Earth science data? (n=2,291)*
2005 2006 2007
Percent Percent PercentAreas of research*
Agriculture 26% 25% 27%
Atmosphere 37% 36% 37%Carbon Cycle 16% 15% 15%Climate -- -- 31%
Climate Change -- -- 34%
Cryosphere 10% 10% 9%Ecosystems 33% 32% 31%Land Cover -- -- 45%
Land Use -- -- 37%
Natural Hazards 22% 21% 19%Oceans 27% 23% 20%Resources 21% 21% 17%Socioeconomics 6% 5% 5%
Solid Earth 9% 8% 6%Space Weather 3% 3% 3%Sun-Earth Connections 4% 4% 3%Water & Energy 25% 23% 23%
Weather 22% 21% 20%
Other 9% 8% 7%Total Respondents 1263 2857 2291
* Multiple responses allowed
Demographics remain fairly consistent with 2006

8© CFI Group 2007
Project BackgroundRespondent information
Demographics remain fairly consistent with 2006
2005 2006 2007
Percent Percent Percent
Became aware of retrieving Earth Science data from NASA through*
Colleague 43% 45% 45%
Conference 16% 15% 12%Data Center's web sites 35% 21% 15%Educational Institution 21% 24% 20%
Internet Search 38% 41% 34%
Journal -- 10% 8%NASA home page/site 28% 32% 25%Workshop -- 8% 8%Other 8% 6% 5%
Total Respondents 1263 2857 2291Reason for requesting NASA EOS data products*Earth science research -- -- 67%Applications using Earth science data -- -- 44%
Research in another science or discipline -- -- 15%
General interest -- -- 4%Higher education -- -- 19%K-12 education -- -- 2%
Total Respondents 2291
AffiliationBusiness/Commercial 11% 11% 10%Non-Profit Organization - Environmental 10% 13% 14%
Non-Profit Organization - Social 1% 1% 2%
Education - K-12 2% 1% 1%Education - Higher Education 50% 51% 51%State or Local Government 4% 4% 3%US Federal Government - Agency 13% 6% 7%
US Federal Government - Foundation 0% 0% 0%US Federal Government - Military 1% 1% 0%US Federal Government - Legislative 0% 0% 0%Native American Tribal Government 0% 0% 0%
Non-US Government -- 11% 12%
Total Respondents 1246 2857 2291Currently locatedUSA 36% 33% 35%
Outside the USA 64% 67% 65%
Total Respondents 1247 2857 2291* Multiple responses allowed

9© CFI Group 2007
Overview Key Results
10© CFI Group 2007
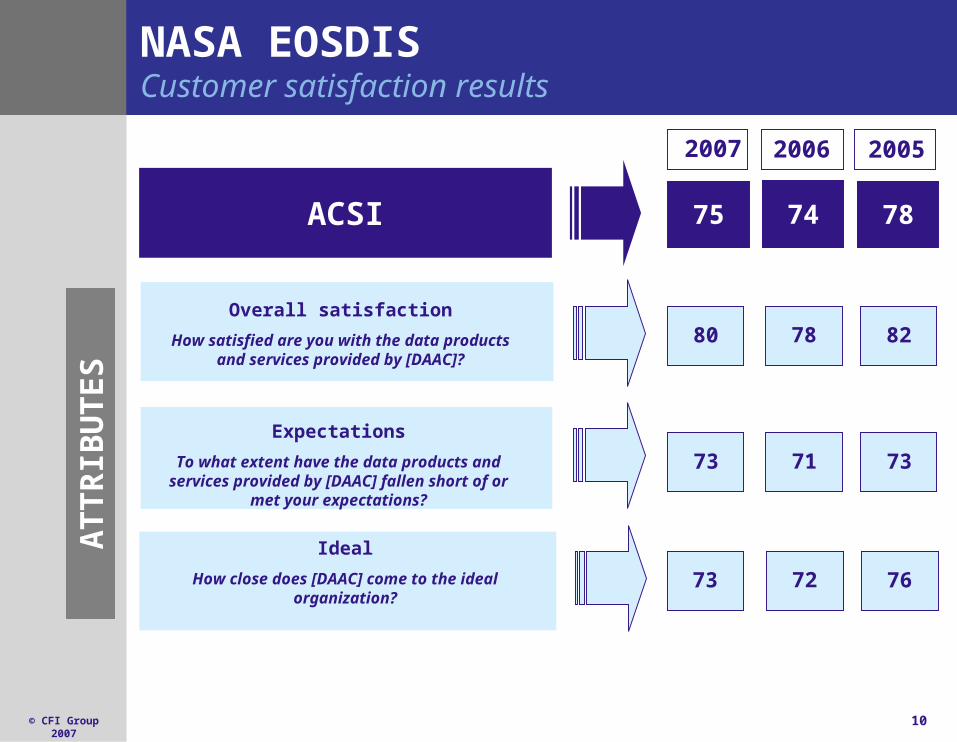
NASA EOSDISCustomer satisfaction results
2006
Ideal
How close does [DAAC] come to the ideal organization?
Overall satisfaction
How satisfied are you with the data products and services provided by [DAAC]?
AT
TR
IBU
TE
S
Expectations
To what extent have the data products and services provided by [DAAC] fallen short of or
met your expectations?
ACSI
72
78
71
74
76
82
73
78
2005 2007
75
80
73
73

11© CFI Group 2007
NASA EOSDIS BenchmarksStrong performance continues …
75
75
68
71
75
30 40 50 60 70 80
E-Business News &Information (Public/Private
Sectors)
NASA EOSDIS - Aggregate
Local Government (Overall)
Federal Government(Overall)
ACSI (Overall)

12© CFI Group 2007
Customer Satisfaction
Index
Future Use
Recommend
NASA EOSDIS ModelProduct Search/Selection/Documentation and Customer Support most critical
Sample Size: 2,291
75
87
85
The performance of each component on a 0 to 100 scale. Component scores are made up of the weighted average of the corresponding survey questions.
Scores
Customer Support
83
1.5
Product Search
72
0.7
Product Quality72
0.3
Product Documentation
74
1.0
Product Selection and
Order
74
0.7
3.3
3.9
The change in target variable that results from a five point change in a component score. For example, a 5-point gain in Product Search would yield a 0.7-point improvement in Satisfaction.
Impacts
Delivery79
0.2

13© CFI Group 2007
75
72
72
87
85
74
82
79
72
72
70
71
88
86
78
84
85
76
74
71
91
89
83
79
74
74
N/A
Customer Satisfaction Index
Customer Support
Delivery
Product Selection and Order
Product Documentation
Product Search
Product Quality
Likelihood to Use Services in Future
Likelihood to Recommend
2007 2006 2005
(+/-) 0.6
(+/-) 1.0
(+/-) 0.7
(+/-) 0.7
(+/-) 0.7
(+/-) 0.7
(+/-) 0.8
(+/-) 0.6
(+/-) 0.6
NASA EOSDIS 2005 - 2007 Significant improvements from 2006
=Significant Difference vs. 2006

14© CFI Group 2007
Areas of Opportunity for NASA EOSDIS Remain consistent year over year
Top Improvement Priority
Product Search (72)Product Selection and Order (74)
Product Documentation (74)
15© CFI Group 2007
Detailed Analysis

16© CFI Group 2007
Score ComparisonHigher satisfaction persists outside of the USA
Respondents outside the USA continue to have a higher overall Satisfaction score with EOSDIS (74 outside vs. 72 USA in 2006), though
gap has lessened.
Respondents outside the USA continue to have a higher overall Satisfaction score with EOSDIS (74 outside vs. 72 USA in 2006), though
gap has lessened.
65% of respondents are outside of the USA in 2007 vs. 64% in 2006.
USAOutside the
USASignificant Difference
Product Search 70 73 _Product Selection and Order 72 75 _Delivery 81 78 _Product Quality 71 73 _Product Documentation 73 74 _Customer Support 85 82 _
Customer Satisfaction Index 74 76 _
Likelihood to Recommend 85 86 _Likelihood to Use Services in Future 88 87 _Complaints 30% 27% _
Sample Size 791 1499

17© CFI Group 2007
CSI by Data CentersAll Data Centers trend positively or stay same
76
75
75
75
79
68
73
69
79
75
72
75
72
78
66
76
72
82
78
77
78
81
80
73
75
75
76
80
N/AN/A
ASDC DAAC - LaRC
ASF DAAC/SAR
GHRC
GSFC DISC
LP DAAC
MODAPS/LAADS
NSIDC DAAC
ORNL DAAC/FLUXNET
PO DAAC - JPL
SEDAC
2007 2006 2005
(+/-) 3.1
(+/-) 2.2
(+/-) 4.2
(+/-) 2.5
(+/-) 2.4
(+/-) 1.0
(+/-) 1.9
(+/-) 3.9
(+/-) 1.5
(+/-) 1.5

18© CFI Group 2007
Product SearchKey driver of satisfaction
52% used EOS Data Gateway to search for data and products (65% in 2006)
72
70
73
69
68
74
75
74
72
75
71
71
Product Search
How well the search
results met yourneeds
Ease of finding data
Ease of using search
capability
2007 2006 2005
(+/-) 0.7
(+/-) 0.7
(+/-) 0.8
(+/-) 0.8
=Significant Difference vs. 2006 Impact=0.7

19© CFI Group 2007
Product Search Score ComparisonBy method for most recent search
Q13. How did you search for the data products or services you were seeking? (n=2,291)
3% indicated other; 2% said direct interaction (did not rate product search questions)
* Wording Change: Data center search capability
76
76
73
77
75
77
81
79
78
71
73
74
75
N/A
78*
N/A
79*
N/A
Data center's onlineholdings
EOS Data Gateway(EDG)/WIST
Data center's searchtool or web site
Direct interaction
Global Change MasterDirectory
Other
2007 2006 2005

20© CFI Group 2007
Product Search Scores by Data Center
72
72
75
71
69
71
63
70
70
62
74
73
68
70
67
73
61
74
72
65
78
75
72
76
73
77
69
74
80
71
75
N/AN/A
NASA EOSDIS
ASDC DAAC - LaRC
ASF DAAC/SAR
GHRC
GSFC DISC
LP DAAC
MODAPS/LAADS
NSIDC DAAC
ORNL DAAC/FLUXNET
PO DAAC - JPL
SEDAC
2007 2006 2005
(+/-) 1.8
(+/-) 0.7
(+/-) 4.4
(+/-) 2.3
(+/-) 1.2
(+/-) 3.3
(+/-) 3.6
(+/-) 4.8
(+/-) 2.3
(+/-) 3.4
(+/-) 1.7

21© CFI Group 2007
Product Selection and Order Also a top opportunity for continuous improvement
94% said that they are finding what they want in terms of type, format, time series, etc.
Q16. Please think about your most recent request/order/download from the Data Center. Did you use a subsetting tool? (n=2,291) 24% said No, 44% said Yes, by geographic area, 7% said Yes, by geophysical parameter, and 24% said Yes, by both geographic area and geophysical parameter.
Impact=0.7
74
72
74
71
71
76
78
76
74
76
73
72
Product Selection and
Order
Ease of
requesting/orderingdata products
Ease of selecting dataproducts
Description of data
products
2007 2006 2005
(+/-) 0.7
(+/-) 0.8
(+/-) 0.8
(+/-) 0.7
=Significant Difference vs. 2006

22© CFI Group 2007
Product Selection and Order Scores by Data Center
74
73
74
74
72
74
69
72
71
66
81
74
71
73
71
75
63
76
74
66
81
77
75
77
78
79
73
73
74
81
75
N/AN/A
NASA EOSDIS
ASDC DAAC - LaRC
ASF DAAC/SAR
GHRC
GSFC DISC
LP DAAC
MODAPS/LAADS
NSIDC DAAC
ORNL DAAC/FLUXNET
PO DAAC - JPL
SEDAC
2007 2006 2005
(+/-) 0.7
(+/-) 3.3
(+/-) 2.3
(+/-) 1.7
(+/-) 1.1
(+/-) 1.8
(+/-) 4.8
(+/-) 3.3
(+/-) 2.5
(+/-) 4.5
(+/-) 3.3
=Significant Difference vs. 2006

23© CFI Group 2007
74
72
73
74
74
72*
ProductDocumentation
Extent to which thedata documentationhelped you use the
data
Overall quality of thedocument (i.e.,technical level,
organization, clarity)
2007 2006
(+/-) 0.7
(+/-) 0.7
(+/-) 0.7
Product DocumentationData product description and product format most sought after
What documentation did you use or were you looking for?*
Data product description 66%
Product format 57%
Science algorithm 46%
Instrument specifications 38%
Tools 31%
Science Applications 30%
Production code 11%
Impact=1.0
*Multi-select
Q38. Was the documentation (n=2,291) ... Delivered with the data (15% vs. 18% in ‘06), Available online (69% vs. 70% in ‘06), Not found (12% vs. 16% in ‘06).
CSI for those whose
documentation was not found is 66 vs. those
who got it delivered with the data (76) or
online (77).
* Wording Change: Readability of the document (i.e., technical level, organization, clarity)

24© CFI Group 2007
Product DocumentationScores by data center
Impact=1.0
74
72
73
75
74
76
71
72
73
70
79
72
71
72
75
77
68
73
79
74
77
N/A
NASA EOSDIS
ASDC DAAC - LaRC
ASF DAAC/SAR
GHRC
GSFC DISC
LP DAAC
MODAPS/LAADS
NSIDC DAAC
ORNL DAAC/FLUXNET
PO DAAC - JPL
SEDAC
2007 2006
(+/-) 1.8
(+/-) 0.7
(+/-) 4.7
(+/-) 2.4
(+/-) 1.2
(+/-) 3.4
(+/-) 3.3
(+/-) 4.2
(+/-) 2.4
(+/-) 3.7
(+/-) 1.7

25© CFI Group 2007
Customer SupportMaintain strong performance
Q41. Did you request assistance from the Data Center’s user services staff during your most recent search or order? (n=2,291) No=60%, Yes, by phone=3%, Yes, by e-mail=33%, Yes, by phone and e-mail=4%
91% (86% in 2006) were able to get
help on first request. These respondents
continue to have a significantly
higher CSI (79) than those who
did not (61).
83
82
82
82
84
83
82
81
80
81
84
86
85
84
84
83
84
85
83
83
83
Customer Support
Professionalism
Technical knowledge
Accuracy of information provided
Helpfulness in selecting/finding data orproducts
Helpfulness in correcting a problem
Timeliness of response
2007 2006 2005
(+/-) 1.0
(+/-) 1.0
(+/-) 1.1
(+/-) 1.0
(+/-) 1.1
(+/-) 1.2
(+/-) 1.1
Impact=1.5=Significant Difference vs. 2006

26© CFI Group 2007
Product QualityPreferences in line with actual for the most part
In 2006, 67% said products were provided in HDF-EOS and HDF and 42% said they were their preferred method.
Format data or products was
provided*
Format preferred
HDF-EOS/HDF 73% 41%NetCDF 8% 7%
Binary 11% 7%
ASCII 11% 8%
TIFF or GeoTIFF 20% 21%JPEG, GIF, PNG 9% 4%
OGC Web services 0% 0%
GIS 6% 1%
Don't know 4% 8%
Other 2% 3%
*Multiple responses allowed
*
27© CFI Group 2007
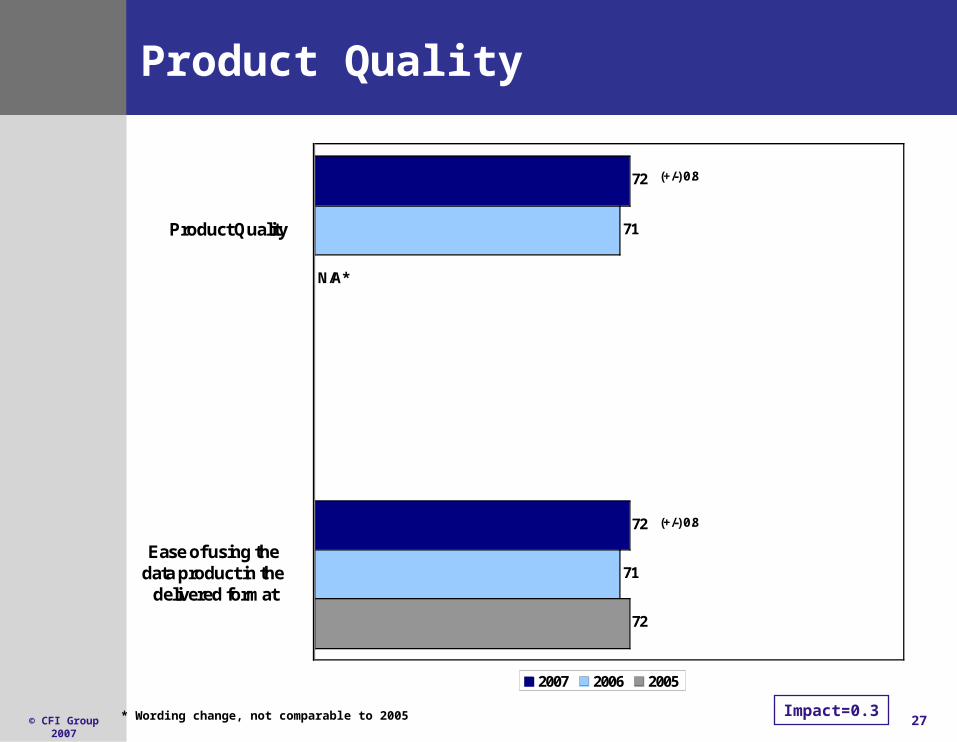
Product Quality
Impact=0.3
72
71
71
72
72
N/A*
Product Quality
Ease of using thedata product in the
delivered format
2007 2006 2005
(+/-) 0.8
(+/-) 0.8
* Wording change, not comparable to 2005
28© CFI Group 2007
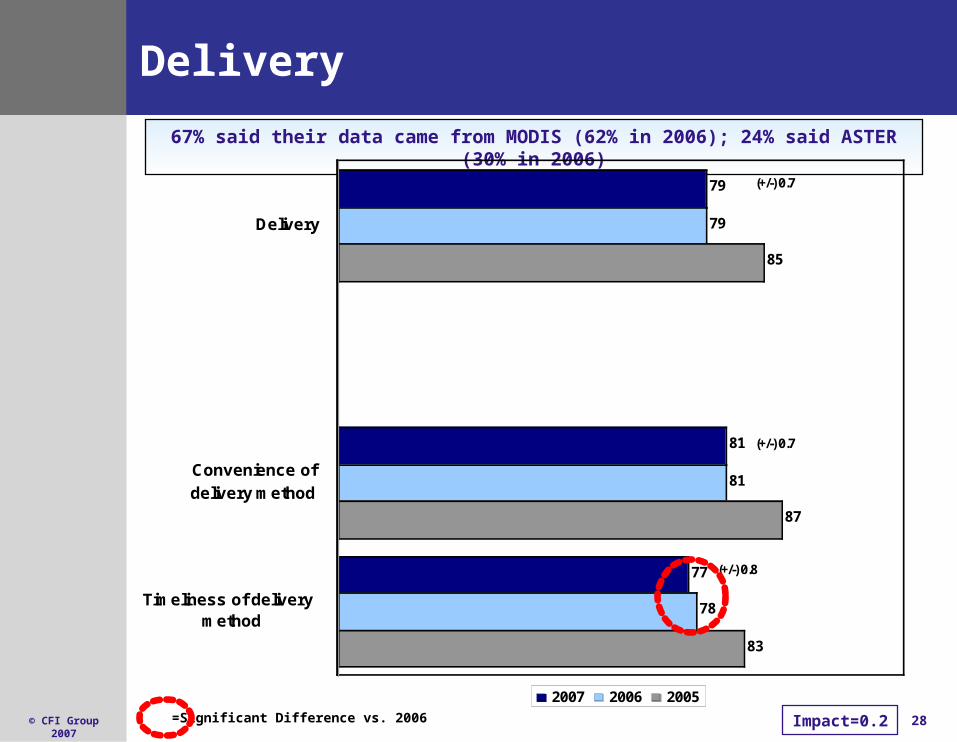
Delivery
67% said their data came from MODIS (62% in 2006); 24% said ASTER (30% in 2006)
Impact=0.2
79
79
81
78
85
87
83
77
81
Delivery
Convenience of
delivery method
Timeliness of deliverymethod
2007 2006 2005
(+/-) 0.7
(+/-) 0.7
(+/-) 0.8
=Significant Difference vs. 2006
29© CFI Group 2007
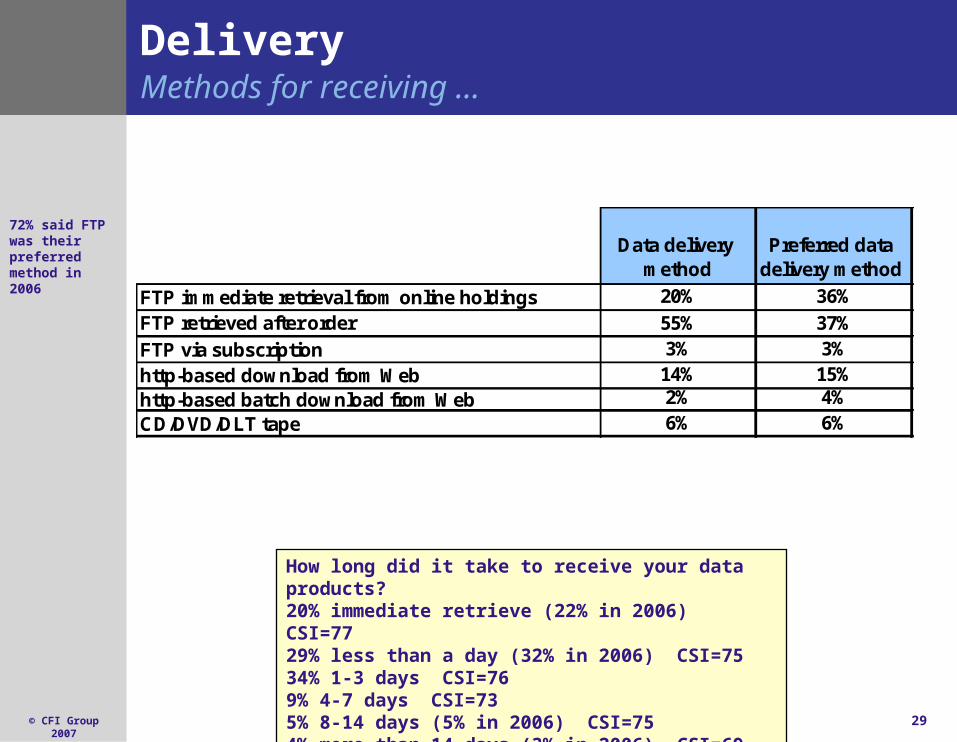
DeliveryMethods for receiving …
How long did it take to receive your data products?20% immediate retrieve (22% in 2006) CSI=7729% less than a day (32% in 2006) CSI=7534% 1-3 days CSI=769% 4-7 days CSI=73 5% 8-14 days (5% in 2006) CSI=754% more than 14 days (3% in 2006) CSI=69
72% said FTP was their preferred method in 2006
Data delivery method
Preferred data delivery method
FTP immediate retrieval from online holdings 20% 36%
FTP retrieved after order 55% 37%
FTP via subscription 3% 3%
http-based download from Web 14% 15%http-based batch download from Web 2% 4%
CD/DVD/DLT tape 6% 6%

30© CFI Group 2007
Summary

31© CFI Group 2007
Summary
NASA EOSDIS has made significant improvements versus last year in multiple areas (Product Selection/Order, Search and Quality)
All Data Centers trend positively or stay same
Product Search, Selection and Order continue to be the top opportunities for improvement
• Documentation also high impact this year
Customer Support continues to be high impact for those who require it. Imperative to maintain the strong level of service.
• Ensure those who are providing it realize how it affects satisfaction

32© CFI Group 2007
Appendix

33© CFI Group 2007
ACSI National, Sector and Industry Scores:Q2 2006 – Q1 2007
71 Hotels81 Full Service
Restaurants 77 Limited-
ServiceRestaurants
66 Newspapers70 Motion Pictures67 Network/Cable
TV News73 Computer
Software70 Fixed Line
Telephone Service
68 Wireless TelephoneService
70 CellularTelephones
62 Cable & Satellite TV
73 EnergyUtilities
75 Supermarkets71 Gasoline
Stations74 Department &
Discount Stores
75 Specialty Retail Stores
78 Health & Personal Care Stores
77 Banks79 Life Insurance72 Health
Insurance78 Property & Casualty Insurance
63 Airlines73 U.S.
Postal Service
81 ExpressDelivery
65.9 Local Government
71.3 Federal Government
Accommodation &Food Services
75.7
Information68.3
Utilities72.9
Finance &Insurance
76.0
Transportation &Warehousing
71.1
PublicAdministration/
Government67.1
83 Retail78 Auctions78 Brokerage76 Travel
E-Commerce80.0
77 Hospitals
Health Care & Social Assistance
76.8
Source: www.theacsi.org
Manufacturing/Durable Goods
80.1
E-Business76.5
77 Personal Computers
80 Electronics(TV/VCR/DVD)
81 Major Appliances
81 Automobiles& Light
Vehicles
73 News &Information
76 Portals79 Search Engines
Manufacturing/Nondurable Goods
82.0
83 Food Manufacturing
83 Pet Food84 Soft Drinks82 Breweries78 Cigarettes80 Apparel76 Athletic Shoes84 Personal Care
& CleaningProducts
Retail Trade74.4
75.2

34© CFI Group 2007
x1
x2
x3
x4
x5
x6
x1
x 3
x4
x5
x 6
y1
y2
y3y
3
y2
y 11
2
xi xi t i , for i=1,2,3 t=1,2y j yj j 1 , for j = 1,2,3
1 1 1 2 2 1
x2
The Math Behind the Numbers
A discussion for a later date…or following this presentation for those who are interested.

35© CFI Group 2007
A Note About Score Calculation
• Attributes (questions on the survey) are typically answered on a 1-10 scale – Social science research shows 7-10 response categories are optimal
– Customers are familiar with a 10 point scale
• Before being reported, scores are transformed from a 1-10 to a 0-100 scale– The transformation is strictly algebraic; e.g.
– The 0-100 scale simplifies reporting:
• Often no need to report many, if any, decimal places
• 0-100 scale is useful as a management tool
Orig. (1-10) Trans. (0-100)1 02 11.13 22.2
8 77.89 88.9
10 100

36© CFI Group 2007
Deriving Impacts
• Remember high school algebra? The general formula for a line is:
y = mx + b
• The basic idea is that x is a “cause” and y is an “effect”, and m represents the slope of the line – summarizing the relationship between x & y
Y
X
Y
X
• CFI Group uses a sophisticated variation of the advanced statistical tool, Partial Least Squares (PLS) Regression, to determine impacts when many different causes (i.e., quality components) simultaneously effect an outcome (e.g., Customer Satisfaction)
Related Documents