บทความวิจัย วารสารวิชาการเทคโนโลยีอุตสาหกรรม ปี ที 12 ฉบับที 2 พฤษภาคม – สิงหาคม 2559 The Journal of Industrial Technology, Vol. 12, No. 2 May – August 2016 87 CFD Simulation of Raschig Ring Packing Patterns in a Pilot Scale: Prediction of Mean Residence time Nattaporn Chutichairattanaphum 1 , Phavanee Narataruksa 1* , Karn Pana-Suppamassadu 1 , Sabaithip Tungkamani 2 , Chaiwat Prapainainar 1 and Thana Sornchamni 3 Abstract Mean Residence Time (MRT) was determined numerically for the pilot packed bed reactor filled with the ceramic raschig rings. Three well-defined patterns and one randomly packed bed were studied, where a tube-to- particle ratio (N) was around 7. A case study of Dry Methane Reforming (DMR) was investigated at 600 °C, 1 atm. Reactant feeding rates were varied in the range of 0.985 to 2.957 L/min.The MRTs of four difference packing pattern, namely, vertical-staggered (pattern 1), chessboard-staggered (pattern 2), reciprocal-staggered (pattern 3), and randomly packed bed were conducted using finite-element based Computational Fluid Dynamics (CFD). The results were shown in terms of E(t) function where a higher value of the E(t) function means greater deviation from the ideal plug flow. Results showed that chessboard-staggered pattern had the lowest E(t) values compared with all patterns and all feeding rates. To deeply representative results for the system configurations, the discussion on non- ideal behaviors of each structured packing can be made systematically in this work. Keywords : Mean Residence Time, Residence Time Distribution, Packed Bed Reactor, Dry Methane Reforming and Computational Fluid Dynamics 1 Department of Chemical Engineering, Faculty of Engineering, King Mongkut’s University of Technology North Bangkok 2 Department of Industrial Chemistry, Faculty of Applied Science, King Mongkut’s University of Technology North Bangkok 3 Analytical & Petrochemical Research Department, PTT Research and Technology Institute, PTT Public Company Limited, Wangnoi, Ayutthaya * Corresponding author, E-mail: [email protected] Received 24 November 2015, Accepted 14 July 2016

Welcome message from author
This document is posted to help you gain knowledge. Please leave a comment to let me know what you think about it! Share it to your friends and learn new things together.
Transcript

บทความวิจยั วารสารวิชาการเทคโนโลยีอุตสาหกรรม ปีที� 12 ฉบบัที� 2 พฤษภาคม – สิงหาคม 2559
The Journal of Industrial Technology, Vol. 12, No. 2 May – August 2016
87
CFD Simulation of Raschig Ring Packing Patterns in a Pilot Scale:
Prediction of Mean Residence time
Nattaporn Chutichairattanaphum1, Phavanee Narataruksa1*,
Karn Pana-Suppamassadu1, Sabaithip Tungkamani2, Chaiwat Prapainainar1
and Thana Sornchamni3
Abstract
Mean Residence Time (MRT) was determined numerically for the pilot packed bed reactor filled with
the ceramic raschig rings. Three well-defined patterns and one randomly packed bed were studied, where a tube-to-
particle ratio (N) was around 7. A case study of Dry Methane Reforming (DMR) was investigated at 600 °C, 1 atm.
Reactant feeding rates were varied in the range of 0.985 to 2.957 L/min. The MRTs of four difference packing
pattern, namely, vertical-staggered (pattern 1), chessboard-staggered (pattern 2), reciprocal-staggered (pattern 3),
and randomly packed bed were conducted using finite-element based Computational Fluid Dynamics (CFD). The
results were shown in terms of E(t) function where a higher value of the E(t) function means greater deviation from
the ideal plug flow. Results showed that chessboard-staggered pattern had the lowest E(t) values compared with all
patterns and all feeding rates. To deeply representative results for the system configurations, the discussion on non-
ideal behaviors of each structured packing can be made systematically in this work.
Keywords : Mean Residence Time, Residence Time Distribution, Packed Bed Reactor, Dry Methane Reforming
and Computational Fluid Dynamics
1 Department of Chemical Engineering, Faculty of Engineering, King Mongkut’s University of Technology North Bangkok 2 Department of Industrial Chemistry, Faculty of Applied Science, King Mongkut’s University of Technology North Bangkok 3 Analytical & Petrochemical Research Department, PTT Research and Technology Institute, PTT Public Company Limited, Wangnoi, Ayutthaya * Corresponding author, E-mail: [email protected] Received 24 November 2015, Accepted 14 July 2016

บทความวิจยั วารสารวิชาการเทคโนโลยีอุตสาหกรรม ปีที� 12 ฉบบัที� 2 พฤษภาคม – สิงหาคม 2559
The Journal of Industrial Technology, Vol. 12, No. 2 May – August 2016
88
1. Introduction
Residence Time Distribution (RTD) has been
fundamentally exploited to characterize the flow
behaviors of reactors in the areas of petrochemical and
chemical processes. The RTD can be estimated directly
to precise the required MRT in order to obtain a
desired reaction yield. It is useful not only for sizing
reactors, but also for troubleshooting existing reactors.
Gas phase through a microstructured falling film
reactor, the RTD was studied to develop an appropriate
flow model for mass - transfer characteristics in the gas
phase of the system [1]. A theoretical approach to RTD
analysis was also used for Tubular Fixed - Bed Reactor
(FBR), multi slit Integrated Micro Packed Bed Reactor
- Heat Exchanger (IMPBRHE) [2], rectangular channel
herringbone structures [3], and gas–liquid micro-fixed
beds [4]. The approximation of RTD method can be
applied to the more complex geometry. Packed bed
reactors are generally filled with a small object such as
pellets or a complex structure such as raschig ring,
porous ring, or balls depending on specifically
designed structured packing. Sebastian Zuercher [5]
has studied the ceramic foams bed structure in catalytic
gas cleaning process using the dispersion model to
quantified back mixing. A good design should have a
good momentum distribution with an acceptable
pressure drop to save pumping costs. In addition,
controlling the desired pressure drop and uniform
velocity distribution over the bed increases the
diffusion efficiency of the reactants.
Besides the RTDs parameter, mean residence time
(MRT) is a significant consideration indicating
whether a certain process or reaction can be carried out
to the desired degree of completion [6]. The MRT is
the average time particle spends in the investigated
system before it reaches a designed point along its flow
path [7]. For mini-channel reactor, the two-phase flows
were investigated in terms of MRT and RTD. The
results showed that liquid phase had much longer of
RTD and MRT than gas phase. Estimation of the
unidirectional dispersion indicated it was the combined
effect of evaporation and condensation inside the mini-
channel which affected the MRT and RTD. Unlike the
fixed bed, the dispersion resulted from the double-
direction diffusions [8]. From the above mentioned, the
RTD were obtained by using the tracer experiment
studies which are injecting an inert tracer at the inlet
and measuring its concentration at the outlet of the
reactor.
Computational approaches have come to be seen as
effective tools to investigate non-ideal behaviors of
flow systems in term of RTD analysis [6]. However,
computational estimation of MRT for a non-ideal
heterogeneous catalytic reactor has not yet been
proposed. Especially in a gas-solid system containing
distinct hydrodynamic patterns due to various catalytic

บทความวิจยั วารสารวิชาการเทคโนโลยีอุตสาหกรรม ปีที� 12 ฉบบัที� 2 พฤษภาคม – สิงหาคม 2559
The Journal of Industrial Technology, Vol. 12, No. 2 May – August 2016
89
packing structures. Therefore, this work differs from
the previous one in that it highlights coupling the RTD
with the raschig ring packing patterns in pilot packed
bed reactors. The main goal of this study is to measure
both the effects of packing patterns and the RTD
deviations from the ideal plug flow regime. By
application of the CFD technique, the behavior of
complex systems influenced by a large number of
flow, fluid and geometric parameters can be predicted.
The methodology was used for testing on a catalytic
packing system of dry methane reforming. Modeling
and simulation were carried out by finite-element
based analysis using the software COMSOL
MULTIPHYSICSTM 3.5. Flow patterns (in 3-D) of
reactant gases in a packed bed were expected as the
solutions in which fluid velocity and pressure profiles
can be displayed. According to availability of velocity
gradients, a post processing equation to estimate MRT
was proposed. The MRT for each corresponding
structured packing and various gas flows was
calculated and compared with that obtained from ideal
plug flow correlation.
2. Methodology and Simulation Model
In this work CFD was used as a computational
technique in verifying MRT of a reactor filled with
solid catalyst pellets in three structured packing and
one randomly packed bed. The COMSOL
MULTIPHYSICSTM 3.5 program was selected as an
effective tool to simultaneously solve the governing
equations relying on the conservation principles of
mass and momentum. Simulation results gave insight
into the physics behind certain packing patterns. The
ceramic raschig ring catalyst was a single channel with
an inside diameter of 0.55 cm, an outside diameter of
1.2 cm, and the pellet was 1.29 cm long. The raschig
ring was packed in the reactor size 10.16 cm in
diameter and 5.16 cm long. Two stainless plates were
installed on both sides to create a set of realization of
close-packed packing. In order to explore the impact of
structured packing of the rasching ring catalyst in the
reactor, three practical structured packing and one
randomly structured packing were selected as shown in
Fig. 1.
2.1 Governing Equations and Mathematical Models
Hydrodynamics of gaseous flow was explained by
simultaneously solving the Navier-Stokes equations,
i.e., nonlinear momentum and continuity equations:
u Tρ .η u u ρu. u p
tF
(1)
.u 0 (2)

บทความวิจยั วารสารวิชาการเทคโนโลยีอุตสาหกรรม ปีที� 12 ฉบบัที� 2 พฤษภาคม – สิงหาคม 2559
The Journal of Industrial Technology, Vol. 12, No. 2 May – August 2016
90
Fig. 1. Computational domain of catalytic structured packing of the raschig ring within the packed bed reactor.
a) Vertical Staggered, b) Chessboard Staggered, c) Reciprocal Staggered, d) Random Packing
Where, η is the viscosity of fluids [kg/(m s)]
u is the velocity vector (m/s)
ρ is the density of the fluid (kg/m3)
p is the pressure (atm)
F is a body force term
n is a normal vector
The boundary condition is shown in Table 1.
Table 1 Boundary conditions
Boundary condition Equation
Inlet
Outflow boundary
No slip (reactor wall and stainless
plates)
Slip symmetry condition (catalyst
surfaces)
u.n = u0
p = p0
u = 0
u.n = 0
2.2. Mean Residence Time (MRT)
To visualize the computational approach proposed
for the determination of MRT of a packed bed reactor,
Dry Methane Reforming (DMR) at 1 bar and 600°C
was chosen as a modeled case study. Here reactant
gases consisting of methane (CH4) and carbon dioxide
(CO2) were converted to synthesis gas products, i.e.
carbon monoxide (CO) and hydrogen (H2) (Eq. 3). To
avoid coke formation as a possible side reaction, very
precise residence time of a few seconds was needed to
be controlled for a tubular plug flow operation.
Dry Reforming Reaction;
4 2 2
CH + CO 2CO + 2H (3)
In this work, four different arrangements of
pellets; vertical staggered with 32 pellets, chessboard
staggered with 32 pellets, reciprocal staggered with 30
pellets, random 28 pellets were considered. The void
volumes (V) of each structured packing configuration
were 3.39 x 10⁻⁵ m3, 3.39 x 10⁻⁵ m3 3.62 x 10⁻⁵ m3 and
3.21 x 10⁻⁵ m3, respectively. For all packing patterns,

บทความวิจยั วารสารวิชาการเทคโนโลยีอุตสาหกรรม ปีที� 12 ฉบบัที� 2 พฤษภาคม – สิงหาคม 2559
The Journal of Industrial Technology, Vol. 12, No. 2 May – August 2016
91
reactant feed rates ( v ) was also investigated in the
range of 0.985 - 2.957 L/min. The constructed
geometries are depicted in Table 2. As the reactor
volume and feed rate have been specified, therefore,
mean residence times, can be obtained from the
design equation of an ideal plug flow reactor assuming
no volume change due to reaction as illustrated in
Table 2.
=V
v (4)
Where; V is the void volume of the reactor, which
obtaining from bedVreactorVV .
v is the volumetric flow rate of the fluid and
is the MRT of the fluid of an ideal plug-
flow.
A conventional way to estimate the MRT in a
chemical reactor is to analyze the RTD from tracer
experiments. Normally, the quantity E(t) is obtained as
a function of the residence time distribution (RTD). It
is the function that describes in a quantitative manner
how much time different fluid elements have spent in
the reactor. The exit concentration of a tracer species
C(t) can be used to define E(t) as illustrated in Fig. 2
and Eqs. (5) - (7).
0
t)dtC(
C(t)E(t) (5)
Such that:
0
1t)dtE( (6)
The MRT or t of the reactor can be calculated
from integral forms as in Eq. (5).
α
α
0
0
Cdt
tCdtt or
ii
iii
tC
tCtt
Δ
Δ (7)
Fig. 2. a) Plug flow model b) packed bed model and
E(t) diagram.
Instead of having RTD data from tracer
experiments to describe the flow regimes within plug
flow reactors, a more convenient way to investigate
laminar flow behaviors in such systems was proposed
in this work. A computational approach using CFD
technique was exploited to solve for normal velocity
profiles of reactant gases within a packed bed reactor.
A generalized form of Eq. (8) was introduced using
parameters Z as mean residence distance of a system.
The mean residence distance stands for an average
distance that fluid elements will travel along a packed
บทความวิจยั วารสารวิชาการเทคโนโลยีอุตสาหกรรม ปีที� 12 ฉบบัที� 2 พฤษภาคม – สิงหาคม 2559
The Journal of Industrial Technology, Vol. 12, No. 2 May – August 2016
92
volume. The Z term includes an effect of structured
packing via integration of local velocity response ( iu ).
i i ii
i ii
Z u Z
Zu Z
(8)
As a first step, hydrodynamics of all packed bed
patterns was analyzed. For validating the simulation
results, post-processing needed to be done by
integration of the boundary velocity correlations. To
estimate the net flow through the axial direction Z, the
mean residence distance Z represents a parameter that
combined the influences of the flow field in terms of
distribution velocity ( iu ) and distance ( iZ ) of the main
flow. Obtaining the mean residence distance, the net
flow can be done by drawing a graph between the
velocity distributions in the axial plane with the main
flow. This data can be collected through the results of
flow models. However, in order to obtain a graph of
the velocity and distance, the data, i.e. normal velocity
( iu ) and distance of fluid from the inlet ( iZ ) needed to
be collected. The domain was divided into groups of
planes, which were not continuously recorded. To find
an average velocity of each plane, domain areas of the
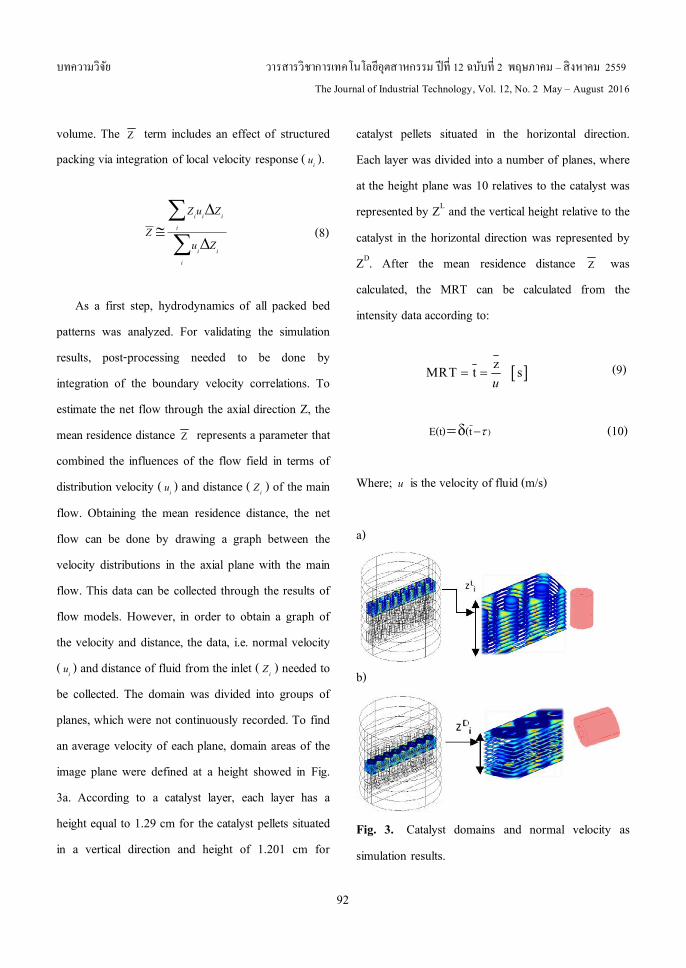
image plane were defined at a height showed in Fig.
3a. According to a catalyst layer, each layer has a
height equal to 1.29 cm for the catalyst pellets situated
in a vertical direction and height of 1.201 cm for
catalyst pellets situated in the horizontal direction.
Each layer was divided into a number of planes, where
at the height plane was 10 relatives to the catalyst was
represented by ZL and the vertical height relative to the
catalyst in the horizontal direction was represented by
ZD. After the mean residence distance Z was
calculated, the MRT can be calculated from the
intensity data according to:
z
MRT t su
(9)
δ )E(t) (t (10)
Where; u is the velocity of fluid (m/s)
a)
b)
Fig. 3. Catalyst domains and normal velocity as
simulation results.
บทความวิจยั วารสารวิชาการเทคโนโลยีอุตสาหกรรม ปีที� 12 ฉบบัที� 2 พฤษภาคม – สิงหาคม 2559
The Journal of Industrial Technology, Vol. 12, No. 2 May – August 2016
93
To obtain the information concerning how far that
a real packed bed reactor behaves differently from an
ideal plug flow one, the E(t) term can be formulated
from the MRT obtained by a finite - element based
method ( t) and an ideal plug flow correlation ( )
[5,9] as shown in Eq. (10). The values of E(t) for each
structured packing and various gaseous flow rates were
calculated and used for discussion on the behaviors of
particular structured packing in the next section.
3. Results and Discussions
3.1 Local Flow Structures
Since the MRT depends on the actual path taken by
the gas phase (reactants inside the reactor) during the
journey within the raschig bed. The degree of deviation
from the axial flow of an individual gas stream causes
the computationally-determined MRT to differ from
that obtained from plug flow basis. The changes of
direction or flow splitting or detouring are forced by
the packing but still under the governing laws of mass
and momentum. In the following subsections, the local
flow fields and the interactions between gaseous and
packing phase will be investigated prior to determining
the values of the corresponding MRT [6, 9-13].
3.1.1 Local Flow Structures of Vertical Staggered
Packing
For the vertical staggered packing, the total number
of 32 pellets was used to create the four-stories
packing, which the centers of each pellet offset with
the centers of the pellets of the following row (story),
as shown in the insert of Table 1. Practically, the
operating volumetric flow rate fell into the laminar
flow regime usually adopted in this type of packed-bed
reactor, namely, 0.986, 0.1577, 0.1971, 0.2366 and
0.2957 L/min. In general, as shown in the figures of
Fig. 4a, the flow velocity was high at the center line of
the hole of raschig ring and the accelerated flow region
occurred due to the confined space between the
external surface of the raschig ring and the inner wall
of the flow channel. The flow direction was mainly in
the axial direction. However, the flow was retarded to
the stagnation point at the bottom surface of the next
row raschig rings. Afterwards, in order to ensure a
mass balance, the fluid stream was divided and
remerged with another half of the flow stream from the
neighbour raschig ring. Nevertheless, the average flow
velocity was the same for each row.
3.1.2 Local Flow Structures of Chessboard-
Staggered Packing
The chessboard-staggered pattern exhibited the
high flow through the hole of vertical raschig rings,
and a very small flow velocity within the horizontal
rings. This pattern of flow distribution persisted onto
the next rows.

บทความวิจยั วารสารวิชาการเทคโนโลยีอุตสาหกรรม ปีที� 12 ฉบบัที� 2 พฤษภาคม – สิงหาคม 2559
The Journal of Industrial Technology, Vol. 12, No. 2 May – August 2016
94
Fig. 4. The velocity distribution of (a) Vertical-
Staggered (b) Chessboard-Staggered (c) Reciprocal-
Staggered.
Fig. 4b showed the sequence of flow distributions.
For this packing pattern, the horizontally-align raschig
rings occupied more spatial volume and caused the
smaller flow area. The higher flow velocity resulted
from the reduction of the flow area due to packing, and
the revealed maximum velocity was higher than in the
vertical-staggered packing. A finite fraction of gaseous
phase must spend a long time within the packing, i.e.,
flowing slowly through the horizontal holes of certain
rings. In addition, its flow direction changed
significantly from the axial flow; however, somehow
the accelerated flow restrained this effect and the
resultant MRT for the chessboard-staggered packing
was close to that of the vertical-staggered packing as
will be shown in section 3.3.
3.1.3 Local Flow Structures of Reciprocal-
Staggered Packing
From the inserts of Fig. 4c, the flow structure
observed within the first row of the reciprocal-
staggered packing was qualitatively the same as that of
the vertical-staggered packing at each flow rate. In the
second row, however, most of the gas volume flow
was in the central holes of the horizontal raschig rings.
The flow velocity was low in those regions except in
the interspaces between neighboring rings. These
reciprocal variations of flow distributions continued to
the next two rows, i.e., the third and the fourth rows
had a similar flow distribution to the first and second
rows, respectively.
Since the high flow velocity observed from the odd
rows of this packing pattern was still lower as
compared to that observed in the vertical-staggered and
chessboard-staggered patterns and the larger fraction of
flow was in the slow flow region, it was suspected that
the reciprocal-staggered packing might give the highest
mean residence time. In addition, the MRT obtained
from the simulation might differ vastly from that
calculated using the plug flow approach.
3.1.4 Local Flow Structures of Randomly Packed
Bed
Randomly-packed catalyst bed is often applied in
an industrial catalytic reactor because of the ease of
loading, however the characteristics of non-uniform

บทความวิจยั วารสารวิชาการเทคโนโลยีอุตสาหกรรม ปีที� 12 ฉบบัที� 2 พฤษภาคม – สิงหาคม 2559
The Journal of Industrial Technology, Vol. 12, No. 2 May – August 2016
95
velocity, temperature, and concentration could easily
be found [14-15]. In order to extend the studies toward
a conventional way of packed beds, some random
packing was also investigated in this work. The total
number of 28 pellets was filled into randomly packed
bed reactor models, as shown in Table 2.
Table 2 Mean residence times obtained from an ideal plug flow correlation.
Packing Pattern Number
of catalyst pellets Void volume (m3)
Flow rate
L/min
τ (sec)
(Eq.4)
Vertical Staggered 32 3.39 x 10⁻⁵
1v 0.986 τ 1 2.07
2v 1.577 τ 2 1.29
3v 1.971 τ 3 1.03
4v 2.365 τ 4 0.86
5v 2.957 τ 5 0.69
Chessboard Staggered 32 3.39 x 10⁻⁵
1v 0.986 τ 1 2.07
2v 1.577 τ 2 1.29
3v 1.971 τ 3 1.03
4v 2.365 τ 4 0.86
5v 2.957 τ 5 0.69
Reciprocal Staggered 30 3.62 x 10⁻⁵
1v 0.986 τ 1 2.21
2v 1.577 τ 2 1.38
3v 1.971 τ 3 1.11
4v 2.365 τ 4 0.92
5v 2.957 τ 5 0.74
Randomly Packed Bed 28 3.21 x 10⁻⁵
1v 0.986 τ 1 3.09
2v 1.577 τ 2 1.93
3v 1.971 τ 3 1.54
4v 2.365 τ 4 1.29
5v 2.957 τ 5 1.03
บทความวิจยั วารสารวิชาการเทคโนโลยีอุตสาหกรรม ปีที� 12 ฉบบัที� 2 พฤษภาคม – สิงหาคม 2559
The Journal of Industrial Technology, Vol. 12, No. 2 May – August 2016
96
To compare with the well-defined patterns, the
studied volumetric flow rate fell into the similar
laminar flow regime, namely 0.986, 1.577, 1.971,
2.365 and 2.957 L/min. From the simulation results of
the random packing, the local flow velocity in each
row of these packed was found not uniform and had its
characters due to the positions of approaching rings. In
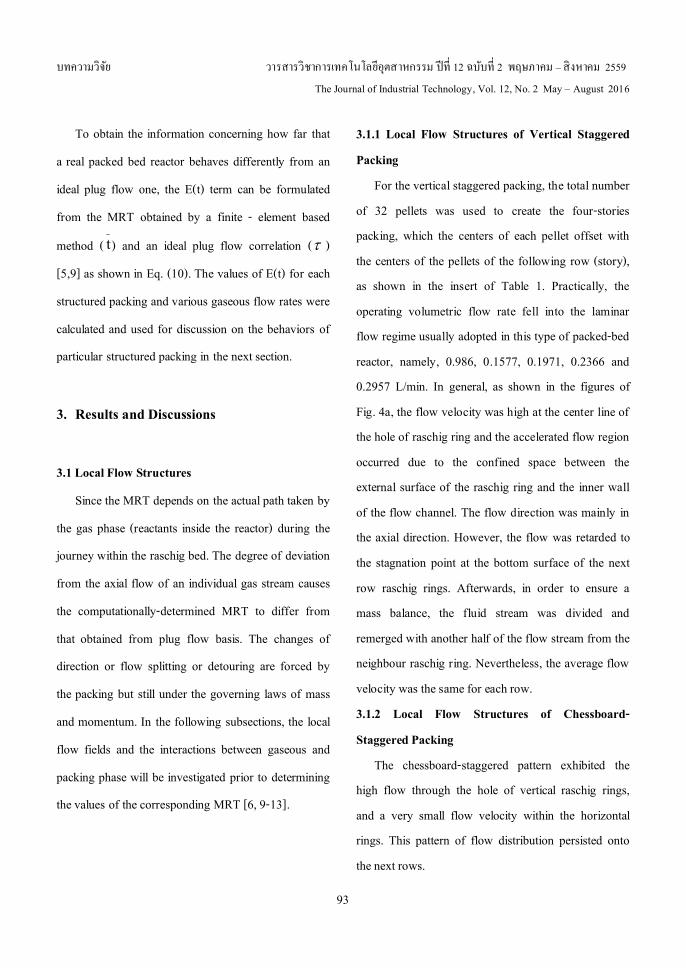
order to explain the results of the randomly packed
beds showed in Fig. 5, local flow velocity distribution
inside and around each ring was impacted by two
factors; which were the ring’s position itself and the
positions of its surrounding rings. At the first row, the
ring’s position itself played an important role in the
local velocity distribution. The two definite positions,
i.e. vertical and horizontal raschig rings can be
systematically explained. In the case of vertical raschig
rings, the gases would rather flow through the middle
hole of the raschig ring and the void volume between
the rings. The vertical rings clearly promoted the axial
flows in the middle hole and the radial flow direction
only at the upper and lower annular surface, and thus
some local turbulence around the entrance and exit of
the middle hole can be found. For the raschig rings in
horizontal position, the gases dispersed all over the
outer surface of these rings, and a very slow flow was
found in the middle holes. As some of the raschig rings
in the randomly packed models were in the positions
between vertical and horizontal placement, so that the
local velocity distribution was observed as a
combination of the vertical and horizontal flow
behaviors depending upon the angle of its place. This
is reasonable due to the fact that the fluid would prefer
to go through the path with minimum resistance, and
channeling flow was typically developed. In the
opposite way, some parts within the randomly-packed
beds faced with the situation which was lacking of
fluid flows or stagnant zones. The channeling and
stagnant behaviors found in the randomly packed beds
could result in the uneven distribution of fluid flows
within the reactor, and that definitely affects to the
MRT of the reaction system.
Fig. 5. Total velocity and velocity vector in the
Random Packing. 3.2 Effect of Packing Pattern on the Mean
Residence Time
To optimize the mean residence time, it is
especially important to consider the packing pattern in
packed bed reactors. For the pilot scale, how packing
pattern affects the mean residence time is an important
consideration in order to obtain a uniform and well
defined flow through the packed catalyst. The effects
of channeling, recirculating and stagnant zone are
problems for packed beds using complicated packing

บทความวิจยั วารสารวิชาการเทคโนโลยีอุตสาหกรรม ปีที� 12 ฉบบัที� 2 พฤษภาคม – สิงหาคม 2559
The Journal of Industrial Technology, Vol. 12, No. 2 May – August 2016
97
geometries which depended on the design of size and
packing method. Atmakidis (2009) studied the
residence time distribution in different spherical
packing methods. For the residence time distribution,
two compared methods are investigated. The first
method is the tracer method and the second is the post
processing method. Results found a channeling effect
in near wall and zero velocity areas. Two methods
gave similar results on the residence time distribution
[16]. Therefore, in order to investigate the effect of
packing pattern, the research aimed to investigate the
MRT which was calculated from the finite-element
based method and calculated from the ideal plug flow
basis and were shown in Fig. 6. For the vertical-
staggered packing (Fig. 6a), the mean residence times
obtained from the finite element method, i.e. 0.8 - 2.4
sec were higher than that obtained from the plug flow
calculation, i.e. 0.6 - 2.0 sec at all flow rate 0.985-
2.957 L/min respectively. The averaged difference of
the mean residence times obtained from both methods
is about 20% difference. Similar behavior and trends of
the mean residence times can be observed for the
chessboard-staggered shown in Fig. 6b. The mean
residence times obtained from the finite element
method, i.e. 0.7-2.3 sec was also higher than that
obtained from the plug flow calculation, i.e. 0.6-2.0 sec
at all flow rate 0.985-2.957 L/min respectively. The
averaged difference of the mean residence times
obtained from both methods is about 13% difference.
For the last packing pattern, the reciprocal-staggered
pattern (Fig. 6c), the mean residence times obtained
from the finite element method, i.e. 1.0-3.2 sec, were
still higher than that obtained from the plug flow
calculation, i.e. 0.7-2.2 sec, at all flow rate 0.985-2.957
L/min respectively. As seen from the Fig. 6c, somehow
this pattern exhibited larger differences of the mean
residence times calculated from each method
approximately of 54% difference. The reason behind
these differences lay in the distinct flow structures as
explained in the Section 3.1.3. The flow structure
observed within the first row of the reciprocal-
staggered packing was qualitatively the same as that of
the vertical-staggered packing at each flow rate. In the
second row, however, most of the gas volume flow
was in the central holes of the horizontal raschig rings.
The flow velocity was low in those regions except the
interspaces between neighboring rings. It was
interesting that the mean residence times determined
from the plug flow correlation for all three packing
patterns were close i.e. vertical-staggered, chessboard-
staggered, and reciprocal-staggered packing as 0.6-2.0
sec, 0.6-2.0 sec, and 0.7-2.2 sec respectively. This can
be explained by seeing that the Eq. (4) was used to
calculate the residence times with almost the same void
fraction where the total numbers of raschig rings of 32,
32, and 30 were applied to vertical-staggered,
chessboard-staggered, and reciprocal-staggered
packing respectively. In the cases of randomly packed
bed, the mean residence times obtained from the finite
element method were higher than that obtained from
the plug flow case for all flow rates. The average
difference of the mean residence times obtained from

บทความวิจยั วารสารวิชาการเทคโนโลยีอุตสาหกรรม ปีที� 12 ฉบบัที� 2 พฤษภาคม – สิงหาคม 2559
The Journal of Industrial Technology, Vol. 12, No. 2 May – August 2016
98
both methods is about 47%. From the results, this can
be explained from the flow behavior of the randomly
packed beds which have no pattern. Channeling effects
can appear in this kind of packed bed reactor and
induce uncontrollable flow regime. Therefore, the use
of mean residence times obtained from the plug flow
correlation might lead to a large error in the design. It
is noteworthy to mention that the finite element
method using computational technique can be used to
systematically identify the MRT for packing bed
reactors, which can represent the values closer to that
of the real reactors. This can lead us to better design in
both sizing and operation of this equipment. 3.3 The E(t) function
Prior to the present study, the E(t) or delta function
obtained by the integration method of the velocity
correlations, as described in Section 2.2, was shown in
the Fig. 7 of the flow channels with four difference
structured packing in the range of feeding rate of 0.985
to 2.957 L/min.
For all pattern packing, a similar trend of delta
functions and feeding rate was observed. The highest
values of the E(t) have been found at the lowest values
of the studied flow rates. As the feeding rate of 0.985
to 2.957 L/min, the E(t) of chessboard-staggered,
vertical-staggered, and reciprocal-staggered patterns
are 0.0041 – 0.0122 sec, 0.0109 – 0.0439 sec, and
0.0750 – 0.2262 sec respectively. For the randomly
packed beds, the E(t) functions are in the range of
0.1353 – 0.3934 sec. The highest MRT was observed
in the reciprocal-staggered packing, which can be
explained that the reciprocal-staggered packing may be
occurred recirculation eddy effect compared with other
patterns.
Fig. 6. The mean residence times obtained from the finite-element based method ( t ) and the ideal plug flow correlation ( τ ).

บทความวิจยั วารสารวิชาการเทคโนโลยีอุตสาหกรรม ปีที� 12 ฉบบัที� 2 พฤษภาคม – สิงหาคม 2559
The Journal of Industrial Technology, Vol. 12, No. 2 May – August 2016
99
On the other hand, the chessboard-staggered
showed the lowest value, which tells us that this
packing pattern can provide a nearly perfect
distribution compared with other packing patterns. The
delta function, decreased as the feeding flow rate
increased in accordance with the counteraction
between the effects of accelerated and slow flow
regions discussed in Section 3.1. This can be explained
by referring to the high shear force of fluid at high
flow rate mainly induced the flow regime through an
axial direction. Stagnant zone and recirculation eddies
were found less at higher flow rate. Therefore, the
MRTs obtained from the plug flow correlation are not
far different from the MRTs obtained from the finite
element method. It is also significant to point out that
the MRT for packed bed reactors when operated with
high flow can be reasonably estimated from the ideal
plug flow correlation. This is confirmed by the
relations between flow rate and E(t) function as seen
by Eq. (10).
Fig. 7. The E(t) functions for each packing pattern at
different feed flow rate.
4. Conclusions
The interaction between the reactant gasses and the
packing of heterogeneous raschig ring flow behavior
were presented in this research. Both the velocity and
the MRT were different among the four packing
patterns discussed herein. The highest MRT was
observed in the randomly packed bed. The flow
channeling and the slow flow regions that occurred
locally within each packed bed emphasize the
importance of the packing pattern on reactor design.
The results were shown in terms of E(t) function where
a higher value of the E(t) function means greater
deviation from the ideal plug flow. Results showed that
chessboard-staggered pattern had the lowest E(t)
values compared with all patterns and all feeding rates.
Thus, a careful selection of packing pattern such as in a
catalytic bed reactor is so crucial. The different
hydrodynamics within the bed will play a significant
role in various aspects of heterogeneous reactor design.
Thus, the simulation results obtained by the present
research may be taken into consideration when
designing this type of reactor in order to achieve the
optimum conditions. The MRT and flow behavior
presented here have established that the CFD
simulations may be used to provide flow information
that can serve as the basis for developing more
complete packed bed reactor models.

บทความวิจยั วารสารวิชาการเทคโนโลยีอุตสาหกรรม ปีที� 12 ฉบบัที� 2 พฤษภาคม – สิงหาคม 2559
The Journal of Industrial Technology, Vol. 12, No. 2 May – August 2016
100
5. Acknowledgments
This work has been partly funded by PTT Public
Company Limited (PTT). The authors are grateful to
the Thailand Research Fund (The Royal Golden
Jubilee Ph.D. Program, Grant no. PHD/ 0310/2551) for
the scholarship to N. Chutichairattanaphum. I would
like to thank Associate Professor Dr. Phavanee
Narataruksa for stimulating my knowledge on the
catalytic packing structure, Assistant Professor
Dr. Karn Pana-Suppamassadu for his support and
everything and comments and editing the draft of an
article, and RCC gangsters, namely, Piyanut
Inbamrung, Dr. Thanarak Srisurat and Dr. Prayut
Jeimrittiwong for sharing their expertise about the
simulation program. Special thanks to Peter Gysegem
for his critical reading of the manuscript.
6. Reference
[1] J.M. Commenge, T. Obein, G. Genin, X.
Framboisier, S. Rode, V. Schanen, P. Pitiot and
M. Matlosz, “Gas - phase residence time
distribution in a falling-film microreactor”,
Chemical Engineering Science 61(2), 2006,
pp.597-604.
[2] H. Bakhtiary-Davijany, F. Hayer, X.K Phan, R.
Myrstad, P. Pfeifer, Hilde J. Venvik and A.
Holmen, “Performance of a multi-slit packed bed
microstructured reactor in the synthesis of
methanol: Comparison with a laboratory fixed -
bed reactor”, Chemical Engineering Science 66,
2011, pp. 6350-6357.
[3] A. Cantu-Perez, S. Barrass and A. Gavriilidis,
“Residence time distributions in microchannels:
Comparison between channels with herringbone
structures and a rectangular channel”, Chemical
Engineering Journal 160(3), 2010, pp. 834-844.
[4] A. Faridkhou, M. Hamidipour, and F. Larachi,
“Hydrodynamics of gas–liquid micro - fixed beds
Measurement approaches and technical
challenges”, Chemical Engineering Journal 223,
2013, pp. 425-435.
[5] S. Zuercher, K. Pabst and G. Schaub, “Ceramic
foams as structured catalyst inserts in gas–particle
filters for gas reactions - Effect of backmixing”,
Applied Catalysis A: General 357(1), 2009,
pp. 85-92.
[6] N. Ghasemi, M. Sohrabi, M. Khosravi, A.S.
Mujumdar and M. Goodarzi, “CFD simulation of
solid–liquid flow in a two impinging streams
cyclone reactor: Prediction of mean residence
time and holdup of solid particles”, Chemical
Engineering and Processing 49(12), 2010, pp.
1277-1283.
[7] K.J. McGuire, D.R. DeWalle and W.J. Gburek,
“Evaluation of mean residence time in subsurface
waters using oxygen - 18 fluctuations during
drought conditions in the mid - Appalachians”,
journal of Hydrology 261(1-4), 2002, pp. 132-
149.

บทความวิจยั วารสารวิชาการเทคโนโลยีอุตสาหกรรม ปีที� 12 ฉบบัที� 2 พฤษภาคม – สิงหาคม 2559
The Journal of Industrial Technology, Vol. 12, No. 2 May – August 2016
101
[8] H.G. Zhang, S.W. Tang and B. Liang, “Residence
time distribution in two-phase flow mini-channel
reactor”, Chemical Engineering Journal 174(2-3),
2011, pp. 652 - 659.
[9] E.L. Christoforatou and V. Balakotaiah,
“Determination of the critical residence time for
the stability of uniform down-flow in a packed-
bed reactor”, Chemical Engineering Science
52(20), 1997, pp. 3463-3469.
[10] Ceramics.CO.LTD, P.C. “Catalyst carrier/catalyst
bed support”, Available: http://www.chemshun.
com/prd_t.aspx?TypeId=12&eId=4&FId=4&qFid
=12.
[11] W.A. Whittenberger, “High Performance, Drop-
In Replacement Catalyst for Steam Reforming
Hydrogen Plant”, Available: http://www.
azocleantech.com/article.aspx?ArticleID=206.
[12] F. Augier, F. Idoux and J.Y. Delenne, “Numerical
simulations of transfer and transport properties
inside packed beds of spherical particles”,
Chemical Engineering Science 65, 2010, pp.
1055-1064.
[13] Grah, U. Nowak, M. Schreier and R. Adler,
“Radial heat transfer in fixed-bed packing with
small tube/particle diameter ratios, Heat Mass
Transfer 45, 2009, pp. 417-425.
[14] M. Nijemeisland, G.A. Dixon and E.H. Stitt,
“Catalyst design by CFD for heat transfer and
reaction in stream reforming”, Chemical
Engineering Science 59, 2004, pp. 5185-5191.
[15] H. Freund, T. Zeiser, F. Huber, E. Klemm, G.
Brenner, F. Durst and G. Emig, “Numerical
simulations of single phase reacting flow in
randomly packed fixed-bed reactors and
experimental validation, Chemical Engineering
Science 58, 2003, pp. 903-910.
[16] T. Atmakidis and E.Y. Kenig, “A numerical
study on the residence time distribution in low
and moderate tube/ particle diameter ratio fixed
bed reactor”, Chemical Engineering Transections,
2009, pp. 581-586.
Related Documents