10th International Conference on CFD in Oil & Gas, Metallurgical and Process Industries SINTEF, Trondheim, Norway 17-19 June 2014 CFD 2014 1 CFD MODELLING OF GAS ENTRAINMENT AT A PROPAGATING SLUG FRONT Jinsong HUA 1 *, Jørgen NORDBØ 2 and Martin FOSS 1 1 Institute for Energy Technology, PO Box 40, NO-2027 Kjeller, NORWAY 2 NTNU Department of Chemical Engineering, 7491 Trondheim, NORWAY * E-mail: [email protected] ABSTRACT Slug flow is encountered frequently during multiphase fluid transport in pipes. The gas entrainment process at a slug front significantly affects the hydrodynamic behaviour of slug flows. Due to the complexity of the flow physics and the dynamic coupling of the affecting factors, the mechanism by which these factors contribute to the gas entrainment process is not clearly understood. Typical factors affecting the gas entrainment are pipe inclination, Taylor bubble propagation and liquid film. Current experiments are not able to clarify the effect of these factors on the flow characteristics of slugs. Hence, a computational fluid dynamics based numerical method is applied in this paper to simulate the gas entrainment process at the slug front. The objective is to investigate the factors affecting the gas entrainment. A 2D numerical model is created using a commercial CFD package Star-CCM+. To capture the dynamic behaviour of liquid-gas interface at the slug front, the volume of fluid (VOF) model with relatively fine mesh and small time step is used. The simulation results show that the turbulent kinetic energy at the slug front is closely related to the gas entrainment rate. The effects of pipe inclination, Taylor bubble propagation and liquid film flow parameters on the turbulent kinetic energy generation and gas entrainment process at the slug front are also discussed. Keywords: CFD, slug flow, gas entrainment, two-phase flow, VOF method. NOMENCLATURE Greek Symbols α Gas volume fraction, [ - ]. ε Dissipation rate of turbulent kinetic energy, [m 2 /s 3 ]. θ Pipe inclination, [degree]. κ Interface curvature, [1/m]. µ Dynamic viscosity, [kg/m/s]. ρ Mass density, [kg/m 3 ]. σ Surface tension coefficient, [N/m]. Φ Gas shedding flux, [m/s]. Latin Symbols µ C , 1 C and 2 C Turbulence model constants, [ - ]. 0 C Velocity distribution coefficient, [ - ]. D Pipe diameter, [m]. ST F Surface tension force distributed in volume, [N/m 3 ]. g Gravity acceleration, [m/s 2 ]. k G Turbulent kinetic energy production term, [m/s 2 ]. k Turbulent kinetic energy, [m 2 /s 2 ]. n Interface unit normal vector, [-]. p Pressure, [Pa]. LC R Liquid recirculating rate in bubble wake zone, [-]. t time, [s]. u Velocity, [m/s]. m U Mixture velocity, [m/s]. d U Drift velocity, [m/s]. Sub/superscripts b Taylor bubble. f Liquid film. G Gas phase. L Liquid Phase. R Moving reference frame. s slug front or slug body. t Turbulence. w Pipe wall or Taylor bubble wake. INTRODUCTION Gas-liquid slug flow is encountered frequently in long distance pipelines over a wide range of gas and liquid flow rates and pipe inclinations. The two-phase slug flow is described by alternating elongated large bubbles (also known as Taylor bubbles) moving above liquid films and liquid slugs containing small bubbles. The small gas bubbles in the liquid slugs originate from the gas entrainment process occurring on the dynamic gas- liquid interface between the tail of the elongated gas bubble and the front of liquid slug. Propagation and dispersion of small bubbles into the liquid slug change the hydrodynamic characteristics (e.g. pressure drop) of the aerated liquid slug significantly. The accuracy of pressure drop predictions in long pipelines depends strongly upon accuracy in estimating the small gas bubble concentration (or the liquid holdup) in the liquid slug. Slug liquid holdup is required for the closure of most slug flow models, including those of Kokal and Stanislav (1989) and Taitel and Barnea (1990). A slug

Welcome message from author
This document is posted to help you gain knowledge. Please leave a comment to let me know what you think about it! Share it to your friends and learn new things together.
Transcript

10th International Conference on CFD in Oil & Gas, Metallurgical and Process Industries SINTEF, Trondheim, Norway 17-19 June 2014
CFD 2014
1
CFD MODELLING OF GAS ENTRAINMENT AT A PROPAGATING SLUG FRONT
Jinsong HUA1*, Jørgen NORDBØ 2 and Martin FOSS 1
1 Institute for Energy Technology, PO Box 40, NO-2027 Kjeller, NORWAY 2 NTNU Department of Chemical Engineering, 7491 Trondheim, NORWAY
* E-mail: [email protected]
ABSTRACT Slug flow is encountered frequently during multiphase fluid transport in pipes. The gas entrainment process at a slug front significantly affects the hydrodynamic behaviour of slug flows. Due to the complexity of the flow physics and the dynamic coupling of the affecting factors, the mechanism by which these factors contribute to the gas entrainment process is not clearly understood. Typical factors affecting the gas entrainment are pipe inclination, Taylor bubble propagation and liquid film. Current experiments are not able to clarify the effect of these factors on the flow characteristics of slugs. Hence, a computational fluid dynamics based numerical method is applied in this paper to simulate the gas entrainment process at the slug front. The objective is to investigate the factors affecting the gas entrainment. A 2D numerical model is created using a commercial CFD package Star-CCM+. To capture the dynamic behaviour of liquid-gas interface at the slug front, the volume of fluid (VOF) model with relatively fine mesh and small time step is used. The simulation results show that the turbulent kinetic energy at the slug front is closely related to the gas entrainment rate. The effects of pipe inclination, Taylor bubble propagation and liquid film flow parameters on the turbulent kinetic energy generation and gas entrainment process at the slug front are also discussed.
Keywords: CFD, slug flow, gas entrainment, two-phase flow, VOF method.
NOMENCLATURE Greek Symbols α Gas volume fraction, [ - ]. ε Dissipation rate of turbulent kinetic energy, [m2/s3]. θ Pipe inclination, [degree]. κ Interface curvature, [1/m]. µ Dynamic viscosity, [kg/m/s]. ρ Mass density, [kg/m3]. σ Surface tension coefficient, [N/m]. Φ Gas shedding flux, [m/s]. Latin Symbols
µC , 1C and 2C Turbulence model constants, [ - ].
0C Velocity distribution coefficient, [ - ]. D Pipe diameter, [m].
STF Surface tension force distributed in volume, [N/m3]. g Gravity acceleration, [m/s2].
kG Turbulent kinetic energy production term, [m/s2]. k Turbulent kinetic energy, [m2/s2]. n Interface unit normal vector, [-]. p Pressure, [Pa].
LCR Liquid recirculating rate in bubble wake zone, [-]. t time, [s]. u Velocity, [m/s].
mU Mixture velocity, [m/s].
dU Drift velocity, [m/s]. Sub/superscripts b Taylor bubble. f Liquid film. G Gas phase. L Liquid Phase. R Moving reference frame. s slug front or slug body. t Turbulence. w Pipe wall or Taylor bubble wake.
INTRODUCTION Gas-liquid slug flow is encountered frequently in long distance pipelines over a wide range of gas and liquid flow rates and pipe inclinations. The two-phase slug flow is described by alternating elongated large bubbles (also known as Taylor bubbles) moving above liquid films and liquid slugs containing small bubbles. The small gas bubbles in the liquid slugs originate from the gas entrainment process occurring on the dynamic gas-liquid interface between the tail of the elongated gas bubble and the front of liquid slug. Propagation and dispersion of small bubbles into the liquid slug change the hydrodynamic characteristics (e.g. pressure drop) of the aerated liquid slug significantly. The accuracy of pressure drop predictions in long pipelines depends strongly upon accuracy in estimating the small gas bubble concentration (or the liquid holdup) in the liquid slug. Slug liquid holdup is required for the closure of most slug flow models, including those of Kokal and Stanislav (1989) and Taitel and Barnea (1990). A slug

J. Hua, J. Nordbø and M. Foss
2
liquid holdup model, empirical or mechanic, is thus an essential part of any slug flow model. The development of an improved liquid holdup model should therefore be based on a detailed understanding of the gas entrainment process at the slug front. The flow complexity of the gas entrainment process at the propagating slug introduces significant challenges and difficulties for accurate measurement in experiments. This hinders the exploration of flow physics and quantification of the flow parameters. First of all, the gas entrainment process involves dynamic interaction between the elongated bubble tail and the propagating slug front. It is challenging for the current multiphase flow measurement techniques to track and measure the fluid flow parameters close to the dynamic liquid-gas interface. It is also challenging to track the volume changes of the elongated bubble with an irregular tail and the gas content in the liquid slug. Secondly, the fluid flow at the slug front is highly turbulent. The turbulence eddy at the slug front interacts with the liquid-gas interface, creating waves and perturbations on the interface. Thirdly, multi-scale sized bubbles are involved in the gas entrainment process. The elongated bubble has the largest scale of the bubbles involved. Due to the shear flow between the liquid film and the slug front, the rolling waves are formed on the liquid-gas interface, and the tail of the elongated bubble is broken up into medium sized bubbles. They are shed into the slug front or the wake region of the elongated bubble. In this region the bubbles are broken up into smaller bubbles due to the strong turbulence eddies. The presence of gas bubbles also modifies the turbulence structure at the slug front. Some of the smaller bubbles are dispersed further into the downstream liquid slug body. In spite of these challenges, research efforts have been put on experimental studies of the gas entrainment process. The experimental results have been used to develop some fundamental mechanistic models or empirical formulations for predicting gas entrainment rate and void fraction in liquid slug. The early research efforts on the gas entrainment process focused on the development of purely empirical correlations for predicting slug liquid holdup based on experimental statistical data. Gregory et al. (1978) proposed a simple correlation to predict slug liquid holdup as a function of mixture velocity only. The correlation was based on experimental data obtained from two horizontal 0.0258 m and 0.0512 m pipe diameter flow loops using air/oil system. Since the correlation neglected the effect of fluid properties and pipe geometric parameters such as pipe inclination, the correlation gave inaccurate predictions compared to data from other flow loops under different conditions. The correlation was improved by Malnes (1982) taking into account the physical properties of fluid such as surface tension and liquid density. The correlation of Gregory et al. is widely used due to its simplicity and reasonable accuracy. Andreussi and Bendiksen (1989) investigated the effects of pipe diameter, inclination angle and fluid physical
properties on slug liquid holdup for air/water flows in horizontal and near horizontal pipes. A semi-correlation was proposed to account for the effects of these parameters. Experimental data by Nydal and Andreussi (1991) showed that the gas entrainment is approximately proportional to the relative velocity between the slug front and the liquid film and to the interfacial width. Further statistical study of Nydal et al. (1992) revealed that slug liquid holdup is a weak function of liquid superficial velocity and pipe diameter in horizontal pipes. The liquid viscosity effect on slug liquid holdup was investigated experimentally by Nadler and Mewes (1995) using three different fluid systems, air/light oil, air/heavy oil and air/water. The experimental results showed that the slug liquid holdup increases significantly with increasing liquid viscosity, which indicates a reduced gas entrainment rate at the slug front. It was also observed that the slug liquid holdup differs significantly between the air/oil system and air/water system. This is attributed to the difference in surface tension and liquid density. Based on the available experimental data over a wide range of two-phase slug flow conditions, improved correlations were developed taking into account better understanding of the slug flow physics. Gomez et al. (2000) developed a correlation to predict the void fraction in liquid slugs in pipes from horizontal to vertical. The experimental data they used included 283 data points collected from six different slug flow studies covering a wide range of pipe diameters, fluid properties and inclination angels. The correlation treats the liquid slug holdup as a function of the inclination angle and the slug Reynolds number. The slug Reynolds number lumps the effect of mixture velocity, liquid viscosity, pipe diameter. Abdul-Majeed (2000) proposed another correlation for estimating slug liquid holdup in horizontal and slightly inclined pipes. It was based on a large data bank consisting of 423 data point from different laboratories. The correlation performed satisfactorily when validated against the horizontal data. However, it performed poorly when validated against the data for inclined pipes. The exercise on developing empirical correlations indicated that the validity of correlations depends strongly on the range of experimental data set used. The correlations cannot be extended to new flow conditions, which is a strong limitation of the empirical correlations as a predictive tool. Another approach for predicting the gas entrainment and liquid holdup in slugs is to develop a unified mechanistic model, which includes the gas entrainment mechanism. Based on the unit cell model proposed by Dukler and Hubbard (1975), Taitel and Barnea (1990, 1998) developed a slug tracking flow model predicting the evolution of slugs in a pipeline. Brauner and Ullmann (2004) proposed a unified approach to predict slug void fraction in horizontal, inclined and vertical slug flows. Slug aeration is attributed to a recurrent bubble entrainment from the Taylor bubble tail. The gas entrainment rate is determined based on an energy balance between the rate of turbulence kinetic energy production and the rate of bubble surface energy production. The gas entrainment

CFD modelling of gas entrainment at a propagating slug front / CFD 2014
3
model of Brauner and Ullmann (2004) was incorporated into the slug flow model of Issa et al. (2006) that improves the slug void fraction prediction at moderate and high mixture velocity. Zhang et al. (2003) developed a unified mechanistic model to predict slug liquid holdup based on the balance between turbulent kinetic energy of the liquid phase and surface free energy of dispersed, spherical gas bubbles. The turbulent kinetic energy is estimated using the shear stress at the pipe wall and the momentum exchange between the liquid slug and the liquid film in a slug unit. Al-Safran (2009) proposed a new correlation for predicting slug liquid holdup in horizontal pipes using an independent, mechanistic, dimensionless variable. The variable is the momentum transfer rate between the slug body and the liquid film. The correlation was developed using 410 horizontal experimental data points with a wide range of fluid physical properties, pipe size scale, operational and geometrical conditions. It was claimed that the performance of this correlation is much better than other correlations. As indicated in the development of the mechanistic models (Taitel and Barnea 1998; Zhang et al. 2003; Brauner and Ullmann 2004) and the one-dimensional two-fluid model (Issa et al. 2006) for slug flows, many assumptions, simplifications and empirical correlations are required for closure of the governing equations. This affects the model accuracy and model extension to other flow conditions. The first principal numerical simulation based on computational fluid dynamics provides another approach to simulate slug flows using constitutive correlations that are less empirical. Yan and Che (2011) investigated hydrodynamic characteristics like velocity field, volume fraction distribution of dispersed small bubbles, wall shear stress and mass transfer coefficient in the gas-liquid upward slug flow in a vertical pipe. Hua et al. (2012) reported the validation study of using VOF method to simulate the propagation of a single elongated bubble in inclined pipes. The numerical predictions agree well with experiments. In this paper, a CFD modelling approach based on the volume of fluid (VOF) method was applied to simulate the gas entrainment process at a propagating slug front. To capture the dynamic liquid-gas interface, a fine resolution mesh and a small time step size are required. Due to the high requirement of computational resources, a 2D model is used in this study. A moving reference attached to the gas bubble is implemented to allow the slug front to be located near the centre of the computational domain during the long simulation time. This was done to incorporate the propagation of slug front and elongated bubble. The focus of this study is on understanding the mechanism of gas entrainment at slug front and influencing factors. They include Taylor bubble traveling speed, pipe inclination and liquid film velocity and thickness. The gas entrainment process can also be affected by other factors such as surface tension and fluid properties. Since the CFD simulations are computationally expensive and the simulation time is long, this limited the number of numerical tests. The simulations provide new insights about the flow physics
of gas entrainment process, which may enable development of better correlations and mechanistic models.
NUMERICAL MODEL DESCRIPTION Problem Description A schematic diagram of a slug unit of gas-liquid slug flow in an inclined pipe is shown in Figure 1. The diameter of pipe is set to 𝐷, and the inclination angle to horizontal is set to 𝜃. The gas and liquid mixture flow upwards along the pipe with superficial velocities of 𝑈 and 𝑈 for the liquid and gas phases respectively. The mixture velocity for the slug flow is 𝑈 = 𝑈 +𝑈 . The propagating speed of the elongated bubble along the pipe is 𝑈 . The liquid film under the Taylor bubble has a liquid holdup of 𝐻 , and an upward flowing speed of 𝑈 . The liquid slug front velocity is 𝑈 . Normally, the slug front velocity is faster than the liquid film velocity (𝑈 > 𝑈 ), the highly turbulent flow at the liquid-gas interface may break the Taylor bubble tail into small bubbles. The bubbles are entrained into the slug front at a flux of Φ . Some of the relatively large bubbles in the Taylor bubble wake can be carried back to the liquid-gas interface by the recirculating liquid flow and merge with the Taylor bubble. The flux for this process is Φ .
Figure 1: Schematic diagram of a slug unit propagating upward an in inclined pipe.
If the slug flow reaches its fully developed status, the Taylor bubble may reach a quasi-steady state. This means that there is no significant change in the Taylor bubble size. Under this situation the net gas volume shedding rate from the Taylor bubble tail to the slug front (Φ −Φ ) is approximately equal to the gas flux entering into the nose of the tailing Taylor bubble (Φ ). The traveling speeds of the Taylor bubble and the slug front are approximately equal (𝑈 ≈ 𝑈 ). CFD Model
Figure 2: Schematic diagram of the CFD model for gas entrainment process at propagating slug front.
A CFD model partially covering the Taylor bubble, the liquid film and the slug body, as indicated by the dot-lines in Figure 1, is built for studying the gas entrainment process. To achieve a better focus on the
bU
mU
SLU
SGU
fUfHSU
θ
g
GeΦ
GsΦ
GbΦ
RU
L
D
θ g
Outlet
fHRfU
GH Taylor bubble Liquid film
RbU
x
y RwU
RwU
Inlet
Flow direction

J. Hua, J. Nordbø and M. Foss
4
dynamic gas-liquid interface between the Taylor bubble and the slug, a moving reference frame with the same moving speed with the Taylor bubble (𝑈 = 𝑈 ) along the pipe is applied. The schematic diagram of the CFD model is shown in Figure 2. The diameter of pipe is set 𝐷 = 0.1 𝑚. The ratio of pipe length to diameter is L/D=20. An air-water fluid system is set in the model. The pipe wall is moving in the opposite direction of the Taylor bubble travelling velocity: 𝑈 = 𝑈 . No-slip condition is applied on the pipe wall. Flow inlet boundary condition is specified on the left end of the pipe, and outflow boundary condition on the right end of the pipe where the reference pressure is set to zero. The inlet velocity of the liquid film layer is assumed to be 𝑈 = 𝑈 −𝑈 in the moving reference frame. Liquid holdup for the Taylor bubble section is assumed to be 𝐻 . The corresponding liquid film thickness is (𝐻 ∙ 𝐷) for the flow inlet boundary. Since the reference frame is moving with the Taylor bubble, the inlet velocity for the gas phase layer is set zero (𝑈 = 0). The pipe inclination angle (𝜃) is set by specifying the direction of the gravitational acceleration inside the computational domain. Mathematical Formulations The dynamics of the gas-liquid interface inside the computational domain is tracked using a volume of fluid method. A phase volume fraction function (𝛼) is used to identify the liquid phase (𝛼 = 0) and gas phase (𝛼 = 1). The two-phase fluid system is treated as a fluid mixture with variable properties (density 𝜌 and viscosity 𝜇), which is weighted by the fluid properties of each phase and its volume fraction,
( )αραρρ −⋅+⋅= 1LG (1) ( )αµαµµ −⋅+⋅= 1LG (2)
It is reasonable to assume both the gas and liquid phases are incompressible under the specified flow conditions in the present study. The Navier-Stokes equations for single phase flow can be extended for the fluid mixture of two-phase flow. The continuity equation the fluid mixture reads
( ) 0=⋅∇ u (3) And the momentum equation can be expressed as
( ) gFuuuu )()( LSTept
ρρµρ∂∂ρ
−++∇⋅∇+−∇=⋅∇+ (4)
where 𝜇 is the effective viscosity, consisting of laminar mixture viscosity and turbulent viscosity 𝜇 = 𝜇 + 𝜇 . 𝑭 stands for the surface tension force, which can be calculated as
ακσ ∇⋅⋅=STF . (5) Here, 𝜎 is the surface tension coefficient, and 𝜅 is the interface curvature, which is calculated by the divergence of the interface normal (𝒏),
n⋅∇=κ and αα
∇∇
=n (6)
The dynamic evolution of the volume fraction function is governed by the conservation of gas phase,
( ) 0
=⋅∇+ α∂∂α u
t. (7)
To close the above governing equations, turbulent viscosity (𝜇 ) is required for the momentum equation.
Hence, a standard k-ε turbulence model is solved. Two governing equations for turbulent kinetic energy (𝑘) and dissipation rate (𝜀) are expressed as
( ) ( ) )( ρεσµµ
ρ∂ρ
−+⎥⎦
⎤⎢⎣
⎡∇
+⋅∇=⋅∇+
∂ kk
t Gkktk u (8)
( ) ( ) )( 21 ρεε
εσµµ
ερ∂ρε
εCGC
kt kt −+⎥
⎦
⎤⎢⎣
⎡∇
+⋅∇=⋅∇+
∂u (9)
where 𝐺 is the turbulent kinetic energy production term. 𝜎 and 𝜎 are the turbulent Prandtl numbers for turbulent kinetic energy and dissipation. 𝐶 and 𝐶 are the model constants. The turbulent viscosity (𝜇 ) can be calculated as
ερµ µ /2kCt = . (10) The turbulent kinetic energy production can be estimated as
ijijtk SSG µ2= and
⎟⎟⎠
⎞⎜⎜⎝
⎛
∂∂
+∂
∂=
j
i
i
jij x
uxu
S21 (11)
Model Implementation The commercial CFD package Star-CCM+ is used as the base numerical tool for implementing the proposed CFD model and solving the governing equations. A uniform square mesh is applied to the CFD model. After some numerical tests on the model sensitivity to mesh grid size and time step size, it is found both of them should be small enough to capture the dynamic liquid-gas interface with acceptable phase volume conservation. The mesh with 100 grids along the diameter and 2000 grids along the axis is a suitable choice for the present study. Therefore, the grid size is at the order of one millimetre. Such fine mesh makes the CFD model capture the sharp interface of the Taylor bubbles reasonably well, but it is still not fine enough to capture the interface for the small dispersed bubbles. A constant time-step size is set to 1.0 × 10 s in the simulations, and a second order temporal discretization scheme is applied. The initial Taylor bubble is assumed to be rectangular shape with length of (5 ∙ 𝐷) and width of [(1 − ℎ ) ∙ 𝐷] located in the upper left part of the model.
RESULTS AND DISCUSSION In the proposed CFD model, an air-water system with constant densities and viscosities (𝜌 = 1.18 𝑘𝑔/𝑚 , 𝜌 = 997 𝑘𝑔/𝑚 , 𝜇 = 1.85 × 10 𝑃𝑎 𝑠, 𝜇 =0.88 × 10 𝑃𝑎 𝑠) and the interfacial tension coefficient (𝜎 = 0.074 𝑁/𝑚) is applied. The pipe diameter is set as 𝐷 = 0.1 𝑚. The simulation can then be specified by the remaining four flowing parameters; (1) pipe wall velocity (𝑈 ) that reflects the Taylor bubble travelling speed in the lab reference frame; (2) liquid holdup (𝐻 ) for the section of the Taylor bubble, and it reflects the liquid film thickness; (3) liquid film velocity (𝑈 ); (4) pipe inclination (𝜃). These four flow parameters are varied one by one to study their effects on the gas entrainment process at the slug front by comparing the simulation results to that of a base reference case. Base Reference Simulation Case The flow condition for the base reference case is defined by the following settings:

CFD modelling of gas entrainment at a propagating slug front / CFD 2014
5
𝑈 = 1.5 𝑚/𝑠; 𝑈 = 1.0 𝑚/𝑠 ; 𝐻 = 0.4; 𝜃 = 10°
Figure 3: Temporal variation of phase distribution predicted
by the CFD model during the gas entrainment process. Figure 3 and Figure 4 shows the temporal variation of void fraction and velocity field at every 0.08 s over a short period of 0.4 s. The red colour represents the gas phase with void fraction higher than 0.2, while the blue colour stands for liquid phase with void fraction of zero. As highlighted by the long yellow arrows shown in Figures 3 and 4, the fragmentation process of a large gas bubble from the Taylor bubble tail and its entrainment into the slug is highlighted. As shown in Figure 4(a), a liquid jet is initiated from the liquid-gas interface due to the interaction between the liquid film and the recirculating liquid flow at the slug front. The liquid jet protrudes into the Taylor bubble as shown in Figures 3(b) and 4(b). Due to gravity, the liquid jet tip moves downward and impinges on the liquid film under the Taylor bubble. A small amount of gas is trapped between the protruded liquid jet and the liquid film as shown in Figure 3(c), and a new strong circulating vortex is formed at slug front due to the shearing flow between the liquid film and slug front as shown in Figure 4(c). Under the effect of the circulating vortex, the entrained gas bubble is shed into the lower part of pipe as shown in Figures 4(d), and small bubbles are pinched off around the large bubble as shown in Figure 3(d). The large entrained bubble is stretched further by the vortex as shown in Figure 3(e) and finally it is broken up into two smaller bubbles as shown in Figures 3(f) and 4(f). These small bubbles will be dispersed further into the slug body. As shown in Figure 4, there are about four vortexes between the slug front and the developed slug body. The
region from the slug front to the developed slug body is also known as the Taylor bubble wake zone. It has been reported from experiments that the wake zone length is about four to seven pipe diameters. As the flow develops further into the slug body, the strength of the circulating vortices becomes weaker. Some of the dispersed bubbles in the wake zone with relatively large size start to rise upward due to buoyancy as indicated by the short yellow arrows in Figures 3 and 4. Finally they will reach the top pipe wall, forming a thin gas layer, which is also known as Taylor bubble tail. Due to the effect of circulating vortexes, the gas layer moves toward the Taylor bubble or slug front. Hence, the characteristics of the dynamic Taylor bubble tail is determined by the balance of the decaying rate of circulating vortexes in the wake zone and the dispersed bubble size. After the wake zone, the small bubbles are dispersed further into the slug body together with the liquid flow.
Figure 4: Temporal variation of velocity field predicted by the
CFD model during the gas entrainment process. To estimate the gas entrainment rate, it is important to measure the dynamic change of the Taylor bubble volume and the shedding rate of gas phase out of the slug body. This is shown in Figure 5. As the simulation is conducted in a 2D CFD model, the area covered by gas phase in the model is used to indicate the physical gas volume. The total gas volume decreases steadily with time at a shedding rate of �� = −1.14 ×10 𝑚 /𝑠. As suggested in (Nydal and Andreussi 1991), it is better to express the gas phase shedding flux using the shedding velocity Φ =
= 1.14 ×
10 𝑚/𝑠. Due to the complex dynamic behaviour at
(a) t= 0.0 s
(b) t= 0.08 s
(c) t= 0.16 s
(d) t= 0.24 s
(e) t= 0.32 s
(f) t= 0.40 s
(a) t= 0.0 s
(b) t= 0.08 s
(c) t= 0.16 s
(d) t= 0.24 s
(e) t= 0.32 s
(f) t= 0.40 s

J. Hua, J. Nordbø and M. Foss
6
the slug front, the Taylor bubble volume fluctuates significantly due to gas entrainment, breakup and coalescence with the tailing small bubbles. In a time averaging view, the Taylor volume also decreases with time at a rate of �� = −1.33 × 10 𝑚 /𝑠. The corresponding gas entrainment velocity is expressed as Φ =
= 1.33 × 10 𝑚/𝑠. A mean gas shedding
flux Φ = (Φ +Φ )/2 is used to quantify the gas entrainment rate in this study.
Figure 5: Temporal variation of total gas phase volume and Taylor bubble volume predicted by the 2D CFD model.
Figure 6: Time averaged variable field of (a) gas volume
fraction and (b) fluid flow direction. Due to the highly dynamic features of liquid-gas interface at the slug front, it is difficult to extract useful and quantified information from the temporal fields of phase distribution and velocity. Instead, we average the temporal variable fields over a longer period of time, about 2 s. Figure 6(a) shows the time averaged field of gas volume fraction. The region of red colour shows the time–averaged Taylor bubble shape. The region with medium gas volume fraction stands for the bubble wake zone. The developed slug body is shown by the blue region. The time averaged velocity field shown in Figure 6(b) illustrates the direction vector of fluid flow, which is coloured by the gas volume fraction. It clearly shows that the fluids near the gas-liquid interface front flows towards the Taylor bubble. This is a result of the strong circulating vortexes at the slug front and wake zone. Hence, the definition of liquid circulation rate proposed by Hua et al. (2012) is used to quantify the strength of circulating flow, 𝑅 = (𝑈 −𝑈 )/𝑈 , where 𝑈 is the net liquid flux and 𝑈 is the flux of liquid flowing towards the downstream. The variation of liquid circulation rate along the pipe axis is shown in Figure 7. The liquid circulation rate is
nonzero at the slug front and wake zone. The highest peak of recirculation rate corresponds to the slug front, where the gas is entrained by a strong circulating vortex. The region with nonzero circulation rate in the downstream of the slug front corresponds to the wake zone. The liquid circulation rates of the liquid film under the Taylor bubble and the developed slug body are approximately zero. Hence, the distribution of liquid circulation rate can be used as an indicator for different flow regions in slug flow.
Figure 7: Variation of liquid circulation rate along the pipe axis and the corresponding regions: A for liquid film; B for slug front; C for wake zone; and D for developed slug body.
As illustrated in the simulation results, the gas entrainment process is related to the instability of liquid-gas interfaces and flow velocity fluctuation. Actually, the flow velocity fluctuation can be characterised by the turbulent kinetic energy. Figure 8 shows the variation of sectional averaged turbulent kinetic energy along the pipe axis. The turbulent kinetic energy is increasing in the liquid film, and reaches the highest value at the slug front. The turbulent kinetic energy decays downstream the slug front, and reaches a medium steady value at the wake zone. After the wake zone, the turbulent kinetic energy decays in the developed slug body.
Figure 8: Variation of sectional averaged turbulent kinetic
energy along pipe axis for different zones: A for liquid film; B for slug front; C for wake zone; and D for developed slug
body.
The pressure drop along the pipe axis due to flow friction is shown in Figure 9. The effect of hydrostatic pressure is subtracted from the static pressure calculated in the CFD simulation. A low pressure region is formed after the Taylor bubble, which is travelling faster than the liquid. This low pressure induces significant acceleration of the slug front, which generates liquid jets. The interaction of liquid jets and liquid film is a mechanism for gas entrainment.
smVg /1014.1 23−×−=&
smVb /1033.1 23−×−=&
(a)
(b)
A B C D
A B C D

CFD modelling of gas entrainment at a propagating slug front / CFD 2014
7
Figure 9: Variation of pressure drop along pipe axis for
different zones: A for liquid film; B for slug front; C for wake zone; and D for developed slug body.
From the results of the base reference simulation case, it can be concluded that the gas entrainment process is caused by the interaction between the turbulent slug front and the liquid film. The fluid acceleration at the slug front is attributed to the pressure gradient caused by the low pressure zone created by the travelling Taylor bubble. Hence, the gas entrainment rate is affected by the turbulent kinetic energy at the slug front and the pressure drop. As we know, both the turbulent kinetic energy and the pressure drop along the pipe can be affected by flow conditions such as pipe inclination, Taylor bubble travelling speed, liquid film thickness and liquid film velocity. Effect of Pipe Inclination (𝜽)
Figure 10: Variation of (a) pressure drop and (b) turbulent
kinetic energy along pipe axis under different pipe inclination angle of 5º, 10º and 20º.
The effect of pipe inclination on the distribution of pressure drop and turbulent kinetic energy along the pipe axis is shown in Figure 10. Here, only pipe inclination angle is changed, while other parameters are kept constant. As shown in Figure 10(a), the overall pressure drop due to friction is not significantly affected by varying the pipe inclination. However, the pressure jump over the slug front increases significantly with
inclination angle. The turbulent kinetic energy distribution along the pipe shown in Figure 10(b) indicates that the turbulent kinetic energy at slug front increases with the pipe inclination. The gas shedding velocity (Φ ), void fractions in the wake zone (α ) and developed slug body (α ) for different pipe inclinations are listed in Table 1. The gas entrainment rate increases with the pipe inclination.
Table 1: Variation of gas shedding velocity and void fractions under different pipe inclinations.
θ 5º 10° 20º
GΦ (m/s) 7.50E-3 1.24E-3 1.28E-2
wα 1.40E-1 1.12E-1 9.59E-2 sα 2.09E-2 2.57E-2 3.79E-2
Effect of Taylor Bubble Propagating Speed
Figure 11: Variation of (a) pressure drop and (b) turbulent
kinetic energy along pipe axis under different Taylor bubble travelling speed of 1.0 m/s, 1.5 m/s and 2.0 m/s.
The Taylor bubble propagating speed is used to set the pipe wall velocity in the CFD model with moving reference frame. As shown in Figure 11(a), the overall pressure drop due to friction increases with the Taylor bubble travelling speed. However, the local pressure gradient at the slug front is related to the local turbulent kinetic energy. The data shows that the highest turbulent kinetic energy at the slug front is seen when the Taylor bubble velocity is 1.5 m/s, as shown in Figure 11(b).
Table 2: Variation of gas shedding velocity and void fractions under different Taylor bubble travelling speeds.
bU (m/s) 1.0 1.5 2.0
GΦ (m/s) 8.46E-3 1.24E-2 1.35E-2 wα 1.66E-1 1.12E-1 2.16E-1 sα 3.44E-2 2.57E-2 2.71E-2
A B C D
(a)
(b)
θ
θ
(a)
(b)
bU
bU
J. Hua, J. Nordbø and M. Foss
8
The gas shedding velocity (Φ ), void fractions in the wake zone (α ) and developed slug body (α ) for different Taylor bubble travelling speeds are listed in Table 2. The gas entrainment rate increases with the Taylor bubble travelling speed. Effect of Liquid Film Thickness (𝒉𝒇)
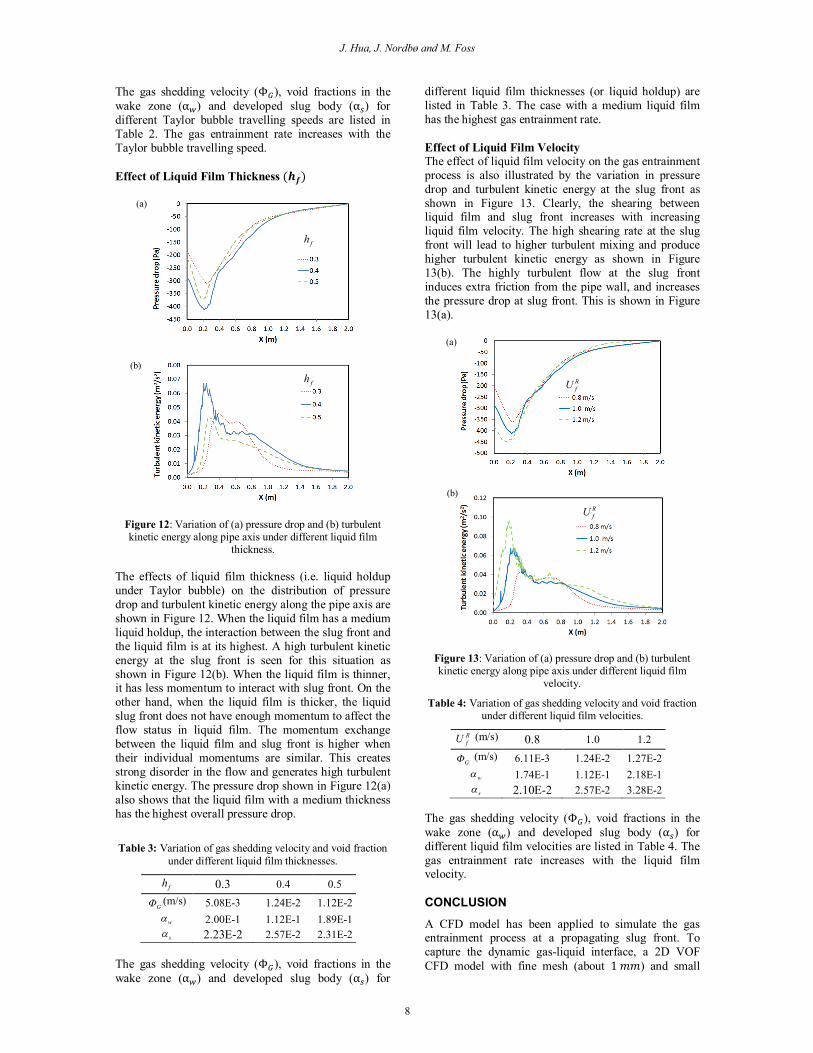
Figure 12: Variation of (a) pressure drop and (b) turbulent kinetic energy along pipe axis under different liquid film
thickness. The effects of liquid film thickness (i.e. liquid holdup under Taylor bubble) on the distribution of pressure drop and turbulent kinetic energy along the pipe axis are shown in Figure 12. When the liquid film has a medium liquid holdup, the interaction between the slug front and the liquid film is at its highest. A high turbulent kinetic energy at the slug front is seen for this situation as shown in Figure 12(b). When the liquid film is thinner, it has less momentum to interact with slug front. On the other hand, when the liquid film is thicker, the liquid slug front does not have enough momentum to affect the flow status in liquid film. The momentum exchange between the liquid film and slug front is higher when their individual momentums are similar. This creates strong disorder in the flow and generates high turbulent kinetic energy. The pressure drop shown in Figure 12(a) also shows that the liquid film with a medium thickness has the highest overall pressure drop.
Table 3: Variation of gas shedding velocity and void fraction under different liquid film thicknesses.
fh 0.3 0.4 0.5
GΦ (m/s) 5.08E-3 1.24E-2 1.12E-2 wα 2.00E-1 1.12E-1 1.89E-1 sα 2.23E-2 2.57E-2 2.31E-2
The gas shedding velocity (Φ ), void fractions in the wake zone (α ) and developed slug body (α ) for
different liquid film thicknesses (or liquid holdup) are listed in Table 3. The case with a medium liquid film has the highest gas entrainment rate. Effect of Liquid Film Velocity The effect of liquid film velocity on the gas entrainment process is also illustrated by the variation in pressure drop and turbulent kinetic energy at the slug front as shown in Figure 13. Clearly, the shearing between liquid film and slug front increases with increasing liquid film velocity. The high shearing rate at the slug front will lead to higher turbulent mixing and produce higher turbulent kinetic energy as shown in Figure 13(b). The highly turbulent flow at the slug front induces extra friction from the pipe wall, and increases the pressure drop at slug front. This is shown in Figure 13(a).
Figure 13: Variation of (a) pressure drop and (b) turbulent kinetic energy along pipe axis under different liquid film
velocity.
Table 4: Variation of gas shedding velocity and void fraction under different liquid film velocities.
RfU (m/s) 0.8 1.0 1.2
GΦ (m/s) 6.11E-3 1.24E-2 1.27E-2 wα 1.74E-1 1.12E-1 2.18E-1 sα 2.10E-2 2.57E-2 3.28E-2
The gas shedding velocity (Φ ), void fractions in the wake zone (α ) and developed slug body (α ) for different liquid film velocities are listed in Table 4. The gas entrainment rate increases with the liquid film velocity.
CONCLUSION
A CFD model has been applied to simulate the gas entrainment process at a propagating slug front. To capture the dynamic gas-liquid interface, a 2D VOF CFD model with fine mesh (about 1 𝑚𝑚) and small
(a)
(b)
fh
fh
(a)
(b)
RfU
RfU

CFD modelling of gas entrainment at a propagating slug front / CFD 2014
9
time step size (about 1.0 × 10 𝑠) is implemented using the commercial CFD package Star-CCM+. In addition, to simulate the propagating slug front, the numerical model is implemented using a moving reference frame attached the Taylor bubble. The gas entrainment rate is obtained by monitoring the decrease of total gas volume or the shrinkage of Taylor bubble volume.
From the flow field and phase volume fraction distribution results, it can be concluded that the amount of gas entrained is determined by the interaction between the liquid film under Taylor bubble and the circulating vortex flow at the slug front. The interaction strength can be characterised by the turbulent kinetic energy at the slug front. This can be affected by many factors such as pipe inclination, Taylor bubble travelling speed, liquid film thickness and liquid film velocity. The parameter sensitivity studies outline the mechanism of action by these factors on the gas entrainment process. High pipe inclination will cause high pressure drop at the slug front and higher liquid acceleration. High Taylor bubble travelling speed will result in lower pressure in the bubble wake zone, which leads to higher pressure drop at the slug front. A medium liquid film thickness has the highest momentum exchange rate between the liquid film and the slug front. High or low liquid film thickness reduces the momentum exchange. Increasing the liquid film velocity will result in high shearing at slug front, which induce high momentum exchange. In general, highly turbulent fluctuations at the slug front will lead to high gas entrainment. A limited number of simulations have been finished to study the gas entrainment at a propagating slug under different flow conditions. The gas entrainment process can be affected by other factors (e.g. surface tension coefficient, fluid properties) which are not considered in this paper. This can be included in future research tasks. The simulation results describes gas entrainment process reasonably well, and provide new insight for developing and improving the mechanistic model for gas entrainment in slug flows.
ACKNOWLEDGEMENT The authors would like to thank the support from the FACE center - a research cooperation between IFE, NTNU and SINTEF, funded by The Research Council of Norway, and by the following industrial partners: Statoil ASA, GE Oil&Gas, Schlumberger, FMC technologies, CD-adapco, and Shell Technology Norway AS.
REFERENCES ABDUL-MAJEED, G.H., (2000), “Liquid slug holdup
in horizontal and slightly inclined two-phase slug flow”. J. Petr. Sci. Eng., 27, 27-32.
AL-SAFRAN, E., (2009), “Prediction of slug liquid holdup in horizontal pipes”, J. Energy Resour. Technol., 131, 023001-1 - 023001-8.
ANDREUSSI, P. and BENDIKSEN, K., (1989), “An investigation of void fraction in slugs for horizontal and inclined gas-liquid slug flow”, Int. J. Multiphase Flow, 15, 937-946.
BRAUNER, N., and ULLMANN, A., (2004), “Modelling of gas entrainment from Taylor bubbles. Part A: Slug flow”, Int. J. Multiphase Flow, 30, 239-272.
DUKLER, A. and HUBBARD, M., (1975), “A model for gas-liquid slug flow in horizontal and near horizontal tubes”, Ind. Eng. Chem. Fundam., 14, 337-347.
GOMEZ, L.E., SHOHAM, O. and TAITEL, Y., (2000), “Prediction of slug liquid holdup horizontal to upward vertical flow”, Int. J. Multiphase Flow, 26, 517-521.
GREGORY, G., NICHOLSON, M. and AZIZ, K. (1978), “Correlation of the liquid volume fraction in the slug for horizontal gas-liquid slug flow”, Int. J. Multiphase Flow, 4, 33-39.
HUA, J., LANGSHOLT, M. and LAWRENCE, C., (2012) “Numerical simulation of single elongated bubble propagation in inclined pipes”, Prog. in Comput. Fluid Dynamics, 12, 131–139.
ISSA, R.I., BONIZZI, M. and BARBEAU S., (2006), “Improved closure models for gas entrainment and interfacial shear for slug flow modelling in horizontal pipes”, Int. J. Multiphase Flow, 32, 1287-1293.
KOKAL, S. and STANISLAV, J., (1989), “An experimental study of two-phase flow in slightly inclined pipes-II: liquid holdup and pressure drop”, Chem. Eng. Sci., 56, 681-693.
MALNES, D., (1982), “Slug flow in vertical, horizontal and inclined pipes”, Institute for Energy Technology, Kjeller Norway, Report No. IFE/KR/E-83-002 V.
NADLER, M., and MEWES, D., (1995), “Effect of the liquid viscosity on phase distribution in horizontal gas-liquid slug flows”, Int. J. Multiphase Flow, 21, 253-266.
NYDAL, O. and ANDREUSSI, P., (1991), “Gas entrainment in long liquid slug advancing in a near horizontal pipe”, Int. J. Multiphase Flow, 17, 179-189.
NYDAL, O., PINTUS, S. and ANDREUSSI, P., (1992), “Statistical characterization of slug flow in horizontal pipes”, Int. J. Multiphase Flow, 18, 439-453.
TAITEL, Y. and BARNEA, D., (1990), “Two-phase slug flow”, Adv. Heat Transfer, 20, 83-132.
TAITEL, Y. and BARNEA, D., (1998), “Effect of gas compressibility on a gas slug tracking model”, Chem. Eng. Sci., 53, 2089-2097.
YAN, K. and CHE, D., (2011), “Hydrodynamic and mass transfer characteristics of slug flow in a vertical pipe with and without dispersed small bubbles”. Int. J. Multiphase Flow, 37, 299–325.
ZHANG, H.Q., WANG, Q., SARICA, C., BRILL, J.P., (2003). “A unified mechanistic model for slug liquid holdup and transition between slug and dispersed bubble flows”, Int. J. Multiphase Flow, 29, 97–107.
Related Documents


![008 Elena Barnea - Prevenirea şi combaterea cancerului uterin [1983]](https://static.cupdf.com/doc/110x72/577cde021a28ab9e78ae33bf/008-elena-barnea-prevenirea-si-combaterea-cancerului-uterin-1983.jpg)


