Citation: Umar, E.; Tandian, N.P.; Syuryavin, A.C.; Ramadhan, A.I.; Prayitno, J.H. CFD Analysis of Convective Heat Transfer in a Vertical Square Sub-Channel for Laminar Flow Regime. Fluids 2022, 7, 207. https://doi.org/10.3390/fluids 7060207 Academic Editor: Mehrdad Massoudi Received: 12 April 2022 Accepted: 30 May 2022 Published: 17 June 2022 Publisher’s Note: MDPI stays neutral with regard to jurisdictional claims in published maps and institutional affil- iations. Copyright: © 2022 by the authors. Licensee MDPI, Basel, Switzerland. This article is an open access article distributed under the terms and conditions of the Creative Commons Attribution (CC BY) license (https:// creativecommons.org/licenses/by/ 4.0/). fluids Article CFD Analysis of Convective Heat Transfer in a Vertical Square Sub-Channel for Laminar Flow Regime Efrizon Umar 1 , Nathanael Panagung Tandian 2 , Ahmad Ciptadi Syuryavin 2,3 , Anwar Ilmar Ramadhan 4 and Joko Hadi Prayitno 1, * 1 National Nuclear Energy Agency, BRIN, Jl. Tamansari No 71, Bandung 40132, Indonesia; [email protected] 2 Faculty of Mechanical and Aerospace Engineering, Bandung Institute of Technology, Jl. Ganesha No 10, Bandung 40132, Indonesia; [email protected] (N.P.T.); [email protected] (A.C.S.) 3 Nuclear Energy Regulation Agency, Jl. Gadjah Mada No 8, Jakarta 11120, Indonesia 4 Department of Mechanical Engineering, Faculty of Engineering, Universitas Muhammadiyah Jakarta, Jl. Cempaka Putih Tengah No 27, Jakarta 10510, Indonesia; [email protected] * Correspondence: [email protected]; Tel.: +62-812-2187-7536 Abstract: The development of new practices in nuclear research reactor safety aspects and opti- mization of recent nuclear reactors needs knowledge on forced convective heat transfer within sub-channels formed between several nuclear fuel rods or heat exchanger tubes, not only in the fully developed regime but also in the developing regime or laminar flow regime. The main objective of this research was to find a new correlation equation for calculating the convective heat transfer coefficient in the vertical square sub-channels. Recently, a simulation study was conducted to find a new heat transfer correlation equation for calculating the convective heat transfer coefficient within a vertical square sub-channel in the developing regime or laminar flow regime for Reynolds number range 400 ≤ Re ≤ 1700. Simulations were carried out using a computational fluid dynamics (CFD) code and modeling already defined in the software. The novelty of the research lies in the analysis of the entrance effect for the sub-channel by proposing a new empirical correlation that can then be inserted into the STAT computer code. The surface temperature distribution around the tangential direction of the active cylinders shows that the implementation of active and dummy cylinders in the current study can simulate sub-channels that exist in a real nuclear reactor core. The current study shows that the flow simulated in this study is in its developing condition (entrance region). A new forced convective heat transfer correlation for the developing region in the form of Nu = 2.094(Gz) 0.329 for the Graetz number range 161 ≤ Gz ≤ 2429 was obtained from the current study. Keywords: CFD code; developing regime; convection; sub-channel; vertical cylinder 1. Introduction Heating and cooling of fluids flowing inside conduits or around rod bundles in a nuclear reactor core are among the most important heat transfer processes in engineering. The design and analysis of heat exchangers or rod bundles in a nuclear reactor core require knowledge of the heat transfer coefficient between the wall of the conduits or rod bundles and the fluid flowing inside or around them [1–4]. Modeling the heat exchanger is very important task so as to estimate the performance of the system in terms of heat transfer and accordingly design the configuration [5]. Rod bundles are the heat exchange elements of a nuclear reactor, where in the coolant that passes through the sub-channels extracts heat from the surrounding fuel rods [6]. For a nuclear research reactor, many researchers have conducted theoretical [7–13] and experimental study [14,15] on convective heat transfer for natural, laminar, and turbulent flow in the sub-channel of a reactor core. In the theoretical study, RELAP5-3D was used for all computational modeling during the thermal–hydraulic analysis. Meanwhile, in the Bandung TRIGA research reactor, the STAT computer code was used [16,17] to study the Fluids 2022, 7, 207. https://doi.org/10.3390/fluids7060207 https://www.mdpi.com/journal/fluids

Welcome message from author
This document is posted to help you gain knowledge. Please leave a comment to let me know what you think about it! Share it to your friends and learn new things together.
Transcript
Citation: Umar, E.; Tandian, N.P.;
Syuryavin, A.C.; Ramadhan, A.I.;
Prayitno, J.H. CFD Analysis of
Convective Heat Transfer in a Vertical
Square Sub-Channel for Laminar
Flow Regime. Fluids 2022, 7, 207.
https://doi.org/10.3390/fluids
7060207
Academic Editor: Mehrdad Massoudi
Received: 12 April 2022
Accepted: 30 May 2022
Published: 17 June 2022
Publisher’s Note: MDPI stays neutral
with regard to jurisdictional claims in
published maps and institutional affil-
iations.
Copyright: © 2022 by the authors.
Licensee MDPI, Basel, Switzerland.
This article is an open access article
distributed under the terms and
conditions of the Creative Commons
Attribution (CC BY) license (https://
creativecommons.org/licenses/by/
4.0/).
fluids
Article
CFD Analysis of Convective Heat Transfer in a Vertical SquareSub-Channel for Laminar Flow RegimeEfrizon Umar 1, Nathanael Panagung Tandian 2 , Ahmad Ciptadi Syuryavin 2,3 , Anwar Ilmar Ramadhan 4 andJoko Hadi Prayitno 1,*
1 National Nuclear Energy Agency, BRIN, Jl. Tamansari No 71, Bandung 40132, Indonesia; [email protected] Faculty of Mechanical and Aerospace Engineering, Bandung Institute of Technology, Jl. Ganesha No 10,
Bandung 40132, Indonesia; [email protected] (N.P.T.); [email protected] (A.C.S.)3 Nuclear Energy Regulation Agency, Jl. Gadjah Mada No 8, Jakarta 11120, Indonesia4 Department of Mechanical Engineering, Faculty of Engineering, Universitas Muhammadiyah Jakarta, Jl.
Cempaka Putih Tengah No 27, Jakarta 10510, Indonesia; [email protected]* Correspondence: [email protected]; Tel.: +62-812-2187-7536
Abstract: The development of new practices in nuclear research reactor safety aspects and opti-mization of recent nuclear reactors needs knowledge on forced convective heat transfer withinsub-channels formed between several nuclear fuel rods or heat exchanger tubes, not only in the fullydeveloped regime but also in the developing regime or laminar flow regime. The main objectiveof this research was to find a new correlation equation for calculating the convective heat transfercoefficient in the vertical square sub-channels. Recently, a simulation study was conducted to find anew heat transfer correlation equation for calculating the convective heat transfer coefficient within avertical square sub-channel in the developing regime or laminar flow regime for Reynolds numberrange 400 ≤ Re ≤ 1700. Simulations were carried out using a computational fluid dynamics (CFD)code and modeling already defined in the software. The novelty of the research lies in the analysisof the entrance effect for the sub-channel by proposing a new empirical correlation that can then beinserted into the STAT computer code. The surface temperature distribution around the tangentialdirection of the active cylinders shows that the implementation of active and dummy cylinders in thecurrent study can simulate sub-channels that exist in a real nuclear reactor core. The current studyshows that the flow simulated in this study is in its developing condition (entrance region). A newforced convective heat transfer correlation for the developing region in the form of Nu = 2.094(Gz)0.329
for the Graetz number range 161 ≤ Gz ≤ 2429 was obtained from the current study.
Keywords: CFD code; developing regime; convection; sub-channel; vertical cylinder
1. Introduction
Heating and cooling of fluids flowing inside conduits or around rod bundles in anuclear reactor core are among the most important heat transfer processes in engineering.The design and analysis of heat exchangers or rod bundles in a nuclear reactor core requireknowledge of the heat transfer coefficient between the wall of the conduits or rod bundlesand the fluid flowing inside or around them [1–4]. Modeling the heat exchanger is veryimportant task so as to estimate the performance of the system in terms of heat transferand accordingly design the configuration [5]. Rod bundles are the heat exchange elementsof a nuclear reactor, where in the coolant that passes through the sub-channels extracts heatfrom the surrounding fuel rods [6].
For a nuclear research reactor, many researchers have conducted theoretical [7–13] andexperimental study [14,15] on convective heat transfer for natural, laminar, and turbulentflow in the sub-channel of a reactor core. In the theoretical study, RELAP5-3D was usedfor all computational modeling during the thermal–hydraulic analysis. Meanwhile, in theBandung TRIGA research reactor, the STAT computer code was used [16,17] to study the
Fluids 2022, 7, 207. https://doi.org/10.3390/fluids7060207 https://www.mdpi.com/journal/fluids
Fluids 2022, 7, 207 2 of 17
essential safety parameters of the reactor. In actuality, the flow in the pool of the BandungTRIGA research reactor is complex; water exiting the reactor rises toward the top of thepool where some part is removed to a cooling system and subsequently returned at thepoint near the level of the bottom grid plate. The construction of the Bandung TRIGAresearch reactor core is also made in such a way that the primary cooling water that comesout at a speed of 2.8 m/s is assumed to have no effect on the flow velocity in the reactorcore. On the basis of this assumption, the heat transfer in the reactor core takes place bya pure natural convection, and the thermal hydraulic parameter analysis can be carriedout via single-channel analysis without involving the outlet flow velocity from the primarycooling system. The use of the computer code STAT gives a significant deviation to theexperimental data [16].
To improve the analysis using STAT computer code, it is necessary to carry out a three-dimensional analysis and consider the effect of flow from the primary cooling system. Onemethod that can be used to overcome this problem is computational fluid dynamics [18–25].Heat, mass, and momentum balance equations of the water are solved with the help ofnumerical analysis [21]. CFD is a powerful technique for study of the complex flow [25],and, compared to the experiment, results from CFD can often be obtained in a shortertime and at a lower cost [22,25]. For the Bandung TRIGA research reactor, a thermal–hydraulic analysis using CFD was carried out, both for the core according to the generalatomic design [23] and for the reactor core after modification [24]. The results of this studyindicated that the outlet flow from the primary cooling system has a significant effecton the sub-channel inlet velocity. Moreover, the length of the sub-channel in the TRIGA2000 reactor core is very limited (38 cm), such that the flow in the sub-channel is predictedto be still in the developing regime. Research related to forced convection in sub-channels,including in developing regimes, is limited [26–39].
Recently, a simulation study was performed in the search for a new heat transfercorrelation equation for calculating the convective heat transfer coefficient within a verticalsquare sub-channel in the developing regime or laminar flow regime with Reynolds number(Re) range 400 ≤ Re ≤ 1700. Simulations were carried out with computational fluiddynamics (CFD) code using modeling already defined in the software. The novelty of thisresearch lies in the analysis of the entrance effect for the sub-channel by proposing a newempirical correlation which can then be inserted into the STAT computer code.
2. Materials and Methods2.1. Numerical Model
Vertical cylinders simulate a bundle of nuclear reactor fuel rods or heat exchangertubes. The size and the geometry of the vertical cylinder used in the current study specifi-cally replicate the fuel rod of a nuclear reactor core with a pitch/diameter (P/D) ratio ofabout 1.16. Sketches of the test section used in this study and its schematic vertical cross-section are shown in Figure 1. The simulation test section was a model of the sub-channelin the CFD computer code consisting of the following components: a test box, a main testsection, a cylinder assembly, a perforated plate acting as a flow distributor, a fresh waterinlet, and a warm water outlet.
The main test section and the test box were made of glass sheets so that they weretransparent. During a forced convection experiment, cooling water flows into lower partof the main test section through the cooling water inlet. The water flows through theperforated plates into the main chamber of the test section, where the cylinder assemblyis installed. The water flows through the sub-channels between the cylinders, and finallyleaves the main test section through the opening at the top of main test section. Thehorizontal cross-section of the cylinder assembly is shown in Figure 2. The cylinderassembly consisted of 16 vertical cylinders; four of them were active cylinders equippedwith electric heaters, while the remaining cylinders were dummy cylinders without electricheaters. The sub-channel explored in this study was the main sub-channel formed by theactive cylinders, i.e., the blue sub-channel in Figure 2.

Fluids 2022, 7, 207 3 of 17Fluids 2022, 6, x FOR PEER REVIEW 3 of 18
(a) (b)
Figure 1. Sketch of experiment test section (a) and its vertical cross-section (b).
The main test section and the test box were made of glass sheets so that they were
transparent. During a forced convection experiment, cooling water flows into lower part
of the main test section through the cooling water inlet. The water flows through the per-
forated plates into the main chamber of the test section, where the cylinder assembly is
installed. The water flows through the sub-channels between the cylinders, and finally
leaves the main test section through the opening at the top of main test section. The hori-
zontal cross-section of the cylinder assembly is shown in Figure 2. The cylinder assembly
consisted of 16 vertical cylinders; four of them were active cylinders equipped with elec-
tric heaters, while the remaining cylinders were dummy cylinders without electric heat-
ers. The sub-channel explored in this study was the main sub-channel formed by the ac-
tive cylinders, i.e., the blue sub-channel in Figure 2.
Figure 2. Horizontal cross-section of simulation test.
Figure 1. Sketch of experiment test section (a) and its vertical cross-section (b).
Fluids 2022, 6, x FOR PEER REVIEW 3 of 18
(a) (b)
Figure 1. Sketch of experiment test section (a) and its vertical cross-section (b).
The main test section and the test box were made of glass sheets so that they were
transparent. During a forced convection experiment, cooling water flows into lower part
of the main test section through the cooling water inlet. The water flows through the per-
forated plates into the main chamber of the test section, where the cylinder assembly is
installed. The water flows through the sub-channels between the cylinders, and finally
leaves the main test section through the opening at the top of main test section. The hori-
zontal cross-section of the cylinder assembly is shown in Figure 2. The cylinder assembly
consisted of 16 vertical cylinders; four of them were active cylinders equipped with elec-
tric heaters, while the remaining cylinders were dummy cylinders without electric heat-
ers. The sub-channel explored in this study was the main sub-channel formed by the ac-
tive cylinders, i.e., the blue sub-channel in Figure 2.
Figure 2. Horizontal cross-section of simulation test. Figure 2. Horizontal cross-section of simulation test.
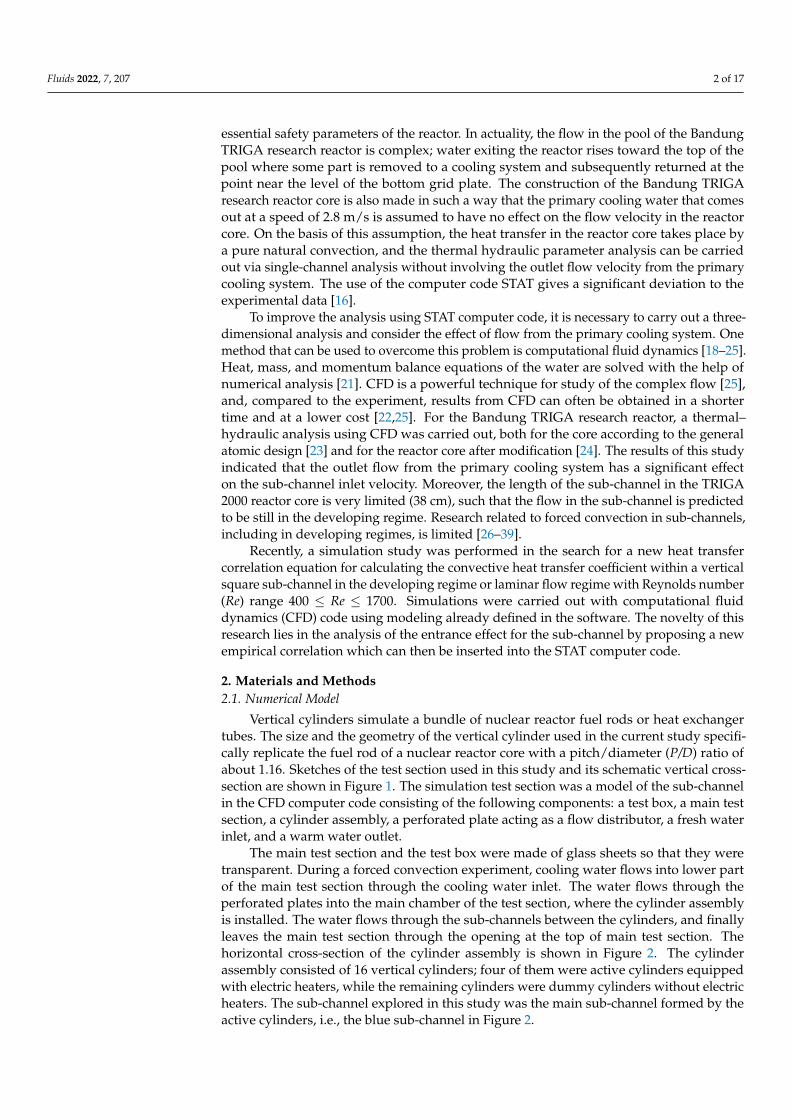
The dummy cylinders were used to distribute the water flows through the sub-channels such that the flow characteristics within the sub-channel were similar to thoseof water flows inside the nuclear reactor core or vertical heat exchanger sub-channels(Figure 3). One major characteristic of the flow inside a sub-channel in a reactor core is theinsignificant lateral flow, i.e., the water flow is dominated by its axial velocity. To ensurethat the tested sub-channel had this flow characteristic, the gap between the cylinder wallsand main test section walls had to be well designed. By using this arrangement, it wasexpected that the water flows inside sub-channels in a nuclear reactor core could be wellsimulated. This theoretical study analyzed the heat transfer in the main sub-channel using aCFD (FLUENT) software package. The computational domain covered by the CFD analysisconsisted of the volume inside the test section main chamber filled with cooling water.
Fluids 2022, 7, 207 4 of 17
Fluids 2022, 6, x FOR PEER REVIEW 4 of 18
The dummy cylinders were used to distribute the water flows through the sub-chan-
nels such that the flow characteristics within the sub-channel were similar to those of wa-
ter flows inside the nuclear reactor core or vertical heat exchanger sub-channels (Figure
3). One major characteristic of the flow inside a sub-channel in a reactor core is the insig-
nificant lateral flow, i.e., the water flow is dominated by its axial velocity. To ensure that
the tested sub-channel had this flow characteristic, the gap between the cylinder walls and
main test section walls had to be well designed. By using this arrangement, it was ex-
pected that the water flows inside sub-channels in a nuclear reactor core could be well
simulated. This theoretical study analyzed the heat transfer in the main sub-channel using
a CFD (FLUENT) software package. The computational domain covered by the CFD anal-
ysis consisted of the volume inside the test section main chamber filled with cooling water.
Figure 3. Modeling, meshing, and boundary conditions of sub-channel vertical square. Figure 3. Modeling, meshing, and boundary conditions of sub-channel vertical square.
2.2. Boundary Conditions
It was assumed that heat flux on the active cylinder surface was constant and uniform,while the surface of the dummy cylinders was assumed to be adiabatic. Several otherimportant assumptions were considered in this study, as listed below:
a. The experiment reached its steady operating condition.b. Since the test section was opened to the atmosphere, the pressure at the water surface
was constant at 1 bar, while pressures at other locations were hydrostatic pressures.c. The fresh water inlet entered the test section at a room temperature of 300 K.d. Gravity was taken as 9.8 m/s2.e. The physical properties of water followed its temperature and were obtained from
the literature (Table 1).
Fluids 2022, 7, 207 5 of 17
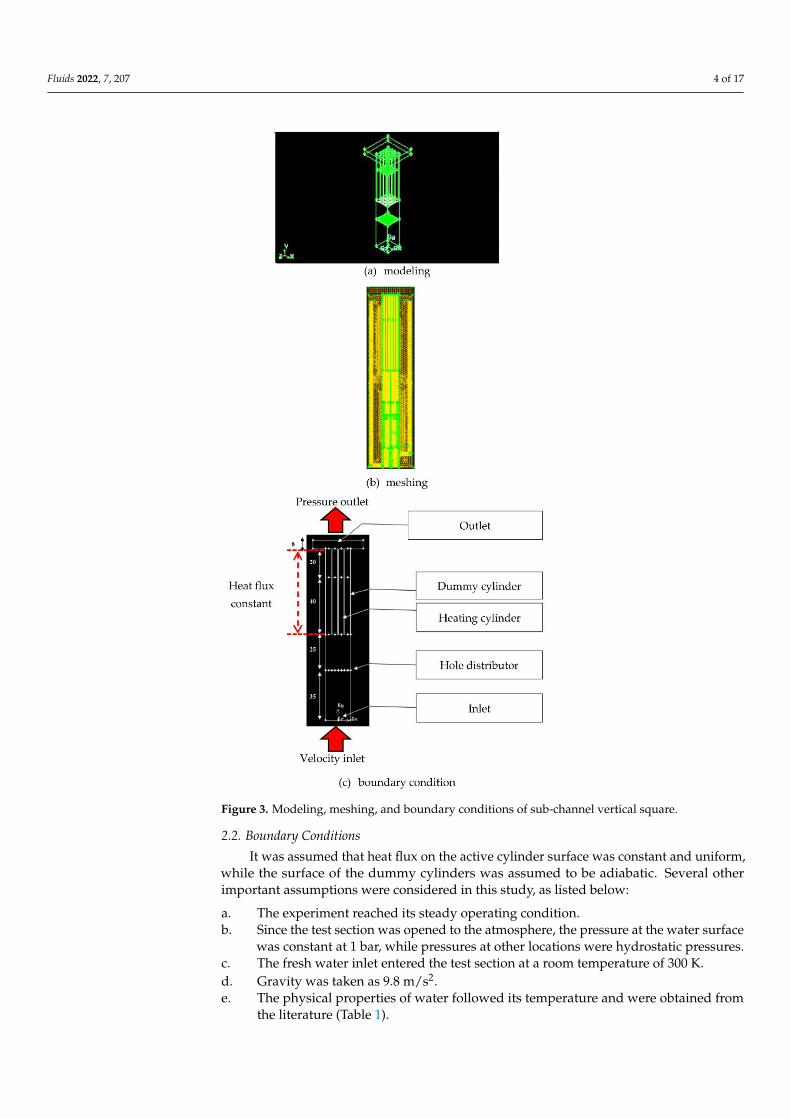
The theoretical CFD model assumed the boundary conditions shown in Table 2 in itscomputational domain.
Table 1. Physical properties of water at temperature of 300 K [23,29].
ρ (kg/m3) µ (N·s/m2) Cp (kJ/kg·K) k (W/m·K)
996.59 0.000852 4.179 0.6
Table 2. Boundary conditions for the CFD model.
Boundary Type Parameter Value
Pressure outlet Gauge pressure 0 PaBackflow temperature 298 K
Wall (heater) Heat flux 100, 500, and 1000 W/m2
Wall (stainless steel) Heat flux 0 W/m2
Inlet Velocity inletReynolds number (Re)
0.7–1.0 m/s(400 ≤ Re ≤ 1700)
2.3. Governing Equations
The governing equations utilized in the theoretical study followed the governingequations implemented in the CFD FLUENT. Basically, the equations consisted of a conti-nuity equation, momentum equation, energy equations, and equations for the standard k–εturbulence model. These equations are expressed below [12,23,29].
Continuity Equation: The continuity equation, or equation for the conservation ofmass, can be written in the tensor notation as follows:
∇(
ρ→v)= 0, (1)
where ρ is water mass density, and→v is velocity vector.
Momentum Equation: The conservation of momentum in an inertial (non-accelerating)reference frame can be described by the following equation:
∇.(
ρ→v→v)= −∇p +∇.
→→τ= ρ
→g , (2)
where p is the static pressure,→→τ is the stress tensor (described below), and ρ
→g is the
gravitational body force. The stress tensor can be expressed as follows:
→→τ = −µ((∇→v +∇vT)− 2
3∇.→v I), (3)
where µ is the molecular viscosity, I is the unit tensor, and the second term on the right-handside of Equation (3) represents the effect of volume dilation.
Energy Equation: The energy conservation equation can be expressed in the followingform:
∇. (→v ρ(h +
12
v2))= ∇. (κe f f∇ T), (4)
where κe f f is the effective thermal conductivity, i.e., the fluid thermal conductivity com-bined with the turbulence thermal conductivity, κt is defined according to the turbulencemodel being used, and T is temperature of the water.
2.4. Parameters of Forced Convective Heat Transfer
In the design and analysis of heat exchangers or rod bundles in a nuclear reactor core,it is necessary to evaluate heat transfer coefficients for fluid flowing inside heat exchangers
Fluids 2022, 7, 207 6 of 17
or around the rod bundles. If the heat transfer coefficient for a given geometry and specifiedflow conditions is known, the heat transfer rate at the prevailing temperature differencecan be calculated using Equation (5) [2].
qc = hc A (Tsurface - Tfluid). (5)
From a dimensional analysis, the experimental results or the simulation results of CFDobtained in forced convection heat transfer experiments in long ducts and conduits can becorrelated by the following equation [7]:
Nu = Φ(Re) Ө(Pr), (6)
where the symbols Φ and Ө denote functions of the Reynolds number and Prandtl number,respectively. For heated fluid and turbulent flow, the Dittus–Boelter correlation [28,29,40]is used to calculate the Nusselt number of flow in a circular tube.
Nu = 0.023 Re0.8Pr0.4, (7)
whereNu = the Nusselt dimensionless number =
h.Dk
Re = the Reynolds dimensionless number =ρ.V.D
µ
Pr = the Prandtl dimensionless number =cp.µ
kIf the channel through which the fluid flows does not have a circular cross-section, it
is also recommended that the heat transfer correlation be based on the hydraulic diameter(Dh), defined by
Dh = 4AP
(8)
where A is the cross-sectional area of the flow, and P is the wetted perimeter.To express the forced convection correlation for fully developed flow in the sub-
channel, the Nusselt number is used as the product of the Nusselt number for circular tube(Nu) with the correction factor formulated in Equation (9) [1,32].
Nu = ψ(Nu)ct, (9)
where Nu = the Nusselt number = h.Dk , (Nu)ct = the Nusselt number for flow in a circular
tube, and ψ = the correction factor. For ratios of length (L) to diameter (D) of circular tubesgreater than 60, and for 1.1 ≤ P/D ≤ 1.3, the correction factor ψ is
ψ = 1826 P/D − 1.043. (10)
For short ducts, particularly in laminar flow, the right-hand side of Equation (6) mustbe modified by including the aspect ratio Dh
x .
Nu = Φ(Re) Ө (Pr) f (Dhx), (11)
where f ( Dhx ) denotes the functional dependence of the aspect ratio.
In addition to the Reynolds number and Prandtl number, another factor that canaffect the conditions of heat transfer by means of forced convection is the influence ofthe developing region. For laminar flow, the influence of the developing region is veryimportant if the L/Dh ratio is <50 [2]. Some studies calculated the local and averageNusselt numbers for laminar entrance regions of circular tubes for the case of a fully
Fluids 2022, 7, 207 7 of 17
developed velocity profile, and results of these analysis were described in the literatureby introducing the Graetz number [2,3,41]. The forced convection heat transfer correlationin the sub-channel in the developing region for constant heat flux can be formulated asfollows:
Nu = f (Re, Pr, Dh/x), (12)
Nu = f (Gz). (13)
The Graetz number is a dimensionless number that characterizes laminar flow in aconduit or sub-channel. The Graetz number is equal to the product of the specific heatcapacity, diameter, characteristic length, characteristic speed, and mass density divided bythermal conductivity and length.
3. Results and Discussion3.1. Grid-Independent Test
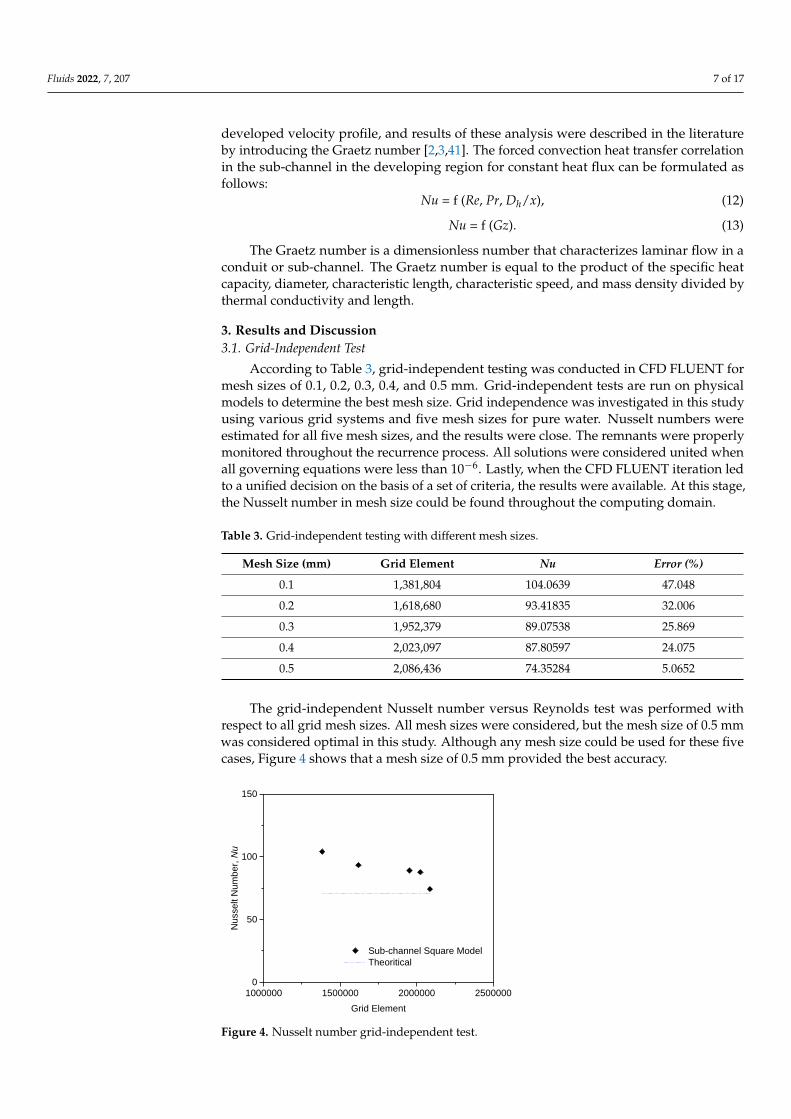
According to Table 3, grid-independent testing was conducted in CFD FLUENT formesh sizes of 0.1, 0.2, 0.3, 0.4, and 0.5 mm. Grid-independent tests are run on physicalmodels to determine the best mesh size. Grid independence was investigated in this studyusing various grid systems and five mesh sizes for pure water. Nusselt numbers wereestimated for all five mesh sizes, and the results were close. The remnants were properlymonitored throughout the recurrence process. All solutions were considered united whenall governing equations were less than 10−6. Lastly, when the CFD FLUENT iteration ledto a unified decision on the basis of a set of criteria, the results were available. At this stage,the Nusselt number in mesh size could be found throughout the computing domain.
Table 3. Grid-independent testing with different mesh sizes.
Mesh Size (mm) Grid Element Nu Error (%)
0.1 1,381,804 104.0639 47.048
0.2 1,618,680 93.41835 32.006
0.3 1,952,379 89.07538 25.869
0.4 2,023,097 87.80597 24.075
0.5 2,086,436 74.35284 5.0652
The grid-independent Nusselt number versus Reynolds test was performed withrespect to all grid mesh sizes. All mesh sizes were considered, but the mesh size of 0.5 mmwas considered optimal in this study. Although any mesh size could be used for these fivecases, Figure 4 shows that a mesh size of 0.5 mm provided the best accuracy.
Fluids 2022, 6, x FOR PEER REVIEW 8 of 18
The grid-independent Nusselt number versus Reynolds test was performed with re-
spect to all grid mesh sizes. All mesh sizes were considered, but the mesh size of 0.5 mm
was considered optimal in this study. Although any mesh size could be used for these five
cases, Figure 4 shows that a mesh size of 0.5 mm provided the best accuracy.
1000000 1500000 2000000 25000000
50
100
150
Nusselt N
um
ber,
Nu
Grid Element
Sub-channel Square Model
Theoritical
Figure 4. Nusselt number grid-independent test.
3.2. Validation of Results
The validation process is critical for ensuring that the results are correct when using
the optimal size mesh model. This can be seen in Figure 5 as the Reynolds number in-
creased (Re). The results of the theoretical study are shown as dotted black lines, revealing
a good fit between the CFD results and the equation.
0 200 400 600 800 1000 1200 1400 1600 1800 2000
0
50
100
150
200
250
300
350
400
Nu
sse
lt N
um
be
r, N
u
Reynold Number, Re
Sub-channel square model
Theoritical
Figure 5. Validation results for Nusselt number.
Figure 4. Nusselt number grid-independent test.
Fluids 2022, 7, 207 8 of 17
3.2. Validation of Results
The validation process is critical for ensuring that the results are correct when using theoptimal size mesh model. This can be seen in Figure 5 as the Reynolds number increased(Re). The results of the theoretical study are shown as dotted black lines, revealing a goodfit between the CFD results and the equation.
Fluids 2022, 6, x FOR PEER REVIEW 8 of 18
The grid-independent Nusselt number versus Reynolds test was performed with re-
spect to all grid mesh sizes. All mesh sizes were considered, but the mesh size of 0.5 mm
was considered optimal in this study. Although any mesh size could be used for these five
cases, Figure 4 shows that a mesh size of 0.5 mm provided the best accuracy.
1000000 1500000 2000000 25000000
50
100
150
Nu
sse
lt N
um
be
r, N
u
Grid Element
Sub-channel Square Model
Theoritical
Figure 4. Nusselt number grid-independent test.
3.2. Validation of Results
The validation process is critical for ensuring that the results are correct when using
the optimal size mesh model. This can be seen in Figure 5 as the Reynolds number in-
creased (Re). The results of the theoretical study are shown as dotted black lines, revealing
a good fit between the CFD results and the equation.
0 200 400 600 800 1000 1200 1400 1600 1800 2000
0
50
100
150
200
250
300
350
400N
usse
lt N
um
be
r, N
u
Reynold Number, Re
Sub-channel square model
Theoritical
Figure 5. Validation results for Nusselt number. Figure 5. Validation results for Nusselt number.
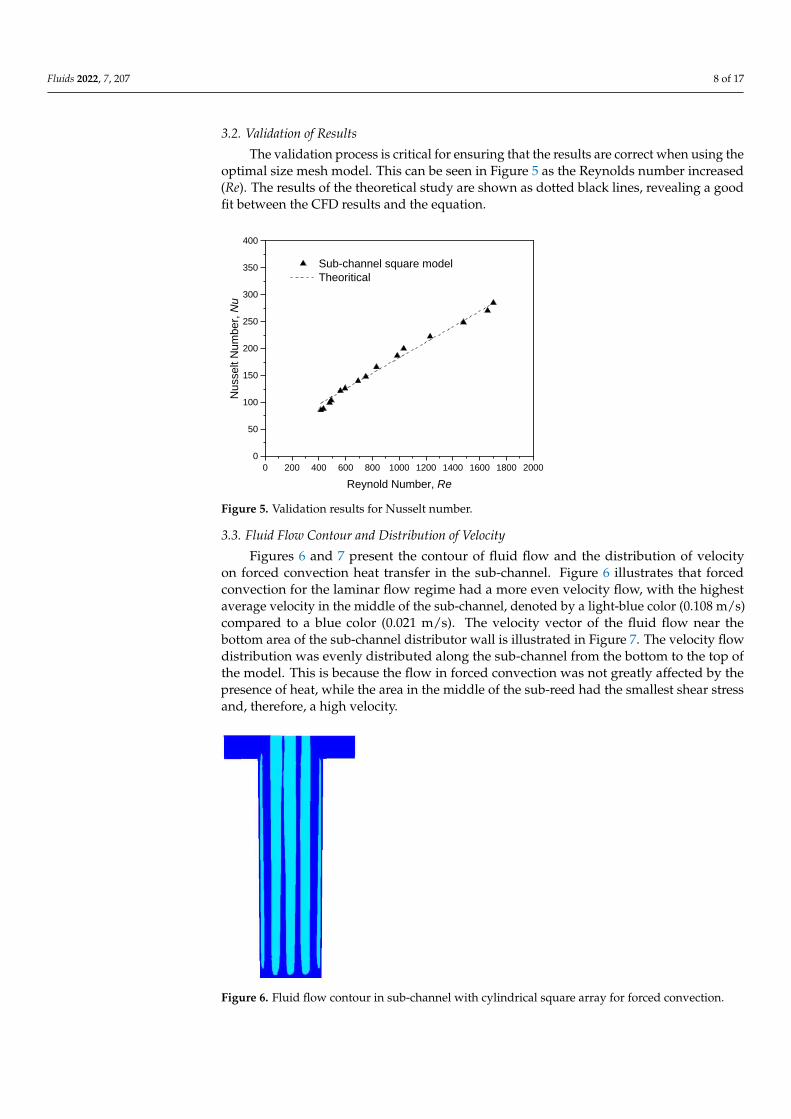
3.3. Fluid Flow Contour and Distribution of Velocity
Figures 6 and 7 present the contour of fluid flow and the distribution of velocityon forced convection heat transfer in the sub-channel. Figure 6 illustrates that forcedconvection for the laminar flow regime had a more even velocity flow, with the highestaverage velocity in the middle of the sub-channel, denoted by a light-blue color (0.108 m/s)compared to a blue color (0.021 m/s). The velocity vector of the fluid flow near thebottom area of the sub-channel distributor wall is illustrated in Figure 7. The velocity flowdistribution was evenly distributed along the sub-channel from the bottom to the top ofthe model. This is because the flow in forced convection was not greatly affected by thepresence of heat, while the area in the middle of the sub-reed had the smallest shear stressand, therefore, a high velocity.
Fluids 2022, 6, x FOR PEER REVIEW 9 of 18
3.3. Fluid Flow Contour and Distribution of Velocity
Figures 6 and 7 present the contour of fluid flow and the distribution of velocity on
forced convection heat transfer in the sub-channel. Figure 6 illustrates that forced convec-
tion for the laminar flow regime had a more even velocity flow, with the highest average
velocity in the middle of the sub-channel, denoted by a light-blue color (0.108 m/s) com-
pared to a blue color (0.021 m/s). The velocity vector of the fluid flow near the bottom area
of the sub-channel distributor wall is illustrated in Figure 7. The velocity flow distribution
was evenly distributed along the sub-channel from the bottom to the top of the model.
This is because the flow in forced convection was not greatly affected by the presence of
heat, while the area in the middle of the sub-reed had the smallest shear stress and, there-
fore, a high velocity.
Figure 6. Fluid flow contour in sub-channel with cylindrical square array for forced convection.
Figure 7. Velocity distribution on sub-channel with cylindrical longitude arrangement on forced
convection for laminar flow regime under distributor wall.
Figure 6. Fluid flow contour in sub-channel with cylindrical square array for forced convection.
Fluids 2022, 7, 207 9 of 17
Fluids 2022, 6, x FOR PEER REVIEW 9 of 18
3.3. Fluid Flow Contour and Distribution of Velocity
Figures 6 and 7 present the contour of fluid flow and the distribution of velocity on
forced convection heat transfer in the sub-channel. Figure 6 illustrates that forced convec-
tion for the laminar flow regime had a more even velocity flow, with the highest average
velocity in the middle of the sub-channel, denoted by a light-blue color (0.108 m/s) com-
pared to a blue color (0.021 m/s). The velocity vector of the fluid flow near the bottom area
of the sub-channel distributor wall is illustrated in Figure 7. The velocity flow distribution
was evenly distributed along the sub-channel from the bottom to the top of the model.
This is because the flow in forced convection was not greatly affected by the presence of
heat, while the area in the middle of the sub-reed had the smallest shear stress and, there-
fore, a high velocity.
Figure 6. Fluid flow contour in sub-channel with cylindrical square array for forced convection.
Figure 7. Velocity distribution on sub-channel with cylindrical longitude arrangement on forced
convection for laminar flow regime under distributor wall.
Figure 7. Velocity distribution on sub-channel with cylindrical longitude arrangement on forcedconvection for laminar flow regime under distributor wall.
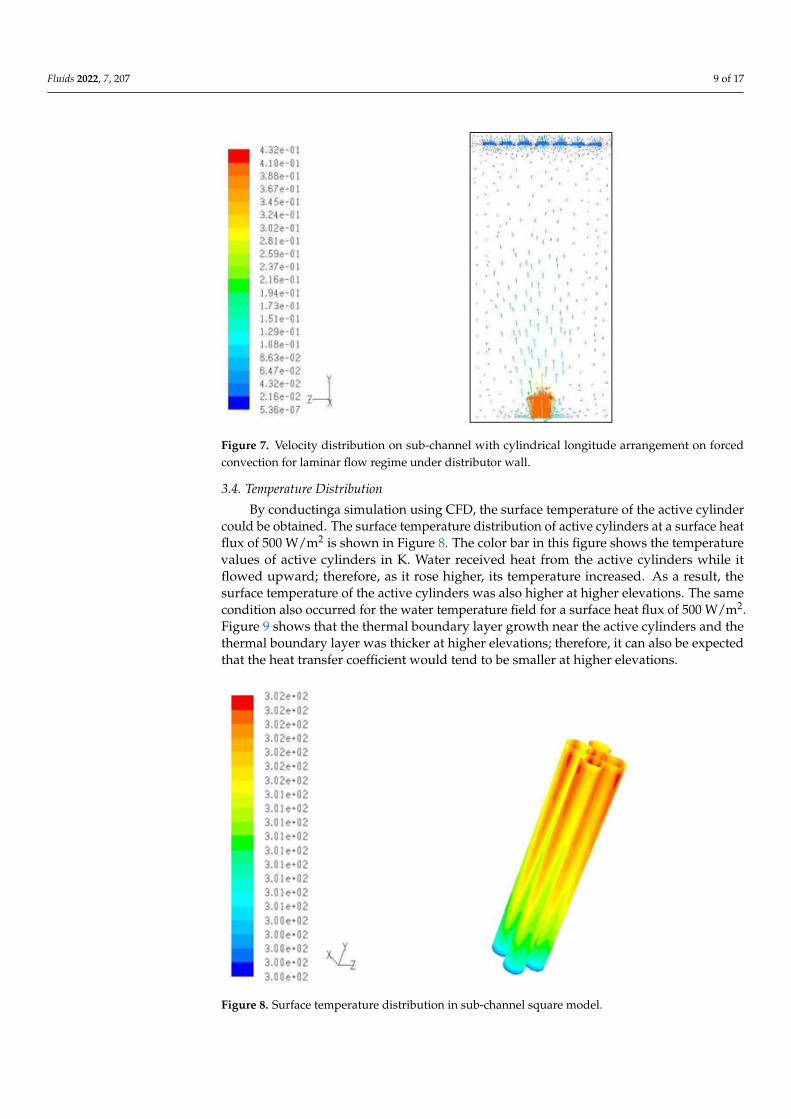
3.4. Temperature Distribution
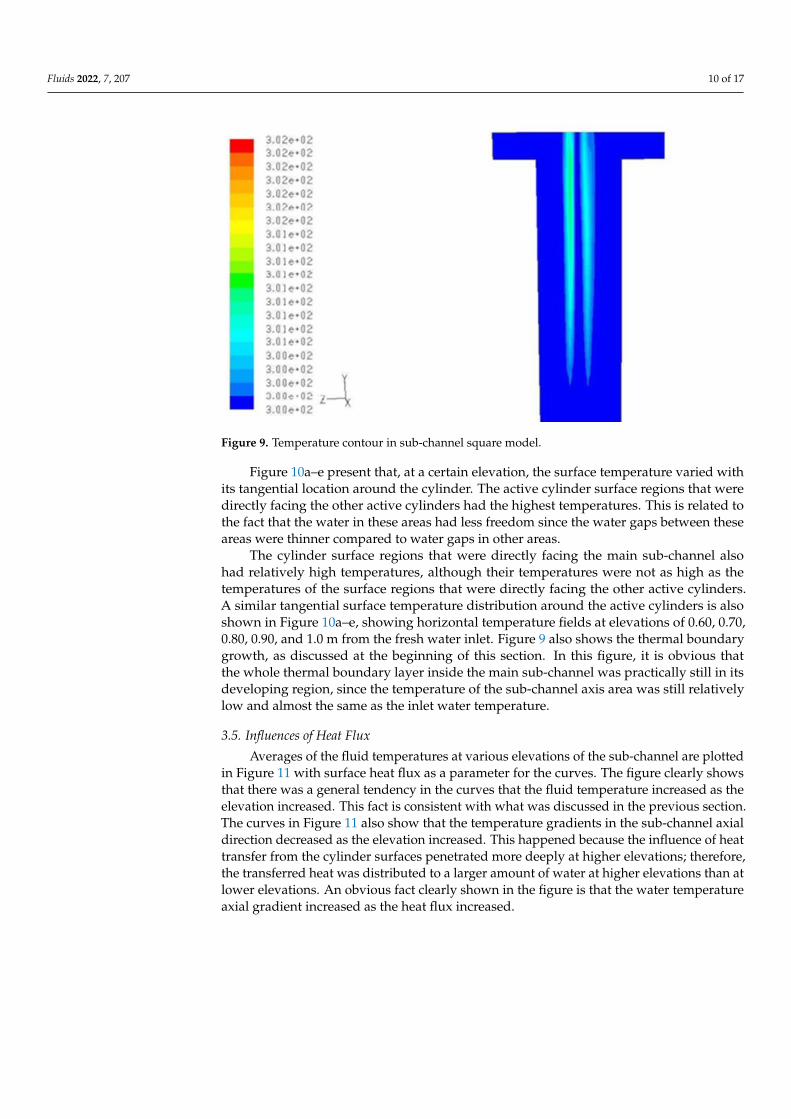
By conductinga simulation using CFD, the surface temperature of the active cylindercould be obtained. The surface temperature distribution of active cylinders at a surface heatflux of 500 W/m2 is shown in Figure 8. The color bar in this figure shows the temperaturevalues of active cylinders in K. Water received heat from the active cylinders while itflowed upward; therefore, as it rose higher, its temperature increased. As a result, thesurface temperature of the active cylinders was also higher at higher elevations. The samecondition also occurred for the water temperature field for a surface heat flux of 500 W/m2.Figure 9 shows that the thermal boundary layer growth near the active cylinders and thethermal boundary layer was thicker at higher elevations; therefore, it can also be expectedthat the heat transfer coefficient would tend to be smaller at higher elevations.
Fluids 2022, 6, x FOR PEER REVIEW 10 of 18
3.4. Temperature Distribution
By conductinga simulation using CFD, the surface temperature of the active cylinder
could be obtained. The surface temperature distribution of active cylinders at a surface
heat flux of 500 W/m2 is shown in Figure 8. The color bar in this figure shows the temper-
ature values of active cylinders in K. Water received heat from the active cylinders while
it flowed upward; therefore, as it rose higher, its temperature increased. As a result, the
surface temperature of the active cylinders was also higher at higher elevations. The same
condition also occurred for the water temperature field for a surface heat flux of 500 W/m2.
Figure 9 shows that the thermal boundary layer growth near the active cylinders and the
thermal boundary layer was thicker at higher elevations; therefore, it can also be expected
that the heat transfer coefficient would tend to be smaller at higher elevations.
Figure 8.Surface temperature distribution in sub-channel square model.
Figure 9. Temperature contour in sub-channel square model.
Figure 8. Surface temperature distribution in sub-channel square model.
Fluids 2022, 7, 207 10 of 17
Fluids 2022, 6, x FOR PEER REVIEW 10 of 18
3.4. Temperature Distribution
By conductinga simulation using CFD, the surface temperature of the active cylinder
could be obtained. The surface temperature distribution of active cylinders at a surface
heat flux of 500 W/m2 is shown in Figure 8. The color bar in this figure shows the temper-
ature values of active cylinders in K. Water received heat from the active cylinders while
it flowed upward; therefore, as it rose higher, its temperature increased. As a result, the
surface temperature of the active cylinders was also higher at higher elevations. The same
condition also occurred for the water temperature field for a surface heat flux of 500 W/m2.
Figure 9 shows that the thermal boundary layer growth near the active cylinders and the
thermal boundary layer was thicker at higher elevations; therefore, it can also be expected
that the heat transfer coefficient would tend to be smaller at higher elevations.
Figure 8.Surface temperature distribution in sub-channel square model.
Figure 9. Temperature contour in sub-channel square model. Figure 9. Temperature contour in sub-channel square model.
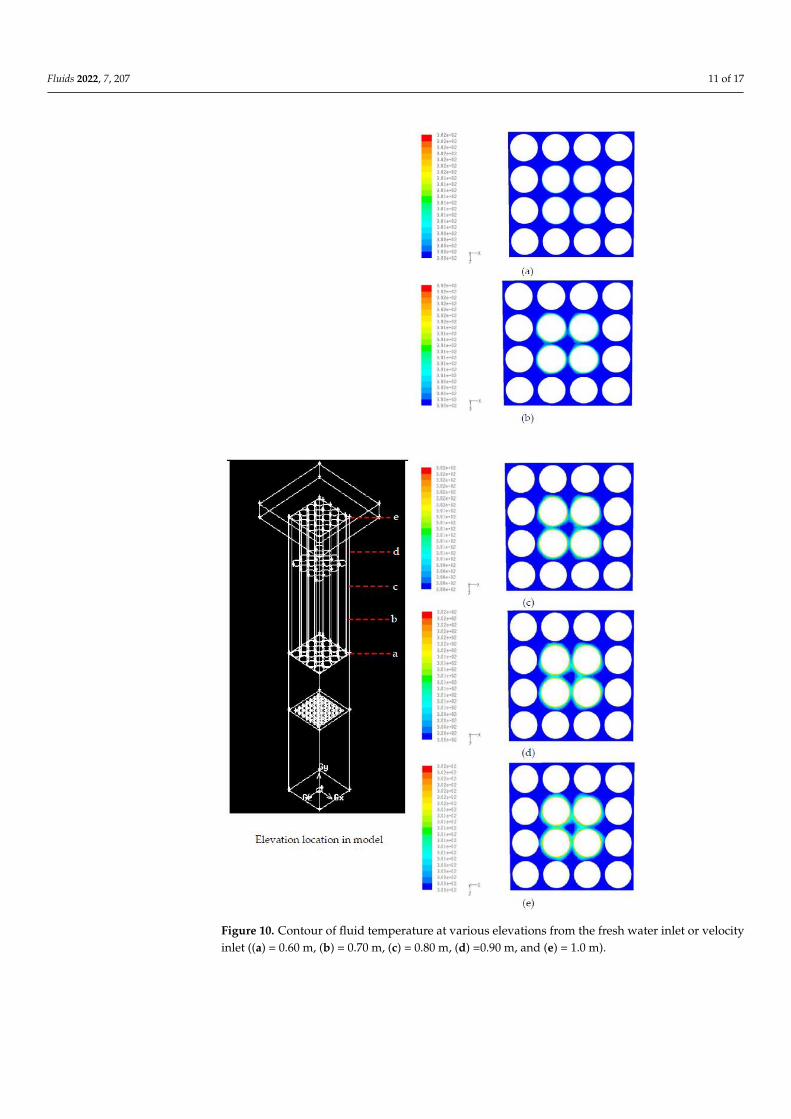
Figure 10a–e present that, at a certain elevation, the surface temperature varied withits tangential location around the cylinder. The active cylinder surface regions that weredirectly facing the other active cylinders had the highest temperatures. This is related tothe fact that the water in these areas had less freedom since the water gaps between theseareas were thinner compared to water gaps in other areas.
The cylinder surface regions that were directly facing the main sub-channel alsohad relatively high temperatures, although their temperatures were not as high as thetemperatures of the surface regions that were directly facing the other active cylinders.A similar tangential surface temperature distribution around the active cylinders is alsoshown in Figure 10a–e, showing horizontal temperature fields at elevations of 0.60, 0.70,0.80, 0.90, and 1.0 m from the fresh water inlet. Figure 9 also shows the thermal boundarygrowth, as discussed at the beginning of this section. In this figure, it is obvious thatthe whole thermal boundary layer inside the main sub-channel was practically still in itsdeveloping region, since the temperature of the sub-channel axis area was still relativelylow and almost the same as the inlet water temperature.
3.5. Influences of Heat Flux
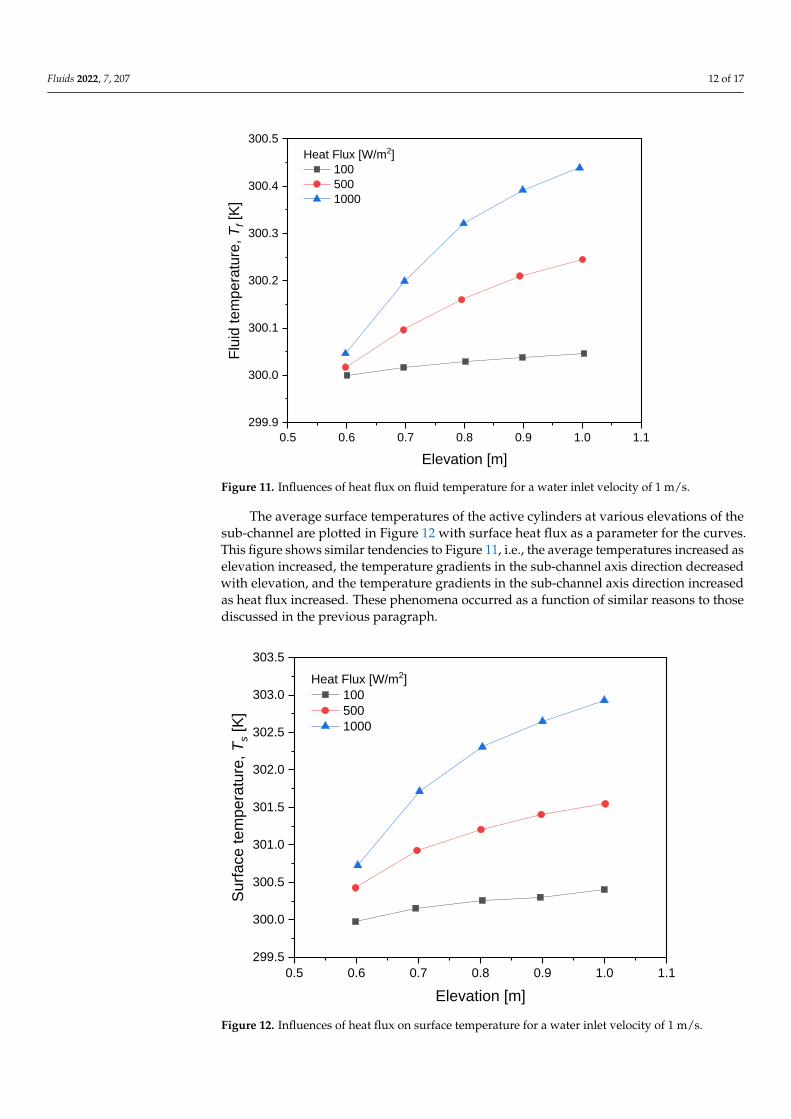
Averages of the fluid temperatures at various elevations of the sub-channel are plottedin Figure 11 with surface heat flux as a parameter for the curves. The figure clearly showsthat there was a general tendency in the curves that the fluid temperature increased as theelevation increased. This fact is consistent with what was discussed in the previous section.The curves in Figure 11 also show that the temperature gradients in the sub-channel axialdirection decreased as the elevation increased. This happened because the influence of heattransfer from the cylinder surfaces penetrated more deeply at higher elevations; therefore,the transferred heat was distributed to a larger amount of water at higher elevations than atlower elevations. An obvious fact clearly shown in the figure is that the water temperatureaxial gradient increased as the heat flux increased.
Fluids 2022, 7, 207 11 of 17
Fluids 2022, 6, x FOR PEER REVIEW 11 of 18
Figure 10a–e present that, at a certain elevation, the surface temperature varied with
its tangential location around the cylinder. The active cylinder surface regions that were
directly facing the other active cylinders had the highest temperatures. This is related to
the fact that the water in these areas had less freedom since the water gaps between these
areas were thinner compared to water gaps in other areas.
Figure 10. Contour of fluid temperature at various elevations from the fresh water inlet or velocity
inlet ((a) = 0.60 m, (b) = 0.70 m, (c) = 0.80 m, (d) =0.90 m, and (e) = 1.0 m).
Figure 10. Contour of fluid temperature at various elevations from the fresh water inlet or velocityinlet ((a) = 0.60 m, (b) = 0.70 m, (c) = 0.80 m, (d) =0.90 m, and (e) = 1.0 m).
Fluids 2022, 7, 207 12 of 17
Fluids 2022, 6, x FOR PEER REVIEW 12 of 18
The cylinder surface regions that were directly facing the main sub-channel also had
relatively high temperatures, although their temperatures were not as high as the temper-
atures of the surface regions that were directly facing the other active cylinders. A similar
tangential surface temperature distribution around the active cylinders is also shown in
Figure 10a–e, showing horizontal temperature fields at elevations of 0.60, 0.70, 0.80, 0.90,
and 1.0 m from the fresh water inlet. Figure 9 also shows the thermal boundary growth,
as discussed at the beginning of this section. In this figure, it is obvious that the whole
thermal boundary layer inside the main sub-channel was practically still in its developing
region, since the temperature of the sub-channel axis area was still relatively low and al-
most the same as the inlet water temperature.
3.5. Influences of Heat Flux
Averages of the fluid temperatures at various elevations of the sub-channel are plot-
ted in Figure 11 with surface heat flux as a parameter for the curves. The figure clearly
shows that there was a general tendency in the curves that the fluid temperature increased
as the elevation increased. This fact is consistent with what was discussed in the previous
section. The curves in Figure 11 also show that the temperature gradients in the sub-chan-
nel axial direction decreased as the elevation increased. This happened because the influ-
ence of heat transfer from the cylinder surfaces penetrated more deeply at higher eleva-
tions; therefore, the transferred heat was distributed to a larger amount of water at higher
elevations than at lower elevations. An obvious fact clearly shown in the figure is that the
water temperature axial gradient increased as the heat flux increased.
0.5 0.6 0.7 0.8 0.9 1.0 1.1
299.9
300.0
300.1
300.2
300.3
300.4
300.5
Flu
id t
em
pe
ratu
re, T
f [K
]
Elevation [m]
Heat Flux [W/m2]
100
500
1000
Figure 11. Influences of heat flux on fluid temperature for a water inlet velocity of 1 m/s.
The average surface temperatures of the active cylinders at various elevations of the
sub-channel are plotted in Figure 12 with surface heat flux as a parameter for the curves.
This figure shows similar tendencies to Figure 11, i.e., the average temperatures increased
as elevation increased, the temperature gradients in the sub-channel axis direction de-
creased with elevation, and the temperature gradients in the sub-channel axis direction
increased as heat flux increased. These phenomena occurred as a function of similar rea-
sons to those discussed in the previous paragraph.
Figure 11. Influences of heat flux on fluid temperature for a water inlet velocity of 1 m/s.
The average surface temperatures of the active cylinders at various elevations of thesub-channel are plotted in Figure 12 with surface heat flux as a parameter for the curves.This figure shows similar tendencies to Figure 11, i.e., the average temperatures increased aselevation increased, the temperature gradients in the sub-channel axis direction decreasedwith elevation, and the temperature gradients in the sub-channel axis direction increasedas heat flux increased. These phenomena occurred as a function of similar reasons to thosediscussed in the previous paragraph.
Fluids 2022, 6, x FOR PEER REVIEW 13 of 18
0.5 0.6 0.7 0.8 0.9 1.0 1.1
299.5
300.0
300.5
301.0
301.5
302.0
302.5
303.0
303.5
Heat Flux [W/m2]
100
500
1000
Surf
ace tem
pera
ture
, T
s [K
]
Elevation [m]
Figure 12. Influences of heat flux on surface temperature for a water inlet velocity of 1 m/s.
3.6. Heat Transfer Coefficient
Figure 13 presents the heat transfer coefficient (h) on a laminar flow regime with a
Reynolds number range of 400 ≤ Re ≤ 1700. The large variation or difference in heat trans-
fer coefficient at various positions was very large. Thus, for laminar flow, the heat transfer
coefficient used to determine correlation was the local heat transfer coefficient. With the
temperature difference still increasing as the altitude increased, the heat transfer coeffi-
cient also continued to decrease as the altitude increased, as shown in Figure 13. This is
one indication that this test range was still in the developing flow region and was not fully
developed thermally. Figure 14 illustrates the Nusselt Number (Nu) plotted against alti-
tude. In the figure, it appears that the Nusselt number (Nu) still tended to decrease with
increasing altitudes; therefore, it can be concluded that the flow was indeed still growing
and not yet fully developed.
Figure 12. Influences of heat flux on surface temperature for a water inlet velocity of 1 m/s.
Fluids 2022, 7, 207 13 of 17
3.6. Heat Transfer Coefficient
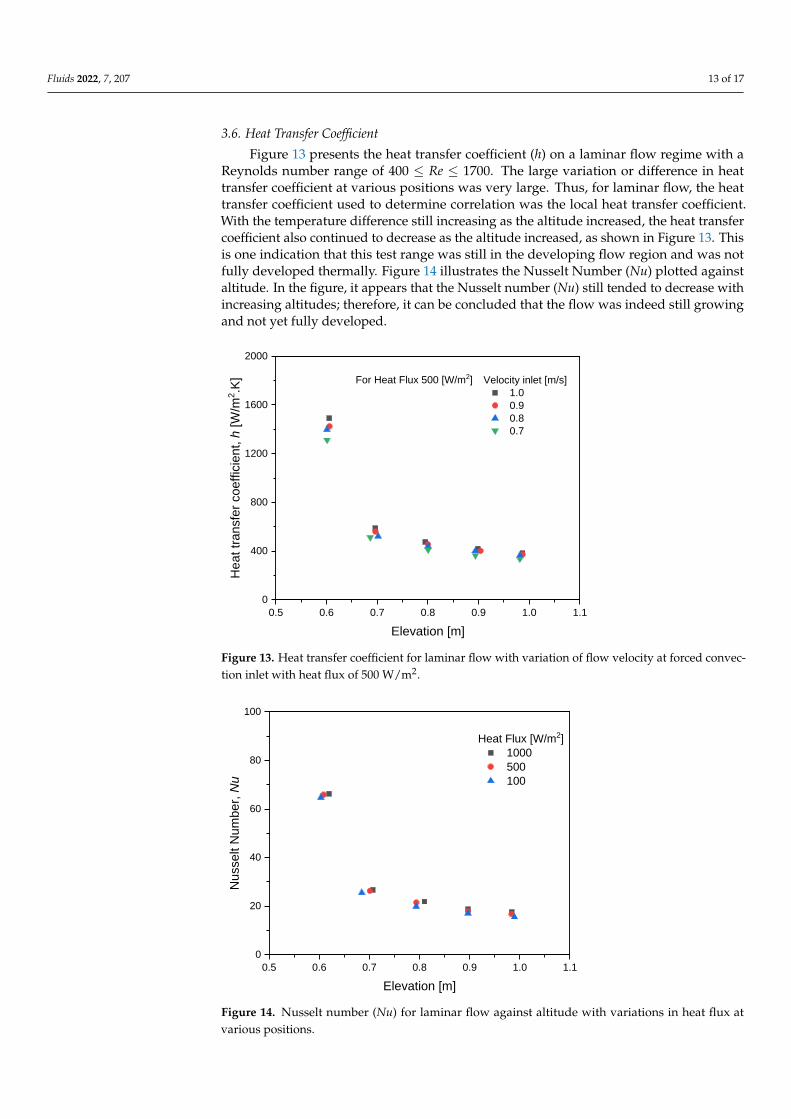
Figure 13 presents the heat transfer coefficient (h) on a laminar flow regime with aReynolds number range of 400 ≤ Re ≤ 1700. The large variation or difference in heattransfer coefficient at various positions was very large. Thus, for laminar flow, the heattransfer coefficient used to determine correlation was the local heat transfer coefficient.With the temperature difference still increasing as the altitude increased, the heat transfercoefficient also continued to decrease as the altitude increased, as shown in Figure 13. Thisis one indication that this test range was still in the developing flow region and was notfully developed thermally. Figure 14 illustrates the Nusselt Number (Nu) plotted againstaltitude. In the figure, it appears that the Nusselt number (Nu) still tended to decrease withincreasing altitudes; therefore, it can be concluded that the flow was indeed still growingand not yet fully developed.
Fluids 2022, 6, x FOR PEER REVIEW 14 of 18
0.5 0.6 0.7 0.8 0.9 1.0 1.1
0
400
800
1200
1600
2000
For Heat Flux 500 [W/m2]
He
at tr
ansfe
r co
eff
icie
nt,
h [
W/m
2.K
]
Elevation [m]
Velocity inlet [m/s]
1.0
0.9
0.8
0.7
Figure 13. Heat transfer coefficient for laminar flow with variation of flow velocity at forced con-
vection inlet with heat flux of 500 W/m2.
0.5 0.6 0.7 0.8 0.9 1.0 1.1
0
20
40
60
80
100
Nusselt N
um
ber,
Nu
Elevation [m]
Heat Flux [W/m2]
1000
500
100
Figure 14. Nusselt number (Nu) for laminar flow against altitude with variations in heat flux at
various positions.
Figure 13. Heat transfer coefficient for laminar flow with variation of flow velocity at forced convec-tion inlet with heat flux of 500 W/m2.
Fluids 2022, 6, x FOR PEER REVIEW 14 of 18
0.5 0.6 0.7 0.8 0.9 1.0 1.1
0
400
800
1200
1600
2000
For Heat Flux 500 [W/m2]
He
at tr
ansfe
r co
eff
icie
nt,
h [
W/m
2.K
]
Elevation [m]
Velocity inlet [m/s]
1.0
0.9
0.8
0.7
Figure 13. Heat transfer coefficient for laminar flow with variation of flow velocity at forced con-
vection inlet with heat flux of 500 W/m2.
0.5 0.6 0.7 0.8 0.9 1.0 1.1
0
20
40
60
80
100
Nusselt N
um
ber,
Nu
Elevation [m]
Heat Flux [W/m2]
1000
500
100
Figure 14. Nusselt number (Nu) for laminar flow against altitude with variations in heat flux at
various positions.
Figure 14. Nusselt number (Nu) for laminar flow against altitude with variations in heat flux atvarious positions.
Fluids 2022, 7, 207 14 of 17
3.7. Development of Forced Convective Heat Transfer Correlation
The local heat transfer coefficient on the active cylinder surface can be calculated byusing Equation (1). The value of heat flux is given as one of simulation inputs, the valuesof surface and fluid temperatures at any observed elevation can be retrieved from the CFDpackage. Therefore, the local heat transfer coefficient can be calculated. After calculatingthe local heat transfer coefficients at several elevations, the average heat transfer coefficientcan be numerically calculated by using the following equation:
h =
∫hdAs∫dAs
≈ ∑ hAi
∑ hAi(14)
where As is surface area, and Ai is surface area of the i-the integration.
3.7.1. Physical Properties and Nusselt Number (Nu)
The bulk average temperature of the fluid can be represented by the mass flowweighted temperature average in the water square sub-channel, which can be retrievedfrom CFD software. If the fluid bulk temperature of the sub-channel is known, then allnecessary fluid physical properties, such as thermal conductivity (k), dynamic viscosity (µ),kinematic viscosity (ν), and mass density (ρ) can be evaluated. Then, the Nusselt numbercan be calculated using its definition,
Nu =h.Dh
k, (15)
where Dh is the hydrodynamic diameter of the sub-channel.
3.7.2. Graetz Number (Gz)
The Graetz number (Gz) of the fluid flow inside the sub-channel is defined by thefollowing equation:
Gz = Re Pr(
Dhx
)(16)
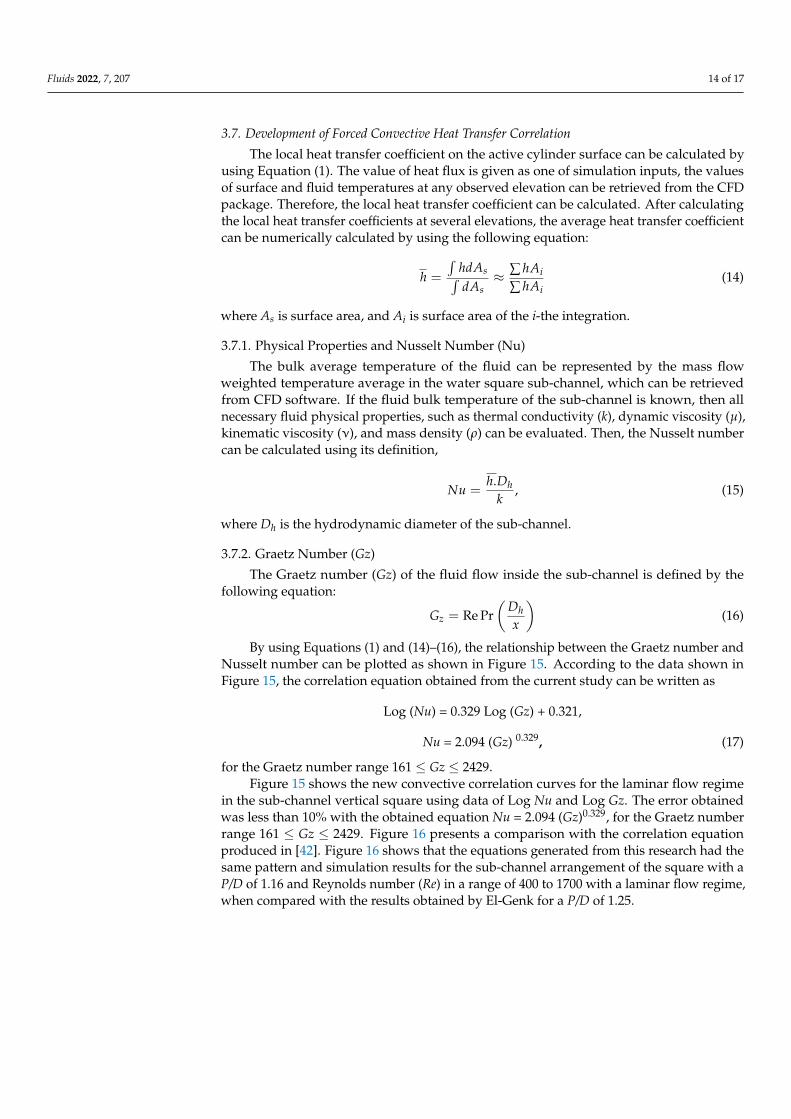
By using Equations (1) and (14)–(16), the relationship between the Graetz number andNusselt number can be plotted as shown in Figure 15. According to the data shown inFigure 15, the correlation equation obtained from the current study can be written as
Log (Nu) = 0.329 Log (Gz) + 0.321,
Nu = 2.094 (Gz) 0.329, (17)
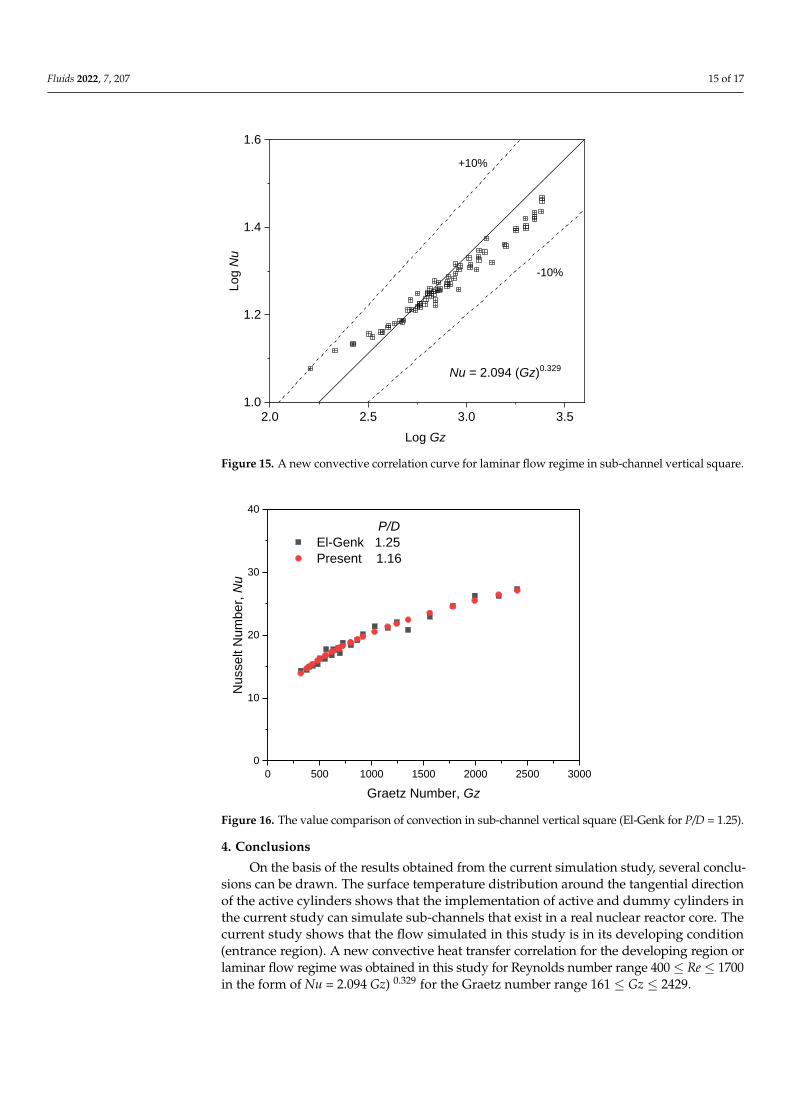
for the Graetz number range 161 ≤ Gz ≤ 2429.Figure 15 shows the new convective correlation curves for the laminar flow regime
in the sub-channel vertical square using data of Log Nu and Log Gz. The error obtainedwas less than 10% with the obtained equation Nu = 2.094 (Gz)0.329, for the Graetz numberrange 161 ≤ Gz ≤ 2429. Figure 16 presents a comparison with the correlation equationproduced in [42]. Figure 16 shows that the equations generated from this research had thesame pattern and simulation results for the sub-channel arrangement of the square with aP/D of 1.16 and Reynolds number (Re) in a range of 400 to 1700 with a laminar flow regime,when compared with the results obtained by El-Genk for a P/D of 1.25.
Fluids 2022, 7, 207 15 of 17Fluids 2022, 6, x FOR PEER REVIEW 16 of 18
2.0 2.5 3.0 3.51.0
1.2
1.4
1.6
Nu = 2.094 (Gz)0.329
-10%
+10%
Lo
g N
u
Log Gz
Figure 15. A new convective correlation curve for laminar flow regime in sub-channel vertical
square.
Figure 15 shows the new convective correlation curves for the laminar flow regime
in the sub-channel vertical square using data of Log Nu and Log Gz. The error obtained
was less than 10% with the obtained equation Nu = 2.094 (Gz)0.329, for the Graetz number
range 161 ≤ Gz ≤ 2429. Figure 16 presents a comparison with the correlation equation pro-
duced in [42]. Figure 16 shows that the equations generated from this research had the
same pattern and simulation results for the sub-channel arrangement of the square with
a P/D of 1.16 and Reynolds number (Re) in a range of 400 to 1700 with a laminar flow
regime, when compared with the results obtained by El-Genk for a P/D of 1.25.
0 500 1000 1500 2000 2500 3000
0
10
20
30
40
Nusselt N
um
ber,
Nu
Graetz Number, Gz
P/D
El-Genk 1.25
Present 1.16
Figure 16. The value comparison of convection in sub-channel vertical square (El-Genk for P/D =
1.25).
Figure 15. A new convective correlation curve for laminar flow regime in sub-channel vertical square.
Fluids 2022, 6, x FOR PEER REVIEW 16 of 18
2.0 2.5 3.0 3.51.0
1.2
1.4
1.6
Nu = 2.094 (Gz)0.329
-10%
+10%
Lo
g N
u
Log Gz
Figure 15. A new convective correlation curve for laminar flow regime in sub-channel vertical
square.
Figure 15 shows the new convective correlation curves for the laminar flow regime
in the sub-channel vertical square using data of Log Nu and Log Gz. The error obtained
was less than 10% with the obtained equation Nu = 2.094 (Gz)0.329, for the Graetz number
range 161 ≤ Gz ≤ 2429. Figure 16 presents a comparison with the correlation equation pro-
duced in [42]. Figure 16 shows that the equations generated from this research had the
same pattern and simulation results for the sub-channel arrangement of the square with
a P/D of 1.16 and Reynolds number (Re) in a range of 400 to 1700 with a laminar flow
regime, when compared with the results obtained by El-Genk for a P/D of 1.25.
0 500 1000 1500 2000 2500 3000
0
10
20
30
40
Nusselt N
um
ber,
Nu
Graetz Number, Gz
P/D
El-Genk 1.25
Present 1.16
Figure 16. The value comparison of convection in sub-channel vertical square (El-Genk for P/D =
1.25).
Figure 16. The value comparison of convection in sub-channel vertical square (El-Genk for P/D = 1.25).
4. Conclusions
On the basis of the results obtained from the current simulation study, several conclu-sions can be drawn. The surface temperature distribution around the tangential directionof the active cylinders shows that the implementation of active and dummy cylinders inthe current study can simulate sub-channels that exist in a real nuclear reactor core. Thecurrent study shows that the flow simulated in this study is in its developing condition(entrance region). A new convective heat transfer correlation for the developing region orlaminar flow regime was obtained in this study for Reynolds number range 400 ≤ Re ≤ 1700in the form of Nu = 2.094 Gz) 0.329 for the Graetz number range 161 ≤ Gz ≤ 2429.
Fluids 2022, 7, 207 16 of 17
Author Contributions: E.U., N.P.T., A.C.S., A.I.R. and J.H.P. contributed equally to this paper (themain contributor). Conceptualization and methodology, E.U. and N.P.T.; software, A.C.S. and A.I.R.;validation, E.U. and N.P.T.; formal analysis, J.H.P.; investigation, A.C.S. and A.I.R.; resources, E.U.;data curation, A.C.S.; writing—original draft preparation, E.U. and J.H.P.; writing—review andediting, E.U. and A.I.R.; visualization, N.P.T.; supervision, E.U.; project administration, J.H.P.; fundingacquisition, J.H.P. All authors have read and agreed to the published version of the manuscript.
Funding: This research was funded by the LPDP and the Ministry of Research and Technology ofIndonesia under contract number 05/E1/III/PRN/2020.
Data Availability Statement: Not applicable.
Acknowledgments: The authors would like to thank the LPDP and the Ministry of Research andTechnology of Indonesia for funding this study under contract number 05/E1/III/PRN/2020.
Conflicts of Interest: The authors declare no conflict of interest.
References1. Todreas, N.E.; Kazimi, M.S. Nuclear System I; Taylor and Francis Publishers: New York, NY, USA, 1993.2. Kreith, F.; Manglik, R.M.; Bohn, M.S. Principles of Heat Transfer, 7th ed.; CENGAGE Learning, Inc.: Stamford, CT, USA, 2011.3. Holman, J.P. Heat Transfer, 10th ed.; McGraw-Hill Education: New York, NY, USA, 2009.4. Oosthuizen, P.H.; David, N. Introduction to Convective Heat Transfer Analysis; McGraw Hill: New York, NY, USA, 1999.5. Gkounta, A.A.; Benos, L.T.; Sofiadis, G.N.; Sarris, I.E. A printed-circuit heat exchanger consideration by exploiting an Al2O3-water
nanofluid: Effect of the nanoparticles interfacial layer on heat transfer. Therm. Sci. Eng. Progress 2021, 22, 100818. [CrossRef]6. Chauhan, A.K.; Prasad, B.V.S.S.S.; Patnaik, B.S.V. Thermal hydraulics of rod bundles: The effect of eccentricity. Nucl. Eng. Des.
2013, 263, 218–240.7. Jensen, R.T.; Newel, D.L. Thermal Hydraulic Calculations to Support to Support Increase in Operating power in Mc. Clellen Nuclear
Radiation Center (MNRC) TRIGA Reactor; The 1998 RELAP5 International User’s Seminar: College Station, TX, USA, 17–22 May 1998.8. Marcum, W.R.; Woods, B.G.; Hartman, M.R.; Reese, S.R.; Palmer, T.S.; Keller, S.T. Steady state thermal-hydraulic analysis of the
Oregon State University TRIGA reactor using RELAP5-3D. Nucl. Sci. Eng. 2009, 162, 261–274. [CrossRef]9. Reis, P.A.; Costa, A.L.; Pereira, C.; Veloso, M.F.; Mesquita, A.Z.; Soares, H.V.; Barros, G.P. Assessment of a RELAP5 model for the
IPR-R1 TRIGA research reactor. Ann. Nucl. Energy 2010, 37, 1341–1350. [CrossRef]10. Huda, M.Q.; Bhuiyan, S.I. Investigation of thermo-hydraulic parameters during natural convection cooling of TRIGA reactor.
Annu. Nucl. Energy 2006, 33, 1079–1086. [CrossRef]11. Waluyo, A.; Tandian, N.P.; Umar, E. Studi perpindahan panas konveksi pada susunan silinder vertikal dalam reaktor nuklir
atau penukar panas menggunakan program CFD. In Proceedings of the Prosiding Seminar Nasional Sains dan TeknologiNuklirPTNBR, Bandung, Indonesia, 3 June 2009.
12. Ramadhan, A.I.; Umar, E.; Tandian, N.P.; Suwono, A. Comparative analysis of preliminary design core of TRIGA Bandung usingfuel element plate MTR in Indonesia. AIP Conf. Proc. 2017, 1799, 030007.
13. Umar, E.; Kamajaya, K.; Tandian, N.P.; Hardianto, T.; Suwono, A. An experimental study of natural convection in the hot-testchannel of TRIGA 2000 kW. In Proceedings of the Pacific Basin Nuclear Conference, Australian Nuclear Association, Sydney,Australia, 15–20 October 2006.
14. Umar, E. Prediction of mass flow rate and pressure drop in the coolant channel of the TRIGA 2000 reactor core. At. Indones. 2001,27, 67–84.
15. Umar, E.; Kamajaya, K.; Ramadhan, A.I. Evaluation of the pump capability of the primary cooling of TRIGA 2000 research reactor.J. Phys. Conf. Ser. 2020, 1493, 012018. [CrossRef]
16. Petersen, J.F. Manual of STAT-A Fortran Program for calculating the natural convection heat transfer—fluid flow in an array ofheated cylinders, General Atomic. 1989.
17. Basuki, P.; Umar, E. Thermal hydraulic analysis of the Bandung TRIGA 2000 research reactor. In Proceedings of the 12thInternational Conference on Thermo-Fluids, Yogyakarta, Indonesia, 18 September 2021.
18. Sohag, F.A.; Mohanta, L.; Cheung, F. CFD analyses of mixed and forced convection in a heated vertical rod bundle. Appl. Therm.Eng. 2017, 117, 85–93. [CrossRef]
19. Chen, G.; Zhang, Z.; Tian, Z.; Appah, T. Research on the Sub-channel analysis method via CFD analysis for PWR. Nucl. Sci. Eng.2017, 188, 270–281. [CrossRef]
20. Saha, P.; Aksan, N.; Andersen, J.; Yan, J.; Simoneau, J.P.; Leung, L.; Bertrand, F.; Aoto, K.; Kamide, H. Issues and future directionof thermal-hydraulics research and development in nuclear power reactors. Nucl. Eng. Des. 2013, 264, 3–23. [CrossRef]
21. Ferziger, J.H.; Peric, M. Computational Methods for Fluid Dynamics; Springer: Berlin, Germany, 2002.22. Henry, R.; Tiselj, I.; Matkovic, M. Natural and mixed convection in the cylindrical pool of TRIGA reactor. Heat Mass Transf. 2017,
53, 537–551. [CrossRef]23. Fiantini, R.; Umar, E. Fluid flow characteristics simulation on the original TRIGA 2000 reactor core design using computational
fluid dynamics code. AIP Conf. Proc. 2010, 1244, 215–223.
Fluids 2022, 7, 207 17 of 17
24. Umar, E.; Fiantini, R. Modification of the core cooling system of TRIGA 2000 reactor. AIP Conf. Proc. 2010, 1244, 224–231.25. Sarris, I.E.; Tsiakaras, P.; Song, S.; Vlachos, N. A three-dimensional CFD model of direct ethanol fuel cells: Anode flow bed
analysis. Solis State Ion. 2006, 177, 2133–2213. [CrossRef]26. El-Genk, M.; Su, B.; Zhanxiong, G. Experimental studies of forced, combined and natural convection of water in vertical nine-rod
bundles with a square lattice. Int. J. Heat Mass Transf. 1993, 36, 2359–2374. [CrossRef]27. Tandian, N.P.; Umar, E.; Hardianto, T.; Febriyanto, C. Experimental study of natural convective heat transfer in a vertical
hexagonal sub channel. AIP Conf. Proc. 2012, 1448, 252–260.28. Mohanta, L.; Cheung, F.; Hoxie, C.L. Experimental study of laminar mixed convection in a rod bundle with mixing vane spacer
grids. Nucl. Eng. Des. 2017, 312, 99–105. [CrossRef]29. Ramadhan, A.I.; Suwono, A.; Umar, E.; Tandian, N.P. Preliminary study for design core of nuclear research reactor of TRIGA
Bandung using fuel element plate MTR. Eng. J. 2017, 21, 173–181. [CrossRef]30. Li, J.; Xiao, Y.; Zhang, Q. Development of a correlation for mixed convection heat transfer in rod bundles. Ann. Nucl. Energy 2021,
155, 108151. [CrossRef]31. Liu, D.; Gu, H. Mixed convection heat transfer in a 5 × 5 rod bundles. Int. J. Heat Mass Transf. 2017, 113, 914–921. [CrossRef]32. Liu, B.; He, S.; Moulinec, C.; Uribe, J. Sub-Channel CFD for nuclear fuel bundles. Nucl. Eng. Des. 2019, 355, 110318. [CrossRef]33. Ramadhan, A.I.; Lasman, A.N.; Septilarso, A. Correlation equations of heat transfer in nanofluid Al2O3-water as cooling fluid in
a rectangular sub channel based CFD code. Int. J. Sci. Eng. 2015, 8, 120–124.34. Shamim, J.A.; Bhowmik, P.K.; Xiangyi, C.; Suh, K.Y. A new correlation for convective heat transfer coefficient of water–alumina
nanofluid in a square array sub channel under PWR condition. Nucl. Eng. Des. 2016, 308, 194–204. [CrossRef]35. Debrah, S.K.; Shitsi, E.; Chabi, S.; Sahebi, N. Assessment of heat transfer correlations in the sub-channels of proposed rod bundle
geometry for supercritical water reactor. Heliyon 2019, 5, e02927. [CrossRef] [PubMed]36. Chen, S.; Liu, D.; Liu, M.; Xiao, Y.; Gu, H. Numerical simulation and analysis of flow and heat transfer in a 5 × 5 vertical rod
bundle with buoyancy effects. Appl. Therm. Eng. 2019, 163, 114221. [CrossRef]37. Qiu, Q.; Du, X.; Zhao, S.; Zhu, X.; Shen, S. Numerical study on heat transfer of SCW near the pseudo-critical temperature in a
hexagon sub-channel. Nucl. Eng. Des. 2018, 331, 263–273. [CrossRef]38. Gu, H.Y.; Hu, Z.X.; Liu, D.; Li, H.B.; Zhao, M.; Cheng, X. Experimental study on heat transfer to supercritical water in 2 × 2 rod
bundle with wire wraps. Exp. Therm. Fluid Sci. 2016, 70, 17–28. [CrossRef]39. Chen, J.; Gu, H.; Xiong, Z. A circumferentially non-uniform heat transfer model for sub channel analysis of tight rod bundles.
Ann. Nucl. Energy 2018, 121, 50–61. [CrossRef]40. Dittus, W.; Boelter, L.M.K. Heat Transfer in Automobile Radiators of the Turbular Type. Int. Commun. Heat Mass Transf. 1985, 12,
3–22. [CrossRef]41. Kamajaya, K.; Hasanah, A.; Pane, J.S. Forced convection heat transfer studies on Al2O3-water nano-fluids in a vertical sub-
channels. AIP Conf. Proceeding 2018, 1488, 261–269.42. El-Genk, M.; Bedrose, S.D.; Rao, D. Forced and combined convection of water in rod bundles. Heat Transf. Eng. 1990, 11, 32–43.
[CrossRef]
Related Documents