R. Larsen, M. Nielsen, and J. Sporring (Eds.): MICCAI 2006, LNCS 4191, pp. 438 – 445, 2006. © Springer-Verlag Berlin Heidelberg 2006 CFD Analysis Incorporating the Influence of Wall Motion: Application to Intracranial Aneurysms Laura Dempere-Marco 1 , Estanislao Oubel 1 , Marcelo Castro 2 , Christopher Putman 3 , Alejandro Frangi 1 , and Juan Cebral 2 1 Department of Technology, Pompeu Fabra University, 08003 Barcelona, Spain {laura.dempere, estanislao.oubel, alejandro.frangi}@upf.edu 2 School of Computational Sciences, George Mason University, 22030 Fairfax, USA {mcastro3, jcebral}@gmu.edu 3 Interventional Neuroradiology, Inova Fairfax Hospital, 22042 Falls Church, USA [email protected] Abstract. Haemodynamics, and in particular wall shear stress, is thought to play a critical role in the progression and rupture of intracranial aneurysms. A novel method is presented that combines image-based wall motion estimation obtained through non-rigid registration with computational fluid dynamics (CFD) simulations in order to provide realistic intra-aneurysmal flow patterns and understand the effects of deforming walls on the haemodynamic patterns. In contrast to previous approaches, which assume rigid walls or ad hoc elastic parameters to perform the CFD simulations, wall compliance has been included in this study through the imposition of measured wall motions. This circum- vents the difficulties in estimating personalized elasticity properties. Although variations in the aneurysmal haemodynamics were observed when incorporat- ing the wall motion, the overall characteristics of the wall shear stress distribu- tion do not seem to change considerably. Further experiments with more cases will be required to establish the clinical significance of the observed variations. 1 Introduction Intracranial aneurysms are pathological dilatations of cerebral arteries, which tend to occur at or near arterial bifurcations, mostly in the circle of Willis. The optimal man- agement of unruptured aneurysms is controversial and current decision-making is mainly based on considering their size and location, as derived from the International Study of Unruptured Intracranial Aneurysms (ISUIA) [1]. However, it is thought that the interaction between haemodynamics and wall mechanics plays a critical role in the formation, growth and rupture of aneurysms. Although there is little doubt that arterial and aneurysmal walls do move under the physiologic pulsatile flow conditions [2], there is no accurate information on the magnitude and other motion characteris- tics required for understanding the interaction between the haemodynamics and the wall biomechanics. Visualization of aneurysmal pulsation seems to have become possible with the advent of 4DCTA imaging techniques [3,4]. Confounding these observations, a number of imaging artifacts were present related to motion of bony

Welcome message from author
This document is posted to help you gain knowledge. Please leave a comment to let me know what you think about it! Share it to your friends and learn new things together.
Transcript
R. Larsen, M. Nielsen, and J. Sporring (Eds.): MICCAI 2006, LNCS 4191, pp. 438 – 445, 2006. © Springer-Verlag Berlin Heidelberg 2006
CFD Analysis Incorporating the Influence of Wall Motion: Application to Intracranial Aneurysms
Laura Dempere-Marco1, Estanislao Oubel1, Marcelo Castro2, Christopher Putman3, Alejandro Frangi1, and Juan Cebral2
1 Department of Technology, Pompeu Fabra University, 08003 Barcelona, Spain {laura.dempere, estanislao.oubel,
alejandro.frangi}@upf.edu 2 School of Computational Sciences, George Mason University, 22030 Fairfax, USA
{mcastro3, jcebral}@gmu.edu 3 Interventional Neuroradiology, Inova Fairfax Hospital, 22042 Falls Church, USA
Abstract. Haemodynamics, and in particular wall shear stress, is thought to play a critical role in the progression and rupture of intracranial aneurysms. A novel method is presented that combines image-based wall motion estimation obtained through non-rigid registration with computational fluid dynamics (CFD) simulations in order to provide realistic intra-aneurysmal flow patterns and understand the effects of deforming walls on the haemodynamic patterns. In contrast to previous approaches, which assume rigid walls or ad hoc elastic parameters to perform the CFD simulations, wall compliance has been included in this study through the imposition of measured wall motions. This circum-vents the difficulties in estimating personalized elasticity properties. Although variations in the aneurysmal haemodynamics were observed when incorporat-ing the wall motion, the overall characteristics of the wall shear stress distribu-tion do not seem to change considerably. Further experiments with more cases will be required to establish the clinical significance of the observed variations.
1 Introduction
Intracranial aneurysms are pathological dilatations of cerebral arteries, which tend to occur at or near arterial bifurcations, mostly in the circle of Willis. The optimal man-agement of unruptured aneurysms is controversial and current decision-making is mainly based on considering their size and location, as derived from the International Study of Unruptured Intracranial Aneurysms (ISUIA) [1]. However, it is thought that the interaction between haemodynamics and wall mechanics plays a critical role in the formation, growth and rupture of aneurysms. Although there is little doubt that arterial and aneurysmal walls do move under the physiologic pulsatile flow conditions [2], there is no accurate information on the magnitude and other motion characteris-tics required for understanding the interaction between the haemodynamics and the wall biomechanics. Visualization of aneurysmal pulsation seems to have become possible with the advent of 4DCTA imaging techniques [3,4]. Confounding these observations, a number of imaging artifacts were present related to motion of bony
CFD Analysis Incorporating the Influence of Wall Motion 439
structures [3]. Since there are no reliable techniques for measuring flow patterns in vivo, various modeling approaches were considered in the past [5,6]. Hitherto, most computational fluid dynamics (CFD) methods assume rigid walls due to a lack of information regarding both wall elasticity and thickness. Moreover, in order to per-form simulations that account for the fluid-structure interaction, it is also necessary to prescribe the intra-arterial pressure waveform, which is not normally acquired during routine clinical exams. In this paper, wall motion is quantified by applying image registration techniques to dynamic X-ray images. To study the effects of wall compli-ance on the aneurysmal haemodynamics, the obtained wall motion is directly imposed to the 3D model derived from the medical images.
2 Wall Motion Estimation Through Image Registration
Three case studies have been considered in this paper. Each patient underwent con-ventional transfemoral catheterization and cerebral angiography using a Philips In-tegris Biplane angiography unit. As part of this examination, a rotational acquisition was performed using a six seconds constant injection of contrast agent and a 180 degrees rotation at 15 frames per second over 8 seconds. These images were trans-ferred to the Philips Integris Workstation and reconstructed into 3D voxel data using the standard proprietary software, which was used for generating a 3D anatomical model. Biplanar dynamic angiogram at 2 Hz was subsequently performed using a six second contrast injection for a period of at least 6 seconds. In addition, an expert neu-roradiologist (CP) measured the diameters D1 and D2 (maximum height and width, respectively) on these projection views. This information was then used to establish the pixel size and to quantify the wall motion.
In order to estimate the wall motion, image registration, which establishes corre-spondences between points in two different images, was applied to the series of 2D images. To this end, a 2D version of the non-rigid registration algorithm proposed by Rueckert et al. [7] was applied. This method is based on free-form deformations, which are modeled through the 2D tensor product of 1D cubic B-splines. By moving a set of control points originally distributed into a regular lattice, a smooth and continu-ous transformation is obtained that is subsequently used for deforming one image into the other. The control points are moved in order to maximize the similarity between the two images. The similarity metric used in this study to characterize the alignment between the two images is the Normalized Mutual Information (NMI) [8].
For each series of sequential X-ray projection images, a set of landmarks were manually delineated in the first frame, and subsequently propagated by using the transformations derived from the image registration procedure. The complete series was registered to the initial reference frame. Thus, wall motion was estimated from the propagated landmarks by calculating the distance between corresponding points. A distribution of displacement vectors was obtained for the complete set of land-marks. The wall motion was estimated by using two assumptions: differential motion (i.e. different amplitude for different regions), and uniform motion (i.e. same ampli-tude for all regions). Thus, the statistical characterization of the displacement field was performed on the whole aneurysm and also on several different anatomical re-gions. In order to characterize the behavior of each region, both the median and the
440 L. Dempere-Marco et al.
90th percentile of the displacement vector modulus were calculated. By considering the 90th percentile, an upper boundary to the wall motion amplitude in the simulations is obtained while excluding outliers.
3 Haemodynamics Modeling Including Wall Compliance
In order to compute the intra-aneurysmal flow patterns, personalized models of blood vessels were constructed from 3D rotational angiography (3DRA) images. The seg-mentation procedure was based upon the use of deformable models by first smoothing the image through a combination of blurring and sharpening operations, followed by a region growing segmentation and isosurface extraction. This surface was then used to initialize a deformable model under the action of internal smoothing forces and exter-nal forces from the gradients of the original unprocessed images [5]. The anatomical model was subsequently used as a support surface to generate a finite element grid with an advancing front method that first re-triangulates the surface and then marches into the domain generating tetrahedral elements [9]. The blood flow was mathemati-cally modeled by the unsteady Navier-Stokes equations for an incompressible fluid:
τvvv
v ⋅∇+−∇=⎟⎟⎠
⎞⎜⎜⎝
⎛∇⋅+
∂∂ρ=⋅∇ p
t ,0 (1)
where ρ is the density, v is the velocity field, p is the pressure, and τ is the deviatoric stress tensor. The fluid was assumed Newtonian with a viscosity of μ=4 cPoise and a density of ρ=1.0 g/cm3. The blood flow boundary conditions were derived from PC-MR images of the main branches of the circle of Willis obtained from a normal volun-teer. Traction free boundary conditions were imposed at the model outflows. At the vessel walls, no-slip boundary conditions were applied. Since the velocity of the wall was estimated through imaging techniques, wall compliance is implicitly included in the simulation process. As it was not possible to determine the shape of the distension waveform at low sampling rates, it was assumed as a first order approximation, that it followed the flow waveform. Such waveform was scaled locally to achieve the meas-ured displacement amplitude in each of the regions considered. The walls were as-sumed to move in the normal direction, and such motion was directly imposed to the 3D mesh derived from the volumetric medical images. The grid was updated at each time step by a non-linear smoothing of the wall velocity into the interior of the com-putational domain [10].
4 Experiments and Results
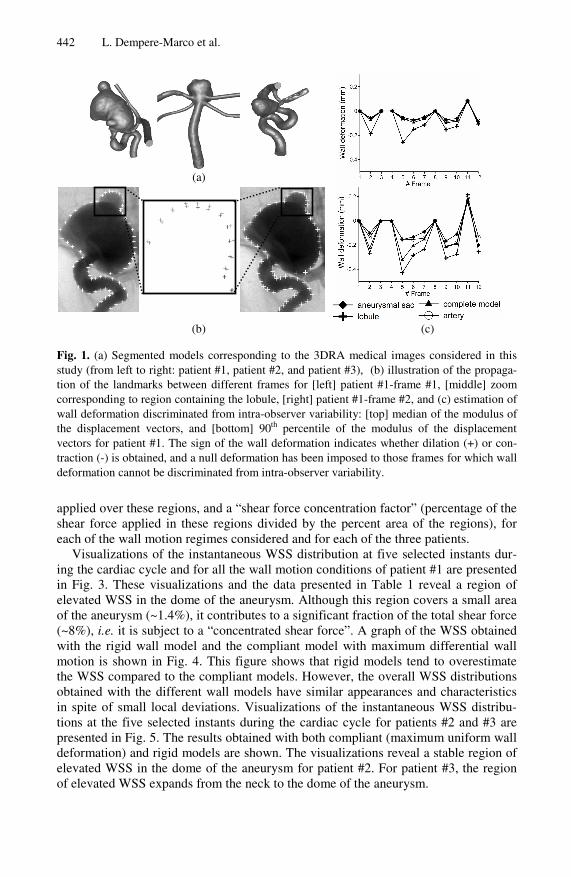
In Fig. 1(a), the results from the segmentation of the 3DRA medical images for the three cases considered in this study are displayed. To establish whether the detected motion could be discriminated from the intra-observer variability in delineating con-tours, a manual segmentation was performed by an expert observer in the first frame by selecting closely located points on the boundary of the aneurysm and subsequently fitting a spline to the series of points. By considering also the independently selected
CFD Analysis Incorporating the Influence of Wall Motion 441
landmarks for this same frame, the distributions of distances derived from: a) original landmarks to the spline, and b) propagated landmarks and original landmarks, were compared. To this end, Student paired t-test and ranked sum Wilcoxon tests were performed. As established before, the landmarks were tracked in the complete series in order to quantify the wall motion. Fig.1(b) illustrates the landmarks propagation from which wall deformation estimates follow. The amplitude of the motion is char-acterized in Fig. 1(c) by both the median and the 90th percentile.
For patient #1, statistically significant differences were found between the two dis-tributions for 8/11 frames (PTTEST<0.04, PWIL<0.02). In all of these cases, the average distance between propagated landmarks and original landmarks was larger than that due to intra-observer variability. Thus, although small deformation fields are obtained for all the images within the temporal series (see Fig. 1(c)), these differ in a statisti-cally meaningful way from the error made in the manual delineation of the contours. Pairwise one-way ANOVA analyses were also performed on the series defined by the median of the displacement of the landmarks for all the frames and statistically mean-ingful differences (P<0.004) were found between the distribution corresponding to the lobule and the rest of distributions.
For patient #2, the deformations recovered by the registration algorithm required subpixel accuracy to be detected. In fact, statistically significant differences were found between the two distributions for 3/6 frames (PTTEST<0.02, PWIL<0.04), how-ever, the intra-observer variability was found to be larger than the average wall mo-tion detected. Thus, it was concluded that the deformation field was so small that could not be reliably quantified given the available image resolution (i.e. maximum mean wall deformation of 0.07 mm in the temporal series).
For patient #3, the deformation fields obtained yielded statistically significant dif-ferences for 6/9 (PTTEST<0.04, PWIL<0.03) frames, with the average wall deformation larger than the error due to intra-observer variation. The amplitude of the maximum displacement observed was 0.25 mm, i.e. about 3% of the aneurysm diameter, with no significant differences between regions.
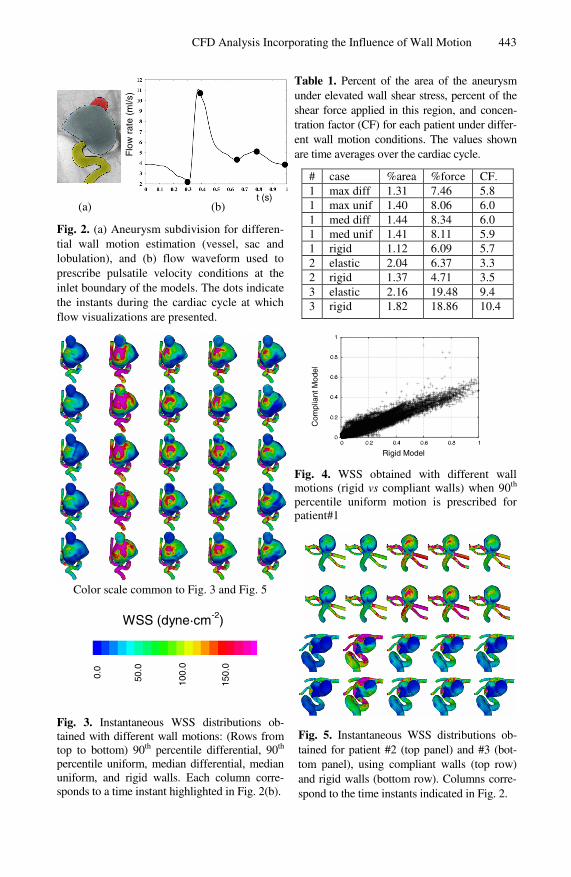
A total of five simulations were carried out for patient #1, using different vessel wall velocity conditions: 1) maximum displacement (i.e. 90th percentile), differential motion, 2) maximum displacement, uniform motion, 3) median displacement, differ-ential motion, 4) median displacement, uniform motion, and 5) rigid walls. For pa-tients #2 and #3, a compliant and a rigid simulation were carried out. Since for patient #2 it was not possible to detect a significant wall deformation, a uniform wall motion with amplitude just below the resolution of the technique was used for the compliant model. For patient #3, only the maximum uniform wall motion was imposed in the elastic model to assess the maximum effect that wall motion would have. In order to compare the results obtained with the different vessel wall movements, the following characterization of the wall shear stress (WSS) was used: the necks of the aneurysms were manually selected on the anatomical models, and a region of approximately 1 cm of the parent vessel (denoted proximal parent vessel) from the neck of the aneu-rysm was identified (see Fig. 2). At each time instant, the average WSS magnitude was computed in the proximal parent vessel region and used to normalize the instan-taneous WSS in the aneurysm and to identify regions of elevated WSS (NWSS>1). Table 1 shows the area of these regions, the percent of the total aneurysm shear force
442 L. Dempere-Marco et al.
(a)
(b) (c)
Fig. 1. (a) Segmented models corresponding to the 3DRA medical images considered in this study (from left to right: patient #1, patient #2, and patient #3), (b) illustration of the propaga-tion of the landmarks between different frames for [left] patient #1-frame #1, [middle] zoom corresponding to region containing the lobule, [right] patient #1-frame #2, and (c) estimation of wall deformation discriminated from intra-observer variability: [top] median of the modulus of the displacement vectors, and [bottom] 90th percentile of the modulus of the displacement vectors for patient #1. The sign of the wall deformation indicates whether dilation (+) or con-traction (-) is obtained, and a null deformation has been imposed to those frames for which wall deformation cannot be discriminated from intra-observer variability.
applied over these regions, and a “shear force concentration factor” (percentage of the shear force applied in these regions divided by the percent area of the regions), for each of the wall motion regimes considered and for each of the three patients.
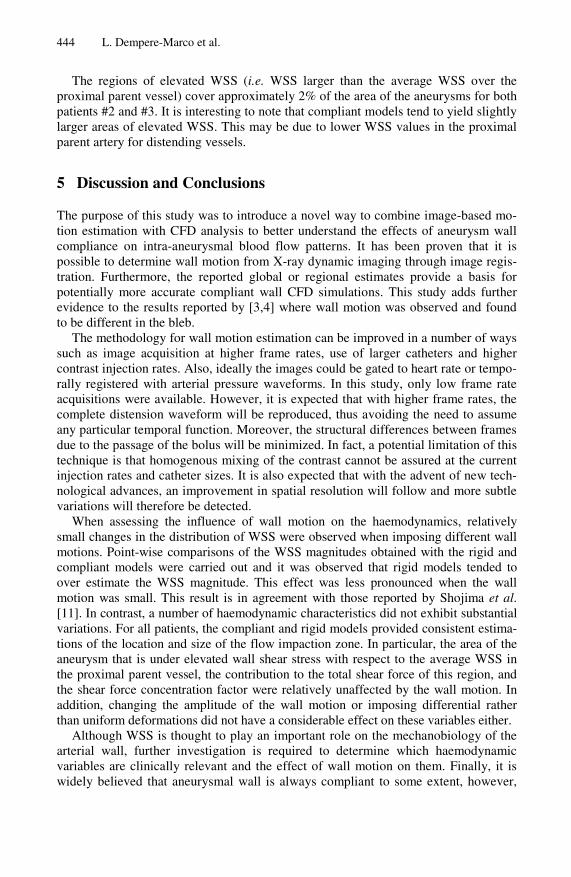
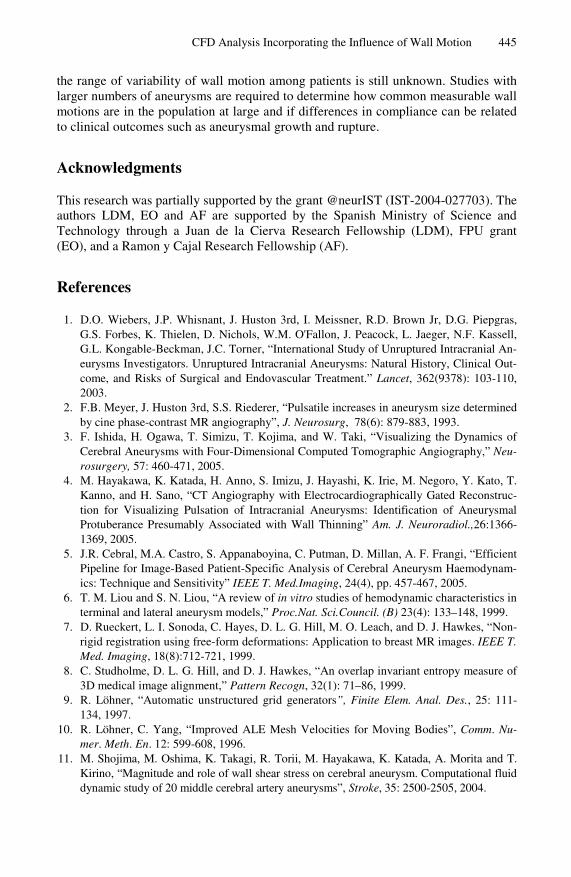
Visualizations of the instantaneous WSS distribution at five selected instants dur-ing the cardiac cycle and for all the wall motion conditions of patient #1 are presented in Fig. 3. These visualizations and the data presented in Table 1 reveal a region of elevated WSS in the dome of the aneurysm. Although this region covers a small area of the aneurysm (~1.4%), it contributes to a significant fraction of the total shear force (~8%), i.e. it is subject to a “concentrated shear force”. A graph of the WSS obtained with the rigid wall model and the compliant model with maximum differential wall motion is shown in Fig. 4. This figure shows that rigid models tend to overestimate the WSS compared to the compliant models. However, the overall WSS distributions obtained with the different wall models have similar appearances and characteristics in spite of small local deviations. Visualizations of the instantaneous WSS distribu-tions at the five selected instants during the cardiac cycle for patients #2 and #3 are presented in Fig. 5. The results obtained with both compliant (maximum uniform wall deformation) and rigid models are shown. The visualizations reveal a stable region of elevated WSS in the dome of the aneurysm for patient #2. For patient #3, the region of elevated WSS expands from the neck to the dome of the aneurysm.
CFD Analysis Incorporating the Influence of Wall Motion 443
(a) (b)
Fig. 2. (a) Aneurysm subdivision for differen-tial wall motion estimation (vessel, sac and lobulation), and (b) flow waveform used to prescribe pulsatile velocity conditions at the inlet boundary of the models. The dots indicate the instants during the cardiac cycle at which flow visualizations are presented.
Color scale common to Fig. 3 and Fig. 5
Fig. 3. Instantaneous WSS distributions ob-tained with different wall motions: (Rows from top to bottom) 90th percentile differential, 90th percentile uniform, median differential, median uniform, and rigid walls. Each column corre-sponds to a time instant highlighted in Fig. 2(b).
Table 1. Percent of the area of the aneurysm under elevated wall shear stress, percent of the shear force applied in this region, and concen-tration factor (CF) for each patient under differ-ent wall motion conditions. The values shown are time averages over the cardiac cycle.
# case %area %force CF. 1 max diff 1.31 7.46 5.8 1 max unif 1.40 8.06 6.0 1 med diff 1.44 8.34 6.0 1 med unif 1.41 8.11 5.9 1 rigid 1.12 6.09 5.7 2 elastic 2.04 6.37 3.3 2 rigid 1.37 4.71 3.5 3 elastic 2.16 19.48 9.4 3 rigid 1.82 18.86 10.4
Fig. 4. WSS obtained with different wall motions (rigid vs compliant walls) when 90th percentile uniform motion is prescribed for patient#1
Fig. 5. Instantaneous WSS distributions ob-tained for patient #2 (top panel) and #3 (bot-tom panel), using compliant walls (top row) and rigid walls (bottom row). Columns corre-spond to the time instants indicated in Fig. 2.
t (s)
Flo
w r
ate
(ml/s
)
Rigid Model
Com
plia
nt M
odel
0.0
50.0
100.
0
150.
0
WSS (dyne·cm-2)
444 L. Dempere-Marco et al.
The regions of elevated WSS (i.e. WSS larger than the average WSS over the proximal parent vessel) cover approximately 2% of the area of the aneurysms for both patients #2 and #3. It is interesting to note that compliant models tend to yield slightly larger areas of elevated WSS. This may be due to lower WSS values in the proximal parent artery for distending vessels.
5 Discussion and Conclusions
The purpose of this study was to introduce a novel way to combine image-based mo-tion estimation with CFD analysis to better understand the effects of aneurysm wall compliance on intra-aneurysmal blood flow patterns. It has been proven that it is possible to determine wall motion from X-ray dynamic imaging through image regis-tration. Furthermore, the reported global or regional estimates provide a basis for potentially more accurate compliant wall CFD simulations. This study adds further evidence to the results reported by [3,4] where wall motion was observed and found to be different in the bleb.
The methodology for wall motion estimation can be improved in a number of ways such as image acquisition at higher frame rates, use of larger catheters and higher contrast injection rates. Also, ideally the images could be gated to heart rate or tempo-rally registered with arterial pressure waveforms. In this study, only low frame rate acquisitions were available. However, it is expected that with higher frame rates, the complete distension waveform will be reproduced, thus avoiding the need to assume any particular temporal function. Moreover, the structural differences between frames due to the passage of the bolus will be minimized. In fact, a potential limitation of this technique is that homogenous mixing of the contrast cannot be assured at the current injection rates and catheter sizes. It is also expected that with the advent of new tech-nological advances, an improvement in spatial resolution will follow and more subtle variations will therefore be detected.
When assessing the influence of wall motion on the haemodynamics, relatively small changes in the distribution of WSS were observed when imposing different wall motions. Point-wise comparisons of the WSS magnitudes obtained with the rigid and compliant models were carried out and it was observed that rigid models tended to over estimate the WSS magnitude. This effect was less pronounced when the wall motion was small. This result is in agreement with those reported by Shojima et al. [11]. In contrast, a number of haemodynamic characteristics did not exhibit substantial variations. For all patients, the compliant and rigid models provided consistent estima-tions of the location and size of the flow impaction zone. In particular, the area of the aneurysm that is under elevated wall shear stress with respect to the average WSS in the proximal parent vessel, the contribution to the total shear force of this region, and the shear force concentration factor were relatively unaffected by the wall motion. In addition, changing the amplitude of the wall motion or imposing differential rather than uniform deformations did not have a considerable effect on these variables either.
Although WSS is thought to play an important role on the mechanobiology of the arterial wall, further investigation is required to determine which haemodynamic variables are clinically relevant and the effect of wall motion on them. Finally, it is widely believed that aneurysmal wall is always compliant to some extent, however,
CFD Analysis Incorporating the Influence of Wall Motion 445
the range of variability of wall motion among patients is still unknown. Studies with larger numbers of aneurysms are required to determine how common measurable wall motions are in the population at large and if differences in compliance can be related to clinical outcomes such as aneurysmal growth and rupture.
Acknowledgments
This research was partially supported by the grant @neurIST (IST-2004-027703). The authors LDM, EO and AF are supported by the Spanish Ministry of Science and Technology through a Juan de la Cierva Research Fellowship (LDM), FPU grant (EO), and a Ramon y Cajal Research Fellowship (AF).
References
1. D.O. Wiebers, J.P. Whisnant, J. Huston 3rd, I. Meissner, R.D. Brown Jr, D.G. Piepgras, G.S. Forbes, K. Thielen, D. Nichols, W.M. O'Fallon, J. Peacock, L. Jaeger, N.F. Kassell, G.L. Kongable-Beckman, J.C. Torner, “International Study of Unruptured Intracranial An-eurysms Investigators. Unruptured Intracranial Aneurysms: Natural History, Clinical Out-come, and Risks of Surgical and Endovascular Treatment.” Lancet, 362(9378): 103-110, 2003.
2. F.B. Meyer, J. Huston 3rd, S.S. Riederer, “Pulsatile increases in aneurysm size determined by cine phase-contrast MR angiography”, J. Neurosurg, 78(6): 879-883, 1993.
3. F. Ishida, H. Ogawa, T. Simizu, T. Kojima, and W. Taki, “Visualizing the Dynamics of Cerebral Aneurysms with Four-Dimensional Computed Tomographic Angiography,” Neu-rosurgery, 57: 460-471, 2005.
4. M. Hayakawa, K. Katada, H. Anno, S. Imizu, J. Hayashi, K. Irie, M. Negoro, Y. Kato, T. Kanno, and H. Sano, “CT Angiography with Electrocardiographically Gated Reconstruc-tion for Visualizing Pulsation of Intracranial Aneurysms: Identification of Aneurysmal Protuberance Presumably Associated with Wall Thinning” Am. J. Neuroradiol.,26:1366-1369, 2005.
5. J.R. Cebral, M.A. Castro, S. Appanaboyina, C. Putman, D. Millan, A. F. Frangi, “Efficient Pipeline for Image-Based Patient-Specific Analysis of Cerebral Aneurysm Haemodynam-ics: Technique and Sensitivity” IEEE T. Med.Imaging, 24(4), pp. 457-467, 2005.
6. T. M. Liou and S. N. Liou, “A review of in vitro studies of hemodynamic characteristics in terminal and lateral aneurysm models,” Proc.Nat. Sci.Council. (B) 23(4): 133–148, 1999.
7. D. Rueckert, L. I. Sonoda, C. Hayes, D. L. G. Hill, M. O. Leach, and D. J. Hawkes, “Non-rigid registration using free-form deformations: Application to breast MR images. IEEE T. Med. Imaging, 18(8):712-721, 1999.
8. C. Studholme, D. L. G. Hill, and D. J. Hawkes, “An overlap invariant entropy measure of 3D medical image alignment,” Pattern Recogn, 32(1): 71–86, 1999.
9. R. Löhner, “Automatic unstructured grid generators”, Finite Elem. Anal. Des., 25: 111-134, 1997.
10. R. Löhner, C. Yang, “Improved ALE Mesh Velocities for Moving Bodies”, Comm. Nu-mer. Meth. En. 12: 599-608, 1996.
11. M. Shojima, M. Oshima, K. Takagi, R. Torii, M. Hayakawa, K. Katada, A. Morita and T. Kirino, “Magnitude and role of wall shear stress on cerebral aneurysm. Computational fluid dynamic study of 20 middle cerebral artery aneurysms”, Stroke, 35: 2500-2505, 2004.
Related Documents