CFA Institute Research Challenge hosted by CFA Society Vietnam RMIT University Saigon South Campus The CFA Institute Research Challenge is a global competition that tests the equity research and valuation, investment report writing, and presentation skills of university students. The following report was prepared in compliance with the Official Rules of the CFA Institute Research Challenge, is submitted by a team of university students as part of this annual educational initiative and should not be considered a professional report. Disclosures: Ownership and material conflicts of interest The author(s), or a member of their household, of this report does not hold a financial interest in the securities of this company. The author(s), or a member of their household, of this report does not know of the existence of any conflicts of interest that might bias the content or publication of this report. Receipt of compensation Compensation of the author(s) of this report is not based on investment banking revenue. Position as an officer or a director The author(s), or a member of their household, does not serve as an officer, director, or advisory board member of the subject company. Market making The author(s) does not act as a market maker in the subject company’s securities. Disclaimer The information set forth herein has been obtained or derived from sources generally available to the public and believed by the author(s) to be reliable, but the author(s) does not make any representation or warranty, express or implied, as to its accuracy or completeness. The information is not intended to be used as the basis of any investment decisions by any person or entity. This information does not constitute investment advice, nor is it an offer or a solicitation of an offer to buy or sell any security. This report should not be considered to be a recommendation by any individual affiliated with CFA Vietnam, CFA Institute, or the CFA Institute Research Challenge with regard to this company’s stock.

Welcome message from author
This document is posted to help you gain knowledge. Please leave a comment to let me know what you think about it! Share it to your friends and learn new things together.
Transcript
CFA Institute Research Challenge hosted by
CFA Society Vietnam RMIT University Saigon South Campus
The CFA Institute Research Challenge is a global competition that tests the equity research and valuation, investment report writing, and presentation skills of university students. The following report was prepared in compliance with the Official Rules of the CFA Institute Research Challenge, is submitted by a team of university students as part of this annual educational initiative and should not be considered a professional report.
Disclosures: Ownership and material conflicts of interest The author(s), or a member of their household, of this report does not hold a financial interest in the securities of this company. The author(s), or a member of their household, of this report does not know of the existence of any conflicts of interest that might bias the content or publication of this report. Receipt of compensation Compensation of the author(s) of this report is not based on investment banking revenue. Position as an officer or a director The author(s), or a member of their household, does not serve as an officer, director, or advisory board member of the subject company. Market making The author(s) does not act as a market maker in the subject company’s securities. Disclaimer The information set forth herein has been obtained or derived from sources generally available to the public and believed by the author(s) to be reliable, but the author(s) does not make any representation or warranty, express or implied, as to its accuracy or completeness. The information is not intended to be used as the basis of any investment decisions by any person or entity. This information does not constitute investment advice, nor is it an offer or a solicitation of an offer to buy or sell any security. This report should not be considered to be a recommendation by any individual affiliated with CFA Vietnam, CFA Institute, or the CFA Institute Research Challenge with regard to this company’s stock.
1
Sector: Materials – Industry: Industrial Metals
Ho Chi Minh Stock Exchange (HOSE)
HOA PHAT GROUP (Ticker: HPG.HM)
Closing price: 32,250 VND
USD/VND: 23,145
Target price: 40,610 VND
Recommendation: BUY (+25.92% Upside)
Date: 15th November 2020 EXECUTIVE SUMMARY
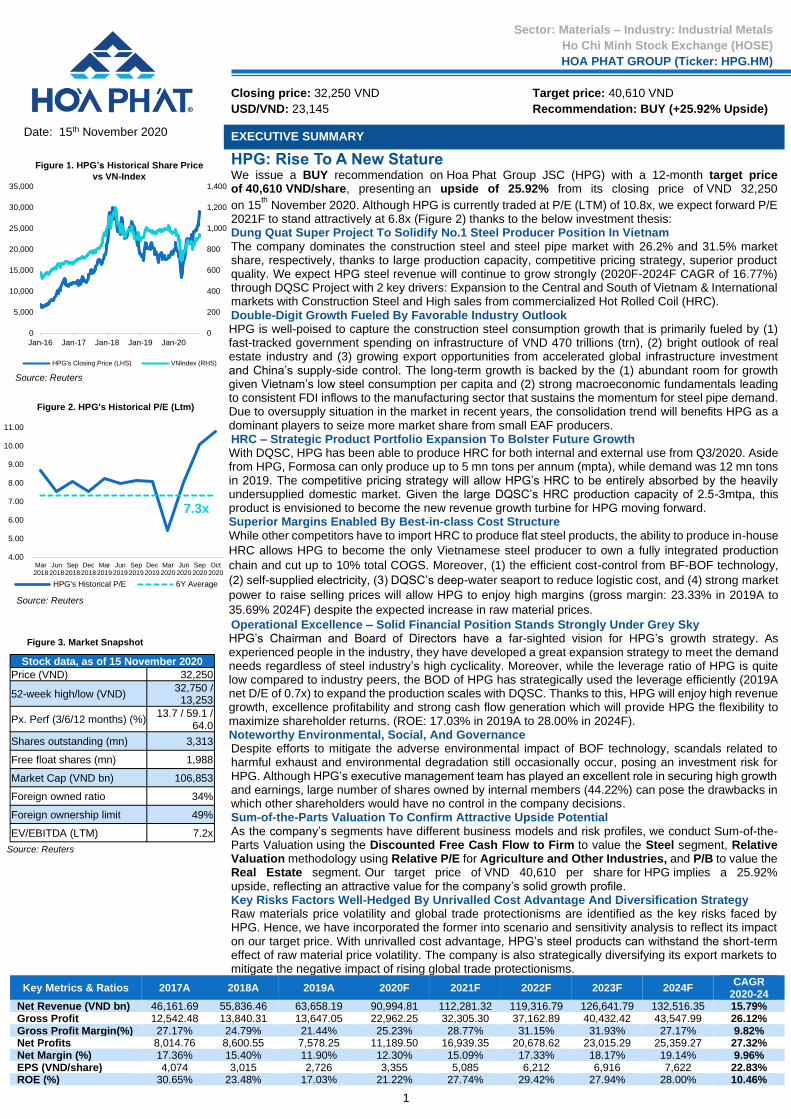
HPG: Rise To A New Stature We issue a BUY recommendation on Hoa Phat Group JSC (HPG) with a 12-month target price of 40,610 VND/share, presenting an upside of 25.92% from its closing price of VND 32,250
on 15th November 2020. Although HPG is currently traded at P/E (LTM) of 10.8x, we expect forward P/E
2021F to stand attractively at 6.8x (Figure 2) thanks to the below investment thesis: Dung Quat Super Project To Solidify No.1 Steel Producer Position In Vietnam The company dominates the construction steel and steel pipe market with 26.2% and 31.5% market share, respectively, thanks to large production capacity, competitive pricing strategy, superior product quality. We expect HPG steel revenue will continue to grow strongly (2020F-2024F CAGR of 16.77%) through DQSC Project with 2 key drivers: Expansion to the Central and South of Vietnam & International markets with Construction Steel and High sales from commercialized Hot Rolled Coil (HRC). Double-Digit Growth Fueled By Favorable Industry Outlook HPG is well-poised to capture the construction steel consumption growth that is primarily fueled by (1) fast-tracked government spending on infrastructure of VND 470 trillions (trn), (2) bright outlook of real estate industry and (3) growing export opportunities from accelerated global infrastructure investment and China’s supply-side control. The long-term growth is backed by the (1) abundant room for growth given Vietnam’s low steel consumption per capita and (2) strong macroeconomic fundamentals leading to consistent FDI inflows to the manufacturing sector that sustains the momentum for steel pipe demand. Due to oversupply situation in the market in recent years, the consolidation trend will benefits HPG as a dominant players to seize more market share from small EAF producers. HRC – Strategic Product Portfolio Expansion To Bolster Future Growth With DQSC, HPG has been able to produce HRC for both internal and external use from Q3/2020. Aside from HPG, Formosa can only produce up to 5 mn tons per annum (mpta), while demand was 12 mn tons in 2019. The competitive pricing strategy will allow HPG’s HRC to be entirely absorbed by the heavily undersupplied domestic market. Given the large DQSC’s HRC production capacity of 2.5-3mtpa, this product is envisioned to become the new revenue growth turbine for HPG moving forward. Superior Margins Enabled By Best-in-class Cost Structure While other competitors have to import HRC to produce flat steel products, the ability to produce in-house
HRC allows HPG to become the only Vietnamese steel producer to own a fully integrated production
chain and cut up to 10% total COGS. Moreover, (1) the efficient cost-control from BF-BOF technology,
(2) self-supplied electricity, (3) DQSC’s deep-water seaport to reduce logistic cost, and (4) strong market
power to raise selling prices will allow HPG to enjoy high margins (gross margin: 23.33% in 2019A to
35.69% 2024F) despite the expected increase in raw material prices.
Operational Excellence – Solid Financial Position Stands Strongly Under Grey Sky HPG’s Chairman and Board of Directors have a far-sighted vision for HPG’s growth strategy. As experienced people in the industry, they have developed a great expansion strategy to meet the demand needs regardless of steel industry’s high cyclicality. Moreover, while the leverage ratio of HPG is quite low compared to industry peers, the BOD of HPG has strategically used the leverage efficiently (2019A net D/E of 0.7x) to expand the production scales with DQSC. Thanks to this, HPG will enjoy high revenue growth, excellence profitability and strong cash flow generation which will provide HPG the flexibility to maximize shareholder returns. (ROE: 17.03% in 2019A to 28.00% in 2024F). Noteworthy Environmental, Social, And Governance Despite efforts to mitigate the adverse environmental impact of BOF technology, scandals related to harmful exhaust and environmental degradation still occasionally occur, posing an investment risk for HPG. Although HPG’s executive management team has played an excellent role in securing high growth and earnings, large number of shares owned by internal members (44.22%) can pose the drawbacks in which other shareholders would have no control in the company decisions. Sum-of-the-Parts Valuation To Confirm Attractive Upside Potential As the company’s segments have different business models and risk profiles, we conduct Sum-of-the-Parts Valuation using the Discounted Free Cash Flow to Firm to value the Steel segment, Relative Valuation methodology using Relative P/E for Agriculture and Other Industries, and P/B to value the Real Estate segment. Our target price of VND 40,610 per share for HPG implies a 25.92% upside, reflecting an attractive value for the company’s solid growth profile. Key Risks Factors Well-Hedged By Unrivalled Cost Advantage And Diversification Strategy Raw materials price volatility and global trade protectionisms are identified as the key risks faced by HPG. Hence, we have incorporated the former into scenario and sensitivity analysis to reflect its impact on our target price. With unrivalled cost advantage, HPG’s steel products can withstand the short-term effect of raw material price volatility. The company is also strategically diversifying its export markets to mitigate the negative impact of rising global trade protectionisms.
Key Metrics & Ratios 2017A 2018A 2019A 2020F 2021F 2022F 2023F 2024F CAGR
2020-24 Net Revenue (VND bn) 46,161.69 55,836.46 63,658.19 90,994.81 112,281.32 119,316.79 126,641.79 132,516.35 15.79% Gross Profit 12,542.48 13,840.31 13,647.05 22,962.25 32,305.30 37,162.89 40,432.42 43,547.99 26.12% Gross Profit Margin(%) 27.17% 24.79% 21.44% 25.23% 28.77% 31.15% 31.93% 27.17% 9.82% Net Profits 8,014.76 8,600.55 7,578.25 11,189.50 16,939.35 20,678.62 23,015.29 25,359.27 27.32% Net Margin (%) 17.36% 15.40% 11.90% 12.30% 15.09% 17.33% 18.17% 19.14% 9.96% EPS (VND/share) 4,074 3,015 2,726 3,355 5,085 6,212 6,916 7,622 22.83% ROE (%) 30.65% 23.48% 17.03% 21.22% 27.74% 29.42% 27.94% 28.00% 10.46%
Figure 3. Market Snapshot
Stock data, as of 15 November 2020
Price (VND) 32,250
52-week high/low (VND) 32,750 / 13,253
Px. Perf (3/6/12 months) (%) 13.7 / 59.1 /
64.0
Shares outstanding (mn) 3,313
Free float shares (mn) 1,988
Market Cap (VND bn) 106,853
Foreign owned ratio 34%
Foreign ownership limit 49%
EV/EBITDA (LTM) 7.2x
Source: Reuters
Figure 1. HPG’s Historical Share Price
vs VN-Index
Source: Reuters
0
200
400
600
800
1,000
1,200
1,400
0
5,000
10,000
15,000
20,000
25,000
30,000
35,000
Jan-16 Jan-17 Jan-18 Jan-19 Jan-20
HPG's Closing Price (LHS) VNIndex (RHS)
Source: Reuters
Figure 2. HPG's Historical P/E (Ltm)
4.00
5.00
6.00
7.00
8.00
9.00
10.00
11.00
Mar2018
Jun2018
Sep2018
Dec2018
Mar2019
Jun2019
Sep2019
Dec2019
Mar2020
Jun2020
Sep2020
Oct2020
HPG's Historical P/E 6Y Average
7.3x
2
BUSINESS DESCRIPTION
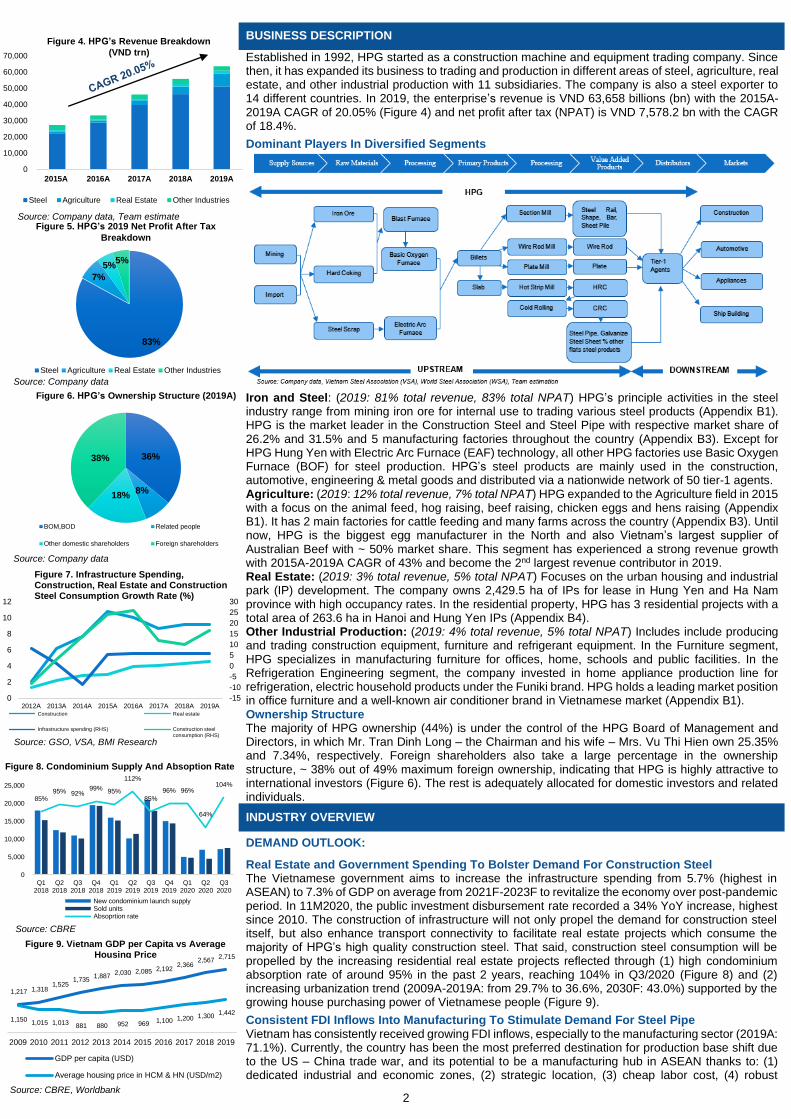
Established in 1992, HPG started as a construction machine and equipment trading company. Since then, it has expanded its business to trading and production in different areas of steel, agriculture, real estate, and other industrial production with 11 subsidiaries. The company is also a steel exporter to 14 different countries. In 2019, the enterprise’s revenue is VND 63,658 billions (bn) with the 2015A-2019A CAGR of 20.05% (Figure 4) and net profit after tax (NPAT) is VND 7,578.2 bn with the CAGR of 18.4%. Dominant Players In Diversified Segments
Iron and Steel: (2019: 81% total revenue, 83% total NPAT) HPG’s principle activities in the steel industry range from mining iron ore for internal use to trading various steel products (Appendix B1). HPG is the market leader in the Construction Steel and Steel Pipe with respective market share of 26.2% and 31.5% and 5 manufacturing factories throughout the country (Appendix B3). Except for HPG Hung Yen with Electric Arc Furnace (EAF) technology, all other HPG factories use Basic Oxygen Furnace (BOF) for steel production. HPG’s steel products are mainly used in the construction, automotive, engineering & metal goods and distributed via a nationwide network of 50 tier-1 agents. Agriculture: (2019: 12% total revenue, 7% total NPAT) HPG expanded to the Agriculture field in 2015 with a focus on the animal feed, hog raising, beef raising, chicken eggs and hens raising (Appendix B1). It has 2 main factories for cattle feeding and many farms across the country (Appendix B3). Until now, HPG is the biggest egg manufacturer in the North and also Vietnam’s largest supplier of Australian Beef with ~ 50% market share. This segment has experienced a strong revenue growth with 2015A-2019A CAGR of 43% and become the 2nd largest revenue contributor in 2019. Real Estate: (2019: 3% total revenue, 5% total NPAT) Focuses on the urban housing and industrial park (IP) development. The company owns 2,429.5 ha of IPs for lease in Hung Yen and Ha Nam province with high occupancy rates. In the residential property, HPG has 3 residential projects with a total area of 263.6 ha in Hanoi and Hung Yen IPs (Appendix B4). Other Industrial Production: (2019: 4% total revenue, 5% total NPAT) Includes include producing and trading construction equipment, furniture and refrigerant equipment. In the Furniture segment, HPG specializes in manufacturing furniture for offices, home, schools and public facilities. In the Refrigeration Engineering segment, the company invested in home appliance production line for refrigeration, electric household products under the Funiki brand. HPG holds a leading market position in office furniture and a well-known air conditioner brand in Vietnamese market (Appendix B1). Ownership Structure The majority of HPG ownership (44%) is under the control of the HPG Board of Management and Directors, in which Mr. Tran Dinh Long – the Chairman and his wife – Mrs. Vu Thi Hien own 25.35% and 7.34%, respectively. Foreign shareholders also take a large percentage in the ownership structure, ~ 38% out of 49% maximum foreign ownership, indicating that HPG is highly attractive to international investors (Figure 6). The rest is adequately allocated for domestic investors and related individuals.
INDUSTRY OVERVIEW
DEMAND OUTLOOK: Real Estate and Government Spending To Bolster Demand For Construction Steel The Vietnamese government aims to increase the infrastructure spending from 5.7% (highest in ASEAN) to 7.3% of GDP on average from 2021F-2023F to revitalize the economy over post-pandemic period. In 11M2020, the public investment disbursement rate recorded a 34% YoY increase, highest since 2010. The construction of infrastructure will not only propel the demand for construction steel itself, but also enhance transport connectivity to facilitate real estate projects which consume the majority of HPG’s high quality construction steel. That said, construction steel consumption will be propelled by the increasing residential real estate projects reflected through (1) high condominium absorption rate of around 95% in the past 2 years, reaching 104% in Q3/2020 (Figure 8) and (2) increasing urbanization trend (2009A-2019A: from 29.7% to 36.6%, 2030F: 43.0%) supported by the growing house purchasing power of Vietnamese people (Figure 9). Consistent FDI Inflows Into Manufacturing To Stimulate Demand For Steel Pipe Vietnam has consistently received growing FDI inflows, especially to the manufacturing sector (2019A: 71.1%). Currently, the country has been the most preferred destination for production base shift due to the US – China trade war, and its potential to be a manufacturing hub in ASEAN thanks to: (1) dedicated industrial and economic zones, (2) strategic location, (3) cheap labor cost, (4) robust
83%
7%
5%5%
Steel Agriculture Real Estate Other Industries
Figure 5. HPG’s 2019 Net Profit After Tax
Breakdown
Source: Company data
36%
8%18%
38%
BOM,BOD Related people
Other domestic shareholders Foreign shareholders
Figure 6. HPG’s Ownership Structure (2019A)
Source: Company data
Source: GSO, VSA, BMI Research
Figure 7. Infrastructure Spending, Construction, Real Estate and Construction Steel Consumption Growth Rate (%)
-15
-10
-5
0
5
10
15
20
25
30
0
2
4
6
8
10
12
2012A 2013A 2014A 2015A 2016A 2017A 2018A 2019AConstruction Real estate
Infrastructure spending (RHS) Construction steelconsumption (RHS)
85%95% 92%
99% 95%
112%
85%
96% 96%
64%
104%
0%
20%
40%
60%
80%
100%
120%
0
5,000
10,000
15,000
20,000
25,000
Q12018
Q22018
Q32018
Q42018
Q12019
Q22019
Q32019
Q42019
Q12020
Q22020
Q32020
New condominium launch supplySold unitsAbsoprtion rate
Figure 8. Condominium Supply And Absoption Rate
Source: CBRE
0
10,000
20,000
30,000
40,000
50,000
60,000
70,000
2015A 2016A 2017A 2018A 2019A
Steel Agriculture Real Estate Other Industries
Figure 4. HPG’s Revenue Breakdown (VND trn)
Source: Company data, Team estimate
1,217 1,318 1,525
1,735 1,887
2,030 2,085 2,192 2,366
2,567 2,715
1,150 1,015 1,013 881 880 952 969 1,100 1,200 1,300
1,442
2009 2010 2011 2012 2013 2014 2015 2016 2017 2018 2019
GDP per capita (USD)
Average housing price in HCM & HN (USD/m2)
Figure 9. Vietnam GDP per Capita vs Average Housing Price
Source: CBRE, Worldbank
3
infrastructure spending, and (5) investment and land rental incentives. Therefore, although COVID-19 has temporarily slowed down FDI in 10M2020 (realized FDI capital dropped by 2.5% YoY), we believe the FDI growth momentum would soon recover. Demand growth for steel pipe is thus expected to gradually recover from -6.8% in 1H2020 to their 2015-2018 CAGR of 15.6%, and for galvanized steel sheet from 6.5% to 20.8% since these products are widely used in the construction of factories, warehouses, and machinery manufacturing, etc. Low Per Capita Consumption And Robust Demand Expected To Propel Long-Term Demand Vietnam’s apparent steel consumption per capita is the 3r lowest in ASEAN and is growing at the 2nd fastest rate in the region with a 2010A-2018A CAGR of 9% (Figure 10). This presents huge room for medium-to-long term growth for steel demand in Vietnam (2021F-2024F CAGR of 9-10%) supported by resilient GDP growth (2020F-2024F CAGR of 6.2%) (Appendix C1) and favorable catalysts. Undersupply Of HRC In Domestic Market To Present Abundant Potentials For DQSC While domestic steel producers consumed around 12 millions (mn) tons of HRC in 2019, only 34% (4.1 Million Tonnes Per Annum (mtpa) was domestically supplied and Formosa (FHS) was the only producer (maximum capacity of 5.2 mtpa) (Figure 11). Such excessive demand bodes very well for HPG as the Phase 2 of DQSC commences HRC production in 3Q2020 with a maximum capacity of 2.5–3.0 mpta. With a cost-effective production chain, HRC products of HPG would have competitive prices against FHS and imported products, thereby are expected to be entirely consumed in the domestic market. Export Potential Spurred By Worldwide Accelerating Infrastructure Investment In June 2020, ASEAN-6 countries announced a total of USD 332 bn stimulus package, especially for infrastructure. Thus, ASEAN-6’s steel consumption growth rate would recover from -2.1% in 2020F to 5.1% in 2021F. The Chinese’s government also decided on a USD 84 bn package, yet the supply control enforced in 2015 due to oversupply and environmental concerns would continue to restrict domestic steel production. This bodes well for Vietnam’s billet export, especially for HPG, who is expected to export 1.8 mn tons of billets in 2020F (2019A: 0.2 mn ton). SUPPLY OUTLOOK Consolidation Trend To Offset Current Oversupply Situation With a wide gap in production technology and economies of scale between leading firms and the rest, the over-supply construction steel industry has seen a sharp consolidation (Figure 12), with the top six biggest players holding 66.7% market share in 2019 – up from 55.4% in 2015 (the year before launching safeguard taxes scheme). Therefore, given the additional years of protection, these biggest local producers can have time to further solidify their competitive capabilities and improve their positions in global markets. The COVID-19 has also posed tremendous challenges for small, financially insecure steel firms, leading to their contracting market share.Consequenrly, the current oversupply situation in Vietnam’s steel industry (Figure 13) will be offset and bodes well for a steel producer with advanced technology, efficient cost management, and nationwide distribution networks like HPG to effectively capture more market share with capacity expansion strategy (Figure 14). Extended Tariff Barriers To Shield Domestic Players Thanks to the implementation of safeguard taxes in 2016, Vietnamese billet prices dropped from a huge premium (30-32%) to discount (5-7%) against Chinese billet prices (Figure 15) and import decreased with a 2015-2019 CAGR of 49.7%. Vietnam’s rebar prices also witnessed the same pattern, dropping from a 29.9% premium to 7.9% discount to Chinese prices in March 2020. Thus, three additional years of self-defense duties on billet (15.3%) and construction steel (9.4%), reducing 2% and 1.5% every year respectively until March 2023, would further enhance the competitiveness of Vietnamese steel against imports from China (Appendix C5). Raw Materials: Iron Ore and Hard Coking Coal Price Expected To Moderately Increase Iron ore prices has recently reached above US 140/ton, driven by China’s strong demand and supply concerns fuelled by disappointing forecasts by Brazilian miner Vale S.A. Meanwhile, HCC price is decreasing due to the Australia-China tension. However, we expect HCC will recover as global demand improves after the black swan event of COVID-19 thanks to the accelerating worldwide government spending. We expected iron ore and HCC’s average price in 2021F would slightly increase from 2020F’s average given the recovering global demand after the black swan of COVID-19 and supply fluctuation due to the pandemic’s impact (Figure 16). Other Businesses To Present Steady Growth Potentials Agriculture: Vietnam’s meat consumption has increased from 33kg to 40kg per capita within the past 10 years and pork consumption ranked 8th in the world. With the consistent population growth and rising middle income class, the demand for beef and meat from cattle is expected to continue rising significantly (2019-2023F CAGR: Poultry – 6.8%, Pig – 0.8%, Cow – 4.6%). Thus, this sector would maintain both its short-term catalysts supported by long-term growth potentials. Real Estate: Vietnam’s Industrial park sector is enjoying a high growth thanks to: (1) the megatrend
of relocation of production base from China to Vietnam that will accelerate over the post-pandemic
period; (2) the recent implementation of EVFTA and EVIPA; (3) FDI investment incentives for projects
led by Vietnam and Japan’s governments to facilitate some Japanese firms to expand their production
to Vietnam, many of which have already had production base in the North; (4) Low land rental price
(~30-40% lower than Indonesia & Thailand), with the expected increase of 5-6% in the North and 7-
8% in the South in 2021F; (5) low labor cost; and (6) Vietnamese Government’s new Industrial Park
(IP) plan for 2021F-2025F to encourage the expansion of IP area in the future.
COMPETITIVE POSITIONING
-40%
-20%
0%
20%
40%
60%
Ja
n-1
6
Ap
r-1
6
Ju
l-16
Oct-
16
Ja
n-1
7
Ap
r-1
7
Ju
l-17
Oct-
17
Ja
n-1
8
Ap
r-1
8
Ju
l-18
Oct-
18
Ja
n-1
9
Ap
r-1
9
Ju
l-19
Oct-
19
Ja
n-2
0
Billet (USD/ton) Rebar (USD/ton)
Figure 15. Billet and Rebar Steel Premium Prices of Vietnam vs China
Source: Bloomberg, VSA, Team estimate
Source: SEAISI
IndonesiaPhilippines
ThailandMalaysia
Singapore
Vietnam0
10,000
20,000
30,000
40,000
50,000
60,000
70,000
0 100 200 300 400 500 600
GD
P p
er
capita (
US
D)
Figure 10. Apparent Steel Consumption per Capita (Kg), 2018
Source: FiinPro
0.9
3.7 4.2
9.2
11.89
88.6
2015A 2016A 2017A 2018A 2019A
Formosa HRC Import
Figure 11. Vietnam Demand for HRC
4.7 56
7.18.2
9.6 10.0
6.64.4
5.25.8
78
9.29.8
6.7
Figure 12. Production and Consumption of Construction Steel
Production Consumption (domestic + export)
Source: FiinPro,VSA
12.36
15.30
21.00 22.31
24.32 25.40
15.17 17.50
22.00 24.20 25.20
26.96
2015 2016 2017 2018 2019 2020
Figure 13. Vietnam Steel Demand and Supply(Million Tons)
Demand Supply
Source: VSA
26.20%
16.00%
8.60%
7.60%
31.7%
16.7%8.7%
2.6%
Figure 14. Construction Steel Market Share in Vietnam
HPG
VNSteel group
Vinakyoei
Pomina
PoscoSS
Formosa
2019
8M2020
Source: FiinPro
Source: VSA, Bloomberg
050
100150200250
Ja
n-1
7
Ap
r-1
7
Au
g-1
7
Nov-1
7
Feb
-18
May-1
8
Au
g-1
8
Nov-1
8
Feb
-19
May-1
9
Au
g-1
9
Nov-1
9
Feb
-20
May-2
0
Au
g-2
0
Nov-2
0
Ave
. 2
02
2F
Iron ore (USD/ton) Hard coking coal (USD/ton)
Figure 16. Iron Ore and Hard Coking Coal (2017A-2022F)
4
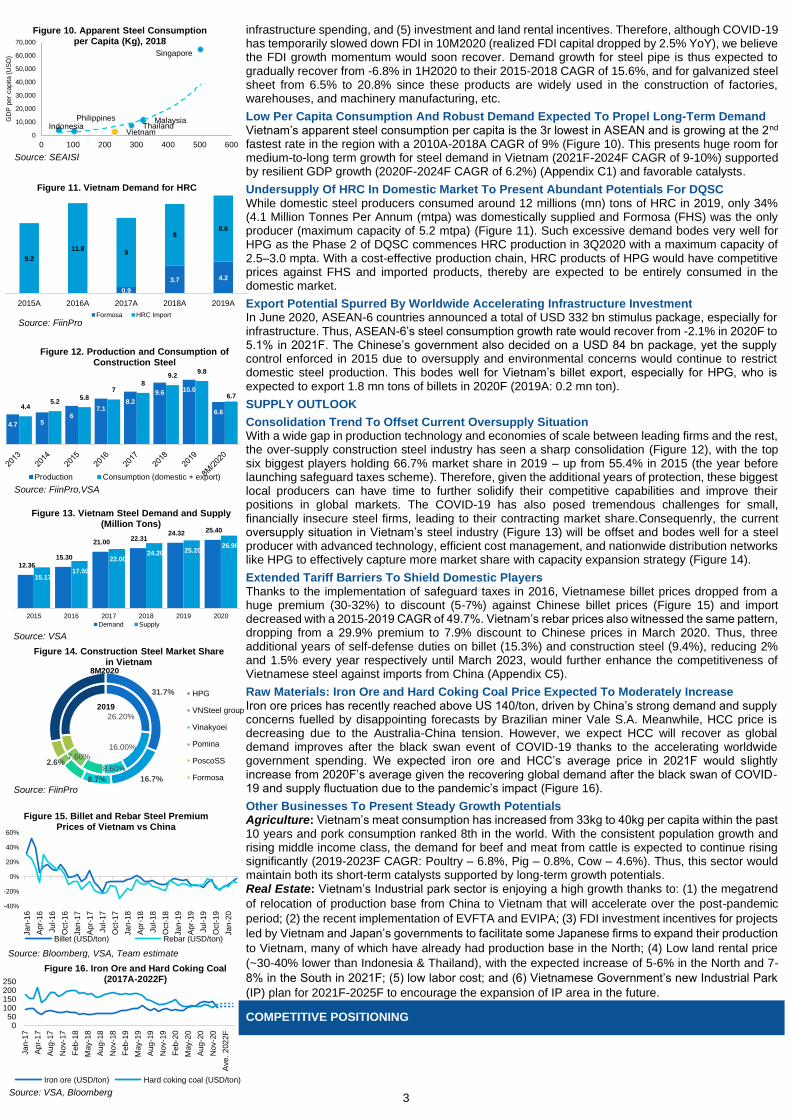
Thanks to the competitive pricing, close relationships with tier-1 agents, huge economies of scale, and superior product quality enhanced by deployment of world-leading technologies, HPG manages to have (1) high bargaining power with buyers, (2) low threat of new entrants; and (3) low threat of substitutes. Yet due to the highly competitive market and huge dependence on overseas suppliers, HPG has (4) relatively low bargaining power with suppliers and (5) moderate rivalry (Figure 17). Fully Integrated Production Chain To Create Huge Gap With Domestic Players HPG is one of the two steelmakers in Vietnam apart from Formosa to have an upstream integrated value chain from raw materials processing to finished products, including HRC production (Appendix B6). This creates a huge competitive advantage for HPG because with control over the production process, HPG can (1) enhance cost control and profit margins thanks to lower logistic cost and self-supplied HRC; (2) secure quality consistency and supply chain continuity; (3) improve demand forecast accuracy; and (4) remain resilient against raw materials and HRC price volatility. Lowest Production Cost Led By BF-BOF Technology And Self-Supplied Electricity HPG is one of the 3 steelmakers (with Formosa & Tisco) to deploy the BF-BOF Technology for making billets (BF-BOF: 95%, EAF: 5% of 2020F’s total capacity).The BF-BOF with cheaper material costs (iron ore, HCC and other) and advanced technology helps save 10-15% production cost per unit compared to all other domestic producers using the EAF technology (steel scrap – 80% of total cost) (Figure 20). Such diversified raw materials of BF-BOF partly shields HPG from commodity price risk. Notably, BF-BOF’s higher initial outlay, operation and maintenance cost as well as low feedstock flexibility compared with EAF act as huge barriers for other domestic producers to adopt BF-BOF technology. The heat generated during HCC processing with BF-BOF technology is also used for thermal power production, which helps self-supply ~80% of Hai Duong plant’s electricity demand and expected 60% of DQSC’s electricity demand. This further cements HPG’s cost advantage compared with domestic players and the primary reason why HPG is able to price its products the lowest among its peers (Figure 18). Unique Advantage Against Southern Peers Thanks To DQSC’s Deep-Water Seaport The deep-water seaport is strategically located in Dung Quat, Quang Ngai province – in the Central of Vietnam, having 11 docks and can accommodate up-to 200,000-ton ships. The port alleviates the HPG’s biggest hindrance to establish its dominance in the Southern market – logistic cost and geographical proximity to customers. Specifically, the port would facilitate importing input materials, exporting finished products from the complex to domestic (both Northern & Southern) and foreign markets. The production cost is also reduced by ~ VND 70,000 – 115,000 per ton, which poses a great cost advantage given that the firm must import millions of tons every year. The cost and geographical advantages of the deep-water seaport will pave the way for HPG to penetrate into this highly attractive market, which accounts for 50% of total domestic steel demand.
CORPORATE STRATEGY
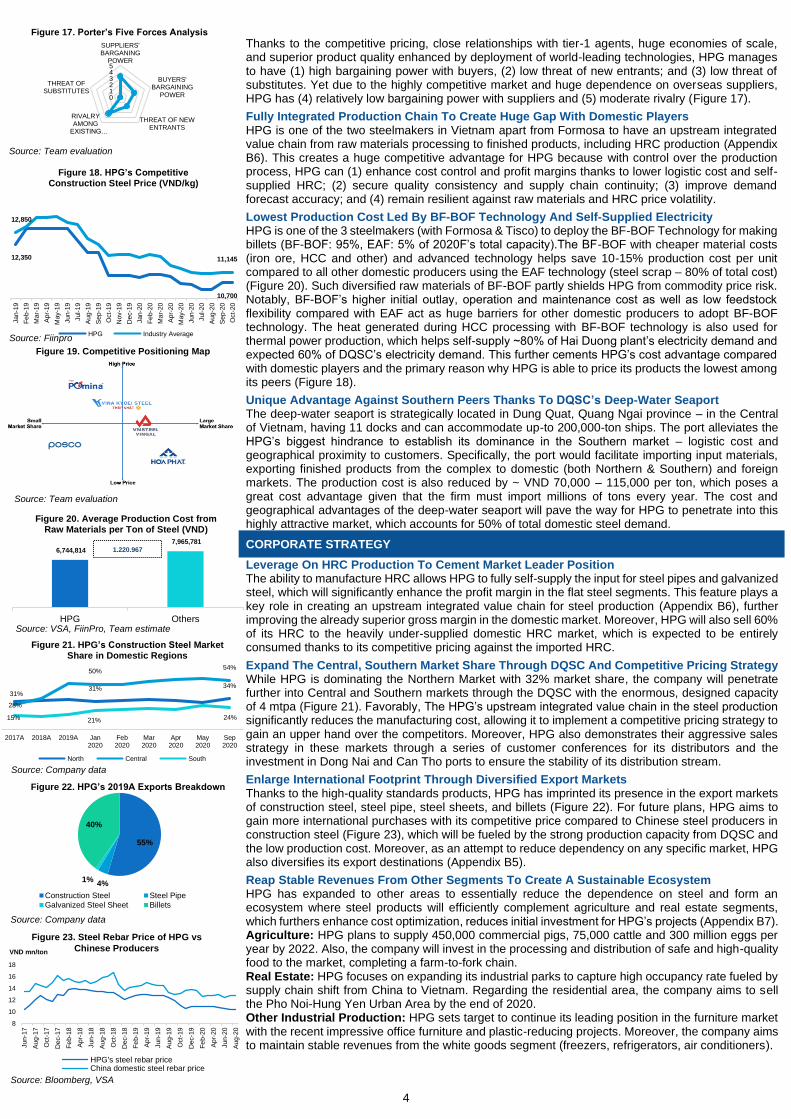
Leverage On HRC Production To Cement Market Leader Position The ability to manufacture HRC allows HPG to fully self-supply the input for steel pipes and galvanized steel, which will significantly enhance the profit margin in the flat steel segments. This feature plays a key role in creating an upstream integrated value chain for steel production (Appendix B6), further improving the already superior gross margin in the domestic market. Moreover, HPG will also sell 60% of its HRC to the heavily under-supplied domestic HRC market, which is expected to be entirely consumed thanks to its competitive pricing against the imported HRC. Expand The Central, Southern Market Share Through DQSC And Competitive Pricing Strategy While HPG is dominating the Northern Market with 32% market share, the company will penetrate further into Central and Southern markets through the DQSC with the enormous, designed capacity of 4 mtpa (Figure 21). Favorably, The HPG’s upstream integrated value chain in the steel production significantly reduces the manufacturing cost, allowing it to implement a competitive pricing strategy to gain an upper hand over the competitors. Moreover, HPG also demonstrates their aggressive sales strategy in these markets through a series of customer conferences for its distributors and the investment in Dong Nai and Can Tho ports to ensure the stability of its distribution stream. Enlarge International Footprint Through Diversified Export Markets Thanks to the high-quality standards products, HPG has imprinted its presence in the export markets of construction steel, steel pipe, steel sheets, and billets (Figure 22). For future plans, HPG aims to gain more international purchases with its competitive price compared to Chinese steel producers in construction steel (Figure 23), which will be fueled by the strong production capacity from DQSC and the low production cost. Moreover, as an attempt to reduce dependency on any specific market, HPG also diversifies its export destinations (Appendix B5). Reap Stable Revenues From Other Segments To Create A Sustainable Ecosystem HPG has expanded to other areas to essentially reduce the dependence on steel and form an ecosystem where steel products will efficiently complement agriculture and real estate segments, which furthers enhance cost optimization, reduces initial investment for HPG’s projects (Appendix B7). Agriculture: HPG plans to supply 450,000 commercial pigs, 75,000 cattle and 300 million eggs per year by 2022. Also, the company will invest in the processing and distribution of safe and high-quality food to the market, completing a farm-to-fork chain. Real Estate: HPG focuses on expanding its industrial parks to capture high occupancy rate fueled by supply chain shift from China to Vietnam. Regarding the residential area, the company aims to sell the Pho Noi-Hung Yen Urban Area by the end of 2020. Other Industrial Production: HPG sets target to continue its leading position in the furniture market with the recent impressive office furniture and plastic-reducing projects. Moreover, the company aims to maintain stable revenues from the white goods segment (freezers, refrigerators, air conditioners).
Source: Team evaluation
Figure 19. Competitive Positioning Map
Figure 21. HPG’s Construction Steel Market Share in Domestic Regions
Source: Company data
31%31% 34%
28%
50%54%
15% 21% 24%
2017A 2018A 2019A Jan2020
Feb2020
Mar2020
Apr2020
May2020
Sep2020
North Central South
012345
SUPPLIERS'BARGANING
POWER
BUYERS'BARGAINING
POWER
THREAT OF NEWENTRANTS
RIVALRYAMONG
EXISTING…
THREAT OFSUBSTITUTES
Source: Team evaluation
Figure 17. Porter’s Five Forces Analysis
Source: Fiinpro
12,350
10,700
12,850
11,145
Jan-1
9
Fe
b-1
9
Mar-
19
Apr-
19
May-1
9
Jun-1
9
Jul-19
Aug-1
9
Sep-1
9
Oct-
19
Nov-1
9
Dec-1
9
Jan-2
0
Fe
b-2
0
Mar-
20
Apr-
20
May-2
0
Jun-2
0
Jul-20
Aug-2
0
Sep-2
0
Oct-
20
HPG Industry Average
Figure 18. HPG’s Competitive Construction Steel Price (VND/kg)
Source: VSA, FiinPro, Team estimate
Figure 20. Average Production Cost from Raw Materials per Ton of Steel (VND)
1,220,967 6,744,814
7,965,781
HPG Others
55%
4%1%
40%
Construction Steel Steel Pipe
Galvanized Steel Sheet Billets
Figure 22. HPG’s 2019A Exports Breakdown
Source: Company data
8
10
12
14
16
18
Jun-1
7
Aug-1
7
Oct-
17
Dec-1
7
Fe
b-1
8
Apr-
18
Jun-1
8
Aug-1
8
Oct-
18
Dec-1
8
Fe
b-1
9
Apr-
19
Jun-1
9
Aug-1
9
Oct-
19
Dec-1
9
Fe
b-2
0
Apr-
20
Jun-2
0
Aug-2
0
VND mn/ton
HPG's steel rebar priceChina domestic steel rebar price
Figure 23. Steel Rebar Price of HPG vs
Chinese Producers
Source: Bloomberg, VSA
5
INVESTMENT SUMMARY
We issue a BUY recommendation on Hoa Phat Group JSC (HPG) with a 12-month target price of 40,610 VND/share, presenting an upside of 25.92% from its closing price of VND 32,250
on 15th November 2020 using Sum of the Parts valuation approach. HPG is currently traded at forward
P/E 2020F of 8.5x. However, we expect forward P/E 2021F to stand attractively at 7.0x given its remarkable performance outlook given the investment thesis below: Dung Quat Super Project To Solidify No.1 Steel Producer Position In Vietnam The company dominates the construction steel and steel pipe market with 26.2% and 31.5% market share respectively thanks to large production capacity, competitive pricing strategy, superior product quality. We expect HPG steel revenue will continue to grow strongly (2020F-2024F CAGR of 16.77%) through DQSC Project with 2 key drivers: Expansion to the Central and South of Vietnam & International markets with Construction Steel and High sales from commercialized Hot Rolled Coil. Double-Digit Growth Fueled By Favourable Industry Outlook
HPG will indirectly enjoy high growth driven by its bright industry position. Short-term growth dimensions are: (1) Fast track Government Spending of VND 470 trn on Infrastructure will stimulate the recovery for real estate and construction industry after Covid-19 thus boosting the steel consumption demand (growth rate: 0-3% 2020F & 10-15% 2021F-2023F), (2) beneficial short-term export opportunities from global infrastructure investment in which the ASEAN steel consumption growth is expected to be 5.1% in 2021. As for Long-term dimensions: the consistent FDI inflows in manufacturing will be the momentum for steel pipe demand and the real consumption growth rate of steel can register 9% - 10% over the medium-to-long term as domestic apparent steel consumption per capita in Vietnam is still the 3rd lowest in ASEAN and have room for exponential growth. Due to oversupply capacity in the market in recent years, the consolidation trend will benefits HPG as a dominant players to seize more market share from small EAF producers. HRC – Strategic Product Mix Expansion To Bolster Future Growth With DQSC, HPG has been able to produce HRC for both internal and external channels from Q3/2020. This marks the official presence of HPG in the HRC market of Vietnam, which has only two domestic suppliers. Aside from HPG, Formosa can only produce up to 5 mn tons, while demand was 12 mn tons in 2019. The competitive pricing strategy will allow HPG’s HRC to be entirely absorbed by the heavily undersupplied domestic market. Given the large DQSC’s HRC production capacity of 2.5-3mtpa, this product is envisioned to become the new revenue growth turbine for HPG moving forward. Superior Margins Enabled By Best-in-class Cost Structure While other competitors can only import HRC to produce flat steel products, the ability to produce in-house HRC allows HPG to become the only Vietnamese steel producer to own fully integrated production chain and cut down up to 10% total COGS. Moreover, (1) the efficient cost-control from BOF technology, (2) the self-supplied electricity, (3) DQSC’s deep-water seaport to reduce logistic cost, and (4) the strong market power to raise affordable selling prices will allow HPG enjoy high margins (from 23.33% 2019A gross margin to 35.69% 2024F) despite the expected increase in raw material prices. Lastly, high barriers to entry on investment, maintenance cost together with tariff barrier on imported steel products, will assist the company lower production cost to compete with China Steel in global market. Operational Excellence – Solid Financial Position Stands Strongly Under Grey Sky HPG’s Chairman and Board of Directors have a strong vision for HPG growth strategy. As experienced people in the industry, they have developed a great expansion strategy to match with the demand needs regardless of steel industry’s high cyclicity. All of HPG products ecosystem complement each other efficiently which optimizing the cost from initial investment for the company. Moreover, while the leverage ratio of HPG historically compared to industry peers is quite low, the BOD of HPG has strategically used the leverage efficiently (2019A net D/E of 0.7x) to expand the production scales with DQSC. Thanks to this, HPG in the future will enjoy high revenue growth, excellence profitability and strong cash flow generation which will provide HPG the flexibility to maximize shareholder returns. (ROE: 17.03% in 2019A to 28.00% in 2024F). Sustainable Ecosystem On The Back Of Other Segments’ Steady Growth The Agriculture segment is expected to have a steady revenue growth 2020F-2024F CAGR of 12%, accounting for 10-11% of total revenue during the next 5 years, due to the increasing demand for pork consumption and the firms’ expansion strategy to achieve the farm-to-fork product line and capacity. The Real Estate segment’s revenue is projected to have a 2020F-2024F CAGR of 10% thanks to the megatrend of production base relocation from China to Vietnam that will foster the demand for Industrial Park industry. Therefore, it will accelerate the potential value and occupancy rate in HPG Industrial Park with favorable location. Other Industrial Production segment is also expected to grow steadily given the current market leading position in office furniture and application of advanced technologies for product line extension from office furniture to home furniture. Sum-of-the-Parts Valuation Confirms Attractive Investment Rating As the company’s segments have different business models and risk profiles, we conduct Sum-of-the-Parts Valuation using the Discounted Free Cash Flow to value the Steel segment, Relative Valuation methodology using Relative P/E for Agriculture and Other Industrial Production, and P/B to value the Real Estate segment. The target price of VND 40,610 per share for HPG implies a 25.92% upside, reflecting attractive value for the company’s solid growth profile. Key Risks To Be Well-Hedged By Unrivalled Cost Advantage And Diversification Strategy Our research identifies raw materials price volatility and global trade protectionisms as the key risks faced by HPG. As such, we have incorporated the former risk into our scenario and sensitivity analysis to reflect its impact on our target price. HPG has the resources to mitigate these risks through the cost minimizing strategy and diversifying the export markets.
Figure 24. HPG’s EPS and EPS Growth
Source: Company data, Team estimate
4,074 3,015 2,726 3,442 5,012 5,538 5,863 6,145
-14.68%
-25.99%
-9.59%
26.27%
45.60%
10.50%
5.86% 4.81%
-30.00%
-20.00%
-10.00%
0.00%
10.00%
20.00%
30.00%
40.00%
50.00%
-
1,000
2,000
3,000
4,000
5,000
6,000
7,000
2017A 2018A 2019A 2020F 2021F 2022F 2023F 2024F
EPS EPS growth
Source: Company data, Team estimate
Figure 26. HPG’s Revenue Breakdown
(VND Trn)
46.16 55.84
63.66
90.99
112.28 119.32
126.64 132.52
-
20,000.00
40,000.00
60,000.00
80,000.00
100 ,000.00
120 ,000.00
140 ,000.00
2017A 2018A 2019A 2020F 2021F 2022F 2023F 2024F
Steel Agriculture Real Estate Other Industrials
Figure 25. HPG’s ROE and Net Margin
Source: Company data, Team estimate
30.65% 23.48% 17.03% 21.22% 27.74% 29.42% 27.94% 28.00%
17.34%
15.35%
11.82% 12.22%
15.01%
17.25%18.09%
19.06%
0.00%
5.00%
10.00%
15.00%
20.00%
25.00%
0.00%
5.00%
10.00%
15.00%
20.00%
25.00%
30.00%
35.00%
2017A 2018A 2019A 2020F 2021F 2022F 2023F 2024F
ROE Net margin
6
FINANCIAL ANALYSIS
Key Financial Metrics
2015A 2016A 2017A 2018A 2019A 2020F 2021F 2022F 2023F 2024F
Net Revenue (VND bn) 27,452.9 33,283.2 46,161.7 55,836.5 63,658.2 90,994.8 112,281.3 119,316.8 126,641.8 132,516.3
Net Revenue growth (%) 7.55% 21.24% 38.69% 20.96% 14.01% 42.94% 23.39% 6.27% 6.14% 4.64%
Dupont Analysis
Gross margin (%) 24.9% 31.1% 27.2% 24.8% 21.4% 25.23% 28.77% 31.15% 31.93% 32.86%
Operating margin (%) 14.53% 23.14% 20.12% 18.04% 14.29% 15.20% 18.69% 21.50% 22.55% 23.75%
Net margin (%) 12.70% 19.84% 17.34% 15.35% 11.82% 12.22% 15.01% 17.25% 18.09% 19.06%
Asset Turnover (times) 1.15 1.13 1.07 0.85 0.71 0.81 0.89 0.90 0.93 0.93
Financial Leverage (times) 1.80 1.71 1.65 1.80 2.04 2.14 2.09 1.90 1.67 1.58
Return on Asset (%) 14.65% 22.48% 18.57% 13.06% 8.36% 9.90% 13.29% 15.52% 16.77% 17.72%
Return on Equity (%) 26.37% 38.48% 30.65% 23.48% 17.03% 21.22% 27.74% 29.42% 27.94% 28.00%
Leverage Metrics
Debt to Equity (times) 0.31 0.10 0.27 0.54 0.67 0.79 0.59 0.42 0.30 0.22
Debt to Asset (times) 0.18 0.06 0.16 0.28 0.32 0.37 0.29 0.24 0.19 0.16
ssssDebt to EBITDA (times) 0.75 0.20 0.75 1.70 2.61 2.14 1.28 0.92 0.71 0.56
Liquidity Metrics Current ratio (times) 1.19 1.52 1.79 1.12 1.13 1.12 1.20 1.45 2.05 2.71
Quick ratio (times) 0.50 0.66 1.15 0.49 0.41 0.54 0.51 0.61 0.91 1.31
Efficiency Metrics
Days Receivables (days) 22.15 21.95 35.38 31.92 19.41 19.76 19.76 19.76 19.76 19.76
Days Inventories (days) 126.73 136.82 119.40 112.40 122.35 128.07 128.07 128.07 128.07 128.07
Days Payables (days) 41.30 44.33 41.36 53.21 53.50 41.37 41.37 41.37 41.37 41.37
Cash Cycle (days) 107.57 114.44 113.43 91.11 88.26 106.46 106.46 106.46 106.46 106.46
Shareholders Ratio
EPS (VND) 3,928 4,775 4,074 3,015 2,726 3,355 5,085 6,212 6,916 7,622
Dividend Payout Ratio (%) 20.00% 26.08% 27.78% 28.57% 23.08% 20.48% 20.00% 20.00% 20.00% 20.00%
0
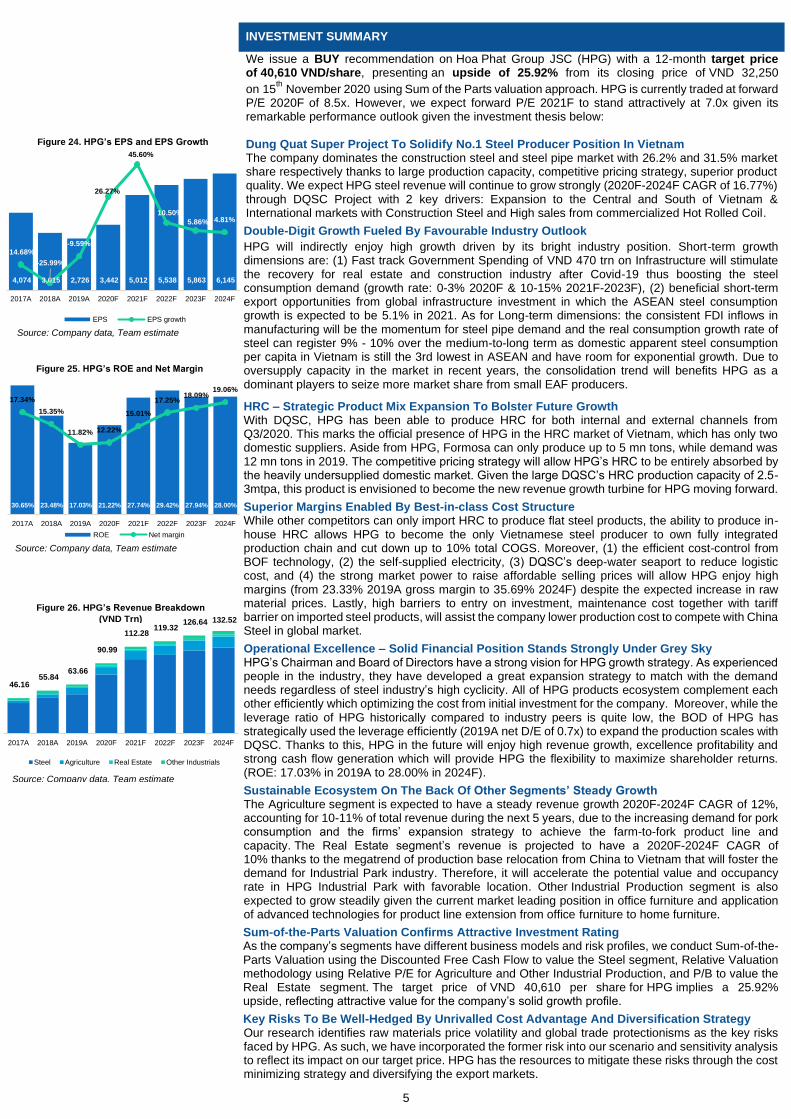
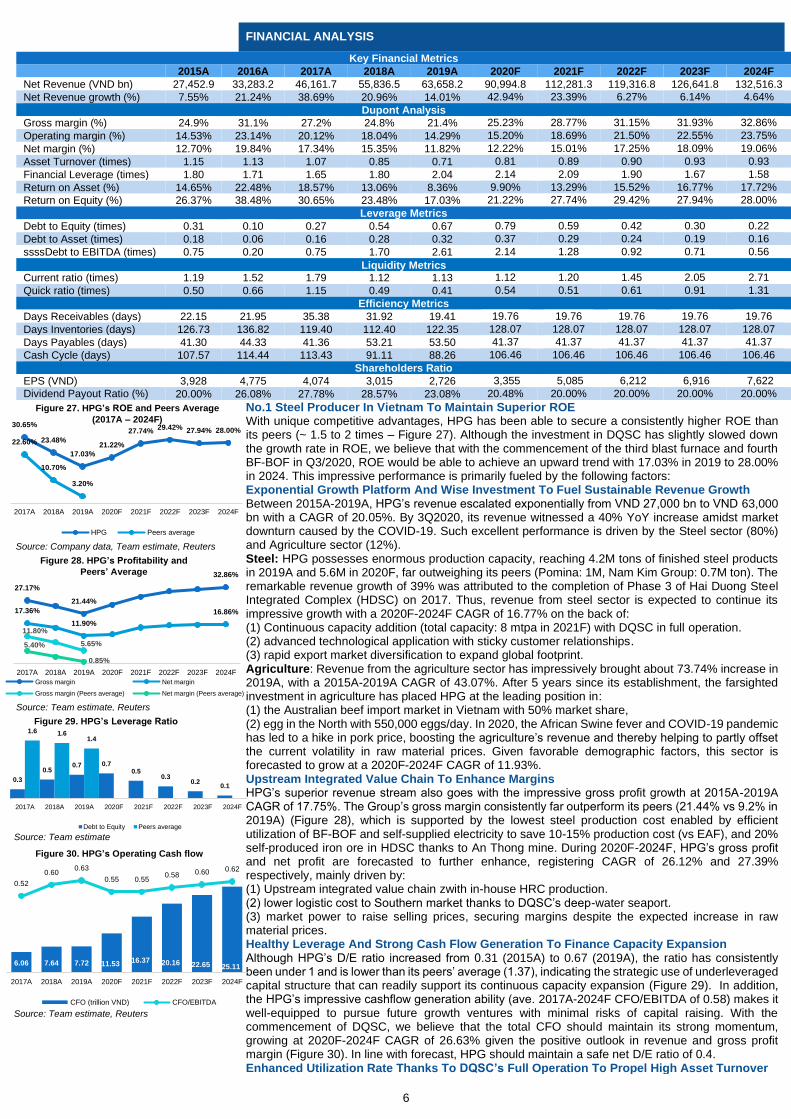
No.1 Steel Producer In Vietnam To Maintain Superior ROE With unique competitive advantages, HPG has been able to secure a consistently higher ROE than its peers (~ 1.5 to 2 times – Figure 27). Although the investment in DQSC has slightly slowed down the growth rate in ROE, we believe that with the commencement of the third blast furnace and fourth BF-BOF in Q3/2020, ROE would be able to achieve an upward trend with 17.03% in 2019 to 28.00% in 2024. This impressive performance is primarily fueled by the following factors: Exponential Growth Platform And Wise Investment To Fuel Sustainable Revenue Growth Between 2015A-2019A, HPG’s revenue escalated exponentially from VND 27,000 bn to VND 63,000 bn with a CAGR of 20.05%. By 3Q2020, its revenue witnessed a 40% YoY increase amidst market downturn caused by the COVID-19. Such excellent performance is driven by the Steel sector (80%) and Agriculture sector (12%). Steel: HPG possesses enormous production capacity, reaching 4.2M tons of finished steel products in 2019A and 5.6M in 2020F, far outweighing its peers (Pomina: 1M, Nam Kim Group: 0.7M ton). The remarkable revenue growth of 39% was attributed to the completion of Phase 3 of Hai Duong Steel Integrated Complex (HDSC) on 2017. Thus, revenue from steel sector is expected to continue its impressive growth with a 2020F-2024F CAGR of 16.77% on the back of: (1) Continuous capacity addition (total capacity: 8 mtpa in 2021F) with DQSC in full operation. (2) advanced technological application with sticky customer relationships. (3) rapid export market diversification to expand global footprint. Agriculture: Revenue from the agriculture sector has impressively brought about 73.74% increase in 2019A, with a 2015A-2019A CAGR of 43.07%. After 5 years since its establishment, the farsighted investment in agriculture has placed HPG at the leading position in: (1) the Australian beef import market in Vietnam with 50% market share, (2) egg in the North with 550,000 eggs/day. In 2020, the African Swine fever and COVID-19 pandemic has led to a hike in pork price, boosting the agriculture’s revenue and thereby helping to partly offset the current volatility in raw material prices. Given favorable demographic factors, this sector is forecasted to grow at a 2020F-2024F CAGR of 11.93%. Upstream Integrated Value Chain To Enhance Margins HPG’s superior revenue stream also goes with the impressive gross profit growth at 2015A-2019A CAGR of 17.75%. The Group’s gross margin consistently far outperform its peers (21.44% vs 9.2% in 2019A) (Figure 28), which is supported by the lowest steel production cost enabled by efficient utilization of BF-BOF and self-supplied electricity to save 10-15% production cost (vs EAF), and 20% self-produced iron ore in HDSC thanks to An Thong mine. During 2020F-2024F, HPG’s gross profit and net profit are forecasted to further enhance, registering CAGR of 26.12% and 27.39% respectively, mainly driven by: (1) Upstream integrated value chain zwith in-house HRC production. (2) lower logistic cost to Southern market thanks to DQSC’s deep-water seaport. (3) market power to raise selling prices, securing margins despite the expected increase in raw material prices. Healthy Leverage And Strong Cash Flow Generation To Finance Capacity Expansion Although HPG’s D/E ratio increased from 0.31 (2015A) to 0.67 (2019A), the ratio has consistently been under 1 and is lower than its peers’ average (1.37), indicating the strategic use of underleveraged capital structure that can readily support its continuous capacity expansion (Figure 29). In addition, the HPG’s impressive cashflow generation ability (ave. 2017A-2024F CFO/EBITDA of 0.58) makes it well-equipped to pursue future growth ventures with minimal risks of capital raising. With the commencement of DQSC, we believe that the total CFO should maintain its strong momentum, growing at 2020F-2024F CAGR of 26.63% given the positive outlook in revenue and gross profit margin (Figure 30). In line with forecast, HPG should maintain a safe net D/E ratio of 0.4. Enhanced Utilization Rate Thanks To DQSC’s Full Operation To Propel High Asset Turnover
Figure 27. HPG’s ROE and Peers Average
(2017A – 2024F)
Source: Company data, Team estimate, Reuters
30.65%
23.48%
17.03%
21.22%
27.74%29.42% 27.94% 28.00%
22.60%
10.70%
3.20%
2017A 2018A 2019A 2020F 2021F 2022F 2023F 2024F
HPG Peers average
Source: Team estimate, Reuters
27.17%
21.44%
32.86%
17.36%
11.90%
16.86%
11.80%
5.65%5.40%
0.85%
2017A 2018A 2019A 2020F 2021F 2022F 2023F 2024F
Gross margin Net margin
Gross margin (Peers average) Net margin (Peers average)
Figure 28. HPG’s Profitability and
Peers’ Average
Source: Team estimate, Reuters
Figure 30. HPG’s Operating Cash flow
6.06 7.64 7.72 11.5316.37 20.16 22.65 25.11
0.52
0.600.63
0.55 0.550.58 0.60 0.62
0.00
0.10
0.20
0.30
0.40
0.50
0.60
0.70
0.00
5.00
10.00
15.00
20.00
25.00
30.00
2017A 2018A 2019A 2020F 2021F 2022F 2023F 2024F
CFO (trillion VND) CFO/EBITDA
Source: Team estimate
Figure 29. HPG’s Leverage Ratio
0.3
0.50.7 0.7
0.50.3
0.20.1
1.6 1.61.4
2017A 2018A 2019A 2020F 2021F 2022F 2023F 2024F
Debt to Equity Peers average
7
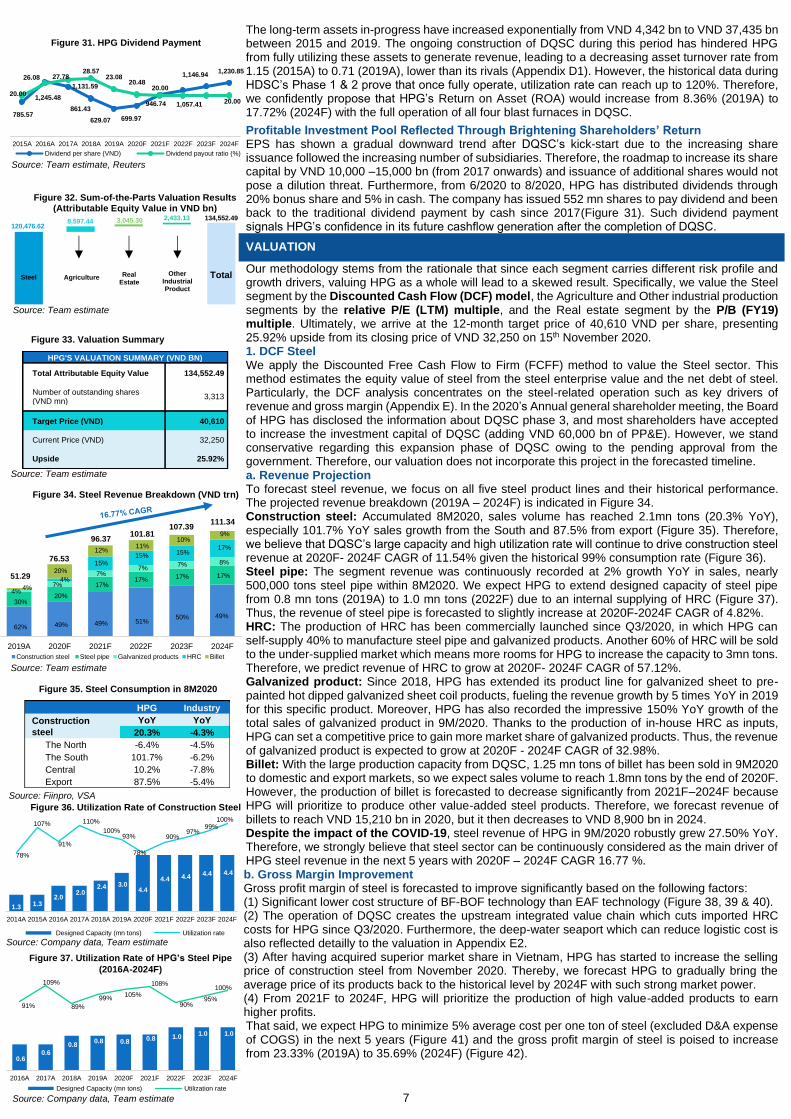
The long-term assets in-progress have increased exponentially from VND 4,342 bn to VND 37,435 bn between 2015 and 2019. The ongoing construction of DQSC during this period has hindered HPG from fully utilizing these assets to generate revenue, leading to a decreasing asset turnover rate from 1.15 (2015A) to 0.71 (2019A), lower than its rivals (Appendix D1). However, the historical data during HDSC’s Phase 1 & 2 prove that once fully operate, utilization rate can reach up to 120%. Therefore, we confidently propose that HPG’s Return on Asset (ROA) would increase from 8.36% (2019A) to 17.72% (2024F) with the full operation of all four blast furnaces in DQSC. Profitable Investment Pool Reflected Through Brightening Shareholders’ Return EPS has shown a gradual downward trend after DQSC’s kick-start due to the increasing share issuance followed the increasing number of subsidiaries. Therefore, the roadmap to increase its share capital by VND 10,000 –15,000 bn (from 2017 onwards) and issuance of additional shares would not pose a dilution threat. Furthermore, from 6/2020 to 8/2020, HPG has distributed dividends through 20% bonus share and 5% in cash. The company has issued 552 mn shares to pay dividend and been back to the traditional dividend payment by cash since 2017(Figure 31). Such dividend payment signals HPG’s confidence in its future cashflow generation after the completion of DQSC.
VALUATION
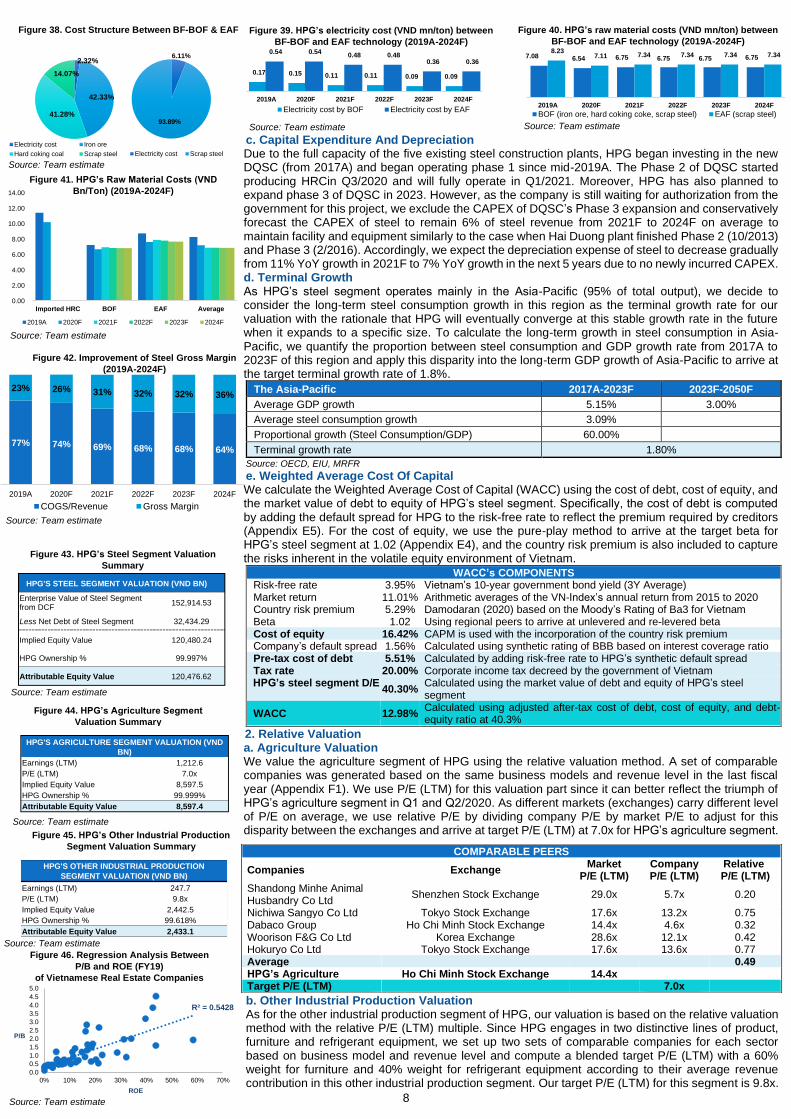
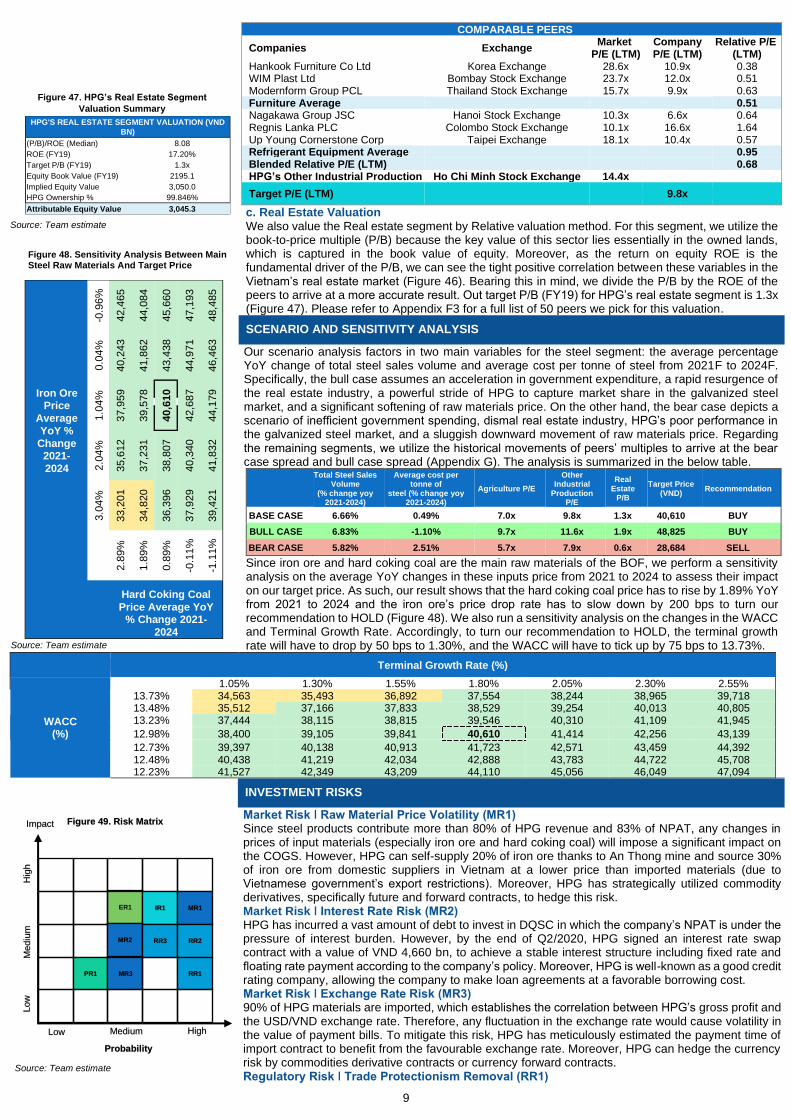
Our methodology stems from the rationale that since each segment carries different risk profile and growth drivers, valuing HPG as a whole will lead to a skewed result. Specifically, we value the Steel segment by the Discounted Cash Flow (DCF) model, the Agriculture and Other industrial production segments by the relative P/E (LTM) multiple, and the Real estate segment by the P/B (FY19) multiple. Ultimately, we arrive at the 12-month target price of 40,610 VND per share, presenting 25.92% upside from its closing price of VND 32,250 on 15th November 2020. 1. DCF Steel We apply the Discounted Free Cash Flow to Firm (FCFF) method to value the Steel sector. This method estimates the equity value of steel from the steel enterprise value and the net debt of steel. Particularly, the DCF analysis concentrates on the steel-related operation such as key drivers of revenue and gross margin (Appendix E). In the 2020’s Annual general shareholder meeting, the Board of HPG has disclosed the information about DQSC phase 3, and most shareholders have accepted to increase the investment capital of DQSC (adding VND 60,000 bn of PP&E). However, we stand conservative regarding this expansion phase of DQSC owing to the pending approval from the government. Therefore, our valuation does not incorporate this project in the forecasted timeline. a. Revenue Projection To forecast steel revenue, we focus on all five steel product lines and their historical performance. The projected revenue breakdown (2019A – 2024F) is indicated in Figure 34. Construction steel: Accumulated 8M2020, sales volume has reached 2.1mn tons (20.3% YoY), especially 101.7% YoY sales growth from the South and 87.5% from export (Figure 35). Therefore, we believe that DQSC’s large capacity and high utilization rate will continue to drive construction steel revenue at 2020F- 2024F CAGR of 11.54% given the historical 99% consumption rate (Figure 36). Steel pipe: The segment revenue was continuously recorded at 2% growth YoY in sales, nearly 500,000 tons steel pipe within 8M2020. We expect HPG to extend designed capacity of steel pipe from 0.8 mn tons (2019A) to 1.0 mn tons (2022F) due to an internal supplying of HRC (Figure 37). Thus, the revenue of steel pipe is forecasted to slightly increase at 2020F-2024F CAGR of 4.82%. HRC: The production of HRC has been commercially launched since Q3/2020, in which HPG can self-supply 40% to manufacture steel pipe and galvanized products. Another 60% of HRC will be sold to the under-supplied market which means more rooms for HPG to increase the capacity to 3mn tons. Therefore, we predict revenue of HRC to grow at 2020F- 2024F CAGR of 57.12%. Galvanized product: Since 2018, HPG has extended its product line for galvanized sheet to pre-painted hot dipped galvanized sheet coil products, fueling the revenue growth by 5 times YoY in 2019 for this specific product. Moreover, HPG has also recorded the impressive 150% YoY growth of the total sales of galvanized product in 9M/2020. Thanks to the production of in-house HRC as inputs, HPG can set a competitive price to gain more market share of galvanized products. Thus, the revenue of galvanized product is expected to grow at 2020F - 2024F CAGR of 32.98%. Billet: With the large production capacity from DQSC, 1.25 mn tons of billet has been sold in 9M2020 to domestic and export markets, so we expect sales volume to reach 1.8mn tons by the end of 2020F. However, the production of billet is forecasted to decrease significantly from 2021F–2024F because HPG will prioritize to produce other value-added steel products. Therefore, we forecast revenue of billets to reach VND 15,210 bn in 2020, but it then decreases to VND 8,900 bn in 2024. Despite the impact of the COVID-19, steel revenue of HPG in 9M/2020 robustly grew 27.50% YoY. Therefore, we strongly believe that steel sector can be continuously considered as the main driver of HPG steel revenue in the next 5 years with 2020F – 2024F CAGR 16.77 %. b. Gross Margin Improvement Gross profit margin of steel is forecasted to improve significantly based on the following factors: (1) Significant lower cost structure of BF-BOF technology than EAF technology (Figure 38, 39 & 40). (2) The operation of DQSC creates the upstream integrated value chain which cuts imported HRC costs for HPG since Q3/2020. Furthermore, the deep-water seaport which can reduce logistic cost is also reflected detailly to the valuation in Appendix E2. (3) After having acquired superior market share in Vietnam, HPG has started to increase the selling price of construction steel from November 2020. Thereby, we forecast HPG to gradually bring the average price of its products back to the historical level by 2024F with such strong market power. (4) From 2021F to 2024F, HPG will prioritize the production of high value-added products to earn higher profits. That said, we expect HPG to minimize 5% average cost per one ton of steel (excluded D&A expense of COGS) in the next 5 years (Figure 41) and the gross profit margin of steel is poised to increase from 23.33% (2019A) to 35.69% (2024F) (Figure 42).
Figure 32. Sum-of-the-Parts Valuation Results (Attributable Equity Value in VND bn)
Source: Team estimate
120,476.62
134,552.498,597.44 3,045.30 2,433.13
3.00
20,003.00
40,003.00
60,003.00
80,003.00
100,003.00
120,003.00
140,003.00
Steel Agriculture Other Industrial Product
Real Estate Total
Figure 34. Steel Revenue Breakdown (VND trn)
Source: Team estimate
2019A 2020F 2021F 2022F 2023F 2024F
Construction steel Steel pipe Galvanized products HRC Billet
51.29 76.53
96.37 101.81 107.39 111.34
62%
30% 4%
4%
49%
20% 4%
20% 7%
49%
17%
15% 12%
7%
51%
17%
11% 15% 7%
50%
17%
10% 15% 7%
49%
17%
9% 17% 8%
Figure 37. Utilization Rate of HPG’s Steel Pipe (2016A-2024F)
Source: Company data, Team estimate
0.6 0.6
0.8 0.8 0.8 0.8 1.0 1.0 1.0
91%
109%
89%
99%105%
108%
90%95%
100%
0%
20%
40%
60%
80%
100%
120%
(0.3)
0.2
0.7
1.2
1.7
2.2
2016A 2017A 2018A 2019A 2020F 2021F 2022F 2023F 2024F
Designed Capacity (mn tons) Utilization rate
Figure 36. Utilization Rate of Construction Steel
Source: Company data, Team estimate
1.3 1.3 2.0
2.0 2.4 3.0
4.4
4.4 4.4 4.4 4.4
78%
107%
91%
110%
100%93%
78%
90%97%
99%100%
0%
20%
40%
60%
80%
100%
120%
(0.6)
0.4
1.4
2.4
3.4
4.4
5.4
6.4
7.4
2014A 2015A 2016A 2017A 2018A 2019A 2020F 2021F 2022F 2023F 2024F
Designed Capacity (mn tons) Utilization rate
Source: Team estimate, Reuters
785.57
1,245.48
1,131.59
861.43
629.07 699.97
946.74 1,057.41
1,146.94 1,230.85
20.00
26.08 27.7828.57
23.0820.48
20.00
20.00
2015A 2016A 2017A 2018A 2019A 2020F 2021F 2022F 2023F 2024F
Dividend per share (VND) Dividend payout ratio (%)
Figure 31. HPG Dividend Payment
Figure 33. Valuation Summary
Source: Team estimate
HPG'S VALUATION SUMMARY (VND BN)
Total Attributable Equity Value 134,552.49
Number of outstanding shares (VND mn)
3,313
Target Price (VND) 40,610
Current Price (VND) 32,250
Upside 25.92%
Figure 35. Steel Consumption in 8M2020
HPG Industry
Construction
steel
YoY YoY
20.3% -4.3%
The North -6.4% -4.5%
The South 101.7% -6.2%
Central 10.2% -7.8%
Export 87.5% -5.4%
Source: Fiinpro, VSA
8
c. Capital Expenditure And Depreciation Due to the full capacity of the five existing steel construction plants, HPG began investing in the new DQSC (from 2017A) and began operating phase 1 since mid-2019A. The Phase 2 of DQSC started producing HRCin Q3/2020 and will fully operate in Q1/2021. Moreover, HPG has also planned to expand phase 3 of DQSC in 2023. However, as the company is still waiting for authorization from the government for this project, we exclude the CAPEX of DQSC’s Phase 3 expansion and conservatively forecast the CAPEX of steel to remain 6% of steel revenue from 2021F to 2024F on average to maintain facility and equipment similarly to the case when Hai Duong plant finished Phase 2 (10/2013) and Phase 3 (2/2016). Accordingly, we expect the depreciation expense of steel to decrease gradually from 11% YoY growth in 2021F to 7% YoY growth in the next 5 years due to no newly incurred CAPEX. d. Terminal Growth As HPG’s steel segment operates mainly in the Asia-Pacific (95% of total output), we decide to consider the long-term steel consumption growth in this region as the terminal growth rate for our valuation with the rationale that HPG will eventually converge at this stable growth rate in the future when it expands to a specific size. To calculate the long-term growth in steel consumption in Asia-Pacific, we quantify the proportion between steel consumption and GDP growth rate from 2017A to 2023F of this region and apply this disparity into the long-term GDP growth of Asia-Pacific to arrive at the target terminal growth rate of 1.8%.
The Asia-Pacific 2017A-2023F 2023F-2050F
Average GDP growth 5.15% 3.00%
Average steel consumption growth 3.09%
Proportional growth (Steel Consumption/GDP) 60.00%
Terminal growth rate 1.80%
Source: OECD, EIU, MRFR
e. Weighted Average Cost Of Capital We calculate the Weighted Average Cost of Capital (WACC) using the cost of debt, cost of equity, and the market value of debt to equity of HPG’s steel segment. Specifically, the cost of debt is computed by adding the default spread for HPG to the risk-free rate to reflect the premium required by creditors (Appendix E5). For the cost of equity, we use the pure-play method to arrive at the target beta for HPG’s steel segment at 1.02 (Appendix E4), and the country risk premium is also included to capture the risks inherent in the volatile equity environment of Vietnam.
WACC’s COMPONENTS Risk-free rate 3.95% Vietnam’s 10-year government bond yield (3Y Average) Market return 11.01% Arithmetic averages of the VN-Index’s annual return from 2015 to 2020 Country risk premium 5.29% Damodaran (2020) based on the Moody’s Rating of Ba3 for Vietnam Beta 1.02 Using regional peers to arrive at unlevered and re-levered beta Cost of equity 16.42% CAPM is used with the incorporation of the country risk premium Company’s default spread 1.56% Calculated using synthetic rating of BBB based on interest coverage ratio Pre-tax cost of debt 5.51% Calculated by adding risk-free rate to HPG’s synthetic default spread Tax rate 20.00% Corporate income tax decreed by the government of Vietnam
HPG’s steel segment D/E 40.30%
Calculated using the market value of debt and equity of HPG’s steel segment
WACC 12.98% Calculated using adjusted after-tax cost of debt, cost of equity, and debt-equity ratio at 40.3%
2. Relative Valuation a. Agriculture Valuation We value the agriculture segment of HPG using the relative valuation method. A set of comparable companies was generated based on the same business models and revenue level in the last fiscal year (Appendix F1). We use P/E (LTM) for this valuation part since it can better reflect the triumph of HPG’s agriculture segment in Q1 and Q2/2020. As different markets (exchanges) carry different level of P/E on average, we use relative P/E by dividing company P/E by market P/E to adjust for this disparity between the exchanges and arrive at target P/E (LTM) at 7.0x for HPG’s agriculture segment.
b. Other Industrial Production Valuation As for the other industrial production segment of HPG, our valuation is based on the relative valuation method with the relative P/E (LTM) multiple. Since HPG engages in two distinctive lines of product, furniture and refrigerant equipment, we set up two sets of comparable companies for each sector based on business model and revenue level and compute a blended target P/E (LTM) with a 60% weight for furniture and 40% weight for refrigerant equipment according to their average revenue contribution in this other industrial production segment. Our target P/E (LTM) for this segment is 9.8x.
COMPARABLE PEERS
Companies Exchange Market
P/E (LTM) Company P/E (LTM)
Relative P/E (LTM)
Shandong Minhe Animal Husbandry Co Ltd
Shenzhen Stock Exchange 29.0x 5.7x 0.20
Nichiwa Sangyo Co Ltd Tokyo Stock Exchange 17.6x 13.2x 0.75 Dabaco Group Ho Chi Minh Stock Exchange 14.4x 4.6x 0.32 Woorison F&G Co Ltd Korea Exchange 28.6x 12.1x 0.42 Hokuryo Co Ltd Tokyo Stock Exchange 17.6x 13.6x 0.77 Average 0.49 HPG’s Agriculture Ho Chi Minh Stock Exchange 14.4x
Target P/E (LTM) 7.0x
0.00
2.00
4.00
6.00
8.00
10.00
12.00
14.00
Imported HRC BOF EAF Average
2019A 2020F 2021F 2022F 2023F 2024F
Source: Team estimate
Figure 41. HPG’s Raw Material Costs (VND
Bn/Ton) (2019A-2024F)
Figure 42. Improvement of Steel Gross Margin
(2019A-2024F)
Source: Team estimate
77% 74% 69% 68% 68% 64%
23% 26% 31% 32% 32% 36%
0%
20%
40%
60%
80%
2019A 2020F 2021F 2022F 2023F 2024F
COGS/Revenue Gross Margin
R² = 0.5428
0.0
0.5
1.0
1.5
2.0
2.5
3.0
3.5
4.0
4.5
5.0
0% 10% 20% 30% 40% 50% 60% 70%
P/B
ROE
Figure 46. Regression Analysis Between
P/B and ROE (FY19) of Vietnamese Real Estate Companies
Source: Team estimate
Source: Team estimate
6.11%
93.89%
Electricity cost Scrap steel
2.32%
42.33%
41.28%
14.07%
Electricity cost Iron ore
Hard coking coal Scrap steel
Figure 38. Cost Structure Between BF-BOF & EAF
7.08 6.54 6.75 6.75 6.75 6.75 8.23
7.11 7.34 7.34 7.34 7.34
-
1.00
2.00
3.00
4.00
5.00
6.00
7.00
8.00
9.00
2019A 2020F 2021F 2022F 2023F 2024F
BOF (iron ore, hard coking coke, scrap steel) EAF (scrap steel)
Figure 40. HPG’s raw material costs (VND mn/ton) between
BF-BOF and EAF technology (2019A-2024F)
Source: Team estimate
0.17 0.15 0.11 0.11 0.09 0.09
0.54 0.54 0.48 0.48
0.36 0.36
2019A 2020F 2021F 2022F 2023F 2024F
Electricity cost by BOF Electricity cost by EAF
Figure 39. HPG’s electricity cost (VND mn/ton) between
BF-BOF and EAF technology (2019A-2024F)
Source: Team estimate
HPG'S STEEL SEGMENT VALUATION (VND BN) Enterprise Value of Steel Segment from DCF 152,914.53 Less Net Debt of Steel Segment 32,434.29 Implied Equity Value 120,480.24 HPG Ownership % 99.997% Attributable Equity Value 120,476.62
Figure 43. HPG’s Steel Segment Valuation
Summary
Source: Team estimate Figure 44. HPG’s Agriculture Segment
Valuation Summary
HPG'S AGRICULTURE SEGMENT VALUATION (VND
BN)
Earnings (LTM) 1,212.6
P/E (LTM) 7.0x
Implied Equity Value 8,597.5
HPG Ownership % 99.999%
Attributable Equity Value 8,597.4
Source: Team estimate
HPG'S OTHER INDUSTRIAL PRODUCTION
SEGMENT VALUATION (VND BN) Earnings (LTM) 247.7 P/E (LTM) 9.8x Implied Equity Value 2,442.5 HPG Ownership % 99.618% Attributable Equity Value 2,433.1 Source: Team estimate
Figure 45. HPG’s Other Industrial Production
Segment Valuation Summary
9
COMPARABLE PEERS
Companies Exchange Market
P/E (LTM) Company P/E (LTM)
Relative P/E (LTM)
Hankook Furniture Co Ltd Korea Exchange 28.6x 10.9x 0.38 WIM Plast Ltd Bombay Stock Exchange 23.7x 12.0x 0.51 Modernform Group PCL Thailand Stock Exchange 15.7x 9.9x 0.63 Furniture Average 0.51 Nagakawa Group JSC Hanoi Stock Exchange 10.3x 6.6x 0.64 Regnis Lanka PLC Colombo Stock Exchange 10.1x 16.6x 1.64 Up Young Cornerstone Corp Taipei Exchange 18.1x 10.4x 0.57 Refrigerant Equipment Average 0.95 Blended Relative P/E (LTM) 0.68 HPG’s Other Industrial Production Ho Chi Minh Stock Exchange 14.4x
Target P/E (LTM) 9.8x
c. Real Estate Valuation We also value the Real estate segment by Relative valuation method. For this segment, we utilize the book-to-price multiple (P/B) because the key value of this sector lies essentially in the owned lands, which is captured in the book value of equity. Moreover, as the return on equity ROE is the fundamental driver of the P/B, we can see the tight positive correlation between these variables in the Vietnam’s real estate market (Figure 46). Bearing this in mind, we divide the P/B by the ROE of the peers to arrive at a more accurate result. Out target P/B (FY19) for HPG’s real estate segment is 1.3x (Figure 47). Please refer to Appendix F3 for a full list of 50 peers we pick for this valuation.
SCENARIO AND SENSITIVITY ANALYSIS
Our scenario analysis factors in two main variables for the steel segment: the average percentage YoY change of total steel sales volume and average cost per tonne of steel from 2021F to 2024F. Specifically, the bull case assumes an acceleration in government expenditure, a rapid resurgence of the real estate industry, a powerful stride of HPG to capture market share in the galvanized steel market, and a significant softening of raw materials price. On the other hand, the bear case depicts a scenario of inefficient government spending, dismal real estate industry, HPG’s poor performance in the galvanized steel market, and a sluggish downward movement of raw materials price. Regarding the remaining segments, we utilize the historical movements of peers’ multiples to arrive at the bear case spread and bull case spread (Appendix G). The analysis is summarized in the below table.
Total Steel Sales Volume
(% change yoy 2021-2024)
Average cost per tonne of
steel (% change yoy 2021-2024)
Agriculture P/E
Other Industrial
Production P/E
Real Estate
P/B
Target Price (VND)
Recommendation
BASE CASE 6.66% 0.49% 7.0x 9.8x 1.3x 40,610 BUY
BULL CASE 6.83% -1.10% 9.7x 11.6x 1.9x 48,825 BUY
BEAR CASE 5.82% 2.51% 5.7x 7.9x 0.6x 28,684 SELL
Since iron ore and hard coking coal are the main raw materials of the BOF, we perform a sensitivity analysis on the average YoY changes in these inputs price from 2021 to 2024 to assess their impact on our target price. As such, our result shows that the hard coking coal price has to rise by 1.89% YoY from 2021 to 2024 and the iron ore’s price drop rate has to slow down by 200 bps to turn our recommendation to HOLD (Figure 48). We also run a sensitivity analysis on the changes in the WACC and Terminal Growth Rate. Accordingly, to turn our recommendation to HOLD, the terminal growth rate will have to drop by 50 bps to 1.30%, and the WACC will have to tick up by 75 bps to 13.73%.
Terminal Growth Rate (%)
WACC (%)
1.05% 1.30% 1.55% 1.80% 2.05% 2.30% 2.55% 13.73% 34,563 35,493 36,892 37,554 38,244 38,965 39,718 13.48% 35,512 37,166 37,833 38,529 39,254 40,013 40,805 13.23% 37,444 38,115 38,815 39,546 40,310 41,109 41,945
12.98% 38,400 39,105 39,841 40,610 41,414 42,256 43,139
12.73% 39,397 40,138 40,913 41,723 42,571 43,459 44,392 12.48% 40,438 41,219 42,034 42,888 43,783 44,722 45,708 12.23% 41,527 42,349 43,209 44,110 45,056 46,049 47,094
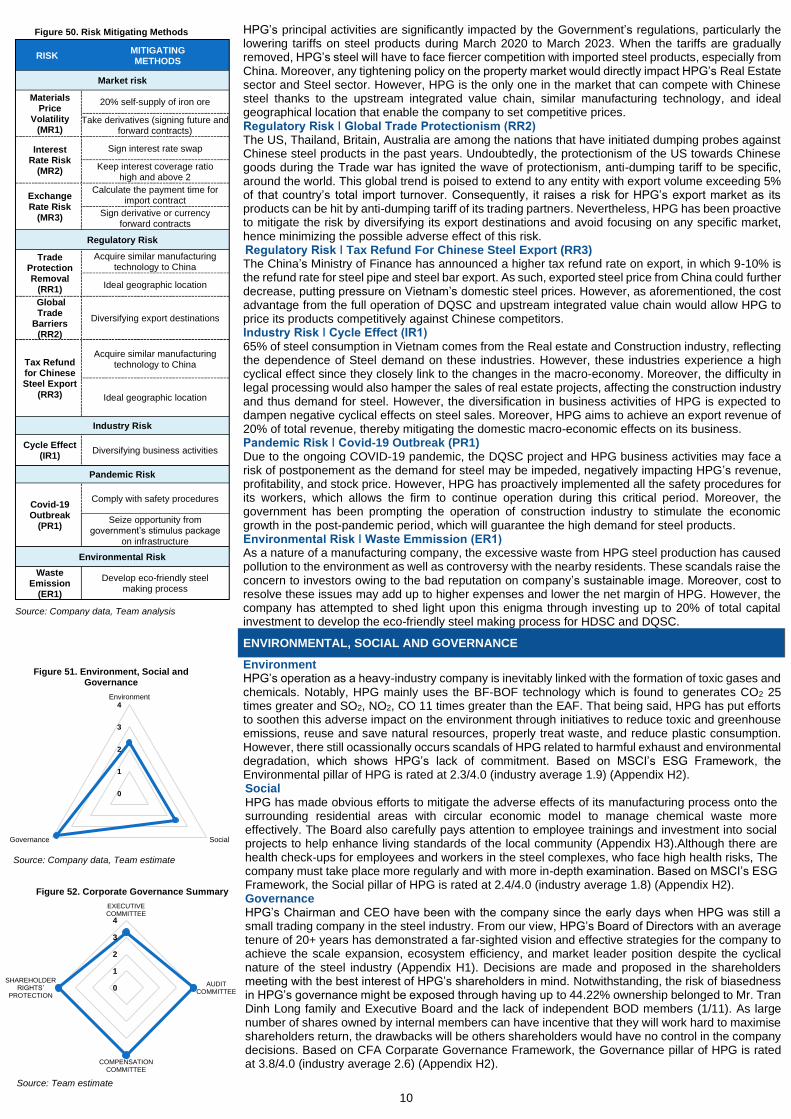
INVESTMENT RISKS
Market Risk ǀ Raw Material Price Volatility (MR1) Since steel products contribute more than 80% of HPG revenue and 83% of NPAT, any changes in prices of input materials (especially iron ore and hard coking coal) will impose a significant impact on the COGS. However, HPG can self-supply 20% of iron ore thanks to An Thong mine and source 30% of iron ore from domestic suppliers in Vietnam at a lower price than imported materials (due to Vietnamese government’s export restrictions). Moreover, HPG has strategically utilized commodity derivatives, specifically future and forward contracts, to hedge this risk. Market Risk ǀ Interest Rate Risk (MR2) HPG has incurred a vast amount of debt to invest in DQSC in which the company’s NPAT is under the pressure of interest burden. However, by the end of Q2/2020, HPG signed an interest rate swap contract with a value of VND 4,660 bn, to achieve a stable interest structure including fixed rate and floating rate payment according to the company’s policy. Moreover, HPG is well-known as a good credit rating company, allowing the company to make loan agreements at a favorable borrowing cost. Market Risk ǀ Exchange Rate Risk (MR3) 90% of HPG materials are imported, which establishes the correlation between HPG’s gross profit and the USD/VND exchange rate. Therefore, any fluctuation in the exchange rate would cause volatility in the value of payment bills. To mitigate this risk, HPG has meticulously estimated the payment time of import contract to benefit from the favourable exchange rate. Moreover, HPG can hedge the currency risk by commodities derivative contracts or currency forward contracts. Regulatory Risk ǀ Trade Protectionism Removal (RR1)
ER1
High Medium
Mediu
m
Hig
h
Low
HPG'S REAL ESTATE SEGMENT VALUATION (VND
BN) (P/B)/ROE (Median) 8.08 ROE (FY19) 17.20% Target P/B (FY19) 1.3x Equity Book Value (FY19) 2195.1 Implied Equity Value 3,050.0 HPG Ownership % 99.846% Attributable Equity Value 3,045.3
Figure 47. HPG’s Real Estate Segment
Valuation Summary
Source: Team estimate
Iron Ore Price
Average
YoY %
Change 2021-
2024
3.0
4%
2.0
4%
1.0
4%
0.0
4%
-0
.96%
Hard Coking Coal
Price Average YoY % Change 2021-
2024
2.8
9%
33,2
01
35,6
12
37,9
59
40,2
43
42,4
65
1.8
9%
34,8
20
37,2
31
39,5
78
41,8
62
44,0
84
0.8
9%
36,3
96
38,8
07
40,6
10
43,4
38
45,6
60
-0.1
1%
37,9
29
40,3
40
42,6
87
44,9
71
47,1
93
-1.1
1%
39,4
21
41,8
32
44,1
79
46,4
63
48,4
85
Figure 48. Sensitivity Analysis Between Main Steel Raw Materials And Target Price
Source: Team estimate
Probability
Impact
Low
IR1 MR1
MR2 RR3 RR2
PR1 MR3 RR1
Figure 49. Risk Matrix
Source: Team estimate
10
HPG’s principal activities are significantly impacted by the Government’s regulations, particularly the lowering tariffs on steel products during March 2020 to March 2023. When the tariffs are gradually removed, HPG’s steel will have to face fiercer competition with imported steel products, especially from China. Moreover, any tightening policy on the property market would directly impact HPG’s Real Estate sector and Steel sector. However, HPG is the only one in the market that can compete with Chinese steel thanks to the upstream integrated value chain, similar manufacturing technology, and ideal geographical location that enable the company to set competitive prices. Regulatory Risk ǀ Global Trade Protectionism (RR2) The US, Thailand, Britain, Australia are among the nations that have initiated dumping probes against Chinese steel products in the past years. Undoubtedly, the protectionism of the US towards Chinese goods during the Trade war has ignited the wave of protectionism, anti-dumping tariff to be specific, around the world. This global trend is poised to extend to any entity with export volume exceeding 5% of that country’s total import turnover. Consequently, it raises a risk for HPG’s export market as its products can be hit by anti-dumping tariff of its trading partners. Nevertheless, HPG has been proactive to mitigate the risk by diversifying its export destinations and avoid focusing on any specific market, hence minimizing the possible adverse effect of this risk. Regulatory Risk ǀ Tax Refund For Chinese Steel Export (RR3) The China’s Ministry of Finance has announced a higher tax refund rate on export, in which 9-10% is the refund rate for steel pipe and steel bar export. As such, exported steel price from China could further decrease, putting pressure on Vietnam’s domestic steel prices. However, as aforementioned, the cost advantage from the full operation of DQSC and upstream integrated value chain would allow HPG to price its products competitively against Chinese competitors. Industry Risk ǀ Cycle Effect (IR1) 65% of steel consumption in Vietnam comes from the Real estate and Construction industry, reflecting the dependence of Steel demand on these industries. However, these industries experience a high cyclical effect since they closely link to the changes in the macro-economy. Moreover, the difficulty in legal processing would also hamper the sales of real estate projects, affecting the construction industry and thus demand for steel. However, the diversification in business activities of HPG is expected to dampen negative cyclical effects on steel sales. Moreover, HPG aims to achieve an export revenue of 20% of total revenue, thereby mitigating the domestic macro-economic effects on its business. Pandemic Risk ǀ Covid-19 Outbreak (PR1) Due to the ongoing COVID-19 pandemic, the DQSC project and HPG business activities may face a risk of postponement as the demand for steel may be impeded, negatively impacting HPG’s revenue, profitability, and stock price. However, HPG has proactively implemented all the safety procedures for its workers, which allows the firm to continue operation during this critical period. Moreover, the government has been prompting the operation of construction industry to stimulate the economic growth in the post-pandemic period, which will guarantee the high demand for steel products. Environmental Risk ǀ Waste Emmission (ER1) As a nature of a manufacturing company, the excessive waste from HPG steel production has caused pollution to the environment as well as controversy with the nearby residents. These scandals raise the concern to investors owing to the bad reputation on company’s sustainable image. Moreover, cost to resolve these issues may add up to higher expenses and lower the net margin of HPG. However, the company has attempted to shed light upon this enigma through investing up to 20% of total capital investment to develop the eco-friendly steel making process for HDSC and DQSC.
ENVIRONMENTAL, SOCIAL AND GOVERNANCE
Environment HPG’s operation as a heavy-industry company is inevitably linked with the formation of toxic gases and chemicals. Notably, HPG mainly uses the BF-BOF technology which is found to generates CO2 25 times greater and SO2, NO2, CO 11 times greater than the EAF. That being said, HPG has put efforts to soothen this adverse impact on the environment through initiatives to reduce toxic and greenhouse emissions, reuse and save natural resources, properly treat waste, and reduce plastic consumption. However, there still ocassionally occurs scandals of HPG related to harmful exhaust and environmental degradation, which shows HPG’s lack of commitment. Based on MSCI’s ESG Framework, the Environmental pillar of HPG is rated at 2.3/4.0 (industry average 1.9) (Appendix H2). Social HPG has made obvious efforts to mitigate the adverse effects of its manufacturing process onto the surrounding residential areas with circular economic model to manage chemical waste more effectively. The Board also carefully pays attention to employee trainings and investment into social projects to help enhance living standards of the local community (Appendix H3).Although there are health check-ups for employees and workers in the steel complexes, who face high health risks, The company must take place more regularly and with more in-depth examination. Based on MSCI’s ESG Framework, the Social pillar of HPG is rated at 2.4/4.0 (industry average 1.8) (Appendix H2). Governance HPG’s Chairman and CEO have been with the company since the early days when HPG was still a small trading company in the steel industry. From our view, HPG’s Board of Directors with an average tenure of 20+ years has demonstrated a far-sighted vision and effective strategies for the company to achieve the scale expansion, ecosystem efficiency, and market leader position despite the cyclical nature of the steel industry (Appendix H1). Decisions are made and proposed in the shareholders meeting with the best interest of HPG’s shareholders in mind. Notwithstanding, the risk of biasedness in HPG’s governance might be exposed through having up to 44.22% ownership belonged to Mr. Tran Dinh Long family and Executive Board and the lack of independent BOD members (1/11). As large number of shares owned by internal members can have incentive that they will work hard to maximise shareholders return, the drawbacks will be others shareholders would have no control in the company decisions. Based on CFA Corparate Governance Framework, the Governance pillar of HPG is rated at 3.8/4.0 (industry average 2.6) (Appendix H2).
RISK MITIGATING METHODS
Market risk
Materials Price
Volatility (MR1)
20% self-supply of iron ore
Take derivatives (signing future and forward contracts)
Interest Rate Risk
(MR2)
Sign interest rate swap
Keep interest coverage ratio high and above 2
Exchange Rate Risk
(MR3)
Calculate the payment time for import contract
Sign derivative or currency forward contracts
Regulatory Risk
Trade Protection Removal
(RR1)
Acquire similar manufacturing technology to China
Ideal geographic location
Global Trade
Barriers (RR2)
Diversifying export destinations
Tax Refund for Chinese Steel Export
(RR3)
Acquire similar manufacturing technology to China
Ideal geographic location
Industry Risk
Cycle Effect (IR1)
Diversifying business activities
Pandemic Risk
Covid-19 Outbreak
(PR1)
Comply with safety procedures
Seize opportunity from government’s stimulus package
on infrastructure
Environmental Risk
Waste Emission
(ER1)
Develop eco-friendly steel making process
Figure 50. Risk Mitigating Methods
Source: Company data, Team analysis
0
1
2
3
4
EXECUTIVECOMMITTEE
AUDITCOMMITTEE
COMPENSATIONCOMMITTEE
SHAREHOLDER RIGHTS’
PROTECTION
Figure 52. Corporate Governance Summary
Source: Team estimate
Source: Company data, Team estimate
0
1
2
3
4Environment
SocialGovernance
Figure 51. Environment, Social and Governance
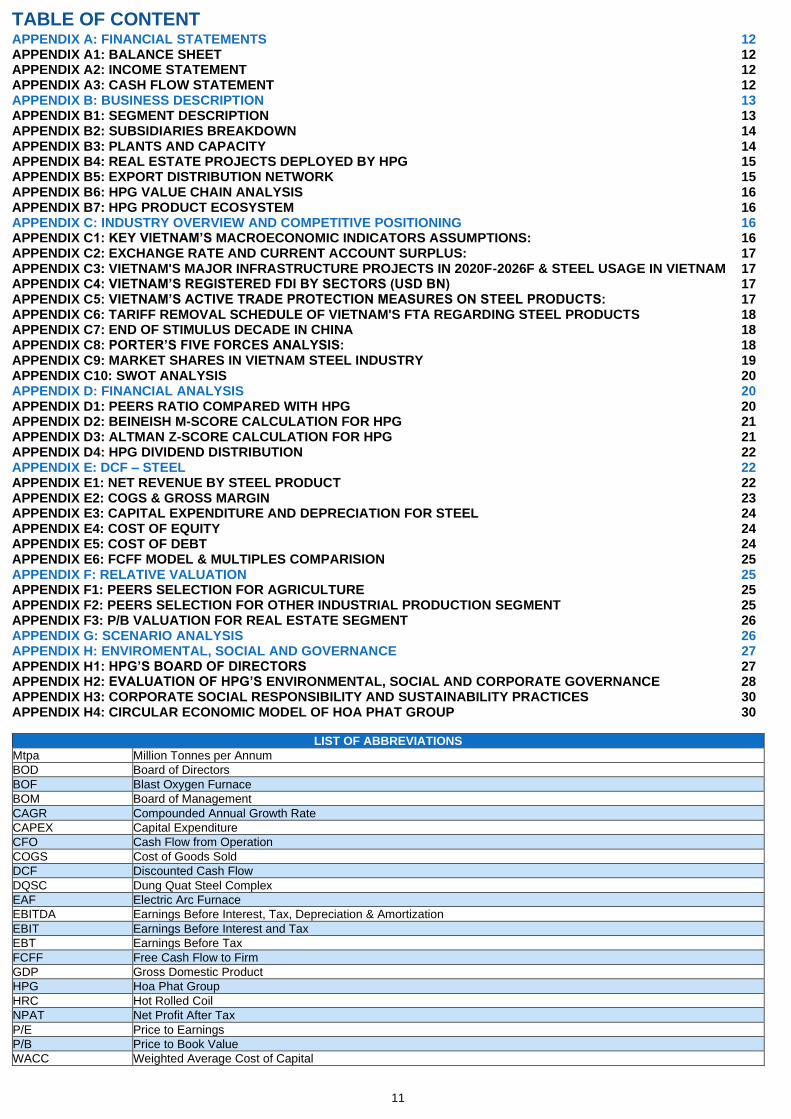
11
TABLE OF CONTENT
APPENDIX A: FINANCIAL STATEMENTS 12 APPENDIX A1: BALANCE SHEET 12 APPENDIX A2: INCOME STATEMENT 12 APPENDIX A3: CASH FLOW STATEMENT 12 APPENDIX B: BUSINESS DESCRIPTION 13 APPENDIX B1: SEGMENT DESCRIPTION 13 APPENDIX B2: SUBSIDIARIES BREAKDOWN 14 APPENDIX B3: PLANTS AND CAPACITY 14 APPENDIX B4: REAL ESTATE PROJECTS DEPLOYED BY HPG 15 APPENDIX B5: EXPORT DISTRIBUTION NETWORK 15 APPENDIX B6: HPG VALUE CHAIN ANALYSIS 16 APPENDIX B7: HPG PRODUCT ECOSYSTEM 16 APPENDIX C: INDUSTRY OVERVIEW AND COMPETITIVE POSITIONING 16 APPENDIX C1: KEY VIETNAM’S MACROECONOMIC INDICATORS ASSUMPTIONS: 16 APPENDIX C2: EXCHANGE RATE AND CURRENT ACCOUNT SURPLUS: 17 APPENDIX C3: VIETNAM'S MAJOR INFRASTRUCTURE PROJECTS IN 2020F-2026F & STEEL USAGE IN VIETNAM 17 APPENDIX C4: VIETNAM’S REGISTERED FDI BY SECTORS (USD BN) 17 APPENDIX C5: VIETNAM’S ACTIVE TRADE PROTECTION MEASURES ON STEEL PRODUCTS: 17 APPENDIX C6: TARIFF REMOVAL SCHEDULE OF VIETNAM'S FTA REGARDING STEEL PRODUCTS 18 APPENDIX C7: END OF STIMULUS DECADE IN CHINA 18 APPENDIX C8: PORTER’S FIVE FORCES ANALYSIS: 18 APPENDIX C9: MARKET SHARES IN VIETNAM STEEL INDUSTRY 19 APPENDIX C10: SWOT ANALYSIS 20 APPENDIX D: FINANCIAL ANALYSIS 20 APPENDIX D1: PEERS RATIO COMPARED WITH HPG 20 APPENDIX D2: BEINEISH M-SCORE CALCULATION FOR HPG 21 APPENDIX D3: ALTMAN Z-SCORE CALCULATION FOR HPG 21 APPENDIX D4: HPG DIVIDEND DISTRIBUTION 22 APPENDIX E: DCF – STEEL 22 APPENDIX E1: NET REVENUE BY STEEL PRODUCT 22 APPENDIX E2: COGS & GROSS MARGIN 23 APPENDIX E3: CAPITAL EXPENDITURE AND DEPRECIATION FOR STEEL 24 APPENDIX E4: COST OF EQUITY 24 APPENDIX E5: COST OF DEBT 24 APPENDIX E6: FCFF MODEL & MULTIPLES COMPARISION 25 APPENDIX F: RELATIVE VALUATION 25 APPENDIX F1: PEERS SELECTION FOR AGRICULTURE 25 APPENDIX F2: PEERS SELECTION FOR OTHER INDUSTRIAL PRODUCTION SEGMENT 25 APPENDIX F3: P/B VALUATION FOR REAL ESTATE SEGMENT 26 APPENDIX G: SCENARIO ANALYSIS 26 APPENDIX H: ENVIROMENTAL, SOCIAL AND GOVERNANCE 27 APPENDIX H1: HPG’S BOARD OF DIRECTORS 27 APPENDIX H2: EVALUATION OF HPG’S ENVIRONMENTAL, SOCIAL AND CORPORATE GOVERNANCE 28 APPENDIX H3: CORPORATE SOCIAL RESPONSIBILITY AND SUSTAINABILITY PRACTICES 30 APPENDIX H4: CIRCULAR ECONOMIC MODEL OF HOA PHAT GROUP 30
LIST OF ABBREVIATIONS
Mtpa Million Tonnes per Annum
BOD Board of Directors
BOF Blast Oxygen Furnace
BOM Board of Management
CAGR Compounded Annual Growth Rate
CAPEX Capital Expenditure
CFO Cash Flow from Operation
COGS Cost of Goods Sold
DCF Discounted Cash Flow
DQSC Dung Quat Steel Complex
EAF Electric Arc Furnace
EBITDA Earnings Before Interest, Tax, Depreciation & Amortization
EBIT Earnings Before Interest and Tax
EBT Earnings Before Tax
FCFF Free Cash Flow to Firm
GDP Gross Domestic Product
HPG Hoa Phat Group
HRC Hot Rolled Coil
NPAT Net Profit After Tax
P/E Price to Earnings
P/B Price to Book Value
WACC Weighted Average Cost of Capital
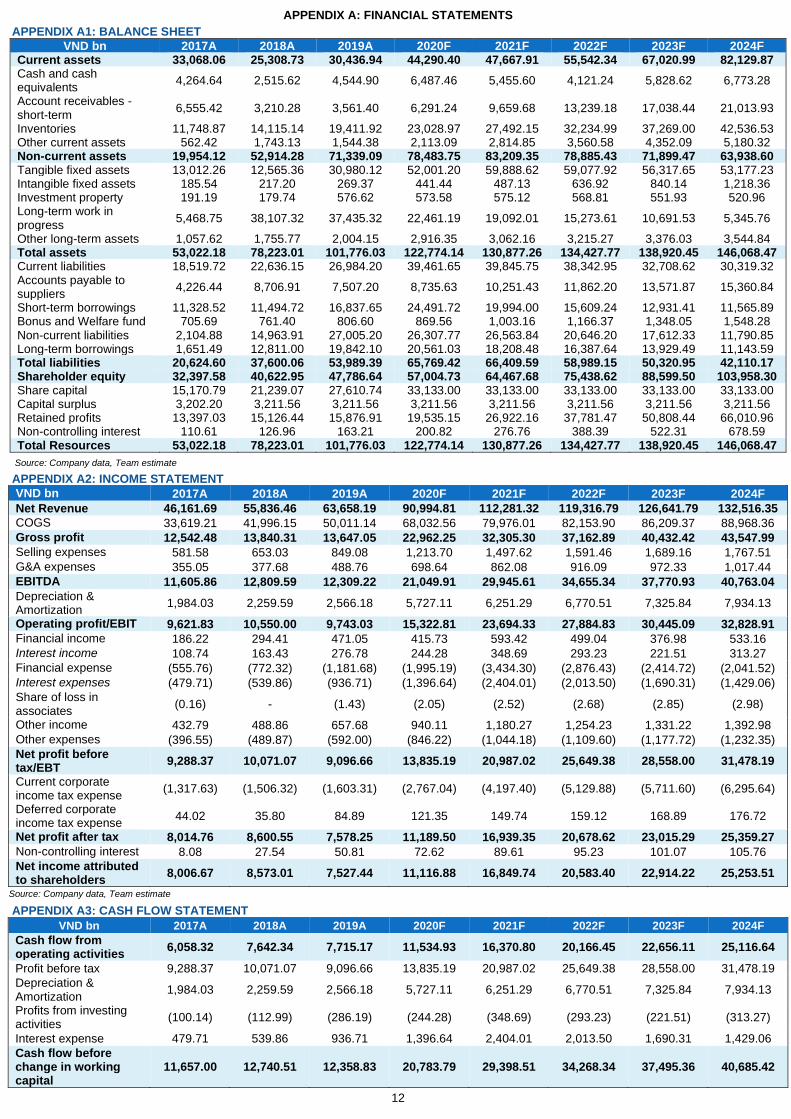
12
APPENDIX A: FINANCIAL STATEMENTS
APPENDIX A1: BALANCE SHEET
VND bn 2017A 2018A 2019A 2020F 2021F 2022F 2023F 2024F Current assets 33,068.06 25,308.73 30,436.94 44,290.40 47,667.91 55,542.34 67,020.99 82,129.87 Cash and cash equivalents
4,264.64 2,515.62 4,544.90 6,487.46 5,455.60 4,121.24 5,828.62 6,773.28
Account receivables - short-term
6,555.42 3,210.28 3,561.40 6,291.24 9,659.68 13,239.18 17,038.44 21,013.93
Inventories 11,748.87 14,115.14 19,411.92 23,028.97 27,492.15 32,234.99 37,269.00 42,536.53 Other current assets 562.42 1,743.13 1,544.38 2,113.09 2,814.85 3,560.58 4,352.09 5,180.32 Non-current assets 19,954.12 52,914.28 71,339.09 78,483.75 83,209.35 78,885.43 71,899.47 63,938.60 Tangible fixed assets 13,012.26 12,565.36 30,980.12 52,001.20 59,888.62 59,077.92 56,317.65 53,177.23 Intangible fixed assets 185.54 217.20 269.37 441.44 487.13 636.92 840.14 1,218.36 Investment property 191.19 179.74 576.62 573.58 575.12 568.81 551.93 520.96 Long-term work in progress
5,468.75 38,107.32 37,435.32 22,461.19 19,092.01 15,273.61 10,691.53 5,345.76
Other long-term assets 1,057.62 1,755.77 2,004.15 2,916.35 3,062.16 3,215.27 3,376.03 3,544.84 Total assets 53,022.18 78,223.01 101,776.03 122,774.14 130,877.26 134,427.77 138,920.45 146,068.47 Current liabilities 18,519.72 22,636.15 26,984.20 39,461.65 39,845.75 38,342.95 32,708.62 30,319.32 Accounts payable to suppliers
4,226.44 8,706.91 7,507.20 8,735.63 10,251.43 11,862.20 13,571.87 15,360.84
Short-term borrowings 11,328.52 11,494.72 16,837.65 24,491.72 19,994.00 15,609.24 12,931.41 11,565.89 Bonus and Welfare fund 705.69 761.40 806.60 869.56 1,003.16 1,166.37 1,348.05 1,548.28 Non-current liabilities 2,104.88 14,963.91 27,005.20 26,307.77 26,563.84 20,646.20 17,612.33 11,790.85 Long-term borrowings 1,651.49 12,811.00 19,842.10 20,561.03 18,208.48 16,387.64 13,929.49 11,143.59 Total liabilities 20,624.60 37,600.06 53,989.39 65,769.42 66,409.59 58,989.15 50,320.95 42,110.17 Shareholder equity 32,397.58 40,622.95 47,786.64 57,004.73 64,467.68 75,438.62 88,599.50 103,958.30 Share capital 15,170.79 21,239.07 27,610.74 33,133.00 33,133.00 33,133.00 33,133.00 33,133.00 Capital surplus 3,202.20 3,211.56 3,211.56 3,211.56 3,211.56 3,211.56 3,211.56 3,211.56 Retained profits 13,397.03 15,126.44 15,876.91 19,535.15 26,922.16 37,781.47 50,808.44 66,010.96 Non-controlling interest 110.61 126.96 163.21 200.82 276.76 388.39 522.31 678.59 Total Resources 53,022.18 78,223.01 101,776.03 122,774.14 130,877.26 134,427.77 138,920.45 146,068.47
APPENDIX A2: INCOME STATEMENT
VND bn 2017A 2018A 2019A 2020F 2021F 2022F 2023F 2024F
Net Revenue 46,161.69 55,836.46 63,658.19 90,994.81 112,281.32 119,316.79 126,641.79 132,516.35
COGS 33,619.21 41,996.15 50,011.14 68,032.56 79,976.01 82,153.90 86,209.37 88,968.36
Gross profit 12,542.48 13,840.31 13,647.05 22,962.25 32,305.30 37,162.89 40,432.42 43,547.99
Selling expenses 581.58 653.03 849.08 1,213.70 1,497.62 1,591.46 1,689.16 1,767.51
G&A expenses 355.05 377.68 488.76 698.64 862.08 916.09 972.33 1,017.44
EBITDA 11,605.86 12,809.59 12,309.22 21,049.91 29,945.61 34,655.34 37,770.93 40,763.04
Depreciation & Amortization
1,984.03 2,259.59 2,566.18 5,727.11 6,251.29 6,770.51 7,325.84 7,934.13
Operating profit/EBIT 9,621.83 10,550.00 9,743.03 15,322.81 23,694.33 27,884.83 30,445.09 32,828.91
Financial income 186.22 294.41 471.05 415.73 593.42 499.04 376.98 533.16
Interest income 108.74 163.43 276.78 244.28 348.69 293.23 221.51 313.27
Financial expense (555.76) (772.32) (1,181.68) (1,995.19) (3,434.30) (2,876.43) (2,414.72) (2,041.52)
Interest expenses (479.71) (539.86) (936.71) (1,396.64) (2,404.01) (2,013.50) (1,690.31) (1,429.06)
Share of loss in associates
(0.16) - (1.43) (2.05) (2.52) (2.68) (2.85) (2.98)
Other income 432.79 488.86 657.68 940.11 1,180.27 1,254.23 1,331.22 1,392.98
Other expenses (396.55) (489.87) (592.00) (846.22) (1,044.18) (1,109.60) (1,177.72) (1,232.35)
Net profit before tax/EBT
9,288.37 10,071.07 9,096.66 13,835.19 20,987.02 25,649.38 28,558.00 31,478.19
Current corporate income tax expense
(1,317.63) (1,506.32) (1,603.31) (2,767.04) (4,197.40) (5,129.88) (5,711.60) (6,295.64)
Deferred corporate income tax expense
44.02 35.80 84.89 121.35 149.74 159.12 168.89 176.72
Net profit after tax 8,014.76 8,600.55 7,578.25 11,189.50 16,939.35 20,678.62 23,015.29 25,359.27
Non-controlling interest 8.08 27.54 50.81 72.62 89.61 95.23 101.07 105.76
Net income attributed to shareholders
8,006.67 8,573.01 7,527.44 11,116.88 16,849.74 20,583.40 22,914.22 25,253.51
APPENDIX A3: CASH FLOW STATEMENT
VND bn 2017A 2018A 2019A 2020F 2021F 2022F 2023F 2024F
Cash flow from operating activities
6,058.32 7,642.34 7,715.17 11,534.93 16,370.80 20,166.45 22,656.11 25,116.64
Profit before tax 9,288.37 10,071.07 9,096.66 13,835.19 20,987.02 25,649.38 28,558.00 31,478.19
Depreciation & Amortization
1,984.03 2,259.59 2,566.18 5,727.11 6,251.29 6,770.51 7,325.84 7,934.13
Profits from investing activities
(100.14) (112.99) (286.19) (244.28) (348.69) (293.23) (221.51) (313.27)
Interest expense 479.71 539.86 936.71 1,396.64 2,404.01 2,013.50 1,690.31 1,429.06
Cash flow before change in working capital
11,657.00 12,740.51 12,358.83 20,783.79 29,398.51 34,268.34 37,495.36 40,685.42
Source: Company data, Team estimate
Source: Company data, Team estimate
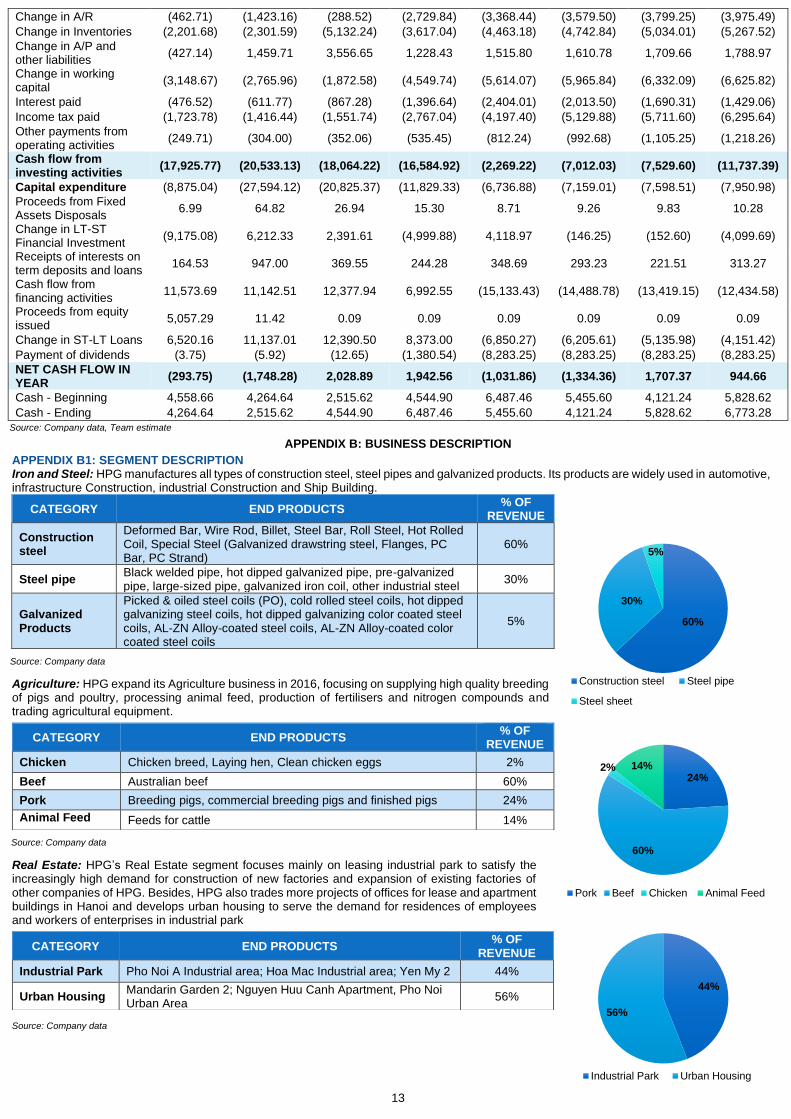
13
Change in A/R (462.71) (1,423.16) (288.52) (2,729.84) (3,368.44) (3,579.50) (3,799.25) (3,975.49)
Change in Inventories (2,201.68) (2,301.59) (5,132.24) (3,617.04) (4,463.18) (4,742.84) (5,034.01) (5,267.52)
Change in A/P and other liabilities
(427.14) 1,459.71 3,556.65 1,228.43 1,515.80 1,610.78 1,709.66 1,788.97
Change in working capital
(3,148.67) (2,765.96) (1,872.58) (4,549.74) (5,614.07) (5,965.84) (6,332.09) (6,625.82)
Interest paid (476.52) (611.77) (867.28) (1,396.64) (2,404.01) (2,013.50) (1,690.31) (1,429.06)
Income tax paid (1,723.78) (1,416.44) (1,551.74) (2,767.04) (4,197.40) (5,129.88) (5,711.60) (6,295.64)
Other payments from operating activities
(249.71) (304.00) (352.06) (535.45) (812.24) (992.68) (1,105.25) (1,218.26)
Cash flow from investing activities
(17,925.77) (20,533.13) (18,064.22) (16,584.92) (2,269.22) (7,012.03) (7,529.60) (11,737.39)
Capital expenditure (8,875.04) (27,594.12) (20,825.37) (11,829.33) (6,736.88) (7,159.01) (7,598.51) (7,950.98)
Proceeds from Fixed Assets Disposals
6.99 64.82 26.94 15.30 8.71 9.26 9.83 10.28
Change in LT-ST Financial Investment
(9,175.08) 6,212.33 2,391.61 (4,999.88) 4,118.97 (146.25) (152.60) (4,099.69)
Receipts of interests on term deposits and loans
164.53 947.00 369.55 244.28 348.69 293.23 221.51 313.27
Cash flow from financing activities
11,573.69 11,142.51 12,377.94 6,992.55 (15,133.43) (14,488.78) (13,419.15) (12,434.58)
Proceeds from equity issued
5,057.29 11.42 0.09 0.09 0.09 0.09 0.09 0.09
Change in ST-LT Loans 6,520.16 11,137.01 12,390.50 8,373.00 (6,850.27) (6,205.61) (5,135.98) (4,151.42)
Payment of dividends (3.75) (5.92) (12.65) (1,380.54) (8,283.25) (8,283.25) (8,283.25) (8,283.25)
NET CASH FLOW IN YEAR
(293.75) (1,748.28) 2,028.89 1,942.56 (1,031.86) (1,334.36) 1,707.37 944.66
Cash - Beginning 4,558.66 4,264.64 2,515.62 4,544.90 6,487.46 5,455.60 4,121.24 5,828.62
Cash - Ending 4,264.64 2,515.62 4,544.90 6,487.46 5,455.60 4,121.24 5,828.62 6,773.28
APPENDIX B: BUSINESS DESCRIPTION
APPENDIX B1: SEGMENT DESCRIPTION Iron and Steel: HPG manufactures all types of construction steel, steel pipes and galvanized products. Its products are widely used in automotive, infrastructure Construction, industrial Construction and Ship Building.
Agriculture: HPG expand its Agriculture business in 2016, focusing on supplying high quality breeding of pigs and poultry, processing animal feed, production of fertilisers and nitrogen compounds and trading agricultural equipment.
Real Estate: HPG’s Real Estate segment focuses mainly on leasing industrial park to satisfy the increasingly high demand for construction of new factories and expansion of existing factories of other companies of HPG. Besides, HPG also trades more projects of offices for lease and apartment buildings in Hanoi and develops urban housing to serve the demand for residences of employees and workers of enterprises in industrial park
CATEGORY END PRODUCTS % OF
REVENUE
Construction steel
Deformed Bar, Wire Rod, Billet, Steel Bar, Roll Steel, Hot Rolled Coil, Special Steel (Galvanized drawstring steel, Flanges, PC Bar, PC Strand)
60%
Steel pipe Black welded pipe, hot dipped galvanized pipe, pre-galvanized pipe, large-sized pipe, galvanized iron coil, other industrial steel
30%
Galvanized Products
Picked & oiled steel coils (PO), cold rolled steel coils, hot dipped galvanizing steel coils, hot dipped galvanizing color coated steel coils, AL-ZN Alloy-coated steel coils, AL-ZN Alloy-coated color coated steel coils
5%
CATEGORY END PRODUCTS % OF
REVENUE
Chicken Chicken breed, Laying hen, Clean chicken eggs 2%
Beef Australian beef 60%
Pork Breeding pigs, commercial breeding pigs and finished pigs 24%
Animal Feed Feeds for cattle 14%
CATEGORY END PRODUCTS % OF
REVENUE
Industrial Park Pho Noi A Industrial area; Hoa Mac Industrial area; Yen My 2 44%
Urban Housing Mandarin Garden 2; Nguyen Huu Canh Apartment, Pho Noi Urban Area
56%
Source: Company data, Team estimate
Source: Company data
Source: Company data
Source: Company data
60%
30%
5%
Construction steel Steel pipe
Steel sheet
24%
60%
2% 14%
Pork Beef Chicken Animal Feed
44%
56%
Industrial Park Urban Housing
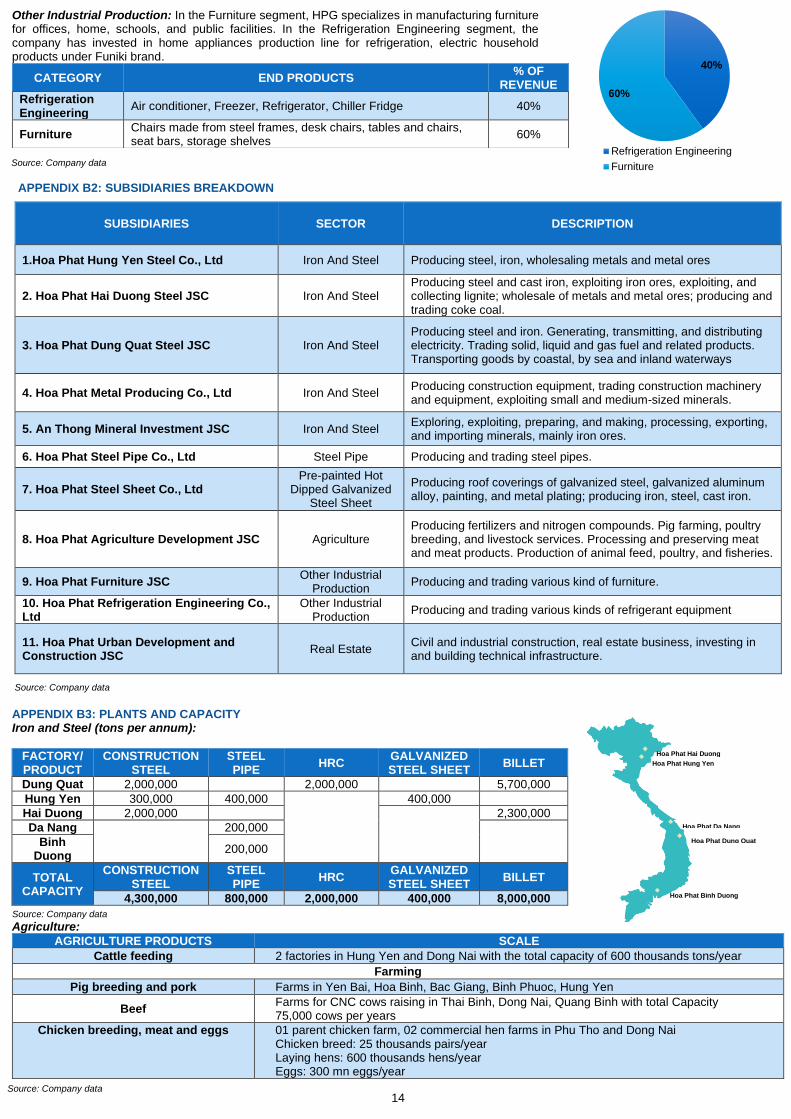
14
Other Industrial Production: In the Furniture segment, HPG specializes in manufacturing furniture for offices, home, schools, and public facilities. In the Refrigeration Engineering segment, the company has invested in home appliances production line for refrigeration, electric household products under Funiki brand.
APPENDIX B2: SUBSIDIARIES BREAKDOWN
SUBSIDIARIES SECTOR DESCRIPTION
1.Hoa Phat Hung Yen Steel Co., Ltd Iron And Steel Producing steel, iron, wholesaling metals and metal ores
2. Hoa Phat Hai Duong Steel JSC Iron And Steel Producing steel and cast iron, exploiting iron ores, exploiting, and collecting lignite; wholesale of metals and metal ores; producing and trading coke coal.
3. Hoa Phat Dung Quat Steel JSC Iron And Steel Producing steel and iron. Generating, transmitting, and distributing electricity. Trading solid, liquid and gas fuel and related products. Transporting goods by coastal, by sea and inland waterways
4. Hoa Phat Metal Producing Co., Ltd Iron And Steel Producing construction equipment, trading construction machinery and equipment, exploiting small and medium-sized minerals.
5. An Thong Mineral Investment JSC Iron And Steel Exploring, exploiting, preparing, and making, processing, exporting, and importing minerals, mainly iron ores.
6. Hoa Phat Steel Pipe Co., Ltd Steel Pipe Producing and trading steel pipes.
7. Hoa Phat Steel Sheet Co., Ltd Pre-painted Hot
Dipped Galvanized Steel Sheet
Producing roof coverings of galvanized steel, galvanized aluminum alloy, painting, and metal plating; producing iron, steel, cast iron.
8. Hoa Phat Agriculture Development JSC Agriculture Producing fertilizers and nitrogen compounds. Pig farming, poultry breeding, and livestock services. Processing and preserving meat and meat products. Production of animal feed, poultry, and fisheries.
9. Hoa Phat Furniture JSC Other Industrial
Production Producing and trading various kind of furniture.
10. Hoa Phat Refrigeration Engineering Co., Ltd
Other Industrial Production
Producing and trading various kinds of refrigerant equipment
11. Hoa Phat Urban Development and Construction JSC
Real Estate Civil and industrial construction, real estate business, investing in and building technical infrastructure.
APPENDIX B3: PLANTS AND CAPACITY Iron and Steel (tons per annum):
FACTORY/ PRODUCT
CONSTRUCTION STEEL
STEEL PIPE
HRC GALVANIZED STEEL SHEET
BILLET
Dung Quat 2,000,000 2,000,000 5,700,000
Hung Yen 300,000 400,000
400,000
Hai Duong 2,000,000
2,300,000
Da Nang
200,000
Binh Duong
200,000
TOTAL CAPACITY
CONSTRUCTION STEEL
STEEL PIPE
HRC GALVANIZED STEEL SHEET
BILLET
4,300,000 800,000 2,000,000 400,000 8,000,000
Agriculture:
AGRICULTURE PRODUCTS SCALE
Cattle feeding 2 factories in Hung Yen and Dong Nai with the total capacity of 600 thousands tons/year
Farming
Pig breeding and pork Farms in Yen Bai, Hoa Binh, Bac Giang, Binh Phuoc, Hung Yen
Beef Farms for CNC cows raising in Thai Binh, Dong Nai, Quang Binh with total Capacity 75,000 cows per years
Chicken breeding, meat and eggs 01 parent chicken farm, 02 commercial hen farms in Phu Tho and Dong Nai Chicken breed: 25 thousands pairs/year Laying hens: 600 thousands hens/year Eggs: 300 mn eggs/year
CATEGORY END PRODUCTS % OF
REVENUE
Refrigeration Engineering
Air conditioner, Freezer, Refrigerator, Chiller Fridge 40%
Furniture Chairs made from steel frames, desk chairs, tables and chairs, seat bars, storage shelves
60%
Source: Company data
Source: Company data
Source: Company data
Source: Company data
40%
60%
Refrigeration Engineering
Furniture
Hoa Phat Hung Yen
Hoa Phat Binh Duong
Hoa Phat Hai Duong
Hoa Phat Dung Quat
Hoa Phat Da Nang
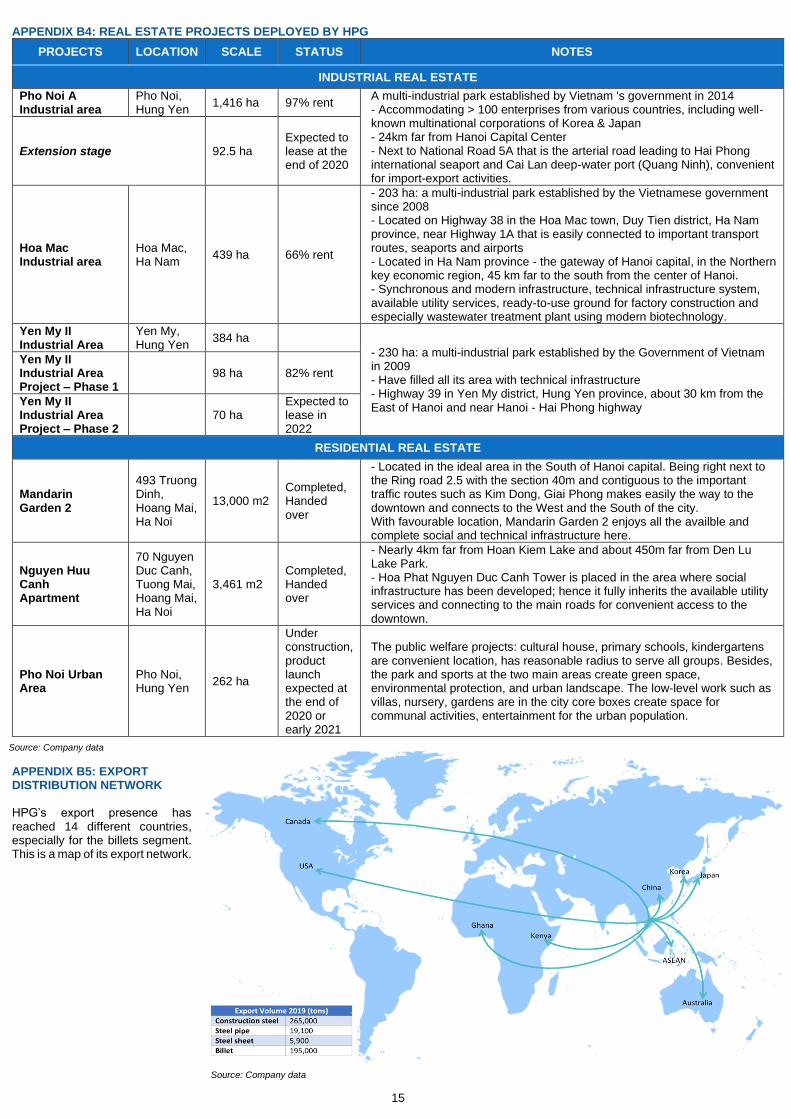
15
APPENDIX B4: REAL ESTATE PROJECTS DEPLOYED BY HPG
PROJECTS LOCATION SCALE STATUS NOTES
INDUSTRIAL REAL ESTATE
Pho Noi A Industrial area
Pho Noi, Hung Yen
1,416 ha 97% rent A multi-industrial park established by Vietnam 's government in 2014 - Accommodating > 100 enterprises from various countries, including well-known multinational corporations of Korea & Japan - 24km far from Hanoi Capital Center - Next to National Road 5A that is the arterial road leading to Hai Phong international seaport and Cai Lan deep-water port (Quang Ninh), convenient for import-export activities.
Extension stage 92.5 ha Expected to lease at the end of 2020
Hoa Mac Industrial area
Hoa Mac, Ha Nam
439 ha 66% rent
- 203 ha: a multi-industrial park established by the Vietnamese government since 2008 - Located on Highway 38 in the Hoa Mac town, Duy Tien district, Ha Nam province, near Highway 1A that is easily connected to important transport routes, seaports and airports - Located in Ha Nam province - the gateway of Hanoi capital, in the Northern key economic region, 45 km far to the south from the center of Hanoi. - Synchronous and modern infrastructure, technical infrastructure system, available utility services, ready-to-use ground for factory construction and especially wastewater treatment plant using modern biotechnology.
Yen My II Industrial Area
Yen My, Hung Yen
384 ha
- 230 ha: a multi-industrial park established by the Government of Vietnam in 2009 - Have filled all its area with technical infrastructure - Highway 39 in Yen My district, Hung Yen province, about 30 km from the East of Hanoi and near Hanoi - Hai Phong highway
Yen My II Industrial Area Project – Phase 1
98 ha 82% rent
Yen My II Industrial Area Project – Phase 2
70 ha Expected to lease in 2022
RESIDENTIAL REAL ESTATE
Mandarin Garden 2
493 Truong Dinh, Hoang Mai, Ha Noi
13,000 m2 Completed, Handed over
- Located in the ideal area in the South of Hanoi capital. Being right next to the Ring road 2.5 with the section 40m and contiguous to the important traffic routes such as Kim Dong, Giai Phong makes easily the way to the downtown and connects to the West and the South of the city. With favourable location, Mandarin Garden 2 enjoys all the availble and complete social and technical infrastructure here.
Nguyen Huu Canh Apartment
70 Nguyen Duc Canh, Tuong Mai, Hoang Mai, Ha Noi
3,461 m2 Completed, Handed over
- Nearly 4km far from Hoan Kiem Lake and about 450m far from Den Lu Lake Park. - Hoa Phat Nguyen Duc Canh Tower is placed in the area where social infrastructure has been developed; hence it fully inherits the available utility services and connecting to the main roads for convenient access to the downtown.
Pho Noi Urban Area
Pho Noi, Hung Yen
262 ha
Under construction, product launch expected at the end of 2020 or early 2021
The public welfare projects: cultural house, primary schools, kindergartens are convenient location, has reasonable radius to serve all groups. Besides, the park and sports at the two main areas create green space, environmental protection, and urban landscape. The low-level work such as villas, nursery, gardens are in the city core boxes create space for communal activities, entertainment for the urban population.
APPENDIX B5: EXPORT DISTRIBUTION NETWORK HPG’s export presence has reached 14 different countries, especially for the billets segment. This is a map of its export network.
Source: Company data
Source: Company data
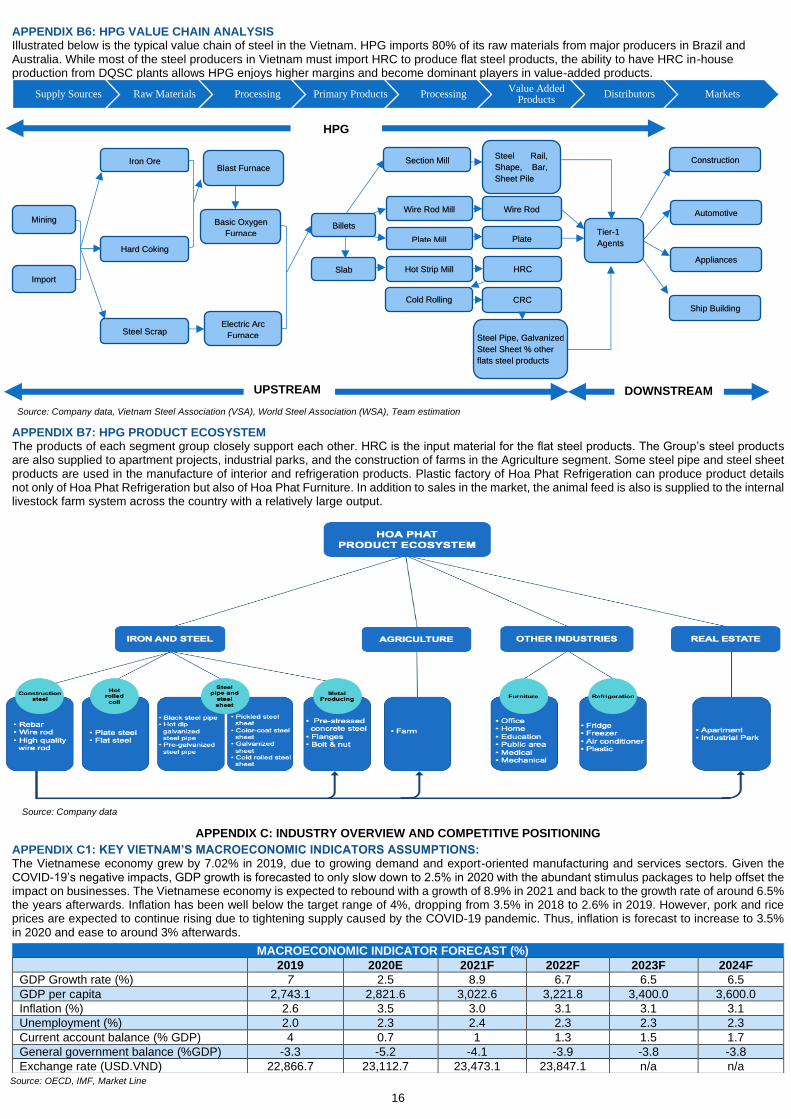
16
APPENDIX B6: HPG VALUE CHAIN ANALYSIS Illustrated below is the typical value chain of steel in the Vietnam. HPG imports 80% of its raw materials from major producers in Brazil and Australia. While most of the steel producers in Vietnam must import HRC to produce flat steel products, the ability to have HRC in-house production from DQSC plants allows HPG enjoys higher margins and become dominant players in value-added products.
APPENDIX B7: HPG PRODUCT ECOSYSTEM The products of each segment group closely support each other. HRC is the input material for the flat steel products. The Group’s steel products are also supplied to apartment projects, industrial parks, and the construction of farms in the Agriculture segment. Some steel pipe and steel sheet products are used in the manufacture of interior and refrigeration products. Plastic factory of Hoa Phat Refrigeration can produce product details not only of Hoa Phat Refrigeration but also of Hoa Phat Furniture. In addition to sales in the market, the animal feed is also is supplied to the internal livestock farm system across the country with a relatively large output.
APPENDIX C: INDUSTRY OVERVIEW AND COMPETITIVE POSITIONING
APPENDIX C1: KEY VIETNAM’S MACROECONOMIC INDICATORS ASSUMPTIONS: The Vietnamese economy grew by 7.02% in 2019, due to growing demand and export-oriented manufacturing and services sectors. Given the COVID-19’s negative impacts, GDP growth is forecasted to only slow down to 2.5% in 2020 with the abundant stimulus packages to help offset the impact on businesses. The Vietnamese economy is expected to rebound with a growth of 8.9% in 2021 and back to the growth rate of around 6.5% the years afterwards. Inflation has been well below the target range of 4%, dropping from 3.5% in 2018 to 2.6% in 2019. However, pork and rice prices are expected to continue rising due to tightening supply caused by the COVID-19 pandemic. Thus, inflation is forecast to increase to 3.5% in 2020 and ease to around 3% afterwards.
Supply Sources Raw Materials Processing Primary Products ProcessingValue Added
ProductsDistributors Markets
MACROECONOMIC INDICATOR FORECAST (%) 2019 2020E 2021F 2022F 2023F 2024F
GDP Growth rate (%) 7 2.5 8.9 6.7 6.5 6.5
GDP per capita 2,743.1 2,821.6 3,022.6 3,221.8 3,400.0 3,600.0
Inflation (%) 2.6 3.5 3.0 3.1 3.1 3.1
Unemployment (%) 2.0 2.3 2.4 2.3 2.3 2.3
Current account balance (% GDP) 4 0.7 1 1.3 1.5 1.7
General government balance (%GDP) -3.3 -5.2 -4.1 -3.9 -3.8 -3.8
Exchange rate (USD.VND) 22,866.7 23,112.7 23,473.1 23,847.1 n/a n/a
Source: Company data, Vietnam Steel Association (VSA), World Steel Association (WSA), Team estimation
Source: Company data
Tier-1
Agents
Blast Furnace
Mining
Import
Iron Ore
Hard Coking
Coal
Steel Scrap
Billets
Slab
Section Mill
Wire Rod Mill
Plate Mill
Hot Strip Mill
Cold Rolling
Steel Rail,
Shape, Bar,
Sheet Pile
Wire Rod
Plate
HRC
CRC
Steel Pipe, Galvanized
Steel Sheet % other
flats steel products
Construction
Automotive
Appliances
Ship Building
Basic Oxygen
Furnace
Electric Arc
Furnace
UPSTREAM
HPG
DOWNSTREAM
Source: OECD, IMF, Market Line
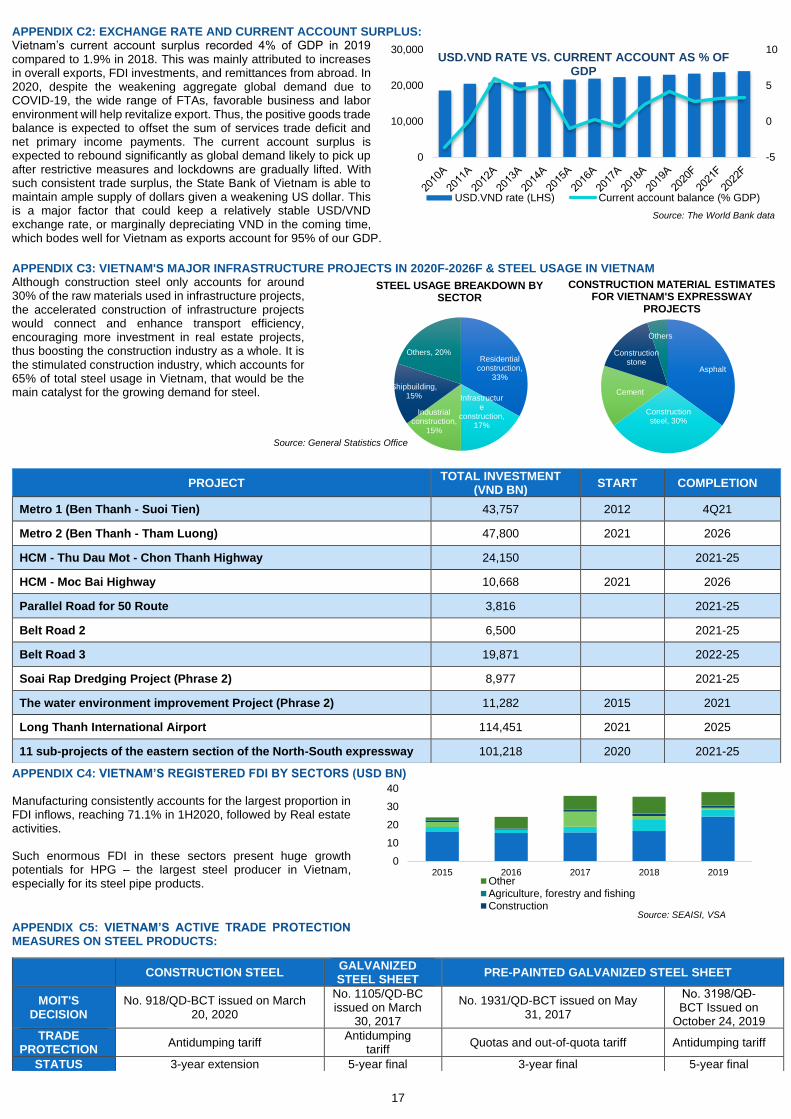
17
APPENDIX C2: EXCHANGE RATE AND CURRENT ACCOUNT SURPLUS: Vietnam’s current account surplus recorded 4% of GDP in 2019 compared to 1.9% in 2018. This was mainly attributed to increases in overall exports, FDI investments, and remittances from abroad. In 2020, despite the weakening aggregate global demand due to COVID-19, the wide range of FTAs, favorable business and labor environment will help revitalize export. Thus, the positive goods trade balance is expected to offset the sum of services trade deficit and net primary income payments. The current account surplus is expected to rebound significantly as global demand likely to pick up after restrictive measures and lockdowns are gradually lifted. With such consistent trade surplus, the State Bank of Vietnam is able to maintain ample supply of dollars given a weakening US dollar. This is a major factor that could keep a relatively stable USD/VND exchange rate, or marginally depreciating VND in the coming time, which bodes well for Vietnam as exports account for 95% of our GDP.
APPENDIX C3: VIETNAM'S MAJOR INFRASTRUCTURE PROJECTS IN 2020F-2026F & STEEL USAGE IN VIETNAM Although construction steel only accounts for around 30% of the raw materials used in infrastructure projects, the accelerated construction of infrastructure projects would connect and enhance transport efficiency, encouraging more investment in real estate projects, thus boosting the construction industry as a whole. It is the stimulated construction industry, which accounts for 65% of total steel usage in Vietnam, that would be the main catalyst for the growing demand for steel.
APPENDIX C4: VIETNAM’S REGISTERED FDI BY SECTORS (USD BN) Manufacturing consistently accounts for the largest proportion in FDI inflows, reaching 71.1% in 1H2020, followed by Real estate activities.
Such enormous FDI in these sectors present huge growth potentials for HPG – the largest steel producer in Vietnam, especially for its steel pipe products.
APPENDIX C5: VIETNAM’S ACTIVE TRADE PROTECTION MEASURES ON STEEL PRODUCTS:
PROJECT TOTAL INVESTMENT
(VND BN) START COMPLETION
Metro 1 (Ben Thanh - Suoi Tien) 43,757 2012 4Q21
Metro 2 (Ben Thanh - Tham Luong) 47,800 2021 2026
HCM - Thu Dau Mot - Chon Thanh Highway 24,150 2021-25
HCM - Moc Bai Highway 10,668 2021 2026
Parallel Road for 50 Route 3,816 2021-25
Belt Road 2 6,500 2021-25
Belt Road 3 19,871 2022-25
Soai Rap Dredging Project (Phrase 2) 8,977 2021-25
The water environment improvement Project (Phrase 2) 11,282 2015 2021
Long Thanh International Airport 114,451 2021 2025
11 sub-projects of the eastern section of the North-South expressway 101,218 2020 2021-25
CONSTRUCTION STEEL GALVANIZED STEEL SHEET
PRE-PAINTED GALVANIZED STEEL SHEET
MOIT'S DECISION
No. 918/QD-BCT issued on March 20, 2020
No. 1105/QD-BC issued on March
30, 2017
No. 1931/QD-BCT issued on May 31, 2017
No. 3198/QĐ-BCT Issued on
October 24, 2019
TRADE PROTECTION
Antidumping tariff Antidumping
tariff Quotas and out-of-quota tariff Antidumping tariff
STATUS 3-year extension 5-year final 3-year final 5-year final
-5
0
5
10
0
10,000
20,000
30,000USD.VND RATE VS. CURRENT ACCOUNT AS % OF
GDP
USD.VND rate (LHS) Current account balance (% GDP)
Source: The World Bank data
0
10
20
30
40
2015 2016 2017 2018 2019OtherAgriculture, forestry and fishingConstruction
Source: SEAISI, VSA
Residential construction,
33%
Infrastructure
construction, 17%
Industrial construction,
15%
Shipbuilding, 15%
Others, 20%
STEEL USAGE BREAKDOWN BY SECTOR
Asphalt
Construction steel, 30%
Cement
Construction stone
Others
CONSTRUCTION MATERIAL ESTIMATES FOR VIETNAM'S EXPRESSWAY
PROJECTS
Source: General Statistics Office
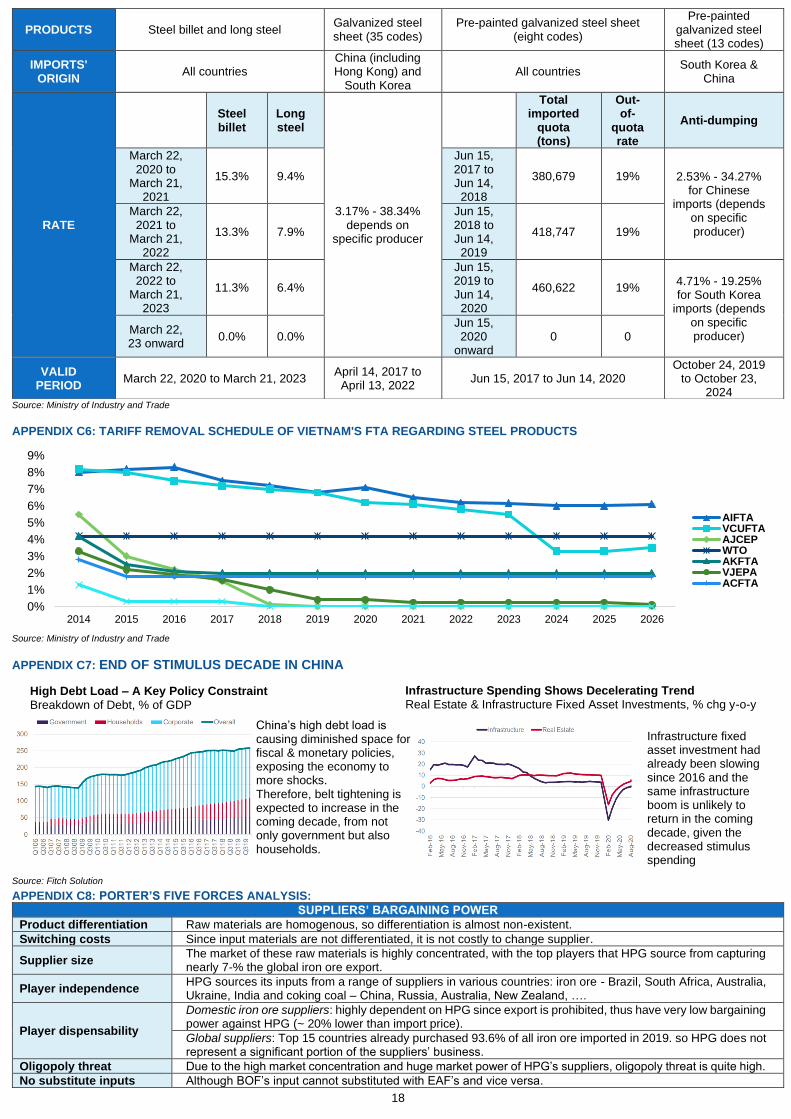
18
Source: Ministry of Industry and Trade
APPENDIX C6: TARIFF REMOVAL SCHEDULE OF VIETNAM'S FTA REGARDING STEEL PRODUCTS
Source: Ministry of Industry and Trade
APPENDIX C7: END OF STIMULUS DECADE IN CHINA
Source: Fitch Solution
APPENDIX C8: PORTER’S FIVE FORCES ANALYSIS:
SUPPLIERS’ BARGAINING POWER
Product differentiation Raw materials are homogenous, so differentiation is almost non-existent.
Switching costs Since input materials are not differentiated, it is not costly to change supplier.
Supplier size The market of these raw materials is highly concentrated, with the top players that HPG source from capturing nearly 7-% the global iron ore export.
Player independence HPG sources its inputs from a range of suppliers in various countries: iron ore - Brazil, South Africa, Australia, Ukraine, India and coking coal – China, Russia, Australia, New Zealand, ….
Player dispensability
Domestic iron ore suppliers: highly dependent on HPG since export is prohibited, thus have very low bargaining power against HPG (~ 20% lower than import price).
Global suppliers: Top 15 countries already purchased 93.6% of all iron ore imported in 2019. so HPG does not represent a significant portion of the suppliers’ business.
Oligopoly threat Due to the high market concentration and huge market power of HPG’s suppliers, oligopoly threat is quite high.
No substitute inputs Although BOF’s input cannot substituted with EAF’s and vice versa.
PRODUCTS Steel billet and long steel Galvanized steel sheet (35 codes)
Pre-painted galvanized steel sheet (eight codes)
Pre-painted galvanized steel sheet (13 codes)
IMPORTS' ORIGIN
All countries China (including Hong Kong) and
South Korea All countries
South Korea & China
RATE
Steel billet
Long steel
3.17% - 38.34% depends on
specific producer
Total imported
quota (tons)
Out-of-
quota rate
Anti-dumping
March 22, 2020 to
March 21, 2021
15.3% 9.4%
Jun 15, 2017 to Jun 14, 2018
380,679 19% 2.53% - 34.27% for Chinese
imports (depends on specific producer)
March 22, 2021 to
March 21, 2022
13.3% 7.9%
Jun 15, 2018 to Jun 14, 2019
418,747 19%
March 22, 2022 to
March 21, 2023
11.3% 6.4%
Jun 15, 2019 to Jun 14, 2020
460,622 19% 4.71% - 19.25% for South Korea
imports (depends on specific producer)
March 22, 23 onward
0.0% 0.0% Jun 15, 2020
onward 0 0
VALID PERIOD
March 22, 2020 to March 21, 2023 April 14, 2017 to
April 13, 2022 Jun 15, 2017 to Jun 14, 2020
October 24, 2019 to October 23,
2024
High Debt Load – A Key Policy Constraint Breakdown of Debt, % of GDP
Infrastructure Spending Shows Decelerating Trend Real Estate & Infrastructure Fixed Asset Investments, % chg y-o-y
0%
1%
2%
3%
4%
5%
6%
7%
8%
9%
2014 2015 2016 2017 2018 2019 2020 2021 2022 2023 2024 2025 2026
AIFTAVCUFTAAJCEPWTOAKFTAVJEPAACFTA
China’s high debt load is causing diminished space for fiscal & monetary policies, exposing the economy to more shocks. Therefore, belt tightening is expected to increase in the coming decade, from not only government but also households.
Infrastructure fixed asset investment had already been slowing since 2016 and the same infrastructure boom is unlikely to return in the coming decade, given the decreased stimulus spending
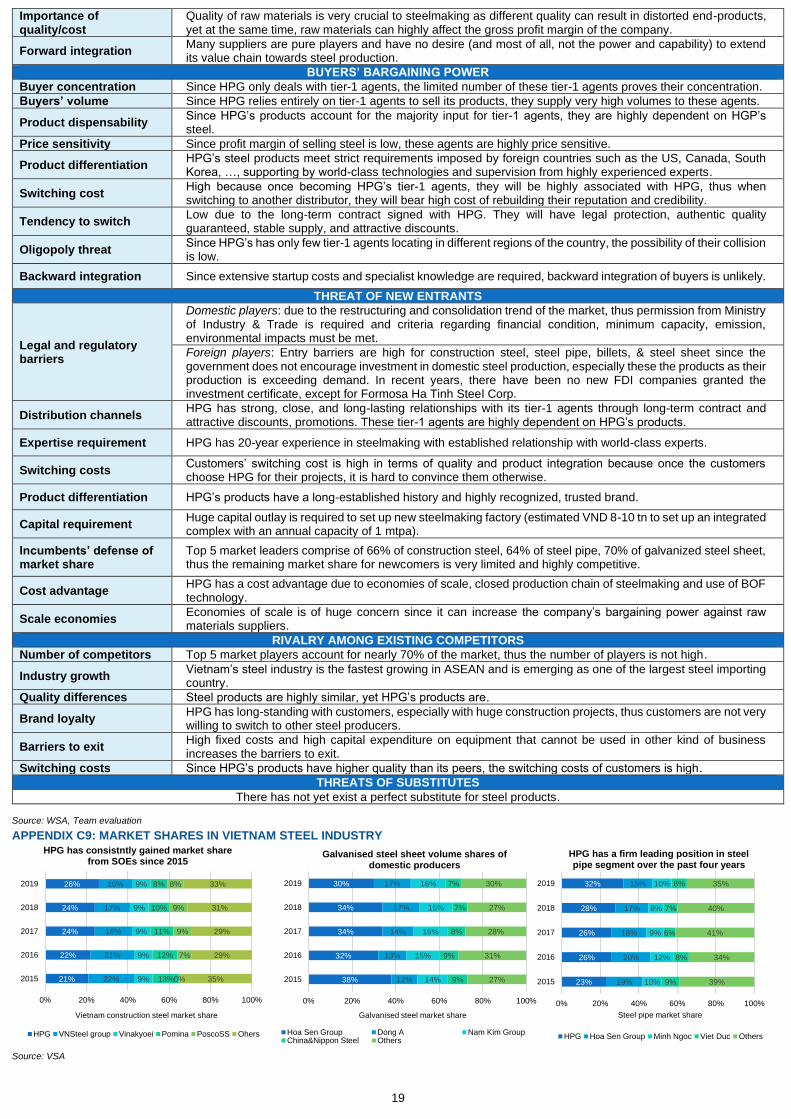
19
23%
26%
26%
28%
32%
19%
20%
18%
17%
15%
10%
12%
9%
8%
10%
9%
8%
6%
7%
8%
39%
34%
41%
40%
35%
0% 20% 40% 60% 80% 100%
2015
2016
2017
2018
2019
Steel pipe market share
HPG has a firm leading position in steel pipe segment over the past four years
HPG Hoa Sen Group Minh Ngoc Viet Duc Others
Importance of quality/cost
Quality of raw materials is very crucial to steelmaking as different quality can result in distorted end-products, yet at the same time, raw materials can highly affect the gross profit margin of the company.
Forward integration Many suppliers are pure players and have no desire (and most of all, not the power and capability) to extend its value chain towards steel production.
BUYERS’ BARGAINING POWER
Buyer concentration Since HPG only deals with tier-1 agents, the limited number of these tier-1 agents proves their concentration.
Buyers’ volume Since HPG relies entirely on tier-1 agents to sell its products, they supply very high volumes to these agents.
Product dispensability Since HPG’s products account for the majority input for tier-1 agents, they are highly dependent on HGP’s steel.
Price sensitivity Since profit margin of selling steel is low, these agents are highly price sensitive.
Product differentiation HPG’s steel products meet strict requirements imposed by foreign countries such as the US, Canada, South Korea, …, supporting by world-class technologies and supervision from highly experienced experts.
Switching cost High because once becoming HPG’s tier-1 agents, they will be highly associated with HPG, thus when switching to another distributor, they will bear high cost of rebuilding their reputation and credibility.
Tendency to switch Low due to the long-term contract signed with HPG. They will have legal protection, authentic quality guaranteed, stable supply, and attractive discounts.
Oligopoly threat Since HPG’s has only few tier-1 agents locating in different regions of the country, the possibility of their collision is low.
Backward integration Since extensive startup costs and specialist knowledge are required, backward integration of buyers is unlikely.
THREAT OF NEW ENTRANTS
Legal and regulatory barriers
Domestic players: due to the restructuring and consolidation trend of the market, thus permission from Ministry of Industry & Trade is required and criteria regarding financial condition, minimum capacity, emission, environmental impacts must be met.
Foreign players: Entry barriers are high for construction steel, steel pipe, billets, & steel sheet since the government does not encourage investment in domestic steel production, especially these the products as their production is exceeding demand. In recent years, there have been no new FDI companies granted the investment certificate, except for Formosa Ha Tinh Steel Corp.
Distribution channels HPG has strong, close, and long-lasting relationships with its tier-1 agents through long-term contract and attractive discounts, promotions. These tier-1 agents are highly dependent on HPG’s products.
Expertise requirement HPG has 20-year experience in steelmaking with established relationship with world-class experts.
Switching costs Customers’ switching cost is high in terms of quality and product integration because once the customers choose HPG for their projects, it is hard to convince them otherwise.
Product differentiation HPG’s products have a long-established history and highly recognized, trusted brand.
Capital requirement Huge capital outlay is required to set up new steelmaking factory (estimated VND 8-10 tn to set up an integrated complex with an annual capacity of 1 mtpa).
Incumbents’ defense of market share
Top 5 market leaders comprise of 66% of construction steel, 64% of steel pipe, 70% of galvanized steel sheet, thus the remaining market share for newcomers is very limited and highly competitive.
Cost advantage HPG has a cost advantage due to economies of scale, closed production chain of steelmaking and use of BOF technology.
Scale economies Economies of scale is of huge concern since it can increase the company’s bargaining power against raw materials suppliers.
RIVALRY AMONG EXISTING COMPETITORS
Number of competitors Top 5 market players account for nearly 70% of the market, thus the number of players is not high.
Industry growth Vietnam’s steel industry is the fastest growing in ASEAN and is emerging as one of the largest steel importing country.
Quality differences Steel products are highly similar, yet HPG’s products are.
Brand loyalty HPG has long-standing with customers, especially with huge construction projects, thus customers are not very willing to switch to other steel producers.
Barriers to exit High fixed costs and high capital expenditure on equipment that cannot be used in other kind of business increases the barriers to exit.
Switching costs Since HPG’s products have higher quality than its peers, the switching costs of customers is high.
THREATS OF SUBSTITUTES
There has not yet exist a perfect substitute for steel products. Source: WSA, Team evaluation
APPENDIX C9: MARKET SHARES IN VIETNAM STEEL INDUSTRY
Source: VSA
21%
22%
24%
24%
26%
22%
21%
18%
17%
16%
9%
9%
9%
9%
9%
13%
12%
11%
10%
8%
0%
7%
9%
9%
8%
35%
29%
29%
31%
33%
0% 20% 40% 60% 80% 100%
2015
2016
2017
2018
2019
Vietnam construction steel market share
HPG has consistntly gained market share from SOEs since 2015
HPG VNSteel group Vinakyoei Pomina PoscoSS Ohers
38%
32%
34%
34%
30%
12%
13%
14%
17%
17%
14%
15%
16%
15%
16%
9%
9%
8%
7%
7%
27%
31%
28%
27%
30%
0% 20% 40% 60% 80% 100%
2015
2016
2017
2018
2019
Galvanised steel market share
Galvanised steel sheet volume shares of domestic producers
Hoa Sen Group Dong A Nam Kim GroupChina&Nippon Steel Others
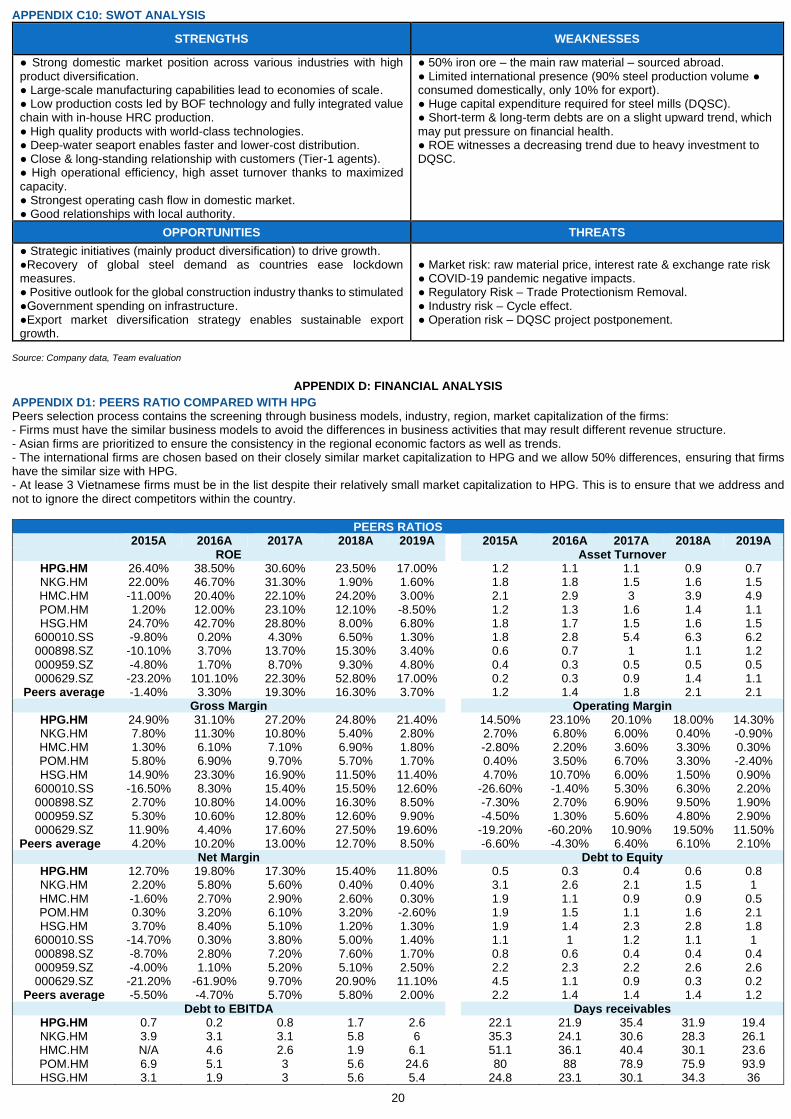
20
APPENDIX C10: SWOT ANALYSIS
STRENGTHS WEAKNESSES
● Strong domestic market position across various industries with high product diversification. ● Large-scale manufacturing capabilities lead to economies of scale. ● Low production costs led by BOF technology and fully integrated value chain with in-house HRC production. ● High quality products with world-class technologies. ● Deep-water seaport enables faster and lower-cost distribution. ● Close & long-standing relationship with customers (Tier-1 agents). ● High operational efficiency, high asset turnover thanks to maximized capacity. ● Strongest operating cash flow in domestic market. ● Good relationships with local authority.
● 50% iron ore – the main raw material – sourced abroad. ● Limited international presence (90% steel production volume ● consumed domestically, only 10% for export). ● Huge capital expenditure required for steel mills (DQSC). ● Short-term & long-term debts are on a slight upward trend, which may put pressure on financial health. ● ROE witnesses a decreasing trend due to heavy investment to DQSC.
OPPORTUNITIES THREATS
● Strategic initiatives (mainly product diversification) to drive growth. ●Recovery of global steel demand as countries ease lockdown measures. ● Positive outlook for the global construction industry thanks to stimulated ●Government spending on infrastructure. ●Export market diversification strategy enables sustainable export growth.
● Market risk: raw material price, interest rate & exchange rate risk ● COVID-19 pandemic negative impacts. ● Regulatory Risk – Trade Protectionism Removal. ● Industry risk – Cycle effect. ● Operation risk – DQSC project postponement.
Source: Company data, Team evaluation
APPENDIX D: FINANCIAL ANALYSIS
APPENDIX D1: PEERS RATIO COMPARED WITH HPG Peers selection process contains the screening through business models, industry, region, market capitalization of the firms: - Firms must have the similar business models to avoid the differences in business activities that may result different revenue structure. - Asian firms are prioritized to ensure the consistency in the regional economic factors as well as trends. - The international firms are chosen based on their closely similar market capitalization to HPG and we allow 50% differences, ensuring that firms have the similar size with HPG. - At lease 3 Vietnamese firms must be in the list despite their relatively small market capitalization to HPG. This is to ensure that we address and not to ignore the direct competitors within the country.
PEERS RATIOS 2015A 2016A 2017A 2018A 2019A 2015A 2016A 2017A 2018A 2019A
ROE Asset Turnover HPG.HM 26.40% 38.50% 30.60% 23.50% 17.00% 1.2 1.1 1.1 0.9 0.7 NKG.HM 22.00% 46.70% 31.30% 1.90% 1.60% 1.8 1.8 1.5 1.6 1.5 HMC.HM -11.00% 20.40% 22.10% 24.20% 3.00% 2.1 2.9 3 3.9 4.9 POM.HM 1.20% 12.00% 23.10% 12.10% -8.50% 1.2 1.3 1.6 1.4 1.1 HSG.HM 24.70% 42.70% 28.80% 8.00% 6.80% 1.8 1.7 1.5 1.6 1.5
600010.SS -9.80% 0.20% 4.30% 6.50% 1.30% 1.8 2.8 5.4 6.3 6.2 000898.SZ -10.10% 3.70% 13.70% 15.30% 3.40% 0.6 0.7 1 1.1 1.2 000959.SZ -4.80% 1.70% 8.70% 9.30% 4.80% 0.4 0.3 0.5 0.5 0.5 000629.SZ -23.20% 101.10% 22.30% 52.80% 17.00% 0.2 0.3 0.9 1.4 1.1
Peers average -1.40% 3.30% 19.30% 16.30% 3.70% 1.2 1.4 1.8 2.1 2.1 Gross Margin Operating Margin
HPG.HM 24.90% 31.10% 27.20% 24.80% 21.40% 14.50% 23.10% 20.10% 18.00% 14.30% NKG.HM 7.80% 11.30% 10.80% 5.40% 2.80% 2.70% 6.80% 6.00% 0.40% -0.90% HMC.HM 1.30% 6.10% 7.10% 6.90% 1.80% -2.80% 2.20% 3.60% 3.30% 0.30% POM.HM 5.80% 6.90% 9.70% 5.70% 1.70% 0.40% 3.50% 6.70% 3.30% -2.40% HSG.HM 14.90% 23.30% 16.90% 11.50% 11.40% 4.70% 10.70% 6.00% 1.50% 0.90%
600010.SS -16.50% 8.30% 15.40% 15.50% 12.60% -26.60% -1.40% 5.30% 6.30% 2.20% 000898.SZ 2.70% 10.80% 14.00% 16.30% 8.50% -7.30% 2.70% 6.90% 9.50% 1.90% 000959.SZ 5.30% 10.60% 12.80% 12.60% 9.90% -4.50% 1.30% 5.60% 4.80% 2.90% 000629.SZ 11.90% 4.40% 17.60% 27.50% 19.60% -19.20% -60.20% 10.90% 19.50% 11.50%
Peers average 4.20% 10.20% 13.00% 12.70% 8.50% -6.60% -4.30% 6.40% 6.10% 2.10% Net Margin Debt to Equity
HPG.HM 12.70% 19.80% 17.30% 15.40% 11.80% 0.5 0.3 0.4 0.6 0.8 NKG.HM 2.20% 5.80% 5.60% 0.40% 0.40% 3.1 2.6 2.1 1.5 1 HMC.HM -1.60% 2.70% 2.90% 2.60% 0.30% 1.9 1.1 0.9 0.9 0.5 POM.HM 0.30% 3.20% 6.10% 3.20% -2.60% 1.9 1.5 1.1 1.6 2.1 HSG.HM 3.70% 8.40% 5.10% 1.20% 1.30% 1.9 1.4 2.3 2.8 1.8
600010.SS -14.70% 0.30% 3.80% 5.00% 1.40% 1.1 1 1.2 1.1 1 000898.SZ -8.70% 2.80% 7.20% 7.60% 1.70% 0.8 0.6 0.4 0.4 0.4 000959.SZ -4.00% 1.10% 5.20% 5.10% 2.50% 2.2 2.3 2.2 2.6 2.6 000629.SZ -21.20% -61.90% 9.70% 20.90% 11.10% 4.5 1.1 0.9 0.3 0.2
Peers average -5.50% -4.70% 5.70% 5.80% 2.00% 2.2 1.4 1.4 1.4 1.2 Debt to EBITDA Days receivables
HPG.HM 0.7 0.2 0.8 1.7 2.6 22.1 21.9 35.4 31.9 19.4 NKG.HM 3.9 3.1 3.1 5.8 6 35.3 24.1 30.6 28.3 26.1 HMC.HM N/A 4.6 2.6 1.9 6.1 51.1 36.1 40.4 30.1 23.6 POM.HM 6.9 5.1 3 5.6 24.6 80 88 78.9 75.9 93.9 HSG.HM 3.1 1.9 3 5.6 5.4 24.8 23.1 30.1 34.3 36
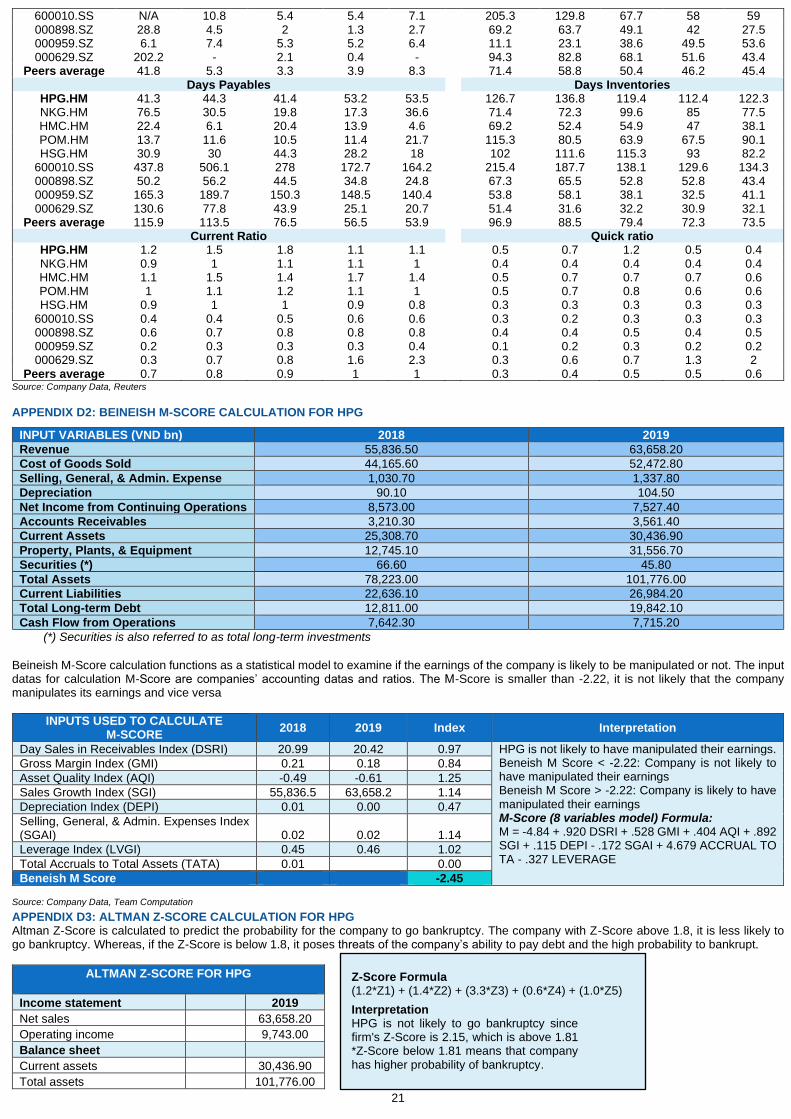
21
600010.SS N/A 10.8 5.4 5.4 7.1 205.3 129.8 67.7 58 59 000898.SZ 28.8 4.5 2 1.3 2.7 69.2 63.7 49.1 42 27.5 000959.SZ 6.1 7.4 5.3 5.2 6.4 11.1 23.1 38.6 49.5 53.6 000629.SZ 202.2 - 2.1 0.4 - 94.3 82.8 68.1 51.6 43.4
Peers average 41.8 5.3 3.3 3.9 8.3 71.4 58.8 50.4 46.2 45.4 Days Payables Days Inventories
HPG.HM 41.3 44.3 41.4 53.2 53.5 126.7 136.8 119.4 112.4 122.3 NKG.HM 76.5 30.5 19.8 17.3 36.6 71.4 72.3 99.6 85 77.5 HMC.HM 22.4 6.1 20.4 13.9 4.6 69.2 52.4 54.9 47 38.1 POM.HM 13.7 11.6 10.5 11.4 21.7 115.3 80.5 63.9 67.5 90.1 HSG.HM 30.9 30 44.3 28.2 18 102 111.6 115.3 93 82.2
600010.SS 437.8 506.1 278 172.7 164.2 215.4 187.7 138.1 129.6 134.3 000898.SZ 50.2 56.2 44.5 34.8 24.8 67.3 65.5 52.8 52.8 43.4 000959.SZ 165.3 189.7 150.3 148.5 140.4 53.8 58.1 38.1 32.5 41.1 000629.SZ 130.6 77.8 43.9 25.1 20.7 51.4 31.6 32.2 30.9 32.1
Peers average 115.9 113.5 76.5 56.5 53.9 96.9 88.5 79.4 72.3 73.5 Current Ratio Quick ratio
HPG.HM 1.2 1.5 1.8 1.1 1.1 0.5 0.7 1.2 0.5 0.4 NKG.HM 0.9 1 1.1 1.1 1 0.4 0.4 0.4 0.4 0.4 HMC.HM 1.1 1.5 1.4 1.7 1.4 0.5 0.7 0.7 0.7 0.6 POM.HM 1 1.1 1.2 1.1 1 0.5 0.7 0.8 0.6 0.6 HSG.HM 0.9 1 1 0.9 0.8 0.3 0.3 0.3 0.3 0.3
600010.SS 0.4 0.4 0.5 0.6 0.6 0.3 0.2 0.3 0.3 0.3 000898.SZ 0.6 0.7 0.8 0.8 0.8 0.4 0.4 0.5 0.4 0.5 000959.SZ 0.2 0.3 0.3 0.3 0.4 0.1 0.2 0.3 0.2 0.2 000629.SZ 0.3 0.7 0.8 1.6 2.3 0.3 0.6 0.7 1.3 2
Peers average 0.7 0.8 0.9 1 1 0.3 0.4 0.5 0.5 0.6 Source: Company Data, Reuters
APPENDIX D2: BEINEISH M-SCORE CALCULATION FOR HPG
Beineish M-Score calculation functions as a statistical model to examine if the earnings of the company is likely to be manipulated or not. The input datas for calculation M-Score are companies’ accounting datas and ratios. The M-Score is smaller than -2.22, it is not likely that the company manipulates its earnings and vice versa
INPUTS USED TO CALCULATE M-SCORE
2018 2019 Index Interpretation
Day Sales in Receivables Index (DSRI) 20.99 20.42 0.97 HPG is not likely to have manipulated their earnings. Beneish M Score < -2.22: Company is not likely to have manipulated their earnings Beneish M Score > -2.22: Company is likely to have manipulated their earnings M-Score (8 variables model) Formula: M = -4.84 + .920 DSRI + .528 GMI + .404 AQI + .892 SGI + .115 DEPI - .172 SGAI + 4.679 ACCRUAL TO TA - .327 LEVERAGE
Gross Margin Index (GMI) 0.21 0.18 0.84
Asset Quality Index (AQI) -0.49 -0.61 1.25
Sales Growth Index (SGI) 55,836.5 63,658.2 1.14
Depreciation Index (DEPI) 0.01 0.00 0.47
Selling, General, & Admin. Expenses Index (SGAI) 0.02 0.02 1.14
Leverage Index (LVGI) 0.45 0.46 1.02
Total Accruals to Total Assets (TATA) 0.01 0.00
Beneish M Score -2.45 Source: Company Data, Team Computation
APPENDIX D3: ALTMAN Z-SCORE CALCULATION FOR HPG Altman Z-Score is calculated to predict the probability for the company to go bankruptcy. The company with Z-Score above 1.8, it is less likely to go bankruptcy. Whereas, if the Z-Score is below 1.8, it poses threats of the company’s ability to pay debt and the high probability to bankrupt.
ALTMAN Z-SCORE FOR HPG
Income statement 2019
Net sales 63,658.20
Operating income 9,743.00
Balance sheet
Current assets 30,436.90
Total assets 101,776.00
INPUT VARIABLES (VND bn) 2018 2019
Revenue 55,836.50 63,658.20
Cost of Goods Sold 44,165.60 52,472.80
Selling, General, & Admin. Expense 1,030.70 1,337.80
Depreciation 90.10 104.50
Net Income from Continuing Operations 8,573.00 7,527.40
Accounts Receivables 3,210.30 3,561.40
Current Assets 25,308.70 30,436.90
Property, Plants, & Equipment 12,745.10 31,556.70
Securities (*) 66.60 45.80
Total Assets 78,223.00 101,776.00
Current Liabilities 22,636.10 26,984.20
Total Long-term Debt 12,811.00 19,842.10
Cash Flow from Operations 7,642.30 7,715.20
(*) Securities is also referred to as total long-term investments
Z-Score Formula (1.2*Z1) + (1.4*Z2) + (3.3*Z3) + (0.6*Z4) + (1.0*Z5) Interpretation HPG is not likely to go bankruptcy since firm's Z-Score is 2.15, which is above 1.81 *Z-Score below 1.81 means that company has higher probability of bankruptcy.
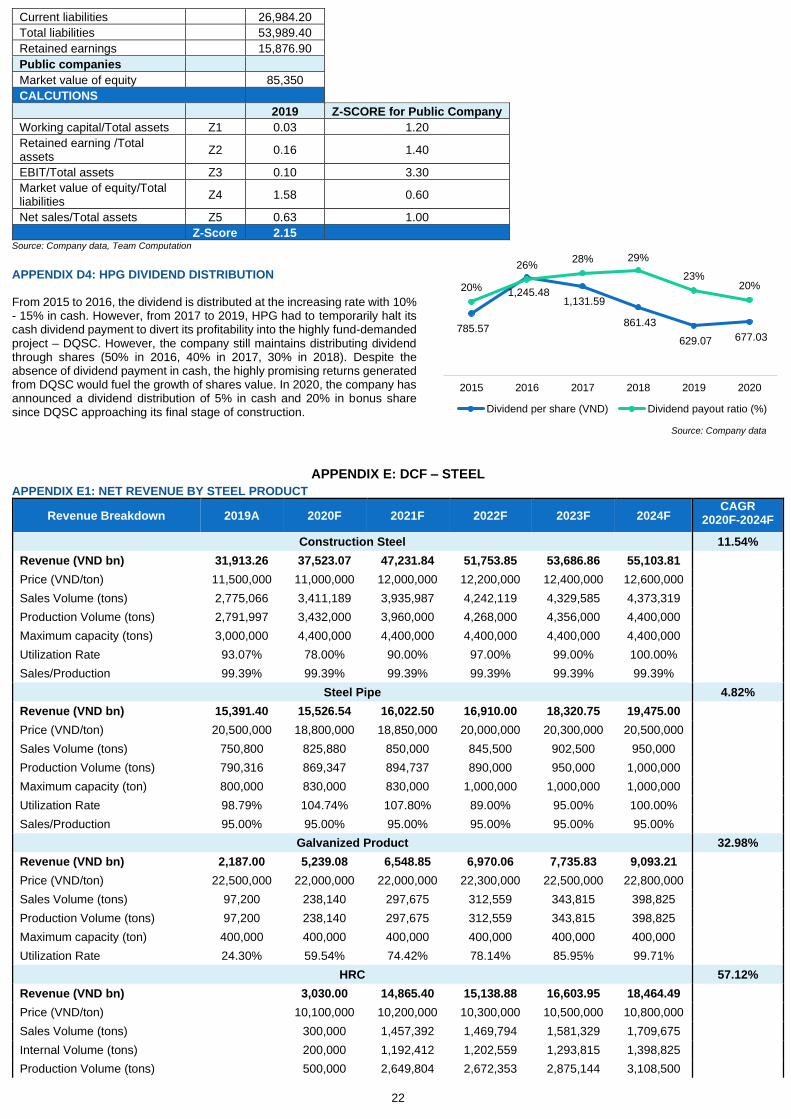
22
Current liabilities 26,984.20
Total liabilities 53,989.40
Retained earnings 15,876.90
Public companies
Market value of equity 85,350
CALCUTIONS
2019 Z-SCORE for Public Company
Working capital/Total assets Z1 0.03 1.20
Retained earning /Total assets
Z2 0.16 1.40
EBIT/Total assets Z3 0.10 3.30
Market value of equity/Total liabilities
Z4 1.58 0.60
Net sales/Total assets Z5 0.63 1.00
Z-Score 2.15 Source: Company data, Team Computation
APPENDIX D4: HPG DIVIDEND DISTRIBUTION From 2015 to 2016, the dividend is distributed at the increasing rate with 10% - 15% in cash. However, from 2017 to 2019, HPG had to temporarily halt its cash dividend payment to divert its profitability into the highly fund-demanded project – DQSC. However, the company still maintains distributing dividend through shares (50% in 2016, 40% in 2017, 30% in 2018). Despite the absence of dividend payment in cash, the highly promising returns generated from DQSC would fuel the growth of shares value. In 2020, the company has announced a dividend distribution of 5% in cash and 20% in bonus share since DQSC approaching its final stage of construction.
APPENDIX E: DCF – STEEL
APPENDIX E1: NET REVENUE BY STEEL PRODUCT
Revenue Breakdown 2019A 2020F 2021F 2022F 2023F 2024F CAGR
2020F-2024F
Construction Steel 11.54%
Revenue (VND bn) 31,913.26 37,523.07 47,231.84 51,753.85 53,686.86 55,103.81
Price (VND/ton) 11,500,000 11,000,000 12,000,000 12,200,000 12,400,000 12,600,000
Sales Volume (tons) 2,775,066 3,411,189 3,935,987 4,242,119 4,329,585 4,373,319
Production Volume (tons) 2,791,997 3,432,000 3,960,000 4,268,000 4,356,000 4,400,000
Maximum capacity (tons) 3,000,000 4,400,000 4,400,000 4,400,000 4,400,000 4,400,000
Utilization Rate 93.07% 78.00% 90.00% 97.00% 99.00% 100.00%
Sales/Production 99.39% 99.39% 99.39% 99.39% 99.39% 99.39%
Steel Pipe 4.82%
Revenue (VND bn) 15,391.40 15,526.54 16,022.50 16,910.00 18,320.75 19,475.00
Price (VND/ton) 20,500,000 18,800,000 18,850,000 20,000,000 20,300,000 20,500,000
Sales Volume (tons) 750,800 825,880 850,000 845,500 902,500 950,000
Production Volume (tons) 790,316 869,347 894,737 890,000 950,000 1,000,000
Maximum capacity (ton) 800,000 830,000 830,000 1,000,000 1,000,000 1,000,000
Utilization Rate 98.79% 104.74% 107.80% 89.00% 95.00% 100.00%
Sales/Production 95.00% 95.00% 95.00% 95.00% 95.00% 95.00%
Galvanized Product 32.98%
Revenue (VND bn) 2,187.00 5,239.08 6,548.85 6,970.06 7,735.83 9,093.21
Price (VND/ton) 22,500,000 22,000,000 22,000,000 22,300,000 22,500,000 22,800,000
Sales Volume (tons) 97,200 238,140 297,675 312,559 343,815 398,825
Production Volume (tons) 97,200 238,140 297,675 312,559 343,815 398,825
Maximum capacity (ton) 400,000 400,000 400,000 400,000 400,000 400,000
Utilization Rate 24.30% 59.54% 74.42% 78.14% 85.95% 99.71%
HRC 57.12%
Revenue (VND bn) 3,030.00 14,865.40 15,138.88 16,603.95 18,464.49
Price (VND/ton) 10,100,000 10,200,000 10,300,000 10,500,000 10,800,000
Sales Volume (tons) 300,000 1,457,392 1,469,794 1,581,329 1,709,675
Internal Volume (tons) 200,000 1,192,412 1,202,559 1,293,815 1,398,825
Production Volume (tons) 500,000 2,649,804 2,672,353 2,875,144 3,108,500
785.57
1,245.48 1,131.59
861.43
629.07 677.03
20%
26%28% 29%
23%20%
0%
5%
10%
15%
20%
25%
30%
-
200.00
400.00
600.00
800.00
1,000.00
1,200.00
1,400.00
2015 2016 2017 2018 2019 2020
Dividend per share (VND) Dividend payout ratio (%)
Source: Company data
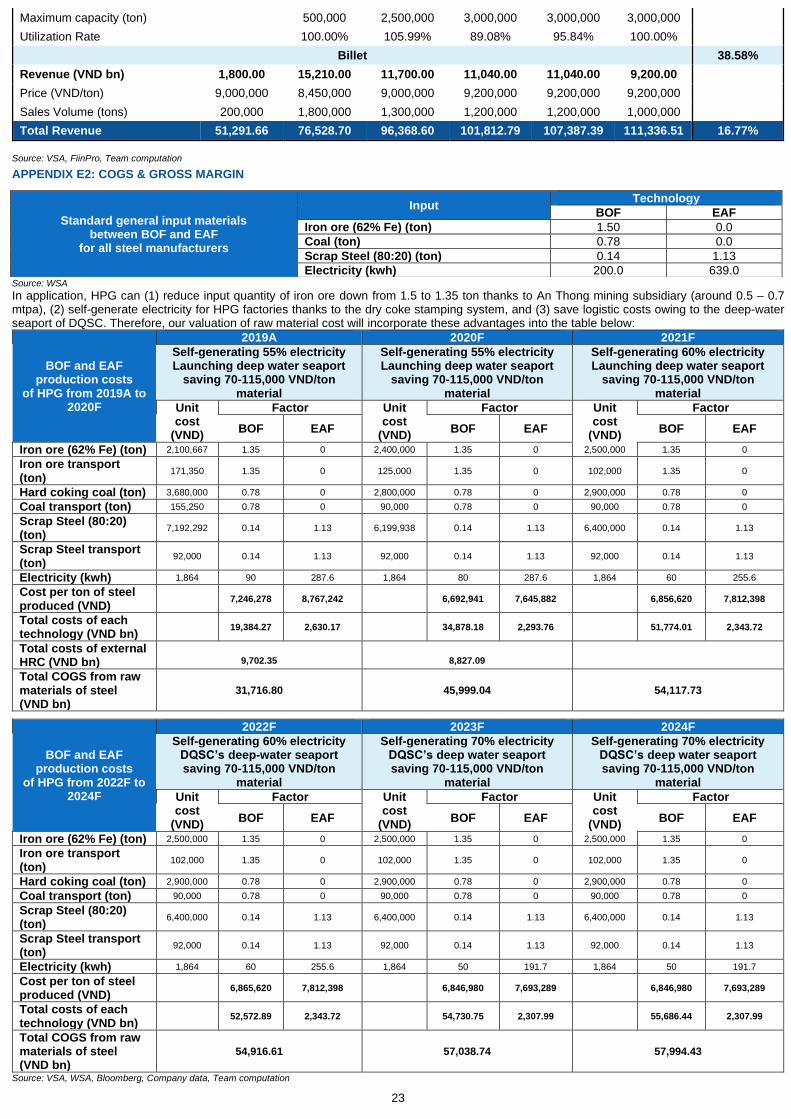
23
Maximum capacity (ton) 500,000 2,500,000 3,000,000 3,000,000 3,000,000
Utilization Rate 100.00% 105.99% 89.08% 95.84% 100.00%
Billet 38.58%
Revenue (VND bn) 1,800.00 15,210.00 11,700.00 11,040.00 11,040.00 9,200.00
Price (VND/ton) 9,000,000 8,450,000 9,000,000 9,200,000 9,200,000 9,200,000
Sales Volume (tons) 200,000 1,800,000 1,300,000 1,200,000 1,200,000 1,000,000
Total Revenue 51,291.66 76,528.70 96,368.60 101,812.79 107,387.39 111,336.51 16.77%
Source: VSA, FiinPro, Team computation
APPENDIX E2: COGS & GROSS MARGIN
Source: WSA
In application, HPG can (1) reduce input quantity of iron ore down from 1.5 to 1.35 ton thanks to An Thong mining subsidiary (around 0.5 – 0.7 mtpa), (2) self-generate electricity for HPG factories thanks to the dry coke stamping system, and (3) save logistic costs owing to the deep-water seaport of DQSC. Therefore, our valuation of raw material cost will incorporate these advantages into the table below:
BOF and EAF production costs
of HPG from 2019A to 2020F
2019A 2020F 2021F
Self-generating 55% electricity Launching deep water seaport
saving 70-115,000 VND/ton material
Self-generating 55% electricity Launching deep water seaport
saving 70-115,000 VND/ton material
Self-generating 60% electricity Launching deep water seaport
saving 70-115,000 VND/ton material
Unit cost
(VND)
Factor Unit cost
(VND)
Factor Unit cost
(VND)
Factor
BOF EAF BOF EAF BOF EAF
Iron ore (62% Fe) (ton) 2,100,667 1.35 0 2,400,000 1.35 0 2,500,000 1.35 0
Iron ore transport (ton)
171,350 1.35 0 125,000 1.35 0 102,000 1.35 0
Hard coking coal (ton) 3,680,000 0.78 0 2,800,000 0.78 0 2,900,000 0.78 0
Coal transport (ton) 155,250 0.78 0 90,000 0.78 0 90,000 0.78 0
Scrap Steel (80:20) (ton)
7,192,292 0.14 1.13 6,199,938 0.14 1.13 6,400,000 0.14 1.13
Scrap Steel transport (ton)
92,000 0.14 1.13 92,000 0.14 1.13 92,000 0.14 1.13
Electricity (kwh) 1,864 90 287.6 1,864 80 287.6 1,864 60 255.6
Cost per ton of steel produced (VND)
7,246,278 8,767,242 6,692,941 7,645,882 6,856,620 7,812,398
Total costs of each technology (VND bn)
19,384.27 2,630.17 34,878.18 2,293.76 51,774.01 2,343.72
Total costs of external HRC (VND bn)
9,702.35
8,827.09
Total COGS from raw materials of steel (VND bn)
31,716.80 45,999.04 54,117.73
BOF and EAF production costs
of HPG from 2022F to 2024F
2022F 2023F 2024F
Self-generating 60% electricity DQSC’s deep-water seaport saving 70-115,000 VND/ton
material
Self-generating 70% electricity DQSC’s deep water seaport saving 70-115,000 VND/ton
material
Self-generating 70% electricity DQSC’s deep water seaport saving 70-115,000 VND/ton
material
Unit cost
(VND)
Factor Unit cost
(VND)
Factor Unit cost
(VND)
Factor
BOF EAF BOF EAF BOF EAF
Iron ore (62% Fe) (ton) 2,500,000 1.35 0 2,500,000 1.35 0 2,500,000 1.35 0
Iron ore transport (ton)
102,000 1.35 0 102,000 1.35 0 102,000 1.35 0
Hard coking coal (ton) 2,900,000 0.78 0 2,900,000 0.78 0 2,900,000 0.78 0
Coal transport (ton) 90,000 0.78 0 90,000 0.78 0 90,000 0.78 0
Scrap Steel (80:20) (ton)
6,400,000 0.14 1.13 6,400,000 0.14 1.13 6,400,000 0.14 1.13
Scrap Steel transport (ton)
92,000 0.14 1.13 92,000 0.14 1.13 92,000 0.14 1.13
Electricity (kwh) 1,864 60 255.6 1,864 50 191.7 1,864 50 191.7
Cost per ton of steel produced (VND)
6,865,620 7,812,398 6,846,980 7,693,289 6,846,980 7,693,289
Total costs of each technology (VND bn)
52,572.89 2,343.72 54,730.75 2,307.99 55,686.44 2,307.99
Total COGS from raw materials of steel (VND bn)
54,916.61 57,038.74 57,994.43
Source: VSA, WSA, Bloomberg, Company data, Team computation
Standard general input materials between BOF and EAF
for all steel manufacturers
Input Technology
BOF EAF
Iron ore (62% Fe) (ton) 1.50 0.0
Coal (ton) 0.78 0.0
Scrap Steel (80:20) (ton) 0.14 1.13
Electricity (kwh) 200.0 639.0
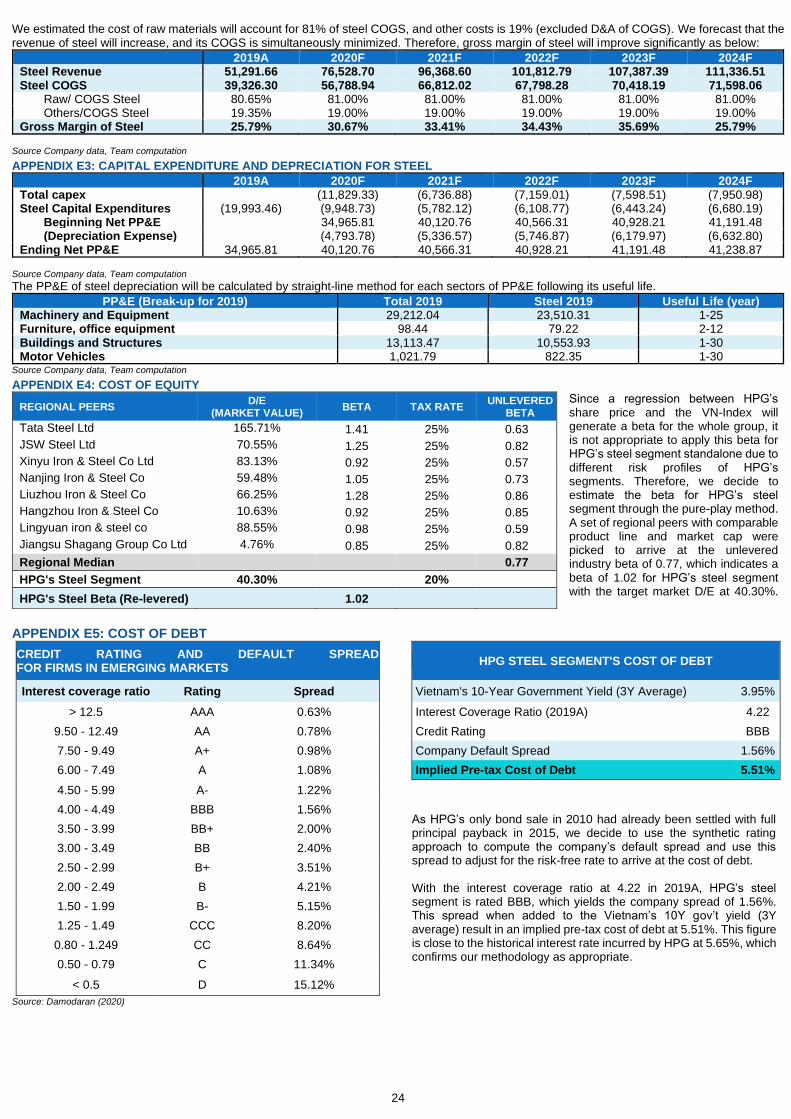
24
We estimated the cost of raw materials will account for 81% of steel COGS, and other costs is 19% (excluded D&A of COGS). We forecast that the revenue of steel will increase, and its COGS is simultaneously minimized. Therefore, gross margin of steel will improve significantly as below:
2019A 2020F 2021F 2022F 2023F 2024F Steel Revenue 51,291.66 76,528.70 96,368.60 101,812.79 107,387.39 111,336.51 Steel COGS 39,326.30 56,788.94 66,812.02 67,798.28 70,418.19 71,598.06
Raw/ COGS Steel 80.65% 81.00% 81.00% 81.00% 81.00% 81.00% Others/COGS Steel 19.35% 19.00% 19.00% 19.00% 19.00% 19.00%
Gross Margin of Steel 25.79% 30.67% 33.41% 34.43% 35.69% 25.79% Source Company data, Team computation
APPENDIX E3: CAPITAL EXPENDITURE AND DEPRECIATION FOR STEEL 2019A 2020F 2021F 2022F 2023F 2024F
Total capex (11,829.33) (6,736.88) (7,159.01) (7,598.51) (7,950.98) Steel Capital Expenditures (19,993.46) (9,948.73) (5,782.12) (6,108.77) (6,443.24) (6,680.19)
Beginning Net PP&E 34,965.81 40,120.76 40,566.31 40,928.21 41,191.48 (Depreciation Expense) (4,793.78) (5,336.57) (5,746.87) (6,179.97) (6,632.80)
Ending Net PP&E 34,965.81 40,120.76 40,566.31 40,928.21 41,191.48 41,238.87 Source Company data, Team computation
The PP&E of steel depreciation will be calculated by straight-line method for each sectors of PP&E following its useful life.
PP&E (Break-up for 2019) Total 2019 Steel 2019 Useful Life (year) Machinery and Equipment 29,212.04 23,510.31 1-25 Furniture, office equipment 98.44 79.22 2-12 Buildings and Structures 13,113.47 10,553.93 1-30 Motor Vehicles 1,021.79 822.35 1-30
Source Company data, Team computation
APPENDIX E4: COST OF EQUITY Since a regression between HPG’s share price and the VN-Index will generate a beta for the whole group, it is not appropriate to apply this beta for HPG’s steel segment standalone due to different risk profiles of HPG’s segments. Therefore, we decide to estimate the beta for HPG’s steel segment through the pure-play method. A set of regional peers with comparable product line and market cap were picked to arrive at the unlevered industry beta of 0.77, which indicates a beta of 1.02 for HPG’s steel segment with the target market D/E at 40.30%.
APPENDIX E5: COST OF DEBT
CREDIT RATING AND DEFAULT SPREAD FOR FIRMS IN EMERGING MARKETS
HPG STEEL SEGMENT'S COST OF DEBT
Interest coverage ratio Rating Spread Vietnam's 10-Year Government Yield (3Y Average) 3.95%
> 12.5 AAA 0.63% Interest Coverage Ratio (2019A) 4.22
9.50 - 12.49 AA 0.78% Credit Rating BBB
7.50 - 9.49 A+ 0.98% Company Default Spread 1.56%
6.00 - 7.49 A 1.08% Implied Pre-tax Cost of Debt 5.51%
4.50 - 5.99 A- 1.22%
As HPG’s only bond sale in 2010 had already been settled with full principal payback in 2015, we decide to use the synthetic rating approach to compute the company’s default spread and use this spread to adjust for the risk-free rate to arrive at the cost of debt. With the interest coverage ratio at 4.22 in 2019A, HPG’s steel segment is rated BBB, which yields the company spread of 1.56%. This spread when added to the Vietnam’s 10Y gov’t yield (3Y average) result in an implied pre-tax cost of debt at 5.51%. This figure is close to the historical interest rate incurred by HPG at 5.65%, which confirms our methodology as appropriate.
4.00 - 4.49 BBB 1.56%
3.50 - 3.99 BB+ 2.00%
3.00 - 3.49 BB 2.40%
2.50 - 2.99 B+ 3.51%
2.00 - 2.49 B 4.21%
1.50 - 1.99 B- 5.15%
1.25 - 1.49 CCC 8.20%
0.80 - 1.249 CC 8.64%
0.50 - 0.79 C 11.34%
< 0.5 D 15.12%
Source: Damodaran (2020)
REGIONAL PEERS D/E
(MARKET VALUE) BETA TAX RATE
UNLEVERED BETA
Tata Steel Ltd 165.71% 1.41 25% 0.63
JSW Steel Ltd 70.55% 1.25 25% 0.82
Xinyu Iron & Steel Co Ltd 83.13% 0.92 25% 0.57
Nanjing Iron & Steel Co 59.48% 1.05 25% 0.73
Liuzhou Iron & Steel Co 66.25% 1.28 25% 0.86
Hangzhou Iron & Steel Co 10.63% 0.92 25% 0.85
Lingyuan iron & steel co 88.55% 0.98 25% 0.59
Jiangsu Shagang Group Co Ltd 4.76% 0.85 25% 0.82
Regional Median
0.77
HPG's Steel Segment 40.30% 20%
HPG's Steel Beta (Re-levered) 1.02
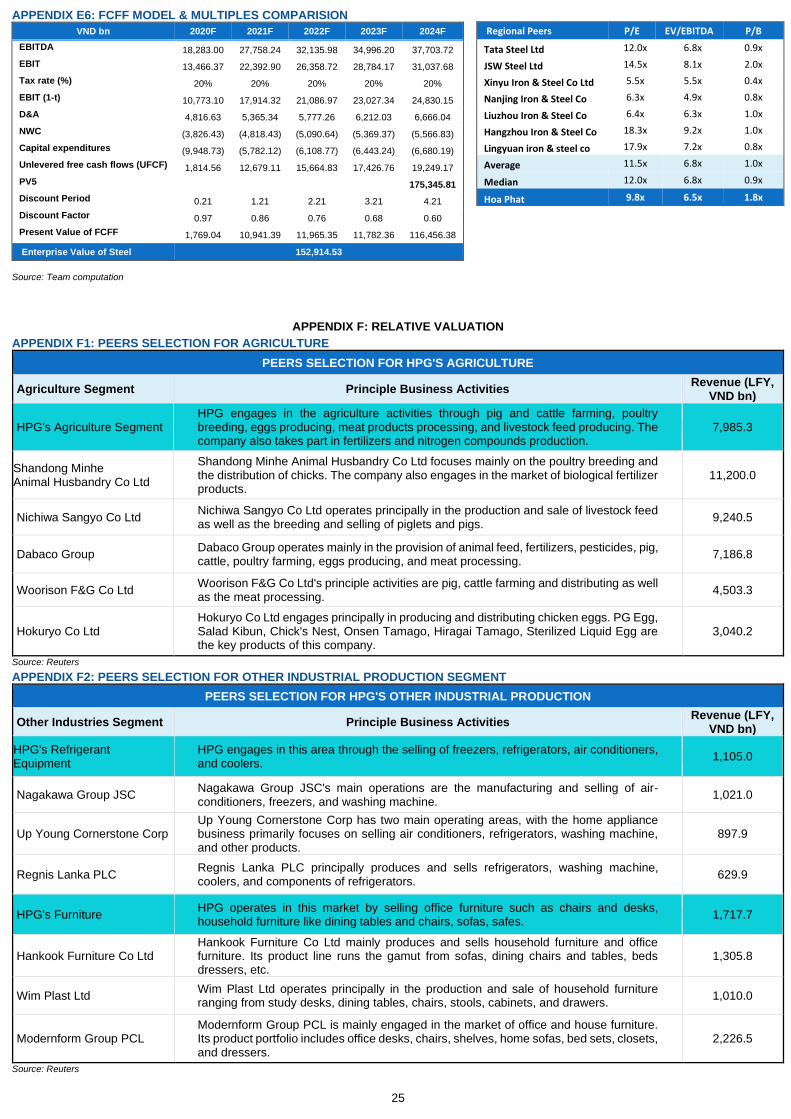
25
APPENDIX E6: FCFF MODEL & MULTIPLES COMPARISION
VND bn 2020F 2021F 2022F 2023F 2024F
EBITDA 18,283.00 27,758.24 32,135.98 34,996.20 37,703.72
EBIT 13,466.37 22,392.90 26,358.72 28,784.17 31,037.68
Tax rate (%) 20% 20% 20% 20% 20%
EBIT (1-t) 10,773.10 17,914.32 21,086.97 23,027.34 24,830.15
D&A 4,816.63 5,365.34 5,777.26 6,212.03 6,666.04
NWC (3,826.43) (4,818.43) (5,090.64) (5,369.37) (5,566.83)
Capital expenditures (9,948.73) (5,782.12) (6,108.77) (6,443.24) (6,680.19)
Unlevered free cash flows (UFCF) 1,814.56 12,679.11 15,664.83 17,426.76 19,249.17
PV5 175,345.81
Discount Period 0.21 1.21 2.21 3.21 4.21
Discount Factor 0.97 0.86 0.76 0.68 0.60
Present Value of FCFF 1,769.04 10,941.39 11,965.35 11,782.36 116,456.38
Enterprise Value of Steel 152,914.53
Source: Team computation
APPENDIX F: RELATIVE VALUATION
APPENDIX F1: PEERS SELECTION FOR AGRICULTURE
PEERS SELECTION FOR HPG'S AGRICULTURE
Agriculture Segment Principle Business Activities Revenue (LFY,
VND bn)
HPG's Agriculture Segment HPG engages in the agriculture activities through pig and cattle farming, poultry breeding, eggs producing, meat products processing, and livestock feed producing. The company also takes part in fertilizers and nitrogen compounds production.
7,985.3
Shandong Minhe Animal Husbandry Co Ltd
Shandong Minhe Animal Husbandry Co Ltd focuses mainly on the poultry breeding and the distribution of chicks. The company also engages in the market of biological fertilizer products.
11,200.0
Nichiwa Sangyo Co Ltd Nichiwa Sangyo Co Ltd operates principally in the production and sale of livestock feed as well as the breeding and selling of piglets and pigs.
9,240.5
Dabaco Group Dabaco Group operates mainly in the provision of animal feed, fertilizers, pesticides, pig, cattle, poultry farming, eggs producing, and meat processing.
7,186.8
Woorison F&G Co Ltd Woorison F&G Co Ltd's principle activities are pig, cattle farming and distributing as well as the meat processing.
4,503.3
Hokuryo Co Ltd Hokuryo Co Ltd engages principally in producing and distributing chicken eggs. PG Egg, Salad Kibun, Chick's Nest, Onsen Tamago, Hiragai Tamago, Sterilized Liquid Egg are the key products of this company.
3,040.2
Source: Reuters
APPENDIX F2: PEERS SELECTION FOR OTHER INDUSTRIAL PRODUCTION SEGMENT
PEERS SELECTION FOR HPG'S OTHER INDUSTRIAL PRODUCTION
Other Industries Segment Principle Business Activities Revenue (LFY,
VND bn)
HPG's Refrigerant Equipment
HPG engages in this area through the selling of freezers, refrigerators, air conditioners, and coolers.
1,105.0
Nagakawa Group JSC Nagakawa Group JSC's main operations are the manufacturing and selling of air-conditioners, freezers, and washing machine.
1,021.0
Up Young Cornerstone Corp Up Young Cornerstone Corp has two main operating areas, with the home appliance business primarily focuses on selling air conditioners, refrigerators, washing machine, and other products.
897.9
Regnis Lanka PLC Regnis Lanka PLC principally produces and sells refrigerators, washing machine, coolers, and components of refrigerators.
629.9
HPG's Furniture HPG operates in this market by selling office furniture such as chairs and desks, household furniture like dining tables and chairs, sofas, safes.
1,717.7
Hankook Furniture Co Ltd Hankook Furniture Co Ltd mainly produces and sells household furniture and office furniture. Its product line runs the gamut from sofas, dining chairs and tables, beds dressers, etc.
1,305.8
Wim Plast Ltd Wim Plast Ltd operates principally in the production and sale of household furniture ranging from study desks, dining tables, chairs, stools, cabinets, and drawers.
1,010.0
Modernform Group PCL Modernform Group PCL is mainly engaged in the market of office and house furniture. Its product portfolio includes office desks, chairs, shelves, home sofas, bed sets, closets, and dressers.
2,226.5
Source: Reuters
Regional Peers P/E EV/EBITDA P/B
Tata Steel Ltd 12.0x 6.8x 0.9x
JSW Steel Ltd 14.5x 8.1x 2.0x
Xinyu Iron & Steel Co Ltd 5.5x 5.5x 0.4x
Nanjing Iron & Steel Co 6.3x 4.9x 0.8x
Liuzhou Iron & Steel Co 6.4x 6.3x 1.0x
Hangzhou Iron & Steel Co 18.3x 9.2x 1.0x
Lingyuan iron & steel co 17.9x 7.2x 0.8x
Average 11.5x 6.8x 1.0x
Median 12.0x 6.8x 0.9x
Hoa Phat 9.8x 6.5x 1.8x
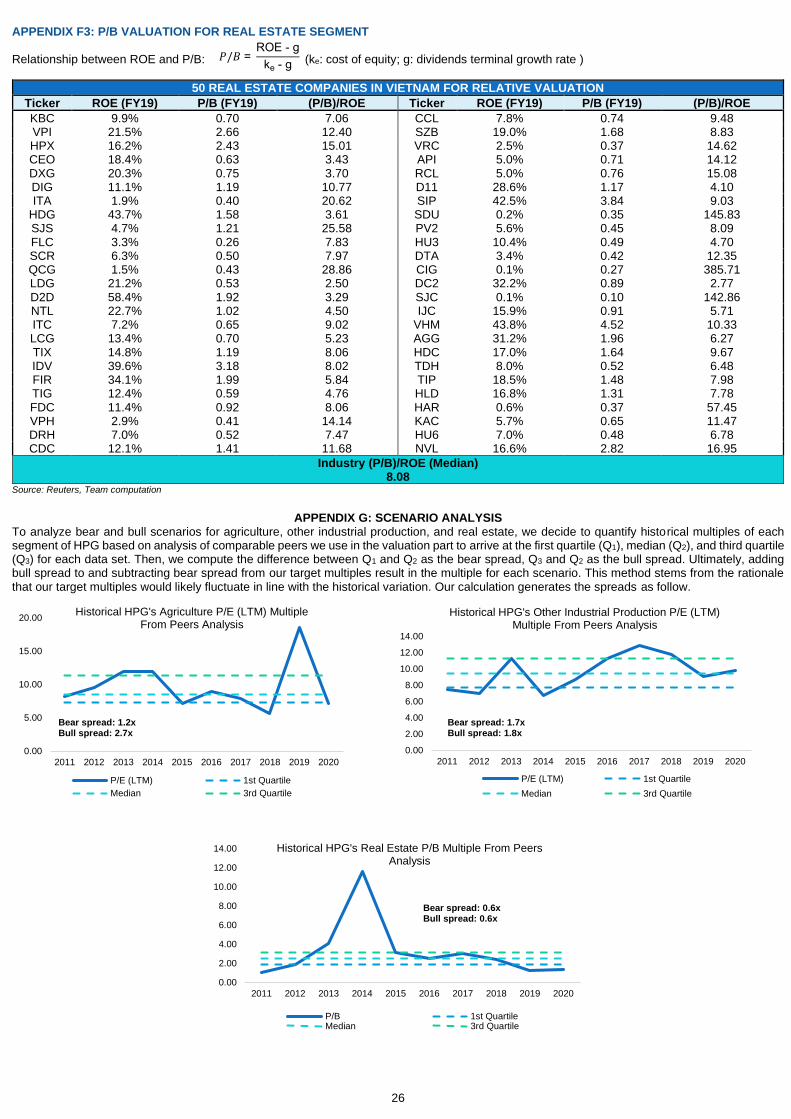
26
APPENDIX F3: P/B VALUATION FOR REAL ESTATE SEGMENT Relationship between ROE and P/B: (ke: cost of equity; g: dividends terminal growth rate )
50 REAL ESTATE COMPANIES IN VIETNAM FOR RELATIVE VALUATION
Ticker ROE (FY19) P/B (FY19) (P/B)/ROE Ticker ROE (FY19) P/B (FY19) (P/B)/ROE
KBC 9.9% 0.70 7.06 CCL 7.8% 0.74 9.48 VPI 21.5% 2.66 12.40 SZB 19.0% 1.68 8.83 HPX 16.2% 2.43 15.01 VRC 2.5% 0.37 14.62 CEO 18.4% 0.63 3.43 API 5.0% 0.71 14.12 DXG 20.3% 0.75 3.70 RCL 5.0% 0.76 15.08 DIG 11.1% 1.19 10.77 D11 28.6% 1.17 4.10 ITA 1.9% 0.40 20.62 SIP 42.5% 3.84 9.03
HDG 43.7% 1.58 3.61 SDU 0.2% 0.35 145.83 SJS 4.7% 1.21 25.58 PV2 5.6% 0.45 8.09 FLC 3.3% 0.26 7.83 HU3 10.4% 0.49 4.70 SCR 6.3% 0.50 7.97 DTA 3.4% 0.42 12.35 QCG 1.5% 0.43 28.86 CIG 0.1% 0.27 385.71 LDG 21.2% 0.53 2.50 DC2 32.2% 0.89 2.77 D2D 58.4% 1.92 3.29 SJC 0.1% 0.10 142.86 NTL 22.7% 1.02 4.50 IJC 15.9% 0.91 5.71 ITC 7.2% 0.65 9.02 VHM 43.8% 4.52 10.33 LCG 13.4% 0.70 5.23 AGG 31.2% 1.96 6.27 TIX 14.8% 1.19 8.06 HDC 17.0% 1.64 9.67 IDV 39.6% 3.18 8.02 TDH 8.0% 0.52 6.48 FIR 34.1% 1.99 5.84 TIP 18.5% 1.48 7.98 TIG 12.4% 0.59 4.76 HLD 16.8% 1.31 7.78 FDC 11.4% 0.92 8.06 HAR 0.6% 0.37 57.45 VPH 2.9% 0.41 14.14 KAC 5.7% 0.65 11.47 DRH 7.0% 0.52 7.47 HU6 7.0% 0.48 6.78 CDC 12.1% 1.41 11.68 NVL 16.6% 2.82 16.95
Industry (P/B)/ROE (Median) 8.08
Source: Reuters, Team computation
APPENDIX G: SCENARIO ANALYSIS To analyze bear and bull scenarios for agriculture, other industrial production, and real estate, we decide to quantify historical multiples of each segment of HPG based on analysis of comparable peers we use in the valuation part to arrive at the first quartile (Q1), median (Q2), and third quartile (Q3) for each data set. Then, we compute the difference between Q1 and Q2 as the bear spread, Q3 and Q2 as the bull spread. Ultimately, adding bull spread to and subtracting bear spread from our target multiples result in the multiple for each scenario. This method stems from the rationale that our target multiples would likely fluctuate in line with the historical variation. Our calculation generates the spreads as follow.
0.00
2.00
4.00
6.00
8.00
10.00
12.00
14.00
2011 2012 2013 2014 2015 2016 2017 2018 2019 2020
Historical HPG's Real Estate P/B Multiple From Peers Analysis
P/B 1st QuartileMedian 3rd Quartile
𝑃/𝐵 = ROE - g
ke - g
Bear spread: 1.2x Bull spread: 2.7x
0.00
2.00
4.00
6.00
8.00
10.00
12.00
14.00
2011 2012 2013 2014 2015 2016 2017 2018 2019 2020
Historical HPG's Other Industrial Production P/E (LTM) Multiple From Peers Analysis
P/E (LTM) 1st Quartile
Median 3rd Quartile
Bear spread: 1.7x Bull spread: 1.8x
Bear spread: 0.6x Bull spread: 0.6x
0.00
5.00
10.00
15.00
20.00
2011 2012 2013 2014 2015 2016 2017 2018 2019 2020
Historical HPG's Agriculture P/E (LTM) Multiple From Peers Analysis
P/E (LTM) 1st Quartile
Median 3rd Quartile
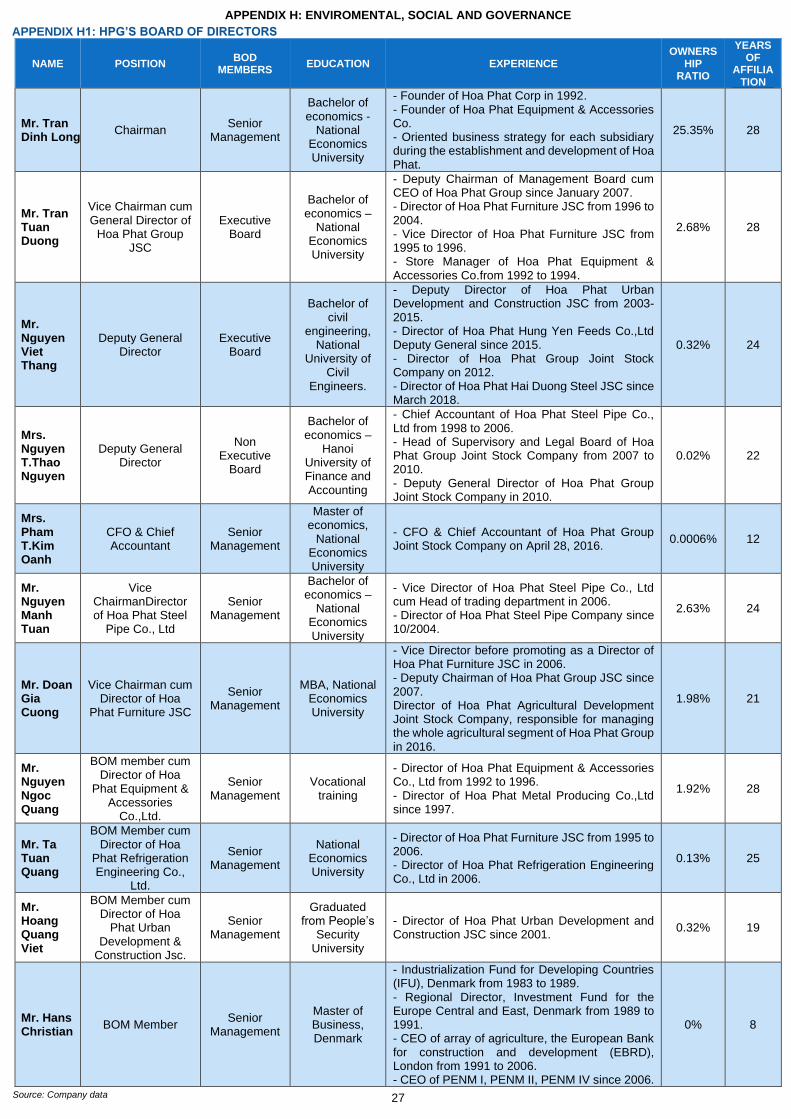
27
APPENDIX H: ENVIROMENTAL, SOCIAL AND GOVERNANCE
APPENDIX H1: HPG’S BOARD OF DIRECTORS
NAME POSITION BOD
MEMBERS EDUCATION EXPERIENCE
OWNERSHIP
RATIO
YEARS OF
AFFILIATION
Mr. Tran Dinh Long
Chairman Senior
Management
Bachelor of economics -
National Economics University
- Founder of Hoa Phat Corp in 1992. - Founder of Hoa Phat Equipment & Accessories Co. - Oriented business strategy for each subsidiary during the establishment and development of Hoa Phat.
25.35% 28
Mr. Tran Tuan Duong
Vice Chairman cum General Director of
Hoa Phat Group JSC
Executive Board
Bachelor of economics –
National Economics University
- Deputy Chairman of Management Board cum CEO of Hoa Phat Group since January 2007. - Director of Hoa Phat Furniture JSC from 1996 to 2004. - Vice Director of Hoa Phat Furniture JSC from 1995 to 1996. - Store Manager of Hoa Phat Equipment & Accessories Co.from 1992 to 1994.
2.68% 28
Mr. Nguyen Viet Thang
Deputy General Director
Executive Board
Bachelor of civil
engineering, National
University of Civil
Engineers.
- Deputy Director of Hoa Phat Urban Development and Construction JSC from 2003-2015. - Director of Hoa Phat Hung Yen Feeds Co.,Ltd Deputy General since 2015. - Director of Hoa Phat Group Joint Stock Company on 2012. - Director of Hoa Phat Hai Duong Steel JSC since March 2018.
0.32% 24
Mrs. Nguyen T.Thao Nguyen
Deputy General Director
Non Executive
Board
Bachelor of economics –
Hanoi University of Finance and Accounting
- Chief Accountant of Hoa Phat Steel Pipe Co., Ltd from 1998 to 2006. - Head of Supervisory and Legal Board of Hoa Phat Group Joint Stock Company from 2007 to 2010. - Deputy General Director of Hoa Phat Group Joint Stock Company in 2010.
0.02% 22
Mrs. Pham T.Kim Oanh
CFO & Chief Accountant
Senior Management
Master of economics,
National Economics University
- CFO & Chief Accountant of Hoa Phat Group Joint Stock Company on April 28, 2016.
0.0006% 12
Mr. Nguyen Manh Tuan
Vice ChairmanDirector of Hoa Phat Steel
Pipe Co., Ltd
Senior Management
Bachelor of economics –
National Economics University
- Vice Director of Hoa Phat Steel Pipe Co., Ltd cum Head of trading department in 2006. - Director of Hoa Phat Steel Pipe Company since 10/2004.
2.63% 24
Mr. Doan Gia Cuong
Vice Chairman cum Director of Hoa
Phat Furniture JSC
Senior Management
MBA, National Economics University
- Vice Director before promoting as a Director of Hoa Phat Furniture JSC in 2006. - Deputy Chairman of Hoa Phat Group JSC since 2007. Director of Hoa Phat Agricultural Development Joint Stock Company, responsible for managing the whole agricultural segment of Hoa Phat Group in 2016.
1.98% 21
Mr. Nguyen Ngoc Quang
BOM member cum Director of Hoa
Phat Equipment & Accessories
Co.,Ltd.
Senior Management
Vocational training
- Director of Hoa Phat Equipment & Accessories Co., Ltd from 1992 to 1996. - Director of Hoa Phat Metal Producing Co.,Ltd since 1997.
1.92% 28
Mr. Ta Tuan Quang
BOM Member cum Director of Hoa
Phat Refrigeration Engineering Co.,
Ltd.
Senior Management
National Economics University
- Director of Hoa Phat Furniture JSC from 1995 to 2006. - Director of Hoa Phat Refrigeration Engineering Co., Ltd in 2006.
0.13% 25
Mr. Hoang Quang Viet
BOM Member cum Director of Hoa
Phat Urban Development &
Construction Jsc.
Senior Management
Graduated from People’s
Security University
- Director of Hoa Phat Urban Development and Construction JSC since 2001.
0.32% 19
Mr. Hans Christian
BOM Member Senior
Management
Master of Business, Denmark
- Industrialization Fund for Developing Countries (IFU), Denmark from 1983 to 1989. - Regional Director, Investment Fund for the Europe Central and East, Denmark from 1989 to 1991. - CEO of array of agriculture, the European Bank for construction and development (EBRD), London from 1991 to 2006. - CEO of PENM I, PENM II, PENM IV since 2006.
0% 8
Source: Company data
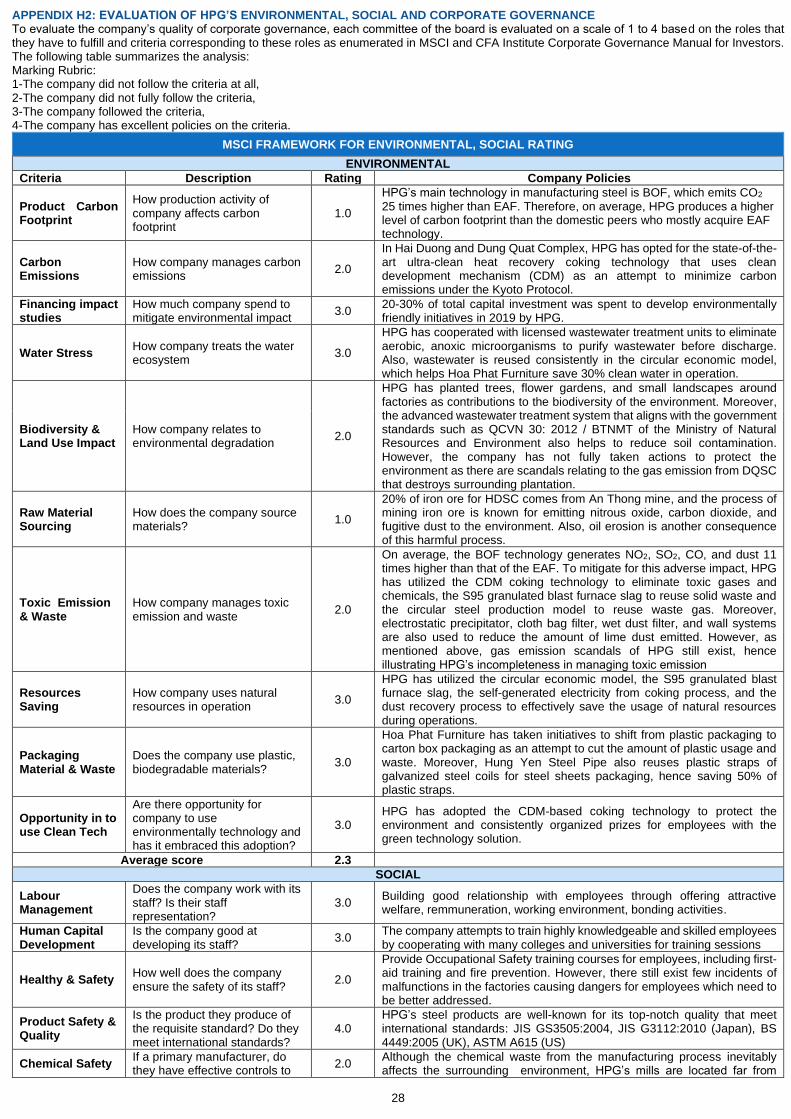
28
APPENDIX H2: EVALUATION OF HPG’S ENVIRONMENTAL, SOCIAL AND CORPORATE GOVERNANCE To evaluate the company’s quality of corporate governance, each committee of the board is evaluated on a scale of 1 to 4 based on the roles that they have to fulfill and criteria corresponding to these roles as enumerated in MSCI and CFA Institute Corporate Governance Manual for Investors. The following table summarizes the analysis: Marking Rubric: 1-The company did not follow the criteria at all, 2-The company did not fully follow the criteria, 3-The company followed the criteria, 4-The company has excellent policies on the criteria.
MSCI FRAMEWORK FOR ENVIRONMENTAL, SOCIAL RATING
ENVIRONMENTAL
Criteria Description Rating Company Policies
Product Carbon Footprint
How production activity of company affects carbon footprint
1.0
HPG’s main technology in manufacturing steel is BOF, which emits CO2 25 times higher than EAF. Therefore, on average, HPG produces a higher level of carbon footprint than the domestic peers who mostly acquire EAF technology.
Carbon Emissions
How company manages carbon emissions
2.0
In Hai Duong and Dung Quat Complex, HPG has opted for the state-of-the-art ultra-clean heat recovery coking technology that uses clean development mechanism (CDM) as an attempt to minimize carbon emissions under the Kyoto Protocol.
Financing impact studies
How much company spend to mitigate environmental impact
3.0 20-30% of total capital investment was spent to develop environmentally friendly initiatives in 2019 by HPG.
Water Stress How company treats the water ecosystem
3.0
HPG has cooperated with licensed wastewater treatment units to eliminate aerobic, anoxic microorganisms to purify wastewater before discharge. Also, wastewater is reused consistently in the circular economic model, which helps Hoa Phat Furniture save 30% clean water in operation.
Biodiversity & Land Use Impact
How company relates to environmental degradation
2.0
HPG has planted trees, flower gardens, and small landscapes around factories as contributions to the biodiversity of the environment. Moreover, the advanced wastewater treatment system that aligns with the government standards such as QCVN 30: 2012 / BTNMT of the Ministry of Natural Resources and Environment also helps to reduce soil contamination. However, the company has not fully taken actions to protect the environment as there are scandals relating to the gas emission from DQSC that destroys surrounding plantation.
Raw Material Sourcing
How does the company source materials?
1.0
20% of iron ore for HDSC comes from An Thong mine, and the process of mining iron ore is known for emitting nitrous oxide, carbon dioxide, and fugitive dust to the environment. Also, oil erosion is another consequence of this harmful process.
Toxic Emission & Waste
How company manages toxic emission and waste
2.0
On average, the BOF technology generates NO2, SO2, CO, and dust 11 times higher than that of the EAF. To mitigate for this adverse impact, HPG has utilized the CDM coking technology to eliminate toxic gases and chemicals, the S95 granulated blast furnace slag to reuse solid waste and the circular steel production model to reuse waste gas. Moreover, electrostatic precipitator, cloth bag filter, wet dust filter, and wall systems are also used to reduce the amount of lime dust emitted. However, as mentioned above, gas emission scandals of HPG still exist, hence illustrating HPG’s incompleteness in managing toxic emission
Resources Saving
How company uses natural resources in operation
3.0
HPG has utilized the circular economic model, the S95 granulated blast furnace slag, the self-generated electricity from coking process, and the dust recovery process to effectively save the usage of natural resources during operations.
Packaging Material & Waste
Does the company use plastic, biodegradable materials?
3.0
Hoa Phat Furniture has taken initiatives to shift from plastic packaging to carton box packaging as an attempt to cut the amount of plastic usage and waste. Moreover, Hung Yen Steel Pipe also reuses plastic straps of galvanized steel coils for steel sheets packaging, hence saving 50% of plastic straps.
Opportunity in to use Clean Tech
Are there opportunity for company to use environmentally technology and has it embraced this adoption?
3.0 HPG has adopted the CDM-based coking technology to protect the environment and consistently organized prizes for employees with the green technology solution.
Average score 2.3
SOCIAL
Labour Management
Does the company work with its staff? Is their staff representation?
3.0 Building good relationship with employees through offering attractive welfare, remmuneration, working environment, bonding activities.
Human Capital Development
Is the company good at developing its staff?
3.0 The company attempts to train highly knowledgeable and skilled employees by cooperating with many colleges and universities for training sessions
Healthy & Safety How well does the company ensure the safety of its staff?
2.0
Provide Occupational Safety training courses for employees, including first-aid training and fire prevention. However, there still exist few incidents of malfunctions in the factories causing dangers for employees which need to be better addressed.
Product Safety & Quality
Is the product they produce of the requisite standard? Do they meet international standards?
4.0 HPG’s steel products are well-known for its top-notch quality that meet international standards: JIS GS3505:2004, JIS G3112:2010 (Japan), BS 4449:2005 (UK), ASTM A615 (US)
Chemical Safety If a primary manufacturer, do they have effective controls to
2.0 Although the chemical waste from the manufacturing process inevitably affects the surrounding environment, HPG’s mills are located far from
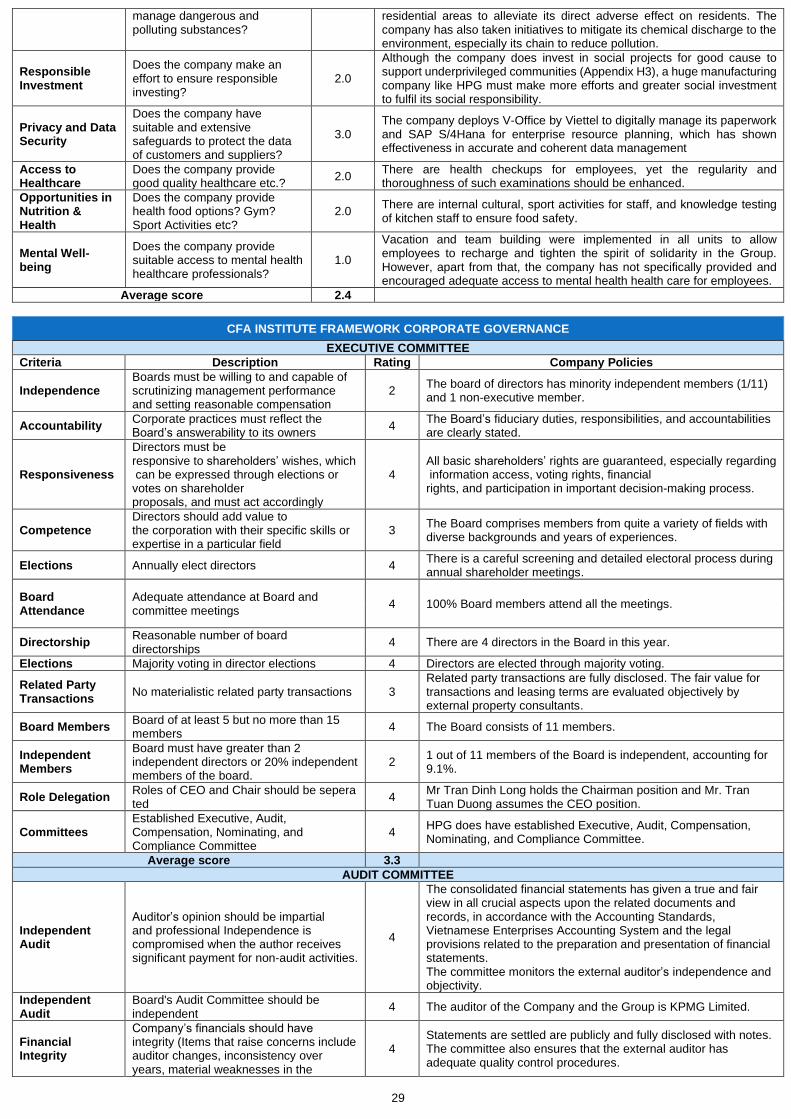
29
manage dangerous and polluting substances?
residential areas to alleviate its direct adverse effect on residents. The company has also taken initiatives to mitigate its chemical discharge to the environment, especially its chain to reduce pollution.
Responsible Investment
Does the company make an effort to ensure responsible investing?
2.0
Although the company does invest in social projects for good cause to support underprivileged communities (Appendix H3), a huge manufacturing company like HPG must make more efforts and greater social investment to fulfil its social responsibility.
Privacy and Data Security
Does the company have suitable and extensive safeguards to protect the data of customers and suppliers?
3.0 The company deploys V-Office by Viettel to digitally manage its paperwork and SAP S/4Hana for enterprise resource planning, which has shown effectiveness in accurate and coherent data management
Access to Healthcare
Does the company provide good quality healthcare etc.?
2.0 There are health checkups for employees, yet the regularity and thoroughness of such examinations should be enhanced.
Opportunities in Nutrition & Health
Does the company provide health food options? Gym? Sport Activities etc?
2.0 There are internal cultural, sport activities for staff, and knowledge testing of kitchen staff to ensure food safety.
Mental Well-being
Does the company provide suitable access to mental health healthcare professionals?
1.0
Vacation and team building were implemented in all units to allow employees to recharge and tighten the spirit of solidarity in the Group. However, apart from that, the company has not specifically provided and encouraged adequate access to mental health health care for employees.
Average score 2.4
CFA INSTITUTE FRAMEWORK CORPORATE GOVERNANCE
EXECUTIVE COMMITTEE
Criteria Description Rating Company Policies
Independence Boards must be willing to and capable of scrutinizing management performance and setting reasonable compensation
2 The board of directors has minority independent members (1/11) and 1 non-executive member.
Accountability Corporate practices must reflect the Board’s answerability to its owners
4 The Board’s fiduciary duties, responsibilities, and accountabilities are clearly stated.
Responsiveness
Directors must be responsive to shareholders’ wishes, which can be expressed through elections or votes on shareholder proposals, and must act accordingly
4 All basic shareholders’ rights are guaranteed, especially regarding information access, voting rights, financial rights, and participation in important decision-making process.
Competence Directors should add value to the corporation with their specific skills or expertise in a particular field
3 The Board comprises members from quite a variety of fields with diverse backgrounds and years of experiences.
Elections Annually elect directors 4 There is a careful screening and detailed electoral process during annual shareholder meetings.
Board Attendance
Adequate attendance at Board and committee meetings
4 100% Board members attend all the meetings.
Directorship Reasonable number of board directorships
4 There are 4 directors in the Board in this year.
Elections Majority voting in director elections 4 Directors are elected through majority voting.
Related Party Transactions
No materialistic related party transactions 3 Related party transactions are fully disclosed. The fair value for transactions and leasing terms are evaluated objectively by external property consultants.
Board Members Board of at least 5 but no more than 15 members
4 The Board consists of 11 members.
Independent Members
Board must have greater than 2 independent directors or 20% independent members of the board.
2 1 out of 11 members of the Board is independent, accounting for 9.1%.
Role Delegation Roles of CEO and Chair should be seperated
4 Mr Tran Dinh Long holds the Chairman position and Mr. Tran Tuan Duong assumes the CEO position.
Committees Established Executive, Audit, Compensation, Nominating, and Compliance Committee
4 HPG does have established Executive, Audit, Compensation, Nominating, and Compliance Committee.
Average score 3.3
AUDIT COMMITTEE
Independent Audit
Auditor’s opinion should be impartial and professional Independence is compromised when the author receives significant payment for non-audit activities.
4
The consolidated financial statements has given a true and fair view in all crucial aspects upon the related documents and records, in accordance with the Accounting Standards, Vietnamese Enterprises Accounting System and the legal provisions related to the preparation and presentation of financial statements. The committee monitors the external auditor’s independence and objectivity.
Independent Audit
Board's Audit Committee should be independent
4 The auditor of the Company and the Group is KPMG Limited.
Financial Integrity
Company’s financials should have integrity (Items that raise concerns include auditor changes, inconsistency over years, material weaknesses in the
4 Statements are settled are publicly and fully disclosed with notes. The committee also ensures that the external auditor has adequate quality control procedures.
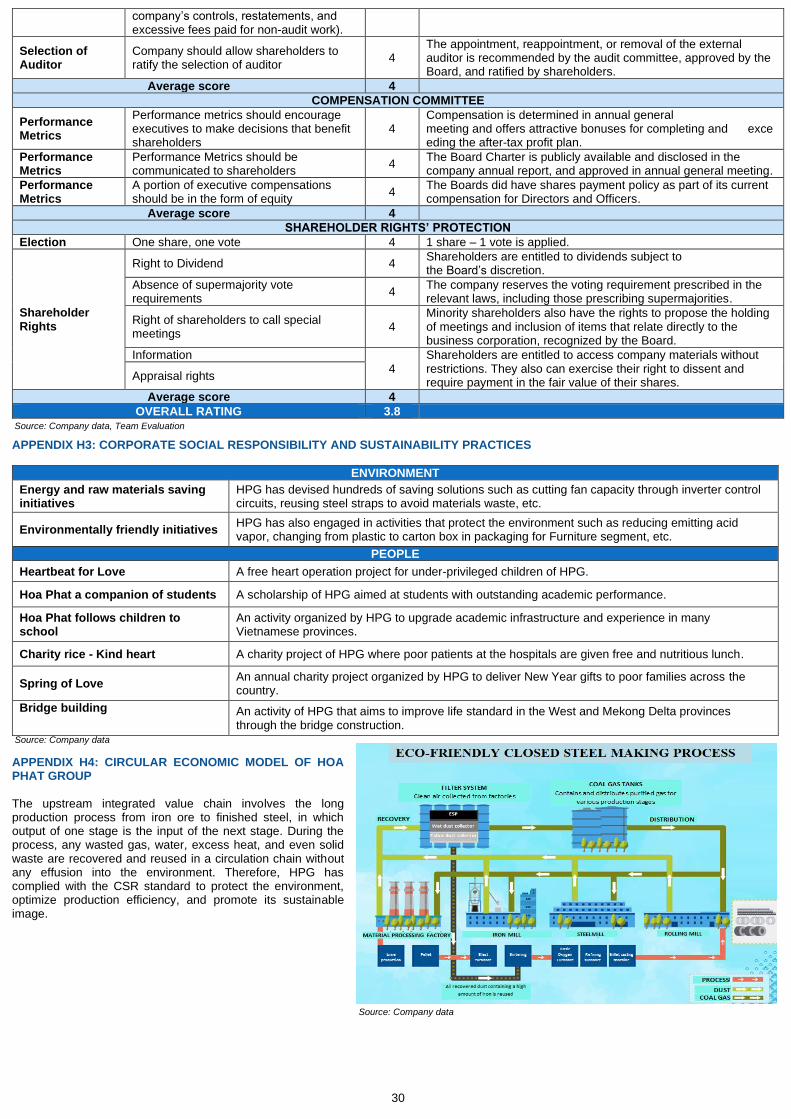
30
company’s controls, restatements, and excessive fees paid for non-audit work).
Selection of Auditor
Company should allow shareholders to ratify the selection of auditor
4 The appointment, reappointment, or removal of the external auditor is recommended by the audit committee, approved by the Board, and ratified by shareholders.
Average score 4
COMPENSATION COMMITTEE
Performance Metrics
Performance metrics should encourage executives to make decisions that benefit shareholders
4 Compensation is determined in annual general meeting and offers attractive bonuses for completing and exceeding the after-tax profit plan.
Performance Metrics
Performance Metrics should be communicated to shareholders
4 The Board Charter is publicly available and disclosed in the company annual report, and approved in annual general meeting.
Performance Metrics
A portion of executive compensations should be in the form of equity
4 The Boards did have shares payment policy as part of its current compensation for Directors and Officers.
Average score 4
SHAREHOLDER RIGHTS’ PROTECTION
Election One share, one vote 4 1 share – 1 vote is applied.
Shareholder Rights
Right to Dividend 4 Shareholders are entitled to dividends subject to the Board’s discretion.
Absence of supermajority vote requirements
4 The company reserves the voting requirement prescribed in the relevant laws, including those prescribing supermajorities.
Right of shareholders to call special meetings
4 Minority shareholders also have the rights to propose the holding of meetings and inclusion of items that relate directly to the business corporation, recognized by the Board.
Information 4
Shareholders are entitled to access company materials without restrictions. They also can exercise their right to dissent and require payment in the fair value of their shares.
Appraisal rights
Average score 4
OVERALL RATING 3.8
APPENDIX H3: CORPORATE SOCIAL RESPONSIBILITY AND SUSTAINABILITY PRACTICES
ENVIRONMENT
Energy and raw materials saving initiatives
HPG has devised hundreds of saving solutions such as cutting fan capacity through inverter control circuits, reusing steel straps to avoid materials waste, etc.
Environmentally friendly initiatives HPG has also engaged in activities that protect the environment such as reducing emitting acid vapor, changing from plastic to carton box in packaging for Furniture segment, etc.
PEOPLE
Heartbeat for Love A free heart operation project for under-privileged children of HPG.
Hoa Phat a companion of students A scholarship of HPG aimed at students with outstanding academic performance.
Hoa Phat follows children to school
An activity organized by HPG to upgrade academic infrastructure and experience in many Vietnamese provinces.
Charity rice - Kind heart A charity project of HPG where poor patients at the hospitals are given free and nutritious lunch.
Spring of Love An annual charity project organized by HPG to deliver New Year gifts to poor families across the country.
Bridge building An activity of HPG that aims to improve life standard in the West and Mekong Delta provinces through the bridge construction.
APPENDIX H4: CIRCULAR ECONOMIC MODEL OF HOA PHAT GROUP The upstream integrated value chain involves the long production process from iron ore to finished steel, in which output of one stage is the input of the next stage. During the process, any wasted gas, water, excess heat, and even solid waste are recovered and reused in a circulation chain without any effusion into the environment. Therefore, HPG has complied with the CSR standard to protect the environment, optimize production efficiency, and promote its sustainable image.
Source: Company data, Team Evaluation
Source: Company data
Source: Company data
Related Documents