Report name: Cetacean Baseline Characterisation for the Firth of Tay based on existing data: Bottlenose dolphins Authors: Nicola Quick and Barbara Cheney Project Manager: Carol Sparling Project Reference: 270811SGW_FTOWDG Cetaceans Date: 22 nd December 2011 This report is not to be cited without prior permission. Please direct all enquiries to Carol Sparling [email protected] Approved by Managing Director: Douglas Mundie For its part, the Buyer acknowledges that Reports supplied by the Seller as part of the Services may be misleading if not read in their entirety, and can misrepresent the position if presented in selectively edited form. Accordingly, the Buyer undertakes that it will make use of Reports only in unedited form, and will use reasonable endeavours to procure that its client under the Main Contract does likewise. As a minimum, a full copy of our Report must be appended to any broader or summary Report to the client.

Welcome message from author
This document is posted to help you gain knowledge. Please leave a comment to let me know what you think about it! Share it to your friends and learn new things together.
Transcript

Report name: Cetacean Baseline Characterisation for the Firth of Tay based on
existing data: Bottlenose dolphins
Authors: Nicola Quick and Barbara Cheney
Project Manager: Carol Sparling
Project Reference: 270811SGW_FTOWDG Cetaceans
Date: 22nd December 2011
This report is not to be cited without prior permission. Please direct all enquiries to Carol Sparling
Approved by Managing Director:
Douglas Mundie
For its part, the Buyer acknowledges that Reports supplied by the Seller as part of the Services may be misleading if not read in their entirety, and can misrepresent the position if presented in selectively edited form. Accordingly, the Buyer undertakes that it will make use of Reports only in unedited form, and will use reasonable endeavours to procure that its client under the Main Contract does likewise. As a minimum, a full copy of our Report must be appended to any broader or summary Report to the client.

Contents
Summary ................................................................................................................................................. 1
Introduction ............................................................................................................................................ 2
The spatial and temporal extent of the data. ....................................................................................... 3
Relative abundance and distribution of bottlenose dolphins in the Tay ............................................. 5
Review of current information on total bottlenose dolphin population size .................................... 20
Connectivity of animals between the Tay and the Moray Firth SAC .................................................. 22
General conclusions ............................................................................................................................. 27
Literature Cited..................................................................................................................................... 29

Report to FTOWDG Issue Date: 22/12/2011
1 | P a g e
Cetacean Baseline Characterisation for the Firth of Tay based on
existing data: Bottlenose dolphins
1 Summary
The only current abundance estimate of bottlenose dolphins for the Tay area uses data from the
summer months of 2003-2004 and gives a range of 81-142 dolphins. More recent photo-
identification data from the summers of 2009 and 2010 identified 107 animals in the Tay area. The
most recent abundance estimate for the whole east coast population of bottlenose dolphins is 195
(95% highest posterior density interval (HPDI): 162-253) from data from 2006. This suggests that a
substantial proportion of the bottlenose dolphins on the east coast of Scotland use the Tay area.
During the summer months of 2009 and 2010 bottlenose dolphins were distributed throughout the
Tay area with the majority of encounters within the Tay estuary. There was no pattern in the
distribution of group sizes in either year, with both large and small groups being sighted across the
study area. Groups comprised all age groups and both sexes. In addition, all behaviour types,
including foraging, socialising and travelling, have been sighted in the Tay area. This suggests that
the Tay area is an important habitat for this east coast bottlenose dolphin population.
Seasonal data on dolphin presence comes from T-PODs, moored at Arbroath and Fife Ness during
2006 to 2009. Despite inter-annual and seasonal differences between sites, T-PODs showed that
dolphins were detected in every year and every month of deployment. This suggests that bottlenose
dolphins are not just occasional visitors to the Tay area but are site faithful as they are detected year
round and in multiple years.
Photo-identification data from 2009 and 2010 showed that 35 individuals were sighted within the
Tay area and also within the Moray Firth SAC within these two years. This shows a high degree of
connectivity between the two sites over the course of these two years. However, there was
variability in movement patterns of individuals between and within years.

Report to FTOWDG Issue Date: 22/12/2011
2 | P a g e
2 Introduction
The Forth and Tay Offshore Wind Developers Group (FTOWDG) consist of the developers of the
proposed Scottish Territorial waters offshore wind farm sites off the Firths of Forth and Tay and the
Round 3 Zone off the Firth of Forth. In total three sites are considered within FTOWDG. Two of these
are within Scottish Territorial waters. The first is the proposed site for the Inch Cape offshore wind
farm in the outer Firth of Tay region located approximately 15-22km to the east of the Angus
coastline and covering approximately 150km2. (SeaEnergy Renewables 2010). The second is the
proposed site for the Neart na Gaoithe offshore wind farm, which is 15.5km east of Fife Ness in the
Firth of Forth and covers an area of approximately 105 km2 (Neart na Gaoithe undated). The Round 3
Zone lies just outside of Scottish Territorial waters, approximately 25km east of Fife Ness in the
outer Firth of Forth, and covers an area of approximately 2,852km2 (Seagreen Wind Energy 2011).
The FTOWDG are currently in the process of obtaining consent for the wind farms sites and as part
of this process are collating available ecological data on marine mammals to help characterise the
sites. This report details information on the bottlenose dolphins that are known to reside off the east
coast of Scotland. Bottlenose dolphins are listed as European protected species and in Annex II of
the EC Habitats Directive and as such require the designation of a Special Areas of Conservation
(SAC) for their protection. There is one SAC with bottlenose dolphins as a qualifying interest,
relevant to the FTOWDG wind farm developments; this is the Moray Firth SAC (Moray Firth
Partnership 2009). The bottlenose dolphins found in the Tay area are individuals from the same
population using the Moray Firth SAC (Thompson et al., 2011). In any one year a proportion of
individuals are sighted both within the SAC and also within the Tay area.
The aim of this report is to provide background information to inform the FTOWDG site assessments.
The first section of this report deals with the spatial and temporal extent of the data; the second the
relative abundance and distribution of bottlenose dolphins in the Tay area; the third reviews current
information on east coast of Scotland bottlenose dolphin total population size; the fourth assesses
the connectivity of individual animals between the Tay and the Moray Firth SAC; and the fifth
outlines the main conclusions.

Report to FTOWDG Issue Date: 22/12/2011
3 | P a g e
Section 1
3 The spatial and temporal extent of the data.
1.1 Firth of Forth
The historical distribution of bottlenose dolphins around Scotland has been recently reviewed (see
Thompson et al., 2011 for details). Records of bottlenose dolphins within the Firth of Forth come
from stranding information and also from numerous sightings including the Joint Nature
Conservation Committee (JNCC) Cetacean Atlas, the Sea Watch Foundation and the Small Cetaceans
in the European Atlantic and North Sea II (SCANS II) survey (see Thompson et al., 2011 for details).
Currently no dedicated photo-identification effort has taken place in the Firth of Forth, so there is no
abundance estimate for this area or information on the fine scale distribution of animals either
temporally or spatially. As such no firm conclusions on how animals may be distributed or the
relative importance of the Firth of Forth in terms of habitat can be made. The Firth of Forth area will
not be considered further in this report.
1.2 Firth of Tay
Data collection on bottlenose dolphins has taken place in the Firth of Tay since 1997. The data
collection has taken place with support from a variety of different organisations and as part of
numerous projects, including PhD studentships and government funding, but on the understanding
that the data and resulting outputs of subsequent analysis are freely available to support additional
research and management questions. All data used in this report are owned, either in part or full by
the Sea Mammal Research Unit, University of St Andrews or the University of Aberdeen.
Varying levels of photo-identification effort, in terms of number of days of survey, have been
undertaken in the Tay area in the last 14 years. Effort generally spans the summer months from May
to September, when better weather conditions increase sighting probabilities and light is more
suitable for photographs. However, some effort has taken place during the winter. Specifically in
2007/2008, 5 winter surveys were conducted (Thompson et al., 2011). Current photographic records
exist for 1997, 1998, 1999, 2000, 2003, 2004, 2006, 2007, 2009 and 2010. In addition a further 10
photo-identification surveys have taken place during June to August 2011.
In addition, dedicated behavioural focal follows took place in the Tay during 2003 and 2004 as part
of a PhD study. These follows consisted of data collection on acoustic behaviour, group composition
and surface behaviour in addition to photo-identification. During 2006, 2007 and 2010 data
collection on group composition, associations and relatedness, acoustic behaviour and surface
behaviour in addition to photo-identification also took place to varying degrees as part of two
further PhD studies.

Report to FTOWDG Issue Date: 22/12/2011
4 | P a g e
Passive acoustic monitoring took place from the middle of December 2006 to the middle of March
2009 using Timing Porpoise Detectors (T-PODs). T-PODs were moored near Arbroath and Fife Ness
as part of a Scottish Government and Scottish Natural Heritage (SNH) project.
1.3 Data available for this study
For the purposes of this report, information is drawn from publically available sources to provide
background information and review. The only unpublished data that will be included is from
dedicated photo-identification data from the Tay from 2009 and 2010.

Report to FTOWDG Issue Date: 22/12/2011
5 | P a g e
Section 2
4 Relative abundance and distribution of bottlenose dolphins in the Tay
2.1 Abundance estimation in the Tay
Individual bottlenose dolphins on the east coast of Scotland are known to range over large distances
(Wilson et al., 2004), but also exhibit some level of residency with many individuals being re-sighted
within the same areas both within and between years (Wilson et al., 1997, Quick 2006, Thompson et
al., 2011). Although this population is often considered resident in the Moray Firth, it is known that
animals from this population regularly use other areas (Wilson et al., 2004, Quick and Janik 2008,
Thompson et al., 2011). One such area is the Firth of Tay. Since 1997, data have been collected in the
Firth of Tay and St Andrews Bay area. There are enough sightings of bottlenose dolphins, at least
over the summer months, for dedicated photo-identification studies to be conducted, and for the
data from these surveys to be incorporated into mark recapture analysis of total population size
(Durban et al., 2005; Corkrey et al., 2008; Cheney et al., In review).
Traditionally, abundance estimation of bottlenose dolphins on the east coast of Scotland has been
for the whole population using the entire east coast (Durban et al., 2005; Thompson et al., 2011;
Cheney et al., In review) or for the parts of the population using the Moray Firth SAC as part of site
condition monitoring for the SAC (Thompson et al., 2006; Thompson et al., 2009; Cheney et al., In
prep). On the whole, these estimations have been carried out with respect to management
questions specifically related to animals from the designated SAC in the Moray Firth (Thompson et
al., 2006; Cheney et al., In prep).
Currently only one abundance estimate exists for the Tay area, using photo-identification data taken
during 35 separate days between July and September of 2003 and 2004 (Quick 2006; Quick and Janik
2008). A further 7 trips were undertaken in this time period with no sightings of bottlenose dolphins.
These data were collected between Arbroath to the North and Fife Ness to the South in sea states of
Beaufort 3 or less. This work formed part of a behavioural focal follow study, with the photo-
identification data collected primarily to determine the associations of the focal animal. The data
collected were therefore biased towards marked animals and effort was constrained by the
movements of the focal animal group. As such, the data are not typical of data that are collected for
abundance estimation. However, methodologies exist to account for bias in mark-recapture photo-
identification data because, even using standard protocols, it is likely that the probability of sighting
each individual is not the same. This is termed heterogeneity in capture, and results from factors
such as variation in individual movement patterns (i.e. an animal that stays nearer the coast may be
more available to photograph), animals being boat shy or boat happy (i.e. animals that like to bow-
ride may be easier to photograph) or researchers concentrating on taking photographs of more
nicked or distinct animals (i.e. it is easier to know if you have photographs of animals with very
obvious marks or colours on their fins).

Report to FTOWDG Issue Date: 22/12/2011
6 | P a g e
Due to the high level of heterogeneity, the study by Quick (2006) used both conventional and
Bayesian methods of analysis to provide an estimation of abundance for 2003 and 2004 combined.
The conventional method used Chao et al.’s (1992) Mth model, implemented in the programme
CAPTURE (Rexstad and Burnham 1991). The Bayesian method involved mark-recapture with
occasion and individual effects, where abundance estimation is achieved through Bayesian model
selection in a fixed dimensional parameter space (Durban and Elston 2005). This method involves
fitting a continuous logistic-normal model to the data to yield a full probability distribution for the
number of dolphins, which demonstrates both the extent and the shape of the uncertainty of the
estimate. This estimate is achieved using Markov Chain Monte Carlo (MCMC) simulation methods
that involve sampling, rather than maximising the likelihood and are run within the program
WinBUGS. The sighting histories of 65 animals with permanent marks were used in the analysis
(Table 1). Thirty marked animals were sighted in both 2003 and 2004. Individuals were sighted
between 1 and 9 times during the study with 13 (20%) marked animals sighted only once (Figure 1).
The re-sight rate of 58% suggests that some individuals may use this area regularly or be partly
resident during the summer months. To inflate the estimates to the total population, the proportion
of clean or unmarked animals was also calculated for each trip.
Table 1: Total number of animals identified with permanent marks (i.e. nicks, deformities, unusual
fin shapes and white fringes) during each study year and both years combined.
Year Number of fieldwork
trips
Total number of animals identified
with permanent marks
Number of permanently
marked animals re-sighted
2003 29 52
2004 13 43 30
Both years 42 65

Report to FTOWDG Issue Date: 22/12/2011
7 | P a g e
Figure 1: Frequency of sightings for the 65 marked individuals throughout the 35 sampling days in
2003 and 2004 (mean = 4, standard deviation ± 2.4, N= 65).
The best abundance estimates from the two methods, conventional and Bayesian were 89 (95%
confidence interval (CI) 81-98) and 112 (95% credible interval (CI) 89-142) animals, respectively.
Whilst the precision of the conventional estimate was higher than that of the Bayesian estimate as
shown by the lower coefficient of variation values (CV = 0.107-0.111), the mean abundance estimate
of 112 for the Bayesian method was larger than for the conventional method. It is difficult, with only
2 years of data, to know if the conventional method is underestimating the abundance or if the
Bayesian model is overestimating. However even if one combines both estimates and take the
lowest and highest confidence limits of the estimates from both methods, between 81-142 dolphins
were using the Tay area during the summer months of 2003 and 2004.
2.2 Distribution of animals in the Tay
In June to August 2009 and June to September 2010 dedicated photo-identification surveys took
place in the Tay and St Andrews Bay area. All trips departed from Tayport harbour and employed
opportunistic search patterns until bottlenose dolphin groups were encountered. On detection of a
dolphin group, standard photo-identification techniques, following the survey protocol for this
population (for detailed survey protocols see Thompson et al., 2011), were used. In total 8 trips were
carried out each year and dolphins were encountered on all trips, giving a rate of 100% of dolphin
positive days (Table 2).
Number of days sighted
9.08.07.06.05.04.03.02.01.0
Num
ber
of
indiv
idual
s
14
12
10
8
6
4
2
0

Report to FTOWDG Issue Date: 22/12/2011
8 | P a g e
Table 2: Summary of trips, encounters and group sizes for 2009 and 2010 data.
Year No. of
trips
Total survey
time (hours)
No. of
encounters
Min group size
(based on best
estimate)
Max group size
(based on best
estimate)
Percentage
of dolphin
positive days
2009 8 43 30 1 35 100
2010 8 56 39 1 31 100
More survey effort and more encounters were evident in 2010, but the general pattern of encounter
locations is very similar between years (Figures 2 and 3). In both years the majority of encounters
took place within the Tay estuary, on the northern side of the large sand bar that marks the south of
the shipping channel (Figures 2 and 3). There is no pattern in the distribution of group sizes in either
year, with both large and small groups being sighted across the study area (Figures 2 and 3).
In 2010, survey effort was increased to north of Arbroath to just south of Montrose. Dolphins were
also encountered on these trips (Figure 3). In both years, some effort took place south of the Tay
sand bar off the Eden estuary and into St Andrews Bay. No dolphin encounters were seen on these
parts of the trips. However, dolphins have been sighted in St Andrews Bay in recent years (Quick
2006) and detections from a moored acoustic device in St Andrews Bay has detected delphinid
whistles, (species level confirmation was not possible), during the summer of 2011 (SMRU Ltd,
Unpublished data). The only other species of cetacean seen during the 2009 and 2010 trips were on
two separate days in 2010 when harbour porpoise were sighted.
All the bottlenose dolphin encounters from both years are located within the coastal waters of the
Tay area. As such they are within 20km of the Inch Cape and Neart na Gaoithe Scottish territorial
waters sites and within 30km of the Round 3 Firth of Forth site (Figure 4). It should be noted that
systematic surveys of the entire area have not be undertaken. The distribution of encounters are
therefore influenced by the distribution of survey effort, and do not necessarily represent the overall
distribution of dolphins within the area.

Report to FTOWDG Issue Date: 22/12/2011
9 | P a g e
Figure 2: Top panel: effort from all 8 photo-identification surveys from 2009, including location of all
encounters. Bottom panel: encounter locations from 2009, with size of circles indicating group sizes.

Report to FTOWDG Issue Date: 22/12/2011
10 | P a g e
Figure 3: Top panel: effort from all 8 photo-identification surveys from 2010, including location of all
encounters. Bottom panel: encounter locations from 2010, with size of circles indicating group sizes.

Report to FTOWDG Issue Date: 22/12/2011
11 | P a g e
Figure 4: Location of all encounters (blue=2009 and red=2010) with respect to the location of the
Inch Cape, Neart na Gaoithe and Round 3 Firth of Forth proposed wind farm zones (black shape
outlines represent wind farm sites).
2.3 T-POD data from Arbroath and Fife Ness
Between 2006 and 2009 Timing Porpoise Detectors (T-PODs) (Figure 5), were deployed on moorings
at Arbroath and Fife Ness by the University of Aberdeen, as part of a series of deployments at 18
sites around the east coast of Scotland (Thompson et al., 2011). Data from this project are available
from January 2007 to March 2009 at Arbroath and from December 2006 to March 2009 at Fife Ness.
T-PODs can be used to provide data on patterns of occurrence of dolphins. T-PODs incorporate a
hydrophone, analogue processor and digital timing systems that automatically log the start and end
of each echolocation click to 10 s resolution. In every minute, the T-POD runs 6 successive scans
within different user-defined frequencies, logging detections for periods of up to 5 months. An
accompanying software program is used to post-process the recovered data, detect characteristic
click trains, and remove noises from other sources such as boat sonar (see www.chelonia.co.uk for
details). Resulting data on the number of click trains recorded in each minute can be used to
determine the presence or absence of target species in different time periods, or to identify the
timing and duration of encounters with target species.

Report to FTOWDG Issue Date: 22/12/2011
12 | P a g e
We used Version 4 and 5 T-PODs to detect echolocation click trains, and processed all data using
version 8.24 of the manufacturer’s software (version 4.1 train filter). Following the manufacturer’s
guidelines for use in areas where both harbour porpoises and bottlenose dolphins might be
detected, T-PODs were configured to detect clicks from dolphins and porpoises on alternate
channels. For dolphins, we set a target frequency of 50 kHz and a reference frequency of 70 kHz.
Previous studies both in the Moray Firth (Bailey et al., 2009) and Ireland (Philpot et al., 2007) have
confirmed that T-PODs can successfully detect bottlenose dolphins at distances of 900-1250m.
Combined visual and acoustic studies in the mouth of the Cromarty Firth further showed that T-
PODs detected all groups of dolphins that spent at least 30 minutes in the area (Bailey et al., 2009),
suggesting that the technique can be used for determining presence or absence of dolphins at hourly
sampling scales. It should be noted that whilst dolphin detections in these areas are likely to
represent bottlenose dolphin occurrence, these devices cannot be used to discriminate between
bottlenose dolphins and other species such as white-beaked dolphins.
Figure 5. A Timing Porpoise Detector (T-POD).
Dolphins were detected on T-PODs at both sites throughout the deployments (Figure 6). Over the
deployment period, dolphins were detected on 24% of days in Arbroath and 18% of days in Fife
Ness. However, both these sites show lower detection rates in comparison with a core site in the
SAC (the mouth of the Cromarty Firth) where dolphins were detected on over 70% of days over the
same time period (Thompson et al., 2011). Although, in Fife Ness there was no inter-annual
differences in the number of days of detections between 2007 and 2008 (the years with most data),
in Arbroath there were significantly more days with dolphin detections in 2008 (Table 3 and Figure
6a).
Table 3. Summary of Chi-Square test comparing the proportion of dolphin positive days in 2007 and
2008 from T-PODs around the Firth of Tay, where N = the total number of days sampled and p =
proportion of days in which dolphins were detected.
AREA 2007 2008 Chi-Sq DF P-Value N p N P
Arbroath 365 0.18 366 0.28 9.3041 1 0.002 Fife Ness 365 0.21 363 0.18 0.9791 1 0.322

Report to FTOWDG Issue Date: 22/12/2011
13 | P a g e
a.
b.
Figure 6. Occurrence of bottlenose dolphins around the Firth of Tay in 2007 and 2008. Pie charts
represent a. the proportion of dolphin positive days and b. the median number of hours with
dolphin detections on dolphin positive days.
Report to FTOWDG Issue Date: 22/12/2011
14 | P a g e
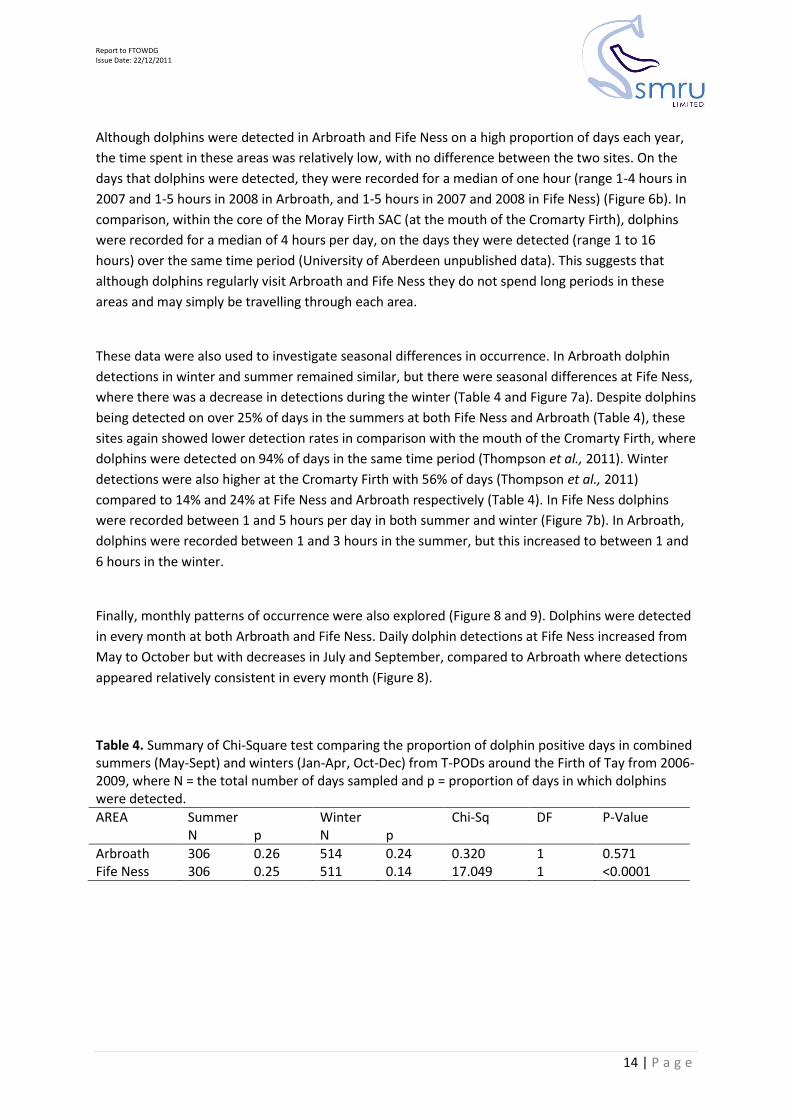
Although dolphins were detected in Arbroath and Fife Ness on a high proportion of days each year,
the time spent in these areas was relatively low, with no difference between the two sites. On the
days that dolphins were detected, they were recorded for a median of one hour (range 1-4 hours in
2007 and 1-5 hours in 2008 in Arbroath, and 1-5 hours in 2007 and 2008 in Fife Ness) (Figure 6b). In
comparison, within the core of the Moray Firth SAC (at the mouth of the Cromarty Firth), dolphins
were recorded for a median of 4 hours per day, on the days they were detected (range 1 to 16
hours) over the same time period (University of Aberdeen unpublished data). This suggests that
although dolphins regularly visit Arbroath and Fife Ness they do not spend long periods in these
areas and may simply be travelling through each area.
These data were also used to investigate seasonal differences in occurrence. In Arbroath dolphin
detections in winter and summer remained similar, but there were seasonal differences at Fife Ness,
where there was a decrease in detections during the winter (Table 4 and Figure 7a). Despite dolphins
being detected on over 25% of days in the summers at both Fife Ness and Arbroath (Table 4), these
sites again showed lower detection rates in comparison with the mouth of the Cromarty Firth, where
dolphins were detected on 94% of days in the same time period (Thompson et al., 2011). Winter
detections were also higher at the Cromarty Firth with 56% of days (Thompson et al., 2011)
compared to 14% and 24% at Fife Ness and Arbroath respectively (Table 4). In Fife Ness dolphins
were recorded between 1 and 5 hours per day in both summer and winter (Figure 7b). In Arbroath,
dolphins were recorded between 1 and 3 hours in the summer, but this increased to between 1 and
6 hours in the winter.
Finally, monthly patterns of occurrence were also explored (Figure 8 and 9). Dolphins were detected
in every month at both Arbroath and Fife Ness. Daily dolphin detections at Fife Ness increased from
May to October but with decreases in July and September, compared to Arbroath where detections
appeared relatively consistent in every month (Figure 8).
Table 4. Summary of Chi-Square test comparing the proportion of dolphin positive days in combined summers (May-Sept) and winters (Jan-Apr, Oct-Dec) from T-PODs around the Firth of Tay from 2006-2009, where N = the total number of days sampled and p = proportion of days in which dolphins were detected.
AREA Summer Winter Chi-Sq DF P-Value N p N p
Arbroath 306 0.26 514 0.24 0.320 1 0.571 Fife Ness 306 0.25 511 0.14 17.049 1 <0.0001

Report to FTOWDG Issue Date: 22/12/2011
15 | P a g e
a.
b.
Figure 7. Occurrence of bottlenose dolphins around the Firth of Tay in winter and summer between
2006 and 2009. Pie charts represent a. the proportion of dolphin positive days and b. the median
number of hours with dolphin detections on dolphin positive days.

Report to FTOWDG Issue Date: 22/12/2011
16 | P a g e
a.
b.
Figure 8. The average proportion of dolphin positive days in each month (+/- SE) for T-POD sites a.
Arbroath, b. Fife Ness for the entire T-POD deployment period.
Arbroath
0.00
0.10
0.20
0.30
0.40
0.50
0.60
0.70
0.80
0.90
1.00
JAN FEB MAR APR MAY JUN JUL AUG SEP OCT NOV DEC
Avera
ge P
rop
ort
ion
of
Do
lph
in P
osit
ive D
ays p
er
Mo
nth
FifeNess
0.00
0.10
0.20
0.30
0.40
0.50
0.60
0.70
0.80
0.90
1.00
JAN FEB MAR APR MAY JUN JUL AUG SEP OCT NOV DEC
Avera
ge P
rop
ort
ion
of
Do
lph
in P
osit
ive D
ays p
er
Mo
nth

Report to FTOWDG Issue Date: 22/12/2011
17 | P a g e
2.4 Behaviour, group size and group composition of animals in the Tay
Behaviour
Bottlenose dolphins engage in all types of behaviour in the Tay area. Groups have been observed
travelling through the area, socialising, foraging, engaged in aerial behaviour, bowriding vessels and
logging at the surface (Quick 2006, Quick and Janik 2008). There has been no dedicated effort to
quantify the time budgets that each group may spend engaged in different behavioural activities.
However, Quick and Janik (2008) carried out visual focal follows whilst simultaneously recording
vocalisation rates of groups, to assess the vocal rates associated with different behavioural types.
Although many different behavioural types were observed, including foraging events, there were
four main behavioural types recorded in their analysis (Table 5).
All behavioural types were observed throughout the study site and frequently groups would switch
between behaviour types during the course of a focal follow (Quick and Janik 2008). However, it is
not possible to make firm conclusions about habitat use or frequency of different behaviours in the
Tay area without targeted analysis of behavioural data.
Table 5: Definitions of behavioural activities assigned to focal and other groups during behavioural
sampling
Behaviour Type Definition
Surface Travel Animals all moving in the same direction, not creating white water in
their wake
Non polarised movement Animals exhibiting non directional movements with all surfacings
facing different directions
Socialising Animals interacting with each other in close proximity; including
rubbing together, rolling over, showing bellies, fins and heads out.
Jumping/body slaps Animals leave water to exhibit aerial behaviour, often causing
splashing
Group composition and size.
Group sizes of bottlenose dolphins in the Tay range from one individual up to groups of over 30
(Table 2, Quick and Janik 2008). However, multiple subgroups are often present and these sub-
groups frequently join and split. Observations of young of the year (i.e. animals <6 months old),
calves, juveniles, sub adults and adults are common throughout the study site during each year
(University of St Andrews Unpublished data, University of Aberdeen Unpublished data). Groups may
be made up of all age classes or may primarily contain only one age class. Although, published data

Report to FTOWDG Issue Date: 22/12/2011
18 | P a g e
on the sex ratio of groups within this area are lacking, data from the 107 identified individuals in
2009 and 2010 comprise 19 known males, 29 known females and 59 of unknown sex (University of
Aberdeen Unpublished data).
2.5 Density Surface
Currently no fine scale density estimate of bottlenose dolphins exists for the Tay area. Estimating
density for mobile marine mammals is challenging due to methodological differences and genuine
variability in population estimates caused by temporal and spatial factors. For the Tay area, there is
only an abundance estimates for 2003 and 2004 (Quick 2006), and efforts to generate a density
surface are therefore limited to these years. The limitations of this are that the estimate will only be
applicable over the spatial area and temporal period for which the data were collected, and cannot
be extrapolated to areas or times/seasons where no survey effort has taken place. In addition these
data were collected as part of a focal follow protocol and effort across the area was not uniform. The
most simplistic application of these data into a density estimate is to take the total area over which
the data were collected, to provide a simple density value for the whole region. During 2003 and
2004, 42 trips took place in the Tay and St Andrews Bay area (Figure 9). Trips departed from St
Andrews harbour and generally travelled north up to the Tay. Areas south of St Andrews Bay were
usually visited if no animals were sighted in the Tay area, or if prevailing weather made this area
more accessible. Trips ranged in duration, dictated mainly by level of data collection and weather
conditions.
A crude estimate of density for the area has been made by drawing a polygon around the area
surveyed and using the values for abundance and area. This method carries the assumption that
animals are distributed equally over the area constrained by the polygon, which is not the case
(Figures 2 and 3) Furthermore, levels of uncertainty are not available for these estimates, so these
density values should not be considered as robust estimates for the density of bottlenose dolphins in
the defined area for the summer months of 2003 and 2004.
The size of this defined polygon was calculated as approximately 319km2. Taking the abundance
estimates generated by Quick (2006), this gives a density of between 0.28 and 0.35 bottlenose
dolphins/km2 (Table 6)

Report to FTOWDG Issue Date: 22/12/2011
19 | P a g e
Figure 9: Effort from all 42 trips from 2003 and 2004 shown in grey. Red outline shows the area of
the defined polygon used to generate the area for the density estimate.
Table 6: Density estimates derived from both conventional and Bayesian abundance estimates for
the 2003-2004 data from the Tay.
Abundance estimate Area (km2) Density (animals/km2)
89 (Conventional) 319 0.28
112 (Bayesian) 319 0.35
Both these density estimates are considerably higher than the density estimate for bottlenose
dolphins from the SCANS II survey for block V (i.e. the block containing the Tay area) of 0.0008
individual/km2 (SCANS II 2008). However, the SCANS II survey was conducted over a much larger
area, using line transect methodology, so is not directly comparable to the fine scale data presented
here.

Report to FTOWDG Issue Date: 22/12/2011
20 | P a g e
Section 3
5 Review of current information on total bottlenose dolphin population size
3.1 Current estimates
The most commonly used estimate for the population of dolphins on the east coast of Scotland is
129 (95% confidence interval (CI): 110-174) (Wilson et al., 1999). Wilson et al., 1999 used data from
surveys in the Moray Firth in 1992 and Chao et al.’s (1992) Mth model, implemented in the
programme CAPTURE (Rexstad and Burnham 1991). At that time the majority of the population were
believed to use this area on a regular basis. However, further work has shown that the geographical
range of this population has expanded over the last 2 decades (Wilson et al., 2004), extending from
the Moray Firth down the east coast of Scotland. This range expansion makes it logistically difficult
for any one research group to cover the entire range of the population and therefore collaboration
between research groups and new methods to accurately estimate population size were required.
Durban et al., (2005) developed a Bayesian multi-site mark-recapture framework to account for the
geographical dependencies between study sites, and allow for the fact that data were collected
opportunistically and concurrently by different groups at study sites that were defined by practical
considerations rather than random design. This method was applied to data collected in 2006 from 3
areas that covered the extended known home range of this population (the inner Moray Firth,
including data from the University of Aberdeen boat-based surveys and Whale and Dolphin
Conservation Society (WDCS) land-based observations; the southern Moray Firth coast, including
data from the WDCS boat-based surveys and the Cetacean Research and Rescue Unit; and the
Grampian and Fife coast, including data from the South Grampian Regional Group of the Sea Watch
Foundation and the University of St Andrews). This provided a current population estimate for the
east coast of Scotland of 195 (95% highest posterior density interval (HPDI): 162-253) (Cheney et al.,
In review). To investigate trends in overall population size, Corkrey et al., (2008) developed a
Bayesian capture-recapture model using a state-space approach to incorporate data from different
survey areas. This model was updated using 1990-2010 data from surveys across the known home
range of the population (see Cheney et al., In prep for details). This state-space approach uses
different statistical techniques and the population estimates are lower than the previous estimates.
However, the confidence limits of each year’s comparison are overlapping, providing support for this
Bayesian capture-recapture method. Results suggested that there is a >80% probability that the
bottlenose dolphin population on the east coast of Scotland is either stable or increasing (Cheney et
al., In prep).
3.2 Implications of the Tay estimate
Between 81-142 bottlenose dolphins from the east coast population were estimated to be using the
Tay area during 2003-2004. For a population currently estimated at 195 individuals (Cheney et al., In
review), this is a considerable proportion of the population. Although the abundance estimate from
the Tay comes only from data from 2003-2004, and the current total population estimate from 2006,

Report to FTOWDG Issue Date: 22/12/2011
21 | P a g e
the values give a relative measure for comparison and indicate that the Tay area is important habitat
for this population.

Report to FTOWDG Issue Date: 22/12/2011
22 | P a g e
Section 4
6 Connectivity of animals between the Tay and the Moray Firth SAC
In the summers (May to September) of 2009 and 2010, a total of 192 individuals (including 95 well-
marked dolphins, i.e. animals with dorsal fin nicks that could be identified from either the left or
right side) were identified by the University of Aberdeen and SMRU in high quality photographs on
the east coast of Scotland. Of these 107 (52 well-marked) were identified in the Tayside region, 120
(61 well-marked) were seen within the Moray Firth SAC and 67 (34 well-marked) were seen in the
outer Moray Firth. Of the total number of individuals seen in 2009 and 2010, 85 (43 well-marked)
were seen within the SAC but not in the Tay.
Of the 107 individual bottlenose dolphins seen in the Tayside region in 2009 and 2010, 35 (18 well-
marked dolphins) were seen in these same years within the SAC (Figure 10). An additional 17
individuals have been seen in the SAC in previous years. However, 55 (21 well-marked) dolphins seen
in the Tay in 2009 and 2010 have never been seen in the SAC. Over 50% (29% of well-marked) of
these were first identified in 2009 or 2010.
In a previous study of social structure, Lusseau et al. (2006) concluded that bottlenose dolphins on
the east coast of Scotland belonged to two social units with different yet overlapping ranging
patterns. Community 1 contained individuals that ranged outside the inner Moray Firth and
community 2 contained animals never seen outside the inner Moray Firth (Lusseau et al. 2006). This
analysis was carried out on data collected between 1990 and 2002, and only 31 of the 107
individuals seen in the Tayside region in 2009 and 2010 were included in that study. However, it is
interesting to note that eight of these individuals that were previously assigned as community 2
members (i.e. only seen in the inner Moray Firth) were seen in the Tay and of these three were not
seen within the SAC in 2009 or 2010.
Patterns of movement between Tayside and the SAC therefore appear variable between individuals
and years (Figure 11). Some individuals were seen in Tayside one year and then in the SAC the next
year, or vice versa. For example, 18 individuals only seen in the Tay in 2009 were only seen in the
SAC in 2010. Similarly, of six individuals only seen in the SAC in 2009, three that were seen again in
the SAC at the beginning of summer 2010 were seen in the Tay by July or August. Other dolphins
moved between the SAC and the Tay within a year and, in some cases, even within a month. For
example, in 2009 and 2010 seven and ten individuals respectively were either seen in the Tay at the
start of the summer and in the SAC by the end of the summer, or vice versa. Also, eight individuals
were seen in both the Tay and the SAC within a month. Yet other individuals seem to make multiple
trips between the Tay and SAC within the year. In 2009 four individuals, and in 2010 two individuals,
seen in the SAC at the start of the summer, were subsequently seen in the Tay and were finally seen
back in the SAC by the end of the summer (Figure 11). For example, ID#1031 was seen in the SAC on
the 18th August 2010, subsequently seen in the Tay on the 26th August and 1st September, but was
seen again in the SAC by the 21st September. The shortest trip observed between the Tay and SAC
was in 2009, where 3 individuals were seen in the Tay on the 8th August 2009 and then in the SAC on

Report to FTOWDG Issue Date: 22/12/2011
23 | P a g e
the 13th August. It is likely that this movement is representative of other individuals which were
either not encountered during surveys in either the Tay or SAC or were only seen in poorer quality
pictures.
It is apparent from these two years of data, that there is high variability in the movement of
individuals between the Tay area and the Moray Firth SAC. From these data there are no clear
patterns of individual or group movement and different individuals appear to employ different
temporal and spatial scales of movement. What drives these different movement patterns is
unknown, but a high proportion of bottlenose dolphins on the east coast of Scotland use both the
Tay area and the Moray Firth SAC over a range of temporal scales, from monthly through to
annually.

Report to FTOWDG Issue Date: 22/12/2011
24 | P a g e
Figure 10. Summary of whether an individual identified in the Tayside region in either 2009 or 2010
were also seen within the Moray Firth SAC in those same years.
IDNO WELL-MARKED TAY SAC TAY SAC IDNO WELL-MARKED TAY SAC TAY SAC
9 N 9 9 1050 Y 1050 1050
20 Y 20 20 1051 Y 1051 1051
30 Y 30 30 1052 Y 1052
42 Y 42 42 42 1053 N 1053 1053
53 Y 53 1054 N 1054 1054
60 Y 60 60 60 60 1055 N 1055 1055
68 Y 68 68 1056 Y 1056 1056
79 Y 79 79 1057 N 1057 1057
102 Y 102 102 1058 Y 1058 1058
116 Y 116 1059 N 1059 1059
125 Y 125 1060 N 1060 1060
129 Y 129 129 129 129 1061 N 1061 1061
209 Y 209 209 209 1062 N 1062 1062
227 Y 227 1063 Y 1063 1063
234 Y 234 234 1064 N 1064 1064
240 N 240 240 1065 Y 1065 1065
323 Y 323 323 1066 N 1066 1066
344 Y 344 344 344 1067 N 1067
440 N 440 440 440 1068 N 1068 1068
571 Y 571 571 1069 N 1069 1069
673 N 673 673 1070 N 1070 1070
769 Y 769 769 1071 N 1071 1071
773 Y 773 773 773 1072 N 1072 1072
805 Y 805 805 805 805 1073 Y 1073 1073
816 Y 816 1074 Y 1074 1074
872 N 872 872 872 1075 N 1075 1075
880 Y 880 880 1076 N 1076 1076
881 Y 881 881 1077 N 1077 1077
882 Y 882 882 1081 N 1081 1081
886 Y 886 886 1089 N 1089
903 Y 903 903 1090 N 1090
908 Y 908 908 908 908 1091 N 1091
909 N 909 909 909 1092 N 1092 1092 1092
964 Y 964 964 964 1093 Y 1093 1093
993 N 993 993 993 1094 N 1094 1094
1002 N 1002 1002 1095 N 1095 1095
1012 N 1012 1012 1096 N 1096 1096
1015 N 1015 1015 1015 1097 N 1097 1097
1016 Y 1016 1016 1098 N 1098 1098
1026 Y 1026 1026 1099 N 1099 1099
1027 Y 1027 1027 1100 Y 1100 1100
1028 Y 1028 1028 1028 1102 N 1102
1029 Y 1029 1029 1103 N 1103
1031 N 1031 1031 1031 1031 1104 N 1104
1036 N 1036 1036 1105 N 1105
1037 Y 1037 1037 1107 N 1107
1038 Y 1038 1038 1108 Y 1108
1039 Y 1039 1039 1112 N 1112
1040 N 1040 1040 1114 N 1114
1042 Y 1042 1042 1042 1115 N 1115
1043 N 1043 1043 1116 N 1116
1047 Y 1047 1047 1117 N 1117
1048 Y 1048 1048 1118 N 1118
1049 Y 1049 1049
2009 2010 2009 2010

Report to FTOWDG Issue Date: 22/12/2011
25 | P a g e
Figure 11. Monthly locations of all individuals seen in the Tayside region in 2009 and 2010. Black
boxes = seen in Tayside and grey = seen in the SAC (continued on next page).
IDNO MAY JUNE SEPTEMBER MAY JUNE JULY
9
20 5 5 5
30 1 1 1
42 1 5
53
60 1
68
79 1 1 1
102 1 5
116 5
125
129 1 5
209 1
227
234 5 1
240 1 1
323 5
344 5 5 1
440 1 1 1
571 5
673 5 5 5 5
769 5 5 5
773 1 5 5 5
805 1 1 1 5 5 5 5 1
816 5 5
872 5 1 1
880 5
881 5
882 5
886 5 5
903 5
908 1 1 5
909 1
964 5
993 1 5
1002 1 1
1012 1
1015 1
1016 5 1 1
1026 5
1027 1 1 1
1028 1 1 1
1029 5
1031 5 1 1 1 5 5 1
1036
1037 5 5 5
1038 5 5
1039 5 5
1040 5
1042 1 1 1 5
1043 5
1047 5
5
5
5
5
5
5
5
5
5
5
5
5
5
5
5
5
5
5
5
5
5
5
5
5
5
5
5
5
5
5
1
1
1
1
5
5
5
5
5
5
5
5
5
5
5
5
5
5
5
5
5
5
5
5
1
AUGUST
1
1
1
5
5
5
5
1
1
1
1
SEPTEMBER
5
5
5
5
5
5
2009
JULY
1
1
AUGUST
1
1
1
1
1
5
5
5
5
1
1
1 5
5
5
5
5
5
1
1
1
1
5
5
1
5
5
5
5
5
5
5
5
5
5
5
5
5
1
5
5
1
5
5
1
5
1
5
5
5
5
1
5
5
5
5
2010
5
1
1
1
5
5
5
5
5
1

Report to FTOWDG Issue Date: 22/12/2011
26 | P a g e
Figure 11. Monthly locations of all individuals seen in the Tayside region in 2009 and 2010. Black
boxes = seen in Tayside and grey = seen in the SAC.
IDNO MAY JUNE SEPTEMBER MAY JUNE JULY
1048 5 5
1049 5
1050 5 5
1051 5 5
1052
1053 5 5
1054 5
1055 5
1056 5
1057 5 5
1058 5 5
1059 5 5
1060 5
1061 5
1062 5
1063 5 1 1
1064
1065 5 5
1066 5 5
1067
1068 1 1
1069 5
1070 5 5 5
1071 1 1
1072 1 1
1073 5
1074 5 5
1075 1 1
1076 5
1077 1 1
1081
1089 5
1090 5
1091
1092 5 1 5
1093 5 5 5
1094
1095 1
1096 5
1097 5
1098 5 5
1099 5
1100 5 5
1102 5
1103 5
1104 5
1105 5
1107
1108 5 5
1112
1114
1115
1116
1117
1118 5 5
5
5
5
5
5
5
5
5
5
5
AUGUST
5
5
5
5
5
5
5
5
5
5
5
5
5
5
5
5
5
5
5
5
5
5
5
5
5
5
5
5
5
5
5
5
5
5
5
5
5
5
AUGUST SEPTEMBER
2009
JULY
5
5
5
5
5
5
5
5
5
5
5
5
5
5
1
5
5
5
5
5
5
1
5
5
5
5
5
5
5
5
5
5
5
5
5
5
5
5
5
5
5
2010
5
5
5
5
5
5
5
5
5
5
5
5
5
1
5
5
5
1
1
5
1
5
1
1
5
5
5
5
5
5
5
5
5
5
5
5
5
5
5

Report to FTOWDG Issue Date: 22/12/2011
27 | P a g e
Section 5
7 General conclusions
The only current abundance estimate of bottlenose dolphins for the Tay area uses data from the
summer months of 2003 and 2004 and gives a range of 81-142 dolphins (Quick 2006). Photo-
identification surveys from the summers of 2009 and 2010 identified 107 animals in the Tay area.
The two published abundance estimate for the entire east coast bottlenose dolphin population were
129 animals (CI 110-174) in 1992 (Wilson et al., 1999) and the most recent estimate of 195 animals
(95% HPDI 162-253) from 2006 (Cheney et al., In review). These population estimates show an
apparent increase in the number of bottlenose dolphins on the east coast of Scotland between 1992
and 2006, which is also supported by a trend analysis using data from 1990 to 2010 (Cheney et al., In
prep). These sources of data show that a substantial proportion of the Scottish east coast population
of bottlenose dolphins uses the St Andrews Bay and Tay area, at least in the summer.
During the summer months the animals are distributed throughout the Tay area with the majority of
encounters within the Tay estuary (Figures 2 and 3). There is no pattern in the distribution of group
sizes in either year, with both large and small groups being sighted across the study area (Figures 2
and 3). It is clear from these data that the Tay is an important habitat for the east coast population
of bottlenose dolphins, as a substantial number of individuals are not only seen in the area in any
one year but are also re-sighted between years.
It is difficult to make firm conclusions about seasonal use of the Tay estuary area by the bottlenose
dolphins, as limited data exists outside of the summer months of June-August. During the winter
months of 2007-2008, 23 hours of photo-identification effort over 5 trips took place in the area but
no bottlenose dolphins were recorded (Thompson et al., 2011). T-POD data from Arbroath and Fife
Ness shows that dolphins were detected in all years of deployment and in every month of the year,
although one cannot be certain that some of these detections were of other species (Figure 7 and 8).
Seasonal patterns showed dolphin detections in winter and summer remained similar in Arbroath,
but there was a decrease in detections during the winter at Fife Ness (Figure 7a). Detection rates,
both daily and monthly, at both Arbroath and Fife Ness were generally less than those from the core
SAC area and may be suggestive of animals travelling through each area.
Bottlenose dolphins engage in all types of behaviour in the Tay area, with groups observed travelling
through the area, socialising, foraging, engaged in aerial behaviour, bowriding vessels and logging at
the surface (Quick 2006, Quick and Janik 2008). In addition, all age classes, both sexes and a variety
of group sizes have been observed throughout the study area. This is suggestive of the area being
important habitat for the animals.
The data from 2009 and 2010 show that 35 individuals were sighted within the Tay area and also
within the Moray Firth SAC within these two years. This shows a high degree of connectivity
between the two sites over the course of these two years. However, there was high variability in

Report to FTOWDG Issue Date: 22/12/2011
28 | P a g e
movement patterns of individuals both between and within years and it is impossible to know what
is driving these differences in movements.
Further work
This study concentrated on published literature and dedicated photo-identification data collected in the Tay area over 2009 and 2010. It is clear from these two years of data that there is inter-annual and within individual variability in ranging patterns and site fidelity. A detailed examination of the entire photo-identification dataset over a longer time period may allow a better assessment of intra and inter-annual variation in movement patterns on varying temporal scales, however this is a reasonably large undertaking and outputs from this work would not be available within the timescale of the FTOWDG developers’ applications.
The only currently available abundance estimate from the Tay area is from 2003-2004. Producing a new abundance estimate of animals using the Tay and the east coast population as a whole was beyond the scope of this study but the there is a more comprehensive dataset covering a longer period of time that could be used to provide such estimates, if required. Similarly, the density surface estimate presented here using currently available data provides an estimate of the density of bottlenose dolphins in the Tay area. However, it may be possible to incorporate more recent data using advanced statistical methods to provide a more robust estimate of density in this area, but similarly, this is unlikely to be possible within the developers’ timescales.
The re-deployment of passive acoustic monitoring in key coastal locations such as Arbroath and Fife Ness could provide further information on inter-annual and seasonal variability in bottlenose dolphin presence in the area. With additional information from photo-identification surveys, deployments in other areas of the Tay where dolphins have been seen more regularly will provide more detailed information on the amount of time bottlenose dolphins actually spend in this area.

Report to FTOWDG Issue Date: 22/12/2011
29 | P a g e
8 Literature Cited
Bailey, H., Clay, G., Coates, E.A., Lusseau, D., Senior, B. and Thompson, P.M. (2009) Using T-PODS to
assess variations in the occurrence of coastal bottlenose dolphins and harbour porpoises.
Aquatic Conservation: Marine and Freshwater Ecosystems 20(2): 150-158.
Chao, A., Lee, S.M. and Jeng, S.L. (1992) Estimating population size for capture-recapture data when
capture probabilities vary by time and individual animal. Biometrics 48: 201-216.
Cheney, B., Thompson, P.,M., Ingram, S.N., Hammond, P.S., Stevick, P.T., Durban, J.W., Culloch, R.M.,
Elwen, S.H., Mandleberg, L., Janik, V.M., Quick, N.J., Islas-Villanueva, V., Robinson, K.P.,
Costa, M., Eisfel, S.M., Walters, A., Phillips, C., Weir, C.R., Evans, P.G.H., Anderwald, P., Reid,
R.J., Reid, J.B. and Wilson, B. (In review) Integrating multiple data sources to assess the
distribution and abundance of bottlenose dolphins (Tursiops truncatus) in Scottish waters.
Mammal Review.
Cheney, B., Corkrey, R., Quick, N.J., Janik, V.M., Islas-Villanueva, V., Hammond, P.S. and Thompson,
P.M. (In prep) Site Condition Monitoring of bottlenose dolphins within the Moray Firth
Special Area of Conservation: Final report. Scottish Natural Heritage Commissioned Report.
Corkrey, R., Brooks, S., Lusseau, D., Parsons, K., Durban, J.W., Hammond, P.S. and Thompson, P.M.
(2008) A Bayesian capture-recapture population model with simultaneous estimation of
heterogeneity. Journal of the American Statistical Association, 103, 948-960
Durban, J. W. and Elston, D. A. (2005). Mark-recapture with occasion and individual effects:
Abundance estimation through Bayesian model selection in a fixed dimensional parameter
space. Journal of Agricultural, Biological and Environmental Statistics 10: 291-305.
Durban, J. W., Elston, D. A., Ellifrit, D. K., Dickson, E., Hammond, P. S. and Thompson, P. M. (2005).
Multisite mark-recapture for cetaceans: population estimates with Bayesian model
averaging. Marine Mammal Science 21: 80-92.
Lusseau, D., Wilson, B., Hammond, P.S., Grellier, K., Durban, J.W., Parsons, K.M., Barton, T.R. and
Thompson PM (2006). Quantifying the influence of sociality on population structure in
bottlenose dolphins. Journal of Animal Ecology 75: 14-24.
Moray Firth Partnership (2009). The Moray Firth Special Area of Conservation Management Scheme
(Revision 2) The Moray Firth Partnership (http://www.morayfirth-partnership.org/work-2-
sac-publications.html).
Neart na Gaoithe (undated). Project Update Information brochure. Available from
http://www.neartnagaoithe.com/downloads/ProjectUpdateInformationBrochure.pdf
Philpott, E., Englund, A., Ingram, S. and Rogan, E. (2007) Using T-PODs to investigate detection range
and echolocation behaviour of coastal bottlenose dolphins. Journal of the Marine Biological
Association (UK) 87: 11-17.

Report to FTOWDG Issue Date: 22/12/2011
30 | P a g e
Quick N.J. (2006) Vocal behaviour and abundance of bottlenose dolphins in St Andrews Bay. PhD
Thesis, University of St. Andrews, St. Andrews, UK.
Quick, N. J. and Janik, V.M. (2008) Whistle rates of wild bottlenose dolphins: influences of group size
and behavior. Journal of Comparative Psychology 122: 305-311.
Rexstad, E. and Burnham, K.P. (1991) User's Guide for Interactive Program CAPTURE. Colorado
Cooperative Fish and Wildlife Research Unit, Colorado State University, Fort Collins, CO, USA.
SCANS II (2008). Small cetaceans in the European Atlantic and North Sea. Final Report, Life project
LIFE04NAT/GB/000245.
SeaEnergy Renewables (2010). Inch cape Offshore Wind Farm, Non Technical Summary of the
Environmental Impact assessment Scoping Report August 2010. Available from
http://www.inchcapewind.com/assets/docs/inch_cape_scoping_nts_web.pdf
SeaGreen Wind Energy (2011) Firth of Forth Offshore Wind Farm Zone, Phase 1, Project Information
January 2011. Available from
http://www.seagreenwindenergy.com/assets/seagreen_exhibition_brochure.pdf
Thompson, P.M., Corkrey, R., Lusseau, D., Lusseau, S.M., Quick, N., Durban, J.W., Parsons, K.M. &
Hammond, P.S. (2006) An assessment of the current condition of the Moray Firth bottlenose
dolphin population. Scottish Natural Heritage Commissioned Report No. 175 (ROAME No.
F02AC409
Thompson, P.M, Cheney, B., Cândido, A.T. & Hammond, P.S. (2009) Site Condition Monitoring of bottlenose dolphins within the Moray Firth Special Area of Conservation: Interim report 2005-2007. Scottish Natural Heritage Commissioned Report.
Thompson, P.M., Cheney, B., Ingram, S., Stevick, P., Wilson, B. and Hammond, P.S. (Eds) (2011)
Distribution, abundance and population structure of bottlenose dolphins in Scottish waters.
Scottish Government and Scottish Natural Heritage funded report. Scottish Natural Heritage
Commissioned Report No. 354.
Wilson, B., Reid, R.J., Grellier, K., Thompson, P.M. and Hammond, P.S. (2004). Considering the
temporal when managing the spatial: a population range expansion impacts protected
areas-based management for bottlenose dolphins. Animal Conservation 7: 331-338.
Wilson, B., Hammond, P.S. and Thompson, P.M. (1999) Estimating size and assessing trends in a
coastal bottlenose dolphin population. Ecological Applications 9: 288-300.
Related Documents