CES National Benchmark Article BLS Establishment Survey National Estimates Revised to Incorporate March 2014 Benchmarks Introduction ..................................................................................................................................... 2 Summary of the benchmark revisions............................................................................................. 2 Revisions in the postbenchmark period ........................................................................................ 12 Changes to the CES published series ............................................................................................ 14 Series changes ........................................................................................................................... 14 Seasonally adjusted data publication change ............................................................................ 17 Why benchmarks differ from estimates ........................................................................................ 17 Benchmark revision effects for other data types........................................................................... 18 Vintage data .................................................................................................................................. 25 Three-month moving average ....................................................................................................... 25 Methods......................................................................................................................................... 25 Benchmark adjustment procedure ............................................................................................ 25 Benchmark source material ...................................................................................................... 26 Business birth and death estimation.......................................................................................... 26 Availability of revised data ........................................................................................................... 28 Seasonal adjustment procedure ..................................................................................................... 28 Table of figures ............................................................................................................................. 29 Authored by Nicholas Fett and Caila Pinkleton. Nicholas Fett and Caila Pinkleton are economists in the Division of Current Employment Statistics – National, Office of Employment and Unemployment Statistics, Bureau of Labor Statistics. Telephone: (202) 691-6555; e-mail: Contact CES U.S. Bureau of Labor Statistics Page 1 of 29 Back to Top

Welcome message from author
This document is posted to help you gain knowledge. Please leave a comment to let me know what you think about it! Share it to your friends and learn new things together.
Transcript

CES National Benchmark Article
BLS Establishment Survey National Estimates Revised to Incorporate March 2014 Benchmarks
Introduction ..................................................................................................................................... 2 Summary of the benchmark revisions............................................................................................. 2 Revisions in the postbenchmark period ........................................................................................ 12 Changes to the CES published series ............................................................................................ 14
Series changes ........................................................................................................................... 14 Seasonally adjusted data publication change ............................................................................ 17
Why benchmarks differ from estimates ........................................................................................ 17 Benchmark revision effects for other data types........................................................................... 18 Vintage data .................................................................................................................................. 25 Three-month moving average ....................................................................................................... 25 Methods......................................................................................................................................... 25
Benchmark adjustment procedure ............................................................................................ 25 Benchmark source material ...................................................................................................... 26 Business birth and death estimation .......................................................................................... 26
Availability of revised data ........................................................................................................... 28 Seasonal adjustment procedure ..................................................................................................... 28 Table of figures ............................................................................................................................. 29
Authored by Nicholas Fett and Caila Pinkleton.
Nicholas Fett and Caila Pinkleton are economists in the Division of Current Employment Statistics – National, Office of Employment and Unemployment Statistics, Bureau of Labor Statistics. Telephone: (202) 691-6555; e-mail: Contact CES
U.S. Bureau of Labor Statistics Page 1 of 29 Back to Top

Introduction
With the release of January 2015 data on February 6, 2015, the Bureau of Labor Statistics (BLS) introduced its annual revision of national estimates of employment, hours, and earnings from the Current Employment Statistics (CES) monthly survey of nonfarm establishments. Each year, the CES survey realigns its sample-based estimates to incorporate universe counts of employment—a process known as benchmarking. Comprehensive counts of employment, or benchmarks, are derived primarily from unemployment insurance (UI) tax reports that nearly all employers are required to file with State Workforce Agencies.
Summary of the benchmark revisions
The March 2014 benchmark level for total nonfarm employment is 137,214,000; this figure is 67,000 above the sample-based estimate for March 2014, an adjustment of less than 0.05 percent. Table 1 below shows the recent history of total nonfarm percentage benchmark revisions. Over the prior ten years, the annual benchmark revision at the total nonfarm level has averaged 0.3 percent (in absolute terms), with an absolute range of 0.1 percent to 0.7 percent.
U.S. Bureau of Labor Statistics Page 2 of 29
Back to Top
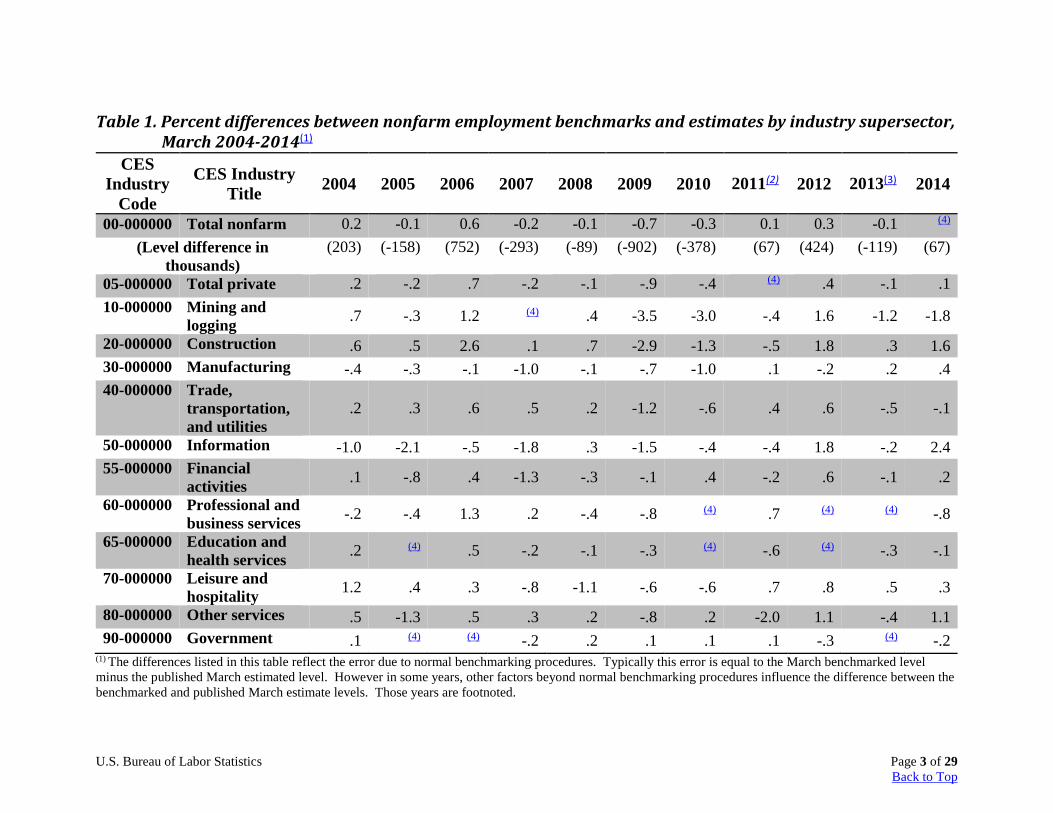
Table 1. Percent differences between nonfarm employment benchmarks and estimates by industry supersector, March 2004-2014(1)
CES Industry
Code
CES Industry Title 2004 2005 2006 2007 2008 2009 2010 2011(2) 2012 2013(3) 2014
00-000000 Total nonfarm 0.2 -0.1 0.6 -0.2 -0.1 -0.7 -0.3 0.1 0.3 -0.1 (4) (Level difference in
thousands) (203) (-158) (752) (-293) (-89) (-902) (-378) (67) (424) (-119) (67)
05-000000 Total private .2 -.2 .7 -.2 -.1 -.9 -.4 (4) .4 -.1 .1
10-000000 Mining and logging .7 -.3 1.2 (4)
.4 -3.5 -3.0 -.4 1.6 -1.2 -1.8
20-000000 Construction .6 .5 2.6 .1 .7 -2.9 -1.3 -.5 1.8 .3 1.6 30-000000 Manufacturing -.4 -.3 -.1 -1.0 -.1 -.7 -1.0 .1 -.2 .2 .4 40-000000 Trade,
transportation, and utilities
.2 .3 .6 .5 .2 -1.2 -.6 .4 .6 -.5 -.1
50-000000 Information -1.0 -2.1 -.5 -1.8 .3 -1.5 -.4 -.4 1.8 -.2 2.4 55-000000 Financial
activities .1 -.8 .4 -1.3 -.3 -.1 .4 -.2 .6 -.1 .2
60-000000 Professional and business services -.2 -.4 1.3 .2 -.4 -.8 (4)
.7 (4)
(4) -.8
65-000000 Education and health services .2 (4)
.5 -.2 -.1 -.3 (4) -.6 (4)
-.3 -.1
70-000000 Leisure and hospitality 1.2 .4 .3 -.8 -1.1 -.6 -.6 .7 .8 .5 .3
80-000000 Other services .5 -1.3 .5 .3 .2 -.8 .2 -2.0 1.1 -.4 1.1 90-000000 Government .1 (4)
(4) -.2 .2 .1 .1 .1 -.3 (4)
-.2 (1) The differences listed in this table reflect the error due to normal benchmarking procedures. Typically this error is equal to the March benchmarked level minus the published March estimated level. However in some years, other factors beyond normal benchmarking procedures influence the difference between the benchmarked and published March estimate levels. Those years are footnoted.
U.S. Bureau of Labor Statistics Page 3 of 29
Back to Top

(2) A review of industries for the possible presence of noncovered employment in benchmark 2011 yielded 13 additional industries. As a result of including these industries, employment in the amount of 95,000 was added to the total nonfarm benchmark level. The difference between the benchmarked and published March 2011 estimate level was 162,000. For this table, the 95,000 amount was added to the original published total nonfarm and total private March 2011 estimates before calculating the percent and level differences. Portions of the 95,000 amount were also added as appropriate to the original published March 2011 estimates of supersectors financial activities and education and health services before calculating the percent differences. (3) The percent and level differences in this column reflect reconstructions to series within CES supersectors financial activities and Education and healthcare services. Each first quarter, the Quarterly Census of Employment and Wages (QCEW) program, whose data account for approximately 97 percent of the CES universe scope (see www.bls.gov/web/empsit/cestn.htm#section1), incorporates updated industry assignments. In 2013, these updates included two substantial groups of nonrandom, noneconomic code changes, one to funds, trusts, and other financial vehicles (NAICS 525), and the other, a reclassification of approximately 466,000 in employment from private households (NAICS 814), which is out of scope for CES, to services for the elderly and persons with disabilities (NAICS 62412), which is in scope. These changes also had an impact, beyond what would be considered typical for a given benchmark year, on corresponding CES series. For more information about the changes to these industries, see the QCEW First Quarter 2013 News Release available at www.bls.gov/news.release/archives/cewqtr_09262013.htm. (4) Less than 0.05 percent.
To Table of Figures
U.S. Bureau of Labor Statistics Page 4 of 29
Back to Top

Table 2 shows the nonfarm employment benchmarks for March 2014, not seasonally adjusted, by industry. The revision to the reconstructed total nonfarm employment is 67,000. Six supersectors had upward revisions. The largest upward revision occurred in construction by an amount of 90,000 or 1.6 percent. Within this supersector, the revision was concentrated in specialty trade contractors, which was revised upward by 92,700, or 2.5 percent. Information had an upward revision of 66,000, or 2.4 percent. Other services was revised upward by 59,000 or 1.1 percent. Manufacturing was revised upward by 43,000, or 0.4 percent, with the majority of the increase attributed to nondurable goods, which experienced an upward revision of 30,000, or 0.7 percent. Leisure and hospitality was also revised upward by 38,000, or 0.3 percent. The smallest upward revision of 19,000, or 0.2 percent occurred in financial activities. The remaining five supersectors saw negative revisions. The largest downward revision occurred in professional and business services, which decreased by 147,000, or 0.8 percent. Within this supersector, the largest revision was in admistrative and support services with a revision of -169,400, or -2.2 percent. The next largest negative revision occurred in government, which experienced a drop of -38,000, or -0.2 percent. Trade, transportation, and utilities was also revised downward by -31,000, or -0.1 percent, with a large decrease occurring in wholesale trade (-45,400, or -0.8 percent). Mining and logging and education and health services exhibited identical level decreases of -16,000 (-1.8 percent and -0.1 percent, respectively).
Table 2. Nonfarm employment benchmarks by industry, March 2014 (in thousands)
CES Industry
Code CES Industry Title Benchmark Estimate
Differences
Amount Percent
00-000000 Total nonfarm 137,214 137,147 67 (1)
05-000000 Total private 114,989 114,884 105 0.1 06-000000 Goods-producing 18,675 18,558 117 0.6 07-000000 Service-providing 118,539 118,589 -50 (1)
08-000000 Private service-providing 96,314 96,326 -12 (1)
10-000000 Mining and logging 868 884 -16 -1.8 10-113300 Logging 50 52.8 -2.8 -5.6 10-210000 Mining 817.6 830.8 -13.2 -1.6 10-211000 Oil and gas extraction 192.7 206.2 -13.5 -7
10-212000 Mining, except oil and gas 201 205.8 -4.8 -2.4
10-212100 Coal mining 73.6 77.7 -4.1 -5.6
10-213000 Support activities for mining 423.9 418.8 5.1 1.2
20-000000 Construction 5,746 5,656 90 1.6
20-236000 Construction of buildings 1,283.4 1,286.2 -2.8 -0.2
20-236100 Residential building 615.2 621.7 -6.5 -1.1 U.S. Bureau of Labor Statistics Page 5 of 29
Back to Top

CES Industry
Code CES Industry Title Benchmark Estimate
Differences
Amount Percent 20-236200 Nonresidential building 668.2 664.5 3.7 0.6
20-237000
Heavy and civil engineering construction 823.9 823.8 0.1 (1)
20-238000 Specialty trade contractors 3,638.2 3,545.5 92.7 2.5
30-000000 Manufacturing 12,061 12,018 43 0.4 31-000000 Durable goods 7,600 7,587 13 0.2 31-321000 Wood products 361.9 358 3.9 1.1
31-327000 Nonmetallic mineral products 369.1 371.4 -2.3 -0.6
31-331000 Primary metals 396.3 396.6 -0.3 -0.1
31-332000 Fabricated metal products 1,438.5 1,440.2 -1.7 -0.1
31-333000 Machinery 1,116.1 1,115.2 0.9 0.1
31-334000 Computer and electronic products 1,048.3 1,055.7 -7.4 -0.7
31-334100 Computer and peripheral equipment 158.2 161.9 -3.7 -2.3
31-334200 Communications equipment 95.3 99.5 -4.2 -4.4
31-334400 Semiconductors and electronic components 368 368.6 -0.6 -0.2
31-334500 Electronic instruments 389.6 387.7 1.9 0.5
31-335000 Electrical equipment and appliances 375.3 374.8 0.5 0.1
31-336000 Transportation equipment 1,547.4 1,533.9 13.5 0.9
31-337000 Furniture and related products 366 362.5 3.5 1
31-339000 Miscellaneous durable goods manufacturing 581 578.4 2.6 0.4
32-000000 Nondurable goods 4,461 4,431 30 0.7 32-311000 Food manufacturing 1,460.8 1,458 2.8 0.2 32-313000 Textile mills 117.2 116.9 0.3 0.3 32-314000 Textile product mills 113.2 110.7 2.5 2.2 32-315000 Apparel 142.6 135.6 7 4.9
32-322000 Paper and paper products 372.1 374.5 -2.4 -0.6
32-323000 Printing and related support activities 452.7 440.7 12 2.7
32-324000 Petroleum and coal products 107.5 110.5 -3 -2.8
U.S. Bureau of Labor Statistics Page 6 of 29
Back to Top

CES Industry
Code CES Industry Title Benchmark Estimate
Differences
Amount Percent 32-325000 Chemicals 797.9 797.4 0.5 0.1
32-326000 Plastics and rubber products 668.6 659.2 9.4 1.4
32-329000
Miscellaneous nondurable goods manufacturing 228.3 227.6 0.7 0.3
40-000000 Trade, transportation, and utilities 25,852 25,883 -31 -0.1
41-420000 Wholesale trade 5,758.3 5,803.7 -45.4 -0.8 41-423000 Durable goods 2,883.8 2,917.2 -33.4 -1.2 41-424000 Nondurable goods 1,989 1,985.6 3.4 0.2
41-425000 Electronic markets and agents and brokers 885.5 900.9 -15.4 -1.7
42-000000 Retail trade 15,009.5 15,004 5.5 (1)
42-441000 Motor vehicle and parts dealers 1,826.3 1,822.9 3.4 0.2
42-441100 Automobile dealers 1,163.7 1,157.5 6.2 0.5
42-442000 Furniture and home furnishings stores 444 442.2 1.8 0.4
42-443000 Electronics and appliance stores 483.2 497.8 -14.6 -3
42-444000 Building material and garden supply stores 1,210.5 1,207.2 3.3 0.3
42-445000 Food and beverage stores 2,943.8 2,957.8 -14 -0.5
42-446000 Health and personal care stores 1,010.3 1,008.4 1.9 0.2
42-447000 Gasoline stations 863.4 859.7 3.7 0.4
42-448000 Clothing and clothing accessories stores 1,320.5 1,338.5 -18 -1.4
42-451000 Sporting goods, hobby, book, and music stores 591.9 574.6 17.3 2.9
42-452000 General merchandise stores 3,043.7 3,053.9 -10.2 -0.3
42-452100 Department stores 1,312.8 1,301.3 11.5 0.9
42-453000 Miscellaneous store retailers 791.3 774.1 17.2 2.2
42-454000 Nonstore retailers 480.6 466.9 13.7 2.9
43-000000 Transportation and warehousing 4,534.5 4,524.8 9.7 0.2
43-481000 Air transportation 440.2 455.2 -15 -3.4 43-482000 Rail transportation 230.3 232.7 -2.4 -1 43-483000 Water transportation 64.9 65.3 -0.4 -0.6
U.S. Bureau of Labor Statistics Page 7 of 29
Back to Top

CES Industry
Code CES Industry Title Benchmark Estimate
Differences
Amount Percent 43-484000 Truck transportation 1,374.3 1,367.7 6.6 0.5
43-485000
Transit and ground passenger transportation 476.9 468.3 8.6 1.8
43-486000 Pipeline transportation 46.5 45.1 1.4 3
43-487000 Scenic and sightseeing transportation 24.5 23.8 0.7 2.9
43-488000 Support activities for transportation 613.7 599.8 13.9 2.3
43-492000 Couriers and messengers 539.2 541 -1.8 -0.3
43-493000 Warehousing and storage 724 725.9 -1.9 -0.3
44-220000 Utilities 549.7 550.3 -0.6 -0.1 50-000000 Information 2,719 2,653 66 2.4
50-511000 Publishing industries, except Internet 723.7 726.5 -2.8 -0.4
50-512000
Motion picture and sound recording industries 380.1 313 67.1 17.7
50-515000 Broadcasting, except Internet 281.5 287.5 -6 -2.1
50-517000 Telecommunications 849.4 854.4 -5 -0.6
50-518000
Data processing, hosting and related services 274.4 267.8 6.6 2.4
50-519000 Other information services 209.6 203.3 6.3 3
55-000000 Financial activities 7,889 7,870 19 0.2 55-520000 Finance and insurance 5,894.9 5,868.9 26 0.4
55-521000 Monetary authorities - central bank 18.2 18 0.2 1.1
55-522000 Credit intermediation and related activities 2,562.8 2,571.1 -8.3 -0.3
55-522100 Depository credit intermediation 1,712.6 1,705 7.6 0.4
55-522110 Commercial banking 1,301.2 1,280.9 20.3 1.6
55-523000
Securities, commodity contracts, investments, and funds and trusts 874.2 870.5 3.7 0.4
55-524000 Insurance carriers and related activities 2,439.7 2,409.3 30.4 1.2
U.S. Bureau of Labor Statistics Page 8 of 29
Back to Top

CES Industry
Code CES Industry Title Benchmark Estimate
Differences
Amount Percent
55-530000 Real estate and rental and leasing 1,994.2 2,000.6 -6.4 -0.3
55-531000 Real estate 1,459.4 1,458.3 1.1 0.1
55-532000 Rental and leasing services 511.3 520.2 -8.9 -1.7
55-533000 Lessors of nonfinancial intangible assets 23.5 22.1 1.4 6
60-000000 Professional and business services 18,685 18,832 -147 -0.8
60-540000 Professional and technical services 8,310.3 8,326.6 -16.3 -0.2
60-541100 Legal services 1,118 1,134.4 -16.4 -1.5
60-541200 Accounting and bookkeeping services 1,058 1,052.3 5.7 0.5
60-541300 Architectural and engineering services 1,344.1 1,369.1 -25 -1.9
60-541500
Computer systems design and related services 1,742.1 1,728.6 13.5 0.8
60-541600
Management and technical consulting services 1,208.2 1,199.1 9.1 0.8
60-550000
Management of companies and enterprises 2,146.5 2,112.8 33.7 1.6
60-560000 Administrative and waste services 8,228 8,392.2 -164.2 -2
60-561000 Administrative and support services 7,852.1 8,021.5 -169.4 -2.2
60-561300 Employment services 3,251.7 3,427.2 -175.5 -5.4
60-561320 Temporary help services 2,626 2,741.2 -115.2 -4.4
60-561400 Business support services 873.8 858.5 15.3 1.8
60-561700 Services to buildings and dwellings 1,803.9 1,802.3 1.6 0.1
60-562000
Waste management and remediation services 375.9 370.7 5.2 1.4
65-000000 Education and health services 21,465 21,481 -16 -0.1
65-610000 Educational services 3,555.4 3,539.1 16.3 0.5
U.S. Bureau of Labor Statistics Page 9 of 29
Back to Top

CES Industry
Code CES Industry Title Benchmark Estimate
Differences
Amount Percent
65-620000 Health care and social assistance 17,909.8 17,941.4 -31.6 -0.2
65-621000 Ambulatory health care services 6,556.1 6,597.3 -41.2 -0.6
65-621100 Offices of physicians 2,448.7 2,473.9 -25.2 -1 65-621400 Outpatient care centers 698.5 705.9 -7.4 -1.1
65-621600 Home health care services 1,240 1,265.7 -25.7 -2.1
65-622000 Hospitals 4,767.3 4,792.7 -25.4 -0.5
65-623000 Nursing and residential care facilities 3,239.6 3,234.9 4.7 0.1
65-623100 Nursing care facilities 1,644.3 1,644.1 0.2 (1)
65-624000 Social assistance 3,346.8 3,316.5 30.3 0.9 65-624400 Child day care services 866.4 876.1 -9.7 -1.1 70-000000 Leisure and hospitality 14,181 14,143 38 0.3
70-710000 Arts, entertainment, and recreation 1,927.5 1,939.7 -12.2 -0.6
70-711000 Performing arts and spectator sports 421 420.9 0.1 (1)
70-712000
Museums, historical sites, and similar institutions 138 134.5 3.5 2.5
70-713000
Amusements, gambling, and recreation 1,368.5 1,384.3 -15.8 -1.2
70-720000 Accommodation and food services 12,253.4 12,203.2 50.2 0.4
70-721000 Accommodation 1,819.2 1,805.9 13.3 0.7
70-722000 Food services and drinking places 10,434.2 10,397.3 36.9 0.4
80-000000 Other services 5,523 5,464 59 1.1
80-811000 Repair and maintenance 1,232.3 1,209 23.3 1.9
80-812000 Personal and laundry services 1,351.9 1,351.7 0.2 (1)
80-813000
Membership associations and organizations 2,938.6 2,903.4 35.2 1.2
90-000000 Government 22,225 22,263 -38 -0.2 90-910000 Federal 2,716 2,705 11 0.4
90-911000 Federal, except U.S. Postal Service 2,127.5 2,117.6 9.9 0.5
90-919120 U.S. Postal Service 588.2 587.1 1.1 0.2
U.S. Bureau of Labor Statistics Page 10 of 29
Back to Top

CES Industry
Code CES Industry Title Benchmark Estimate
Differences
Amount Percent 90-920000 State government 5,211 5,217 -6 -0.1
90-921611 State government education 2,565.4 2,565.2 0.2 (1)
90-922000 State government, excluding education 2,645.1 2,651.8 -6.7 -0.3
90-930000 Local government 14,298 14,341 -43 -0.3
90-931611 Local government education 8,129 8,147.8 -18.8 -0.2
90-932000 Local government, excluding education 6,169.3 6,193.1 -23.8 -0.4
(1) Less than 0.05 percent. To Table of Figures
U.S. Bureau of Labor Statistics Page 11 of 29
Back to Top
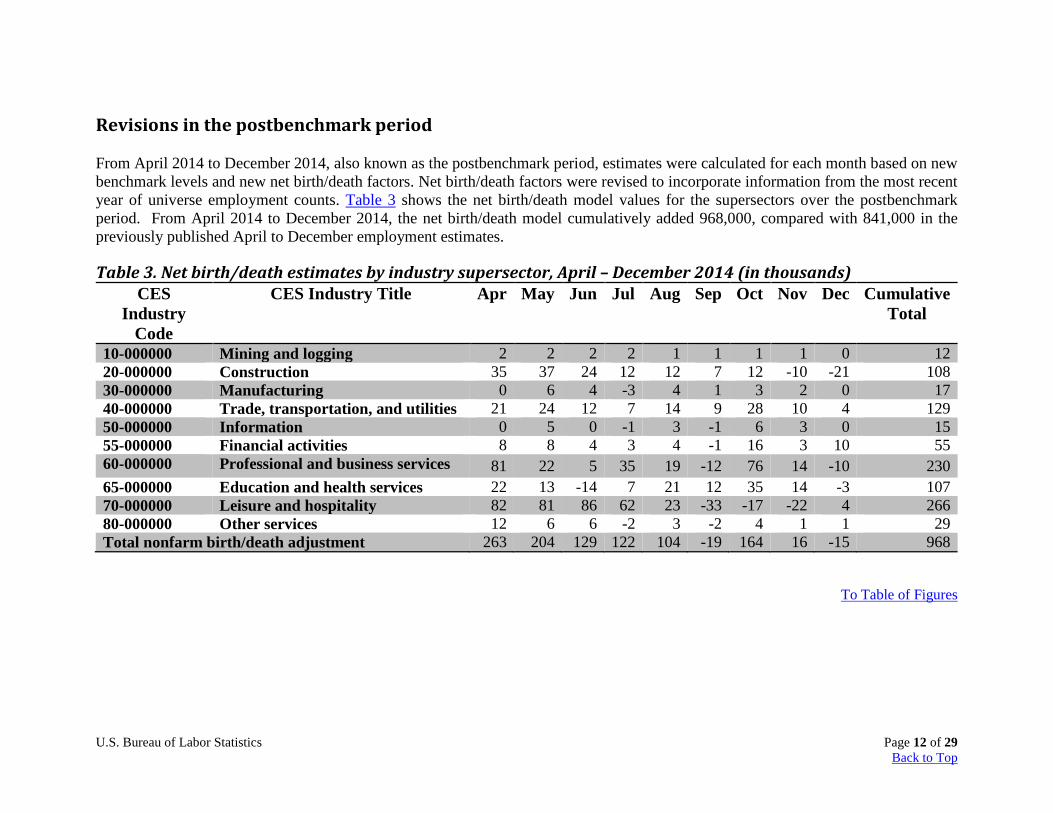
Revisions in the postbenchmark period
From April 2014 to December 2014, also known as the postbenchmark period, estimates were calculated for each month based on new benchmark levels and new net birth/death factors. Net birth/death factors were revised to incorporate information from the most recent year of universe employment counts. Table 3 shows the net birth/death model values for the supersectors over the postbenchmark period. From April 2014 to December 2014, the net birth/death model cumulatively added 968,000, compared with 841,000 in the previously published April to December employment estimates.
Table 3. Net birth/death estimates by industry supersector, April – December 2014 (in thousands) CES
Industry Code
CES Industry Title Apr May Jun Jul Aug Sep Oct Nov Dec Cumulative Total
10-000000 Mining and logging 2 2 2 2 1 1 1 1 0 12 20-000000 Construction 35 37 24 12 12 7 12 -10 -21 108 30-000000 Manufacturing 0 6 4 -3 4 1 3 2 0 17 40-000000 Trade, transportation, and utilities 21 24 12 7 14 9 28 10 4 129 50-000000 Information 0 5 0 -1 3 -1 6 3 0 15 55-000000 Financial activities 8 8 4 3 4 -1 16 3 10 55 60-000000 Professional and business services 81 22 5 35 19 -12 76 14 -10 230 65-000000 Education and health services 22 13 -14 7 21 12 35 14 -3 107 70-000000 Leisure and hospitality 82 81 86 62 23 -33 -17 -22 4 266 80-000000 Other services 12 6 6 -2 3 -2 4 1 1 29 Total nonfarm birth/death adjustment 263 204 129 122 104 -19 164 16 -15 968
To Table of Figures
U.S. Bureau of Labor Statistics Page 12 of 29
Back to Top

Table 4 presents revised total nonfarm employment data on a seasonally adjusted basis for January 2014 through December 2014. The revised data for April 2014 forward incorporate the effect of applying the rate of change measured by the sample to the new benchmark level, as well as updated net birth/death model adjustments and new seasonal adjustment factors.
Table 4. Differences in seasonally adjusted levels and over-the-month changes, total nonfarm employment, January – December 2014 (in thousands)
2014
Levels Over-the-month changes As
Previously Published
As Revised Difference
As Previously Published
As Revised Difference
January 137,539 137,642 103 144 166 22 February 137,761 137,830 69 222 188 -34 March 137,964 138,055 91 203 225 22 April 138,268 138,385 117 304 330 26 May 138,497 138,621 124 229 236 7 June 138,764 138,907 143 267 286 19 July 139,007 139,156 149 243 249 6 August 139,210 139,369 159 203 213 10 September 139,481 139,619 138 271 250 -21 October 139,742 139,840 98 261 221 -40 November 140,095 140,263 168 353 423 70 December(p) 140,347 140,592 245 252 329 77
(p)Preliminary. To Table of Figures
U.S. Bureau of Labor Statistics Page 13 of 29
Back to Top
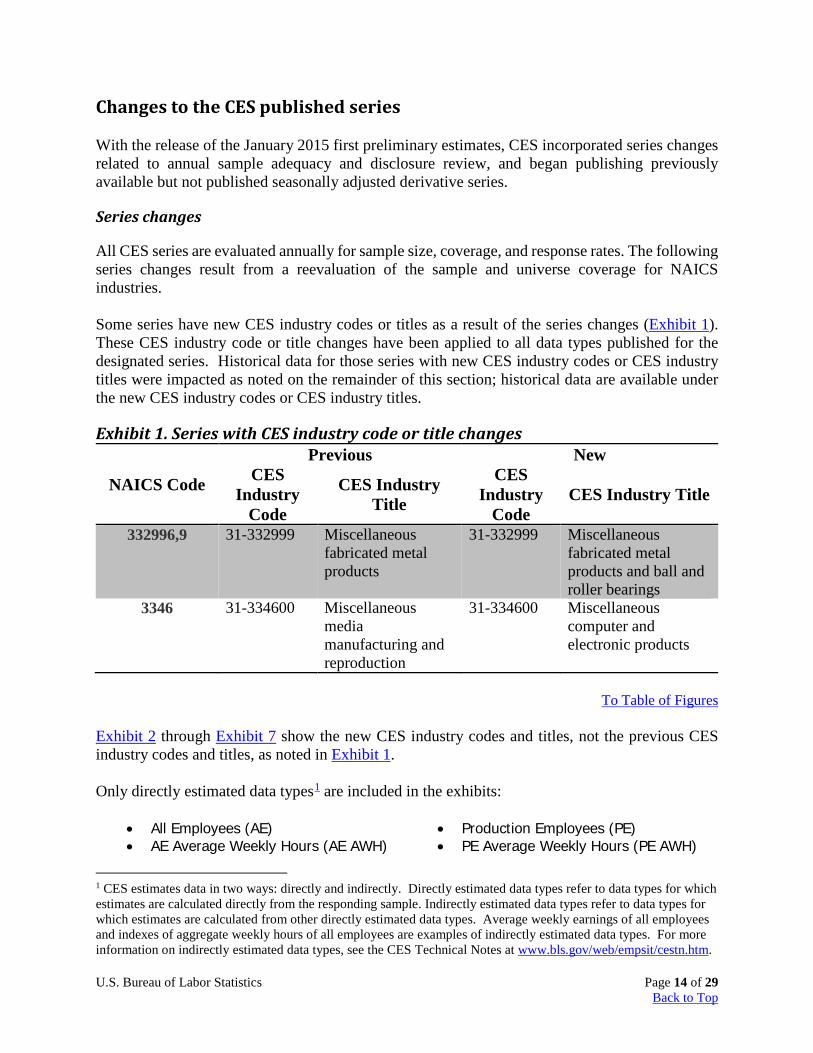
Changes to the CES published series
With the release of the January 2015 first preliminary estimates, CES incorporated series changes related to annual sample adequacy and disclosure review, and began publishing previously available but not published seasonally adjusted derivative series.
Series changes
All CES series are evaluated annually for sample size, coverage, and response rates. The following series changes result from a reevaluation of the sample and universe coverage for NAICS industries. Some series have new CES industry codes or titles as a result of the series changes (Exhibit 1). These CES industry code or title changes have been applied to all data types published for the designated series. Historical data for those series with new CES industry codes or CES industry titles were impacted as noted on the remainder of this section; historical data are available under the new CES industry codes or CES industry titles.
Exhibit 1. Series with CES industry code or title changes
NAICS Code
Previous New CES
Industry Code
CES Industry Title
CES Industry
Code CES Industry Title
332996,9 31-332999 Miscellaneous fabricated metal products
31-332999 Miscellaneous fabricated metal products and ball and roller bearings
3346 31-334600 Miscellaneous media manufacturing and reproduction
31-334600 Miscellaneous computer and electronic products
To Table of Figures
Exhibit 2 through Exhibit 7 show the new CES industry codes and titles, not the previous CES industry codes and titles, as noted in Exhibit 1. Only directly estimated data types1 are included in the exhibits:
• All Employees (AE) • Production Employees (PE) • AE Average Weekly Hours (AE AWH) • PE Average Weekly Hours (PE AWH)
1 CES estimates data in two ways: directly and indirectly. Directly estimated data types refer to data types for which estimates are calculated directly from the responding sample. Indirectly estimated data types refer to data types for which estimates are calculated from other directly estimated data types. Average weekly earnings of all employees and indexes of aggregate weekly hours of all employees are examples of indirectly estimated data types. For more information on indirectly estimated data types, see the CES Technical Notes at www.bls.gov/web/empsit/cestn.htm. U.S. Bureau of Labor Statistics Page 14 of 29
Back to Top
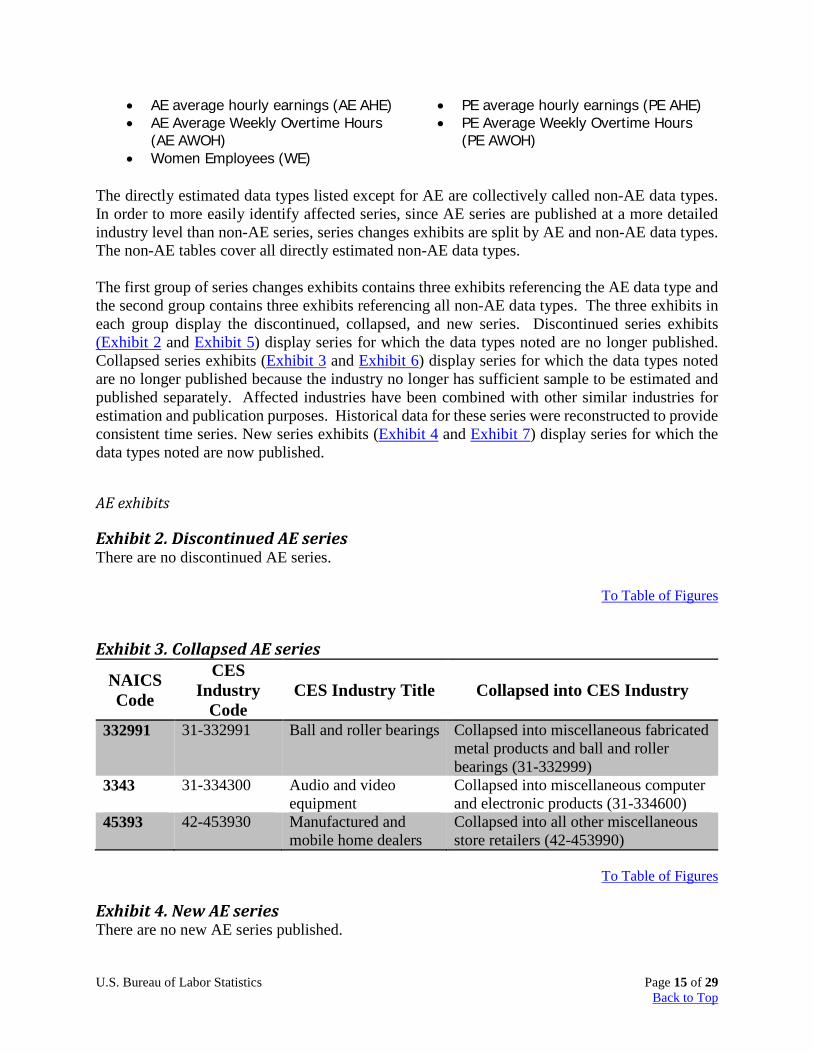
• AE average hourly earnings (AE AHE) • PE average hourly earnings (PE AHE) • AE Average Weekly Overtime Hours
(AE AWOH) • PE Average Weekly Overtime Hours
(PE AWOH) • Women Employees (WE)
The directly estimated data types listed except for AE are collectively called non-AE data types. In order to more easily identify affected series, since AE series are published at a more detailed industry level than non-AE series, series changes exhibits are split by AE and non-AE data types. The non-AE tables cover all directly estimated non-AE data types. The first group of series changes exhibits contains three exhibits referencing the AE data type and the second group contains three exhibits referencing all non-AE data types. The three exhibits in each group display the discontinued, collapsed, and new series. Discontinued series exhibits (Exhibit 2 and Exhibit 5) display series for which the data types noted are no longer published. Collapsed series exhibits (Exhibit 3 and Exhibit 6) display series for which the data types noted are no longer published because the industry no longer has sufficient sample to be estimated and published separately. Affected industries have been combined with other similar industries for estimation and publication purposes. Historical data for these series were reconstructed to provide consistent time series. New series exhibits (Exhibit 4 and Exhibit 7) display series for which the data types noted are now published.
AE exhibits
Exhibit 2. Discontinued AE series There are no discontinued AE series.
To Table of Figures
Exhibit 3. Collapsed AE series
NAICS Code
CES Industry
Code CES Industry Title Collapsed into CES Industry
332991 31-332991 Ball and roller bearings Collapsed into miscellaneous fabricated metal products and ball and roller bearings (31-332999)
3343 31-334300 Audio and video equipment
Collapsed into miscellaneous computer and electronic products (31-334600)
45393 42-453930 Manufactured and mobile home dealers
Collapsed into all other miscellaneous store retailers (42-453990)
To Table of Figures
Exhibit 4. New AE series There are no new AE series published. U.S. Bureau of Labor Statistics Page 15 of 29
Back to Top
To Table of Figures
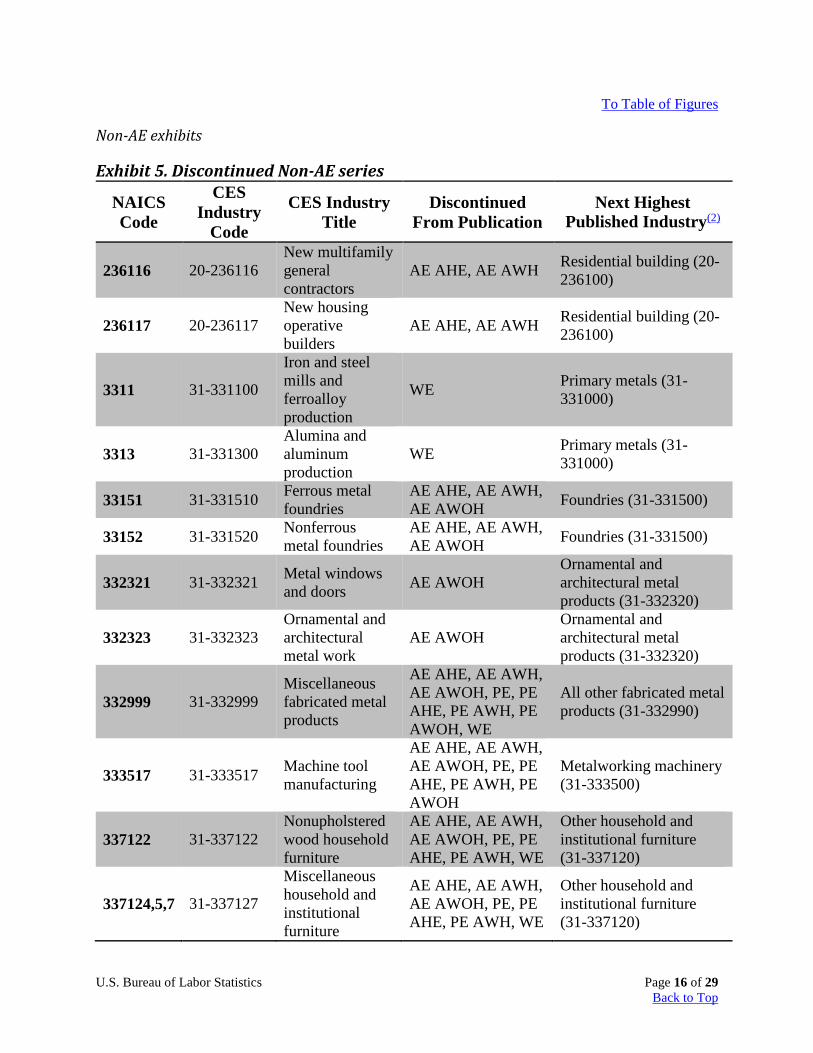
Non-AE exhibits
Exhibit 5. Discontinued Non-AE series
NAICS Code
CES Industry
Code
CES Industry Title
Discontinued From Publication
Next Highest Published Industry(2)
236116 20-236116 New multifamily general contractors
AE AHE, AE AWH Residential building (20-236100)
236117 20-236117 New housing operative builders
AE AHE, AE AWH Residential building (20-236100)
3311 31-331100
Iron and steel mills and ferroalloy production
WE Primary metals (31-331000)
3313 31-331300 Alumina and aluminum production
WE Primary metals (31-331000)
33151 31-331510 Ferrous metal foundries
AE AHE, AE AWH, AE AWOH Foundries (31-331500)
33152 31-331520 Nonferrous metal foundries
AE AHE, AE AWH, AE AWOH Foundries (31-331500)
332321 31-332321 Metal windows and doors AE AWOH
Ornamental and architectural metal products (31-332320)
332323 31-332323 Ornamental and architectural metal work
AE AWOH Ornamental and architectural metal products (31-332320)
332999 31-332999 Miscellaneous fabricated metal products
AE AHE, AE AWH, AE AWOH, PE, PE AHE, PE AWH, PE AWOH, WE
All other fabricated metal products (31-332990)
333517 31-333517 Machine tool manufacturing
AE AHE, AE AWH, AE AWOH, PE, PE AHE, PE AWH, PE AWOH
Metalworking machinery (31-333500)
337122 31-337122 Nonupholstered wood household furniture
AE AHE, AE AWH, AE AWOH, PE, PE AHE, PE AWH, WE
Other household and institutional furniture (31-337120)
337124,5,7 31-337127
Miscellaneous household and institutional furniture
AE AHE, AE AWH, AE AWOH, PE, PE AHE, PE AWH, WE
Other household and institutional furniture (31-337120)
U.S. Bureau of Labor Statistics Page 16 of 29
Back to Top

NAICS Code
CES Industry
Code
CES Industry Title
Discontinued From Publication
Next Highest Published Industry(2)
311611 32-311611 Animal, except poultry, slaughtering
AE AWOH Animal slaughtering and processing (32-311600)
311612,3 32-311613
Meat processed from carcasses, and rendering and meat byproduct processing
AE AWOH Animal slaughtering and processing (32-311600)
45399 42-453990 All other miscellaneous store retailers
AE AHE, AE AWH, PE, PE AHE, PE AWH, WE
Other miscellaneous store retailers (42-453900)
54186 60-541860 Direct mail advertising
PE, PE AHE, PE AWH
Advertising and related services (60-541800)
(2) The industry listed is the next highest published industry for all data types discontinued from publication.
To Table of Figures
Exhibit 6. Collapsed Non-AE series There are no collapsed non-AE series.
To Table of Figures
Exhibit 7. New Non-AE series There are no new non-AE series published.
To Table of Figures ___________________________
Seasonally adjusted data publication change
Seasonally adjusted estimates for the indirectly estimated data types associated with series not available until the second preliminary release are now available with the second preliminary release. This change in publication status does not impact the seasonally adjusted series published for a given month with the first preliminary release of CES data. Approximately 8,300 more seasonally adjusted derivative series will be published.
Why benchmarks differ from estimates
A benchmark revision is the difference between the benchmark employment level for a given March and its corresponding sample-based estimate. The overall accuracy of the establishment
U.S. Bureau of Labor Statistics Page 17 of 29
Back to Top

survey is usually gauged by the size of this difference. The benchmark revision often is regarded as a proxy for total survey error, but this does not take into account error in the universe data or infrequent events such as historical reconstructions. The employment counts obtained from quarterly UI tax forms are administrative data that reflect employer record-keeping practices and differing state laws and procedures. The benchmark revision can be more precisely interpreted as the difference between two independently derived employment counts, each subject to its own error sources. Like all sample surveys, the establishment survey is susceptible to two sources of error: sampling error and nonsampling error. Sampling error is present any time a sample is used to make inferences about a population. The magnitude of the sampling error, or variance, relates directly to sample size and the percentage of the universe covered by that sample. The CES monthly survey captures slightly under one-third of the universe, exceptionally high by usual sampling standards. This coverage ensures a small sampling error at the Total nonfarm employment level. Both the universe counts and the establishment survey estimates are subject to nonsampling errors common to all surveys – measurement, response, and processing errors. The error structures for both the CES monthly survey and the UI universe are complex. Still, the two programs generally produce consistent total employment figures, each validating the other.
Benchmark revision effects for other data types
The routine benchmarking process results in revisions to the series for production and nonsupervisory employees and women employees. There are no benchmark employment levels for these series; they are revised by preserving ratios of employment for the particular data type to all employee employment prior to benchmarking, and then applying these ratios to the revised all employee figures. These figures are calculated at the basic cell level and then aggregated to produce the summary estimates. Average weekly hours, average hourly earnings, and in manufacturing industries, average weekly overtime hours are not benchmarked; they are estimated solely from reports supplied by survey respondents at the basic estimating cell level. The aggregate industry levels of the hours and earnings series are derived as a weighted average. The all employee employment estimates or the production and nonsupervisory employee employment estimates for the basic cells essentially act as weights for their respective hours and earnings estimates for broader industry groupings. Adjustments of the all employee estimates to new benchmarks may alter the weights used for both AE and PE hours and earnings, which, in turn, may change the estimates for both AE and PE hours and earnings at higher levels of aggregation. Generally, new employment benchmarks have little effect on hours and earnings estimates for major industry groupings. To influence the hours and earnings estimates of a broader industry group, employment revisions have to be relatively large and must affect industries that have hours or earnings averages that are substantially different from those of other industries in their broader group. Table 5 and Table 6 provide information on the levels of specific hours and earnings series
U.S. Bureau of Labor Statistics Page 18 of 29
Back to Top

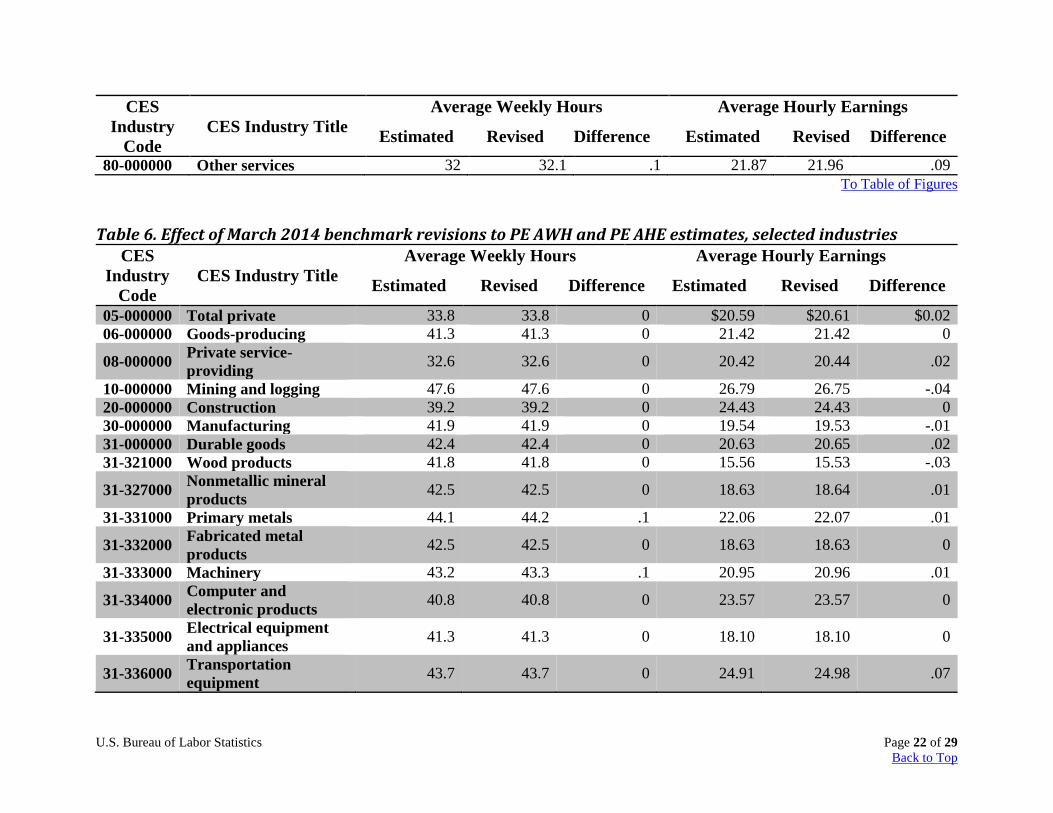
resulting from the March 2014 benchmark. Total private average hourly earnings increased by two cents for AE and PE from the previously published level.
U.S. Bureau of Labor Statistics Page 19 of 29
Back to Top
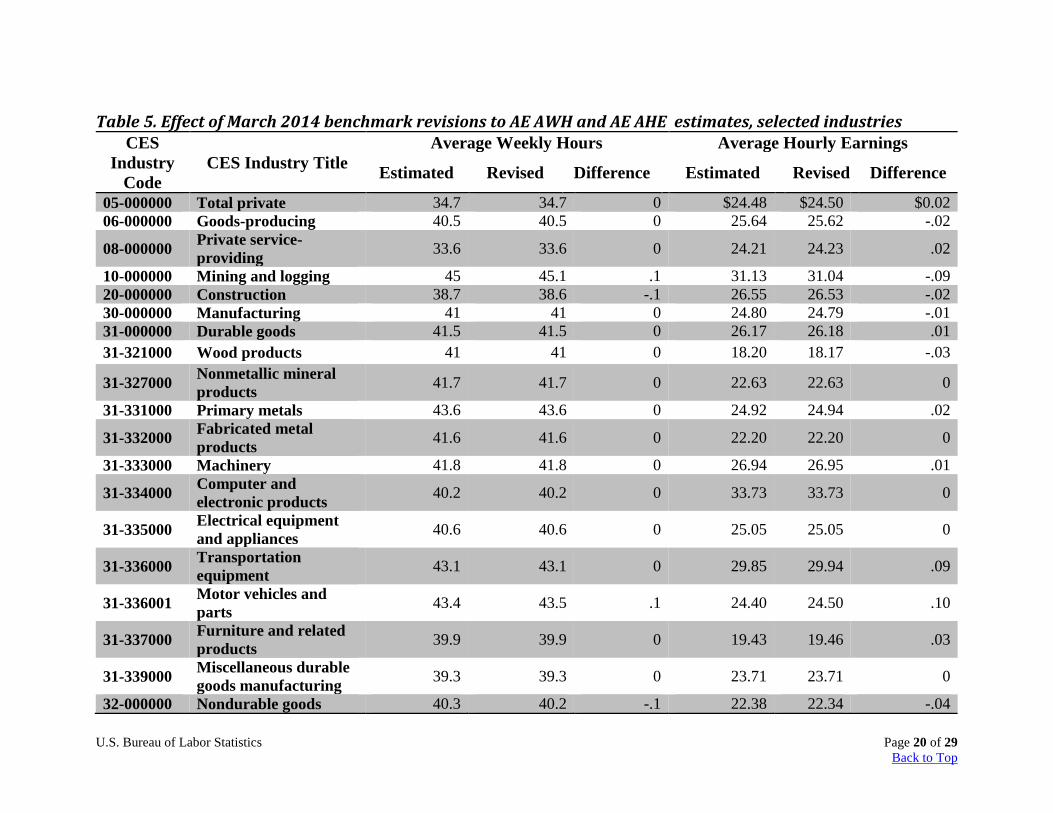
Table 5. Effect of March 2014 benchmark revisions to AE AWH and AE AHE estimates, selected industries CES
Industry Code
CES Industry Title Average Weekly Hours Average Hourly Earnings
Estimated Revised Difference Estimated Revised Difference
05-000000 Total private 34.7 34.7 0 $24.48 $24.50 $0.02 06-000000 Goods-producing 40.5 40.5 0 25.64 25.62 -.02
08-000000 Private service-providing 33.6 33.6 0 24.21 24.23 .02
10-000000 Mining and logging 45 45.1 .1 31.13 31.04 -.09 20-000000 Construction 38.7 38.6 -.1 26.55 26.53 -.02 30-000000 Manufacturing 41 41 0 24.80 24.79 -.01 31-000000 Durable goods 41.5 41.5 0 26.17 26.18 .01 31-321000 Wood products 41 41 0 18.20 18.17 -.03
31-327000 Nonmetallic mineral products 41.7 41.7 0 22.63 22.63 0
31-331000 Primary metals 43.6 43.6 0 24.92 24.94 .02
31-332000 Fabricated metal products 41.6 41.6 0 22.20 22.20 0
31-333000 Machinery 41.8 41.8 0 26.94 26.95 .01
31-334000 Computer and electronic products 40.2 40.2 0 33.73 33.73 0
31-335000 Electrical equipment and appliances 40.6 40.6 0 25.05 25.05 0
31-336000 Transportation equipment 43.1 43.1 0 29.85 29.94 .09
31-336001 Motor vehicles and parts 43.4 43.5 .1 24.40 24.50 .10
31-337000 Furniture and related products 39.9 39.9 0 19.43 19.46 .03
31-339000 Miscellaneous durable goods manufacturing 39.3 39.3 0 23.71 23.71 0
32-000000 Nondurable goods 40.3 40.2 -.1 22.38 22.34 -.04 U.S. Bureau of Labor Statistics Page 20 of 29
Back to Top

CES Industry
Code CES Industry Title
Average Weekly Hours Average Hourly Earnings
Estimated Revised Difference Estimated Revised Difference 32-311000 Food manufacturing 39.8 39.8 0 18.46 18.47 .01 32-313000 Textile mills 41.4 41.4 0 17.53 17.53 0 32-314000 Textile product mills 37.8 37.8 0 16.14 16.13 -.01 32-315000 Apparel 37.2 37.3 .1 17.15 17.17 .02
32-322000 Paper and paper products 42.4 42.4 0 24.58 24.60 .02
32-323000 Printing and related support activities 37.5 37.5 0 22.65 22.65 0
32-324000 Petroleum and coal products 43.6 43.4 -.2 38.09 37.58 -.51
32-325000 Chemicals 41.8 41.8 0 29.83 29.83 0
32-326000 Plastics and rubber products 41.3 41.3 0 20.53 20.52 -.01
32-329000 Miscellaneous nondurable goods manufacturing
37.4 37.4 0 21.32 21.32 0
40-000000 Trade, transportation, and utilities 34.6 34.6 0 21.45 21.44 -.01
41-420000 Wholesale trade 39.3 39.3 0 28.18 28.17 -.01 42-000000 Retail trade 31.3 31.3 0 16.94 16.95 .01
43-000000 Transportation and warehousing 38.6 38.6 0 22.88 22.90 .02
44-220000 Utilities 42.3 42.3 0 35.72 35.72 0 50-000000 Information 37.5 37.4 -.1 34.05 34.08 .03 55-000000 Financial activities 37.8 37.8 0 30.87 30.87 0
60-000000 Professional and business services 36.6 36.7 .1 29.39 29.49 .10
65-000000 Education and health services 32.8 32.8 0 24.57 24.59 .02
70-000000 Leisure and hospitality 26.5 26.5 0 13.78 13.79 .01
U.S. Bureau of Labor Statistics Page 21 of 29
Back to Top
CES Industry
Code CES Industry Title
Average Weekly Hours Average Hourly Earnings
Estimated Revised Difference Estimated Revised Difference 80-000000 Other services 32 32.1 .1 21.87 21.96 .09
To Table of Figures
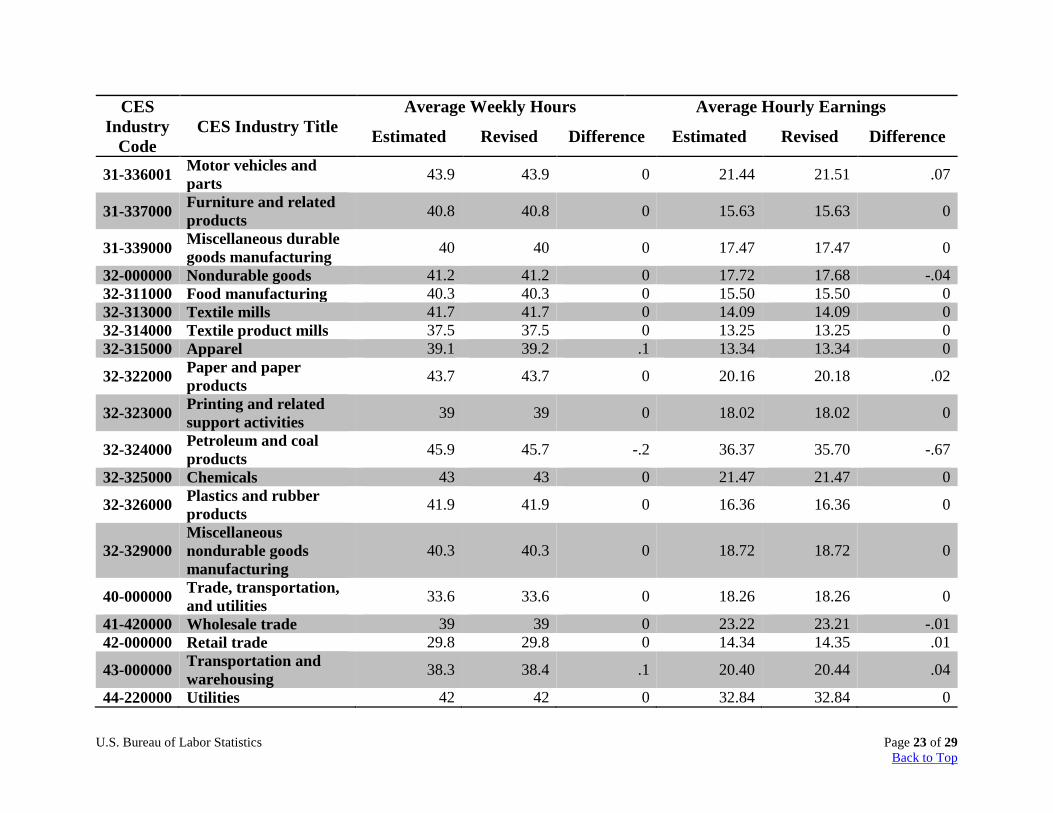
Table 6. Effect of March 2014 benchmark revisions to PE AWH and PE AHE estimates, selected industries CES
Industry Code
CES Industry Title Average Weekly Hours Average Hourly Earnings
Estimated Revised Difference Estimated Revised Difference
05-000000 Total private 33.8 33.8 0 $20.59 $20.61 $0.02 06-000000 Goods-producing 41.3 41.3 0 21.42 21.42 0
08-000000 Private service-providing 32.6 32.6 0 20.42 20.44 .02
10-000000 Mining and logging 47.6 47.6 0 26.79 26.75 -.04 20-000000 Construction 39.2 39.2 0 24.43 24.43 0 30-000000 Manufacturing 41.9 41.9 0 19.54 19.53 -.01 31-000000 Durable goods 42.4 42.4 0 20.63 20.65 .02 31-321000 Wood products 41.8 41.8 0 15.56 15.53 -.03
31-327000 Nonmetallic mineral products 42.5 42.5 0 18.63 18.64 .01
31-331000 Primary metals 44.1 44.2 .1 22.06 22.07 .01
31-332000 Fabricated metal products 42.5 42.5 0 18.63 18.63 0
31-333000 Machinery 43.2 43.3 .1 20.95 20.96 .01
31-334000 Computer and electronic products 40.8 40.8 0 23.57 23.57 0
31-335000 Electrical equipment and appliances 41.3 41.3 0 18.10 18.10 0
31-336000 Transportation equipment 43.7 43.7 0 24.91 24.98 .07
U.S. Bureau of Labor Statistics Page 22 of 29
Back to Top
CES Industry
Code CES Industry Title
Average Weekly Hours Average Hourly Earnings
Estimated Revised Difference Estimated Revised Difference
31-336001 Motor vehicles and parts 43.9 43.9 0 21.44 21.51 .07
31-337000 Furniture and related products 40.8 40.8 0 15.63 15.63 0
31-339000 Miscellaneous durable goods manufacturing 40 40 0 17.47 17.47 0
32-000000 Nondurable goods 41.2 41.2 0 17.72 17.68 -.04 32-311000 Food manufacturing 40.3 40.3 0 15.50 15.50 0 32-313000 Textile mills 41.7 41.7 0 14.09 14.09 0 32-314000 Textile product mills 37.5 37.5 0 13.25 13.25 0 32-315000 Apparel 39.1 39.2 .1 13.34 13.34 0
32-322000 Paper and paper products 43.7 43.7 0 20.16 20.18 .02
32-323000 Printing and related support activities 39 39 0 18.02 18.02 0
32-324000 Petroleum and coal products 45.9 45.7 -.2 36.37 35.70 -.67
32-325000 Chemicals 43 43 0 21.47 21.47 0
32-326000 Plastics and rubber products 41.9 41.9 0 16.36 16.36 0
32-329000 Miscellaneous nondurable goods manufacturing
40.3 40.3 0 18.72 18.72 0
40-000000 Trade, transportation, and utilities 33.6 33.6 0 18.26 18.26 0
41-420000 Wholesale trade 39 39 0 23.22 23.21 -.01 42-000000 Retail trade 29.8 29.8 0 14.34 14.35 .01
43-000000 Transportation and warehousing 38.3 38.4 .1 20.40 20.44 .04
44-220000 Utilities 42 42 0 32.84 32.84 0
U.S. Bureau of Labor Statistics Page 23 of 29
Back to Top

CES Industry
Code CES Industry Title
Average Weekly Hours Average Hourly Earnings
Estimated Revised Difference Estimated Revised Difference 50-000000 Information 36.4 36.2 -.2 28.84 28.83 -.01 55-000000 Financial activities 37.3 37.3 0 24.78 24.77 -.01
60-000000 Professional and business services 35.8 35.8 0 24.47 24.55 .08
65-000000 Education and health services 32.1 32 -.1 21.49 21.51 .02
70-000000 Leisure and hospitality 25.5 25.5 0 11.99 11.99 0 80-000000 Other services 31 31 0 18.40 18.50 .10
To Table of Figures
U.S. Bureau of Labor Statistics Page 24 of 29
Back to Top
Vintage data
Due to user interest in versions of CES estimates from original to current publication, CES compiled vintage data tables that display the CES published employment values for a given reference month across time. CES vintage data can be found at www.bls.gov/ces/cesvininfo.htm.
Three-month moving average
Effective with the release of January 2015 data, the establishment survey will introduce two new data series: total nonfarm employment, 3-month average change and total private employment, 3-month average change. Both series are seasonally adjusted.
Methods
Benchmark adjustment procedure
Establishment survey benchmarking is done on an annual basis to a population derived primarily from the administrative file of employees covered by UI. The time required to complete the revision process—from the full collection of the UI population data to publication of the revised industry estimates—is about ten months. The benchmark adjustment procedure replaces the March sample-based employment estimates with UI-based population counts for March. The benchmark therefore determines the final employment levels, while sample movements capture month-to-month trends. Benchmarks are established for each basic estimating cell and are aggregated to develop published levels. On a not seasonally adjusted basis, the sample-based estimates for the year preceding and the nine months following the benchmark also are then subject to revision. Employment estimates for the months between the most recent March benchmark and the previous year's benchmark are adjusted using a "wedge-back" procedure. In this process, the difference between the benchmark level and the previously published March estimate for each estimating cell is computed. This difference, or error, is linearly distributed across the 11 months of estimates subsequent to the previous benchmark; eleven-twelfths of the March difference is added to February estimates, ten-twelfths to January estimates, and so on, ending with the previous April estimates, which receive one-twelfth of the March difference. The wedge procedure assumes that the total estimation error accumulated at a steady rate since the last benchmark. Applying previously derived over-the-month sample changes to the revised March level yields revised estimates for the nine months following the March benchmark (also referred to as the post benchmark period, see Revisions in the post benchmark period). New net birth/death model estimates also are calculated and applied during post benchmark estimation.
U.S. Bureau of Labor Statistics Page 25 of 29
Back to Top

Benchmark source material
The principal source of benchmark data for private industries is the Quarterly Census of Employment and Wages (QCEW). The QCEW scope is defined by employment data provided to state employment security agencies by employers covered by state UI laws. BLS uses several other sources to establish benchmarks for the industries partially covered or exempt from mandatory UI coverage, accounting for nearly 3 percent of the nonfarm employment total. Data on employees covered under Social Security laws, published by the U.S. Census Bureau in County Business Patterns, are used to augment UI data for industries not fully covered by the UI scope, such as Non-office insurance sales workers, child daycare workers, Religious organizations, and Private schools and hospitals. Noncovered employment for state and local government hospitals and educational institutions is based on the Annual Survey of Public Employment and Payroll (ASPEP) conducted by the Census Bureau. Noncovered employment data from these sources are available only on a lagged basis. Extrapolation to a current level is accomplished by applying the employment trends from the UI-covered part of the population in these industries to the noncovered part. Universe data for interstate railroads are obtained from the Railroad Retirement Board. More information on calculating noncovered employment in the CES program is available in the CES Technical Notes at www.bls.gov/web/empsit/cestn.htm#NCE.
Business birth and death estimation
Regular updating of the CES sample frame with information from the UI universe files helps to keep the CES survey current with respect to employment from business births and deaths. However, the timeliest UI universe files available will always be a minimum of six to seven months out of date. The CES survey thus cannot rely on regular frame maintenance alone to provide estimates for business birth and death employment contributions. BLS has researched both sample-based and model-based approaches to measuring birth units that have not yet appeared on the UI universe frame. Since the research demonstrated that sampling for births was not feasible in the very short CES production timeframes, the Bureau is utilizing a model-based approach for this component. Earlier research indicated that while both the business birth and death portions of total employment are generally significant, the net contribution is relatively small. To account for this net birth/death portion of total employment, BLS is utilizing an estimation procedure with two components. The first component excludes employment losses from business deaths from sample-based estimation in order to offset the missing employment gains from business births. This is incorporated into the sample-based link relative estimate procedure by simply not reflecting sample units going out of business, but imputing to them the same trend as the other firms in the sample. The second component is an Autoregressive Integrated Moving Average (ARIMA) time series model designed to estimate the net birth/death employment not accounted for by the imputation. The historical time series used to create and test the ARIMA model was derived from the UI universe micro level database, and reflects the actual net of births and deaths over the past five years. The net birth/death model component figures are unique to each month and include negative adjustments in some months. Furthermore, these figures exhibit a seasonal pattern similar to the seasonal patterns of the continuing businesses. U.S. Bureau of Labor Statistics Page 26 of 29
Back to Top

Only error from the second component is directly measurable. Error from this component is measured by comparing the actual net of births and deaths from March 2013-14 — once it becomes available — with the model-based estimate. As Table 7 shows, the actual net birth/death for April 2013 to March 2014 was approximately 202,000 above the forecasted amount used in the CES monthly estimates for the time period.
U.S. Bureau of Labor Statistics Page 27 of 29
Back to Top

Table 7. Differences between forecasted and actual net birth/death, total private employment, April 2013 – March 2014 (in thousands)
Benchmark 2014
2013 2014 Total Apr May Jun Jul Aug Sep Oct Nov Dec Jan Feb Mar Actual Net Birth/Death 277 201 129 143 127 -19 164 22 -26 -252 141 64 971 Forecast Net Birth/Death 236 210 140 86 99 -30 159 -11 -12 -307 124 75 769 Difference 41 -9 -11 57 28 11 5 33 -14 55 17 -11 202 Cumulative Difference 41 32 21 78 106 117 122 155 141 196 213 202
To Table of Figures
Availability of revised data
LABSTAT, the BLS public database, contains all historical employment, hours, and earnings data revised as a result of this benchmark, including both not seasonally adjusted and seasonally adjusted data. The data can be accessed at www.bls.gov/ces/, the CES homepage. Some data published on previous dates can be accessed through the CES Vintage data webpage at www.bls.gov/ces/vininfo/.
Seasonal adjustment procedure
For technical information on how seasonal adjustment is performed in the CES program, refer to the Seasonal Adjustment section of the CES Technical Notes, available at www.bls.gov/web/empsit/cestn.htm#section5e. For more information on seasonal adjustment model specifications and special model adjustments, please see the Seasonal Adjustment Model Specification List section of the CES Seasonal Adjustment Files and Documentation page, available at www.bls.gov/web/empsit/cesseasadj.htm#samodel.
U.S. Bureau of Labor Statistics Page 28 of 29
Back to Top

Table of figures
Tables Table 1. Percent differences between nonfarm employment benchmarks and estimates by
industry supersector, March 2004-2014 .................................................................5 Table 2. Nonfarm employment benchmarks by industry, March 2014 (in thousands) .......7 Table 3. Net birth/death estimates by industry supersector, April – December 2014 (in
thousands) .............................................................................................................15 Table 4. Differences in seasonally adjusted levels and over-the-month changes, total
nonfarm employment, January – December 2014 (in thousands) ........................16 Table 5. Effect of March 2014 benchmark revisions to AE AWH and AE AHE
estimates, selected industries ................................................................................24 Table 6. Effect of March 2014 benchmark revisions to PE AWH and PE AHE estimates,
selected industries .................................................................................................26 Table 7. Differences between forecasted and actual net birth/death, total private
employment, April 2013 – March 2014(in thousands) ........................................31
Exhibits Exhibit 1. Series with CES industry code or title changes ................................................17 Exhibit 2. Discontinued AE series .....................................................................................18 Exhibit 3. Collapsed AE series ..........................................................................................19 Exhibit 4. New AE series ...................................................................................................19 Exhibit 5. Discontinued Non-AE series .............................................................................19 Exhibit 6. Collapsed Non-AE series ..................................................................................22 Exhibit 7. New Non-AE series...........................................................................................22
Last Modified Date: February 6, 2015
Nicholas Fett and Caila Pinkleton, Economists
U.S. Bureau of Labor Statistics | Division of Current Employment Statistics – National PSB Suite 4860, 2 Massachusetts Avenue, NE Washington, DC 20212-0001
www.bls.gov/CES | Telephone: 1-202-691-6555 | [email protected]
U.S. Bureau of Labor Statistics Page 29 of 29
Back to Top
Related Documents