Investor Visit – Cajamarca, Peru South America Region – Cerro Corona Day 2 | 15 November 2011

Welcome message from author
This document is posted to help you gain knowledge. Please leave a comment to let me know what you think about it! Share it to your friends and learn new things together.
Transcript
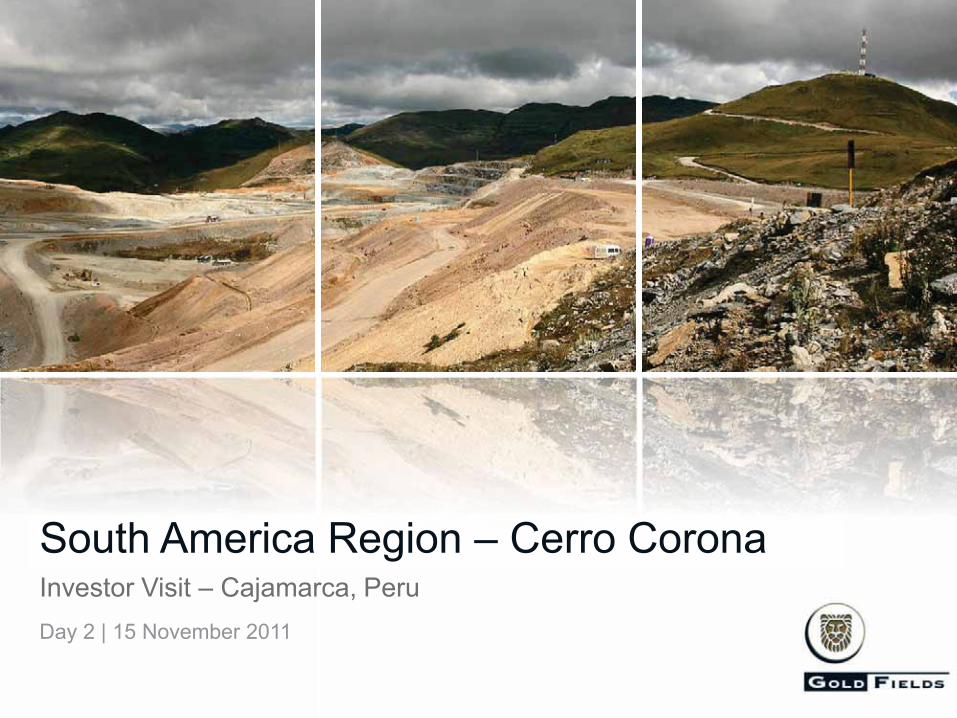
Investor Visit – Cajamarca, Peru South America Region – Cerro Corona
Day 2 | 15 November 2011

Forward Looking Statements
Certain statements in this document constitute “forward looking statements” within the meaning of Section 27A of the US
Securities Act of 1933 and Section 21E of the US Securities Exchange Act of 1934.
Such forward looking statements involve known and unknown risks, uncertainties and other important factors that could cause
the actual results, performance or achievements of the company to be materially different from the future results, performance
or achievements expressed or implied by such forward looking statements. Such risks, uncertainties and other important
factors include among others: economic, business and political conditions in South Africa, Ghana, Australia, Peru and
elsewhere; the ability to achieve anticipated efficiencies and other cost savings in connection with past and future acquisitions,
exploration and development activities; decreases in the market price of gold and/or copper; hazards associated with
underground and surface gold mining; labour disruptions; availability terms and deployment of capital or credit; changes in
government regulations, particularly environmental regulations; and new legislation affecting mining and mineral rights;
changes in exchange rates; currency devaluations; inflation and other macro-economic factors, industrial action, temporary
stoppages of mines for safety and unplanned maintenance reasons; and the impact of the AIDS crisis in South Africa. These
forward looking statements speak only as of the date of this document.
The company undertakes no obligation to update publicly or release any revisions to these forward looking statements to
reflect events or circumstances after the date of this document or to reflect the occurrence of unanticipated events.
2
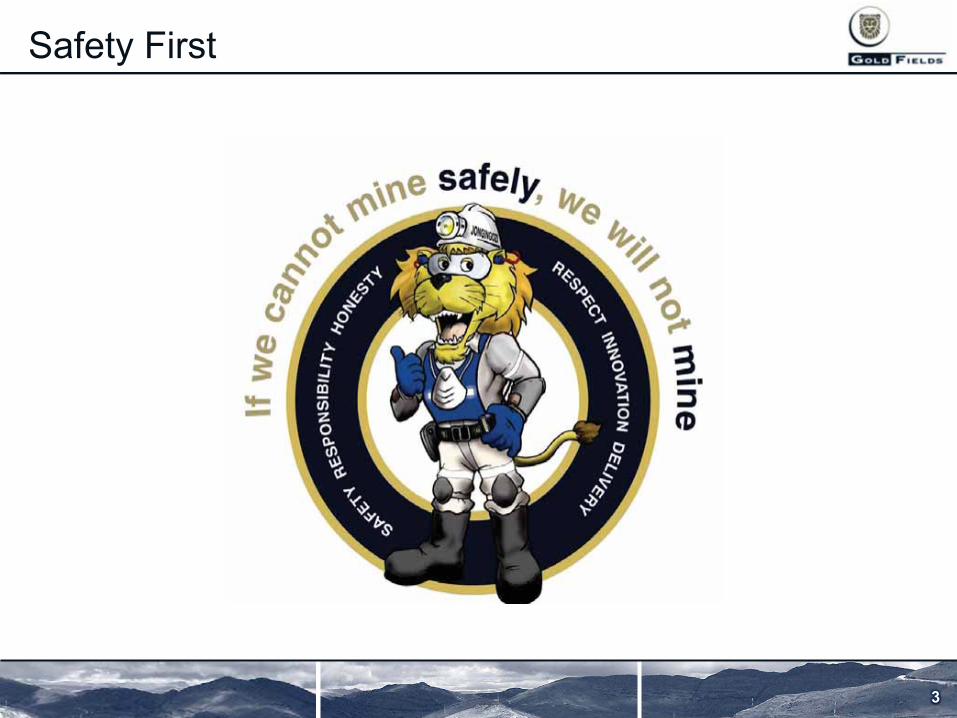
Safety First
3
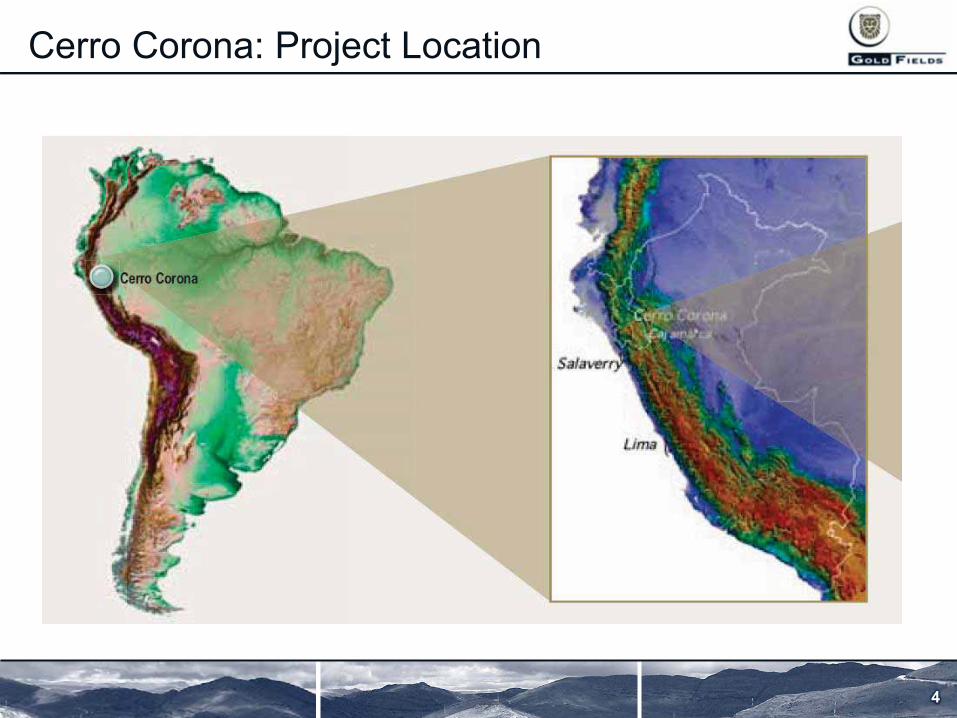
Cerro Corona: Project Location
4
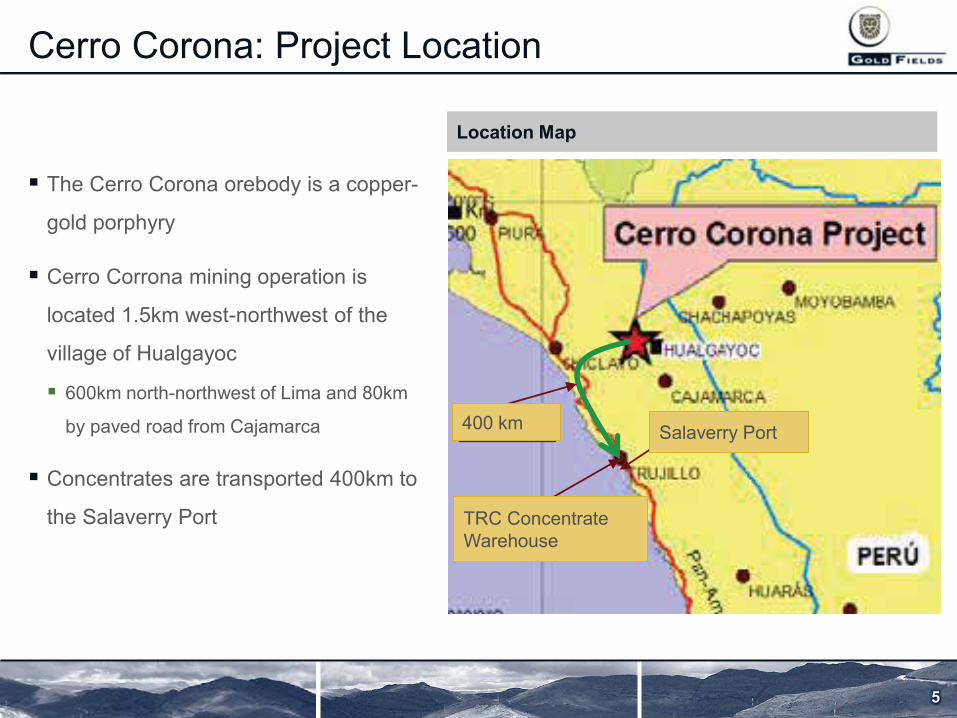
Cerro Corona: Project Location
� The Cerro Corona orebody is a copper-
gold porphyry
� Cerro Corrona mining operation is
located 1.5km west-northwest of the
village of Hualgayoc
� 600km north-northwest of Lima and 80km
by paved road from Cajamarca
� Concentrates are transported 400km to
the Salaverry Port
5
Salaverry Port
TRC Concentratewarehouse
250 Km400 km
TRC Concentrate Warehouse
Salaverry Port
Location Map
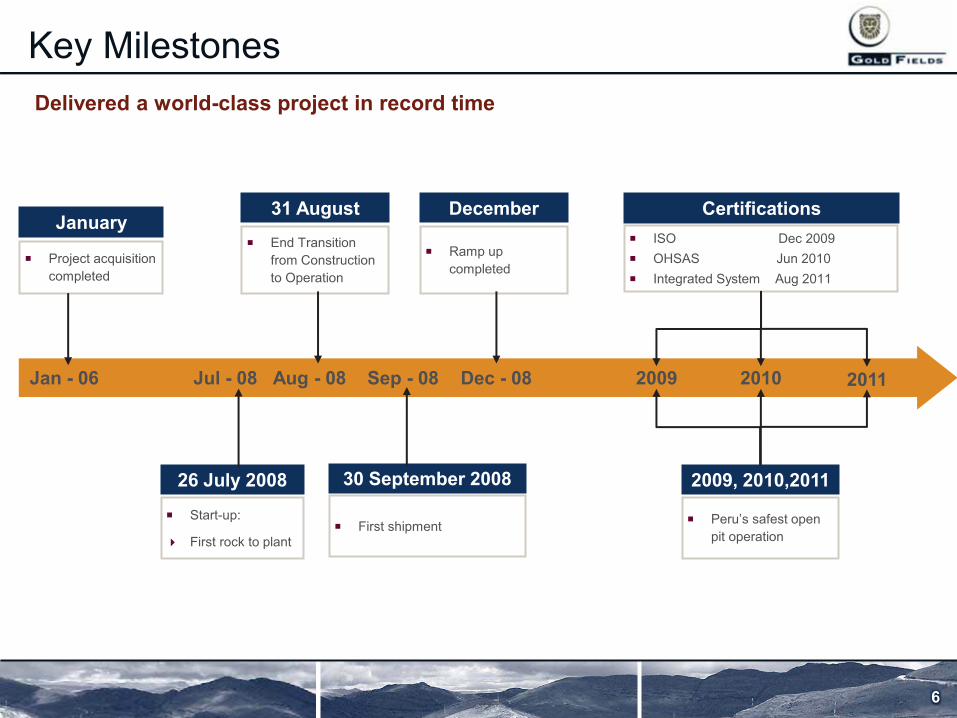
Key Milestones
6
Delivered a world-class project in record time
26 July 2008
� Start-up:
� First rock to plant
Jul - 08 Aug - 08 Sep - 08 2009 Jan - 06
January
� Project acquisition completed
31 August � End Transition
from Construction to Operation
30 September 2008
� First shipment
December � ISO Dec 2009 � OHSAS Jun 2010 � Integrated System Aug 2011
Dec - 08
� Ramp up completed
Certifications
2009, 2010,2011
� Peru’s safest open pit operation
2010 2011
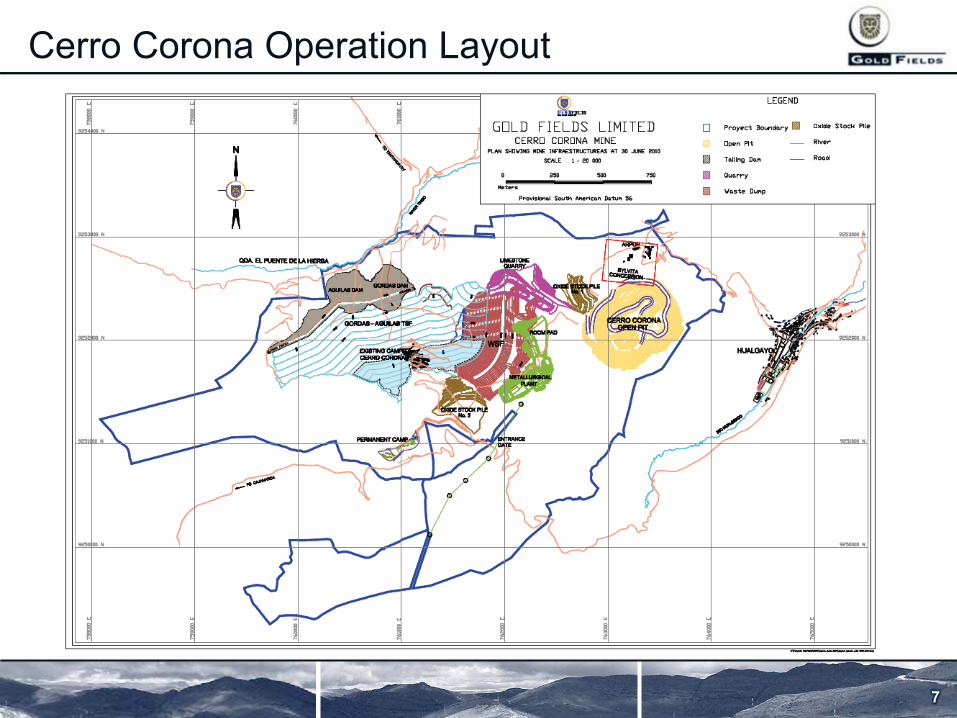
Cerro Corona Operation Layout
7
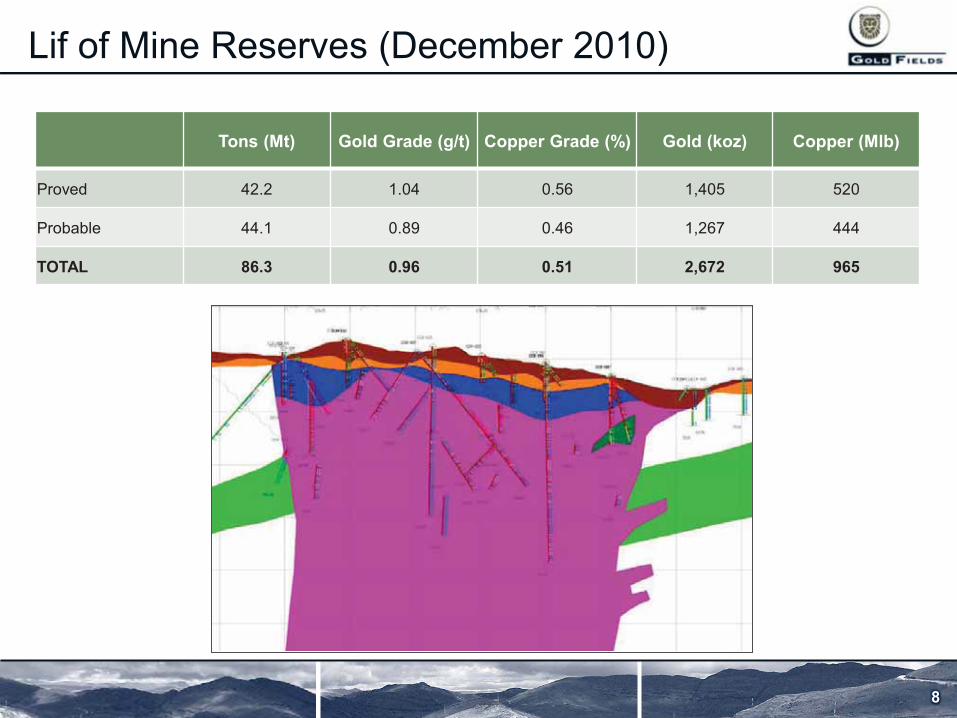
Lif of Mine Reserves (December 2010)
Tons (Mt) Gold Grade (g/t) Copper Grade (%) Gold (koz) Copper (Mlb)
Proved 42.2 1.04 0.56 1,405 520
Probable 44.1 0.89 0.46 1,267 444
TOTAL 86.3 0.96 0.51 2,672 965
8
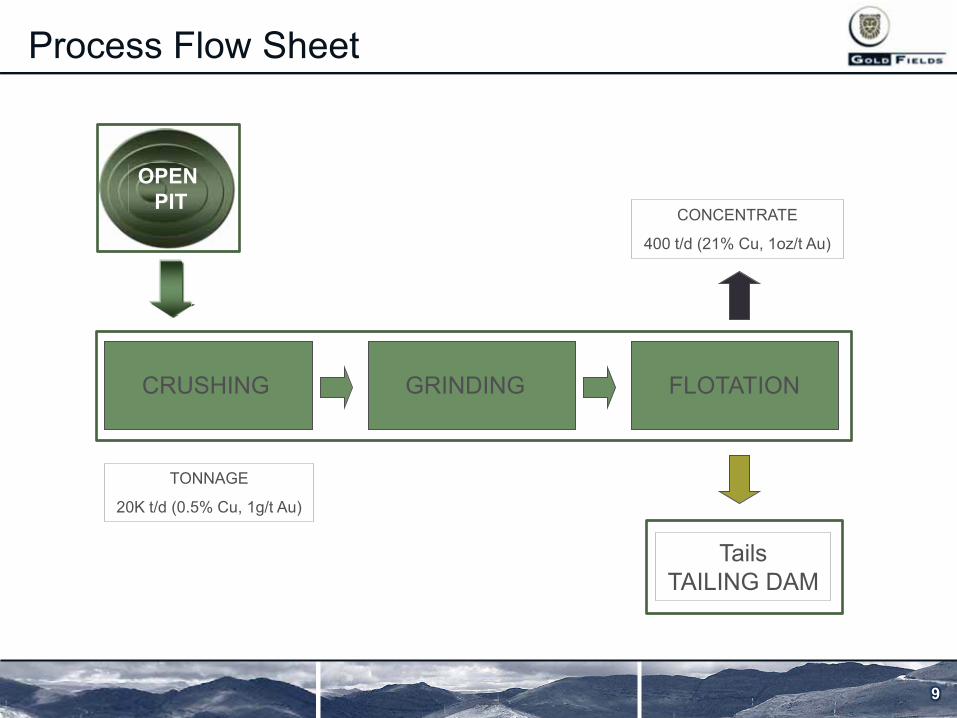
CRUSHING GRINDING FLOTATION
CONCENTRATE
400 t/d (21% Cu, 1oz/t Au)
Tails TAILING DAM
TONNAGE
20K t/d (0.5% Cu, 1g/t Au)
OPEN PIT
Process Flow Sheet
9
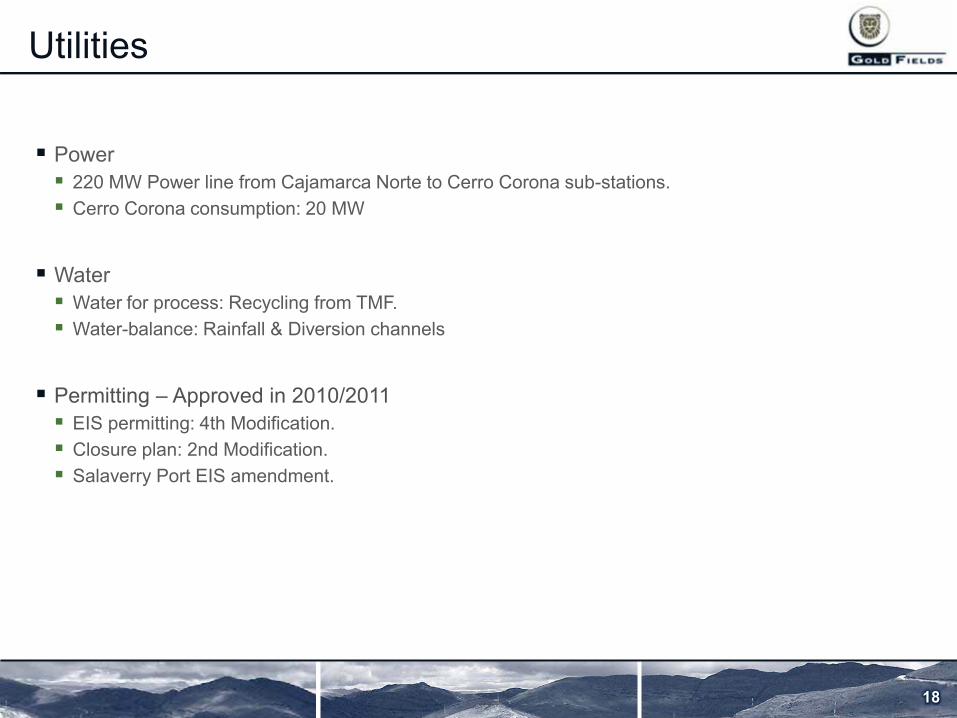
Utilities
� Power � 220 MW Power line from Cajamarca Norte to Cerro Corona sub-stations. � Cerro Corona consumption: 20 MW
� Water � Water for process: Recycling from TMF. � Water-balance: Rainfall & Diversion channels
� Permitting – Approved in 2010/2011 � EIS permitting: 4th Modification. � Closure plan: 2nd Modification. � Salaverry Port EIS amendment.
18
0
1
0 0 0 0 0 0 0
1
Jun-
09
Sep-
09
Dec
-09
Mar
-10
Jun-
10
Sep-
10
Dec
-10
Mar
-11
Jun-
11
Sep-
11
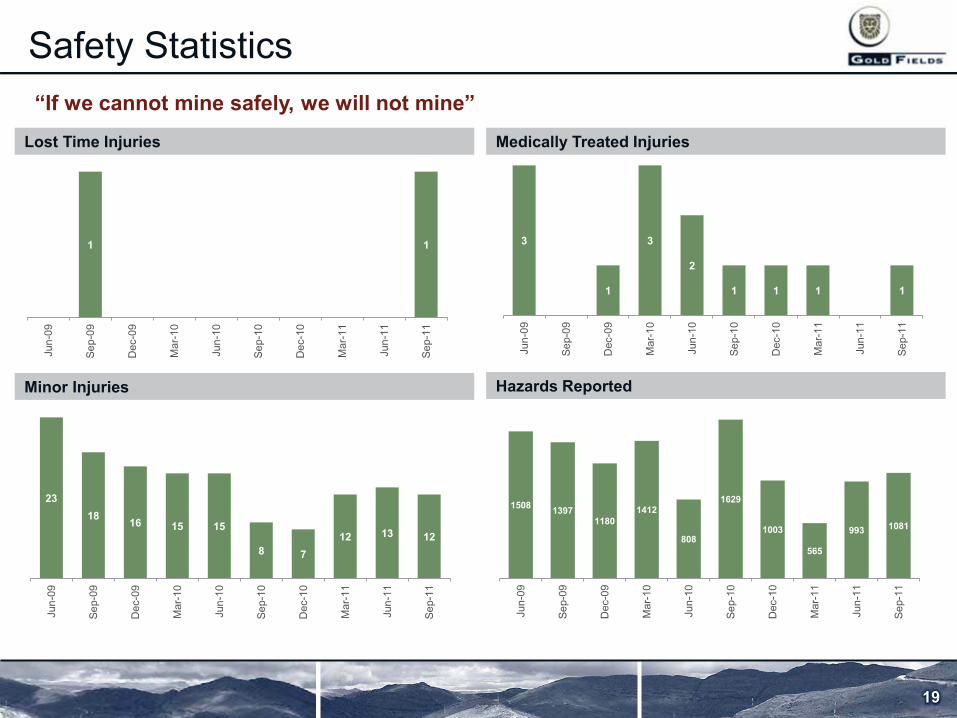
“If we cannot mine safely, we will not mine”
19
23 18 16 15 15
8 7 12 13 12
Jun-
09
Sep-
09
Dec
-09
Mar
-10
Jun-
10
Sep-
10
Dec
-10
Mar
-11
Jun-
11
Sep-
11
3
0 1
3
2
1 1 1 0
1
Jun-
09
Sep-
09
Dec
-09
Mar
-10
Jun-
10
Sep-
10
Dec
-10
Mar
-11
Jun-
11
Sep-
11
1508 1397 1180
1412
808
1629
1003
565
993 1081 Ju
n-09
Sep-
09
Dec
-09
Mar
-10
Jun-
10
Sep-
10
Dec
-10
Mar
-11
Jun-
11
Sep-
11
Lost Time Injuries Medically Treated Injuries
Minor Injuries Hazards Reported
Safety Statistics
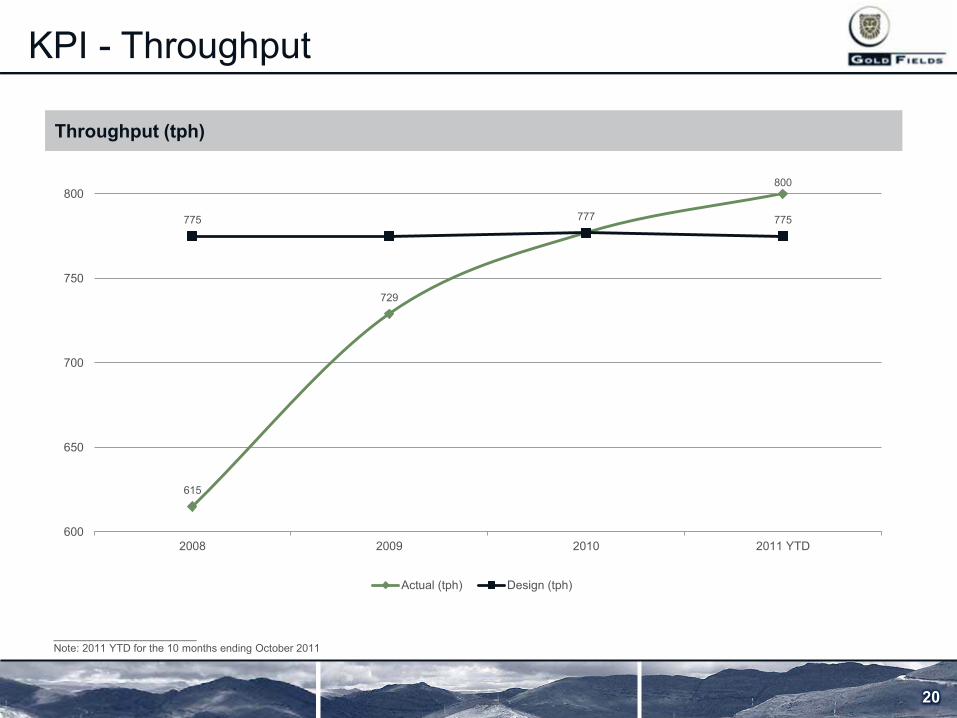
KPI - Throughput
Throughput (tph)
615
729
777
800
775 775
600
650
700
750
800
2008 2009 2010 2011 YTD
Actual (tph) Design (tph)
________________________ Note: 2011 YTD for the 10 months ending October 2011
20
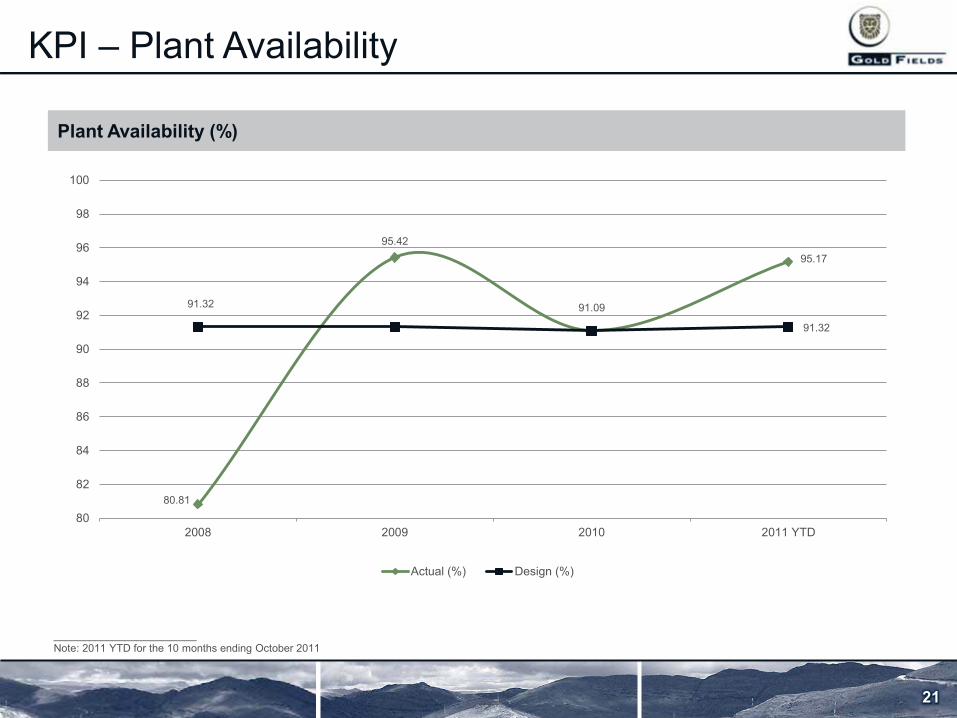
KPI – Plant Availability
Plant Availability (%)
________________________ Note: 2011 YTD for the 10 months ending October 2011
80.81
95.42
91.09
95.17
91.32
91.32
80
82
84
86
88
90
92
94
96
98
100
2008 2009 2010 2011 YTD
Actual (%) Design (%)
21
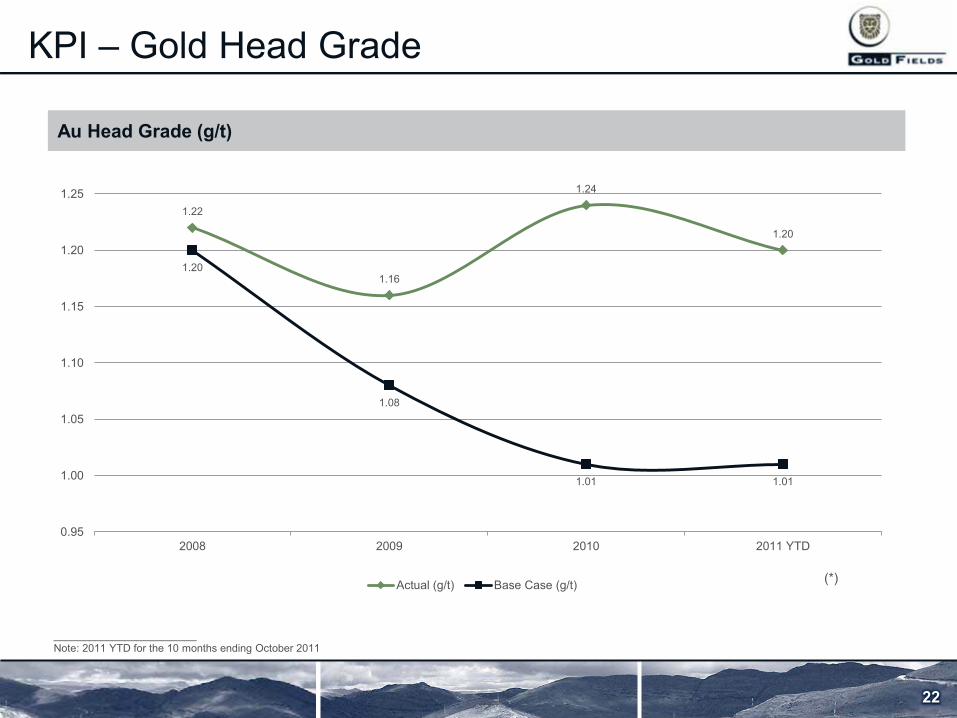
KPI – Gold Head Grade
Au Head Grade (g/t)
(*)
1.22
1.16
1.24
1.20
1.20
1.08
1.01 1.01
0.95
1.00
1.05
1.10
1.15
1.20
1.25
2008 2009 2010 2011 YTD
Actual (g/t) Base Case (g/t)
________________________ Note: 2011 YTD for the 10 months ending October 2011
22
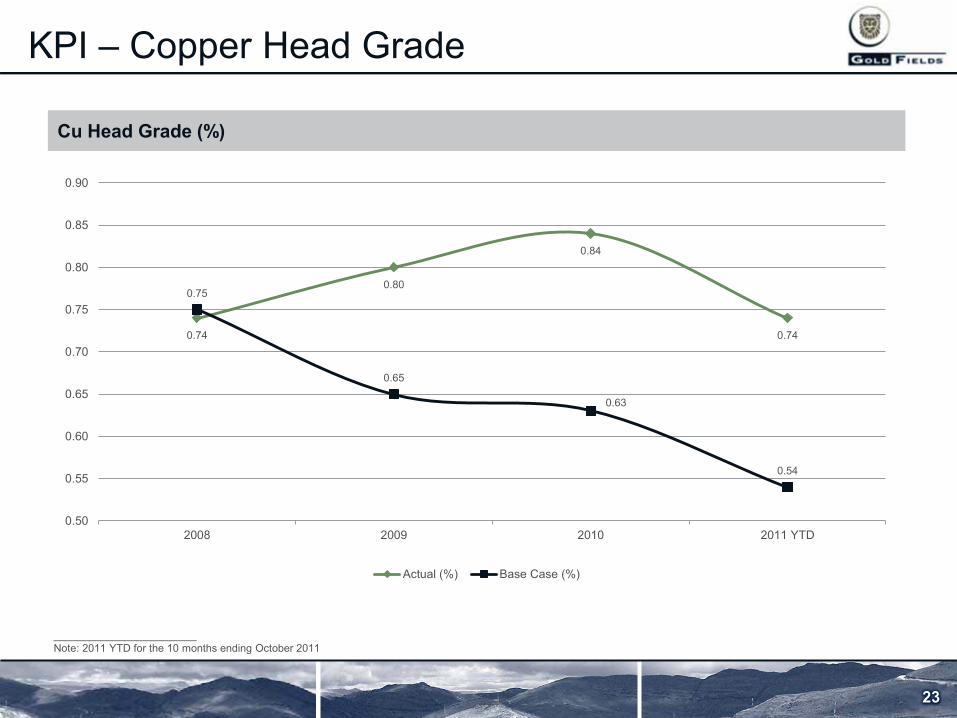
KPI – Copper Head Grade
Cu Head Grade (%)
0.74
0.80
0.84
0.74
0.75
0.65
0.63
0.54
0.50
0.55
0.60
0.65
0.70
0.75
0.80
0.85
0.90
2008 2009 2010 2011 YTD
Actual (%) Base Case (%)
________________________ Note: 2011 YTD for the 10 months ending October 2011
23
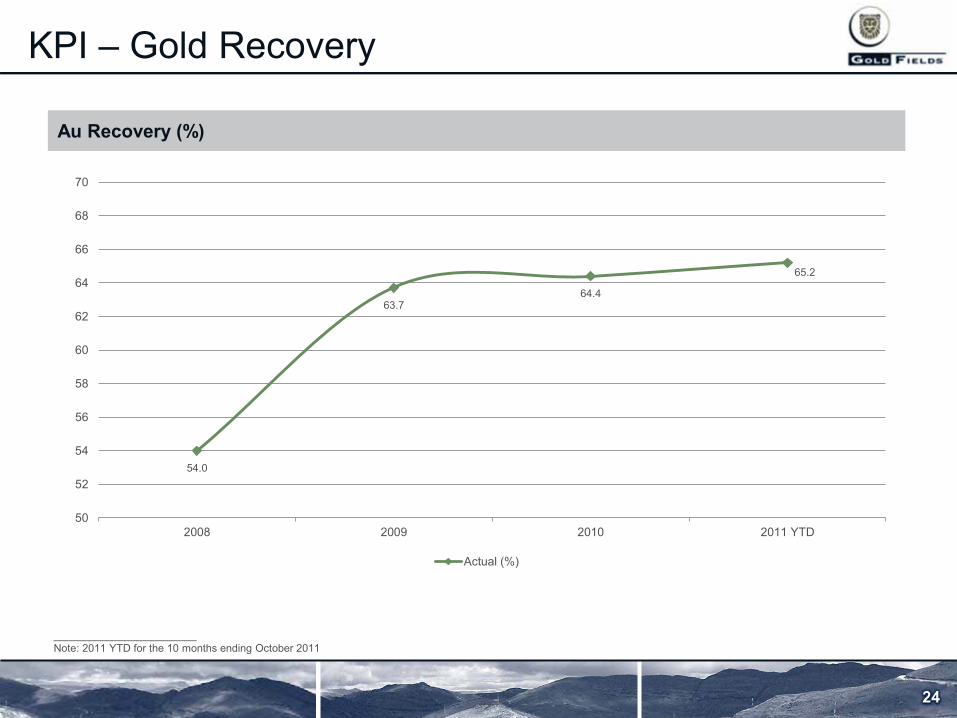
KPI – Gold Recovery
Au Recovery (%)
54.0
63.7 64.4
65.2
50
52
54
56
58
60
62
64
66
68
70
2008 2009 2010 2011 YTD
Actual (%)
________________________ Note: 2011 YTD for the 10 months ending October 2011
24
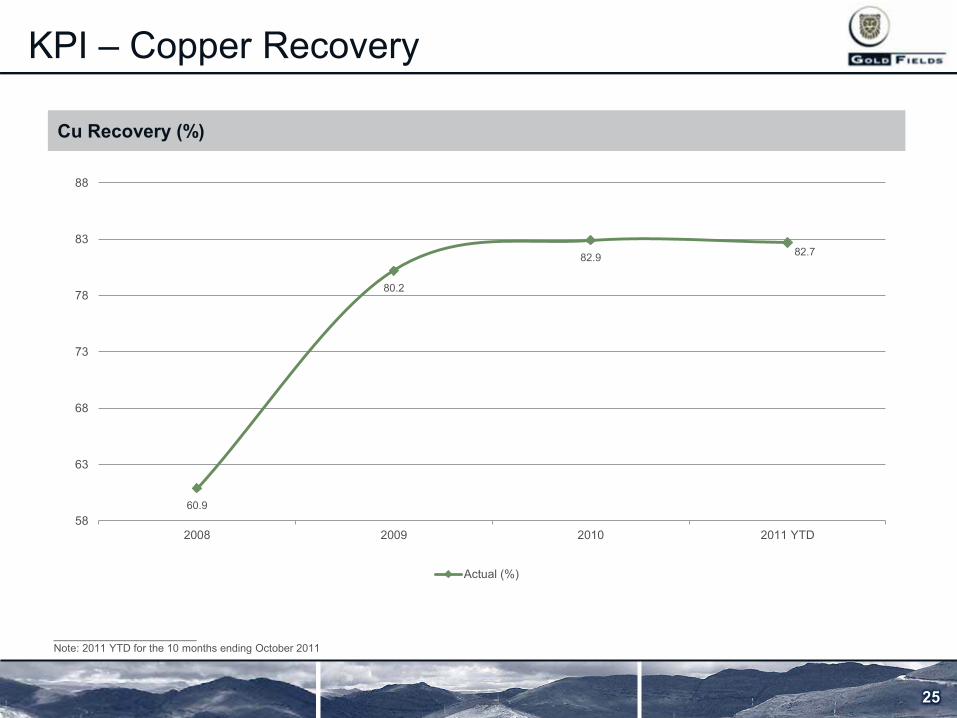
KPI – Copper Recovery
Cu Recovery (%)
60.9
80.2
82.9 82.7
58
63
68
73
78
83
88
2008 2009 2010 2011 YTD
Actual (%)
________________________ Note: 2011 YTD for the 10 months ending October 2011
25
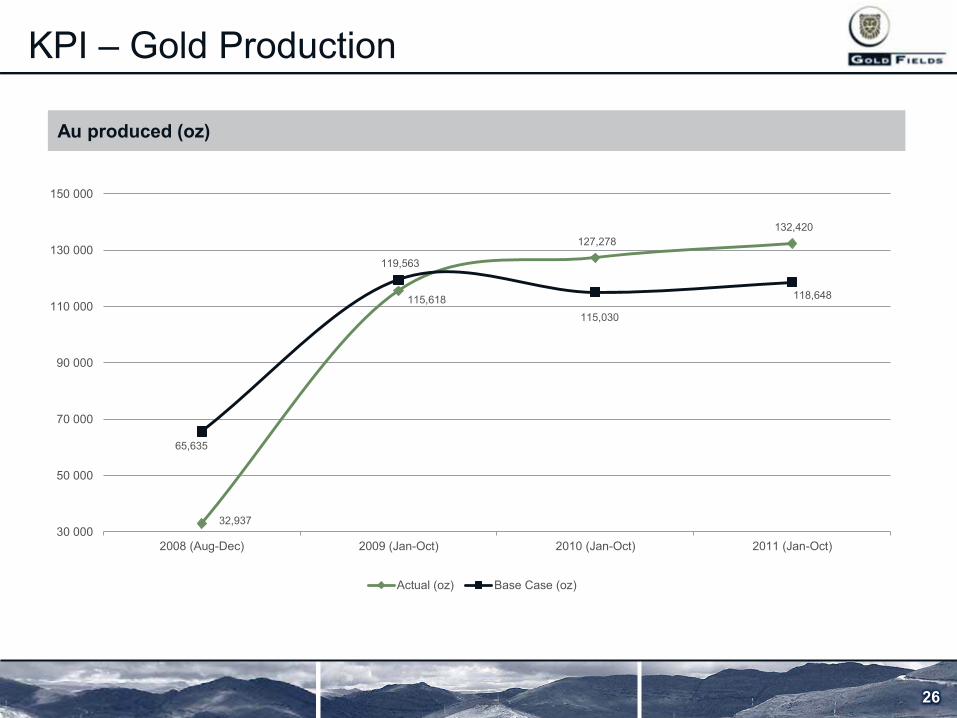
KPI – Gold Production
Au produced (oz)
32,937
115,618
127,278 132,420
65,635
119,563
115,030
118,648
30 000
50 000
70 000
90 000
110 000
130 000
150 000
2008 (Aug-Dec) 2009 (Jan-Oct) 2010 (Jan-Oct) 2011 (Jan-Oct)
Actual (oz) Base Case (oz)
26
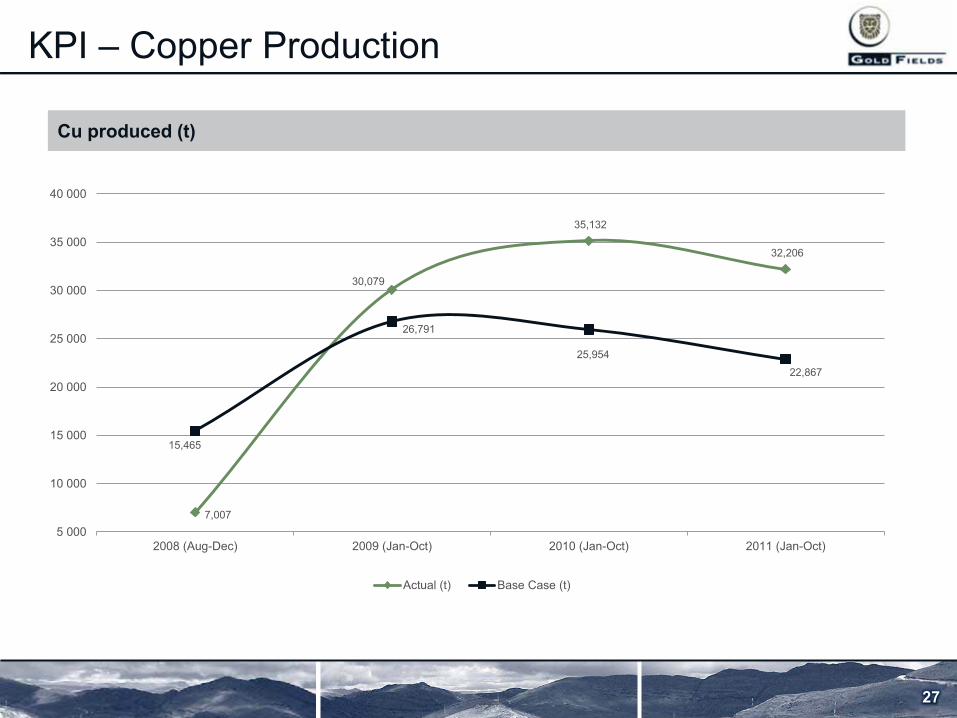
KPI – Copper Production
Cu produced (t)
7,007
30,079
35,132
32,206
15,465
26,791
25,954
22,867
5 000
10 000
15 000
20 000
25 000
30 000
35 000
40 000
2008 (Aug-Dec) 2009 (Jan-Oct) 2010 (Jan-Oct) 2011 (Jan-Oct)
Actual (t) Base Case (t)
27
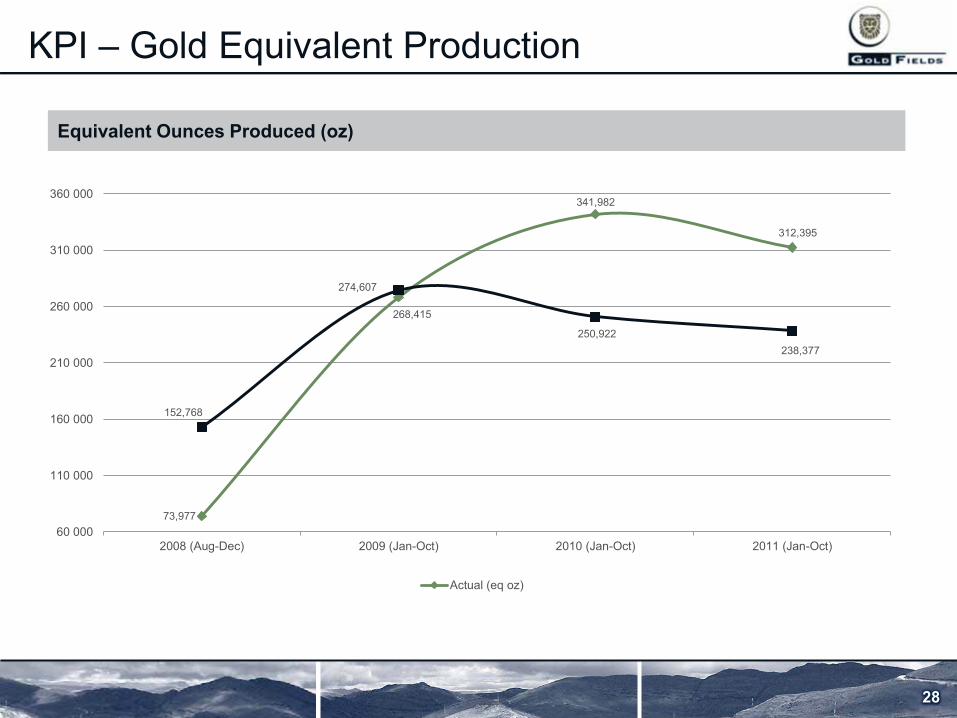
KPI – Gold Equivalent Production
Equivalent Ounces Produced (oz)
73,977
268,415
341,982
312,395
152,768
274,607
250,922 238,377
60 000
110 000
160 000
210 000
260 000
310 000
360 000
2008 (Aug-Dec) 2009 (Jan-Oct) 2010 (Jan-Oct) 2011 (Jan-Oct)
Actual (eq oz)
28
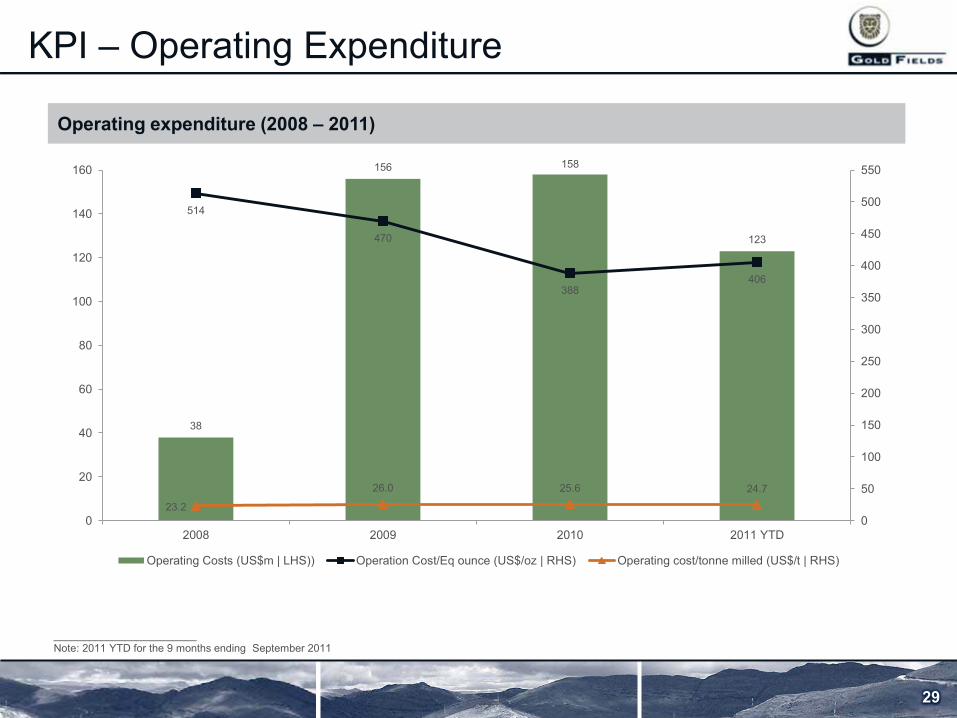
KPI – Operating Expenditure
Operating expenditure (2008 – 2011)
38
156 158
123
514
470
388 406
23.2
26.0 25.6 24.7
0
50
100
150
200
250
300
350
400
450
500
550
0
20
40
60
80
100
120
140
160
2008 2009 2010 2011 YTD
Operating Costs (US$m | LHS)) Operation Cost/Eq ounce (US$/oz | RHS) Operating cost/tonne milled (US$/t | RHS)
________________________ Note: 2011 YTD for the 9 months ending September 2011
29

KPI – Captital Expenditure
Capital expenditure (2008 – 2011)
244
85
70
49
3292
257 172 162
0
400
800
1200
1600
2000
2400
2800
3200
3600
0
50
100
150
200
250
300
2008 2009 2010 2011 YTD
Capex (US$m | LHS) Capex/Eq ounce (US$/oz | RHS)
________________________ Note: 2011 YTD for the 9 months ending September 2011
30
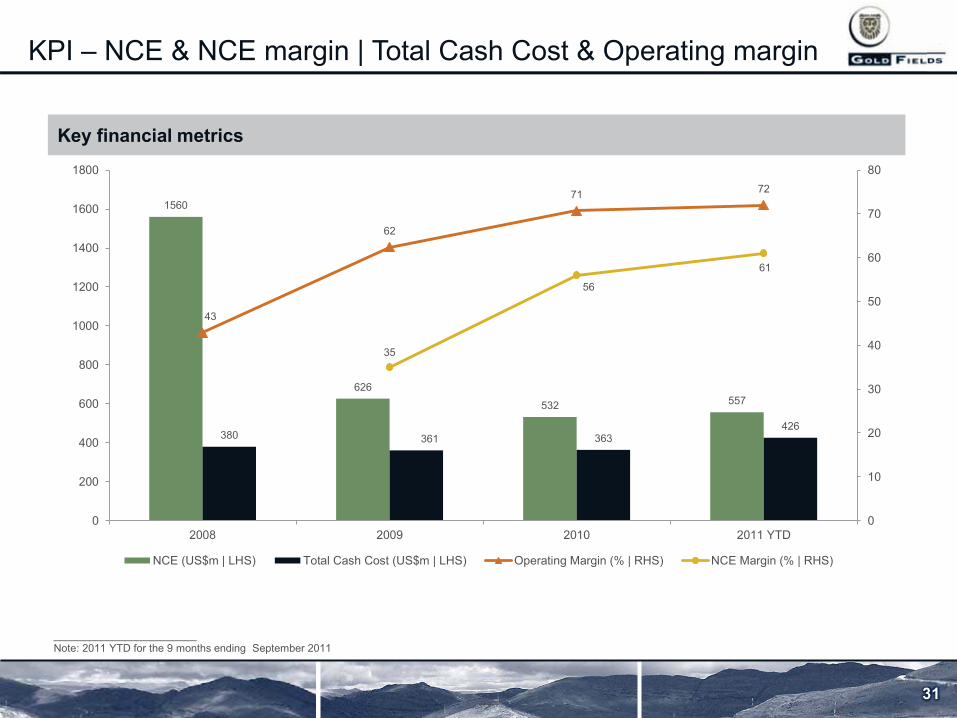
Key financial metrics
KPI – NCE & NCE margin | Total Cash Cost & Operating margin
1560
626
532 557
380 361 363 426
43
62
71 72
35
56
61
0
10
20
30
40
50
60
70
80
0
200
400
600
800
1000
1200
1400
1600
1800
2008 2009 2010 2011 YTD
NCE (US$m | LHS) Total Cash Cost (US$m | LHS) Operating Margin (% | RHS) NCE Margin (% | RHS)
________________________ Note: 2011 YTD for the 9 months ending September 2011
31
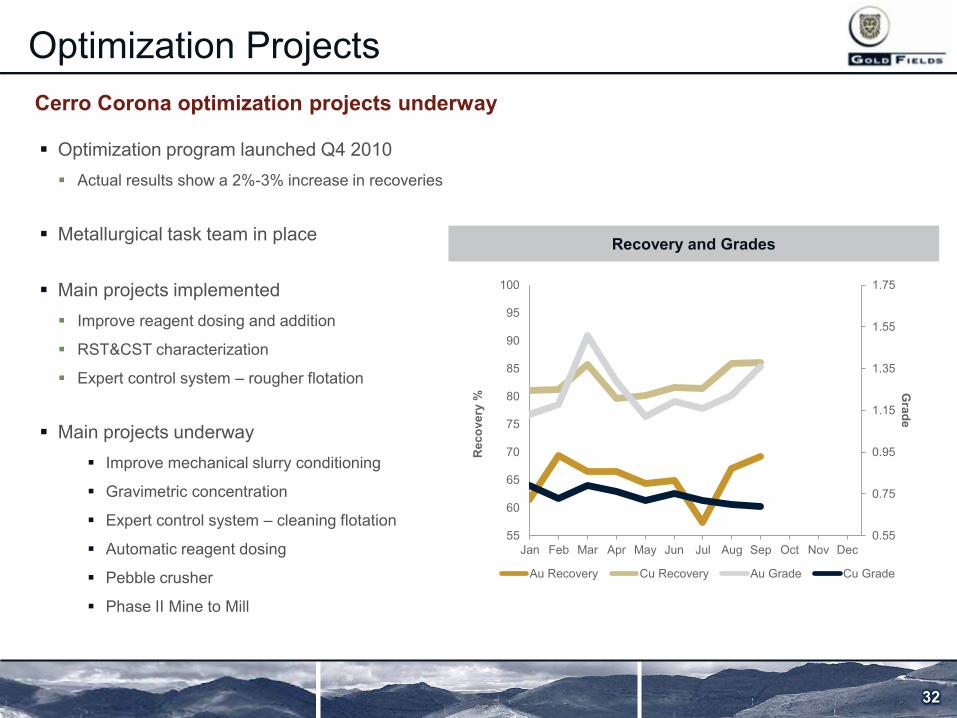
Optimization Projects
32
� Optimization program launched Q4 2010 � Actual results show a 2%-3% increase in recoveries
� Metallurgical task team in place
� Main projects implemented � Improve reagent dosing and addition
� RST&CST characterization
� Expert control system – rougher flotation
� Main projects underway � Improve mechanical slurry conditioning
� Gravimetric concentration
� Expert control system – cleaning flotation
� Automatic reagent dosing
� Pebble crusher
� Phase II Mine to Mill
Cerro Corona optimization projects underway
0.55
0.75
0.95
1.15
1.35
1.55
1.75
55
60
65
70
75
80
85
90
95
100
Jan Feb Mar Apr May Jun Jul Aug Sep Oct Nov Dec
Grade
Rec
over
y %
Au Recovery Cu Recovery Au Grade Cu Grade
Recovery and Grades
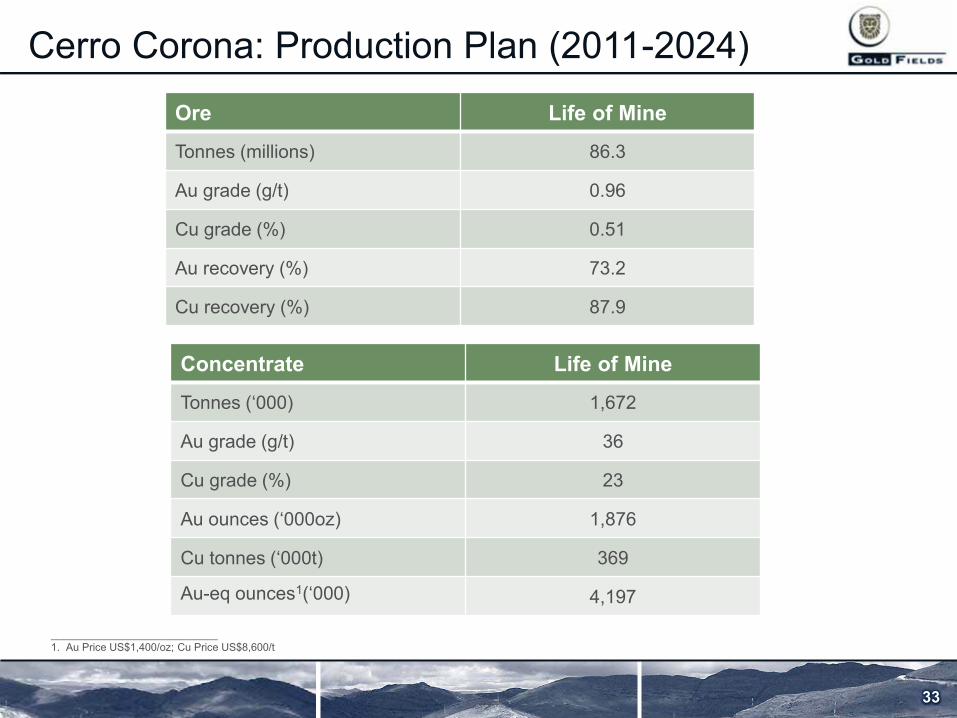
Cerro Corona: Production Plan (2011-2024)
Ore Life of Mine
Tonnes (millions) 86.3
Au grade (g/t) 0.96
Cu grade (%) 0.51
Au recovery (%) 73.2
Cu recovery (%) 87.9
33
Concentrate Life of Mine
Tonnes (‘000) 1,672
Au grade (g/t) 36
Cu grade (%) 23
Au ounces (‘000oz) 1,876
Cu tonnes (‘000t) 369
Au-eq ounces1(‘000) 4,197
____________________________ 1. Au Price US$1,400/oz; Cu Price US$8,600/t
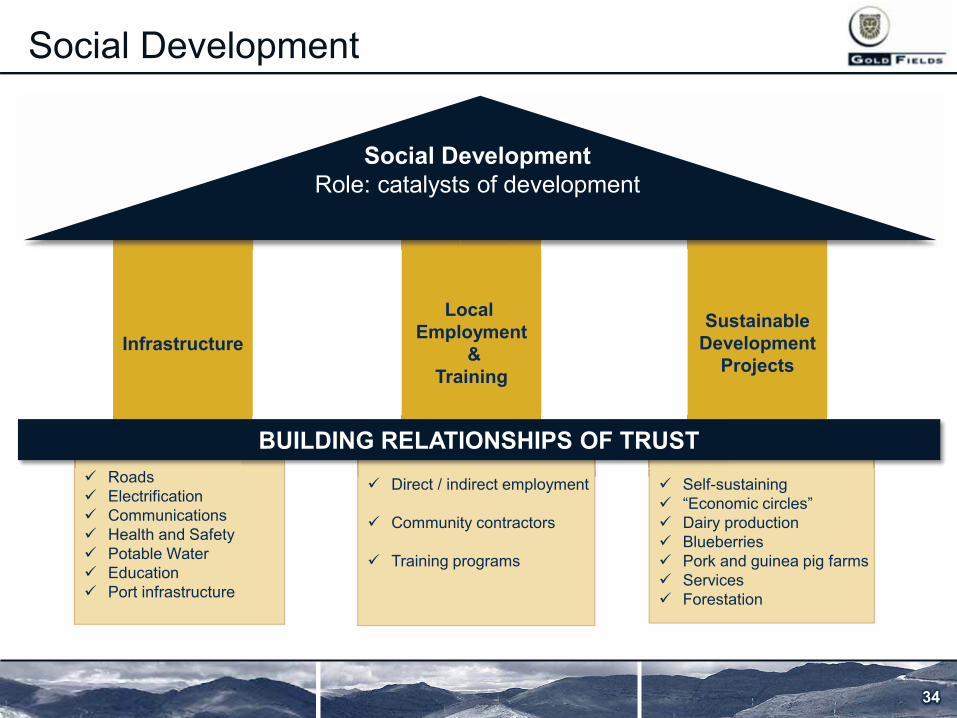
� Direct / indirect employment
� Community contractors
� Training programs
Social Development
34
Infrastructure
Local Employment
& Training
Sustainable Development
Projects
� Roads � Electrification � Communications � Health and Safety � Potable Water � Education � Port infrastructure
� Self-sustaining � “Economic circles” � Dairy production � Blueberries � Pork and guinea pig farms � Services � Forestation
Social Development Role: catalysts of development
BUILDING RELATIONSHIPS OF TRUST
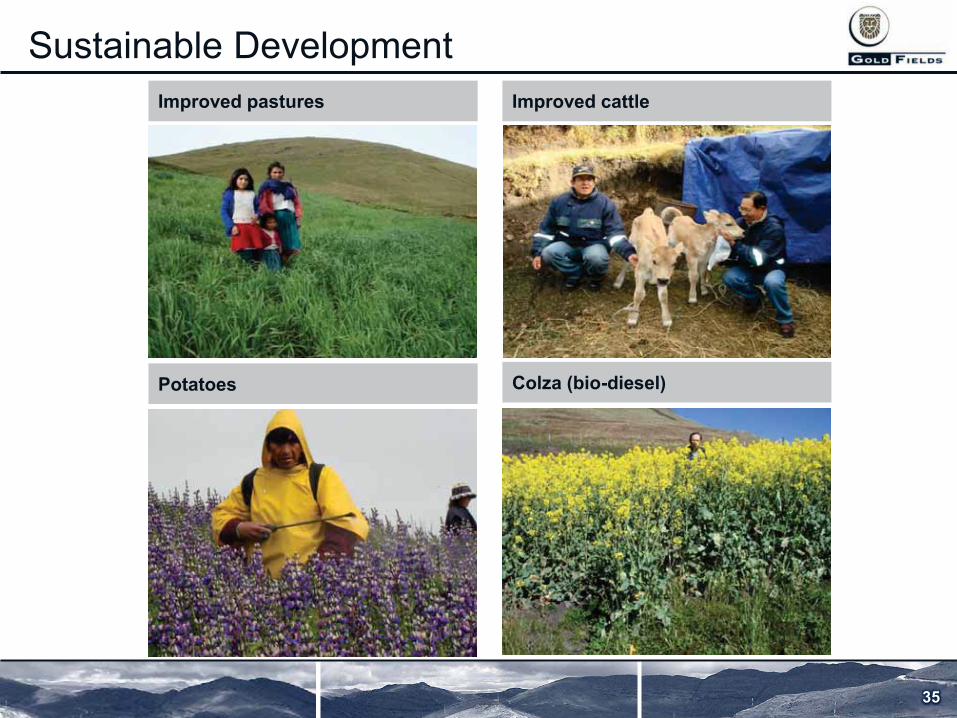
Improved pastures
Sustainable Development Improved pastures Improved cattle
Potatoes Colza (bio-diesel)
35
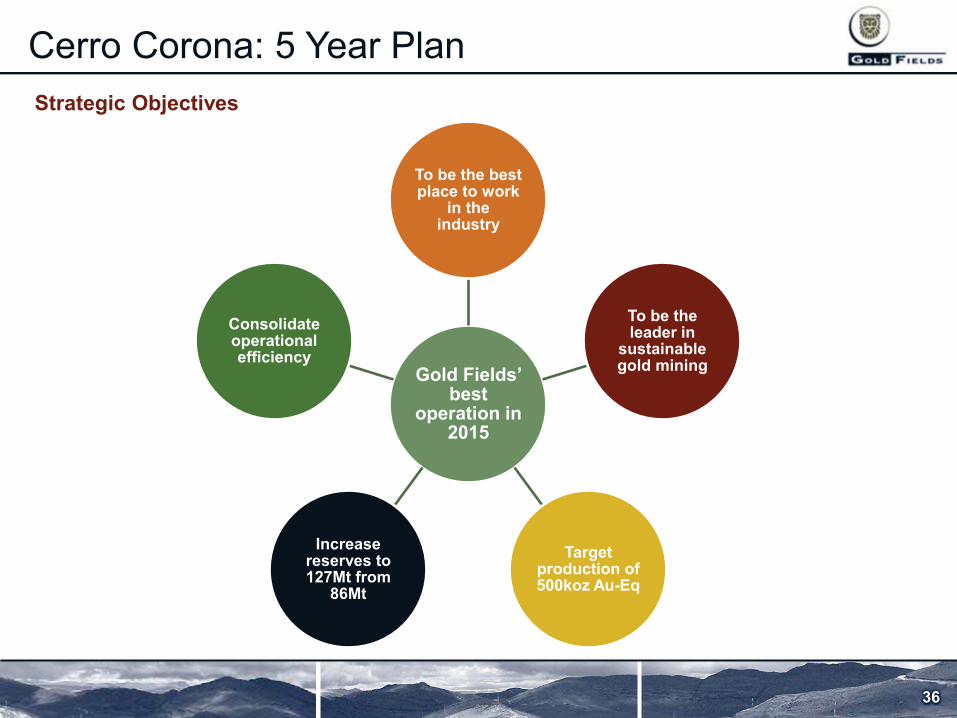
Cerro Corona: 5 Year Plan
36
Strategic Objectives
Gold Fields’ best
operation in 2015
To be the best place to work
in the industry
To be the leader in
sustainable gold mining
Target production of 500koz Au-Eq
Increase reserves to 127Mt from
86Mt
Consolidate operational efficiency
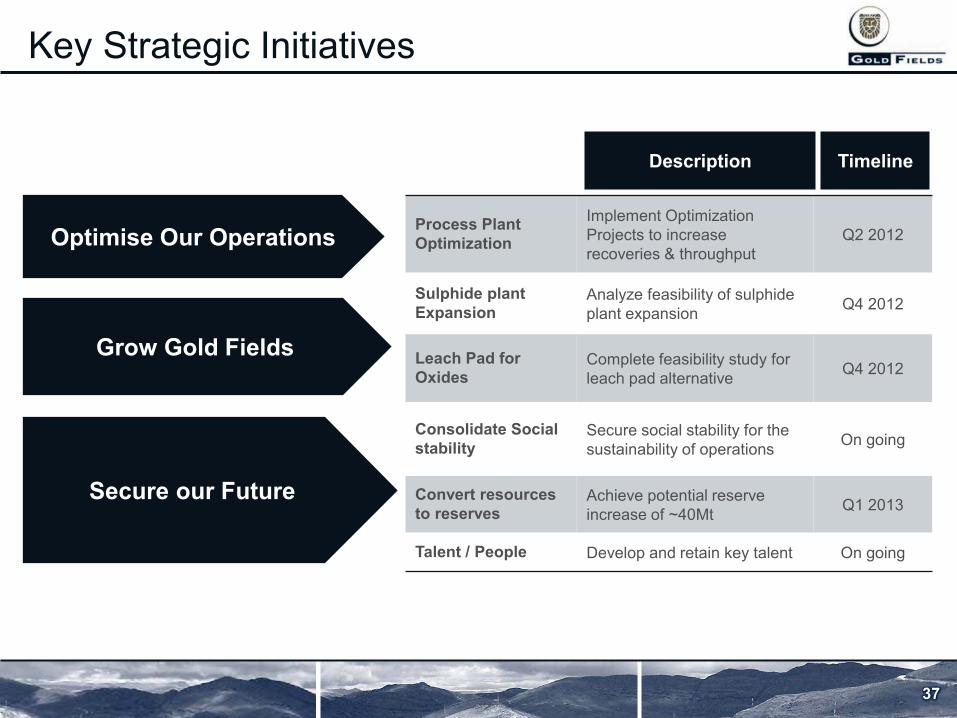
Process Plant Optimization
Implement Optimization Projects to increase recoveries & throughput
Q2 2012
Sulphide plant Expansion
Analyze feasibility of sulphide plant expansion Q4 2012
Leach Pad for Oxides
Complete feasibility study for leach pad alternative Q4 2012
Consolidate Social stability
Secure social stability for the sustainability of operations On going
Convert resources to reserves
Achieve potential reserve increase of ~40Mt Q1 2013
Talent / People Develop and retain key talent On going
Description Timeline
Optimise Our Operations
Grow Gold Fields
Secure our Future
Key Strategic Initiatives
37
Questions?
Related Documents