The Astronomical Journal, 137:3619–3631, 2009 March doi:10.1088/0004-6256/137/3/3619 c 2009. The American Astronomical Society. All rights reserved. Printed in the U.S.A. CEPHEID VARIABLE STARSIN THEPEGASUS DWARF IRREGULAR GALAXY: CONSTRAINTS ON THE STAR FORMATION HISTORY I. Meschin 1 , C. Gallart 1 , A. Aparicio 1 , S. Cassisi 2 , and A. Rosenberg 1 1 Instituto de Astrof´ ısica de Canarias, E-38200 La Laguna, Canary Island, Spain; [email protected], [email protected], [email protected], [email protected] 2 INAF-Osservatorio Astronomico di Teramo, via M. Maggini, 64100 Teramo, Italy; [email protected] Received 2007 December 4; accepted 2008 December 26; published 2009 February 23 ABSTRACT Observations of the resolved stars obtained over a period of 11 years in the Local Group dwarf irregular galaxy Pegasus have been used to search for Cepheid variable stars. Images were obtained in 55 epochs in the V band and in 24 epochs in the I band. We have identified 26 Cepheids and have obtained their light curves and periods. On the basis of their position in the period-luminosity (PL) diagram, we have classified them as 18 fundamental modes and eight first overtone Cepheids. Two PL relations for Cepheids have been used to derive the distance, resulting in 1.07 ± 0.05 Mpc. We present the VARFINDER code which finds the variable stars and their predicted periods in a given synthetic color–magnitude diagram computed with IAC-star and we propose the use of the Cepheid population as a constraint of the star formation history of Pegasus. Key words: Cepheids – galaxies: dwarf – galaxies: individual (Pegasus, DDO 216) – galaxies: stellar content Online-only material: color figure 1. INTRODUCTION Nearby galaxies with resolved stars are interesting because their star formation history (SFH) can be directly determined from the color–magnitude diagram (CMD). The ideal case is when the oldest turnoff of the main sequence (MS) is observed. In this case, the SFH can be obtained from the distribution of stars in the MS. From shallower data—for example, data just a couple of magnitudes below the tip of the red giant branch (TRGB)—an estimate of the star formation rate (SFR) averaged over age 1 Gyr, plus a direct estimate of the young SFR (few hundred Myr) directly from stars in the MS and the blue loops is possible. In this case, a potential complementary indicator of the SFH is Cepheid variable stars (age 300 Myr), since the number of observed Cepheids can be compared to the number of them in synthetic populations computed under the assumption of different SFHs. A more common use of Cepheid variables is as distance indicators (Madore & Freedman 1991; Macri et al. 2006). For nearby galaxies, the distance inferred from the Cepheid period– luminosity (PL) relation can be compared with other distance indicators like the TRGB method (Lee et al. 1993; Salaris & Cassisi 1998; Dolphin et al. 2001; Rizzi et al. 2007). Pegasus (DDO 216) is among the faint dwarf irregular galax- ies of the Local Group. Even though it was discovered in the 1950s by A. Wilson (see Holmberg 1958), it was not recognized as a nearby galaxy and a possible member of the Local Group un- til Fisher & Tully (1975) detected its H i and measured its radial velocity. The main properties of this dwarf galaxy are summa- rized in Table 1. Concerning its structural properties, Pegasus presents an interesting structural combination of a dwarf irregu- lar system, with a chaotic appearance due to star formation, and that of a relatively symmetric dwarf spheroidal galaxy. Pegasus presents a smooth outer envelope with elliptical isophotes and a brighter nucleus with at least two OB associations (Ivanov 1996). In addition, this galaxy retains a low amount of gas as indicated by its moderate—for a dwarf irregular galaxy— M HI /L V ≈ 0.4 ratio (Hoffman et al. 1996; Mateo 1998). This empirical evidence seems to indicate that Pegasus might, indeed, be a nearby example of a transition object between dwarf galaxies showing strong ongoing star formation and those dis- closing clear signatures of a past star formation only. Quite recently, McConnachie et al. (2007) have provided strong indi- cations that Pegasus is undergoing ram pressure stripping. The quoted authors consider this result an evidence for the presence of an intergalactic medium (IGM) associated with the Local Group. The first CCD CMD analysis of Pegasus made by Hoessel & Mould (1982) set the galaxy well outside the Lo- cal Group at a distance of about 1.7 Mpc. Hoessel et al. (1990) confirmed this distance determination by using a few newly identified Cepheids. However, Aparicio (1994) derived a new distance estimate of 955 ± 44 Kpc, i.e., about a factor of 2 lower than the previous determinations using the I magnitude of the TRGB. In an attempt to reveal the origin of this large discrepancy in the two different distance determinations, Aparicio (1994) showed that the variable stars identified by Hoessel et al. (1990) as Cepheids, had a CMD location largely discrepant with respect to the location of the Cepheid instability strip boundaries. This result called for a re-analysis of the variable star population in Pegasus. Concerning the investigation of the SFH in Pegasus, the only studies performed until now are those of Aparicio & Gallart (1995) and Gallagher et al. (1998) on the basis of ground- based photometry and Hubble Space Telescope (HST) WFPC2 data, respectively. From an analysis through synthetic CMDs, Aparicio & Gallart (1995) found that Pegasus shows scarce star formation activity over the last 100 Myr, although the youngest stars may be as young as 10 Myr. The largest stellar population in Pegasus was found to be older than 10 Gyr. On the basis of the red giant branch (RGB) morphology, Aparicio & Gallart (1995) put an upper limit of about Z ≈ 0.008 the metallicity of this galaxy. The more recent analysis performed by Gallagher et al. (1998) largely confirmed the previous work of Aparicio & Gallart (1995). However, they obtained a shorter distance; the main reason for this change was the larger—more than a factor of 2—reddening adopted by these authors and a significantly lower value (Z ≈ 0.001) for the mean metallicity. In addition, 3619

Welcome message from author
This document is posted to help you gain knowledge. Please leave a comment to let me know what you think about it! Share it to your friends and learn new things together.
Transcript
The Astronomical Journal, 137:3619–3631, 2009 March doi:10.1088/0004-6256/137/3/3619c© 2009. The American Astronomical Society. All rights reserved. Printed in the U.S.A.
CEPHEID VARIABLE STARS IN THE PEGASUS DWARF IRREGULAR GALAXY: CONSTRAINTS ON THESTAR FORMATION HISTORY
I. Meschin1, C. Gallart
1, A. Aparicio
1, S. Cassisi
2, and A. Rosenberg
11 Instituto de Astrofısica de Canarias, E-38200 La Laguna, Canary Island, Spain; [email protected], [email protected], [email protected], [email protected]
2 INAF-Osservatorio Astronomico di Teramo, via M. Maggini, 64100 Teramo, Italy; [email protected] 2007 December 4; accepted 2008 December 26; published 2009 February 23
ABSTRACT
Observations of the resolved stars obtained over a period of 11 years in the Local Group dwarf irregulargalaxy Pegasus have been used to search for Cepheid variable stars. Images were obtained in 55 epochs inthe V band and in 24 epochs in the I band. We have identified 26 Cepheids and have obtained their lightcurves and periods. On the basis of their position in the period-luminosity (PL) diagram, we have classifiedthem as 18 fundamental modes and eight first overtone Cepheids. Two PL relations for Cepheids have beenused to derive the distance, resulting in 1.07 ± 0.05 Mpc. We present the VARFINDER code which finds thevariable stars and their predicted periods in a given synthetic color–magnitude diagram computed with IAC-starand we propose the use of the Cepheid population as a constraint of the star formation history of Pegasus.
Key words: Cepheids – galaxies: dwarf – galaxies: individual (Pegasus, DDO 216) – galaxies: stellar content
Online-only material: color figure
1. INTRODUCTION
Nearby galaxies with resolved stars are interesting becausetheir star formation history (SFH) can be directly determinedfrom the color–magnitude diagram (CMD). The ideal case iswhen the oldest turnoff of the main sequence (MS) is observed.In this case, the SFH can be obtained from the distribution ofstars in the MS. From shallower data—for example, data justa couple of magnitudes below the tip of the red giant branch(TRGB)—an estimate of the star formation rate (SFR) averagedover age � 1 Gyr, plus a direct estimate of the young SFR (fewhundred Myr) directly from stars in the MS and the blue loopsis possible. In this case, a potential complementary indicator ofthe SFH is Cepheid variable stars (age � 300 Myr), since thenumber of observed Cepheids can be compared to the number ofthem in synthetic populations computed under the assumptionof different SFHs.
A more common use of Cepheid variables is as distanceindicators (Madore & Freedman 1991; Macri et al. 2006). Fornearby galaxies, the distance inferred from the Cepheid period–luminosity (PL) relation can be compared with other distanceindicators like the TRGB method (Lee et al. 1993; Salaris &Cassisi 1998; Dolphin et al. 2001; Rizzi et al. 2007).
Pegasus (DDO 216) is among the faint dwarf irregular galax-ies of the Local Group. Even though it was discovered in the1950s by A. Wilson (see Holmberg 1958), it was not recognizedas a nearby galaxy and a possible member of the Local Group un-til Fisher & Tully (1975) detected its H i and measured its radialvelocity. The main properties of this dwarf galaxy are summa-rized in Table 1. Concerning its structural properties, Pegasuspresents an interesting structural combination of a dwarf irregu-lar system, with a chaotic appearance due to star formation, andthat of a relatively symmetric dwarf spheroidal galaxy. Pegasuspresents a smooth outer envelope with elliptical isophotes anda brighter nucleus with at least two OB associations (Ivanov1996). In addition, this galaxy retains a low amount of gasas indicated by its moderate—for a dwarf irregular galaxy—MH I/LV ≈ 0.4 ratio (Hoffman et al. 1996; Mateo 1998).This empirical evidence seems to indicate that Pegasus might,
indeed, be a nearby example of a transition object between dwarfgalaxies showing strong ongoing star formation and those dis-closing clear signatures of a past star formation only. Quiterecently, McConnachie et al. (2007) have provided strong indi-cations that Pegasus is undergoing ram pressure stripping. Thequoted authors consider this result an evidence for the presenceof an intergalactic medium (IGM) associated with the LocalGroup.
The first CCD CMD analysis of Pegasus made byHoessel & Mould (1982) set the galaxy well outside the Lo-cal Group at a distance of about 1.7 Mpc. Hoessel et al. (1990)confirmed this distance determination by using a few newlyidentified Cepheids. However, Aparicio (1994) derived a newdistance estimate of 955±44 Kpc, i.e., about a factor of 2 lowerthan the previous determinations using the I magnitude of theTRGB. In an attempt to reveal the origin of this large discrepancyin the two different distance determinations, Aparicio (1994)showed that the variable stars identified by Hoessel et al. (1990)as Cepheids, had a CMD location largely discrepant with respectto the location of the Cepheid instability strip boundaries. Thisresult called for a re-analysis of the variable star population inPegasus.
Concerning the investigation of the SFH in Pegasus, the onlystudies performed until now are those of Aparicio & Gallart(1995) and Gallagher et al. (1998) on the basis of ground-based photometry and Hubble Space Telescope (HST) WFPC2data, respectively. From an analysis through synthetic CMDs,Aparicio & Gallart (1995) found that Pegasus shows scarce starformation activity over the last 100 Myr, although the youngeststars may be as young as 10 Myr. The largest stellar populationin Pegasus was found to be older than 10 Gyr. On the basisof the red giant branch (RGB) morphology, Aparicio & Gallart(1995) put an upper limit of about Z ≈ 0.008 the metallicity ofthis galaxy. The more recent analysis performed by Gallagheret al. (1998) largely confirmed the previous work of Aparicio &Gallart (1995). However, they obtained a shorter distance; themain reason for this change was the larger—more than a factorof 2—reddening adopted by these authors and a significantlylower value (Z ≈ 0.001) for the mean metallicity. In addition,
3619
3620 MESCHIN ET AL. Vol. 137
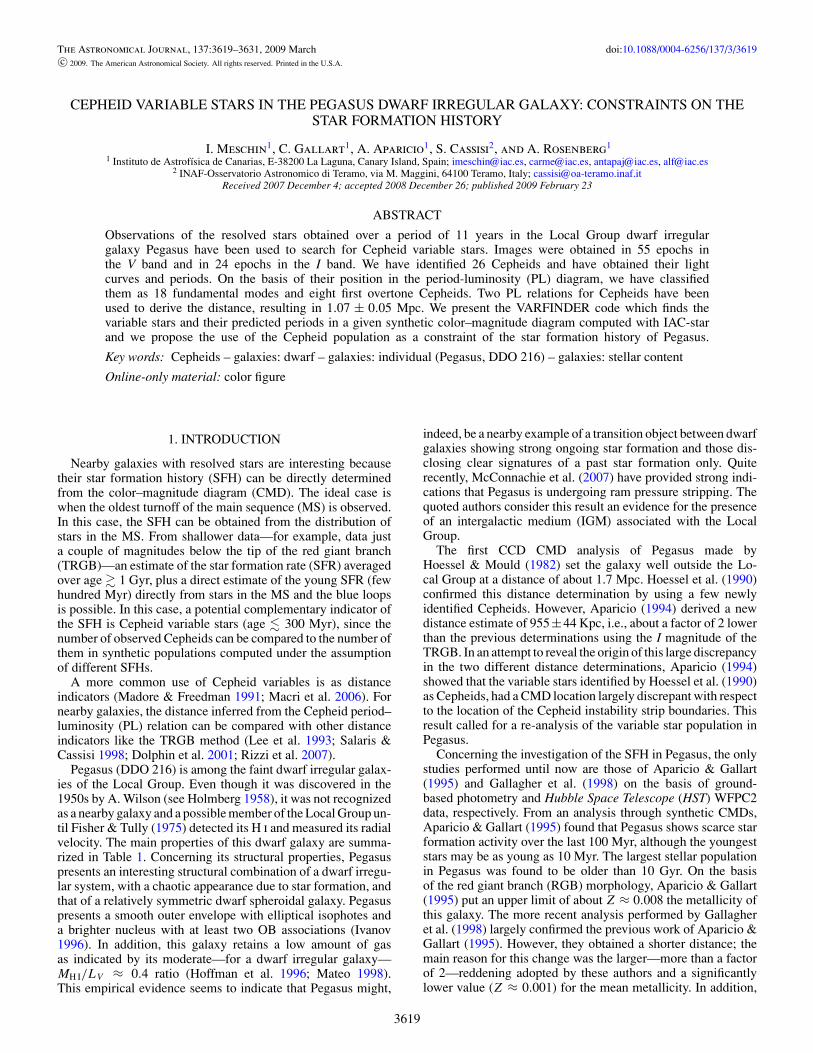
Figure 1. Composed image of Pegasus using magnitudes in three bands (BVI) obtained with the WHT at Roque de los Muchachos Observatory in La Palma. Theboxes show the different regions observed in the remaining 12 campaigns.
Gallagher et al. (1998) showed indications that the star-formingactivity is still ongoing, although at a low level, and provided anumber of possible models for the long-term SFH of the Pegasusgalaxy.
In this paper, we present and analyze the results of a searchfor Cepheid stars in the dwarf irregular galaxy of Pegasus, usingdata spanning 11 years. The plan of the paper is as follows.In Section 2, we present the observations, data reduction, andprofile-fitting photometry. Section 3 describes the search andcharacterization of the variable stars. In Section 4, we carry outan accurate completeness analysis by means of artificial stars.Section 5 presents a distance determination and the comparisonwith previously published distances. In Section 6, we discusshow the knowledge of the characteristics of the variable starpopulation can provide insight into the SFH of the relevant agerange, and apply these ideas to further constrain the PegasusSFH. Finally, in Section 7 the results presented throughout thepaper are summarized.
2. OBSERVATIONS AND DATA REDUCTION
The data analyzed in this paper were obtained with differenttelescopes (and/or detectors) between 1993 October and 2004November (see Figure 1 and Table 2). Even though the datawere not primarily collected to search for variable stars, thepotential for the discovery of such objects did exist, sinceit included 14 separate observing runs over about 11 years.Only one observational campaign was specifically designed tosearch for Cepheids: the 4.2 m William Herschel Telescope
Table 1Properties of the Pegasus Dwarf Irregular Galaxy
Property Value Reference
(α2000, δ2000) (23h28m34s, 14◦44′48′′) Mateo (1998)E(B − V ) 0.066 Schlegel et al. (1998)MV −12.9 mag Mateo (1998)MB −12.3 mag Mateo (1998)LV 12 × 106L� Mateo (1998)M 58 × 106M� Mateo (1998)D 1.75 ± 0.16 Mpc Hoessel et al. (1990)
0.95 ± 0.04 Mpc Aparicio (1994)0.76 ± 0.10 Mpc Gallagher et al. (1998)0.92 ± 0.03 Mpc McConnachie et al. (2005)0.97 ± 0.12 Mpc This work (Theoretical TRGB)1.07 ± 0.05 Mpc This work (Cepheids)
MHI/LB 0.44 M�/L� Mateo (1998)MHI/M 0.99 Mateo (1998)[Fe/H] −1.0 ± 0.3 dex Mateo (1998)
(WHT; Roque de los Muchachos Observatory, La Palma, CanaryIslands, Spain) with the Prime Focus Imaging Camera (PFIC).In this one, we obtained 22 images, 16 in V and six in I, duringthree consecutive nights in 2004 September.
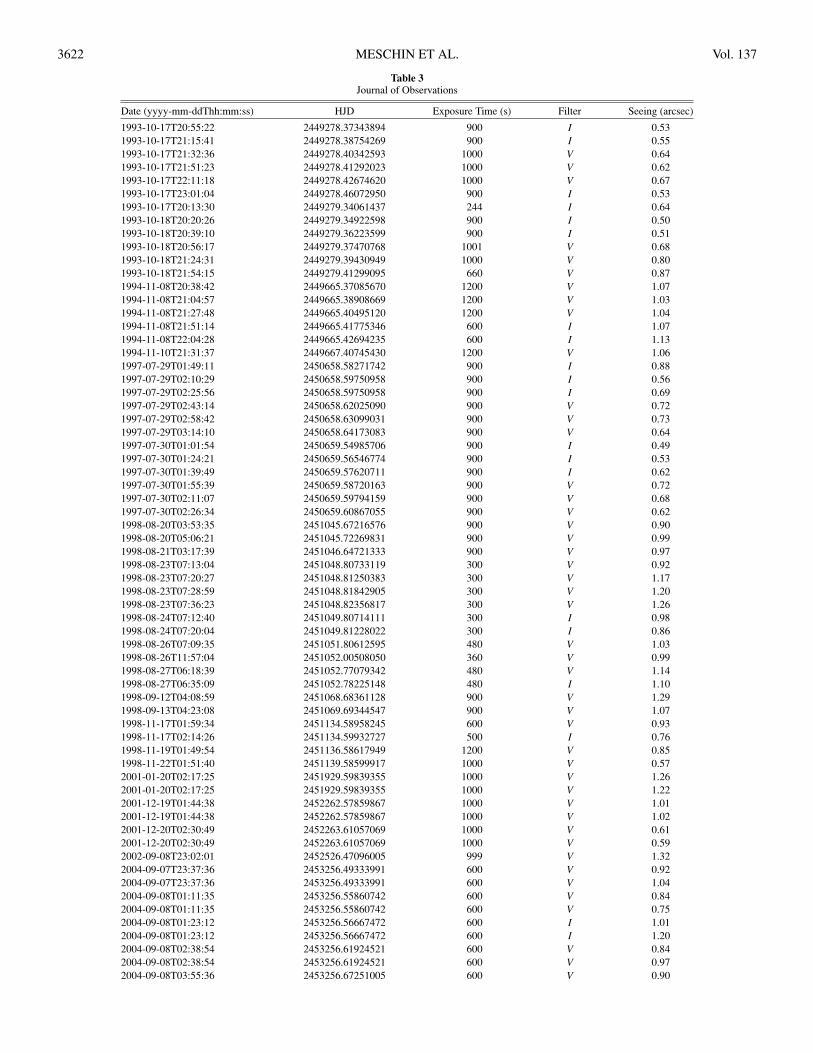
In total, we collected 73 images in V and 24 in I. Imageswith seeing > 1.′′35 and exposure time shorter than 200 s werediscarded. In this way, 55 images in V and 24 in I were selected.A complete summary of all the data available is presented inTable 3.
No. 3, 2009 CEPHEID VARIABLE STARS IN THE PEGASUS DWARF IRREGULAR GALAXY 3621
Table 2Instrumentals Characteristics
Observatory Date Telescope Camera Area Scale Gain Read Noise(pixel × pixel) (arcsec pixel−1) (e−/ADU) (e−)
La Palma 1994 Nov 8 INT 2.5 m PFCU 1242 × 1152 0.57 0.7 6La Palma 1994 Nov 10 INT 2.5 m PFCU 1242 × 1152 0.54 0.7 6La Palma 2002 Sep 8 INT 2.5 m WFC 2048 × 4100 0.33 0.7 6La Palma 1993 Oct 17 and 18 NOT 2.5 m WRIGHT 2048 × 4100 0.33 2.9 5.8La Palma 1997 Jul 28 and 29 NOT 2.5 m BROCAM 2048 × 4100 0.33 2.9 12La Palma 2004 Nov 15 and 16 INT 2.5 m WFC 2048 × 2048 0.14 2 5.4La Palma 1998 Aug 20 and 21 INT 2.5 m WFC 2048 × 2048 0.19 2 13.2La Palma 2004 Sep 7, 8, and 9 WHT 4.2 m PFIC 2048 × 4100 0.27 1.46 and 1.23 4.9 and 4.5Las Campanas 1998 Sep 11, 12, and 13 Du Pont 2.5 m TEK5 2048 × 2048 0.26 3 7Kitt Peak 1998 Nov 17, 19, and 22 WIYN S2KB 2048 × 2048 0.19 2.8 8Kitt Peak 1998 Aug 23 and 24 WIYN S2KB 2048 × 2048 0.19 2.8 8Kitt Peak 2001 Dec 19 and 20 WIYN MiniMos 2048 × 4096 0.141 1.4 and 1.5 5.5Kitt Peak 2001 Jan 20 and 21 WIYN MiniMos 2048 × 4096 0.141 1.3 5.4Palomar 1998 Sep 26 and 27 Hale 5 m TEK3 2048 × 2048 0.28 3.1 12
Data reduction was performed in the IRAF3 environ-ment. The photometry was obtained using the DAOPHOT-ALLSTAR-ALLFRAME suite of programs (Stetson 1987,1994).
Due to the inhomogeneity of the image database, matching ofthe star lists is more difficult than usual. Geometric transforma-tions between frames, including cubic distortions in addition totranslations and scale changes, were calculated using TMATCH(a variant of DAOMATCH) and DAOMASTER (Stetson 1990).The first program uses the method of matching triangles to findthe coordinate transformation between the lists of two frameswith the use of the brightest 30 stars; the second one transformsboth lists to a common coordinate system and then performsthe match of stars within a given radius. If a star has morethan one possible correspondence within this critical radius, itis associated with the nearest match. Some images could not bealigned in this way and we needed to solve the transformationequations manually. In this case, once the transformation coef-ficients were obtained, we refined them with DAOMASTER. Atotal of ≈14,000 stars were found and input into ALLFRAMEfor the simultaneous profile-fitting photometry of all the 79 in-dividual images.
For each star, ALLFRAME provides a set of quality controlparameters of the fit. We removed all the objects with CHI >2.5, thus with problems in the fitting, and −1 < SHARP <1, i.e., objects with size smaller than a star (like cosmicrays or image defects) or objects too extended (like blendsor semiresolved star clusters, H ii regions, and galaxies).Mean V and I magnitudes were obtained for each star inthe corresponding set of images in each filter, again usingDAOMASTER.
The photometric transformation to the Johnson–Cousinsstandard system was carried out by comparison with the cal-ibrated photometry by Aparicio & Gallart (1995). Zero-pointerrors of this transformation are 0.004 in V and 0.003 in I.Aparicio & Gallart (1995) used 18 standard stars from the list ofLandolt (1992). The zero-point errors in the transformation toJohnson–Cousins magnitudes, provided by them, are 0.004 in Vand 0.009 in I. So the total zero-point errors of our photometrycan be assumed to about 0.006 in V and 0.01 in I.
3 IRAF is distributed by the National Optical Astronomy Observatories,which is operated by the Association of Universities for Research inAstronomy, Inc., under cooperative agreement with the National ScienceFoundation.
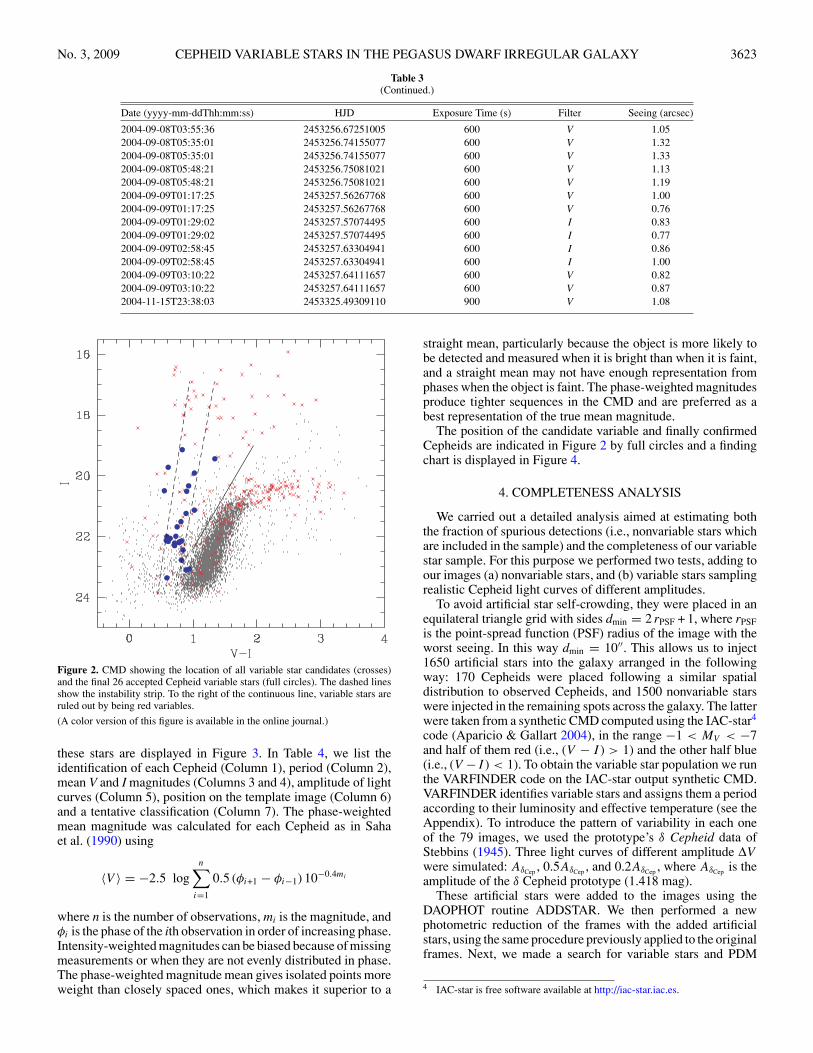
The observed CMD obtained by combining all the data ispresented in Figure 2. The main feature of the Pegasus CMD isthe clump that extends from (V −I ) = 0.8 at the faint magnitudelimit, to [(V − I ), I ] = [1.8, 20.9]. This feature is the redtangle discussed in Aparicio & Gallart (1995). It is composedof the RGB locus, the lower part of old- and intermediate-age asymptotic giant branches (AGBs), and by intermediate-mass core He-burning stars. Therefore, it is a clear tracer of theexistence of old- and intermediate-age stars in the galaxy. On theother hand, some very red stars extending up to (V − I ) � 3.7are intermediate-age AGB stars. Only a few stars populate theMS region, at (V −I ) � 0.0, and a few red supergiants populatea strip lying from [(V − I ), I ] = [1.1, 20.9] to [2.2, 18.4].
3. SEARCHING FOR VARIABLES
Only V images were used for the variable star search.Photometry of the images separated by less than 1 hr wasaveraged. In this way, 40 epochs were obtained in V.
We made a first selection of variable candidates based on thevariability index “var,” defined as the ratio of the external tothe internal standard error (var = σext/σint), as calculated byDAOMASTER from the individual magnitudes of the 40 Vepochs. The stars with var � 3 were flagged as variablecandidates. This requirement produced a list of 319 stars.Figure 2 shows the location of the candidates in the CMD. Thosein the RGB (to the right of the straight line I = −3.6(V −I )+26),about 42% of the total list, were discarded because we areinterested only in radially pulsating stars within the instabilitystrip for core He-burning structures. This left a list of 186 stars.
The light variations of all the candidate pulsating variableswere searched for periodicities. We used the Stellingwerf (1978)phase-dispersion minimization (PDM) algorithm in order todetermine a pulsation period. This program is excellent in thecase of nonsinusoidal time variations covered by only a fewirregularly spaced observations. We visually inspected the lightcurves that each of the most likely periods would produce foreach variable. When more than one likely period was found,the quality of the derived light curve was used to decide amongthem.
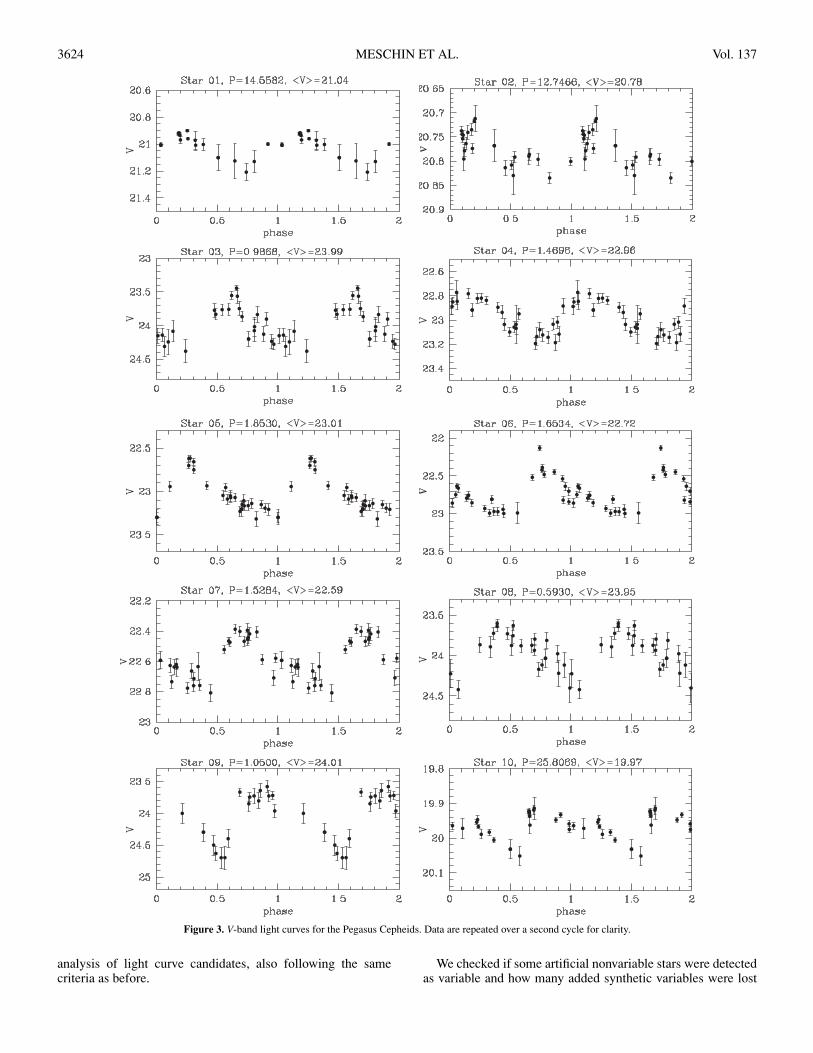
We found periods for 34 candidates. One of them wasdiscarded because it was very far from the instability stripand another seven candidates were also discarded because ofthe poor quality of their light curves. With these constraints,26 bona fide Cepheids were retained. The V light curves for
3622 MESCHIN ET AL. Vol. 137
Table 3Journal of Observations
Date (yyyy-mm-ddThh:mm:ss) HJD Exposure Time (s) Filter Seeing (arcsec)
1993-10-17T20:55:22 2449278.37343894 900 I 0.531993-10-17T21:15:41 2449278.38754269 900 I 0.551993-10-17T21:32:36 2449278.40342593 1000 V 0.641993-10-17T21:51:23 2449278.41292023 1000 V 0.621993-10-17T22:11:18 2449278.42674620 1000 V 0.671993-10-17T23:01:04 2449278.46072950 900 I 0.531993-10-17T20:13:30 2449279.34061437 244 I 0.641993-10-18T20:20:26 2449279.34922598 900 I 0.501993-10-18T20:39:10 2449279.36223599 900 I 0.511993-10-18T20:56:17 2449279.37470768 1001 V 0.681993-10-18T21:24:31 2449279.39430949 1000 V 0.801993-10-18T21:54:15 2449279.41299095 660 V 0.871994-11-08T20:38:42 2449665.37085670 1200 V 1.071994-11-08T21:04:57 2449665.38908669 1200 V 1.031994-11-08T21:27:48 2449665.40495120 1200 V 1.041994-11-08T21:51:14 2449665.41775346 600 I 1.071994-11-08T22:04:28 2449665.42694235 600 I 1.131994-11-10T21:31:37 2449667.40745430 1200 V 1.061997-07-29T01:49:11 2450658.58271742 900 I 0.881997-07-29T02:10:29 2450658.59750958 900 I 0.561997-07-29T02:25:56 2450658.59750958 900 I 0.691997-07-29T02:43:14 2450658.62025090 900 V 0.721997-07-29T02:58:42 2450658.63099031 900 V 0.731997-07-29T03:14:10 2450658.64173083 900 V 0.641997-07-30T01:01:54 2450659.54985706 900 I 0.491997-07-30T01:24:21 2450659.56546774 900 I 0.531997-07-30T01:39:49 2450659.57620711 900 I 0.621997-07-30T01:55:39 2450659.58720163 900 V 0.721997-07-30T02:11:07 2450659.59794159 900 V 0.681997-07-30T02:26:34 2450659.60867055 900 V 0.621998-08-20T03:53:35 2451045.67216576 900 V 0.901998-08-20T05:06:21 2451045.72269831 900 V 0.991998-08-21T03:17:39 2451046.64721333 900 V 0.971998-08-23T07:13:04 2451048.80733119 300 V 0.921998-08-23T07:20:27 2451048.81250383 300 V 1.171998-08-23T07:28:59 2451048.81842905 300 V 1.201998-08-23T07:36:23 2451048.82356817 300 V 1.261998-08-24T07:12:40 2451049.80714111 300 I 0.981998-08-24T07:20:04 2451049.81228022 300 I 0.861998-08-26T07:09:35 2451051.80612595 480 V 1.031998-08-26T11:57:04 2451052.00508050 360 V 0.991998-08-27T06:18:39 2451052.77079342 480 V 1.141998-08-27T06:35:09 2451052.78225148 480 I 1.101998-09-12T04:08:59 2451068.68361128 900 V 1.291998-09-13T04:23:08 2451069.69344547 900 V 1.071998-11-17T01:59:34 2451134.58958245 600 V 0.931998-11-17T02:14:26 2451134.59932727 500 I 0.761998-11-19T01:49:54 2451136.58617949 1200 V 0.851998-11-22T01:51:40 2451139.58599917 1000 V 0.572001-01-20T02:17:25 2451929.59839355 1000 V 1.262001-01-20T02:17:25 2451929.59839355 1000 V 1.222001-12-19T01:44:38 2452262.57859867 1000 V 1.012001-12-19T01:44:38 2452262.57859867 1000 V 1.022001-12-20T02:30:49 2452263.61057069 1000 V 0.612001-12-20T02:30:49 2452263.61057069 1000 V 0.592002-09-08T23:02:01 2452526.47096005 999 V 1.322004-09-07T23:37:36 2453256.49333991 600 V 0.922004-09-07T23:37:36 2453256.49333991 600 V 1.042004-09-08T01:11:35 2453256.55860742 600 V 0.842004-09-08T01:11:35 2453256.55860742 600 V 0.752004-09-08T01:23:12 2453256.56667472 600 I 1.012004-09-08T01:23:12 2453256.56667472 600 I 1.202004-09-08T02:38:54 2453256.61924521 600 V 0.842004-09-08T02:38:54 2453256.61924521 600 V 0.972004-09-08T03:55:36 2453256.67251005 600 V 0.90
No. 3, 2009 CEPHEID VARIABLE STARS IN THE PEGASUS DWARF IRREGULAR GALAXY 3623
Table 3(Continued.)
Date (yyyy-mm-ddThh:mm:ss) HJD Exposure Time (s) Filter Seeing (arcsec)
2004-09-08T03:55:36 2453256.67251005 600 V 1.052004-09-08T05:35:01 2453256.74155077 600 V 1.322004-09-08T05:35:01 2453256.74155077 600 V 1.332004-09-08T05:48:21 2453256.75081021 600 V 1.132004-09-08T05:48:21 2453256.75081021 600 V 1.192004-09-09T01:17:25 2453257.56267768 600 V 1.002004-09-09T01:17:25 2453257.56267768 600 V 0.762004-09-09T01:29:02 2453257.57074495 600 I 0.832004-09-09T01:29:02 2453257.57074495 600 I 0.772004-09-09T02:58:45 2453257.63304941 600 I 0.862004-09-09T02:58:45 2453257.63304941 600 I 1.002004-09-09T03:10:22 2453257.64111657 600 V 0.822004-09-09T03:10:22 2453257.64111657 600 V 0.872004-11-15T23:38:03 2453325.49309110 900 V 1.08
Figure 2. CMD showing the location of all variable star candidates (crosses)and the final 26 accepted Cepheid variable stars (full circles). The dashed linesshow the instability strip. To the right of the continuous line, variable stars areruled out by being red variables.
(A color version of this figure is available in the online journal.)
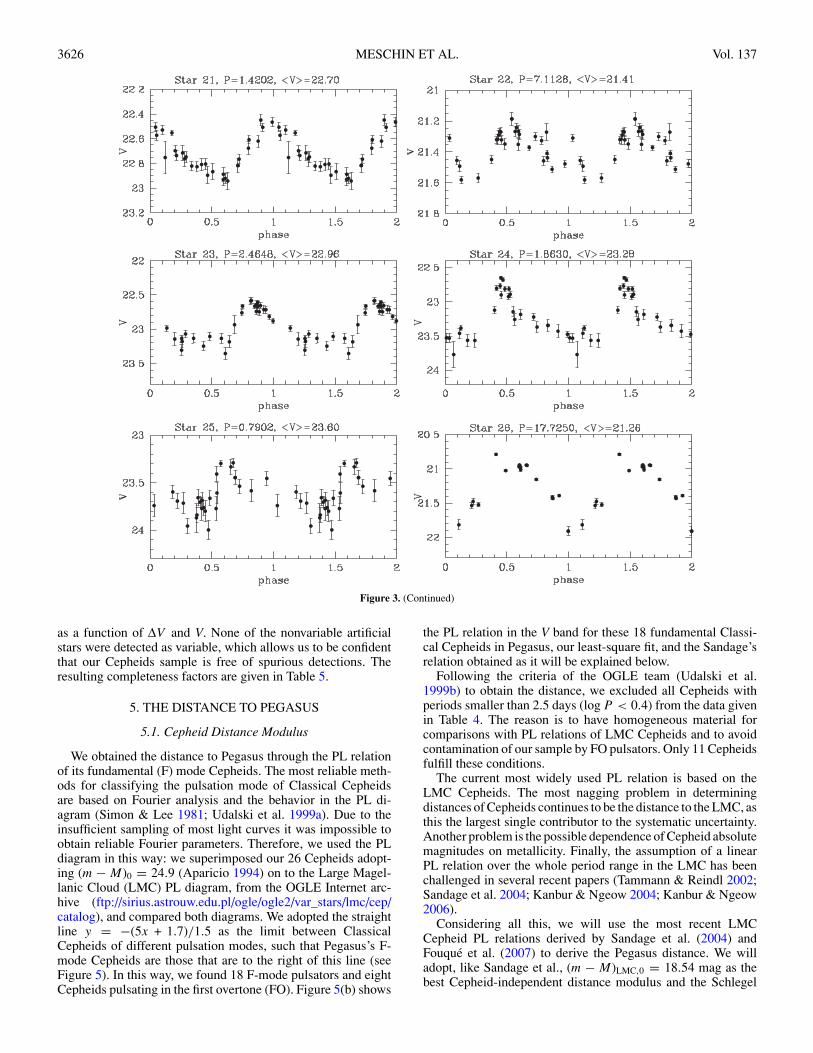
these stars are displayed in Figure 3. In Table 4, we list theidentification of each Cepheid (Column 1), period (Column 2),mean V and I magnitudes (Columns 3 and 4), amplitude of lightcurves (Column 5), position on the template image (Column 6)and a tentative classification (Column 7). The phase-weightedmean magnitude was calculated for each Cepheid as in Sahaet al. (1990) using
〈V 〉 = −2.5 logn∑
i=1
0.5 (φi+1 − φi−1) 10−0.4mi
where n is the number of observations, mi is the magnitude, andφi is the phase of the ith observation in order of increasing phase.Intensity-weighted magnitudes can be biased because of missingmeasurements or when they are not evenly distributed in phase.The phase-weighted magnitude mean gives isolated points moreweight than closely spaced ones, which makes it superior to a
straight mean, particularly because the object is more likely tobe detected and measured when it is bright than when it is faint,and a straight mean may not have enough representation fromphases when the object is faint. The phase-weighted magnitudesproduce tighter sequences in the CMD and are preferred as abest representation of the true mean magnitude.
The position of the candidate variable and finally confirmedCepheids are indicated in Figure 2 by full circles and a findingchart is displayed in Figure 4.
4. COMPLETENESS ANALYSIS
We carried out a detailed analysis aimed at estimating boththe fraction of spurious detections (i.e., nonvariable stars whichare included in the sample) and the completeness of our variablestar sample. For this purpose we performed two tests, adding toour images (a) nonvariable stars, and (b) variable stars samplingrealistic Cepheid light curves of different amplitudes.
To avoid artificial star self-crowding, they were placed in anequilateral triangle grid with sides dmin = 2 rPSF + 1, where rPSFis the point-spread function (PSF) radius of the image with theworst seeing. In this way dmin = 10′′. This allows us to inject1650 artificial stars into the galaxy arranged in the followingway: 170 Cepheids were placed following a similar spatialdistribution to observed Cepheids, and 1500 nonvariable starswere injected in the remaining spots across the galaxy. The latterwere taken from a synthetic CMD computed using the IAC-star4
code (Aparicio & Gallart 2004), in the range −1 < MV < −7and half of them red (i.e., (V − I ) > 1) and the other half blue(i.e., (V −I ) < 1). To obtain the variable star population we runthe VARFINDER code on the IAC-star output synthetic CMD.VARFINDER identifies variable stars and assigns them a periodaccording to their luminosity and effective temperature (see theAppendix). To introduce the pattern of variability in each oneof the 79 images, we used the prototype’s δ Cepheid data ofStebbins (1945). Three light curves of different amplitude ΔVwere simulated: AδCep , 0.5AδCep , and 0.2AδCep , where AδCep is theamplitude of the δ Cepheid prototype (1.418 mag).
These artificial stars were added to the images using theDAOPHOT routine ADDSTAR. We then performed a newphotometric reduction of the frames with the added artificialstars, using the same procedure previously applied to the originalframes. Next, we made a search for variable stars and PDM
4 IAC-star is free software available at http://iac-star.iac.es.
3624 MESCHIN ET AL. Vol. 137
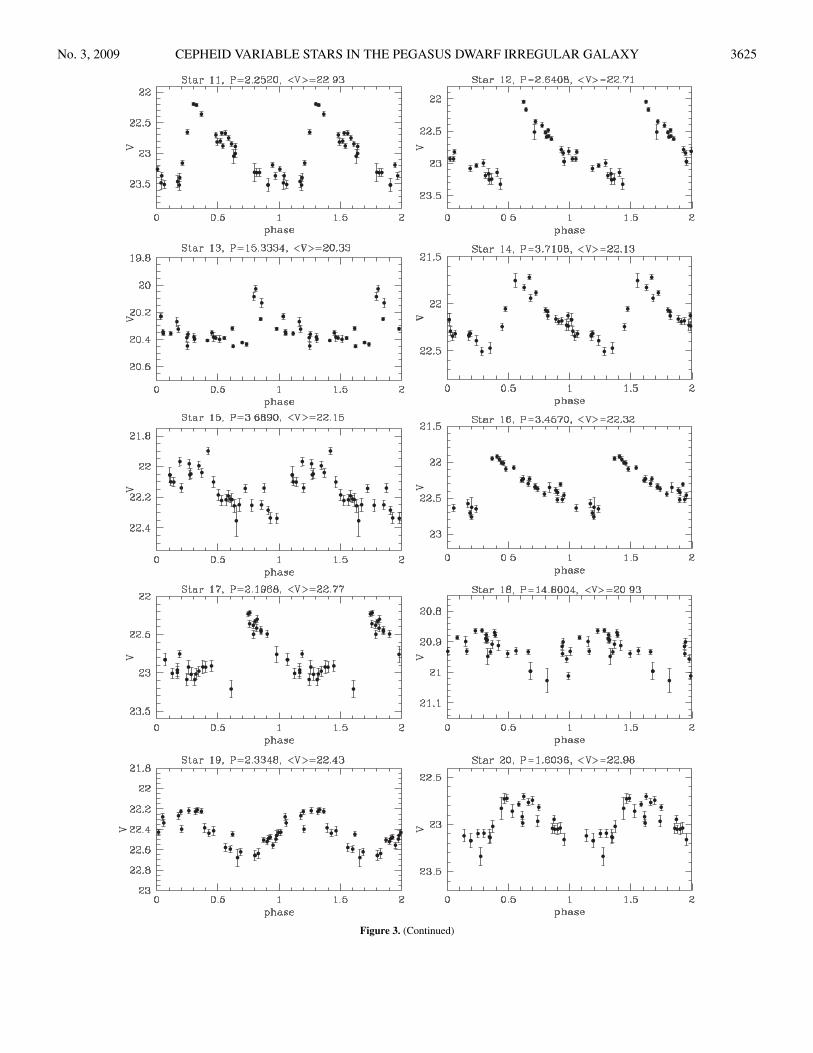
Figure 3. V-band light curves for the Pegasus Cepheids. Data are repeated over a second cycle for clarity.
analysis of light curve candidates, also following the samecriteria as before.
We checked if some artificial nonvariable stars were detectedas variable and how many added synthetic variables were lost
No. 3, 2009 CEPHEID VARIABLE STARS IN THE PEGASUS DWARF IRREGULAR GALAXY 3625
Figure 3. (Continued)
3626 MESCHIN ET AL. Vol. 137
Figure 3. (Continued)
as a function of ΔV and V. None of the nonvariable artificialstars were detected as variable, which allows us to be confidentthat our Cepheids sample is free of spurious detections. Theresulting completeness factors are given in Table 5.
5. THE DISTANCE TO PEGASUS
5.1. Cepheid Distance Modulus
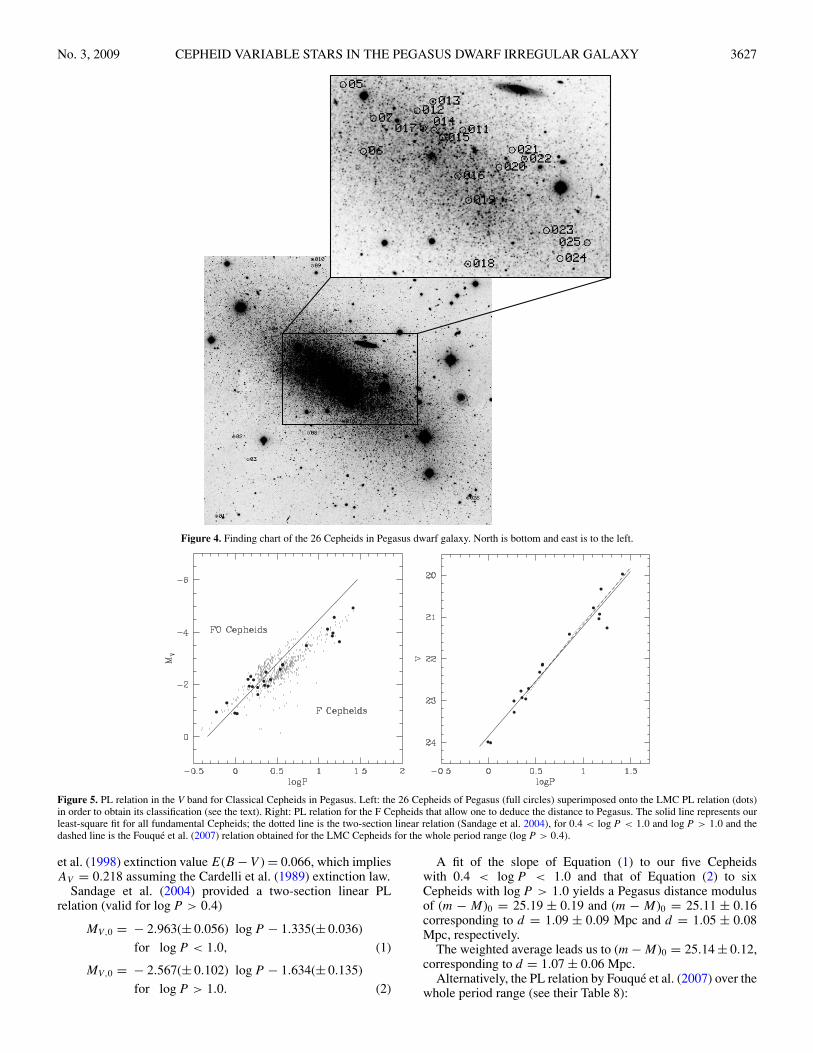
We obtained the distance to Pegasus through the PL relationof its fundamental (F) mode Cepheids. The most reliable meth-ods for classifying the pulsation mode of Classical Cepheidsare based on Fourier analysis and the behavior in the PL di-agram (Simon & Lee 1981; Udalski et al. 1999a). Due to theinsufficient sampling of most light curves it was impossible toobtain reliable Fourier parameters. Therefore, we used the PLdiagram in this way: we superimposed our 26 Cepheids adopt-ing (m − M)0 = 24.9 (Aparicio 1994) on to the Large Magel-lanic Cloud (LMC) PL diagram, from the OGLE Internet arc-hive (ftp://sirius.astrouw.edu.pl/ogle/ogle2/var_stars/lmc/cep/catalog), and compared both diagrams. We adopted the straightline y = −(5x + 1.7)/1.5 as the limit between ClassicalCepheids of different pulsation modes, such that Pegasus’s F-mode Cepheids are those that are to the right of this line (seeFigure 5). In this way, we found 18 F-mode pulsators and eightCepheids pulsating in the first overtone (FO). Figure 5(b) shows
the PL relation in the V band for these 18 fundamental Classi-cal Cepheids in Pegasus, our least-square fit, and the Sandage’srelation obtained as it will be explained below.
Following the criteria of the OGLE team (Udalski et al.1999b) to obtain the distance, we excluded all Cepheids withperiods smaller than 2.5 days (log P < 0.4) from the data givenin Table 4. The reason is to have homogeneous material forcomparisons with PL relations of LMC Cepheids and to avoidcontamination of our sample by FO pulsators. Only 11 Cepheidsfulfill these conditions.
The current most widely used PL relation is based on theLMC Cepheids. The most nagging problem in determiningdistances of Cepheids continues to be the distance to the LMC, asthis the largest single contributor to the systematic uncertainty.Another problem is the possible dependence of Cepheid absolutemagnitudes on metallicity. Finally, the assumption of a linearPL relation over the whole period range in the LMC has beenchallenged in several recent papers (Tammann & Reindl 2002;Sandage et al. 2004; Kanbur & Ngeow 2004; Kanbur & Ngeow2006).
Considering all this, we will use the most recent LMCCepheid PL relations derived by Sandage et al. (2004) andFouque et al. (2007) to derive the Pegasus distance. We willadopt, like Sandage et al., (m − M)LMC,0 = 18.54 mag as thebest Cepheid-independent distance modulus and the Schlegel
No. 3, 2009 CEPHEID VARIABLE STARS IN THE PEGASUS DWARF IRREGULAR GALAXY 3627
Figure 4. Finding chart of the 26 Cepheids in Pegasus dwarf galaxy. North is bottom and east is to the left.
Figure 5. PL relation in the V band for Classical Cepheids in Pegasus. Left: the 26 Cepheids of Pegasus (full circles) superimposed onto the LMC PL relation (dots)in order to obtain its classification (see the text). Right: PL relation for the F Cepheids that allow one to deduce the distance to Pegasus. The solid line represents ourleast-square fit for all fundamental Cepheids; the dotted line is the two-section linear relation (Sandage et al. 2004), for 0.4 < log P < 1.0 and log P > 1.0 and thedashed line is the Fouque et al. (2007) relation obtained for the LMC Cepheids for the whole period range (log P > 0.4).
et al. (1998) extinction value E(B −V ) = 0.066, which impliesAV = 0.218 assuming the Cardelli et al. (1989) extinction law.
Sandage et al. (2004) provided a two-section linear PLrelation (valid for log P > 0.4)
MV,0 = − 2.963(± 0.056) log P − 1.335(± 0.036)
for log P < 1.0, (1)
MV,0 = − 2.567(± 0.102) log P − 1.634(± 0.135)
for log P > 1.0. (2)
A fit of the slope of Equation (1) to our five Cepheidswith 0.4 < log P < 1.0 and that of Equation (2) to sixCepheids with log P > 1.0 yields a Pegasus distance modulusof (m − M)0 = 25.19 ± 0.19 and (m − M)0 = 25.11 ± 0.16corresponding to d = 1.09 ± 0.09 Mpc and d = 1.05 ± 0.08Mpc, respectively.
The weighted average leads us to (m − M)0 = 25.14 ± 0.12,corresponding to d = 1.07 ± 0.06 Mpc.
Alternatively, the PL relation by Fouque et al. (2007) over thewhole period range (see their Table 8):
3628 MESCHIN ET AL. Vol. 137
Table 4Periods, V and I Mean Magnitudes, ΔV Amplitude of Light Curves, Positions,
and Classification of the 26 Selected Cepheids
Cepheid ID P (days) V I ΔV X Y Classification
01 14.5582 21.04 20.49 0.31 215.1 59.2 F02 12.7466 20.78 19.44 0.12 279.7 353.6 F03 0.9868 23.99 23.10 0.94 332.4 270.2 F04 1.4696 22.96 22.17 0.42 411.5 753.7 FO05 1.8530 23.01 22.30 0.70 481.5 705.1 F06 1.6534 22.72 21.99 0.86 515.0 595.9 FO07 1.5284 22.59 22.00 0.42 531.4 649.8 FO08 0.5930 23.95 23.36 0.82 557.1 368.3 FO09 1.0500 24.01 23.07 1.11 571.2 989.2 F10 25.8069 19.97 19.14 0.14 571.7 1012.6 F11 2.2520 22.93 22.22 1.32 602.7 662.5 F12 2.6408 22.71 22.13 1.27 612.6 633.3 F13 15.3334 20.33 19.72 0.42 628.8 677.5 F14 3.7108 22.13 21.24 0.79 630.8 630.5 F15 3.6890 22.15 21.13 0.46 644.6 618.2 F16 3.4570 22.32 21.51 0.84 669.8 555.9 F17 2.1968 22.77 22.16 0.99 678.0 630.7 F18 14.8004 20.93 19.91 0.16 686.2 411.8 F19 2.3348 22.43 21.68 0.47 687.3 516.0 FO20 1.6036 22.98 22.20 0.64 737.4 569.7 FO21 1.4202 22.70 22.06 0.49 758.5 598.2 FO22 7.1128 21.41 20.51 0.39 778.7 583.3 F23 2.4648 22.96 22.14 0.77 814.9 466.7 F24 1.8630 23.28 22.44 1.12 837.3 420.9 F25 0.7902 23.60 22.78 0.71 881.7 446.7 FO26 17.7250 21.26 20.33 1.12 1148.1 126.4 F
MV,0 = −2.734(± 0.029) log P − 1.488(± 0.007)
yields (m − M)0 = 25.16 ± 0.10, corresponding to d =1.08 ± 0.05 Mpc. Note that a direct fit to our full data setof fundamental Cepheids provides a slope of −2.624(± 0.14),which is consistent with the relation given by Fouque et al.(2007).
We will adopt an error’s weighted mean of the two differentPegasus Cepheid distance estimates (m − M)0 = 25.15 ± 0.11,which yields d = 1.07 ± 0.05 Mpc.
5.2. Tip of the RGB Distance Modulus
We also obtained the distance to Pegasus from the absoluteI magnitude of the TRGB (MTRGB
I ), which has proved to bean excellent distance estimator for nearby resolved galaxies(Lee et al. 1993; Madore & Freedman 1995; Bellazzini et al.2004). This point marks the core helium flash of low-mass stars,which occurs at a nearly constant I-Cousin magnitude in stellarpopulations with ages larger than 2–3 Gyr.
Salaris & Cassisi (1998) provided two theoretical calibrationsobtained by using two different assumptions for the I-bandbolometric corrections (see Equations (5) and (6) of their paperfor more details):
MTRGBI = −3.953 + 0.437[M/H] + 0.147[M/H]2 (3)
MTRGBI = −4.156 + 0.157[M/H] + 0.070[M/H]2 (4)
where [M/H] is the global metallicity, accounting for theα-elements enhancement.
On the other hand, Bellazzini et al. (2001, 2004) gave anew robust empirical calibration of MTRGB
I , extended to highmetallicities (−2.2 < [Fe/H] < −0.2) and to IR bands. Thiscalibration is based on the observations of ω Cen and 47 Tuc,
Table 5Completeness Factors as a Function of ΔV/AδCep and V
V (mag) 0.2 ΔV/AδCep 10.5
<22 1 1 122–23 0.57 0.75 0.9123–24 0.13 0.64 0.73
globular clusters that meet the completeness criteria as set inMadore & Freedman (1995), and give MTRGB
I as a function ofthe metallicity:
MTRGBI = −3.629 + 0.676[M/H] + 0.258[M/H]2. (5)
We adopt Z = 0.003 ± 0.001, which is the average valueand the dispersion of the metallicities adopted in the calculationof the SFH of Pegasus (see Section 6). This leads to [M/H]= log(Z/Z�) = −0.63, which yields MTRGB
I = −4.199 ±0.031,−4.234 ± 0.007, and −3.992 ± 0.041, respectively,for the three calibrations (Equations (3)–(5)) given above. Thequoted uncertainties are those associated with the assumedZ dispersion.
From the CMD we obtain, through the RGB luminosity func-tion and an edge-detector (Sobel filter with kernel [−1, 0, 1]),TRGB luminosity ITRGB = 20.86 ± 0.17. We adopt the half-width at half-maximum (HWHM) of the Sobel filter peak as theassociated uncertainty. Therefore, the distance modulus
(m − M)0 = ITRGB − MTRGBI − AI
estimates are 24.93 ± 0.17, 24.97 ± 0.17 for the theoreticalrelations and 24.72 ± 0.17 for the empirical one, obtained byadopting AI = 0.128 (Schlegel et al. 1998).
Some discrepancy exists between the estimates based onthe theoretical and empirical relations. Our adopted distancemodulus, based on the PL relation, 25.15±0.11 is a little largerthan the theoretical values.
5.3. Comparison with Previously Published Distances
Since its discovery in the 1950s, the distance to Pegasus hasbeen an unclear. The first CCD analysis of Pegasus made byHoessel & Mould (1982) set the galaxy well outside the LocalGroup at a distance of about 1.7 Mpc. A few years later, Hoesselet al. (1990) confirmed this distance determination using thePL relation of 10 Cepheid stars. They established 1.75 ±0.16 Mpc. However we find, in agreement with Aparicio (1994),that these Cepheids are badly located in the CMD (in the zoneof red giants), far away from the instability strip and thereforethis distance is not valid.
Aparicio (1994) derived a new distance using the TRGB,and found 0.95 ± 0.04 Mpc, making this dwarf galaxy a likelymember of the Local Group. Gallagher et al. (1998) combinedCMDs obtained with the HST and from the ground in orderto investigate the stellar population. They adopted a shorterdistance, 0.76 ± 0.10 Mpc on account of a larger reddeningvalue (E(B − V ) = 0.15) than that normally assumed forPegasus, and that they found necessary in order to match thecolors of the MS with theoretical models. Finally, McConnachieet al. (2005) obtained a TRGB distance to Pegasus of 0.92 ±0.03 Mpc. Our adopted distance modulus, based on the PLrelation, d = 1.07 ± 0.05 Mpc is greater but marginallycompatible with the distance determinations of McConnachieet al. (2005) and Aparicio (1994).
No. 3, 2009 CEPHEID VARIABLE STARS IN THE PEGASUS DWARF IRREGULAR GALAXY 3629
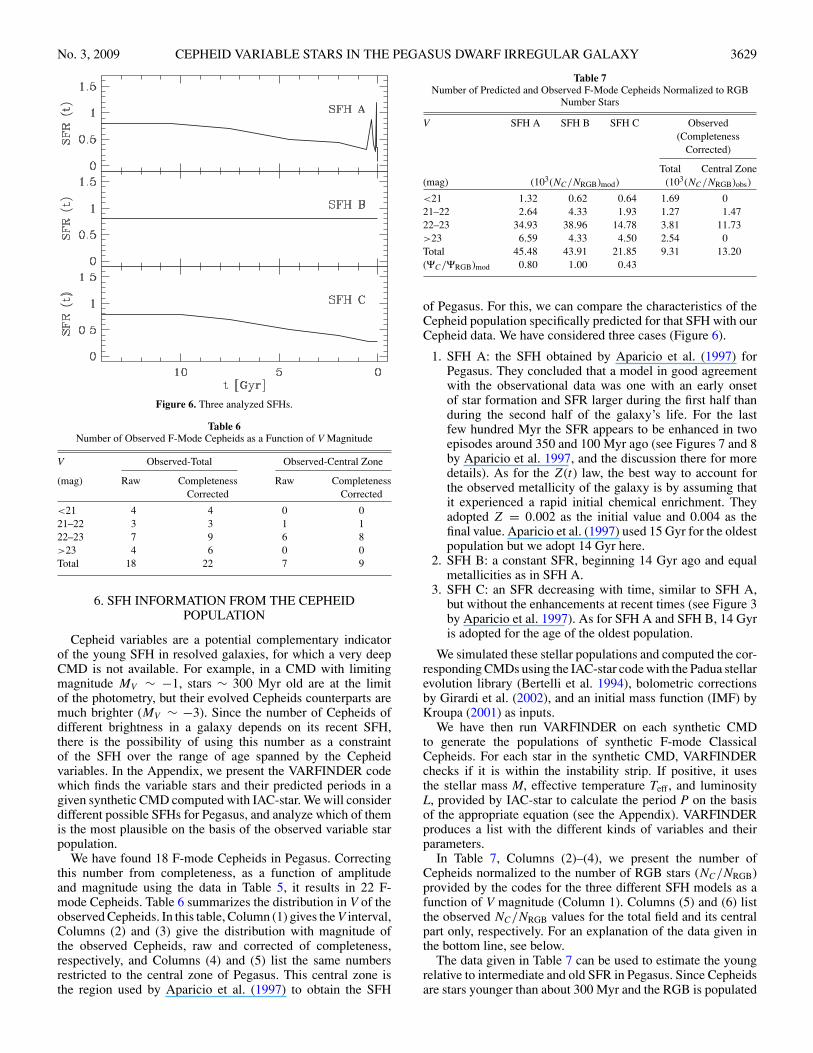
Figure 6. Three analyzed SFHs.
Table 6Number of Observed F-Mode Cepheids as a Function of V Magnitude
V Observed-Total Observed-Central Zone
(mag) Raw Completeness Raw CompletenessCorrected Corrected
<21 4 4 0 021–22 3 3 1 122–23 7 9 6 8>23 4 6 0 0Total 18 22 7 9
6. SFH INFORMATION FROM THE CEPHEIDPOPULATION
Cepheid variables are a potential complementary indicatorof the young SFH in resolved galaxies, for which a very deepCMD is not available. For example, in a CMD with limitingmagnitude MV ∼ −1, stars ∼ 300 Myr old are at the limitof the photometry, but their evolved Cepheids counterparts aremuch brighter (MV ∼ −3). Since the number of Cepheids ofdifferent brightness in a galaxy depends on its recent SFH,there is the possibility of using this number as a constraintof the SFH over the range of age spanned by the Cepheidvariables. In the Appendix, we present the VARFINDER codewhich finds the variable stars and their predicted periods in agiven synthetic CMD computed with IAC-star. We will considerdifferent possible SFHs for Pegasus, and analyze which of themis the most plausible on the basis of the observed variable starpopulation.
We have found 18 F-mode Cepheids in Pegasus. Correctingthis number from completeness, as a function of amplitudeand magnitude using the data in Table 5, it results in 22 F-mode Cepheids. Table 6 summarizes the distribution in V of theobserved Cepheids. In this table, Column (1) gives the V interval,Columns (2) and (3) give the distribution with magnitude ofthe observed Cepheids, raw and corrected of completeness,respectively, and Columns (4) and (5) list the same numbersrestricted to the central zone of Pegasus. This central zone isthe region used by Aparicio et al. (1997) to obtain the SFH
Table 7Number of Predicted and Observed F-Mode Cepheids Normalized to RGB
Number Stars
V SFH A SFH B SFH C Observed(Completeness
Corrected)
Total Central Zone(mag) (103(NC/NRGB)mod) (103(NC/NRGB)obs)
<21 1.32 0.62 0.64 1.69 021–22 2.64 4.33 1.93 1.27 1.4722–23 34.93 38.96 14.78 3.81 11.73>23 6.59 4.33 4.50 2.54 0Total 45.48 43.91 21.85 9.31 13.20(ΨC/ΨRGB)mod 0.80 1.00 0.43
of Pegasus. For this, we can compare the characteristics of theCepheid population specifically predicted for that SFH with ourCepheid data. We have considered three cases (Figure 6).
1. SFH A: the SFH obtained by Aparicio et al. (1997) forPegasus. They concluded that a model in good agreementwith the observational data was one with an early onsetof star formation and SFR larger during the first half thanduring the second half of the galaxy’s life. For the lastfew hundred Myr the SFR appears to be enhanced in twoepisodes around 350 and 100 Myr ago (see Figures 7 and 8by Aparicio et al. 1997, and the discussion there for moredetails). As for the Z(t) law, the best way to account forthe observed metallicity of the galaxy is by assuming thatit experienced a rapid initial chemical enrichment. Theyadopted Z = 0.002 as the initial value and 0.004 as thefinal value. Aparicio et al. (1997) used 15 Gyr for the oldestpopulation but we adopt 14 Gyr here.
2. SFH B: a constant SFR, beginning 14 Gyr ago and equalmetallicities as in SFH A.
3. SFH C: an SFR decreasing with time, similar to SFH A,but without the enhancements at recent times (see Figure 3by Aparicio et al. 1997). As for SFH A and SFH B, 14 Gyris adopted for the age of the oldest population.
We simulated these stellar populations and computed the cor-responding CMDs using the IAC-star code with the Padua stellarevolution library (Bertelli et al. 1994), bolometric correctionsby Girardi et al. (2002), and an initial mass function (IMF) byKroupa (2001) as inputs.
We have then run VARFINDER on each synthetic CMDto generate the populations of synthetic F-mode ClassicalCepheids. For each star in the synthetic CMD, VARFINDERchecks if it is within the instability strip. If positive, it usesthe stellar mass M, effective temperature Teff , and luminosityL, provided by IAC-star to calculate the period P on the basisof the appropriate equation (see the Appendix). VARFINDERproduces a list with the different kinds of variables and theirparameters.
In Table 7, Columns (2)–(4), we present the number ofCepheids normalized to the number of RGB stars (NC/NRGB)provided by the codes for the three different SFH models as afunction of V magnitude (Column 1). Columns (5) and (6) listthe observed NC/NRGB values for the total field and its centralpart only, respectively. For an explanation of the data given inthe bottom line, see below.
The data given in Table 7 can be used to estimate the youngrelative to intermediate and old SFR in Pegasus. Since Cepheidsare stars younger than about 300 Myr and the RGB is populated
3630 MESCHIN ET AL. Vol. 137
Table 8Variable Type Index and References for the Source of the Instability Strip Boundaries
Variables Type Index Variable Type Source for Instability Strip Boundaries
0 No variable1 Fundamental RR Lyrae Marconi et al. (2003); Di Criscienzo et al. (2004)2 FO RR Lyrae Marconi et al. (2003); Di Criscienzo et al. (2004)3 Fundamental Anomalous Cepheid Marconi et al. (2004)4 FO Anomalous Cepheid Marconi et al. (2004)5 Fundamental Classical Cepheid Bono et al. (2000)
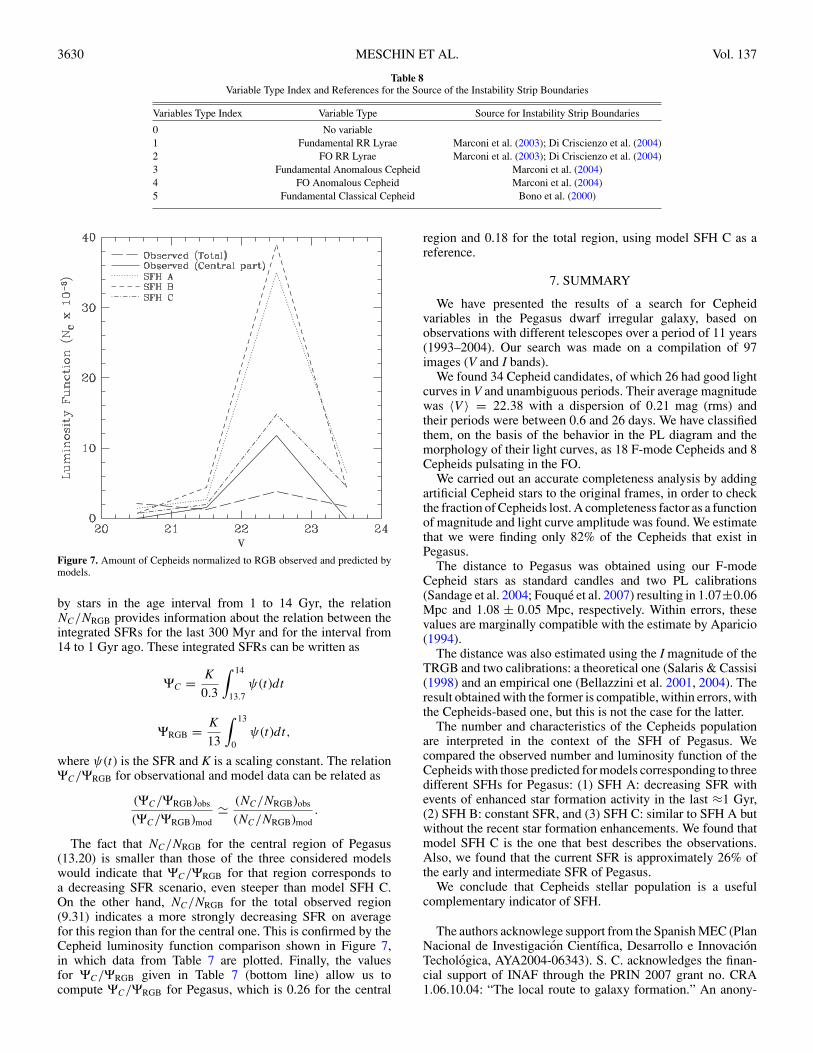
Figure 7. Amount of Cepheids normalized to RGB observed and predicted bymodels.
by stars in the age interval from 1 to 14 Gyr, the relationNC/NRGB provides information about the relation between theintegrated SFRs for the last 300 Myr and for the interval from14 to 1 Gyr ago. These integrated SFRs can be written as
ΨC = K
0.3
∫ 14
13.7ψ(t)dt
ΨRGB = K
13
∫ 13
0ψ(t)dt,
where ψ(t) is the SFR and K is a scaling constant. The relationΨC/ΨRGB for observational and model data can be related as
(ΨC/ΨRGB)obs
(ΨC/ΨRGB)mod� (NC/NRGB)obs
(NC/NRGB)mod.
The fact that NC/NRGB for the central region of Pegasus(13.20) is smaller than those of the three considered modelswould indicate that ΨC/ΨRGB for that region corresponds toa decreasing SFR scenario, even steeper than model SFH C.On the other hand, NC/NRGB for the total observed region(9.31) indicates a more strongly decreasing SFR on averagefor this region than for the central one. This is confirmed by theCepheid luminosity function comparison shown in Figure 7,in which data from Table 7 are plotted. Finally, the valuesfor ΨC/ΨRGB given in Table 7 (bottom line) allow us tocompute ΨC/ΨRGB for Pegasus, which is 0.26 for the central
region and 0.18 for the total region, using model SFH C as areference.
7. SUMMARY
We have presented the results of a search for Cepheidvariables in the Pegasus dwarf irregular galaxy, based onobservations with different telescopes over a period of 11 years(1993–2004). Our search was made on a compilation of 97images (V and I bands).
We found 34 Cepheid candidates, of which 26 had good lightcurves in V and unambiguous periods. Their average magnitudewas 〈V 〉 = 22.38 with a dispersion of 0.21 mag (rms) andtheir periods were between 0.6 and 26 days. We have classifiedthem, on the basis of the behavior in the PL diagram and themorphology of their light curves, as 18 F-mode Cepheids and 8Cepheids pulsating in the FO.
We carried out an accurate completeness analysis by addingartificial Cepheid stars to the original frames, in order to checkthe fraction of Cepheids lost. A completeness factor as a functionof magnitude and light curve amplitude was found. We estimatethat we were finding only 82% of the Cepheids that exist inPegasus.
The distance to Pegasus was obtained using our F-modeCepheid stars as standard candles and two PL calibrations(Sandage et al. 2004; Fouque et al. 2007) resulting in 1.07±0.06Mpc and 1.08 ± 0.05 Mpc, respectively. Within errors, thesevalues are marginally compatible with the estimate by Aparicio(1994).
The distance was also estimated using the I magnitude of theTRGB and two calibrations: a theoretical one (Salaris & Cassisi(1998) and an empirical one (Bellazzini et al. 2001, 2004). Theresult obtained with the former is compatible, within errors, withthe Cepheids-based one, but this is not the case for the latter.
The number and characteristics of the Cepheids populationare interpreted in the context of the SFH of Pegasus. Wecompared the observed number and luminosity function of theCepheids with those predicted for models corresponding to threedifferent SFHs for Pegasus: (1) SFH A: decreasing SFR withevents of enhanced star formation activity in the last ≈1 Gyr,(2) SFH B: constant SFR, and (3) SFH C: similar to SFH A butwithout the recent star formation enhancements. We found thatmodel SFH C is the one that best describes the observations.Also, we found that the current SFR is approximately 26% ofthe early and intermediate SFR of Pegasus.
We conclude that Cepheids stellar population is a usefulcomplementary indicator of SFH.
The authors acknowlege support from the Spanish MEC (PlanNacional de Investigacion Cientıfica, Desarrollo e InnovacionTechologica, AYA2004-06343). S. C. acknowledges the finan-cial support of INAF through the PRIN 2007 grant no. CRA1.06.10.04: “The local route to galaxy formation.” An anony-
No. 3, 2009 CEPHEID VARIABLE STARS IN THE PEGASUS DWARF IRREGULAR GALAXY 3631
mous referee helped us to improve the manuscript. This workhas made use of the IAC-STAR Synthetic CMD computationcode. IAC-STAR is supported and maintained by the computerdivision of the Instituto de Astrofısica de Canarias.
APPENDIX
THE VARFINDER CODE
The VARFINDER numerical code verifies if the effectivetemperature of each star in the synthetic CMD is within theblue and red boundaries of the instability strip (see below). Ifthe CMD location corresponds to a point within an instabilitystrip, the code controls whether the total mass of the star iscompatible—from an evolutionary point of view—with the typeof variable that has been classified. This is done in order to avoiddefining as a specific type of pulsating star a structure that, justdue to the path it follows in the CMD, crosses the instabilitystrip characteristic of more massive stars. The more immediateexample is provided by low-mass, post-AGB stars, which cancross the Cepheid instability strip when moving from the AGBto the white dwarf cooling sequence.
The present version of the code accounts for three differentkinds of variables: RR Lyrae, Anomalous Cepheids, and Clas-sical Cepheids.
As far as it concerns both RR Lyrae and Anomalous Cepheids,our code is able to properly select if a given synthetic star—onceestablished that it is located in the instability strip of one ofthese two kinds of variables—behaves as an FO- or an F-modevariable. In the case of Classical Cepheids, we do not distinguishbetween FO and fundamental pulsators and for this reason weaccount only for the instability strip boundaries of fundamentalCepheids.
For all three types of variables, the effective temperaturelocation of the blue and red boundaries of the different regionsis computed by taking into account their dependence on thestellar luminosity as provided by accurate pulsational models.In Table 8, we report the reference for the source of theboundaries of the various instability strips accounted for in theVARFINDER code.
Once the VARFINDER code has identified a certain kindof variable, it attributes to the synthetic star an index whosevalue identifies its status as a radially pulsating star—the valuesadopted for this “variability index” are listed in Table 8. For eachstellar structure identified as variable, the code computes alsothe predicted pulsational period on the basis of the appropriatefundamental equation, i.e., the relation which gives the periodP as a function of the mass M, luminosity L, and effectivetemperature Teff—and the metallicity, when necessary—of thestructure. More in detail, we use the following fundamentalpulsational relations (see the references quoted in Table 8) forthe different classes of variables:
1. Fundamental RR Lyrae: log PRRab= 11.015 + 0.833 ×
log(L/L�) − 0.651 × log(M/M�) + −3.350 × log Teff +0.008 × (log Z + 3.0)
2. FO RR Lyrae: log PRRc= log PRRab
− 0.133. Fundamental Anomalous Cepheids: log P = 10.879 +
0.818×log(L/L�)−0.616×log(M/M�)−3.309×log Teff
4. FO Anomalous Cepheids: log P = 10.198 + 0.775 ×log(L/L�) − 0.530 × log(M/M�) − 3.143 × log Teff
5. Fundamental Cepheids: in this case a relation of the typelog P = a + b × log(L/L�) − c × log(M/M�) − d ×log Teff is still adopted but with the coefficients a, b, c,and d depending on the stellar metallicity according to thepredictions by Bono et al. (2000).
REFERENCES
Aparicio, A. 1994, ApJ, 437, L27Aparicio, A., & Gallart, C. 1995, AJ, 110, 2105Aparicio, A., & Gallart, C. 2004, AJ, 128, 1465Aparicio, A., Gallart, C., & Bertelli, G. 1997, AJ, 114, 669Bellazzini, M., Ferraro, F. R., & Pancino, E. 2001, ApJ, 556, 635Bellazzini, M., Ferraro, F. R., Sollima, A., Pancino, E., & Origlia, L. 2004, A&A,
424, 199Bertelli, G., Bressan, A., Chiosi, C., Fagotto, F., & Nasi, E. 1994, A&AS, 106,
275Bono, G., Castellani, V., & Marconi, M. 2000, ApJ, 529, 293Cardelli, J. A., Clayton, G. C., & Mathis, J. S. 1989, ApJ, 345, 245Di Criscienzo, M., Marconi, M., & Caputo, F. 2004, ApJ, 612, 1092Dolphin, A. E., et al. 2001, ApJ, 550, 554Fisher, J. R., & Tully, R. B. 1975, A&A, 44, 151Fouque, P., et al. 2007, A&A, 476, 73Gallagher, J. S., Tolstoy, E., Dohm-Palmer, R. C., Skillman, E. D., Cole, A. A.,
Hoessel, J. G., Saha, A., & Mateo, M. 1998, AJ, 115, 1869Girardi, L., Bertelli, G., Bressan, A., Chiosi, C., Groenewegen, M. A. T., Marigo,
P., Salasnich, B., & Weiss, A. 2002, A&A, 391, 195Hoessel, J. G., Abbott, M. J., Saha, A., Mossman, A. E., & Danielson, G. E.
1990, AJ, 100, 1151Hoessel, J. G., & Mould, J. R. 1982, ApJ, 254, 38Hoffman, G. L., Salpeter, E. E., Farhat, B., Roos, T., Williams, H., & Helou, G.
1996, ApJS, 105, 269Holmberg, E. 1958, Meddelanden fran Lunds Astron. Obs. Ser. II, 136, 1Ivanov, G. R. 1996, A&A, 305, 708Kanbur, S. M., & Ngeow, C.-C. 2004, MNRAS, 350, 962Kanbur, S. M., & Ngeow, C.-C. 2006, MNRAS, 369, 705Kroupa, P. 2001, MNRAS, 322, 231Landolt, A. U. 1992, AJ, 104, 372Lee, M. G., Freedman, W. L., & Madore, B. F. 1993, ApJ, 417, 553Macri, L. M., Stanek, K. Z., Bersier, D., Greenhill, L. J., & Reid, M. J. 2006, ApJ,
652, 1133Madore, B. F., & Freedman, W. L. 1991, PASP, 103, 933Madore, B. F., & Freedman, W. L. 1995, AJ, 109, 1645Marconi, M., Caputo, F., Di Criscienzo, M., & Castellani, M. 2003, ApJ, 596,
299Marconi, M., Fiorentino, G., & Caputo, F. 2004, A&A, 417, 1101Mateo, M. L. 1998, ARA&A, 36, 435McConnachie, A. W., Irwin, M. J., Ferguson, A. M. N., Ibata, R. A., Lewis, G.
F., & Tanvir, N. 2005, MNRAS, 356, 979McConnachie, A. W., Venn, K. A., Irwin, M. J., Young, L. M., & Geehan, J. J.
2007, ApJ, 671, L33Rizzi, L., Tully, R. B., Makarov, D., Makarova, L., Dolphin, A. E., Sakai, S., &
Shaya, E. J. 2007, ApJ, 661, 815Saha, A., Hoessel, J. G., & Mossman, A. E. 1990, AJ, 100, 108Salaris, M., & Cassisi, S. 1998, MNRAS, 298, 166Sandage, A., Tammann, G. A., & Reindl, B. 2004, A&A, 424, 43Simon, N. R., & Lee, A. S. 1981, ApJ, 248, 291Schlegel, D. J., Finkbeiner, D. P., & Davis, M. 1998, ApJ, 500, 525Stebbins, J. 1945, Six-Color Photometry of Stars. II. Light-Curves of δCephei,
Vol. 704, Contributions From the Mount Wilson Observatory/CarnegieInstitution of Washington, 1
Stellingwerf, R. F. 1978, ApJ, 224, 953Stetson, P. B. 1987, PASP, 99, 191Stetson, P. B. 1990, PASP, 102, 932Stetson, P. B. 1994, PASP, 106, 250Tammann, G. A., & Reindl, B. 2002, Ap&SS, 280, 165Udalski, A., Soszynski, I., Szymanski, M., Kubiak, M., Pietrzynski, G.,
Wozniak, P., & Zebrun, K. 1999a, Acta Astron., 49, 223Udalski, A., Szymanski, M., Kubiak, M., Pietrzynski, G., Soszynski, I.,
Wozniak, P., & Zebrun, K. 1999b, Acta Astron., 49, 201
Related Documents