CEP – Nutrition Services

CEP – Nutrition Services. Overview – Nutrition Services Option provides an alternative to household applications for free and reduced price meals in high.
Dec 22, 2015
Welcome message from author
This document is posted to help you gain knowledge. Please leave a comment to let me know what you think about it! Share it to your friends and learn new things together.
Transcript

CEP – Nutrition Services

Overview – Nutrition Services
• Option provides an alternative to household applications for free and reduced price meals in high poverty local educational agencies (LEAs) and schools.
• LEA or schools electing the Provision agree to serve all students free lunches and breakfasts for four successive school years.
• Count total breakfasts and total lunches served to students daily
• Meal program claims are based on the percentage of identified students multiplied by a factor of 1.6.
• Available Nationwide starting SY 2014/15
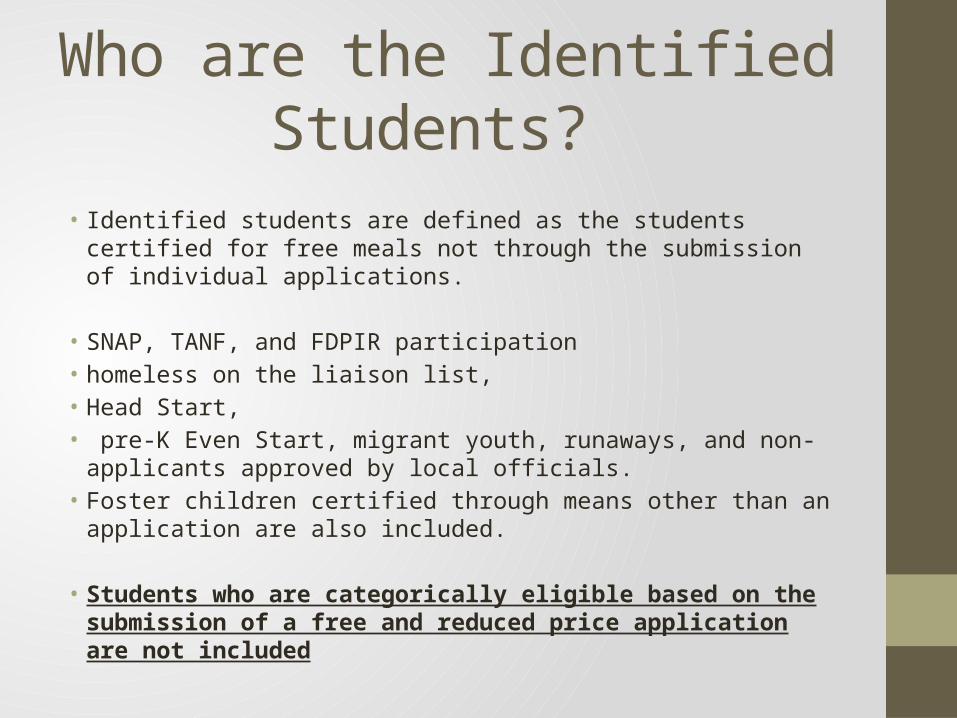
Who are the Identified Students?
• Identified students are defined as the students certified for free meals not through the submission of individual applications.
• SNAP, TANF, and FDPIR participation • homeless on the liaison list, • Head Start,• pre-K Even Start, migrant youth, runaways, and non-applicants
approved by local officials. • Foster children certified through means other than an application
are also included.
• Students who are categorically eligible based on the submission of a free and reduced price application are not included

CEP Claiming Example
Example:
Identified student % = 50%Free claiming percentage = 80% (50% X 1.6)Paid claiming percentage = 20% (100% - 80%)Total meals = 1,000Number of free meals = 800 (1,000 X 80%)Number of paid meals = 200 (1,000 – 800)

Community Eligibility In SC(2014-2015)
• Thirty Eight School Districts
• 224 Schools
• Entire School districts

Community Eligibility in SC2014-2015 SY
Participating Districts• Allendale• Barnwell 19• Bamberg One• Bamberg Two• Beaufort• Calhoun• Cherokee• Chesterfield• Colleton County• Clarendon Two• Dorchester Four
Participating Districts
• Darlington• Dillon Four• Fairfield • Georgetown• Greenville• Hampton One• Hampton Two• Jasper• Legacy Charter• Lee County• Lexington Four

Community Eligibility in SC2014-2015 SY
• Marlboro• Marion• McCormick• Orangeburg Four• Orangeburg Five• St. Anthony of Padua
• Sumter One• Spartanburg 7• Williamsburg
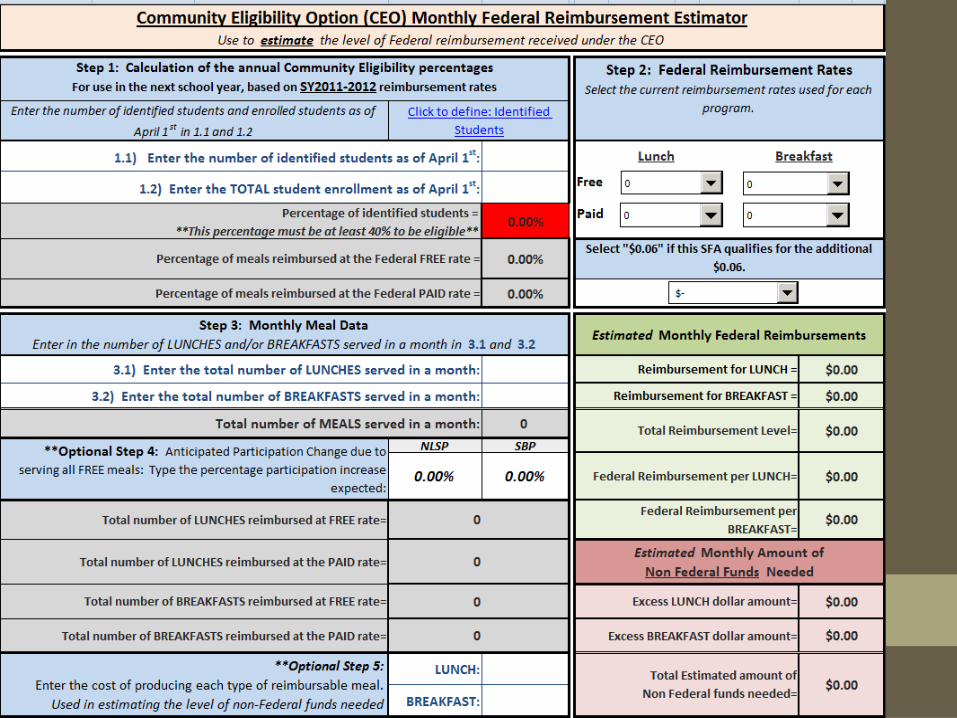

Step 1: Determining Identified Student, Free, and Paid Percentages

Invalid Identified Student Percentage:

Step 2: Federal Reimbursement Rates
• The reimbursement rates in the Estimator are for the current year.
• The monthly Federal reimbursement payments will be based on the updated reimbursement rates for the new school year.

Step 3: Entering Monthly Meal Data:

Estimated Federal and Non-Federal Funds

Participation Projection

Issues surrounding CEP!!!!
• How will state level funding be determined?
• Will the 1.6 multiplier remain constant?
• Will my district lose money?
• What happens if my ISP increases in the second year after I enroll in CEP?
• How will students in CEP schools who do not want free meals be handled?

CEP AND TITLE I

Poverty Data• Historically, Free and Reduced Lunch counts have been used
by education programs to determine poverty percentages and figures for funding and reporting.
• With the new CEP program, traditional Free and Reduced Lunch data on students will not be available at CEP schools.
• Poverty data is needed at the student level for Federal and State reporting and accountability purposes and for state finance calculations.

Title I District Allocations
• Title I, Part A allocations to school districts are based on largely on census poverty data, not on Free and Reduced Lunch counts.
• There may be some special school districts that might be affected.

School Rankings• The poverty percentage is necessary for the ranking of schools
within a district. • Districts have used the March Free and Reduced Lunch count
numbers (minus PreK) and the 135 ADM to determine the poverty percent for each school to use to rank schools and provide allocations.
• Spring 2014 Free and Reduced lunch data was available for all LEAs to rank schools for 2014-15 school year.

LEA’s with no CEP schools• If an LEA and its schools are not eligible to qualify for CEP or
chose not to participate in CEP, then the LEA may rank its schools for Title I via the traditional method of F/R lunch counts (March F/R Lunch count and 135 ADM)
or• by using the direct certification percentage for each school
(number of “identified students” and the April 1 enrollment).

LEA (no CEP schools)F/R Lunch Count (minus PreK)
School 135 ADM
F/R Lunch Count
Poverty Percent Rank PPA
Allocation =Lunch count X
PPA
Prevatt Elementary 100 90 90% 1 $100 $9000
Stehle Elementary 100 85 85% 2 $100 $8500
Larkin Elementary 200 150 75% 3 $100 $15,000
Cook Elementary 200 150 75% 4 $100 $15,000
Boison Middle 300 222 74% 5 $50 $11,100
Dillard Middle 300 216 72% 6 $50 $10,800
Boggs HS 300 150 50% 7 $50 $7,500
Stanley HS 300 144 48% 8 $50 $7,200

LEA (no CEP schools) Direct Certification Data (minus PreK)
School April 1 Enrollment
Identified Students –
Direct Certification
Poverty Percent Rank PPA
Identified students X
PPA
Stehle Elementary 100 80 80% 1 $100 $8000
Prevatt Elementary 100 70 70% 2 $100 $7000
Cook Elementary 200 125 63% 3 $50 $6250
Larkin Elementary 200 100 50% 4 $50 $5000
Boison Middle 300 150 50% 5 $50 $7500
Stanley HS 300 125 42% 6 $25 $3125
Dillard Middle 300 100 33% 7 NA NA
Boggs HS 300 100 33% 8 NA NA

LEA’s with all CEP schools• If an LEA has all schools as CEP schools, then the ranking could
be done on the April 1st direct certification percentage or
• by the direct certification percentage times the 1.6 multiplier (which approximates F/R lunch counts).
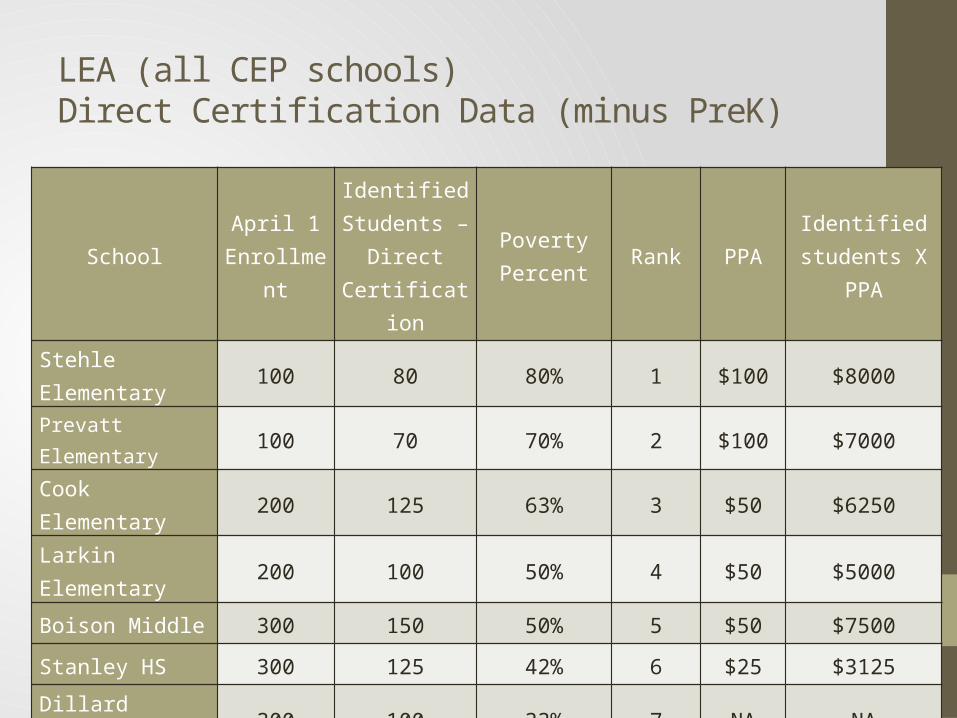
LEA (all CEP schools) Direct Certification Data (minus PreK)
School April 1 Enrollment
Identified Students –
Direct Certification
Poverty Percent Rank PPA Identified
students X PPA
Stehle Elementary 100 80 80% 1 $100 $8000
Prevatt Elementary 100 70 70% 2 $100 $7000
Cook Elementary 200 125 63% 3 $50 $6250
Larkin Elementary 200 100 50% 4 $50 $5000
Boison Middle 300 150 50% 5 $50 $7500
Stanley HS 300 125 42% 6 $25 $3125
Dillard Middle 300 100 33% 7 NA NA
Boggs HS 300 100 33% 8 NA NA

LEA (all CEP schools)Direct Certification Data times multiplier
SchoolApril 1 Enroll
#
# Identified Students –
Direct Certification
DirectCert %
Direct cert % times 1.6 multiplier
Poverty Percent Rank
# Identified students times 1.6 multiplier
PPA Allocation
Stehle Elementary 100 80 80% 128% 100% 1 128 $100 $12,800
Prevatt Elementary 100 70 70% 112% 100% 2 112 $100 $11,200
Cook Elementary 200 125 63% 101% 100% 3 200 $100 $20,000
Larkin Elementary 200 100 50% 80% 80% 4 160 $50 $8,000
Boison Middle 300 150 50% 80% 80% 5 240 $50 $12,000
Stanley HS 300 125 42% 67% 67% 6 200 $25 $5000
Dillard Middle 300 100 33% 53% 53% 7 160 $25 $4000
Boggs HS 300 100 33% 53% 53% 8 160 $25 $4000

LEAs with CEP schools and non-CEP schools
• If an LEA has both CEP schools and non-CEP schools, then it could rank the schools using the direct certification percentage for each school
or• by using the F/R lunch count at non-CEP schools and the direct
certification percentage times the 1.6 multiplier to get the approximate F/R lunch percent.
or• by using the F/R lunch count at non-CEP schools and an alternate
income survey form similar to the F/R lunch form at CEP schools (some districts have discussed this option).
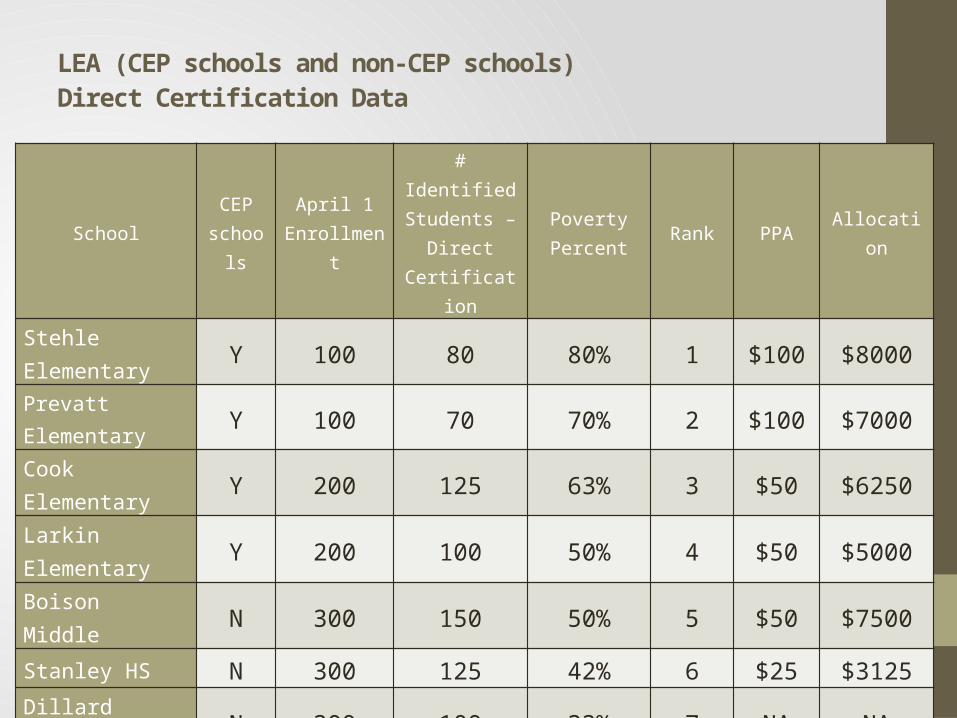
LEA (CEP schools and non-CEP schools) Direct Certification Data
School CEP schools
April 1 Enrollment
# Identified Students –
Direct Certification
Poverty Percent Rank PPA Allocation
Stehle Elementary Y 100 80 80% 1 $100 $8000
Prevatt Elementary Y 100 70 70% 2 $100 $7000
Cook Elementary Y 200 125 63% 3 $50 $6250
Larkin Elementary Y 200 100 50% 4 $50 $5000
Boison Middle N 300 150 50% 5 $50 $7500
Stanley HS N 300 125 42% 6 $25 $3125
Dillard Middle N 300 100 33% 7 NA NA
Boggs HS N 300 100 33% 8 NA NA
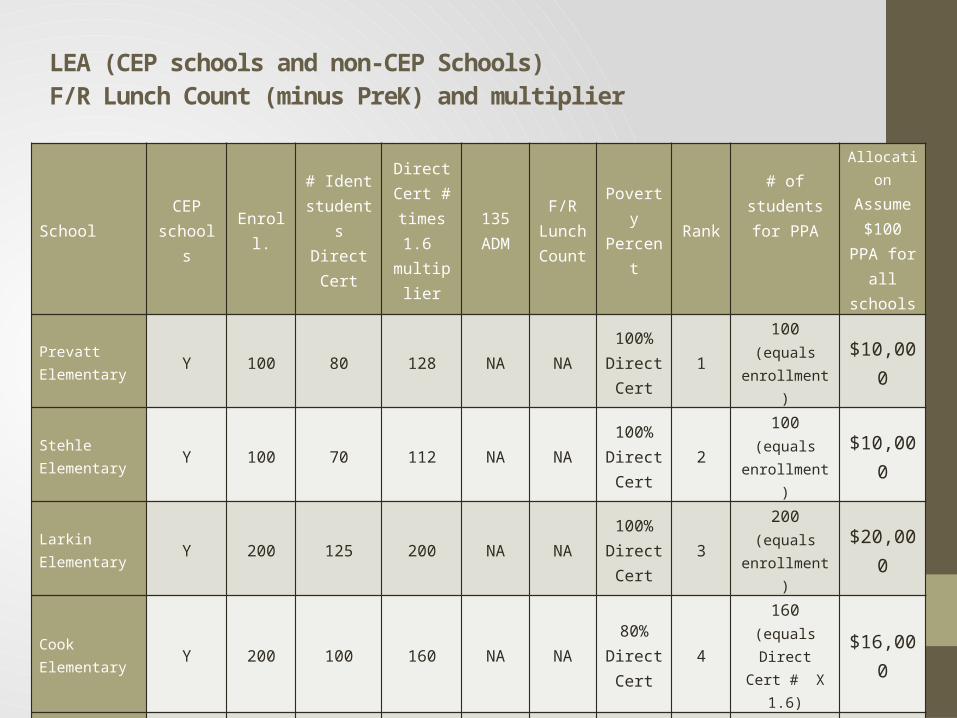
LEA (CEP schools and non-CEP Schools)F/R Lunch Count (minus PreK) and multiplier
School CEP schools Enroll.
# Ident students
Direct Cert
Direct Cert #
times 1.6 multiplier
135 ADM
F/R Lunch Count
Poverty Percent Rank
# of students for PPA
AllocationAssume
$100 PPA for all
schools
Prevatt Elementary Y 100 80 128 NA NA
100%Direct Cert
1100
(equals enrollment)
$10,000
Stehle Elementary Y 100 70 112 NA NA
100%Direct Cert
2100
(equals enrollment)
$10,000
Larkin Elementary Y 200 125 200 NA NA
100%Direct Cert
3200
(equals enrollment)
$20,000
Cook Elementary Y 200 100 160 NA NA
80%Direct Cert
4160
(equals Direct Cert # X 1.6)
$16,000
Boison Middle N 300 222 74%F/R 5 222 $35,520
Dillard Middle N 300 216 72%F/R 6 216 $21,600
Boggs HS N 300 150 50% F/R 7 150 $15,000
Stanley HS N 300 144 48% F/R 8 144 $14,400

Allocations• The general rules of per pupil allocations apply (no higher poverty
school receives a lower PPA than lower poverty schools). The number of students used as the basis of the per pupil allocation must be consistent within the LEA.
• The method must be consistently applied across district schools.
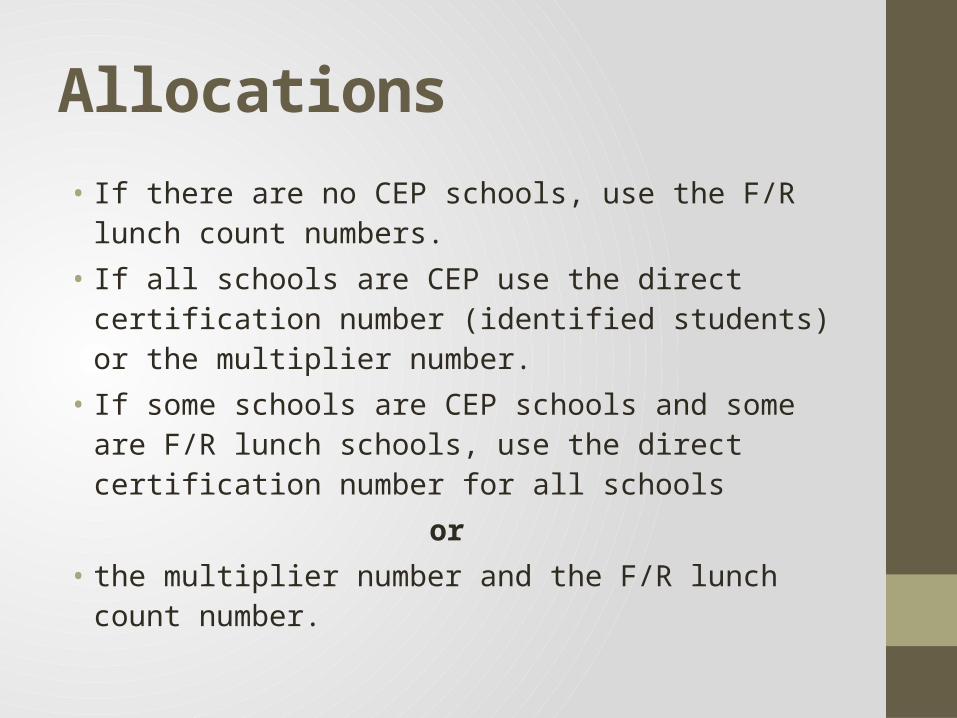
Allocations• If there are no CEP schools, use the F/R lunch count numbers.• If all schools are CEP use the direct certification number
(identified students) or the multiplier number.• If some schools are CEP schools and some are F/R lunch
schools, use the direct certification number for all schools or
• the multiplier number and the F/R lunch count number.

Accountability• Title I must assess and report annually on the progress of
economically disadvantaged students toward meeting the State’s academic goals (subsidized meals subgroup on State Report Cards).
• F/R Lunch data or CEP data may be the best source of data for accountability.

Accountability• For 2014-15 (spring 2015 testing) CEP schools will code all
students as Free in PowerSchool.• Beyond 2014-15, the State will probably need to identify one
measure common to all regarding poverty reporting• CEP identified students data may be the new F/R Lunch count.

CEP & State Funding

What will we use in 2014-15?
• Current definition of poverty – Free/reduced and/or Medicaid will be used for all state funding in FY 15 using FY 14 data.• Report card data will reflect this
information and 45-day will be updated with most current data
What will we use going forward?
•Options•Census?•Direct Cert Data?

Questions??
Related Documents