CEO Investment Cycles Yihui Pan University of Utah Tracy Yue Wang University of Minnesota Michael S. Weisbach Ohio State University, NBER, and SIFR September 28, 2015 Abstract This paper documents the existence of a CEO Investment Cycle, in which disinvestment decreases over CEO tenure while investment increases, leading to “cyclical” firm growth in assets as well as in employment. The estimated variation in investment rate over the CEO cycle is of the same order of magnitude as the differences caused by business cycles or financial constraints. This investment cycle appears to reflect CEOs’ preference for investment growth, which leads to increasing investment quantity and decreasing investment quality over time as the CEO gains more control over his board. JEL classification: G32, G34, M12, M51 Key words: Investment, disinvestment, non-performance motivated CEO turnover, CEO control of the board, overinvestment. Contact information: Yihui Pan, Department of Finance, David Eccles School of Business, University of Utah, email: [email protected]; Tracy Yue Wang, Department of Finance, Carlson School of Management University of Minnesota: email: [email protected]; Michael S. Weisbach, Department of Finance, Fisher College of Business, Ohio State University, Columbus, OH 43210, email: [email protected]. We would like to thank Zilu Chen, Shan Ge, Xingzhou Li, Jongsik Park, and Kristina Rodriquez for excellent research assistance, and Murillo Campello, Sergey Chernenko, John Core, Claudia Custodio, Dave Denis, Ran Duchin, Charlie Hadlock, Brandon Julio, Kathy Kahle, Jonathan Leonard, Karl Lins, Merih Sevilir, Andrei Shleifer, Luke Taylor, Daniel Wolfenzon, two anonymous referees, as well as seminar participants at Berkeley, Harvard Business School, Koc, Minnesota, MIT Sloan, NOVA, Ohio State, Stanford, Utah, the 2013 FMA Meeting, the 2013 Conference on Financial Economics and Accounting, the 2013 China International Conference on Finance, the 2014 ASU Sonoran Winter Finance Conference, the 2014 ASSA annual meeting, and the 2015 BI Conference on Corporate Governance for helpful comments.

Welcome message from author
This document is posted to help you gain knowledge. Please leave a comment to let me know what you think about it! Share it to your friends and learn new things together.
Transcript
CEO Investment Cycles
Yihui Pan University of Utah
Tracy Yue Wang
University of Minnesota
Michael S. Weisbach Ohio State University, NBER, and SIFR
September 28, 2015
Abstract
This paper documents the existence of a CEO Investment Cycle, in which disinvestment decreases over CEO tenure while investment increases, leading to “cyclical” firm growth in assets as well as in employment. The estimated variation in investment rate over the CEO cycle is of the same order of magnitude as the differences caused by business cycles or financial constraints. This investment cycle appears to reflect CEOs’ preference for investment growth, which leads to increasing investment quantity and decreasing investment quality over time as the CEO gains more control over his board. JEL classification: G32, G34, M12, M51 Key words: Investment, disinvestment, non-performance motivated CEO turnover, CEO control of the board, overinvestment. Contact information: Yihui Pan, Department of Finance, David Eccles School of Business, University of Utah, email: [email protected]; Tracy Yue Wang, Department of Finance, Carlson School of Management University of Minnesota: email: [email protected]; Michael S. Weisbach, Department of Finance, Fisher College of Business, Ohio State University, Columbus, OH 43210, email: [email protected]. We would like to thank Zilu Chen, Shan Ge, Xingzhou Li, Jongsik Park, and Kristina Rodriquez for excellent research assistance, and Murillo Campello, Sergey Chernenko, John Core, Claudia Custodio, Dave Denis, Ran Duchin, Charlie Hadlock, Brandon Julio, Kathy Kahle, Jonathan Leonard, Karl Lins, Merih Sevilir, Andrei Shleifer, Luke Taylor, Daniel Wolfenzon, two anonymous referees, as well as seminar participants at Berkeley, Harvard Business School, Koc, Minnesota, MIT Sloan, NOVA, Ohio State, Stanford, Utah, the 2013 FMA Meeting, the 2013 Conference on Financial Economics and Accounting, the 2013 China International Conference on Finance, the 2014 ASU Sonoran Winter Finance Conference, the 2014 ASSA annual meeting, and the 2015 BI Conference on Corporate Governance for helpful comments.

1
1. Introduction
A central question in both economics and management concerns the extent to which the CEO and
top management actually make a difference in the fortunes of companies. The literature has adopted a
variety of viewpoints about the role of the CEO and top management, ranging from a first-best world in
which the CEO always picks value-maximizing projects, to a principal-agent framework that allows for a
variety of types of agency concerns.1 While any model of the firm is by definition an approximation, how
bad of an approximation is it to ignore management and to assume investment is first best? If in fact
management does affect firm behavior, does it do so because of agency problems or an efficient
allocation of resources? More generally, how can one determine the quantitative importance of
management to our understanding of corporate investment decisions?
One way to measure the extent to which CEOs matter is to estimate the way that firms’ activities
vary over their time in office. While there are numerous differences across CEOs and firms, a CEO’s
incentives and power inside the firm vary systematically over his career, so systematic differences in firm
behavior over CEO tenure are likely to reflect these changes.
In this paper, we document striking patterns in corporate investment and disinvestment activities
over the “CEO cycle” in a large sample of publicly traded U.S. firms. Disinvestments are fairly common
in the early years of a CEO's tenure and decrease over time. Investments, on the other hand, are relatively
low in the early years of a CEO’s tenure and increase over time. The overall effect is “cyclical” firm
growth in assets as well as in employment over CEO tenure, with the firm growth rate being lower in
early years of a CEO’s tenure than in his later years. Both disinvestment and investment vary
systematically over the CEO cycle irrespective of the way we measure them, using information from
firm-level financial statements, corporate announcements, acquisition data, or segment-level data.
1 In the literature on principal-agent problems, CEOs have been accused of providing too little effort, overinvesting, underinvesting, enjoying the “quiet life”, investing in projects that maximize their own human capital, delaying recognition of mistakes, building empires that maximize their utility rather than firm value, etc. See Jensen and Murphy (1990), Jensen and Meckling (1976), Myers (1977), Bertrand and Mullinathan (2003), Shleifer and Vishny (1989), Boot (1992), Shivdasani and Yermack (1999), and Bebchuk and Fried (2004).
2
Cyclical behavior of investment and growth over CEO tenure appears to be a general phenomenon in
publicly traded corporations.
The magnitude of the changes in firm investment and growth over the CEO cycle is substantial.
For example, a one-standard-deviation increase in the number of years since the CEO took office is
associated with a 2 percentage-point increase in the annual investment rate (investment-to-asset ratio) and
a 13.2 percentage-point increase in the asset growth rate. Given that the mean investment rate in our
sample is 9.4% and the mean asset growth rate is 18.4%, the differences in investment and growth over
the CEO cycle are clearly non-trivial. The effect of the CEO cycle on investment is of the same order of
magnitude as the effects of other factors known to influence investment such as the business cycle,
political uncertainty, and financial constraints.
The correlation between the CEO cycle and firm investment could occur either because the
CEO’s choices about investment vary over the CEO cycle, or because CEO turnovers tend to occur
during periods of high disinvestment and low investment. To evaluate the possibility that the timing of
CEO changes explains the CEO investment cycle, we consider several subsamples of turnovers with
timing unlikely to be correlated with investment shocks: turnovers in which the departing CEO leaves his
job because of death or illness; turnovers in which the departing CEO is close to retirement age; turnovers
for which there are no top management changes other than the change of CEO; and turnovers following
good firm performance. CEO investment cycles exist in each of these subsamples and are of comparable
magnitude as in the full sample. Further, the CEO investment cycles are present regardless of the new
CEO’s succession origin, the CEO’s time in office, and the industry conditions at the time of turnover.
The CEO investment cycle also does not merely reflect changes occurring around CEO turnover, but
characterizes investment over the entire CEO tenure.
Since the observed pattern in investment over the CEO cycle is not driven by the timing of
management changes, it likely reflects the impact of management on corporate investment. Management
could affect investment in two different ways: investment decisions could deviate from the first best
because of agency conflicts, or management changes could lead to efficient investment that varies over
3
the CEO cycle. We perform a series of tests to evaluate these explanations. However, regardless of
whether investment is efficient or inefficient, the existence of economically important variation in
investment over the CEO cycle implies that, inconsistent with traditional economic models that ignore the
roles of managers, management has a large impact on firms’ investments.
One possible explanation for the investment cycle is based on agency conflicts with the CEO. For
many reasons, CEOs usually prefer their firms to grow, potentially at the expense of shareholder value
maximization. The board of directors is an important constraint on CEOs’ ability to deviate from the
shareholders’ interest. However, as a CEO becomes more powerful in the firm over time, he will have
more sway over his board and will be able to undertake investments that maximize his utility at the
expense of firm value. At the same time, the CEO is reluctant to divest assets that he has acquired, even if
the firm is no longer the optimal owner of the assets. CEO turnover can facilitate re-optimization of these
bad assets, since the incoming CEO does not necessarily enjoy the same private benefit from assets
established by the predecessor. Eventually, the process is repeated during each CEO cycle.
We confirm that a number of predictions of this agency explanation hold in the data. First, since
an uncaptured board of directors is an important factor that limits the CEO’s ability to overinvest, the
agency explanation implies that more direct measures of the CEO’s control over the board should be more
powerful at explaining the investment increases than the CEO’s tenure in office. We measure the CEO’s
capture of the board by the fraction of the board appointed during his tenure, and find that the increasing
CEO influence on the board over his tenure explains the positive relation between CEO tenure and
investment, even when the CEO power comes exogenously through changes in the fraction of directors
reaching retirement age over time.
Second, we find that the quality of a firm’s investments, measured by the market reaction to
acquisition announcements, decreases with CEO tenure and becomes on average negative during the later
portion of his time in office. This deteriorating investment quality also appears to be a function of the
CEO’s control of the board. These findings suggest that the increases in the quantity and the decreases in
the quality of investments over the CEO cycle is likely driven by the CEO’s preference for growth, which

4
becomes more relevant when the CEO gains more control over his board and can exercise more discretion
over the firm’s investments.
Third, using segment-level data, we show that the poor investment decisions tend to be reversed
only after the original CEO steps down and the new CEO takes office. The degree of reversal negatively
depends on the prior management’s residual influence on the new CEO, even when the residual influence
occurs for exogenous reasons.
Alternatively, CEO investment cycles could exist even if investment over CEO tenure is efficient
at all times. Suppose, for example, a CEO’s ability to identify positive NPV projects improves over time,
so an optimal investment policy would entail increasing investment over tenure. However, this
explanation is not consistent with the deteriorating investment quality (to negative NPV) over CEO tenure.
Further, we find that the increase in the CEO’s capture of the board due to directors reaching retirement
age, which is unrelated to CEO ability, still leads to an increase in investment level and a decrease in
investment quality. Consequently, it appears that the CEO investment cycle is not driven by changes in
CEO ability over time.
In addition, efficient changes in investment could occur following turnovers if they reflect the
match between the new CEO’s skills and firm assets. Such matching predicts high disinvestment right
after CEO turnover, since the assets that match well with the outgoing CEO’s skills do not necessarily
match well with the incoming CEO’s. However, it does not predict increasing investment over the entire
CEO tenure. In addition, in contrast to this view, we find that the magnitude of the disinvestment cycle
does not depend on the degree of fit between the new CEO’s prior work experience and the firm’s
existing asset structure.
The existence of an economically meaningful CEO investment cycle has a number of
implications. First, there has been much work on external factors that affect investment, such as the
business cycle, political uncertainty, and conditions of the financial markets. Our results suggest that the
impact of management-related factors on investment is quantitatively as important as these external
factors. Second, our results provide insights on the types of agency problems that are likely to be

5
important for understanding the investment decisions in public companies; they suggest that the empire-
building preference is likely an important factor leading to investment inefficiencies in public companies.
Although the literature arguing that mangers tend to build “empires” is enormous and dates back to
Baumol (1959), Marris (1964), Williamson (1964), and Donaldson (1984), its empirical relevance has
been debated. Third, the results imply that a policy of regular management turnover in public corporations
potentially can be valuable. Such a policy will likely minimize overinvestment resulting from a CEO’s
growing capture of his board, and facilitate re-optimization of investments.
This work is related to the literature that aims to establish and quantify systematic managerial
influences on firm policies and value. Several influential studies examine whether CEO-specific styles
affect firm policies (see Bertrand and Schoar (2003), and Fee, Hadlock and Pierce (2013)). The literature
also has drawn inferences about the value of CEOs based on rare events such as CEO death (Johnson et al.
1985, Bennedsen et al. 2007) and hospitalization (Bennedsen et al. 2012). Finally, using an approach
based on systematic changes in stock return volatility after the CEO takes office, Pan, Wang, and
Weisbach (2015a) estimate that CEOs contribute a nontrivial amount to firm values. Documenting the
way in which firm policies vary over the CEO cycle is an alternative approach to identify and to quantify
potential systematic managerial effects.
This work also extends a literature on firm behavior around CEO turnovers. Using a much earlier
sample than ours, Murphy and Zimmerman (1993) document systematic changes in a number of
accounting variables around CEO turnover, which the authors conclude are mainly driven by poor pre-
turnover firm performance. Denis and Denis (1995) find that firms’ assets, number of employees, and
capital expenditures all decrease following forced CEO turnovers. In addition, they document that these
restructurings are associated with cost-cutting measures, plant closings and other corporate refocusing
activities. Weisbach (1995) finds that the likelihood of divesting poorly performing deals to be unusually
high immediately following CEO turnovers based on a small sample of large acquisitions.2 Our analysis
2 In addition, there is a large literature in accounting documenting that CEOs manage earnings for career concerns using both accrual manipulation and investments in R&D and advertisement, especially around CEO turnovers (see Dechow, Ge, and Schrand (2010) for detailed discussion and references).

6
extends this earlier work in a number of ways. We show that the phenomena documented by these papers
are only part of a larger process by which investment and growth are related to the CEO cycle.
Finally, our study contributes to the literature on the interaction between CEOs and their boards.
Our analysis suggests that a major determinant of CEO investment cycles is the fact that the relationship
between the CEO and his board changes over his tenure. The residual influence of the prior leadership on
the board could prohibit a new CEO from disinvesting poorly performing assets established by the prior
leadership. Thus, board turnovers accompanying CEO turnover can facilitate reoptimization. Over time,
however, the board tends to become captured by the CEO and the CEO’s ability to overinvest increases.
These two effects combine to give investment a cyclical pattern over a CEO's career. Coles, Daniel and
Naveen (2014) documents the role of a non-coopted board in corporate governance. Our study further
highlights the importance of regular CEO turnover as one of the institutions that allow firms to correct
managerial mistakes.
2. Data
2.1. CEO Turnover and Tenure
Our sample includes 4,219 CEO turnovers in 2,991 firms between 1992 and 2009. We identify
CEOs based on the information in the ExecuComp database. We use the information on job title, the year
becoming CEO, and the CEO annual flag provided in ExecuComp to identify CEOs at the firm-year level.
For each firm, we compare the designated CEO in each fiscal year with the CEO in the previous year to
identify whether there is a CEO turnover in that year.
Panel A of Table 1 describes the distribution of turnovers over time. For each new CEO, the
variable “Tenure” equals 0 for the fiscal year in which the CEO takes office, and increases with each year
the CEO is in office. The average tenure in our sample is 5.4 (median 5), and the standard deviation is 4
years. The average age of the incoming CEO at the time of turnover is 54.

7
2.2. Corporate Investment
We consider two major forms of corporate investment: capital expenditures and acquisitions. We
define Capx Rate as capital expenditures scaled by the total book assets at the beginning of the year, and
Acquisition Rate as the value of acquisitions scaled by the total book assets at the beginning of the year.
Acquisitions include completed deals covered in the SDC database, either acquisition of assets or equity
interests. For each sample firm, we include both domestic and international acquisitions with disclosed
transaction values above $1 million over the sample period.3 Investment Rate is defined to be the sum of
Capx Rate and Acquisition Rate. Panel B of Table 1 reports that the average Capx Rate is 5.9% (median
3.6%), the average Acquisition Rate is 3.8% (median 0%), and the average total Investment Rate is 9.4%
(median 4.6%).
We also examine the intensity of corporate announcements about expansion or acquisition over
CEO tenure. The business expansion news includes “Event 3” (“Seeking Acquisitions/ Investment”) and
“Event 31” (“Business Expansion”) from the “Key Developments” database from Capital IQ. We further
augment these announcements with the acquisition announcements from the SDC Platinum. Based on the
announcement date of each event, we define a monthly investment indicator variable I{ investment announcement(s)
in the month} that equals one if the company has either expansion or acquisition announcements in the month.
Panel B of Table 1 documents that 7.9% of firm-months contain investment announcements.
Further, we identify new business units by examining whether a new segment ID appears in a
given year (provided it is not the first year the company appears in the segment data base) and exists for at
least 2 years. About 13.6% of all firm-segment-year observations in our sample consist of newly initiated
segments.
2.3. Corporate Disinvestment
To identify corporate disinvestment activities in a given fiscal year, we use data on both
discontinued operations from COMPUSTAT and asset sales from SDC Platinum Mergers & Acquisitions
Database. We consider the firm to have discontinued operations (“I{discontinued operations>0}”=1) if the firm
3 We exclude leveraged buyouts, exchange offers, repurchases, spinoffs, minority stake purchases, recapitalizations, self-tenders, and privatizations.

8
reports income or loss from discontinued operations ( “DO” in COMPUSTAT), and asset sales (“I{asset
sales>0}”=1) if the firm is indicated by SDC as the target company in transactions of “Acquisitions of Assets”
or “Acquisitions of Certain Assets”. Panel B of Table 1 reports that 9.8% of the firm-year observations
have asset sales, about 19.7% have discontinued operations, and 24.9% have at least one of these types of
disinvestment activities.
An alternative way to identify disinvestment activities is to use corporate announcements
obtained from the “Key Developments” database from the Capital IQ database (coverage starting in
2001): “Event 1” contains announcements of “Seeking to Sell/Divest” and “Event 21” captures
announcements related to “Discontinued Operation/Downsizing”.4 Based on the announcement date of
each event provided by Capital IQ, we define a monthly disinvestment indicator variable I{ downsizing
announcement(s) in the month} that equals one if the company announces either Event 1 or Event 21 or both in a
month. Panel B of Table 1 documents that 4.4% of firm-months contain disinvestment announcements.
Further, we use information from COMPUSTAT “historical segment” data to measure the
divestiture or discontinuation of investments at the segment level for all multi-segment firms in our
sample. We start with all operating/business segments with positive sales over the sample period, and
track them through time using the unique segment ID provided by COMPUSTAT. We identify
divestitures or discontinuations of segments (I{ segment termination}=1) when a distinct segment ID disappears in
a particular year and does not reappear in the sample subsequently. The likelihood a segment will be
terminated in a particular years is 11.0%. We measure segment performance using segment-year level
operating profit/loss scaled by sales.5
We also measure the combined effect of disinvestment and investment on a firm. Since both
disinvestment and investment can affect the size of the firm’s physical asset and labor, we construct Asset
4 Both Event 1 and Event 21 appear to capture ongoing or intended disinvestment activities. Sample headlines for these events: “ADC Telecommunications to close LeSueur facility”; “BSQUARE Corp. intends to close its information division in San Diego”. 5 The COMPUSTAT segment data is an imperfect measure of firms’ lines of business and their profitability (see Maksimovic and Phillips (2007)). However, the concerns about the use of segment data to measure segment profitability are unlikely to be systematically correlated with CEO tenure. Unreported robustness checks using segment start or termination measures conditional on a contemporaneous increase or decline in the firm’s total assets lead to similar results to those reported in the paper.

9
Growth Rate as the annual growth rate of the firm’s book assets and Employment Growth Rate as the
annual growth rate in the number of employees. The average Asset Growth Rate is 18.4% (median 6.6%).
The average Employment Growth Rate is 7.9% (median 2.4%).
2.4. Other Firm Characteristics
To control for other factors that potentially affect investment or disinvestment intensity, we also
include a set of firm characteristics in our econometric specifications. Panel C of Table 1 contains
summary statistics of these variables. The average firm in our sample has book assets of about $1.2
billion (=exp(7.334)), 24% of leverage (total debt divided by total assets), and market-to-book equity ratio
of 2.9. The average industry-adjusted ROA is 5.4% (median 3.2%), and the average industry-adjusted
stock return is 15.1% (median 3.7%). Slightly more than half of the firms pay dividends.6 All variables
described in Sections 2.2-2.4 are winsorized at the top and bottom 1% of the distribution in the
COMPUSTAT universe. Appendix A presents definitions of all variables.
3. Measuring the CEO Investment Cycle
3.1. Investment and CEO Tenure
We first consider the way in which corporate investment varies with CEO tenure from three years
prior to turnover (year 0) until 6 years following the turnover. Plot A of Figure 1 graphs the average
investment rate by tenure year. This figure suggests that there is no obvious declining trend in the
investment rate prior to the CEO turnover. During the turnover year, however, the investment rate drops
by about 2.5 percentage points and then increases continuously over CEO tenure. The total investment
rate increases from 8.45% in year 0 to 10.44% in year 6, a 24% increase.
In Panel A of Table 2, we estimate equations predicting the investment rate as a function of CEO
tenure, controlling for firm characteristics that potentially affect investment. We include firm-CEO fixed
effects in each equation, so that the estimates can be interpreted as representing the change in investment
within a particular CEO’s career in a given firm. The within-firm-CEO variation also helps to mitigate the
6 The average industry-adjusted performance measures are different from zero because we construct the industry averages using the COMPUSTAT universe, not just our sample firms.

10
survivorship bias in the estimation. The estimated coefficient on Tenure in Column (1) indicates that the
annual investment on average increases by 0.5 percentage point a year during the CEO’s tenure. If we
take the average investment rate in our sample (9.4%) as the “typical” rate, then our result implies that a
one-standard-deviation increase in Tenure is associated with an almost 21% (=0.5%*4/9.4%) increase
relative to the typical investment rate.
3.1.1. Subsamples of Turnovers Unlikely to be Motivated by Performance
An important issue in interpreting the relatively low investment rates and high disinvestment rates
in the early years of a CEO’s tenure is the extent to which they reflect the timing of turnovers coinciding
with times when it is desirable for firms to cut investment. For this reason, we present estimates of the
specification used in Column (1) on the firm-years after the subsamples of CEO turnovers that we believe
to be unlikely to coincide with periods of low investment.
One group of turnovers that are unlikely to coincide with bad investment shocks are those caused
by death or illness of the departing CEOs. We use Factiva news search to identify such a subsample of
turnovers and form our first subsample consisting of these death/illness motivated turnovers.7 In addition,
we follow Jenter and Lewellen (2014) and classify all turnovers occurring when the outgoing CEO is
between age 64 and 66 as retirements. We group these likely retirements together with the death/illness
turnovers to form a second subsample of turnovers that are unlikely to coincide with bad investment
shocks. To mitigate the incidence of “suspicious retirements,” following Fee et al. (2013), we also create
a modified version of the second subsample by additionally requiring that death, illness, retirements be
preceded by above industry-year median ROA in the year prior to the turnover.
Turnovers for which the CEO change is not accompanied by other changes in the top
management team, which we refer to as the “no management shakeup” subsample, are also likely not to
coincide with poor firm performance and low investment. Finally, because performance-driven turnovers
tend to be preceded by high stock return volatility or poor stock and accounting performances, we
consider the subsample of turnovers that are preceded by both good performance (both stock return and
7 We thank Edward Fee, Charles Hadlock, and Joshua Pierce for kindly providing us with their classification of illness, death related, and outright forced turnovers.
11
ROA above industry-year median) as well as low idiosyncratic volatility (below industry-year median) as
another subsample of turnovers unlikely to have been performance-motivated.
Panel A of Table 1 reports the number of turnovers in each subsample. We have 125 turnovers
occurring because of death or health issues of outgoing CEOs, 359 because of death or health issues or
retirements, 175 when we further condition on the death, illness, or retirement occurring following good
performance, 1032 turnovers that are not accompanied by top management shakeups, and 795 turnovers
preceded by good performance and low volatility. The union of these subsamples accounts for 1,826
turnovers, accounting for 43% of the 4,219 turnovers in our sample.
Columns (2) to (6) in Panel A of Table 2 present estimates of the equation predicting investment
as a function of CEO tenure in each of these subsamples. In each column, the coefficient on Tenure is
positive and statistically significant. In addition, the magnitudes of the estimated CEO cycle effect in
these subsamples of likely non-performance-driven turnovers are all close to the estimate obtained using
the full sample of turnovers in Column (1), suggesting that changes in the investment rates over a CEO’s
tenure are unlikely to be driven by shocks to investment opportunities coinciding with the departures of
the outgoing CEOs.
3.1.2. The Shape of the Investment-Tenure Relation
The rate at which the investment rate increases is not necessarily constant over CEO tenure. To
evaluate potential nonlinearities in this relation, we estimate two specifications that allow for changing
investment rates over tenure. We present the results in Panel B of Table 2. In each specification, we
break the CEO’s entire tenure into three time periods, Years [0,2], Years [3,5], and Years [6 and after].
The cutoff points, 3 and 6, correspond to the median and 75th percentile of the firm-year level tenure
distribution. In Column (1), we replace the continuous Tenure variable with two time period dummies for
Years [3,5] and Years [6 and after] (with the dummy for Years [0,2] being the omitted one). The
estimates imply that the investment rate in Years [3,5] is about 0.6 percentage points higher than that in
Years [0,2], and the investment rate in Years [6 and after] is 0.8 percentage points higher than in Years
[0,2]. In Column (2), we use a spline specification that measures the speed of investment increase

12
separately for each time period. The estimates from this specification imply that investment increases the
fastest in the first three years at the average speed of 0.8% per year, and then slows down to an average
increase of 0.4% per year in the two later periods. Overall, the results in Panel B of Table 2 suggest that
investment increases throughout the CEO’s tenure, and that the increase is fastest during the first three
years.
3.1.3. Alternative Measures of Investment
In most of our analyses, we combine capital expenditures and acquisitions. In Panel A of Table
IA.1 in the Internet Appendix, we estimate the CEO investment cycle using capital expenditures and
acquisitions separately. The results suggest that capital expenditure and acquisition rates each increase
significantly over CEO tenure. However, the magnitude of the increase for acquisitions is larger than that
for capital expenditures.
Next, we estimate corporate investment using two different data sources: corporate
announcements of business expansion and acquisitions and establishment of new segments. The results
using corporate announcements are presented in Columns (1) and (2) of Panel C of Table 2. The
likelihood of a company announcing expansion or acquisition increases by 0.1 percentage point per
month or 1.2 percentage points per year during a CEO’s tenure, consistent with the results reported in
Panel A using financial statement information. The same pattern holds after turnovers due to death, illness
or retirement of the outgoing CEO. In Columns (3) and (4) of Panel C of Table 2, we estimate the
likelihood of starting a new segment in a particular year. Again, the probability of establishing a segment
is significantly lower in the early years of a CEO’s tenure than in his later years.8
3.1.4. Alternative Benchmark Investment Rate
The baseline specification of the investment-tenure regression includes firm-CEO fixed effects,
so the tests we present effectively compare the investment rate later in a CEO’s tenure to that during the
8 There was a change in how segments were reported in 1997-1999 (SFAS 131). This rule could potentially have led some firms to disaggregate segment data, which would have looked like an expansion in our specification. In unreported analysis, we reestimate the equations reported here on the subsample of turnovers occurring after 1999, and obtain results similar to those reported here. In another unreported analysis, we define segment starts conditional on a contemporaneous increase in the firm’s total assets and segment termination conditional on a contemporaneous decrease in the firm’s total assets. All the results using the segment data are robust to this modification.

13
same CEO’s earlier years in office in the same firm. An alternative approach is to compare investment
across firms and measure whether, holding other factors constant, investment in a firm with a CEO in his
later years of tenure is larger than that in a comparable firm with a CEO in his earlier years of tenure. To
implement this approach, we match each firm-year for which the CEO has been in office for more than
three years (the sample median), to a peer firm with below-median CEO tenure in the same two-digit SIC
industry-year with the closest firm size, measured by total book assets. After this matching process, the
difference in the average firm size between matched firms is less than 4% and is not statistically
significant.
We then compare the investment rate of firms with CEOs having greater than three years of
tenure and that of their matched peer firms in a multivariate regression, controlling for other firm
characteristics that are likely to be related to the firms’ investment opportunities. We present the
estimated equation in Column (1) of Table 2, Panel D. The estimates indicate that investment rates of
firms with CEOs who have been in office for more than 3 years are significantly higher than those in the
peer firms by 1.3% per year. This effect is economically meaningful given that the average investment
rate in the sample is 9.4% (median 4.6%). In Column (2), we restrict the sample to those firms with CEOs
who have been in office for more than 6 years (the 75th percentile of the sample distribution) together with
their matched peer firms. In this equation, the estimated effect of longer tenure is 1.4% higher investment
per year. These results suggest that CEOs in the later years of their tenure invest not only more than they
do in their own early years of tenure, but also more than comparable firms with CEOs who are in their
early years of tenure.
3.2. Disinvestment and Growth over CEO Tenure
Plot B of Figure 1 graphs the average probability of disinvestment by tenure years. There is no
obvious trend in the likelihood of disinvestment prior to year 0. The disinvestment probability jumps up
by 5.8 percentage points in the turnover year, becoming as high as 27% in year 1, and monotonically
decreases subsequently. By year 6, the likelihood of disinvestment decreases to 20.9%, a 23% reduction
relative to year 1.

14
Panel A of Table 3 presents estimates of multivariate equations predicting the likelihood of
disinvestment as a function of CEO tenure and CEO and firm characteristics. We first estimate an
equation predicting the likelihood of disinvestment as a function of CEO tenure in Column (1). The
negative and significant estimated coefficient on tenure implies that a one standard deviation increase in
CEO tenure is associated with a ten percentage point decline in the likelihood of disinvestment, compared
to an average disinvestment probability of 25% (standard deviation 43.3%) in our sample.
Columns (2)–(6) present estimates of this equation for the subsamples of firms that follow the
turnovers which are unlikely to coincide with high disinvestment. In each case, the disinvestment
probability appears to be higher in the early years of the CEO’s tenure than in later years. These findings
suggest that the empirical finding of decreasing likelihood of corporate disinvestment over the CEO’s
tenure does not occur because of CEO turnovers coinciding with other factors that lead to high
disinvestment.
Panel B of Table 3 considers the likelihood of downsizing related news announcements and the
segment termination/reorganization (for multi-segment firms) over CEO tenure. Consistent with the
decreasing likelihood of disinvestment over tenure documented in Panel A, we find that the probability of
downsizing related corporate news and the likelihood that a segment is terminated or reorganized are also
significantly higher in a CEO’s earlier years in office than in the later years, both in the full sample and
after turnovers due to death, illness, or retirement of the departing CEOs.
An implication of changing investment and disinvestment behavior is that the firm’s total asset
and employment will also grow over CEO tenure. Table 4 documents that both growth rates do indeed
increase over CEO tenure. The estimates in this table indicate that a one standard deviation increase in
CEO tenure is associated with a 13.2% increase in the asset growth rate and 6% in the employment
growth rate. Given that the average asset growth rate is 18.4% (standard deviation 63.9%) and the average
employment growth rate is 7.9% (standard deviation 32.8%), the difference in these growth rates over
CEO tenure is clearly substantial. The behavior of the growth rates in assets and employment over the
CEO cycle is likely reflective of the cyclical disinvestment and investment documented above.

15
3.3. Robustness
The estimates in Tables 2-4 suggest that the CEO investment cycle is an important characteristic
of firms’ investments. We next discuss the robustness of these results to a number of alternative
specifications and samples. The results are reported in Internet Appendix A.
3.3.1. Alternative Scaling of Investment and Disinvestment
In our estimates of the effect of CEO tenure on investment and disinvestment, we have scaled
investment by the book value of assets at the beginning of the year. Alternatively, we could have scaled
by a different variable such as sales, by a variable measured before the CEO turnover rather than at the
time of the investment which is not affected by any actions of the incoming CEO, or even not scaled at all
and estimated the equations using the raw investment or disinvestment. Table IA.1 in the internet
appendix presents estimates of the equations from Tables 2 and 3 using these alternative approaches to
scaling investment and disinvestment. The results in each estimated equation are similar to those reported
in Tables 2 and 3. These results suggest that the reported relation between CEO tenure and
investment/disinvestment does not depend on the way we have chosen to scale these variables.
3.3.2. Non-Classified Turnovers, Forced Turnovers, Insider Successions
Table IA.2 presents estimates of the equations in Tables 2, 3 and 4 on subsamples constructed to
follow turnovers of different types. Panel A reports the results using the subsample for which the turnover
reason is unclassified, Panel B for the subsample of turnovers that appear to be outright forced, and Panel
C for insider successions. The estimated CEO investment cycle effects following non-classified turnovers
and insider successions are similar to that in the full sample and those in the various subsamples of likely
non-performance-driven turnovers. In contrast, following forced turnovers, disinvestment is larger and the
growth rate is lower than in the entire sample.
3.3.3. Excluding Turnover Years
Another possibility is that the investment cycle could merely reflect short-term changes in
investment around the time of the turnover. To evaluate whether the investment cycle is solely a function
of behavior surrounding CEO turnovers, or a phenomenon that occurs throughout the CEO’s tenure, we
16
reestimate our equations excluding the turnover year and the subsequent year. These results are presented
in Table IA.3. Consistent with the notion that the CEO investment cycle is not merely a turnover year
occurrence, the estimated magnitudes of CEO investment cycles are comparable to those in the full
sample.
3.3.4. CEO Career Cycle vs. CEO Life Cycle and Firm Life Cycle
Firm investment and growth can also vary with a CEO’s age and a firm’s age. Yim (2013) finds
that younger CEOs are more likely to engage in acquisitions than older CEOs. In addition, younger firms
tend to have higher investment and growth rates than do older firms. Because we include firm-CEO fixed
effects in the main specifications, we cannot identify the effects of a CEO’s age or the firm’s age on
investment. For this reason, we present estimates of our main equations in Panel A of Table IA.4,
controlling for both CEO age and firm age but no firm-CEO fixed effects. The results in Panel A suggest
that the CEO tenure effect is the opposite of the life cycle effects: investment and growth rates increase
with CEOs’ time in office, but decrease with CEO age and firm age.
Because this specification does not contain firm-CEO fixed effects, we re-estimate the main
specification (with the usual set of controls and firm-CEO fixed effects) for a subsample of 163 CEOs
who change employers during our sample period in Panel B, and subsamples with young CEOs (CEOs
younger than the sample median age of 52 when taking office), old CEOs (those older than 52 when
taking office), young firms (firms that entered our sample younger than the sample median age of 8), and
old firms (firms that entered our sample older than 8) in Panel C. The estimated coefficients on Tenure
reported in Panels B and C of Table IA.4 suggest that the CEO investment cycles exist in all subsamples
with similar magnitude, and thus are not driven by CEO or firm age.
3.4. Benchmarking the Magnitude of the CEO Investment Cycle
The CEO investment cycle leads to variation in investment likely caused by forces internal to the
firm. As a benchmark to assess the magnitude of the CEO investment cycle, it is useful to compare its
size to estimates of other factors that are known to affect investment. In particular, the literature has
argued that external factors such as the business cycle, political uncertainty due to the election cycle and
17
financial constraints can affect a firm’s investment. Table 5 surveys estimates of the extent to which these
factors affect investment. To estimate the effect of business cycles on investment, we re-estimate
equations from Tables 2-4, including an indicator variable for recession years. These estimates are
presented in Table IA.6 in Internet Appendix B. For estimates of the effect of political uncertainty on
investment, we rely on Julio and Yook (2012), and for estimates of the effect of financial constraints on
investment, on Hoberg and Maksimovic (2015). The detailed discussion is in Table 5.
This summary table indicates that the incremental effect of a one-standard-deviation increase in
Tenure is of the same order of magnitude as being in recession or being in an election year or facing
financial constraints during the latest financial crisis. These numbers suggest that the effect of the CEO
investment cycle is substantial in magnitude, comparable to other factors that are commonly accepted to
be important determinants of investment.
4. Potential Reasons for the CEO Investment Cycle
Because the CEO investment cycle is substantial in magnitude and present in public firms
regardless of the circumstances of the turnover, it is important to identify the theories that could explain
the existence of this cycle and to distinguish between them empirically. One view that clearly is not
consistent with the CEO investment cycle is the traditional economic view, in which the firm is a
collection of physical assets that always chooses profit-maximizing actions. Since management plays no
role, this view implies that firm investment and growth should not depend on the CEO’s time in office.
To explain the CEO investment cycle, one must incorporate an explicit role for management, and
the CEO in particular. This role could exist because the CEO is entrusted by the owners to make decisions
about the way the firm’s resources will be used. However, since the CEO is self-interested, he will
sometimes make decisions that maximize his utility rather than firm value. As we discuss below, such
non-value-maximization leads naturally to an agency-based explanation for the CEO investment cycle.
Alternatively, the CEO himself can be viewed as an asset, who provides skills to the firm that can be used
to maximize profits. If a new CEO arrives with a different set of skills than his predecessor or the CEO’s

18
ability to invest improves over time, it could be optimal for the firm to change its assets so as to better
complement the new CEO’s skills. These views are not mutually exclusive and both probably are relevant
to some extent. To evaluate their relative importance, we discuss the implications of each for the CEO
investment cycle and test these predictions on our sample. We summarize the alternative explanations for
the CEO Investment Cycle and their implications in Table 6, as well as the empirical evidence presented
below that evaluates these implications.
4.1. Management as a Decision-Making Agent: Implications for the CEO Investment Cycle
There are many reasons why CEOs could prefer to grow their firms rather than to shrink them. A
CEO’s pay and prestige are generally positively correlated with firm size, adding units that diversify the
firm can lower the risk of a CEO’s personal financial position in the firm and his human capital, a CEO
can purchase “glamorous” divisions that are fun to manage, a CEO can create new positions for favorite
employees through growth, or a CEO could have “hubris” and overestimate his ability to add value to a
line of business.9 These arguments imply that a CEO is likely to prefer the firm to grow more than is
optimal from the shareholders’ perspective. Consequently, factors that constrain management from taking
as many investments as it wants are important contractual elements of the firm. For example, Jensen
(1986) focuses on the role of debt in constraining managers’ propensity to overinvest. Another source of
constraints on management’s ability to invest as it chooses is the board of directors.
The board of directors is particularly relevant for understanding CEO investment cycles, since the
CEO’s influence over the board is likely to increase over time. As emphasized by Hermalin and Weisbach
(1998), so long as a CEO is infra-marginal relative to a potential replacement, he will have some
influence over the director selection process and will have incentives to use this influence to appoint
directors who are less likely to oppose his will. Over time, boards will evolve towards ones that are loyal
to the CEOs that appoint them, and thus less likely to constrain the CEOs from undertaking whichever
investments they want. Therefore, the dynamics of the board and its loyalty to the CEO, together with the
9 The literature arguing that managers tend to build “empires” is enormous and partially summarized in the introduction. See also Roll (1986), Morck, Shleifer and Vishny (1990), and Jensen (1993).

19
CEO’s preference for investments even if they are not value-maximizing, could potentially lead to the
increase in investment with CEO tenure that we document in Table 2.
Implication 1: CEO Power and Investment. Holding other factors constant, the increase in
investment over CEO tenure should come through the CEO’s control over the board of directors.
Therefore, controlling for the CEO’s influence on the board should lessen the estimated effect of CEO
tenure on investment.
Implication 2: Quality of Investments over CEO tenure. Holding other factors constant, the
quality of firms’ investments should decrease with the CEO’s tenure, and should also be related to the
CEO’s control of the board.
If CEOs enjoy private benefit from growing the firm and tend to overinvest as they gain more
control of the board, then they are unlikely to divest the assets that they have acquired, even if the assets
turn out to be less profitable than expected.10 In addition, the market sometimes views divestitures as
essentially an admission of a mistake and divesting poorly performing assets can reflect poorly on the
CEO (see Kanodia, Bushman, and Dickhaut (1989) and Boot (1992)). When a new CEO arrives, he does
not necessarily enjoy the same private benefits from these assets and could be less averse to admitting his
predecessor’s mistakes. Therefore, a new CEO is likely to sell poorly performing assets at a higher rate
than the outgoing CEO. Moreover, a natural additional testable implication of this agency view of post-
turnover disinvestment is as follows.
Implication 3: The Influence of Prior Management. The influence that the old management has
on the new CEO after turnover should negatively affect his willingness to divest poorly performing assets
acquired by the prior management.
This view of the CEO as a decision-making agent who sometimes puts his personal agenda ahead
of the firm’s, can therefore explain both portions of the CEO investment cycle. When a new CEO takes
office, he will tend to disinvest poorly performing assets established by the predecessor. As the CEO
becomes more powerful over time, he will have more sway over his board and will be able to undertake
10 Discussion of private benefits of control goes back at least to Berle and Means (1932) and private benefits have become a key element of many models of corporate governance (see Tirole (2006), pp. 16-17 for example).

20
and hold onto investments that maximize his own utility. When this CEO steps down, the pattern of
investments is repeated over the next CEO’s tenure.
4.2. Management as an Asset: Implications for the CEO investment Cycle
When a CEO is viewed as an asset rather than just a decision-maker, his ability should be an
important determinant of not only the level of the firm’s investment but also the composition of its assets.
Maksimovic and Phillips (2002) provide a skill-based explanation for the high disinvestment rate
following management changes. In this model, conglomerate firms choose their asset structure based on
the relative productivity of its business segments, which in turn depends on the CEO’s relative skill in
managing assets in different industries. In such a world, if the CEO changes and the incoming CEO has
different skills from the outgoing one, then it is possible that the optimal set of assets the firm should own
will change, leading to divestitures. Applying the Maksimovic and Phillips (2002) logic to CEO turnover
yields the following implication:
Implication 4: The Fit of the Incoming CEO’s skills with the Firm’s Assets. Holding other factors
constant, the more that the new CEO’s skills differ from the firm’s current asset structure, the more
divestitures will be observed after CEO turnover.
The skill-based arguments, however, do not predict that divested units should have unusually bad
performance beyond being hit by negative shocks outside of the management’s control, because the firm
should be the optimal owner of the asset prior to the CEO change. In addition, this argument does not
predict increasing investment levels over CEO tenure, nor do they predict that the CEO’s control of the
board should explain the investment over CEO tenure. To explain the increase in investment over CEO
tenure in a world in which all investment is first best, something like the CEO’s ability to identify positive
NPV projects must systematically improve over time, possibly through learning by doing. But in contrast
to the agency explanation, investment quality should not deteriorate (to negative) over time, since
investment is always efficient under this view.
A variant on the CEO skills explanation is that uncertainty about a CEO’s ability could create
additional risk for the firm, which in turn could affect the firm’s cost of capital (see Pan, Wang, and

21
Weisbach (2015b) for evidence consistent with this view). Changes in this uncertainty could potentially
lead to a pattern in investment similar to what we report above. However, similar to the CEO skills
explanation, it does not imply that investment quality would decline to negative over time.
5. Distinguishing between the Explanations for the Existence of CEO Investment Cycles
5.1. CEO Power and Investment
5.1.1. The CEO’s Capture of the Board and Investment
To test Implication 1, that the increase in investment over CEO tenure is a function of the CEO’s
growing power over his board, we construct a variable that is likely to be highly correlated with the
CEO’s power over the board as well as his tenure, and evaluate the extent to which this variable explains
the relation between CEO tenure and corporate investment. Specifically, we calculate the fraction of “co-
opted” directors, who are appointed after the CEO takes office (“% of New Directors”). The idea,
formalized in Hermalin and Weisbach (1998), is that the CEO will use his influence to ensure that the
firm appoints directors who are unlikely to oppose any actions he wishes to take. Existing empirical
studies also provide evidence that co-opted boards are indeed associated with less board monitoring.11
We construct this variable using data from ISS Governance Services, which provides the starting
and ending years for each director in the S&P 1500 firms during 1996 to 2011, with comprehensive data
for S&P 1500 firms starting from 1998. For each firm-year in our sample, we count the number of
directors who start their directorship since the current CEO took office, and scale it by the total number of
directors on the board in that year. By construction, % of New Directors is highly correlated with the
CEO’s time in office: The correlation between the two is 0.64, which is much higher than the correlations
between CEO tenure and other proxies of CEO power (e.g., 0.13 with CEO ownership, and 0.23 with
CEO being Chairman).
11 Morse et al. (2011) and Coles et al. (2014) document that board cooption is associated with a higher level of managerial pay, but less incentives provided to managers, and a lower level of turnover-performance sensitivity. In addition, similar to some of the results reported below, Coles et al. independently find that a firm’s rate of capital expenditures is increasing with the level of the board’s cooption.

22
In Panel A of Table 7, we test Implication 1 by including % of New Directors in our investment
equations. Even though tenure and % of New Directors are highly correlated with one another, % of New
Directors directly reflects the CEO’s control over the board. Therefore, if the effect of tenure on
investment only occurs because of the increase in the CEO’s control of the board over his tenure, then the
tenure effect should be picked up by % of New Directors. Alternatively, if there is some other reason why
tenure is related to investment, then estimates of the effect of tenure on investment should be relatively
unaffected by including % of New Directors into the equation.
Since the inclusion of % of New Directors reduces the sample size, in Column (1) of Panel A we
first reproduce the baseline results in the relevant subsample and obtain similar estimates to those
reported above. In Column (2), we control for % of New Directors and find that CEO tenure no longer has
any effect on investment, suggesting that the channel through which CEO tenure affects investment is
indeed the control over the board that the CEO acquires over time.12 The estimate implies that a one-
standard-deviation increase in % of New Directors would lead to an increase in the investment rate by
about 2 percentage points (=0.061*0.3), which suggests that a CEO’s control over his board has a
substantial effect on a firm’s investment decisions. Columns (3)-(4) estimate the effect of % of New
Directors on capital expenditures and acquisitions separately. These estimates suggest that the effect of %
of New Directors is stronger on acquisition (coefficient = 0.052) than on capital expenditures (coefficient
= 0.011), but the effect on each is significantly positive. The larger effect for acquisitions than on capital
expenditures likely reflects that large and non-recurring investments such as acquisitions are more subject
to the board scrutiny than routine capital expenditures.
5.1.2. Instrumental Variable Estimates
One potential concern is that our measure of the CEO’s capture of the board is jointly endogenous
with the firm’s investment. For example, a CEO’s ability could affect both investment and his capture of
the board (Hermalin and Weisbach (1998)). Such endogeneity would lead the coefficients reported in 12 In unreported analysis, we find that CEO ownership or CEO being the chairman of the board does not explain the effect of CEO tenure on investment and disinvestment. We also include all three measures of CEO power in one equation, and obtain results similar to those reported in Panel A of Table 7. These findings suggest that measures of growing CEO power over time can better explain the CEO investment cycles than other more static/dichotomous measures of CEO power.
23
Panel A of Table 7 to be biased. In particular, if a CEO’s ability were positively related to both his control
over the board and the level of investment, then the OLS estimate would be biased upwards.
To address this concern, we rely on the custom of directors resigning when they reach a
predetermined retirement age to identify the demand for new directors that is not a function of CEO
ability or the firm’s conditions. Most companies have a mandatory retirement age of 72 for outside
directors, and inside directors’ mandatory retirement age is usually around 65 (see Larcker (2011) for a
discussion of directors’ retirement policies). The fraction of directors that have reached the retirement age
in a given year (“% of Directors Reaching Retirement Age”) is unlikely to be correlated to the CEO’s
ability or the firms’ investment policies and therefore would represent a valid instrument for % of New
Directors.13 Because the age of the directors could potentially be related to investment independently of
their monitoring, we also control for the average age of the directors.
Panel B of Table 7 reports the estimates of the instrumental variable specification. The first stage
results as well as the F-statistics indicate that our instrument is positively and significantly related to % of
New Directors. The second stage results suggest that the exogenous variation in % of New Directors due
to director aging still leads to higher corporate investment. Consequently, there appears to be a causal
effect of CEO capture over the board on investment and growth, and the increase in investment over CEO
tenure is not driven by improvement in CEO ability over time.
5.2. Investment Quality over CEO Tenure
An implication of the agency-based interpretation of the CEO investment cycle is that the quality
of the firm’s investments should decrease (to negative NPV) over the CEO cycle (Implication 2). We
evaluate this implication using the stock market reaction to announcements of the firm’s acquisitions,
which has been commonly used as a measure of the firm’s acquisition quality (e.g., Masulis et al. (2007),
13 This instrument is valid since it is highly correlated with the number of directors who actually retire and thus the fraction of new directors appointed by the CEO. In our sample, among the directors who have reached the retirement age, about 75% of them indeed resign around the mandatory age. This percentage is calculated as the fraction of directors who left the company in a one-year window around the retirement age (65 for inside directors and 72 for outside directors). This instrument also satisfies the exclusion restriction because changes in the instrumented % of New Directors over CEO tenure is driven solely by the aging of directors, which is unrelated to changes in the CEO’s ability, and director aging should predict increasing investment only through the channel of CEO capture of the board. Note that we do not condition on a director’s actual departure (due to retirement), as departure is a choice while aging is not.
24
Harford et al. (2012), Fracassi and Tate (2012)). The quality of acquisitions is particularly relevant to our
tests for two reasons. First, the acquisition rate increases on average by forty percent after three years and
by two-thirds six years after a CEO took office, accounting for a large fraction of the investment increases
over the CEO cycle. Second, prior literature argues that corporate mergers and acquisitions are often
motivated by non-value maximizing reasons (e.g., Jensen (1993), Grinstein and Hribar (2004), Harford
and Li (2007)).
Panel A of Table 8 documents that during the first three years of CEO tenure, the fraction of
acquisitions with negative three-day cumulative market-adjusted announcement returns is 44%, rising to
57% after the third year. At the same time, the average announcement return decreases from 0.64 in the
first three years to -0.360 in later periods.14
The market reaction to acquisition announcement reflects not only the quality of the acquisition,
but also certain firm characteristics such as firm size and deal characteristics such as the payment method.
For this reason, in Panels B of Table 8 we present equations predicting whether the three-day market-
adjusted return to acquisition announcements is negative, controlling for relevant firm and deal
characteristics. Column (1) documents that acquisition announcement returns decrease with CEO tenure.
However, in Column (2), when we include % of New Directors into the equation, CEO tenure does not
affect announcement returns any more. These results suggest a CEO’s ability to undertake value-
decreasing acquisitions comes through his influence over the board of directors.
If % of New Directors partially reflects the CEO’s ability and higher ability corresponds to both
higher investment quality and more CEO power over the board, then the OLS estimate in Column (2) is
biased upwards. For this reason, we use % of Directors Reaching Retirement Age as an instrument for %
of New Directors. Column (3) reports the first stage regression, and Column (4) reports the second stage.
The estimates in Column (4) imply that the instrumented % of New Directors still negatively predicts the
14 A concern when comparing announcement returns over tenure is that returns are both conditional on the market’s estimate of a CEO’s ability and also reveal information about his ability. A CEO who has made it to a longer tenure will on average be of higher quality and thus the market’s expectation of his decisions will be higher (Hermalin and Weisbach (1998)). However, as long as the projects have positive NPV, the market reaction should not be systematically negative in the later years of a CEO’s tenure, unless the market systematically overestimates the CEO’s ability.

25
acquisition announcement returns, suggesting that the CEO’s capture of the board, which increases over
time, is the reason for the decline in acquisition quality over CEO tenure.
To further address the concern that a negative announcement return potentially does not imply
bad quality of the acquisition, we examine the probability of an extremely poor acquisition announcement
return (in the bottom quartile of the sample distribution, lower than -2%) over CEO tenure. The results in
Column (5) suggest that the probability of such a poor acquisition also increases with CEO tenure. The
results in Column (6) show that such probability is almost six percentage points higher when CEOs have
been in office for more than 6 years relative to when they are in their first 3 years of office.15
Overall, the results in subsections 5.1 and 5.2 are consistent with the agency view of the CEO
investment cycle, which states that as a CEO’s power grows in a firm, he will tend to increase corporate
investment, and that the incremental investments tend to be of lower quality. Both the increase in
investment level and the decrease in investment quality appear to be more related to a direct measure of
the CEO’s control of the board than simply his time in office. The findings that exogenous variation in
CEO tenure that is unrelated to CEO ability leads to increasing investment levels and deteriorating
investment quality are not consistent with the efficiency-based view in which a CEO’s time in office
reflects improvement in the CEO’s ability.
5.3. Residual Influence of the Old Management and Disinvestment
The agency explanation for disinvestment implies that CEO turnovers facilitate the divestiture of
poorly-performing assets established under the prior leadership. However, the residual influence from the
prior management on the new CEO should negatively affect the intensity of such error correction.
To test this implication, we rely on COMPUSTAT (historical) segment data, which offers two
advantages over other potential data sources. First, these data allow us to identify the CEO and year when
a segment is established and when it is divested or discontinued. Second, they allow us to capture
industry- or firm-specific shocks that could affect disinvestment intensity by including (segment)
15 In Table IA.5 in the Internet Appendix, we provide further evidence of deteriorating investment quality over CEO tenure using long-term segment performance as the proxy for investment quality.

26
industry-year or firm-year fixed effects. The inclusion of these fixed effects implies that any measured
segment underperformance does not occur because of industry-wide or firm-specific economic shocks,
but instead reflects (idiosyncratic) decisions by the previous management.
We define “Underperforming Segment” to be an indicator variable that equals one if the industry-
adjusted segment profitability (operating profits/loss over sales) is in the bottom tercile of the sample
distribution for two consecutive years right before the CEO turnover. Panel C of Table 1 reports the
summary statistics of this indicator. In addition, “Original CEO Replaced” is an indicator variable that
equals one for all firm-year observations after the CEO who established the segment steps down.
In Panel A of Table 9, we use these two indicator variables as well as their interaction to predict
the likelihood that a given segment is terminated in a given year for both the sample of multi-segment
firms and the subsample of turnovers due to death, illness, or retirement of the departing CEOs. We also
control for the segment’s age and the segment’s industry shocks or firm-specific shocks by including
industry-year or firm-year fixed effects. We find that the effects of Original CEO Replaced and
Underperforming Segment are small in magnitudes and statistically insignificant, and the coefficient on
the interaction of the two variables is positive and significant both economically and statistically. These
estimates imply that CEO turnover facilitates the disinvestment of poorly performing units established by
the previous leadership.16
To evaluate Implication 3, that the disinvestment of poorly performing assets by the new CEO is
negatively affected by the residual influence of the prior management, we construct four measures of the
residual influence of the previous CEO (or management) on the new CEO. The first measure is
“Staggered Board”, which is a dummy variable equal to one if the company has a staggered board. The
existence of staggered board is determined historically, rather than at the discretion of the current
management. Thus, the cross-sectional variation in Staggered Board provides variation in the residual
influence from prior management that is unrelated to the firm’s current conditions. In addition, we define
16 These results are consistent with Weisbach (1995). However, they are based on a much larger sample than in the earlier study and the empirical design better allows us to address alternative interpretations of the findings. Therefore, these results constitute a substantial extension of Weisbach (1995).

27
“Prior CEO Stays As Chairman” to be a dummy variable equaling one if the outgoing CEO serves as the
Chairman of the Board during the first year of the new CEO’s tenure,“% of Prior Mgmt. On Board” as
the fraction of the four most highly paid non-CEO executives under the previous management who sit on
the board after turnover, and “Outsider Succession” as a dummy variable equaling one if the new CEO
comes from outside the company.17
We expect the residual influence from the old management to be stronger if the firm has a
staggered board, or the old CEO stays as the Chairman of the board, or a larger fraction of the old
management stays on the board after turnover, or the new CEO is an insider (likely on the prior
management team before the promotion).18
In Panel B of Table 9, we consider only the segments established during the outgoing CEO’s
tenure, and examine the probability of them being divested or reorganized immediately following CEO
turnover (i.e., during the first three years of the incoming CEO’s tenure). Segment performance is
measured before the CEO turnover to ensure that the performance reflects decisions made by the prior
management rather than the new, which mitigates the concern that the new CEO manipulates the
performance of the terminated segment downward to justify the decision or to blame his predecessor.
The estimate on “Staggered Board x Underperforming Segment” in Column (1) implies that the
probability of downsizing a poorly performing segment is reduced by 52% (=0.036/0.069) in the presence
of a staggered board. Staggered boards are determined historically but do increase the residual influence
of the prior management on the new CEO, since an incoming CEO cannot change the board composition
quickly. The finding that a staggered board reduces the likelihood of a new CEO divesting a poorly
performing segment is consistent with the agency explanation for the high disinvestment rate in the early
years of a CEO’s tenure. However, it is not consistent with the skill-based explanation, which argues that
the post-turnover disinvestment intensity depends on the match between the new CEO’s skills and the
firm’s existing assets (Implication 4), because the historically determined staggered board is unlikely to 17 We classify CEOs who have been with the firm for less than three years when becoming CEO as outsider CEOs. Based on this classification, about 33% of new CEOs in our sample are considered as outsider CEOs. 18 We acknowledge that the latter three proxies of the residual influence of the outgoing CEO could reflect unobservable performance under his leadership, and thus are potentially endogenous.
28
be correlated with current productivity shocks or the quality of match between the CEO’s skills and the
firm’s assets.
The results in Panel B of Table 9 also suggest that the post-turnover disinvestment of poorly
performing assets negatively depends on the residual influence of the prior leadership, regardless of how
we measure such influence, by the existence a staggered board, by whether the departing CEO remains as
the chairman of the board, by whether other executives from the previous leadership remain on the board,
and by whether the incoming CEO is an insider. All these findings are consistent with Implication 3 of
the agency arguments, that the residual influence of the outgoing management has a substantial effect on
the magnitude of post-turnover disinvestment.
5.4. The Fit of the Incoming CEO’s Skills with the Firm’s Assets
The final set of tests concerns Implication 4, which states that the rate of post-turnover
divestitures will be higher when the incoming CEO’s skills differ more from the firm’s asset structure,
thus leading to the disinvestment cycle. To test this implication, we construct a variable “Fit” intended to
measure the fit between new CEO’s experience and the existing business scope of the firm prior to the
turnover.19 This measure is a weighted average of a CEO’s prior experience in a firm’s industries as of the
year before turnover, with the weight being the percentage of firm’s sales in an industry. For example,
suppose the new CEO worked for 3 industries (A, B, C) before becoming CEO. Suppose that he worked
for 2 years in A, 3 years in B, and 5 years in C and the firm’s business spans in two industries (A and B),
with 50% of sales in each. Then the fit measure is: [2/(2+3+5)]*50% + [3/(2+3+5)]*50%=0.25.
Column (1) of Table 10 examines whether the magnitude of the CEO disinvestment cycle
depends on the firm-CEO fit. The coefficient on the interaction between the fit measure and CEO tenure
is small and not statistically significant, suggesting that the decline in divestiture over CEO tenure does
not vary significantly across firm-CEO pairs with different degrees of fit between new CEO’s industry
experience and the firm’s business scope.
19 We thank Claudia Custodio for providing the data on the prior work experiences of a CEO in different industries, which was used to construct the general ability measure used in Custodio, Ferreira, and Matos (2013).

29
Next, we identify situations in which the new CEO’s skills are more likely to fit (or do not fit) the
firm’s assets, and compare the magnitude of the post-turnover disinvestment in these situations with that
in the full sample. One such situation is when the outgoing CEO departs because of death, illness, or
retirement. Presumably, since the board did not fire the CEO, it was satisfied with the departing CEO’s
skills and would be happy to find a new CEO with a similar set of skills. The fact that we find a similar
investment cycle after these turnovers as in the full sample suggests that the changing management skills
are not a main driver of the CEO investment cycle.
In addition, single-industry firms are less likely to have an incoming CEO with different skills
from his predecessor than are conglomerates, so skill-motivated divestitures following turnovers are less
likely in single-industry firms than in conglomerates. In addition, a replacement CEO who is a company
or industry insider is likely to have a similar set of skills to the outgoing CEO in these firms. Therefore, a
comparison of whether there is less post-turnover disinvestment in single-industry firms than in
conglomerates, and even less if these firms hire firm or industry insiders as CEOs, would represent a test
of Implication 4.
We classify firms as operating in a single industry using the COMPUSTAT historical segment
database and four-digit SIC. Column (2) of Table 10 presents estimates of the equations from Table 3
using the subsample of single-industry firms. These estimates indicate that the CEO disinvestment cycle
for these firms is comparable to that for the full sample. Column (3) further restricts the sample to be
single-industry firms that hired company or industry insiders.20 The estimated magnitude of the CEO
disinvestment cycle for this subsample is again similar to those reported in Column (2) and the full
sample. Overall, the results in Table 10 do not support Implication 4 and therefore suggest that the skill-
matching explanation is unlikely to be a main driver for the abnormally high disinvestment rate
immediately following CEO turnover.
The model of Eisfeldt and Kuhnen (2013) provides additional predictions of the skill-matching-
based explanation for post-turnover disinvestment. In this model, a shock to the productivity of physical
20 The data on industry backgrounds of CEOs is taken from Camelia Kuhnen’s website, http://public.kenan-flagler.unc.edu/faculty/kuhnenc/.
30
capital can change the optimal set of managerial skills, leading to management turnovers. Thus, CEO
turnovers that follow significant industry shocks are more likely to have incoming CEOs possessing
different skills from outgoing CEOs, and are also more likely to be followed by significant changes in
investment and disinvestment. Consequently, this argument predicts that there should be larger CEO
investment cycles when CEO turnovers follow industry shocks.
However, this argument cannot explain the existence of the CEO investment cycles after
exogenous CEO turnovers, which are unlikely to coincide with industry productivity shocks. We further
provide direct tests of the impact of industry productivity shocks on the magnitudes of the CEO cycles in
Table IA.7 in Internet Appendix C. These tests suggest that the existence and the magnitudes of the CEO
investment cycles are not sensitive to the industry conditions at the time when new CEOs take office.
In summary, while skills that differ between incoming and outgoing CEOs could potentially lead
to post-turnover disinvestment pattern in some firms, our results suggest that differing skills is not the
predominate explanation for the observed patterns in investment and disinvestment over the CEO cycle.
6. Summary and Implications
One of the most important things we study in business schools is the role of management in
public companies. Much of what we teach presumes that managerial decisions make a difference, and that
firms in reality are not in the “first-best” world described by many economic models. Yet, identifying
systematic influences of management empirically is challenging because of heterogeneity across CEOs
and firms, as well as the endogenous matching between CEOs and firms.
Our paper addresses this issue by documenting a systematic relation between CEO tenure and the
firm’s investment and growth, which we refer to as the CEO Investment Cycle. Shortly after a new CEO
takes office, the firm’s disinvestment rate rises sharply while the firm’s investment and growth rate are
relatively low. As the CEO’s tenure lengthens, the disinvestment rate declines and the investment rate and
growth rate increase continuously and substantially. The cyclical pattern of investment over CEO tenure
exists regardless of the reasons for the predecessor CEO’s departure, and regardless of the background of

31
the incoming CEO. The effect of the CEO cycle on investment is of the same order of magnitude as the
effects of other well-known factors such as the business cycle, political uncertainty, and financial
constraints.
Our analysis suggests that the CEO investment cycle is best explained by a combination of
agency-related factors. CEOs have many reasons to prefer more investment than is optimal from a value-
maximization perspective. As a CEO acquires more influence over the board, his ability to overinvest
increases, leading to increasing investment quantity but decreasing quality over the CEO’s tenure. The
poor investment decisions tend to be reversed only after the CEO steps down and his successor takes
office, and the intensity of the reversal is negatively affected by the residual influence of the old
management on the new CEO. Eventually, the process is repeated during each CEO cycle.
In contrast, arguments based on differing CEO skills, productivity shocks, or CEO tenure
endogenously reflecting the firm’s investment opportunities or CEO ability do not explain the nature and
magnitude of the CEO investment cycles. One cannot definitively rule out that investment changes over
the CEO cycle could occur in some firms because the first-best set of investments varies systematically
with the identity and tenure of the CEO. However, all the evidence presented in this paper favors the view
that in most firms, the change in investment over the CEO cycle occurs because of agency problems.
The evidence in this paper implies that factors internal to the firm appear to affect investment in a
consequential way. Much attention in the economics literature has been paid to the effect of economy-
wide variables such as tax policies, business cycles, and financial constraints on firms’ investments. Yet,
the governance-related effects that we document in this paper are of the same order of magnitude as these
often-studied external factors. While much attention has been given to corporate governance in the
academic literature lately, its impact on investment likely has been understated, and should be
incorporated into models of investment.
Analysis of changes in investment over the CEO cycle provides a way to identify the role of
management in corporations. While the results we present here favor agency-based explanations for
investment, much more remains to be done. Our analysis focuses mainly on the quantity and quality of

32
investment, ignoring other factors as its risk, horizon, etc. There are a number of theories that characterize
the manner in which principal-agent problems can lead to distortions away from the first-best investments
along these dimensions. Quantifying the nature of these distortions is likely to be a fruitful direction for
future research. In addition, more sophisticated theories in which management cycles interact with
productivity could lead to different empirical interpretations, potentially reconciling the results presented
here with first-best investment, or with other types of agency problems.
Finally, although our analysis focuses on investment in physical assets, our empirical framework
also provides a way to examine the management’s role in investment in intangibles. Interestingly, our
initial investigation suggests that unlike investment in physical capital, there is no robust pattern in R&D
expenditures over the CEO cycle (see Panel B of Table IA.8 in the internet appendix), and the CEO’s
control over the board does not seem to impact the R&D rate (see Panel C of Table IA.8). These results
suggest that investment in intangible capital and in physical capital could be subject to different agency
incentives. For example, a CEO’s preference to grow his firms beyond what is optimal for shareholders
could be more relevant for physical rather than intangible investments. Exploring the extent to which
investment in intangibles varies over the CEO cycle as well as the differences in agency motivations for
intangible and physical investments would be an excellent topic for future research.
33
References
Baumol, William J., 1959, “Business Behavior, Value and Growth,” The Macmillan Company, London. Bebchuk, Lucian and Jesse Fried, 2004, “Pay without Performance: The Unfilled Promise of Executive Compensation,” Harvard University Press, Cambridge, MA. Bennedsen, Morten, Francisco Pérez-González, Kasper Nielsen, and Daniel Wolfenzon, 2007, “Inside the Family Firm: The Role of Families in Succession Decisions and Performance,” Quarterly Journal of Economics, 122 (2), 647‐691. Bennedsen, Morten, Francisco Pérez-González, and Daniel Wolfenzon, 2012, “Estimating the Value of the Boss: Evidence from CEO Hospitalization Events,” Working Paper. Berle, Adolf and Gardiner Means, 1932, “The Modern Corporation and Private Property,” Macmillan, New York. Bertrand, Marianne and Sendhil Mullainathan, 2003, “Enjoying the Quiet Life? Corporate Governance and Managerial Preferences,” Journal of Political Economy, 111(5), 1043-1075. Bertrand, Marianne and Antoinette Schoar, 2003, “Managing with Style: The Effect of Managers on Firm Policies,” Quarterly Journal of Economics, 118(4), 1169-1208. Boot, Arnoud W.A., 1992, “Why Hang on to Losers? Divestitures and Takeovers,” Journal of Finance, 47, 1401-1423. Coles, Jeffrey, Naveen Daniel and Lalitha Naveen, 2014, “Co-opted Boards: Costs, Benefits, Causes and Consequences,” Review of Financial Studies, 27, 1751-1796. Custódio, Claudia, Miguel Ferreira and Pedro Matos, 2013, “Generalists vs. Specialists: Lifetime Work Experience and Chief Executive Officer Pay,” Journal of Financial Economics, 108(2), 471-492. Dechow, Patricia, Weili Ge, and Catherine Schrand, 2010, “Understanding Earnings Quality: A Review of the Proxies, Their Determinants and Their Consequences,” Journal of Accounting and Economics 50, 344-401. Denis, David J. and Diane K. Denis, 1995, “Performance Changes Following Management Dismissals,” The Journal of Finance, 50, 1029-1057. Donaldson, Gordon, 1984, “Managing Corporate Wealth,” Praeger Publishers, New York.
Eisfeldt, Andrea L. and Camilia M. Kuhnen, 2013, “CEO Turnover in a Competitive Assignment Framework,” Journal of Financial Economics, 109, 351-372.
Fee, C. Edward, Charles J. Hadlock, and Joshua R. Pierce, 2013, “Managers with and without Style: Evidence using Exogenous Variation,” Review of Financial Studies, 26 (3), 567-601.
Fracassi, Cesare and Geoffrey Tate, 2012, “External Networking and Internal Firm Governance,” The Journal of Finance, 67(1), 153-194. Grinstein, Yaniv and Paul Hribar, 2004, “CEO Compensation and Incentives: Evidence from M&A Bonus,” Journal of Financial Economics, 73, 119–143.
34
Harford, Jarrad, Mark Humphery and Ronan Powell, 2012, “The sources of value destruction in acquisitions by entrenched managers,” Journal of Financial Economics, 106(2), 247-261. Harford, Jarrad and Kai Li, 2007, “Decoupling CO Wealth and Firm Performance: The Case of Acquiring CEOs,” Journal of Finance, 62(2), 917-949. Hermalin, Benjamin E. and Michael S. Weisbach, 1998, “Endogenously Chosen Boards of Directors and their Monitoring of the CEO,” American Economic Review, 88, 96-118. Hoberg, Gerard and Vojislav Maksimovic, 2015, “Redefining Financial Constraints: A Text-Based Analysis,” Review of Financial Studies, 28(5), 1312-1352. Jensen, Michael C., 1986, “The Agency Costs of Free Cash Flow: Corporate Finance and Takeovers,” American Economic Review, 76(2), 323-29. Jensen, Michael C., 1993, “The Modern Industrial Revolution, Exit and the Failure of Internal Control Systems,” The Journal of Finance, 48(3), 831-880. Jensen, Michael C. and Meckling, William H., 1976, “Theory of the Firm: Managerial Behavior, Agency Costs and Ownership Structure,” Journal of Financial Economics, 3(4), 305-360. Jensen, Michael C and Murphy, Kevin J, 1990, “Performance Pay and Top-Management Incentives," Journal of Political Economy, 98 (2), 225-64. Jenter, Dirk, and Katharina Lewellen, 2014, “CEO Preferences and Acquisitions,” The Journal of Finance, forthcoming. Johnson, Bruce W., Robert Magee, Nandu Nagarajan, and Herry Newman, 1985, “An Analysis of the Stock Price Reaction to Sudden Executive Death: Implications for the Management Labor Market,” Journal of Accounting and Economics, 7, 151–174. Jorgenson, Dale and and Zvi Griliches, 1967, “The Explanation of Productivity Change,” Review of Economic Studies 34(3), 249-280. Julio, Brandon and Youngsuk Yook, 2012, “Political Uncertainty and Corporate Investment Cycle,” Journal of Finance, 67(1), 45-84. Kanodia, Chandra, Robert Bushman, and John Dickhaut, 1989, “Escalation Errors and the Sunk Cost Effect: An Explanation Based on Reputation and Information Asymmetries,” Journal of Accounting Research, 27(1), 59-77. Larcker, David, 2011, “Board of Directors: Selection, Compensation, and Removal,” Working Paper. Maksimovic, Vojislav and Gordon Phillips, 2002, “Do Conglomerate Firms Allocate Resources Inefficiently Across Industries? Theory and Evidence,” The Journal of Finance, 67, 721-767. Maksimovic, Vojislav and Gordon Phillips, 2007, “Conglomerate Firms and Internal Capital Markets,” Handbook of Corporate Finance: Empirical Corporate Finance, ed. B. Espen Eckbo, Handbooks in Finance Series, Elsevier/North-Holland. Masulis, Ronald W, Cong Wang, and Fei xie, 2007, “Corporate Governance and Acquirer Returns”, The Journal of Finance, 62, 1851-1889.

35
Marris, Robin, 1964, “The Economic Theory of Managerial Capitalism,” Free Press of Glencoe, Glencoe, IL. Morck, Randall K., Andrei Shleifer and Robert W. Vishny, 1990, “Do Managerial Objectives Drive Bad Acquisitions?” The Journal of Finance, 45(1), 31-48. Morse, Adair, Vikram Nanda and Amit Seru, 2011, “Are Incentive Contracts Rigged by Powerful CEOs?” The Journal of Finance, 1779-1821. Myers, Stewart C., 1977, “Determinants of Corporate Borrowing,” Journal of Financial Economics, 5, 147−175.
Murphy, Kevin J. and Jerold L. Zimmerman, 1993. “Financial performance surrounding CEO turnover,” Journal of Accounting and Economics, 16, 273-315.
Pan, Yihui, Tracy Yue Wang, and Michael S. Weisbach, 2015a, “Learning about CEO Ability and Stock Return Volatility,” Review of Financial Studies, 28, 1623-1666. Pan, Yihui, Tracy Yue Wang, and Michael S. Weisbach, 2015b, “Does Uncertainty about Management Affect Firms’ Costs of Borrowing?” Working Paper. Roll, Richard, 1986, “The Hubris Hypothesis of Corporate Takeovers,” Journal of Business, 59, 197-216. Shivdasani, Anil, and David Yermack, 1999, “CEO Involvement in the Selection of New Board Members: An Empirical Analysis,” Journal of Finance, 54, 1829-1853. Shleifer, Andrei, and Robert W. Vishny, 1989, “Management Entrenchment: The Case of Manager-specific Investments,” Journal of Financial Economics, 25(1), 123-139. Tirole, Jean, 2006, “The Theory of Corporate Finance,” Princeton University Press, Princeton, 2006. Vancil, Richard, 1987, Passing the Baton: Managing the Process of CEO Succession, Boston: Harvard Business School Press. Weisbach, Michael S., 1995, “CEO Turnover and the Firm’s Investment Decisions,” Journal of Financial Economics, 37, 155-188. Williamson, Oliver E., 1964, “The Economics of Discretionary Behavior: Managerial Objectives in a Theory of the Firm,” Prentice-Hall, Englewood Cliff. Yim, Soojin, 2013, “The Acquisition of Youth: CEO Age and Acquisition Behavior”, Journal of Financial Economics, 108, 250-273.
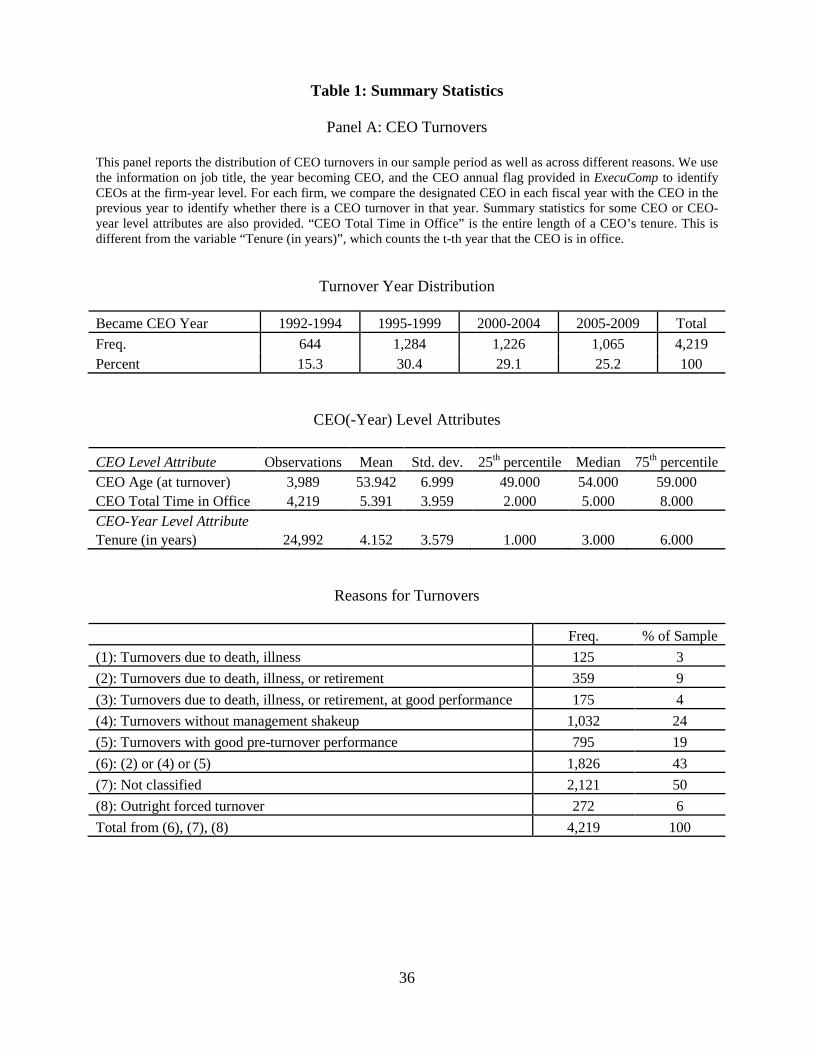
36
Table 1: Summary Statistics
Panel A: CEO Turnovers
This panel reports the distribution of CEO turnovers in our sample period as well as across different reasons. We use the information on job title, the year becoming CEO, and the CEO annual flag provided in ExecuComp to identify CEOs at the firm-year level. For each firm, we compare the designated CEO in each fiscal year with the CEO in the previous year to identify whether there is a CEO turnover in that year. Summary statistics for some CEO or CEO-year level attributes are also provided. “CEO Total Time in Office” is the entire length of a CEO’s tenure. This is different from the variable “Tenure (in years)”, which counts the t-th year that the CEO is in office.
Turnover Year Distribution Became CEO Year 1992-1994 1995-1999 2000-2004 2005-2009 Total Freq. 644 1,284 1,226 1,065 4,219 Percent 15.3 30.4 29.1 25.2 100
CEO(-Year) Level Attributes
CEO Level Attribute Observations Mean Std. dev. 25th percentile Median 75th percentile CEO Age (at turnover) 3,989 53.942 6.999 49.000 54.000 59.000 CEO Total Time in Office 4,219 5.391 3.959 2.000 5.000 8.000 CEO-Year Level Attribute
Tenure (in years) 24,992 4.152 3.579 1.000 3.000 6.000
Reasons for Turnovers Freq. % of Sample (1): Turnovers due to death, illness 125 3 (2): Turnovers due to death, illness, or retirement 359 9 (3): Turnovers due to death, illness, or retirement, at good performance 175 4 (4): Turnovers without management shakeup 1,032 24 (5): Turnovers with good pre-turnover performance 795 19 (6): (2) or (4) or (5) 1,826 43 (7): Not classified 2,121 50 (8): Outright forced turnover 272 6 Total from (6), (7), (8) 4,219 100

37
Panel B: Investment and Disinvestment Variables
This table reports summary statistics of the investment, disinvestment, and growth variables. “Capx Rate” is capital expenditures divided by lagged total assets. “Acquisition Rate” is the value of acquired assets (from SDC Platinum) divided by lagged total assets. “Investment Rate” is the sum of acquisitions and capital expenditures scaled by lagged total assets. “R&D Rate” is R&D expenditure scaled by lagged total assets. “Asset sales” is the absolute value of the total asset sales (from SDC Platinum). “Discontinued operations” is the absolute value of the income from discontinued operations (item “DO” in Compustat). “Asset Growth Rate” is the annual growth rate of book assets, and “Employment Growth Rate” is the annual growth rate of the firm’s number of employees. The two indicator variables related to announcements are constructed at the firm-month level, the two indicator variables related to segment start and termination (termination only defined for multi-segment firms) are constructed at the firm-segment-year level, while other variable at the firm-year level. Downsizing and expansion announcements are from the Capital IQ database with coverage starting after 2000. Segment variables are constructed using Compustat (historical) segment database. Our sample includes S&P 1,500 firms with available data on total assets and identifiable CEOs from Execucomp, over the period 1992-2011. Investment Obs. Mean Std. dev. 25th percentile Median 75th percentile Capx Rate 24,636 0.059 0.086 0.015 0.036 0.070 Acquisition Rate 24,636 0.038 0.159 0.000 0.000 0.000 Investment Rate 24,636 0.094 0.185 0.019 0.046 0.097 R&D Rate 13,462 0.070 0.134 0.002 0.026 0.090 I{expansion announcement(s) in the month} 195,165 0.079 0.273 0.000 0.000 0.000 I{segment start} 122,990 0.136 0.342 0.000 0.000 0.000 Disinvestment I{asset sales>0} 24,992 0.098 0.298 0.000 0.000 0.000 I{discontinued operations>0} 24,992 0.197 0.397 0.000 0.000 0.000 I{asset sales>0 or discontinued operations>0} 24,992 0.249 0.433 0.000 0.000 0.000 I{downsizing announcement(s) in the month} 195,165 0.044 0.205 0.000 0.000 0.000 I{segment termination}, Multi-segment Firms 69,609 0.110 0.313 0.000 0.000 0.000 Net Effects Asset Growth Rate 24,636 0.184 0.639 -0.014 0.066 0.187 Employment Growth Rate 23,576 0.079 0.328 -0.040 0.024 0.120
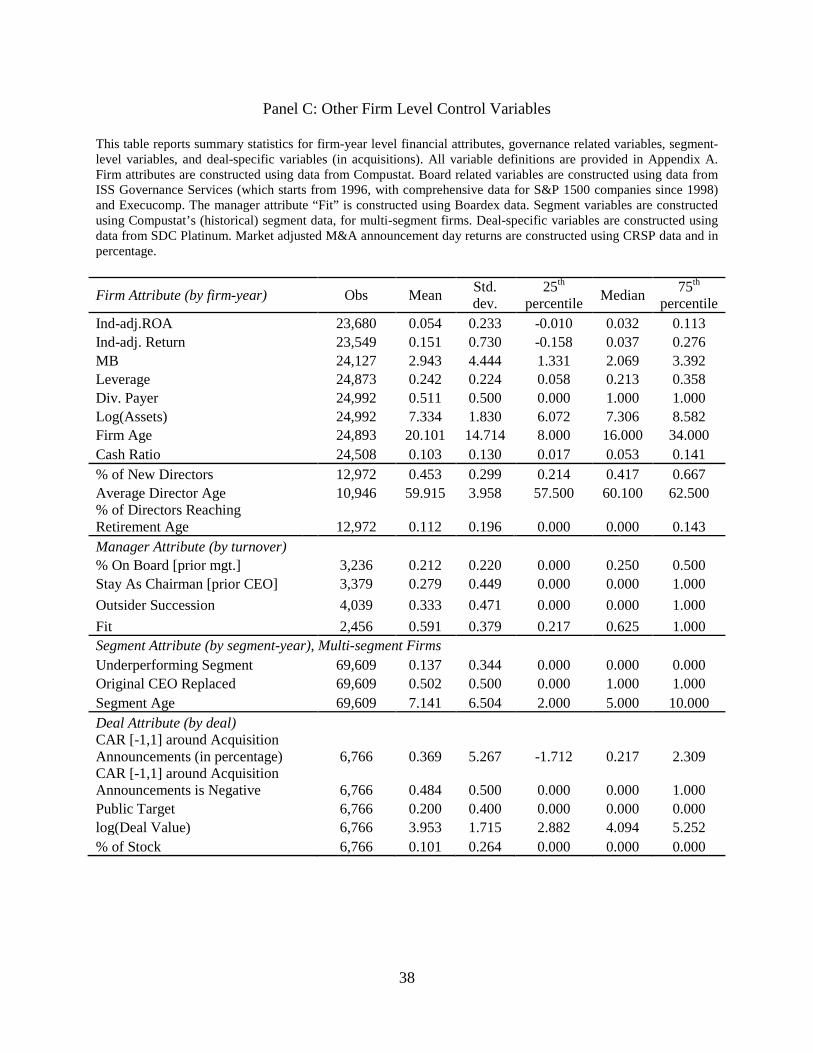
38
Panel C: Other Firm Level Control Variables
This table reports summary statistics for firm-year level financial attributes, governance related variables, segment-level variables, and deal-specific variables (in acquisitions). All variable definitions are provided in Appendix A. Firm attributes are constructed using data from Compustat. Board related variables are constructed using data from ISS Governance Services (which starts from 1996, with comprehensive data for S&P 1500 companies since 1998) and Execucomp. The manager attribute “Fit” is constructed using Boardex data. Segment variables are constructed using Compustat’s (historical) segment data, for multi-segment firms. Deal-specific variables are constructed using data from SDC Platinum. Market adjusted M&A announcement day returns are constructed using CRSP data and in percentage.
Firm Attribute (by firm-year) Obs Mean Std. dev.
25th percentile Median 75th
percentile Ind-adj.ROA 23,680 0.054 0.233 -0.010 0.032 0.113 Ind-adj. Return 23,549 0.151 0.730 -0.158 0.037 0.276 MB 24,127 2.943 4.444 1.331 2.069 3.392 Leverage 24,873 0.242 0.224 0.058 0.213 0.358 Div. Payer 24,992 0.511 0.500 0.000 1.000 1.000 Log(Assets) 24,992 7.334 1.830 6.072 7.306 8.582 Firm Age 24,893 20.101 14.714 8.000 16.000 34.000 Cash Ratio 24,508 0.103 0.130 0.017 0.053 0.141 % of New Directors 12,972 0.453 0.299 0.214 0.417 0.667 Average Director Age 10,946 59.915 3.958 57.500 60.100 62.500 % of Directors Reaching Retirement Age 12,972 0.112 0.196 0.000 0.000 0.143 Manager Attribute (by turnover)
% On Board [prior mgt.] 3,236 0.212 0.220 0.000 0.250 0.500 Stay As Chairman [prior CEO] 3,379 0.279 0.449 0.000 0.000 1.000 Outsider Succession 4,039 0.333 0.471 0.000 0.000 1.000 Fit 2,456 0.591 0.379 0.217 0.625 1.000 Segment Attribute (by segment-year), Multi-segment Firms Underperforming Segment 69,609 0.137 0.344 0.000 0.000 0.000 Original CEO Replaced 69,609 0.502 0.500 0.000 1.000 1.000 Segment Age 69,609 7.141 6.504 2.000 5.000 10.000 Deal Attribute (by deal)
CAR [-1,1] around Acquisition Announcements (in percentage) 6,766 0.369 5.267 -1.712 0.217 2.309 CAR [-1,1] around Acquisition Announcements is Negative 6,766 0.484 0.500 0.000 0.000 1.000 Public Target 6,766 0.200 0.400 0.000 0.000 0.000 log(Deal Value) 6,766 3.953 1.715 2.882 4.094 5.252 % of Stock 6,766 0.101 0.264 0.000 0.000 0.000

39
Table 2: Investment Rate and CEO Tenure
Panel A: Investment Rate and CEO Tenure
This table reports the trend in the investment rate over CEO tenure. A constant term is included in all models but omitted for brevity. All control variables are lagged. The definitions of all variables are in Appendix A. The standard errors are clustered by firm. ***, ** and * indicate significance at the 1%, 5% and 10% levels respectively. (1) (2) (3) (4) (5) (6)
Full Sample Death/Illness Death/Illness/ Retirement
Death/Illness/ Retirement at
Good Performance No Mgt Shakeup Good Pre-turnover
Performance
Investment Rate
Tenure (in years) 0.005*** 0.002** 0.003** 0.005** 0.003*** 0.006***
(0.001) (0.001) (0.001) (0.002) (0.001) (0.002)
Ind-adj. ROA 0.139*** 0.097 0.122** 0.161*** 0.175*** 0.178***
(0.023) (0.072) (0.050) (0.060) (0.048) (0.057)
Ind-adj. Return 0.009*** 0.019 0.006 0.001 0.002 0.015
(0.003) (0.026) (0.004) (0.011) (0.003) (0.011)
MB 0.002*** 0.001 -0.001 -0.001 0.001 0.001
(0.001) (0.001) (0.001) (0.001) (0.001) (0.001)
Leverage 0.005 0.019 0.018* 0.056 0.009 -0.014
(0.007) (0.048) (0.011) (0.037) (0.010) (0.013)
Div. Payer -0.140*** -0.237** -0.045 -0.003 -0.114*** -0.123***
(0.020) (0.099) (0.081) (0.093) (0.035) (0.035)
log(Assets) -0.067*** -0.056*** -0.051*** -0.095*** -0.056*** -0.075***
(0.006) (0.022) (0.017) (0.026) (0.009) (0.011)
Firm-CEO F.E., Year F.E. x x x x x x Observations 21,915 595 2,567 1,230 7,516 6,608 Adj. R-sqr. 0.277 0.238 0.317 0.229 0.354 0.277

40
Panel B: Shape of the Investment-Tenure Curve
This table reports the speed of the investment increase over different time periods in a CEO’s tenure. We break a CEO’s entire tenure length into three periods: Years [0,2], Years [3,5], and Year 6 and after. The specification in Column (1) includes period indicators, and that in column (2) is a spline regression. “Dummy (Years [3, 5])” is an indicator variable for the second 3-year period in CEO tenure. “Dummy (Year 6 and after)” indicates the period after the first 6 years. “Spline (Years [0,2])” is the spline for the first three years of tenure, “Spline (Years [3,5])” is for the next 3-year period, and “Spline (Year 6 and after)” is for the years after the first 6 years. A constant term is included in all models but omitted for brevity. All control variables are lagged. The definitions of all variables are in Appendix A. The standard errors are clustered by firm. ***, ** and * indicate significance at the 1%, 5% and 10% levels respectively.
(1) (2)
Investment Rate
Dummy (Years [3,5]) 0.006** (0.003) Dummy (Year 6 and after) 0.008** (0.003) Spline (Years [0,2])
0.008***
(0.002) Spline (Years [3,5])
0.004**
(0.002) Spline (Year 6 and after)
0.004***
(0.001) Ind-adj. ROA 0.135*** 0.139*** (0.019) (0.023) Ind-adj. Return 0.009*** 0.009*** (0.003) (0.003) MB 0.002*** 0.002*** (0.000) (0.001) Leverage 0.008 0.005 (0.005) (0.007) Div. Payer -0.106*** -0.140*** (0.014) (0.020) log(Assets) -0.053*** -0.066*** (0.004) (0.006) Year and Firm-CEO F.E. x x Observations 21,915 21,915 Adj. R-sqr. 0.277 0.277

41
Panel C: Expansion Announcements and Segment Starts
In Columns (1) and (2), the dependent variables are the expansion announcement indicator I{ expansion announcement(s) in the
month}, and the observations are at the firm-month level. Expansion announcements are from the Capital IQ database and acquisition announcements are from SDC Platinum. The sample period is 2001-2009, since the Capital IQ coverage begins after 2000. In Columns (3) and (4), the dependent variables are the segment start indicator I{segment start}. The data source is Compustat “historical segment” database. In columns (2) and (4), we use the subsample of turnovers due to death, illness, or retirement of the departing CEOs. The definitions of all variables are in Appendix A. The Huber-White robust standard errors are clustered by firm and reported in parenthesis. ***, ** and * indicate significance at the 1%, 5% and 10% levels respectively. (1) (2) (3) (4)
I{expansion announcement(s) in the month} I{segment start}
Full Sample Death/Illness/Retirement Full Sample Death/Illness/Retirement
Tenure (in months) 0.001*** 0.001***
(0.0002) (0.0002)
Tenure (in years)
0.018*** 0.008*
(0.006) (0.004)
Ind-adj. ROA 0.021* 0.030 0.055** -0.068
(0.013) (0.039) (0.025) (0.059)
Ind-adj. Return 0.003** 0.012** 0.001 -0.0003
(0.001) (0.005) (0.003) (0.009)
MB 0.0003 -0.0002 0.0003 -0.001
(0.0001) (0.001) (0.001) (0.001)
Leverage -0.042*** -0.044 0.019* 0.023
(0.009) (0.029) (0.011) (0.028)
Div. Payer 0.015*** 0.013 -0.014 0.039
(0.006) (0.011) (0.025) (0.069)
log(Assets) 0.014*** 0.020 -0.015** 0.015
(0.004) (0.013) (0.007) (0.020)
# of Segments
-0.103*** -0.101***
(0.003) (0.006)
Firm-CEO F.E., Year F.E. x x x x Observations 183,054 19,043 122,990 12,787 Adj. R-sqr. 0.159 0.158 0.318 0.284

42
Panel D: Benchmarking Investment Rate on Peer Firms This table estimates the investment rate as a function of CEO tenure in the cross section. We construct a sample consisting of firm-years with CEO tenure longer than 3 years (sample median) [Dummy (Tenure>3 years) equals 1] and matching firm-years with below median tenure in the same (2-digit SIC) industry with the closest firm size (total book assets) [Dummy (Tenure>3 years) equals 0]. We then compare the investment rates in firm-years with long-tenured CEOs and in peer firm-years in a multivariate regression, controlling for Industry-adj. ROA and Return, MB, Div. Payer, and leverage. In Column (2), we change the tenure threshold to be 6 years (75th percentile of the sample), and repeat the analysis in Column (1). Dummy (Tenure>6 years) is an indicator variable that equals 1 for the firm-years with CEO tenure longer than 6 years, and 0 for the peer firm-years. A constant term is included in all models but omitted for brevity. The definitions of all variables are in Appendix A. The standard errors are clustered by firm and reported in parenthesis. *** indicates significance at the 1% level.
(1) (2) Investment Rate
Dummy (Tenure>3 years) 0.013** (0.005) Dummy (Tenure>6 years) 0.014**
(0.006) Ind-adj. ROA 0.064*** 0.075*** (0.018) (0.022) Ind-adj. Return 0.016*** 0.013** (0.005) (0.005) MB 0.004*** 0.003*** (0.001) (0.001) Div. Payer -0.057*** -0.062*** (0.006) (0.007) Leverage -0.093*** -0.111*** (0.015) (0.014) Observations 25,008 12,370 Adj. R-sqr. 0.038 0.039
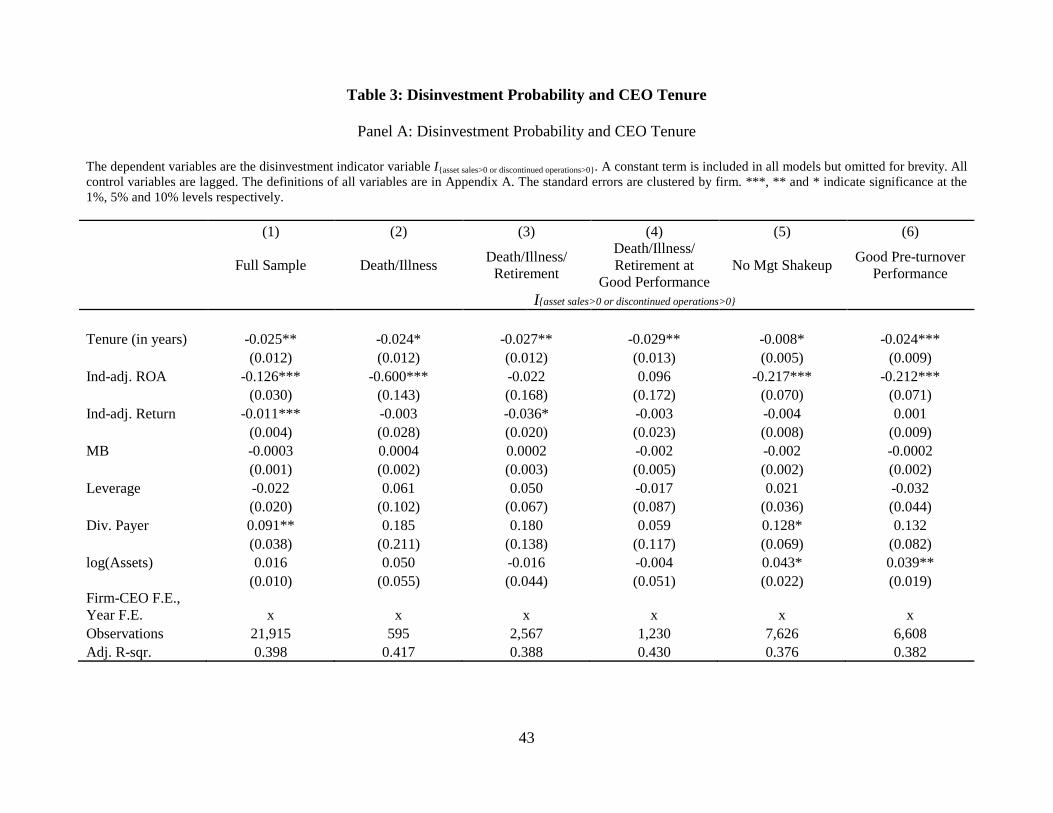
43
Table 3: Disinvestment Probability and CEO Tenure
Panel A: Disinvestment Probability and CEO Tenure
The dependent variables are the disinvestment indicator variable I{asset sales>0 or discontinued operations>0}. A constant term is included in all models but omitted for brevity. All control variables are lagged. The definitions of all variables are in Appendix A. The standard errors are clustered by firm. ***, ** and * indicate significance at the 1%, 5% and 10% levels respectively. (1) (2) (3) (4) (5) (6)
Full Sample Death/Illness Death/Illness/ Retirement
Death/Illness/ Retirement at
Good Performance No Mgt Shakeup Good Pre-turnover
Performance
I{asset sales>0 or discontinued operations>0}
Tenure (in years) -0.025** -0.024* -0.027** -0.029** -0.008* -0.024***
(0.012) (0.012) (0.012) (0.013) (0.005) (0.009)
Ind-adj. ROA -0.126*** -0.600*** -0.022 0.096 -0.217*** -0.212***
(0.030) (0.143) (0.168) (0.172) (0.070) (0.071)
Ind-adj. Return -0.011*** -0.003 -0.036* -0.003 -0.004 0.001
(0.004) (0.028) (0.020) (0.023) (0.008) (0.009)
MB -0.0003 0.0004 0.0002 -0.002 -0.002 -0.0002
(0.001) (0.002) (0.003) (0.005) (0.002) (0.002)
Leverage -0.022 0.061 0.050 -0.017 0.021 -0.032
(0.020) (0.102) (0.067) (0.087) (0.036) (0.044)
Div. Payer 0.091** 0.185 0.180 0.059 0.128* 0.132
(0.038) (0.211) (0.138) (0.117) (0.069) (0.082)
log(Assets) 0.016 0.050 -0.016 -0.004 0.043* 0.039**
(0.010) (0.055) (0.044) (0.051) (0.022) (0.019)
Firm-CEO F.E., Year F.E. x x x x x x Observations 21,915 595 2,567 1,230 7,626 6,608 Adj. R-sqr. 0.398 0.417 0.388 0.430 0.376 0.382
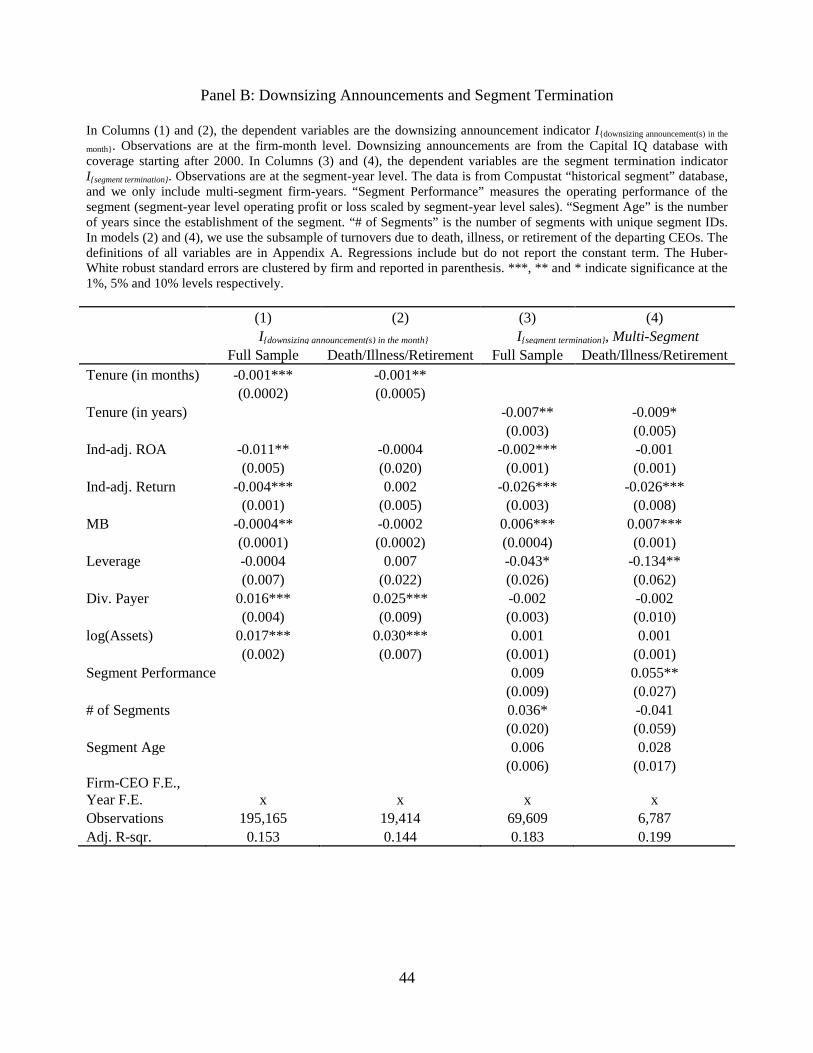
44
Panel B: Downsizing Announcements and Segment Termination
In Columns (1) and (2), the dependent variables are the downsizing announcement indicator I{downsizing announcement(s) in the
month}. Observations are at the firm-month level. Downsizing announcements are from the Capital IQ database with coverage starting after 2000. In Columns (3) and (4), the dependent variables are the segment termination indicator I{segment termination}. Observations are at the segment-year level. The data is from Compustat “historical segment” database, and we only include multi-segment firm-years. “Segment Performance” measures the operating performance of the segment (segment-year level operating profit or loss scaled by segment-year level sales). “Segment Age” is the number of years since the establishment of the segment. “# of Segments” is the number of segments with unique segment IDs. In models (2) and (4), we use the subsample of turnovers due to death, illness, or retirement of the departing CEOs. The definitions of all variables are in Appendix A. Regressions include but do not report the constant term. The Huber-White robust standard errors are clustered by firm and reported in parenthesis. ***, ** and * indicate significance at the 1%, 5% and 10% levels respectively. (1) (2) (3) (4)
I{downsizing announcement(s) in the month} I{segment termination}, Multi-Segment
Full Sample Death/Illness/Retirement Full Sample Death/Illness/Retirement
Tenure (in months) -0.001*** -0.001**
(0.0002) (0.0005)
Tenure (in years)
-0.007** -0.009*
(0.003) (0.005)
Ind-adj. ROA -0.011** -0.0004 -0.002*** -0.001
(0.005) (0.020) (0.001) (0.001)
Ind-adj. Return -0.004*** 0.002 -0.026*** -0.026***
(0.001) (0.005) (0.003) (0.008)
MB -0.0004** -0.0002 0.006*** 0.007***
(0.0001) (0.0002) (0.0004) (0.001)
Leverage -0.0004 0.007 -0.043* -0.134**
(0.007) (0.022) (0.026) (0.062)
Div. Payer 0.016*** 0.025*** -0.002 -0.002
(0.004) (0.009) (0.003) (0.010)
log(Assets) 0.017*** 0.030*** 0.001 0.001
(0.002) (0.007) (0.001) (0.001)
Segment Performance 0.009 0.055**
(0.009) (0.027)
# of Segments
0.036* -0.041
(0.020) (0.059)
Segment Age
0.006 0.028
(0.006) (0.017)
Firm-CEO F.E., Year F.E. x x x x Observations 195,165 19,414 69,609 6,787 Adj. R-sqr. 0.153 0.144 0.183 0.199

45
Table 4: Net Effects CEO Tenure on Disinvestment and Investment Panel A reports the trend in the asset growth rate over CEO tenure. Panel B reports the trend in the employment growth rate over CEO tenure. The usual set of control variables (lagged): Industry-adj. ROA and Return, MB, Leverage, Div. Payer, log(Assets), firm-CEO fixed effects and year fixed effects, as well as a constant term is included in all models but omitted for brevity. The definitions of all variables are in Appendix A. The standard errors are clustered by firm and reported in parenthesis. ***, ** and * indicate significance at the 1%, 5% and 10% levels respectively.
Panel A: Asset Growth Rate and CEO Tenure
(1) (2) (3) (4) (5) (6)
Full Sample Death/Illness Death/Illness/ Retirement
Death/Illness/ Retirement at
Good Performance No Mgt Shakeup Good Pre-turnover
Performance
Asset Growth Rate
Tenure (in years)
0.033*** 0.028* 0.022*** 0.051*** 0.026*** 0.036*** (0.003) (0.015) (0.007) (0.013) (0.004) (0.004)
Firm-level Controls x x x x x x Firm-CEO F.E., Year F.E. x x x x x x Observations 21,915 595 2,567 1,010 7,626 6,608 Adj. R-sqr. 0.278 0.098 0.190 0.242 0.306 0.297
Panel B: Employment Growth Rate and CEO Tenure
(1) (2) (3) (4) (5) (6)
Full Sample Death/Illness Death/Illness/ Retirement
Death/Illness/ Retirement at
Good Performance No Mgt Shakeup Good Pre-turnover
Performance
Employment Rate Growth
Tenure (in years) 0.015*** 0.028** 0.014*** 0.025*** 0.015*** 0.020***
(0.002) (0.014) (0.004) (0.008) (0.002) (0.003)
Firm-level Controls x x x x x x Firm-CEO F.E., Year F.E. x x x x x x Observations 21,499 585 2,541 1,001 7,494 6,467 Adj. R-sqr. 0.205 0.130 0.120 0.130 0.164 0.191
46
Table 5: Comparing the Magnitude of the CEO Cycle with Other Factors Affecting
Investment (Capital Expenditures) This table compares the CEO cycle effect (one std. dev. change in Tenure (in years) in column (1) of Table 2, Panel B and in column (2) of Appendix Table IA.5) with the effects of other external factors that affect firm’s capital expenditure: business cycle (Recession vs. non-recession, see results presented in Appendix Table IA.5, Column (2)), political cycle (Election vs. non-election, see Julio and Yook, 2012), and financial constraints (One std. dev. increase in financial constraint during 2008-2009, see Hoberg, and Maksimovic, 2014). I/A and I/S are Capital Expenditures scaled by lagged (beginning-of-period) Assets and Sales, respectively.
Business cycles: Firm level and aggregate corporate investment rates tend to vary substantially between expansions and recessions. In Appendix Table IA.5, we compare the magnitude of the business cycle effect to the CEO investment cycle effect. To do so, we define Recession as an indicator variable that equals one for years 2001, 2008-2010 and include this variable into the specification predicting changes in disinvestment, investment, and firm growth. Columns (1)-(3) in Appendix Table IA.5 show that the effects of CEO tenure and the business cycle on corporate investment rates are comparable in magnitude. Column (4) shows that disinvestment is actually less likely to occur in recession years than in expansion years, and thus the business cycle effect on disinvestment intensity is very different from the CEO cycle effect. Columns (5)-(6) show that the effects of CEO tenure and the business cycle on asset growth and employment growth are comparable in magnitude as well. The CEO cycle effect on corporate investment is non-trivial compared to the effect of the business cycle.
Political uncertainty: Julio and Yook (2012) estimate the extent to which corporate investment varies over the political election cycle. These authors find that the corporate investment rate (capital expenditures scaled by the beginning-of-year book assets) is on average 0.4 percentage point lower in national election years than in non-election years, or a 5% reduction relative to the sample median rate (=5.1%). Thus, the CEO investment cycle is comparable to the election cycle effect documented by Julio and Yook (2012).
Financial constraints: If firms face financial constraints, meaning that their cost of finance exceeds the appropriate risk-adjusted rate of return, then firms’ investment is likely to be reduced. Using a text-based approach to measure the existence of financial constraints, Hoberg and Maksimovic (2015) estimate that during the 2008-2009 Financial Crisis, a one standard-deviation increase in financial constraint is associated with a decrease in the annual corporate investment rate (CAPX scaled by sales) in the range of 0% to 0.8%, depending on the measure of financial constraint they use. In other years, the estimated effect of financial constraints on investment is smaller than during the Financial Crisis. Our estimates imply that the magnitude of the CEO investment cycle is in the range that Hoberg and Maksimovic find for the Financial Crisis. CapX/Assets CapX/Sales One std. dev. increase in Tenure (in years) 0.4 pts 0.4 pts Recession vs. non-recession -0.2 pts
Election vs. non-election (Julio and Yook, 2012) -0.4 pts One std. dev. increase in financial constraint during 2008-2009 (Hoberg
and Maksimovic, 2015) 0 to –0.8 pts
47
Table 6: Summary of Explanations for CEO Investment Cycles and their Empirical Support This table summarizes three explanations for CEO investment cycles and their empirical implications. It also summarizes the main findings that either support or contradict the implications of each explanation.
Explanation
Empirical Implications Empirical Findings about Investment Empirical Findings about Disinvestment
Management Irrelevance: Management plays no role in determining firms’ investments.
CEO investment cycles could exist in this world if CEO turnovers happen to coincide with investment shocks that lead to high disinvestment and low investment.
[Inconsistent]: CEO investment cycles exist even after turnovers due to death or illness of the departing CEOs, which are unlikely to be related to investment shocks. [Inconsistent]: CEO investment cycles exist following other turnovers that are also unlikely to coincide with periods of high disinvestment and low investment: - Turnovers due to normal
retirement of the departing CEOs - Turnovers with no shakeups in the
top management team - Turnovers preceded by good pre-
turnover performance and low pre-turnover volatility
[Inconsistent]: The same as those listed in the previous column.
Agency Explanation: CEO investment cycles reflect the changing equilibrium in a world in which managers’ incentives are not perfectly aligned with shareholders. CEOs prefer their firms to grow, potentially at the cost of shareholders. This preference leads to overinvestment in the later part of CEO tenure as the CEO becomes more powerful over the board. The private benefits from growth make CEOs reluctant to divest
Increasing investment over CEO tenure: - Holding other factors constant, the
increase in investment over CEO tenure should come through the CEO’s power over the board.
- Investment quality decreases with CEO tenure, and is also related to the CEO’s power over the board.
Decreasing disinvestment over CEO tenure: - The residual influence of the prior
management negatively affects the post-turnover disinvestment intensity of poorly performing assets.
[Consistent]: Investment quality (measured by acquisition announcement returns) decreases over CEO tenure, and are significantly more likely to be negative in later periods of CEO tenure. [Consistent]: Both the increase in the investment level and the decrease in quality are driven by the CEO’s increasing capture of the board over time, even when the board capture results exogenously from directors reaching retirement age.
[Consistent]: The residual influence of the prior management negatively affects the disinvestment intensity of poorly performing assets post turnover, even when the residual influence occurs for exogenous reasons (in the presence of a staggered board).
48
assets they have established, even if the firm is no longer the optimal owner of the assets. CEO turnover facilitate investment re-optimization, leading to high disinvestment after turnover. Efficiency Explanations: The CEO’s ability to identify positive NPV projects improves over his tenure, leading to increasing investment. The new CEO’s skills do not fit with the firm’s existing asset structure, leading to high disinvestment immediately after turnover.
Increasing investment over CEO tenure: - Increasing investment level is not
associated with a change in investment quality.
Decreasing disinvestment over CEO tenure: - The intensity of post-turnover
disinvestment negatively depends on the fit between the new CEO’s skills and the firm’s assets.
[Inconsistent]: Variation in CEO power due to factors unrelated to CEO ability (i.e., director aging) still leads to increase in investment. [Inconsistent]: Investment quality decreases (to negative) over CEO tenure.
[Inconsistent]: The CEO investment cycles exist even after turnovers due to death or illness of the departing CEOs (when the boards do not necessarily have desire to select new CEOs with different skills). [Inconsistent]: The magnitudes of the CEO investment cycles when single-industry firms hire insider CEOs (when the new CEOs’ skills are more likely to fit firms’ assets) are comparable to those in the full sample. [Inconsistent]: In multi-industry firms, the magnitudes of the CEO investment cycles are similar no matter whether the firm hires a generalist CEO or a specialist CEO. [Inconsistent]: The magnitude of the CEO investment cycle is similar regardless of whether there is an industry productivity shock at the time of the turnover (when the new CEO’s skills are less likely to fit the firm’s assets) or not.

49
Table 7: Agency Explanations for the Investment Cycle
Panel A: CEO Capture of the Board and Investment
This table reports the effect of the percentage of directors appointed during the incumbent CEO’s tenure on firm investment. All control variables are lagged. Firm-CEO fixed effects and year fixed effects are included in all models. The definitions of all variables are in Appendix A. The Huber-White robust standard errors are clustered by firm and reported in parenthesis. ***, ** and * indicate significance at the 1%, 5% and 10% levels respectively.
(1) (2) (3) (4)
Investment Rate CapX Rate Acquisition Rate
Tenure (in years) 0.005*** 0.001 0.0004 0.001
(0.001) (0.001) (0.0004) (0.001)
% of New Directors
0.064*** 0.011* 0.052**
(0.020) (0.006) (0.023)
Ind-adj. ROA 0.152*** 0.161*** 0.079*** 0.083***
(0.040) (0.031) (0.009) (0.029)
Ind-adj. Return 0.010* 0.011** 0.003*** 0.007
(0.006) (0.005) (0.001) (0.005)
MB 0.001 0.001** 0.001*** 0.001
(0.001) (0.001) (0.000) (0.001)
Leverage -0.179*** -0.161*** -0.056*** -0.106***
(0.028) (0.021) (0.007) (0.020)
Div. Payer 0.008 0.009 -0.003 0.012**
(0.008) (0.006) (0.003) (0.005)
log(Assets) -0.109*** -0.089*** -0.018*** -0.072***
(0.010) (0.007) (0.002) (0.007)
Firm-CEO F.E., Year F.E. x x x x Observations 12,972 12,972 12,972 12,972 Adj. R-sqr. 0.318 0.315 0.729 0.192

50
Panel B: Instrumental Variables Estimates of the Effect of CEO Power on Investment This table reports the results with the instrumented “% of New Directors”, using the cumulative number of directors reaching retirement age during the incumbent CEO’s tenure until the current fiscal year, scaled by the current board size. All control variables are lagged, including the average age of the directors. Firm-CEO fixed effects and year fixed effects are included. The definitions of all variables are in Appendix A. The Huber-White robust standard errors are clustered by firm and reported in parenthesis. ***, ** and * indicate significance at the 1%, 5% and 10% levels respectively. The F-statistics for the first-stage and the Anderson-Rubin Wald tests are reported at the bottom of the table.
First-Stage Second-Stage
% of New Directors Investment Rate
% of Directors Reaching Retirement Age 0.475***
(0.042)
% of New Directors
0.061**
(0.030)
Avg Director Age -0.017*** 0.0002
(0.002) (0.001)
Ind-adj. ROA 0.085* 0.143***
(0.045) (0.036)
Ind-adj. Return 0.011*** 0.006
(0.004) (0.005)
MB -0.001 0.001*
(0.001) (0.001)
Leverage 0.011 -0.171***
(0.036) (0.024)
Div. Payer -0.018 0.004
(0.018) (0.006)
log(Assets) 0.016 -0.092***
(0.012) (0.008)
Firm-CEO F.E., Year F.E. x x Observations 10,742 10,742 First-Stage F-Statistics 108.63***
Anderson-Rubin Wald test 5.74**
51
Table 8: Investment Quality
Panel A: Quality and Timing of Investment This panel reports the % of negative announcement abnormal returns and the average announcement abnormal returns, for deals made in the first three years of a CEO’s tenure vs. in later years. *** and ** indicate significance at the 1% and 5% levels, respectively. Deals made in years[0,2] Deals made after years[0, 2] Difference % of CAR [-1, 1] around Acq. Announcements<0 44% 57% -13%** Average CAR [-1, 1] 0.642 -0.360 -1.002***
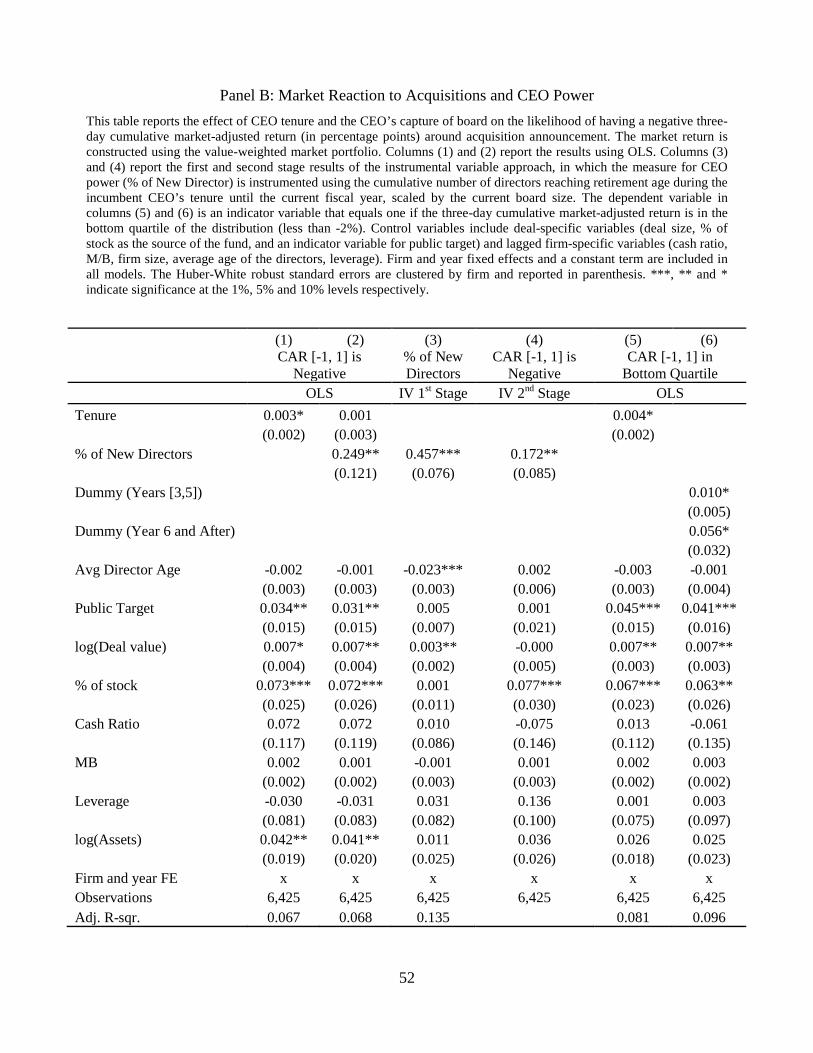
52
Panel B: Market Reaction to Acquisitions and CEO Power This table reports the effect of CEO tenure and the CEO’s capture of board on the likelihood of having a negative three-day cumulative market-adjusted return (in percentage points) around acquisition announcement. The market return is constructed using the value-weighted market portfolio. Columns (1) and (2) report the results using OLS. Columns (3) and (4) report the first and second stage results of the instrumental variable approach, in which the measure for CEO power (% of New Director) is instrumented using the cumulative number of directors reaching retirement age during the incumbent CEO’s tenure until the current fiscal year, scaled by the current board size. The dependent variable in columns (5) and (6) is an indicator variable that equals one if the three-day cumulative market-adjusted return is in the bottom quartile of the distribution (less than -2%). Control variables include deal-specific variables (deal size, % of stock as the source of the fund, and an indicator variable for public target) and lagged firm-specific variables (cash ratio, M/B, firm size, average age of the directors, leverage). Firm and year fixed effects and a constant term are included in all models. The Huber-White robust standard errors are clustered by firm and reported in parenthesis. ***, ** and * indicate significance at the 1%, 5% and 10% levels respectively.
(1) (2) (3) (4) (5) (6)
CAR [-1, 1] is
Negative % of New Directors
CAR [-1, 1] is Negative
CAR [-1, 1] in Bottom Quartile
OLS IV 1st Stage IV 2nd Stage OLS Tenure 0.003* 0.001 0.004* (0.002) (0.003) (0.002) % of New Directors 0.249** 0.457*** 0.172** (0.121) (0.076) (0.085) Dummy (Years [3,5]) 0.010* (0.005) Dummy (Year 6 and After) 0.056* (0.032) Avg Director Age -0.002 -0.001 -0.023*** 0.002 -0.003 -0.001 (0.003) (0.003) (0.003) (0.006) (0.003) (0.004) Public Target 0.034** 0.031** 0.005 0.001 0.045*** 0.041*** (0.015) (0.015) (0.007) (0.021) (0.015) (0.016) log(Deal value) 0.007* 0.007** 0.003** -0.000 0.007** 0.007** (0.004) (0.004) (0.002) (0.005) (0.003) (0.003) % of stock 0.073*** 0.072*** 0.001 0.077*** 0.067*** 0.063** (0.025) (0.026) (0.011) (0.030) (0.023) (0.026) Cash Ratio 0.072 0.072 0.010 -0.075 0.013 -0.061 (0.117) (0.119) (0.086) (0.146) (0.112) (0.135) MB 0.002 0.001 -0.001 0.001 0.002 0.003 (0.002) (0.002) (0.003) (0.003) (0.002) (0.002) Leverage -0.030 -0.031 0.031 0.136 0.001 0.003 (0.081) (0.083) (0.082) (0.100) (0.075) (0.097) log(Assets) 0.042** 0.041** 0.011 0.036 0.026 0.025 (0.019) (0.020) (0.025) (0.026) (0.018) (0.023) Firm and year FE x x x x x x Observations 6,425 6,425 6,425 6,425 6,425 6,425 Adj. R-sqr. 0.067 0.068 0.135 0.081 0.096

53
Table 9: Agency Explanations for the Disinvestment Cycle
Panel A: Segment Termination This table reports the OLS estimation of the probability of a segment being terminated, using the segment data from Compustat “historical segment” data base, for multi-segment firms in our sample. The dependent variable is an indicator variable that equals 1 if the segment is divested or discontinued in a given year. “Underperforming Segment” is a dummy variable that equals 1 if the industry-adjusted segment performance is in the bottom tercile of the sample distribution for two consecutive years. The observations are at the segment-year level for the entire life of each segment. In model (1) and (3), we control for industry-year fixed effects. In models (2) and (4), we control for firm-year fixed effects. In models (3) and (4), we use the subsample with original CEOs replaced (if replaced) after turnovers due to death, illness, or retirement of the departing CEOs. A constant term is included in all models. All variables definitions are in Appendix A. The Huber-White robust standard errors are clustered by firm and reported in parenthesis. ***, ** and * indicate significance at the 1%, 5%, and 10% levels respectively.
I{segment termination}
(1) (2) (3) (4)
Death/Illness/Retirement
Original CEO Replaced 0.005 0.012* 0.003 0.010
(0.004) (0.007) (0.015) (0.008)
Original CEO Replaced x Underperforming Segment 0.106*** 0.062*** 0.067** 0.084*** (0.018) (0.010) (0.028) (0.024) Underperforming Segment 0.026* 0.001 0.004 0.001
(0.014) (0.002) (0.016) (0.007)
Segment Age -0.001*** -0.001*** -0.001*** -0.001***
(0.000) (0.000) (0.000) (0.000)
Industry-Year F.E. x
x Firm-Year F.E.
x
x
Observations 69,609 69,609 6,787 6,787 Adj. R-sqr. 0.102 0.323 0.230 0.261

54
Panel B: Residual Influence of Old CEO on Post-Turnover Downsizing The analysis in this table uses the segment data from Compustat “historical segment” data base, for multi-segment firms in our sample. The dependent variable is an indicator variable that equals 1 if a segment established during the outgoing CEO’s tenure is divested or discontinued during the first three years of the incoming CEO’s tenure. We only include segments that are established during the departing CEO’s tenure. “Underperforming Segment (Prior to Turnover)” is a dummy variable that equals 1 if the industry-adjusted segment performance is in the bottom tercile of the sample distribution for two consecutive years right before the CEO turnover. Information on “Staggered Board” is from the governance (and governance-legacy) database from ISS Governance Services, which starts from 1990. Information on “% of Prior Mgt. On Board” is from the director (and director-legacy) database from ISS Governance Services, which starts from 1996 (with comprehensive data for S&P 1,500 firms from 1998). The observations are at the segment-year level. In all models, we control for firm-year fixed effects and use the first three years after the original CEO was replaced (“under new regime”). A constant term are included in all models. All variables definitions are in Appendix A. The Huber-White robust standard errors are clustered by firm and reported in parenthesis. ***, ** and * indicate significance at the 1%, 5% and 10% levels respectively. I{segment termination}
Under new regime in years [0,2]
(1) (2) (3) (4)
Underperforming Segment (Prior to Turnover) 0.069*** 0.055*** 0.062*** 0.043***
(0.013) (0.010) (0.012) (0.008)
Staggered Board x Underperforming Segment (Prior to Turnover)
-0.036** (0.016) Prior CEO Stay as Chairman x Underperforming
Segment (Prior to Turnover) -0.015*
(0.008) % of Prior Mgt. On Board x Underperforming
Segment (Prior to Turnover) -0.026*
(0.013) Outsider Succession x Underperforming
Segment (Prior to Turnover) 0.035**
(0.016)
Segment Age -0.003*** -0.004*** -0.004*** -0.004***
(0.000) (0.000) (0.000) (0.000)
Firm-Year F.E. x x x x Observations 24,778 29,521 30,095 35,739 Adj. R-sqr. 0.281 0.276 0.282 0.291

55
Table 10: CEO Investment Cycles in Single- vs. Multi-Industry Firms
This table estimates the probability of disinvestment as a function of CEO tenure. Model (1) reports results for all firms with available data on CEOs’ prior experience before becoming their CEOs. “Fit” measures the fit between new CEO’s experience and the existing business scope of the firm prior to the turnover. It multiplies the percentage of CEO’s prior experience in an industry with the percentage of firm’s sales in that industry; both measured as the year before turnover, and then summed up at the firm-year level. For example, suppose the new CEO worked for 3 industries (A, B, C). As of the year before turnover, he worked for 2 years in A, 3 years in B, and 5 years in C. The firm’s business spans in two industries (A and B), with 50% of sales in each. Then the fit measure is: [2/(2+3+5)]*50% + [3/(2+3+5)]*50%=0.25. Models (2) and (3) report results for the subsample of firms with segment(s) in only one industry at the CEO turnover year, defined by four-digit segment SIC in Compustat (historical) segment data base. Firms that did not report segment data is classified as single-industry firms. A constant term is included in all models. All explanatory variables except for Tenure and General Ability are lagged by one year. The definitions of all variables are in Appendix A. The Huber-White robust standard errors are clustered by firm and reported in parenthesis. ***, ** and * indicate significance at the 1%, 5% and 10% levels respectively.
(1) (2) (3)
Single-Industry Firms Single-Industry Firms/
Industry Insider Succession Tenure (in years) -0.022** -0.021** -0.024**
(0.010) (0.010) (0.011)
Tenure*Fit 0.006
(0.008)
Ind-adj. ROA -0.124*** -0.108*** -0.134***
(0.041) (0.031) (0.048)
Ind-adj. Return -0.008 -0.011*** -0.013**
(0.006) (0.004) (0.006)
MB 0.0004 -0.002 -0.001
(0.001) (0.001) (0.001)
Leverage -0.011 -0.016 -0.026
(0.024) (0.022) (0.030)
Div. Payer 0.087* 0.050 0.089
(0.047) (0.041) (0.059)
log(Assets) 0.018 0.009 -0.005
(0.013) (0.011) (0.014)
Firm-CEO F.E., Year F.E. x x x Observations 12,294 15,902 10,455 Adj. R-sqr. 0.329 0.398 0.401
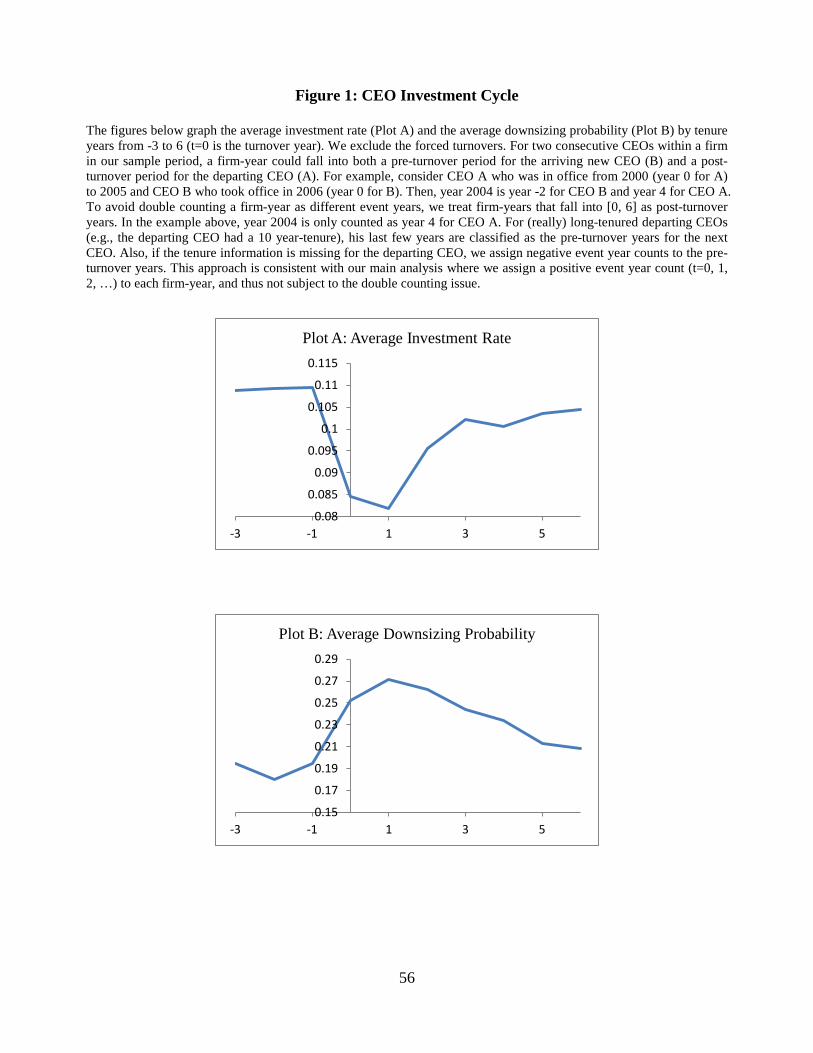
56
Figure 1: CEO Investment Cycle
The figures below graph the average investment rate (Plot A) and the average downsizing probability (Plot B) by tenure years from -3 to 6 (t=0 is the turnover year). We exclude the forced turnovers. For two consecutive CEOs within a firm in our sample period, a firm-year could fall into both a pre-turnover period for the arriving new CEO (B) and a post-turnover period for the departing CEO (A). For example, consider CEO A who was in office from 2000 (year 0 for A) to 2005 and CEO B who took office in 2006 (year 0 for B). Then, year 2004 is year -2 for CEO B and year 4 for CEO A. To avoid double counting a firm-year as different event years, we treat firm-years that fall into [0, 6] as post-turnover years. In the example above, year 2004 is only counted as year 4 for CEO A. For (really) long-tenured departing CEOs (e.g., the departing CEO had a 10 year-tenure), his last few years are classified as the pre-turnover years for the next CEO. Also, if the tenure information is missing for the departing CEO, we assign negative event year counts to the pre-turnover years. This approach is consistent with our main analysis where we assign a positive event year count (t=0, 1, 2, …) to each firm-year, and thus not subject to the double counting issue.
0.08
0.085
0.09
0.095
0.1
0.105
0.11
0.115
-3 -1 1 3 5
Plot A: Average Investment Rate
0.15
0.17
0.19
0.21
0.23
0.25
0.27
0.29
-3 -1 1 3 5
Plot B: Average Downsizing Probability
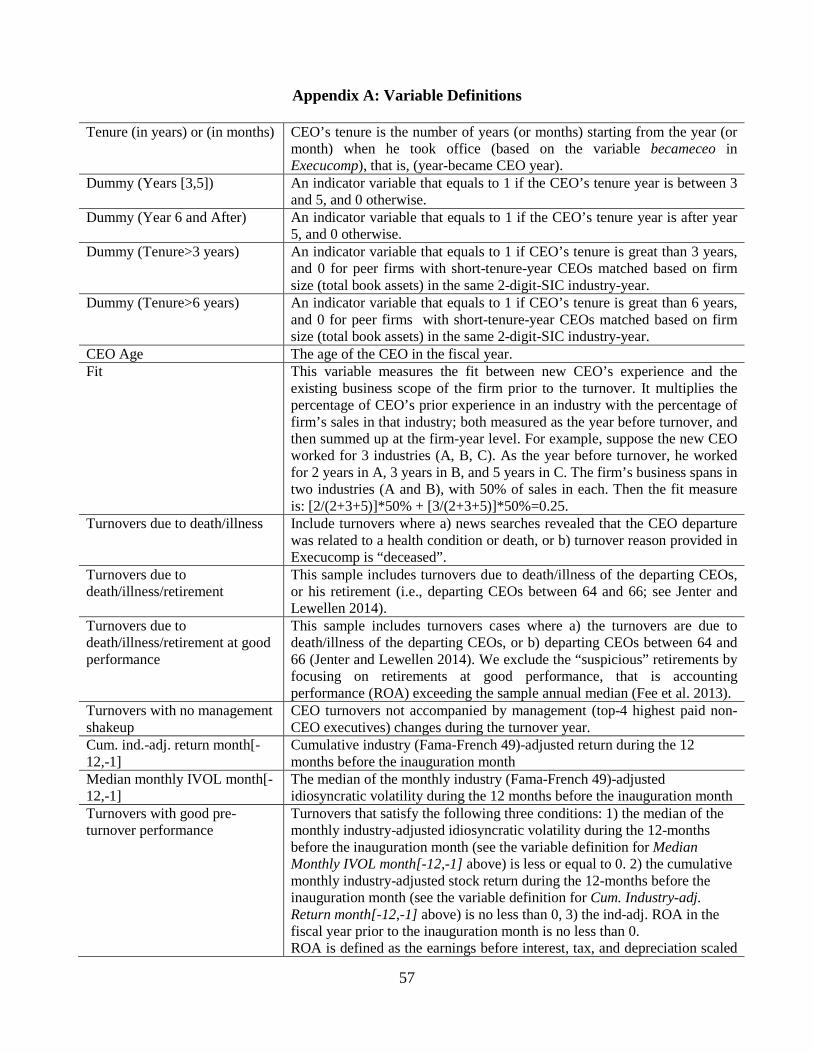
57
Appendix A: Variable Definitions
Tenure (in years) or (in months) CEO’s tenure is the number of years (or months) starting from the year (or month) when he took office (based on the variable becameceo in Execucomp), that is, (year-became CEO year).
Dummy (Years [3,5]) An indicator variable that equals to 1 if the CEO’s tenure year is between 3 and 5, and 0 otherwise.
Dummy (Year 6 and After) An indicator variable that equals to 1 if the CEO’s tenure year is after year 5, and 0 otherwise.
Dummy (Tenure>3 years) An indicator variable that equals to 1 if CEO’s tenure is great than 3 years, and 0 for peer firms with short-tenure-year CEOs matched based on firm size (total book assets) in the same 2-digit-SIC industry-year.
Dummy (Tenure>6 years) An indicator variable that equals to 1 if CEO’s tenure is great than 6 years, and 0 for peer firms with short-tenure-year CEOs matched based on firm size (total book assets) in the same 2-digit-SIC industry-year.
CEO Age The age of the CEO in the fiscal year. Fit This variable measures the fit between new CEO’s experience and the
existing business scope of the firm prior to the turnover. It multiplies the percentage of CEO’s prior experience in an industry with the percentage of firm’s sales in that industry; both measured as the year before turnover, and then summed up at the firm-year level. For example, suppose the new CEO worked for 3 industries (A, B, C). As the year before turnover, he worked for 2 years in A, 3 years in B, and 5 years in C. The firm’s business spans in two industries (A and B), with 50% of sales in each. Then the fit measure is: [2/(2+3+5)]*50% + [3/(2+3+5)]*50%=0.25.
Turnovers due to death/illness Include turnovers where a) news searches revealed that the CEO departure was related to a health condition or death, or b) turnover reason provided in Execucomp is “deceased”.
Turnovers due to death/illness/retirement
This sample includes turnovers due to death/illness of the departing CEOs, or his retirement (i.e., departing CEOs between 64 and 66; see Jenter and Lewellen 2014).
Turnovers due to death/illness/retirement at good performance
This sample includes turnovers cases where a) the turnovers are due to death/illness of the departing CEOs, or b) departing CEOs between 64 and 66 (Jenter and Lewellen 2014). We exclude the “suspicious” retirements by focusing on retirements at good performance, that is accounting performance (ROA) exceeding the sample annual median (Fee et al. 2013).
Turnovers with no management shakeup
CEO turnovers not accompanied by management (top-4 highest paid non-CEO executives) changes during the turnover year.
Cum. ind.-adj. return month[-12,-1]
Cumulative industry (Fama-French 49)-adjusted return during the 12 months before the inauguration month
Median monthly IVOL month[-12,-1]
The median of the monthly industry (Fama-French 49)-adjusted idiosyncratic volatility during the 12 months before the inauguration month
Turnovers with good pre-turnover performance
Turnovers that satisfy the following three conditions: 1) the median of the monthly industry-adjusted idiosyncratic volatility during the 12-months before the inauguration month (see the variable definition for Median Monthly IVOL month[-12,-1] above) is less or equal to 0. 2) the cumulative monthly industry-adjusted stock return during the 12-months before the inauguration month (see the variable definition for Cum. Industry-adj. Return month[-12,-1] above) is no less than 0, 3) the ind-adj. ROA in the fiscal year prior to the inauguration month is no less than 0. ROA is defined as the earnings before interest, tax, and depreciation scaled

58
by the beginning of fiscal year total book assets. Acquisition Rate Value of acquisitions/lagged total book assets. Acquisitions include
completed deals covered in SDC with the deal form of “Acquisitions of Assets”, “Acquisitions of certain Assets”, “Acq. Maj. Int.”, “Acq. Part. Int.”, “Acq. Rem. Int.”, “Acquisition” or “Merger” (as the acquirer”).
CapX Rate Capital expenditure/lagged total book assets, with missing or negative Capx set to 0.
Investment Rate (Value of acquisitions + Capital expenditure)/lagged total book assets R&D Rate R&D expenditure/lagged total book assets I{expansion announcement(s) in the month} An indicator variable that equals to one if the company makes expansion
announcements (Events 3 or 31 in Capital IQ) in a month. I{ segment start} An indicator variable that equals 1 if the segment is newly established in
the fiscal year, 0 otherwise. I{asset sales>0 or discontinued operations>0} An indicator function that equals 1 of the firm either has asset sales or
reports discontinued operations (inflow/outflow of funds due to discontinuation of operations (item “DO” in Compustat) in the fiscal year.
I{ downsizing announcement(s) in the month} An indicator variable that equals to one if the company makes downsizing announcement (Events 1, 21 in Capital IQ) in a month.
I{ segment termination} An indicator variable that equals to one if the segment is divested or discontinued in the fiscal year, and 0 otherwise.
Asset Growth Rate Total assets in the fiscal year – total assets last fiscal year/total assets last fiscal year.
Employment Growth Rate Total employment in the fiscal year – total employment last fiscal year/total employment last fiscal year.
Ind-adj. Return Industry (Fama-French 49)-adjusted return Ind-adj. ROA Industry (Fama-French 49)-adjusted ROA. ROA is defined as the earnings
before interest, tax, and depreciation scaled by the beginning of fiscal year total book assets.
M/B Market value of equity (closing price at the fiscal year end times shares outstanding) divided by book value of equity
Leverage (Long-term debt + debt in current liabilities)/total assets Div. Payer An indicator variable that equals 1 if the firm pays out dividend to common
stock holders in a year Log(Assets) Logarithm of the total book assets # of Segments The number of segments (defined by segment id) in a firm-year Firm Age Age of the firm since IPO, using the first day appear in CRSP (or the IPO
date in Compustat if missing) Cash Ratio Cash divided by total assets % of New Directors The percentage of directors on the board appointed during the incumbent
CEO’s tenure, using ISS Governance Services’ director database. % of Directors Reaching Retirement Age
The cumulative number of directors reaching retirement age (72 or above when service ends for outsider directors; 65 for insider directors) during the incumbent CEO’s tenure up until the current fiscal year, scaled by the current board size, using ISS Governance Services’ director database.
Avg Director Age The average age of directors in a firm-year Staggered Board An indicator variable that equals to 1 if the board of directors is divided, for
the purpose of election, into separate classes. In most instances there are three classes, with the directors in each class serving overlapping three-year terms. With a classified board, also known as a staggered board, the change in the makeup of the board is limited because it would take at least two elections to replace a majority of the board. This variable is constructed
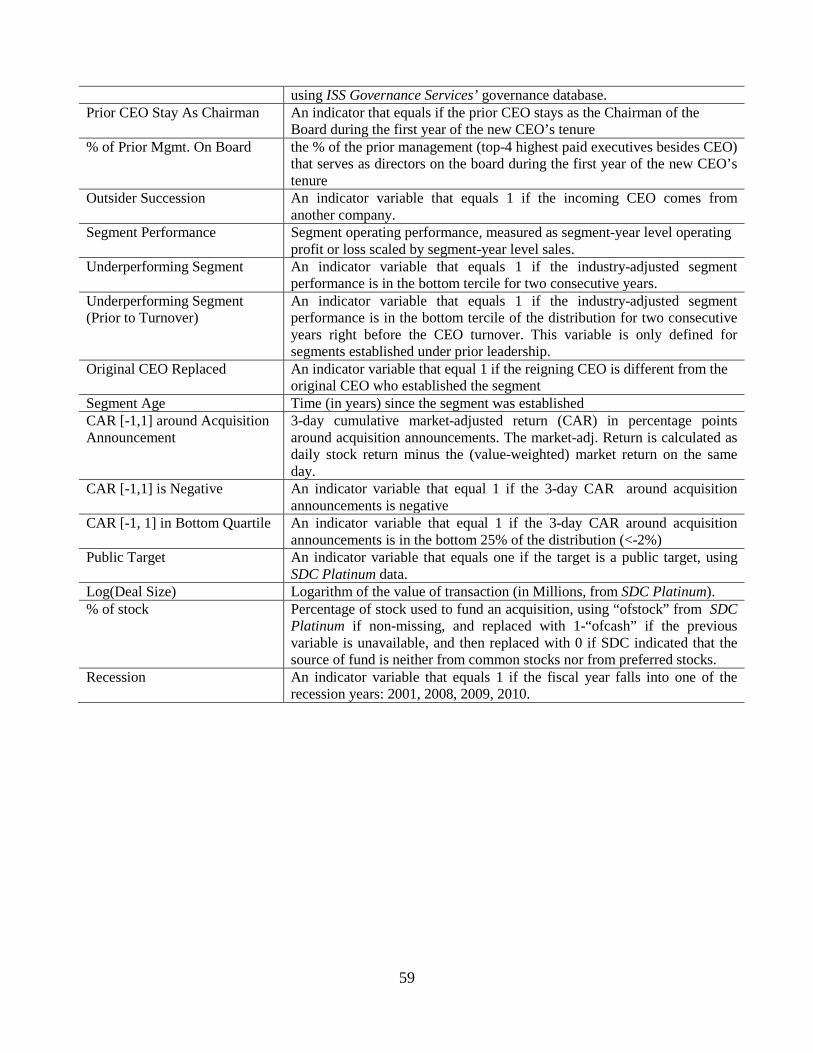
59
using ISS Governance Services’ governance database. Prior CEO Stay As Chairman An indicator that equals if the prior CEO stays as the Chairman of the
Board during the first year of the new CEO’s tenure % of Prior Mgmt. On Board the % of the prior management (top-4 highest paid executives besides CEO)
that serves as directors on the board during the first year of the new CEO’s tenure
Outsider Succession An indicator variable that equals 1 if the incoming CEO comes from another company.
Segment Performance Segment operating performance, measured as segment-year level operating profit or loss scaled by segment-year level sales.
Underperforming Segment An indicator variable that equals 1 if the industry-adjusted segment performance is in the bottom tercile for two consecutive years.
Underperforming Segment (Prior to Turnover)
An indicator variable that equals 1 if the industry-adjusted segment performance is in the bottom tercile of the distribution for two consecutive years right before the CEO turnover. This variable is only defined for segments established under prior leadership.
Original CEO Replaced An indicator variable that equal 1 if the reigning CEO is different from the original CEO who established the segment
Segment Age Time (in years) since the segment was established CAR [-1,1] around Acquisition Announcement
3-day cumulative market-adjusted return (CAR) in percentage points around acquisition announcements. The market-adj. Return is calculated as daily stock return minus the (value-weighted) market return on the same day.
CAR [-1,1] is Negative An indicator variable that equal 1 if the 3-day CAR around acquisition announcements is negative
CAR [-1, 1] in Bottom Quartile An indicator variable that equal 1 if the 3-day CAR around acquisition announcements is in the bottom 25% of the distribution (<-2%)
Public Target An indicator variable that equals one if the target is a public target, using SDC Platinum data.
Log(Deal Size) Logarithm of the value of transaction (in Millions, from SDC Platinum). % of stock Percentage of stock used to fund an acquisition, using “ofstock” from SDC
Platinum if non-missing, and replaced with 1-“ofcash” if the previous variable is unavailable, and then replaced with 0 if SDC indicated that the source of fund is neither from common stocks nor from preferred stocks.
Recession An indicator variable that equals 1 if the fiscal year falls into one of the recession years: 2001, 2008, 2009, 2010.
60
Internet Appendix for “CEO Investment Cycles”
Yihui Pan
University of Utah
Tracy Yue Wang University of Minnesota
Michael S. Weisbach
Ohio State University, NBER, and SIFR
Abstract
This document provides supplementary materials to the paper CEO Investment Cycles. The document reports and discusses eight tables that we mention in the paper but do not report for brevity. The appendix is organized as follows. Section A reports various robustness to our baseline results (Table IA.1-4), and additional results using the segment data (Table IA.5). Section B compares the variation over the CEO cycle and the variation over the business cycle (Table IA.6). Section C reports the magnitudes of the CEO investment cycles under various industry conditions at the time of the CEO turnover (Table IA.7). Section D reports some preliminary results on the relation between R&D expenditures and CEO tenure (Table IA.18).

61
Internet Appendix A Various Robustness Checks for the CEO Investment Cycle
Table IA.1: Different Investment Measures
Panel A: Capital Expenditures vs. Acquisitions
This table reports CapX and acquisition rates as a function of CEO tenure. We control for firm level variables as in Panel A. The usual set of control variables (lagged): Industry-adj. ROA and Return, MB, Leverage, Div. Payer, log(Assets), as well as a constant term is included in all models but omitted for brevity. The definitions of all variables are in Appendix A. The standard errors are clustered by firm. The Huber-White robust standard errors are clustered by firm and reported in parenthesis. ***, ** and * indicate significance at the 1%, 5% and 10% levels respectively.
(1) (2)
CapX Rate Acquisition Rate
Tenure (in years) 0.002** 0.004***
(0.001) (0.001)
Firm-level Controls x x Firm-CEO F.E., Year F.E. x x Observations 21,915 21,915 Adj. R-sqr. 0.669 0.149
Panel B: Alternative Scaling of Investment
This table reports robustness of the investment-tenure relation to different ways of scaling the investment expenditures. We scale investment by lagged book assets in the main analysis. Column (1) scale it by lagged sales. A possible alternative interpretation of the increasing investment rate over CEO tenure is that it occurs because of high disinvestment in the early years of CEO tenure, reducing the assets and thus the denominator for the investment rate. To address this concern, in Column (2) we re-estimate the investment equations, scaling the investment throughout the CEO’s tenure by the total assets before the turnover year. In Column (3), we do not scale the investment expenditures. The usual set of control variables (lagged): Industry-adj. ROA and Return, MB, Leverage, Div. Payer, log(Assets), as well as a constant term is included in all models but omitted for brevity. We also control for firm-CEO fixed effects and year fixed effects in all the regressions in this table. The definitions of all variables are in Appendix A. The standard errors are clustered by firm. The Huber-White robust standard errors are clustered by firm and reported in parenthesis. ***, ** and * indicate significance at the 1%, 5% and 10% levels respectively.
(1) (2) (3)
Inv/lagged Sales Inv/(Assets before Turnover) Inv
Tenure (in years) 0.004** 0.004** 7.983***
(0.002) (0.002) (1.324)
Controls x x x Firm-CEO f.e., year f.e. x x x Observations 21,876 20,261 21,915 Adj. R-sqr. 0.446 0.627 0.836

62
Table IA.2: Different Turnover Reasons and Types
Panel A reports how the investment rate, disinvestment probability, asset and growth rates change over CEO tenure, for a subsample of 2,121 CEO turnovers for which the reason for the turnover is unclassified. Pan, Wang, and Weisbach (2015) show that in terms of pre-turnover stock performance and volatility, these turnovers are more similar to the turnovers that we have identified as unlikely to be performance-driven than to the turnovers identified as forced. Panel B reports the results for a subsample of 272 outright forced CEO turnovers based on Factiva news search. This subsample represents only 6% of the turnover sample, and exhibit significantly lower industry-adjusted return as well as higher industry-adjusted return volatility in the 12 months prior to the turnover. Panel C reports the results for a subsample of 2,694 insider successions, that is, the new CEO has been with the firm for at least three years when becoming CEO. The usual set of control variables (lagged): Industry-adj. ROA and Return, MB, Leverage, Div. Payer, log(Assets), as well as a constant term is included in all models but omitted for brevity. The standard errors are clustered by firm. The Huber-White robust standard errors are clustered by firm and reported in parenthesis. ***, ** and * indicate significance at the 1%, 5% and 10% levels respectively.
Panel A: Non-classified Turnovers (1) (2) (3) (4)
Investment
Rate I{asset sales>0 or discontinued operations>0} Asset Growth Rate
Sales Growth Rate
Tenure (in years)
0.006*** -0.012* 0.040*** 0.014*** (0.001) (0.007) (0.005) (0.003)
Firm-CEO F.E., Year F.E. x x x x Observations 10,471 10,471 10,471 10,289 Adj. R-sqr. 0.266 0.408 0.263 0.214
Panel B: Outright Forced Turnovers (1) (2) (3) (4)
Investment
Rate I{asset sales>0 or discontinued
operations>0} Asset Growth
Rate Sales Growth
Rate Tenure (in years)
0.005** -0.044* 0.024*** 0.008* (0.002) (0.023) (0.006) (0.005)
Firm-CEO F.E., Year F.E. x x x x Observations 1,309 1,309 1,309 1,282 Adj. R-sqr. 0.172 0.393 0.222 0.182
Panel C: Insider Successions
(1) (2) (3) (4)
Investment
Rate I{asset sales>0 or discontinued
operations>0} Asset Growth
Rate Sales Growth
Rate Tenure (in years)
0.003*** -0.019*** 0.030*** 0.013*** (0.001) (0.006) (0.003) (0.002)
Firm-CEO F.E., Year F.E. x x x x Obs 14,807 14,807 14,807 14,530 Adj. R-sqr. 0.309 0.393 0.215 0.187

63
Table IA.3: Excluding the Turnover Year and the Year After
This table reports how the investment rate, disinvestment probability, and growth rates change over CEO tenure, excluding the turnover year and the year after. The usual set of control variables (lagged): Industry-adj. ROA and Return, MB, Leverage, Div. Payer, log(Assets), as well as a constant term is included in all models but omitted for brevity. We also control for firm-CEO fixed effects and year fixed effects in all the regressions in this table. The definitions of all variables are in Appendix A. The standard errors are clustered by firm. The Huber-White robust standard errors are clustered by firm and reported in parenthesis. ***, ** and * indicate significance at the 1%, 5% and 10% levels respectively.
(1) (2) (3) (4)
Investment
Rate I{asset sales>0 or discontinued
operations>0} Asset Growth
Rate Employment Growth
Rate Tenure (in years)
0.005*** -0.015*** 0.034*** 0.014*** (0.001) (0.005) (0.004) (0.003)
Firm-CEO F.E., Year F.E. x x x x Observations 16,437 16,437 16,437 16,145 Adj. R-sqr. 0.275 0.417 0.257 0.179

64
Table IA.4: CEO Career Cycle vs. Life Cycle Effects
Panel A: With CEO and Firm Age This table reports how the investment rate, disinvestment probability, asset and growth rates change over CEO tenure, controlling for CEO age and firm age. The usual set of control variables (lagged): Industry-adj. ROA and Return, MB, Leverage, Div. Payer, log(Assets), as well as a constant term is included in all models but omitted for brevity. Note that to identify the effects of CEO age and firm age, we cannot control for firm-CEO fixed effects or firm fixed effects. Thus, instead we use subsample analysis in Panel B and report the coefficients on Tenure (in years). The definitions of all variables are in Appendix A. The standard errors are clustered by firm. The Huber-White robust standard errors are clustered by firm and reported in parenthesis. ***, ** and * indicate significance at the 1%, 5% and 10% levels respectively.
(1) (2) (3) (4) (5)
Investment Rate I{asset sales>0 or
discontinued operations>0} Asset Growth
Rate Employment Growth Rate
Tenure (in years) 0.001** 0.001** -0.010*** 0.007*** 0.006***
(0.000) (0.001) (0.002) (0.001) (0.001)
CEO Age
-0.001** 0.001 -0.002*** -0.002***
(0.000) (0.001) (0.001) (0.000)
Firm Age
-0.000 0.005*** -0.002*** -0.002***
(0.000) (0.000) (0.000) (0.000)
Firm-level Controls x x x x x Year F.E. x x x x x Observations 21,915 21,169 21,169 21,169 20,765 Adj. R-sqr. 0.081 0.082 0.089 0.096 0.077
Panel B: Mover CEOs
This panel reports how the investment rate, disinvestment probability, asset and growth rates change over CEO tenure, for a subsample of 163 CEO who changed companies during our sample period. The usual set of control variables (lagged): Industry-adj. ROA and Return, MB, Leverage, Div. Payer, log(Assets), as well as a constant term is included in all models but omitted for brevity. We control for firm-CEO fixed effects and year fixed effects in all the regressions in this table. The standard errors are clustered by firm. The Huber-White robust standard errors are clustered by firm and reported in parenthesis. ***, ** and * indicate significance at the 1%, 5% and 10% levels respectively.
(1) (2) (3) (4)
Investment
Rate I{asset sales>0 or discontinued
operations>0} Asset Growth
Rate Employment Growth
Rate Tenure (in years)
0.013*** -0.025** 0.047*** 0.023*** (0.004) (0.011) (0.011) (0.007)
Firm-CEO F.E., Year F.E. x x x x Observations 1,257 1,257 1,257 1,237 Adj. R-sqr. 0.321 0.455 0.404 0.228

65
Panel C: Subsample Analysis Based on CEO and Firm Age
This panel reports the coefficient estimates on the CEO tenure variable in the investment (Table 2, Panel A, Column (1)), disinvestment (Table 3, Panel A, Column (1)), and growth (Table 4, Panels A and B, Column (1)) regressions, for subsamples based on CEO age when taking office, or firm age when entering our sample. Young CEOs are CEOs younger than the sample median age of 52 when taking office. Old CEOs are those older than 52 when taking office. Young firms are firms that entered our sample younger than the sample median age of 8. Old firms are those that entered our sample older than 8.
Young CEOs Old CEOs Young Firms Old Firms Investment Rate 0.004* 0.005*** 0.009*** 0.004*** (0.002) (0.001) (0.002) (0.001) I{asset sales>0 or discontinued operations>0} -0.017*** -0.014* -0.018*** -0.016** (0.007) (0.008) (0.006) (0.008) Asset Growth 0.031*** 0.036*** 0.040*** 0.027*** (0.004) (0.004) (0.007) (0.002) Employment Growth 0.014*** 0.015*** 0.015*** 0.015*** (0.003) (0.002) (0.004) (0.002)

66
Table IA.5: Segment Performance and the Establishing CEO’s Tenure Year
The analysis in this table uses the segment data from Compustat “historical segment” data base, for multi-segment firms in our sample. We only include segments that are established during the departing CEO’s tenure for whom we have information on the tenure years. We use the segment performance under the new CEO’s regime as a proxy for a segment’s long-term performance. Column (1) examines segment performance in the first 3 years of the new CEO’s tenure, and Column (2) extends it to the entire tenure of the new CEO. “Underperforming Segment” is a dummy variable that equals 1 if the industry-adjusted segment performance is in the bottom tercile of the sample distribution for two consecutive years in t-1 and t. “CEO Tenure (at segment start)” is the tenure year of the CEO in which the segment is established. “Dummy (segment in first 3 years of life)” is an indicator variable that equals 1 if a segment has been established for no more than 3 three years. This variable is included to control for the possibility that a newly established segment is underperforming because it is still in the expansion stage. The observations are at the segment-year level. A constant term is included in the regression. All variables definitions are in Appendix A. The Huber-White robust standard errors are clustered by firm-segment and reported in parenthesis. ***, ** and * indicate significance at the 1%, 5% and 10% levels respectively.
(1) (2) Underperforming Segment Under new regime in years [0, 2] Under new regime Departing CEO Tenure (at segment start) 0.011*** 0.009*** (0.002) (0.001) Dummy (segment in first 3 years of life) 0.023 0.030** (0.015) (0.014) Firm-Year FE x x Cluster by Firm-Segment x x Observations 24,668 52,354 Adj. R-sqr. 0.167 0.154
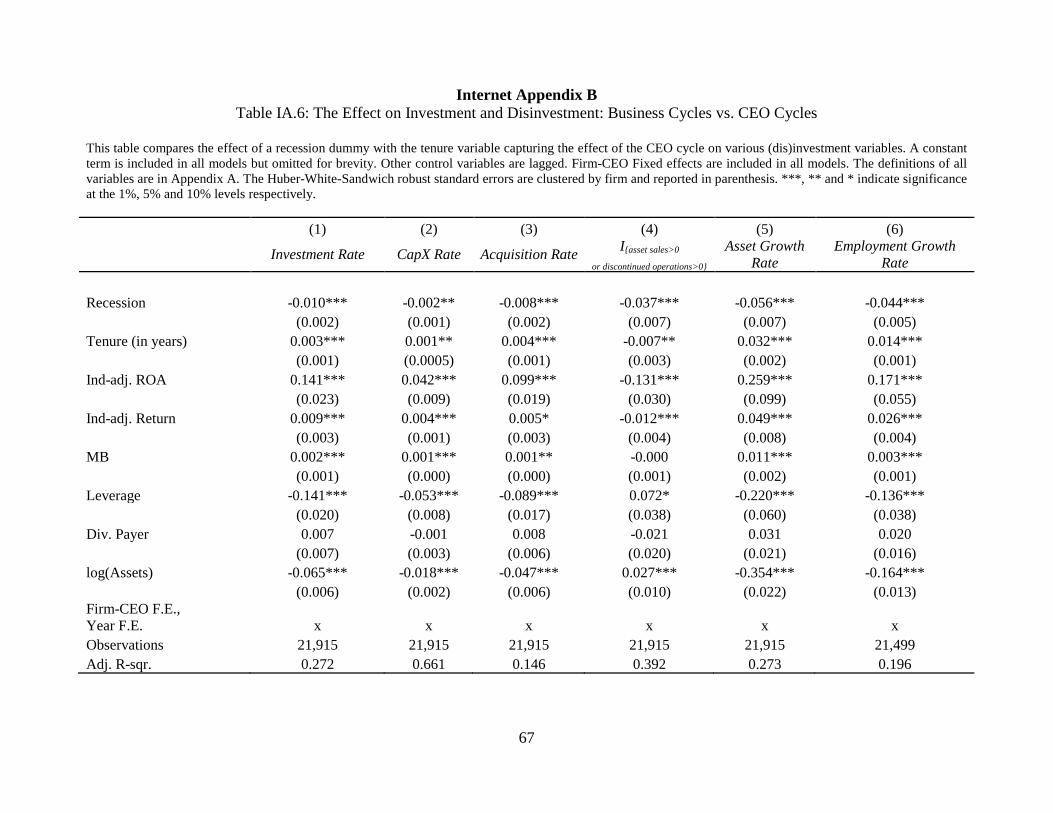
67
Internet Appendix B Table IA.6: The Effect on Investment and Disinvestment: Business Cycles vs. CEO Cycles
This table compares the effect of a recession dummy with the tenure variable capturing the effect of the CEO cycle on various (dis)investment variables. A constant term is included in all models but omitted for brevity. Other control variables are lagged. Firm-CEO Fixed effects are included in all models. The definitions of all variables are in Appendix A. The Huber-White-Sandwich robust standard errors are clustered by firm and reported in parenthesis. ***, ** and * indicate significance at the 1%, 5% and 10% levels respectively. (1) (2) (3) (4) (5) (6)
Investment Rate CapX Rate Acquisition Rate I{asset sales>0 or discontinued operations>0}
Asset Growth Rate
Employment Growth Rate
Recession -0.010*** -0.002** -0.008*** -0.037*** -0.056*** -0.044***
(0.002) (0.001) (0.002) (0.007) (0.007) (0.005)
Tenure (in years) 0.003*** 0.001** 0.004*** -0.007** 0.032*** 0.014***
(0.001) (0.0005) (0.001) (0.003) (0.002) (0.001)
Ind-adj. ROA 0.141*** 0.042*** 0.099*** -0.131*** 0.259*** 0.171***
(0.023) (0.009) (0.019) (0.030) (0.099) (0.055)
Ind-adj. Return 0.009*** 0.004*** 0.005* -0.012*** 0.049*** 0.026***
(0.003) (0.001) (0.003) (0.004) (0.008) (0.004)
MB 0.002*** 0.001*** 0.001** -0.000 0.011*** 0.003***
(0.001) (0.000) (0.000) (0.001) (0.002) (0.001)
Leverage -0.141*** -0.053*** -0.089*** 0.072* -0.220*** -0.136***
(0.020) (0.008) (0.017) (0.038) (0.060) (0.038)
Div. Payer 0.007 -0.001 0.008 -0.021 0.031 0.020
(0.007) (0.003) (0.006) (0.020) (0.021) (0.016)
log(Assets) -0.065*** -0.018*** -0.047*** 0.027*** -0.354*** -0.164***
(0.006) (0.002) (0.006) (0.010) (0.022) (0.013)
Firm-CEO F.E., Year F.E. x x x x x x Observations 21,915 21,915 21,915 21,915 21,915 21,499 Adj. R-sqr. 0.272 0.661 0.146 0.392 0.273 0.196

Internet Appendix C Industry Productivity Shocks and CEO Investment Cycles
In this appendix, we examine the impact of industry productivity shocks on the magnitudes of the CEO (dis)investment cycles. We use a variety of measures to capture the changes in industry conditions as of the CEO turnover year. We examine changes in the industry median of ROA, sales growth rate, employment growth rate, and in the industry total factor productivity. The industry total factor productivity is constructed following Jorgenson and Griliches (1976). For each industry shock measure, we also capture the changes over different horizons: year-to-year changes and three-year cumulative changes. Then we classify the nature of the shock by dividing turnover-year industry conditions into negative, neutral, or positive shocks based on the tercile distribution (bottom, middle, top) of each industry shock measure. This procedure generates 24 categories of industry conditions at the time of CEO turnover: 4 (performance measures) * 2 (horizons) * 3 (types) =24. Finally, within each of the 24 categories, we estimate the magnitudes of the CEO investment cycle (Panel A) and the disinvestment cycle (Panel B) using the baseline regressions in Tables 2 and 3. We report the coefficient estimate for the CEO tenure variable and its standard error under each category.
The results in this appendix show that both the CEO (dis)investment cycle exists regardless of the industry condition in which the CEO takes office. Moreover, even the magnitudes of the cycles are similar across industry conditions. These results suggest that the CEO (dis)investment cycle does not occur because of productivity shocks coinciding with the CEO changes.
Table IA.7: Industry Shocks and CEO Investment Cycle This table reports the coefficient estimates on the CEO tenure variable in the investment and disinvestment regressions, for subsamples based on various industry shocks. For example, “Shock based on Industry ROA, 1 (3) year” measures the year-to-year change (the 3-year cumulative change) in the industry median of firm-year level ROA. Shocks based on Sales Growth and Employment Growth are constructed using changes in the industry medians sales growth and employment growth. Shocks based on Total Factor Productivity measures the changes (rate of growth) in total factor productivity, following Jorgenson and Griliches (1967). We then define negative (neutral, positive) shock to be the bottom (middle, top) tercile of the sample distribution for each industry shock measure. We use all the CEOs in Execucomp for this test, instead of restricting to the prior-1992 sample, to ensure that we have a decent sample size for each subsample. The Huber-White robust standard errors are clustered by firm. ***, ** and * indicate significance at the 1%, 5% and 10% levels.
Panel A: Coefficients of Regressing Investment Rate on CEO Tenure (in years) Shock Based on Industry Horizon of Shock Negative Shock Neutral Positive Shock ROA 1 year 0.004*** 0.004*** 0.004***
(0.001) (0.001) (0.001)
3 year 0.006*** 0.004** 0.006***
(0.001) (0.002) (0.002)
Sales Growth 1 year 0.004*** 0.004*** 0.003***
(0.001) (0.001) (0.001)
3 year 0.004*** 0.005*** 0.003**
(0.001) (0.001) (0.001)
Employment Growth 1 year 0.004*** 0.004*** 0.004***
(0.001) (0.001) (0.001)
3 year 0.029*** 0.010* 0.022**
(0.009) (0.006) (0.009)
Total Factor Productivity 1 year 0.003** 0.006*** 0.007***
(0.002) (0.002) (0.002)
3 year 0.004** 0.008*** 0.006***
(0.002) (0.002) (0.001)
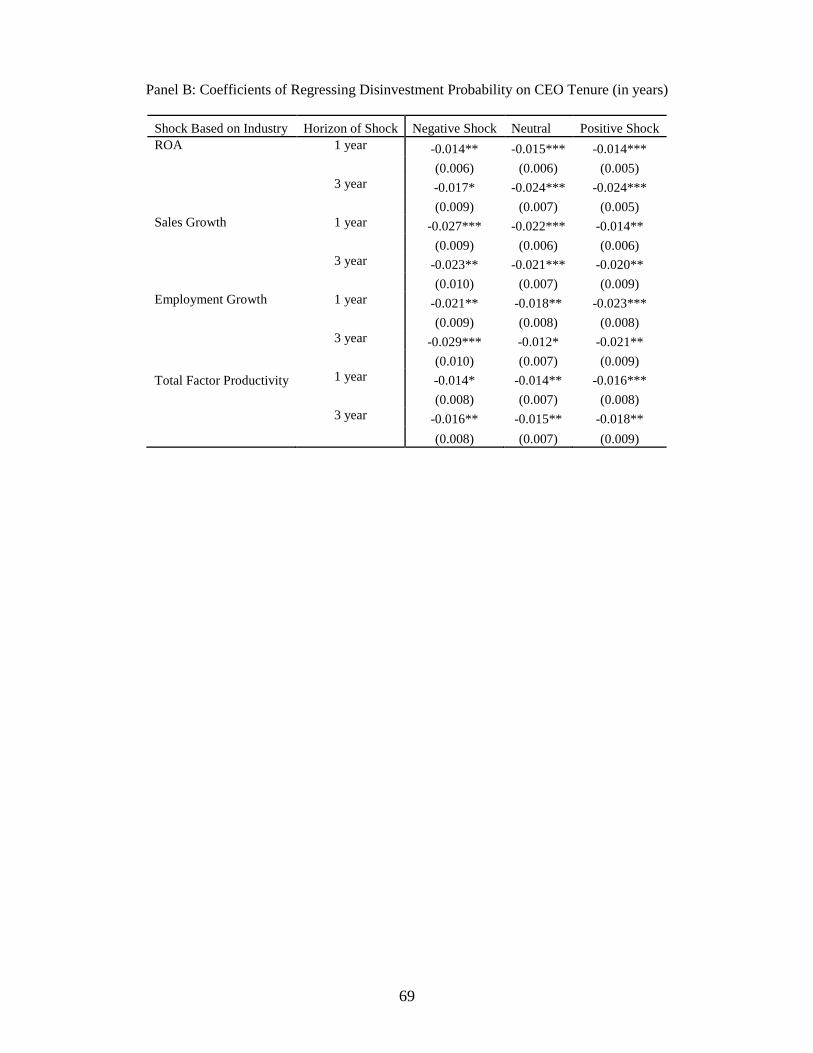
69
Panel B: Coefficients of Regressing Disinvestment Probability on CEO Tenure (in years)
Shock Based on Industry Horizon of Shock Negative Shock Neutral Positive Shock ROA 1 year -0.014** -0.015*** -0.014***
(0.006) (0.006) (0.005)
3 year -0.017* -0.024*** -0.024***
(0.009) (0.007) (0.005)
Sales Growth 1 year -0.027*** -0.022*** -0.014**
(0.009) (0.006) (0.006)
3 year -0.023** -0.021*** -0.020**
(0.010) (0.007) (0.009)
Employment Growth 1 year -0.021** -0.018** -0.023***
(0.009) (0.008) (0.008)
3 year -0.029*** -0.012* -0.021**
(0.010) (0.007) (0.009)
Total Factor Productivity 1 year -0.014* -0.014** -0.016***
(0.008) (0.007) (0.008)
3 year -0.016** -0.015** -0.018**
(0.008) (0.007) (0.009)
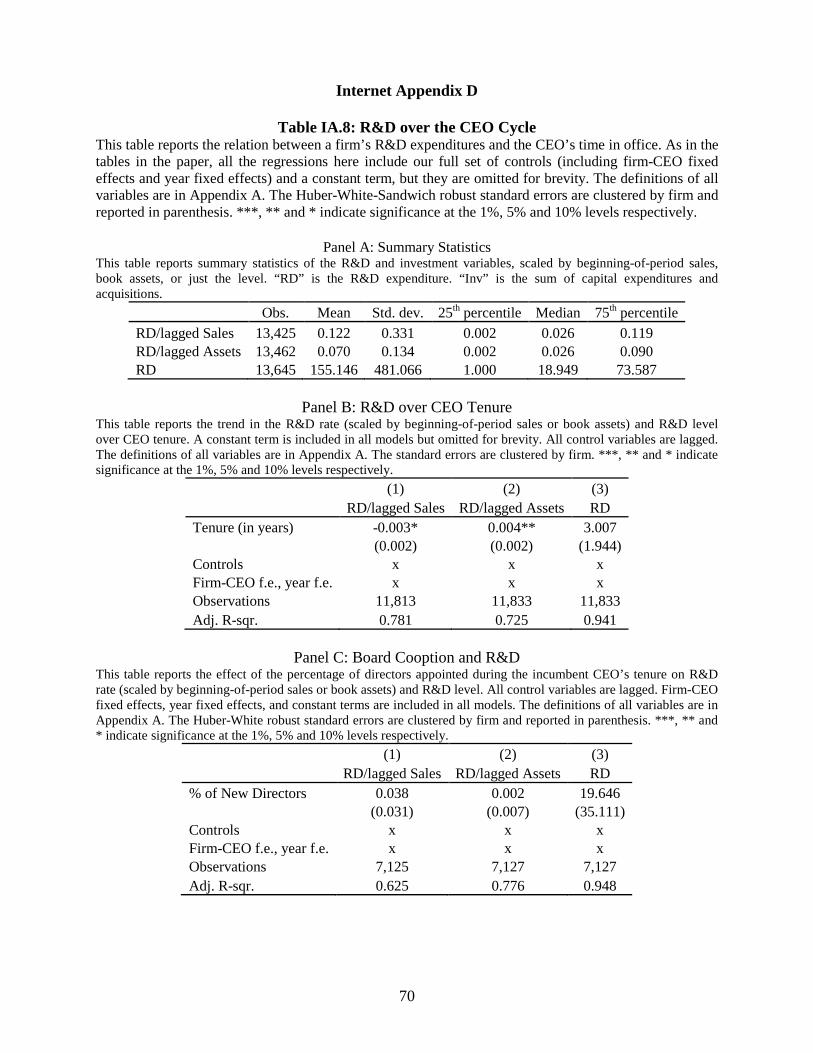
70
Internet Appendix D
Table IA.8: R&D over the CEO Cycle This table reports the relation between a firm’s R&D expenditures and the CEO’s time in office. As in the tables in the paper, all the regressions here include our full set of controls (including firm-CEO fixed effects and year fixed effects) and a constant term, but they are omitted for brevity. The definitions of all variables are in Appendix A. The Huber-White-Sandwich robust standard errors are clustered by firm and reported in parenthesis. ***, ** and * indicate significance at the 1%, 5% and 10% levels respectively.
Panel A: Summary Statistics This table reports summary statistics of the R&D and investment variables, scaled by beginning-of-period sales, book assets, or just the level. “RD” is the R&D expenditure. “Inv” is the sum of capital expenditures and acquisitions.
Obs. Mean Std. dev. 25th percentile Median 75th percentile
RD/lagged Sales 13,425 0.122 0.331 0.002 0.026 0.119 RD/lagged Assets 13,462 0.070 0.134 0.002 0.026 0.090 RD 13,645 155.146 481.066 1.000 18.949 73.587
Panel B: R&D over CEO Tenure
This table reports the trend in the R&D rate (scaled by beginning-of-period sales or book assets) and R&D level over CEO tenure. A constant term is included in all models but omitted for brevity. All control variables are lagged. The definitions of all variables are in Appendix A. The standard errors are clustered by firm. ***, ** and * indicate significance at the 1%, 5% and 10% levels respectively.
(1) (2) (3)
RD/lagged Sales RD/lagged Assets RD
Tenure (in years) -0.003* 0.004** 3.007
(0.002) (0.002) (1.944)
Controls x x x Firm-CEO f.e., year f.e. x x x Observations 11,813 11,833 11,833 Adj. R-sqr. 0.781 0.725 0.941
Panel C: Board Cooption and R&D
This table reports the effect of the percentage of directors appointed during the incumbent CEO’s tenure on R&D rate (scaled by beginning-of-period sales or book assets) and R&D level. All control variables are lagged. Firm-CEO fixed effects, year fixed effects, and constant terms are included in all models. The definitions of all variables are in Appendix A. The Huber-White robust standard errors are clustered by firm and reported in parenthesis. ***, ** and * indicate significance at the 1%, 5% and 10% levels respectively.
(1) (2) (3) RD/lagged Sales RD/lagged Assets RD % of New Directors 0.038 0.002 19.646
(0.031) (0.007) (35.111)
Controls x x x Firm-CEO f.e., year f.e. x x x Observations 7,125 7,127 7,127 Adj. R-sqr. 0.625 0.776 0.948
Related Documents


