CEO Home Bias and Corporate Acquisitions Kiseo Chung, T. Clifton Green, and Breno Schmidt * January 2018 CEOs are significantly more likely to purchase targets near their birth place, reflecting either beneficial informational advantages or inefficient managerial objectives. Evidence from bidder announcement returns supports the latter view. Acquirer returns are significantly lower for CEO home bias acquisitions, and the negative announcement effect is stronger when the target is located further away, among poorly-governed firms, and when the CEO has a deeper birth place connection. Home bias CEOs are more likely to purchase stock following merger announcements, which supports a familiarity bias interpretation over agency concerns. Our findings suggest that CEO home bias influences firm investment. JEL Classification: G14, G34 Keywords: Mergers and Acquisitions, Home Bias * Chung is from Rawls College of Business, Texas Tech University, [email protected]; Green is from the Goizueta Business School, Emory University, [email protected]; and Schmidt is from the University of New South Wales, [email protected]. We thank seminar participants at Georgia Tech, UNSW, Católica Lisbon School of Business & Economics, and the Research in Behavioral Finance Conference at VU Amsterdam for comments.

Welcome message from author
This document is posted to help you gain knowledge. Please leave a comment to let me know what you think about it! Share it to your friends and learn new things together.
Transcript
CEO Home Bias and Corporate Acquisitions
Kiseo Chung, T. Clifton Green, and Breno Schmidt*
January 2018
CEOs are significantly more likely to purchase targets near their birth place, reflecting
either beneficial informational advantages or inefficient managerial objectives. Evidence
from bidder announcement returns supports the latter view. Acquirer returns are
significantly lower for CEO home bias acquisitions, and the negative announcement effect
is stronger when the target is located further away, among poorly-governed firms, and
when the CEO has a deeper birth place connection. Home bias CEOs are more likely to
purchase stock following merger announcements, which supports a familiarity bias
interpretation over agency concerns. Our findings suggest that CEO home bias influences
firm investment.
JEL Classification: G14, G34
Keywords: Mergers and Acquisitions, Home Bias
* Chung is from Rawls College of Business, Texas Tech University, [email protected]; Green is from the
Goizueta Business School, Emory University, [email protected]; and Schmidt is from the University
of New South Wales, [email protected]. We thank seminar participants at Georgia Tech, UNSW,
Católica Lisbon School of Business & Economics, and the Research in Behavioral Finance Conference at
VU Amsterdam for comments.

1
1. Introduction
In 2010, after considering roughly 400 possible targets, Indiana-based
manufacturer of funeral caskets Hillenbrand Inc. announced a plan to acquire K-Tron
International Inc., a Pitman, New Jersey firm which engineers industrial coal crushers and
feeding equipment (including a machine to shoot raisins into breakfast cereal). Despite the
considerable difference in product lines, K-Tron provided Hillenbrand CEO Kenneth
Camp with a unique benefit. Although Camp said the location in Pitman had no influence
on his decision to buy the company, he acknowledged: “When I heard it was in Pitman I
thought people would say I spent all this money to go see my mother.” Camp was raised
in Pitman and his mother Edith still lived nearby in his childhood home.1
In this article, we study the effects of CEO home bias on corporate acquisitions.
We analyze whether CEOs are more likely to acquire companies located near their birth
place, and we explore whether CEO home bias acquisitions are in the best interest of
shareholders. Specifically, we examine whether home bias mergers reflect beneficial
information advantages or are instead driven by inefficient managerial objectives such as
private benefits to the CEO or an underlying bias towards the familiar.
A well-established literature in equity markets finds that investors like to invest
close to home, and evidence is mixed regarding whether local preferences reflect
informational advantages or familiarity bias. Coval and Moskowitz (2001) and Ivkovic and
Weisbenner (2005) find that investors’ local stock holdings outperform, and Kang and
Stulz (1997) find that foreign investors avoid stocks with high information asymmetry. On
1 Details are taken from an article in the Philadelphia Inquirer (Fernandez, 2010). Hillenbrand’s stock price
fell by (CAPM-adjusted) 2.5% in the three-day window around the merger announcement.
2
the other hand, Seasholes and Zhu (2010) and Pool, Stoffman, and Yonker (2012) find no
benefits to local investing, and they observe a greater propensity to invest locally among
less experienced investors, which is more consistent with familiarity bias.2
As with equity investments, a local preference for corporate investment may occur
for beneficial informational reasons. For example, CEOs’ educational or professional
network connections may cluster geographically, which could lead to worthwhile
investment opportunities close to home (e.g., Cohen, Frazzini, and Malloy, 2008; Cai and
Sevilir, 2012). Cultural awareness of a geographic region may also facilitate the process of
merging, which could also lead to more local mergers (Ahern, Daminelli, and Fracassi,
2015).
On the other hand, home bias acquisitions may also be influenced by inefficient
managerial objectives (e.g., Morck, Shleifer, and Vishny, 1990; Harford, Humphery-
Jenner, and Powell, 2012). In particular, local investment may generate private benefits for
the CEO, with home bias acquisitions reflecting the pursuit of CEO pet projects that are
unrelated to value optimization. For example, acquiring and maintaining operations close
to home may raise the CEO’s stature within their home region or facilitate visits to friends
and family.
CEOs may also be susceptible to familiarity bias. Place attachment and place
identity are well-established concepts in environmental psychology (e.g. Manzo, 2003),
and familiarity is viewed as a central cognitive element of place attachment (Scannell and
Gifford, 2010). Familiarity has been linked to confidence in risky gambles (Heath and
2 Other work on equity home bias includes French and Poterba (1991), Tesar and Werner (1995), Huberman
(2001), Coval and Moskowitz (1999), Grinblatt and Keloharju (2001), Bhattacharya and Groznik (2008), and
Parwada (2008).
3
Tversky, 1991), and measures of CEO overconfidence have previously been linked to
corporate investment (e.g. Malmendier and Tate, 2008; Hirshleifer, Low, and Teoh, 2012;
and Ben-David, Graham, and Harvey, 2013). CEOs’ regional upbringing reflects a source
of deep-seated familiarity which may drive CEOs to overestimate the value of their local
connections and investment opportunities.
Our initial tests uncover compelling evidence that CEO home bias influences
corporate acquisitions. We consider two proxies for proximity between an acquirer CEO’s
birth place and the acquisition target based on state boundaries and geographic distance.3
Following an approach similar to Rhodes-Kropf and Robinson (2008), we compare actual
acquirers to hypothetical bidders with similar characteristics. We find that mergers are 27-
29% more likely when the CEO grew up near the target, controlling for bidder, industry,
and state characteristics.
The rest of our analysis seeks to identify the forces that drive CEO home bias
acquisitions. We focus on three potential explanations for CEOs’ proclivity for selecting
targets near their home regions: beneficial informational advantages, managerial objectives
such as status seeking, and a cognitive bias toward the familiar. We conduct a series of
tests to help differentiate between these explanations. As part of our identification strategy,
we distinguish between near and faraway mergers. Our rationale is that we expect the effect
of CEO home bias on target selection to be stronger, through each potential channel, when
the target is distant from the acquirer.
3 We refer to the region of a CEO’s childhood as their “birth” place to denote upbringing and help
differentiate it from their current place of residence. Empirically, our geographic measures emphasize CEO’s
place of residence during their teenage years. Section 2 describes the measures of CEO origin.
4
Our first test considers whether home bias acquisitions reflect beneficial
informational advantages, and we explore this hypothesis by examining bidder merger
announcement returns. We find evidence that the market reacts negatively to acquisition
announcements when the CEO grew up near the target. In particular, after controlling for
firm and deal characteristics, home bias acquisitions are associated with a 40 to 48 basis
point lower bidder announcement return on average, and distant home bias mergers
experience between 1.71 and 1.95 percent lower returns. The findings are robust to
alternative econometric approaches and when considering longer-horizon returns.
Together, they provide evidence against the information advantage hypothesis.
We next explore whether agency or familiarity biases can help explain home bias
acquisitions. In particular, we examine differences in the quality of corporate governance,
and we also consider measures of the strength of connection between CEOs and their home
regions. If CEO home bias acquisitions reflect managerial objectives or personal biases
rather than value maximization, we would expect the practice to be more prevalent among
poorly governed firms. Consistent with the managerial objectives hypothesis, we find a
greater proclivity for home bias mergers when the CEO is also the board chair, the board
is less independent, institutional ownership is low, or the firm has a higher entrenchment
index (Bebchuk, Cohen, and Ferrell, 2009). Moreover, bidder announcement returns for
home bias mergers are also significantly lower among poorly governed firms. The
governance results provide additional evidence in support of the interpretation that home
bias acquisitions reflect either manager preferences or personal biases.
Under the managerial preference and familiarity hypotheses, we anticipate that the
effect of CEO home bias on birth state merger activity will be stronger when the CEO holds
5
a deeper connection to their birth state. Place attachment is generally thought to be the
result of a long-term connection (Altman and Low, 1992) and we conjecture that CEOs
who attended college in their birth state or resided there in early adulthood will hold
stronger attachments. Consistent with both agency and familiarity interpretations, we find
that home bias acquisitions are more likely, and home bias announcement returns are
significantly lower, when the acquirer CEO attended college in the target state or lived
nearby in the region after college.
Taken together, the evidence that markets react negatively to CEOs’ proclivity to
purchase targets near their home region is consistent with a bias for the familiar that leads
to over-optimism regarding the value of the merger. Alternatively, CEOs may understand
that home bias mergers are inefficient, but nevertheless undertake such investments for
personal rather than firm reasons. We distinguish between agency and familiarity
interpretations by examining CEO insider trading around merger announcements. In
particular, if familiarity leads CEOs to overestimate the synergies arising from home bias
mergers, they would be more likely to purchase shares in their company following the
merger. On the other hand, if CEOs engage in suboptimal home bias mergers for the private
benefits they afford, they would be less likely to purchase shares following the merger.
We observe significant differences in the trading behavior of home bias CEOs and
other firm executives following merger announcements. In particular, acquirer CEOs are
roughly 20% more likely to purchase stock if they grew up near the target, whereas other
top executives are between 5% and 15% less likely to purchase the stock for CEO home
bias acquisitions. We find no differences in trading activity among insiders around a
placebo date chosen two years prior to the announcement, which suggests the behavior is
6
related to the home bias merger, rather than specific to the firm or CEO.4 The evidence that
CEOs purchase company stock following home bias merger announcements is inconsistent
with rent extraction through pet projects. Instead, it supports the view that CEO home bias
mergers reflect familiarity-based optimism.
Our evidence of a familiarity-driven birth state home bias is consistent with Pool,
Stoffman, and Yonker (2012), who find mutual fund managers are more likely to invest in
companies with headquarters in their birth state with no evidence of outperformance. Our
results are also in line with Cornaggia, Cornaggia, and Israelsen (2017), who find credit
analysts rate municipal bonds issued in their birth states more favorably. Our setting is
most closely related to Yonker (2016b), who finds that home state CEOs are significantly
less likely to lay off employees than their non-local peers following industry distress.5
The remainder of the paper proceeds as follows. In Section 2 we describe the
sample and construction of the home bias variables. Section 3 examines the effects of CEO
birth state on his or her propensity to make an acquisition. Section 4 explores the market
response to and underlying drivers of home bias acquisitions. Section 5 describes a series
of robustness checks and additional analysis.
2. Data and Variable Construction
This section describes the acquisition sample and provides details for the
construction of the CEO home bias related variables.
4 While trades by insiders are well known to be informative on average (e.g. Seyhun, 1986; Cohen, Malloy,
and Pomorski, 2012; Alldredge and Cicero, 2015), we find no evidence that CEO purchases following home
bias acquisitions are associated with outperformance 6 to 24 months after the announcement. 5 We recognize Jian, Qian, and Yonker (2016) as independent contemporaneous work that also documents a
home bias in corporate acquisitions. Their findings generally support our own results, although they find
evidence of home advantage for a subset of public target mergers.
7
2.1 Acquisition Sample
The merger data are obtained from Securities Data Company (SDC). After
collecting all mergers from 1990 to 2014, we impose data requirements which are similar
to those in Masulis, Wang, and Xie (2007). Acquirers must be publicly traded companies
with stock return data available in the Center for Research in Security Prices (CRSP). We
exclude deals with values lower than $1 million or representing less than 1% of the
acquirer’s market value, as measured at the fiscal year end before the announcement. We
also gather state and zip code information for the firm headquarters of both the acquirer
and target.
The bidder firm CEO data are obtained from both BoardEx and ExecuComp.
Boardex data contains detailed profiles of US executives and board members, covering
virtually all US public companies. ExecuComp data contains detailed information on
executive compensation data for past and current S&P 1500 firms. We also collect
compensation data from BoardEx for firms not covered by ExecuComp. Using the
Boardex/EcecuComp data, we are able to identify the bidder firm CEO for 15,526 of the
mergers of public/private targets reported in SDC data during the sample period.6
2.2 Measuring CEO Home Bias
In order to identify each CEO’s birth state, we collect information on his or her full
name, age, and firm name from both BoardEx and ExecuComp. Using the CEO’s name
6 We require CEO information to be available at the date of the announcement (dates of employment are
occasionally missing early in the sample period). We exclude leverage buyouts, spin-off/split-offs,
recapitalizations, self-tender offers and exchange offers, repurchases, acquisition of minority stakes or
remaining interest, and privatizations, reverse takeovers, and bankruptcies. See Cohen, Frazzini and Malloy
(2008), Ferreira and Matos (2012), Cohen, Frazzini, and Malloy (2012), and Schmidt (2015) for more
detailed descriptions of the database.
8
and age for each acquisition in our sample, we collect data on each CEO’s birth state and
previous addresses from the Lexis Nexis Online Public Records Database following the
methodology of Pool, Stoffman, and Yonker (2012). Specifically, we search by CEO name
and age, and we also use other information such as employment history and email addresses
to pinpoint the correct person. In order to further guarantee each CEO’s identity, we also
require that the firm employing the CEO when the deal was announced corresponds to one
of the employers listed in the CEO’s Lexis Nexis personal file.
For the CEOs for whom we could identify a unique Lexis Nexis ID, we use the first
five digits of their social security number to identify their home state.7 Alternately, for
CEOs for whom a unique Lexis Nexis ID could not be identified, we use firm name, CEO
name, and age to search Google for their home state. In order to be included in our sample,
information on the birth state of the acquirer firm CEO must be available. We were able to
collect CEO public records data for 12,221 mergers, which represents 79% of the number
of mergers and 94% of total deal value for the mapped set of SDC and
Boardex/ExecuComp mergers.
We match the SDC and CEO birth state merged dataset with data from CRSP and
Compustat, from which all financial and accounting variables are obtained. Our merger
sample consists of 9,891 acquisitions after applying the initial data requirements. In cases
where the zip code is missing for either the acquirer or target firm in SDC database, we use
7 Currently, US citizens typically obtain social security numbers (SSNs) near birth. For CEOs during the
sample period, they were more likely to obtain SSNs prior to their first jobs or when obtaining a driver’s
license. Yonker (2015a) indicates that a majority of the CEOs in a similarly-constructed sample received
their SSN when they were between the ages of 14 and 17. Therefore, “birth” state is more accurately described
as home state during the mid-teenage years.
9
the headquarters zip code variable in Compustat when available. Our resulting distance
merger sample consists of 9,494 mergers.
We consider two measures of CEO birthplace proximity. Our first measure is based
on state boundaries. We define the dummy variable Home Bias State as equal to one when
the acquirer firm CEO birth state is equal to target headquarters state. We then partition the
merger sample into in-state and cross-state mergers by defining the dummy variable
Faraway State, which is one if the acquirer and target headquarters states differ. We use
headquarters’ state rather than state of incorporation as the latter is often chosen for
regulatory rather than operational reasons.
Our second measure of CEO home proximity is based on the geographic distance
between the target firm headquarters and the CEO’s hometown. We obtain information on
the CEO’s birth town by searching the public records data from Lexis Nexis. We identify
the oldest available address that matches the birth state implied by the Social Security
Number as the CEO’s birthplace. If no address is available that matches the SSN-implied
state, we use the zip code of the largest city in the state as a proxy for hometown.8
Based on the CEO’s hometown, we then use the latitude/longitude of the zip codes
in the census files to determine the distances between the target firm headquarters and
acquirer CEO hometown.9 We set Home Bias Distance equal to one if the distance between
the target headquarters and the acquirer firm CEO’s hometown is less than 100 miles, and
zero otherwise. Analogous to cross-state mergers but capturing geographic distance rather
8 The results are very similar if we use the state capital instead of the largest city for the observations with
state, name, and employer matches but no listed addresses. 9 Census zip code LAT/LONG data is posted here: www2.census.gov/geo/tiger/TIGER2010/ZCTA5/2010/.
10
than state borders, the dummy variable Faraway Distance that we create is equal to one if the
target firm headquarters is located more than 100 miles from the acquirer firm headquarters.
2.3 Sample Summary Statistics
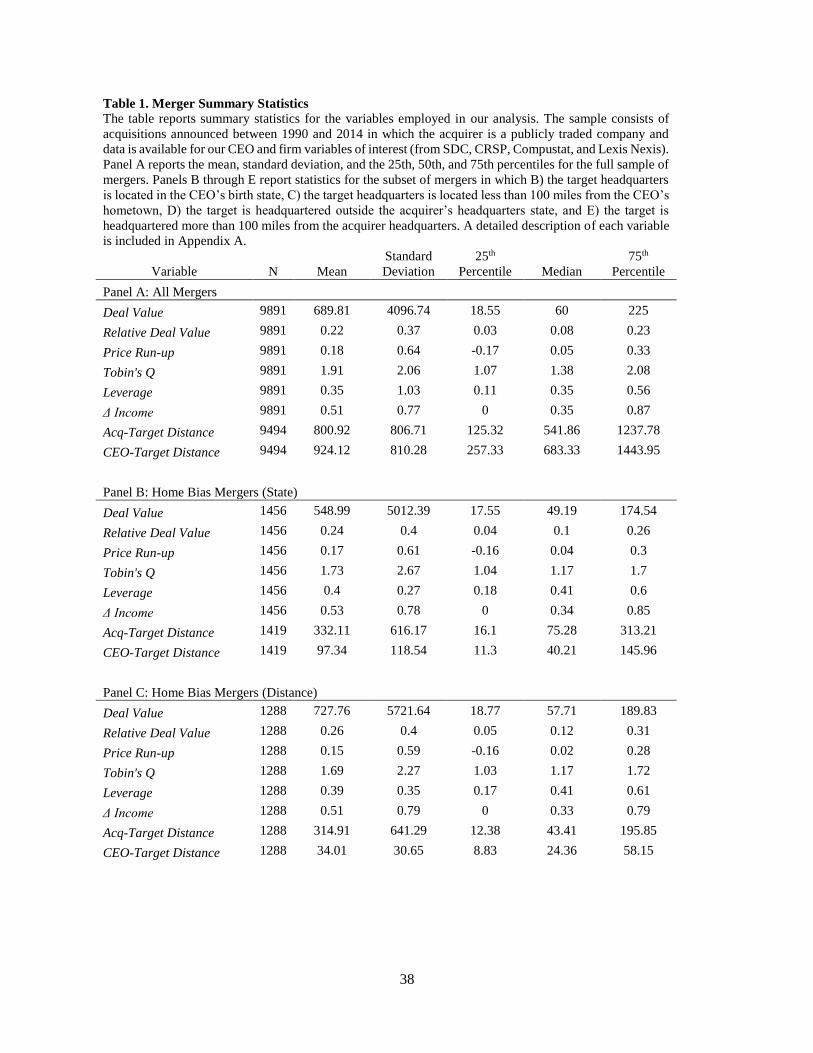
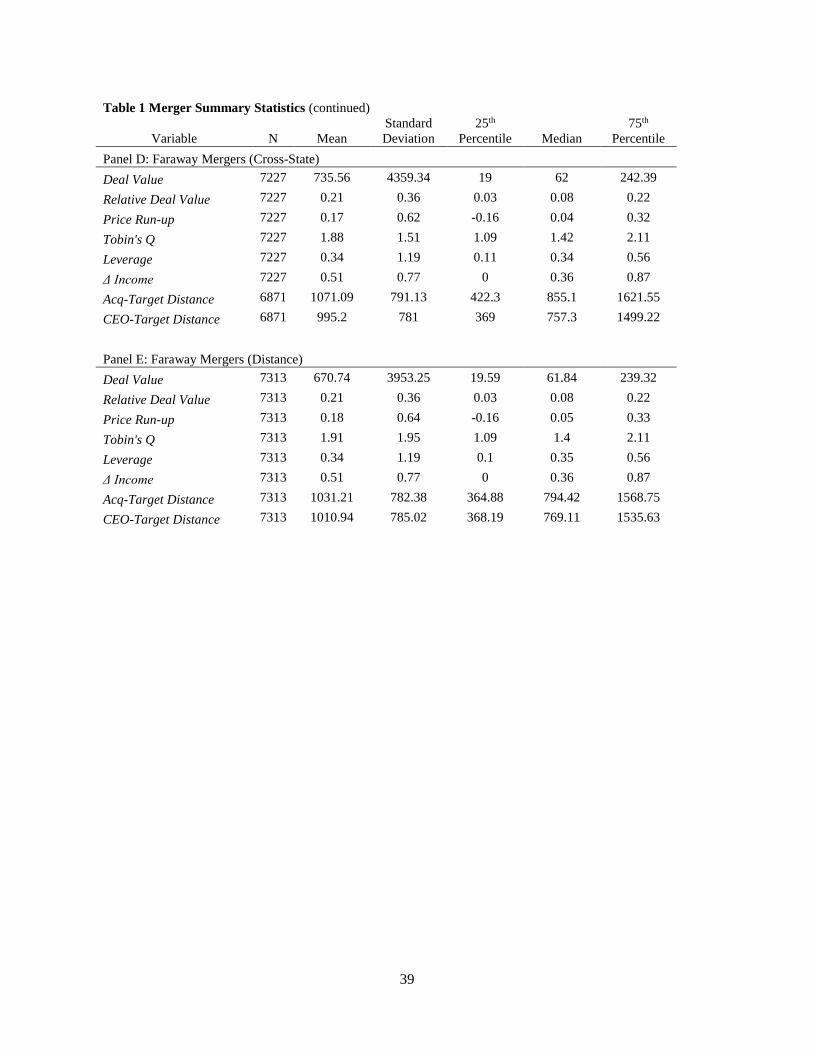
Table 1 presents summary characteristics for the merger sample. The main
takeaway from the table is that deal size and firm characteristics are generally similar for
CEO home bias mergers and the full sample. Cross-state and faraway mergers also do not
differ materially from other types of mergers. Although there is overlap in our measures of
CEO home bias, the state and distance home bias measures do capture different samples.
For example, among the CEO birth state home bias mergers, the CEO grew up more than
100 miles from the target 34% of the time. Also, in 26% of the mergers in which the CEO
grew up within 100 miles of the target, they resided in a nearby state rather than in the
target state. The differences are greater among distant home bias mergers. Specifically,
only 64% of Faraway Home Bias State mergers are also Faraway Home Bias Distance mergers,
and 50% of Faraway Home Bias Distance mergers qualify as Faraway Home Bias State
mergers.10
3. CEO Home Bias and the Choice of Acquisition Targets
We begin by exploring the relation between the geographic location of CEO
upbringing and the location of corporate acquisitions. In particular, we examine whether
acquirer firm CEOs show a greater tendency to acquire targets from the same geographic
region as their birth place. Our approach is similar to Rhodes-Kropf and Robinson (2008),
10 The smaller number of observations for distance- vs. state-based mergers in Panel A (9494 vs 9891) is due
to state information on the target being available more often than zip code information (which we use to
determine distance).
11
and it involves comparing the likelihood of home bias mergers among the population of
actual mergers to a hypothetical sample of control mergers matched on firm characteristics.
For each acquisition, we select hypothetical acquirers from the set of CRSP-
Compustat firms that did not participate in a merger in a three-year window around the
announcement date of the actual merger. We only consider hypothetical acquirers that are
headquartered in the same state as the actual acquirer. This helps ensure that the distribution
of headquarter-states is the same for both actual and hypothetical targets. Additionally,
hypothetical acquirers are required to operate in the same industry as the actual acquirer,
based on the Fama-French 48 industry classification. We further narrow the set of
hypothetical acquirers by selecting those in the same market capitalization and book-to-
market ratio quintiles of the actual acquired firm.
Using this approach, we obtain a sample of 9,891 (9,494) actual acquisitions based
on state (distance), with an average of 43 (44) hypothetical candidates for each merger. For
our main analysis, we select a hypothetical acquirer firm that has the closest size and book
to market ratio to the actual acquirer.11 We then estimate the following probit regression
on the actual and hypothetical merger sample:
𝑃𝑟(𝑀 ∧ 𝐴 = 1| ∙) ∝ 𝑒𝑥𝑝(𝛼 + 𝛽1𝐻𝐵 + 𝛽2𝐹𝑎𝑟 + 𝛽1𝐻𝐵 × 𝐹𝑎𝑟 + 𝐼𝑛𝑑 + 𝑌𝑟 + 𝑆𝑡), (1)
where M&A is set equal to 1 for the actual mergers, HB is either Home Bias State or Home
Bias Distance, and Far is either Faraway State or Faraway Distance. By construction, the
unconditional likelihood of a home bias merger in the sample is 0.5.
11 In Section 5.1, we also consider simulations in which we randomly select one hypothetical candidate from
the size and book quintiles.
12
One potential concern with our approach is that CEO birth and firm locations are
not randomly distributed across states. In particular, the top 5 states in terms of population
represent 38% of total acquirer headquarter states, 38% of total target headquarter states,
and 31% of total CEO birth states (tabulated in Table IA.1 in the Internet Appendix). As a
result, state-specific shocks that affect the propensity or value of acquisitions, such as
industry merger waves, could produce spurious home-bias effects. We mitigate this omitted
variable problem by ensuring that the distribution of paired acquirer and target states is the
same for the actual and hypothetical acquisitions, as described above. Moreover, in
addition to year (Yr) and industry (Ind) fixed effects, we also consider state fixed effects
(St) for acquirers from the top five most populous states (California, Texas, New York,
Florida, and Illinois).
As in Rhodes-Kropf and Robinson (2008), our methodological approach does not
measure the probability that a given company will choose to engage in an acquisition.
Instead, the regressions estimate the likelihood that an actual acquirer-target pair will be
selected instead of its hypothetical counterpart. In principle, this matching strategy allows
us to identify the determining characteristics of acquirers without modeling the decision to
acquire.
Table 2 reports the results from the probit regressions. The evidence indicates that
home bias mergers happen significantly more often than in the control group. In particular,
actual mergers are 29.3% more likely to be selected when the CEO grew up in the target
state and 26.5% more likely when the CEO grew up less than 100 miles from the target.
The coefficient on Faraway is significantly negative in all specifications, consistent with
close mergers being more likely than expected due to their industry, size, and book-to-
13
market alone. Our emphasis is on whether CEO upbringing serves to narrow the distance
between the acquirer and faraway targets, and we examine this relation by interacting
faraway and home bias measures in Specifications 3 and 6. We observe positive and
significant coefficients for the interaction terms, which indicates that the home bias effect
is stronger for faraway acquisitions. The findings are similar in magnitude when including
Top Five state fixed effects in Specifications 4 and 8. The evidence in Table 2 suggests
that CEO home bias mergers, and especially distant home bias mergers, occur more often
than expected by chance.
4. Drivers of CEO Home Bias Mergers: Information, Agency, or Familiarity
We consider three potential explanations for CEO’s proclivity for selecting targets
near their home region: beneficial informational advantages, managerial objectives such as
status seeking, and a cognitive bias toward the familiar. Table 3 outlines a series of tests
that we conduct to help differentiate between information, private benefits, and familiarity-
based explanations. The table presents a brief test description, the directional hypotheses,
and also the section headings for each test conducted below. We begin by examining bidder
announcement returns.
4.1 The Informational Advantages Hypothesis: Merger Announcement Return Evidence
The tendency for CEOs to invest in the region of their upbringing could be the result
of comparative advantages. For example, CEOs’ informational networks may cluster
geographically, which could lead to worthwhile investments (e.g. Cohen, Frazzini, and
Malloy, 2008; Cai and Sevilir, 2012). Cultural awareness of a geographic region may also
improve assimilation, which could also lead to more local mergers (Ahern, Daminelli, and
14
Fracassi, 2015). In this section, we examine bidder announcement returns to explore
whether home bias acquisitions reflect informational advantages.
We measure bidder announcement effects using market-model adjusted stock
returns around merger announcements as in Moeller, Schlingemann, and Stulz (2004),
Masulis, Wang, and Xie (2007), and Schmidt (2015). Market-model estimates are obtained
using the daily CRSP value-weighted index as the proxy for market returns. The estimation
period is from 230 days to 11 days before the announcement date, which is obtained from
SDC. We regress cumulative abnormal merger announcement returns on the CEO home
bias measures as follows:
𝐶𝐴𝑅𝑖 = 𝛼 + 𝛽1𝐻𝐵𝑖 + 𝛽2𝐹𝑎𝑟𝑖 + 𝛽1𝐻𝐵𝑖 × 𝐹𝑎𝑟𝑖 + 𝐶𝑜𝑛𝑡𝑟𝑜𝑙𝑠𝑖 + 𝐼𝑛𝑑 + 𝑌𝑟 + 𝑆𝑡, (2)
where CARi is the three-day cumulative abnormal return around the announcement date for
merger i, HB is either Home Bias State or Home Bias Distance, and Far is either Faraway State or
Faraway Distance. Each specification includes fixed effects for year and industry (Fama and
French 48 industries), and standard errors are clustered by both year and industry. We
control for extreme return outliers by winsorizing CARs at the 1st and 99th percentiles each
year.
We follow Schmidt (2015) in selecting control variables. We include Log Total
Assets to capture acquirer size, which has been shown to negatively affect bidder
performance (e.g. Moeller, Schlingemann, and Stulz, 2004). Tobin's Q also has a
documented negative effect on announcement returns (e.g., Lang, Stulz, and Walkling,
1991). We follow Masulis, Wang, and Xie (2007) and Gillan, Hartzell, and Starks (2011)
and use Industry Tobin’s Q rather than firm-level Tobin’s Q due to endogeneity concerns.
We also include Industry Leverage for similar reasons.
15
Shleifer and Vishny (1989) suggest that managers may enter new lines of business
when threatened by poor performance, a view supported by the evidence in Morck, Shleifer,
and Vishny (1990). We follow Morck, Shleifer, and Vishny (1990) and use the change in
operating income during the prior three years as a measure of performance (Δ Income). To
account for past performance of the bidder, we include Price Run-up, which is the bidder's
buy and hold abnormal return from 230 to 11 days before the announcement as in Masulis,
Wang, and Xie (2007).
Acquirer announcement returns have been shown to be related to the method of
payment and the type of target (e.g., Chang, 1998, Moeller, Schlingemann, and Stulz, 2004;
and Officer, Poulsen, and Stegemoller, 2009). To account for this variation, we include
controls for the type of target (a Public dummy variable) and the medium of payment (Cash
Deal and Stock Deal dummy variables). We also include Relative Deal Size to control for
the size of the deal. Appendix A provides more details regarding the construction of the
independent variables.
Table 4 reports the results from the bidder CAR regressions, with Panel A (B)
presenting the results for the state-based (distance-based) home bias measures. The first
specification in each panel includes the home bias indicator variable along with the set of
control variables. The coefficient on Home Bias is negative and statistically different from
zero for both measures. Specifically, when bidder firms announce the acquisition of a target
that is headquartered in the state where the CEO grew up, the market response is 0.40%
lower. The evidence from Panel B is similar. If the CEO grew up within 100 miles of the
target, the market response is 0.48% lower.
16
Including the interaction term between home bias and faraway mergers in
Specification 3 reveals that the negative announcement response to CEO home bias
acquisitions is stronger for more distant mergers. In particular, a cross-state merger in
which the bidder CEO grew up in the target state results in significantly lower
announcement returns, with an estimated coefficient of -1.71%. Similarly, announcing the
acquisition of a target greater than 100 miles away that is within 100 miles of the CEOs
birthplace also results in lower returns (-1.95%). The results are very similar after including
the fixed effects for Top Five states in terms of population.12
Another important finding that emerges from Table 4 is that the negative response
to distant mergers, -0.59% (-0.69%) on average for faraway mergers based on state
(distance), is concentrated among CEO home bias mergers. For the subset of faraway
mergers that do not exhibit CEO home bias, the announcement returns are considerably
less negative, at -0.34% for both cross-state and distant mergers. Moreover, the negative
response to non-home bias faraway mergers is no longer significant after the inclusion of
Top Five state fixed effects. Taken together, the evidence of a negative market reaction to
CEO home bias mergers in Table 4 does not support the view that these mergers reflect
valuable information obtained through the CEO’s network.
4.2 Home Bias Acquisitions: Corporate Agency and Familiarity Hypotheses
The negative market response to CEO home bias mergers is inconsistent with CEOs’
possessing important informational advantages when selecting targets in their home region.
If home bias acquisitions reflect managerial objectives or personal biases rather than value
12 In Table IA.2 in the internet appendix, we repeat Table 3 using four- and six-day event windows and find
similar evidence. We also find similar evidence using excess returns rather than market model returns.
17
maximization, we would expect the practice to be more prevalent among poorly governed
firms and when CEOs have a stronger connection to their home region.
4.2.1 Strength of Connection Evidence
If the effect of CEO birth region on merger activity reflects manager preferences or
a bias towards the familiar, we conjecture that it will be stronger when the CEO has a
deeper connection to their home region. We explore this hypothesis using measures of
strength of connection based on CEOs’ educational backgrounds and residence histories.
First, we gather information on CEOs’ educational backgrounds provided by Boardex, and
we find the location of each institution of higher education using data from the U.S.
Department of Education.13 We define a strong education connection if the acquirer firm
CEO attended an institution of higher education within their home state for the state-based
home bias measure, and if the college was within 100 miles of their hometown for the
distance-based home bias measure.
Our second strength of connection measure is based on each CEO’s residence
history. The Lexis Nexis database provides address histories for each person beginning in
their early- to mid-twenties. In our sample, roughly 65% of each CEO’s past address
history became available between the ages of 18 and 25. We conjecture that CEOs who
continued to live in their home state or hometown for ten or more years in adulthood will
hold stronger connections to their home region. We define state- and distance-based
dummy variables accordingly.
13 http://ope.ed.gov/accreditation/GetDownLoadFile.aspx.
18
The propensity results using proxies for a CEO’s strength of connection to his or
her birth region are presented in Table 5. For both of the strength of connection proxies,
we find a significantly greater propensity for home bias mergers for CEOs with strong
home region connections. For example, the interaction term between home bias and strong
connection indicates a 21.8% higher probability of acquiring a target firm located in their
birth state for CEOs who also attended a college in their home state. The evidence is similar
for the residency strength of connection measure, with home bias mergers being 10.96%
more likely when the CEO maintained residency during adulthood for ten or more years in
the region of the target.
In Table 6, we repeat the bidder return analysis in Table 4 after including the
strength of connection interaction terms. As expected, CEO home bias mergers in which
the CEO has more than ten years of residency in adulthood in the target state (100-mile
region) exhibit 3-day bidder CARs of -2.23% (-1.59%), and the estimate is significantly
different from zero at the 5 (1) percent level. We find similar negative response patterns
when we measure strength of connection using CEOs’ educational backgrounds. As can be
seen from the second and fourth specifications, home bias mergers engaged in by CEOs
who attended an institution of higher education located in their birth state show negative
3-day CARs that vary from -1.09 to -0.68%.14 The evidence that home bias mergers are
more prevalent and greeted less warmly by the market when the CEO has a deeper
14 A potential complication arises when we consider foreign-born CEOs who may not exhibit the same degree
of connection to their U.S. home state. Yonker (2016a) classifies CEOs who obtain SSNs after age 21 as
“foreign.” Using this approach, we classify 293 CEOs as foreign, representing roughly 8% of the CEO
population. We might expect foreign CEOs to exhibit a less strong connection with their U.S. home state,
particularly when the connection is not established until adulthood. Consistent with this view, in untabulated
analysis we find evidence of insignificant negative three-day announcement returns when foreign CEOs
engage in home bias mergers.
19
connection to his or her home region is consistent with home bias mergers reflecting
manager preferences or a bias towards the familiar.
4.2.2 Corporate Governance Evidence
Masulis, Wang, and Xie (2007) find that entrenched managers are less susceptible
to market discipline and may therefore be more likely to engage in value-destroying
acquisitions. In this subsection, we examine whether CEOs of poorly governed firms are
more likely to engage in home bias mergers, and we analyze whether these mergers are
more poorly received by the market on announcement.
We consider several proxies to identify poorly governed firms. Our first governance
measure is the entrenchment index (E-index) of Bebchuk, Cohen, and Ferrell (2009), which
is based on shareholder voting provisions and takeover defenses, such staggered boards
and poison pills. We next consider a dummy variable for when the CEO is also the board
chair, as past literature has found evidence that CEO/chairman duality is associated with
higher CEO compensation (Core, Holthausen, and Larcker, 1999), lower sensitivity of
CEO turnover to firm performance (Goyal and Park, 2002), and a greater likelihood of
participating in merger waves (Duchin and Schmidt, 2013).
Our next corporate governance measure is related to board independence. Byrd and
Hickman (1992) find evidence that independent boards are associated with higher quality
mergers, and following Weisbach (1988) we construct a dummy variable to capture firms
in which independent directors comprise a minority on the board. Finally, we also consider
ownership by independent long-term institutions. Chen, Harford, and Li (2007) find that
greater institutional ownership is associated with stronger post-merger performance, which
they attribute to the active external monitoring role of independent investors. For the
20
holdings-based and E-index governance measures, we use the median level to divide the
acquisition sample into well- and poorly-governed groups.
Table 7 repeats the probit analysis from Table 2 after including the series of
corporate governance measures, with Panel A (B) providing results for the state-based
(distance-based) home bias variables. In particular, we add interaction terms between the
Home Bias variables with dummy variables that are equal to one if the acquiring firm falls
into the low governance category for each of the corporate governance variables (zero
otherwise). Our objective is to analyze the incremental effect of low governance on the
probability of acquisition.
The home bias coefficients in Table 7 are considerably larger among low
governance firms, consistent with a greater propensity that a target will be selected from
near the acquirer CEO’s birthplace if the acquiring firm is poorly governed. For example,
firms with a high E-Index show a 15.06% higher probability of acquisition if the target
firm is located in the same region as the CEO birth region. We also find significant
interaction terms for CEO is Chair, Low Board Independence, and Low Institutional
Ownership, for both state and distance-based home bias measures.15
In Table 8, we test our hypothesis that home bias mergers are more likely to be
perceived negatively by the market when conducted by poorly governed firms. The table
provides bidder return results, as in Table 4, interacted with the set of poor governance
measures. Consistent with home bias mergers being influenced by manager preferences,
we find negative and significant coefficients for Poor Governance home bias mergers. The
15 Consistent with Duchin and Schmidt (2013), we also observe a greater likelihood of mergers in general
among poorly governed firms, suggesting poorly governed firms are more likely to participate in mergers.
21
economic magnitude varies from -0.80% to -1.56% depending on which governance
variable we use and whether home region proximity is measured using state or distance,
but we find strong and consistent evidence that the reaction to home bias mergers
conducted by poorly governed firms is more negative than those conducted by well
governed firms. The evidence that the negative market effect of home bias mergers is
stronger among poorly governed firms helps confirm the evidence that investment
decisions of home bias CEOs are affected by reasons other than information advantages.
If home bias mergers are driven by agency considerations alone, with CEOs fully
recognizing that home region targets are unlikely to create value, then we might expect
fewer home bias mergers and more favorable market responses when the CEO’s incentives
are more closely aligned with investors. We explore this conjecture using the low CEO
ownership stake measure of Jensen and Meckling (1976), with low CEO ownership
indicating less alignment with investors and a greater risk of agency-motivated mergers.
We create a dummy variable for whether the CEO’s ownership is below the median level
in the sample, and we interact Low CEO Ownership with home bias as with the governance
measures above.
The CEO ownership results are reported in the last column of Tables 7 and 8. We
observe no evidence of a significant relation between Home Bias and Low CEO Ownership
for either the likelihood or market response analysis, which suggests agency may not be
the primary driver of home bias mergers. In the next subsection, we explore CEO
ownership more thoroughly by examining insider trading around CEO home bias mergers.
4.3 Discriminating Between Agency and Familiarity: Insider Trading Evidence
22
Our findings suggest that markets react negatively to CEOs’ proclivity toward
home bias mergers, especially for distant targets. The evidence is consistent with a bias for
the familiar that leads to over-optimism regarding the value of the merger. On the other
hand, it is possible that CEOs understand that these mergers are inefficient, and yet engage
in them as a type of rent seeking behavior. The evidence that markets react more negatively
to home bias mergers when the firm is poorly governed, as well as when the CEO has a
stronger connection to their birth state, is consistent with both interpretations.
In order to test whether home bias mergers are more consistent with familiarity bias
or a pet project motivation, we examine insider trading by CEOs. If CEOs understand that
home bias mergers are inefficient but engage in them for private benefits, we would expect
a smaller investment in their company stock following the merger announcement compared
to non-home bias mergers. However, if familiarity leads CEOs to be unduly optimistic
about the prospects of the merger, we would be more likely to observe home bias CEOs
buying company stock. We also examine board members and other executives’ trading
behavior as a benchmark which can be compared with the behavior of CEOs.
For each acquisition, we consider a transaction window that begins two days after
the announcement date and ends 60 days after the announcement or the effective date,
whichever comes first. We then compute the market value of shares traded by the CEO,
Top Executives, and Board members during each day in the transaction window.16 If each
group has a positive (negative) average value of shares traded over the transaction period,
16 We take the cross-sectional mean of the group for each date and sum over the window to define whether
the group made a purchase. We find similar results using an alternative approach in which we look at the
largest trade executed during the transaction window and assign a purchase or sell for each group based on
that largest trade. Results are also similar when excluding insiders from the board member group.
23
we classify them to have purchased (sold) shares. Finally, we create three dummy variables
to describe each group’s average trading behavior. We define two additional dummy
variables to identify cases in which the CEO purchases shares on average but other top
executives do not buy (CEO Buys, Top Execs do not Buy), and the case in which the CEO
bought shares but other directors did not (CEO Buys, Directors do not Buy).
We estimate probit regressions that measure the propensities for the acquirer CEO
and other corporate insiders to purchase stock following CEO home bias mergers. The
results are reported in Table 9. Consistent with the familiarity bias hypothesis, in Panels A
and B we find CEOs of home bias mergers are significantly more likely to purchase
company stock following the deal announcement for both close and faraway home bias
acquisition. On the other hand, we observe the opposite purchasing pattern for directors
and other executives. The table shows directors and other executives are more likely to sell
following home bias acquisition announcements.
In Specifications 4 and 5, we examine mergers in which CEOs appear to be alone
in their optimism. Specifically, we consider mergers where CEOs purchase shares after the
announcement, but directors and other executives do not purchase shares. The evidence
indicates that optimism exhibited by the CEO alone is much more likely to occur for home
bias mergers than non-home bias mergers. For example, for close mergers, the probability
of home bias CEOs purchasing and other executives not purchasing is 23.91% greater when
compared to non-home bias cases.
The evidence that CEOs are more likely to purchase shares following home bias
mergers, without similar evidence among other firm insiders, is consistent with CEOs
being overly optimistic about the success of targets headquartered near their home regions.
24
CEO optimism is consistent with home bias mergers reflecting a bias toward the familiar
rather than private benefits and agency considerations.
5. Robustness and Additional Analysis
In this section, we provide a series of robustness checks which consider alternative
approaches for measuring the likelihood of CEO home bias acquisitions and their
announcement effects. We also present evidence for the subset of mergers with public
targets, and we analyze measures of overconfidence to help rule out general overconfidence
among home bias CEOs.
5.1 Simulation Evidence
The probit analysis in Table 2, which examines the propensity of CEOs to engage
in home bias mergers, compares actual mergers to hypothetical mergers with potential
bidders matched on industry, state headquarters, and the closest match on size and book to
market. Although we include year and industry fixed effects as well as a fixed effect for
whether the bidder resides in a Top Five population state, concerns may remain that our
findings are sensitive to the specific hypothetical merger chosen. As a robustness check,
we choose one firm randomly from the set of hypothetical bidders matched on industry,
and size and book-to-market quintiles (rather than the single closest size and book-to-
market match as in Table 2). We then estimate the probit model in Equation (1), draw again
randomly, and repeat the process 1000 times.
The likelihood simulation results are presented in Table 10, with state-based
measures of home bias in Specifications 1-4 and distance-based measures in Specifications
5-8. Consistent with the evidence in Table 2, we find significant evidence of CEO home
bias in target selection. For example, in Specifications 1 and 5, the average home bias
25
coefficients are statistically significant and positive for all 1,000 simulations, suggesting
that actual home bias mergers occur more often than expected.
We also consider a simulation approach for estimating the market reaction to home
bias mergers. In particular, for each home bias merger, we randomly select a matching non-
home bias merger in which the bidder resides in the same state (for state-based proximity)
or the same 100-mile region (distance-based proximity). This drops the sample size
considerably, as the simulated samples are comprised of half home bias mergers and half
non-home bias mergers. We then estimate the regressions in as in Table 4 with the full set
of controls, draw again randomly, and repeat this process 1000 times.
The regression simulation results are reported in Table IA.3 in the Internet
Appendix. The home bias coefficients in Specification (1), -0.53% for state measures and
-0.56% for distance measures, are larger than the analogous coefficients in Table 4, but
they are weaker statistically, with 41% (55% for Home Bias Distance) of the regressions
leading to significant coefficients (none of the estimates were negatively significant). The
announcement effect for faraway home bias mergers is very similar to the evidence in Table
4, with announcement returns of -1.77% for state-measures and -1.72% for distance
measures, and the estimates are significant in no fewer than 93% of the simulation
regressions.
5.2 Calendar Time Announcement Returns
A potential concern regarding the interpretation of the announcement response
coefficients in Table 4 (and Tables 6 and 8) is that our approach relies on bidder
announcement returns, whereas it is possible that the market initially incorrectly assesses
the relative merits of home bias mergers. In Table 11, we estimate the longer-term effects

26
of CEO home bias on the value of the firm using a calendar time approach which is less
susceptible to econometric issues (Barber and Lyon, 1997). The calendar time strategy
involves buying each home bias merger beginning three days after the announcement and
holding for 6, 12, and 24 months. For non-home bias mergers, we sell the acquirer and buy
the risk-free asset and hold for 6, 12, and 24 months. We use the Fama-French 3-factor
model, Fama-French-Carhart 4-factor model, and CAPM to risk-adjust returns, and report
the monthly alpha for the set of home bias mergers.
The evidence in Table 11 does not support the view that the initial negative reaction
to home bias deals reflects misreaction. Abnormal returns of buying home bias mergers
and selling non-home bias mergers are negative on average and statistically significant for
up to 12 months. In particular, the long-short strategy yields roughly 30bps per month for
the 12 months following the deal announcement, depending on the proxy for home bias.
We find a similar pattern when we restrict our focus to faraway mergers and when
measuring abnormal performance using CAPM or the Fama-French-Carhart 4-factor
model.
5.3 Announcement Returns for Public Targets
In Table 12, we focus on the subset mergers with publicly traded targets, and we
examine bidder as well as target returns following merger announcements. We use the
same set of controls as in Table 2 and include year and industry fixed effects. Consistent
with past literature, we observe a negative market response on average for acquirers when
the target is publicly traded. Moreover, distant home bias mergers continue to be poorly

27
received by the market, with bidder firms experiencing 1.2-1.4% lower announcement
returns.17
For the subset of public target mergers, we are able to explore whether home bias
CEOs pay larger takeover premiums by examining the target price announcement response.
Columns 3 and 4 of Table 12 report regressions of the public target 3-day price responses
using the same set of controls as for bidder returns. Although neither coefficient is
significantly different from zero, the coefficients for faraway home bias targets are positive
for both state-based and distance-based measures, which is generally consistent with
paying a premium for distant home bias targets.
5.4 Ruling out General Overconfidence Among Home Bias CEOs
The insider trading evidence in Table 9 is consistent with excess optimism among
CEOs when investing near their birth region. A possible alternative explanation is that
CEOs that engage in home bias mergers tend to be overconfident in general. Measures of
CEO overconfidence have previously been linked to merger activity (Malmendier and Tate,
2008). If overconfidence is related to home bias investing, our findings may be capturing
overconfident CEOs engaging in value destroying acquisitions.
If home bias acquisitions are driven by perennially overconfident CEOs, we would
expect these CEOs to be generally more likely to purchase shares of their own stocks than
other insiders. We therefore perform a placebo test of insider trading in which we analyze
17 In contemporaneous work, Jian, Qian, and Yonker (2016) find evidence of a positive market response to
in-state, home bias public target mergers. Their sample is taken from ExecuComp for 1992-2014, which
generally covers S&P 1500 firms (S&P 500 firms for 1992-1993). We broaden the merger sample to also
include smaller public acquirers listed in BoardEx from 1990-2014, and our sample of public target mergers
is roughly twice as large. The evidence in Jian, et al. (2016) is consistent with larger acquirers being less
likely to engage in value destroying home bias mergers, perhaps due to better monitoring.
28
CEOs’ trading behavior two years prior to the announcement of an acquisition, and
examine whether (future) home bias CEOs are more likely to purchase stock than other
company insiders.
In Table 13, we report results of insider trading by CEOs, directors, and top
executives during the placebo period. For both state- and distance-based home bias
variables, we no longer observe the same pattern as in Table 9. In particular, we find no
evidence that CEOs are more likely than other company insiders to purchase their own
stock during the placebo period, which is inconsistent with general overconfidence among
home bias CEOs.
The placebo analysis considers trading over a relatively short, 60-day window. We
further explore the conjecture that home bias CEOs may be generally overconfident by
examining overconfidence measures based on the moneyness of their unexercised options
(Malmendier and Tate, 2008). Specifically, we classify executives as overconfident if the
average moneyness of their unexercised options during the fiscal year prior to the
acquisition is 0.67, and zero otherwise. We estimate similar probit analyses and present the
evidence in Table 14. For both state- and distance-based home bias variables, we find no
evidence that CEOs are more likely to be overconfident in the year prior to home bias
acquisitions. Taken together, the placebo insider trading and overconfidence evidence
supports the view that CEO’s are uniquely optimistic about investing near the birth region.
6. Conclusions
We consider CEOs’ regional upbringing as a source of deep-seated familiarity, and
we explore whether a CEO’s birth state location influences the firm’s acquisition behavior.
We find evidence that CEOs are significantly more likely to acquire targets from their birth
29
region, and the effects are stronger when the CEO does not currently live near their
hometown. We follow up the initial analysis with a number of tests to help determine
whether CEO home bias mergers reflect beneficial information advantages or are instead
driven by inefficient managerial objectives such as private benefits or an underlying bias
towards the familiar.
We find evidence of negative acquirer market responses to CEO home bias mergers.
For example, the market response to faraway home bias mergers is 1.71-1.95% lower than
non-home bias mergers, and the differences are statistically significant after controlling for
firm and deal characteristics. The negative announcement effect of home bias mergers is
stronger when the CEO has a deeper connection to his or her birth state. The effect is also
stronger among poorly governed firms, which is consistent with these projects reflecting
manager preferences rather than informational advantages.
We help distinguish whether home bias mergers reflect agency considerations and
private benefits to the CEO such as status seeking, or excess optimism through an
underlying bias toward the familiar, by studying how CEOs and other insiders trade
following home bias merger announcements. We find evidence that CEOs are significantly
more likely to purchase company shares following home bias acquisition announcements,
consistent with familiarity-driven optimism interpretations rather than explanations related
to private benefits.
Our findings present compelling evidence that CEOs are more likely to invest in
their home regions through acquisitions. Our findings of a familiarity-oriented home bias
are consistent with evidence from mutual funds managers and credit rating analysts, and

30
support the interpretation that familiarity can lead to misplaced confidence in firm
investment.
31
Appendix A: Variable Definitions:
Measures of Home Bias and Proximity
Home Bias – Denotes either Home Bias State or Home Bias Distance
o Home Bias State – A dummy variable that is equal to one when the acquirer firm
CEO birth state is the same as the target headquarters state, zero otherwise.
o Home Bias Distance – A dummy variable that is equal to one when the distance
between the acquirer firm CEO’s home town and the target headquarters
location is less than 100 miles, zero otherwise.
Faraway – Denotes either Faraway State or Faraway Distance
o Faraway State – A dummy variable that is equal to one when the acquirer
headquarters state is different from target headquarters state.
o Faraway Distance – A dummy variable that is equal to one when the distance
between acquirer firm CEO’s hometown and the target headquarters location is
less than 100 miles.
Home Bias × Faraway – The interaction between Home Bias and Faraway.
Interaction Effects
Strong Connection – A variable that denotes either Attended College or Long-Time
Resident
o Attended College – A dummy variable that is equal to one if the acquiring firm
CEO obtained a degree from institution of higher education that is located in
their birth state (state measures), or within 100 miles of the CEO’s hometown
(distance measures), zero otherwise.
o Long-Time Resident – A dummy variable that is equal to one if the acquiring
firm CEO lived in their birth state/hometown for more than 10 years after they
reach adulthood, zero otherwise.
Poor Governance – A variable that denotes one of the following corporate governance
measures:
o High E-Index – A dummy variable that is equal to one if the entrenchment index
of Bebchuk, Cohen and Ferrell (2009) is above 2 (the median), zero otherwise.
o CEO is Chair – A dummy variable that is equal to one when the CEO is also
the chair of the board, zero otherwise.
o Low Board Independence – A dummy variable that is equal to one when less
than 50% of the board is comprised of independent directors, zero otherwise.
o Low CEO Ownership – A dummy variable that is equal to one when the CEO
ownership stake in the firm is below median using the measure, zero otherwise.
o Low Inst. Ownership – A dummy variable that is equal to one when the acquirer
firm’s institutional ownership is below the median, zero otherwise. Institutional
ownership is measured as the (industry-adjusted) proportion of shares
32
outstanding (in percent) in the hands of US independent, non-transient, long-
term institutional investors (Chen, Harford, and Li, 2007).
Insider Trading Measures
CEO Buys – A dummy variable that is equal to one if the acquirer CEO has a positive
average market value of shares traded (bought less sold) during the period two days
after the merger announcement date to effective date or 60 days after the announcement,
whichever comes first (zero otherwise).
Directors Buy – A dummy variable that is equal to one if the acquirer firm (non-CEO)
directors have a positive average market value of shares traded (bought less sold)
during the period two days after the merger announcement date to effective date or 60
days after the announcement, whichever comes first (zero otherwise). We take the
cross-sectional mean of the group for each date and sum over event window.
Top Execs Buy – A dummy variable that is equal to one if the acquirer firm (non-CEO)
top executives have a positive average market value of shares traded (bought less sold)
during the period two days after the merger announcement date to effective date or 60
days after the announcement, whichever comes first (zero otherwise). We take the
cross-sectional mean of the group for each date and sum over the event window.
CEO Buys, Not Directors – A dummy variable that is equal to one when CEO Buys
equals one and Directors Buys equals zero, zero otherwise.
CEO Buys, Not Top Execs – A dummy variable that is equal to one when CEO Buys
equals one and Top Exec Buy equals zero, zero otherwise.
Control Variables
Δ Income (x100) – Industry-adjusted three-year income growth, defined as log(It-1) –
log(It-4), where It-1 is the sum of net income, interest, and deferred taxes for the fiscal
year preceding the announcement (Morck, Shleifer and Vishny, 1990).
Cash Deal – A dummy variable that is equal to one when the acquisition is financed
entirely with cash.
Industry Leverage – Acquirer's industry median leverage across all Compustat firms
classified using four-digit standard industrial classification (SIC) codes. Leverage is
defined as representing the sum of long-term debt (DLTT) and debt in current liabilities
(DLC) over common equity (CEQ).
Industry Tobin's Q – Acquirer's industry median Tobin's Q across all Compustat firms
(using four-digit SIC codes) divided by 100. See Tobin's Q.
Is Cash – A dummy variable that is equal to one when the acquisition is financed
entirely with cash.
Is Diversifying Merger – A dummy variable that is equal to one when the acquirer and
the target are in different four-digit SIC code industries.
33
Is Public – A dummy variable that is equal to one when the target firm is publicly
traded.
Is Stock – A dummy variable that is equal to one when the acquisition is financed
entirely with bidder stocks.
Leverage – Sum of long-term debt (DLTT) and debt in current liabilities (DLC) over
common equity (CEQ).
Log Total Assets – Logarithm of total assets (AT).
Price Run-up – Bidder's buy-and-hold abnormal return from 230 to 11 days before the
announcement. The CRSP value-weighted index is used as the benchmark.
Relative Deal Size – Value of the deal as reported by Securities Data Company over
the market value of the acquirer measured at the end of the fiscal year preceding the
announcement.
Tobin's Q – Sum of the market value of book assets (AT) and the market value of
common equity (CSHO x PRCC) minus the sum of common equity (CEQ) and deferred
taxes (TXDB), all over the sum of 0.9 x book value of assets (AT) and 0.1 x market
value of assets.
Total Assets – Total book assets (AT) in billions of dollars.
34
References
Ahern, K.R., Daminelli, D. and Fracassi, C., 2015. Lost in translation? The effect of
cultural values on mergers around the world. Journal of Financial Economics, 117(1),
165-189.
Alldredge, D., and Cicero, D., 2015. Attentive insider trading. Journal of Financial
Economics 115, 84–101.
Altman, I., Low, S., 1992. Place attachment. Plenum Press.
Barber, B., and Lyon, J. D., 1997. Detecting long-run abnormal stock returns: The
empirical power and specification of test statistics. Journal of Financial Economics,
43, 341-372.
Bebchuk, L. A., Cohen, A., Ferrell, A., 2009. What matters in corporate governance?
Review of Financial Studies, 22, 783–827.
Ben-David, I., Graham, J.R. and Harvey, C.R., 2013. Managerial miscalibration. The
Quarterly Journal of Economics, 128, 1547-1584.
Bhattacharya, U., and Groznik, P., 2008. Melting pot or salad bowl: Some evidence from
U.S. investments abroad. Journal of Financial Markets 11, 228–58.
Byrd, J. W., and Hickman, K. A., 1992. Do outside directors monitor managers? Evidence
from tender offer bids. Journal of Financial Economics, 32.2, 195-221.
Cai, Y. and Sevilir, M., 2012. Board connections and M&A transactions. Journal of
Financial Economics, 103(2), 327-349.
Capron, L. and Shen, J.C., 2007. Acquisitions of private vs. public firms: Private
information, target selection, and acquirer returns. Strategic Management
Journal, 28(9), 891-911.
Carhart, M. M., 1997. On persistence in mutual fund performance. Journal of Finance, 52,
57–82.
Chang, S., 1998. Takeovers of privately held targets, methods of payment, and bidder
returns. Journal of Finance, 53, 773–784.
Chen, X., Harford, J., Li, K., 2007. Monitoring: which institutions matter? Journal of
Financial Economics, 86, 279–305.
Cohen, L., Frazzini, A., Malloy, C., 2008. The small world of investing: board connections
and mutual fund returns. Journal of Political Economy, 116, 951–979.
Cohen, L., Frazzini, A., Malloy, C., 2012. Hiring cheerleaders: board appointments of
“independent” directors. Management Science, 58, 1039–1058.
35
Core, J. E., Holthausen, R. W., and Larcker, D. F., 1999. Corporate governance, chief
executive officer compensation, and firm performance. Journal of Financial
Economics, 51.3, 371-406.
Cornaggia J., Cornaggia K. R., and Israelsen R. D., 2017. Where the heart is: Information
production and the home bias. SSRN Scholarly Paper ID 2518040, Social Science
Research Network, Rochester, NY
Cohen, L., Malloy, C., and Pomorski L., 2012, Decoding Inside Information. Journal of
Finance 67, 1009–1043.
Coval, J.D., Moskowitz, T.J., 1999. Home bias at home: Local equity preference in
domestic portfolios. Journal of Finance, 54, 2045–2073.
Coval, J.D., Moskowitz, T.J., 2001. The geography of investment: informed trading and
asset prices. Journal of Political Economy, 109, 811–841.
Cumming D. and Dai. N., 2010. Local bias in venture capital investments. Journal of
Empirical Finance, 17(3): 362-380.
Duchin, R., and Schmidt, B., 2013. Riding the merger wave: Uncertainty, reduced
monitoring, and bad acquisitions. Journal of Financial Economics, 107, 69-88.
Fernandez, B., 2010 (Jan 2010), “Casket maker to buy Pitman's K-Tron International” The
Philadelphia Inquirer.
Ferreira, M.A. and Matos, P., 2012. Universal banks and corporate control: Evidence from
the global syndicated loan market. Review of Financial Studies, 25(9), 2703-2744.
French, K.R., and Poterba, J.M., 1991. Investor diversification and international equity
markets. American Economic Review, 81 (2), 222-226.
Gillan, S. L., Hartzell, J. C., Starks, L. T., 2011. Tradeoffs in corporate governance:
evidence from board structures and charter provisions. Quarterly Journal of Finance,
1(04), 667-705
Goyal, V. K., and Park, C. W., 2002. Board leadership structure and CEO turnover. Journal
of Corporate Finance, 8, 49-66.
Grinblatt, M., and Keloharju, M., 2001. Distance, language, and culture bias: The role of
investor sophistication. Journal of Finance, 56, 1053–1073.
Heath, C. and Tversky, A., 1991. Preference and belief: Ambiguity and competence in
choice under uncertainty. Journal of Risk and Uncertainty, 4(1), 5-28.
Hirshleifer, D., Low, A. and Teoh, S.H., 2012. Are overconfident CEOs better innovators?
The Journal of Finance, 67(4), 1457-1498.
Huberman, G., 2001. Familiarity breeds investment. Review of Financial Studies, 14, 659–
680.
36
Ivkovic, Z., and Weisbenner, S. 2005. Local does as local is: Information content of the
geography of individual investors’ common stock investments. Journal of Finance, 60
(1), 267-306.
Jian, Feng, Qian, Yiming, and Yonker, Scott E., 2016, Home biased acquisitions, Working
Paper, University of Buffalo.
Kang, J., and Stulz, R.M., 1997. Why is there a home bias? An analysis of foreign portfolio
equity ownership in Japan. Journal of Financial Economics, 46, 3-28.
Lang, L. H. P., Stulz, R. M., Walkling, R. A., 1991. A test of the free cash flow hypothesis:
the case of bidder returns. Journal of Financial Economics, 29, 315–335.
Malmendier, U. and Tate, G., 2008. Who makes acquisitions? CEO overconfidence and
the market's reaction. Journal of financial Economics, 89(1), 20-43.
Manzo, L., 2003. Beyond house and haven: toward a revisioning of emotional relationships
with places. Journal of Environmental Psychology, 23 (1), 47-61.
Masulis, R. W., Wang, C., Xie, F., 2007. Corporate governance and acquirer returns.
Journal of Finance, 62, 1851–1889.
Moeller, S. B., Schlingemann, F. P., Stulz, R. M., 2004. Firm size and the gains from
acquisitions. Journal of Financial Economics, 73, 201–228.
Morck R., Shleifer A., and Vishny R.W., 1990. Do managerial objectives drive bad
acquisitions? Journal of Finance, 45(1): 31-48.
Myers, S. C., Majluf, N. S., 1984. Corporate financing and investment decisions when
firms have information that investors do not have. Journal of Financial Economics, 13,
187–221.
Officer, M. S., Poulsen, A. B., Stegemoller, M., 2009. Target-firm information asymmetry
and acquirer returns. Review of Finance, 13, 467–493.
Parwada, J. T., 2008. The genesis of home bias? The location and portfolio choices of
investment company start-ups. Journal of Financial and Quantitative Analysis, 43,
245–66.
Pool, V.K., Stoffman, N., and Yonker, S.E., 2012. No place like home: Familiarity in
mutual fund manager portfolio choice. Review of Financial Studies, 25 (8), 2563-2599.
Ravina, E. and Sapienza, P., 2010. What do independent directors know? Evidence from
their trading. Review of Financial Studies, 23(3), 962-1003.
Rhodes-Kropf, M., Robinson, D. T., 2008. The market for mergers and the boundaries of
the firm. Journal of Finance, 63, 1169–1211.
Roll, R., 1986. The hubris hypothesis of corporate takeovers. Journal of Business, 59, 197–
216.
37
Shleifer, A., Vishny, R. W., 1989. Management entrenchment: the case of manager-
specific investments. Journal of Financial Economics, 25, 123–139.
Scannell, Leila; Robert Gifford, 2010. Defining place attachment: a tripartite organizing
framework. Journal of Environmental Psychology 30: 1–10.
Schmidt, B., 2015. Costs and benefits of friendly boards during mergers and
acquisitions. Journal of Financial Economics, 117(2), 424-447.
Seasholes, M.S., and Zhu, N., 2010. Individual investors and local bias. Journal of Finance,
65 (5), 1987-2010.
Seyhun, N., N., 1986. Insiders’ profits, costs of trading, and market efficiency. Journal of
Financial Economics 16, 189–212.
Taylor, R.B., Gottfredson, S.D. and Brower, S., 1985. Attachment to place: Discriminant
validity, and impacts of disorder and diversity. American Journal of Community
Psychology, 13(5), 525-542.
Tesar, L.L., and Werner, I., 1995. Home bias and high turnover. Journal of International
Money and Finance, 14 (4), 467-492.
Weisbach, M. S., 1988. Outside directors and CEO turnover. Journal of Financial
Economics, 20, 431-460.
Yonker, S.E., 2017a. Geography and the market for CEOs. Management Science, 63 (3),
609-630
Yonker, S.E., 2017b. Do managers give hometown labor an edge? Review of Financial
Studies, 30 (10), 3581-3604
38
Table 1. Merger Summary Statistics
The table reports summary statistics for the variables employed in our analysis. The sample consists of
acquisitions announced between 1990 and 2014 in which the acquirer is a publicly traded company and
data is available for our CEO and firm variables of interest (from SDC, CRSP, Compustat, and Lexis Nexis).
Panel A reports the mean, standard deviation, and the 25th, 50th, and 75th percentiles for the full sample of
mergers. Panels B through E report statistics for the subset of mergers in which B) the target headquarters
is located in the CEO’s birth state, C) the target headquarters is located less than 100 miles from the CEO’s
hometown, D) the target is headquartered outside the acquirer’s headquarters state, and E) the target is
headquartered more than 100 miles from the acquirer headquarters. A detailed description of each variable
is included in Appendix A.
Variable N Mean
Standard
Deviation
25th
Percentile Median
75th
Percentile
Panel A: All Mergers
Deal Value 9891 689.81 4096.74 18.55 60 225
Relative Deal Value 9891 0.22 0.37 0.03 0.08 0.23
Price Run-up 9891 0.18 0.64 -0.17 0.05 0.33
Tobin's Q 9891 1.91 2.06 1.07 1.38 2.08
Leverage 9891 0.35 1.03 0.11 0.35 0.56
Δ Income 9891 0.51 0.77 0 0.35 0.87
Acq-Target Distance 9494 800.92 806.71 125.32 541.86 1237.78
CEO-Target Distance 9494 924.12 810.28 257.33 683.33 1443.95
Panel B: Home Bias Mergers (State)
Deal Value 1456 548.99 5012.39 17.55 49.19 174.54
Relative Deal Value 1456 0.24 0.4 0.04 0.1 0.26
Price Run-up 1456 0.17 0.61 -0.16 0.04 0.3
Tobin's Q 1456 1.73 2.67 1.04 1.17 1.7
Leverage 1456 0.4 0.27 0.18 0.41 0.6
Δ Income 1456 0.53 0.78 0 0.34 0.85
Acq-Target Distance 1419 332.11 616.17 16.1 75.28 313.21
CEO-Target Distance 1419 97.34 118.54 11.3 40.21 145.96
Panel C: Home Bias Mergers (Distance)
Deal Value 1288 727.76 5721.64 18.77 57.71 189.83
Relative Deal Value 1288 0.26 0.4 0.05 0.12 0.31
Price Run-up 1288 0.15 0.59 -0.16 0.02 0.28
Tobin's Q 1288 1.69 2.27 1.03 1.17 1.72
Leverage 1288 0.39 0.35 0.17 0.41 0.61
Δ Income 1288 0.51 0.79 0 0.33 0.79
Acq-Target Distance 1288 314.91 641.29 12.38 43.41 195.85
CEO-Target Distance 1288 34.01 30.65 8.83 24.36 58.15
39
Table 1 Merger Summary Statistics (continued)
Variable N Mean
Standard
Deviation
25th
Percentile Median
75th
Percentile
Panel D: Faraway Mergers (Cross-State)
Deal Value 7227 735.56 4359.34 19 62 242.39
Relative Deal Value 7227 0.21 0.36 0.03 0.08 0.22
Price Run-up 7227 0.17 0.62 -0.16 0.04 0.32
Tobin's Q 7227 1.88 1.51 1.09 1.42 2.11
Leverage 7227 0.34 1.19 0.11 0.34 0.56
Δ Income 7227 0.51 0.77 0 0.36 0.87
Acq-Target Distance 6871 1071.09 791.13 422.3 855.1 1621.55
CEO-Target Distance 6871 995.2 781 369 757.3 1499.22
Panel E: Faraway Mergers (Distance)
Deal Value 7313 670.74 3953.25 19.59 61.84 239.32
Relative Deal Value 7313 0.21 0.36 0.03 0.08 0.22
Price Run-up 7313 0.18 0.64 -0.16 0.05 0.33
Tobin's Q 7313 1.91 1.95 1.09 1.4 2.11
Leverage 7313 0.34 1.19 0.1 0.35 0.56
Δ Income 7313 0.51 0.77 0 0.36 0.87
Acq-Target Distance 7313 1031.21 782.38 364.88 794.42 1568.75
CEO-Target Distance 7313 1010.94 785.02 368.19 769.11 1535.63
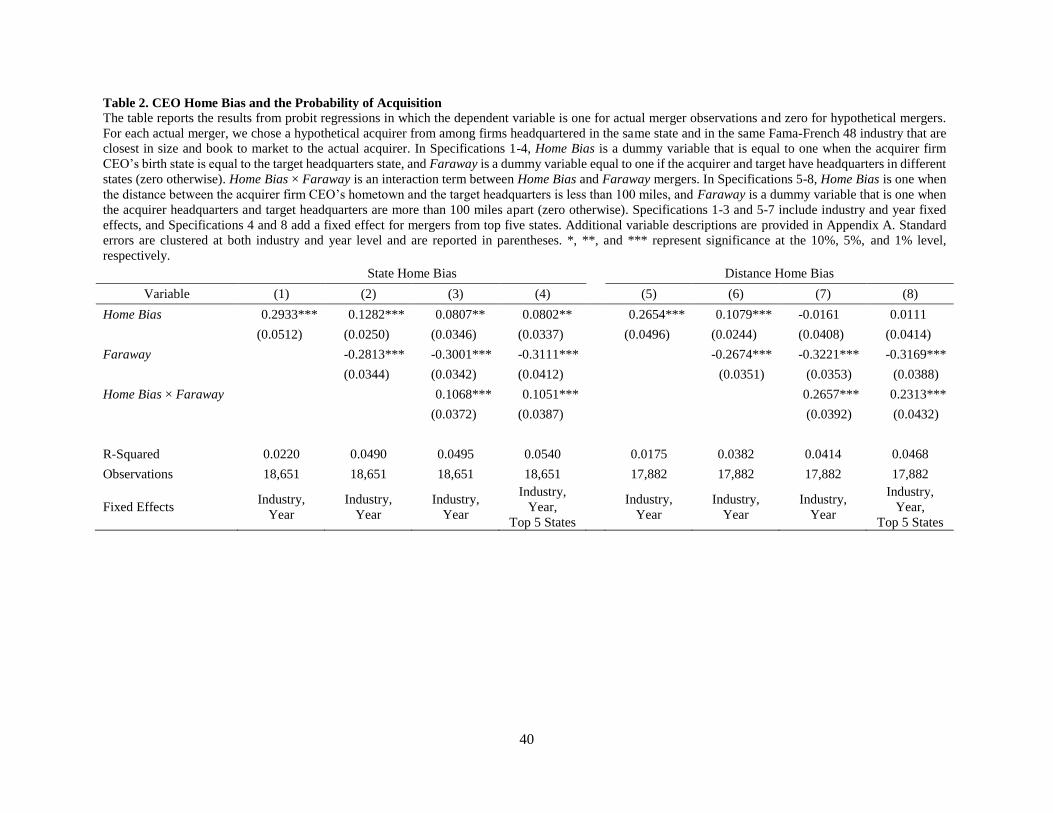
40
Table 2. CEO Home Bias and the Probability of Acquisition
The table reports the results from probit regressions in which the dependent variable is one for actual merger observations and zero for hypothetical mergers.
For each actual merger, we chose a hypothetical acquirer from among firms headquartered in the same state and in the same Fama-French 48 industry that are
closest in size and book to market to the actual acquirer. In Specifications 1-4, Home Bias is a dummy variable that is equal to one when the acquirer firm
CEO’s birth state is equal to the target headquarters state, and Faraway is a dummy variable equal to one if the acquirer and target have headquarters in different
states (zero otherwise). Home Bias × Faraway is an interaction term between Home Bias and Faraway mergers. In Specifications 5-8, Home Bias is one when
the distance between the acquirer firm CEO’s hometown and the target headquarters is less than 100 miles, and Faraway is a dummy variable that is one when
the acquirer headquarters and target headquarters are more than 100 miles apart (zero otherwise). Specifications 1-3 and 5-7 include industry and year fixed
effects, and Specifications 4 and 8 add a fixed effect for mergers from top five states. Additional variable descriptions are provided in Appendix A. Standard
errors are clustered at both industry and year level and are reported in parentheses. *, **, and *** represent significance at the 10%, 5%, and 1% level,
respectively.
State Home Bias Distance Home Bias
Variable (1) (2) (3) (4) (5) (6) (7) (8)
Home Bias 0.2933*** 0.1282*** 0.0807** 0.0802** 0.2654*** 0.1079*** -0.0161 0.0111
(0.0512) (0.0250) (0.0346) (0.0337) (0.0496) (0.0244) (0.0408) (0.0414)
Faraway -0.2813*** -0.3001*** -0.3111*** -0.2674*** -0.3221*** -0.3169***
(0.0344) (0.0342) (0.0412) (0.0351) (0.0353) (0.0388)
Home Bias × Faraway 0.1068*** 0.1051*** 0.2657*** 0.2313***
(0.0372) (0.0387) (0.0392) (0.0432)
R-Squared 0.0220 0.0490 0.0495 0.0540 0.0175 0.0382 0.0414 0.0468
Observations 18,651 18,651 18,651 18,651 17,882 17,882 17,882 17,882
Fixed Effects Industry,
Year
Industry,
Year
Industry,
Year
Industry,
Year,
Top 5 States
Industry,
Year
Industry,
Year
Industry,
Year
Industry,
Year,
Top 5 States
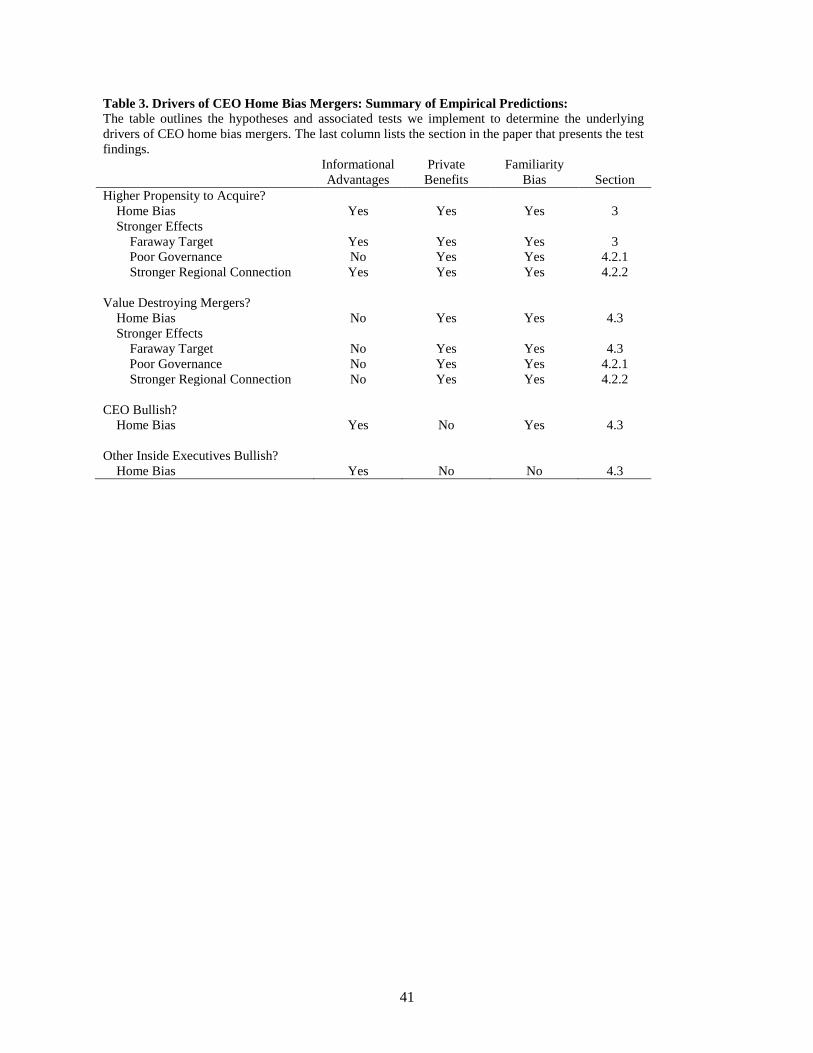
41
Table 3. Drivers of CEO Home Bias Mergers: Summary of Empirical Predictions:
The table outlines the hypotheses and associated tests we implement to determine the underlying
drivers of CEO home bias mergers. The last column lists the section in the paper that presents the test
findings.
Informational
Advantages
Private
Benefits
Familiarity
Bias
Section
Higher Propensity to Acquire?
Home Bias Yes Yes Yes 3
Stronger Effects
Faraway Target Yes Yes Yes 3
Poor Governance No Yes Yes 4.2.1
Stronger Regional Connection Yes Yes Yes 4.2.2
Value Destroying Mergers?
Home Bias No Yes Yes 4.3
Stronger Effects
Faraway Target No Yes Yes 4.3
Poor Governance No Yes Yes 4.2.1
Stronger Regional Connection No Yes Yes 4.2.2
CEO Bullish?
Home Bias Yes No Yes 4.3
Other Inside Executives Bullish?
Home Bias Yes No No 4.3
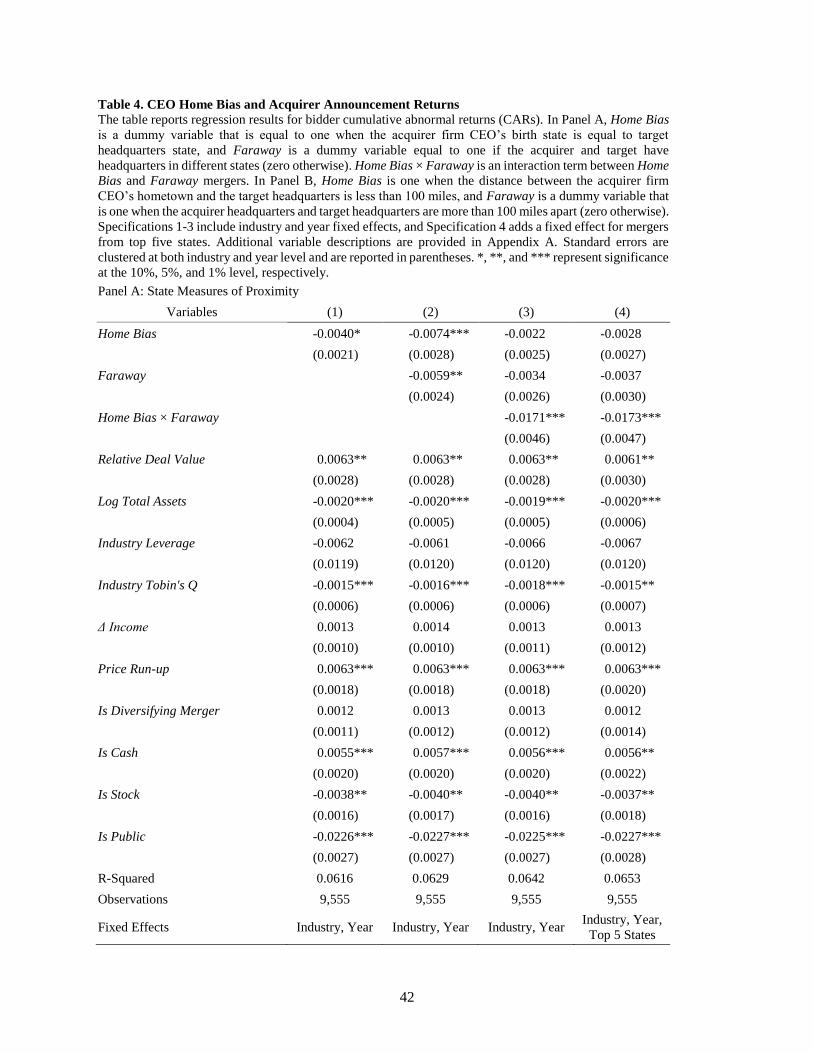
42
Table 4. CEO Home Bias and Acquirer Announcement Returns
The table reports regression results for bidder cumulative abnormal returns (CARs). In Panel A, Home Bias
is a dummy variable that is equal to one when the acquirer firm CEO’s birth state is equal to target
headquarters state, and Faraway is a dummy variable equal to one if the acquirer and target have
headquarters in different states (zero otherwise). Home Bias × Faraway is an interaction term between Home
Bias and Faraway mergers. In Panel B, Home Bias is one when the distance between the acquirer firm
CEO’s hometown and the target headquarters is less than 100 miles, and Faraway is a dummy variable that
is one when the acquirer headquarters and target headquarters are more than 100 miles apart (zero otherwise).
Specifications 1-3 include industry and year fixed effects, and Specification 4 adds a fixed effect for mergers
from top five states. Additional variable descriptions are provided in Appendix A. Standard errors are
clustered at both industry and year level and are reported in parentheses. *, **, and *** represent significance
at the 10%, 5%, and 1% level, respectively.
Panel A: State Measures of Proximity
Variables (1) (2) (3) (4)
Home Bias -0.0040* -0.0074*** -0.0022 -0.0028
(0.0021) (0.0028) (0.0025) (0.0027)
Faraway -0.0059** -0.0034 -0.0037
(0.0024) (0.0026) (0.0030)
Home Bias × Faraway -0.0171*** -0.0173***
(0.0046) (0.0047)
Relative Deal Value 0.0063** 0.0063** 0.0063** 0.0061**
(0.0028) (0.0028) (0.0028) (0.0030)
Log Total Assets -0.0020*** -0.0020*** -0.0019*** -0.0020***
(0.0004) (0.0005) (0.0005) (0.0006)
Industry Leverage -0.0062 -0.0061 -0.0066 -0.0067
(0.0119) (0.0120) (0.0120) (0.0120)
Industry Tobin's Q -0.0015*** -0.0016*** -0.0018*** -0.0015**
(0.0006) (0.0006) (0.0006) (0.0007)
Δ Income 0.0013 0.0014 0.0013 0.0013
(0.0010) (0.0010) (0.0011) (0.0012)
Price Run-up 0.0063*** 0.0063*** 0.0063*** 0.0063***
(0.0018) (0.0018) (0.0018) (0.0020)
Is Diversifying Merger 0.0012 0.0013 0.0013 0.0012
(0.0011) (0.0012) (0.0012) (0.0014)
Is Cash 0.0055*** 0.0057*** 0.0056*** 0.0056**
(0.0020) (0.0020) (0.0020) (0.0022)
Is Stock -0.0038** -0.0040** -0.0040** -0.0037**
(0.0016) (0.0017) (0.0016) (0.0018)
Is Public -0.0226*** -0.0227*** -0.0225*** -0.0227***
(0.0027) (0.0027) (0.0027) (0.0028)
R-Squared 0.0616 0.0629 0.0642 0.0653
Observations 9,555 9,555 9,555 9,555
Fixed Effects Industry, Year Industry, Year Industry, Year Industry, Year,
Top 5 States
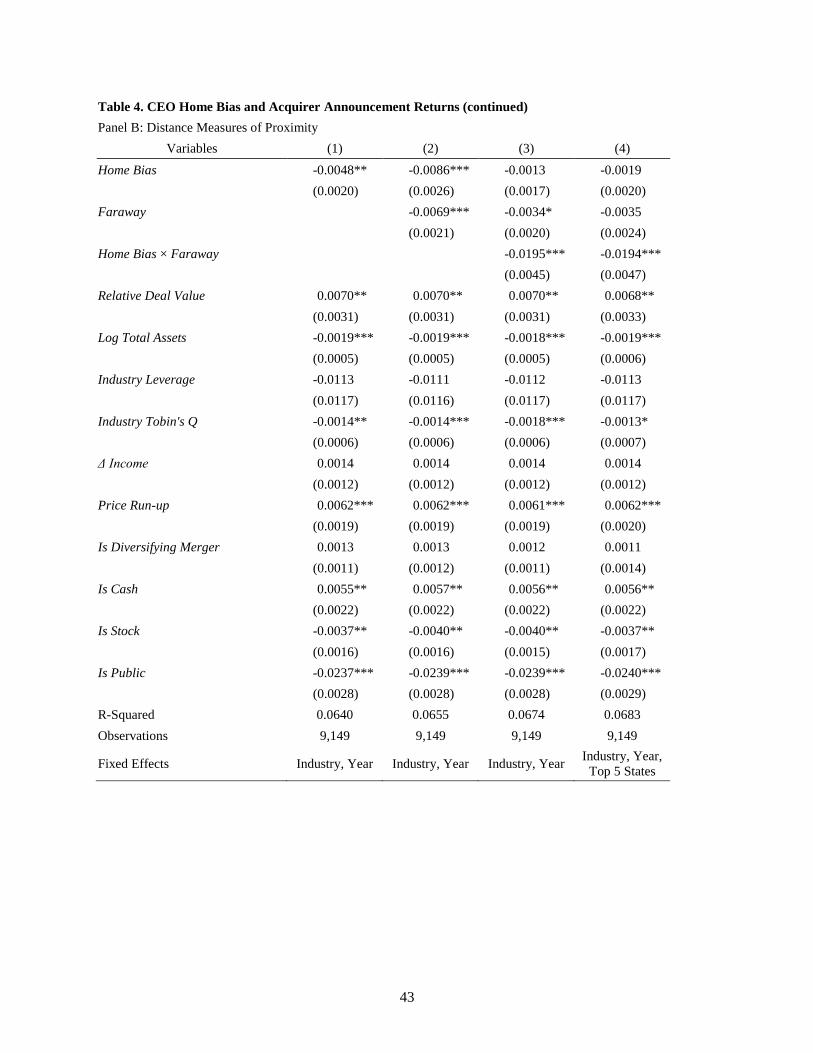
43
Table 4. CEO Home Bias and Acquirer Announcement Returns (continued)
Panel B: Distance Measures of Proximity
Variables (1) (2) (3) (4)
Home Bias -0.0048** -0.0086*** -0.0013 -0.0019
(0.0020) (0.0026) (0.0017) (0.0020)
Faraway -0.0069*** -0.0034* -0.0035
(0.0021) (0.0020) (0.0024)
Home Bias × Faraway -0.0195*** -0.0194***
(0.0045) (0.0047)
Relative Deal Value 0.0070** 0.0070** 0.0070** 0.0068**
(0.0031) (0.0031) (0.0031) (0.0033)
Log Total Assets -0.0019*** -0.0019*** -0.0018*** -0.0019***
(0.0005) (0.0005) (0.0005) (0.0006)
Industry Leverage -0.0113 -0.0111 -0.0112 -0.0113
(0.0117) (0.0116) (0.0117) (0.0117)
Industry Tobin's Q -0.0014** -0.0014*** -0.0018*** -0.0013*
(0.0006) (0.0006) (0.0006) (0.0007)
Δ Income 0.0014 0.0014 0.0014 0.0014
(0.0012) (0.0012) (0.0012) (0.0012)
Price Run-up 0.0062*** 0.0062*** 0.0061*** 0.0062***
(0.0019) (0.0019) (0.0019) (0.0020)
Is Diversifying Merger 0.0013 0.0013 0.0012 0.0011
(0.0011) (0.0012) (0.0011) (0.0014)
Is Cash 0.0055** 0.0057** 0.0056** 0.0056**
(0.0022) (0.0022) (0.0022) (0.0022)
Is Stock -0.0037** -0.0040** -0.0040** -0.0037**
(0.0016) (0.0016) (0.0015) (0.0017)
Is Public -0.0237*** -0.0239*** -0.0239*** -0.0240***
(0.0028) (0.0028) (0.0028) (0.0029)
R-Squared 0.0640 0.0655 0.0674 0.0683
Observations 9,149 9,149 9,149 9,149
Fixed Effects Industry, Year Industry, Year Industry, Year Industry, Year,
Top 5 States
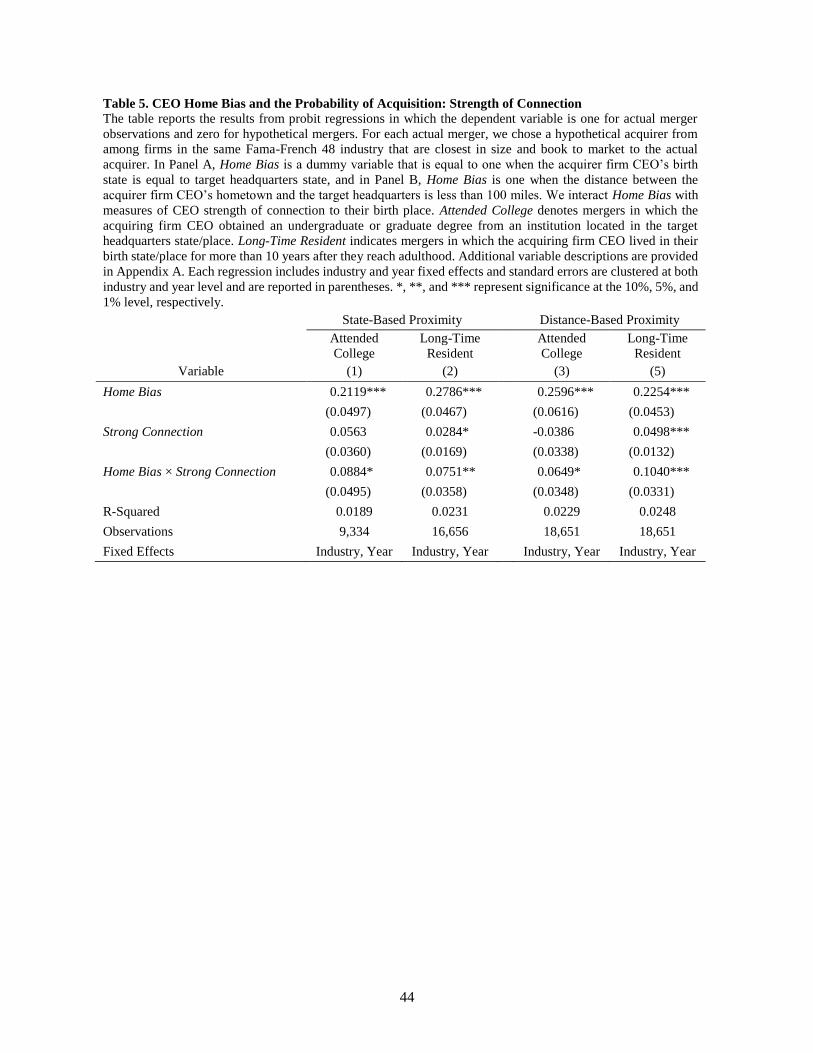
44
Table 5. CEO Home Bias and the Probability of Acquisition: Strength of Connection The table reports the results from probit regressions in which the dependent variable is one for actual merger
observations and zero for hypothetical mergers. For each actual merger, we chose a hypothetical acquirer from
among firms in the same Fama-French 48 industry that are closest in size and book to market to the actual
acquirer. In Panel A, Home Bias is a dummy variable that is equal to one when the acquirer firm CEO’s birth
state is equal to target headquarters state, and in Panel B, Home Bias is one when the distance between the
acquirer firm CEO’s hometown and the target headquarters is less than 100 miles. We interact Home Bias with
measures of CEO strength of connection to their birth place. Attended College denotes mergers in which the
acquiring firm CEO obtained an undergraduate or graduate degree from an institution located in the target
headquarters state/place. Long-Time Resident indicates mergers in which the acquiring firm CEO lived in their
birth state/place for more than 10 years after they reach adulthood. Additional variable descriptions are provided
in Appendix A. Each regression includes industry and year fixed effects and standard errors are clustered at both
industry and year level and are reported in parentheses. *, **, and *** represent significance at the 10%, 5%, and
1% level, respectively.
State-Based Proximity Distance-Based Proximity
Attended
College
Long-Time
Resident
Attended
College
Long-Time
Resident
Variable (1) (2) (3) (5)
Home Bias 0.2119*** 0.2786*** 0.2596*** 0.2254***
(0.0497) (0.0467) (0.0616) (0.0453)
Strong Connection 0.0563 0.0284* -0.0386 0.0498***
(0.0360) (0.0169) (0.0338) (0.0132)
Home Bias × Strong Connection 0.0884* 0.0751** 0.0649* 0.1040***
(0.0495) (0.0358) (0.0348) (0.0331)
R-Squared 0.0189 0.0231 0.0229 0.0248
Observations 9,334 16,656 18,651 18,651
Fixed Effects Industry, Year Industry, Year Industry, Year Industry, Year
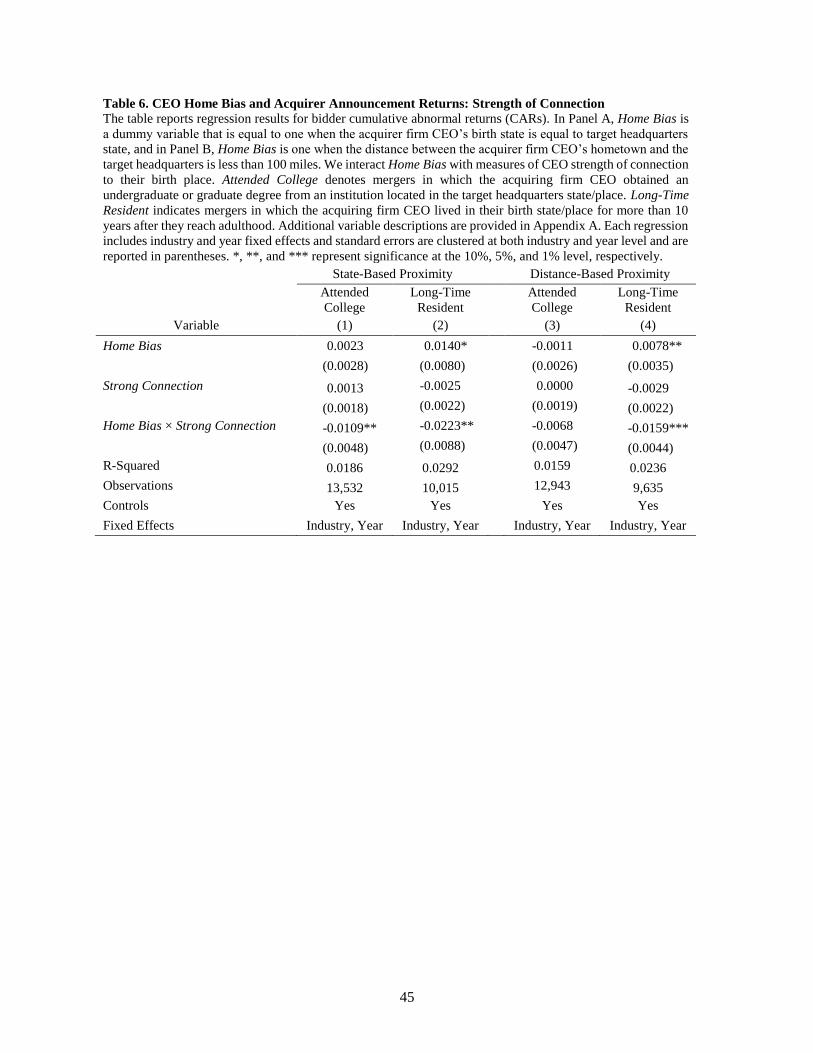
45
Table 6. CEO Home Bias and Acquirer Announcement Returns: Strength of Connection The table reports regression results for bidder cumulative abnormal returns (CARs). In Panel A, Home Bias is
a dummy variable that is equal to one when the acquirer firm CEO’s birth state is equal to target headquarters
state, and in Panel B, Home Bias is one when the distance between the acquirer firm CEO’s hometown and the
target headquarters is less than 100 miles. We interact Home Bias with measures of CEO strength of connection
to their birth place. Attended College denotes mergers in which the acquiring firm CEO obtained an
undergraduate or graduate degree from an institution located in the target headquarters state/place. Long-Time
Resident indicates mergers in which the acquiring firm CEO lived in their birth state/place for more than 10
years after they reach adulthood. Additional variable descriptions are provided in Appendix A. Each regression
includes industry and year fixed effects and standard errors are clustered at both industry and year level and are
reported in parentheses. *, **, and *** represent significance at the 10%, 5%, and 1% level, respectively.
State-Based Proximity Distance-Based Proximity
Attended
College
Long-Time
Resident
Attended
College
Long-Time
Resident
Variable (1) (2) (3) (4)
Home Bias 0.0023 0.0140* -0.0011 0.0078**
(0.0028) (0.0080) (0.0026) (0.0035)
Strong Connection 0.0013 -0.0025 0.0000 -0.0029
(0.0018) (0.0022) (0.0019) (0.0022)
Home Bias × Strong Connection -0.0109** -0.0223** -0.0068 -0.0159***
(0.0048) (0.0088) (0.0047) (0.0044)
R-Squared 0.0186 0.0292 0.0159 0.0236
Observations 13,532 10,015 12,943 9,635
Controls Yes Yes Yes Yes
Fixed Effects Industry, Year Industry, Year Industry, Year Industry, Year
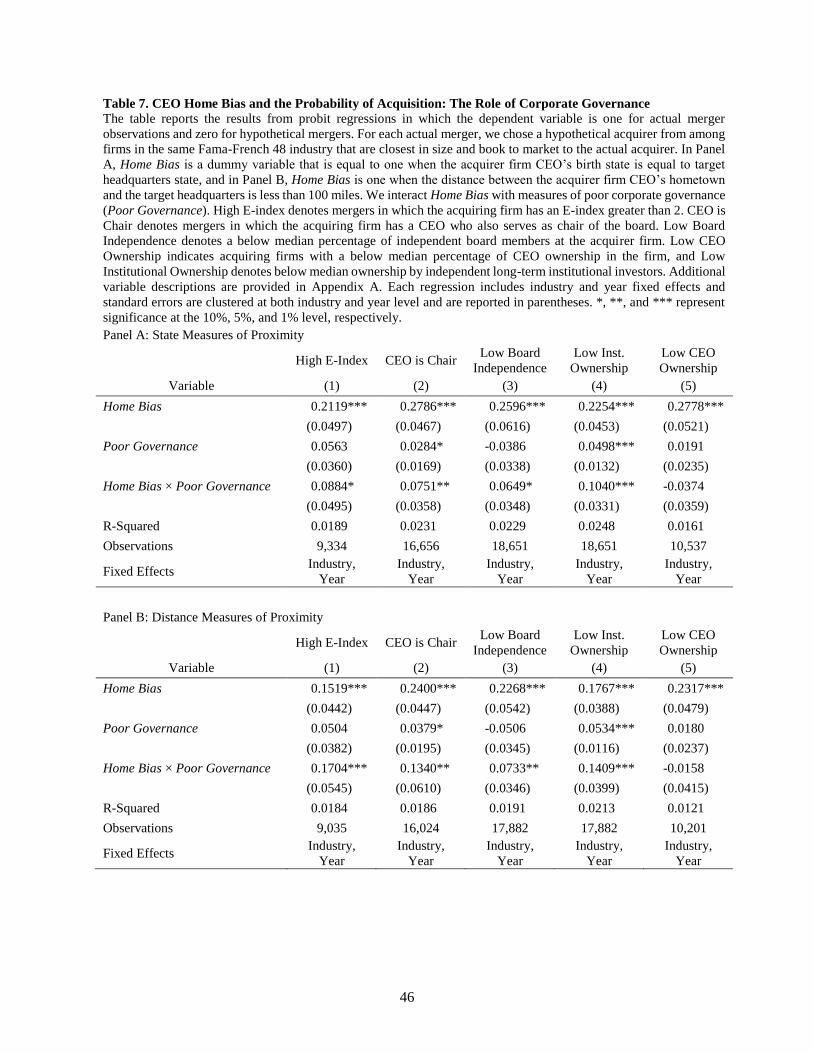
46
Table 7. CEO Home Bias and the Probability of Acquisition: The Role of Corporate Governance The table reports the results from probit regressions in which the dependent variable is one for actual merger
observations and zero for hypothetical mergers. For each actual merger, we chose a hypothetical acquirer from among
firms in the same Fama-French 48 industry that are closest in size and book to market to the actual acquirer. In Panel
A, Home Bias is a dummy variable that is equal to one when the acquirer firm CEO’s birth state is equal to target
headquarters state, and in Panel B, Home Bias is one when the distance between the acquirer firm CEO’s hometown
and the target headquarters is less than 100 miles. We interact Home Bias with measures of poor corporate governance
(Poor Governance). High E-index denotes mergers in which the acquiring firm has an E-index greater than 2. CEO is
Chair denotes mergers in which the acquiring firm has a CEO who also serves as chair of the board. Low Board
Independence denotes a below median percentage of independent board members at the acquirer firm. Low CEO
Ownership indicates acquiring firms with a below median percentage of CEO ownership in the firm, and Low
Institutional Ownership denotes below median ownership by independent long-term institutional investors. Additional
variable descriptions are provided in Appendix A. Each regression includes industry and year fixed effects and
standard errors are clustered at both industry and year level and are reported in parentheses. *, **, and *** represent
significance at the 10%, 5%, and 1% level, respectively.
Panel A: State Measures of Proximity
High E-Index CEO is Chair Low Board
Independence
Low Inst.
Ownership
Low CEO
Ownership
Variable (1) (2) (3) (4) (5)
Home Bias 0.2119*** 0.2786*** 0.2596*** 0.2254*** 0.2778***
(0.0497) (0.0467) (0.0616) (0.0453) (0.0521)
Poor Governance 0.0563 0.0284* -0.0386 0.0498*** 0.0191
(0.0360) (0.0169) (0.0338) (0.0132) (0.0235)
Home Bias × Poor Governance 0.0884* 0.0751** 0.0649* 0.1040*** -0.0374
(0.0495) (0.0358) (0.0348) (0.0331) (0.0359)
R-Squared 0.0189 0.0231 0.0229 0.0248 0.0161
Observations 9,334 16,656 18,651 18,651 10,537
Fixed Effects Industry,
Year
Industry,
Year
Industry,
Year
Industry,
Year
Industry,
Year
Panel B: Distance Measures of Proximity
High E-Index CEO is Chair Low Board
Independence
Low Inst.
Ownership
Low CEO
Ownership
Variable (1) (2) (3) (4) (5)
Home Bias 0.1519*** 0.2400*** 0.2268*** 0.1767*** 0.2317***
(0.0442) (0.0447) (0.0542) (0.0388) (0.0479)
Poor Governance 0.0504 0.0379* -0.0506 0.0534*** 0.0180
(0.0382) (0.0195) (0.0345) (0.0116) (0.0237)
Home Bias × Poor Governance 0.1704*** 0.1340** 0.0733** 0.1409*** -0.0158
(0.0545) (0.0610) (0.0346) (0.0399) (0.0415)
R-Squared 0.0184 0.0186 0.0191 0.0213 0.0121
Observations 9,035 16,024 17,882 17,882 10,201
Fixed Effects Industry,
Year
Industry,
Year
Industry,
Year
Industry,
Year
Industry,
Year
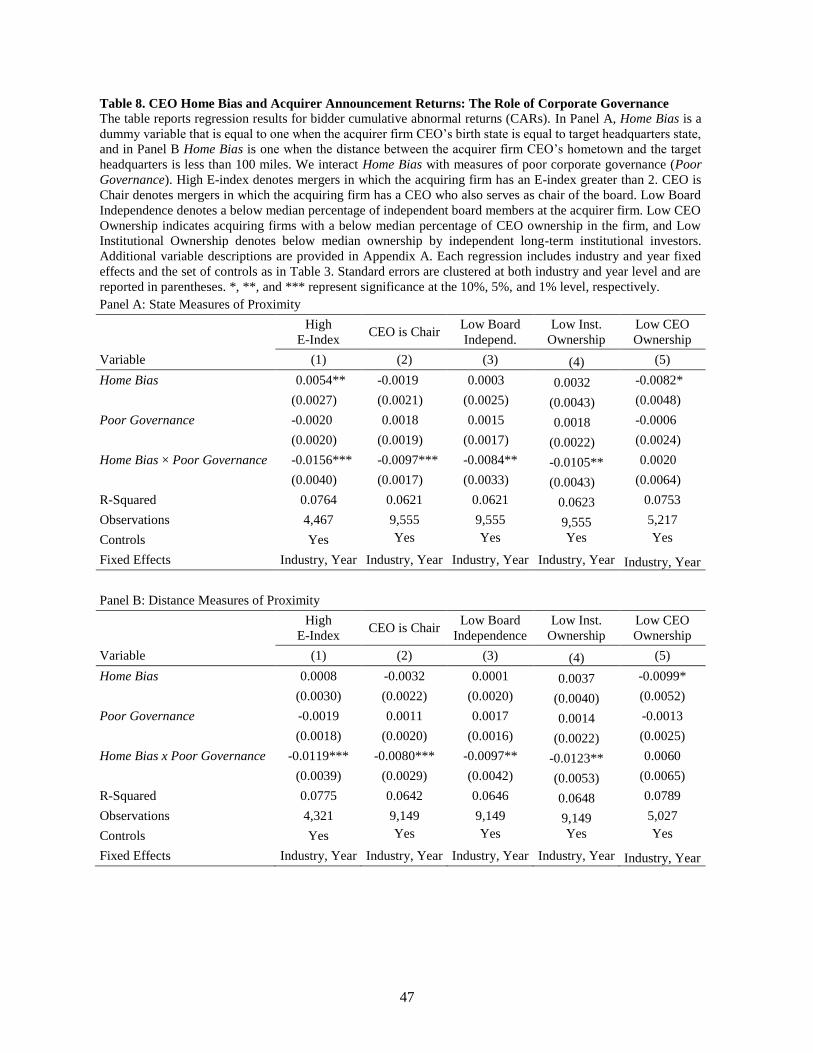
47
Table 8. CEO Home Bias and Acquirer Announcement Returns: The Role of Corporate Governance The table reports regression results for bidder cumulative abnormal returns (CARs). In Panel A, Home Bias is a
dummy variable that is equal to one when the acquirer firm CEO’s birth state is equal to target headquarters state,
and in Panel B Home Bias is one when the distance between the acquirer firm CEO’s hometown and the target
headquarters is less than 100 miles. We interact Home Bias with measures of poor corporate governance (Poor
Governance). High E-index denotes mergers in which the acquiring firm has an E-index greater than 2. CEO is
Chair denotes mergers in which the acquiring firm has a CEO who also serves as chair of the board. Low Board
Independence denotes a below median percentage of independent board members at the acquirer firm. Low CEO
Ownership indicates acquiring firms with a below median percentage of CEO ownership in the firm, and Low
Institutional Ownership denotes below median ownership by independent long-term institutional investors.
Additional variable descriptions are provided in Appendix A. Each regression includes industry and year fixed
effects and the set of controls as in Table 3. Standard errors are clustered at both industry and year level and are
reported in parentheses. *, **, and *** represent significance at the 10%, 5%, and 1% level, respectively.
Panel A: State Measures of Proximity
High
E-Index CEO is Chair
Low Board
Independ.
Low Inst.
Ownership
Low CEO
Ownership
Variable (1) (2) (3) (4) (5)
Home Bias 0.0054** -0.0019 0.0003 0.0032 -0.0082*
(0.0027) (0.0021) (0.0025) (0.0043) (0.0048)
Poor Governance -0.0020 0.0018 0.0015 0.0018 -0.0006
(0.0020) (0.0019) (0.0017) (0.0022) (0.0024)
Home Bias × Poor Governance -0.0156*** -0.0097*** -0.0084** -0.0105** 0.0020
(0.0040) (0.0017) (0.0033) (0.0043) (0.0064)
R-Squared 0.0764 0.0621 0.0621 0.0623 0.0753
Observations 4,467 9,555 9,555 9,555 5,217
Controls Yes Yes Yes Yes Yes
Fixed Effects Industry, Year Industry, Year Industry, Year Industry, Year Industry, Year
Panel B: Distance Measures of Proximity
High
E-Index CEO is Chair
Low Board
Independence
Low Inst.
Ownership
Low CEO
Ownership
Variable (1) (2) (3) (4) (5)
Home Bias 0.0008 -0.0032 0.0001 0.0037 -0.0099*
(0.0030) (0.0022) (0.0020) (0.0040) (0.0052)
Poor Governance -0.0019 0.0011 0.0017 0.0014 -0.0013
(0.0018) (0.0020) (0.0016) (0.0022) (0.0025)
Home Bias x Poor Governance -0.0119*** -0.0080*** -0.0097** -0.0123** 0.0060
(0.0039) (0.0029) (0.0042) (0.0053) (0.0065)
R-Squared 0.0775 0.0642 0.0646 0.0648 0.0789
Observations 4,321 9,149 9,149 9,149 5,027
Controls Yes Yes Yes Yes Yes
Fixed Effects Industry, Year Industry, Year Industry, Year Industry, Year Industry, Year
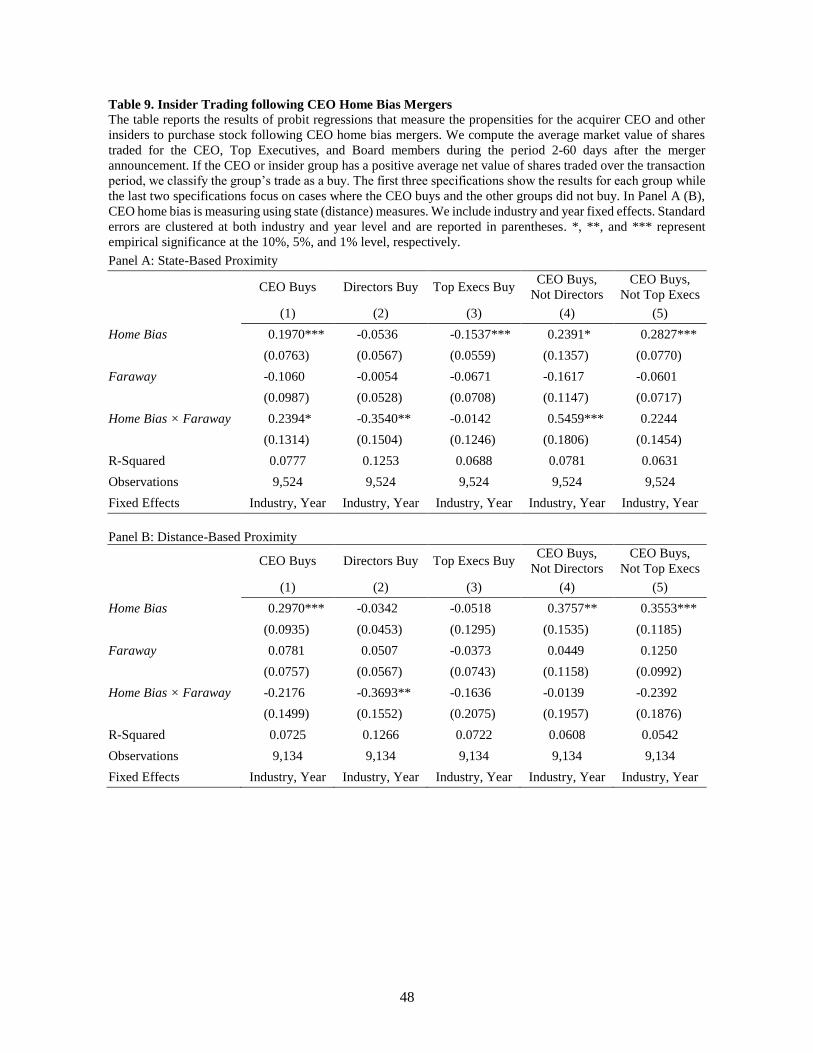
48
Table 9. Insider Trading following CEO Home Bias Mergers The table reports the results of probit regressions that measure the propensities for the acquirer CEO and other
insiders to purchase stock following CEO home bias mergers. We compute the average market value of shares
traded for the CEO, Top Executives, and Board members during the period 2-60 days after the merger
announcement. If the CEO or insider group has a positive average net value of shares traded over the transaction
period, we classify the group’s trade as a buy. The first three specifications show the results for each group while
the last two specifications focus on cases where the CEO buys and the other groups did not buy. In Panel A (B),
CEO home bias is measuring using state (distance) measures. We include industry and year fixed effects. Standard
errors are clustered at both industry and year level and are reported in parentheses. *, **, and *** represent
empirical significance at the 10%, 5%, and 1% level, respectively.
Panel A: State-Based Proximity
CEO Buys Directors Buy Top Execs Buy CEO Buys,
Not Directors
CEO Buys,
Not Top Execs
(1) (2) (3) (4) (5)
Home Bias 0.1970*** -0.0536 -0.1537*** 0.2391* 0.2827***
(0.0763) (0.0567) (0.0559) (0.1357) (0.0770)
Faraway -0.1060 -0.0054 -0.0671 -0.1617 -0.0601
(0.0987) (0.0528) (0.0708) (0.1147) (0.0717)
Home Bias × Faraway 0.2394* -0.3540** -0.0142 0.5459*** 0.2244
(0.1314) (0.1504) (0.1246) (0.1806) (0.1454)
R-Squared 0.0777 0.1253 0.0688 0.0781 0.0631
Observations 9,524 9,524 9,524 9,524 9,524
Fixed Effects Industry, Year Industry, Year Industry, Year Industry, Year Industry, Year
Panel B: Distance-Based Proximity
CEO Buys Directors Buy Top Execs Buy CEO Buys,
Not Directors
CEO Buys,
Not Top Execs
(1) (2) (3) (4) (5)
Home Bias 0.2970*** -0.0342 -0.0518 0.3757** 0.3553***
(0.0935) (0.0453) (0.1295) (0.1535) (0.1185)
Faraway 0.0781 0.0507 -0.0373 0.0449 0.1250
(0.0757) (0.0567) (0.0743) (0.1158) (0.0992)
Home Bias × Faraway -0.2176 -0.3693** -0.1636 -0.0139 -0.2392
(0.1499) (0.1552) (0.2075) (0.1957) (0.1876)
R-Squared 0.0725 0.1266 0.0722 0.0608 0.0542
Observations 9,134 9,134 9,134 9,134 9,134
Fixed Effects Industry, Year Industry, Year Industry, Year Industry, Year Industry, Year
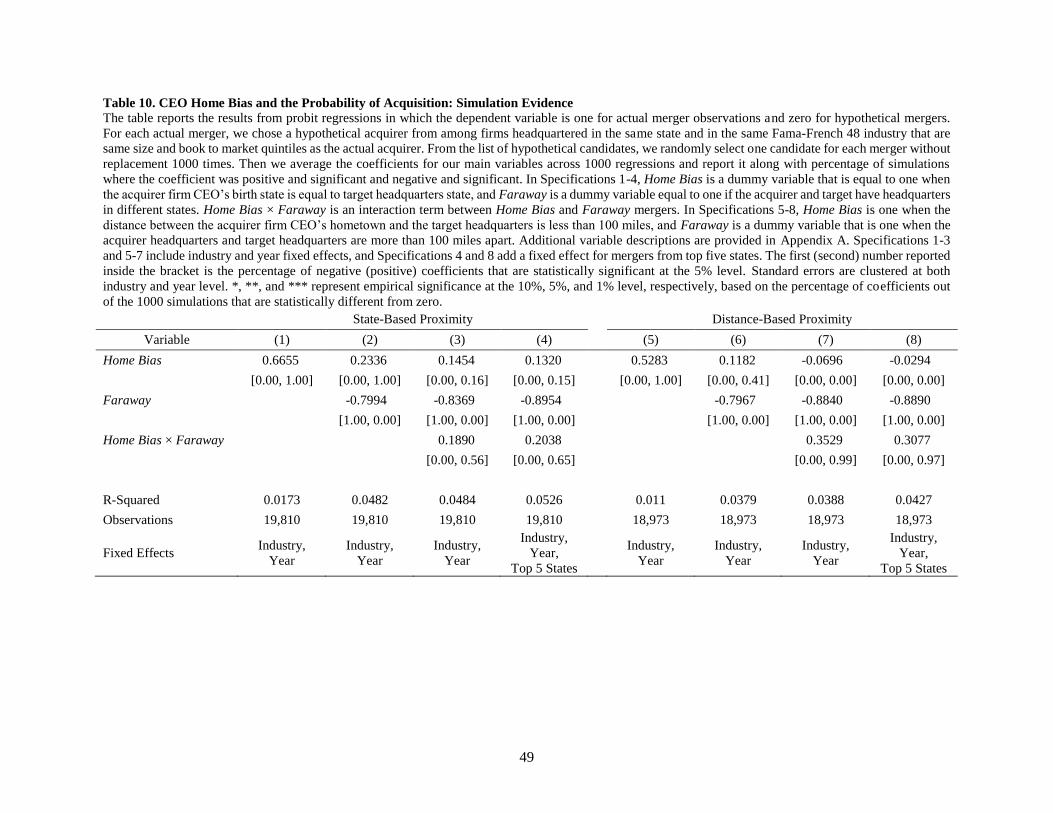
49
Table 10. CEO Home Bias and the Probability of Acquisition: Simulation Evidence
The table reports the results from probit regressions in which the dependent variable is one for actual merger observations and zero for hypothetical mergers.
For each actual merger, we chose a hypothetical acquirer from among firms headquartered in the same state and in the same Fama-French 48 industry that are
same size and book to market quintiles as the actual acquirer. From the list of hypothetical candidates, we randomly select one candidate for each merger without
replacement 1000 times. Then we average the coefficients for our main variables across 1000 regressions and report it along with percentage of simulations
where the coefficient was positive and significant and negative and significant. In Specifications 1-4, Home Bias is a dummy variable that is equal to one when
the acquirer firm CEO’s birth state is equal to target headquarters state, and Faraway is a dummy variable equal to one if the acquirer and target have headquarters
in different states. Home Bias × Faraway is an interaction term between Home Bias and Faraway mergers. In Specifications 5-8, Home Bias is one when the
distance between the acquirer firm CEO’s hometown and the target headquarters is less than 100 miles, and Faraway is a dummy variable that is one when the
acquirer headquarters and target headquarters are more than 100 miles apart. Additional variable descriptions are provided in Appendix A. Specifications 1-3
and 5-7 include industry and year fixed effects, and Specifications 4 and 8 add a fixed effect for mergers from top five states. The first (second) number reported
inside the bracket is the percentage of negative (positive) coefficients that are statistically significant at the 5% level. Standard errors are clustered at both
industry and year level. *, **, and *** represent empirical significance at the 10%, 5%, and 1% level, respectively, based on the percentage of coefficients out
of the 1000 simulations that are statistically different from zero.
State-Based Proximity Distance-Based Proximity
Variable (1) (2) (3) (4) (5) (6) (7) (8)
Home Bias 0.6655 0.2336 0.1454 0.1320 0.5283 0.1182 -0.0696 -0.0294
[0.00, 1.00] [0.00, 1.00] [0.00, 0.16] [0.00, 0.15] [0.00, 1.00] [0.00, 0.41] [0.00, 0.00] [0.00, 0.00]
Faraway -0.7994 -0.8369 -0.8954 -0.7967 -0.8840 -0.8890
[1.00, 0.00] [1.00, 0.00] [1.00, 0.00] [1.00, 0.00] [1.00, 0.00] [1.00, 0.00]
Home Bias × Faraway 0.1890 0.2038 0.3529 0.3077
[0.00, 0.56] [0.00, 0.65] [0.00, 0.99] [0.00, 0.97]
R-Squared 0.0173 0.0482 0.0484 0.0526 0.011 0.0379 0.0388 0.0427
Observations 19,810 19,810 19,810 19,810 18,973 18,973 18,973 18,973
Fixed Effects Industry,
Year
Industry,
Year
Industry,
Year
Industry,
Year,
Top 5 States
Industry,
Year
Industry,
Year
Industry,
Year
Industry,
Year,
Top 5 States
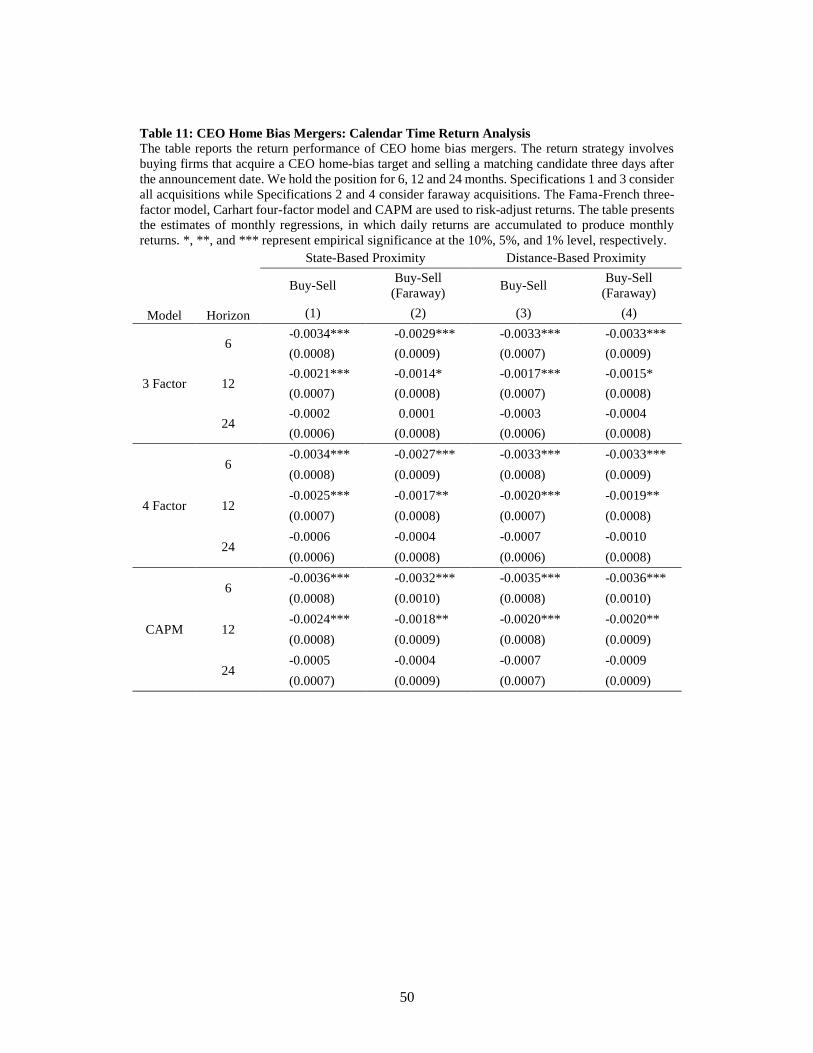
50
Table 11: CEO Home Bias Mergers: Calendar Time Return Analysis
The table reports the return performance of CEO home bias mergers. The return strategy involves
buying firms that acquire a CEO home-bias target and selling a matching candidate three days after
the announcement date. We hold the position for 6, 12 and 24 months. Specifications 1 and 3 consider
all acquisitions while Specifications 2 and 4 consider faraway acquisitions. The Fama-French three-
factor model, Carhart four-factor model and CAPM are used to risk-adjust returns. The table presents
the estimates of monthly regressions, in which daily returns are accumulated to produce monthly
returns. *, **, and *** represent empirical significance at the 10%, 5%, and 1% level, respectively.
State-Based Proximity Distance-Based Proximity
Model Horizon
Buy-Sell Buy-Sell
(Faraway) Buy-Sell
Buy-Sell
(Faraway)
(1) (2) (3) (4)
3 Factor
6 -0.0034*** -0.0029*** -0.0033*** -0.0033***
(0.0008) (0.0009) (0.0007) (0.0009)
12 -0.0021*** -0.0014* -0.0017*** -0.0015*
(0.0007) (0.0008) (0.0007) (0.0008)
24 -0.0002 0.0001 -0.0003 -0.0004
(0.0006) (0.0008) (0.0006) (0.0008)
4 Factor
6 -0.0034*** -0.0027*** -0.0033*** -0.0033***
(0.0008) (0.0009) (0.0008) (0.0009)
12 -0.0025*** -0.0017** -0.0020*** -0.0019**
(0.0007) (0.0008) (0.0007) (0.0008)
24 -0.0006 -0.0004 -0.0007 -0.0010
(0.0006) (0.0008) (0.0006) (0.0008)
CAPM
6 -0.0036*** -0.0032*** -0.0035*** -0.0036***
(0.0008) (0.0010) (0.0008) (0.0010)
12 -0.0024*** -0.0018** -0.0020*** -0.0020**
(0.0008) (0.0009) (0.0008) (0.0009)
24 -0.0005 -0.0004 -0.0007 -0.0009
(0.0007) (0.0009) (0.0007) (0.0009)
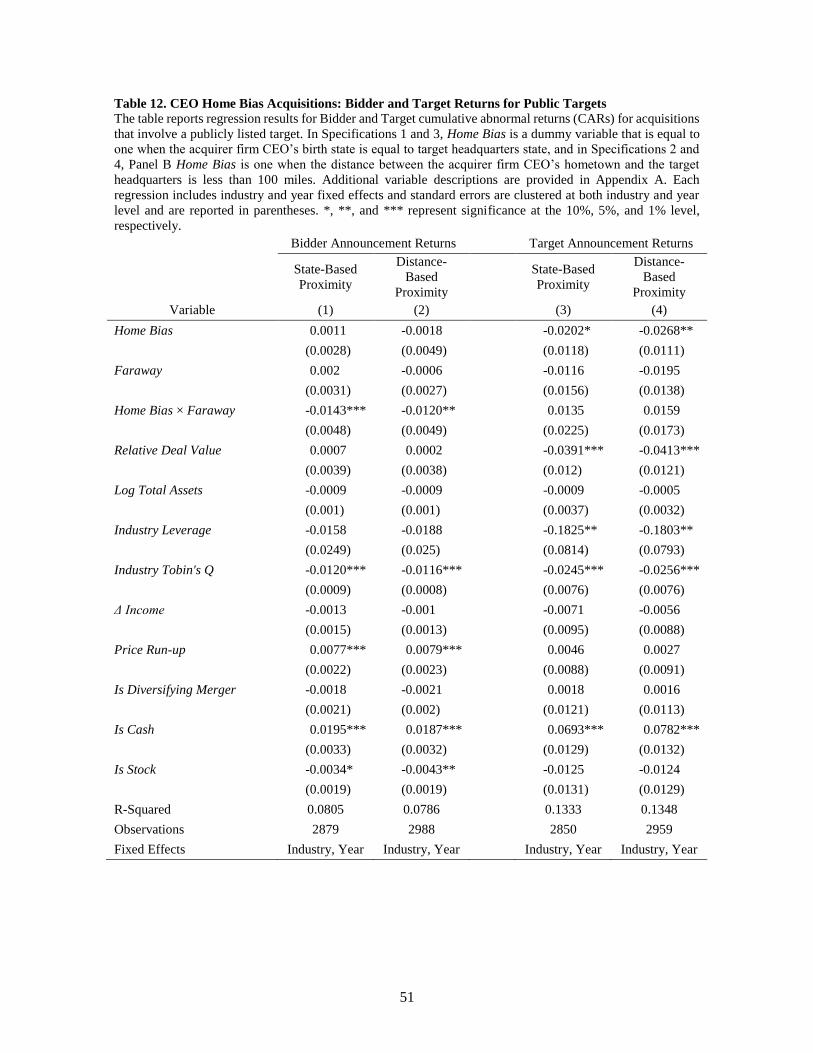
51
Table 12. CEO Home Bias Acquisitions: Bidder and Target Returns for Public Targets The table reports regression results for Bidder and Target cumulative abnormal returns (CARs) for acquisitions
that involve a publicly listed target. In Specifications 1 and 3, Home Bias is a dummy variable that is equal to
one when the acquirer firm CEO’s birth state is equal to target headquarters state, and in Specifications 2 and
4, Panel B Home Bias is one when the distance between the acquirer firm CEO’s hometown and the target
headquarters is less than 100 miles. Additional variable descriptions are provided in Appendix A. Each
regression includes industry and year fixed effects and standard errors are clustered at both industry and year
level and are reported in parentheses. *, **, and *** represent significance at the 10%, 5%, and 1% level,
respectively.
Bidder Announcement Returns Target Announcement Returns
State-Based
Proximity
Distance-
Based
Proximity
State-Based
Proximity
Distance-
Based
Proximity
Variable (1) (2) (3) (4)
Home Bias 0.0011 -0.0018 -0.0202* -0.0268**
(0.0028) (0.0049) (0.0118) (0.0111)
Faraway 0.002 -0.0006 -0.0116 -0.0195
(0.0031) (0.0027) (0.0156) (0.0138)
Home Bias × Faraway -0.0143*** -0.0120** 0.0135 0.0159
(0.0048) (0.0049) (0.0225) (0.0173)
Relative Deal Value 0.0007 0.0002 -0.0391*** -0.0413***
(0.0039) (0.0038) (0.012) (0.0121)
Log Total Assets -0.0009 -0.0009 -0.0009 -0.0005
(0.001) (0.001) (0.0037) (0.0032)
Industry Leverage -0.0158 -0.0188 -0.1825** -0.1803**
(0.0249) (0.025) (0.0814) (0.0793)
Industry Tobin's Q -0.0120*** -0.0116*** -0.0245*** -0.0256***
(0.0009) (0.0008) (0.0076) (0.0076)
Δ Income -0.0013 -0.001 -0.0071 -0.0056
(0.0015) (0.0013) (0.0095) (0.0088)
Price Run-up 0.0077*** 0.0079*** 0.0046 0.0027
(0.0022) (0.0023) (0.0088) (0.0091)
Is Diversifying Merger -0.0018 -0.0021 0.0018 0.0016
(0.0021) (0.002) (0.0121) (0.0113)
Is Cash 0.0195*** 0.0187*** 0.0693*** 0.0782***
(0.0033) (0.0032) (0.0129) (0.0132)
Is Stock -0.0034* -0.0043** -0.0125 -0.0124
(0.0019) (0.0019) (0.0131) (0.0129)
R-Squared 0.0805 0.0786 0.1333 0.1348
Observations 2879 2988 2850 2959
Fixed Effects Industry, Year Industry, Year Industry, Year Industry, Year
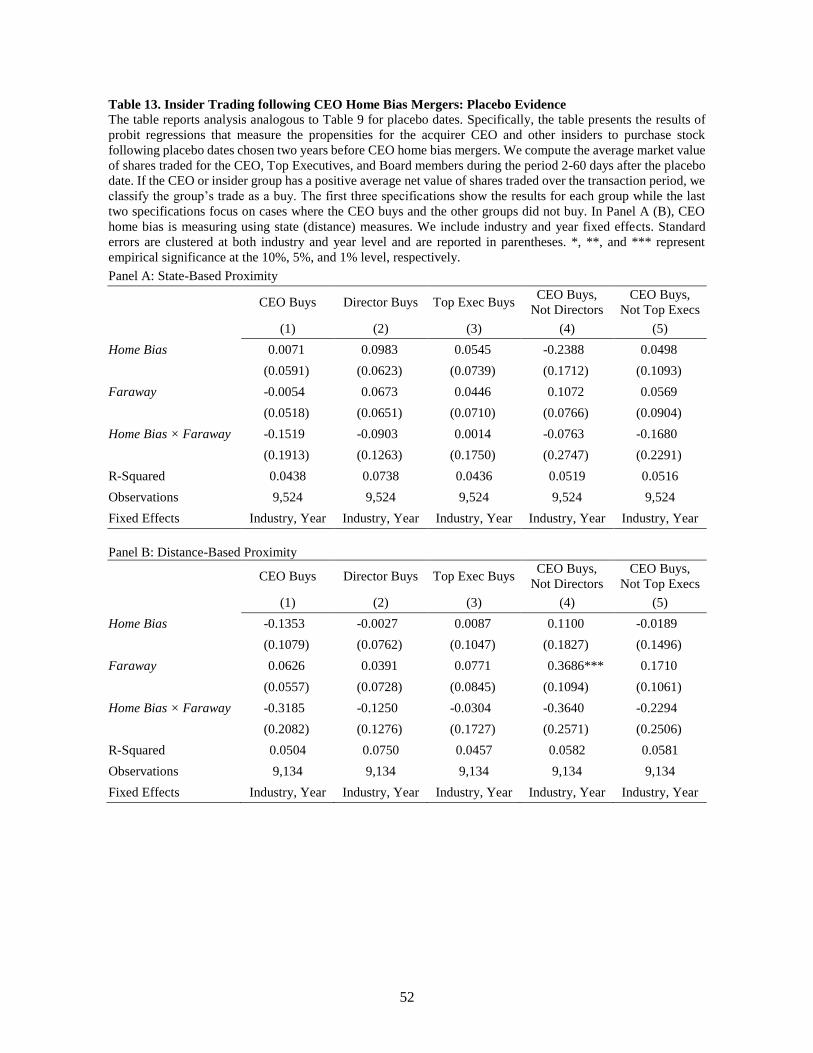
52
Table 13. Insider Trading following CEO Home Bias Mergers: Placebo Evidence The table reports analysis analogous to Table 9 for placebo dates. Specifically, the table presents the results of
probit regressions that measure the propensities for the acquirer CEO and other insiders to purchase stock
following placebo dates chosen two years before CEO home bias mergers. We compute the average market value
of shares traded for the CEO, Top Executives, and Board members during the period 2-60 days after the placebo
date. If the CEO or insider group has a positive average net value of shares traded over the transaction period, we
classify the group’s trade as a buy. The first three specifications show the results for each group while the last
two specifications focus on cases where the CEO buys and the other groups did not buy. In Panel A (B), CEO
home bias is measuring using state (distance) measures. We include industry and year fixed effects. Standard
errors are clustered at both industry and year level and are reported in parentheses. *, **, and *** represent
empirical significance at the 10%, 5%, and 1% level, respectively.
Panel A: State-Based Proximity
CEO Buys Director Buys Top Exec Buys CEO Buys,
Not Directors
CEO Buys,
Not Top Execs
(1) (2) (3) (4) (5)
Home Bias 0.0071 0.0983 0.0545 -0.2388 0.0498
(0.0591) (0.0623) (0.0739) (0.1712) (0.1093)
Faraway -0.0054 0.0673 0.0446 0.1072 0.0569
(0.0518) (0.0651) (0.0710) (0.0766) (0.0904)
Home Bias × Faraway -0.1519 -0.0903 0.0014 -0.0763 -0.1680
(0.1913) (0.1263) (0.1750) (0.2747) (0.2291)
R-Squared 0.0438 0.0738 0.0436 0.0519 0.0516
Observations 9,524 9,524 9,524 9,524 9,524
Fixed Effects Industry, Year Industry, Year Industry, Year Industry, Year Industry, Year
Panel B: Distance-Based Proximity
CEO Buys Director Buys Top Exec Buys CEO Buys,
Not Directors
CEO Buys,
Not Top Execs
(1) (2) (3) (4) (5)
Home Bias -0.1353 -0.0027 0.0087 0.1100 -0.0189
(0.1079) (0.0762) (0.1047) (0.1827) (0.1496)
Faraway 0.0626 0.0391 0.0771 0.3686*** 0.1710
(0.0557) (0.0728) (0.0845) (0.1094) (0.1061)
Home Bias × Faraway -0.3185 -0.1250 -0.0304 -0.3640 -0.2294
(0.2082) (0.1276) (0.1727) (0.2571) (0.2506)
R-Squared 0.0504 0.0750 0.0457 0.0582 0.0581
Observations 9,134 9,134 9,134 9,134 9,134
Fixed Effects Industry, Year Industry, Year Industry, Year Industry, Year Industry, Year
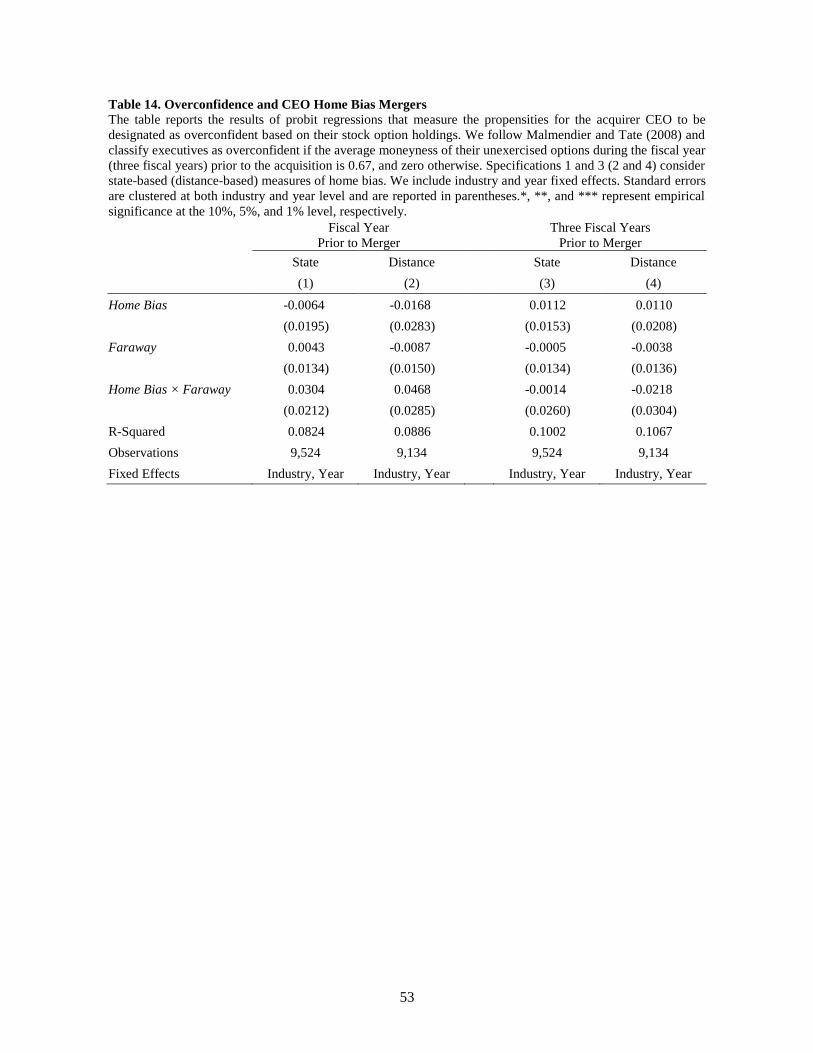
53
Table 14. Overconfidence and CEO Home Bias Mergers The table reports the results of probit regressions that measure the propensities for the acquirer CEO to be
designated as overconfident based on their stock option holdings. We follow Malmendier and Tate (2008) and
classify executives as overconfident if the average moneyness of their unexercised options during the fiscal year
(three fiscal years) prior to the acquisition is 0.67, and zero otherwise. Specifications 1 and 3 (2 and 4) consider
state-based (distance-based) measures of home bias. We include industry and year fixed effects. Standard errors
are clustered at both industry and year level and are reported in parentheses.*, **, and *** represent empirical
significance at the 10%, 5%, and 1% level, respectively.
Fiscal Year
Prior to Merger
Three Fiscal Years
Prior to Merger
State Distance State Distance
(1) (2) (3) (4)
Home Bias -0.0064 -0.0168 0.0112 0.0110
(0.0195) (0.0283) (0.0153) (0.0208)
Faraway 0.0043 -0.0087 -0.0005 -0.0038
(0.0134) (0.0150) (0.0134) (0.0136)
Home Bias × Faraway 0.0304 0.0468 -0.0014 -0.0218
(0.0212) (0.0285) (0.0260) (0.0304)
R-Squared 0.0824 0.0886 0.1002 0.1067
Observations 9,524 9,134 9,524 9,134
Fixed Effects Industry, Year Industry, Year Industry, Year Industry, Year
IA.1
CEO Home Bias and Corporate Acquisitions
Internet Appendix
Kiseo Chung, T. Clifton Green, and Breno Schmidt*
This internet appendix tabulates a number of robustness tests discussed in the paper.
Table IA.1 tabulates the results discussed in Section 3.2 of the text.
Table IA.2 tabulates the results discussed in footnote 20 of Section 3.3.
Table IA.3 tabulates the results discussed in Section 4.2
* Chung is from Rawls College of Business, Texas Tech University, [email protected]; Green is from the Goizueta
Business School, Emory University, [email protected]; and Schmidt is from the University of New South Wales,
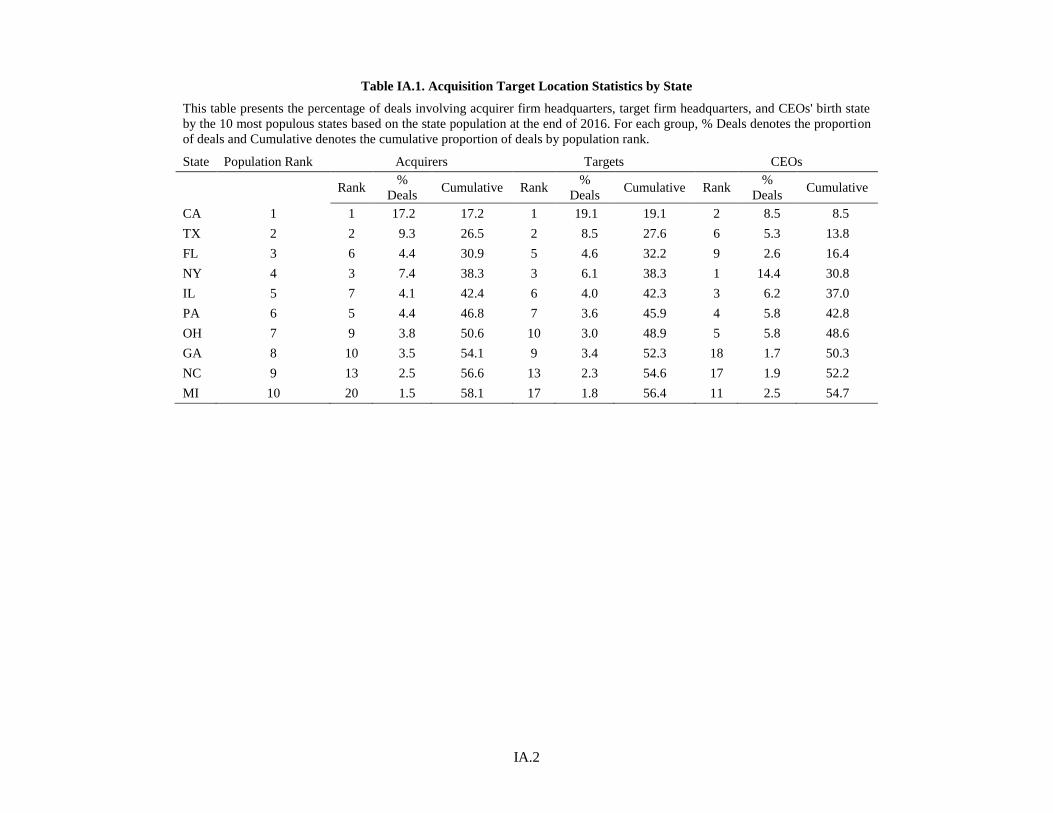
IA.2
Table IA.1. Acquisition Target Location Statistics by State
This table presents the percentage of deals involving acquirer firm headquarters, target firm headquarters, and CEOs' birth state
by the 10 most populous states based on the state population at the end of 2016. For each group, % Deals denotes the proportion
of deals and Cumulative denotes the cumulative proportion of deals by population rank.
State Population Rank Acquirers Targets CEOs
Rank %
Deals Cumulative Rank
%
Deals Cumulative Rank
%
Deals Cumulative
CA 1 1 17.2 17.2 1 19.1 19.1 2 8.5 8.5
TX 2 2 9.3 26.5 2 8.5 27.6 6 5.3 13.8
FL 3 6 4.4 30.9 5 4.6 32.2 9 2.6 16.4
NY 4 3 7.4 38.3 3 6.1 38.3 1 14.4 30.8
IL 5 7 4.1 42.4 6 4.0 42.3 3 6.2 37.0
PA 6 5 4.4 46.8 7 3.6 45.9 4 5.8 42.8
OH 7 9 3.8 50.6 10 3.0 48.9 5 5.8 48.6
GA 8 10 3.5 54.1 9 3.4 52.3 18 1.7 50.3
NC 9 13 2.5 56.6 13 2.3 54.6 17 1.9 52.2
MI 10 20 1.5 58.1 17 1.8 56.4 11 2.5 54.7
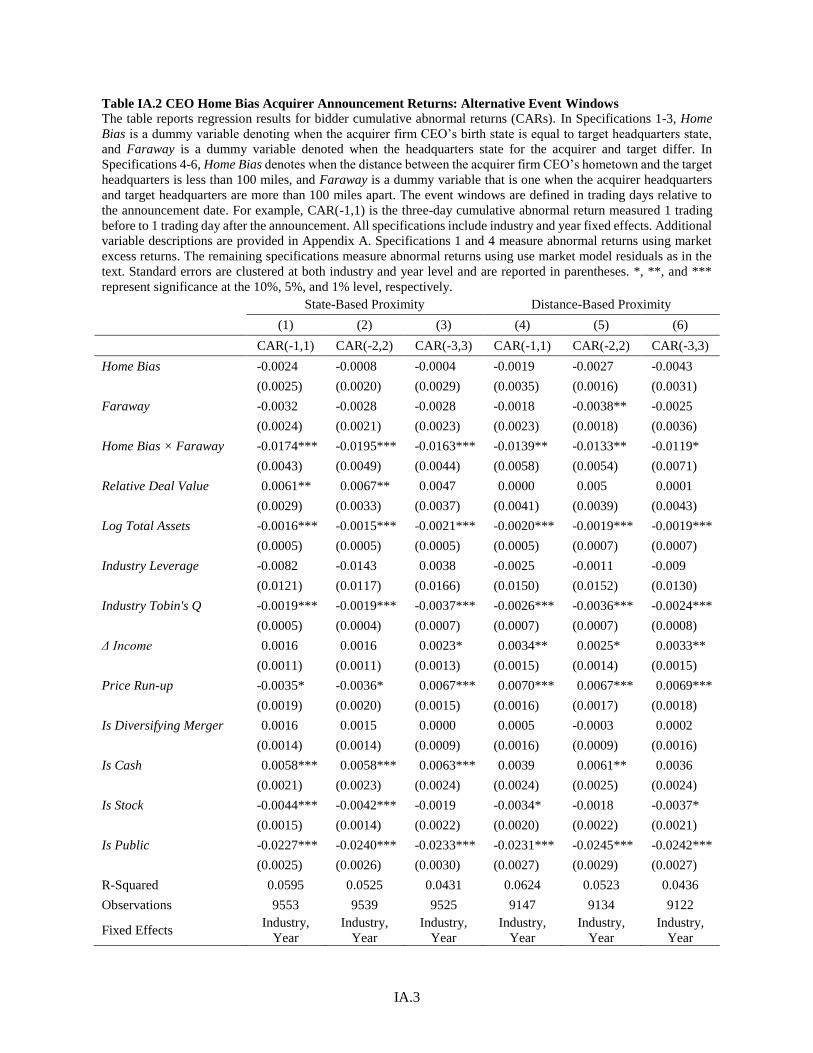
IA.3
Table IA.2 CEO Home Bias Acquirer Announcement Returns: Alternative Event Windows
The table reports regression results for bidder cumulative abnormal returns (CARs). In Specifications 1-3, Home
Bias is a dummy variable denoting when the acquirer firm CEO’s birth state is equal to target headquarters state,
and Faraway is a dummy variable denoted when the headquarters state for the acquirer and target differ. In
Specifications 4-6, Home Bias denotes when the distance between the acquirer firm CEO’s hometown and the target
headquarters is less than 100 miles, and Faraway is a dummy variable that is one when the acquirer headquarters
and target headquarters are more than 100 miles apart. The event windows are defined in trading days relative to
the announcement date. For example, CAR(-1,1) is the three-day cumulative abnormal return measured 1 trading
before to 1 trading day after the announcement. All specifications include industry and year fixed effects. Additional
variable descriptions are provided in Appendix A. Specifications 1 and 4 measure abnormal returns using market
excess returns. The remaining specifications measure abnormal returns using use market model residuals as in the
text. Standard errors are clustered at both industry and year level and are reported in parentheses. *, **, and ***
represent significance at the 10%, 5%, and 1% level, respectively.
State-Based Proximity Distance-Based Proximity
(1) (2) (3) (4) (5) (6)
CAR(-1,1) CAR(-2,2) CAR(-3,3) CAR(-1,1) CAR(-2,2) CAR(-3,3)
Home Bias -0.0024 -0.0008 -0.0004 -0.0019 -0.0027 -0.0043
(0.0025) (0.0020) (0.0029) (0.0035) (0.0016) (0.0031)
Faraway -0.0032 -0.0028 -0.0028 -0.0018 -0.0038** -0.0025
(0.0024) (0.0021) (0.0023) (0.0023) (0.0018) (0.0036)
Home Bias × Faraway -0.0174*** -0.0195*** -0.0163*** -0.0139** -0.0133** -0.0119*
(0.0043) (0.0049) (0.0044) (0.0058) (0.0054) (0.0071)
Relative Deal Value 0.0061** 0.0067** 0.0047 0.0000 0.005 0.0001
(0.0029) (0.0033) (0.0037) (0.0041) (0.0039) (0.0043)
Log Total Assets -0.0016*** -0.0015*** -0.0021*** -0.0020*** -0.0019*** -0.0019***
(0.0005) (0.0005) (0.0005) (0.0005) (0.0007) (0.0007)
Industry Leverage -0.0082 -0.0143 0.0038 -0.0025 -0.0011 -0.009
(0.0121) (0.0117) (0.0166) (0.0150) (0.0152) (0.0130)
Industry Tobin's Q -0.0019*** -0.0019*** -0.0037*** -0.0026*** -0.0036*** -0.0024***
(0.0005) (0.0004) (0.0007) (0.0007) (0.0007) (0.0008)
Δ Income 0.0016 0.0016 0.0023* 0.0034** 0.0025* 0.0033**
(0.0011) (0.0011) (0.0013) (0.0015) (0.0014) (0.0015)
Price Run-up -0.0035* -0.0036* 0.0067*** 0.0070*** 0.0067*** 0.0069***
(0.0019) (0.0020) (0.0015) (0.0016) (0.0017) (0.0018)
Is Diversifying Merger 0.0016 0.0015 0.0000 0.0005 -0.0003 0.0002
(0.0014) (0.0014) (0.0009) (0.0016) (0.0009) (0.0016)
Is Cash 0.0058*** 0.0058*** 0.0063*** 0.0039 0.0061** 0.0036
(0.0021) (0.0023) (0.0024) (0.0024) (0.0025) (0.0024)
Is Stock -0.0044*** -0.0042*** -0.0019 -0.0034* -0.0018 -0.0037*
(0.0015) (0.0014) (0.0022) (0.0020) (0.0022) (0.0021)
Is Public -0.0227*** -0.0240*** -0.0233*** -0.0231*** -0.0245*** -0.0242***
(0.0025) (0.0026) (0.0030) (0.0027) (0.0029) (0.0027)
R-Squared 0.0595 0.0525 0.0431 0.0624 0.0523 0.0436
Observations 9553 9539 9525 9147 9134 9122
Fixed Effects Industry,
Year
Industry,
Year
Industry,
Year
Industry,
Year
Industry,
Year
Industry,
Year
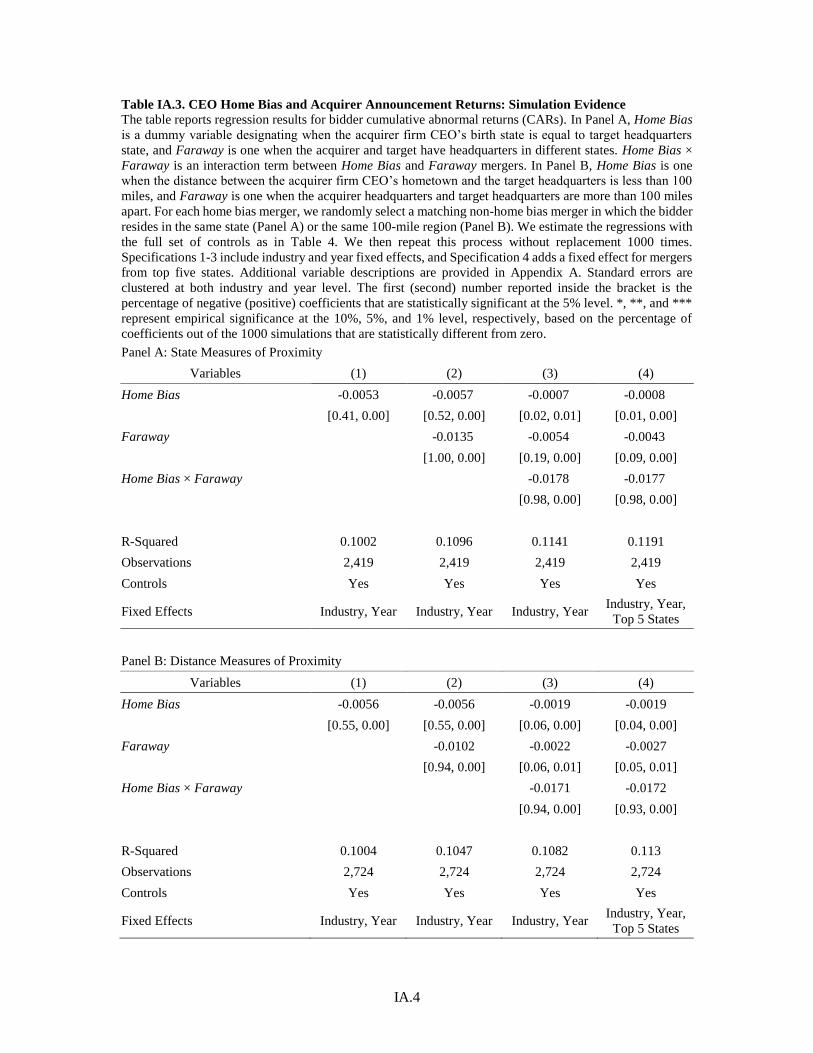
IA.4
Table IA.3. CEO Home Bias and Acquirer Announcement Returns: Simulation Evidence
The table reports regression results for bidder cumulative abnormal returns (CARs). In Panel A, Home Bias
is a dummy variable designating when the acquirer firm CEO’s birth state is equal to target headquarters
state, and Faraway is one when the acquirer and target have headquarters in different states. Home Bias ×
Faraway is an interaction term between Home Bias and Faraway mergers. In Panel B, Home Bias is one
when the distance between the acquirer firm CEO’s hometown and the target headquarters is less than 100
miles, and Faraway is one when the acquirer headquarters and target headquarters are more than 100 miles
apart. For each home bias merger, we randomly select a matching non-home bias merger in which the bidder
resides in the same state (Panel A) or the same 100-mile region (Panel B). We estimate the regressions with
the full set of controls as in Table 4. We then repeat this process without replacement 1000 times.
Specifications 1-3 include industry and year fixed effects, and Specification 4 adds a fixed effect for mergers
from top five states. Additional variable descriptions are provided in Appendix A. Standard errors are
clustered at both industry and year level. The first (second) number reported inside the bracket is the
percentage of negative (positive) coefficients that are statistically significant at the 5% level. *, **, and ***
represent empirical significance at the 10%, 5%, and 1% level, respectively, based on the percentage of
coefficients out of the 1000 simulations that are statistically different from zero.
Panel A: State Measures of Proximity
Variables (1) (2) (3) (4)
Home Bias -0.0053 -0.0057 -0.0007 -0.0008
[0.41, 0.00] [0.52, 0.00] [0.02, 0.01] [0.01, 0.00]
Faraway -0.0135 -0.0054 -0.0043
[1.00, 0.00] [0.19, 0.00] [0.09, 0.00]
Home Bias × Faraway -0.0178 -0.0177
[0.98, 0.00] [0.98, 0.00]
R-Squared 0.1002 0.1096 0.1141 0.1191
Observations 2,419 2,419 2,419 2,419
Controls Yes Yes Yes Yes
Fixed Effects Industry, Year Industry, Year Industry, Year Industry, Year,
Top 5 States
Panel B: Distance Measures of Proximity
Variables (1) (2) (3) (4)
Home Bias -0.0056 -0.0056 -0.0019 -0.0019
[0.55, 0.00] [0.55, 0.00] [0.06, 0.00] [0.04, 0.00]
Faraway -0.0102 -0.0022 -0.0027
[0.94, 0.00] [0.06, 0.01] [0.05, 0.01]
Home Bias × Faraway -0.0171 -0.0172
[0.94, 0.00] [0.93, 0.00]
R-Squared 0.1004 0.1047 0.1082 0.113
Observations 2,724 2,724 2,724 2,724
Controls Yes Yes Yes Yes
Fixed Effects Industry, Year Industry, Year Industry, Year Industry, Year,
Top 5 States
Related Documents